CHUBB LTD
10-Ks and 10-Qs
|
|
|
|
|
|
|
|
|
|
|
|
|
|
|
|
|
|
|
|
|
|
|
|
|
|
|
|
|
|
|
|
|
|
|
|
|
|
|
|
|
|
|
|
|
|
|
|
|
|
|
|
|
|
|
|
|
|
|
|
|
|
|
|
|
|
|
|
UNITED STATES SECURITIES AND EXCHANGE COMMISSION
Washington, D.C. 20549
FORM 10-K
þ
ANNUAL REPORT PURSUANT TO SECTION 13 OR 15(d) OF THE SECURITIES EXCHANGE ACT OF 1934
For the fiscal year ended
December 31, 2017
OR
¨
TRANSITION REPORT PURSUANT TO SECTION 13 OR 15(d) OF THE SECURITIES EXCHANGE ACT OF 1934
For the Transition Period from to
Commission File No. 1-11778
CHUBB LIMITED
(Exact name of registrant as specified in its charter)
|
Switzerland
|
|
98-0091805
|
|
(State or other jurisdiction of incorporation or organization)
|
|
(I.R.S. Employer Identification No.)
|
Baerengasse 32
Zurich, Switzerland CH-8001
(Address of principal executive offices) (Zip Code)
+41 (0)43 456 76 00
(Registrant’s telephone number, including area code)
|
Securities registered pursuant to Section 12(b) of the Act:
|
||
|
Title of each class
|
|
Name of each exchange on which registered
|
|
Common Shares, par value CHF 24.15 per share
|
|
New York Stock Exchange
|
Securities registered pursuant to Section 12(g) of the Act: None
Indicate by check mark if the registrant is a well-known seasoned issuer, as defined in Rule 405 of the Securities Act.
YES
þ
NO
¨
Indicate by check mark if the registrant is not required to file reports pursuant to Section 13 or Section 15(d) of the Act.
YES
¨
NO
þ
Indicate by check mark whether the registrant (1) has filed all reports required to be filed by Section 13 or 15 (d) of the Securities Exchange Act of 1934 during the preceding 12 months (or for such shorter period that the registrant was required to file such reports), and (2) has been subject to such filing requirements for the past 90 days. YES
þ
NO
¨
Indicate by check mark whether the registrant has submitted electronically and posted on its corporate Web site, if any, every Interactive Data File required to be submitted and posted pursuant to Rule 405 of Regulation S-T (§232.405 of this chapter) during the preceding 12 months (or for such shorter period that the registrant was required to submit and post such files). YES
þ
NO
¨
Indicate by check mark if disclosure of delinquent filers pursuant to Item 405 of Regulation S-K (§229.405 of this chapter) is not contained herein, and will not be contained, to the best of the registrant's knowledge, in definitive proxy or information statements incorporated by reference into Part III of this Form 10-K or any amendment to this Form 10-K.
¨
Indicate by check mark whether the registrant is a large accelerated filer, an accelerated filer, a non-accelerated filer, smaller reporting company, or an emerging growth company. See the definitions of “large accelerated filer,” “accelerated filer,” "smaller reporting company," and “emerging growth company” in Rule 12b-2 of the Exchange Act.
|
Large accelerated filer
þ
|
|
|
|
|
Accelerated filer
¨
|
|
|
Non-accelerated filer
¨
|
(Do not check if a smaller reporting company)
|
Smaller reporting company
¨
|
||||
|
Emerging growth company
¨
|
||||||
If an emerging growth company, indicate by check mark if the registrant has elected not to use the extended transition period for complying with any new or revised financial accounting standards provided pursuant to Section 13(a) of the Exchange Act.
¨
Indicate by check mark whether the registrant is a shell company (as defined in Rule 12b-2 of the Act). YES
¨
NO
þ
The aggregate market value of voting stock held by non-affiliates as of June 30,
2017
(the last business day of the registrant's most recently completed second fiscal quarter), was approximately $
67
billion. For the purposes of this computation, shares held by directors and officers of the registrant have been excluded. Such exclusion is not intended, nor shall it be deemed, to be an admission that such persons are affiliates of the registrant.
As of
February 12, 2018
there were
464,091,254
Common Shares par value CHF
24.15
of the registrant outstanding.
|
Documents Incorporated by Reference
|
||||
Certain portions of the registrant's definitive proxy statement relating to its 2018 Annual General Meeting of Shareholders are incorporated by reference into Part III of this report.
|
PART I
|
Page
|
||
|
ITEM 1.
|
|||
|
ITEM 1A.
|
|||
|
ITEM 1B.
|
|||
|
ITEM 2.
|
|||
|
ITEM 3.
|
|||
|
ITEM 4.
|
|||
|
PART II
|
|||
|
ITEM 5.
|
|||
|
ITEM 6.
|
|||
|
ITEM 7.
|
|||
|
ITEM 7A.
|
|||
|
ITEM 8.
|
|||
|
ITEM 9.
|
|||
|
ITEM 9A.
|
|||
|
ITEM 9B.
|
|||
|
PART III
|
|||
|
ITEM 10.
|
|||
|
ITEM 11.
|
|||
|
ITEM 12.
|
|||
|
ITEM 13.
|
|||
|
ITEM 14.
|
|||
|
PART IV
|
|||
|
ITEM 15.
|
|||
|
ITEM 16.
|
|||
ITEM 1.
Business
General
Chubb Limited is the Swiss-incorporated holding company of the Chubb Group of Companies. Chubb Limited, which is headquartered in Zurich, Switzerland, and its direct and indirect subsidiaries (collectively, the Chubb Group of Companies, Chubb, we, us, or our) are a global insurance and reinsurance organization, serving the needs of a diverse group of clients worldwide. At
December 31, 2017
, we had total assets of $
167
billion and shareholders’ equity of $
51
billion. Chubb was incorporated in 1985 at which time it opened its first business office in Bermuda and continues to maintain operations in Bermuda. We have grown our business through increased premium volume, expansion of product offerings and geographic reach, and the acquisition of other companies, including The Chubb Corporation (Chubb Corp), to become a global property and casualty (P&C) leader.
With operations in 54 countries and territories, Chubb provides commercial and personal property and casualty insurance, personal accident and supplemental health insurance (A&H), reinsurance, and life insurance to a diverse group of clients. We offer commercial insurance products and service offerings such as risk management programs, loss control, and engineering and complex claims management. We provide specialized insurance products ranging from Directors & Officers (D&O) and professional liability to various specialty-casualty and umbrella and excess casualty lines to niche areas such as aviation and energy. We also offer personal lines insurance coverage including homeowners, automobile, valuables, umbrella liability, and recreational marine products. In addition, we supply personal accident, supplemental health, and life insurance to individuals in select countries.
We serve multinational corporations, mid-size and small businesses with property and casualty insurance and risk engineering services; affluent and high net worth individuals with substantial assets to protect; individuals purchasing life, personal accident, supplemental health, homeowners, automobile, and specialty personal insurance coverage; companies and affinity groups providing or offering accident and health insurance programs and life insurance to their employees or members; and insurers managing exposures with reinsurance coverage.
At
December 31, 2017
, we employed approximately 31,000 people. We believe that employee relations are satisfactory.
We make available free of charge through our website (investors.chubb.com, under Financials) our annual report on Form 10-K, quarterly reports on Form 10-Q, current reports on Form 8-K, and amendments to those reports, if any, filed or furnished pursuant to Section 13(a) or 15(d) of the Exchange Act as soon as reasonably practicable after they have been electronically filed with or furnished to the U.S. Securities and Exchange Commission (SEC). Also available through our website (under Investor Relations / Corporate Governance) are our Corporate Governance Guidelines, Code of Conduct, and Charters for the Committees of our Board of Directors (the Board). Printed documents are available by contacting our Investor Relations Department (Telephone: +1 (441) 299-9283, E-mail: investorrelations@chubb.com).
We also use our website as a means of disclosing material, non-public information and for complying with our disclosure obligations under SEC Regulation FD (Fair Disclosure). Accordingly, investors should monitor the Investor Relations portion of our website, in addition to following our press releases, SEC filings, and public conference calls and webcasts. The information contained on, or that may be accessed through, our website is not incorporated by reference into, and is not a part of, this report. The public may also read and copy any materials Chubb files with the SEC at the SEC's Public Reference Room at 100 F Street, NE, Washington, DC 20549 or by calling the SEC at 1-800-SEC-0330. The SEC maintains an Internet site (www.sec.gov) that contains reports, proxy and information statements, and other information regarding issuers that file electronically with the SEC.
Customers
For most commercial and personal lines of business we offer, insureds typically use the services of an insurance broker or agent. An insurance broker acts as an agent for the insureds, offering advice on the types and amount of insurance to purchase and also assisting in the negotiation of price and terms and conditions. We obtain business from the local and major international insurance brokers and typically pay a commission to brokers for any business accepted and bound. Loss of all or a substantial portion of the business provided by one or more of these brokers could have a material adverse effect on our business. In our opinion, no material part of our business is dependent upon a single insured or group of insureds. We do not believe that the
2
loss of any one insured would have a material adverse effect on our financial condition or results of operations, and no one insured or group of affiliated insureds account for as much as 10 percent of our total revenues.
Competition
Competition in the insurance and reinsurance marketplace is substantial. We compete on an international and regional basis with major U.S., Bermuda, European, and other international insurers and reinsurers and with underwriting syndicates, some of which have greater financial, technological, marketing, distribution and management resources than we do. In addition, capital market participants have created alternative products that are intended to compete with reinsurance products. We also compete with new companies and existing companies that move into the insurance and reinsurance markets. Competitors include other stock companies, mutual companies, alternative risk sharing groups (such as group captives and catastrophe pools), and other underwriting organizations. Competitors sell through various distribution channels and business models, across a broad array of product lines, and with a high level of variation regarding geographic, marketing, and customer segmentation. We compete for business not only on the basis of price but also on the basis of availability of coverage desired by customers and quality of service. Our ability to compete is dependent on a number of factors, particularly our ability to maintain the appropriate financial strength ratings as assigned by independent rating agencies and effectively utilize new technology in our business. Our broad market capabilities in personal, commercial, specialty, and A&H lines made available by our underwriting expertise, business infrastructure, and global presence, define our competitive advantage. Our strong balance sheet is attractive to businesses, and our strong capital position and global platform affords us opportunities for growth not available to smaller, less diversified insurance companies. Refer to “Segment Information” for competitive environment by segment.
Trademarks and Trade Names
Various trademarks and trade names we use protect names of certain products and services we offer and are important to the extent they provide goodwill and name recognition in the insurance industry. We use commercially reasonable efforts to protect these proprietary rights, including various trade secret and trademark laws. We intend to retain material trademark rights in perpetuity, so long as it satisfies the use and registration requirements of applicable countries. One or more of the trademarks and trade names could be material to our ability to sell our products and services. We have taken appropriate steps to protect our ownership of key names, and we believe it is unlikely that anyone would be able to prevent us from using names in places or circumstances material to our operations.
Segment Information
Chubb operates through six business segments: North America Commercial P&C Insurance, North America Personal P&C Insurance, North America Agricultural Insurance, Overseas General Insurance, Global Reinsurance, and Life Insurance. The following table presents net premiums earned (NPE) by segment:
|
Years Ended December 31
(in millions of U.S. dollars, except for percentages)
|
2017 Net Premiums Earned
|
|
% of Total
|
|
2016 Net Premiums Earned
|
|
% of Total
|
|
2015 Net Premiums Earned
|
|
% of Total
|
|
||||||||
|
North America Commercial P&C Insurance
|
$
|
12,191
|
|
42
|
%
|
$
|
12,217
|
|
43
|
%
|
$
|
5,634
|
|
33
|
%
|
|||||
|
North America Personal P&C Insurance
|
4,399
|
|
15
|
%
|
4,319
|
|
15
|
%
|
948
|
|
5
|
%
|
||||||||
|
North America Agricultural Insurance
|
1,508
|
|
6
|
%
|
1,316
|
|
5
|
%
|
1,364
|
|
8
|
%
|
||||||||
|
Overseas General Insurance
|
8,131
|
|
28
|
%
|
8,132
|
|
28
|
%
|
6,471
|
|
38
|
%
|
||||||||
|
Global Reinsurance
|
704
|
|
2
|
%
|
710
|
|
2
|
%
|
849
|
|
5
|
%
|
||||||||
|
Life Insurance
|
2,101
|
|
7
|
%
|
2,055
|
|
7
|
%
|
1,947
|
|
11
|
%
|
||||||||
|
Total
|
$
|
29,034
|
|
100
|
%
|
$
|
28,749
|
|
100
|
%
|
$
|
17,213
|
|
100
|
%
|
|||||
The results of operations of Chubb Corp are included from the acquisition date forward (i.e., after January 14, 2016). Additional financial information about our segments, including net premiums earned by geographic region, is included in
Note
15
to the Consolidated Financial Statements.
3
North America Commercial P&C Insurance (
42
percent of
2017
Consolidated NPE)
Overview
The North America Commercial P&C Insurance segment comprises operations that provide P&C insurance and services to large, middle market, and small commercial businesses in the U.S., Canada, and Bermuda. This segment includes:
|
•
|
Major Accounts, a retail division focused on large institutional organizations and corporate companies
|
|
•
|
Commercial Insurance, which includes the retail division focused on middle market customers and small businesses
|
|
•
|
Westchester and Chubb Bermuda, our wholesale and specialty divisions
|
Products and Distribution
Major Accounts provides a broad array of traditional and specialty P&C, A&H, and risk management products and services to large U.S. and Canadian-based institutional organizations and corporate companies. Major Accounts distributes its insurance products primarily through a limited number of retail brokers. In addition to using brokers, certain products are also distributed through general agents, independent agents, managing general agents (MGA), managing general underwriters, alliances, affinity groups, and direct marketing operations. Products and services offered include property, professional liability, cyber risk, excess casualty, commercial marine, surety, environmental, construction, medical risk, inland marine, A&H coverages, as well as claims and risk management products and services.
The Major Accounts operations, which represented approximately 40 percent of North America Commercial P&C Insurance’s net premiums earned in 2017, are organized into the following distinct business units, each offering specialized products and services targeted at specific markets:
|
•
|
Chubb Global Casualty offers a range of customized risk management primary casualty products designed to help large insureds, including national accounts, address the significant costs of financing and managing risk for workers’ compensation, general liability and automobile liability coverages. Chubb Global Casualty also provides products which insure specific global operating risks of U.S.-based multinational companies and include deductible programs, captive programs, and paid or incurred loss retrospective plans. Within Chubb Global Casualty, Chubb Alternative Risk Solutions Group underwrites contractual indemnification policies which provides prospective coverage for loss events within the insured’s policy retention levels, and underwrites assumed loss portfolio transfer (LPT) contracts in which insured loss events have occurred prior to the inception of the contract.
|
|
•
|
Property provides products and services including primary, quota share and excess all-risk insurance, risk management programs and services, commercial and inland marine products.
|
|
•
|
Surety offers a wide variety of surety products and specializes in underwriting both commercial and contract bonds and has the capacity for bond issuance on an international basis.
|
|
•
|
Accident & Health (A&H) products include employee benefit plans, occupational accident, student accident, and worldwide travel accident and global medical programs. With respect to products that include supplemental medical and hospital indemnity coverages, we typically pay fixed amounts for claims and are therefore insulated from rising healthcare costs. Accident & Health also provides specialty personal lines products, including credit card enhancement programs (identity theft, rental car collision damage waiver, trip travel, and purchase protection benefits) distributed through affinity groups.
|
|
•
|
Financial Lines provides management liability and professional liability (D&O and E&O) and cyber risk products to public companies as well as to private and not for profit organizations.
|
|
•
|
Casualty Risk provides coverages including umbrella and excess liability, environmental risk, and casualty programs for commercial construction related projects for companies and institutions.
|
|
•
|
Medical Risk offers a wide range of specialty liability products for the healthcare industry through licensed excess and surplus lines brokers. Products include primary coverages for professional liability and general liability for selected types of medical facilities, excess/umbrella liability for medical facilities, primary and excess coverages for products liability for large biotechnology and specialty pharmaceutical companies, and liability insurance for human clinical trials.
|
|
•
|
ESIS Inc. (ESIS), is an in-house third-party claims administrator, performs claims management and risk control services for domestic and international organizations as well as for the North America Commercial P&C Insurance segment. ESIS services include comprehensive medical managed care; integrated disability services; pre-loss control and risk management; health, safety and environmental consulting; salvage and subrogation; and healthcare recovery services. The net results for ESIS are included in North America Commercial P&C Insurance’s administrative expenses.
|
4
The Commercial Insurance operations, which include Small Commercial, represented approximately 40 percent of North America Commercial P&C Insurance’s net premiums earned in 2017. Commercial Insurance provides a broad range of P&C, professional lines, and Accident & Health products targeted to U.S and Canadian-based middle market customers in a variety of industries with annual revenues generally greater than $10 million, while the Small Commercial operations provide a broad range of property and casualty, workers' compensation, small commercial management and professional liability for small businesses based in the U.S., targeted to customers with annual revenues up to $10 million.
|
•
|
Commercial Insurance products and services offered include traditional property and casualty lines of business, including Package which combines property and general liability, workers' compensation, automobile, umbrella; financial lines of business, including professional liability, management liability and cyber risk coverage; and other lines including environmental, accident & health, international coverages, and product recall. Commercial Insurance distributes its insurance products through a North American network of independent retail agents, regional brokers, multinational and digital brokers. Generally, our customers purchase insurance through a single retail agent or broker, do not employ a risk management department and do not retain significant risk through self-insured retentions. The majority of our customers purchase a Package or Portfolio product.
|
|
•
|
Small Commercial Insurance products and services offered include property and casualty lines of business, including a business owner policy which contains property and general liability, financial lines, including professional liability, management liability, and cyber risk, workers’ compensation, automobile liability, and international coverages. Products are generally offered through a North American network of retail agents and brokers.
|
Wholesale and Specialty P&C, which represented approximately 20 percent of North America Commercial P&C Insurance’s net premiums earned in 2017, comprises Westchester and Chubb Bermuda. Westchester serves the market for business risks that tend to be hard to place or not easily covered by traditional policies due to unique or complex exposures. Products offered include wholesale excess and surplus lines property, casualty, environmental, professional liability, inland marine, and product recall coverages in the U.S., Canada, and Bermuda.
Chubb Bermuda provides commercial insurance products on an excess basis including excess liability, D&O, professional liability, property, and political risk, the latter being written by Sovereign Risk Insurance Ltd., a wholly-owned managing agent. Chubb Bermuda focuses on Fortune 1000 companies and targets risks that are generally low in frequency and high in severity. Chubb Bermuda offers its products primarily through the Bermuda offices of major, internationally recognized insurance brokers.
Competitive Environment
Major Accounts competes against a number of large, national carriers as well as regional competitors and other entities offering risk alternatives such as self-insured retentions and captive programs. The markets in which we compete are subject to significant cycles of fluctuating capacity and wide disparities in price adequacy. We pursue a specialist strategy and focus on market opportunities where we can compete effectively based on service levels and product design, while still achieving an adequate level of profitability. We also achieve a competitive advantage through Major Accounts’ innovative product offerings and our ability to provide multiple products to a single client due to our nationwide local presence. In addition, all our domestic commercial units are able to deliver global products and coverage to customers in concert with our Overseas General Insurance segment.
The Commercial Insurance and Small Commercial Insurance operations compete against numerous insurance companies ranging from large national carriers to small and mid-size insurers who provide specialty coverages and standard P&C products.
Westchester competes against a number of large, national carriers as well as regional competitors and other entities offering risk alternatives such as self-insured retentions and captive programs. Chubb Bermuda competes against international commercial carriers writing business on an excess of loss basis.
5
North America Personal P&C Insurance (
15
percent of
2017
Consolidated NPE)
Overview
The North America Personal P&C Insurance segment includes the business written by Chubb Personal Risk Services division, which comprises Chubb high net worth personal lines business and ACE Private Risk Services, with operations in the U.S. and Canada. This segment provides affluent and high net worth individuals and families with homeowners, automobile and collector cars, valuable articles (including fine arts), personal and excess liability, travel insurance, and recreational marine insurance and services. Our homeowners business, including valuable articles, represented 69
percent
of North America Personal P&C Insurance’s net premiums earned in 2017.
Products and Distribution
Chubb Personal Risk Services offers comprehensive personal insurance products and services to meet the evolving needs of high net worth families and individuals. Our seamless customer experience and superior coverage protect not only our clients’ most valuable possessions, but also their standard of living. Our target customers consist of high net worth consumers with insurance needs that typically extend beyond what mass market carriers can offer. These coverages are offered solely through independent regional agents and brokers.
Competitive Environment
Chubb Personal Risk Services competes against insurance companies of varying sizes that sell personal lines products through various distribution channels, including retail agents as well as online distribution channels. We achieve a competitive advantage through our ability to provide superior service to our customers as well as our ability to address the specific needs of high net worth families and individuals.
North America Agricultural Insurance (
6
percent of
2017
Consolidated NPE)
Overview
The North America Agricultural Insurance segment comprises our U.S. and Canadian-based businesses that provide a variety of coverages including crop insurance, primarily Multiple Peril Crop Insurance (MPCI) and crop-hail insurance through Rain and Hail Insurance Service, Inc. (Rain and Hail) as well as farm and ranch and specialty P&C commercial insurance products and services through our Chubb Agribusiness unit.
Products and Distribution
The Rain and Hail business provides comprehensive MPCI and crop-hail insurance, and Chubb Agribusiness offers farm and ranch coverages as well as specialty P&C coverages for companies that manufacture, process and distribute agriculture products. The MPCI program is offered in conjunction with the U.S. Department of Agriculture (USDA). The USDA's Risk Management Agency (RMA) sets the policy terms and conditions, rates and forms, and is also responsible for setting compliance standards. As a participating company, we report all details of policies underwritten to the RMA and are party to a Standard Reinsurance Agreement (SRA). The SRA sets out the relationship between private insurance companies and the Federal Crop Insurance Corporation (FCIC) concerning the terms and conditions regarding the risks each will bear including the pro-rata and state stop-loss provisions which allow companies to limit the exposure of any one state or group of states on their underwriting results. In addition to the pro-rata and excess of loss reinsurance protections inherent in the SRA, we also purchase third-party proportional and stop-loss reinsurance for our MPCI business to reduce our exposure. We may also enter into crop derivative contracts to further manage our risk exposure. For additional information, refer to “Crop Insurance”, under Item 7.
Competitive Environment
Rain and Hail primarily operates in a federally regulated program where all approved providers offer the same product forms and rates through independent and/or captive agents. Chubb Agribusiness competes against both national and regional competitors offering specialty P&C insurance coverages to companies that manufacture, process, and distribute agricultural products.
6
Overseas General Insurance (
28
percent of
2017
Consolidated NPE)
Overview
The Overseas General Insurance segment comprises Chubb International and Chubb Global Markets (CGM). CGM, our London-based international specialty and excess and surplus lines business, includes Lloyd's of London (Lloyd's) Syndicate 2488, a wholly-owned Chubb syndicate supported by funds at Lloyd’s provided by Chubb Corporate Members. Syndicate 2488 has an underwriting capacity of £405 million for the Lloyd’s 2018 year of account. The syndicate is managed by Chubb’s Lloyd’s managing agency, ACE Underwriting Agencies Limited.
Products and Distribution
Chubb International maintains a presence in every major insurance market in the world and is organized geographically along product lines as follows: Europe, Asia Pacific, Eurasia and Africa, Far East, and Latin America. Products offered include P&C, A&H, specialty coverages, and personal lines insurance products and services. Chubb International's P&C business is generally written, on both a direct and assumed basis, through major international, regional, and local brokers and agents. Certain European branded products are also offered via a digital-commerce platform, Chubb Online, that allows brokers to quote, bind, and issue specialty policies online. Property insurance products include traditional commercial fire coverage as well as energy industry-related, marine, construction, and other technical coverages. Principal casualty products are commercial primary and excess casualty, environmental, and general liability. A&H and other consumer lines products are distributed through brokers, agents, direct marketing programs, and sponsor relationships. The A&H operations primarily offer personal accident and supplemental medical coverages including accidental death, business/holiday travel, specified disease, disability, medical and hospital indemnity, and income protection. We are not in the primary healthcare business. With respect to our supplemental medical and hospital indemnity products, we typically pay fixed amounts for claims and are therefore largely insulated from the direct impact of rising healthcare costs. Chubb International specialty coverages include D&O, professional indemnity, energy, aviation, political risk, and specialty personal lines products. Chubb International's personal lines operations provide specialty products and services designed to meet the needs of specific target markets and include property damage, automobile, homeowners, and personal liability.
CGM offers products through its parallel distribution network via two legal entities, Chubb European Group Limited (CEGL) and Chubb Underwriting Agencies Limited, managing agent of Syndicate 2488. CGM uses the syndicate to underwrite P&C business on a global basis through Lloyd's worldwide licenses. CGM uses CEGL to underwrite similar classes of business through its network of U.K. and European licenses, and in the U.S. where it is eligible to write excess and surplus lines business. Factors influencing the decision to place business with the syndicate or CEGL include licensing eligibilities, capitalization requirements, and client/broker preference. All business underwritten by CGM is accessed through registered brokers. The main lines of business include aviation, property, energy, professional lines, marine, financial lines, political risk, and A&H.
Competitive Environment
Chubb International's primary competitors include U.S.-based companies with global operations, as well as non-U.S. global carriers and indigenous companies in regional and local markets. For the A&H lines of business, locally based competitors also include financial institutions and bank owned insurance subsidiaries. Our international operations have the distinct advantage of being part of one of the few international insurance groups with a global network of licensed companies able to write policies on a locally admitted basis. The principal competitive factors that affect the international operations are underwriting expertise and pricing, relative operating efficiency, product differentiation, producer relations, and the quality of policyholder services. A competitive strength of our international operations is our global network and breadth of insurance programs, which assist individuals and business organizations to meet their risk management objectives, while also giving us the advantage of accessing local technical expertise, accomplishing a spread of risk, and offering a global network to service multinational accounts.
CGM is one of the preeminent international specialty insurers in London and is an established lead underwriter on a significant portion of the risks it underwrites for all lines of business. This leadership position allows CGM to set the policy terms and conditions of many of the policies written. All lines of business face competition, depending on the business class, from Lloyd's syndicates, the London market, and other major international insurers and reinsurers. Competition for international risks is also seen from domestic insurers in the country of origin of the insured. CGM differentiates itself from competitors through long standing experience in its product lines, its multiple insurance entities (Syndicate 2488 and CEGL), and the quality of its underwriting and claims service.
7
Global Reinsurance (
2
percent of
2017
Consolidated NPE)
Overview
The Global Reinsurance segment represents Chubb's reinsurance operations comprising Chubb Tempest Re Bermuda, Chubb Tempest Re USA, Chubb Tempest Re International, and Chubb Tempest Re Canada. Global Reinsurance markets reinsurance products worldwide under the Chubb Tempest Re brand name and provides solutions for small to mid-sized clients and multinational ceding companies. Global Re offers a broad array of traditional and non-traditional (e.g., loss portfolio transfer) property and casualty products.
Products and Distribution
Global Reinsurance services clients globally through its major units. Major international brokers submit business to one or more of these units' underwriting teams who have built strong relationships with both key brokers and clients by providing a responsive, client-focused approach to risk assessment and pricing.
Chubb Tempest Re Bermuda principally provides property catastrophe reinsurance globally to insurers of commercial and personal property. Property catastrophe reinsurance is on an occurrence or aggregate basis and protects a ceding company against an accumulation of losses covered by its issued insurance policies, arising from a common event or occurrence. Chubb Tempest Re Bermuda underwrites reinsurance principally on an excess of loss basis, meaning that its exposure only arises after the ceding company's accumulated losses have exceeded the attachment point of the reinsurance policy. Chubb Tempest Re Bermuda also writes other types of reinsurance on a limited basis for selected clients. Examples include proportional property where the reinsurer shares a proportional part of the premiums and losses of the ceding company, together with casualty (catastrophe workers' compensation) and specialty lines (assumed retrocessional catastrophe business and terrorism). Chubb Tempest Re Bermuda's business is produced through reinsurance intermediaries.
Chubb Tempest Re USA writes all lines of traditional and specialty P&C reinsurance, and surety and fidelity reinsurance for the North American market, principally on a treaty basis, with a focus on writing property per risk and casualty reinsurance. Chubb Tempest Re USA underwrites reinsurance on both a proportional and excess of loss basis. This unit's diversified portfolio is produced through reinsurance intermediaries.
Chubb Tempest Re International provides traditional and specialty P&C reinsurance to insurance companies worldwide, with emphasis on non-U.S. and Canadian risks. Chubb Tempest Re International writes all lines of traditional and specialty reinsurance including property risk and property catastrophe, casualty, marine, aviation, and specialty through our London- and Zurich-based divisions. The London-based divisions of Chubb Tempest Re International focus on the development of business sourced through London market brokers and, accordingly, write a diverse book of international business using Syndicate 2488 and CEGL. The Zurich-based division focuses on providing reinsurance to continental European insurers via continental European brokers while also serving Asian and Latin American markets. Chubb Tempest Re International also includes our Shanghai, China office which provides reinsurance coverage for Chinese-based risks. Chubb Tempest Re International underwrites reinsurance on both a proportional and excess of loss basis.
Chubb Tempest Re Canada offers a full array of traditional and specialty P&C, and reinsurance to the Canadian market, including casualty, property risk and property catastrophe, surety, and crop hail. Chubb Tempest Re Canada provides coverage through its Canadian company platform and also offers clients access to Syndicate 2488. Chubb Tempest Re Canada underwrites reinsurance on both a proportional and excess of loss basis.
Competitive Environment
The Global Reinsurance segment competes worldwide with major U.S. and non-U.S. reinsurers as well as reinsurance departments of numerous multi-line insurance organizations. In addition, capital markets participants have developed alternative capital sources intended to compete with traditional reinsurance. Additionally, government sponsored or backed catastrophe funds can affect demand for reinsurance. Global Reinsurance is considered a lead reinsurer and is typically involved in the negotiation and quotation of the terms and conditions of the majority of the contracts in which it participates. Global Reinsurance competes effectively in P&C markets worldwide because of its strong capital position, analytical capabilities and quality customer service, the leading role it plays in setting the terms, pricing, and conditions in negotiating contracts, and its customized approach to risk selection. The key competitors in our markets vary by geographic region and product line. An advantage of our international platform is that we are able to change our mix of business in response to changes in competitive conditions in the territories in which we operate. Our geographic reach is also sought by multinational ceding companies since all of our offices, with the exception of Bermuda, provide local reinsurance license capabilities which benefit our clients in dealing with country regulators.
8
Life Insurance (
7
percent of
2017
Consolidated NPE)
Overview
The Life segment comprises Chubb's international life operations (Chubb Life), Chubb Tempest Life Re (Chubb Life Re), and the North American supplemental A&H and life business of Combined Insurance.
Products and Distribution
Chubb Life provides individual life and group benefit insurance primarily in developing markets, including Hong Kong, Indonesia, South Korea, Taiwan, Thailand, Vietnam, and Egypt; also throughout Latin America; selectively in Europe; and in China through a non-consolidated joint venture insurance company. Chubb Life offers a broad portfolio of protection and savings products including whole life, endowment plans, individual term life, group term life, medical and health, personal accident, credit life, universal life, and unit linked contracts. The policies written by Chubb Life generally provide funds to beneficiaries of insureds after death and/or protection and/or savings benefits while the contract owner is living. Chubb Life sells to consumers through a variety of distribution channels including captive and independent agencies, bancassurance, worksite marketing, retailers, brokers, and direct to consumer marketing. We continue to expand Chubb Life with a focus on opportunities in developing markets that we believe will result in strong and sustainable operating profits as well as a favorable return on capital commitments over time. Our dedicated captive agency distribution channel, whereby agents sell Chubb Life products exclusively, enables us to maintain direct contact with the individual consumer, promote quality sales practices, and exercise greater control over the future of the business. We have developed a substantial sales force of agents principally located in our Asia-Pacific countries. Chubb also maintains approximately 36 percent direct and indirect ownership interest in Huatai Life Insurance Co., Ltd. (Huatai Life), which commenced operations in 2005 and has since grown to become one of the larger life insurance foreign joint ventures in China. Huatai Life offers a broad portfolio of insurance products through a variety of distribution channels including approximately 373 licensed sales locations in 17 Chinese provinces.
Chubb Life Re's core business is a Bermuda-based operation which provides reinsurance to primary life insurers, focusing on guarantees included in certain fixed and variable annuity products and also on more traditional mortality reinsurance protection. Chubb Life Re's U.S.-based traditional life reinsurance operation was discontinued for new business in January 2010. Since 2007, Chubb Life Re has not quoted on new opportunities in the variable annuity reinsurance marketplace and our focus has been on managing the current portfolio of risk, both in the aggregate and on a contract basis. This business is managed with a long-term perspective and short-term earnings volatility is expected.
Combined Insurance distributes specialty supplemental A&H and life insurance products targeted to middle income consumers and businesses in the U.S. and Canada. Combined Insurance's substantial North American sales force distributes a wide range of supplemental accident and sickness insurance products, including personal accident, short-term disability, critical illness, Medicare supplement products, and hospital confinement/recovery. Most of these products are primarily fixed-indemnity benefit obligations and are not directly subject to escalating medical cost inflation.
Competitive Environment
Chubb Life's competition differs by location but generally includes multinational insurers, and in some locations, local insurers, joint ventures, or state-owned insurers. Chubb's financial strength and reputation as an entrepreneurial organization with a global presence gives Chubb Life a strong base from which to compete. While Chubb Life Re is not currently quoting on new opportunities in the variable annuity reinsurance marketplace, we continue to monitor developments in this market. Combined Insurance competes for A&H business in the U.S. against numerous A&H and life insurance companies across various industry segments.
Corporate
Overview
Corporate results primarily include results of all run-off asbestos and environmental (A&E) exposures, the results of our run-off Brandywine business, the results of Westchester specialty operations for 1996 and prior years, certain other run-off exposures, and income and expenses not attributable to reportable segments and the results of our non-insurance companies. The run-off operations do not actively sell insurance products, but are responsible for the management of existing policies and settlement of related claims.
9
Our exposure to A&E claims principally arises out of liabilities acquired when we purchased Westchester Specialty in 1998, CIGNA’s P&C business in 1999, and Chubb Corp A&E claims in 2016. The A&E liabilities principally relate to claims arising from bodily-injury claims related to asbestos products and remediation costs associated with hazardous waste sites.
Underwriting
Chubb is an underwriting company and we strive to emphasize quality of underwriting rather than volume of business or market share. Our underwriting strategy is to manage risk by employing consistent, disciplined pricing and risk selection. This, coupled with writing a number of less cyclical product lines, has helped us develop flexibility and stability of our business, and has allowed us to maintain a profitable book of business throughout market cycles. Clearly defined underwriting authorities, standards, and guidelines coupled with a strong underwriting audit function are in place in each of our local operations and global profit centers. Global product boards ensure consistency of approach and the establishment of best practices throughout the world. Our priority is to help ensure adherence to criteria for risk selection by maintaining high levels of experience and expertise in our underwriting staff. In addition, we employ a business review structure that helps ensure control of risk quality and appropriate use of policy limits and terms and conditions. Underwriting discipline is at the heart of our operating philosophy.
Actuaries in each region work closely with the underwriting teams to provide additional expertise in the underwriting process. We use internal and external data together with sophisticated analytical, catastrophe loss and risk modeling techniques to ensure an appropriate understanding of risk, including diversification and correlation effects, across different product lines and territories. This is intended to help to ensure that losses are contained within our risk tolerance and appetite for individual product lines, businesses, and Chubb as a whole. Our use of such tools and data also reflects an understanding of their inherent limitations and uncertainties. We also purchase protection from third parties, including, but not limited to, reinsurance as a tool to diversify risk and limit the net loss potential of catastrophes and large or unusually hazardous risks. For additional information refer to "Risk Factors" under Item 1A, “Reinsurance Protection”, below, “Catastrophe Management” and “Natural Catastrophe Property Reinsurance Program”, under Item 7, and Note 5 to the Consolidated Financial Statements, under Item 8.
Reinsurance Protection
As part of our risk management strategy, we purchase reinsurance protection to mitigate our exposure to losses, including certain catastrophes, to a level consistent with our risk appetite. Although reinsurance agreements contractually obligate our reinsurers to reimburse us for an agreed-upon portion of our gross paid losses, reinsurance does not discharge our primary liability to our insureds and, thus, we ultimately remain liable for the gross direct losses. In certain countries, reinsurer selection is limited by local laws or regulations. In most countries there is more freedom of choice, and the counterparty is selected based upon its financial strength, claims settlement record, management, line of business expertise, and its price for assuming the risk transferred. In support of this process, we maintain a Chubb authorized reinsurer list that stratifies these authorized reinsurers by classes of business and acceptable limits. This list is maintained by our Reinsurance Security Committee (RSC), a committee comprising senior management personnel and a dedicated reinsurer security team. Changes to the list are authorized by the RSC and recommended to the Chair of the Risk and Underwriting Committee. The reinsurers on the authorized list and potential new markets are regularly reviewed and the list may be modified following these reviews. In addition to the authorized list, there is a formal exception process that allows authorized reinsurance buyers to use reinsurers already on the authorized list for higher limits or different lines of business, for example, or other reinsurers not on the authorized list if their use is supported by compelling business reasons for a particular reinsurance program.
A separate policy and process exists for captive reinsurance companies. Generally, these reinsurance companies are established by our clients or our clients have an interest in them. It is generally our policy to obtain collateral equal to the expected losses that may be ceded to the captive. Where appropriate, exceptions to the collateral requirement are granted but only after senior management review. Specific collateral guidelines and an exception process are in place for the North America Commercial P&C Insurance, North America Personal P&C Insurance, and Overseas General Insurance segments, all of which have credit management units evaluating the captive's credit quality and that of their parent company. The credit management units, working with actuaries, determine reasonable exposure estimates (collateral calculations), ensure receipt of collateral in an acceptable form, and coordinate collateral adjustments as and when needed. Financial reviews and expected loss evaluations are performed annually for active captive accounts and as needed for run-off exposures. In addition to collateral, parental guarantees are often used to enhance the credit quality of the captive.
In general, we seek to place our reinsurance with highly rated companies with which we have a strong trading relationship. For additional information refer to “Catastrophe Management” and “Natural Catastrophe Property Reinsurance Program” under Item 7, and Note
5
to the Consolidated Financial Statements, under Item 8.
10
Unpaid Losses and Loss Expenses
We establish reserves for unpaid losses and loss expenses, which are estimates of future payments on reported and unreported claims for losses and related expenses, with respect to insured events that have occurred. These reserves are recorded in Unpaid losses and loss expenses in the Consolidated balance sheets. The process of establishing loss and loss expense reserves for P&C claims can be complex and is subject to considerable uncertainty as it requires the use of informed estimates and judgments based on circumstances known at the date of accrual. These estimates and judgments are based on numerous factors, and may be revised as additional experience and other data become available and are reviewed, as new or improved methodologies are developed, or as laws change. Internal actuaries regularly analyze the levels of loss and loss expense reserves, taking into consideration factors that may impact the ultimate settlement value of the unpaid losses and loss expenses. These analyses could result in future changes in the estimates of loss and loss expense reserves or reinsurance recoverables and any such changes would be reflected in our results of operations in the period in which the estimates are changed. Losses and loss expenses are charged to income as incurred. The reserve for unpaid losses and loss expenses represents the estimated ultimate losses and loss expenses less paid losses and loss expenses, and comprises case reserves and incurred but not reported (IBNR) reserves. With the exception of certain structured settlements, for which the timing and amount of future claim payments are reliably determinable, and certain reserves for unsettled claims that are discounted in statutory filings, our loss reserves are not discounted for the time value of money. In connection with such structured settlements and certain reserves for unsettled claims, we carried net discounted reserves of $77 million at December 31, 2017.
For each product line, management, after consultation with internal actuaries, develops a “best estimate” of the ultimate settlement value of the unpaid losses and loss expenses that it believes provides a reasonable estimate of the required reserve. We evaluate our estimates of reserves quarterly in light of developing information. While we are unable at this time to determine whether additional reserves may be necessary in the future, we believe that our reserves for unpaid losses and loss expenses are adequate at
December 31, 2017
. Future additions to reserves, if needed, could have a material adverse effect on our financial condition, results of operations, and cash flows. For additional information refer to “Critical Accounting Estimates – Unpaid losses and loss expenses”, under Item 7, and Note
7
to the Consolidated Financial Statements, under Item 8.
Investments
Our objective is to maximize investment income and total return while ensuring an appropriate level of liquidity, and investment quality, and diversification. As such, Chubb's investment portfolio is invested primarily in investment-grade fixed-income securities as measured by the major rating agencies. We do not allow leverage in our investment portfolio.
The critical aspects of the investment process are controlled by Chubb Asset Management, an indirect wholly-owned subsidiary of Chubb. These aspects include asset allocation, portfolio and guideline design, risk management, and oversight of external asset managers. In this regard, Chubb Asset Management:
|
•
|
conducts formal asset allocation modeling for each of the Chubb subsidiaries, providing formal recommendations for the portfolio's structure;
|
|
•
|
establishes recommended investment guidelines that are appropriate to the prescribed asset allocation targets;
|
|
•
|
provides the analysis, evaluation, and selection of our external investment advisors;
|
|
•
|
establishes and develops investment-related analytics to enhance portfolio engineering and risk control;
|
|
•
|
monitors and aggregates the correlated risk of the overall investment portfolio; and
|
|
•
|
provides governance over the investment process for each of our operating companies to ensure consistency of approach and adherence to investment guidelines.
|
Under our guidance and direction, external asset managers conduct security and sector selection and transaction execution. Use of multiple managers benefits Chubb in several ways – it provides us with operational and cost efficiencies, diversity of styles and approaches, innovations in investment research and credit and risk management, all of which enhance the risk adjusted returns of our portfolios.
Chubb Asset Management determines the investment portfolio's allowable, targeted asset allocation and ranges for each of the segments. These asset allocation targets are derived from sophisticated asset and liability modeling that measures correlated histories of returns and volatility of returns. Allowable investment classes are further refined through analysis of our operating environment including expected volatility of cash flows, potential impact on our capital position, and regulatory and rating agency considerations.
11
The Board has established a Risk & Finance Committee which helps execute the Board's supervisory responsibilities pertaining to enterprise risk management including investment risk. Under the overall supervision of the Risk & Finance Committee, Chubb's governance over investment management is rigorous and ongoing. Among its responsibilities, the Risk & Finance Committee of the Board:
|
•
|
reviews and approves asset allocation targets and investment policy to ensure that it is consistent with our overall goals, strategies, and objectives;
|
|
•
|
reviews and approves investment guidelines to ensure that appropriate levels of portfolio liquidity, credit quality, diversification, and volatility are maintained; and
|
|
•
|
systematically reviews the portfolio's exposures including any potential violations of investment guidelines.
|
We have long-standing global credit limits for our entire portfolio across the organization and for individual obligors. Exposures are aggregated, monitored, and actively managed by our Global Credit Committee, comprising senior executives, including our Chief Financial Officer, our Chief Risk Officer, our Chief Investment Officer, and our Treasurer.
Within the guidelines and asset allocation parameters established by the Risk & Finance Committee, individual investment committees of the segments determine tactical asset allocation. Additionally, these committees review all investment-related activity that affects their operating company, including the selection of outside investment advisors, proposed asset allocation changes, and the systematic review of investment guidelines.
For additional information regarding the investment portfolio, including breakdowns of the sector and maturity distributions, refer to Note
3
to the Consolidated Financial Statements under Item 8.
Regulation
Our insurance and reinsurance subsidiaries conduct business globally, including in all 50 states of the United States and the District of Columbia. Our business is subject to varying degrees of regulation and supervision in each of the jurisdictions in which our insurance and reinsurance subsidiaries are domiciled and on a group basis. The laws and regulations of the jurisdictions in which our insurance and reinsurance subsidiaries are domiciled require among other things that these subsidiaries maintain minimum levels of statutory capital, surplus, and liquidity, meet solvency standards, and submit to periodic examinations of their financial condition. The complex regulatory environments in which Chubb operates are subject to change and are regularly monitored.
Group Supervision
In September 2012, the Pennsylvania Insurance Department (Department), in consultation with other insurance regulatory bodies that oversee Chubb's insurance activities, convened the first Chubb Supervisory College (College). Regulators from approximately 15 jurisdictions worldwide were invited to participate in the College, the purpose of which was to initiate establishment of, and to clarify the membership, participation, functionality, and ongoing activities in, the College with respect to group-wide supervision of Chubb. Representatives from approximately ten jurisdictions attended the College in Philadelphia, Pennsylvania, during which the supervisors reviewed, without adverse comment, information on Chubb. On October 19, 2012, the Department, in cooperation with the other supervisory college regulators, published a notice of its determination that it is the appropriate group-wide supervisor for Chubb.
Since September 2012, the College has convened bi-annually in person; and in July 2017, the College convened its first interim College teleconference. During these meetings, the College reviewed, without adverse comment, information on Chubb. The next in-person College is scheduled for September 2018 in Philadelphia, Pennsylvania.
The following is an overview of regulations for our operations in Switzerland, the U.S., Bermuda, and other international locations.
Swiss Operations
The Swiss Financial Market Supervisory Authority (FINMA) has the discretion to supervise Chubb on a group-wide basis. However, FINMA acknowledges the Department's assumption of group supervision over us.
In 2008, we formed Chubb Insurance (Switzerland) Limited which offers property and casualty insurance to Swiss companies, A&H insurance for individuals of Swiss Corporations as well as reinsurance predominantly in Continental Europe. We have also formed a reinsurance subsidiary named Chubb Reinsurance (Switzerland) Limited, which we operate as primarily a provider of reinsurance to Chubb entities. Both companies are licensed and governed by FINMA.
12
U.S. Operations
Our U.S. insurance subsidiaries are subject to extensive regulation and supervision by the states in which they do business. The laws of the various states establish departments of insurance with broad authority to regulate, among other things: the standards of solvency that must be met and maintained, the licensing of insurers and their producers, approval of policy forms and rates, the nature of and limitations on investments, restrictions on the size of the risks which may be insured under a single policy, deposits of securities for the benefit of policyholders, requirements for the acceptability of reinsurers, periodic examinations of the affairs of insurance companies, the form and content of reports of financial condition required to be filed, and the adequacy of reserves for unearned premiums, losses, and other exposures.
Our U.S. insurance subsidiaries are required to file detailed annual and quarterly reports with state insurance regulators. In addition, our U.S. insurance subsidiaries' operations and financial records are subject to examination at regular intervals by state regulators.
All states have enacted legislation that regulates insurance holding companies. This legislation provides that each insurance company in the insurance holding company system (system) is required to register with the insurance department of its state of domicile and furnish information concerning the operations of companies within the system that may materially affect the operations, management, or financial condition of the insurers within the system. We are required to file an annual enterprise risk report with the Department, identifying the material risks within our system that could pose enterprise risk to the insurance subsidiaries in the system. All transactions within a system must be fair and equitable. Notice to the insurance departments is required prior to the consummation of transactions affecting the ownership or control of an insurer and of certain material transactions between an insurer and an entity in its system. In addition, certain transactions may not be consummated without the department's prior approval.
We are also required to file an annual summary report with the Department, reflecting our internal assessment of material risks associated with our current business plan and the sufficiency of our capital resources to support those risks.
Statutory surplus is an important measure used by the regulators and rating agencies to assess our U.S. insurance subsidiaries' ability to support business operations and provide dividend capacity. Our U.S. insurance subsidiaries are subject to various state statutory and regulatory restrictions that limit the amount of dividends that may be paid without prior approval from regulatory authorities. These restrictions differ by state, but are generally based on calculations incorporating statutory surplus, statutory net income, and/or investment income.
The NAIC has a risk-based capital requirement for P&C insurance companies. This risk-based capital formula is used by many state regulatory authorities to identify insurance companies that may be undercapitalized and which merit further regulatory attention. These requirements are designed to monitor capital adequacy using a formula that prescribes a series of risk measurements to determine a minimum capital amount for an insurance company, based on the profile of the individual company. The ratio of a company's actual policyholder surplus to its minimum capital requirement will determine whether any state regulatory action is required. There are progressive risk-based capital failure levels that trigger more stringent regulatory action. If an insurer's policyholders' surplus falls below the Mandatory Control Level (70 percent of the Authorized Control Level, as defined by the NAIC), the relevant insurance commissioner is required to place the insurer under regulatory control.
However, an insurance regulator may allow a P&C company operating below the Mandatory Control Level that is writing no business and is running off its existing business to continue its run-off. Brandywine is running off its liabilities consistent with the terms of an order issued by the Insurance Commissioner of Pennsylvania. This includes periodic reporting obligations to the Department.
Government intervention has also occurred in the insurance and reinsurance markets in relation to terrorism coverage in the U.S. (and through industry initiatives in other countries). The U.S. Terrorism Risk Insurance Act (TRIA), which was enacted in 2002 to ensure the availability of insurance coverage for certain types of terrorist acts in the U.S., was extended in 2015 for six years, through December 31, 2020, and applies to certain of our operations.
From time to time, Chubb and its subsidiaries and affiliates receive inquiries from state agencies and attorneys general, with which we generally comply, seeking information concerning business practices, such as underwriting and non-traditional or loss mitigation insurance products. Moreover, many recent factors, such as consequences of and reactions to industry and economic conditions and focus on domestic issues, have contributed to the potential for change in the legal and regulatory framework applicable to Chubb's U.S. operations and businesses. We cannot assure that changes in laws or investigative or enforcement
13
activities in the various states in the U.S. will not have a material adverse impact on our financial condition, results of operations, or business practices.
We are subject to numerous U.S. federal and state laws governing the protection of personal and confidential information of our clients or employees. These laws and regulations are increasing in complexity, and the requirements are extensive and detailed. Several states, including New York and Connecticut, require us to certify our compliance with their data protection laws.
On March 1, 2017, we became subject to the New York Department of Financial Services’ Cybersecurity Regulation (the NYDFS Cybersecurity Regulation) which mandates detailed cybersecurity standards for all institutions, including insurance entities, authorized by the NYDFS to operate in New York. Among the requirements are the maintenance of a cybersecurity program with governance controls, risk-based minimum data security standards for technology systems, cyber breach preparedness and response requirements, including reporting obligations, vendor oversight, training, and program record keeping and certification obligations. Because our North America systems are integrated our companies domiciled in other states may also be impacted by this requirement.
Additionally, on October 24, 2017, the National Association of Insurance Commissioners (NAIC) adopted an Insurance Data Security Model Law, which would require licensed insurance entities to comply with detailed information security requirements. The NAIC model law is similar in many respects to the NYDFS Cybersecurity Regulation.
Bermuda Operations
The Insurance Act 1978 of Bermuda and related regulations, as amended (the Insurance Act), regulates the insurance business of our Bermuda domiciled (re)insurance subsidiaries (Bermuda domiciled subsidiaries) and provides that no person may carry on any insurance business in or from within Bermuda unless registered as an insurer by the Bermuda Monetary Authority (BMA). The Insurance Act imposes solvency and liquidity standards and auditing and reporting requirements on Bermuda insurance companies and grants the BMA powers to supervise, investigate, and intervene in the affairs of insurance companies.
Bermuda domiciled subsidiaries must prepare and file with the BMA, audited annual statutory financial statements and audited annual financial statements prepared in accordance with accounting principles generally accepted in the U.S. (GAAP), International Financial Reporting Standards (IFRS), or any such other generally accepted accounting principles as the BMA may recognize. These audited financial statements are made public by the BMA. The Insurance Act prescribes rules for the preparation and content of the statutory financial statements that require Bermuda domiciled subsidiaries to give detailed information and analyses regarding premiums, claims, reinsurance, and investments. In addition, commencing with the 2016 financial year end filing, the Bermuda domiciled subsidiaries are required to prepare and publish a Financial Condition Report (FCR). The FCR provides details of measures governing the business operations, corporate governance framework, solvency and financial performance. The FCR must be filed with the BMA and requires Bermuda insurance companies to make the FCR publicly available.
Effective January 1, 2016, Bermuda implemented a new solvency and risk management regime which has been deemed equivalent to the EU’s Solvency II regime. Bermuda statutory reporting rules have been amended to introduce an economic balance sheet (EBS) framework. The Bermuda domiciled subsidiaries submitted their first annual filings under the EBS framework in April 2017.
Bermuda’s regulatory regime provides a risk-based capital model, termed the Bermuda Solvency Capital Requirement (BSCR), as a tool to assist the BMA both in measuring risk and in determining appropriate levels of capitalization. The BSCR employs a standard mathematical model that correlates the risk underwritten by Bermuda insurers to their capital. The BSCR framework applies a standard measurement format to the risk associated with an insurer's assets, liabilities, and premiums, including a formula to take into account catastrophe risk exposure.
The BMA established risk-based regulatory capital adequacy and solvency margin requirements for Bermuda insurers that mandate that a Bermuda domiciled subsidiary’s Enhanced Capital Requirement (ECR) be calculated by either (a) BSCR, or (b) an internal capital model which the BMA has approved for use for this purpose. The Bermuda domiciled subsidiaries use the BSCR in calculating their solvency requirements. The EBS framework is embedded as part of the BSCR and forms the basis of our ECR.
In order to minimize the risk of a shortfall in capital arising from an unexpected adverse deviation and in moving towards the implementation of a risk based capital approach, the BMA has established a threshold capital level, (termed the Target Capital
14
Level (TCL)), set at 120 percent of ECR, that serves as an early warning tool for the BMA and failure to maintain statutory capital at least equal to the TCL will likely result in increased BMA regulatory oversight.
Under the Insurance Act, Chubb's Bermuda domiciled subsidiaries are prohibited from declaring or paying any dividends of more than 25 percent of total statutory capital and surplus, as shown in its previous financial year statutory balance sheet, unless at least seven days before payment of the dividends, it files with the BMA an affidavit that it will continue to meet its required solvency margins. Furthermore, Bermuda domiciled subsidiaries may only declare and pay a dividend from retained earnings and a dividend or distribution from contributed surplus if it has no reasonable grounds for believing that it is, or would after the payment be, unable to pay its liabilities as they become due, or if the realizable value of its assets would not be less than the aggregate of its liabilities and its issued share capital and share premium accounts.
In addition, Chubb's Bermuda domiciled subsidiaries must obtain the BMA's prior approval before reducing total statutory capital, as shown in its previous financial year statutory balance sheet, by 15 percent or more.
Other International Operations
The extent of insurance regulation varies significantly among the countries in which non-U.S. Chubb operations conduct business. While each country imposes licensing, solvency, auditing, and financial reporting requirements, the type and extent of the requirements differ substantially. For example:
|
•
|
in some countries, insurers are required to prepare and file monthly and/or quarterly financial reports, and in others, only annual reports;
|
|
•
|
some regulators require intermediaries to be involved in the sale of insurance products, whereas other regulators permit direct sales contact between the insurer and the customer;
|
|
•
|
the extent of restrictions imposed upon an insurer's use of local and offshore reinsurance vary;
|
|
•
|
policy form filing and rate regulation vary by country;
|
|
•
|
the frequency of contact and periodic on-site examinations by insurance authorities differ by country; and
|
|
•
|
regulatory requirements relating to insurer dividend policies vary by country.
|
Significant variations can also be found in the size, structure, and resources of the local regulatory departments that oversee insurance activities. Certain regulators prefer close relationships with all subject insurers and others operate a risk-based approach.
Chubb operates in some countries through subsidiaries and in some countries through branches of subsidiaries. Local capital requirements applicable to a subsidiary generally include its branches. Certain Chubb companies are jointly owned with local companies to comply with legal requirements for local ownership. Other legal requirements include discretionary licensing procedures, compulsory cessions of reinsurance, local retention of funds and records, data privacy and protection program requirements, and foreign exchange controls. Chubb's international companies are also subject to multinational application of certain U.S. laws.
There are various regulatory bodies and initiatives that impact Chubb in multiple international jurisdictions and the potential for significant impact on Chubb could be heightened as a result of recent industry and economic developments.
On March 29, 2017, the UK government gave notice to the European Union (EU), under Article 50(2) of the Treaty on EU, of the UK’s intention to withdraw from the EU. The UK is currently in the process of negotiating a withdrawal agreement. If the UK leaves the EU as expected in March 2019, we intend to locate our EU headquarters in France. The decision to choose France as the headquarters for our Continental European operations is contingent upon receiving all necessary regulatory and other governmental approvals, which might not be obtained in a timely manner or at all.
The EU’s General Data Protection Regulation (GDPR) comes into effect on May 25, 2018, and requires businesses operating in the EU or foreign business offering goods and services to or monitoring the behavior of customers in the EU, to comply with onerous accountability obligations and significantly enhanced conditions to processing personal data. For example, the GDPR has more rigorous rules for obtaining consent on the use of personal data and more stringent guidelines to demonstrate compliance. The GDPR also has specific requirements regarding the transfer of data out of the EU, including only transfers to countries deemed to have adequate data protection laws.
15
The EU’s executive body, the European Commission, implemented a new capital adequacy and risk management regulations for the European insurance industry, known as Solvency II, which aims to establish a revised set of EU-wide capital requirements and risk management standards that replaced the Solvency I requirements. The Solvency II requirements were effective January 1, 2016 for our European operations. Our capital management strategies, results of operations, and financial condition were not materially affected by the Solvency II requirements.
Enterprise Risk Management
As an insurer, Chubb is in the business of profitably managing risk for its customers. Since risk management must permeate an organization conducting a global insurance business, we have an established Enterprise Risk Management (ERM) framework that is integrated into management of our businesses and is led by Chubb's senior management. As a result, ERM is a part of the day-to-day management of Chubb and its operations.
Our global ERM framework is broadly multi-disciplinary and its objectives include:
|
•
|
External Risks
: identify, analyze, quantify, and where possible, mitigate significant external risks that could materially hamper the financial condition of Chubb and/or the achievement of corporate business objectives over the next 36 months;
|
|
•
|
Exposure Accumulations
: identify and quantify the accumulation of exposure to individual counterparties, products or industry sectors, particularly those that materially extend across or correlate between business units or divisions and/or the balance sheet;
|
|
•
|
Risk Modeling
: develop and use various data-sets, analytical tools, metrics and processes (including economic capital models and advanced analytics) that help business and corporate leaders make informed underwriting, portfolio management and risk management decisions within a consistent risk/reward framework;
|
|
•
|
Governance
: establish and coordinate risk guidelines that reflect the corporate appetite for risk, monitor exposure accumulations relative to established guidelines, and ensure effective internal risk management communication up to management and the Board, down to the various business units and legal entities, and across the firm; and
|
|
•
|
Disclosure
: develop protocols and processes for risk-related disclosure internally as well as externally to rating agencies, regulators, shareholders and analysts.
|
Chubb Group's Risk and Underwriting Committee (RUC) reports to and assists the Chief Executive Officer in the oversight and review of the ERM framework which covers the processes and guidelines used to manage insurance risk, financial risk, strategic risk, and operational risk. The RUC is chaired by Chubb Group’s Chief Risk Officer. The RUC meets at least monthly, and is comprised of Chubb Group's most senior executives, in addition to the Chair, including the Chief Executive Officer, Chief Operating Officer, Chief Financial Officer, Chief Investment Officer, Chief Claims Officer, General Counsel, President – North America Commercial and Personal Insurance, President – North America Major Accounts and Specialty Insurance, President – Overseas General Insurance, and Chief Underwriting Officer.
The RUC is assisted in its activities by Chubb's Enterprise Risk Unit (ERU) and Product Boards. The ERU is responsible for the collation and analysis of risk insight in two key areas. First, external information that provides insight to the RUC on existing or emerging risks that might significantly impact Chubb's key objectives and second, internal risk aggregations arising from Chubb's business writings and other activities such as investments and operations. The ERU is independent of the operating units and reports to our Chief Risk Officer. The Product Boards exist to provide oversight for products that we offer globally. A Product Board currently exists for each of Chubb's major product areas. Each Product Board is responsible for ensuring consistency in underwriting and pricing standards, identification of emerging issues, and guidelines for relevant accumulations.
Chubb's Chief Risk Officer also reports to the Board's Risk & Finance Committee, which helps execute the Board's supervisory responsibilities pertaining to ERM. The role of the Risk & Finance Committee includes evaluation of the integrity and effectiveness of our ERM procedures, systems, and information; governance on major policy decisions pertaining to risk aggregation and minimization; and assessment of our major decisions and preparedness levels pertaining to perceived material risks. The Audit Committee meets annually and on an as needed basis with the Risk & Finance Committee in order to exercise its duties under New York Stock Exchange Rules.
Others within the ERM structure contribute toward accomplishing Chubb's ERM objectives, including regional management, Corporate Underwriting, Internal Audit, Compliance, external consultants, and managers of our internal control processes and procedures.
16
Tax Matters
Refer to “Risk Factors”, under Item 1A and Note
1
o) and Note 8 to the Consolidated Financial Statements, under Item 8.
EXECUTIVE OFFICERS OF THE REGISTRANT
|
Name
|
Age
|
Position
|
|
Evan G. Greenberg
|
63
|
Chairman, President, Chief Executive Officer, and Director
|
|
John W. Keogh
|
53
|
Executive Vice Chairman and Chief Operating Officer
|
|
Philip V. Bancroft
|
58
|
Executive Vice President and Chief Financial Officer
|
|
John J. Lupica
|
52
|
Vice Chairman; President, North America Major Accounts & Specialty Insurance
|
|
Joseph F. Wayland
|
60
|
Executive Vice President and General Counsel
|
|
Sean Ringsted
|
54
|
Executive Vice President, Chief Digital Officer, and Chief Risk Officer
|
|
Timothy A. Boroughs
|
68
|
Executive Vice President and Chief Investment Officer
|
|
Paul J. Krump
|
58
|
Executive Vice President; President, North America Commercial and Personal Insurance
|
|
Juan C. Andrade
|
52
|
Executive Vice President; President, Overseas General Insurance
|
Evan G. Greenberg has been a director of Chubb Limited since August 2002. Mr. Greenberg was elected Chairman of the Board of Directors in May 2007. Mr. Greenberg was a director of The Coca-Cola Company from February 2011 until his resignation in October 2016. Mr. Greenberg was appointed to the position of President and Chief Executive Officer of Chubb Limited in May 2004, and in June 2003, was appointed President and Chief Operating Officer of Chubb Limited. Mr. Greenberg was appointed to the position of Chief Executive Officer of Chubb Overseas General in April 2002. He joined Chubb as Vice Chairman, Chubb Limited, and Chief Executive Officer of Chubb Tempest Re in November 2001. Prior to joining Chubb, Mr. Greenberg was most recently President and Chief Operating Officer of American International Group (AIG), a position he held from 1997 until 2000.
John W. Keogh was appointed Executive Vice Chairman of Chubb Limited in November 2015. Mr. Keogh has served as Chief Operating Officer of Chubb Limited since July 2011 and Vice Chairman of Chubb Limited and Chubb Group Holdings since August 2010. Mr. Keogh joined Chubb as Chief Executive Officer of Overseas General Insurance in April 2006 and became Chairman of Overseas General Insurance in August 2010. Prior to joining Chubb, Mr. Keogh served as Senior Vice President, Domestic General Insurance of AIG, and President and Chief Executive Officer of National Union Fire Insurance Company, AIG's member company that specializes in D&O and fiduciary liability coverages. Mr. Keogh joined AIG in 1986. He served in a number of other senior positions there including as Executive Vice President of AIG's Domestic Brokerage Group and as President and Chief Operating Officer of AIG's Lexington Insurance Company unit.
Philip V. Bancroft was appointed Chief Financial Officer of Chubb Limited in January 2002. For nearly 20 years, Mr. Bancroft worked for PricewaterhouseCoopers LLP. Prior to joining Chubb, he served as partner-in-charge of the New York Regional Insurance Practice. Mr. Bancroft had been a partner with PricewaterhouseCoopers LLP for ten years.
John J. Lupica was appointed President, North America Major Accounts & Specialty Insurance in January 2016, Vice Chairman of Chubb Limited and Chubb Group Holdings in November 2013 and Chairman, Insurance - North America, in July 2011. Mr. Lupica had been Chief Operating Officer, Insurance - North America, since 2010 and President of ACE USA since 2006. He also previously served as Division President of U.S. Professional Risk business and U.S. Regional Operations. Mr. Lupica joined Chubb
as Executive Vice President of Professional Risk in 2000. Prior to joining Chubb, he served as Senior Vice President for Munich-American Risk Partners, Inc. He also held various management positions at AIG.
Joseph F. Wayland was appointed Executive Vice President of Chubb Limited in January 2016, General Counsel and Secretary of Chubb Limited in July 2013. Mr. Wayland joined Chubb from the law firm of Simpson Thacher & Bartlett LLP, where he was a partner since 1994. From 2010 to 2012, he served in the United States Department of Justice, first as Deputy Assistant Attorney General of the Antitrust Division, and was later appointed as the Acting Assistant Attorney General in charge of that division.
Sean Ringsted was appointed Executive Vice President and Chief Digital Officer in February 2017 and Chief Risk Officer in November 2008. Mr. Ringsted previously served as Chief Actuary of Chubb Limited from November 2008 to January 2017. Mr.
17
Ringsted’s previous roles at Chubb also include Chief Actuary for Chubb Group from 2004 to 2008, Executive Vice President and Chief Risk Officer for Chubb Tempest Re from 2002 to 2004, and Senior Vice President and Chief Actuary for Chubb Tempest Re from 1998 to 2002. Prior to joining Chubb, Mr. Ringsted was a consultant at Tillinghast-Towers Perrin.
Timothy A. Boroughs was appointed Executive Vice President and Chief Investment Officer of Chubb Group in June 2000. Prior to joining Chubb, Mr. Boroughs was Director of Fixed Income at Tudor Investment Corporation from 1997 to 2000, and Managing Partner and Director of Global Leveraged Investment Activity at Fischer Francis Trees & Watts from 1976 to 1997.
Paul J. Krump was appointed Executive Vice President, Chubb Group and President North America Commercial and Personal Insurance in January 2016. Prior to Chubb Limited’s January 2016 acquisition of The Chubb Corporation, Mr. Krump was Chief Operating Officer of The Chubb Corporation, responsible for the company’s Commercial, Specialty, Personal and Accident & Health insurance lines; Claims; Global Field Operations; Information Technology; Human Resources; Communications; and External Affairs. Mr. Krump joined The Chubb Corporation in 1982 as a commercial underwriting trainee in the Minneapolis office. He held numerous headquarters and field positions in the United States and Europe, including President of Personal Lines and Claims and President of Commercial and Specialty Lines.
Juan C. Andrade was appointed Executive Vice President, Chubb Group and President, Overseas General Insurance in January 2016. Mr. Andrade joined Chubb in December 2010 to lead the global personal lines and small commercial property & casualty insurance businesses. In January 2013, he became the Chief Operating Officer for Overseas General Insurance. Prior to joining Chubb, Mr. Andrade was President and Chief Operating Officer of property & casualty operations for The Hartford Financial Services Group. He joined The Hartford in 2006 as head of the property & casualty claims organization.
Factors that could have a material impact on our results of operations or financial condition are outlined below. Additional risks not presently known to us or that we currently deem insignificant may also impair our business or results of operations as they become known or as facts and circumstances change. Any of the risks described below could result in a material adverse effect on our results of operations or financial condition.
Insurance
Our results of operations or financial condition could be adversely affected by the occurrence of natural and man-made disasters.
We have substantial exposure to losses resulting from natural disasters, man-made catastrophes such as terrorism or cyber-attack, and other catastrophic events, including pandemics. This could impact a variety of our businesses, including our commercial and personal lines, and life and accident and health (A&H) products. Catastrophes can be caused by various events, including hurricanes, typhoons, earthquakes, hailstorms, drought, explosions, severe winter weather, fires, war, acts of terrorism, nuclear accidents, political instability, and other natural or man-made disasters, including a global or other wide-impact pandemic or a significant cyber-attack. 2017 witnessed a particularly significant set of catastrophes, principally in the form of Hurricanes Harvey, Irma and Maria; the Mexican earthquakes; and the California wildfires. The incidence and severity of catastrophes are inherently unpredictable and our losses from catastrophes could be substantial. In addition, climate conditions may be changing, primarily through changes in global temperatures, which may increase the frequency and severity of natural catastrophes and the resulting losses in the future. We cannot predict the impact that changing climate conditions, if any, may have on our results of operations or our financial condition. Additionally, we cannot predict how legal, regulatory and/or social responses to concerns around global climate change may impact our business. The occurrence of claims from catastrophic events could result in substantial volatility in our results of operations or financial condition for any fiscal quarter or year. The historical incidence for events such as earthquakes, pandemics and cyber-attacks is infrequent and may not be representative of contemporary exposures and risks. As an example, increases in the values and concentrations of insured property may increase the severity of these occurrences in the future. Although we attempt to manage our exposure to such events through the use of underwriting controls, risk models, and the purchase of third-party reinsurance, catastrophic events are inherently unpredictable and the actual nature of such events when they occur could be more frequent or severe than contemplated in our pricing and risk management expectations. As a result, the occurrence of one or more catastrophic events could have an adverse effect on our results of operations and financial condition.
If actual claims exceed our loss reserves, our financial results could be adversely affected.
Our results of operations and financial condition depend upon our ability to accurately assess the potential losses associated with the risks that we insure and reinsure. We establish reserves for unpaid losses and loss expenses, which are estimates of future payments of reported and unreported claims for losses and related expenses, with respect to insured events that have
18
occurred at or prior to the balance sheet date. The process of establishing reserves can be highly complex and is subject to considerable variability as it requires the use of informed estimates and judgments.
Actuarial staff in each of our segments regularly evaluates the levels of loss reserves. Any such evaluation could result in future changes in estimates of losses or reinsurance recoverables and would be reflected in our results of operations in the period in which the estimates are changed. Losses and loss expenses are charged to income as incurred. During the loss settlement period, which can be many years in duration for some of our lines of business, additional facts regarding individual claims and trends often will become known which may result in a change in overall reserves. In addition, application of statistical and actuarial methods may require the adjustment of overall reserves upward or downward from time to time.
Included in our loss reserves are liabilities for latent claims such as asbestos and environmental (A&E), which are principally related to claims arising from remediation costs associated with hazardous waste sites and bodily-injury claims related to exposure to asbestos products and environmental hazards. At
December 31, 2017
, gross A&E liabilities represented approximately
3.5 percent
of our loss reserves. The estimation of these liabilities is subject to many complex variables including: the current legal environment; specific settlements that may be used as precedents to settle future claims; assumptions regarding trends with respect to claim severity and the frequency of higher severity claims; assumptions regarding the ability to allocate liability among defendants (including bankruptcy trusts) and other insurers; the ability of a claimant to bring a claim in a state in which it has no residency or exposure; the ability of a policyholder to claim the right to non-products coverage; whether high-level excess policies have the potential to be accessed given the policyholder's claim trends and liability situation; payments to unimpaired claimants; and the potential liability of peripheral defendants. Accordingly, the ultimate settlement of losses, arising from either latent or non-latent causes, may be significantly greater or less than the loss and loss expense reserves held at the balance sheet date. In particular the amount and timing of the settlement of our P&C liabilities are not determinate and our actual payments could be higher than contemplated in our loss reserves owing to the impact of insurance, judicial decisions, and/or social inflation. If our loss reserves are determined to be inadequate, we may be required to increase loss reserves at the time of the determination and our net income and capital may be reduced.
The effects of emerging claim and coverage issues on our business are uncertain.
As industry practices and legislative, regulatory, judicial, social, financial, technology and other environmental conditions change, unexpected and unintended issues related to claims and coverage may emerge. These issues may adversely affect our business by either extending coverage beyond our underwriting intent or by increasing the frequency and severity of claims. In some instances, these changes may not become apparent until after we have issued insurance or reinsurance contracts that are affected by the changes. As a result, the full extent of liability under our insurance or reinsurance contracts may not be known for many years after issuance.
The failure of any of the loss limitation methods we use could have an adverse effect on our results of operations and financial condition.
We seek to manage our loss exposure by maintaining a disciplined underwriting process throughout our insurance operations. We also look to limit our loss exposure by writing a number of our insurance and reinsurance contracts on an excess of loss basis. Excess of loss insurance and reinsurance indemnifies the insured against losses in excess of a specified amount. In addition, we limit program size for each client and purchase third-party reinsurance for our own account. In the case of our assumed proportional reinsurance treaties, we seek per occurrence limitations or loss and loss expense ratio caps to limit the impact of losses ceded by the client. In proportional reinsurance, the reinsurer shares a proportional part of the premiums and losses of the reinsured. We also seek to limit our loss exposure by geographic diversification. Geographic zone limitations involve significant underwriting judgments, including the determination of the area of the zones and the inclusion of a particular policy within a particular zone's limits.
However, there are inherent limitations in all of these tactics and no assurance can be given against the possibility of an event or series of events that could result in loss levels that could have an adverse effect on our financial condition or results of operations. It is also possible that losses could manifest themselves in ways that we do not anticipate and that our risk mitigation strategies are not designed to address. Additionally, various provisions of our policies, such as limitations or exclusions from coverage or choice of forum negotiated to limit our risks, may not be enforceable in the manner we intend. As a result, one or more natural catastrophes and/or terrorism or other events could result in claims that substantially exceed our expectations, which could have an adverse effect on our results of operations and financial condition.
19
We may be unable to purchase reinsurance, and/or if we successfully purchase reinsurance, we are subject to the possibility of non-payment.
We purchase protection from third parties including, but not limited to, reinsurance to protect against catastrophes and other sources of volatility, to increase the amount of protection we can provide our clients, and as part of our overall risk management strategy. Our reinsurance business also purchases retrocessional protection which allows a reinsurer to cede to another company all or part of the reinsurance originally assumed by the reinsurer. A reinsurer's or retrocessionaire's insolvency or inability or unwillingness to make timely payments under the terms of its reinsurance agreement with us could have an adverse effect on us because we remain liable to the insured. From time to time, market conditions have limited, and in some cases have prevented, insurers and reinsurers from obtaining the types and amounts of reinsurance or retrocessional reinsurance that they consider adequate for their business needs.
There is no guarantee our desired amounts of reinsurance or retrocessional reinsurance will be available in the marketplace in the future. In addition to capacity risk, the remaining capacity may not be on terms we deem appropriate or acceptable or with companies with whom we want to do business. Finally, we face some degree of counterparty risk whenever we purchase reinsurance or retrocessional reinsurance. Consequently, the insolvency of these counterparties, or the inability, or unwillingness of any of our present or future reinsurers to make timely payments to us under the terms of our reinsurance or retrocessional agreements could have an adverse effect on us. At
December 31, 2017
, we had $15.2 billion of reinsurance recoverables, net of reserves for uncollectible recoverables.
Certain active Chubb companies are primarily liable for A&E and other exposures they have reinsured to our inactive run-off company Century Indemnity Company (Century). At
December 31, 2017
, the aggregate reinsurance balances ceded by our active subsidiaries to Century were approximately
$1.4 billion
. Should Century's loss reserves experience adverse development in the future and should Century be placed into rehabilitation or liquidation, the reinsurance recoverables due from Century to its affiliates would be payable only after the payment in full of third party expenses and liabilities, including administrative expenses and direct policy liabilities. Thus, the intercompany reinsurance recoverables would be at risk to the extent of the shortage of assets remaining to pay these recoverables. While we believe the intercompany reinsurance recoverables from Century are not impaired at this time, we cannot assure that adverse development with respect to Century's loss reserves, if manifested, will not result in Century's insolvency, which could result in our recognizing a loss to the extent of any uncollectible reinsurance from Century. This could have an adverse effect on our results of operations and financial condition.
Our net income may be volatile because certain products sold by our Life Insurance business expose us to reserve and fair value liability changes that are directly affected by market and other factors and assumptions.
Our pricing, establishment of reserves for future policy benefits and valuation of life insurance and annuity products, including reinsurance programs, are based upon various assumptions, including but not limited to equity market changes, interest rates, mortality rates, morbidity rates, and policyholder behavior. The process of establishing reserves for future policy benefits relies on our ability to accurately estimate insured events that have not yet occurred but that are expected to occur in future periods. Significant deviations in actual experience from assumptions used for pricing and for reserves for future policy benefits could have an adverse effect on the profitability of our products and our business.
Under reinsurance programs covering variable annuity guarantees, we assumed the risk of guaranteed minimum death benefits (GMDB) and guaranteed living benefits (GLB) associated with variable annuity contracts. Our GLB liability includes guaranteed minimum income benefits (GMIB) and guaranteed minimum accumulation benefits (GMAB). We ceased writing this business in 2007. Our net income is directly impacted by changes in the reserves calculated in connection with the reinsurance of GMDB and GLB liabilities. In addition, our net income is directly impacted by the change in the fair value of the GLB liability. Reported liabilities for both GMDB and GLB reinsurance are determined using internal valuation models which require considerable judgment and are subject to significant uncertainty. Refer to the “Critical Accounting Estimates – Guaranteed living benefits (GLB) derivatives” under Item 7 and “Quantitative and Qualitative Disclosures about Market Risk – Reinsurance of GMDB and GLB guarantees” under Item 7A for additional information on the assumptions used in this program. We view our variable annuity reinsurance business as having a similar risk profile to that of catastrophe reinsurance, with the probability of long-term economic loss relatively small at the time of pricing. Adverse changes in market factors and policyholder behavior will have an impact on both Life Insurance underwriting income and consolidated net income.
Payment of obligations under surety bonds could have an adverse effect on our results of operations.
The surety business tends to be characterized by infrequent but potentially high severity losses. The majority of our surety obligations are intended to be performance-based guarantees. When losses occur, they may be mitigated, at times, by recovery rights to the customer’s assets, contract payments, and collateral and bankruptcy recoveries. We have substantial commercial and construction surety exposure for current and prior customers. In that regard, we have exposures related to surety bonds
20
issued on behalf of companies that have experienced or may experience deterioration in creditworthiness. If the financial condition of these companies were adversely affected by the economy or otherwise, we may experience an increase in filed claims and may incur high severity losses, which could have an adverse effect on our results of operations.
Our exposure to counterparties in various industries, our reliance on brokers, and certain of our policies may subject us to credit risk.
We have exposure to counterparties through reinsurance and in various industries, including banks, hedge funds and other investment vehicles, and derivative transactions that expose us to credit risk in the event our counterparty fails to perform its obligations. We also have exposure to financial institutions in the form of secured and unsecured debt instruments and equity securities.
In accordance with industry practice, we generally pay amounts owed on claims to brokers who, in turn, remit these amounts to the insured or ceding insurer. Although the law is unsettled and depends upon the facts and circumstances of the particular case, in some jurisdictions, if a broker fails to make such a payment, we might remain liable to the insured or ceding insurer for the deficiency. Conversely, in certain jurisdictions, if a broker does not remit premiums paid for these policies over to us, these premiums might be considered to have been paid and the insured or ceding insurer will no longer be liable to us for those amounts, whether or not we have actually received the premiums from the broker. Consequently, we assume a degree of credit risk associated with a broker with whom we transact business. However, due to the unsettled and fact-specific nature of the law, we are unable to quantify our exposure to this risk. To date, we have not experienced any material losses related to these credit risks.
Under the terms of certain high-deductible policies which we offer, such as workers’ compensation and general liability, our customers are responsible to reimburse us for an agreed-upon dollar amount per claim. In nearly all cases we are required under such policies to pay covered claims first, and then seek reimbursement for amounts within the applicable deductible from our customers. This obligation subjects us to credit risk from these customers. While we generally seek to mitigate this risk through collateral agreements and maintain a provision for uncollectible accounts associated with this credit exposure, an increased inability of customers to reimburse us in this context could have an adverse effect on our financial condition and results of operations. In addition, a lack of credit available to our customers could impact our ability to collateralize this risk to our satisfaction, which in turn, could reduce the amount of high-deductible policies we could offer.
Since we depend on a few distribution partners for a large portion of our revenues, loss of business provided by any one of them could adversely affect us.
We market our insurance and reinsurance worldwide primarily through independent insurance agents and insurance and reinsurance brokers. Accordingly, our business is dependent on the willingness of these agents and brokers to recommend our products to their customers, who may also promote and distribute the products of our competitors. Deterioration in relationships with our agent and broker distribution network or their increased promotion and distribution of our competitors' products could adversely affect our ability to sell our products. Loss of all or a substantial portion of the business provided by one or more of these agents and brokers could have an adverse effect on our business.
Financial
Our investment performance may affect our financial results and our ability to conduct business.
Our investment assets are invested by professional investment management firms under the direction of our management team in accordance with investment guidelines approved by the Risk & Finance Committee of the Board of Directors. Although our investment guidelines stress diversification of risks and conservation of principal and liquidity, our investments are subject to market risks and risks inherent in individual securities. Interest rates are highly sensitive to many factors, including inflation, monetary and fiscal policies, and domestic and international political conditions. The volatility of our losses may force us to liquidate securities, which may cause us to incur capital losses. Realized and unrealized losses in our investment portfolio would reduce our book value, and if significant, can affect our ability to conduct business.
Volatility in interest rates could impact the performance of our investment portfolio which could have an adverse effect on our investment income and operating results. Although we take measures to manage the risks of investing in a changing interest rate environment, we may not be able to effectively mitigate interest rate sensitivity. Our mitigation efforts include maintaining a high quality portfolio of primarily fixed income investments with a relatively short duration to reduce the effect of interest rate changes on book value. A significant increase in interest rates would generally have an adverse effect on our book value. Our life insurance investments typically focus on longer duration bonds to better match the obligations of this business. For the life insurance business, policyholder behavior may be influenced by changing interest rate conditions and require a re-balancing of duration to effectively manage our asset/liability position.
21
As stated, our fixed income portfolio is primarily invested in high quality, investment-grade securities. However, a smaller portion of the portfolio, approximately
13 percent
at
December 31, 2017
, is invested in below investment-grade securities. These securities, which pay a higher rate of interest, also have a higher degree of credit or default risk and may also be less liquid in times of economic weakness or market disruptions. While we have put in place procedures to monitor the credit risk and liquidity of our invested assets, it is possible that, in periods of economic weakness (such as recession), we may experience credit or default losses in our portfolio, which could adversely affect our results of operations and financial condition.
As a part of our ongoing analysis of our investment portfolio, we are required to assess whether the debt and equity securities we hold for which we have recorded an unrealized loss have been “other-than-temporarily impaired” under GAAP, which implies an inability to recover the full economic benefits of these securities. Refer to Note 3 to the Consolidated Financial Statements for additional information. This analysis requires a high degree of judgment and requires us to make certain assessments about the potential for recovery of the assets we hold. Declines in relevant stock and other financial markets, and other factors impacting the value of our investments, could result in impairments and could adversely affect our net income and other financial results.
We may require additional capital or financing sources in the future, which may not be available or may be available only on unfavorable terms.
Our future capital and financing requirements depend on many factors, including our ability to write new business successfully and to establish premium rates and reserves at levels sufficient to cover losses, as well as our investment performance and capital expenditure obligations, including with respect to acquisitions. We may need to raise additional funds through financings or access funds through existing or new credit facilities or through short-term repurchase agreements. We also from time to time seek to refinance debt or credit as amounts become due or commitments expire. Any equity or debt financing or refinancing, if available at all, may be on terms that are not favorable to us. In the case of equity financings, dilution to our shareholders could result, and in any case, such securities may have rights, preferences, and privileges that are senior to those of our Common Shares. Our access to funds under existing credit facilities is dependent on the ability of the banks that are parties to the facilities to meet their funding commitments. If we cannot obtain adequate capital or sources of credit on favorable terms, or at all, we could be forced to use assets otherwise available for our business operations, and our business, results of operations, and financial condition could be adversely affected.
We may be required to post additional collateral because of changes in our reinsurance liabilities to regulated insurance companies, or because of regulatory changes that affect our companies.
If our reinsurance liabilities increase, including in our property & casualty and variable annuity reinsurance businesses, we may be required to post additional collateral for insurance company clients. In addition, regulatory changes sometimes affect our obligations to post collateral. The need to post this additional collateral, if significant enough, may require us to sell investments at a loss in order to provide securities of suitable credit quality or otherwise secure adequate capital at an unattractive cost. This could adversely impact our net income and liquidity and capital resources.
U.S. and global economic and financial industry events and their consequences could harm our business, our liquidity and financial condition, and our stock price.
The consequences of adverse global or regional market and economic conditions may affect (among other aspects of our business) the demand for and claims made under our products, the ability of customers, counterparties, and others to establish or maintain their relationships with us, our ability to access and efficiently use internal and external capital resources, the availability of reinsurance protection, the risks we assume under reinsurance programs covering variable annuity guarantees, and our investment performance. Volatility in the U.S. and other securities markets may adversely affect our stock price.
A decline in our financial strength ratings could affect our standing among distribution partners and customers and cause our premiums and earnings to decrease. A decline in our debt ratings could increase our borrowing costs and impact our ability to access capital markets.
Ratings are an important factor in establishing the competitive position of insurance and reinsurance companies. The objective of these rating systems is to provide an opinion of an insurer's financial strength and ability to meet ongoing obligations to its policyholders. A ratings downgrade could result in a substantial loss of business as insureds, ceding companies, and brokers move to other insurers and reinsurers with higher ratings. If one or more of our debt ratings were downgraded, we could also incur higher borrowing costs, and our ability to access the capital markets could be impacted. Additionally, we could be required to post collateral or be faced with the cancellation of policies and resulting premium in certain circumstances. We cannot give any assurance regarding whether or to what extent any of the rating agencies might downgrade our ratings in the future.
22
Our ability to pay dividends and/or to make payments on indebtedness may be constrained by our holding company structure.
Chubb Limited is a holding company and does not have any significant operations or assets other than its ownership of the shares of its operating insurance and reinsurance subsidiaries. Dividends and other permitted distributions from our insurance subsidiaries are our primary source of funds to meet ongoing cash requirements, including any future debt service payments and other expenses, and to pay dividends to our shareholders. Some of our insurance subsidiaries are subject to significant regulatory restrictions limiting their ability to declare and pay dividends. The inability of our insurance subsidiaries to pay dividends in an amount sufficient to enable us to meet our cash requirements at the holding company level could have an adverse effect on our operations and our ability to pay dividends to our shareholders and/or meet our debt service obligations.
Our operating results and shareholders' equity may be adversely affected by currency fluctuations.
Our reporting currency is the U.S. dollar. In general, we match assets and liabilities in local currencies. Where possible, capital levels in local currencies are limited to satisfy minimum regulatory requirements and to support local insurance operations. The principal currencies creating foreign exchange risk are the British pound sterling, the euro, the Mexican peso, the Brazilian real, the Korean won, the Canadian dollar, the Japanese yen, the Thai baht, the Australian dollar, and the Hong Kong dollar. At
December 31, 2017
, approximately
27.7 percent
of our net assets were denominated in foreign currencies. We may experience losses resulting from fluctuations in the values of non-U.S. currencies, which could adversely impact our results of operations and financial condition.
Operational
The regulatory and political regimes under which we operate, and their volatility, could have an adverse effect on our business.
Our insurance and reinsurance subsidiaries conduct business globally. Our businesses in each jurisdiction are subject to varying degrees of regulation and supervision. The laws and regulations of the jurisdictions in which our insurance and reinsurance subsidiaries are domiciled require, among other things, maintenance of minimum levels of statutory capital, surplus, and liquidity; various solvency standards; and periodic examinations of subsidiaries' financial condition. In some jurisdictions, laws and regulations also restrict payments of dividends and reductions of capital. Applicable statutes, regulations, and policies may also restrict the ability of these subsidiaries to write insurance and reinsurance policies, to make certain investments, and to distribute funds. The purpose of insurance laws and regulations generally is to protect policyholders and ceding insurance companies, not our shareholders. For example, some jurisdictions have enacted various consumer protection laws that make it more burdensome for insurance companies to sell policies and interact with customers in personal lines businesses. Failure to comply with such regulations can lead to significant penalties and reputational injury. Fines and penalties in the U.S. in particular have been trending upwards.
The foreign and U.S. federal and state laws and regulations that are applicable to our operations are complex and may increase the costs of regulatory compliance or subject our business to the possibility of regulatory actions or proceedings. Laws and regulations not specifically related to the insurance industry include trade sanctions that relate to certain countries, anti-money laundering laws, and anti-corruption laws such as the U.S. Foreign Corrupt Practices Act, the U.K. Bribery Act 2010, the anti-bribery provisions of the Swiss Penal Code and similar local laws prohibiting corrupt payments to governmental officials. The insurance industry is also affected by political, judicial, and legal developments that may create new and expanded regulations and theories of liability. The current economic and financial climates present additional uncertainties and risks relating to increased regulation and the potential for increased involvement of the U.S. and other governments in the financial services industry.
Regulators in countries where we have operations are working with the International Association of Insurance Supervisors (IAIS) to consider changes to insurance company supervision, including with respect to group supervision and solvency requirements. The IAIS has developed a Common Framework for the Supervision of Internationally Active Insurance Groups (ComFrame) which is focused on the effective group-wide supervision of international active insurance groups (IAIGs), such as Chubb. As part of ComFrame, the IAIS has announced plans to develop an international capital standard for insurance groups. The details of ComFrame including this global capital standard and its applicability to Chubb are uncertain at this time. In addition, Chubb businesses across the EU are subject to Solvency II, a capital and risk management regime and our Bermuda businesses are subject to an equivalent of the EU's Solvency II regime. Also applicable to Chubb businesses are the requirements of the Swiss Financial Market Supervisory Authority (FINMA) whose regulations include Swiss Solvency Tests. There are also Risk Based Capital (RBC) requirements in the U.S. which are also subject to revision in response to global developments. While it is not
23
certain how or if these actions will impact Chubb, we do not currently expect that our capital management strategies, results of operations and financial condition will be materially affected by these regulatory changes.
In the event or absence of changes in applicable laws and regulations in particular jurisdictions, we may from time to time face challenges, or changes in approach to oversight of our business from insurance or other regulators, including challenges resulting from requiring the use of information technology that cannot be quickly adjusted to address new regulatory requirements.
We may not be able to comply fully with, or obtain appropriate exemptions from, applicable statutes and regulations and any changes thereto, which could have an adverse effect on our business. Failure to comply with or obtain appropriate authorizations and/or exemptions under any applicable laws and regulations could result in restrictions on our ability to do business or undertake activities that are regulated in one or more of the jurisdictions in which we conduct business and could subject us to fines and other sanctions.
Evolving privacy and data security regulations could adversely affect our business.
We are subject to numerous U.S. federal and state laws and non-U.S. regulations governing the protection of personal and confidential information of our clients or employees, including in relation to medical records, credit card data and financial information. These laws and regulations are increasing in complexity and number, change frequently and sometimes conflict.
We are subject to the New York Department of Financial Services’ Cybersecurity Regulation (the NYDFS Cybersecurity Regulation) which mandates detailed cybersecurity standards for all institutions, including insurance entities, authorized by the NYDFS to operate in New York. Among the requirements are the maintenance of a cybersecurity program with governance controls, risk-based minimum data security standards for technology systems, cyber breach preparedness and response requirements, including reporting obligations, vendor oversight, training, and program record keeping and certification obligations. The NYDFS Cybersecurity Regulation has increased our compliance costs and could increase the risk of noncompliance and subject us to regulatory enforcement actions and penalties, as well as reputation risk.
Additionally, on October 24, 2017, the National Association of Insurance Commissioners (NAIC) adopted an Insurance Data Security Model Law, which would require licensed insurance entities to comply with detailed information security requirements. The NAIC model law is similar in many respects to the NYDFS Cybersecurity Regulation. It is not yet known whether or not, and to what extent, states legislatures or insurance regulators where we operate will enact the Insurance Data Security Model Law in whole or in part, or in a modified form. Such enactments, especially if inconsistent between states or with existing laws and regulations could raise compliance costs or increase the risk of noncompliance, with the attendant risk of being subject to regulatory enforcement actions and penalties, as well as reputational harm. Any such events could potentially have an adverse impact on our business, financial condition or results of operations.
We operate in a number of countries outside of the U.S. whose laws may in some cases be more stringent than the requirements in the U.S. For example, European Union (EU) member countries have specific requirements relating to cross-border transfers of personal information to certain jurisdictions, including to the U.S. In addition, some countries provide stronger individual rights and have stricter consumer notice and/or consent requirements for the collection, use or sharing of personal information and more stringent requirements relating to organizations’ privacy programs. Moreover, international privacy and data security regulations may become more complex and have greater consequences.
May 25, 2018 is the date on which enforcement begins for the General Data Protection Regulation (the “GDPR”) that was adopted by the EU in 2016 as a comprehensive regulation for all EU member states. All of our business units (regardless of whether they are located in the EU) may be subject to the GDPR when personal data is processed in relation to the offer of goods and services to individuals within the EU. Our compliance with GDPR will require preparation, expenditures, and ongoing compliance efforts. Further, as the GDPR has not yet come into effect, enforcement priorities and interpretation of certain provisions are still unclear. Under the GDPR there are penalties for non-compliance which could result in a material fine for certain activities of up to 4 percent of a firm’s global annual revenue per violation. Our failure to comply with GDPR and other countries’ privacy or data security-related laws, rules or regulations could result in significant penalties imposed by regulators, which could have an adverse effect on our business, financial condition and results of operations.
Political uncertainty in the United Kingdom and the European Union may lead to volatility and/or have an adverse effect on our business, our liquidity and financial condition, and our stock price.
On June 23, 2016, the United Kingdom (UK) voted in a national referendum to withdraw from the European Union (EU). On March 29, 2017, the UK government gave notice to the EU, under Article 50(2) of the Treaty on EU, of the UK’s intention to
24
withdraw from the EU. The UK is currently in the process of negotiating a withdrawal agreement with the EU. However, a withdrawal agreement may not be concluded and ratified within the time limit specified in Article 50(3), in which case the UK may be required to withdraw from the EU without a withdrawal agreement being in force.
The possible exit of the UK (or any other country) from the EU, or prolonged periods of uncertainty relating to such a possibility could result in significant macroeconomic deterioration including, but not limited to, decreases in global stock exchange indices, increased foreign exchange volatility (in particular a further weakening of the pound sterling and euro against other leading currencies), decreased GDP in the UK, and a downgrade of the UK’s sovereign credit rating. In addition, these events could push the UK, Eurozone, and/or United States into an economic recession any of which, were they to occur, would further destabilize the global financial markets and could have a material adverse effect on our business, financial condition, and results of operations. We have significant operations in the UK and other EU member states. If the UK leaves the EU as expected in March 2019, we intend to relocate our EU headquarters in France. The decision to choose France as the headquarters for our Continental European operations is contingent upon receiving all necessary regulatory and other governmental approvals, which might not be obtained in a timely manner or at all. Paris is the principal office for our Continental European operations. We have a significant investment there in both financial and human resources, as well as a large portfolio of commercial and consumer insurance business throughout France. Following the withdrawal of the UK from the EU, Chubb will continue to have a substantial presence in London in addition to its offices and operations across the UK and EU.
The rules governing the EU Single Market (which is made up of the 27 other EU member states and to some extent, Iceland, Liechtenstein, and Norway (together, the European Economic Area or EEA)) require local risks to be underwritten by a local authorized insurer, an EEA authorized insurer or a non-local insurer with the benefit of an EU “passport”. As such, UK insurers, including us, are currently able to underwrite risks from the UK into EEA member states via a “passport”. The UK government has announced that it will not be seeking membership of the EU Single Market during the withdrawal negotiations. However, there can be no assurance that there will be any agreement between the UK and the EU by the date on which the UK withdraws from the EU, by the end of any transitional period, or at all. In addition, any such free trade agreement may not maintain the passporting rights of UK insurers nor deem relevant UK regulations to be equivalent to those of the EU. In the event that, following the UK’s withdrawal from the EU, UK insurers are unable to access the EU Single Market via a passporting arrangement, a regulatory equivalence regime or other similar arrangement, such insurers may not be able to underwrite risks into EEA member states except through local branches incorporated in the EEA. Such branches might require local authorization, regulatory and prudential supervision, and capital to be deposited. Although we have commenced implementation of plans to ensure we would have a locally authorized insurer in the UK as well as an EEA authorized insurer able to underwrite risks in EEA/EU member states via a "passport", any change to the terms of the UK’s access to the EU Single Market following the withdrawal of the UK from the EU could still have a material adverse effect on our business, financial condition, and results of operations.
In addition, Lloyd’s currently benefits from EU Single Market passporting arrangements, which allow its syndicates and coverholders (i.e., only those authorized by our managing agency to enter into a contract but only in accordance with specified terms) to write business in EEA member states. Although Lloyd's has announced steps it will take to maintain its passporting rights within the EU, if it is not successful in maintaining those rights, our ability to write business in the EEA through Lloyd’s syndicates and coverholders could have a material adverse effect on our business, financial condition, and results of operations.
Our worldwide operations, particularly in developing nations, expose us to global geopolitical developments that could have an adverse effect on our business, liquidity, results of operations, and financial condition.
With operations in 54 countries and territories, we provide insurance and reinsurance products and services to a diverse group of clients worldwide, including operations in various developing nations. Both current and future foreign operations could be adversely affected by unfavorable geopolitical developments including law changes, tax changes, changes in trade policies, changes to visa or immigration policies, regulatory restrictions, government leadership changes, political events and upheaval, sociopolitical instability, and nationalization of our operations without compensation. Adverse activity in any one country could negatively impact operations, increase our loss exposure under certain of our insurance products, and could, otherwise, have an adverse effect on our business, liquidity, results of operations, and financial condition depending on the magnitude of the events and our net financial exposure at that time in that country.
A failure in our operational systems or infrastructure or those of third parties, including due to security breaches or cyber-attacks, could disrupt business, damage our reputation, and cause losses.
Our operations rely on the secure processing, storage, and transmission of confidential and other information and assets, including in our computer systems and networks and those of third-party service providers. Our business depends on effective
25
information security and systems and the integrity and timeliness of the data our information systems use to run our business. Our ability to adequately price products and services, to establish reserves, to provide effective, efficient and secure service to our customers, to value our investments and to timely and accurately report our financial results also depends significantly on the integrity and availability of the data we maintain, including that within our information systems, as well as data in and assets held through third-party service providers and systems. In an effort to ensure the integrity of such data, we implement new security measures and systems, including the use of confidential intellectual property, and improve or upgrade our existing security measures and systems on a continuing basis. The instances of major cyber incidents have continued to expand in recent years, as exemplified by the 2017 "Petya" and “WannaCry” ransomware attacks. Although we have implemented administrative and technical controls and take protective actions to reduce the risk of cyber incidents and to protect our information technology and assets, and although we additionally endeavor to modify such procedures as circumstances warrant and negotiate agreements with third-party providers to protect our assets, such measures may be insufficient to prevent unauthorized access, computer viruses, malware or other malicious code or cyber-attack, catastrophic events, system failures and disruptions (including in relation to new security measures and systems), employee errors or malfeasance, third party (including outsourced service providers) errors or malfeasance, loss of assets and other events that could have security consequences (each, a Security Event). In some cases, such events may not be immediately detected. As the breadth and complexity of our security infrastructure continues to grow, the potential risk of a Security Event increases. Like other global companies, we have from time to time experienced Security Events, none of which had, individually or in the aggregate, an adverse impact on our business, results of operations, or financial condition. If additional Security Events occur, these events may jeopardize Chubb's or its clients' or counterparties' confidential and other information processed and stored within Chubb, and transmitted through its computer systems and networks, or otherwise cause interruptions, delays, or malfunctions in Chubb's, its clients', its counterparties', or third parties' operations, or result in data loss or loss of assets which could result in significant losses, reputational damage or an adverse effect on our operations and critical business functions. Chubb may be required to expend significant additional resources to modify our protective measures or to investigate and remediate vulnerabilities or other exposures and to pursue recovery of lost data or assets and we may be subject to litigation and financial losses that are either not insured against or not fully covered by insurance maintained.
The regulatory environment surrounding information security and privacy is increasingly demanding. We are subject to numerous U.S. federal and state laws and regulations in jurisdictions outside the U.S. governing the protection of personal and confidential information of our clients or employees, including in relation to medical records, credit card data and financial information. These laws and regulations are increasing in complexity and number, change frequently and sometimes conflict. If any person, including any of our employees or those with whom we share such information, negligently disregards or intentionally breaches our established controls with respect to our client data, or otherwise mismanages or misappropriates that data, we could be subject to significant monetary damages, regulatory enforcement actions, fines and/or criminal prosecution in one or more jurisdictions.
Despite the contingency plans and facilities we have in place and our efforts to observe the regulatory requirements surrounding information security, our ability to conduct business may be adversely affected by a disruption of the infrastructure that supports our business in the communities in which we are located, or of outsourced services or functions. This may include a disruption involving electrical, communications, transportation, or other services used by Chubb. If a disruption occurs in one location and Chubb employees in that location are unable to occupy our offices and conduct business or communicate with or travel to other locations, our ability to service and interact with clients may suffer and we may not be able to successfully implement contingency plans that depend on communication or travel.
We use analytical models to assist our decision making in key areas such as underwriting, claims, reserving, and catastrophe risks but actual results could differ materially from the model outputs and related analyses.
We use various modeling techniques (e.g., scenarios, predictive, stochastic and/or forecasting) and data analytics to analyze and estimate exposures, loss trends and other risks associated with our assets and liabilities. We use the modeled outputs and related analyses to assist us in decision-making (e.g., underwriting, pricing, claims, reserving, reinsurance, and catastrophe risk) and to maintain competitive advantage. The modeled outputs and related analyses are subject to various assumptions, uncertainties, model errors and the inherent limitations of any statistical analysis, including the use of historical internal and industry data. In addition, the modeled outputs and related analyses may from time to time contain inaccuracies, perhaps in material respects, including as a result of inaccurate inputs or applications thereof. Consequently, actual results may differ materially from our modeled results. If, based upon these models or other factors, we misprice our products or underestimate the frequency and/or severity of loss events, or overestimate the risks we are exposed to, new business growth and retention of our existing business may be adversely affected which could have an adverse effect on our results of operations and financial condition.
26
We could be adversely affected by the loss of one or more key executives or by an inability to attract and retain qualified personnel.
Our success depends on our ability to retain the services of our existing key executives and to attract and retain additional qualified personnel in the future. The loss of the services of any of our key executives or the inability to hire and retain other highly qualified personnel in the future could adversely affect our ability to conduct or grow our business. This risk may be particularly acute for us relative to some of our competitors because some of our senior executives work in countries where they are not citizens and work permit and immigration issues could adversely affect the ability to retain or hire key persons. We do not maintain key person life insurance policies with respect to our employees.
Employee error and misconduct may be difficult to detect and prevent and could adversely affect our business, results of operations, and financial condition.
Losses may result from, among other things, fraud, errors, failure to document transactions properly, failure to obtain proper internal authorization, failure to comply with underwriting or other internal guidelines, or failure to comply with regulatory requirements. It is not always possible to deter or prevent employee misconduct and the precautions that we take to prevent and detect this activity may not be effective in all cases. Resultant losses could adversely affect our business, results of operations, and financial condition.
Strategic
The continually changing landscape, including competition, technology and products, existing and new market entrants could reduce our margins
and adversely impact our business and results of operations.
Insurance and reinsurance markets are highly competitive. We compete on an international and regional basis with major U.S., Bermuda, European, and other international insurers and reinsurers and with underwriting syndicates, some of which have greater financial, technological, marketing, distribution and management resources than we do. In addition, capital market participants have created alternative products that are intended to compete with reinsurance products. We also compete with new companies and existing companies that move into the insurance and reinsurance markets.
If competition, or technological or other changes to the insurance markets in which we operate, limits our ability to retain existing business or write new business at adequate rates or on appropriate terms, our business and results of operations could be materially and adversely affected. Increased competition could also result in fewer submissions, lower premium rates, and less favorable policy terms and conditions, which could reduce our profit margins and adversely impact our net income and shareholders' equity.
Recent technological advancements in the insurance industry and information technology industry present new and fast-evolving competitive risks as participants seek to increase transaction speeds, lower costs and create new opportunities. Advancements in technology are occurring in underwriting, claims, distribution and operations at a pace that may quicken, including as companies increase use of data analytics and technology as part of their business strategy. We will be at a competitive disadvantage if, over time, our competitors are more effective than us in their utilization of technology and evolving data analytics. If we do not anticipate or keep pace with these technological and other changes impacting the insurance industry, it could also limit our ability to compete in desired markets.
Insurance and reinsurance markets are historically cyclical, and we expect to experience periods with excess underwriting capacity and unfavorable premium rates.
The insurance and reinsurance markets have historically been cyclical, characterized by periods of intense price competition due to excessive underwriting capacity as well as periods when shortages of capacity permitted favorable premium levels. An increase in premium levels is often offset by an increasing supply of insurance and reinsurance capacity, either by capital provided by new entrants or by the commitment of additional capital by existing insurers or reinsurers, which may cause prices to decrease. Any of these factors could lead to a significant reduction in premium rates, less favorable policy terms, and fewer submissions for our underwriting services. In addition to these considerations, changes in the frequency and severity of losses suffered by insureds and insurers may affect the cycles of the insurance and reinsurance markets significantly, as could periods of economic weakness (such as recession).
The integration of acquired companies may not be as successful as we anticipate.
Acquisitions, such as our acquisition of The Chubb Corporation (Chubb Corp) through a merger (the Chubb acquisition), involve numerous operational, strategic, financial, accounting, legal, tax, and other risks; potential liabilities associated with the acquired businesses; and uncertainties related to design, operation and integration of acquired businesses’ internal controls over financial reporting. Difficulties in integrating an acquired company, along with its personnel, may result in the acquired company performing differently than we expected, in operational challenges or in our failure to realize anticipated expense-related efficiencies. Our existing businesses could also be negatively impacted by acquisitions. In addition, goodwill and
27
intangible assets recorded in connection with insurance company acquisitions may be impaired if premium growth, underwriting profitability, agency retention and policy persistency, among other factors, differ from expectations.
There is also the potential that proposed acquisitions that have been publicly announced will not be consummated, even if a definitive agreement has been signed by the parties. If an agreement is terminated before closing, the result would be that our proposed acquisition would not occur, which could, among other things, expose us to damages or liability and adversely impact our stock price and future operations.
We may be subject to U.S. tax and Bermuda tax which may have an adverse effect on our results of operations and shareholder investment.
Chubb Limited and our non-U.S. subsidiaries operate in a manner so that none of these companies should be subject to U.S. tax (other than U.S. excise tax on insurance and reinsurance premium income attributable to insuring or reinsuring U.S. risks and U.S. withholding tax on some types of U.S. source investment income), because none of these companies should be treated as engaged in a trade or business within the U.S. However, because there is considerable uncertainty as to the activities that constitute being engaged in a trade or business within the U.S., we cannot be certain that the Internal Revenue Service (IRS) will not contend successfully that Chubb Limited or its non-U.S. subsidiaries are engaged in a trade or business in the U.S. If Chubb Limited or any of its non-U.S. subsidiaries were considered to be engaged in a trade or business in the U.S., such entity could be subject to U.S. corporate income and branch profits taxes on the portion of its earnings effectively connected to such U.S. business, in which case our results of operations and our shareholders' investments could be adversely affected.
The Bermuda Minister of Finance, under the Exempted Undertakings Tax Protection Act 1966 of Bermuda, as amended, has given Chubb Limited and its Bermuda insurance subsidiaries a written assurance that if any legislation is enacted in Bermuda that would impose tax computed on profits or income, or computed on any capital asset, gain, or appreciation, or any tax in the nature of estate duty or inheritance tax, then the imposition of any such tax would not be applicable to those companies or any of their respective operations, shares, debentures, or other obligations until March 31, 2035, except insofar as such tax would apply to persons ordinarily resident in Bermuda or is payable by us in respect of real property owned or leased by us in Bermuda. We cannot be certain that we will not be subject to any Bermuda tax after March 31, 2035.
We could be adversely affected by certain features of the 2017 U.S. tax reform legislation.
New tax legislation known as the Tax Cuts and Jobs Act (2017 Tax Act) became law in the U.S. on December 22, 2017. In addition to reducing the U.S. corporate income tax rate from 35 percent to 21 percent, it fundamentally changed many elements of the pre-2017 Tax Act U.S. tax law and introduced several new concepts to tax multinational corporations such as us. Among the most notable new rules are the Base Erosion and Anti-Abuse Tax (commonly called BEAT), which generally applies to payments by U.S. taxpayers to non-U.S. affiliates, and the Global Intangible Low Taxed Income (GILTI) addition to Subpart F income, which for insurance groups potentially expands U.S. taxation on the earnings of foreign subsidiaries. The 2017 Tax Act also includes a one-time reduced-rate transition tax in 2017 on previously untaxed post-1986 earnings of foreign subsidiaries of U.S. corporations. The 2017 Tax Act, which is generally effective for 2018, is a complex law with many significant new provisions and it will be a while before the IRS/Treasury provides meaningful guidance on its application. Thus, there are many uncertainties relating to its ultimate application and effects on our company.
The Organization for Economic Cooperation and Development (OECD) and the European Union (EU) are considering measures that might encourage countries to increase our taxes.
A number of multilateral organizations, including the EU and the OECD have, in recent years, expressed concern about some countries not participating in adequate tax information exchange arrangements and have threatened those that do not agree to cooperate with punitive sanctions by member countries. It is as yet unclear what all of these sanctions might be, which countries might adopt them, and when or if they might be imposed. We cannot assure, however, that the Tax Information Exchange Agreements (TIEAs) that have been or will be entered into by Switzerland and Bermuda will be sufficient to preclude all of the sanctions described above, which, if ultimately adopted, could adversely affect us or our shareholders.
The OECD has published an action plan to address base erosion and profit shifting (BEPS) impacting its member countries and other jurisdictions. It is possible that jurisdictions in which we do business could react to the BEPS initiative or their own concerns by enacting tax legislation that could adversely affect us or our shareholders.
28
Shareholders
There are provisions in our charter documents that may reduce the voting rights and diminish the value of our Common Shares.
Our Articles of Association generally provide that shareholders have one vote for each Common Share held by them and are entitled to vote at all meetings of shareholders. However, the voting rights exercisable by a shareholder may be limited so that certain persons or groups are not deemed to hold 10 percent or more of the voting power conferred by our Common Shares. Moreover, these provisions could have the effect of reducing the voting power of some shareholders who would not otherwise be subject to the limitation by virtue of their direct share ownership. Our Board of Directors may refuse to register holders of shares as shareholders with voting rights based on certain grounds, including if the holder would, directly or indirectly, formally, constructively or beneficially own (as described in Articles 8 and 14 of our Articles of Association) or otherwise control voting rights with respect to 10 percent or more of the registered share capital recorded in the commercial register. In addition, the Board of Directors shall reject entry of holders of registered shares as shareholders with voting rights in the share register or shall decide on their deregistration when the acquirer or shareholder upon request does not expressly state that she/he has acquired or holds the shares in her/his own name and for her/his account.
Applicable laws may make it difficult to effect a change of control of our company.
Before a person can acquire control of a U.S. insurance company, prior written approval must be obtained from the insurance commissioner of the state where the domestic insurer is domiciled. Prior to granting approval of an application to acquire control of a domestic insurer, the state insurance commissioner will consider such factors as the financial strength of the applicant, the integrity and management of the applicant's Board of Directors and executive officers, the acquirer's plans for the future operations of the domestic insurer, and any anti-competitive results that may arise from the consummation of the acquisition of control. Generally, state statutes provide that control over a domestic insurer is presumed to exist if any person, directly or indirectly, owns, controls, holds with the power to vote, or holds proxies representing 10 percent or more of the voting securities of the domestic insurer. Because a person acquiring 10 percent or more of our Common Shares would indirectly control the same percentage of the stock of our U.S. insurance subsidiaries, the insurance change of control laws of various U.S. jurisdictions would likely apply to such a transaction. Laws of other jurisdictions in which one or more of our existing subsidiaries are, or a future subsidiary may be, organized or domiciled may contain similar restrictions on the acquisition of control of Chubb.
While our Articles of Association limit the voting power of any shareholder to less than 10 percent, we cannot assure that the applicable regulatory body would agree that a shareholder who owned 10 percent or more of our Common Shares did not, because of the limitation on the voting power of such shares, control the applicable insurance subsidiary.
These laws may discourage potential acquisition proposals and may delay, deter, or prevent a change of control of Chubb, including transactions that some or all of our shareholders might consider to be desirable.
Shareholder voting requirements under Swiss law may limit our flexibility with respect to certain aspects of capital management
.
Swiss law allows our shareholders to authorize share capital which can be issued by the Board of Directors without shareholder approval but this authorization must be renewed by the shareholders every two years. Swiss law also does not provide as much flexibility in the various terms that can attach to different classes of stock as permitted in other jurisdictions. Swiss law also reserves for approval by shareholders many corporate actions over which the Board of Directors had authority prior to our re-domestication to Switzerland. For example, dividends must be approved by shareholders. While we do not believe that Swiss law requirements relating to our capital management will have an adverse effect on Chubb, we cannot assure that situations will not arise where such flexibility would have provided substantial benefits to our shareholders.
Chubb Limited is a Swiss company; it may be difficult to enforce judgments against it or its directors and executive officers.
Chubb Limited is incorporated pursuant to the laws of Switzerland. In addition, certain of our directors and officers reside outside the U.S. and all or a substantial portion of our assets and the assets of such persons are located in jurisdictions outside the U.S. As such, it may be difficult or impossible to effect service of process within the U.S. upon those persons or to recover against us or them on judgments of U.S. courts, including judgments predicated upon civil liability provisions of the U.S. federal securities laws.
Chubb has been advised by its Swiss counsel that there is doubt as to whether the courts in Switzerland would enforce:
|
•
|
judgments of U.S. courts based upon the civil liability provisions of the U.S. federal securities laws obtained in actions against it or its directors and officers, who reside outside the U.S.; or
|
|
•
|
original actions brought in Switzerland against these persons or Chubb predicated solely upon U.S. federal securities laws.
|
29
Chubb has also been advised by its Swiss counsel that there is no treaty in effect between the U.S. and Switzerland providing for this enforcement and there are grounds upon which Swiss courts may not enforce judgments of U.S. courts. Some remedies available under the laws of U.S. jurisdictions, including some remedies available under the U.S. federal securities laws, would not be allowed in Swiss courts as contrary to that nation's public policy.
Under Swiss law, if we need to raise equity capital at a time when our share price is below the par value of our shares, the equity issuance could be delayed by the need to obtain shareholder approval, which cannot be assured.
As of December 31, 2017, the par value of our Common Shares is CHF
24.15
per share. Under Swiss law, we generally may not issue registered shares below their par value. In the event there is a need to raise common equity capital at a time when the trading price of our registered shares is below our par value, we will need to obtain approval of our shareholders to decrease the par value of our registered shares. We cannot assure that we would be able to obtain such shareholder approval. Furthermore, obtaining shareholder approval would require filing a preliminary proxy statement with the SEC and convening a meeting of shareholders which would delay any capital raising plans. Furthermore, any reduction in par value would decrease our ability to pay dividends as a repayment of share capital which is not subject to Swiss withholding tax. See “Shareholders may be subject to Swiss withholding taxes on the payment of dividends” for additional information.
Shareholders may be subject to Swiss withholding taxes on the payment of dividends.
Our dividends are generally subject to a Swiss withholding tax at a rate of 35 percent; however, payment of a dividend in the form of a par value reduction or qualifying capital contribution reserves reduction is not subject to Swiss withholding tax. We have previously obtained shareholder approval for dividends to be paid in such form. We currently intend to recommend to shareholders that they annually approve the payment of dividends in such form but we cannot assure that our shareholders will continue to approve a reduction in such form each year or that we will be able to meet the other legal requirements for a reduction in par value, or that Swiss withholding tax rules will not be changed in the future. We estimate we would be able to pay dividends in such form, and thus exempt from Swiss withholding tax until 2028–2033. This range may vary depending upon changes in annual dividends, special dividends, fluctuations in U.S. dollar/Swiss franc exchange rates, changes in par value or qualifying capital contribution reserves or changes or new interpretations to Swiss corporate or tax law or regulations.
Under certain circumstances, U.S. shareholders may be subject to adverse U.S. federal income tax consequences.
Under certain circumstances, a U.S. person who owns or is deemed to own 10 percent or more of the voting power or value of a foreign corporation that is a “controlled foreign corporation” (CFC) (a foreign corporation in which 10 percent U.S. shareholders own or are deemed to own more than 50 percent of the voting power or value of the stock of a foreign corporation or more than 25 percent of certain foreign insurance corporations) for any period during a taxable year must include in gross income for U.S. federal income tax purposes such "10 percent U.S. Shareholder's" pro rata share of the CFC's "subpart F income". We believe that because of the dispersion of our share ownership it is unlikely that any U.S. person who acquires shares of Chubb Limited directly or indirectly through one or more foreign entities should be required to include any subpart F income in income under the CFC rules of U.S. tax law.
Separately, any U.S. persons who hold shares may be subject to U.S. federal income taxation at ordinary income tax rates on their proportionate share of our Related Person Insurance Income (RPII). If the RPII of any of our non-U.S. insurance subsidiaries (each a "Non-U.S. Insurance Subsidiary") were to equal or exceed 20 percent of that company's gross insurance income in any taxable year and direct or indirect insureds (and persons related to those insureds) own directly or indirectly through foreign entities 20 percent or more of the voting power or value of Chubb Limited, then a U.S. person who owns any shares of Chubb Limited (directly or indirectly through foreign entities) on the last day of the taxable year would be required to include in his or her income for U.S. federal income tax purposes such person's pro rata share of such company's RPII for the entire taxable year. In addition, any RPII that is includible in the income of a U.S. tax-exempt organization may be treated as unrelated business taxable income. We believe that the gross RPII of each Non-U.S. Insurance Subsidiary did not in prior years of operation and is not expected in the foreseeable future to equal or exceed 20 percent of each such company's gross insurance income. Likewise, we do not expect the direct or indirect insureds of each Non-U.S. Insurance Subsidiary (and persons related to such insureds) to directly or indirectly own 20 percent or more of either the voting power or value of our shares. However, we cannot be certain that this will be the case because some of the factors which determine the extent of RPII may be beyond our control. If these thresholds are met or exceeded, any U.S. person’s investment in Chubb Limited could be adversely affected.
A U.S. tax-exempt organization may recognize unrelated business taxable income if a portion of our insurance income is allocated to the organization. This generally would be the case if either we are a CFC and the tax-exempt shareholder is a 10 percent U.S. shareholder or there is RPII, certain exceptions do not apply, and the tax-exempt organization, directly or indirectly through foreign entities, owns any shares of Chubb Limited. Although we do not believe that any U.S. tax-exempt organization
30
should be allocated such insurance income, we cannot be certain that this will be the case. Potential U.S. tax-exempt investors are advised to consult their tax advisors.
U.S. persons who hold shares will be subject to adverse tax consequences if we are considered to be a Passive Foreign Investment Company (PFIC) for U.S. federal income tax purposes.
If Chubb Limited is considered a PFIC for U.S. federal income tax purposes, a U.S. person who holds Chubb Limited shares will be subject to adverse U.S. federal income tax consequences in which case their investment could be adversely affected. In addition, if Chubb Limited were considered a PFIC, upon the death of any U.S. individual owning shares, such individual's heirs or estate would not be entitled to a "step-up" in the basis of the shares which might otherwise be available under U.S. federal income tax laws. We believe that we are not, have not been, and currently do not expect to become, a PFIC for U.S. federal income tax purposes. We cannot assure, however, that we will not be deemed a PFIC by the IRS. Recently enacted U.S. federal tax law and proposed regulations previously issued by the IRS contain objective and subjective standards regarding the application of the PFIC provisions to an insurance company. Final regulations or pronouncements interpreting or clarifying these rules may be forthcoming. We cannot predict what impact, if any, such guidance would have on an investor that is subject to U.S. federal income taxation.
Changes in tax law could adversely affect an investment in us and our securities.
New U.S. federal tax law was recently enacted containing significant changes. Portions of the new law address certain previously perceived tax advantages of domestic companies (including insurance companies) that have affiliates with legal domiciles outside the U.S. The new law is complex and lacks developed administrative guidance; thus, the full impact to us, or our investors, is currently unclear. This new law or future tax law changes, administrative guidance, or U.S. court decisions regarding tax law could have an adverse impact on us or our investors.
Similarly, jurisdictions outside the U.S. in which we do business could enact tax legislation in the future that could have an adverse impact on us or our investors. For example, Switzerland is currently pursuing the implementation of corporate tax reform measures. The first effort was rejected by a public vote; however a revised corporate tax reform measure is expected. The next tax reform version could adversely affect us or our investors.
Risks Relating to The Chubb Corporation Acquisition (Chubb Corp Acquisition)
We may fail to realize all of the anticipated benefits of the Chubb Corp Acquisition.
The integration of Chubb Corp may not be as successful as we anticipate. The success of the Chubb Corp acquisition will depend, in part, on our ability to realize the anticipated benefits of cross-selling and other revenue-related benefits from combining our businesses. Some of the assumptions that we have made, such as the achievement of revenue synergies, premium growth and underwriting profitability, among other factors, may differ from expectations.
There are currently no unresolved SEC staff comments regarding our periodic or current reports.
We maintain office facilities around the world including in North America, Europe (including our principal executive offices in Switzerland), Bermuda, Latin America, Asia Pacific, and the Far East. Most of our office facilities are leased, although we own major facilities in Hamilton, Bermuda, and in the U.S., including in Philadelphia, Pennsylvania; Wilmington, Delaware; Whitehouse Station, New Jersey; and Simsbury, Connecticut. Management considers its office facilities suitable and adequate for the current level of operations.
The information required with respect to Item 3 is included in Note
10
h) to the Consolidated Financial Statements, which is hereby incorporated herein by reference.
31
Our Common Shares have been listed on the New York Stock Exchange since March 25, 1993, with a current par value of CHF
24.15
per share. The trading symbol for our Common Shares is "CB."
Quarterly Stock Information
The following table sets forth the high and low closing sales prices of our Common Shares per fiscal quarter, as reported on the New York Stock Exchange Composite Tape, and cash dividends on Common Shares:
|
2017
|
2016
|
|||||||||||||||||||||||||||
|
Dividends
|
Dividends
|
|||||||||||||||||||||||||||
|
Quarter Ended
|
High
|
|
Low
|
|
USD
|
|
CHF
|
High
|
|
Low
|
|
USD
|
|
CHF
|
||||||||||||||
|
March 31
|
$
|
140.38
|
|
$
|
128.48
|
|
$
|
0.69
|
|
|
0.69
|
$
|
122.47
|
|
$
|
108.00
|
|
$
|
0.67
|
|
0.66
|
|||||||
|
June 30
|
$
|
147.58
|
|
$
|
135.48
|
|
$
|
0.71
|
|
0.69
|
$
|
130.71
|
|
$
|
117.19
|
|
$
|
0.69
|
|
0.68
|
||||||||
|
September 30
|
$
|
149.87
|
|
$
|
134.88
|
|
$
|
0.71
|
|
0.68
|
$
|
130.32
|
|
$
|
124.28
|
|
$
|
0.69
|
|
0.67
|
||||||||
|
December 31
|
$
|
155.19
|
|
$
|
144.70
|
|
$
|
0.71
|
|
0.70
|
$
|
133.32
|
|
$
|
121.88
|
|
$
|
0.69
|
|
0.69
|
||||||||
We have paid dividends each quarter since we became a public company in 1993. Following Chubb's redomestication to Switzerland, our dividends have been distributed primarily by way of a par value reduction. However, our annual dividends were paid by way of a distribution from capital contribution reserves (Additional paid-in capital) through the transfer of dividends from Additional paid-in capital to Retained earnings (free reserves) as approved by our shareholders in 2017 and 2016.
Chubb Limited is a holding company whose principal sources of income are investment income and dividends from its operating subsidiaries. The ability of the operating subsidiaries to pay dividends to us and our ability to pay dividends to our shareholders are each subject to legal and regulatory restrictions. The recommendation and payment of future dividends will be based on the determination of the Board of Directors (Board) and will be dependent upon shareholder approval, profits and financial requirements of Chubb and other factors, including legal restrictions on the payment of dividends and such other factors as the Board deems relevant. Refer to Part I, Item 1A and Part II, Item 7 for additional information.
The last reported sale price of the Common Shares on the New York Stock Exchange Composite Tape on
February 12, 2018
was
$144.61
.
The number of record holders of Common Shares as of
February 12, 2018
was
8,466
. This is not the actual number of beneficial owners of Chubb's Common Shares since most of our shareholders hold their shares through a stockbroker, bank or other nominee rather than directly in their own names.
Refer to Part III, Item 12 for information relating to compensation plans under which equity securities are authorized for issuance.
32
Issuer's Repurchases of Equity Securities for the Three Months Ended December 31, 2017
|
Period
|
Total Number of Shares Purchased
(1)
|
|
Average Price
Paid per Share
|
|
Total Number of Shares Purchased as Part of Publicly Announced Plan
(2)
|
|
Approximate Dollar Value of Shares that May Yet be Purchased Under Publicly Announced Plan
(3)
|
|
|||||||
|
October 1 through October 31
|
28,046
|
|
$
|
150.78
|
|
25,000
|
|
$
|
289
|
million
|
|||||
|
November 1 through November 30
|
257,154
|
|
$
|
149.01
|
|
253,599
|
|
$
|
251
|
million
|
|||||
|
December 1 through December 31
|
556,632
|
|
$
|
146.69
|
|
555,000
|
|
$
|
170
|
million
|
(4)
|
||||
|
Total
|
841,832
|
|
$
|
147.54
|
|
833,599
|
|
||||||||
|
(1)
|
This column includes activity related to the surrender to Chubb of common shares to satisfy tax withholding obligations in connection with the vesting of restricted stock issued to employees and the exercising of options by employees.
|
|
(2)
|
The aggregate value of shares purchased in the three months ended December 31, 2017 as part of the publicly announced plan was $123 million.
|
|
(3)
|
In November 2016, our Board authorized $1.0 billion of share repurchases through December 31, 2017.
|
|
(4)
|
Refer to Note 11 to the Consolidated Financial Statements for more information on the Chubb Limited securities repurchase authorization. In December 2017, our Board authorized the repurchase of up to $1.0 billion of Chubb’s Common Shares through December 31, 2018.
|
Performance Graph
Set forth below is a line graph comparing the dollar change in the cumulative total shareholder return on Chubb's Common Shares from
December 31, 2012
, through
December 31, 2017
, as compared to the cumulative total return of the Standard & Poor's 500 Stock Index and the cumulative total return of the Standard & Poor's Property-Casualty Insurance Index. The cumulative total shareholder return is a concept used to compare the performance of a company's stock over time and is the ratio of the stock price change plus the cumulative amount of dividends over the specified time period (assuming dividend reinvestment), to the stock price at the beginning of the time period. The chart depicts the value on
December 31, 2013
,
2014
,
2015
,
2016
, and
2017
, of a $100 investment made on
December 31, 2012
, with all dividends reinvested.
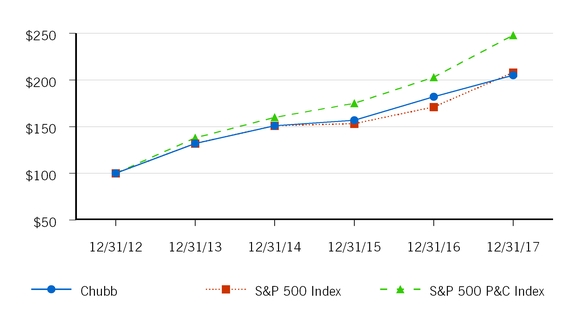
|
12/31/2012
|
12/31/2013
|
12/31/2014
|
12/31/2015
|
12/31/2016
|
12/31/2017
|
|
|
Chubb Limited
|
$100
|
$132
|
$151
|
$157
|
$182
|
$205
|
|
S&P 500 Index
|
$100
|
$132
|
$151
|
$153
|
$171
|
$208
|
|
S&P 500 P&C Index
|
$100
|
$138
|
$160
|
$175
|
$203
|
$248
|
33
On January 14, 2016, we completed the acquisition of the Chubb Corporation (Chubb Corp). The results of operations of Chubb Corp are included in our results from the acquisition date forward (i.e., after January 14, 2016 and only in the 2016 and 2017 columns) within the table below. Refer to Note 2 to the Consolidated Financial Statements for additional information on the acquisition.
|
(in millions, except per share data and percentages)
|
2017
|
|
2016
|
|
2015
|
|
2014
|
|
2013
|
|
|||||||||
|
Operations data:
|
|||||||||||||||||||
|
Net premiums earned – excluding Life Insurance segment
|
$
|
26,933
|
|
$
|
26,694
|
|
$
|
15,266
|
|
$
|
15,464
|
|
$
|
14,708
|
|
||||
|
Net premiums earned – Life Insurance segment
|
2,101
|
|
2,055
|
|
1,947
|
|
1,962
|
|
1,905
|
|
|||||||||
|
Total net premiums earned
|
29,034
|
|
28,749
|
|
17,213
|
|
17,426
|
|
16,613
|
|
|||||||||
|
Net investment income
|
3,125
|
|
2,865
|
|
2,194
|
|
2,252
|
|
2,144
|
|
|||||||||
|
Losses and loss expenses
|
18,454
|
|
16,052
|
|
9,484
|
|
9,649
|
|
9,348
|
|
|||||||||
|
Policy benefits
|
676
|
|
588
|
|
543
|
|
517
|
|
515
|
|
|||||||||
|
Policy acquisition costs and administrative expenses
|
8,614
|
|
8,985
|
|
5,211
|
|
5,320
|
|
4,870
|
|
|||||||||
|
Net income
|
3,861
|
|
4,135
|
|
2,834
|
|
2,853
|
|
3,758
|
|
|||||||||
|
Weighted-average shares outstanding – diluted
|
471
|
|
466
|
|
329
|
|
339
|
|
344
|
|
|||||||||
|
Diluted earnings per share
|
$
|
8.19
|
|
$
|
8.87
|
|
$
|
8.62
|
|
$
|
8.42
|
|
$
|
10.92
|
|
||||
|
Balance sheet data (at end of period):
|
|||||||||||||||||||
|
Total investments
|
$
|
102,444
|
|
$
|
99,094
|
|
$
|
66,251
|
|
$
|
62,904
|
|
$
|
60,928
|
|
||||
|
Total assets
|
167,022
|
|
159,786
|
|
102,306
|
|
98,223
|
|
94,487
|
|
|||||||||
|
Net unpaid losses and loss expenses
|
49,165
|
|
47,832
|
|
26,562
|
|
27,008
|
|
26,831
|
|
|||||||||
|
Net future policy benefits
|
5,137
|
|
4,854
|
|
4,620
|
|
4,537
|
|
4,397
|
|
|||||||||
|
Long-term debt
|
11,556
|
|
12,610
|
|
9,389
|
|
3,334
|
|
3,786
|
|
|||||||||
|
Trust preferred securities
|
308
|
|
308
|
|
307
|
|
307
|
|
307
|
|
|||||||||
|
Total liabilities
|
115,850
|
|
111,511
|
|
73,171
|
|
68,636
|
|
65,662
|
|
|||||||||
|
Shareholders' equity
|
51,172
|
|
48,275
|
|
29,135
|
|
29,587
|
|
28,825
|
|
|||||||||
|
Book value per share
|
$
|
110.32
|
|
$
|
103.60
|
|
$
|
89.77
|
|
$
|
90.02
|
|
$
|
84.83
|
|
||||
|
Selected data:
|
|||||||||||||||||||
|
Loss and loss expense ratio
(1)
|
65.8
|
%
|
57.7
|
%
|
58.1
|
%
|
58.7
|
%
|
59.6
|
%
|
|||||||||
|
Underwriting and administrative expense ratio
(2)
|
28.9
|
%
|
30.6
|
%
|
29.2
|
%
|
29.4
|
%
|
28.4
|
%
|
|||||||||
|
Combined ratio
(3)
|
94.7
|
%
|
88.3
|
%
|
87.3
|
%
|
88.1
|
%
|
88.0
|
%
|
|||||||||
|
Cash dividends per share
(4)
|
$
|
2.82
|
|
$
|
2.74
|
|
$
|
2.66
|
|
$
|
2.70
|
|
$
|
2.02
|
|
||||
|
(1)
|
The Loss and loss expense ratio is calculated by dividing losses and loss expenses, excluding the Life Insurance segment, by Net premiums earned – excluding Life Insurance segment. Losses and loss expenses for the Life Insurance segment were $
739 million
,
$663 million
,
$601 million
,
$589 million
, and
$582 million
for the years ended December 31,
2017
,
2016
,
2015
,
2014
, and
2013
, respectively.
|
|
(2)
|
The Underwriting and administrative expense ratio is calculated by dividing the policy acquisition costs and administrative expenses, excluding the Life Insurance segment, by Net premiums earned – excluding Life Insurance segment. Policy acquisition costs and administrative expenses for the Life Insurance segment were $
833 million
, $
816 million
, $
767 million
, $
763 million
, and
$701 million
for the years ended December 31,
2017
,
2016
,
2015
,
2014
, and
2013
, respectively.
|
|
(3)
|
The combined ratio is the sum of Loss and loss expense ratio and the Underwriting and administrative expense ratio.
|
|
(4)
|
Cash dividends per share in 2014 include a $0.12 per share increase related to the fourth quarter 2013, approved by our shareholders on January 10, 2014.
|
34
The following is a discussion of our results of operations, financial condition, and liquidity and capital resources as of and for the year ended
December 31, 2017
. This discussion should be read in conjunction with the consolidated financial statements and related Notes, under Item 8 of this Form 10-K.
All comparisons in this discussion are to the corresponding prior year unless otherwise indicated.
|
MD&A Index
|
Page
|
35
Forward-Looking Statements
The Private Securities Litigation Reform Act of 1995 provides a “safe harbor” for forward-looking statements. Any written or oral statements made by us or on our behalf may include forward-looking statements that reflect our current views with respect to future events and financial performance. These forward-looking statements are subject to certain risks, uncertainties, and other factors that could, should potential events occur, cause actual results to differ materially from such statements. These risks, uncertainties, and other factors, which are described in more detail under Part I, Item 1A, under Risk Factors, starting on page 18 and elsewhere herein and in other documents we file with the U.S. Securities and Exchange Commission (SEC), include but are not limited to:
|
•
|
losses arising out of natural or man-made catastrophes such as hurricanes, typhoons, earthquakes, floods, climate change (including effects on weather patterns; greenhouse gases; sea; land and air temperatures; sea levels; and rain and snow), nuclear accidents, or terrorism which could be affected by:
|
|
•
|
the number of insureds and ceding companies affected;
|
|
•
|
the amount and timing of losses actually incurred and reported by insureds;
|
|
•
|
the impact of these losses on our reinsurers and the amount and timing of reinsurance recoverable actually received;
|
|
•
|
the cost of building materials and labor to reconstruct properties or to perform environmental remediation following a catastrophic event; and
|
|
•
|
complex coverage and regulatory issues such as whether losses occurred from storm surge or flooding and related lawsuits;
|
|
•
|
actions that rating agencies may take from time to time, such as financial strength or credit ratings downgrades or placing these ratings on credit watch negative or the equivalent;
|
|
•
|
the ability to collect reinsurance recoverable, credit developments of reinsurers, and any delays with respect thereto and changes in the cost, quality, or availability of reinsurance;
|
|
•
|
actual loss experience from insured or reinsured events and the timing of claim payments;
|
|
•
|
the uncertainties of the loss-reserving and claims-settlement processes, including the difficulties associated with assessing environmental damage and asbestos-related latent injuries, the impact of aggregate-policy-coverage limits, the impact of bankruptcy protection sought by various asbestos producers and other related businesses, and the timing of loss payments;
|
|
•
|
changes to our assessment as to whether it is more likely than not that we will be required to sell, or have the intent to sell, available for sale fixed maturity investments before their anticipated recovery;
|
|
•
|
infection rates and severity of pandemics and their effects on our business operations and claims activity;
|
|
•
|
developments in global financial markets, including changes in interest rates, stock markets, and other financial markets, increased government involvement or intervention in the financial services industry, the cost and availability of financing, and foreign currency exchange rate fluctuations (which we refer to in this report as foreign exchange and foreign currency exchange), which could affect our statement of operations, investment portfolio, financial condition, and financing plans;
|
|
•
|
general economic and business conditions resulting from volatility in the stock and credit markets and the depth and duration of potential recession;
|
|
•
|
global political conditions, the occurrence of any terrorist attacks, including any nuclear, radiological, biological, or chemical events, or the outbreak and effects of war, and possible business disruption or economic contraction that may result from such events;
|
|
•
|
the potential impact of the United Kingdom’s vote to withdraw from the European Union, including political, regulatory, social, and economic uncertainty and market and exchange rate volatility;
|
|
•
|
judicial decisions and rulings, new theories of liability, legal tactics, and settlement terms;
|
36
|
•
|
the effects of public company bankruptcies and/or accounting restatements, as well as disclosures by and investigations of public companies relating to possible accounting irregularities, and other corporate governance issues, including the effects of such events on:
|
|
•
|
the capital markets;
|
|
•
|
the markets for directors and officers (D&O) and errors and omissions (E&O) insurance; and
|
|
•
|
claims and litigation arising out of such disclosures or practices by other companies;
|
|
•
|
uncertainties relating to governmental, legislative and regulatory policies, developments, actions, investigations, and treaties, which, among other things, could subject us to insurance regulation or taxation in additional jurisdictions or affect our current operations;
|
|
•
|
the actual amount of new and renewal business, market acceptance of our products, and risks associated with the introduction of new products and services and entering new markets, including regulatory constraints on exit strategies;
|
|
•
|
the competitive environment in which we operate, including trends in pricing or in policy terms and conditions, which may differ from our projections and changes in market conditions that could render our business strategies ineffective or obsolete;
|
|
•
|
acquisitions made by us performing differently than expected, our failure to realize anticipated expense-related efficiencies or growth from acquisitions, the impact of acquisitions on our pre-existing organization, or announced acquisitions not closing;
|
|
•
|
risks associated with being a Swiss corporation, including reduced flexibility with respect to certain aspects of capital management and the potential for additional regulatory burdens;
|
|
•
|
the potential impact from government-mandated insurance coverage for acts of terrorism;
|
|
•
|
the availability of borrowings and letters of credit under our credit facilities;
|
|
•
|
the adequacy of collateral supporting funded high deductible programs;
|
|
•
|
changes in the distribution or placement of risks due to increased consolidation of insurance and reinsurance brokers;
|
|
•
|
material differences between actual and expected assessments for guaranty funds and mandatory pooling arrangements;
|
|
•
|
the effects of investigations into market practices in the property and casualty (P&C) industry;
|
|
•
|
changing rates of inflation and other economic conditions, for example, recession;
|
|
•
|
the amount of dividends received from subsidiaries;
|
|
•
|
loss of the services of any of our executive officers without suitable replacements being recruited in a reasonable time frame;
|
|
•
|
the ability of our technology resources, including information systems and security, to perform as anticipated such as with respect to preventing material information technology failures or third-party infiltrations or hacking resulting in consequences adverse to Chubb or its customers or partners; and
|
|
•
|
management’s response to these factors and actual events (including, but not limited to, those described above).
|
The words “believe,” “anticipate,” “estimate,” “project,” “should,” “plan,” “expect,” “intend,” “hope,” “feel,” “foresee,” “will likely result,” or “will continue,” and variations thereof and similar expressions, identify forward-looking statements. You are cautioned not to place undue reliance on these forward-looking statements, which speak only as of their dates. We undertake no obligation to publicly update or review any forward-looking statements, whether as a result of new information, future events or otherwise.
37
Overview
We operate through six business segments: North America Commercial P&C Insurance, North America Personal P&C Insurance, North America Agricultural Insurance, Overseas General Insurance, Global Reinsurance, and Life Insurance. For more information on our segments refer to “Segment Information” under Item 1.
We have grown our business through increased premium volume, expansion of product offerings and geographic reach, and acquisitions of other companies. Acquisitions in 2016 and 2015 are as follows:
|
•
|
All segments excluding North America Agricultural Insurance:
The Chubb Corporation (Chubb Corp) (January 14, 2016).
|
|
•
|
North America Personal P&C Insurance:
Fireman's Fund Insurance Company high net worth personal lines insurance business in the U.S. (April 1, 2015).
|
The consolidated financial statements include results of acquired businesses from the acquisition dates. Refer to Note 2 to the Consolidated Financial Statements for additional information on our acquisitions.
Our product and geographic diversification differentiates us from the vast majority of our competitors and has been a source of stability during periods of industry volatility. Our long-term business strategy focuses on sustained growth in book value achieved through a combination of underwriting and investment income. By doing so, we provide value to our clients and shareholders through use of our substantial capital base in the insurance and reinsurance markets.
We are organized along a profit center structure by line of business and territory that does not necessarily correspond to corporate legal entities. Profit centers can access various legal entities subject to licensing and other regulatory rules. Profit centers are expected to generate underwriting income and appropriate risk-adjusted returns. Our corporate structure has facilitated the development of management talent by giving each profit center's senior management team the necessary autonomy within underwriting authorities to make operating decisions and create products and coverages needed by its target customer base. We are focused on delivering underwriting profit by only writing policies which we believe adequately compensate us for the risk we accept.
Our insurance and reinsurance operations generate gross revenues from two principal sources: premiums and investment income. Cash flow is generated from premiums collected and investment income received less paid losses and loss expenses, policy acquisition costs, and administrative expenses. Invested assets are substantially held in liquid, investment grade fixed income securities of relatively short duration. Claims payments in any short-term period are highly unpredictable due to the random nature of loss events and the timing of claims awards or settlements. The value of investments held to pay future claims is subject to market forces such as the level of interest rates, stock market volatility, and credit events such as corporate defaults. The actual cost of claims is also volatile based on loss trends, inflation rates, court awards, and catastrophes. We believe that our cash balance, our highly liquid investments, credit facilities, and reinsurance protection provide sufficient liquidity to meet unforeseen claim demands that might occur in the year ahead. Refer to “Liquidity” and “Capital Resources” for additional information.
Combined legacy ACE and legacy Chubb Corp results ("comparative basis")
We discuss financial measures on a "comparative basis" for the 2016 and 2015 periods throughout the Management's Discussion and Analysis section. We believe these measures provide visibility into our results, allow for comparability to our historical results and are consistent with how management evaluates results. We define our results discussed on a "comparative basis" as follows:
2016 "comparative basis" results: The combined company results do not include the impact of the unearned premium reserves intangible amortization and the elimination of the historical policy acquisition costs as a result of purchase accounting related to the Chubb Corp acquisition. The combined company results for the year ended December 31, 2016 are inclusive of the first 14 days of January 2016 (the Chubb Corp acquisition closed January 14, 2016).
2015 "comparative basis" results: Legacy ACE plus legacy Chubb Corp historical results after accounting policy alignment adjustments, including reclassifying certain legacy Chubb Corp corporate expenses to administrative expenses and redefining legacy Chubb Corp segment underwriting income by allocating the amortization of deferred policy acquisition costs to each segment. 2015 "comparative basis" results exclude purchase accounting adjustments related to the Chubb Corp acquisition.
A reconciliation of "comparative basis" results as defined above is provided under the Non-GAAP Reconciliation section starting on page 74.
38
Financial Highlights for the Year Ended
December 31, 2017
|
•
|
Net income was $3,861 million compared with $4,135 million last year. Net income in 2017 was adversely impacted by significant catastrophe losses in the year of $2,171 million after-tax and favorably impacted by a provisional tax benefit of $450 million, related to the 2017 U.S. Tax Cuts and Jobs Act (2017 Tax Act). Net income included a one-time contribution of $50 million ($32.5 million after-tax) to the Chubb Charitable Foundation.
|
|
•
|
Total company and P&C net premiums written were $29.2 billion and $27.1 billion, respectively, up 3.9 percent and 4.2 percent, respectively.
|
|
•
|
Total pre-tax and after-tax catastrophe losses, including reinstatement premiums, were $2,746 million (10.2 percentage points of the combined ratio) and $2,171 million, respectively, compared with $1,060 million (4.0 percentage points of the combined ratio) and $844 million, respectively, in 2016. Pre-tax catastrophe losses, net of reinsurance and including reinstatement premiums, included $650 million, $880 million, and $201 million from Hurricanes Harvey, Irma, and Maria, respectively, $277 million and $157 million from the northern and southern California wildfires, respectively, and $556 million from other catastrophe losses, principally U.S. weather-related events.
|
|
•
|
Since the acquisition of Chubb Corp, we have entered into new reinsurance agreements with third-party reinsurers for certain legacy Chubb Corp business and have taken other merger-related underwriting actions, including exiting certain types of business that do not meet our underwriting standards or adhere to our risk diversification strategy. Together, these items adversely impacted P&C net premiums written growth by $545 million. Accounting policy alignment also adversely impacted P&C net premiums written growth by $126 million. In addition, net premiums written growth in 2016 was adversely impacted from a one-time unearned premium reserve (UPR) transfer in 2016 which reduced net premiums written by $128 million in the prior year.
|
|
•
|
P&C combined ratio was 94.7 percent compared with 88.7 percent in 2016. P&C current accident year combined ratio excluding catastrophe losses was 87.6 percent compared with 89.0 percent in 2016.
|
|
•
|
Total pre-tax and after-tax favorable prior period development was $829 million (3.1 percentage points of the combined ratio) and $634 million, respectively, compared with $1,135 million pre-tax (4.3 percentage points of the combined ratio) and $898 million after-tax in 2016.
|
|
•
|
Net investment income was $3,125 million compared with $2,865 million in 2016. Excluding the amortization of the fair value adjustment on acquired invested assets of Chubb Corp, net investment income was $3,457 million, compared with $3,258 million in 2016, up 6.1 percent.
|
|
•
|
Share repurchases totaled $830 million, or approximately 5.9 million shares for the year.
|
Outlook
In 2017, we produced net income per share of $8.19 and book value per share growth of 6.5 percent, despite large natural catastrophe events in the year, including Hurricanes Harvey, Irma, and Maria in the U.S and Caribbean, large earthquakes in Mexico, and multiple large wildfires in California. We had strong net premiums written of $29.2 billion, up nearly 4 percent. We are optimistic about our growth prospects for 2018 given strengthening economies in the U.S. and globally, an improving pricing environment, and because our merger-related underwriting actions and their impact on revenue growth are largely behind us. In particular, we expect our commercial P&C business to continue to grow and benefit from improving pricing conditions in a number of our businesses globally in 2018. We also expect growth to improve in our U.S. middle market and small commercial business, and expect good growth in this area outside the U.S. as well. We also expect good growth in our global A&H and personal lines business from investments we are making in marketing and technology to provide a more digital experience for customers and business partners. One of our strategic focus areas is to transform ourselves to thrive in a digital age. We expect this to significantly enhance our competitive profile and contribute revenue growth and efficiencies in the medium and longer term.
We also expect to benefit from both a lower U.S. corporate tax rate as a result of the 2017 Tax Act and the additional insurance exposure growth that will accompany a growing economy.
There are a number of factors that impact the variability in investment income. Nevertheless, excluding the amortization of the fair value adjustment on acquired invested assets, we expect quarterly investment income to be in the range of $865 million to $875 million, and expect it to improve as the year progresses.
Our distribution agreement with Singapore’s DBS Bank, the largest banking group in Southeast Asia, and our strategic cooperation agreement with China’s PICC Property & Casualty Company, both announced in 2017, are investments that we believe will further expand our global growth potential. At the heart of the distribution agreement with DBS Bank is our joint
39
ability to market and service insurance digitally to millions of DBS customers, both consumers and businesses, in Asia Pacific countries. The strategic cooperation agreement with PICC is an opportunity to support the insurance needs of PICC and its customers, some of the largest enterprises in China.
We achieved annualized run rate integration-related savings of $875 million by the end of 2017, ahead of schedule and above initial projections. Through 2017 we have realized $766 million of savings, of which 63 percent favorably impacted administrative expenses. The expected incremental realized savings in 2018 is more highly weighted to claims expense savings than the administrative expense savings experienced to date. While incremental savings are expected to benefit us in 2018, these savings will be partially offset by increased spending to support growth, including our continued investment in marketing, technology and digitization, and strategic partnerships, such as those mentioned above.
Critical Accounting Estimates
Our consolidated financial statements include amounts that, either by their nature or due to requirements of generally accepted accounting principles in the U.S. (GAAP), are determined using best estimates and assumptions. While we believe that the amounts included in our consolidated financial statements reflect our best judgment, actual amounts could ultimately materially differ from those currently presented. We believe the items that require the most subjective and complex estimates are:
|
•
|
unpaid loss and loss expense reserves, including long-tail asbestos and environmental (A&E) reserves;
|
|
•
|
future policy benefits reserves;
|
|
•
|
the valuation of value of business acquired (VOBA) and amortization of deferred policy acquisition costs and VOBA;
|
|
•
|
the assessment of risk transfer for certain structured insurance and reinsurance contracts;
|
|
•
|
reinsurance recoverable, including a provision for uncollectible reinsurance;
|
|
•
|
the valuation of our investment portfolio and assessment of other-than-temporary impairments (OTTI);
|
|
•
|
the valuation of deferred tax assets;
|
|
•
|
the valuation of derivative instruments related to guaranteed living benefits (GLB); and
|
|
•
|
the assessment of goodwill for impairment.
|
We believe our accounting policies for these items are of critical importance to our consolidated financial statements. The following discussion provides more information regarding the estimates and assumptions required to arrive at these amounts and should be read in conjunction with the sections entitled: Prior Period Development, Asbestos and Environmental (A&E), Reinsurance Recoverable on Ceded Reinsurance, Investments, Net Realized and Unrealized Gains (Losses), and Other Income and Expense Items.
Unpaid losses and loss expenses
As an insurance and reinsurance company, we are required by applicable laws and regulations and GAAP to establish loss and loss expense reserves for the estimated unpaid portion of the ultimate liability for losses and loss expenses under the terms of our policies and agreements with our insured and reinsured customers. At
December 31, 2017
, our gross unpaid loss and loss expense reserves were
$63.2
billion and our net unpaid loss and loss expense reserves were
$49.2
billion. With the exception of certain structured settlements, for which the timing and amount of future claim payments are reliably determinable, and certain reserves for unsettled claims that are discounted in statutory filings, our loss reserves are not discounted for the time value of money. In connection with such structured settlements and certain reserves for unsettled claims, we carried net discounted reserves of $77 million and $88 million at
December 31, 2017
and
2016
, respectively.
40
The following table presents a roll-forward of our unpaid losses and loss expenses:
|
December 31, 2017
|
December 31, 2016
|
||||||||||||||||||||||
|
(in millions of U.S. dollars)
|
Gross Losses
|
|
Reinsurance Recoverable
(1)
|
|
Net Losses
|
|
Gross Losses
|
|
Reinsurance Recoverable
(1)
|
|
Net Losses
|
|
|||||||||||
|
Balance, beginning of year
|
$
|
60,540
|
|
$
|
12,708
|
|
$
|
47,832
|
|
$
|
37,303
|
|
$
|
10,741
|
|
$
|
26,562
|
|
|||||
|
Losses and loss expenses incurred
|
23,933
|
|
5,479
|
|
18,454
|
|
20,195
|
|
4,143
|
|
16,052
|
|
|||||||||||
|
Losses and loss expenses paid
|
(21,812
|
)
|
(4,364
|
)
|
(17,448
|
)
|
(19,436
|
)
|
(3,721
|
)
|
(15,715
|
)
|
|||||||||||
|
Other (including foreign exchange translation)
|
518
|
|
191
|
|
327
|
|
(445
|
)
|
24
|
|
(469
|
)
|
|||||||||||
|
Losses and loss expenses acquired
|
—
|
|
—
|
|
—
|
|
22,923
|
|
1,521
|
|
21,402
|
|
|||||||||||
|
Balance, end of year
|
$
|
63,179
|
|
$
|
14,014
|
|
$
|
49,165
|
|
$
|
60,540
|
|
$
|
12,708
|
|
$
|
47,832
|
|
|||||
|
(1)
|
Net of provision for uncollectible reinsurance.
|
The estimate of the liabilities includes provisions for claims that have been reported but are unpaid at the balance sheet date (case reserves) and for obligations on claims that have been incurred but not reported (IBNR) at the balance sheet date. IBNR may also include provisions to account for the possibility that reported claims may settle for amounts that differ from the established case reserves. Loss reserves also include an estimate of expenses associated with processing and settling unpaid claims (loss expenses). Our loss reserves comprise approximately 78 percent casualty-related business, which typically encompasses long-tail risks, and other risks where a high degree of judgment is required.
The process of establishing loss reserves for property and casualty claims can be complex and is subject to considerable uncertainty as it requires the use of informed estimates and judgments based on circumstances underlying the insured loss known at the date of accrual. For example, the reserves established for high excess casualty claims, asbestos and environmental claims, claims from major catastrophic events, or for our various product lines each require different assumptions and judgments to be made. Necessary judgments are based on numerous factors and may be revised as additional experience and other data become available and are reviewed, as new or improved methods are developed, or as laws change. Hence, ultimate loss payments may differ from the estimate of the ultimate liabilities made at the balance sheet date. Changes to our previous estimates of prior period loss reserves impact the reported calendar year underwriting results, adversely if our estimates increase and favorably if our estimates decrease. The potential for variation in loss reserve estimates is impacted by numerous factors. Reserve estimates for casualty lines are particularly uncertain given the lengthy reporting patterns and corresponding need for IBNR.
Case reserves for those claims reported by insureds or ceding companies to us prior to the balance sheet date and where we have sufficient information are determined by our claims personnel as appropriate based on the circumstances of the claim(s), standard claim handling practices, and professional judgment. Furthermore, for our Brandywine run-off operations and our
assumed reinsurance operation, Global Reinsurance, we may adjust the case reserves as notified by the ceding company if the judgment of our respective claims department differs from that of the cedant.
With respect to IBNR reserves and those claims that have been incurred but not reported prior to the balance sheet date, there is, by definition, limited actual information to form the case reserve estimate and reliance is placed upon historical loss experience and actuarial methods to estimate the ultimate loss obligations and the corresponding amount of IBNR. IBNR reserve estimates are generally calculated by first projecting the ultimate amount of losses for a product line and subtracting paid losses and case reserves for reported claims. The judgments involved in projecting the ultimate losses may pertain to the use and interpretation of various standard actuarial reserving methods that place reliance on the extrapolation of actual historical data, loss development patterns, industry data, and other benchmarks as appropriate. The estimate of the required IBNR reserve also requires judgment by actuaries and management to reflect the impact of more contemporary and subjective factors, both qualitative and quantitative. Among some of these factors that might be considered are changes in business mix or volume, changes in ceded reinsurance structures, changes in claims handling practices, reported and projected loss trends, inflation, the legal environment, and the terms and conditions of the contracts sold to our insured parties.
Determining management's best estimate
Our recorded reserves represent management's best estimate of the provision for unpaid claims as of the balance sheet date, and establishing them involves a process that includes collaboration with various relevant parties in the company. For information on our reserving process, refer to Note 7 to the Consolidated Financial Statements.
41
Sensitivity to underlying assumptions
While we believe that our reserve for unpaid losses and loss expenses at December 31, 2017, is adequate, new information or emerging trends that differ from our assumptions may lead to future development of losses and loss expenses that is significantly greater or less than the recorded reserve, which could have a material effect on future operating results. As noted previously, our best estimate of required loss reserves for most portfolios is judgmentally selected for each origin year after considering the results from a number of reserving methods and is not a purely mechanical process. Therefore, it is difficult to convey, in a simple and quantitative manner, the impact that a change to a single assumption will have on our best estimate. In the examples below, we attempt to give an indication of the potential impact by isolating a single change for a specific reserving method that would be pertinent in establishing the best estimate for the product line described. We consider each of the following sensitivity analyses to represent a reasonably likely deviation in the underlying assumption.
North America Commercial P&C Insurance
Given the long reporting and paid development patterns for workers' compensation business, the development factors used to project actual current losses to ultimate losses for our current exposure require considerable judgment that could be material to consolidated loss and loss expense reserves. Specifically, adjusting ground up ultimate losses by a one percent change in the tail factor (i.e., 1.04 changed to either 1.05 or 1.03) would cause a change of approximately $658 million, either positive or negative, for the projected net loss and loss expense reserves. This represents an impact of about 8.3 percent relative to recorded net loss and loss expense reserves of approximately $7.9 billion.
The reserve portfolio for our Chubb Bermuda operations contains exposure to predominantly high excess liability coverage on an occurrence-first-reported basis (typically with attachment points in excess of $325 million and gross limits of up to $150 million) and D&O and other professional liability coverage on a claims-made basis (typically with attachment points in excess of $125 million and gross limits of up to $75 million). Due to the layer of exposure covered, the expected frequency for this book is very low. As a result of the low frequency/high severity nature of the book, a small difference in the actual vs. expected claim frequency, either positive or negative, could result in a material change to the projected ultimate loss if such change in claim frequency was related to a policy where close to maximum limits were deployed.
North America Personal P&C Insurance
Due to the relatively short-tailed nature of many of the coverages involved (e.g., homeowners property damage), most of the incurred losses in Personal Lines are resolved within a few years of occurrence. As shown in our loss triangle disclosure, the vast majority (over 95 percent) of Personal Lines net ultimate losses and allocated loss adjustment expenses are typically paid within five years of the accident date and over 80 percent within two years. Even though there are significant reserves associated with some liability exposures such as personal excess/umbrella liability, our incurred loss triangle also shows a roughly consistent pattern of only relatively minor movements in incurred estimates over time by accident year especially after twenty four months of maturity. While the liability exposures are subject to additional uncertainties from more protracted resolution times, the main drivers of volatility in the Personal Lines business are relatively short-term in nature and relate to things like natural catastrophes, non-catastrophe weather events, man-made risks, and individual large loss volatility from other fortuitous claim events.
North America Agricultural Insurance
Approximately 69 percent of the reserves for this segment are from the crop related lines, which all have short payout patterns, with the majority of the liabilities expected to be resolved in the ensuing twelve months. Claim reserves for our Multiple Peril Crop Insurance (MPCI) product are set on a case-by-case basis and our aggregate exposure is subject to state level risk sharing formulae as well as third-party reinsurance. The majority of the development risk arises out of the accuracy of case reserve estimates and the time needed for final crop conditions to be assessed. We do not view our Agriculture reserves as substantially influenced by the general assumptions and risks underlying more typical P&C reserve estimates.
Overseas General Insurance
Certain long-tail lines, such as casualty and professional lines, are particularly susceptible to changes in loss trend and claim inflation. Heightened perceptions of tort and settlement awards around the world can increase the demand for these products as well as contributing to the uncertainty in the reserving estimates. Our reserving methods rely on loss development patterns estimated from historical data and while we attempt to adjust such factors for known changes in the current tort environment, it is possible that such factors may not entirely reflect all recent trends in tort environments. For example, when applying the reported loss development method, the lengthening of our selected loss development patterns by six months would increase reserve estimates on long-tail casualty and professional lines for accident years 2015 and prior by approximately
$484
42
million. This represents an impact of 13.7 percent relative to recorded net loss and loss expense reserves of approximately $3.5 billion.
Global Reinsurance
Typically, there is inherent uncertainty around the length of paid and reported development patterns, especially for certain casualty lines such as excess workers' compensation or general liability, which may take decades to fully develop. This uncertainty is accentuated by the need to supplement client development patterns with industry development patterns due to the sometimes low statistical credibility of the data. The underlying source and selection of the final development patterns can thus have a significant impact on the selected ultimate net losses and loss expenses. For example, a 20 percent shortening or lengthening of the development patterns used for U.S. long-tail lines would cause the loss reserve estimate derived by the reported Bornhuetter-Ferguson method for these lines to change by approximately $458 million. This represents an impact of 52 percent relative to recorded net loss and loss expense reserves of approximately $888 million.
Assumed reinsurance
At
December 31, 2017
, net unpaid losses and loss expenses for the Global Reinsurance segment aggregated to $1.7 billion, consisting of $843 million of case reserves and $870 million of IBNR. In comparison, at
December 31, 2016
, net unpaid losses and loss expenses for the Global Reinsurance segment aggregated to $1.7 billion, consisting of $760 million of case reserves and $978 million of IBNR.
For our catastrophe business, we principally estimate unpaid losses and loss expenses on an event basis by considering various sources of information, including specific loss estimates reported by our cedants, ceding company and overall industry loss estimates reported by our brokers, and our internal data regarding reinsured exposures related to the geographical location of the event. Our internal data analysis enables us to establish catastrophe reserves for known events with more certainty at an earlier date than would be the case if we solely relied on reports from third parties to determine carried reserves.
For our casualty reinsurance business, we generally rely on ceding companies to report claims and then use that data as a key input to estimate unpaid losses and loss expenses. Due to the reliance on claims information reported by ceding companies, as well as other factors, the estimation of unpaid losses and loss expenses for assumed reinsurance includes certain risks and uncertainties that are unique relative to our direct insurance business. These include, but are not necessarily limited to, the following:
|
•
|
The reported claims information could be inaccurate;
|
|
•
|
Typically, a lag exists between the reporting of a loss event to a ceding company and its reporting to us as a reinsurance claim. The use of a broker to transmit financial information from a ceding company to us increases the reporting lag. Because most of our reinsurance business is produced by brokers, ceding companies generally first submit claim and other financial information to brokers, who then report the proportionate share of such information to each reinsurer of a particular treaty. The reporting lag generally results in a longer period of time between the date a claim is incurred and the date a claim is reported compared with direct insurance operations. Therefore, the risk of delayed recognition of loss reserve development is higher for assumed reinsurance than for direct insurance lines; and
|
|
•
|
The historical claims data for a particular reinsurance contract can be limited relative to our insurance business in that there may be less historical information available. Further, for certain coverages or products, such as excess of loss contracts, there may be relatively few expected claims in a particular year so the actual number of claims may be susceptible to significant variability. In such cases, the actuary often relies on industry data from several recognized sources.
|
We mitigate the above risks in several ways. In addition to routine analytical reviews of ceding company reports to ensure reported claims information appears reasonable, we perform regular underwriting and claims audits of certain ceding companies to ensure reported claims information is accurate, complete, and timely. As appropriate, audit findings are used to adjust claims in the reserving process. We also use our knowledge of the historical development of losses from individual ceding companies to adjust the level of adequacy we believe exists in the reported ceded losses.
On occasion, there will be differences between our carried loss reserves and unearned premium reserves and the amount of loss reserves and unearned premium reserves reported by the ceding companies. This is due to the fact that we receive consistent and timely information from ceding companies only with respect to case reserves. For IBNR, we use historical experience and other statistical information, depending on the type of business, to estimate the ultimate loss. We estimate our unearned premium reserve by applying estimated earning patterns to net premiums written for each treaty based upon that treaty's coverage basis (i.e., risks attaching or losses occurring). At
December 31, 2017
, the case reserves reported to us by our ceding
43
companies were $827 million, compared with the $843 million we recorded. Our policy is to post additional case reserves in addition to the amounts reported by our cedants when our evaluation of the ultimate value of a reported claim is different than the evaluation of that claim by our cedant.
Within Corporate, we also have exposure to certain liability reinsurance lines that have been in run-off since 1994. Unpaid losses and loss expenses relating to this run-off reinsurance business resides within the Brandywine Division of Corporate. Most of the remaining unpaid loss and loss expense reserves for the run-off reinsurance business relate to A&E claims. Refer to the “Asbestos and Environmental (A&E)” section for additional information.
Asbestos and environmental reserves
Included in our liabilities for losses and loss expenses are amounts for A&E (A&E liabilities). The A&E liabilities principally relate to claims arising from bodily-injury claims related to asbestos products and remediation costs associated with hazardous waste sites. The estimation of our A&E liabilities is particularly sensitive to future changes in the legal, social, and economic environment. We have not assumed any such future changes in setting the value of our A&E liabilities, which include provisions for both reported and IBNR claims.
There are many complex variables that we consider when estimating the reserves for our inventory of asbestos accounts and these variables may directly impact the predicted outcome. We believe the most significant variables relating to our A&E liabilities include the current legal environment; specific settlements that may be used as precedents to settle future claims; assumptions regarding trends with respect to claim severity and the frequency of higher severity claims; assumptions regarding the ability to allocate liability among defendants (including bankruptcy trusts) and other insurers; the ability of a claimant to bring a claim in a state in which they have no residency or exposure; the ability of a policyholder to claim the right to unaggregated coverage; whether high-level excess policies have the potential to be accessed given the policyholder's claim trends and liability situation; payments to unimpaired claimants; and, the potential liability of peripheral defendants. Based on the policies, the facts, the law, and a careful analysis of the impact that these factors will likely have on any given account, we estimate the potential liability for indemnity, policyholder defense costs, and coverage litigation expense.
The results in asbestos cases announced by other carriers or defendants may well have little or no relevance to us because coverage exposures are highly dependent upon the specific facts of individual coverage and resolution status of disputes among carriers, policyholders, and claimants.
For additional information refer to the “Asbestos and Environmental (A&E)” section and to Note
7
to the Consolidated Financial Statements.
Future policy benefits reserves
We issue contracts in our Overseas General Insurance and Life Insurance segments that are classified as long-duration. These contracts generally include accident and supplemental health products, term and whole life products, endowment products, and annuities. In accordance with GAAP, we establish reserves for contracts determined to be long-duration based on approved actuarial methods that include assumptions related to expenses, mortality, morbidity, persistency, and investment yields with a factor for adverse deviation. These assumptions are “locked in” at the inception of the contract, meaning we use our original assumptions throughout the life of the policy and do not subsequently modify them unless we deem the reserves to be inadequate. The future policy benefits reserves balance is regularly evaluated for a premium deficiency. If experience is less favorable than assumptions, additional liabilities may be required, resulting in a charge to policyholder benefits and claims.
Valuation of value of business acquired (VOBA), and amortization of deferred policy acquisition costs and VOBA
As part of the acquisition of businesses that sell long-duration contracts, such as life products, we established an intangible asset related to VOBA, which represented the fair value of the future profits of the in-force contracts. The valuation of VOBA at the time of acquisition is derived from similar assumptions to those used to establish the associated future policy benefits reserves. The most significant input in this calculation is the discount rate used to arrive at the present value of the net cash flows. We amortize deferred policy acquisition costs associated with long-duration contracts and VOBA (collectively policy acquisition costs) over the estimated life of the contracts, generally in proportion to premium revenue recognized based upon the same assumptions used in estimating the liability for future policy benefits. For non-traditional long-duration contracts, we amortize policy acquisition costs over the expected life of the contracts in proportion to estimates of expected gross profits. The estimated life is established at the inception of the contracts or upon acquisition and is based on current persistency assumptions. Policy acquisition costs, which consist of commissions, premium taxes, and certain underwriting costs related directly to the successful acquisition of a new or renewal insurance contract, are reviewed to determine if they are recoverable from future income, including investment income. Unrecoverable costs are expensed in the period identified.
44
Risk transfer
In the ordinary course of business, we both purchase (or cede) and sell (or assume) reinsurance protection. We discontinued the purchase of all finite risk reinsurance contracts, as a matter of policy, in 2002. For both ceded and assumed reinsurance, risk transfer requirements must be met in order to use reinsurance accounting, principally resulting in the recognition of cash flows under the contract as premiums and losses. If risk transfer requirements are not met, a contract is to be accounted for as a deposit, typically resulting in the recognition of cash flows under the contract through a deposit asset or liability and not as revenue or expense. To meet risk transfer requirements, a reinsurance contract must include both insurance risk, consisting of underwriting and timing risk, and a reasonable possibility of a significant loss for the assuming entity. We also apply similar risk transfer requirements to determine whether certain commercial insurance contracts should be accounted for as insurance or a deposit. Contracts that include fixed premium (i.e., premium not subject to adjustment based on loss experience under the contract) for fixed coverage generally transfer risk and do not require judgment.
Reinsurance and insurance contracts that include both significant risk sharing provisions, such as adjustments to premiums or loss coverage based on loss experience, and relatively low policy limits, as evidenced by a high proportion of maximum premium assessments to loss limits, can require considerable judgment to determine whether or not risk transfer requirements are met. For such contracts, often referred to as finite or structured products, we require that risk transfer be specifically assessed for each contract by developing expected cash flow analyses at contract inception. To support risk transfer, the cash flow analyses must demonstrate that a significant loss is reasonably possible, such as a scenario in which the ratio of the net present value of losses divided by the net present value of premiums equals or exceeds 110 percent. For purposes of cash flow analyses, we generally use a risk-free rate of return consistent with the expected average duration of loss payments. In addition, to support insurance risk, we must prove the reinsurer's risk of loss varies with that of the reinsured and/or support various scenarios under which the assuming entity can recognize a significant loss.
To ensure risk transfer requirements are routinely assessed, qualitative and quantitative risk transfer analyses and memoranda supporting risk transfer are developed by underwriters for all structured products. We have established protocols for structured products that include criteria triggering an accounting review of the contract prior to quoting. If any criterion is triggered, a contract must be reviewed by a committee established by each of our segments with reporting oversight, including peer review, from our global Structured Transaction Review Committee.
With respect to ceded reinsurance, we entered into a few multi-year excess of loss retrospectively-rated contracts, principally in 2002. These contracts primarily provided severity protection for specific product divisions. Because traditional one-year reinsurance coverage had become relatively costly, these contracts were generally entered into in order to secure a more cost-effective reinsurance program. All of these contracts transferred risk and were accounted for as reinsurance. In addition, we maintain a few aggregate excess of loss reinsurance contracts that were principally entered into prior to 2003, such as the National Indemnity Company (NICO) contracts referred to in the section entitled, “Asbestos and Environmental (A&E)”. We have not purchased any other retroactive ceded reinsurance contracts since 1999.
With respect to assumed reinsurance and insurance contracts, products giving rise to judgments regarding risk transfer were primarily sold by our financial solutions business. Although we have significantly curtailed writing financial solutions business, several contracts remain in-force and principally include multi-year retrospectively-rated contracts and loss portfolio transfers. Because transfer of insurance risk is generally a primary client motivation for purchasing these products, relatively few insurance and reinsurance contracts have historically been written for which we concluded that risk transfer criteria had not been met. For certain insurance contracts that have been reported as deposits, the insured desired to self-insure a risk but was required, legally or otherwise, to purchase insurance so that claimants would be protected by a licensed insurance company in the event of non-payment from the insured.
Reinsurance recoverable
Reinsurance recoverable includes balances due to us from reinsurance companies for paid and unpaid losses and loss expenses and is presented net of a provision for uncollectible reinsurance. The provision for uncollectible reinsurance is determined based upon a review of the financial condition of the reinsurers and other factors. Ceded reinsurance contracts do not relieve our primary obligation to our policyholders. Consequently, an exposure exists with respect to reinsurance recoverable to the extent that any reinsurer is unable or unwilling to meet its obligations or disputes the liabilities assumed under the reinsurance contracts. We determine the reinsurance recoverable on unpaid losses and loss expenses using actuarial estimates as well as a determination of our ability to cede unpaid losses and loss expenses under existing reinsurance contracts.
45
The recognition of a reinsurance recoverable asset requires two key judgments. The first judgment involves our estimation based on the amount of gross reserves and the percentage of that amount which may be ceded to reinsurers. Ceded IBNR, which is a major component of the reinsurance recoverable on unpaid losses and loss expenses, is generally developed as part of our loss reserving process and, consequently, its estimation is subject to similar risks and uncertainties as the estimation of gross IBNR (refer to “Critical Accounting Estimates – Unpaid losses and loss expenses”). The second judgment involves our estimate of the amount of the reinsurance recoverable balance that we may ultimately be unable to recover from reinsurers due to insolvency, contractual dispute, or for other reasons. Estimated uncollectible amounts are reflected in a provision that reduces the reinsurance recoverable asset and, in turn, shareholders' equity. Changes in the provision for uncollectible reinsurance are reflected in net income.
Although the obligation of individual reinsurers to pay their reinsurance obligations is based on specific contract provisions, the collectability of such amounts requires estimation by management. The majority of the recoverable balance will not be due for collection until sometime in the future, and the duration of our recoverables may be longer than the duration of our direct exposures. Over this period of time, economic conditions and operational performance of a particular reinsurer may impact their ability to meet these obligations and while they may continue to acknowledge their contractual obligation to do so, they may not have the financial resources or willingness to fully meet their obligation to us.
To estimate the provision for uncollectible reinsurance, the reinsurance recoverable must first be determined for each reinsurer. This determination is based on a process rather than an estimate, although an element of judgment must be applied. As part of the process, ceded IBNR is allocated to reinsurance contracts because ceded IBNR is not generally calculated on a contract by contract basis. The allocations are generally based on premiums ceded under reinsurance contracts, adjusted for actual loss experience and historical relationships between gross and ceded losses. If actual premium and loss experience vary materially from historical experience, the allocation of reinsurance recoverable by reinsurer will be reviewed and may change. While such change is unlikely to result in a large percentage change in the provision for uncollectible reinsurance, it could, nevertheless, have a material effect on our net income in the period recorded.
Generally, we use a default analysis to estimate uncollectible reinsurance. The primary components of the default analysis are reinsurance recoverable balances by reinsurer, net of collateral, and default factors used to estimate the probability that the reinsurer may be unable to meet its future obligations in full. The definition of collateral for this purpose requires some judgment and is generally limited to assets held in a Chubb-only beneficiary trust, letters of credit, and liabilities held by us with the same legal entity for which we believe there is a right of offset. We do not currently include multi-beneficiary trusts. However, we have several reinsurers that have established multi-beneficiary trusts for which certain of our companies are beneficiaries. The determination of the default factor is principally based on the financial strength rating of the reinsurer and a corresponding default factor applicable to the financial strength rating. Default factors require considerable judgment and are determined using the current financial strength rating, or rating equivalent, of each reinsurer as well as other key considerations and assumptions. Significant considerations and assumptions include, but are not necessarily limited to, the following:
|
•
|
For reinsurers that maintain a financial strength rating from a major rating agency, and for which recoverable balances are considered representative of the larger population (i.e., default probabilities are consistent with similarly rated reinsurers and payment durations conform to averages), the judgment exercised by management to determine the provision for uncollectible reinsurance of each reinsurer is typically limited because the financial rating is based on a published source and the default factor we apply is based on a historical default factor of a major rating agency applicable to the particular rating class. Default factors applied for financial ratings of AAA, AA, A, BBB, BB, B, and CCC, are 0.8 percent, 1.2 percent, 1.7 percent, 4.9 percent, 19.6 percent, 34.0 percent, and 62.2 percent, respectively. Because our model is predicated on the historical default factors of a major rating agency, we do not generally consider alternative factors. However, when a recoverable is expected to be paid in a brief period of time by a highly-rated reinsurer, such as certain property catastrophe claims, a default factor may not be applied;
|
|
•
|
For balances recoverable from reinsurers that are both unrated by a major rating agency and for which management is unable to determine a credible rating equivalent based on a parent or affiliated company, we may determine a rating equivalent based on our analysis of the reinsurer that considers an assessment of the creditworthiness of the particular entity, industry benchmarks, or other factors as considered appropriate. We then apply the applicable default factor for that rating class. For balances recoverable from unrated reinsurers for which our ceded reserve is below a certain threshold, we generally apply a default factor of 34.0 percent;
|
|
•
|
For balances recoverable from reinsurers that are either insolvent or under regulatory supervision, we establish a default factor and resulting provision for uncollectible reinsurance based on specific facts and circumstances surrounding each company. Upon initial notification of an insolvency, we generally recognize expense for a substantial portion of all balances outstanding, net of collateral, through a combination of write-offs of recoverable balances and increases to the provision for
|
46
uncollectible reinsurance. When regulatory action is taken on a reinsurer, we generally recognize a default factor by estimating an expected recovery on all balances outstanding, net of collateral. When sufficient credible information becomes available, we adjust the provision for uncollectible reinsurance by establishing a default factor pursuant to information received; and
|
•
|
For captives and other recoverables, management determines the provision for uncollectible reinsurance based on the specific facts and circumstances.
|
The following table summarizes reinsurance recoverables and the provision for uncollectible reinsurance for each type of recoverable balance at
December 31, 2017
:
|
Gross Reinsurance Recoverables on Losses and Loss Expenses
|
|
Recoverables (net of Usable Collateral)
|
|
|||||||||
|
Provision for Uncollectible Reinsurance
(1)
|
|
|||||||||||
|
(in millions of U.S. dollars)
|
||||||||||||
|
Type
|
||||||||||||
|
Reinsurers with credit ratings
|
$
|
11,442
|
|
$
|
10,097
|
|
$
|
166
|
|
|||
|
Reinsurers not rated
|
426
|
|
190
|
|
59
|
|
||||||
|
Reinsurers under supervision and insolvent reinsurers
|
100
|
|
97
|
|
41
|
|
||||||
|
Captives
|
2,199
|
|
258
|
|
18
|
|
||||||
|
Other - structured settlements and pools
|
1,188
|
|
992
|
|
37
|
|
||||||
|
Total
|
$
|
15,355
|
|
$
|
11,634
|
|
$
|
321
|
|
|||
(1)
The provision for uncollectible reinsurance is based on a default analysis applied to gross reinsurance recoverables, net of approximately
$3.7 billion
and $
3.3 billion
of collateral at
December 31, 2017
and
2016
, respectively.
At
December 31, 2017
, the use of different assumptions within our approach could have a material effect on the provision for uncollectible reinsurance. To the extent the creditworthiness of our reinsurers were to deteriorate due to an adverse event affecting the reinsurance industry, such as a large number of major catastrophes, actual uncollectible amounts could be significantly greater than our provision for uncollectible reinsurance. Such an event could have a material adverse effect on our financial condition, results of operations, and our liquidity. Given the various considerations used to estimate our uncollectible provision, we cannot precisely quantify the effect a specific industry event may have on the provision for uncollectible reinsurance. However, based on the composition (particularly the average credit quality) of the reinsurance recoverable balance at
December 31, 2017
, we estimate that a ratings downgrade of one notch for all rated reinsurers (i.e., from A to A- or A- to BBB+) could increase our provision for uncollectible reinsurance by approximately $64 million or approximately 0.4 percent of the gross reinsurance recoverable balance, assuming no other changes relevant to the calculation. While a ratings downgrade would result in an increase in our provision for uncollectible reinsurance and a charge to earnings in that period, a downgrade in and of itself does not imply that we will be unable to collect all of the ceded reinsurance recoverable from the reinsurers in question. Refer to Note
5
to the Consolidated Financial Statements for additional information.
Other-than-temporary impairments (OTTI)
Each quarter, we review securities in an unrealized loss position (impaired securities), including fixed maturities, securities lending collateral, equity securities, and other investments, to identify impaired securities to be specifically evaluated for a potential OTTI. Because our investment portfolio is the largest component of consolidated assets, OTTI could be material to our financial condition and results of operations. Refer to Note
3
d) to the Consolidated Financial Statements for a description of the OTTI process.
Deferred taxes
At
December 31, 2017
, our net deferred tax liability was
$699 million
. Many of our insurance businesses operate in income tax-paying jurisdictions. Our deferred tax assets and liabilities primarily result from temporary differences between the amounts recorded in our consolidated financial statements and the tax basis of our assets and liabilities. We determine deferred tax assets and liabilities separately for each tax-paying component (an individual entity or group of entities that is consolidated for tax purposes) in each tax jurisdiction. The realization of deferred tax assets depends upon the existence of sufficient taxable income within the carryback or carryforward periods under the tax law in the applicable tax jurisdiction. There may be changes in tax laws in a number of countries where we transact business that impact our tax balances. For example, the recently enacted 2017 Tax Act in the U.S. required us to reassess our deferred tax balances, principally to reflect the reduction of the corporate tax rate from 35 percent to 21 percent. We have adjusted our deferred tax balances in the fourth quarter of 2017 based on our best estimate and understanding of the new tax legislation. However, the
2017 Tax Act is a complex law with
47
many new provisions. Until additional guidance is issued, there are many uncertainties relating to its ultimate application. Refer to Note
8
to the Consolidated Financial Statements for additional information.
At each balance sheet date, management assesses the need to establish a valuation allowance that reduces deferred tax assets when it is more likely than not that all, or some portion, of the deferred tax assets will not be realized. The valuation allowance is based on all available information including projections of future taxable income from each tax-paying component in each tax jurisdiction, principally derived from business plans and available tax planning strategies. Projections of future taxable income incorporate several assumptions of future business and operations that are apt to differ from actual experience. If our assumptions and estimates that resulted in our forecast of future taxable income for each tax-paying component prove to be incorrect, an additional valuation allowance could become necessary, which could have a material adverse effect on our financial condition, results of operations, and liquidity. At
December 31, 2017
, the valuation allowance of
$99
million reflects management's assessment that it is more likely than not that a portion of the deferred tax asset will not be realized due to the potential inability to utilize foreign tax credits in the U.S. and the inability of certain foreign subsidiaries to generate sufficient taxable income.
Fair value measurements
Accounting guidance defines fair value as the price to sell an asset or transfer a liability (an exit price) in an orderly transaction between market participants and establishes a three-level valuation hierarchy based on the reliability of the inputs. The fair value hierarchy gives the highest priority to quoted prices in active markets (Level 1 inputs) and the lowest priority to unobservable data (Level 3 inputs). Level 2 includes inputs, other than quoted prices within Level 1, that are observable for assets or liabilities either directly or indirectly. Refer to Note 4 and Note 13 to the Consolidated Financial Statements for information on our fair value measurements.
Assumed reinsurance programs involving minimum benefit guarantees under variable annuity contracts
Chubb reinsures various death and living benefit guarantees associated with variable annuities issued primarily in the United States and Japan. We ceased writing this business in 2007. Guarantees which are payable on death are referred to as guaranteed minimum death benefits (GMDB). Guarantees on living benefits (GLB) includes guaranteed minimum income benefits (GMIB) and guaranteed minimum accumulation benefits (GMAB). For further description of this product and related accounting treatment, refer to Note 1 j) to the Consolidated Financial Statements.
Guaranteed living benefits (GLB) derivatives
Our GLB reinsurance is classified as a derivative for accounting purposes and therefore carried at fair value. We believe that the most meaningful presentation of these GLB derivatives is as follows:
|
•
|
Estimates of the average modeled value of future cash outflows is recorded as incurred losses (i.e., benefit reserves). Cash inflows or revenue are reported as net premiums earned and changes in the benefit reserves are reflected as Policy benefits expense in the Consolidated statements of operations, which is included in underwriting income.
|
|
•
|
The incremental difference between the fair value of GLB reinsurance contracts and benefit reserves is reflected in Accounts payable, accrued expenses, and other liabilities in the Consolidated balance sheets and related changes in fair value are reflected in Net realized gains (losses) in the Consolidated statements of operations.
|
Determination of GLB fair value
The fair value of GLB reinsurance is estimated using an internal valuation model, which includes current market information and estimates of policyholder behavior from the perspective of a theoretical market participant that would assume these liabilities. All of our treaties contain claim limits, which are factored into the valuation model. The fair value depends on a number of factors, including interest rates, equity markets, credit risk, current account value, market volatility, expected annuitization rates and other policyholder behavior, and changes in policyholder mortality. The model and related assumptions are regularly re-evaluated by management and enhanced, as appropriate, based upon additional experience obtained related to policyholder behavior and availability of more timely market information. Due to the inherent uncertainties of the assumptions used in the valuation models to determine the fair value of these derivative products, actual experience may differ materially from the estimates reflected in our Consolidated Financial Statements.
We intend to hold these derivative contracts to maturity (i.e., the expiration of the underlying liabilities through lapse, annuitization, death, or expiration of the reinsurance contract). To partially offset the risk of changes in the fair value of GLB reinsurance contracts, we invest in derivative hedge instruments. At maturity, the cumulative realized gains and losses (excluding cumulative hedge gains or losses) from fair value changes of GLB reinsurance contracts will net to zero because, over time, the insurance liability will be increased or decreased to equal our obligation.
48
Determination of GLB and Guaranteed minimum death benefits (GMDB) benefit reserves
Management established benefit reserves based on a long-term benefit ratio (or loss ratio) calculated using assumptions reflecting management’s best estimate of the future short-term and long-term performance of the variable annuity line of business. Despite the long-term nature of the risk, the benefit ratio calculation is impacted by short-term market movements that may be judged by management to be transient. Management regularly examines both qualitative and quantitative analysis, including a review of the differential between the benefit ratio used at the most recent valuation date and the benefit ratio calculated on subsequent dates. Management regularly evaluates its estimates and uses judgment to determine the extent to which assumptions underlying the benefit ratio calculation should be adjusted. For the year ended December 31, 2017, management determined that no change to the benefit ratio was warranted.
For further information on the estimates and assumptions used in determining the fair value of GLB reinsurance, refer to Note 4 to the Consolidated Financial Statements. For a sensitivity discussion of the effect of changes in interest rates, equity indices, and other assumptions on the fair value of GLBs, and the estimated resulting impact on our net income, refer to Item 7A.
Risk Management
We employ a strategy to manage the financial market and policyholder behavior risks embedded in the reinsurance of variable annuity (VA) guarantees. Risk management begins with underwriting a prospective client and guarantee design, with particular focus on protecting our position from policyholder options that, because of anti-selective behavior, could adversely impact our obligation.
A second layer of risk management is the structure of the reinsurance contracts. All VA guarantee reinsurance contracts include some form of annual or aggregate claim limit(s). For example, for 65 percent of the GMDB portfolio (based on guaranteed value), there is an annual claim limit of 2 percent of account value. The different categories of claim limits are as follows:
|
Reinsurance program covering
|
% of total guaranteed value (GV)
|
% of GV that has additional reinsurance coverage
|
Additional terms
|
|||
|
GMDB with an annual claim limit of 2% of account value (AV)
|
65% of total GMDB
|
2% for GLB
|
N/A
|
|||
|
GMDB with annual claim limits that are a function of underlying GV
(varies from 0.4% to 2.0% of GV)
|
30% of total GMDB
|
80% for GLB
|
• 50% of GV subject to annual claim
deductibles
(1)
of 0.1% to 0.2% of GV
• 30% of GV subject to an aggregate claim limit
of approximately $275 million
|
|||
|
GMDB and GMAB
|
5% of total GLB
5% of total GMDB |
N/A
|
• Programs are quota-share (QS) agreements
with QS % decreasing as ratio of AV to GV
decreases:
— QS 100% for ratios between 100% - 75%
— QS 60% for ratios between 75% - 45%
— QS 30% for ratios less than 45%
• 5% of GV subject to a per policy claim
deductible of 8.8% of GV for GMAB only
(1)
|
|||
|
GMIB with annual claim limits that are a function of underlying GV (typically 10% of GV)
|
65% of total GLB
|
45% for GMDB
|
• Annual annuitization limit range 17.5% - 30%:
— 55% subject to limit of 30%
— 45% subject to limit of 20% or under
• 43% of GV subject to minimum annuity
conversion factors that limits exposure to low
interest rates
|
|||
|
GMIB with an aggregate claim limit of
$2.0
billion
|
30% of total GLB
|
35% for GMDB
|
•
Annual annuitization limit of 20%
•
65% of GV subject to minimum annuity
conversion factors that limit exposure to low
interest rates
•
40% of GV subject to an aggregate claim
deductible of 2% of underlying annuity deposits
|
|||
(1)
Chubb would only pay total annual claims in excess of deductibles.
A third layer of risk management is the hedging strategy which looks to mitigate both long-term economic loss over time as well as dampen income statement volatility. We owned financial market instruments as part of the hedging strategy with a fair value (liability) asset of
$(21)
million and $
1
million at
December 31, 2017
and
2016
, respectively. The instruments are substantially collateralized by our counterparties, on a daily basis.
49
We also limit the aggregate amount of variable annuity reinsurance guarantee risk we are willing to assume. The last substantive transactions were quoted in late 2007. The aggregate number of policyholders is currently decreasing through policyholder withdrawals, annuitizations, and deaths at a rate of
5
percent to
15
percent per annum.
Note that GLB claims cannot occur for any reinsured policy until it has reached the end of its “waiting period”. As shown in the table below,
80
percent of the policies we reinsure reached the end of their “waiting periods” in 2017 and prior.
|
Year of first payment eligibility
|
Percent of living benefit
account values
|
|
|
2017 and prior
|
80
|
%
|
|
2018
|
10
|
%
|
|
2019
|
3
|
%
|
|
2020
|
1
|
%
|
|
2021
|
2
|
%
|
|
2022 and after
|
4
|
%
|
|
Total
|
100
|
%
|
The following table presents the historical cash flows under these policies for the periods indicated. The amounts represent accrued past premium received and claims paid, split by benefit type.
|
(in millions of U.S. dollars)
|
2017
|
2016
|
2015
|
||||||||||||||||||||||||||||||||
|
GMDB
|
|
GLB
|
|
Total
|
|
GMDB
|
|
GLB
|
|
Total
|
|
GMDB
|
|
GLB
|
|
Total
|
|
||||||||||||||||||
|
Premium received
|
$
|
49
|
|
$
|
110
|
|
$
|
159
|
|
$
|
55
|
|
$
|
118
|
|
$
|
173
|
|
$
|
61
|
|
$
|
121
|
|
$
|
182
|
|
||||||||
|
Less paid claims
|
31
|
|
54
|
|
85
|
|
42
|
|
39
|
|
81
|
|
28
|
|
16
|
|
44
|
|
|||||||||||||||||
|
Net cash received
|
$
|
18
|
|
$
|
56
|
|
$
|
74
|
|
$
|
13
|
|
$
|
79
|
|
$
|
92
|
|
$
|
33
|
|
$
|
105
|
|
$
|
138
|
|
||||||||
Collateral
Chubb holds collateral on behalf of most of its clients in the form of qualified assets in trust or letters of credit, typically in an amount sufficient for the client to obtain statutory reserve credit for the reinsurance. The timing of the calculation and amount of the collateral varies by client according to the particulars of the reinsurance treaty and the statutory reserve guidelines of the client's domicile.
Goodwill impairment assessment
Goodwill, which represents the excess of acquisition cost over the estimated fair value of net assets acquired, was
$15.5 billion
and
$15.3 billion
at
December 31, 2017
and
2016
, respectively. Goodwill is assigned to applicable reporting units of acquired entities at the time of acquisition. Our reporting units are the same as our reportable segments. For goodwill balances by reporting units, refer to Note 6 to the Consolidated Financial Statements.
Goodwill is not amortized but is subject to a periodic evaluation for impairment at least annually, or earlier if there are any indications of possible impairment. Impairment is tested at the reporting unit level. The impairment evaluation first uses a qualitative assessment to determine whether it is more likely than not (i.e., more than a 50 percent probability) that the fair value of a reporting unit is greater than its carrying amount. If a reporting unit fails this qualitative assessment, a single quantitative analysis is used to measure and record the amount of the impairment.
In assessing the fair value of a reporting unit, we make assumptions and estimates about the profitability attributable to our reporting units, including:
|
•
|
short-term and long-term growth rates; and
|
|
•
|
estimated cost of equity and changes in long-term risk-free interest rates.
|
If our assumptions and estimates made in assessing the fair value of acquired entities change, we could be required to write-down the carrying value of goodwill which could be material to our results of operations in the period the charge is taken.
Based on our impairment testing for
2017
, we determined no impairment was required and none of our reporting units were at risk for impairment.
50
Consolidated Operating Results – Years Ended December 31,
2017
,
2016
, and
2015
|
|
% Change
|
||||||||||||||||
|
(in millions of U.S. dollars, except for percentages)
|
2017
|
|
2016
|
|
2015
|
|
2017 vs. 2016
|
|
2016 vs. 2015
|
|
|||||||
|
Net premiums written
(1)
|
$
|
29,244
|
|
$
|
28,145
|
|
$
|
17,713
|
|
3.9
|
%
|
58.9
|
%
|
||||
|
Net premiums earned
(1)
|
29,034
|
|
28,749
|
|
17,213
|
|
1.0
|
%
|
67.0
|
%
|
|||||||
|
Net investment income
|
3,125
|
|
2,865
|
|
2,194
|
|
9.1
|
%
|
30.6
|
%
|
|||||||
|
Net realized gains (losses)
|
84
|
|
(145
|
)
|
(420
|
)
|
NM
|
|
(65.5
|
)%
|
|||||||
|
Total revenues
|
32,243
|
|
31,469
|
|
18,987
|
|
2.5
|
%
|
65.7
|
%
|
|||||||
|
Losses and loss expenses
|
18,454
|
|
16,052
|
|
9,484
|
|
15.0
|
%
|
69.3
|
%
|
|||||||
|
Policy benefits
|
676
|
|
588
|
|
543
|
|
15.0
|
%
|
8.3
|
%
|
|||||||
|
Policy acquisition costs
|
5,781
|
|
5,904
|
|
2,941
|
|
(2.1
|
)%
|
100.7
|
%
|
|||||||
|
Administrative expenses
|
2,833
|
|
3,081
|
|
2,270
|
|
(8.0
|
)%
|
35.7
|
%
|
|||||||
|
Interest expense
|
607
|
|
605
|
|
300
|
|
0.3
|
%
|
101.7
|
%
|
|||||||
|
Other (income) expense
|
(400
|
)
|
(222
|
)
|
(51
|
)
|
80.2
|
%
|
335.3
|
%
|
|||||||
|
Amortization of purchased intangibles
|
260
|
|
19
|
|
171
|
|
NM
|
|
(88.9
|
)%
|
|||||||
|
Chubb integration expenses
|
310
|
|
492
|
|
33
|
|
(37.0
|
)%
|
NM
|
|
|||||||
|
Total expenses
|
28,521
|
|
26,519
|
|
15,691
|
|
7.5
|
%
|
69.0
|
%
|
|||||||
|
Income before income tax
|
3,722
|
|
4,950
|
|
3,296
|
|
(24.8
|
)%
|
50.2
|
%
|
|||||||
|
Income tax expense (benefit)
|
(139
|
)
|
815
|
|
462
|
|
NM
|
|
76.4
|
%
|
|||||||
|
Net income
|
$
|
3,861
|
|
$
|
4,135
|
|
$
|
2,834
|
|
(6.6
|
)%
|
45.9
|
%
|
||||
|
NM – not meaningful
|
|||||||||||||||||
|
(1)
|
On a constant-dollar basis for the years ended
December 31, 2017
and 2016, net premiums written increased
$1.1 billion
, or 3.9 percent, and $10.8 billion, or 62.3 percent, respectively, and net premiums earned increased
$232 million
, or 0.8 percent, and $11.9 billion, or 70.3 percent, respectively. Amounts are calculated by translating prior period results using the same local currency rates as the comparable current period.
|
Net Premiums Written
2017 vs. 2016
Net premiums written reflect the premiums we retain after purchasing reinsurance protection. Consolidated net premiums written
increased
$1.1 billion
in
2017
, reflecting growth across most segments. The increase is also due to the timing of the Chubb Corp acquisition in the prior year, which excluded approximately $
855 million
of production generated prior to the Chubb Corp acquisition close on January 14, 2016 (14-day stub period). On a comparative basis, which includes the 14-day stub period, net premiums written increased $
244 million
. This increase in premiums was partially offset by merger-related actions of
$582 million
. Merger-related actions include the cancellation of certain portfolios or lines of business that do not meet our underwriting standards and the purchase of additional reinsurance due to the acquisition of Chubb Corp.
|
•
|
Net premiums written in our North America Commercial P&C Insurance segment
increased
$288 million
in
2017
. On a comparative basis, which includes the 14-day stub period ($519 million), net premiums written decreased
$231 million
driven by merger-related actions (
$278 million
). Excluding these items, net premiums written increased
$47 million
, or
0.4
percent, as growth, primarily in our risk management and casualty business was offset by declines in property and select components of our financial lines businesses due to competitive market conditions.
|
|
•
|
Net premiums written in our North America Personal P&C Insurance segment increased
$380 million
in
2017
. On a comparative basis, which includes the 14-day stub period (
$100 million
), net premiums written increased $
280 million
reflecting both growth across most lines as well as the non-renewal of a quota share treaty in 2017 covering the acquired Fireman's Fund homeowners and automobile businesses ($189 million).
|
|
•
|
Net premiums written in our North America Agricultural Insurance segment increased
$188 million
in 2017, primarily due to an increase in MPCI production and growth in our Agriculture P&C products. The increase in MPCI premium was driven in part by higher policy count and the year-over-year impact of our update to the MPCI margin estimate which resulted in a smaller cession to the U.S. government in 2016. Under the government's crop insurance profit and loss calculation formulas, we retained more premiums in 2017 as losses were higher compared to 2016.
|
51
|
•
|
Net premiums written in our Overseas General Insurance segment
increased
$217 million
in
2017
, or
$220 million
on a constant-dollar basis. Excluding the favorable impact of the 14-day stub period (
$215 million
), unfavorable impact of merger-related accounting policy adjustments in 2016 to align the timing of premium recognition (
$126 million
) and merger-related actions (
$131 million
), net premiums written increased
$262 million
on a constant-dollar basis, driven by growth in personal lines business, primarily from new automobile business written in Latin America, as well as growth across most property and casualty (P&C) lines, primarily in Asia and Latin America.
|
|
•
|
Net premiums written in our Global Reinsurance segment increased
$9 million
in
2017
primarily due to a $30 million increase in catastrophe reinstatement premiums and the favorable impact of the 14-day stub period ($20 million). These increases were negatively impacted by merger-related actions of $
10 million
, declining rates and increasing competition.
|
|
•
|
Net premiums written in our Life Insurance segment increased $
17 million
in
2017
due to growth in our Asian international life operations and Combined Insurance supplemental A&H program business. This growth was partially offset by planned declines in our Latin American operations, reflecting merger-related actions of $
37 million
, and in our life reinsurance business, which continues to decline as no new business is currently being written.
|
2016 vs. 2015
Consolidated net premiums written increased $10.4 billion in 2016, primarily due to the Chubb Corp acquisition, which added about $10.8 billion of growth to premiums. This increase in premiums was partially offset by the adverse impact of foreign exchange of $367 million. On a constant-dollar basis, as if legacy ACE and legacy Chubb were one company in 2015 and since the beginning of 2016 (comparative basis), net premiums written decreased $843 million in 2016, primarily driven by merger-related actions ($650 million), including the purchase of additional reinsurance. See below for additional items impacting net premiums written.
|
•
|
Net premiums written in our North America Commercial P&C Insurance segment increased $6,025 million in 2016. On a comparative basis, net premiums written decreased $355 million in 2016, principally due to merger-related actions ($241 million). In addition, net premiums decreased due to lower new business written, driven by competitive market conditions and rate declines.
|
|
•
|
Net premiums written in our North America Personal P&C Insurance segment increased $2,961 million in 2016. On a comparative basis, excluding the impact of a number of risk management related actions ($525 million), net premiums written were up 1.3 percent in 2016 due to growth in our high net worth homeowners and auto lines.
|
|
•
|
Net premiums written in our Overseas General Insurance segment increased $1,490 million in 2016, and increased $95 million, on a comparative constant-dollar basis, primarily driven by growth in personal lines, property and casualty lines (P&C), and A&H lines. This increase was partially offset by declines in our business written by Chubb Global Markets and by merger-related actions ($119 million).
|
|
•
|
Net premiums written in our Life Insurance segment increased $126 million in 2016 and increased $32 million on a comparative basis. Growth in our international life operations and in our Combined Insurance Supplemental A&H program business was partially offset by the adverse effect of foreign exchange. Our life reinsurance business continues to decline as there is no new life reinsurance business currently being written. On a constant-dollar basis, production, which includes deposits collected on universal life and investment contracts of $1,006 million in 2016 and $997 million in 2015, increased 6.0 percent.
|
|
•
|
Net premiums written in our North America Agricultural Insurance segment decreased $18 million in 2016, primarily due to the revision to the 2016 crop year margin estimate related to the MPCI program, which resulted in lower premium retention under the premium sharing formula with the U.S. government. This decrease was partially offset by lower cessions under existing third-party proportional reinsurance programs.
|
|
•
|
Net premiums written in our Global Reinsurance segment decreased $152 million in 2016 and decreased $161 million on a comparative basis, as we maintained underwriting discipline in an environment of declining rates and increasing competition. In addition, the decline in premiums reflects increased cessions of $17 million due to the purchase of additional property catastrophe reinsurance coverage in 2016.
|
52
Line of Business
The following table presents a breakdown of consolidated net premiums written by line of business for the years indicated:
|
% Change
|
|
||||||||||||||||||||
|
(in millions of U.S. dollars, except for percentages)
|
2017
|
|
2016
|
|
2015
|
|
C$
(1)
2016
|
|
C$
(1)
2017 vs. 2016 |
|
C$
(1)
% Change ex Merger actions 2017 vs. 2016
|
|
|||||||||
|
Commercial multiple peril
(2)
|
$
|
879
|
|
$
|
815
|
|
$
|
—
|
|
$
|
816
|
|
7.7
|
%
|
8.2
|
%
|
|||||
|
Commercial casualty
|
3,638
|
|
3,433
|
|
2,171
|
|
3,434
|
|
5.9
|
%
|
8.5
|
%
|
|||||||||
|
Workers' compensation
|
2,067
|
|
2,006
|
|
901
|
|
2,006
|
|
3.0
|
%
|
7.1
|
%
|
|||||||||
|
Professional liability
|
3,491
|
|
3,544
|
|
1,516
|
|
3,541
|
|
(1.4
|
)%
|
0.1
|
%
|
|||||||||
|
Surety
|
627
|
|
584
|
|
323
|
|
585
|
|
7.2
|
%
|
8.1
|
%
|
|||||||||
|
Property and other short-tail lines
|
3,866
|
|
3,856
|
|
2,884
|
|
3,859
|
|
0.2
|
%
|
3.2
|
%
|
|||||||||
|
International other casualty
|
1,092
|
|
1,038
|
|
755
|
|
1,019
|
|
7.2
|
%
|
9.8
|
%
|
|||||||||
|
Total Commercial P&C
|
15,660
|
|
15,276
|
|
8,550
|
|
15,260
|
|
2.6
|
%
|
5.1
|
%
|
|||||||||
|
|
|
||||||||||||||||||||
|
Agriculture
|
1,516
|
|
1,328
|
|
1,346
|
|
1,328
|
|
14.2
|
%
|
14.2
|
%
|
|||||||||
|
Personal automobile - North America
|
775
|
|
698
|
|
219
|
|
700
|
|
10.7
|
%
|
10.7
|
%
|
|||||||||
|
Personal automobile - International
|
788
|
|
674
|
|
700
|
|
671
|
|
17.4
|
%
|
18.6
|
%
|
|||||||||
|
Personal homeowners
|
3,302
|
|
3,053
|
|
937
|
|
3,057
|
|
8.0
|
%
|
7.6
|
%
|
|||||||||
|
Personal other
|
1,441
|
|
1,399
|
|
606
|
|
1,402
|
|
2.8
|
%
|
9.3
|
%
|
|||||||||
|
Total Personal lines
|
6,306
|
|
5,824
|
|
2,462
|
|
5,830
|
|
8.2
|
%
|
9.6
|
%
|
|||||||||
|
Total Property and Casualty lines
|
23,482
|
|
22,428
|
|
12,358
|
|
22,418
|
|
4.7
|
%
|
6.8
|
%
|
|||||||||
|
Other Lines
|
|
|
|
|
|||||||||||||||||
|
Global A&H
(3)
|
4,056
|
|
3,970
|
|
3,548
|
|
3,990
|
|
1.7
|
%
|
3.3
|
%
|
|||||||||
|
Reinsurance
|
685
|
|
676
|
|
828
|
|
670
|
|
2.2
|
%
|
3.7
|
%
|
|||||||||
|
Life
|
1,021
|
|
1,071
|
|
979
|
|
1,077
|
|
(5.2
|
)%
|
(1.8
|
)%
|
|||||||||
|
Total consolidated
|
$
|
29,244
|
|
$
|
28,145
|
|
$
|
17,713
|
|
$
|
28,155
|
|
3.9
|
%
|
5.9
|
%
|
|||||
|
(1)
|
On a constant-dollar basis. Amounts are calculated by translating prior period results using the same local currency rates as the comparable current period.
|
|
(2)
|
Commercial multiple peril represents retail package business (property and general liability).
|
|
(3)
|
For purposes of this schedule only, A&H results from our Combined North America and International businesses, normally included in the Life Insurance and Overseas General Insurance segments, respectively, as well as the A&H results of our North America Commercial P&C segment, are included in the Global A&H line item above.
|
On a constant-dollar basis, total consolidated net premiums written, excluding merger actions, increased
5.9
percent in 2017 due to the following:
|
•
|
Total commercial P&C net premiums written, excluding merger actions, increased
5.1
percent in 2017 due to growth in our risk management and casualty business as well as growth in Asia and Latin America.
|
|
•
|
Total personal lines net premiums written, excluding merger actions, increased
9.6
percent in 2017 primarily due to new automobile business written in Latin America and the non-renewal of a quota share treaty in 2017.
|
|
•
|
Global A&H lines, excluding merger actions, increased
3.3
percent in 2017 due to growth in North America, Latin America and Asia, as well as in our Combined Insurance Supplemental A&H program business.
|
|
•
|
Reinsurance lines, excluding merger actions, increased
3.7
percent in 2017 primarily due to increased catastrophe reinstatement premiums, partially offset by declining rates and increasing competition.
|
53
Net Premiums Earned
2017 vs. 2016
Net premiums earned for short-duration contracts, typically P&C contracts, generally reflect the portion of net premiums written that were recorded as revenues for the period as the exposure periods expire. Net premiums earned for long-duration contracts, typically traditional life contracts, generally are recognized as earned when due from policyholders. Net premiums earned
increased
$285 million
, or
$232 million
on a constant-dollar basis in
2017
, primarily due to the same factors driving the increase in net premiums written as described above.
The prior year excluded approximately $391 million of premiums earned in the 14-day stub period. On a comparative constant-dollar basis, which includes the 14-day stub period, net premiums earned decreased
$159 million
as growth was more than offset by merger-related actions.
2016 vs. 2015
Net premiums earned increased $11.5 billion in 2016, primarily due to the Chubb Corp acquisition which added about $11.8 billion of growth to premiums, partially offset by the adverse impact of foreign currency of $328 million. On a constant-dollar basis, net premiums earned increased $11.9 billion in 2016.
Combined Ratio
In evaluating our segments excluding Life Insurance, we use the P&C combined ratio, the loss and loss expense ratio, the policy acquisition cost ratio, and the administrative expense ratio. We calculate these ratios by dividing the respective expense amounts by net premiums earned. We do not calculate these ratios for the Life Insurance segment as we do not use these measures to monitor or manage that segment. The P&C combined ratio is determined by adding the loss and loss expense ratio, the policy acquisition cost ratio, and the administrative expense ratio. A P&C combined ratio under 100 percent indicates underwriting income, and a combined ratio exceeding 100 percent indicates underwriting loss.
The following table presents the components of the combined ratio:
|
|
2017
|
|
2016
|
|
2015
|
|
||
|
Loss and loss expense ratio
|
65.8
|
%
|
57.7
|
%
|
58.1
|
%
|
||
|
Policy acquisition cost ratio
|
19.5
|
%
|
20.2
|
%
|
16.1
|
%
|
||
|
Administrative expense ratio
|
9.4
|
%
|
10.4
|
%
|
13.1
|
%
|
||
|
Combined ratio
|
94.7
|
%
|
88.3
|
%
|
87.3
|
%
|
||
The following table presents pre-tax catastrophe losses and pre-tax favorable prior period development, net of related reinstatement premiums:
|
(in millions of U.S dollars)
|
2017
|
|
2016
|
|
2015
|
|
|||||
|
Catastrophe losses, pre-tax
|
$
|
2,753
|
|
$
|
1,067
|
|
$
|
321
|
|
||
|
Favorable prior period development net of related reinstatement premiums, pre-tax
|
$
|
829
|
|
$
|
1,135
|
|
$
|
546
|
|
||
54
We generally define catastrophe loss events consistent with the definition of the Property Claims Service (PCS) for events in the U.S. and Canada. PCS defines a catastrophe as an event that causes damage of $25 million or more in insured property losses and affects a significant number of insureds. For events outside of the U.S. and Canada, we generally use a similar definition. The following table presents the break out of catastrophe losses for the twelve months ended December 31, 2017, by segment, net of reinsurance as well as reinstatement premiums (RIPs) collected (expensed):
|
Catastrophe Loss Charge by Event
|
|||||||||||||||||||||||||||||||
|
North America Commercial P&C Insurance
|
|
North America Personal P&C Insurance
|
|
North America Agricultural Insurance
|
|
Overseas General Insurance
|
|
Global
Reinsurance
|
|
Total excluding RIPs
|
|
RIPs collected (expensed)
|
|
Total including RIPs
|
|
||||||||||||||||
|
(in millions of U.S. dollars)
|
|||||||||||||||||||||||||||||||
|
Net losses
|
|||||||||||||||||||||||||||||||
|
N. California wildfires
|
$
|
61
|
|
$
|
151
|
|
$
|
—
|
|
$
|
2
|
|
$
|
42
|
|
$
|
256
|
|
$
|
(21
|
)
|
$
|
277
|
|
|||||||
|
S. California wildfires
|
23
|
|
134
|
|
—
|
|
—
|
|
—
|
|
157
|
|
—
|
|
157
|
|
|||||||||||||||
|
Hurricane Harvey
|
391
|
|
175
|
|
1
|
|
40
|
|
48
|
|
655
|
|
5
|
|
650
|
|
|||||||||||||||
|
Hurricane Irma
|
464
|
|
206
|
|
2
|
|
79
|
|
159
|
|
910
|
|
30
|
|
880
|
|
|||||||||||||||
|
Hurricane Maria
|
50
|
|
—
|
|
—
|
|
89
|
|
55
|
|
194
|
|
(7
|
)
|
201
|
|
|||||||||||||||
|
Mexico Earthquakes
|
—
|
|
—
|
|
—
|
|
25
|
|
—
|
|
25
|
|
—
|
|
25
|
|
|||||||||||||||
|
Other
|
231
|
|
205
|
|
15
|
|
96
|
|
9
|
|
556
|
|
—
|
|
556
|
|
|||||||||||||||
|
Total
|
$
|
1,220
|
|
$
|
871
|
|
$
|
18
|
|
$
|
331
|
|
$
|
313
|
|
$
|
2,753
|
|
|||||||||||||
|
Reinstatement premium collected (expensed)
|
(4
|
)
|
(22
|
)
|
—
|
|
(4
|
)
|
37
|
|
7
|
|
|||||||||||||||||||
|
Total before income tax
|
$
|
1,224
|
|
$
|
893
|
|
$
|
18
|
|
$
|
335
|
|
$
|
276
|
|
$
|
2,746
|
|
|||||||||||||
Catastrophe losses through December 31, 2016 included severe weather-related events in the U.S., including Hurricane Matthew, severe weather-related events in Europe, a wildfire in Canada, and earthquakes in Ecuador and New Zealand. Catastrophe losses through December 31, 2015 included severe weather-related events in the U.S. and Asia, a chemical storage facility explosion in Tianjin, China, a hailstorm in Australia, and flooding and an earthquake in Chile.
Prior period development (PPD) arises from changes to loss estimates recognized in the current year that relate to loss events that occurred in previous calendar years and excludes the effect of losses from the development of earned premium from previous accident years. Favorable prior period development was
$829 million
in 2017 compared to
$1,135 million
in the prior year, a decline of
$306 million
, pre-tax primarily reflecting favorable prior accident year loss activity, though at a reduced level from 2016. In addition, 2017 included higher adverse development related to asbestos, environmental, and other run-off liabilities compared to the prior year. Refer to the Prior Period Development section in Note 7 to the Consolidated Financial Statements for additional information.
55
The loss ratio numerator includes losses and loss expenses adjusted to exclude catastrophe losses and PPD. The loss ratio denominator includes net premiums earned adjusted to exclude the amount of reinstatement premiums (expensed) collected. Reinstatement premiums are additional fully-earned, prorated premiums payable to reinsurers to restore coverage that has been reduced by reinsurance loss payments. In periods where there are adjustments on loss sensitive policies, these adjustments are excluded from PPD and net premiums earned when calculating this ratio. We believe that excluding the impact of catastrophe losses and PPD provides a better evaluation of our underwriting performance and enhances the understanding of the trends in our property & casualty business that may be obscured by these items.
The following table presents the current accident year loss and loss expense ratio, excluding catastrophe losses and related reinstatement premiums ("CAY loss ratio excluding catastrophe losses"):
|
|
2017
|
|
2016
|
|
2015
|
|
||
|
Loss and loss expense ratio
|
65.8
|
%
|
57.7
|
%
|
58.1
|
%
|
||
|
Catastrophe losses and related reinstatement premiums
|
(10.2
|
)%
|
(4.0
|
)%
|
(2.1
|
)%
|
||
|
Prior period development net of related reinstatement premiums
|
3.2
|
%
|
4.3
|
%
|
3.6
|
%
|
||
|
Current accident year loss and loss expense ratio excluding catastrophe losses
|
58.8
|
%
|
58.0
|
%
|
59.6
|
%
|
||
2017 vs. 2016
The CAY loss ratio excluding catastrophe losses
increased
0.8
percentage points in
2017
, primarily due to the following:
|
•
|
Higher non-catastrophe large losses in property lines and mix of business in our Major Accounts division in our North America Commercial P&C Insurance segment, driven by growth in casualty lines which have a higher loss ratio and declines in property lines which have a lower loss ratio (0.4 percentage points);
|
|
•
|
Higher non-catastrophe large losses in our North America Personal P&C Insurance segment (0.2 percentage point);
|
|
•
|
An updated allocation that more appropriately classified certain claims-related expenses as loss adjustment expenses (previously reported as administrative expenses). This updated allocation increased loss adjustment expenses (0.4 percentage points), with an offsetting decrease to administrative expenses;
|
|
•
|
Partially offset by integration-related claims handling expense savings realized of
$128 million
(0.5 percentage points).
|
Policy acquisition costs consist of commissions, premium taxes, and certain underwriting costs directly related to the successful acquisition of a new or renewal insurance contract. Our policy acquisition cost ratio
decreased
0.7
percentage points in
2017
, compared to the prior year period, which included a net unfavorable impact of purchase accounting adjustments related to the Chubb Corp acquisition (0.7 percentage points). The decrease was also due to integration-related expense savings realized (0.2 percentage points),which was offset by a change in the mix of business, principally in our Overseas General Insurance segment, and the non-renewal of the Fireman's Fund quota share treaty.
Our administrative expense ratio
decreased
1.0
percentage point in
2017
, primarily due to integration-related expense savings realized as a result of the Chubb Corp acquisition of
$262 million
(1.0 percentage point), lower employee benefit-related expenses (0.7 percentage points), and the updated loss expenses and administrative expenses allocation as noted above (0.4 percentage points), partially offset by the impact of merit-based salary increases, inflation, and increased spending to support growth.
2016 vs. 2015
The CAY loss ratio excluding catastrophe losses decreased 1.6 percentage points in 2016, primarily due to the net favorable impact of the Chubb Corp acquisition which experienced a relatively lower loss ratio in our North America P&C businesses but experienced a higher loss ratio in our international business. The current year also included claims handling expense savings realized in connection with the integration of Chubb Corp of $60 million (0.2 percentage points).
On a comparative basis, the CAY loss ratio excluding catastrophe losses decreased 0.1 percentage points in 2016.
Policy acquisition costs consist of commissions, premium taxes, and certain underwriting costs directly related to the successful acquisition of a new or renewal insurance contract. Our policy acquisition cost ratio increased 4.1 percentage points in 2016, primarily due to the addition of the Chubb Corp business which carried a higher acquisition cost ratio (2.1 percentage points) and due to the net unfavorable impact of purchase accounting adjustments (1.4 percentage points) related to the Chubb Corp acquisition in the current year and the Fireman's Fund acquisition in the prior year. In addition, during 2016, we determined that certain underwriting costs that are directly attributable to the successful acquisition of business previously classified as
56
administrative expenses were more appropriately classified as policy acquisition costs. This resulted in a $290 million (1.1 percentage points) increase to policy acquisition costs, with an offsetting decrease to administrative expenses in 2016.
On a comparative basis, the policy acquisition cost ratio increased 0.3 percentage points in 2016, primarily due to the impact of the Fireman’s Fund acquisition in 2015 which favorably impacted the prior year ratio by 0.4 percentage points.
Our administrative expense ratio decreased 2.7 percentage points in 2016, primarily due to cost savings realized as a result of the Chubb Corp acquisition of $223 million (0.8 percentage points), the $290 million (1.1 percentage points) reclassification of underwriting costs that are directly attributable to the successful acquisition of business, as discussed above, and the one-time pension curtailment benefit of $90 million (0.3 percentage points) related to the amendment of our U.S. pension plan as part of a harmonization effort that moves us toward a more unified retirement savings approach.
On a comparative basis, our administrative expense ratio decreased 0.5 percentage points in 2016, primarily due to cost savings realized as a result of the Chubb Corp acquisition and the one-time pension curtailment benefit, as discussed above, partially offset by increased spending to support growth initiatives.
Policy benefits
Policy benefits represent losses on contracts classified as long-duration and generally include accident and supplemental health products, term and whole life products, endowment products, and annuities. Policy benefits also include gains and losses from changes in liabilities associated with our separate account assets that do not qualify for separate account reporting under GAAP. Certain of our long duration contracts are supported by assets that do not qualify for separate account reporting under GAAP. These assets are classified as trading securities and reported in Other investments and the offsetting liabilities are reported in Future policy benefits in the Consolidated balance sheet. Fair value changes in separate account assets that do not qualify for separate account reporting under GAAP are reported in Other income (expense) and the offsetting movements in the liabilities are included in Policy benefits in the Consolidated statements of operations.
Policy benefits were
$676 million
,
$588 million
and $
543 million
in 2017, 2016 and 2015, respectively, which included separate account liabilities losses (gains) of
$97 million
,
$11 million
and $(19) million, respectively. The offsetting movements of these liabilities are recorded in Other income (expense) on the Consolidated statement of operations. Excluding the separate account gains and losses, Policy benefits were $579 million in
2017
, compared with $577 million and $562 million in 2016 and 2015, respectively.
Refer to the Corporate results section below for information on Net investment income, Interest expense, and Income tax expense.
57
Integration-Related Savings
Integration-related savings realized were $152 million, $177 million, $201 million, and $236 million for the first, second, third, and fourth quarters of 2017, respectively. Integration-related savings of $236 million in the fourth quarter of 2017 included savings realized of $71 million in Losses and loss expenses, $32 million in Policy acquisition costs, $130 million in Administrative expenses, and $3 million in Net investment income.
The following table presents consolidated integration-related savings realized by segment and income statement line item:
|
Years Ended December 31
|
||||||||||||||||||||||||||||||||
|
North America Commercial P&C Insurance
|
|
North America Personal P&C Insurance
|
|
Overseas General Insurance
|
|
Global Reinsurance
|
|
Corporate
|
|
Total P&C
|
|
Life Insurance
|
|
Consolidated
|
|
|||||||||||||||||
|
2017
|
||||||||||||||||||||||||||||||||
|
(in millions of U.S. dollars)
|
||||||||||||||||||||||||||||||||
|
Losses and loss expenses
|
$
|
102
|
|
$
|
37
|
|
$
|
49
|
|
$
|
—
|
|
$
|
—
|
|
$
|
188
|
|
$
|
—
|
|
$
|
188
|
|
||||||||
|
Policy acquisition costs
|
40
|
|
13
|
|
34
|
|
—
|
|
—
|
|
87
|
|
—
|
|
87
|
|
||||||||||||||||
|
Administrative expenses
|
169
|
|
67
|
|
182
|
|
2
|
|
59
|
|
479
|
|
6
|
|
485
|
|
||||||||||||||||
|
Net investment income
|
3
|
|
2
|
|
—
|
|
—
|
|
1
|
|
6
|
|
—
|
|
6
|
|
||||||||||||||||
|
Total
|
$
|
314
|
|
$
|
119
|
|
$
|
265
|
|
$
|
2
|
|
$
|
60
|
|
$
|
760
|
|
$
|
6
|
|
$
|
766
|
|
||||||||
|
2016
|
||||||||||||||||||||||||||||||||
|
Losses and loss expenses
|
$
|
34
|
|
$
|
15
|
|
$
|
11
|
|
$
|
—
|
|
$
|
—
|
|
$
|
60
|
|
$
|
—
|
|
$
|
60
|
|
||||||||
|
Policy acquisition costs
|
19
|
|
6
|
|
12
|
|
—
|
|
—
|
|
37
|
|
—
|
|
37
|
|
||||||||||||||||
|
Administrative expenses
|
91
|
|
38
|
|
66
|
|
1
|
|
25
|
|
221
|
|
2
|
|
223
|
|
||||||||||||||||
|
Net investment income
|
2
|
|
2
|
|
—
|
|
—
|
|
1
|
|
5
|
|
—
|
|
5
|
|
||||||||||||||||
|
Total
|
$
|
146
|
|
$
|
61
|
|
$
|
89
|
|
$
|
1
|
|
$
|
26
|
|
$
|
323
|
|
$
|
2
|
|
$
|
325
|
|
||||||||
|
Incremental Change
|
||||||||||||||||||||||||||||||||
|
Losses and loss expenses
|
$
|
68
|
|
$
|
22
|
|
$
|
38
|
|
$
|
—
|
|
$
|
—
|
|
$
|
128
|
|
$
|
—
|
|
$
|
128
|
|
||||||||
|
Policy acquisition costs
|
21
|
|
7
|
|
22
|
|
—
|
|
—
|
|
50
|
|
—
|
|
50
|
|
||||||||||||||||
|
Administrative expenses
|
78
|
|
29
|
|
116
|
|
1
|
|
34
|
|
258
|
|
4
|
|
262
|
|
||||||||||||||||
|
Net investment income
|
1
|
|
—
|
|
—
|
|
—
|
|
—
|
|
1
|
|
—
|
|
1
|
|
||||||||||||||||
|
Total
|
$
|
168
|
|
$
|
58
|
|
$
|
176
|
|
$
|
1
|
|
$
|
34
|
|
$
|
437
|
|
$
|
4
|
|
$
|
441
|
|
||||||||
58
Segment Operating Results – Years Ended
December 31, 2017
,
2016
, and
2015
We operate through six business segments: North America Commercial P&C Insurance, North America Personal P&C Insurance, North America Agricultural Insurance, Overseas General Insurance, Global Reinsurance, and Life Insurance. In addition, the results of all run-off asbestos and environmental (A&E) exposures, the results of our run-off Brandywine business, the results of Westchester specialty operations for 1996 and prior years, and certain other run-off exposures are presented within Corporate.
North America Commercial P&C Insurance
The North America Commercial P&C Insurance segment comprises operations that provide property and casualty (P&C) insurance and services to large, middle market, and small commercial businesses in the U.S., Canada, and Bermuda. This segment includes our North America Major Accounts and Specialty Insurance division (principally large corporate accounts and wholesale business), and the North America Commercial Insurance division (principally middle market and small commercial accounts).
|
|
% Change
|
|||||||||||||||||||
|
(in millions of U.S. dollars, except for percentages)
|
2017
|
|
|
2016
|
|
|
2015
|
|
|
2017 vs. 2016
|
2016 vs. 2015
|
|||||||||
|
Net premiums written
|
$
|
12,028
|
|
|
$
|
11,740
|
|
|
$
|
5,715
|
|
|
2.5
|
%
|
105.4
|
%
|
||||
|
Net premiums earned
|
12,191
|
|
|
12,217
|
|
|
5,634
|
|
|
(0.2
|
)%
|
116.9
|
%
|
|||||||
|
Losses and loss expenses
|
8,287
|
|
|
7,439
|
|
|
3,661
|
|
|
11.4
|
%
|
103.2
|
%
|
|||||||
|
Policy acquisition costs
|
1,873
|
|
|
2,023
|
|
|
531
|
|
|
(7.4
|
)%
|
281.0
|
%
|
|||||||
|
Administrative expenses
|
981
|
|
|
1,125
|
|
|
621
|
|
|
(12.8
|
)%
|
81.2
|
%
|
|||||||
|
Underwriting income
|
1,050
|
|
|
1,630
|
|
|
821
|
|
|
(35.6
|
)%
|
98.5
|
%
|
|||||||
|
Net investment income
|
1,961
|
|
|
1,860
|
|
|
1,032
|
|
|
5.4
|
%
|
80.2
|
%
|
|||||||
|
Other (income) expense
|
1
|
|
|
(2
|
)
|
|
(7
|
)
|
|
NM
|
(71.4
|
)%
|
||||||||
|
Segment income
|
$
|
3,010
|
|
|
$
|
3,492
|
|
|
$
|
1,860
|
|
|
(13.8
|
)%
|
87.7
|
%
|
||||
|
Loss and loss expense ratio
|
68.0
|
%
|
|
60.9
|
%
|
|
65.0
|
%
|
|
7.1
|
|
pts
|
|
(4.1
|
)
|
pts
|
|
|||
|
Policy acquisition cost ratio
|
15.4
|
%
|
|
16.6
|
%
|
|
9.4
|
%
|
|
(1.2
|
)
|
pts
|
|
7.2
|
|
pts
|
|
|||
|
Administrative expense ratio
|
8.0
|
%
|
|
9.2
|
%
|
|
11.0
|
%
|
|
(1.2
|
)
|
pts
|
|
(1.8
|
)
|
pts
|
|
|||
|
Combined ratio
|
91.4
|
%
|
|
86.7
|
%
|
|
85.4
|
%
|
|
4.7
|
|
pts
|
|
1.3
|
|
pts
|
|
|||
NM – not meaningful
Premiums
2017 vs. 2016
Net premiums written
increased
$288 million
in 2017 due to the timing of the Chubb Corp acquisition in 2016. Approximately $519 million of production was generated prior to the acquisition close on January 14, 2016 (14-day stub period). On a comparative basis, which includes the 14-day stub period, net premiums written, excluding merger-related actions of
$278 million
, increased
$47 million
, or
0.4
percent, as growth, primarily in our risk management and casualty business was offset by declines in property and select components of our financial lines businesses due to competitive market conditions.
Net premiums earned
decreased
$
26 million
in 2017. On a comparative basis, which includes the 14-day stub period ($208 million), net premiums earned decreased $234 million driven primarily by merger-related actions.
2016 vs. 2015
Net premiums written increased $6,025 million in 2016 primarily due to the Chubb Corp acquisition which added about $5.9 billion in premiums to this segment.
On a comparative basis (refer to non-GAAP section), net premiums written declined $355 million in 2016, principally reflecting merger-related actions ($241 million) which decreased premiums, and lower new business written, driven by competitive market conditions and rate declines, particularly in our property and financial lines. Partially offsetting the decline was growth in our global risk management and workers' compensation lines reflecting new business and strong renewal retention.
Net premiums earned increased $6,583 million in 2016 primarily due to the Chubb Corp acquisition which added about $6.5 billion in earned premiums. On a comparative basis, net premiums earned decreased $59 million primarily due to the same
59
factors driving the decrease in net premiums written as described above, partially offset by the earning in of prior year premium growth.
Combined Ratio
The following table presents pre-tax catastrophe losses and pre-tax favorable prior period development net of related reinstatement premiums:
|
(in millions of U.S. dollars)
|
2017
|
|
2016
|
|
2015
|
|
|||||
|
Catastrophe losses, pre-tax
|
$
|
1,220
|
|
$
|
448
|
|
$
|
85
|
|
||
|
Favorable prior period development net of related reinstatement premiums, pre-tax
|
$
|
746
|
|
$
|
778
|
|
$
|
264
|
|
||
Catastrophe losses were primarily from the following events:
|
•
|
2017: Hurricane Irma, Hurricane Harvey, Hurricane Maria and severe weather-related events in the U.S., including California wildfires
|
|
•
|
2016: severe weather-related events in the U.S., including Hurricane Matthew, and a wildfire in Canada
|
|
•
|
2015: severe-weather related events in the U.S., a Mexican hurricane, and civil unrest in Baltimore, Maryland
|
The following table presents the current accident year loss and loss expense ratio, excluding catastrophe losses and related reinstatement premiums ("CAY loss ratio excluding catastrophe losses"):
|
|
2017
|
|
|
2016
|
|
|
2015
|
|
|
Loss and loss expense ratio
|
68.0
|
%
|
|
60.9
|
%
|
|
65.0
|
%
|
|
Catastrophe losses and related reinstatement premiums
|
(10.0
|
)%
|
|
(3.7
|
)%
|
|
(1.5
|
)%
|
|
Prior period development net of related reinstatement premiums
|
6.3
|
%
|
|
6.5
|
%
|
|
4.7
|
%
|
|
Current accident year loss and loss expense ratio excluding catastrophe losses
|
64.3
|
%
|
|
63.7
|
%
|
|
68.2
|
%
|
2017 vs. 2016
The CAY loss ratio excluding catastrophe losses increased
0.6
percentage points for 2017, primarily due to mix of business in our Major Accounts division, driven by growth in casualty lines which have a higher loss ratio and declines in property lines which have a lower loss ratio, as well as an updated allocation that more appropriately classified certain claims-related expenses as loss adjustment expenses (previously reported as administrative expenses). This updated allocation increased loss adjustment expenses (0.6 percentage points for 2017) with an offsetting decrease to administrative expenses. This increase was partially offset by integration-related expense savings realized of
$68 million
(0.5 percentage points).
The policy acquisition cost ratio decreased
1.2
percentage points in 2017, compared to the prior year which included the net unfavorable impact of initial year purchase accounting adjustments related to the Chubb Corp acquisition (1.1 percentage points). Excluding this item, the policy acquisition cost ratio decreased 0.1 percentage points primarily due to integration-related expense savings realized of
$21 million
.
The administrative expense ratio decreased
1.2
percentage points in 2017 primarily reflecting integration-related expense savings realized of
$78 million
(0.7 percentage points), lower employee benefit-related expenses of $107 million (0.9 percentage points), and the updated loss expenses and administrative expenses allocation as noted above (0.6 percentage points for 2017), partially offset by the impact of merit-based salary increases, inflation, and increased spending to support growth.
2016 vs. 2015
The CAY loss ratio excluding catastrophe losses decreased 4.5 percentage points in 2016, primarily due to the addition of the Chubb Corp business, which experienced a lower loss ratio. On a comparative basis, CAY loss ratio excluding catastrophe losses increased 0.8 percentage points in 2016, primarily due to lower non-catastrophe losses in the prior year, partially offset by integration related claims handling expense savings realized of $34 million (0.3 percentage points).
The policy acquisition cost ratio increased 7.2 percentage points in 2016, primarily due to the addition of the Chubb Corp business which carried a higher acquisition cost ratio and due to the normal impact of initial year purchase accounting adjustments related to the Chubb Corp acquisition. In addition, during 2016, we determined that certain underwriting costs that are directly attributable to the successful acquisition of business previously classified as administrative expenses were more
60
appropriately classified as policy acquisition costs. Excluding these items, the policy acquisition cost ratio decreased 0.4 percentage points in 2016, primarily due to integration related savings realized.
The normal impact of initial year purchase accounting adjustments related to the Chubb Corp acquisition includes a fair value adjustment for the unearned premiums at the date of the purchase. This adjustment is then amortized into policy acquisition costs. Partially offsetting this is a favorable impact related to the recognition of the acquired unearned premiums without having to recognize the associated policy acquisition costs. The net impact of these purchase accounting adjustments was an increase to policy acquisition costs of $130 million (1.1 percentage points) in 2016, which did not recur in 2017. In addition, the reclassification described above resulted in a $129 million (1.1 percentage points of the ratio) increase to policy acquisition costs in 2016 with an offsetting decrease to administrative expenses.
On a comparative basis, which excludes purchase accounting adjustments, the policy acquisition cost ratio decreased 0.4 percentage points in 2016, primarily due to integration related savings realized as described above.
The administrative expense ratio decreased 1.8 percentage points in 2016 due to the $129 million reclassification noted above which decreased the administrative expense ratio by 1.1 percentage points, and the inclusion of the Chubb Corp businesses which carried a lower administrative expense ratio, partially offset by increased spending to support growth.
On a comparative basis, the administrative expense ratio decreased 0.2 percentage points in 2016, as cost savings realized of $91 million (0.7 percentage points) were partially offset by increased spending to support growth.
North America Personal P&C Insurance
The North America Personal P&C Insurance segment comprises operations that provide high net worth personal lines products, including homeowners and complementary products such as valuable articles, excess liability, automobile, and recreational marine insurance and services in the U.S. and Canada.
|
|
% Change
|
||||||||||||||||||||
|
(in millions of U.S. dollars, except for percentages)
|
2017
|
|
2016
|
|
2015
|
|
2017 vs. 2016
|
2016 vs. 2015
|
|||||||||||||
|
Net premiums written
|
$
|
4,533
|
|
$
|
4,153
|
|
$
|
1,192
|
|
9.1
|
%
|
248.4
|
%
|
||||||||
|
Net premiums earned
|
4,399
|
|
4,319
|
|
948
|
|
1.9
|
%
|
355.5
|
%
|
|||||||||||
|
Losses and loss expenses
|
3,265
|
|
2,558
|
|
590
|
|
27.6
|
%
|
333.6
|
%
|
|||||||||||
|
Policy acquisition costs
|
899
|
|
966
|
|
69
|
|
(6.9
|
)%
|
NM
|
||||||||||||
|
Administrative expenses
|
264
|
|
363
|
|
123
|
|
(27.3
|
)%
|
195.1
|
%
|
|||||||||||
|
Underwriting income (loss)
|
(29
|
)
|
432
|
|
166
|
|
NM
|
160.2
|
%
|
||||||||||||
|
Net investment income
|
226
|
|
207
|
|
25
|
|
9.2
|
%
|
NM
|
||||||||||||
|
Other (income) expense
|
4
|
|
6
|
|
2
|
|
(33.3
|
)%
|
200.0
|
%
|
|||||||||||
|
Amortization of purchased intangibles
|
16
|
|
19
|
|
78
|
|
(15.8
|
)%
|
(75.6
|
)%
|
|||||||||||
|
Segment income
|
$
|
177
|
|
$
|
614
|
|
$
|
111
|
|
(71.2
|
)%
|
453.2
|
%
|
||||||||
|
Loss and loss expense ratio
|
74.2
|
%
|
59.2
|
%
|
62.3
|
%
|
15.0
|
|
pts
|
|
(3.1
|
)
|
pts
|
|
|||||||
|
Policy acquisition cost ratio
|
20.4
|
%
|
22.4
|
%
|
7.3
|
%
|
(2.0
|
)
|
pts
|
|
15.1
|
|
pts
|
|
|||||||
|
Administrative expense ratio
|
6.1
|
%
|
8.4
|
%
|
13.0
|
%
|
(2.3
|
)
|
pts
|
|
(4.6
|
)
|
pts
|
|
|||||||
|
Combined ratio
|
100.7
|
%
|
90.0
|
%
|
82.6
|
%
|
10.7
|
|
pts
|
|
7.4
|
|
pts
|
|
|||||||
NM – not meaningful
Premiums
2017 vs. 2016
Net premiums written increased
$380 million
in 2017. On a comparative basis, which includes the 14-day stub period (
$100 million
), net premiums written increased $
280 million
reflecting both growth across most lines as well as the non-renewal of a quota share treaty in 2017 covering the acquired Fireman's Fund homeowners and automobile businesses ($189 million).
Net premiums earned increased
$80 million
, primarily due to the factors described above.
61
2016 vs. 2015
Net premiums written increased $2,961 million in 2016. On a comparative basis, excluding the impact of a number of risk management related actions ($525 million), net premiums written were up 1.3 percent in 2016 due to growth in our high net worth homeowners and auto lines.
Net premiums earned increased $3,371 million in 2016 primarily due to the Chubb Corp acquisition. On a comparative basis, net premiums earned decreased slightly in 2016.
Combined Ratio
The following table presents pre-tax catastrophe losses and pre-tax unfavorable prior period development:
|
(in millions of U.S. dollars)
|
2017
|
|
2016
|
|
2015
|
|
|||||
|
Catastrophe losses, pre-tax
|
$
|
871
|
|
$
|
326
|
|
$
|
63
|
|
||
|
Unfavorable prior period development net of related reinstatement premiums, pre-tax
|
$
|
(69
|
)
|
$
|
(27
|
)
|
$
|
(25
|
)
|
||
Catastrophe losses were primarily from the following events:
|
•
|
2017: Hurricane Harvey, Hurricane Irma, and severe weather-related events in the U.S., including California wildfires
|
|
•
|
2016: severe weather-related events in the U.S., including Hurricane Matthew
|
|
•
|
2015: severe weather-related events in the U.S., including the California wildfires
|
The following table presents the current accident year loss and loss expense ratio, excluding catastrophe losses and related reinstatement premiums ("CAY loss ratio excluding catastrophe losses"):
|
|
2017
|
|
2016
|
|
2015
|
|
||
|
Loss and loss expense ratio
|
74.2
|
%
|
59.2
|
%
|
62.3
|
%
|
||
|
Catastrophe losses and related reinstatement premiums
|
(20.1
|
)%
|
(7.5
|
)%
|
(6.7
|
)%
|
||
|
Prior period development net of related reinstatement premiums
|
(1.5
|
)%
|
(0.7
|
)%
|
(2.7
|
)%
|
||
|
Current accident year loss and loss expense ratio excluding catastrophe losses
|
52.6
|
%
|
51.0
|
%
|
52.9
|
%
|
||
2017 vs. 2016
The CAY loss ratio excluding catastrophe losses increased
1.6
percentage points in 2017, primarily due to higher non-catastrophe large losses (1.2 percentage points), as well as an updated allocation that more appropriately classified certain claims-related expenses as loss adjustment expenses (previously reported as administrative expenses). This updated allocation increased loss adjustment expenses (0.5 percentage points), with an offsetting decrease to administrative expenses. This increase was partially offset by integration-related claims handling expense savings realized of
$22 million
(0.5 percentage points).
The policy acquisition cost ratio decreased
2.0
percentage points in 2017 compared to the prior year which included the net unfavorable impact from purchase accounting adjustments (1.9 percentage points) related to the Chubb Corp acquisition. Excluding this adjustment, the policy acquisition cost ratio remained flat as the increase related to the non-renewal of the Fireman's Fund quota share treaty which had a higher ceded acquisition cost ratio was offset by integration-related expense savings realized of
$7 million
(0.2 percentage points).
The administrative expense ratio decreased
2.3
percentage points in 2017, due to integration-related expense savings realized of
$29 million
(0.7 percentage points), lower employee benefit-related expenses of $42 million (0.9 percentage points), and the updated loss expenses and administrative expenses allocation as noted above (0.5 percentage points).
2016 vs. 2015
The CAY loss ratio excluding catastrophe losses decreased 1.9 percentage points in 2016 primarily due to the addition of the Chubb Corp business, which experienced a lower loss ratio. On a comparative basis, CAY loss ratio excluding catastrophe losses decreased 0.8 percentage points reflecting lower non-catastrophe weather related losses and integration related claims handling expense savings of $15 million (0.3 percentage points).
The policy acquisition cost ratio increased 15.1 percentage points in 2016, primarily due to the net unfavorable impact of purchase accounting adjustments (12.5 percentage points) related to the Chubb Corp acquisition in the current year, which will
62
not recur in 2017, and the Fireman's Fund acquisition in the prior year and due to the addition of the Chubb Corp business which carried a higher acquisition cost ratio (2.7 percentage points).
On a comparative basis, which excludes purchase accounting adjustments related to the Chubb Corp acquisition, the policy acquisition cost ratio increased 0.9 percentage points in 2016, primarily due to our Fireman's Fund acquisition in the prior year which favorably impacted the prior year policy acquisition cost ratio by $100 million (2.2 percentage points). This increase was partially offset by the favorable impact of the ceded commission benefits related to the additional reinsurance purchased in 2016.
The administrative expense ratio decreased 4.6 percentage points in 2016, primarily due to the Chubb Corp acquisition which carried a lower administrative expense ratio.
On a comparative basis, the administrative expense ratio remained flat as cost savings realized as a result of the Chubb Corp acquisition of $38 million (0.9 percentage points) were offset by increased spending to support growth.
North America Agricultural Insurance
The North America Agricultural Insurance segment comprises our North American based businesses that provide a variety of coverages in the U.S. and Canada including crop insurance, primarily Multiple Peril Crop Insurance (MPCI) and crop-hail through Rain and Hail Insurance Service, Inc. (Rain and Hail) as well as farm and ranch and specialty P&C commercial insurance products and services through our Chubb Agribusiness unit.
|
|
% Change
|
||||||||||||||||||||
|
(in millions of U.S. dollars, except for percentages)
|
2017
|
|
2016
|
|
2015
|
|
2017 vs. 2016
|
2016 vs. 2015
|
|||||||||||||
|
Net premiums written
|
$
|
1,516
|
|
$
|
1,328
|
|
$
|
1,346
|
|
14.2
|
%
|
(1.3
|
)%
|
||||||||
|
Net premiums earned
|
1,508
|
|
1,316
|
|
1,364
|
|
14.6
|
%
|
(3.6
|
)%
|
|||||||||||
|
Losses and loss expenses
(1)
|
1,043
|
|
898
|
|
1,097
|
|
16.1
|
%
|
(18.1
|
)%
|
|||||||||||
|
Policy acquisition costs
|
81
|
|
83
|
|
69
|
|
(2.4
|
)%
|
20.3
|
%
|
|||||||||||
|
Administrative expenses
|
(8
|
)
|
(6
|
)
|
1
|
|
33.3
|
%
|
NM
|
||||||||||||
|
Underwriting income
|
392
|
|
341
|
|
197
|
|
15.0
|
%
|
73.1%
|
||||||||||||
|
Net investment income
|
25
|
|
20
|
|
23
|
|
25.0
|
%
|
(13.0
|
)%
|
|||||||||||
|
Other (income) expense
|
2
|
|
1
|
|
1
|
|
100.0
|
%
|
—
|
||||||||||||
|
Amortization of purchased intangibles
|
29
|
|
29
|
|
30
|
|
—
|
(3.3
|
)%
|
||||||||||||
|
Segment income
|
$
|
386
|
|
$
|
331
|
|
$
|
189
|
|
16.6
|
%
|
75.1
|
%
|
||||||||
|
Loss and loss expense ratio
|
69.2
|
%
|
68.3
|
%
|
80.4
|
%
|
0.9
|
|
pts
|
|
(12.1
|
)
|
pts
|
|
|||||||
|
Policy acquisition cost ratio
|
5.4
|
%
|
6.3
|
%
|
5.1
|
%
|
(0.9
|
)
|
pts
|
|
1.2
|
|
pts
|
|
|||||||
|
Administrative expense ratio
|
(0.6
|
)%
|
(0.5
|
)%
|
—
|
|
(0.1
|
)
|
pts
|
|
(0.5
|
)
|
pts
|
|
|||||||
|
Combined ratio
|
74.0
|
%
|
74.1
|
%
|
85.5
|
%
|
(0.1
|
)
|
pts
|
|
(11.4
|
)
|
pts
|
|
|||||||
NM – not meaningful
|
(1)
|
Gains (losses) on crop derivatives were $
(7) million
, $(5) million, and $(9) million in 2017, 2016, and 2015, respectively. These gains (losses) are included in Net realized gains (losses) in our Consolidated statements of operations but are reclassified to Losses and loss expenses for purposes of presenting North America Agricultural Insurance underwriting income.
|
Premiums
2017 vs 2016
Net premiums written increased
$188 million
in 2017, primarily due to an increase in MPCI production and growth in our Agriculture P&C products. The increase in MPCI premium was driven in part by higher policy count and the year over year impact of our update to the MPCI margin estimate which resulted in a smaller cession to the U.S. government. Under the government's crop insurance profit and loss calculation formulas, we retained more premiums in 2017 as losses were higher compared to 2016.
Net premiums earned increased
$192 million
in 2017, due to the factors described above.
63
2016 vs 2015
Net premiums written decreased $18 million in 2016 primarily due to the revision to the 2016 crop year margin estimate related to the MPCI program, which resulted in lower premium retention under the premium sharing formula with the U.S. government. Under the government's crop insurance profit and loss calculation formulas, we retained less premiums in 2016 as losses were lower compared to 2015. This decrease was partially offset by lower cessions under existing third-party proportional reinsurance programs.
Net premiums earned decreased $48 million in 2016 primarily due to the same factors driving the decrease in net premiums written as described above.
Underwriting income increased $144 million in 2016 primarily due to the favorable revision to the 2016 crop year margin estimate reflecting a combination of better than average yields and less than expected movement in price between base price and harvest price this year.
Combined Ratio
The following table presents pre-tax catastrophe losses and pre-tax favorable prior period development net of related reinstatement premiums:
|
(in millions of U.S. dollars)
|
2017
|
|
2016
|
|
2015
|
|
|||||
|
Catastrophe losses, pre-tax
|
$
|
18
|
|
$
|
19
|
|
$
|
9
|
|
||
|
Favorable prior period development net of related reinstatement premiums, pre-tax
|
$
|
119
|
|
$
|
72
|
|
$
|
45
|
|
||
Catastrophe losses in 2017, 2016, and 2015 were primarily from our farm, ranch and specialty P&C business. Net favorable prior period development was
$119
million, $72 million, and $45 million in 2017, 2016, and 2015, respectively. For 2017, the prior period development amount included $174 million of favorable incurred losses and $11 million of lower acquisition costs due to lower than expected MPCI losses for the 2016 crop year, partially offset by a $66 million decrease in net premiums earned related to the MPCI profit and loss calculation formula. For 2016, the prior period development amount included $99 million of favorable incurred losses due to lower than expected MPCI losses for the 2015 crop year, partially offset by $52 million of unfavorable decrease in net premiums earned related to the government’s crop insurance profit and loss calculation formulas. Also included in prior period development, but not impacting the loss and loss expense ratio was a $12 million favorable benefit of ceded profit share commissions earned from third-party reinsurers.
The following table presents the current accident year loss and loss expense ratio, excluding catastrophe losses and related reinstatement premiums ("CAY loss ratio excluding catastrophe losses"):
|
|
2017
|
|
2016
|
|
2015
|
|
||
|
Loss and loss expense ratio
|
69.2
|
%
|
68.3
|
%
|
80.4
|
%
|
||
|
Catastrophe losses and related reinstatement premiums
|
(1.2
|
)%
|
(1.5
|
)%
|
(0.7
|
)%
|
||
|
Prior period development net of related reinstatement premiums
|
8.2
|
%
|
5.6
|
%
|
3.1
|
%
|
||
|
Current accident year loss and loss expense ratio excluding catastrophe losses
|
76.2
|
%
|
72.4
|
%
|
82.8
|
%
|
||
2017 vs 2016
T
he
CAY loss ratio excluding catastrophe losses
increased
3.8
percentage points in 20
17 reflecting the revision to the 2017 crop year margin estimate as discussed above.
The policy acquisition cost ratio decreased
0.9
percentage point in 2017, primarily due to lower direct commissions in the current year and an increase in MPCI net premiums earned.
The administrative expense ratio remained relatively flat in 2017.
2016 vs 2015
T
he
CAY loss ratio excluding catastrophe losses
decreased 10.4 percentage points in 20
16 reflecting the revision to the 2016 crop year margin estimate as discussed above.
The policy acquisition cost ratio increased 1.2 percentage point in 2016, primarily due to the reduction in net premiums earned related to the government's crop insurance profit and loss calculation formula this year of $202 million, compared to a reduction
64
of $30 million in the prior year. Excluding the impact of these reductions in net premiums earned, the policy acquisition ratio increased over prior year by 0.4 percentage points, primarily due to higher agent profit sharing commissions in the current year. In addition, during 2016, we determined that certain underwriting costs that are directly attributable to the successful acquisition of business previously classified as administrative expenses were more appropriately classified as policy acquisition costs. This resulted in a $2 million (0.2 percentage points) increase to policy acquisition costs, with an offsetting decrease to administrative expenses in 2016.
The administrative expense ratio decreased 0.5 percentage points in 2016 primarily due to higher Administrative and Operating (A&O) reimbursements on the MPCI business and the reclassification as noted above.
Overseas General Insurance
Overseas General Insurance segment comprises Chubb International and Chubb Global Markets (CGM). Chubb International comprises our commercial P&C traditional and specialty lines serving large corporations, middle market and small customers, A&H and traditional and specialty personal lines business serving local territories outside the U.S., Bermuda, and Canada. CGM, our London-based international commercial P&C excess and surplus lines business, includes Lloyd's of London (Lloyd's) Syndicate 2488. Chubb provides funds at Lloyd's to support underwriting by Syndicate 2488 which is managed by Chubb Underwriting Agencies Limited.
|
|
% Change
|
||||||||||||||||||||
|
(in millions of U.S. dollars, except for percentages)
|
2017
|
|
2016
|
|
2015
|
|
2017 vs. 2016
|
2016 vs. 2015
|
|||||||||||||
|
Net premiums written
(1)
|
$
|
8,341
|
|
$
|
8,124
|
|
$
|
6,634
|
|
2.7
|
%
|
22.5
|
%
|
||||||||
|
Net premiums earned
|
8,131
|
|
8,132
|
|
6,471
|
|
—
|
25.7
|
%
|
||||||||||||
|
Losses and loss expenses
|
4,281
|
|
4,005
|
|
3,052
|
|
6.9
|
%
|
31.2
|
%
|
|||||||||||
|
Policy acquisition costs
|
2,221
|
|
2,136
|
|
1,581
|
|
4.0
|
%
|
35.1
|
%
|
|||||||||||
|
Administrative expenses
|
982
|
|
1,057
|
|
997
|
|
(7.1
|
)%
|
6.0
|
%
|
|||||||||||
|
Underwriting income
(2)
|
647
|
|
934
|
|
841
|
|
(30.7
|
)%
|
11.1
|
%
|
|||||||||||
|
Net investment income
|
610
|
|
600
|
|
534
|
|
1.7
|
%
|
12.4
|
%
|
|||||||||||
|
Other (income) expense
|
(4
|
)
|
(11
|
)
|
(17
|
)
|
(63.6
|
)%
|
(35.3
|
)%
|
|||||||||||
|
Amortization of purchased intangibles
|
45
|
|
48
|
|
61
|
|
(6.3
|
)%
|
(21.3
|
)%
|
|||||||||||
|
Segment income
|
$
|
1,216
|
|
$
|
1,497
|
|
$
|
1,331
|
|
(18.8
|
)%
|
12.5
|
%
|
||||||||
|
Loss and loss expense ratio
|
52.6
|
%
|
49.3
|
%
|
47.2
|
%
|
3.3
|
|
pts.
|
2.1
|
|
pts.
|
|||||||||
|
Policy acquisition cost ratio
|
27.3
|
%
|
26.3
|
%
|
24.4
|
%
|
1.0
|
|
pt.
|
1.9
|
|
pts.
|
|||||||||
|
Administrative expense ratio
|
12.1
|
%
|
12.9
|
%
|
15.4
|
%
|
(0.8
|
)
|
pts.
|
(2.5
|
)
|
pts.
|
|||||||||
|
Combined ratio
|
92.0
|
%
|
88.5
|
%
|
87.0
|
%
|
3.5
|
|
pts.
|
1.5
|
|
pts.
|
|||||||||
|
(1)
|
On a constant-dollar basis, for the years ended
December 31, 2017
and 2016, net premiums written increased
$220 million
, or
2.7
percent, and increased $1,792 million, or 28.3 percent, respectively. Amounts are calculated by translating prior period results using the same local currency rates as the comparable current period.
|
|
(2)
|
On a constant-dollar basis, for the years ended
December 31, 2017
and 2016, underwriting income
decreased
$310 million
, or 32.3 percent, and increased $115 million or 14.1 percent, respectively. Amounts are calculated by translating prior period results using the same local currency rates as the comparable current period.
|
Premiums
2017 vs. 2016
Net premiums written
increased
$217 million
in
2017
, or
$220 million
on constant-dollar basis. Excluding the favorable impact of the 14-day stub period (
$215 million
), adverse impact of merger-related accounting policy adjustments in 2016 to align the timing of premium recognition (
$126 million
) and merger-related actions (
$131 million
), net premiums written increased
$262 million
on a constant-dollar basis, driven by growth in personal lines business, primarily from new automobile business written in Latin America, as well as growth across most property and casualty (P&C) lines, primarily in Asia and Latin America.
Net premiums earned remained flat in
2017
, and
decreased
$31 million
on a constant-dollar basis, primarily due to a higher mix of multi-year policies written in the current year in comparison to the growth in net premiums written, as well as
from the merger-related actions described above. These decreases were partially offset by the favorable impact of the 14-day stub period, as noted above.
65
2016 vs. 2015
Net premiums written increased $1,490 million in 2016, primarily due to the impact of the Chubb Corp acquisition, which added about $1.5 billion of growth in premiums. This increase was partially offset by the adverse impact of foreign exchange which decreased premiums by $302 million in 2016.
In 2016, net premiums written increased $95 million, on a constant-dollar comparative basis, primarily driven by growth in personal lines, property and casualty lines (P&C), and A&H lines, partially offset by declines in our business written by Chubb Global Markets. Personal lines and P&C growth was primarily in Europe and Asia. Growth in personal lines was negatively impacted by our decision to exit the legacy Chubb Brazilian high net worth automobile business due to competitive market conditions. Growth in P&C was partially offset by declines in Latin America, reflecting economic conditions. A&H lines growth was driven by new business, primarily in Latin America and Asia. Additionally, growth was partially offset by merger-related actions ($119 million).
Net premiums earned increased $1,661 million in 2016, and increased $81 million on a constant-dollar comparative basis, primarily due to the same factors driving the movements in net premiums written as described above.
Overseas General Insurance conducts business internationally and in most major foreign currencies. The following tables present a regional breakdown of Overseas General Insurance net premiums written:
|
% Change
|
||||||||||||||||||||||||
|
(in millions of U.S. dollars, except for percentages)
|
2017
|
|
2016
|
|
2015
|
|
C$
(1)
2016 |
|
2017 vs.
2016 |
|
C$
(1)
2017 vs. 2016
|
|
2016 vs. 2015
|
|
||||||||||
|
Region
|
||||||||||||||||||||||||
|
Europe
|
$
|
3,281
|
|
$
|
3,227
|
|
$
|
2,508
|
|
$
|
3,162
|
|
1.7
|
%
|
3.8
|
%
|
28.7
|
%
|
||||||
|
Latin America
|
2,108
|
|
1,992
|
|
1,767
|
|
2,044
|
|
5.8
|
%
|
3.1
|
%
|
12.7
|
%
|
||||||||||
|
Asia
|
2,596
|
|
2,537
|
|
1,963
|
|
2,549
|
|
2.3
|
%
|
1.8
|
%
|
29.2
|
%
|
||||||||||
|
Other
(2)
|
356
|
|
368
|
|
396
|
|
366
|
|
(3.3
|
)%
|
(2.7
|
)%
|
(7.1
|
)%
|
||||||||||
|
Net premiums written
|
$
|
8,341
|
|
$
|
8,124
|
|
$
|
6,634
|
|
$
|
8,121
|
|
2.7
|
%
|
2.7
|
%
|
22.5
|
%
|
||||||
|
2017 % of Total
|
|
2016 % of Total
|
|
2015 % of total
|
|
|||||||||||||||||||
|
Region
|
||||||||||||||||||||||||
|
Europe
|
40
|
%
|
40
|
%
|
38
|
%
|
||||||||||||||||||
|
Latin America
|
25
|
%
|
25
|
%
|
27
|
%
|
||||||||||||||||||
|
Asia
|
31
|
%
|
31
|
%
|
30
|
%
|
||||||||||||||||||
|
Other
(2)
|
4
|
%
|
4
|
%
|
5
|
%
|
||||||||||||||||||
|
Net premiums written
|
100
|
%
|
100
|
%
|
100
|
%
|
||||||||||||||||||
(1)
On a constant-dollar basis. Amounts are calculated by translating prior period results using the same local currency rates as the comparable current period.
(2)
Comprises Combined International, Eurasia and Africa region, and other international.
Combined Ratio
The following table presents pre-tax catastrophe losses and pre-tax favorable prior period development net of related reinstatement premiums:
|
(in millions of U.S. dollars)
|
2017
|
|
2016
|
|
2015
|
|
|||||
|
Catastrophe losses, pre-tax
|
$
|
331
|
|
$
|
183
|
|
$
|
142
|
|
||
|
Favorable prior period development net of related reinstatement premiums, pre-tax
|
$
|
252
|
|
$
|
423
|
|
$
|
343
|
|
||
Catastrophe losses were primarily from the following events:
|
•
|
2017
: Hurricane Maria, Hurricane Harvey, Hurricane Irma, Earthquakes in Mexico, Cyclone Debbie in Australia, and flooding in Latin America
|
|
•
|
2016: severe weather related events in Europe, earthquakes in Ecuador and New Zealand, and flooding in the U.K.
|
|
•
|
2015: a chemical storage facility explosion in Tianjin, China, a hailstorm in Australia, flooding and an earthquake in Chile, and severe storms in the U.K. and Asia
|
66
The following table presents the current accident year loss and loss expense ratio, excluding catastrophe losses and related reinstatement premiums ("CAY loss ratio excluding catastrophe losses"):
|
|
2017
|
|
2016
|
|
2015.
|
|
||
|
Loss and loss expense ratio
|
52.6
|
%
|
49.3
|
%
|
47.2
|
%
|
||
|
Catastrophe losses and related reinstatement premiums
|
(4.0
|
)%
|
(2.3
|
)%
|
(2.2
|
)%
|
||
|
Prior period development net of related reinstatement premiums
|
3.1
|
%
|
5.2
|
%
|
5.3
|
%
|
||
|
Current accident year loss and loss expense ratio excluding catastrophe losses
|
51.7
|
%
|
52.2
|
%
|
50.3
|
%
|
||
2017 vs. 2016
The CAY loss ratio excluding catastrophe losses
decreased
0.5
percentage points in
2017
, primarily due to a change in the mix of business (0.5 percentage points) towards products and regions that have a lower loss ratio and a higher acquisition cost ratio and integration-related claims handling expense savings realized of $
38 million
(0.5 percentage points), partially offset by a higher non-catastrophe large losses in the current year (0.2 percentage points).
The policy acquisition cost ratio
increased
1.0
percentage point in
2017
, compared to the prior year periods, which included the net favorable impact of initial year purchase accounting adjustments related to the Chubb Corp acquisition (0.3 percentage points). Excluding this item, the policy acquisition cost ratio increased 0.7 percentage points for the twelve months ended December 31, 2017, primarily due to a change in the mix of business (0.4 percentage points) towards products and regions within personal lines which have a higher acquisition cost ratio and a lower loss ratio. In addition, the adverse impact of aligning accounting policy after the Chubb Corp acquisition in the prior year increased the policy acquisition ratio by 0.2 percentage points. These increases were partially offset by integration-related expense savings realized of $
22 million
(0.3 percentage points).
The administrative expense ratio
decreased
0.8
percentage points in
2017
, primarily due to integration-related expense savings realized of $
116 million
(1.4 percentage points). This decrease was partially offset by the impact of merit-based salary increases, inflation, and increased spending to support growth initiatives.
2016 vs. 2015
The CAY loss ratio excluding catastrophe losses increased 1.9 percentage points in 2016, primarily due to the Chubb Corp acquisition which experienced a higher loss ratio.
On a comparative basis (refer to non-GAAP section), the CAY loss ratio excluding catastrophe losses increased 0.5 percentage points in 2016, primarily due to a lower level of short-tail large losses in the prior year.
The policy acquisition cost ratio increased 1.9 percentage points in 2016, primarily because we determined that certain underwriting costs that are directly attributable to the successful acquisition of business previously classified as administrative expenses were more appropriately classified as policy acquisition costs. This resulted in a $144 million (1.8 percentage points) increase to policy acquisition costs, with an offsetting decrease to administrative expenses in 2016.
On a comparative basis, which excludes purchase accounting adjustments related to the Chubb Corp acquisition, the policy acquisition cost ratio increased 0.8 percentage points in 2016, due to a shift in the mix of business away from E&S lines, which carry a lower acquisition cost ratio, towards more personal lines products which carry a higher acquisition cost ratio.
The administrative expense ratio decreased 2.5 percentage points in 2016, due to the $144 million (1.8 percentage points) reclassification noted above, and cost savings realized as a result of the Chubb Corp acquisition of $66 million (0.8 percentage points).
On a comparative basis, the administrative expense ratio decreased 1.0 percentage points in 2016, primarily due to cost savings realized as a result of the Chubb Corp acquisition as noted above.
67
Global Reinsurance
The Global Reinsurance segment represents our reinsurance operations comprising Chubb Tempest Re Bermuda, Chubb Tempest Re USA, Chubb Tempest Re International, and Chubb Tempest Re Canada. Global Reinsurance markets its reinsurance products worldwide under the Chubb Tempest Re brand name and provides a broad range of traditional reinsurance coverage to a diverse array of primary P&C companies.
|
|
% Change
|
||||||||||||||||||||
|
(in millions of U.S. dollars, except for percentages)
|
2017
|
|
2016
|
|
2015
|
|
2017 vs. 2016
|
2016 vs. 2015
|
|||||||||||||
|
Net premiums written
|
$
|
685
|
|
$
|
676
|
|
$
|
828
|
|
1.4
|
%
|
(18.4
|
)%
|
||||||||
|
Net premiums earned
|
704
|
|
710
|
|
849
|
|
(0.7
|
)%
|
(16.5
|
)%
|
|||||||||||
|
Losses and loss expenses
|
561
|
|
325
|
|
290
|
|
72.6
|
%
|
12.1
|
%
|
|||||||||||
|
Policy acquisition costs
|
177
|
|
187
|
|
214
|
|
(5.3
|
)%
|
(12.6
|
)%
|
|||||||||||
|
Administrative expenses
|
44
|
|
52
|
|
49
|
|
(15.4
|
)%
|
6.1
|
%
|
|||||||||||
|
Underwriting income (loss)
|
(78
|
)
|
146
|
|
296
|
|
NM
|
(50.7
|
)%
|
||||||||||||
|
Net investment income
|
273
|
|
263
|
|
300
|
|
3.8
|
%
|
(12.3
|
)%
|
|||||||||||
|
Other (income) expense
|
(1
|
)
|
(4
|
)
|
(6
|
)
|
(75.0
|
)%
|
(33.3
|
)%
|
|||||||||||
|
Segment income
|
$
|
196
|
|
$
|
413
|
|
$
|
602
|
|
(52.5
|
)%
|
(31.4
|
)%
|
||||||||
|
Loss and loss expense ratio
|
79.8
|
%
|
45.7
|
%
|
34.2
|
%
|
34.1
|
|
pts.
|
|
11.5
|
|
pts.
|
|
|||||||
|
Policy acquisition cost ratio
|
25.1
|
%
|
26.3
|
%
|
25.2
|
%
|
(1.2
|
)
|
pts.
|
|
1.1
|
|
pts.
|
|
|||||||
|
Administrative expense ratio
|
6.3
|
%
|
7.5
|
%
|
5.8
|
%
|
(1.2
|
)
|
pts.
|
|
1.7
|
|
pts.
|
|
|||||||
|
Combined ratio
|
111.2
|
%
|
79.5
|
%
|
65.2
|
%
|
31.7
|
|
pts.
|
|
14.3
|
|
pts.
|
|
|||||||
NM – not meaningful
Premiums
2017 vs. 2016
Net premiums written increased $
9 million
in
2017
primarily due to a $30 million increase in catastrophe reinstatement premiums and the timing of the Chubb Corp acquisition which excluded approximately $20 million of production generated prior to the Chubb Corp acquisition close on January 14, 2016 (14-day stub period). These increases were negatively impacted by merger-related actions of $
10 million
, declining rates and increasing competition.
Net premiums earned were about flat in 2017, which is approximately in line with the modest increase in net premiums written.
2016 vs. 2015
Net premiums written decreased $152 million in 2016 as we maintained underwriting discipline in an environment of declining rates and increasing competition. In addition, the decline in premiums reflects increased cessions of $17 million due to the purchase of additional property catastrophe reinsurance in 2016. On a comparative basis (refer to non-GAAP section), net premiums written declined $161 million in 2016 due to the same factors as described above.
Net premiums earned decreased $139 million in 2016 and $165 million on a comparative basis, primarily due to the same factors driving the decrease in net premiums written as described above.
Combined Ratio
The following table presents pre-tax catastrophe losses and pre-tax favorable prior period development net of related reinstatement premiums:
|
(in millions of U.S dollars)
|
2017
|
|
2016
|
|
2015
|
|
|||||
|
Catastrophe losses, pre-tax
(1)
|
$
|
313
|
|
$
|
91
|
|
$
|
22
|
|
||
|
Favorable prior period development net of related reinstatement premiums, pre-tax
(2)
|
$
|
59
|
|
$
|
78
|
|
$
|
119
|
|
||
|
(1)
Excludes catastrophe reinstatement premiums collected - pre-tax
|
$
|
37
|
|
$
|
7
|
|
$
|
1
|
|
||
|
(2)
Excludes reinstatement premiums (collected) expensed on prior period development - pre-tax
|
$
|
(4
|
)
|
$
|
5
|
|
$
|
4
|
|
||
68
Catastrophe losses were primarily from the following events:
|
•
|
2017
: Hurricane Irma, Hurricane Maria, Hurricane Harvey, Northern California Wildfires, and severe weather related events in the U.S.
|
|
•
|
2016
: Fort McMurray wildfire, Hurricane Matthew, and severe weather-related events in Europe, the U.S. and Canada
|
|
•
|
2015
: severe weather-related events in the U.S.
|
The following table presents the current accident year loss and loss expense ratio, excluding catastrophe losses and related reinstatement premiums ("CAY loss ratio excluding catastrophe losses"):
|
|
2017
|
|
2016
|
|
2015
|
|
||
|
Loss and loss expense ratio
|
79.8
|
%
|
45.7
|
%
|
34.2
|
%
|
||
|
Catastrophe losses and related reinstatement premiums
|
(42.4
|
)%
|
(12.5
|
)%
|
(2.6
|
)%
|
||
|
Prior period development net of related reinstatement premiums
|
8.6
|
%
|
11.8
|
%
|
14.3
|
%
|
||
|
Current accident year loss and loss expense ratio excluding catastrophe losses
|
46.0
|
%
|
45.0
|
%
|
45.9
|
%
|
||
2017 vs. 2016
The CAY loss ratio excluding catastrophe losses increased
1.0
percentage point in
2017
mainly due to an increase in the loss ratio on our U.S. property business.
The policy acquisition cost ratio decreased
1.2
percentage points in
2017
primarily due to higher net earned premiums from fully earned catastrophe reinstatement premiums, partially offset by lower profit commissions receivable on our outbound retrocessional treaties.
The administrative expense ratio decreased
1.2
percentage points in
2017
primarily reflecting expense reductions implemented to align our cost structure with our premium base and integration-related expense savings realized.
2016 vs. 2015
The CAY loss ratio excluding catastrophe losses decreased 0.9 percentage points in 2016 primarily due to a change in the mix of business towards products that have a lower loss ratio. On a comparative basis, the CAY loss ratio excluding catastrophe losses decreased 1.7 percentage points in 2016 due to the change in the mix of business as described above.
The policy acquisition cost ratio increased 1.1 percentage points in 2016 primarily due to a change in the mix of business towards regions and products that have higher acquisition cost ratios, partially offset by the impact of the Chubb Corp acquisition which carries a lower acquisition cost ratio. On a comparative basis, the policy acquisition cost ratio increased 1.9 percentage points in 2016, primarily due to the change in the mix of business as described above.
The administrative expense ratio increased 1.7 percentage points in 2016 primarily due to decreases in net premiums earned and the inclusion of the Chubb Corp business. On a comparative basis, the administrative expense ratio increased 1.2 percentage points in 2016 primarily due to decreases in net premiums earned outpacing the decline in administrative expenses.
69
Life Insurance
The Life Insurance segment comprises Chubb's international life operations (Chubb Life), Chubb Tempest Life Re (Chubb Life Re), and the North American supplemental A&H and life business of Combined Insurance. We assess the performance of our life business based on Life Insurance underwriting income, which includes Net investment income and (Gains) losses from fair value changes in separate account assets that do not qualify for separate account reporting under GAAP.
|
|
% Change
|
||||||||||||||||
|
(in millions of U.S. dollars, except for percentages)
|
2017
|
|
2016
|
|
2015
|
|
2017 vs. 2016
|
|
2016 vs 2015
|
|
|||||||
|
Net premiums written
|
$
|
2,141
|
|
$
|
2,124
|
|
$
|
1,998
|
|
0.8
|
%
|
6.3
|
%
|
||||
|
Net premiums earned
|
2,101
|
|
2,055
|
|
1,947
|
|
2.2
|
%
|
5.6
|
%
|
|||||||
|
Losses and loss expenses
|
739
|
|
663
|
|
601
|
|
11.5
|
%
|
10.3
|
%
|
|||||||
|
Policy benefits
(1)
|
676
|
|
588
|
|
543
|
|
15.0
|
%
|
8.3
|
%
|
|||||||
|
(Gains) losses from fair value changes in separate account assets
(1)
|
(97
|
)
|
(11
|
)
|
19
|
|
NM
|
|
NM
|
|
|||||||
|
Policy acquisition costs
|
530
|
|
509
|
|
476
|
|
4.1
|
%
|
6.9
|
%
|
|||||||
|
Administrative expenses
|
303
|
|
307
|
|
291
|
|
(1.3
|
)%
|
5.5
|
%
|
|||||||
|
Net investment income
|
313
|
|
283
|
|
265
|
|
10.6
|
%
|
6.8
|
%
|
|||||||
|
Life Insurance underwriting income
|
263
|
|
282
|
|
282
|
|
(6.7
|
)%
|
—
|
|
|||||||
|
Other (income) expense
(1)
|
13
|
|
16
|
|
4
|
|
(18.8
|
)%
|
300.0
|
%
|
|||||||
|
Amortization of purchased intangibles
|
2
|
|
3
|
|
2
|
|
(33.3
|
)%
|
50.0
|
%
|
|||||||
|
Segment income
|
$
|
248
|
|
$
|
263
|
|
$
|
276
|
|
(5.7
|
)%
|
(4.7
|
)%
|
||||
|
NM – not meaningful
|
|||||||||||||||||
|
(1)
|
(Gains) losses from fair value changes in separate account assets that do not qualify for separate account reporting under GAAP have been reclassified from Other income (expense) for purposes of presenting Life Insurance underwriting income. The offsetting movement in the separate account liabilities is included in Policy benefits.
|
Premiums
2017 vs. 2016
Net premiums written increased $
17 million
in
2017
, due to growth in our Asian international life operations and Combined Insurance supplemental A&H program business. This growth was partially offset by planned declines in our Latin American operations, reflecting merger-related actions of $
37 million
, and in our life reinsurance business, which continues to decline as no new business is currently being written.
2016 vs. 2015
Net premiums written increased $126 million in 2016, primarily reflecting the impact of the Chubb Corp acquisition, which added $64 million of growth to premiums. In addition, growth in our international life operations, primarily in Asia, and in our Combined Insurance supplemental A&H program business contributed to the increase. The adverse effect of foreign exchange impacted growth in net premiums written by $41 million in 2016. Our life reinsurance business continues to decline as there is no new life reinsurance business currently being written. On a comparative basis, net premiums written increased $32 million in 2016 due to the same factors as described above.
Deposits
The following table presents deposits collected on universal life and investment contracts:
|
|
% Change
|
|||||||||||||||||||
|
(in millions of U.S. dollars, except for percentages)
|
2017
|
|
2016
|
|
2015
|
|
2017 vs. 2016
|
|
C$
(1)
2017 vs. 2016
|
|
2016 vs. 2015
|
|
||||||||
|
Deposits collected on universal life and investment contracts
|
$
|
1,436
|
|
$
|
1,006
|
|
$
|
1,015
|
|
42.7
|
%
|
39.4
|
%
|
(0.9
|
)%
|
|||||
(1)
On a constant-dollar basis. Amounts are calculated by translating prior period results using the same local currency rates as the comparable current period.
Deposits collected on universal life and investment contracts (life deposits) are not reflected as revenues in our Consolidated statements of operations in accordance with GAAP. New life deposits are an important component of production, and although they do not significantly affect current period income from operations they are key to our efforts to grow our business. Life
70
deposits collected increased in
2017
due to growth in Taiwan, partially offset by a decline in Korea. Foreign exchange favorably impacted growth by $
25 million
in
2017
.
Life deposits collected decreased slightly in 2016 due to a decline in Korea, partially offset by growth in other Asian markets,
primarily in Hong Kong, Vietnam, and Taiwan. Foreign exchange adversely impacted growth by $18 million in 2016.
Life Insurance underwriting income
Life Insurance underwriting income decreased
$19 million
in
2017
compared to 2016 primarily due to the adverse impact of updating our long-term benefit ratio in our variable annuity business in 2016 ($48 million). This decrease was partially offset by higher net investment income as well as improved margins in our international life operations and growth in our Combined North America operations.
Life Insurance underwriting income remained flat in 2016 compared to 2015 due to the adverse impact of updating our long-term benefit ratio in the fourth quarter of 2016 as described above ($17 million), which was offset by unfavorable loss reserve development in the prior year in our Combined Insurance supplemental A&H program business.
Corporate
Corporate results primarily include the results of our non-insurance companies, income and expenses not attributable to reportable segments and loss and loss expenses of asbestos and environmental (A&E) liabilities.
Our exposure to A&E claims principally arises out of liabilities acquired when we purchased Westchester Specialty in 1998, CIGNA’s P&C business in 1999, and legacy Chubb Corp A&E claims in 2016. Corporate staff expenses and net investment income of Chubb Limited, including the amortization of the fair value adjustment on acquired invested assets and debt, interest expense, amortization of purchased intangibles related to the Chubb Corp acquisition, Chubb integration expenses and other merger related expenses, the one-time pension curtailment benefit related to the harmonization of our U.S. pension plans, and the results of Chubb Group Management and Holdings Ltd, and Chubb INA Holdings Inc. are reported within Corporate.
|
|
% Change
|
||||||||||||||||
|
(in millions of U.S. dollars, except for percentages)
|
2017
|
|
2016
|
|
2015
|
|
2017 vs. 2016
|
|
2016 vs. 2015
|
|
|||||||
|
Losses and loss expenses
|
$
|
285
|
|
$
|
169
|
|
$
|
202
|
|
68.6
|
%
|
(16.3
|
)%
|
||||
|
Policy acquisition costs
|
—
|
|
—
|
|
1
|
|
—
|
|
NM
|
|
|||||||
|
Administrative expenses
|
267
|
|
183
|
|
188
|
|
45.9
|
%
|
(2.7
|
)%
|
|||||||
|
Underwriting loss
|
552
|
|
352
|
|
391
|
|
56.8
|
%
|
(10.0
|
)%
|
|||||||
|
Net investment income (loss)
|
(283
|
)
|
(368
|
)
|
15
|
|
(23.1
|
)%
|
NM
|
|
|||||||
|
Interest expense
|
607
|
|
605
|
|
300
|
|
0.3
|
%
|
101.7
|
%
|
|||||||
|
Adjusted net realized gains (losses)
|
91
|
|
(140
|
)
|
(411
|
)
|
NM
|
|
(65.9
|
)%
|
|||||||
|
Other (income) expense
|
(318
|
)
|
(217
|
)
|
(47
|
)
|
46.5
|
%
|
361.7
|
%
|
|||||||
|
Amortization expense (benefit) of purchased intangibles
|
168
|
|
(80
|
)
|
—
|
|
NM
|
|
NM
|
|
|||||||
|
Chubb integration expenses
|
310
|
|
492
|
|
33
|
|
(37.0
|
)%
|
NM
|
|
|||||||
|
Income tax expense (benefit)
|
(139
|
)
|
815
|
|
462
|
|
NM
|
|
76.4
|
%
|
|||||||
|
Net corporate loss
|
$
|
(1,372
|
)
|
$
|
(2,475
|
)
|
$
|
(1,535
|
)
|
(44.6
|
)%
|
61.2
|
%
|
||||
|
NM – not meaningful
|
|||||||||||||||||
Losses and loss expenses in 2017, 2016, and 2015 were primarily due to unfavorable prior period development related to Brandywine asbestos and environmental exposures and related unallocated loss adjustment expenses. Refer to Note 7 of the Consolidated Financial Statements for further information. Additionally, during the fourth quarter of 2016, we amended several of our U.S. retirement programs as part of a harmonization effort that moved us towards a more unified retirement savings approach. This resulted in a one-time pension curtailment benefit of
$113 million
, $
23 million
of which was related to claims staff and was therefore recorded in losses and loss expenses in the above table. Refer to Note 13 to the Consolidated Financial Statements for further discussion of the pension curtailment.
71
Administrative expenses were higher by $
84
million in
2017
compared to 2016 which included the one-time pension curtailment benefit in 2016 discussed above, of which
$90 million
reduced administrative expenses last year. This increase was partially offset by integration-related expense savings (
$34 million
) and lower post-retirement benefit expenses ($7 million).
Administrative expenses were lower by $5 million in 2016 compared to 2015 primarily due to the one-time pension curtailment benefit in 2016, offset by the addition of Chubb Corp expenses from the Chubb Corp acquisition of $69 million. On a comparative basis, administrative expenses decreased $131 million, primarily due to the one-time pension curtailment benefit and cost savings of $25 million realized as a result of the Chubb Corp acquisition.
Net investment income for the years ended
December 31, 2017
and
2016
included amortization of $332 million and $393 million, respectively, related to the fair value adjustment on invested assets related to the Chubb Corp acquisition. Excluding the fair value adjustment amortization, net investment income increased by $24 million and $10 million at
December 31, 2017
and
2016
, respectively, primarily due to a higher overall invested asset base. Refer to the Net Investment Income section for a discussion on consolidated Net investment income.
Interest expense increased $
2
million in
2017
primarily due to the timing of the Chubb Corp acquisition in the prior year which excluded approximately $8 million of interest expense incurred prior to the Chubb Corp acquisition close on January 14, 2016 and higher interest expense related to our notional cash pool ($30 million) and repurchase agreements ($6 million) in 2017. These increases were partially offset by the conversion of the interest rate on our $1.0 billion of unsecured junior subordinated capital securities to a floating rate, equal to the three-month LIBOR plus 2.25 percentage points ($17 million) and the retirement of the $500 million of 5.7% senior debt that matured in February 2017 ($25 million). Interest expense increased $305 million in 2016 primarily driven by the $5.3 billion senior notes issued in November 2015, as well as the $3.3 billion par value of debt assumed in connection with the Chubb Corp acquisition.
During 2017, net realized gains of
$91
million were primarily associated with a net decrease in the fair value of GLB liabilities of $364 million. The decrease was primarily due to higher global equity market levels and annual changes in our assumptions for interest rates and assumptions on policyholder behavior. These impacts were partially offset by the unfavorable impact of discounting future claims for one less year. The net gains associated with the valuation of GLB liabilities were partially offset by realized losses on our investment portfolio of $37 million. Refer to Note 4 of the Consolidated Financial Statements for further information regarding the fair value of GLB liabilities.
During 2016, net realized losses of $140 million were primarily associated with net losses on our investment portfolio of $156 million, partially offset by realized gains associated with a net decrease in the fair value of GLB liabilities of $50 million. The decrease was primarily due to higher global equity market levels and the impact of updating our assumptions on policyholder behavior, partially offset by the unfavorable impact of discounting future claims for one less year.
During 2015, realized losses of $411 million were primarily associated with a net increase in the fair value of GLB liabilities; this increase was primarily due to the falling equity market levels and the unfavorable impact of discounting future claims for one less year, partially offset by higher interest rates. Additionally, there were realized losses on our investment portfolio of $106 million.
As part of our loss mitigation strategy for our GLB exposures, we maintain positions in derivative instruments that decrease in fair value when the S&P 500 index increases. During the years ended December 31,
2017
,
2016
, and
2015
, we experienced realized losses of
$261 million
,
$136 million
, and
$10 million
, respectively, related to these derivative instruments. For further discussion of the remaining Net realized gains and (losses), refer to the Net Realized and Unrealized Gains (Losses) section.
For the year ended
December 31, 2017
, Other income recognized in Corporate was $
318
million, compared to $
217
million and $
47
million in the years ended December 31, 2016 and 2015, respectively, comprised of:
|
•
|
Other income in 2017 of $406 million, compared to $227 million, and $67 million in 2016 and 2015, respectively, from our share of net realized gains from partially-owned investment companies.
|
|
•
|
Other expense in 2017 of $88 million, compared to $10 million and $20 million in 2016 and 2015, respectively. The higher expense in 2017 was primarily due to a $50 million charitable contribution to The Chubb Charitable Foundation and an increase in capital taxes resulting from a higher equity base after the Chubb Corp acquisition.
|
72
Amortization expense of purchased intangibles increased $
248
million for the year ended
December 31, 2017
, primarily reflecting the increase in intangible amortization expense related to agency distribution relationships and renewal rights as well as lower amortization benefit from the fair value adjustment of Unpaid losses and loss expenses acquired as part of the Chubb Corp acquisition. Refer to the Amortization of purchased intangibles and Other amortization section for further information.
Chubb integration expenses
The following table presents the components of Chubb integration expenses:
|
(in millions of U.S dollars)
|
2017
|
|
2016
|
|
2015
|
|
|||||
|
Personnel-related expenses
|
$
|
168
|
|
$
|
181
|
|
$
|
—
|
|
||
|
Consulting fees
|
64
|
|
125
|
|
16
|
|
|||||
|
Leases and real estate termination costs
|
26
|
|
58
|
|
—
|
|
|||||
|
Legal fees
|
—
|
|
—
|
|
6
|
|
|||||
|
System integration costs
|
—
|
|
—
|
|
5
|
|
|||||
|
Advisor fees
|
—
|
|
38
|
|
—
|
|
|||||
|
Other
|
52
|
|
90
|
|
6
|
|
|||||
|
Totals
|
$
|
310
|
|
$
|
492
|
|
$
|
33
|
|
||
Chubb integration expenses are one-time in nature and are not related to the on-going business activities of the segments. The Chief Executive Officer does not manage segment results or allocate resources to segments when considering these costs and they are therefore excluded from our definition of segment income.
Effective income tax rate
Our effective income tax rate, which we calculate as income tax expense divided by income before income tax, is dependent upon the mix of earnings from different jurisdictions with various tax rates. A change in the geographic mix of earnings would change the effective income tax rate.
In 2017, 2016, and 2015, our effective income tax rate was (3.7) percent, 16.5 percent, and 14.0 percent, respectively. The effective income tax rate in 2017 included the favorable transition income tax benefit of $450 million, representing our best estimate of the impact of the 2017 Tax Act. This benefit was recorded in the fourth quarter of 2017, the period when the legislation was enacted. In addition, the income tax benefit in 2017 reflects the significant catastrophe losses in the year. Refer to Note 8 to the Consolidated Financial Statements for additional information on the 2017 Tax Act. The increase in the effective income tax rate in 2016 compared to 2015 was primarily due to realized losses being generated in lower taxing jurisdictions and realized gains being generated in higher taxing jurisdictions in 2016, compared to net realized losses in both higher and lower taxing jurisdictions in 2015. Additionally, a higher percentage of profit excluding realized gains and losses were generated in higher taxing jurisdictions in 2016, largely driven by earnings generated as a result of the Chubb Corp acquisition.
The lower tax rates attributed to our foreign operations primarily reflect the lower corporate tax rates that have prevailed outside of the U.S. prior to the U.S. tax reform. During 2017, approximately 62 percent of our total pre-tax income was tax effected based on these lower rates compared with 54 percent and 69 percent in 2016 and 2015, respectively. The significant lower taxing jurisdictions outside of the U.S. include the U.K., Switzerland, and Bermuda with federal income tax rates in those countries of 19.0 percent, 7.83 percent, and 0.0 percent, respectively.
73
Non-GAAP Reconciliation
We provide financial measures such as net premiums written and net premiums earned on a constant-dollar basis. We believe it is useful to evaluate the trends in these measures exclusive of the effect of fluctuations in exchange rates between the U.S. dollar and the currencies in which our international business is transacted, as these exchange rates could fluctuate significantly between periods and distort the analysis of trends. The impact is determined by assuming constant foreign exchange rates between periods by translating prior period results using the same local currency exchange rates as the comparable current period.
P&C performance metrics are non-GAAP financial measures and comprise consolidated operating results (including Corporate) and exclude the operating results of the Life Insurance segment. We believe that these measures are useful and meaningful to investors as they are used by management to assess the company’s P&C operations which are the most economically similar. We exclude the Life Insurance segment because the results of this business do not always correlate with the results of our P&C operations.
The P&C combined ratio is a non-GAAP financial measure and includes the impact of realized gains and losses on crop derivatives. These derivatives were purchased to provide economic benefit, in a manner similar to reinsurance protection, in the event that a significant decline in commodity pricing will impact underwriting results. We view gains and losses on these derivatives as part of the results of our underwriting operations. The P&C combined ratio also excludes the one-time pension curtailment benefit recognized in 2016. Current accident year (CAY) P&C combined ratio excluding catastrophe losses excludes the impact of catastrophe losses and PPD. We believe this measure provides a better evaluation of our underwriting performance and enhances the understanding of the trends in our property and casualty business that may be obscured by these items.
74
The following table presents the calculation of combined ratio, as reported, to combined ratio, adjusted for catastrophe losses (CATs) and PPD:
|
North America Commercial P&C Insurance
|
|
North America Personal P&C Insurance
|
|
North America Agricultural Insurance
|
|
Overseas General Insurance
|
|
Global
Reinsurance
|
|
Corporate
|
|
Total P&C
|
|
|||||||||||||||
|
For the Twelve Months Ended
|
||||||||||||||||||||||||||||
|
December 31, 2017
|
||||||||||||||||||||||||||||
|
(in millions of U.S. dollars except for ratios)
|
||||||||||||||||||||||||||||
|
Numerator
|
||||||||||||||||||||||||||||
|
Losses and loss expenses
|
||||||||||||||||||||||||||||
|
Losses and loss expenses
|
A
|
$
|
8,287
|
|
$
|
3,265
|
|
$
|
1,043
|
|
$
|
4,281
|
|
$
|
561
|
|
$
|
285
|
|
$
|
17,722
|
|
||||||
|
Catastrophe losses
|
(1,220
|
)
|
(871
|
)
|
(18
|
)
|
(331
|
)
|
(313
|
)
|
—
|
|
(2,753
|
)
|
||||||||||||||
|
PPD and related adjustments
|
||||||||||||||||||||||||||||
|
PPD, net of related adjustments - favorable (unfavorable)
|
746
|
|
(69
|
)
|
119
|
|
252
|
|
59
|
|
(278
|
)
|
829
|
|
||||||||||||||
|
Net earned premium adjustments on PPD - unfavorable (favorable)
|
42
|
|
—
|
|
66
|
|
—
|
|
(4
|
)
|
—
|
|
104
|
|
||||||||||||||
|
Expense adjustments - unfavorable (favorable)
|
6
|
|
—
|
|
(11
|
)
|
—
|
|
—
|
|
—
|
|
(5
|
)
|
||||||||||||||
|
Reinstatement premiums expensed on PPD
|
9
|
|
—
|
|
—
|
|
—
|
|
—
|
|
9
|
|
||||||||||||||||
|
PPD - gross of related adjustments - favorable (unfavorable)
|
803
|
|
(69
|
)
|
174
|
|
252
|
|
55
|
|
(278
|
)
|
937
|
|
||||||||||||||
|
CAY Loss and loss expense ex CATs
|
B
|
$
|
7,870
|
|
$
|
2,325
|
|
$
|
1,199
|
|
$
|
4,202
|
|
$
|
303
|
|
$
|
7
|
|
$
|
15,906
|
|
||||||
|
Policy acquisition costs and administrative expenses
|
||||||||||||||||||||||||||||
|
Policy acquisition costs and administrative expenses
|
C
|
$
|
2,854
|
|
$
|
1,163
|
|
$
|
73
|
|
$
|
3,203
|
|
$
|
221
|
|
$
|
267
|
|
$
|
7,781
|
|
||||||
|
Expense adjustments - favorable (unfavorable)
|
(6
|
)
|
—
|
|
11
|
|
—
|
|
—
|
|
—
|
|
5
|
|
||||||||||||||
|
Policy acquisition costs and administrative expenses, adjusted
|
D
|
$
|
2,848
|
|
$
|
1,163
|
|
$
|
84
|
|
$
|
3,203
|
|
$
|
221
|
|
$
|
267
|
|
$
|
7,786
|
|
||||||
|
Denominator
|
||||||||||||||||||||||||||||
|
Net premiums earned
|
E
|
$
|
12,191
|
|
$
|
4,399
|
|
$
|
1,508
|
|
$
|
8,131
|
|
$
|
704
|
|
$
|
26,933
|
|
|||||||||
|
Reinstatement premiums (collected) expensed on catastrophe losses
|
4
|
|
22
|
|
—
|
|
4
|
|
(37
|
)
|
(7
|
)
|
||||||||||||||||
|
Net earned premium adjustments on PPD - unfavorable (favorable)
|
42
|
|
—
|
|
66
|
|
—
|
|
(4
|
)
|
104
|
|
||||||||||||||||
|
Reinstatement premiums expensed on PPD
|
9
|
|
—
|
|
|
—
|
|
—
|
|
—
|
|
9
|
|
|||||||||||||||
|
Net premiums earned excluding adjustments
|
F
|
$
|
12,246
|
|
$
|
4,421
|
|
$
|
1,574
|
|
$
|
8,135
|
|
$
|
663
|
|
$
|
27,039
|
|
|||||||||
|
Combined ratio
|
||||||||||||||||||||||||||||
|
Losses and loss expense ratio
|
A/E
|
68.0
|
%
|
74.2
|
%
|
69.2
|
%
|
52.6
|
%
|
79.8
|
%
|
65.8
|
%
|
|||||||||||||||
|
Policy acquisition costs and administrative expense ratio
|
C/E
|
23.4
|
%
|
26.5
|
%
|
4.8
|
%
|
39.4
|
%
|
31.4
|
%
|
28.9
|
%
|
|||||||||||||||
|
Combined ratio
|
91.4
|
%
|
100.7
|
%
|
74.0
|
%
|
92.0
|
%
|
111.2
|
%
|
94.7
|
%
|
||||||||||||||||
|
CAY Combined ratio, adjusted for CATs
|
||||||||||||||||||||||||||||
|
Loss and loss expense ratio, adjusted
|
B/F
|
64.3
|
%
|
52.6
|
%
|
76.2
|
%
|
51.7
|
%
|
46.0
|
%
|
58.8
|
%
|
|||||||||||||||
|
Policy acquisition costs and administrative expense ratio, adjusted
|
D/F
|
23.2
|
%
|
26.3
|
%
|
5.3
|
%
|
39.3
|
%
|
33.2
|
%
|
28.8
|
%
|
|||||||||||||||
|
CAY Combined ratio, adjusted for CATs
|
87.5
|
%
|
78.9
|
%
|
81.5
|
%
|
91.0
|
%
|
79.2
|
%
|
87.6
|
%
|
||||||||||||||||
|
Note: The ratios above are calculated using whole U.S. dollars. Accordingly, calculations using rounded amounts may differ. Letters A, B, C, D, E, and F included in the table are references for calculating the ratios above.
|
||||||||||||||||||||||||||||
75
"Comparative basis" measures presented throughout this section are prepared exclusive of the impact of the unearned premium reserves intangible amortization and the elimination of the historical policy acquisition costs as a result of purchase accounting related to the Chubb Corp acquisition in order to present the underlying profitability of our insurance business for the entire relevant periods. We believe this measure provides visibility into our results, allows for comparability to our historical results and is consistent with how management evaluates results. We have discussed our results on a "Comparative basis" for 2016 and 2015, defined below:
2016 "Comparative basis" results: The combined company results do not include the impact of the unearned premium reserves intangible amortization and the elimination of the historical policy acquisition costs as a result of purchase accounting related to the Chubb Corp acquisition. The combined company results for the year ended December 31, 2016 are inclusive of the first 14 days of January 2016 (the Chubb Corp acquisition closed January 14, 2016).
2015 "Comparative basis" results: Legacy ACE plus legacy Chubb Corp historical results after accounting policy alignment adjustments, including reclassifying certain legacy Chubb Corp corporate expenses to administrative expenses and redefining legacy Chubb Corp segment underwriting income by allocating the amortization of deferred policy acquisition costs to each segment. 2015 "Comparative basis" results exclude purchase accounting adjustments.
The following tables present a reconciliation of 2016 "Comparative basis" results to 2016 results, as well as 2015 "Comparative basis" results to 2015 results and pro forma results as calculated in accordance with SEC Article 11:
|
(in millions of U.S. dollars, except percentages)
|
North America Commercial P&C Insurance
|
|
North America Personal P&C Insurance
|
|
North America Agricultural Insurance
|
|
Overseas General Insurance
|
|
Global Reinsurance
|
|
Life Insurance
|
|
Consolidated
|
|
|||||||||||||
|
Net premiums written
|
|||||||||||||||||||||||||||
|
2016
|
|||||||||||||||||||||||||||
|
Net premiums written
|
$
|
11,740
|
|
$
|
4,153
|
|
$
|
1,328
|
|
$
|
8,124
|
|
$
|
676
|
|
$
|
2,124
|
|
$
|
28,145
|
|
||||||
|
14 day stub period
|
519
|
|
100
|
|
—
|
|
215
|
|
20
|
|
1
|
|
855
|
|
|||||||||||||
|
2016 Comparative basis
|
$
|
12,259
|
|
$
|
4,253
|
|
$
|
1,328
|
|
$
|
8,339
|
|
$
|
696
|
|
$
|
2,125
|
|
$
|
29,000
|
|
||||||
|
2015 Comparative basis
|
|||||||||||||||||||||||||||
|
Net premiums written
|
$
|
5,715
|
|
$
|
1,192
|
|
$
|
1,346
|
|
$
|
6,634
|
|
$
|
828
|
|
$
|
1,998
|
|
$
|
17,713
|
|
||||||
|
Legacy Chubb
|
6,899
|
|
3,570
|
|
—
|
|
2,099
|
|
29
|
|
36
|
|
12,633
|
|
|||||||||||||
|
Accounting policy alignment
|
—
|
|
—
|
|
—
|
|
18
|
|
—
|
|
59
|
|
77
|
|
|||||||||||||
|
2015 Comparative basis
(1)
|
$
|
12,614
|
|
$
|
4,762
|
|
$
|
1,346
|
|
$
|
8,751
|
|
$
|
857
|
|
$
|
2,093
|
|
$
|
30,423
|
|
||||||
|
Constant-dollar 2015 Comparative basis
|
$
|
12,605
|
|
$
|
4,756
|
|
$
|
1,346
|
|
$
|
8,244
|
|
$
|
843
|
|
$
|
2,049
|
|
$
|
29,843
|
|
||||||
|
Constant-dollar change Comparative basis
|
$
|
(346
|
)
|
$
|
(503
|
)
|
$
|
(18
|
)
|
$
|
95
|
|
$
|
(147
|
)
|
$
|
76
|
|
$
|
(843
|
)
|
||||||
|
Constant-dollar percent change Comparative basis
|
(2.8
|
)%
|
(10.6
|
)%
|
(1.3
|
)%
|
1.2
|
%
|
(17.5
|
)%
|
3.7
|
%
|
(2.8
|
)%
|
|||||||||||||
|
Net premiums earned
|
|||||||||||||||||||||||||||
|
2016
|
|||||||||||||||||||||||||||
|
Net premiums earned
|
$
|
12,217
|
|
$
|
4,319
|
|
$
|
1,316
|
|
$
|
8,132
|
|
$
|
710
|
|
$
|
2,055
|
|
$
|
28,749
|
|
||||||
|
14 day stub period
|
208
|
|
110
|
|
—
|
|
71
|
|
—
|
|
2
|
|
391
|
|
|||||||||||||
|
2016 Comparative basis
|
$
|
12,425
|
|
$
|
4,429
|
|
$
|
1,316
|
|
$
|
8,203
|
|
$
|
710
|
|
$
|
2,057
|
|
$
|
29,140
|
|
||||||
|
2015 Comparative basis
|
|||||||||||||||||||||||||||
|
Net premiums earned
|
$
|
5,634
|
|
$
|
948
|
|
$
|
1,364
|
|
$
|
6,471
|
|
$
|
849
|
|
$
|
1,947
|
|
$
|
17,213
|
|
||||||
|
Legacy Chubb
|
6,850
|
|
3,506
|
|
—
|
|
2,096
|
|
26
|
|
40
|
|
12,518
|
|
|||||||||||||
|
Accounting policy alignment
|
—
|
|
—
|
|
—
|
|
(1
|
)
|
—
|
|
56
|
|
55
|
|
|||||||||||||
|
2015 Comparative basis
(1)
|
$
|
12,484
|
|
$
|
4,454
|
|
$
|
1,364
|
|
$
|
8,566
|
|
$
|
875
|
|
$
|
2,043
|
|
$
|
29,786
|
|
||||||
|
Constant-dollar 2015 Comparative basis
|
$
|
12,471
|
|
$
|
4,454
|
|
$
|
1,364
|
|
$
|
8,122
|
|
$
|
863
|
|
$
|
2,001
|
|
$
|
29,275
|
|
||||||
|
Constant-dollar change Comparative basis
|
$
|
(46
|
)
|
$
|
(25
|
)
|
$
|
(48
|
)
|
$
|
81
|
|
$
|
(153
|
)
|
$
|
56
|
|
$
|
(135
|
)
|
||||||
|
Constant-dollar percent change Comparative basis
|
(0.4
|
)%
|
(0.6
|
)%
|
(3.6
|
)%
|
1.0
|
%
|
(17.9
|
)%
|
2.8
|
%
|
(0.5
|
)%
|
|||||||||||||
(1)
Comparative basis amounts for premium are calculated on the same basis as SEC pro forma.
76
|
(in millions of U.S. dollars)
|
North America Commercial P&C Insurance
|
|
North America Personal P&C Insurance
|
|
North America Agricultural Insurance
|
|
Overseas General Insurance
|
|
Global Reinsurance
|
|
Corporate
|
|
Total P&C
|
|
|||||||||||||
|
Loss and loss expenses
|
|||||||||||||||||||||||||||
|
2016
|
|||||||||||||||||||||||||||
|
Loss and loss expenses
|
$
|
7,439
|
|
$
|
2,558
|
|
$
|
893
|
|
$
|
4,005
|
|
$
|
325
|
|
$
|
169
|
|
$
|
15,389
|
|
||||||
|
14 day stub period
|
127
|
|
53
|
|
—
|
|
42
|
|
—
|
|
—
|
|
222
|
|
|||||||||||||
|
(Gain) loss on crop derivatives
|
—
|
|
—
|
|
5
|
|
—
|
|
—
|
|
—
|
|
5
|
|
|||||||||||||
|
Pension curtailment benefit
|
—
|
|
—
|
|
—
|
|
—
|
|
—
|
|
23
|
|
23
|
|
|||||||||||||
|
2016 Comparative basis
|
$
|
7,566
|
|
$
|
2,611
|
|
$
|
898
|
|
$
|
4,047
|
|
$
|
325
|
|
$
|
192
|
|
$
|
15,639
|
|
||||||
|
2015
|
|||||||||||||||||||||||||||
|
Loss and loss expenses
|
$
|
3,661
|
|
$
|
590
|
|
$
|
1,088
|
|
$
|
3,052
|
|
$
|
290
|
|
$
|
202
|
|
$
|
8,883
|
|
||||||
|
Legacy Chubb
|
3,681
|
|
2,079
|
|
—
|
|
1,064
|
|
5
|
|
105
|
|
6,934
|
|
|||||||||||||
|
(Gain) loss on crop derivatives
|
—
|
|
—
|
|
9
|
|
—
|
|
—
|
|
—
|
|
9
|
|
|||||||||||||
|
Accounting policy alignments
|
—
|
|
—
|
|
—
|
|
4
|
|
—
|
|
(14
|
)
|
(10
|
)
|
|||||||||||||
|
2015 Comparative basis
(1)
|
$
|
7,342
|
|
$
|
2,669
|
|
$
|
1,097
|
|
$
|
4,120
|
|
$
|
295
|
|
$
|
293
|
|
$
|
15,816
|
|
||||||
|
Policy acquisition costs
|
|||||||||||||||||||||||||||
|
2016
|
|||||||||||||||||||||||||||
|
Policy acquisition costs
|
$
|
2,023
|
|
$
|
966
|
|
$
|
83
|
|
$
|
2,136
|
|
$
|
187
|
|
$
|
—
|
|
$
|
5,395
|
|
||||||
|
Amortization of acquired UPR intangible asset
|
(859
|
)
|
(492
|
)
|
—
|
|
(208
|
)
|
—
|
|
—
|
|
(1,559
|
)
|
|||||||||||||
|
Elimination of deferred acquisition cost benefit
|
729
|
|
406
|
|
—
|
|
238
|
|
—
|
|
—
|
|
1,373
|
|
|||||||||||||
|
14 day stub period
|
33
|
|
14
|
|
—
|
|
13
|
|
—
|
|
—
|
|
60
|
|
|||||||||||||
|
2016 Comparative basis
|
$
|
1,926
|
|
$
|
894
|
|
$
|
83
|
|
$
|
2,179
|
|
$
|
187
|
|
$
|
—
|
|
$
|
5,269
|
|
||||||
|
2015
|
|||||||||||||||||||||||||||
|
Policy acquisition costs
|
$
|
531
|
|
$
|
69
|
|
$
|
69
|
|
$
|
1,581
|
|
$
|
214
|
|
$
|
1
|
|
$
|
2,465
|
|
||||||
|
Legacy Chubb
|
1,321
|
|
774
|
|
—
|
|
491
|
|
—
|
|
—
|
|
2,586
|
|
|||||||||||||
|
Accounting policy alignment
|
128
|
|
15
|
|
—
|
|
138
|
|
—
|
|
—
|
|
281
|
|
|||||||||||||
|
2015 Comparative basis
|
$
|
1,980
|
|
$
|
858
|
|
$
|
69
|
|
$
|
2,210
|
|
$
|
214
|
|
$
|
1
|
|
$
|
5,332
|
|
||||||
|
Amortization of acquired UPR intangible asset
|
855
|
|
490
|
|
—
|
|
205
|
|
—
|
|
—
|
|
1,550
|
|
|||||||||||||
|
Elimination of deferred acquisition cost benefit
|
(709
|
)
|
(406
|
)
|
—
|
|
(169
|
)
|
—
|
|
—
|
|
(1,284
|
)
|
|||||||||||||
|
2015 SEC pro forma
|
$
|
2,126
|
|
$
|
942
|
|
$
|
69
|
|
$
|
2,246
|
|
$
|
214
|
|
$
|
1
|
|
$
|
5,598
|
|
||||||
|
Administrative expenses
|
|||||||||||||||||||||||||||
|
2016
|
|||||||||||||||||||||||||||
|
Administrative expenses
|
$
|
1,125
|
|
$
|
363
|
|
$
|
(6
|
)
|
$
|
1,057
|
|
$
|
52
|
|
$
|
183
|
|
$
|
2,774
|
|
||||||
|
Pension curtailment benefit
|
—
|
|
—
|
|
—
|
|
—
|
|
—
|
|
90
|
|
90
|
|
|||||||||||||
|
14 day stub period
|
35
|
|
13
|
|
—
|
|
12
|
|
—
|
|
3
|
|
63
|
|
|||||||||||||
|
2016 Comparative basis
|
$
|
1,160
|
|
$
|
376
|
|
$
|
(6
|
)
|
$
|
1,069
|
|
$
|
52
|
|
$
|
276
|
|
$
|
2,927
|
|
||||||
|
2015
|
|||||||||||||||||||||||||||
|
Administrative expenses
|
$
|
621
|
|
$
|
123
|
|
$
|
1
|
|
$
|
997
|
|
$
|
49
|
|
$
|
188
|
|
$
|
1,979
|
|
||||||
|
Legacy Chubb
|
694
|
|
271
|
|
—
|
|
343
|
|
6
|
|
45
|
|
1,359
|
|
|||||||||||||
|
Accounting policy alignment
|
(128
|
)
|
(15
|
)
|
—
|
|
(142
|
)
|
—
|
|
84
|
|
(201
|
)
|
|||||||||||||
|
2015 Comparative basis
(1)
|
$
|
1,187
|
|
$
|
379
|
|
$
|
1
|
|
$
|
1,198
|
|
$
|
55
|
|
$
|
317
|
|
$
|
3,137
|
|
||||||
|
(Favorable) unfavorable PPD, pre-tax
|
|||||||||||||||||||||||||||
|
2015
|
|||||||||||||||||||||||||||
|
(Favorable) unfavorable PPD, pre-tax
|
$
|
(264
|
)
|
$
|
25
|
|
$
|
(45
|
)
|
$
|
(343
|
)
|
$
|
(119
|
)
|
$
|
200
|
|
$
|
(546
|
)
|
||||||
|
Legacy Chubb
|
(519
|
)
|
(43
|
)
|
—
|
|
(134
|
)
|
(19
|
)
|
91
|
|
(624
|
)
|
|||||||||||||
|
2015 Comparative basis
(1)
|
$
|
(783
|
)
|
$
|
(18
|
)
|
$
|
(45
|
)
|
$
|
(477
|
)
|
$
|
(138
|
)
|
$
|
291
|
|
$
|
(1,170
|
)
|
||||||
|
Catastrophe losses, pre-tax
|
|||||||||||||||||||||||||||
|
2015
|
|||||||||||||||||||||||||||
|
Catastrophe losses, pre-tax
|
$
|
85
|
|
$
|
63
|
|
$
|
9
|
|
$
|
142
|
|
$
|
22
|
|
$
|
—
|
|
$
|
321
|
|
||||||
|
Legacy Chubb
|
183
|
|
320
|
|
—
|
|
20
|
|
4
|
|
—
|
|
527
|
|
|||||||||||||
|
2015 Comparative basis
(1)
|
$
|
268
|
|
$
|
383
|
|
$
|
9
|
|
$
|
162
|
|
$
|
26
|
|
$
|
—
|
|
$
|
848
|
|
||||||
77
Net Investment Income
|
(in millions of U.S. dollars)
|
2017
|
|
2016
|
|
2015
|
|
|||||
|
Fixed maturities
|
$
|
2,987
|
|
$
|
2,779
|
|
$
|
2,157
|
|
||
|
Short-term investments
|
131
|
|
93
|
|
49
|
|
|||||
|
Equity securities
|
38
|
|
36
|
|
16
|
|
|||||
|
Other investments
|
133
|
|
98
|
|
86
|
|
|||||
|
Gross investment income
(1)
|
3,289
|
|
3,006
|
|
2,308
|
|
|||||
|
Investment expenses
|
(164
|
)
|
(141
|
)
|
(114
|
)
|
|||||
|
Net investment income
(1)
|
$
|
3,125
|
|
$
|
2,865
|
|
$
|
2,194
|
|
||
|
(1)
Includes amortization expense related to fair value adjustment of acquired invested assets related to the Chub Corp acquisition
|
$
|
(332
|
)
|
$
|
(393
|
)
|
$
|
—
|
|
||
Net investment income is influenced by a number of factors including the amounts and timing of inward and outward cash flows, the level of interest rates, and changes in overall asset allocation. Net investment income increased
9.1 percent
in
2017
compared with
2016
primarily reflecting higher private equity income distributions that included a $44 million final distribution from a co-investment with one of our private equity fund partners and a higher overall invested asset base. Additionally, the current year's amortization expense related to the fair value adjustment of acquired invested assets is $61 million less than prior year. Net investment income increased 30.6 percent in 2016 compared with 2015 primarily due to the Chubb Corp acquisition which added $1.2 billion of net investment income, partially offset by the unfavorable impact of liquidating investments to fund the acquisition, and the unfavorable impact of amortizing the purchase accounting fair value adjustment to investments at the date of acquisition of $393 million.
Our yield on average invested assets was
3.5
percent in 2017 and 3.4 percent and 3.5 percent in 2016 and 2015, respectively, which is primarily driven by the yield on our fixed maturities. This compares to the average market yield, which represents the weighted average yield to maturity of our fixed income portfolio based on market prices of the holdings throughout the period, of
2.8 percent
for 2017 and 2.4 percent and 2.8 percent in
2016
and
2015
, respectively.
The following table shows the yield on average invested assets:
|
(in millions of U.S. dollars, except for percentages)
|
2017
|
|
2016
|
|
2015
|
|
|||||
|
Average invested assets
|
$
|
99,675
|
|
$
|
96,656
|
|
$
|
63,252
|
|
||
|
Net investment income
|
$
|
3,125
|
|
$
|
2,865
|
|
$
|
2,194
|
|
||
|
Yield on average invested assets
(1)
|
3.5
|
%
|
3.4
|
%
|
3.5
|
%
|
|||||
|
(1)
|
Excludes $332 million and $393 million of amortization on the purchase accounting fair value adjustment of acquired invested assets related to the Chubb Corp acquisition in 2017 and 2016, respectively.
|
Net Realized and Unrealized Gains (Losses)
We take a long-term view with our investment strategy, and our investment managers manage our investment portfolio to maximize total return within certain specific guidelines designed to minimize risk. The majority of our investment portfolio is available for sale and reported at fair value. Our held to maturity investment portfolio is reported at amortized cost.
The effect of market movements on our available for sale investment portfolio impacts Net income (through Net realized gains (losses)) when securities are sold or when we record an Other-than-temporary impairment (OTTI) charge in Net income. For a discussion related to how we assess OTTI for all of our investments, including credit-related OTTI, and the related impact on Net income, refer to Note
3
d) to the Consolidated Financial Statements. Additionally, Net income is impacted through the reporting of changes in the fair value of derivatives, including financial futures, options, swaps, and GLB reinsurance. Changes in unrealized appreciation and depreciation on available for sale securities resulting from the revaluation of securities held, changes in cumulative foreign currency translation adjustment, and unrealized postretirement benefit obligations liability adjustment, are reported as separate components of Accumulated other comprehensive income in Shareholders’ equity in the Consolidated balance sheets.
78
The following table presents our net realized and unrealized gains (losses):
|
|
Year Ended December 31, 2017
|
|
Year Ended December 31, 2016
|
||||||||||||||||||||
|
(in millions of U.S. dollars)
|
Net
Realized
Gains
(Losses)
|
|
Net
Unrealized
Gains
(Losses)
|
|
Net
Impact
|
|
Net
Realized
Gains
(Losses)
|
|
Net
Unrealized
Gains
(Losses)
|
|
Net
Impact
|
|
|||||||||||
|
Fixed maturities
|
$
|
(31
|
)
|
$
|
537
|
|
$
|
506
|
|
$
|
(163
|
)
|
$
|
83
|
|
$
|
(80
|
)
|
|||||
|
Fixed income derivatives
|
(11
|
)
|
—
|
|
(11
|
)
|
(33
|
)
|
—
|
|
(33
|
)
|
|||||||||||
|
Public equity
|
16
|
|
88
|
|
104
|
|
44
|
|
52
|
|
96
|
|
|||||||||||
|
Private equity
|
(11
|
)
|
8
|
|
(3
|
)
|
(4
|
)
|
(49
|
)
|
(53
|
)
|
|||||||||||
|
Total investment portfolio
(1)
|
(37
|
)
|
633
|
|
596
|
|
(156
|
)
|
86
|
|
(70
|
)
|
|||||||||||
|
Variable annuity reinsurance derivative transactions, net of applicable hedges
|
103
|
|
—
|
|
103
|
|
(83
|
)
|
—
|
|
(83
|
)
|
|||||||||||
|
Other derivatives
|
(5
|
)
|
—
|
|
(5
|
)
|
(10
|
)
|
—
|
|
(10
|
)
|
|||||||||||
|
Foreign exchange
|
36
|
|
471
|
|
507
|
|
118
|
|
(154
|
)
|
(36
|
)
|
|||||||||||
|
Other
|
(13
|
)
|
(16
|
)
|
(29
|
)
|
(14
|
)
|
543
|
|
529
|
|
|||||||||||
|
Net gains (losses) before tax
|
$
|
84
|
|
$
|
1,088
|
|
$
|
1,172
|
|
$
|
(145
|
)
|
$
|
475
|
|
$
|
330
|
|
|||||
|
(1)
|
For the year ended
December 31, 2017
, other-than-temporary impairments in Net realized gains (losses) include
$23
million for fixed maturities,
$10
million for public equity, and
$12
million for private equity. For the year ended
December 31, 2016
, other-than-temporary impairments in Net realized gains (losses) include
$81
million for fixed maturities,
$8
million for public equity, and
$14
million for private equity.
|
Amortization of purchased intangibles and Other amortization
Amortization expense related to purchased intangibles amounted to
$260 million
, $
19
million, and $
171
million for the years ended
December 31, 2017
,
2016
, and
2015
, respectively. Amortization expense of purchased intangibles was low in 2016 reflecting the favorable impact of the amortization benefit from the fair value adjustment on acquired Unpaid losses and loss expenses. This benefit was lower in 2017 and will be comparatively lower in 2018. As a result, the amortization of purchased intangibles is expected to increase to
$338 million
in 2018 as presented in the table below.
Amortization expense in 2018 is expected to be $338 million as shown in the table below, or approximately $85 million each quarter.
The following table presents, as of
December 31, 2017
, the estimated pre-tax amortization expense (benefit) of purchased intangibles, at current foreign currency exchange rates, for the next five years:
|
Associated with the Chubb Corp Acquisition
|
|||||||||||||||||||||||
|
For the Years Ending December 31
(in millions of U.S. dollars) |
Agency distribution relationships and renewal rights
|
|
Internally developed technology
|
|
Fair value adjustment on Unpaid losses and loss expense
|
|
Total
(1)
|
|
Other intangible assets
(2)
|
|
Total
Amortization of purchased intangibles
|
|
|||||||||||
|
2018
|
$
|
325
|
|
$
|
32
|
|
$
|
(102
|
)
|
$
|
255
|
|
$
|
83
|
|
$
|
338
|
|
|||||
|
2019
|
282
|
|
—
|
|
(63
|
)
|
219
|
|
75
|
|
294
|
|
|||||||||||
|
2020
|
241
|
|
—
|
|
(36
|
)
|
205
|
|
67
|
|
272
|
|
|||||||||||
|
2021
|
218
|
|
—
|
|
(20
|
)
|
198
|
|
61
|
|
259
|
|
|||||||||||
|
2022
|
198
|
|
—
|
|
(14
|
)
|
184
|
|
57
|
|
241
|
|
|||||||||||
|
Total
|
$
|
1,264
|
|
$
|
32
|
|
$
|
(235
|
)
|
$
|
1,061
|
|
$
|
343
|
|
$
|
1,404
|
|
|||||
(1)
Recorded in Corporate.
(2)
Recorded in applicable segment(s) that acquired the intangible assets.
79
Reduction of deferred tax liability associated with intangible assets related to Other intangible assets (excluding the fair value adjustment on Unpaid losses and loss expense)
At
December 31, 2017
, the deferred tax liability associated with the Other intangibles assets (excluding the fair value adjustment on Unpaid losses and loss expenses) was $1,433 million.
The following table presents, as of
December 31, 2017
, the expected reduction to the deferred tax liability associated with Other intangible assets (which reduces as agency distribution relationships and renewal rights, internally developed technology, and other intangible assets amortize), at current foreign currency exchange rates for the next five years:
|
For the Years Ending December 31
(in millions of U.S. dollars) |
Reduction to deferred tax liability associated with intangible assets
|
|
|
|
2018
|
$
|
97
|
|
|
2019
|
79
|
|
|
|
2020
|
68
|
|
|
|
2021
|
61
|
|
|
|
2022
|
56
|
|
|
|
Total
|
$
|
361
|
|
Amortization of the fair value adjustment on acquired invested assets and assumed long-term debt
The following table presents at
December 31, 2017
, the expected amortization expense of the fair value adjustment on acquired invested assets, at current foreign currency exchange rates, and the expected amortization benefit from the amortization of the fair value adjustment on assumed long-term debt for the next five years as follows:
|
Amortization (expense) benefit of the fair value adjustment on
|
|||||||
|
For the Years Ending December 31
(in millions of U.S. dollars) |
Acquired invested assets
(1)
|
|
Assumed long-term debt
(2)
|
|
|||
|
2018
|
$
|
(300
|
)
|
$
|
31
|
|
|
|
2019
|
(270
|
)
|
19
|
|
|||
|
2020
|
(250
|
)
|
19
|
|
|||
|
2021
|
(38
|
)
|
19
|
|
|||
|
2022
|
—
|
|
19
|
|
|||
|
Total
|
$
|
(858
|
)
|
$
|
107
|
|
|
(1)
Recorded as a reduction to Net investment income in the Consolidated statements of operations.
(2)
Recorded as a reduction to Interest expense in the Consolidated statements of operations.
The estimate of amortization expense of the fair value adjustment on acquired invested assets could vary materially based on current market conditions, bond calls, overall duration of the acquired investment portfolio, and foreign exchange.
Interest Expense
Interest expense in 2017 of $607 million was comprised of interest expense on our debt obligations ($560 million) which included $8 million of amortization of debt issuance costs, interest expense on notional pools ($56 million), fees on collateral, and repurchase agreements and credit facility usage ($40 million). This expense was offset by the amortization of the fair value of debt related to the Chubb Corp acquisition ($49 million). Interest expense in 2016 was comparable at $605 million.
For 2018, interest expense on our existing debt obligations is expected to be $513 million, which includes $8 million of amortization of debt issuance costs. This estimate excludes interest expense expected to be incurred in 2018 relating to our notional pools, fees on collateral, repurchase agreements and credit facilities, as interest expense in these arrangements are based on usage and could fluctuate from prior years. This estimated interest expense also excludes $31 million of expected amortization of fair value of debt related to the Chubb Corp acquisition.
80
Investments
Our investment portfolio is invested primarily in publicly traded, investment grade, fixed income securities with an average credit quality of A/Aa as rated by the independent investment rating services Standard and Poor’s (S&P)/ Moody’s Investors Service (Moody’s). The portfolio is externally managed by independent, professional investment managers and is broadly diversified across geographies, sectors, and issuers. Other investments principally comprise direct investments, investment funds, and limited partnerships. We hold no collateralized debt obligations in our investment portfolio, and we provide no credit default protection. We have long-standing global credit limits for our entire portfolio across the organization. Exposures are aggregated, monitored, and actively managed by our Global Credit Committee, comprising senior executives, including our Chief Financial Officer, our Chief Risk Officer, our Chief Investment Officer, and our Treasurer. We also have well-established, strict contractual investment rules requiring managers to maintain highly diversified exposures to individual issuers and closely monitor investment manager compliance with portfolio guidelines.
The average duration of our fixed income securities, including the effect of options and swaps, was
4.2
years at both
December 31, 2017
and
2016
. We estimate that a 100 basis point (bps) increase in interest rates would reduce the valuation of our fixed income portfolio by approximately
$4.1
billion at
December 31, 2017
.
The following table shows the fair value and cost/amortized cost of our invested assets:
|
|
December 31, 2017
|
December 31, 2016
|
|||||||||||||
|
(in millions of U.S. dollars)
|
Fair
Value
|
|
Cost/
Amortized
Cost
|
|
Fair
Value
|
|
Cost/
Amortized
Cost
|
|
|||||||
|
Fixed maturities available for sale
|
$
|
78,939
|
|
$
|
77,835
|
|
$
|
80,115
|
|
$
|
79,536
|
|
|||
|
Fixed maturities held to maturity
|
14,474
|
|
14,335
|
|
10,670
|
|
10,644
|
|
|||||||
|
Short-term investments
|
3,561
|
|
3,561
|
|
3,002
|
|
3,002
|
|
|||||||
|
96,974
|
|
95,731
|
|
93,787
|
|
93,182
|
|
||||||||
|
Equity securities
|
937
|
|
737
|
|
814
|
|
706
|
|
|||||||
|
Other investments
|
4,672
|
|
4,417
|
|
4,519
|
|
4,270
|
|
|||||||
|
Total investments
|
$
|
102,583
|
|
$
|
100,885
|
|
$
|
99,120
|
|
$
|
98,158
|
|
|||
The fair value of our total investments increased
$3.5 billion
during the year ended
December 31, 2017
, primarily due to the investing of operating cash flows, unrealized appreciation, and the favorable impact of foreign exchange, partially offset by the payment of dividends on our Common Shares, repurchases of our Common Shares, and the repayment of $500 million senior notes that matured in February 2017.
81
The following tables present the market value of our fixed maturities and short-term investments at
December 31, 2017
and
2016
. The first table lists investments according to type and the second according to S&P credit rating:
|
|
December 31, 2017
|
December 31, 2016
|
|||||||||||
|
(in millions of U.S. dollars, except for percentages)
|
Market Value
|
|
% of Total
|
|
Market Value
|
|
% of Total
|
|
|||||
|
Treasury
|
$
|
4,049
|
|
4
|
%
|
$
|
2,832
|
|
3
|
%
|
|||
|
Agency
|
564
|
|
1
|
%
|
699
|
|
1
|
%
|
|||||
|
Corporate and asset-backed securities
|
27,215
|
|
28
|
%
|
26,944
|
|
29
|
%
|
|||||
|
Mortgage-backed securities
|
18,032
|
|
19
|
%
|
15,435
|
|
16
|
%
|
|||||
|
Municipal
|
20,766
|
|
21
|
%
|
22,768
|
|
24
|
%
|
|||||
|
Non-U.S.
|
22,787
|
|
23
|
%
|
22,107
|
|
24
|
%
|
|||||
|
Short-term investments
|
3,561
|
|
4
|
%
|
3,002
|
|
3
|
%
|
|||||
|
Total
|
$
|
96,974
|
|
100
|
%
|
$
|
93,787
|
|
100
|
%
|
|||
|
AAA
|
$
|
15,512
|
|
16
|
%
|
$
|
15,746
|
|
17
|
%
|
|||
|
AA
|
37,407
|
|
39
|
%
|
36,235
|
|
39
|
%
|
|||||
|
A
|
18,369
|
|
19
|
%
|
17,519
|
|
19
|
%
|
|||||
|
BBB
|
12,377
|
|
13
|
%
|
12,237
|
|
13
|
%
|
|||||
|
BB
|
7,941
|
|
8
|
%
|
6,993
|
|
7
|
%
|
|||||
|
B
|
5,135
|
|
5
|
%
|
4,814
|
|
5
|
%
|
|||||
|
Other
|
233
|
|
—
|
|
243
|
|
—
|
|
|||||
|
Total
|
$
|
96,974
|
|
100
|
%
|
$
|
93,787
|
|
100
|
%
|
|||
Corporate and asset-backed securities
The following table presents our 10 largest global exposures to corporate bonds by market value at
December 31, 2017
:
|
(in millions of U.S. dollars)
|
Market Value
|
|
|
|
Wells Fargo & Co
|
$
|
579
|
|
|
JP Morgan Chase & Co
|
465
|
|
|
|
Anheuser-Busch InBev NV
|
439
|
|
|
|
Goldman Sachs Group Inc
|
437
|
|
|
|
AT&T Inc
|
406
|
|
|
|
General Electric Co
|
376
|
|
|
|
Verizon Communications Inc
|
345
|
|
|
|
Morgan Stanley
|
335
|
|
|
|
Bank of America Corp
|
320
|
|
|
|
Citigroup Inc
|
312
|
|
|
82
Mortgage-backed securities
|
S&P Credit Rating
|
Market Value
|
|
Amortized Cost
|
|
|||||||||||||||||||||||
|
December 31, 2017 (in millions of U.S. dollars)
|
AAA
|
|
AA
|
|
A
|
|
BBB
|
|
BB and
below
|
|
Total
|
|
Total
|
|
|||||||||||||
|
Agency residential mortgage-backed (RMBS)
|
$
|
—
|
|
$
|
14,876
|
|
$
|
—
|
|
$
|
—
|
|
$
|
—
|
|
$
|
14,876
|
|
$
|
14,857
|
|
||||||
|
Non-agency RMBS
|
11
|
|
10
|
|
72
|
|
16
|
|
26
|
|
135
|
|
133
|
|
|||||||||||||
|
Commercial mortgage-backed
|
2,858
|
|
118
|
|
45
|
|
—
|
|
—
|
|
3,021
|
|
3,013
|
|
|||||||||||||
|
Total mortgage-backed securities
|
$
|
2,869
|
|
$
|
15,004
|
|
$
|
117
|
|
$
|
16
|
|
$
|
26
|
|
$
|
18,032
|
|
$
|
18,003
|
|
||||||
Municipal
As part of our overall investment strategy, we may invest in states, municipalities, and other political subdivisions fixed maturity securities (Municipal). We apply the same investment selection process described previously to our Municipal investments. The portfolio is highly diversified primarily in state general obligation bonds and essential service revenue bonds including education and utilities (water, power, and sewers).
Non-U.S.
Our exposure to the Euro results primarily from Chubb European Group Limited which is headquartered in London and offers a broad range of coverages throughout the European Union, Central, and Eastern Europe. Chubb primarily invests in Euro denominated investments to support its local currency insurance obligations and required capital levels. Chubb’s local currency investment portfolios have strict contractual investment guidelines requiring managers to maintain a high quality and diversified portfolio to both sector and individual issuers. Investment portfolios are monitored daily to ensure investment manager compliance with portfolio guidelines.
Our non-U.S. investment grade fixed income portfolios are currency-matched with the insurance liabilities of our non-U.S. operations. The average credit quality of our non-U.S. fixed income securities is A and
55 percent
of our holdings are rated AAA or guaranteed by governments or quasi-government agencies. Within the context of these investment portfolios, our government and corporate bond holdings are highly diversified across industries and geographies. Issuer limits are based on credit rating (AA—
two
percent, A—
one
percent, BBB—
0.5
percent of the total portfolio) and are monitored daily via an internal compliance system. Because of this investment approach, we do not have a direct exposure to troubled sovereign borrowers in Europe. We manage our indirect exposure using the same credit rating based investment approach. Accordingly, we do not believe our indirect exposure is material.
The following table summarizes the market value and amortized cost of our non-U.S. fixed income portfolio by country/sovereign for non-U.S. government securities at
December 31, 2017
:
|
(in millions of U.S. dollars)
|
Market Value
|
|
Amortized Cost
|
|
|||
|
United Kingdom
|
$
|
1,387
|
|
$
|
1,364
|
|
|
|
Republic of Korea
|
1,056
|
|
978
|
|
|||
|
Canada
|
933
|
|
944
|
|
|||
|
Federative Republic of Brazil
|
741
|
|
730
|
|
|||
|
Province of Ontario
|
646
|
|
647
|
|
|||
|
United Mexican States
|
536
|
|
544
|
|
|||
|
Province of Quebec
|
507
|
|
507
|
|
|||
|
Kingdom of Thailand
|
462
|
|
431
|
|
|||
|
Federal Republic of Germany
|
424
|
|
419
|
|
|||
|
French Republic
|
326
|
|
313
|
|
|||
|
Other Non-U.S. Government Securities
(1)
|
4,497
|
|
4,385
|
|
|||
|
Total
|
$
|
11,515
|
|
$
|
11,262
|
|
|
(1)
There are no investments in Portugal, Ireland, Italy, Greece or Spain.
83
The following table summarizes the market value and amortized cost of our non-U.S. fixed income portfolio by country/sovereign for non-U.S. corporate securities at
December 31, 2017
:
|
(in millions of U.S. dollars)
|
Market Value
|
|
Amortized Cost
|
|
|||
|
United Kingdom
|
$
|
1,979
|
|
$
|
1,904
|
|
|
|
Canada
|
1,413
|
|
1,396
|
|
|||
|
United States
(1)
|
960
|
|
939
|
|
|||
|
France
|
829
|
|
804
|
|
|||
|
Netherlands
|
773
|
|
754
|
|
|||
|
Australia
|
758
|
|
743
|
|
|||
|
Germany
|
561
|
|
545
|
|
|||
|
Switzerland
|
356
|
|
345
|
|
|||
|
Japan
|
319
|
|
320
|
|
|||
|
China
|
312
|
|
308
|
|
|||
|
Other Non-U.S. Corporate Securities
|
3,012
|
|
2,932
|
|
|||
|
Total
|
$
|
11,272
|
|
$
|
10,990
|
|
|
(1)
The countries that are listed in the non-U.S. corporate fixed income portfolio above represent the ultimate parent company's country of risk. Non-U.S. corporate securities could be issued by foreign subsidiaries of U.S. corporations.
Below-investment grade corporate fixed income portfolio
Below-investment grade securities have different characteristics than investment grade corporate debt securities. Risk of loss from default by the borrower is greater with below-investment grade securities. Below-investment grade securities are generally unsecured and are often subordinated to other creditors of the issuer. Also, issuers of below-investment grade securities usually have higher levels of debt and are more sensitive to adverse economic conditions, such as recession or increasing interest rates, than investment grade issuers. At
December 31, 2017
, our corporate fixed income investment portfolio included below-investment grade and non-rated securities which, in total, comprised approximately
12 percent
of our fixed income portfolio. Our below-investment grade and non-rated portfolio includes over
1,100
issuers, with the greatest single exposure being
$152
million.
We manage high-yield bonds as a distinct and separate asset class from investment grade bonds. The allocation to high-yield bonds is explicitly set by internal management and is targeted to securities in the upper tier of credit quality (BB/B). Our minimum rating for initial purchase is BB/B. Nine external investment managers are responsible for high-yield security selection and portfolio construction. Our high-yield managers have a conservative approach to credit selection and very low historical default experience. Holdings are highly diversified across industries and generally subject to a
1.5 percent
issuer limit as a percentage of high-yield allocation. We monitor position limits daily through an internal compliance system. Derivative and structured securities (e.g., credit default swaps and collateralized loan obligations) are not permitted in the high-yield portfolio.
Asbestos and Environmental (A&E)
Asbestos and environmental (A&E) reserving considerations
For asbestos, Chubb faces claims relating to policies issued to manufacturers, distributors, installers, and other parties in the chain of commerce for asbestos and products containing asbestos. Claimants will generally allege damages across an extended time period which may coincide with multiple policies covering a wide range of time periods for a single insured.
Environmental claims present exposure for remediation and defense costs associated with the contamination of property as a result of pollution.
84
The following table presents count information for asbestos claims by causative agent and environmental claims by account, for direct policies only:
|
Asbestos (by causative agent)
|
Environmental (by account)
|
||||||||||
|
2017
|
|
2016
|
|
2017
|
|
2016
|
|
||||
|
Open at beginning of year
|
1,766
|
|
1,145
|
|
1,395
|
|
1,011
|
|
|||
|
Newly reported
|
106
|
|
81
|
|
81
|
|
76
|
|
|||
|
Closed or otherwise disposed
|
123
|
|
23
|
|
138
|
|
18
|
|
|||
|
Acquired
|
—
|
|
563
|
|
—
|
|
326
|
|
|||
|
Open at end of year
|
1,749
|
|
1,766
|
|
1,338
|
|
1,395
|
|
|||
Closed or otherwise disposed claims were significantly higher in 2017 due to a review of pending cases completed in 2017. Survival ratios are calculated by dividing the asbestos or environmental loss and allocated loss adjustment expense (ALAE) reserves by the average asbestos or environmental loss and ALAE payments for the three most recent calendar years (3-year survival ratio). The 3-year survival ratios for gross and net Asbestos loss and ALAE reserves were 4.5 years and 5.2 years, respectively. The 3-year survival ratios for gross and net Environmental loss and ALAE reserves were 4.3 years and 4.4 years, respectively. The survival ratios provide only a very rough depiction of reserves and are significantly impacted by a number of factors such as aggressive settlement practices, variations in gross to ceded relationships within the asbestos or environmental claims, and levels of coverage provided. We, therefore, urge caution in using these very simplistic ratios to gauge reserve adequacy.
Catastrophe Management
We actively monitor and manage our catastrophe risk accumulation around the world. The table below presents our modeled pre-tax estimates of natural catastrophe probable maximum loss (PML), net of reinsurance, for Worldwide, U.S. hurricane and California earthquake events as of
December 31, 2017
. For example, according to the model, for the 1-in-100 return period scenario, there is a one percent chance that our losses incurred in any year from U.S. hurricane events could be in excess of
$2,889
million (or
5.6
percent of our total shareholders’ equity at
December 31, 2017
).
|
Modeled Net PML
|
||||||||||||||||||||
|
|
Worldwide
(1)
|
U.S. Hurricane
|
California Earthquake
|
|||||||||||||||||
|
Annual Aggregate
|
Annual Aggregate
|
Single Occurrence
|
||||||||||||||||||
|
(in millions of U.S. dollars, except for percentages)
|
Chubb
|
% of Total
Shareholders’ Equity |
Chubb
|
% of Total
Shareholders’ Equity |
Chubb
|
% of Total
Shareholders’ Equity |
||||||||||||||
|
1-in-10
|
$
|
2,033
|
|
4.0
|
%
|
$
|
1,166
|
|
2.3
|
%
|
$
|
366
|
|
0.7
|
%
|
|||||
|
1-in-100
|
$
|
4,450
|
|
8.7
|
%
|
$
|
2,889
|
|
5.6
|
%
|
$
|
1,395
|
|
2.7
|
%
|
|||||
|
1-in-250
|
$
|
7,267
|
|
14.2
|
%
|
$
|
5,144
|
|
10.1
|
%
|
$
|
1,495
|
|
2.9
|
%
|
|||||
(1)
Worldwide losses are comprised of losses arising only from hurricanes, typhoons, convective storms and earthquakes and do not include “non-modeled” perils such as wildfire and flood.
The above modeled loss information at
December 31, 2017
reflects our in-force portfolio at October 1, 2017. The
December 31, 2017
modeled loss information reflects the April 1, 2017 reinsurance program (see Natural Catastrophe Property Reinsurance Program section) as well as inuring reinsurance protection coverages. Included in the loss estimates for hurricane and earthquake are estimates for losses arising from storm-surge and fire-following perils respectively.
The above estimates of Chubb’s loss profile are inherently uncertain owing to key assumptions. First, while the use of third-party catastrophe modeling packages to simulate potential hurricane and earthquake losses is prevalent within the insurance industry, the models are reliant upon significant meteorology, seismology, and engineering assumptions to estimate catastrophe losses. In particular, modeled catastrophe events are not always a representation of actual events and ensuing additional loss potential. Second, there is no universal standard in the preparation of insured data for use in the models, the running of the modeling software and interpretation of loss output. These loss estimates do not represent our potential maximum exposures and it is highly likely that our actual incurred losses would vary materially from the modeled estimates.
85
Natural Catastrophe Property Reinsurance Program
Chubb’s core property catastrophe reinsurance program provides protection against natural catastrophes impacting its primary property operations (i.e., excluding our Global Reinsurance and Life Insurance segments).
We regularly review our reinsurance protection and corresponding property catastrophe exposures. This may or may not lead to the purchase of additional reinsurance prior to a program’s renewal date. In addition, prior to each renewal date, we consider how much, if any, coverage we intend to buy and we may make material changes to the current structure in light of various factors, including modeled PML assessment at various return periods, reinsurance pricing, our risk tolerance and exposures, and various other structuring considerations.
Chubb renewed its Global Property Catastrophe Reinsurance Program for our North American and International operations effective April 1, 2017 through March 31, 2018, with no significant change in coverage from the expiring program. The program consists of three layers in excess of losses retained by Chubb. In addition, Chubb also renewed its terrorism coverage (excluding nuclear, biological, chemical and radiation coverage, with an inclusion of coverage for biological and chemical coverage for personal lines) for the United States from April 1, 2017 through March 31, 2018 with the same limits and retention and percentage placed except that the majority of terrorism coverage is on an aggregate basis above our retentions without a reinstatement.
|
Loss Location
|
Layer of Loss
|
Comments
|
Notes
|
||
|
United States
(excluding Alaska and Hawaii) |
$0 million
–
$1.0 billion
|
Losses retained by Chubb
|
(a)
|
||
|
United States
(excluding Alaska and Hawaii) |
$1.0 billion
–
$1.25 billion
|
All natural perils and terrorism
|
(b)
|
||
|
United States
(excluding Alaska and Hawaii) |
$1.25 billion
–
$2.0 billion
|
All natural perils and terrorism
|
(c)
|
||
|
United States
(excluding Alaska and Hawaii) |
$2.0 billion
–
$3.5 billion
|
All natural perils and terrorism
|
(d)
|
||
|
International
(including Alaska and Hawaii) |
$0 million
–
$175 million
|
Losses retained by Chubb
|
(a)
|
||
|
International
(including Alaska and Hawaii) |
$175 million
–
$925 million
|
All natural perils and terrorism
|
(c)
|
||
|
Alaska, Hawaii, and Canada
|
$925 million
–
$2.425 billion
|
All natural perils and terrorism
|
(d)
|
||
|
(a)
Ultimate retention will depend upon the nature of the loss and the interplay between the underlying per risk programs and certain other catastrophe programs purchased by individual business units. These other catastrophe programs have the potential to reduce our effective retention below the stated levels.
|
|
(b)
These coverages are 20 percent placed with Reinsurers.
|
|
(c)
These coverages are both part of the same Second layer within the Global Catastrophe Program and are 100 percent placed with Reinsurers. As such, it may be exhausted in one region and not available in the other.
|
|
(d)
These coverages are both part of the same Third layer within the Global Catastrophe Program and are 100 percent placed with Reinsurers. As such, it may be exhausted in one region and not available in the other.
|
Chubb also has two series of property catastrophe bonds in place (assumed as part of the Chubb Corp acquisition) that offer additional natural catastrophe protection for certain parts of the portfolio. The geographic scope of this coverage is from Virginia through Maine. The East Lane VI 2014 series currently provides $270 million of coverage as part of a $300 million layer in excess of $2,660 million retention through March 14, 2018. The East Lane VI 2015 series currently provides $250 million of coverage as part of a $408 million layer in excess of $2,014 million retention through March 13, 2020.
86
Political Risk and Credit Insurance
Political risk insurance is a specialized coverage that provides clients with protection against unexpected, catastrophic political or macroeconomic events, primarily in developing markets. We participate in this market through our wholly-owned subsidiary Sovereign Risk Insurance Ltd. (Sovereign), and through a unit of our London-based CGM operation. Chubb is one of the world's leading underwriters of political risk and credit insurance and has a global portfolio spread across more than 150 countries, and is also a member of the Berne Union. Our clients include financial institutions, national export credit agencies, leading multilateral agencies, and multinational corporations. CGM writes political risk and credit insurance business out of underwriting offices in London, United Kingdom; Hamburg, Germany; Sao Paulo, Brazil; Singapore; Tokyo, Japan; and in the U.S. in the following locations: Chicago, Illinois; New York, New York; and Los Angeles, California.
Our political risk insurance provides protection to commercial lenders against defaults on cross border loans, insulates investors against equity losses, and protects exporters against defaults on contracts. Commercial lenders, our largest client segment, are covered for missed scheduled loan repayments due to acts of confiscation, expropriation or nationalization by the host government, currency inconvertibility or exchange transfer restrictions, or war or other acts of political violence. In addition, in the case of loans to government-owned entities or loans that have a government guarantee, political risk policies cover scheduled payments against risks of non-payment or non-honoring of government guarantees. Equity investors and corporations receive similar coverage to that of lenders, except they are protected against financial losses, inability to repatriate dividends, and physical damage to their operations caused by covered events. Our export contracts protection provides coverage for both exporters and their financing banks against the risk of contract frustration due to government actions, including non-payment by government entities.
CGM's credit insurance businesses cover losses due to insolvency, protracted default, and political risk perils including export and license cancellation. Our credit insurance product provides coverage to larger companies that have sophisticated credit risk management systems, with exposure to multiple customers and that have the ability to self-insure losses up to a certain level through excess of loss coverage. It also provides coverage to trade finance banks, exporters, and trading companies, with exposure to trade-related financing instruments.
We have implemented structural features in our policies in order to control potential losses within the political risk and credit insurance businesses. These include basic loss sharing features that include co-insurance and deductibles, and in the case of trade credit, the use of non-qualifying losses that drop smaller exposures deemed too difficult to assess. Ultimate loss severity is also limited by using waiting periods to enable the insurer and insured to agree on recovery strategies, and the subrogation of the rights of the lender/exporter to the insurer following a claim. We have the option to pay claims over the original loan payment schedule, rather than in a lump sum in order to provide insureds and the insurer additional time to remedy problems and work towards full recoveries. It is important to note that political risk and credit policies are named peril conditional contracts, not financial guarantees, and claims are only paid after conditions and warranties are fulfilled. Political risk and credit insurance do not cover currency devaluations, bond defaults, movements in overseas equity markets, transactions deemed illegal, situations where corruption or misrepresentation has occurred, or debt that is not legally enforceable. In addition to assessing and mitigating potential exposure on a policy-by-policy basis, we also have specific risk management measures in place to manage overall exposure and risk. These measures include placing country, credit, and individual transaction limits based on country risk and credit ratings, combined single loss limits on multi-country policies, the use of reinsurance protection, and regular modeling and stress-testing of the portfolio. We have a dedicated Country and Credit Risk management team that are responsible for the portfolio.
Crop Insurance
We are, and have been since the 1980s, one of the leading writers of crop insurance in the U.S. and have conducted that business through a managing general agent subsidiary of Rain and Hail. We provide protection throughout the U.S. on a variety of crops and are therefore geographically diversified, which reduces the risk of exposure to a single event or a heavy accumulation of losses in any one region. Our crop insurance business comprises two components – Multiple Peril Crop Insurance (MPCI) and crop-hail insurance.
The MPCI program is offered in conjunction with the U.S. Department of Agriculture (USDA). The policies cover revenue shortfalls or production losses due to natural causes such as drought, excessive moisture, hail, wind, frost, insects, and disease. Generally, policies have deductibles ranging from 10 percent to 50 percent of the insured's risk. The USDA's Risk Management
87
Agency (RMA) sets the policy terms and conditions, rates and forms, and is also responsible for setting compliance standards. As a participating company, we report all details of policies underwritten to the RMA and are party to a Standard Reinsurance Agreement (SRA). The SRA sets out the relationship between private insurance companies and the Federal Crop Insurance Corporation (FCIC) concerning the terms and conditions regarding the risks each will bear including the pro-rata and state stop-loss provisions which allows companies to limit the exposure of any one state or group of states on their underwriting results. In addition to the pro-rata and excess of loss reinsurance protections inherent in the SRA, we also purchase third-party proportional and stop-loss reinsurance for our MPCI business to reduce our exposure. We may also enter into crop derivative contracts to further manage our risk exposure.
Each year the RMA issues a final SRA for the subsequent reinsurance year. In June
2017
, the RMA released the 2018 SRA which establishes the terms and conditions for the 2018 reinsurance year (i.e., July 1, 2017 through June 30, 2018) that replaced the
2017
SRA. There were no significant changes in the terms and conditions, and therefore the new SRA does not impact Chubb's outlook on the crop program relative to 2018.
On the MPCI business, we recognize net premiums written as soon as estimable, which is generally when we receive acreage reports from the policyholders on the various crops throughout the U.S. This allows us to best determine the premium associated with the liability that is being planted. The MPCI program has specific timeframes as to when producers must report acreage to us and in certain cases, the reporting occurs after the close of the respective reinsurance year. Once the net premium written has been recorded, the premium is then earned over the growing season for the crops. A majority of the crops that are covered in the program are typically subject to the SRA in effect at the beginning of the year. Given the major crops covered in the program, we typically see a substantial written and earned premium impact in the second and third quarters.
The pricing of MPCI premium is determined using a number of factors including commodity prices and related volatility. For instance, in most states the pricing for the MPCI Revenue Product for corn includes a factor that is based on the average price in February of the Chicago Board of Trade December corn futures. To the extent that the corn commodity prices are higher in February than they were in the previous February, and all other factors are the same, the increase in corn prices will increase the corn premium year over year.
Our crop-hail program is a private offering. Premium is earned on the crop-hail program over the coverage period of the policy. Given the very short nature of the growing season, most crop-hail business is typically written in the second and third quarters with the earned premium also more heavily occurring during this time frame. We use industry data to develop our own rates and forms for the coverage offered. The policy primarily protects farmers against yield reduction caused by hail and/or fire, and related costs such as transit to storage. We offer various deductibles to allow the grower to partially self-insure for a reduced premium cost. We limit our crop-hail exposures through the use of township liability limits and third-party proportional and stop-loss reinsurance on our net retained hail business.
Liquidity
Liquidity is a measure of a company's ability to generate cash flows sufficient to meet short-term and long-term cash requirements. As a holding company, Chubb Limited possesses assets that consist primarily of the stock of its subsidiaries and other investments. In addition to net investment income, Chubb Limited's cash flows depend primarily on dividends or other statutorily permissible payments. Historically, these dividends and other payments have come primarily from Chubb's Bermuda-based operating subsidiaries, which we refer to as our Bermuda subsidiaries. Our consolidated sources of funds consist primarily of net premiums written, fees, net investment income, and proceeds from sales and maturities of investments. Funds are used at our various companies primarily to pay claims, operating expenses, and dividends, to service debt, to purchase investments, and to fund acquisitions.
We anticipate that positive cash flows from operations (underwriting activities and investment income) should be sufficient to cover cash outflows under most loss scenarios for the near term. Should the need arise, we generally have access to capital markets and available credit facilities.
Refer to “Credit Facilities” below for additional information. Our access to funds under the existing credit facility is dependent on the ability of the bank that is a party to the facility to meet its funding commitments. Should our existing credit provider experience financial difficulty, we may be required to replace credit sources, possibly in a difficult market. If we cannot obtain adequate capital or sources of credit on favorable terms, on a timely basis, or at all, our business, operating results, and financial condition could be adversely affected. To date, we have not experienced difficulty accessing our credit facility
.
To further ensure the sufficiency of funds to settle unforeseen claims, we hold certain invested assets in cash and short-term
88
investments. In addition, for certain insurance, reinsurance, or deposit contracts that tend to have relatively large and reasonably predictable cash outflows, we attempt to establish dedicated portfolios of assets that are duration-matched with the related liabilities. With respect to the duration of our overall investment portfolio, we manage asset durations to both maximize return given current market conditions and provide sufficient liquidity to cover future loss payments. All things being equal, in a low interest rate environment, the overall duration of our fixed maturities tends to be shorter and in a high interest rate environment, such duration tends to be longer. At
December 31, 2017
, the average duration of our fixed maturities (
4.2
years) is less than the average expected duration of our insurance liabilities (
4.3
years).
Despite our safeguards, if paid losses accelerate beyond our ability to fund such paid losses from current operating cash flows, we might need to either liquidate a portion of our investment portfolio or arrange for financing. Potential events causing such a liquidity strain could include several significant catastrophes occurring in a relatively short period of time, large uncollectible reinsurance recoverables on paid losses (as a result of coverage disputes, reinsurers' credit problems, or decreases in the value of collateral supporting reinsurance recoverables) or increases in collateral postings under our variable annuity reinsurance business. Because each subsidiary focuses on a more limited number of specific product lines than is collectively available from the Chubb Group of Companies, the mix of business tends to be less diverse at the subsidiary level. As a result, the probability of a liquidity strain, as described above, may be greater for individual subsidiaries than when liquidity is assessed on a consolidated basis. If such a liquidity strain were to occur in a subsidiary, we could be required to liquidate a portion of our investments, potentially at distressed prices, as well as be required to contribute capital to the particular subsidiary and/or curtail dividends from the subsidiary to support holding company operations.
The payment of dividends or other statutorily permissible distributions from our operating companies are subject to the laws and regulations applicable to each jurisdiction, as well as the need to maintain capital levels adequate to support the insurance and reinsurance operations, including financial strength ratings issued by independent rating agencies. During
2017
, we were able to meet all of our obligations, including the payments of dividends on our Common Shares, with our net cash flows.
We assess which subsidiaries to draw dividends from based on a number of factors. Considerations such as regulatory and legal restrictions as well as the subsidiary's financial condition are paramount to the dividend decision. Chubb Limited received dividends of $450 million and
$1.0 billion
from its Bermuda subsidiaries in 2017 and 2016, respectively.
The payment of any dividends from CGM or its subsidiaries is subject to applicable U.K. insurance laws and regulations. In addition, the release of funds by Syndicate 2488 to subsidiaries of CGM is subject to regulations promulgated by the Society of Lloyd's. Chubb Limited received no dividends from CGM in
2017
and
2016
.
The U.S. insurance subsidiaries of Chubb INA may pay dividends, without prior regulatory approval, subject to restrictions set out in state law of the subsidiary's domicile (or, if applicable, commercial domicile). Chubb INA's international subsidiaries are also subject to insurance laws and regulations particular to the countries in which the subsidiaries operate. These laws and regulations sometimes include restrictions that limit the amount of dividends payable without prior approval of regulatory insurance authorities. Chubb Limited received no dividends from Chubb INA in
2017
and
2016
. Debt issued by Chubb INA is serviced by statutorily permissible distributions by Chubb INA's insurance subsidiaries to Chubb INA as well as other group resources. Chubb INA received dividends of $2.1 billion and $1.8 billion from its subsidiaries in
2017
and
2016
, respectively. At December 31, 2017, the amount of dividends available to be paid to Chubb INA in 2018 from its subsidiaries without prior approval of insurance regulatory authorities totals $3.3 billion.
Chubb INA received $1.0 billion in capital contributions from Chubb Limited and $4.2 billion from Chubb Group Holdings during 2016. Chubb INA did not receive any capital contributions in 2017.
Cash Flows
Our insurance and reinsurance operations provide liquidity in that premiums are received in advance, sometimes substantially in advance, of the time claims are paid. Generally, cash flows are affected by claim payments that, due to the nature of our operations, may comprise large loss payments on a limited number of claims and which can fluctuate significantly from period to period. The irregular timing of these loss payments can create significant variations in cash flows from operations between periods. Refer to “Contractual Obligations and Commitments” for our estimate of future claim payments by period. Sources of liquidity include cash from operations, routine sales of investments, and financing arrangements. The following is a discussion of our cash flows for
2017
,
2016
, and 2015.
Operating cash flows reflect Net income for each period, adjusted for non-cash items and changes in working capital.
89
Operating cash flows were
$4.5
billion in
2017
, compared to
$5.3 billion
and
$3.9 billion
in
2016
and 2015, respectively. Operating cash flow was lower in 2017 compared to 2016 principally reflecting higher claims paid, principally due to the significant catastrophe losses in the year. The increase in operating cash flows of $1.4 billion in
2016
compared to
2015
was primarily due to cash flow contributions from legacy Chubb Corp operations, partially offset by integration expenses paid, higher interest paid on long-term debt, and higher taxes paid.
Cash used for investing was
$2.4
billion in
2017
, compared to
$5.3
billion and $
6.3
billion in
2016
and 2015, respectively. Cash used for investing in 2017 was lower compared to 2016 which included cash paid for the purchase of Chubb Corp of $14.3 billion, largely funded by sales in our investment portfolio, including net proceeds in short-term investments. Cash used for investing in 2015 included an increase in short-term investments to fund the Chubb Corp acquisition.
Cash (used for) from financing was
$(2.3) billion
in
2017
, compared to $
(742) million
in
2016
, and $
3.7 billion
in
2015
. Cash used for financing was higher by $1.6 billion in
2017
compared to 2016 principally reflecting
$501 million
of repayments of long-term debt and $
801 million
of share repurchases. Cash from financing in 2015 included $4.9 billion of net proceeds from the issuance of long-term debt (net of repayments) partially offset by $862 million of dividends paid on Common Shares and $758 million of share repurchases.
Both internal and external forces influence our financial condition, results of operations, and cash flows. Claim settlements, premium levels, and investment returns may be impacted by changing rates of inflation and other economic conditions. In many cases, significant periods of time, ranging up to several years or more, may lapse between the occurrence of an insured loss, the reporting of the loss to us, and the settlement of the liability for that loss.
In the current low interest rate environment, we use repurchase agreements as a low-cost funding alternative. At
December 31, 2017
, there were $
1.4 billion
in repurchase agreements outstanding with various maturities over the next 7 months.
In addition to cash from operations, routine sales of investments, and financing arrangements, we have agreements with a third-party bank provider which implemented two international multi-currency notional cash pooling programs to enhance cash management efficiency during periods of short-term timing mismatches between expected inflows and outflows of cash by currency. The programs allow us to optimize investment income by avoiding portfolio disruption. In each program, participating Chubb entities establish deposit accounts in different currencies with the bank provider. Each day the credit or debit balances in every account are notionally translated into a single currency (U.S. dollars) and then notionally pooled. The bank extends overdraft credit to all participating Chubb entities as needed, provided that the overall notionally pooled balance of all accounts in each pool at the end of each day is at least zero. Actual cash balances are not physically converted and are not commingled between legal entities. Chubb entities may incur overdraft balances as a means to address short-term liquidity needs. Any overdraft balances incurred under this program by a Chubb entity would be guaranteed by Chubb Limited (up to
$300 million
in the aggregate). Our syndicated letter of credit facility allows for same day drawings to fund a net pool overdraft should participating Chubb entities withdraw contributed funds from the pool.
Capital Resources
Capital resources consist of funds deployed or available to be deployed to support our business operations.
|
December 31
|
|
December 31
|
|
||||
|
(in millions of U.S. dollars, except for percentages)
|
2017
|
|
2016
|
|
|||
|
Short-term debt
|
$
|
1,013
|
|
$
|
500
|
|
|
|
Long-term debt
|
11,556
|
|
12,610
|
|
|||
|
Total financial debt
|
12,569
|
|
13,110
|
|
|||
|
Trust preferred securities
|
308
|
|
308
|
|
|||
|
Total shareholders’ equity
|
51,172
|
|
48,275
|
|
|||
|
Total capitalization
|
$
|
64,049
|
|
$
|
61,693
|
|
|
|
Ratio of financial debt to total capitalization
|
19.6
|
%
|
21.3
|
%
|
|||
|
Ratio of financial debt plus trust preferred securities to total capitalization
|
20.1
|
%
|
21.8
|
%
|
|||
Repurchase agreements are excluded from the table above and are disclosed separately from short-term debt in the Consolidated balance sheets. The repurchase agreements are collateralized borrowings where we maintain the right and ability
90
to redeem the collateral on short notice, unlike short-term debt which comprises the current maturities of our long-term debt instruments.
Included in the debt obligations are junior subordinated capital securities of $1.0 billion. Prior to April 15, 2017, these securities carried a fixed interest rate of 6.375 percent. Effective April 15, 2017, these securities bear interest at a rate equal to the three-month LIBOR plus 2.25 percentage points. The current interest rate at the time of this filing on these securities is 3.97 percent. The scheduled maturity date for these securities is April 15, 2037.
We believe our financial strength provides us with the flexibility and capacity to obtain available funds externally through debt or equity financing on both a short-term and long-term basis. Our ability to access the capital markets is dependent on, among other things, market conditions and our perceived financial strength. We have accessed both the debt and equity markets from time to time. We generally maintain the ability to issue certain classes of debt and equity securities via an unlimited SEC shelf registration which is renewed every three years. This allows us capital market access for refinancing as well as for unforeseen or opportunistic capital needs. We have an unlimited shelf registration which allows us to issue certain classes of debt and equity. This shelf registration expires in October 2018.
Securities Repurchases
From time to time, we repurchase shares as part of our capital management program. Our Board of Directors has authorized share repurchase programs as follows:
|
•
|
$1.5 billion of Chubb Common Shares from January 1, 2015 through December 31, 2015
|
|
•
|
$1.0 billion of Chubb Common Shares from November 17, 2016 through December 31, 2017
|
|
•
|
$1.0 billion of Chubb Common Shares from January 1, 2018 through December 31, 2018.
|
Share repurchases may be made in the open market, in privately negotiated transactions, block trades, accelerated repurchases and/or through option or other forward transactions. In 2015, we repurchased
$734 million
of Common Shares in a series of open market transactions under the Board share repurchase authorization. There were no share repurchases in 2016. In 2017, we repurchased $
830 million
of Common Shares in a series of open market transactions under the Board share repurchase authorization.
Common Shares
Our Common Shares had a par value of CHF
24.15
each at
December 31, 2017
.
As of
December 31, 2017
, there were
15,950,685
Common Shares in treasury with a weighted average cost of
$121.85
per share.
Under Swiss law, dividends must be stated in Swiss francs though dividend payments are made by Chubb in U.S. dollars.
At our May 2016 annual general meeting, our shareholders approved an annual dividend for the following year of up to
$2.76
per share, which was paid in four quarterly installments of $
0.69
per share at dates determined by the Board after the annual general meeting by way of a distribution from capital contribution reserves, transferred to free reserves for payment.
At our May 2017 annual general meeting, our shareholders approved an annual dividend for the following year of up to
$2.84
per share, expected to be paid in four quarterly installments of
$0.71
per share after the annual general meeting by way of distribution from capital contribution reserves, transferred to free reserves for payment. The Board will determine the record and payment dates at which the annual dividend may be paid until the date of the 2018 annual general meeting, and is authorized to abstain from distributing a dividend at its discretion. The first three quarterly installments each of $
0.71
per share, have been distributed by the Board as expected.
Dividend distributions on Common Shares amounted to CHF
2.76
(
$2.82
) per share for the year ended December 31, 2017. Refer to Note 11 to the Consolidated Financial Statements for additional information on our dividends.
91
Contractual Obligations and Commitments
The following table presents our future payments due by period under contractual obligations at
December 31, 2017
:
|
Payments Due By Period
|
|||||||||||||||||||
|
2019
|
|
2021
|
|
||||||||||||||||
|
(in millions of U.S. dollars)
|
Total
|
|
2018
|
|
and 2020
|
|
and 2022
|
|
Thereafter
|
|
|||||||||
|
Payment amounts determinable from the respective contracts
|
|||||||||||||||||||
|
Deposit liabilities
(1)
|
$
|
1,872
|
|
$
|
20
|
|
$
|
33
|
|
$
|
46
|
|
$
|
1,773
|
|
||||
|
Purchase obligations
(2)
|
641
|
|
209
|
|
290
|
|
142
|
|
—
|
|
|||||||||
|
Investments, including Limited Partnerships
(3)
|
5,081
|
|
1,728
|
|
1,576
|
|
1,111
|
|
666
|
|
|||||||||
|
Operating leases
|
900
|
|
181
|
|
286
|
|
203
|
|
230
|
|
|||||||||
|
Repurchase agreements
|
1,408
|
|
1,408
|
|
—
|
|
—
|
|
—
|
|
|||||||||
|
Short-term debt
|
1,000
|
|
1,000
|
|
—
|
|
—
|
|
—
|
|
|||||||||
|
Long-term debt
|
11,260
|
|
—
|
|
1,810
|
|
1,000
|
|
8,450
|
|
|||||||||
|
Trust preferred securities
|
309
|
|
—
|
|
—
|
|
—
|
|
309
|
|
|||||||||
|
Interest on debt obligations
(4)
|
7,044
|
|
516
|
|
926
|
|
851
|
|
4,751
|
|
|||||||||
|
Total obligations in which payment amounts are determinable from the respective contracts
|
29,515
|
|
5,062
|
|
4,921
|
|
3,353
|
|
16,179
|
|
|||||||||
|
Payment amounts not determinable from the respective contracts
|
|||||||||||||||||||
|
Estimated gross loss payments under insurance and reinsurance contracts
|
63,202
|
|
17,139
|
|
17,559
|
|
8,859
|
|
19,645
|
|
|||||||||
|
Estimated payments for future policy benefits
|
19,939
|
|
943
|
|
1,786
|
|
1,595
|
|
15,615
|
|
|||||||||
|
Total contractual obligations and commitments
|
$
|
112,656
|
|
$
|
23,144
|
|
$
|
24,266
|
|
$
|
13,807
|
|
$
|
51,439
|
|
||||
|
(1)
|
Refer to Note 1 k) to the Consolidated Financial Statements.
|
|
(2)
|
Primarily comprises audit fees and agreements with vendors to purchase system software administration and maintenance services.
|
|
(3)
|
Funding commitment primarily related to limited partnerships. The timing of the payments of these commitments is uncertain and may differ from the estimated timing in the table.
|
|
(4)
|
Included in the debt obligations are junior subordinated capital securities of $1.0 billion, these securities bear interest at a rate equal to the three-month LIBOR plus 2.25 percentage points. For purposes of the above table, interest from January 1, 2018 through January 15, 2018, was calculated at a rate of 3.609 percent. Interest after January 15, 2018 is calculated using the three-month LIBOR rate as of January 12, 2018 plus 2.25 percentage points totaling 3.972 percent. The scheduled maturity date for these securities is April 15, 2037. Interest payments for the period from the scheduled maturity date through the final maturity date, March 29, 2067, would increase the contractual obligation by $1,207 million.
|
The above table excludes the following items:
|
•
|
Pension obligations: Minimum funding requirements for our pension obligations are immaterial. Subsequent funding commitments are apt to vary due to many factors and are difficult to estimate at this time. Refer to Note
13
to the Consolidated Financial Statements for additional information.
|
|
•
|
Liabilities for unrecognized tax benefits: The liability for unrecognized tax benefits, excluding interest, was
$13 million
at
December 31, 2017
. We recognize accruals for interest and penalties, if any, related to unrecognized tax benefits in Income tax expense in the Consolidated statements of operations. At
December 31, 2017
, we had
$3 million
in liabilities for income tax-related interest and penalties in our Consolidated balance sheets. We are unable to make a reasonably reliable estimate for the timing of cash settlement with respect to these liabilities. Refer to Note
8
to the Consolidated Financial Statements for additional information.
|
We have no other significant contractual obligations or commitments not reflected in the table above. We do not have any off-balance sheet arrangements that are reasonably likely to have a material effect on our financial condition, changes in financial condition, revenues or expenses, results of operations, liquidity, capital expenditures, or capital resources.
Estimated gross loss payments under insurance and reinsurance contracts
We are obligated to pay claims under insurance and reinsurance contracts for specified loss events covered under those contracts. Such loss payments represent our most significant future payment obligation as a P&C insurance and reinsurance company. In contrast to other contractual obligations, cash payments are not determinable from the terms specified within the
92
contract. For example, we do not ultimately make a payment to our counterparty for many insurance and reinsurance contracts (i.e., when a loss event has not occurred) and if a payment is to be made, the amount and timing cannot be determined from the contract. In the table above, we estimate payments by period relating to our gross liability for unpaid losses and loss expenses included in the Consolidated balance sheet at
December 31, 2017
, and do not take into account reinsurance recoverable. These estimated loss payments are inherently uncertain and the amount and timing of actual loss payments are likely to differ from these estimates and the differences could be material. Given the numerous factors and assumptions involved in both estimates of loss and loss expense reserves and related estimates as to the timing of future loss and loss expense payments in the table above, differences between actual and estimated loss payments will not necessarily indicate a commensurate change in ultimate loss estimates. The liability for Unpaid losses and loss expenses presented in our balance sheet is discounted for certain structured settlements for which the timing and amount of future claim payments are reliably determinable and certain reserves for unsettled claims that are discounted in statutory filings. Accordingly, the estimated amounts in the table exceed the liability for Unpaid losses and loss expenses presented in our balance sheet. Refer to Note 1 h) to the Consolidated Financial Statements for additional information.
Estimated payments for future policy benefits
We establish reserves for future policy benefits for life, long-term health, and annuity contracts. The amounts in the table are gross of fees or premiums due from the underlying contracts. The liability for Future policy benefits for life, long-term health, and annuity contracts presented in our balance sheet is discounted and reflected net of fees or premiums due from the underlying contracts. Accordingly, the estimated amounts in the table exceed the liability for Future policy benefits presented in our balance sheet. Payment amounts related to these reserves must be estimated and are not determinable from the contract. Due to the uncertainty with respect to the timing and amount of these payments, actual results could materially differ from the estimates in the table.
Credit Facilities
As our Bermuda subsidiaries are non-admitted insurers and reinsurers in the U.S., the terms of certain U.S. insurance and reinsurance contracts require them to provide collateral, which can be in the form of letters of credit (LOCs). LOCs may also be used for general corporate purposes.
On October 25, 2017, we entered into a credit facility that provides for up to $1.0 billion of availability, all of which may be used for the issuance of LOC and for revolving loans. We have the ability to increase the capacity to $2.0 billion under certain conditions, but any such increase would not raise the sub-limit for revolving loans above $1.0 billion. Our existing credit facility has a remaining term expiring in October 2022. At December 31, 2017, our LOC usage was $250 million.
Our access to funds under an existing credit facility is dependent on the ability of the banks that are a party to the facility to meet their funding commitments. In the event that such credit support is insufficient, we could be required to provide alternative security to clients. This could take the form of additional insurance trusts supported by our investment portfolio or funds withheld using our cash resources. The value of LOCs required is driven by, among other things, statutory liabilities reported by variable annuity guarantee reinsurance clients, loss development of existing reserves, the payment pattern of such reserves, the expansion of business, and loss experience of such business.
The facility noted above requires that we maintain certain covenants, all of which have been met at
December 31, 2017
. These covenants include:
|
(i)
|
a minimum consolidated net worth of not less than $34.985 billion; and
|
|
(ii)
|
a ratio of consolidated debt to total capitalization of not greater than 0.35 to 1.
|
At
December 31, 2017
, (a) the minimum consolidated net worth requirement under the covenant described in (i) above was $34.985 billion and our actual consolidated net worth as calculated under that covenant was $50.6 billion and (b) our ratio of debt to total capitalization, as calculated under the covenant which excludes the fair value adjustment of debt acquired through the Chubb Corp acquisition, was 0.19 to 1, which is below the maximum debt to total capitalization ratio of 0.35 to 1 as described in (ii) above.
Our failure to comply with the covenants under any credit facility would, subject to grace periods in the case of certain covenants, result in an event of default. This could require us to repay any outstanding borrowings or to cash collateralize LOCs
93
under such facility. Our failure to repay material financial obligations, as well as our failure with respect to certain other events expressly identified, would result in an event of default under the facility.
Should our existing credit provider experience financial difficulty, we may be required to replace credit sources, possibly in a difficult market. If we cannot obtain adequate capital or sources of credit on favorable terms, on a timely basis, or at all, our business, operating results, and financial condition could be adversely affected. To date, we have not experienced difficulty accessing our credit facility.
Ratings
Chubb Limited and its subsidiaries are assigned credit and financial strength (insurance) ratings from internationally recognized rating agencies, including S&P, A.M. Best, Moody's, and Fitch. The ratings issued on our companies by these agencies are announced publicly and are available directly from the agencies. Our Internet site (investors.chubb.com, under Shareholder Resources/Rating Agency Ratings) also contains some information about our ratings, but such information on our website is not incorporated by reference into this report.
Financial strength ratings reflect the rating agencies' opinions of a company's claims paying ability. Independent ratings are one of the important factors that establish our competitive position in the insurance markets. The rating agencies consider many factors in determining the financial strength rating of an insurance company, including the relative level of statutory surplus necessary to support the business operations of the company. These ratings are based upon factors relevant to policyholders, agents, and intermediaries and are not directed toward the protection of investors. Such ratings are not recommendations to buy, sell, or hold securities.
Credit ratings assess a company's ability to make timely payments of principal and interest on its debt.
It is possible that, in the future, one or more of the rating agencies may reduce our existing ratings. If one or more of our ratings were downgraded, we could incur higher borrowing costs, and our ability to access the capital markets could be impacted. In addition, our insurance and reinsurance operations could be adversely impacted by a downgrade in our financial strength ratings, including a possible reduction in demand for our products in certain markets. Also, we have insurance and reinsurance contracts which contain rating triggers. In the event the S&P or A.M. Best financial strength ratings of Chubb fall, we may be faced with the cancellation of premium or be required to post collateral on our underlying obligation associated with this premium. We estimate that at
December 31, 2017
, a one-notch downgrade of our S&P or A.M. Best financial strength ratings would result in an immaterial loss of premium or requirement for collateral to be posted.
Market Sensitive Instruments and Risk Management
Market risk represents the potential for loss due to adverse changes in the fair value of financial instruments. We are exposed to potential losses from various market risks including changes in interest rates, equity prices, and foreign currency exchange rates. Further, through writing the GLB and GMDB products, we are exposed to volatility in the equity and credit markets, as well as interest rates. Our investment portfolio consists primarily of fixed income securities, denominated in both U.S. dollars and foreign currencies, which are sensitive to changes in interest rates and foreign currency exchange rates. The majority of our fixed income portfolio is classified as available for sale. The effect of market movements on our available for sale investment portfolio impacts Net income (through Net realized gains (losses)) when securities are sold or when we record an OTTI charge in Net income. Changes in interest rates and foreign currency exchange rates will have an immediate effect on Shareholders' equity and Comprehensive income and in certain instances, Net income. From time to time, we also use derivative instruments such as futures, options, swaps, and foreign currency forward contracts to manage the duration of our investment portfolio and foreign currency exposures and also to obtain exposure to a particular financial market. At
December 31, 2017
and
2016
, our notional exposure to derivative instruments was
$4.8 billion
and $6.2 billion, respectively. These instruments are recognized as assets or liabilities in our consolidated financial statements and are sensitive to changes in interest rates, foreign currency exchange rates, and equity security prices. As part of our investing activities, we from time to time purchase to be announced mortgage backed securities (TBAs). Changes in the fair value of TBAs are included in Net realized gains (losses) and therefore, have an immediate effect on both our Net income and Shareholders' equity.
94
We seek to mitigate market risk using a number of techniques, including maintaining and managing the assets and liabilities of our international operations consistent with the foreign currencies of the underlying insurance and reinsurance businesses, thereby limiting exchange rate risk to net assets denominated in foreign currencies.
The following is a discussion of our primary market risk exposures at
December 31, 2017
. Our policies to address these risks in
2017
were not materially different from
2016
. We do not currently anticipate significant changes in our primary market risk exposures or in how those exposures are managed in future reporting periods based upon what is known or expected to be in effect in future reporting periods.
Interest rate risk – fixed income portfolio and debt obligations
Our fixed income portfolio and debt obligations have exposure to interest rate risk. Changes in investment values attributable to interest rate changes are mitigated by corresponding and partially offsetting changes in the economic value of our insurance reserves and debt obligations. We monitor this exposure through periodic reviews of our asset and liability positions.
The following table presents the impact at
December 31, 2017
and
2016
, on the fair value of our fixed income portfolio of a hypothetical increase in interest rates of 100 bps applied instantly across the U.S. yield curve (an immediate time horizon was used as this presents the worst case scenario):
|
(in billions of U.S. dollars, except for percentages)
|
2017
|
|
2016
|
|
||||
|
Fair value of fixed income portfolio
|
$
|
97.0
|
|
$
|
93.8
|
|
||
|
Pre-tax impact of 100 bps increase in interest rates:
|
||||||||
|
Decrease in dollars
|
$
|
4.1
|
|
$
|
3.9
|
|
||
|
As a percentage of total fixed income portfolio at fair value
|
4.2
|
%
|
4.2
|
%
|
||||
Changes in interest rates will have an immediate effect on Comprehensive income and Shareholders' equity but will not ordinarily have an immediate effect on Net income. Variations in market interest rates could produce significant changes in the timing of prepayments due to available prepayment options. For these reasons, actual results could differ from those reflected in the tables.
Although our debt and trust preferred securities (collectively referred to as debt obligations) are reported at amortized cost and not adjusted for fair value changes, changes in interest rates could have a material impact on their fair value, albeit there would be no impact on our consolidated financial statements.
The following table presents the impact at
December 31, 2017
and
2016
, on the fair value of our debt obligations of a hypothetical decrease in interest rates of 100 bps applied instantly across the U.S. yield curve (an immediate time horizon was used as this presents the worst case scenario):
|
(in millions of U.S. dollars, except for percentages)
|
2017
|
|
2016
|
|
||||
|
Fair value of debt obligations, including repurchase agreements
|
$
|
15,221
|
|
$
|
15,360
|
|
||
|
Impact of 100 bps decrease in interest rates:
|
||||||||
|
Increase in dollars
|
$
|
1,144
|
|
$
|
1,154
|
|
||
|
As a percentage of total debt obligations at fair value
|
7.5
|
%
|
7.5
|
%
|
||||
95
Foreign currency management
As a global company, Chubb entities transact business in multiple currencies. Our policy is to generally match assets, liabilities and required capital for each individual jurisdiction in local currency, which would include the use of derivatives. We do not hedge our net asset non-U.S. dollar capital positions; however, we do consider hedging for planned cross border transactions.
The following table summarizes the net assets in non-U.S. currencies at
December 31, 2017
and
2016
:
|
2017
|
|
2016
|
|
2017 vs. 2016 % change in exchange rate per USD
|
|
||||||||||||
|
Value of
|
|
Exchange rate
|
|
Value of
|
|
Exchange
rate
|
|
||||||||||
|
(in millions of U.S. dollars, except for percentages)
|
Net Assets
|
|
per USD
|
|
Net Assets
|
|
per USD
|
|
|||||||||
|
British pound sterling (GBP)
|
$
|
2,696
|
|
1.3513
|
$
|
2,643
|
|
1.2340
|
|
9.5
|
%
|
||||||
|
Canadian dollar (CAD)
|
2,289
|
|
0.7955
|
2,508
|
|
0.7440
|
|
6.9
|
%
|
||||||||
|
Euro (EUR)
|
1,846
|
|
1.2005
|
1,871
|
|
1.0517
|
|
14.1
|
%
|
||||||||
|
Brazilian real (BRL)
|
1,524
|
|
0.3019
|
1,194
|
|
0.3072
|
|
(1.7
|
)%
|
||||||||
|
Australian dollar (AUD)
|
1,283
|
|
0.7809
|
1,327
|
|
0.7208
|
|
8.3
|
%
|
||||||||
|
Mexican peso (MXN)
|
815
|
|
0.0509
|
687
|
|
0.0483
|
|
5.3
|
%
|
||||||||
|
Korean won (KRW) (x100)
|
674
|
|
0.0937
|
316
|
|
0.0829
|
|
13.0
|
%
|
||||||||
|
Thai baht (THB)
|
513
|
|
0.0307
|
429
|
|
0.0279
|
|
10.0
|
%
|
||||||||
|
Japanese yen (JPY)
|
465
|
|
0.0089
|
391
|
|
0.0086
|
|
3.1
|
%
|
||||||||
|
Hong Kong dollar (HKD)
|
400
|
|
0.1280
|
370
|
|
0.1289
|
|
(0.7
|
)%
|
||||||||
|
Other foreign currencies
|
1,644
|
|
various
|
|
1,191
|
|
various
|
|
NM
|
|
|||||||
|
Value of net assets denominated in foreign currencies
|
$
|
14,149
|
|
|
$
|
12,927
|
|
|
|||||||||
|
As a percentage of total net assets
|
27.7
|
%
|
26.8
|
%
|
|||||||||||||
|
Pre-tax decrease to Shareholders' equity of a hypothetical 10 percent strengthening of the U.S. dollar
|
$
|
1,285
|
|
$
|
1,175
|
|
|||||||||||
NM – not meaningful
(1)
At
December 31, 2017
, net assets denominated in foreign currencies comprised approximately 41 percent tangible assets and 59 percent intangible assets, primarily goodwill.
Reinsurance of GMDB and GLB guarantees
Chubb views its variable annuity reinsurance business as having a similar risk profile to that of catastrophe reinsurance with the probability of long-term economic loss relatively small, at the time of pricing. Adverse changes in market factors and policyholder behavior will have an impact on both Life insurance underwriting income and net income. When evaluating these risks, we expect to be compensated for taking both the risk of a cumulative long-term economic net loss, as well as the short-term accounting variations caused by these market movements. Therefore, we evaluate this business in terms of its long-term economic risk and reward.
Net income is directly impacted by changes in benefit reserves calculated in connection with reinsurance of variable annuity guarantees, primarily GMDB and GLB. In addition, net income is directly impacted by changes in the fair value of the GLB liability (FVL), which is classified as a derivative for accounting purposes. The FVL established for a GLB reinsurance contract represents the difference between the fair value of the contract and the benefit reserves. Benefit reserves and FVL calculations are directly affected by market factors, including equity levels, interest rate levels, credit risk, and implied volatilities, as well as policyholder behaviors, such as annuitization and lapse rates.
96
The tables below are estimates of the sensitivities to instantaneous changes in economic inputs (e.g., equity shock, interest rate shock etc.) or actuarial assumptions at
December 31, 2017
of the FVL and of the fair value of specific derivative instruments held (hedge value) to partially offset the risk in the variable annuity guarantee reinsurance portfolio. The following assumptions should be considered when using the below tables:
|
•
|
No changes to the benefit ratio used to establish benefit reserves at
December 31, 2017
.
|
|
•
|
Equity shocks impact all global equity markets equally
|
|
•
|
Our liabilities are sensitive to global equity markets in the following proportions:
75
percent—
85
percent U.S. equity,
10
percent—
20
percent international equity ex-Japan, up to
10
percent Japan equity.
|
|
•
|
Our current hedge portfolio is sensitive to global equity markets in the following proportions: 100 percent U.S. equity.
|
|
•
|
We would suggest using the S&P 500 index as a proxy for U.S. equity, the MSCI EAFE index as a proxy for international equity, and the TOPIX as a proxy for Japan equity.
|
|
•
|
Interest rate shocks assume a parallel shift in the U.S. yield curve
|
|
•
|
Our liabilities are also sensitive to global interest rates at various points on the yield curve, mainly the U.S. Treasury curve in the following proportions: up to
10
percent short-term rates (maturing in less than 5 years),
20
percent—
30
percent medium-term rates (maturing between 5 years and 10 years, inclusive), and
60
percent—
70
percent long-term rates (maturing beyond 10 years).
|
|
•
|
A change in AA-rated credit spreads (AA-rated credit spreads are a proxy for both our own credit spreads and the credit spreads of the ceding insurers) impacts the rate used to discount cash flows in the fair value model.
|
|
•
|
The hedge sensitivity is from
December 31, 2017
market levels.
|
|
•
|
The sensitivities are not directly additive because changes in one factor will affect the sensitivity to changes in other factors. The sensitivities do not scale linearly and may be proportionally greater for larger movements in the market factors. The sensitivities may also vary due to foreign exchange rate fluctuations. The calculation of the FVL is based on internal models that include assumptions regarding future policyholder behavior, including lapse, annuitization, and asset allocation. These assumptions impact both the absolute level of the FVL as well as the sensitivities to changes in market factors shown below. Actual sensitivity of our net income may differ from those disclosed in the tables below due to differences between short-term market movements and management judgment regarding the long-term assumptions implicit in our benefit ratios. Furthermore, the sensitivities below could vary by multiples of the sensitivities in the tables below.
|
|
•
|
In addition, the tables below do not reflect the expected quarterly run rate of net income generated by the variable annuity guarantee reinsurance portfolio if markets remain unchanged during the period. All else equal, if markets remain unchanged during the period, the Gross FVL will increase, resulting in a realized loss. The realized loss occurs primarily because, during the period, we will collect premium on the full population while
80
percent of that population has become eligible to annuitize and generate a claim (since approximately 20 percent of policies are not eligible to annuitize until after
December 31, 2017
). This increases the Gross FVL because future premiums are lower by the amount collected in the quarter, and also because future claims are discounted for a shorter period. We refer to this increase in Gross FVL as “timing effect”. The unfavorable impact of timing effect on our Gross FVL in a quarter is not reflected in the sensitivity tables below. For this reason, when using the tables below to estimate the sensitivity of Gross FVL in the first quarter 2018 to various changes, it is necessary to assume an additional
$5
million to
$45
million increase in Gross FVL and realized losses. However, the impact to Net income is substantially mitigated because the majority of this realized loss is offset by the positive quarterly run rate of Life insurance underwriting income generated by the variable annuity guarantee reinsurance portfolio if markets remain unchanged during the period. Note that both the timing effect and the quarterly run rate of Life insurance underwriting income change over time as the book ages.
|
97
|
Interest Rate Shock
|
Worldwide Equity Shock
|
|||||||||||||||||||||||
|
(in millions of U.S. dollars)
|
+10
|
%
|
Flat
|
|
-10
|
%
|
-20
|
%
|
-30
|
%
|
-40
|
%
|
||||||||||||
|
+100 bps
|
(Increase)/decrease in Gross FVL
|
$
|
228
|
|
$
|
148
|
|
$
|
29
|
|
$
|
(160
|
)
|
$
|
(389
|
)
|
$
|
(656
|
)
|
|||||
|
Increase/(decrease) in hedge value
|
(157
|
)
|
—
|
|
157
|
|
315
|
|
472
|
|
630
|
|
||||||||||||
|
Increase/(decrease) in net income
|
$
|
71
|
|
$
|
148
|
|
$
|
186
|
|
$
|
155
|
|
$
|
83
|
|
$
|
(26
|
)
|
||||||
|
Flat
|
(Increase)/decrease in Gross FVL
|
$
|
120
|
|
$
|
—
|
|
$
|
(180
|
)
|
$
|
(397
|
)
|
$
|
(658
|
)
|
$
|
(952
|
)
|
|||||
|
Increase/(decrease) in hedge value
|
(157
|
)
|
—
|
|
157
|
|
315
|
|
472
|
|
630
|
|
||||||||||||
|
Increase/(decrease) in net income
|
$
|
(37
|
)
|
$
|
—
|
|
$
|
(23
|
)
|
$
|
(82
|
)
|
$
|
(186
|
)
|
$
|
(322
|
)
|
||||||
|
-100 bps
|
(Increase)/decrease in Gross FVL
|
$
|
(57
|
)
|
$
|
(232
|
)
|
$
|
(438
|
)
|
$
|
(683
|
)
|
$
|
(966
|
)
|
$
|
(1,277
|
)
|
|||||
|
Increase/(decrease) in hedge value
|
(157
|
)
|
—
|
|
157
|
|
315
|
|
472
|
|
630
|
|
||||||||||||
|
Increase/(decrease) in net income
|
$
|
(214
|
)
|
$
|
(232
|
)
|
$
|
(281
|
)
|
$
|
(368
|
)
|
$
|
(494
|
)
|
$
|
(647
|
)
|
||||||
|
Sensitivities to Other Economic Variables
|
AA-rated Credit Spreads
|
Interest Rate Volatility
|
Equity Volatility
|
|||||||||||||||||||||
|
(in millions of U.S. dollars)
|
+100 bps
|
|
-100 bps
|
|
+2
|
%
|
-2
|
%
|
+2
|
%
|
-2
|
%
|
||||||||||||
|
(Increase)/decrease in Gross FVL
|
$
|
58
|
|
$
|
(65
|
)
|
$
|
—
|
|
$
|
—
|
|
$
|
(6
|
)
|
$
|
5
|
|
||||||
|
Increase/(decrease) in hedge value
|
—
|
|
—
|
|
—
|
|
—
|
|
—
|
|
—
|
|
||||||||||||
|
Increase/(decrease) in net income
|
$
|
58
|
|
$
|
(65
|
)
|
$
|
—
|
|
$
|
—
|
|
$
|
(6
|
)
|
$
|
5
|
|
||||||
|
Sensitivities to Actuarial Assumptions
|
Mortality
|
|||||||||||||||||||||||
|
(in millions of U.S. dollars)
|
+20
|
%
|
+10
|
%
|
-10
|
%
|
-20
|
%
|
||||||||||||||||
|
(Increase)/decrease in Gross FVL
|
$
|
20
|
|
$
|
10
|
|
$
|
(10
|
)
|
$
|
(20
|
)
|
||||||||||||
|
Increase/(decrease) in hedge value
|
—
|
|
—
|
|
—
|
|
—
|
|
||||||||||||||||
|
Increase/(decrease) in net income
|
$
|
20
|
|
$
|
10
|
|
$
|
(10
|
)
|
$
|
(20
|
)
|
||||||||||||
|
|
Lapses
|
|||||||||||||||||||||||
|
(in millions of U.S. dollars)
|
+50
|
%
|
+25
|
%
|
-25
|
%
|
-50
|
%
|
||||||||||||||||
|
(Increase)/decrease in Gross FVL
|
$
|
77
|
|
$
|
43
|
|
$
|
(50
|
)
|
$
|
(106
|
)
|
||||||||||||
|
Increase/(decrease) in hedge value
|
—
|
|
—
|
|
—
|
|
—
|
|
||||||||||||||||
|
Increase/(decrease) in net income
|
$
|
77
|
|
$
|
43
|
|
$
|
(50
|
)
|
$
|
(106
|
)
|
||||||||||||
|
|
Annuitization
|
|||||||||||||||||||||||
|
(in millions of U.S. dollars)
|
+50
|
%
|
+25
|
%
|
-25
|
%
|
-50
|
%
|
||||||||||||||||
|
(Increase)/decrease in Gross FVL
|
$
|
(388
|
)
|
$
|
(207
|
)
|
$
|
171
|
|
$
|
341
|
|
||||||||||||
|
Increase/(decrease) in hedge value
|
—
|
|
—
|
|
—
|
|
—
|
|
||||||||||||||||
|
Increase/(decrease) in net income
|
$
|
(388
|
)
|
$
|
(207
|
)
|
$
|
171
|
|
$
|
341
|
|
||||||||||||
98
Variable Annuity Net Amount at Risk
All our VA reinsurance treaties include annual or aggregate claim limits and many include an aggregate deductible which limit the net amount at risk under these programs. The tables below present the net amount at risk at
December 31, 2017
following an immediate change in equity market levels, assuming all global equity markets are impacted equally. For further information on the net amount at risk, refer to Note 5 c) to the Consolidated Financial Statements.
a) Reinsurance covering the GMDB risk only
|
|
Equity Shock
|
||||||||||||||||||||||
|
(in millions of U.S. dollars)
|
+20
|
%
|
Flat
|
|
-20
|
%
|
-40
|
%
|
-60
|
%
|
-80
|
%
|
|||||||||||
|
GMDB net amount at risk
|
$
|
308
|
|
$
|
279
|
|
$
|
478
|
|
$
|
944
|
|
$
|
994
|
|
$
|
852
|
|
|||||
|
Claims at 100% immediate mortality
|
176
|
|
189
|
|
184
|
|
200
|
|
217
|
|
219
|
|
|||||||||||
The treaty claim limits function as a ceiling as equity markets fall. As the shocks in the table above become incrementally more negative, the impact on the NAR and claims at 100 percent mortality begin to drop due to the specific nature of these claim limits, many of which are annual claim limits calculated as a percentage of the reinsured account value. There is also some impact due to a small portion of the GMDB reinsurance under which claims are positively correlated to equity markets (claims decrease as equity markets fall).
b) Reinsurance covering the GLB risk only
|
|
Equity Shock
|
||||||||||||||||||||||
|
(in millions of U.S. dollars)
|
+20
|
%
|
Flat
|
|
-20
|
%
|
-40
|
%
|
-60
|
%
|
-80
|
%
|
|||||||||||
|
GLB net amount at risk
|
$
|
420
|
|
$
|
691
|
|
$
|
1,215
|
|
$
|
2,044
|
|
$
|
2,620
|
|
$
|
2,912
|
|
|||||
The treaty claim limits cause the net amount at risk to increase at a declining rate as equity markets fall.
c) Reinsurance covering both the GMDB and GLB risks on the same underlying policyholders
|
|
Equity Shock
|
||||||||||||||||||||||
|
(in millions of U.S. dollars)
|
+20
|
%
|
Flat
|
|
-20
|
%
|
-40
|
%
|
-60
|
%
|
-80
|
%
|
|||||||||||
|
GMDB net amount at risk
|
$
|
64
|
|
$
|
81
|
|
$
|
102
|
|
$
|
119
|
|
$
|
130
|
|
$
|
136
|
|
|||||
|
GLB net amount at risk
|
255
|
|
392
|
|
624
|
|
989
|
|
1,398
|
|
1,748
|
|
|||||||||||
|
Claims at 100% immediate mortality
|
18
|
|
18
|
|
22
|
|
75
|
|
142
|
|
180
|
|
|||||||||||
The treaty limits control the increase in the GMDB net amount at risk as equity markets fall. The GMDB net amount at risk continues to grow as equity markets fall because most of these reinsurance treaties do not have annual claim limits calculated as a percentage of the underlying account value. The treaty limits cause the GLB net amount at risk to increase at a declining rate as equity markets fall.
The financial statements and supplementary data are included in this Form 10-K commencing on page F-1.
None.
99
Chubb’s management, with the participation of Chubb’s Chief Executive Officer and Chief Financial Officer, evaluated the effectiveness of Chubb’s disclosure controls and procedures as defined in Rule 13a-15(e) and Rule 15d-15(e) under the Securities Exchange Act of 1934 as of
December 31, 2017
. Based upon that evaluation, Chubb’s Chief Executive Officer and Chief Financial Officer concluded that Chubb’s disclosure controls and procedures are effective in allowing information required to be disclosed in reports filed under the Securities and Exchange Act of 1934 to be recorded, processed, summarized, and reported within time periods specified in the rules and forms of the SEC, and that such information is accumulated and communicated to Chubb’s management, including its Chief Executive Officer and Chief Financial Officer, as appropriate to allow timely decisions regarding required disclosure.
In 2016, Chubb completed the acquisition of The Chubb Corporation. For the year ended
December 31, 2017
, we continued to integrate the information technology environments of the two companies.
There were no other changes to Chubb's internal controls over financial reporting for the year ended
December 31, 2017
that have materially affected, or are reasonably likely to materially affect, Chubb's internal controls over financial reporting. Chubb's management report on internal control over financial reporting is included on page F-3 and PricewaterhouseCoopers LLP's audit report is included on page F-4.
Disclosure of Certain Activities Under Section 13(r) of the Securities Exchange Act of 1934
Section 13(r) of the Securities Exchange Act of 1934, as amended, requires an issuer to disclose in its annual or quarterly reports whether it or an affiliate knowingly engaged in certain activities described in that section, including certain activities related to Iran during the period covered by the report.
Chubb, through certain of its non-U.S. subsidiaries, provides insurance and reinsurance coverage relating to marine risks for policyholders with global operations. As a result of the modification of U.S. and European sanctions on Iran in 2016, several marine policyholders have informed us that they are shipping cargo to and from Iran, including transporting crude oil, petrochemicals and refined petroleum products. As the activities of our insureds and reinsureds are permitted under applicable laws and regulations, including U. S. Department of Treasury General License H, Chubb intends for its non-U.S. subsidiaries to continue providing such coverage to its insureds and reinsureds to the extent permitted by applicable law. Since these policies insure multiple voyages and fleets containing multiple ships, we are unable to attribute gross revenues and net profits from such marine policies to these activities involving Iran.
100
Information pertaining to this item is incorporated by reference to the sections entitled “Agenda Item 5 - Election of the Board of Directors”, “Corporate Governance - The Board of Directors - Director Nomination Process”, “Corporate Governance - The Committees of the Board - Audit Committee”, and “Corporate Governance - Did Our Officers and Directors Comply with Section 16(a) Beneficial Ownership Reporting in
2017
?” of the definitive proxy statement for the 2018 Annual General Meeting of Shareholders which will be filed with the SEC not later than 120 days after the close of the fiscal year pursuant to Regulation 14A. Also incorporated herein by reference is the text under the caption “Executive Officers of the Registrant” appearing at the end of Part I Item 1 of the Annual Report on Form 10-K.
Code of Ethics
Chubb has adopted a Code of Conduct, which sets forth standards by which all Chubb employees, officers, and directors must abide as they work for Chubb. Chubb has posted this Code of Conduct on its Internet site (investors.chubb.com, under Corporate Governance/Highlights and Governance Documents/The Chubb Code of Conduct). Chubb intends to disclose on its Internet site any amendments to, or waivers from, its Code of Conduct that are required to be publicly disclosed pursuant to the rules of the SEC or the New York Stock Exchange.
This item is incorporated by reference to the sections entitled “Executive Compensation”, “Compensation Committee Report” and “Director Compensation” of the definitive proxy statement for the 2018 Annual General Meeting of Shareholders which will be filed with the SEC not later than 120 days after the close of the fiscal year pursuant to Regulation 14A.
|
Plan category
|
Number of securities to be issued upon exercise of outstanding options, warrants, and rights
|
Weighted-average exercise price of outstanding options, warrants, and rights
(3)
|
Number of securities remaining available for future issuance under equity compensation plans
|
|||||||
|
Equity compensation plans approved by security holders
(1)
|
12,679,686
|
|
$
|
99.09
|
|
19,517,763
|
|
|||
|
Equity compensation plans not approved by security holders
(2)
|
39,756
|
|
||||||||
(1)
These totals include securities available for future issuance under the following plans:
(i) Chubb Limited 2016 Long-Term Incentive Plan (LTIP). A total of 19,500,000 shares are authorized to be issued pursuant to awards made as options, stock appreciation rights, stock units, performance shares, performance units, restricted stock, and restricted stock units. The maximum number of shares that may be delivered to participants and their beneficiaries under the LTIP shall be equal to the sum of: (x) 19,500,000 shares of stock; and (y) any shares of stock that have not been delivered pursuant to the ACE LTIP (as defined in clause (ii) of this footnote (1) below) and remain available for grant pursuant to the ACE LTIP, including shares of stock represented by awards granted under the ACE LTIP that are forfeited, expire or are canceled after the effective date of the LTIP without delivery of shares of stock or which result in the forfeiture of the shares of stock back to the Company to the extent that such shares would have been added back to the reserve under the terms of the ACE LTIP. As of December 31, 2017, a total of 2,009,261 option awards and 348,792 restricted stock unit awards are outstanding, and 17,065,705 shares remain available for future issuance under this plan.
(ii) ACE Limited 2004 Long-Term Incentive Plan (ACE LTIP). As of December 31, 2017, a total of 8,255,720 option awards, 508,851 restricted stock unit awards and nil performance unit awards are outstanding. No additional grants will be made pursuant to the ACE LTIP.
(iii) The Chubb Corporation Long-Term Incentive Plan (2014) (Chubb Corp. LTIP). As of December 31, 2017, a total of 184,845 option awards, 755,504 restricted stock unit awards, 490,470 performance unit awards (representing 100% of the aggregate target in accordance with the Chubb Corp. merger agreement) and 165,999 deferred stock unit awards are outstanding. No additional grants will be made pursuant to the Chubb Corp. LTIP.
(iv) ESPP. A total of 6,500,000 shares have been authorized for purchase at a discount. As of December 31, 2017, 2,452,058 shares remain available for future issuance under this plan.
101
(2)
These plans are the Chubb Corp. CCAP Excess Benefit Plan (CCAP Excess Benefit Plan) and the Chubb Corp. Deferred Compensation Plan for Directors, under which no Common Shares are available for future issuance other than with respect to outstanding rewards. The CCAP Excess Benefit Plan is a nonqualified, defined contribution plan and covers those participants in the Capital Accumulation Plan of The Chubb Corporation (CCAP) (Chubb Corp.’s legacy 401(k) plan) and Chubb Corp.’s legacy employee stock ownership plan (ESOP) whose total benefits under those plans are limited by certain provisions of the Internal Revenue Code. A participant in the CCAP Excess Benefit Plan is entitled to a benefit equaling the difference between the participant’s benefits under the CCAP and the ESOP, without considering the applicable limitations of the Code, and the participant’s actual benefits under such plans. A participant’s excess ESOP benefit is expressed as Common Shares. Payments under the CCAP Excess Benefit Plan are generally made: (i) for excess benefits related to the CCAP, in cash annually as soon as practical after the amount of excess benefit can be determined; and (ii) for excess benefits related to the ESOP, in Common Shares as soon as practicable after the participant’s termination of employment. Allocations under the ESOP ceased in 2004. Accordingly, other than dividends, no new contributions are made to the ESOP or the CCAP Excess Benefit Plan with respect to excess ESOP benefits.
(3)
Weighted average exercise price excludes shares issuable under performance unit awards and restricted stock unit awards.
This item is incorporated by reference to the sections entitled “Corporate Governance - What Is Our Related Party Transactions Approval Policy and What Procedures Do We Use to Implement It?”, “Corporate Governance - What Related Party Transactions Do We Have?”, and “Corporate Governance - The Board of Directors - Director Independence” of the definitive proxy statement for the 2018 Annual General Meeting of Shareholders which will be filed with the SEC not later than 120 days after the close of the fiscal year pursuant to Regulation 14A.
This item is incorporated by reference to the section entitled “Agenda Item 4 – Election of Auditors – 4.2 – Ratification of appointment of PricewaterhouseCoopers LLP (United States) as independent registered public accounting firm for purposes of U.S. securities law reporting” of the definitive proxy statement for the 2018 Annual General Meeting of Shareholders which will be filed with the SEC not later than 120 days after the close of the fiscal year pursuant to Regulation 14A.
102
(a)
Financial Statements, Schedules, and Exhibits
|
Page
|
||
|
1.
|
Consolidated Financial Statements
|
|
|
–
|
||
|
–
|
||
|
–
|
||
|
–
|
||
|
–
|
||
|
–
|
||
|
–
|
||
|
2.
|
Financial Statement Schedules
|
|
|
–
|
||
|
–
|
||
|
–
|
||
|
–
|
||
|
Other schedules have been omitted as they are not applicable to Chubb, or the required information has been included in the Consolidated Financial Statements and related notes.
|
||||
|
3.
|
Exhibits
|
|||
|
Incorporated by Reference
|
||||||||||
|
Exhibit Number
|
Exhibit Description
|
Form
|
Original Number
|
Date Filed
|
Filed Herewith
|
|||||
|
8-K
|
2.1
|
July 7, 2015
|
||||||||
|
8-K
|
3.1
|
May 20, 2016
|
||||||||
|
8-K
|
3.1
|
November 21, 2016
|
||||||||
|
8-K
|
4.1
|
May 20, 2016
|
||||||||
|
8-K
|
3.1
|
November 21, 2016
|
||||||||
|
8-K
|
4.3
|
July 18, 2008
|
||||||||
|
8-K
|
4.1
|
November 23, 2010
|
||||||||
103
|
Incorporated by Reference
|
||||||||||
|
Exhibit Number
|
Exhibit Description
|
Form
|
Original Number
|
Date Filed
|
Filed Herewith
|
|||||
|
8-K
|
4.1
|
March 22, 2002
|
||||||||
|
S-3
ASR
|
4.4
|
December 10, 2014
|
||||||||
|
10-K
|
10.38
|
March 29, 2000
|
||||||||
|
10-K
|
10.41
|
March 29, 2000
|
||||||||
|
10-K
|
4.17
|
March 16, 2006
|
||||||||
|
10-K
|
4.18
|
March 16, 2006
|
||||||||
|
10-K
|
4.19
|
March 16, 2006
|
||||||||
|
8-K
|
4.1
|
March 13, 2013
|
||||||||
|
8-K
|
4.2
|
March 13, 2013
|
||||||||
|
8-K
|
4.3
|
March 13, 2013
|
||||||||
|
8-K
|
4.1
|
May 27, 2014
|
||||||||
|
8-K
|
4.1
|
March 16, 2015
|
||||||||
|
8-K
|
4.1
|
November 3, 2015
|
||||||||
|
8-K
|
4.2
|
November 3, 2015
|
||||||||
|
8-K
|
4.3
|
November 3, 2015
|
||||||||
|
8-K
|
4.4
|
November 3, 2015
|
||||||||
|
8-K
|
4.1
|
January 15, 2016
|
||||||||
|
8-K
|
4.2
|
January 15, 2016
|
||||||||
|
4.23
|
Chubb Corp Senior Indenture (incorporated by reference to Exhibit 4(a) to Chubb Corp's Registration Statement on Form S-3 filed on October 27, 1989) (File No. 33-31796)
|
S-3
|
4(a)
|
October 27, 1989
|
||||||
104
|
Incorporated by Reference
|
||||||||||
|
Exhibit Number
|
Exhibit Description
|
Form
|
Original Number
|
Date Filed
|
Filed Herewith
|
|||||
|
8-K
|
4.1
|
March 30, 2007
|
||||||||
|
8-K
|
4.2
|
March 30, 2007
|
||||||||
|
8-K
|
4.1
|
May 6, 2008
|
||||||||
|
4.27
|
Form of 6.60 percent Chubb Corp Debentures due 2018 (incorporated by reference to Exhibit 4(a) to Chubb Corp's Registration Statement on Form S-3 filed on October 27, 1989) (File No. 33-31796)
|
S-3
|
4(a)
|
October 27, 1989
|
||||||
|
4.28
|
Form of 6.80 percent Chubb Corp Debentures due 2031 (incorporated by reference to Exhibit 4(a) to Chubb Corp's Registration Statement on Form S-3 filed on October 27, 1989) (File No. 33-31796)
|
S-3
|
4(a)
|
October 27, 1989
|
||||||
|
8-K
|
4.1
|
May 11, 2007
|
||||||||
|
8-K
|
4.2
|
May 6, 2008
|
||||||||
|
8-K
|
4.3
|
March 30, 2007
|
||||||||
|
10-K
|
4.32
|
February 28, 2017
|
||||||||
|
10.1
*
|
10-K
|
10.1
|
February 26, 2016
|
|||||||
|
10-K
|
10.13
|
February 28, 2013
|
||||||||
|
10.3
*
|
10-K
|
10.64
|
March 27, 2003
|
|||||||
|
10.4
*
|
10-K
|
10.65
|
March 27, 2003
|
|||||||
|
10.5
*
|
10-Q
|
10.1
|
May 10, 2004
|
|||||||
105
|
Incorporated by Reference
|
||||||||||
|
Exhibit Number
|
Exhibit Description
|
Form
|
Original Number
|
Date Filed
|
Filed Herewith
|
|||||
|
10.6
*
|
10-K
|
10.17
|
February 25, 2011
|
|||||||
|
10.7
*
|
10-K
|
10.29
|
February 29, 2008
|
|||||||
|
10.8
*
|
10-K
|
10.30
|
February 29, 2008
|
|||||||
|
10.9
*
|
10-K
|
10.21
|
February 24, 2012
|
|||||||
|
10.10
*
|
8-K
|
10.1
|
July 16, 2008
|
|||||||
|
10.11
*
|
10-Q
|
10.1
|
November 3, 2011
|
|||||||
|
10.12
*
|
10-K
|
10.12
|
February 28, 2017
|
|||||||
|
10.13*
|
ACE Limited Annual Performance Incentive Plan
|
|
S-1
|
10.13
|
January 21, 1993
|
|||||
|
10.14
*
|
10-K
|
10.24
|
March 16, 2006
|
|||||||
|
10.15
*
|
10-K
|
10.25
|
March 16, 2006
|
|||||||
|
10.16
*
|
10-Q
|
10.7
|
October 30, 2013
|
|||||||
|
10.17
*
|
10-K
|
10.36
|
February 27, 2009
|
|||||||
|
10.18
*
|
10-K
|
10.28
|
February 25, 2010
|
|||||||
|
10.19
*
|
10-Q
|
10.2
|
May 7, 2010
|
|||||||
|
10.20
*
|
10-Q
|
10.1
|
November 14, 2001
|
|||||||
|
10.21
*
|
10-Q
|
10.6
|
October 30, 2013
|
|||||||
|
10.22
*
|
10-K
|
10.38
|
February 29, 2008
|
|||||||
|
10.23
*
|
10-K
|
10.39
|
February 27, 2009
|
|||||||
|
10.24
*
|
10-Q
|
10.5
|
October 30, 2013
|
|||||||
|
10.25
*
|
10-K
|
10.40
|
February 27, 2009
|
|||||||
|
10.26
*
|
10-K
|
10.39
|
February 29, 2008
|
|||||||
106
|
Incorporated by Reference
|
||||||||||
|
Exhibit Number
|
Exhibit Description
|
Form
|
Original Number
|
Date Filed
|
Filed Herewith
|
|||||
|
10.27
*
|
10-K
|
10.42
|
February 27, 2009
|
|||||||
|
10.28
*
|
10-Q
|
10.6
|
May 15, 2000
|
|||||||
|
10.29
*
|
10-K
|
10.30
|
March 1, 2007
|
|||||||
|
10.30
*
|
10-K
|
10.31
|
March 1, 2007
|
|||||||
|
10.31
*
|
10-K
|
10.46
|
February 27, 2009
|
|||||||
|
10.32
*
|
10-K
|
10.39
|
February 25, 2010
|
|||||||
|
10.33
*
|
10-Q
|
10.1
|
August 14, 2003
|
|||||||
|
10.34
*
|
10-K
|
10.34
|
March 1, 2007
|
|||||||
|
10.35
*
|
8-K
|
10
|
May 21, 2010
|
|||||||
|
10.36
*
|
8-K
|
10.1
|
May 20, 2013
|
|||||||
|
10.37
*
|
10-Q
|
10.2
|
February 13, 1998
|
|||||||
|
10.38
*
|
10-K
|
10.54
|
February 27, 2009
|
|||||||
|
10.39
*
|
10-K
|
10.55
|
February 27, 2009
|
|||||||
|
10.40
*
|
10-Q
|
10.1
|
November 9, 2009
|
|||||||
|
10.41
*
|
10-Q
|
10.1
|
May 8, 2008
|
|||||||
|
10.42
*
|
10-Q
|
10.2
|
May 8, 2008
|
|||||||
|
10.43
*
|
10-K
|
10.60
|
February 27, 2009
|
|||||||
|
10.44
*
|
10-Q
|
10.2
|
October 30, 2013
|
|||||||
|
10.45
*
|
10-K
|
10.56
|
February 28, 2014
|
|||||||
107
|
Incorporated by Reference
|
||||||||||
|
Exhibit Number
|
Exhibit Description
|
Form
|
Original Number
|
Date Filed
|
Filed Herewith
|
|||||
|
10.46
*
|
8-K
|
10.4
|
September 13, 2004
|
|||||||
|
10.47
*
|
10-Q
|
10.4
|
May 8, 2008
|
|||||||
|
10.48
*
|
10-K
|
10.63
|
February 27, 2009
|
|||||||
|
10.49
*
|
10-Q
|
10.3
|
October 30, 2013
|
|||||||
|
10.50
*
|
8-K
|
10.5
|
September 13, 2004
|
|||||||
|
10.51
*
|
10-Q
|
10.3
|
May 8, 2008
|
|||||||
|
10.52
*
|
10-Q
|
10.4
|
October 30, 2013
|
|||||||
|
10.53
*
|
10-Q
|
10.3
|
May 5, 2006
|
|||||||
|
10.54
*
|
10-Q
|
10.2
|
November 8, 2006
|
|||||||
|
10.55
*
|
10-K
|
10.65
|
February 25, 2011
|
|||||||
|
10.56
*
|
10-K
|
10.67
|
February 28, 2014
|
|||||||
|
10.57
*
|
10-K
|
10.68
|
February 28, 2014
|
|||||||
|
10.58
*
|
10-Q
|
10.2
|
November 7, 2007
|
|||||||
|
10.59
*
|
10-Q
|
10.2
|
August 7, 2009
|
|||||||
|
10.60
*
|
10-Q
|
10.1
|
August 4, 2011
|
|||||||
|
10.61
*
|
10-Q
|
10.2
|
August 4, 2011
|
|||||||
|
10.62
*
|
10-Q
|
10.3
|
August 4, 2011
|
|||||||
|
10.63
*
|
8-K
|
10.1
|
May 22, 2012
|
|||||||
108
|
Incorporated by Reference
|
||||||||||
|
Exhibit Number
|
Exhibit Description
|
Form
|
Original Number
|
Date Filed
|
Filed Herewith
|
|||||
|
10.64
*
|
10-K
|
10.72
|
February 24, 2012
|
|||||||
|
10.65
*
|
10-Q
|
10.8
|
October 30, 2013
|
|||||||
|
10.66
*
|
10-K
|
10.68
|
February 27, 2015
|
|||||||
|
10.67
*
|
10-K
|
10.69
|
February 27, 2015
|
|||||||
|
10.68
*
|
10-K
|
10.70
|
February 27, 2015
|
|||||||
|
10.69
*
|
10-K
|
10.71
|
February 27, 2015
|
|||||||
|
10.70
*
|
10-K
|
10.72
|
February 27, 2015
|
|||||||
|
10.71
*
|
8-K
|
10.1
|
May 22, 2015
|
|||||||
|
10-K
|
10.72
|
February 26, 2016
|
||||||||
|
10.73
*
|
10-K
|
10.73
|
February 26, 2016
|
|||||||
|
10.74
*
|
10-K
|
10.74
|
February 26, 2016
|
|||||||
|
10.75
*
|
S-8
|
4.4
|
May 26, 2016
|
|||||||
|
10.76
*
|
10-Q
|
10.2
|
August 5, 2016
|
|||||||
|
10.77
*
|
10-Q
|
10.3
|
August 5, 2016
|
|||||||
|
10.78
*
|
10-Q
|
10.4
|
August 5, 2016
|
|||||||
|
10.79
*
|
10-Q
|
10.5
|
August 5, 2016
|
|||||||
|
10.80
*
|
10-Q
|
10.6
|
August 5, 2016
|
|||||||
109
|
Incorporated by Reference
|
||||||||||
|
Exhibit Number
|
Exhibit Description
|
Form
|
Original Number
|
Date Filed
|
Filed Herewith
|
|||||
|
10.81
*
|
10-Q
|
10.7
|
August 5, 2016
|
|||||||
|
10.82
*
|
10-Q
|
10.8
|
August 5, 2016
|
|||||||
|
10.83
*
|
10-Q
|
10.9
|
August 5, 2016
|
|||||||
|
10.84
*
|
10-K
|
10.84
|
February 28, 2017
|
|||||||
|
10.85
*
|
10-K
|
10.85
|
February 28, 2017
|
|||||||
|
10.86
*
|
S-8
|
4.4
|
May 25, 2017
|
|||||||
|
10.87
*
|
10-Q
|
10.1
|
August 3, 2017
|
|||||||
|
X
|
||||||||||
|
10.89
*
|
X
|
|||||||||
|
10.90
*
|
X
|
|||||||||
|
10.91
*
|
X
|
|||||||||
|
10.92
*
|
X
|
|||||||||
|
10.93
*
|
X
|
|||||||||
|
10.94
*
|
X
|
|||||||||
|
10.95
*
|
X
|
|||||||||
|
10.96
*
|
X
|
|||||||||
|
10.97
*
|
X
|
|||||||||
110
|
Incorporated by Reference
|
||||||||||
|
Exhibit Number
|
Exhibit Description
|
Form
|
Original Number
|
Date Filed
|
Filed Herewith
|
|||||
|
10.98
*
|
X
|
|||||||||
|
10.99
*
|
X
|
|||||||||
|
X
|
||||||||||
|
10-Q
|
18.1
|
October 29, 2014
|
||||||||
|
X
|
||||||||||
|
X
|
||||||||||
|
X
|
||||||||||
|
X
|
||||||||||
|
X
|
||||||||||
|
X
|
||||||||||
|
101
|
The following financial information from Chubb Limited's Annual Report on Form 10-K for the year ended December 31, 2017, formatted in XBRL: (i) Consolidated Balance Sheets at December 31, 2017 and 2016; (ii) Consolidated Statements of Operations and Comprehensive Income for the years ended December 31, 2017, 2016, and 2015; (iii) Consolidated Statements of Shareholders' Equity for the years ended December 31, 2017, 2016, and 2015; (iv) Consolidated Statements of Cash Flows for the years ended December 31, 2017, 2016, and 2015; and (v) Notes to the Consolidated Financial Statements
|
X
|
||||||||
|
* Management contract, compensatory plan or arrangement
|
||||||||||
None.
111
SIGNATURES
Pursuant to the requirements of Section 13 or 15(d) of the Securities Exchange Act of 1934, the registrant has duly caused this report to be signed on its behalf by the undersigned, thereunto duly authorized.
CHUBB LIMITED
|
By:
|
/s/ Philip V. Bancroft
|
|
Philip V. Bancroft
Executive Vice President and Chief Financial Officer
|
|
February 23, 2018
Pursuant to the requirements of the Securities Exchange Act of 1934, this report has been signed below by the following persons on behalf of the registrant and in the capacities and on the dates indicated.
|
Signature
|
Title
|
Date
|
|
|
/s/ Evan G. Greenberg
|
Chairman, President, Chief Executive Officer, and Director
|
February 23, 2018
|
|
|
Evan G. Greenberg
|
|||
|
/s/ Philip V. Bancroft
|
Executive Vice President and Chief Financial Officer
|
February 23, 2018
|
|
|
Philip V. Bancroft
|
(Principal Financial Officer)
|
||
|
/s/ Paul B. Medini
|
Chief Accounting Officer
|
February 23, 2018
|
|
|
Paul B. Medini
|
(Principal Accounting Officer)
|
|
|
|
/s/ Michael G. Atieh
|
Director
|
February 23, 2018
|
|
|
Michael G. Atieh
|
|
||
|
/s/ Sheila P. Burke
|
Director
|
February 23, 2018
|
|
|
Sheila P. Burke
|
|||
|
/s/ James I. Cash
|
Director
|
February 23, 2018
|
|
|
James I. Cash
|
|||
|
/s/ Mary A. Cirillo
|
Director
|
February 23, 2018
|
|
|
Mary A. Cirillo
|
|
||
|
/s/ Michael P. Connors
|
Director
|
February 23, 2018
|
|
|
Michael P. Connors
|
|
||
112
|
Signature
|
Title
|
Date
|
|
|
/s/ John Edwardson
|
Director
|
February 23, 2018
|
|
|
John Edwardson
|
|||
|
/s/ Robert M. Hernandez
|
Director
|
February 23, 2018
|
|
|
Robert M. Hernandez
|
|||
|
/s/ Leo F. Mullin
|
Director
|
February 23, 2018
|
|
|
Leo F. Mullin
|
|||
|
/s/ Kimberly Ross
|
Director
|
February 23, 2018
|
|
|
Kimberly Ross
|
|
||
|
/s/ Robert Scully
|
Director
|
February 23, 2018
|
|
|
Robert Scully
|
|
||
|
/s/ Eugene B. Shanks, Jr.
|
Director
|
February 23, 2018
|
|
|
Eugene B. Shanks, Jr.
|
|
||
|
/s/ Theodore E. Shasta
|
Director
|
February 23, 2018
|
|
|
Theodore E. Shasta
|
|
||
|
/s/ David Sidwell
|
Director
|
February 23, 2018
|
|
|
David Sidwell
|
|||
|
/s/ Olivier Steimer
|
Director
|
February 23, 2018
|
|
|
Olivier Steimer
|
|
||
|
/s/ James M. Zimmerman
|
Director
|
February 23, 2018
|
|
|
James M. Zimmerman
|
|||
113
CHUBB LIMITED AND SUBSIDIARIES
CONSOLIDATED FINANCIAL STATEMENTS
DECEMBER 31, 2017
F-1
|
|
|
Page
|
|
Consolidated Financial Statements
|
||
|
Note 1.
|
||
|
Note 2.
|
||
|
Note 3.
|
||
|
Note 4.
|
||
|
Note 5.
|
||
|
Note 6.
|
||
|
Note 7.
|
||
|
Note 8.
|
||
|
Note 9.
|
||
|
Note 10.
|
||
|
Note 11.
|
||
|
Note 12.
|
||
|
Note 13.
|
||
|
Note 14.
|
||
|
Note 15.
|
||
|
Note 16.
|
||
|
Note 17.
|
||
|
Note 18.
|
||
|
Note 19.
|
||
|
Note 20.
|
||
|
Financial Statement Schedules
|
||
|
Schedule I
|
||
|
Schedule II
|
||
|
Schedule IV
|
||
|
Schedule VI
|
||
F-2
MANAGEMENT'S RESPONSIBILITY FOR FINANCIAL STATEMENTS AND
INTERNAL CONTROL OVER FINANCIAL REPORTING
Financial Statements
The consolidated financial statements of Chubb Limited (Chubb) were prepared by management, which is responsible for their reliability and objectivity. The statements have been prepared in conformity with accounting principles generally accepted in the United States of America and, as such, include amounts based on informed estimates and judgments of management. Financial information elsewhere in this annual report is consistent with that in the consolidated financial statements.
The Board of Directors (Board), operating through its Audit Committee, which is composed entirely of directors who are not officers or employees of Chubb, provides oversight of the financial reporting process and safeguarding of assets against unauthorized acquisition, use or disposition. The Audit Committee annually recommends the appointment of an independent registered public accounting firm and submits its recommendation to the Board for approval.
The Audit Committee meets with management, the independent registered public accountants and the internal auditor; approves the overall scope of audit work and related fee arrangements; and reviews audit reports and findings. In addition, the independent registered public accountants and the internal auditor meet separately with the Audit Committee, without management representatives present, to discuss the results of their audits; the adequacy of Chubb's internal control; the quality of its financial reporting; and the safeguarding of assets against unauthorized acquisition, use or disposition.
The consolidated financial statements have been audited by an independent registered public accounting firm, PricewaterhouseCoopers LLP, which has been given unrestricted access to all financial records and related data, including minutes of all meetings of the Board and committees of the Board. Chubb believes that all representations made to our independent registered public accountants during their audits were valid and appropriate.
Internal Control over Financial Reporting
The management of Chubb is responsible for establishing and maintaining adequate internal control over financial reporting. Pursuant to the rules and regulations of the Securities and Exchange Commission, internal control over financial reporting is a process designed by, or under the supervision of our Chief Executive Officer and Chief Financial Officer to provide reasonable assurance regarding the reliability of financial reporting and the preparation of our consolidated financial statements for external purposes in accordance with accounting principles generally accepted in the United States of America.
As of
December 31, 2017
, management has evaluated the effectiveness of Chubb's internal control over financial reporting based on the criteria for effective internal control over financial reporting established in “Internal Control - Integrated Framework,” issued by the Committee of Sponsoring Organizations of the Treadway Commission in 2013. Based on this evaluation, we have concluded that Chubb's internal control over financial reporting was effective as of
December 31, 2017
.
PricewaterhouseCoopers LLP, the independent registered public accounting firm that audited the consolidated financial statements of Chubb included in this Annual Report, has issued a report on the effectiveness of Chubb's internal controls over financial reporting as of
December 31, 2017
. The report, which expresses an unqualified opinion on the effectiveness of Chubb's internal control over financial reporting as of
December 31, 2017
, is included in this Item under “Report of Independent Registered Public Accounting Firm” and follows this statement.
|
/s/ Evan G. Greenberg
|
/s/ Philip V. Bancroft
|
|
|
Evan G. Greenberg
|
Philip V. Bancroft
|
|
|
Chairman, President and Chief Executive Officer
|
Executive Vice President and Chief Financial Officer
|
|
F-3
To the Board of Directors and Shareholders of Chubb Limited
Opinions on the Financial Statements and Internal Control over Financial Reporting
We have audited the accompanying consolidated balance sheets of Chubb Limited and its subsidiaries as of December 31, 2017 and 2016, and the related consolidated statements of operations and comprehensive income, shareholders' equity, and cash flows for each of the three years in the period ended December 31, 2017, including the related notes and financial statement schedules listed in the index appearing under Item 15(a)(2) (collectively referred to as the “consolidated financial statements”). We also have audited the Company's internal control over financial reporting as of December 31, 2017, based on criteria established in Internal Control - Integrated Framework (2013) issued by the Committee of Sponsoring Organizations of the Treadway Commission (COSO).
In our opinion, the consolidated financial statements referred to above present fairly, in all material respects, the financial position of the Company as of December 31, 2017 and 2016, and the results of their operations and their cash flows for each of the three years in the period ended December 31, 2017 in conformity with accounting principles generally accepted in the United States of America. Also in our opinion, the Company maintained, in all material respects, effective internal control over financial reporting as of December 31, 2017, based on criteria established in Internal Control - Integrated Framework (2013) issued by the COSO.
Basis for Opinions
The Company's management is responsible for these consolidated financial statements, for maintaining effective internal control over financial reporting, and for its assessment of the effectiveness of internal control over financial reporting, included in the accompanying Management’s Responsibility for Financial Statements and Internal Control over Financial Reporting. Our responsibility is to express opinions on the Company’s consolidated financial statements and on the Company's internal control over financial reporting based on our audits. We are a public accounting firm registered with the Public Company Accounting Oversight Board (United States) ("PCAOB") and are required to be independent with respect to the Company in accordance with the U.S. federal securities laws and the applicable rules and regulations of the Securities and Exchange Commission and the PCAOB.
We conducted our audits in accordance with the standards of the PCAOB. Those standards require that we plan and perform the audits to obtain reasonable assurance about whether the consolidated financial statements are free of material misstatement, whether due to error or fraud, and whether effective internal control over financial reporting was maintained in all material respects.
Our audits of the consolidated financial statements included performing procedures to assess the risks of material misstatement of the consolidated financial statements, whether due to error or fraud, and performing procedures that respond to those risks. Such procedures included examining, on a test basis, evidence regarding the amounts and disclosures in the consolidated financial statements. Our audits also included evaluating the accounting principles used and significant estimates made by management, as well as evaluating the overall presentation of the consolidated financial statements. Our audit of internal control over financial reporting included obtaining an understanding of internal control over financial reporting, assessing the risk that a material weakness exists, and testing and evaluating the design and operating effectiveness of internal control based on the assessed risk. Our audits also included performing such other procedures as we considered necessary in the circumstances. We believe that our audits provide a reasonable basis for our opinions.
Definition and Limitations of Internal Control over Financial Reporting
A company’s internal control over financial reporting is a process designed to provide reasonable assurance regarding the reliability of financial reporting and the preparation of financial statements for external purposes in accordance with generally accepted accounting principles. A company’s internal control over financial reporting includes those policies and procedures that (i) pertain to the maintenance of records that, in reasonable detail, accurately and fairly reflect the transactions and dispositions of the assets of the company; (ii) provide reasonable assurance that transactions are recorded as necessary to permit preparation of financial statements in accordance with generally accepted accounting principles, and that receipts and expenditures of the company are being made only in accordance with authorizations of management and directors of the company; and (iii) provide reasonable assurance regarding prevention or timely detection of unauthorized acquisition, use, or disposition of the company’s assets that could have a material effect on the financial statements.
F-4
Because of its inherent limitations, internal control over financial reporting may not prevent or detect misstatements. Also, projections of any evaluation of effectiveness to future periods are subject to the risk that controls may become inadequate because of changes in conditions, or that the degree of compliance with the policies or procedures may deteriorate.
|
/s/ PricewaterhouseCoopers LLP
|
|
PricewaterhouseCoopers LLP
|
|
Philadelphia, Pennsylvania
|
|
February 23, 2018
|
We have served as the Company’s auditor since 1985, which includes periods before the Company became subject to SEC reporting requirements.
F-5
|
December 31
|
|
December 31
|
|
||||||
|
(in millions of U.S. dollars, except share and per share data)
|
2017
|
|
2016
|
|
|||||
|
Assets
|
|||||||||
|
Investments
|
|||||||||
|
Fixed maturities available for sale, at fair value (amortized cost –
$77,835
and
$79,536
)
|
$
|
78,939
|
|
$
|
80,115
|
|
|||
|
(includes hybrid financial instruments of
$5
and
$2
)
|
|||||||||
|
Fixed maturities held to maturity, at amortized cost (fair value –
$14,474
and
$10,670
)
|
14,335
|
|
10,644
|
|
|||||
|
Equity securities, at fair value (cost –
$737
and
$706
)
|
937
|
|
814
|
|
|||||
|
Short-term investments, at fair value and amortized cost
|
3,561
|
|
3,002
|
|
|||||
|
Other investments (cost –
$4,417
and
$4,270
)
|
4,672
|
|
4,519
|
|
|||||
|
Total investments
|
102,444
|
|
99,094
|
|
|||||
|
Cash
|
728
|
|
985
|
|
|||||
|
Securities lending collateral
|
1,737
|
|
1,092
|
|
|||||
|
Accrued investment income
|
909
|
|
918
|
|
|||||
|
Insurance and reinsurance balances receivable
|
9,334
|
|
8,970
|
|
|||||
|
Reinsurance recoverable on losses and loss expenses
|
15,034
|
|
13,577
|
|
|||||
|
Reinsurance recoverable on policy benefits
|
184
|
|
182
|
|
|||||
|
Deferred policy acquisition costs
|
4,723
|
|
4,314
|
|
|||||
|
Value of business acquired
|
326
|
|
355
|
|
|||||
|
Goodwill
|
15,541
|
|
15,332
|
|
|||||
|
Other intangible assets
|
6,513
|
|
6,763
|
|
|||||
|
Prepaid reinsurance premiums
|
2,529
|
|
2,448
|
|
|||||
|
Investments in partially-owned insurance companies
|
662
|
|
666
|
|
|||||
|
Other assets
|
6,358
|
|
5,090
|
|
|||||
|
Total assets
|
$
|
167,022
|
|
$
|
159,786
|
|
|||
|
Liabilities
|
|||||||||
|
Unpaid losses and loss expenses
|
$
|
63,179
|
|
$
|
60,540
|
|
|||
|
Unearned premiums
|
15,216
|
|
14,779
|
|
|||||
|
Future policy benefits
|
5,321
|
|
5,036
|
|
|||||
|
Insurance and reinsurance balances payable
|
5,868
|
|
5,637
|
|
|||||
|
Securities lending payable
|
1,737
|
|
1,093
|
|
|||||
|
Accounts payable, accrued expenses, and other liabilities
|
9,545
|
|
8,617
|
|
|||||
|
Deferred tax liabilities
|
699
|
|
988
|
|
|||||
|
Repurchase agreements
|
1,408
|
|
1,403
|
|
|||||
|
Short-term debt
|
1,013
|
|
500
|
|
|||||
|
Long-term debt
|
11,556
|
|
12,610
|
|
|||||
|
Trust preferred securities
|
308
|
|
308
|
|
|||||
|
Total liabilities
|
115,850
|
|
111,511
|
|
|||||
|
Commitments and contingencies
|
|
|
|||||||
|
Shareholders’ equity
|
|||||||||
|
Common Shares (CHF
24.15
par value;
479,783,864
shares issued;
463,833,179
and
465,968,716
shares outstanding)
|
11,121
|
|
11,121
|
|
|||||
|
Common Shares in treasury (
15,950,685
and
13,815,148
shares)
|
(1,944
|
)
|
(1,480
|
)
|
|||||
|
Additional paid-in capital
|
13,978
|
|
15,335
|
|
|||||
|
Retained earnings
|
27,474
|
|
23,613
|
|
|||||
|
Accumulated other comprehensive income (loss) (AOCI)
|
543
|
|
(314
|
)
|
|||||
|
Total shareholders’ equity
|
51,172
|
|
48,275
|
|
|||||
|
Total liabilities and shareholders’ equity
|
$
|
167,022
|
|
$
|
159,786
|
|
|||
F-6
Chubb Limited and Subsidiaries
|
For the years ended December 31, 2017, 2016 and 2015
|
|||||||||||
|
(in millions of U.S. dollars, except per share data)
|
2017
|
|
2016
|
|
2015
|
|
|||||
|
Revenues
|
|||||||||||
|
Net premiums written
|
$
|
29,244
|
|
$
|
28,145
|
|
$
|
17,713
|
|
||
|
(Increase) decrease in unearned premiums
|
(210
|
)
|
604
|
|
(500
|
)
|
|||||
|
Net premiums earned
|
29,034
|
|
28,749
|
|
17,213
|
|
|||||
|
Net investment income
|
3,125
|
|
2,865
|
|
2,194
|
|
|||||
|
Net realized gains (losses):
|
|||||||||||
|
Other-than-temporary impairment (OTTI) losses gross
|
(46
|
)
|
(111
|
)
|
(151
|
)
|
|||||
|
Portion of OTTI losses recognized in other comprehensive income (OCI)
|
1
|
|
8
|
|
39
|
|
|||||
|
Net OTTI losses recognized in income
|
(45
|
)
|
(103
|
)
|
(112
|
)
|
|||||
|
Net realized gains (losses) excluding OTTI losses
|
129
|
|
(42
|
)
|
(308
|
)
|
|||||
|
Total net realized gains (losses) (includes
$(15)
,
$(119)
, and
$(151)
reclassified from AOCI)
|
84
|
|
(145
|
)
|
(420
|
)
|
|||||
|
Total revenues
|
32,243
|
|
31,469
|
|
18,987
|
|
|||||
|
Expenses
|
|||||||||||
|
Losses and loss expenses
|
18,454
|
|
16,052
|
|
9,484
|
|
|||||
|
Policy benefits
|
676
|
|
588
|
|
543
|
|
|||||
|
Policy acquisition costs
|
5,781
|
|
5,904
|
|
2,941
|
|
|||||
|
Administrative expenses
|
2,833
|
|
3,081
|
|
2,270
|
|
|||||
|
Interest expense
|
607
|
|
605
|
|
300
|
|
|||||
|
Other (income) expense
|
(400
|
)
|
(222
|
)
|
(51
|
)
|
|||||
|
Amortization of purchased intangibles
|
260
|
|
19
|
|
171
|
|
|||||
|
Chubb integration expenses
|
310
|
|
492
|
|
33
|
|
|||||
|
Total expenses
|
28,521
|
|
26,519
|
|
15,691
|
|
|||||
|
Income before income tax
|
3,722
|
|
4,950
|
|
3,296
|
|
|||||
|
Income tax expense (benefit) (includes
$(13)
,
$28
, and
$(2)
on reclassified unrealized gains and losses)
|
(139
|
)
|
815
|
|
462
|
|
|||||
|
Net income
|
$
|
3,861
|
|
$
|
4,135
|
|
$
|
2,834
|
|
||
|
Other comprehensive income (loss)
|
|||||||||||
|
Unrealized appreciation (depreciation)
|
$
|
618
|
|
$
|
(35
|
)
|
$
|
(1,280
|
)
|
||
|
Reclassification adjustment for net realized (gains) losses included in net income
|
15
|
|
119
|
|
151
|
|
|||||
|
633
|
|
84
|
|
(1,129
|
)
|
||||||
|
Change in:
|
|||||||||||
|
Cumulative foreign currency translation adjustment
|
471
|
|
(154
|
)
|
(958
|
)
|
|||||
|
Postretirement benefit liability adjustment
|
(16
|
)
|
545
|
|
15
|
|
|||||
|
Other comprehensive income (loss), before income tax
|
1,088
|
|
475
|
|
(2,072
|
)
|
|||||
|
Income tax (expense) benefit related to OCI items
|
(231
|
)
|
(54
|
)
|
146
|
|
|||||
|
Other comprehensive income (loss)
|
857
|
|
421
|
|
(1,926
|
)
|
|||||
|
Comprehensive income
|
$
|
4,718
|
|
$
|
4,556
|
|
$
|
908
|
|
||
|
Earnings per share
|
|||||||||||
|
Basic earnings per share
|
$
|
8.26
|
|
$
|
8.94
|
|
$
|
8.71
|
|
||
|
Diluted earnings per share
|
$
|
8.19
|
|
$
|
8.87
|
|
$
|
8.62
|
|
||
See accompanying notes to the consolidated financial statements
F-7
|
For the years ended December 31, 2017, 2016 and 2015
|
|||||||||||
|
(in millions of U.S. dollars)
|
2017
|
|
2016
|
|
2015
|
|
|||||
|
Common Shares
|
|||||||||||
|
Balance – beginning of year
|
$
|
11,121
|
|
$
|
7,833
|
|
$
|
8,055
|
|
||
|
Shares issued for Chubb Corp acquisition
|
—
|
|
3,288
|
|
—
|
|
|||||
|
Dividends declared on Common Shares – par value reduction
|
—
|
|
—
|
|
(222
|
)
|
|||||
|
Balance – end of year
|
11,121
|
|
11,121
|
|
7,833
|
|
|||||
|
Common Shares in treasury
|
|||||||||||
|
Balance – beginning of year
|
(1,480
|
)
|
(1,922
|
)
|
(1,448
|
)
|
|||||
|
Common Shares repurchased
|
(830
|
)
|
—
|
|
(734
|
)
|
|||||
|
Net shares redeemed under employee share-based compensation plans
|
366
|
|
442
|
|
260
|
|
|||||
|
Balance – end of year
|
(1,944
|
)
|
(1,480
|
)
|
(1,922
|
)
|
|||||
|
Additional paid-in capital
|
|||||||||||
|
Balance – beginning of year
|
15,335
|
|
4,481
|
|
5,145
|
|
|||||
|
Shares issued for Chubb Corp acquisition
|
—
|
|
11,916
|
|
—
|
|
|||||
|
Equity awards assumed in Chubb Corp acquisition
|
—
|
|
323
|
|
—
|
|
|||||
|
Net shares redeemed under employee share-based compensation plans
|
(313
|
)
|
(382
|
)
|
(160
|
)
|
|||||
|
Exercise of stock options
|
(58
|
)
|
(64
|
)
|
(61
|
)
|
|||||
|
Share-based compensation expense and other
|
331
|
|
313
|
|
184
|
|
|||||
|
Funding of dividends declared to Retained earnings
|
(1,317
|
)
|
(1,284
|
)
|
(653
|
)
|
|||||
|
Tax benefit on share-based compensation expense
|
—
|
|
32
|
|
26
|
|
|||||
|
Balance – end of year
|
13,978
|
|
15,335
|
|
4,481
|
|
|||||
|
Retained earnings
|
|||||||||||
|
Balance – beginning of year
|
23,613
|
|
19,478
|
|
16,644
|
|
|||||
|
Net income
|
3,861
|
|
4,135
|
|
2,834
|
|
|||||
|
Funding of dividends declared from Additional paid-in capital
|
1,317
|
|
1,284
|
|
653
|
|
|||||
|
Dividends declared on Common Shares
|
(1,317
|
)
|
(1,284
|
)
|
(653
|
)
|
|||||
|
Balance – end of year
|
27,474
|
|
23,613
|
|
19,478
|
|
|||||
|
Accumulated other comprehensive income (loss)
|
|||||||||||
|
Net unrealized appreciation on investments
|
|||||||||||
|
Balance – beginning of year
|
1,058
|
|
874
|
|
1,851
|
|
|||||
|
Change in year, before reclassification from AOCI, net of income tax benefit (expense) of
$(228)
,
$72
, and
$154
|
390
|
|
37
|
|
(1,126
|
)
|
|||||
|
Amounts reclassified from AOCI, net of income tax benefit (expense) of
$(13)
,
$28
, and
$(2)
|
2
|
|
147
|
|
149
|
|
|||||
|
Change in year, net of income tax benefit (expense) of
$(241)
,
$100
, and
$152
|
392
|
|
184
|
|
(977
|
)
|
|||||
|
Balance – end of year
|
1,450
|
|
1,058
|
|
874
|
|
|||||
|
Cumulative foreign currency translation adjustment
|
|||||||||||
|
Balance – beginning of year
|
(1,663
|
)
|
(1,539
|
)
|
(581
|
)
|
|||||
|
Change in year, net of income tax benefit of
$5
,
$30
, and nil
|
476
|
|
(124
|
)
|
(958
|
)
|
|||||
|
Balance – end of year
|
(1,187
|
)
|
(1,663
|
)
|
(1,539
|
)
|
|||||
|
Postretirement benefit liability adjustment
|
|||||||||||
|
Balance – beginning of year
|
291
|
|
(70
|
)
|
(79
|
)
|
|||||
|
Change in year, net of income tax benefit (expense) of
$5
,
$(184)
, and
$(6)
|
(11
|
)
|
361
|
|
9
|
|
|||||
|
Balance – end of year
|
280
|
|
291
|
|
(70
|
)
|
|||||
|
Accumulated other comprehensive income (loss)
|
543
|
|
(314
|
)
|
(735
|
)
|
|||||
|
Total shareholders’ equity
|
$
|
51,172
|
|
$
|
48,275
|
|
$
|
29,135
|
|
||
See accompanying notes to the consolidated financial statements
F-8
|
For the years ended December 31, 2017, 2016, and 2015
|
|||||||||||
|
(in millions of U.S. dollars)
|
2017
|
|
2016
|
|
2015
|
|
|||||
|
Cash flows from operating activities
|
|||||||||||
|
Net income
|
$
|
3,861
|
|
$
|
4,135
|
|
$
|
2,834
|
|
||
|
Adjustments to reconcile net income to net cash flows from operating activities
|
|
|
|||||||||
|
Net realized (gains) losses
|
(84
|
)
|
145
|
|
420
|
|
|||||
|
Amortization of premiums/discounts on fixed maturities
|
694
|
|
737
|
|
158
|
|
|||||
|
Amortization of UPR related to the Chubb Corp acquisition and other intangibles
|
260
|
|
1,578
|
|
171
|
|
|||||
|
Deferred income taxes
|
(527
|
)
|
96
|
|
113
|
|
|||||
|
Unpaid losses and loss expenses
|
2,137
|
|
332
|
|
(375
|
)
|
|||||
|
Unearned premiums
|
264
|
|
(680
|
)
|
335
|
|
|||||
|
Future policy benefits
|
217
|
|
188
|
|
216
|
|
|||||
|
Insurance and reinsurance balances payable
|
271
|
|
848
|
|
268
|
|
|||||
|
Accounts payable, accrued expenses, and other liabilities
|
(517
|
)
|
(97
|
)
|
179
|
|
|||||
|
Income taxes payable
|
(365
|
)
|
147
|
|
(148
|
)
|
|||||
|
Insurance and reinsurance balances receivable
|
(243
|
)
|
(616
|
)
|
(53
|
)
|
|||||
|
Reinsurance recoverable on losses and loss expenses
|
(1,248
|
)
|
(365
|
)
|
218
|
|
|||||
|
Reinsurance recoverable on policy benefits
|
—
|
|
7
|
|
33
|
|
|||||
|
Deferred policy acquisition costs
|
(317
|
)
|
(1,449
|
)
|
(435
|
)
|
|||||
|
Prepaid reinsurance premiums
|
(82
|
)
|
18
|
|
(212
|
)
|
|||||
|
Other
|
182
|
|
268
|
|
142
|
|
|||||
|
Net cash flows from operating activities
|
4,503
|
|
5,292
|
|
3,864
|
|
|||||
|
Cash flows from investing activities
|
|
||||||||||
|
Purchases of fixed maturities available for sale
|
(25,720
|
)
|
(30,759
|
)
|
(16,040
|
)
|
|||||
|
Purchases of to be announced mortgage-backed securities
|
(27
|
)
|
(56
|
)
|
(31
|
)
|
|||||
|
Purchases of fixed maturities held to maturity
|
(352
|
)
|
(282
|
)
|
(62
|
)
|
|||||
|
Purchases of equity securities
|
(173
|
)
|
(146
|
)
|
(158
|
)
|
|||||
|
Sales of fixed maturities available for sale
|
13,228
|
|
16,621
|
|
10,783
|
|
|||||
|
Sales of to be announced mortgage-backed securities
|
27
|
|
56
|
|
31
|
|
|||||
|
Sales of equity securities
|
187
|
|
1,000
|
|
183
|
|
|||||
|
Maturities and redemptions of fixed maturities available for sale
|
10,425
|
|
9,349
|
|
6,567
|
|
|||||
|
Maturities and redemptions of fixed maturities held to maturity
|
879
|
|
958
|
|
669
|
|
|||||
|
Net change in short-term investments
|
(537
|
)
|
12,350
|
|
(8,216
|
)
|
|||||
|
Net derivative instruments settlements
|
(265
|
)
|
(168
|
)
|
(21
|
)
|
|||||
|
Acquisition of subsidiaries (net of cash acquired of
$nil
,
$71
, and
$629
)
|
—
|
|
(14,248
|
)
|
264
|
|
|||||
|
Other
|
(114
|
)
|
10
|
|
(263
|
)
|
|||||
|
Net cash flows used for investing activities
|
(2,442
|
)
|
(5,315
|
)
|
(6,294
|
)
|
|||||
|
Cash flows from financing activities
|
|||||||||||
|
Dividends paid on Common Shares
|
(1,308
|
)
|
(1,173
|
)
|
(862
|
)
|
|||||
|
Common Shares repurchased
|
(801
|
)
|
—
|
|
(758
|
)
|
|||||
|
Proceeds from issuance of long-term debt
|
—
|
|
—
|
|
6,090
|
|
|||||
|
Proceeds from issuance of repurchase agreements
|
2,353
|
|
2,310
|
|
2,029
|
|
|||||
|
Repayment of long-term debt
|
(501
|
)
|
—
|
|
(1,150
|
)
|
|||||
|
Repayment of repurchase agreements
|
(2,348
|
)
|
(2,311
|
)
|
(2,027
|
)
|
|||||
|
Proceeds from share-based compensation plans
|
151
|
|
167
|
|
131
|
|
|||||
|
Policyholder contract deposits
|
442
|
|
522
|
|
503
|
|
|||||
|
Policyholder contract withdrawals
|
(307
|
)
|
(253
|
)
|
(221
|
)
|
|||||
|
Other
|
—
|
|
(4
|
)
|
(40
|
)
|
|||||
|
Net cash flows (used for) from financing activities
|
(2,319
|
)
|
(742
|
)
|
3,695
|
|
|||||
|
Effect of foreign currency rate changes on cash and cash equivalents
|
1
|
|
(25
|
)
|
(145
|
)
|
|||||
|
Net (decrease) increase in cash
|
(257
|
)
|
(790
|
)
|
1,120
|
|
|||||
|
Cash – beginning of year
|
985
|
|
1,775
|
|
655
|
|
|||||
|
Cash – end of year
|
$
|
728
|
|
$
|
985
|
|
$
|
1,775
|
|
||
|
Supplemental cash flow information
|
|||||||||||
|
Taxes paid
|
$
|
736
|
|
$
|
662
|
|
$
|
469
|
|
||
|
Interest paid
|
$
|
644
|
|
$
|
642
|
|
$
|
259
|
|
||
F-9
1
. Summary of significant accounting policies
a) Basis of presentation
Chubb Limited is a holding company incorporated in Zurich, Switzerland. Chubb Limited, through its subsidiaries, provides a broad range of insurance and reinsurance products to insureds worldwide. Our results are reported through the following business segments: North America Commercial P&C Insurance, North America Personal P&C Insurance, North America Agricultural Insurance, Overseas General Insurance, Global Reinsurance, and Life Insurance. Refer to Note
15
for additional information.
The accompanying consolidated financial statements, which include the accounts of Chubb Limited and its subsidiaries (collectively, Chubb, we, us, or our), have been prepared in accordance with accounting principles generally accepted in the United States of America (GAAP) and, in the opinion of management, reflect all adjustments (consisting of normally recurring accruals) necessary for a fair statement of the results and financial position for such periods. All significant intercompany accounts and transactions, including internal reinsurance transactions, have been eliminated.
The preparation of financial statements in conformity with GAAP requires management to make estimates and assumptions that affect the reported amounts of assets and liabilities, disclosure of contingent assets and liabilities at the date of the financial statements, and the reported amounts of revenues and expenses during the reporting period. Amounts included in the Consolidated financial statements reflect our best estimates and assumptions; actual amounts could differ materially from these estimates. Chubb's principal estimates include:
|
•
|
unpaid loss and loss expense reserves, including long-tail asbestos and environmental (A&E) reserves;
|
|
•
|
future policy benefits reserves;
|
|
•
|
the valuation of value of business acquired (VOBA) and amortization of deferred policy acquisition costs and VOBA;
|
|
•
|
reinsurance recoverable, including a provision for uncollectible reinsurance;
|
|
•
|
the assessment of risk transfer for certain structured insurance and reinsurance contracts;
|
|
•
|
the valuation of the investment portfolio and assessment of OTTI;
|
|
•
|
the valuation of deferred tax assets;
|
|
•
|
the valuation of derivative instruments related to guaranteed living benefits (GLB);
|
|
•
|
the valuation and amortization of purchased intangibles; and
|
|
•
|
the assessment of goodwill for impairment.
|
b) Premiums
Premiums are generally recorded as written upon inception of the policy. For multi-year policies for which premiums written are payable in annual installments, only the current annual premium is included as written at policy inception due to the ability of the insured/reinsured to commute or cancel coverage within the policy term. The remaining annual premiums are recorded as written at each successive anniversary date within the multi-year term.
For P&C insurance and reinsurance products, premiums written are primarily earned on a pro-rata basis over the policy terms to which they relate. Unearned premiums represent the portion of premiums written applicable to the unexpired portion of the policies in force. For retrospectively-rated policies, written premiums are adjusted to reflect expected ultimate premiums consistent with changes to incurred losses, or other measures of exposure as stated in the policy, and earned over the policy coverage period. For retrospectively-rated multi-year policies, premiums recognized in the current period are computed using a with-and-without method as the difference between the ceding enterprise's total contract costs before and after the experience under the contract at the reporting date. Accordingly, for retrospectively-rated multi-year policies, additional premiums are generally written and earned when losses are incurred.
Mandatory reinstatement premiums assessed on reinsurance policies are earned in the period of the loss event that gave rise to the reinstatement premiums. All remaining unearned premiums are recognized over the remaining coverage period.
F-10
NOTES TO CONSOLIDATED FINANCIAL STATEMENTS
(continued)
Chubb Limited and Subsidiaries
Premiums from long-duration contracts such as certain traditional term life, whole life, endowment, and long-duration personal accident and health (A&H) policies are generally recognized as revenue when due from policyholders. Traditional life policies include those contracts with fixed and guaranteed premiums and benefits. Benefits and expenses are matched with income to result in the recognition of profit over the life of the contracts.
Retroactive loss portfolio transfer (LPT) contracts in which the insured loss events occurred prior to contract inception are evaluated to determine whether they meet criteria for reinsurance accounting. If reinsurance accounting is appropriate, written premiums are fully earned and corresponding losses and loss expenses recognized at contract inception. These contracts can cause significant variances in gross premiums written, net premiums written, net premiums earned, and net incurred losses in the years in which they are written. Reinsurance contracts sold not meeting criteria for reinsurance accounting are recorded using the deposit method as described below in Note
1
k).
Reinsurance premiums assumed are based on information provided by ceding companies supplemented by our own estimates of premium when we have not received ceding company reports. Estimates are reviewed and adjustments are recorded in the period in which they are determined. Premiums are earned over the coverage terms of the related reinsurance contracts and range from
one
to
three
years.
c) Deferred policy acquisition costs and value of business acquired
Policy acquisition costs consist of commissions (direct and ceded), premium taxes, and certain underwriting costs related directly to the successful acquisition of new or renewal insurance contracts. A VOBA intangible asset is established upon the acquisition of blocks of long-duration contracts in a business combination and represents the present value of estimated net cash flows for the contracts in force at the acquisition date. Acquisition costs and VOBA, collectively policy acquisition costs, are deferred and amortized. Amortization is recorded in Policy acquisition costs in the Consolidated statements of operations. Policy acquisition costs on P&C contracts are generally amortized ratably over the period in which premiums are earned. Policy acquisition costs on traditional long-duration contracts are amortized over the estimated life of the contracts, generally in proportion to premium revenue recognized based upon the same assumptions used in estimating the liability for future policy benefits. For non-traditional long-duration contracts, we amortize policy acquisition costs over the expected life of the contracts in proportion to expected gross profits. The effect of changes in estimates of expected gross profits is reflected in the period the estimates are revised. Policy acquisition costs are reviewed to determine if they are recoverable from future income, including investment income. Unrecoverable policy acquisition costs are expensed in the period identified.
Advertising costs are expensed as incurred except for direct-response campaigns that qualify for cost deferral, principally related to long-duration A&H business produced by the Overseas General Insurance segment, which are deferred and recognized as a component of Policy acquisition costs
.
For individual direct-response marketing campaigns that we can demonstrate have specifically resulted in incremental sales to customers and such sales have probable future economic benefits, incremental costs directly related to the marketing campaigns are capitalized as Deferred policy acquisition costs. Deferred policy acquisition costs, including deferred marketing costs, are reviewed regularly for recoverability from future income, including investment income, and amortized in proportion to premium revenue recognized, primarily over a
ten
-year period, the expected economic future benefit period based upon the same assumptions used in estimating the liability for future policy benefits. The expected future benefit period is evaluated periodically based on historical results and adjusted prospectively. The amount of deferred marketing costs reported in Deferred policy acquisition costs in the Consolidated balance sheets was $
271
million and $
256
million at
December 31, 2017
and
2016
, respectively. Amortization expense for deferred marketing costs was $
116
million, $
92
million, and $
78
million for the years ended
December 31, 2017
,
2016
, and
2015
, respectively.
d) Reinsurance
Chubb assumes and cedes reinsurance with other insurance companies to provide greater diversification of business and minimize the net loss potential arising from large risks. Ceded reinsurance contracts do not relieve Chubb of its primary obligation to policyholders.
For both ceded and assumed reinsurance, risk transfer requirements must be met in order to account for a contract as reinsurance, principally resulting in the recognition of cash flows under the contract as premiums and losses. To meet risk transfer requirements, a reinsurance contract must include insurance risk, consisting of both underwriting and timing risk, and a reasonable possibility of a significant loss for the assuming entity. To assess risk transfer for certain contracts, Chubb generally develops expected discounted cash flow analyses at contract inception. Deposit accounting is used for contracts that do not meet risk transfer requirements. Deposit accounting requires that consideration received or paid be recorded in the balance sheet as opposed to recording premiums written or losses incurred in the statement of operations. Non-refundable fees on deposit contracts are earned based on the terms of the contract described below in Note
1
k).
F-11
NOTES TO CONSOLIDATED FINANCIAL STATEMENTS
(continued)
Chubb Limited and Subsidiaries
Reinsurance recoverable includes balances due from reinsurance companies for paid and unpaid losses and loss expenses and future policy benefits that will be recovered from reinsurers, based on contracts in force. The method for determining the reinsurance recoverable on unpaid losses and loss expenses incurred but not reported (IBNR) involves actuarial estimates consistent with those used to establish the associated liability for unpaid losses and loss expenses as well as a determination of Chubb's ability to cede unpaid losses and loss expenses under the terms of the reinsurance agreement.
Reinsurance recoverable is presented net of a provision for uncollectible reinsurance determined based upon a review of the financial condition of reinsurers and other factors. The provision for uncollectible reinsurance is based on an estimate of the reinsurance recoverable balance that will ultimately be unrecoverable due to reinsurer insolvency, a contractual dispute, or any other reason. The valuation of this provision includes several judgments including certain aspects of the allocation of reinsurance recoverable on IBNR claims by reinsurer and a default analysis to estimate uncollectible reinsurance. The primary components of the default analysis are reinsurance recoverable balances by reinsurer, net of collateral, and default factors used to determine the portion of a reinsurer's balance deemed uncollectible. The definition of collateral for this purpose requires some judgment and is generally limited to assets held in a Chubb-only beneficiary trust, letters of credit, and liabilities held with the same legal entity for which Chubb believes there is a contractual right of offset. The determination of the default factor is principally based on the financial strength rating of the reinsurer. Default factors require considerable judgment and are determined using the current financial strength rating, or rating equivalent, of each reinsurer as well as other key considerations and assumptions. The more significant considerations include, but are not necessarily limited to, the following:
|
•
|
For reinsurers that maintain a financial strength rating from a major rating agency, and for which recoverable balances are considered representative of the larger population (i.e., default probabilities are consistent with similarly rated reinsurers and payment durations conform to averages), the financial rating is based on a published source and the default factor is based on published default statistics of a major rating agency applicable to the reinsurer's particular rating class. When a recoverable is expected to be paid in a brief period of time by a highly rated reinsurer, such as certain property catastrophe claims, a default factor may not be applied;
|
|
•
|
For balances recoverable from reinsurers that are both unrated by a major rating agency and for which management is unable to determine a credible rating equivalent based on a parent, affiliate, or peer company, we determine a rating equivalent based on an analysis of the reinsurer that considers an assessment of the creditworthiness of the particular entity, industry benchmarks, or other factors as considered appropriate. We then apply the applicable default factor for that rating class. For balances recoverable from unrated reinsurers for which the ceded reserve is below a certain threshold, we generally apply a default factor of
34
percent, consistent with published statistics of a major rating agency;
|
|
•
|
For balances recoverable from reinsurers that are either insolvent or under regulatory supervision, we establish a default factor and resulting provision for uncollectible reinsurance based on reinsurer-specific facts and circumstances. Upon initial notification of an insolvency, we generally recognize an expense for a substantial portion of all balances outstanding, net of collateral, through a combination of write-offs of recoverable balances and increases to the provision for uncollectible reinsurance. When regulatory action is taken on a reinsurer, we generally recognize a default factor by estimating an expected recovery on all balances outstanding, net of collateral. When sufficient credible information becomes available, we adjust the provision for uncollectible reinsurance by establishing a default factor pursuant to information received; and
|
|
•
|
For other recoverables, management determines the provision for uncollectible reinsurance based on the specific facts and circumstances.
|
The methods used to determine the reinsurance recoverable balance and related provision for uncollectible reinsurance are regularly reviewed and updated, and any resulting adjustments are reflected in earnings in the period identified.
Prepaid reinsurance premiums represent the portion of premiums ceded to reinsurers applicable to the unexpired coverage terms of the reinsurance contracts in-force.
The value of reinsurance business assumed of $
18
million and $
20
million at
December 31, 2017
and
2016
, respectively, included in Other assets in the accompanying Consolidated balance sheets, represents the excess of estimated ultimate value of the liabilities assumed under retroactive reinsurance contracts over consideration received. The value of reinsurance business assumed is amortized and recorded to Losses and loss expenses based on the payment pattern of the losses assumed and ranges between
9
and
40
years. The unamortized value is reviewed regularly to determine if it is recoverable based upon the terms of the contract, estimated losses and loss expenses, and anticipated investment income. Unrecoverable amounts are expensed in the period identified.
F-12
NOTES TO CONSOLIDATED FINANCIAL STATEMENTS
(continued)
Chubb Limited and Subsidiaries
e) Investments
Fixed maturities are classified as either available for sale or held to maturity. The available for sale portfolio is reported at fair value. The held to maturity portfolio includes securities for which we have the ability and intent to hold to maturity or redemption and is reported at amortized cost. Equity securities are classified as available for sale and are recorded at fair value. Short-term investments comprise securities due to mature within one year of the date of purchase and are recorded at fair value which typically approximates cost. Short-term investments include certain cash and cash equivalents, which are part of investment portfolios under the management of external investment managers.
Other investments principally comprise life insurance policies, policy loans, trading securities, other direct equity investments, investment funds, and limited partnerships.
|
•
|
Life insurance policies are carried at policy cash surrender value and income is recorded in Other income (expense).
|
|
•
|
Policy loans are carried at outstanding balance and interest income is recorded to Net investment income.
|
|
•
|
Trading securities are recorded on a trade date basis and carried at fair value. Unrealized gains and losses on trading securities are reflected in Other (income) expense.
|
|
•
|
Other investments over which Chubb can exercise significant influence are accounted for using the equity method and income is recorded in Other (income) expense.
|
|
•
|
All other investments over which Chubb cannot exercise significant influence are carried at fair value with changes in fair value recognized through OCI. For these investments, investment income is recognized in Net investment income and realized gains are recognized as related distributions are received.
|
|
•
|
Partially-owned investment companies comprise entities in which we hold an ownership interest in excess of three percent. These investments as well as Chubb's investments in investment funds where our ownership interest is in excess of three percent are accounted for under the equity method because Chubb exerts significant influence. These investments apply investment company accounting to determine operating results, and Chubb retains the investment company accounting in applying the equity method. This means that investment income, realized gains or losses, and unrealized gains or losses are included in the portion of equity earnings reflected in Other (income) expense. As a result of the timing of the receipt of valuation data from the investment managers, these investments are generally reported on a three month lag.
|
Investments in partially-owned insurance companies primarily represent direct investments in which Chubb has significant influence and, as such, meet the requirements for equity accounting. We report our share of the net income or loss of the partially-owned insurance companies in Other (income) expense.
Realized gains or losses on sales of investments are determined on a first-in, first-out basis. Unrealized appreciation (depreciation) on investments is included as a separate component of AOCI in Shareholders' equity. We regularly review our investments for OTTI. Refer to Note
3
for additional information.
With respect to securities where the decline in value is determined to be temporary and the security's value is not written down, a subsequent decision may be made to sell that security and realize a loss. Subsequent decisions on security sales are the result of changing or unforeseen facts and circumstances (i.e., arising from a large insured loss such as a catastrophe), deterioration of the creditworthiness of the issuer or its industry, or changes in regulatory requirements. We believe that subsequent decisions to sell such securities are consistent with the classification of the majority of the portfolio as available for sale.
We use derivative instruments including futures, options, swaps, and foreign currency forward contracts for the purpose of managing certain investment portfolio risks and exposures. Refer to Note
10
for additional information. Derivatives are reported at fair value and are recorded in the accompanying Consolidated balance sheets in either Accounts payable, accrued expenses, and other liabilities or Other assets with changes in fair value included in Net realized gains (losses) in the Consolidated statements of operations. Collateral held by brokers equal to a percentage of the total value of open futures contracts is included in the investment portfolio.
Net investment income includes interest and dividend income and amortization of fixed maturity market premiums and discounts and is net of investment management and custody fees. In addition, net investment income includes the amortization of the fair value adjustment related to the acquired invested assets of Chubb Corp. An adjustment of
$1,652 million
related to the fair value of Chubb Corp’s fixed maturities securities was recorded (fair value adjustment) at the date of acquisition. At December 31, 2017, the remaining balance of this fair value adjustment was
$858 million
which is expected to amortize over the next four years; however, the estimate could vary materially based on current market conditions, bond calls, and the
F-13
NOTES TO CONSOLIDATED FINANCIAL STATEMENTS
(continued)
Chubb Limited and Subsidiaries
duration of the acquired investment portfolio. In addition, sales of these acquired fixed maturities would also reduce the fair value adjustment balance. For mortgage-backed securities, and any other holdings for which there is a prepayment risk, prepayment assumptions are evaluated and revised as necessary. Any adjustments required due to the resultant change in effective yields and maturities are recognized prospectively. Prepayment fees or call premiums that are only payable when a security is called prior to its maturity are earned when received and reflected in Net investment income.
Chubb participates in a securities lending program operated by a third-party banking institution whereby certain assets are loaned to qualified borrowers and from which we earn an incremental return. Borrowers provide collateral, in the form of either cash or approved securities, of
102
percent of the fair value of the loaned securities. Each security loan is deemed to be an overnight transaction. Cash collateral is invested in a collateral pool which is managed by the banking institution. The collateral pool is subject to written investment guidelines with key objectives which include the safeguard of principal and adequate liquidity to meet anticipated redemptions. The fair value of the loaned securities is monitored on a daily basis, with additional collateral obtained or refunded as the fair value of the loaned securities changes. The collateral is held by the third-party banking institution, and the collateral can only be accessed in the event that the institution borrowing the securities is in default under the lending agreement. As a result of these restrictions, we consider our securities lending activities to be non-cash investing and financing activities. An indemnification agreement with the lending agent protects us in the event a borrower becomes insolvent or fails to return any of the securities on loan. The fair value of the securities on loan is included in fixed maturities and equity securities. The securities lending collateral is reported as a separate line in the Consolidated balance sheets with a related liability reflecting our obligation to return the collateral plus interest.
Similar to securities lending arrangements, securities sold under repurchase agreements, whereby Chubb sells securities and repurchases them at a future date for a predetermined price, are accounted for as collateralized investments and borrowings and are recorded at the contractual repurchase amounts plus accrued interest. Assets to be repurchased are the same, or substantially the same, as the assets transferred and the transferor, through right of substitution, maintains the right and ability to redeem the collateral on short notice. The fair value of the underlying securities is included in fixed maturities and equity securities. In contrast to securities lending programs, the use of cash received is not restricted. We report the obligation to return the cash as Repurchase agreements in the Consolidated balance sheets.
Refer to Note
4
for a discussion on the determination of fair value for Chubb's various investment securities.
f) Cash
Cash includes cash on hand and deposits with an original maturity of three months or less at time of purchase. Cash held by external money managers is included in Short-term investments.
We have agreements with a third-party bank provider which implemented two international multi-currency notional cash pooling programs. In each program, participating Chubb entities establish deposit accounts in different currencies with the bank provider and each day the credit or debit balances in every account are notionally translated into a single currency (U.S. dollars) and then notionally pooled. The bank extends overdraft credit to any participating Chubb entity as needed, provided that the overall notionally-pooled balance of all accounts in each pool at the end of each day is at least zero. Actual cash balances are not physically converted and are not commingled between legal entities. Any overdraft balances incurred under this program by a Chubb entity would be guaranteed by Chubb Limited (up to $
300
million in the aggregate). Our syndicated letter of credit facility allows for same day drawings to fund a net pool overdraft should participating Chubb entities overdraw contributed funds from the pool.
g) Goodwill and Other intangible assets
Goodwill represents the excess of the cost of acquisitions over the fair value of net assets acquired and is not amortized. Goodwill is assigned at acquisition to the applicable reporting unit of the acquired entities giving rise to the goodwill. Goodwill impairment tests are performed annually or more frequently if circumstances indicate a possible impairment. For goodwill impairment testing, we use a qualitative assessment to determine whether it is more likely than not (i.e., more than a
50
percent probability) that the fair value of a reporting unit is greater than its carrying amount. If our assessment indicates less than a
50
percent probability that fair value exceeds carrying value, we quantitatively estimate a reporting unit's fair value. Goodwill recorded in connection with investments in partially-owned insurance companies is recorded in Investments in partially-owned insurance companies and is also measured for impairment annually.
Indefinite lived intangible assets are not subject to amortization. Finite lived intangible assets are amortized over their useful lives, generally ranging from
1
to
30
years. Intangible assets are regularly reviewed for indicators of impairment. Impairment is
F-14
NOTES TO CONSOLIDATED FINANCIAL STATEMENTS
(continued)
Chubb Limited and Subsidiaries
recognized if the carrying amount is not recoverable from its undiscounted cash flows and is measured as the difference between the carrying amount and fair value.
h) Unpaid losses and loss expenses
A liability is established for the estimated unpaid losses and loss expenses under the terms of, and with respect to, Chubb's policies and agreements. Similar to premiums that are recognized as revenues over the coverage period of the policy, a liability for unpaid losses and loss expenses is recognized as expense when insured events occur over the coverage period of the policy. This liability includes a provision for both reported claims (case reserves) and incurred but not reported claims (IBNR reserves). IBNR reserve estimates are generally calculated by first projecting the ultimate cost of all losses that have occurred (expected losses), and then subtracting paid losses, case reserves, and loss expenses. The methods of determining such estimates and establishing the resulting liability are reviewed regularly and any adjustments are reflected in operations in the period in which they become known. Future developments may result in losses and loss expenses materially greater or less than recorded amounts.
Except for net loss and loss expense reserves of $
36
million net of discount, held at
December 31, 2017
, representing certain structured settlements for which the timing and amount of future claim payments are reliably determinable and $
41
million, net of discount, of certain reserves for unsettled claims that are discounted in statutory filings, Chubb does not discount its P&C loss reserves. This compares with reserves of $
38
million for certain structured settlements and $
50
million of certain reserves for unsettled claims at
December 31, 2016
. Structured settlements represent contracts purchased from life insurance companies primarily to settle workers' compensation claims, where payments to the claimant by the life insurance company are expected to be made in the form of an annuity. Chubb retains the liability to the claimant in the event that the life insurance company fails to pay. At
December 31, 2017
, the liability due to claimants was $
586
million, net of discount, and reinsurance recoverables due from the life insurance companies was $
550
million, net of discount. For structured settlement contracts where payments are guaranteed regardless of claimant life expectancy, the amounts recoverable from the life insurance companies at
December 31, 2017
are included in Other assets in the Consolidated balance sheets, as they do not meet the requirements for reinsurance accounting.
Included in Unpaid losses and loss expenses are liabilities for asbestos and environmental (A&E) claims and expenses. These unpaid losses and loss expenses are principally related to claims arising from remediation costs associated with hazardous waste sites and bodily-injury claims related to asbestos products and environmental hazards. The estimation of these liabilities is particularly sensitive to changes in the legal environment including specific settlements that may be used as precedents to settle future claims. However, Chubb does not anticipate future changes in laws and regulations in setting its A&E reserve levels.
Also included in Unpaid losses and loss expenses is a fair value adjustment of $
309 million
at December 31, 2017 related to Chubb Corp’s historical unpaid losses and loss expenses. The estimated fair value consists of the present value of the expected net unpaid loss and loss adjustment expense payments adjusted for an estimated risk margin. The estimated cash flows are discounted at a risk free rate. The estimated risk margin varies based on the inherent risks associated with each type of reserve. The fair value is amortized through Amortization of purchased intangibles on the consolidated statements of operations over a range of
5
to
17
years, based on the estimated payout patterns of unpaid loss and loss expenses at the acquisition date.
Prior period development arises from changes to loss estimates recognized in the current year that relate to loss reserves first reported in previous calendar years and excludes the effect of losses from the development of earned premiums from previous accident years.
For purposes of analysis and disclosure, management views prior period development to be changes in the nominal value of loss estimates from period to period, net of premium and profit commission adjustments on loss sensitive contracts. Prior period development generally excludes changes in loss estimates that do not arise from the emergence of claims, such as those related to uncollectible reinsurance, interest, unallocated loss adjustment expenses, or foreign currency. Accordingly, specific items excluded from prior period development include the following: gains/losses related to foreign currency remeasurement; losses recognized from the early termination or commutation of reinsurance agreements that principally relate to the time value of money; changes in the value of reinsurance business assumed reflected in losses incurred but principally related to the time value of money; and losses that arise from changes in estimates of earned premiums from prior accident years. Except for foreign currency remeasurement, which is included in Net realized gains (losses), these items are included in current year losses.
F-15
NOTES TO CONSOLIDATED FINANCIAL STATEMENTS
(continued)
Chubb Limited and Subsidiaries
i) Future policy benefits
The valuation of long-duration contract reserves requires management to make estimates and assumptions regarding expenses, mortality, persistency, and investment yields. Estimates are primarily based on historical experience and information provided by ceding companies and include a margin for adverse deviation. Interest rates used in calculating reserves range from less than
1.0 percent
to
8.0 percent
at both
December 31, 2017
and
2016
. Actual results could differ materially from these estimates. Management monitors actual experience and where circumstances warrant, will revise assumptions and the related reserve estimates. Revisions are recorded in the period they are determined.
Certain of our long-duration contracts are supported by assets that do not qualify for separate account reporting under GAAP. These assets are classified as trading securities and reported in Other investments and the offsetting liabilities are reported in Future policy benefits in the Consolidated balance sheets. Changes in the fair value of separate account assets that do not qualify for separate account reporting under GAAP are reported in Other income (expense) and the offsetting movements in the liabilities are included in Policy benefits in the Consolidated statements of operations.
j) Assumed reinsurance programs involving minimum benefit guarantees under variable annuity contracts
Chubb reinsures various death and living benefit guarantees associated with variable annuities issued primarily in the United States and Japan. We generally receive a monthly premium during the accumulation phase of the covered annuities (in-force) based on a percentage of either the underlying accumulated account values or the underlying accumulated guaranteed values. Depending on an annuitant's age, the accumulation phase can last many years. To limit our exposure under these programs, all reinsurance treaties include annual or aggregate claim limits and many include an aggregate deductible.
The guarantees which are payable on death, referred to as guaranteed minimum death benefits (GMDB), principally cover shortfalls between accumulated account value at the time of an annuitant's death and either i) an annuitant's total deposits; ii) an annuitant's total deposits plus a minimum annual return; or iii) the highest accumulated account value attained at any policy anniversary date. In addition, a death benefit may be based on a formula specified in the variable annuity contract that uses a percentage of the growth of the underlying contract value. Liabilities for GMDBs are based on cumulative assessments or premiums to date multiplied by a benefit ratio that is determined by estimating the present value of benefit payments and related adjustment expenses divided by the present value of cumulative assessment or expected premiums during the contract period.
Under reinsurance programs covering GLBs, we assume the risk of guaranteed minimum income benefits (GMIB) and guaranteed minimum accumulation benefits (GMAB) associated with variable annuity contracts. The GMIB risk is triggered if, at the time the contract holder elects to convert the accumulated account value to a periodic payment stream (annuitize), the accumulated account value is not sufficient to provide a guaranteed minimum level of monthly income. The GMAB risk is triggered if, at contract maturity, the contract holder's account value is less than a guaranteed minimum value. Our GLB reinsurance products meet the definition of a derivative for accounting purposes and are carried at fair value with changes in fair value recognized in income. Refer to Notes
5
c
) and 10 a) for additional information.
k) Deposit assets and liabilities
Deposit assets arise from ceded reinsurance contracts purchased that do not transfer significant underwriting or timing risk. Deposit liabilities include reinsurance deposit liabilities and contract holder deposit funds. The reinsurance deposit liabilities arise from contracts sold for which there is not a significant transfer of risk. Contract holder deposit funds represent a liability for investment contracts sold that do not meet the definition of an insurance contract, and certain of these contracts are sold with a guaranteed rate of return. Under deposit accounting, consideration received or paid is recorded as a deposit asset or liability in the balance sheet as opposed to recording premiums and losses in the statement of operations.
Interest income on deposit assets, representing the consideration received or to be received in excess of cash payments related to the deposit contract, is earned based on an effective yield calculation. The calculation of the effective yield is based on the amount and timing of actual cash flows at the balance sheet date and the estimated amount and timing of future cash flows. The effective yield is recalculated periodically to reflect revised estimates of cash flows. When a change in the actual or estimated cash flows occurs, the resulting change to the carrying amount of the deposit asset is reported as income or expense. Deposit assets of $
89
million and $
93
million at
December 31, 2017
and
2016
, respectively, are reflected in Other assets in the Consolidated balance sheets and the accretion of deposit assets related to interest pursuant to the effective yield calculation is reflected in Net investment income in the Consolidated statements of operations.
Deposit liabilities include reinsurance deposit liabilities of $
100
million and $
108
million and contract holder deposit funds of $
1.8
billion and $
1.5
billion at
December 31, 2017
and
2016
, respectively. Deposit liabilities are reflected in Accounts
F-16
NOTES TO CONSOLIDATED FINANCIAL STATEMENTS
(continued)
Chubb Limited and Subsidiaries
payable, accrued expenses, and other liabilities in the Consolidated balance sheets. At contract inception, the deposit liability equals net cash received. An accretion rate is established based on actuarial estimates whereby the deposit liability is increased to the estimated amount payable over the contract term. The deposit accretion rate is the rate of return required to fund expected future payment obligations. We periodically reassess the estimated ultimate liability and related expected rate of return. Changes to the deposit liability are generally reflected through Interest expense to reflect the cumulative effect of the period the contract has been in force, and by an adjustment to the future accretion rate of the liability over the remaining estimated contract term.
The liability for contract holder deposit funds equals accumulated policy account values, which consist of the deposit payments plus credited interest less withdrawals and amounts assessed through the end of the period.
l) Property and Equipment
Property and equipment used in operations, including certain costs incurred to develop or obtain computer software for internal use, are capitalized and carried at cost less accumulated depreciation. Depreciation is calculated using the straight-line method over the estimated useful lives of the assets. Property and equipment are included in Other assets in the Consolidated balance sheets and totaled $
1.3 billion
and $
1.2 billion
at December 31, 2017 and 2016, respectively.
m) Foreign currency remeasurement and translation
The functional currency for each of our foreign operations is generally the currency of the local operating environment. Transactions in currencies other than a foreign operation's functional currency are remeasured into the functional currency and the resulting foreign exchange gains and losses are reflected in Net realized gains (losses) in the Consolidated statements of operations. Functional currency assets and liabilities are translated into the reporting currency, U.S. dollars, using period end exchange rates and the related translation adjustments are recorded as a separate component of AOCI. Functional statement of operations amounts expressed in functional currencies are translated using average exchange rates.
n) Administrative expenses
Administrative expenses generally include all operating costs other than policy acquisition costs. The North America Commercial P&C Insurance segment manages and uses an in-house third-party claims administrator, ESIS Inc. (ESIS). ESIS performs claims management and risk control services for domestic and international organizations that self-insure P&C exposures as well as internal P&C exposures. The net operating results of ESIS are included within Administrative expenses in the Consolidated statements of operations and were $
38
million, $
32
million, and $
30
million for the years ended
December 31, 2017
,
2016
, and
2015
, respectively.
o) Income taxes
Income taxes have been recorded related to those operations subject to income taxes. Deferred tax assets and liabilities result from temporary differences between the amounts recorded in the Consolidated financial statements and the tax basis of our assets and liabilities. The effect on deferred tax assets and liabilities of a change in tax law or rates is recognized in income in the period that includes the enactment date. For example, we recorded a net reduction in our deferred tax balances reflecting the impact of the Tax Cuts and Jobs Act (2017 Tax Act) in the fourth quarter of 2017, the period when the legislation was enacted. Refer to Note
8
for additional information. A valuation allowance against deferred tax assets is recorded if it is more likely than not that all, or some portion, of the benefits related to deferred tax assets will not be realized. The valuation allowance assessment considers tax planning strategies, where applicable.
We recognize uncertain tax positions deemed more likely than not of being sustained upon examination. Recognized income tax positions are measured at the largest amount that has a greater than
50
percent likelihood of being realized. Changes in recognition or measurement are reflected in the period in which the change in judgment occurs.
p) Earnings per share
Basic earnings per share is calculated using the weighted-average shares outstanding including participating securities with non-forfeitable rights to dividends such as unvested restricted stock. All potentially dilutive securities including stock options are excluded from the basic earnings per share calculation. In calculating diluted earnings per share, the weighted-average shares outstanding is increased to include all potentially dilutive securities. Basic and diluted earnings per share are calculated by dividing net income by the applicable weighted-average number of shares outstanding during the year.
q) Cash flow information
Premiums received and losses paid associated with the GLB reinsurance products, which as discussed previously meet the definition of a derivative instrument for accounting purposes, are included within Cash flows from operating activities. Cash
F-17
NOTES TO CONSOLIDATED FINANCIAL STATEMENTS
(continued)
Chubb Limited and Subsidiaries
flows, such as settlements and collateral requirements, associated with GLB and all other derivative instruments are included on a net basis within Cash flows from investing activities. Purchases, sales, and maturities of short-term investments are recorded on a net basis within Cash flows from investing activities.
r) Derivatives
Chubb recognizes all derivatives at fair value in the Consolidated balance sheets and participates in derivative instruments in two principal ways:
(i)
To sell protection to customers as an insurance or reinsurance contract that meets the definition of a derivative for accounting purposes
.
For
2017
and
2016
, the reinsurance of GLBs was our primary product falling into this category; and
(ii)
To mitigate financial risks, principally arising from investment holdings, products sold, or assets and liabilities held in foreign currencies. For these instruments, changes in assets or liabilities measured at fair value are recorded as realized gains or losses in the Consolidated statements of operations.
We did not designate any derivatives as accounting hedges during
2017
,
2016
, or
2015
.
s) Share-based compensation
Chubb measures and records compensation cost for all share-based payment awards at grant-date fair value. Compensation costs are recognized for share-based payment awards with only service conditions that have graded vesting schedules on a straight-line basis over the requisite service period for each separately vesting portion of the award as if the award were, in substance, multiple awards. Refer to Note
12
for additional information.
t) Chubb integration expenses
Direct costs related to the Chubb Corp acquisition were expensed as incurred. Chubb integration expenses were $
310 million
and $
492 million
for the years ended December 31, 2017 and 2016, respectively, and include all internal and external costs directly related to the integration activities of the Chubb Corp acquisition, consisting primarily of personnel-related expenses, including severance and employee retention and relocation; lease termination costs; and consulting fees. Chubb integration expenses were $
33 million
for the year ended December 31, 2015, consisting primarily of personnel-related expenses; consulting fees; and advisor fees.
u) New accounting pronouncements
Adopted in 2017
Stock Compensation
Effective January 2017, we prospectively adopted new guidance on stock compensation which requires recognition of the excess tax benefits or deficiencies of share-based compensation awards to employees through net income rather than through additional paid in capital. The calculation of the excess tax benefits or deficiencies is based on the difference between the market value of a stock award at the date of vesting, or at the time of exercise for a stock option, compared to the grant date fair value recognized as compensation expense in the Consolidated statements of operations. For the year ended December 31, 2017, the excess tax benefit recorded to Income tax expense in the Consolidated statement of operations was $
48 million
. Additionally, the guidance allowed for an election to account for forfeitures related to share-based payments either as they occur or through an estimation method. We elected to retain our current accounting for compensation expense using a forfeiture estimation process.
Income Tax Accounting Implications of the Tax Cuts and Jobs Act
The Tax Cuts and Jobs Act (2017 Tax Act) was signed into legislation in December 2017. Among other things, the 2017 Tax Act reduces the U.S. federal income tax rate to
21 percent
from
35 percent
effective in 2018, institutes a dividends received deduction for foreign earnings with a related tax for the deemed repatriation of unremitted foreign earnings and creates a new base erosion anti-abuse tax (BEAT) which is a new U.S. minimum tax.
The Securities and Exchange Commission issued Staff Accounting Bulletin No. 118, Income Tax Accounting Implications of the Tax Cuts and Jobs Act, which provides guidance for the application of the 2017 Tax Act. The income tax guidance allows for the transition impact of the 2017 Tax Act to be recorded as 1) complete with all accounting implications identified, 2) provisional based on a reasonable estimate, or 3) not recorded as no reasonable estimate was determinable.
F-18
NOTES TO CONSOLIDATED FINANCIAL STATEMENTS
(continued)
Chubb Limited and Subsidiaries
We recorded a
$450 million
income tax transition benefit in the fourth quarter of 2017 on a provisional basis. This income tax benefit principally reflects our best estimate of the impact of the reduced U.S. corporate tax rate and other provisions of the 2017 Tax Act. Refer to Note 8 for additional information.
Adopted in 2018
Revenue from Contracts with Customers
In May 2014, the FASB issued an accounting standard that supersedes most existing revenue recognition guidance. The standard excludes from its scope the accounting for insurance contracts, leases, financial instruments, and certain other agreements that are governed under other GAAP guidance, but could affect the revenue recognition for certain of our claims management and risk control services. The updated guidance requires an entity to recognize revenue as performance obligations are met, in order to reflect the transfer of promised goods or services to customers in an amount that reflects the consideration the entity is entitled to receive for those goods or services. This guidance was effective for us on January 1, 2018. The adoption of this guidance did not have a material impact on our financial condition or results of operations given that the majority of our business is outside the scope of this guidance.
Financial Instruments – Recognition and Measurement of Financial Assets and Financial Liabilities
In January 2016, the FASB issued guidance that affects the recognition, measurement, presentation, and disclosure of financial instruments. The guidance requires equity investments to be measured at fair value with changes in fair value recognized through net income (other than those accounted for under equity method of accounting or those that result in consolidation of the investee). The standard was effective for us in the first quarter of 2018 and required recognition of a cumulative effect adjustment at adoption to beginning retained earnings. As a result, in the first quarter of 2018, we reduced other comprehensive income by $
455 million
, representing the unrealized appreciation on our equity investments, other than those accounted for under the equity method, with an offsetting increase in retained earnings. All subsequent changes in fair value will be recognized within realized gains (losses) on the consolidated statement of operations.
Statement of Cash Flows
In August 2016, the FASB issued guidance clarifying the classification of certain cash receipts and cash payments within the statement of cash flows, including distributions received from equity method investments. The guidance requires entities to make an accounting policy election to present cash flows received either in operating cash flows or investing cash flows based on cumulative equity-method earnings or on the nature of the distributions. We adopted this guidance effective January 1, 2018 and elected to retain our current presentation of cash receipts and cash payments based on the nature of the distributions.
Goodwill Impairment
In January 2017, the FASB issued updated guidance on goodwill impairment testing that eliminates Step 2 of the goodwill impairment test requiring entities to calculate the implied fair value of goodwill through a hypothetical purchase price allocation. Under the updated guidance, impairment will now be recognized as the amount by which a reporting unit’s carrying value exceeds its fair value. Although the standard would have been effective for us in the first quarter of 2020 on a prospective basis, we adopted this guidance early effective January 1, 2018, as permitted. The adoption of this guidance did not have an impact on our financial condition or results of operations.
Accounting guidance not yet adopted
Reclassification of Certain Tax Effects from Accumulated Other Comprehensive Income
In February 2018, the FASB issued guidance that allows the reclassification from accumulated other comprehensive loss to retained earnings for stranded tax effects resulting from the newly enacted corporate tax rate. Because the adjustment of deferred taxes due to the reduction of the corporate tax rate is required to be included in net income, the tax effects of items within accumulated other comprehensive income (referred to as stranded tax effects) do not reflect the appropriate tax rates. The amount of the reclassification will be the difference between the
35 percent
historical U.S. corporate tax rate and the newly enacted
21 percent
U.S. corporate tax rate. This guidance is effective for us in the first quarter of 2019 with early adoption permitted.
F-19
NOTES TO CONSOLIDATED FINANCIAL STATEMENTS
(continued)
Chubb Limited and Subsidiaries
Premium Amortization on Purchased Callable Debt Securities
In March 2017, the FASB issued guidance on the amortization period for purchased callable debt securities held at a premium. The guidance requires the premium to be amortized to the earliest call date. Under current guidance, premiums generally are amortized over the contracted life of the security. This guidance is effective for us in the first quarter of 2019 on a modified retrospective basis through a cumulative effect adjustment to beginning retained earnings. Early adoption is permitted. Securities held at a discount do not require an accounting change. Based on our best estimate at the time of this filing, the cumulative effect adjustment at the time of adoption would be approximately $
30 million
pre-tax.
Lease Accounting
In February 2016, the FASB issued accounting guidance requiring leases with lease terms of more than 12 months to recognize a right of use asset and a corresponding lease liability on the balance sheets. This accounting guidance is effective for us in the first quarter of 2019 on a modified retrospective basis with early adoption permitted. In January 2018, the FASB issued a proposed update that provides an alternative transition method of adoption, permitting the recognition of a cumulative-effect adjustment to retained earnings on the date of adoption. The adoption of the guidance is not expected to have a material impact on our financial condition or results of operations. We expect that the most significant impact will be the recognition of a right of use asset and a corresponding lease liability for our real estate leases.
Financial Instruments – Credit Losses: Measurement of Credit Losses on Financial Instruments
In June 2016, the FASB issued guidance on the accounting for credit losses of financial instruments that are measured at amortized cost, including held to maturity securities and reinsurance recoverables, by applying an approach based on the current expected credit losses (CECL). The estimate of expected credit losses should consider historical information, current information, as well as reasonable and supportable forecasts, including estimates of prepayments. The allowance for credit losses is a valuation account that is deducted from the amortized cost basis of the financial asset in order to present the net carrying value at the amount expected to be collected on the financial asset on the Consolidated balance sheet.
The guidance also amends the current debt security other-than-temporary impairment model by requiring an estimate of the expected credit loss (ECL) only when the fair value is below the amortized cost of the asset. The length of time the fair value of an AFS debt security has been below the amortized cost will no longer impact the determination of whether a potential credit loss exists. The AFS debt security model will also require the use of a valuation allowance as compared to the current practice of writing down the asset.
The standard is effective for us in the first quarter of 2020 with early adoption permitted in the first quarter of 2019. We will be able to assess the effect of adopting this guidance on our financial condition and results of operations closer to the date of adoption.
2
. Acquisitions
The Chubb Corporation (Chubb Corp)
On January 14, 2016, we completed the acquisition of Chubb Corp, a leading provider of middle-market commercial, specialty, surety, and personal insurance for $
29.5 billion
, comprising $
14.3 billion
in cash and $
15.2 billion
in newly-issued stock. In addition, we assumed outstanding equity awards to employees and directors with an attributed value of $
323 million
. The total consideration, including the assumption of equity awards, was
$29.8 billion
. We recognized goodwill of $
10.5 billion
, attributable to expected growth and profitability,
none
of which is expected to be deductible for income tax purposes. We financed the cash portion of the transaction through a combination of $
9.0 billion
sourced from various Chubb Limited and Chubb Corp companies plus $
5.3 billion
of senior notes, which were issued in November 2015. Refer to Note 9 for additional information on the senior notes.
Upon completion of the merger, each Chubb Corp common share (other than shares held by certain legacy Chubb Corp employee benefit plans) was canceled and converted, in accordance with the procedures set forth in the merger agreement, into the right to receive (i)
0.6019
of a Chubb Limited common share and (ii)
$62.93
in cash. In addition, replacement equity awards were issued by Chubb Limited to the holders of Chubb Corp's outstanding equity awards (stock options, restricted stock units, deferred stock units, deferred unit obligations, and performance units).
We believe the Chubb Corp acquisition is highly complementary to our existing business lines, distribution channels, customer segments, and underwriting skills. Chubb Corp has a substantial presence in the U.S. with a broad variety of coverages serving large corporate and upper middle market accounts, middle market and small commercial accounts, and personal lines. Together we are one of the largest commercial insurers in the U.S. Internationally, where legacy ACE is a truly global insurer with
F-20
NOTES TO CONSOLIDATED FINANCIAL STATEMENTS
(continued)
Chubb Limited and Subsidiaries
extensive presence in 54 countries and territories, Chubb Corp's operations in 25 markets added to our presence and capabilities and positioned us to better pursue important market opportunities globally. The combined company is a leader in a number of global specialty and traditional products such as professional lines, risk management, workers' compensation, accident and health (A&H), and other property and general casualty lines.
The table below details the purchase consideration and allocation of assets acquired and liabilities assumed:
|
(in millions of U.S. dollars, except per share data)
|
|||
|
Purchase consideration
|
|||
|
Chubb Limited common shares
|
|||
|
Chubb Corp common shares outstanding
|
228
|
|
|
|
Per share exchange ratio
|
0.6019
|
|
|
|
Common shares issued by Chubb Limited
|
137
|
|
|
|
Common share price of Chubb Limited at January 14, 2016
|
$
|
111.02
|
|
|
Fair value of common shares issued by Chubb Limited to common shareholders of Chubb Corp
|
$
|
15,204
|
|
|
Cash consideration
|
|||
|
Chubb Corp common shares outstanding
|
228
|
|
|
|
Agreed cash price per share paid to common shareholders of Chubb Corp
|
$
|
62.93
|
|
|
Cash consideration paid by Chubb Limited to common shareholders of Chubb Corp
|
$
|
14,319
|
|
|
Stock-based awards
|
|||
|
Fair value of equity awards issued
(1)
|
$
|
323
|
|
|
Fair value of purchase consideration
|
$
|
29,846
|
|
|
Assets acquired and (liabilities) assumed
|
|||
|
Cash
|
$
|
71
|
|
|
Investments
|
42,967
|
|
|
|
Accrued investment income
|
359
|
|
|
|
Insurance and reinsurance balances receivable
|
3,095
|
|
|
|
Reinsurance recoverable on losses and loss expenses
|
1,676
|
|
|
|
Indefinite lived intangible assets
|
2,860
|
|
|
|
Finite lived intangible assets
|
4,795
|
|
|
|
Prepaid reinsurance premiums
|
280
|
|
|
|
Other assets
|
853
|
|
|
|
Unpaid losses and loss expenses
|
(22,923
|
)
|
|
|
Unearned premiums
|
(7,011
|
)
|
|
|
Insurance and reinsurance balances payable
|
(603
|
)
|
|
|
Accounts payable, accrued expenses, and other liabilities
|
(2,030
|
)
|
|
|
Deferred tax liabilities
|
(1,292
|
)
|
|
|
Long-term debt
|
(3,765
|
)
|
|
|
Total identifiable net assets acquired
|
19,332
|
|
|
|
Goodwill
|
10,514
|
|
|
|
Purchase price
|
$
|
29,846
|
|
(1)
The fair value of the replacement equity awards was
$525 million
, of which
$323 million
was attributed to service periods prior to the acquisition and was included in the purchase consideration. Refer to Note 12 for further information on these replacement equity awards.
F-21
NOTES TO CONSOLIDATED FINANCIAL STATEMENTS
(continued)
Chubb Limited and Subsidiaries
The purchase price allocation to intangible assets recorded in connection with the Chubb Corp acquisition and their related useful lives are as follows:
|
(in millions of U.S. dollars)
|
Purchase price Allocation at
January 14, 2016
|
|
Estimated useful life
|
|
|
Definite life
|
||||
|
Unearned premium reserves (UPR) intangible asset
|
$
|
1,550
|
|
1 year
|
|
Agency distribution relationships and renewal rights
|
3,150
|
|
24 years
|
|
|
Internally developed technology
|
95
|
|
3 years
|
|
|
Indefinite life
|
||||
|
Trademarks
|
2,800
|
|
Indefinite
|
|
|
Licenses
|
50
|
|
Indefinite
|
|
|
Syndicate capacity
|
10
|
|
Indefinite
|
|
|
Total identified intangible assets
|
$
|
7,655
|
|
|
Refer to Note 6 for additional information on goodwill and intangible assets acquired.
The following table summarizes the results of the acquired Chubb Corp operations since the acquisition date that have been included within our Consolidated statement of operations:
|
(in millions of U.S. dollars)
|
January 14, 2016 to December 31, 2016
|
|
|
|
Total revenues
|
$
|
12,376
|
|
|
Net income
|
$
|
1,756
|
|
The following table provides supplemental unaudited pro forma consolidated information for the years ended December 31, 2016 and 2015, as if Chubb Corp had been acquired as of January 1, 2015. The unaudited pro forma consolidated financial statements are presented solely for informational purposes and are not necessarily indicative of the consolidated results of operations that might have been achieved had the transaction been completed as of the date indicated, nor are they meant to be indicative of any anticipated consolidated future results of operations that the combined company will experience after the transaction.
|
Year Ended December 31
|
|||||||
|
(in millions of U.S. dollars, except per share data)
|
2016
|
|
2015
|
|
|||
|
Total revenues
|
$
|
31,937
|
|
$
|
32,622
|
|
|
|
Net income
|
$
|
4,183
|
|
$
|
4,478
|
|
|
|
Earnings per share
|
|||||||
|
Basic earnings per share
|
$
|
8.95
|
|
$
|
9.61
|
|
|
|
Diluted earnings per share
|
$
|
8.88
|
|
$
|
9.52
|
|
|
Total revenues and net income were lower for the year ended December 31, 2016, compared to the prior year, primarily reflecting merger-related actions in 2016, which lowered net premiums earned.
F-22
NOTES TO CONSOLIDATED FINANCIAL STATEMENTS
(continued)
Chubb Limited and Subsidiaries
Fireman's Fund Insurance Company High Net Worth Personal Lines Insurance Business in the U.S. (Fireman's Fund)
On April 1, 2015, we acquired the Fireman's Fund Insurance Company high net worth personal lines insurance business in the U.S., which included the renewal rights for new and existing business and reinsurance of all existing reserves for
$365 million
in cash. We acquired assets with a fair value of
$753 million
, consisting primarily of cash of
$629 million
and insurance and reinsurance balances receivable of
$124 million
. We assumed liabilities with a fair value of
$863 million
, consisting primarily of unpaid losses and loss expenses of
$417 million
and unearned premiums of
$428 million
. This acquisition generated
$196 million
of goodwill, attributable to expected growth and profitability, all of which is expected to be deductible for income tax purposes, and other intangible assets of
$278 million
, primarily related to renewal rights, based on Chubb’s purchase price allocation. The acquisition expanded our position in the high net worth personal lines insurers in the U.S. The Fireman’s Fund business was integrated into our existing high net worth personal lines business, offering a broad range of coverage including homeowners, automobile, umbrella and excess liability, collectibles, and yachts. Goodwill and other intangible assets arising from this acquisition are included in our North America Personal P&C Insurance segment.
The Consolidated financial statements include results of acquired businesses from the acquisition dates.
3
. Investments
a) Transfers of securities
During December 2017, we transferred securities, considered essential holdings in a diversified portfolio, with a total fair value of
$4.3 billion
from Fixed maturities available for sale to Fixed maturities held to maturity. These securities, which we have the intent and ability to hold to maturity, were transferred given the growth in our investment portfolio over the last several years, as well as continued efforts to manage the diversification of our global portfolio. The net unrealized appreciation at the date of the transfer continues to be reported in the carrying value of the transferred investments and is amortized through OCI over the remaining life of the securities using the effective interest method in a manner consistent with the amortization of any premium or discount. This transfer represents a non-cash transaction and does not impact the Consolidated statements of cash flows.
b) Fixed maturities
|
December 31, 2017
|
Amortized
Cost
|
|
Gross
Unrealized
Appreciation
|
|
Gross
Unrealized
Depreciation
|
|
Fair
Value
|
|
OTTI Recognized
in AOCI
|
|
|||||||||
|
(in millions of U.S. dollars)
|
|||||||||||||||||||
|
Available for sale
|
|||||||||||||||||||
|
U.S. Treasury and agency
|
$
|
3,701
|
|
$
|
32
|
|
$
|
(35
|
)
|
$
|
3,698
|
|
$
|
—
|
|
||||
|
Foreign
|
20,514
|
|
622
|
|
(106
|
)
|
21,030
|
|
(1
|
)
|
|||||||||
|
Corporate securities
|
23,453
|
|
638
|
|
(95
|
)
|
23,996
|
|
(4
|
)
|
|||||||||
|
Mortgage-backed securities
|
15,279
|
|
111
|
|
(100
|
)
|
15,290
|
|
(1
|
)
|
|||||||||
|
States, municipalities, and political subdivisions
|
14,888
|
|
125
|
|
(88
|
)
|
14,925
|
|
—
|
|
|||||||||
|
$
|
77,835
|
|
$
|
1,528
|
|
$
|
(424
|
)
|
$
|
78,939
|
|
$
|
(6
|
)
|
|||||
|
Held to maturity
|
|||||||||||||||||||
|
U.S. Treasury and agency
|
$
|
908
|
|
$
|
12
|
|
$
|
(5
|
)
|
$
|
915
|
|
$
|
—
|
|
||||
|
Foreign
|
1,738
|
|
27
|
|
(8
|
)
|
1,757
|
|
—
|
|
|||||||||
|
Corporate securities
|
3,159
|
|
67
|
|
(7
|
)
|
3,219
|
|
—
|
|
|||||||||
|
Mortgage-backed securities
|
2,724
|
|
23
|
|
(5
|
)
|
2,742
|
|
—
|
|
|||||||||
|
States, municipalities, and political subdivisions
|
5,806
|
|
50
|
|
(15
|
)
|
5,841
|
|
—
|
|
|||||||||
|
$
|
14,335
|
|
$
|
179
|
|
$
|
(40
|
)
|
$
|
14,474
|
|
$
|
—
|
|
|||||
F-23
NOTES TO CONSOLIDATED FINANCIAL STATEMENTS
(continued)
Chubb Limited and Subsidiaries
|
December 31, 2016
|
Amortized
Cost |
|
Gross
Unrealized Appreciation |
|
Gross
Unrealized Depreciation |
|
Fair
Value |
|
OTTI Recognized
in AOCI |
|
|||||||||
|
(in millions of U.S. dollars)
|
|||||||||||||||||||
|
Available for sale
|
|||||||||||||||||||
|
U.S. Treasury and agency
|
$
|
2,883
|
|
$
|
32
|
|
$
|
(45
|
)
|
$
|
2,870
|
|
$
|
—
|
|
||||
|
Foreign
|
20,929
|
|
636
|
|
(125
|
)
|
21,440
|
|
(5
|
)
|
|||||||||
|
Corporate securities
|
23,736
|
|
580
|
|
(167
|
)
|
24,149
|
|
(8
|
)
|
|||||||||
|
Mortgage-backed securities
|
14,066
|
|
135
|
|
(194
|
)
|
14,007
|
|
(1
|
)
|
|||||||||
|
States, municipalities, and political subdivisions
|
17,922
|
|
72
|
|
(345
|
)
|
17,649
|
|
—
|
|
|||||||||
|
$
|
79,536
|
|
$
|
1,455
|
|
$
|
(876
|
)
|
$
|
80,115
|
|
$
|
(14
|
)
|
|||||
|
Held to maturity
|
|||||||||||||||||||
|
U.S. Treasury and agency
|
$
|
655
|
|
$
|
9
|
|
$
|
(3
|
)
|
$
|
661
|
|
$
|
—
|
|
||||
|
Foreign
|
640
|
|
28
|
|
(1
|
)
|
667
|
|
—
|
|
|||||||||
|
Corporate securities
|
2,771
|
|
50
|
|
(26
|
)
|
2,795
|
|
—
|
|
|||||||||
|
Mortgage-backed securities
|
1,393
|
|
35
|
|
—
|
|
1,428
|
|
—
|
|
|||||||||
|
States, municipalities, and political subdivisions
|
5,185
|
|
26
|
|
(92
|
)
|
5,119
|
|
—
|
|
|||||||||
|
$
|
10,644
|
|
$
|
148
|
|
$
|
(122
|
)
|
$
|
10,670
|
|
$
|
—
|
|
|||||
As discussed in Note
3
d), if a credit loss is incurred on an impaired fixed maturity, an OTTI is considered to have occurred and the portion of the impairment not related to credit losses (non-credit OTTI) is recognized in OCI. Included in the “OTTI Recognized in AOCI” columns above are the cumulative amounts of non-credit OTTI recognized in OCI adjusted for subsequent sales, maturities, and redemptions. OTTI recognized in AOCI does not include the impact of subsequent changes in fair value of the related securities. In periods subsequent to a recognition of OTTI in OCI, changes in the fair value of the related fixed maturities are reflected in Net unrealized appreciation on investments in the Consolidated statements of shareholders' equity. For the years ended
December 31, 2017
and
2016
, $
2
million of net unrealized depreciation and $
62
million of net unrealized appreciation, respectively, related to such securities is included in OCI. At
December 31, 2017
and
2016
, AOCI included cumulative net unrealized appreciation of $
7
million and $
10
million, respectively, related to securities remaining in the investment portfolio for which a non-credit OTTI was recognized.
Mortgage-backed securities (MBS) issued by U.S. government agencies are combined with all other to be announced mortgage derivatives held (refer to Note
10
c) (iv)) and are included in the category, “Mortgage-backed securities”. Approximately
83 percent
and
81 percent
of the total mortgage-backed securities at
December 31, 2017
and
2016
, respectively, are represented by investments in U.S. government agency bonds. The remainder of the mortgage exposure consists of collateralized mortgage obligations and non-government mortgage-backed securities, the majority of which provide a planned structure for principal and interest payments and carry a rating of AAA by the major credit rating agencies.
F-24
NOTES TO CONSOLIDATED FINANCIAL STATEMENTS
(continued)
Chubb Limited and Subsidiaries
The following table presents fixed maturities by contractual maturity:
|
December 31
|
December 31
|
||||||||||||||
|
2017
|
|
2016
|
|
||||||||||||
|
(in millions of U.S. dollars)
|
Amortized Cost
|
|
Fair Value
|
|
Amortized Cost
|
|
Fair Value
|
|
|||||||
|
Available for sale
|
|||||||||||||||
|
Due in 1 year or less
|
$
|
3,164
|
|
$
|
3,182
|
|
$
|
3,892
|
|
$
|
3,913
|
|
|||
|
Due after 1 year through 5 years
|
24,749
|
|
25,068
|
|
24,027
|
|
24,429
|
|
|||||||
|
Due after 5 years through 10 years
|
25,388
|
|
25,704
|
|
27,262
|
|
27,379
|
|
|||||||
|
Due after 10 years
|
9,255
|
|
9,695
|
|
10,289
|
|
10,387
|
|
|||||||
|
62,556
|
|
63,649
|
|
65,470
|
|
66,108
|
|
||||||||
|
Mortgage-backed securities
|
15,279
|
|
15,290
|
|
14,066
|
|
14,007
|
|
|||||||
|
$
|
77,835
|
|
$
|
78,939
|
|
$
|
79,536
|
|
$
|
80,115
|
|
||||
|
Held to maturity
|
|||||||||||||||
|
Due in 1 year or less
|
$
|
743
|
|
$
|
746
|
|
$
|
430
|
|
$
|
435
|
|
|||
|
Due after 1 year through 5 years
|
2,669
|
|
2,688
|
|
2,646
|
|
2,691
|
|
|||||||
|
Due after 5 years through 10 years
|
4,744
|
|
4,756
|
|
2,969
|
|
2,944
|
|
|||||||
|
Due after 10 years
|
3,455
|
|
3,542
|
|
3,206
|
|
3,172
|
|
|||||||
|
11,611
|
|
11,732
|
|
9,251
|
|
9,242
|
|
||||||||
|
Mortgage-backed securities
|
2,724
|
|
2,742
|
|
1,393
|
|
1,428
|
|
|||||||
|
$
|
14,335
|
|
$
|
14,474
|
|
$
|
10,644
|
|
$
|
10,670
|
|
||||
Expected maturities could differ from contractual maturities because borrowers may have the right to call or prepay obligations, with or without call or prepayment penalties.
c) Equity securities
|
December 31
|
|
|
December 31
|
|
|||
|
(in millions of U.S. dollars)
|
2017
|
|
|
2016
|
|
||
|
Cost
|
$
|
737
|
|
$
|
706
|
|
|
|
Gross unrealized appreciation
|
212
|
|
129
|
|
|||
|
Gross unrealized depreciation
|
(12
|
)
|
(21
|
)
|
|||
|
Fair value
|
$
|
937
|
|
$
|
814
|
|
|
d) Net realized gains (losses)
In accordance with guidance related to the recognition and presentation of OTTI, when an impairment related to a fixed maturity has occurred, OTTI is required to be recorded in Net income if management has the intent to sell the security or it is more likely than not that we will be required to sell the security before the recovery of its amortized cost. Further, in cases where we do not intend to sell the security and it is more likely than not that we will not be required to sell the security, we must evaluate the security to determine the portion of the impairment, if any, related to credit losses. If a credit loss is incurred, an OTTI is considered to have occurred and any portion of the OTTI related to credit losses must be reflected in Net income, while the portion of OTTI related to all other factors is recognized in OCI. For fixed maturities held to maturity, OTTI recognized in OCI is accreted from AOCI to the amortized cost of the fixed maturity prospectively over the remaining term of the securities.
Each quarter, securities in an unrealized loss position (impaired securities), including fixed maturities, securities lending collateral, equity securities, and other investments, are reviewed to identify impaired securities to be specifically evaluated for a potential OTTI.
F-25
NOTES TO CONSOLIDATED FINANCIAL STATEMENTS
(continued)
Chubb Limited and Subsidiaries
For all non-fixed maturities, OTTI is evaluated based on the following:
|
•
|
the amount of time a security has been in a loss position and the magnitude of the loss position;
|
|
•
|
the period in which cost is expected to be recovered, if at all, based on various criteria including economic conditions and other issuer-specific developments; and
|
|
•
|
our ability and intent to hold the security to the expected recovery period.
|
As a general rule, we also consider that equity securities in an unrealized loss position for twelve consecutive months are other than temporarily impaired. For mutual funds included in equity securities in our Consolidated balance sheets, we employ analysis similar to fixed maturities, when applicable.
Evaluation of potential credit losses related to fixed maturities
We review each fixed maturity in an unrealized loss position to assess whether the security is a candidate for credit loss. Specifically, we consider credit rating, market price, and issuer-specific financial information, among other factors, to assess the likelihood of collection of all principal and interest as contractually due. Securities, for which we determine that credit loss is likely, are subjected to further analysis to estimate the credit loss recognized in Net income, if any. In general, credit loss recognized in Net income equals the difference between the security’s amortized cost and the net present value of its projected future cash flows discounted at the effective interest rate implicit in the debt security. All significant assumptions used in determining credit losses are subject to change as market conditions evolve.
U.S. Treasury and agency obligations (including agency mortgage-backed securities); foreign government obligations; and states, municipalities, and political subdivisions obligations
U.S. Treasury and agency obligations (including agency mortgage-backed securities); foreign government obligations; and states, municipalities, and political subdivisions obligations represent $
311
million of gross unrealized loss at
December 31, 2017
. These securities were evaluated for credit loss primarily using qualitative assessments of the likelihood of credit loss considering credit rating of the issuers and level of credit enhancement, if any. We concluded that the high level of creditworthiness of the issuers coupled with credit enhancement, where applicable, supports recognizing no credit loss in Net income.
Corporate securities
Projected cash flows for corporate securities (principally senior unsecured bonds) are driven primarily by assumptions regarding probability of default and also the timing and amount of recoveries associated with defaults. Chubb developed projected cash flows for corporate securities using market observable data, issuer-specific information, and credit ratings. We use historical default data by Moody’s Investors Service (Moody’s) rating category to calculate a 1-in-100 year probability of default, which results in a default assumption in excess of the historical mean default rate. Consistent with management's approach, Chubb assumed a
32 percent
recovery rate (the par value of a defaulted security that will be recovered) across all rating categories, rather than using Moody's historical mean recovery rate of
42 percent
. We believe that use of a default assumption, in excess of the historical mean, is conservative in light of current market conditions.
The following table presents default assumptions by Moody's rating category (historical mean default rate provided for comparison):
|
Moody's Rating Category
|
1-in-100 Year Default Rate
|
|
Historical Mean Default Rate
|
|
|
|
Investment Grade:
|
|||||
|
Aaa-Baa
|
0.0-1.3%
|
|
0.0-0.3%
|
|
|
|
Below Investment Grade:
|
|||||
|
Ba
|
4.8
|
%
|
1.0
|
%
|
|
|
B
|
12.1
|
%
|
3.2
|
%
|
|
|
Caa-C
|
36.8
|
%
|
10.5
|
%
|
|
Application of the methodology and assumptions described above resulted in credit losses recognized in Net income for corporate securities of $
5
million, $
30
million, and $
50
million for the years ended
December 31, 2017
,
2016
, and
2015
, respectively.
F-26
NOTES TO CONSOLIDATED FINANCIAL STATEMENTS
(continued)
Chubb Limited and Subsidiaries
Mortgage-backed securities
For mortgage-backed securities, credit impairment is assessed using a cash flow model that estimates the cash flows on the underlying mortgages, using the security-specific collateral and transaction structure. The model estimates cash flows from the underlying mortgage loans and distributes those cash flows to various tranches of securities, considering the transaction structure and any subordination and credit enhancements that exist in that structure. The cash flow model incorporates actual cash flows on the mortgage-backed securities through the current period and then projects the remaining cash flows using a number of assumptions, including default rates, prepayment rates, and loss severity rates (the par value of a defaulted security that will not be recovered) on foreclosed properties.
We develop specific assumptions using market data, where available, and include internal estimates as well as estimates published by rating agencies and other third-party sources. We project default rates by mortgage sector considering current underlying mortgage loan performance, generally assuming lower loss severity for Prime sector bonds versus ALT-A and Sub-prime bonds.
These estimates are extrapolated along a default timing curve to estimate the total lifetime pool default rate. Other assumptions used contemplate the actual collateral attributes, including geographic concentrations, rating agency loss projections, rating actions, and current market prices. If cash flow projections indicate that losses will exceed the credit enhancement for a given tranche, then we do not expect to recover our amortized cost basis, and we recognize an estimated credit loss in Net income.
For the years ended
December 31, 2017
and
2015
, there were no credit losses recognized in Net income for mortgage-backed securities. For the year ended December 31,
2016
, there was $
1 million
of credit losses recognized in Net income for mortgage-backed securities.
F-27
NOTES TO CONSOLIDATED FINANCIAL STATEMENTS
(continued)
Chubb Limited and Subsidiaries
The following table presents the Net realized gains (losses) and the losses included in Net realized gains (losses) and OCI as a result of conditions which caused us to conclude the decline in fair value of certain investments was “other-than-temporary” and the change in net unrealized appreciation (depreciation) of investments:
|
|
Year Ended December 31
|
||||||||||
|
(in millions of U.S. dollars)
|
2017
|
|
2016
|
|
2015
|
|
|||||
|
Fixed maturities:
|
|||||||||||
|
OTTI on fixed maturities, gross
|
$
|
(24
|
)
|
$
|
(89
|
)
|
$
|
(142
|
)
|
||
|
OTTI on fixed maturities recognized in OCI (pre-tax)
|
1
|
|
8
|
|
39
|
|
|||||
|
OTTI on fixed maturities, net
|
(23
|
)
|
(81
|
)
|
(103
|
)
|
|||||
|
Gross realized gains excluding OTTI
|
149
|
|
183
|
|
158
|
|
|||||
|
Gross realized losses excluding OTTI
|
(157
|
)
|
(265
|
)
|
(235
|
)
|
|||||
|
Total fixed maturities
|
(31
|
)
|
(163
|
)
|
(180
|
)
|
|||||
|
Equity securities:
|
|||||||||||
|
OTTI on equity securities
|
(10
|
)
|
(8
|
)
|
(7
|
)
|
|||||
|
Gross realized gains excluding OTTI
|
28
|
|
65
|
|
47
|
|
|||||
|
Gross realized losses excluding OTTI
|
(2
|
)
|
(13
|
)
|
(11
|
)
|
|||||
|
Total equity securities
|
16
|
|
44
|
|
29
|
|
|||||
|
OTTI on other investments
|
(12
|
)
|
(14
|
)
|
(2
|
)
|
|||||
|
Foreign exchange gains (losses)
|
36
|
|
118
|
|
(80
|
)
|
|||||
|
Investment and embedded derivative instruments
|
(11
|
)
|
(33
|
)
|
32
|
|
|||||
|
Fair value adjustments on insurance derivative
|
364
|
|
53
|
|
(203
|
)
|
|||||
|
S&P put options and futures
|
(261
|
)
|
(136
|
)
|
(10
|
)
|
|||||
|
Other derivative instruments
|
(5
|
)
|
(10
|
)
|
(12
|
)
|
|||||
|
Other
|
(12
|
)
|
(4
|
)
|
6
|
|
|||||
|
Net realized gains (losses)
|
84
|
|
(145
|
)
|
(420
|
)
|
|||||
|
Change in net unrealized appreciation (depreciation) on investments:
|
|||||||||||
|
Fixed maturities available for sale
|
519
|
|
142
|
|
(1,119
|
)
|
|||||
|
Fixed maturities held to maturity
|
18
|
|
(59
|
)
|
43
|
|
|||||
|
Equity securities
|
88
|
|
52
|
|
(17
|
)
|
|||||
|
Other
|
8
|
|
(51
|
)
|
(36
|
)
|
|||||
|
Income tax (expense) benefit
|
(241
|
)
|
100
|
|
152
|
|
|||||
|
Change in net unrealized appreciation (depreciation) on investments
|
392
|
|
184
|
|
(977
|
)
|
|||||
|
Total net realized gains (losses) and change in net unrealized appreciation (depreciation) on investments
|
$
|
476
|
|
$
|
39
|
|
$
|
(1,397
|
)
|
||
The following table presents a roll-forward of pre-tax credit losses related to fixed maturities for which a portion of OTTI was recognized in OCI:
|
Year Ended December 31
|
|||||||||||
|
(in millions of U.S. dollars)
|
2017
|
|
2016
|
|
2015
|
|
|||||
|
Balance of credit losses related to securities still held – beginning of year
|
$
|
35
|
|
$
|
53
|
|
$
|
28
|
|
||
|
Additions where no OTTI was previously recorded
|
4
|
|
17
|
|
41
|
|
|||||
|
Additions where an OTTI was previously recorded
|
2
|
|
14
|
|
9
|
|
|||||
|
Reductions for securities sold during the period
|
(19
|
)
|
(49
|
)
|
(25
|
)
|
|||||
|
Balance of credit losses related to securities still held – end of year
|
$
|
22
|
|
$
|
35
|
|
$
|
53
|
|
||
F-28
NOTES TO CONSOLIDATED FINANCIAL STATEMENTS
(continued)
Chubb Limited and Subsidiaries
e) Other investments
|
December 31
|
|
December 31
|
|
||||||||||||
|
2017
|
|
2016
|
|
||||||||||||
|
(in millions of U.S. dollars)
|
Fair Value
|
|
Cost
|
|
Fair Value
|
|
Cost
|
|
|||||||
|
Investment funds
|
$
|
270
|
|
$
|
123
|
|
$
|
251
|
|
$
|
126
|
|
|||
|
Limited partnerships
|
549
|
|
441
|
|
730
|
|
607
|
|
|||||||
|
Partially-owned investment companies
|
2,803
|
|
2,803
|
|
2,645
|
|
2,645
|
|
|||||||
|
Life insurance policies
|
305
|
|
305
|
|
248
|
|
248
|
|
|||||||
|
Policy loans
|
244
|
|
244
|
|
209
|
|
209
|
|
|||||||
|
Trading securities
|
333
|
|
333
|
|
296
|
|
295
|
|
|||||||
|
Other
|
168
|
|
168
|
|
140
|
|
140
|
|
|||||||
|
Total
|
$
|
4,672
|
|
$
|
4,417
|
|
$
|
4,519
|
|
$
|
4,270
|
|
|||
Investment funds include one highly diversified fund investment as well as several direct funds that employ a variety of investment styles such as long/short equity and arbitrage/distressed. Included in limited partnerships and partially-owned investment companies are
138
individual limited partnerships covering a broad range of investment strategies including large cap buyouts, specialist buyouts, growth capital, distressed, mezzanine, real estate, and co-investments. The underlying portfolio consists of various public and private debt and equity securities of publicly traded and privately held companies and real estate assets. The underlying investments across various partnerships, geographies, industries, asset types, and investment strategies provide risk diversification within the limited partnership portfolio and the overall investment portfolio. Trading securities comprise $
333
million of mutual funds supported by assets that do not qualify for separate account reporting under GAAP at
December 31, 2017
compared with $
271
million at
December 31, 2016
. There were no trading securities held in rabbi trusts at
December 31, 2017
, compared with $
14
million of equity securities and $
11
million of fixed maturities at
December 31, 2016
.
f) Investments in partially-owned insurance companies
The following table presents Investments in partially-owned insurance companies:
|
December 31, 2017
|
December 31, 2016
|
||||||||||||||||||||||
|
(in millions of U.S. dollars, except for percentages)
|
Carrying Value
|
|
Issued
Share
Capital
|
|
Ownership Percentage
|
|
Carrying Value
|
|
Issued Share Capital
|
|
Ownership Percentage
|
|
Domicile
|
||||||||||
|
Huatai Group
|
$
|
438
|
|
$
|
616
|
|
20
|
%
|
$
|
447
|
|
$
|
624
|
|
20
|
%
|
China
|
||||||
|
Huatai Life Insurance Company
|
105
|
|
495
|
|
20
|
%
|
99
|
|
428
|
|
20
|
%
|
China
|
||||||||||
|
Freisenbruch-Meyer
|
9
|
|
—
|
|
40
|
%
|
8
|
|
5
|
|
40
|
%
|
Bermuda
|
||||||||||
|
Chubb Arabia Cooperative Insurance Company
|
15
|
|
27
|
|
30
|
%
|
13
|
|
27
|
|
30
|
%
|
Saudi Arabia
|
||||||||||
|
Russian Reinsurance Company
|
2
|
|
4
|
|
23
|
%
|
2
|
|
4
|
|
23
|
%
|
Russia
|
||||||||||
|
ABR Reinsurance Ltd.
|
93
|
|
800
|
|
11
|
%
|
97
|
|
800
|
|
11
|
%
|
Bermuda
|
||||||||||
|
Total
|
$
|
662
|
|
$
|
1,942
|
|
$
|
666
|
|
$
|
1,888
|
|
|||||||||||
Huatai Group and Huatai Life Insurance Company provide a range of P&C, life, and investment products.
F-29
NOTES TO CONSOLIDATED FINANCIAL STATEMENTS
(continued)
Chubb Limited and Subsidiaries
g) Gross unrealized loss
At
December 31, 2017
, there were
9,828
fixed maturities out of a total of
30,932
fixed maturities in an unrealized loss position. The largest single unrealized loss in the fixed maturities was
$7
million. There were
82
equity securities out of a total of
328
equity securities in an unrealized loss position. The largest single unrealized loss in the equity securities was
$3
million. Fixed maturities in an unrealized loss position at
December 31, 2017
, comprised both investment grade and below investment grade securities for which fair value declined primarily due to widening credit spreads since the date of purchase.
The following tables present, for all securities in an unrealized loss position (including securities on loan), the aggregate fair value and gross unrealized loss by length of time the security has continuously been in an unrealized loss position:
|
|
0 – 12 Months
|
Over 12 Months
|
Total
|
||||||||||||||||||||
|
December 31, 2017
|
Fair Value
|
|
Gross
Unrealized Loss
|
|
Fair Value
|
|
Gross
Unrealized Loss
|
|
Fair Value
|
|
Gross
Unrealized Loss
|
|
|||||||||||
|
(in millions of U.S. dollars)
|
|||||||||||||||||||||||
|
U.S. Treasury and agency
|
$
|
2,172
|
|
$
|
(14
|
)
|
$
|
1,249
|
|
$
|
(26
|
)
|
$
|
3,421
|
|
$
|
(40
|
)
|
|||||
|
Foreign
|
5,657
|
|
(65
|
)
|
1,693
|
|
(49
|
)
|
7,350
|
|
(114
|
)
|
|||||||||||
|
Corporate securities
|
5,210
|
|
(56
|
)
|
1,332
|
|
(46
|
)
|
6,542
|
|
(102
|
)
|
|||||||||||
|
Mortgage-backed securities
|
6,194
|
|
(31
|
)
|
3,209
|
|
(74
|
)
|
9,403
|
|
(105
|
)
|
|||||||||||
|
States, municipalities, and political subdivisions
|
9,259
|
|
(71
|
)
|
1,402
|
|
(32
|
)
|
10,661
|
|
(103
|
)
|
|||||||||||
|
Total fixed maturities
|
28,492
|
|
(237
|
)
|
8,885
|
|
(227
|
)
|
37,377
|
|
(464
|
)
|
|||||||||||
|
Equity securities
|
115
|
|
(12
|
)
|
—
|
|
—
|
|
115
|
|
(12
|
)
|
|||||||||||
|
Other investments
|
78
|
|
(8
|
)
|
—
|
|
—
|
|
78
|
|
(8
|
)
|
|||||||||||
|
Total
|
$
|
28,685
|
|
$
|
(257
|
)
|
$
|
8,885
|
|
$
|
(227
|
)
|
$
|
37,570
|
|
$
|
(484
|
)
|
|||||
|
|
0 – 12 Months
|
Over 12 Months
|
Total
|
||||||||||||||||||||
|
December 31, 2016
|
Fair Value
|
|
Gross
Unrealized Loss
|
|
Fair Value
|
|
Gross
Unrealized Loss
|
|
Fair Value
|
|
Gross
Unrealized Loss
|
|
|||||||||||
|
(in millions of U.S. dollars)
|
|||||||||||||||||||||||
|
U.S. Treasury and agency
|
$
|
2,216
|
|
$
|
(48
|
)
|
$
|
—
|
|
$
|
—
|
|
$
|
2,216
|
|
$
|
(48
|
)
|
|||||
|
Foreign
|
5,918
|
|
(99
|
)
|
386
|
|
(27
|
)
|
6,304
|
|
(126
|
)
|
|||||||||||
|
Corporate securities
|
7,021
|
|
(149
|
)
|
641
|
|
(44
|
)
|
7,662
|
|
(193
|
)
|
|||||||||||
|
Mortgage-backed securities
|
8,638
|
|
(189
|
)
|
234
|
|
(5
|
)
|
8,872
|
|
(194
|
)
|
|||||||||||
|
States, municipalities, and political subdivisions
|
19,448
|
|
(435
|
)
|
49
|
|
(2
|
)
|
19,497
|
|
(437
|
)
|
|||||||||||
|
Total fixed maturities
|
43,241
|
|
(920
|
)
|
1,310
|
|
(78
|
)
|
44,551
|
|
(998
|
)
|
|||||||||||
|
Equity securities
|
199
|
|
(21
|
)
|
—
|
|
—
|
|
199
|
|
(21
|
)
|
|||||||||||
|
Other investments
|
201
|
|
(18
|
)
|
—
|
|
—
|
|
201
|
|
(18
|
)
|
|||||||||||
|
Total
|
$
|
43,641
|
|
$
|
(959
|
)
|
$
|
1,310
|
|
$
|
(78
|
)
|
$
|
44,951
|
|
$
|
(1,037
|
)
|
|||||
F-30
NOTES TO CONSOLIDATED FINANCIAL STATEMENTS
(continued)
Chubb Limited and Subsidiaries
h) Net investment income
|
Year Ended December 31
|
|||||||||||
|
(in millions of U.S. dollars)
|
2017
|
|
2016
|
|
2015
|
|
|||||
|
Fixed maturities
|
$
|
2,987
|
|
$
|
2,779
|
|
$
|
2,157
|
|
||
|
Short-term investments
|
131
|
|
93
|
|
49
|
|
|||||
|
Equity securities
|
38
|
|
36
|
|
16
|
|
|||||
|
Other investments
|
133
|
|
98
|
|
86
|
|
|||||
|
Gross investment income
(1)
|
3,289
|
|
3,006
|
|
2,308
|
|
|||||
|
Investment expenses
|
(164
|
)
|
(141
|
)
|
(114
|
)
|
|||||
|
Net investment income
(1)
|
$
|
3,125
|
|
$
|
2,865
|
|
$
|
2,194
|
|
||
|
(1)
Includes amortization expense related to fair value adjustment of acquired invested assets related to the Chubb Corp acquisition
|
$
|
(332
|
)
|
$
|
(393
|
)
|
$
|
—
|
|
||
i) Restricted assets
Chubb
is required to maintain assets on deposit with various regulatory authorities to support its insurance and reinsurance operations. These requirements are generally promulgated in the statutory regulations of the individual jurisdictions. The assets on deposit are available to settle insurance and reinsurance liabilities.
Chubb
is also required to restrict assets pledged under repurchase agreements. We also use trust funds in certain large reinsurance transactions where the trust funds are set up for the benefit of the ceding companies and generally take the place of letter of credit (LOC) requirements. We also have investments in segregated portfolios primarily to provide collateral or guarantees for LOC and derivative transactions. Included in restricted assets at
December 31, 2017
and
2016
, are investments, primarily fixed maturities, totaling
$23.3 billion
and $
20.1 billion
, and cash of
$123
million and
$103
million, respectively.
The following table presents the components of restricted assets:
|
December 31
|
|
December 31
|
|
||||
|
(in millions of U.S. dollars)
|
2017
|
|
2016
|
|
|||
|
Trust funds
|
$
|
17,011
|
|
$
|
13,880
|
|
|
|
Deposits with U.S. regulatory authorities
|
2,345
|
|
2,203
|
|
|||
|
Deposits with non-U.S. regulatory authorities
|
2,250
|
|
2,191
|
|
|||
|
Assets pledged under repurchase agreements
|
1,434
|
|
1,461
|
|
|||
|
Other pledged assets
|
414
|
|
435
|
|
|||
|
$
|
23,454
|
|
$
|
20,170
|
|
||
F-31
NOTES TO CONSOLIDATED FINANCIAL STATEMENTS
(continued)
Chubb Limited and Subsidiaries
4
. Fair value measurements
a
) Fair value hierarchy
Fair value of financial assets and financial liabilities is estimated based on the framework established in the fair value accounting guidance. The guidance defines fair value as the price to sell an asset or transfer a liability (an exit price) in an orderly transaction between market participants and establishes a three-level valuation hierarchy based on the reliability of the inputs. The fair value hierarchy gives the highest priority to quoted prices in active markets and the lowest priority to unobservable data.
The three levels of the hierarchy are as follows:
|
•
|
Level 1 – Unadjusted quoted prices for identical assets or liabilities in active markets;
|
|
•
|
Level 2 – Includes, among other items, inputs other than quoted prices that are observable for the asset or liability such as
|
interest rates and yield curves, quoted prices for similar assets and liabilities in active markets, and quoted prices for identical or similar assets and liabilities in markets that are not active; and
|
•
|
Level 3 – Inputs that are unobservable and reflect management’s judgments about assumptions that market participants
|
would use in pricing an asset or liability.
We categorize financial instruments within the valuation hierarchy at the balance sheet date based upon the lowest level of inputs that are significant to the fair value measurement. Accordingly, transfers between levels within the valuation hierarchy occur when there are significant changes to the inputs, such as increases or decreases in market activity, changes to the availability of current prices, changes to the transparency to underlying inputs, and whether there are significant variances in quoted prices. Transfers in and/or out of any level are assumed to occur at the end of the period.
We use pricing services to obtain fair value measurements for the majority of our investment securities. Based on management’s understanding of the methodologies used, these pricing services only produce an estimate of fair value if there is observable market information that would allow them to make a fair value estimate. Based on our understanding of the market inputs used by the pricing services, all applicable investments have been valued in accordance with GAAP. We do not adjust prices obtained from pricing services. The following is a description of the valuation techniques and inputs used to determine fair values for financial instruments carried at fair value, as well as the general classification of such financial instruments pursuant to the valuation hierarchy.
Fixed maturities
We use pricing services to estimate fair value measurements for the majority of our fixed maturities. The pricing services use market quotations for fixed maturities that have quoted prices in active markets; such securities are classified within Level 1. For fixed maturities other than U.S. Treasury securities that generally do not trade on a daily basis, the pricing services prepare estimates of fair value measurements using their pricing applications, which include available relevant market information, benchmark curves, benchmarking of like securities, sector groupings, and matrix pricing. Additional valuation factors that can be taken into account are nominal spreads, dollar basis, and liquidity adjustments. The pricing services evaluate each asset class based on relevant market and credit information, perceived market movements, and sector news. The market inputs used in the pricing evaluation, listed in the approximate order of priority include: benchmark yields, reported trades, broker/dealer quotes, issuer spreads, two-sided markets, benchmark securities, bids, offers, reference data, and industry and economic events. The extent of the use of each input is dependent on the asset class and the market conditions. Given the asset class, the priority of the use of inputs may change, or some market inputs may not be relevant. Additionally, fixed maturities valuation is more subjective when markets are less liquid due to the lack of market based inputs (i.e., stale pricing), which may increase the potential that an investment's estimated fair value is not reflective of the price at which an actual transaction would occur. The overwhelming majority of fixed maturities are classified within Level 2 because the most significant inputs used in the pricing techniques are observable. For a small number of fixed maturities, we obtain a single broker quote (typically from a market maker). Due to the disclaimers on the quotes that indicate that the price is indicative only, we include these fair value estimates in Level 3.
Equity securities
Equity securities with active markets are classified within Level 1 as fair values are based on quoted market prices. For equity securities in markets which are less active, fair values are based on market valuations and are classified within Level 2. Equity securities for which pricing is unobservable are classified within Level 3.
F-32
NOTES TO CONSOLIDATED FINANCIAL STATEMENTS
(continued)
Chubb Limited and Subsidiaries
Short-term investments
Short-term investments, which comprise securities due to mature within one year of the date of purchase that are traded in active markets, are classified within Level 1 as fair values are based on quoted market prices. Securities such as commercial paper and discount notes are classified within Level 2 because these securities are typically not actively traded due to their approaching maturity and, as such, their cost approximates fair value. Short-term investments for which pricing is unobservable are classified within Level 3.
Other investments
Fair values for the majority of Other investments including investments in partially-owned investment companies, investment funds, and limited partnerships are based on their respective net asset values or equivalent (NAV) and are excluded from the fair value hierarchy table below. Certain of our long-duration contracts are supported by assets that do not qualify for separate account reporting under GAAP. These assets comprise mutual funds classified within Level 1 in the valuation hierarchy on the same basis as other equity securities traded in active markets. Other investments also include equity securities classified within Level 1, and fixed maturities, classified within Level 2, held in rabbi trusts maintained by Chubb for deferred compensation plans and are classified within the valuation hierarchy on the same basis as other equity securities and fixed maturities. Other investments for which pricing is unobservable are classified within Level 3.
Securities lending collateral
The underlying assets included in Securities lending collateral in the Consolidated balance sheets are fixed maturities which are classified in the valuation hierarchy on the same basis as other fixed maturities. Excluded from the valuation hierarchy is the corresponding liability related to Chubb’s obligation to return the collateral plus interest as it is reported at contract value and not fair value in the Consolidated balance sheets.
Investment derivative instruments
Actively traded investment derivative instruments, including futures, options, and forward contracts are classified within Level 1 as fair values are based on quoted market prices. The fair value of cross-currency swaps is based on market valuations and is classified within Level 2. Investment derivative instruments are recorded in either Other assets or Accounts payable, accrued expenses, and other liabilities in the Consolidated balance sheets.
Other derivative instruments
We generally maintain positions in other derivative instruments including exchange-traded equity futures contracts and option contracts designed to limit exposure to a severe equity market decline, which would cause an increase in expected claims and, therefore, an increase in reserves for our guaranteed minimum death benefits (GMDB) and guaranteed living benefits (GLB) reinsurance business. Our position in exchange-traded equity futures contracts is classified within Level 1. At December 31, 2017, we held no positions in option contracts on equity market indices. The fair value of the majority of the remaining positions in other derivative instruments is based on significant observable inputs including equity security and interest rate indices. Accordingly, these are classified within Level 2. Other derivative instruments based on unobservable inputs are classified within Level 3. Other derivative instruments are recorded in either Other assets or Accounts payable, accrued expenses, and other liabilities in the Consolidated balance sheets.
Separate account assets
Separate account assets represent segregated funds where investment risks are borne by the customers, except to the extent of certain guarantees made by Chubb. Separate account assets comprise mutual funds classified within Level 1 in the valuation hierarchy on the same basis as other equity securities traded in active markets. Separate account assets also include fixed maturities classified within Level 2 because the most significant inputs used in the pricing techniques are observable. Excluded from the valuation hierarchy are the corresponding liabilities as they are reported at contract value and not fair value in the Consolidated balance sheets. Separate account assets are recorded in Other assets in the Consolidated balance sheets.
Guaranteed living benefits
The GLB arises from life reinsurance programs covering living benefit guarantees whereby we assume the risk of guaranteed minimum income benefits (GMIB) and guaranteed minimum accumulation benefits (GMAB) associated with variable annuity contracts. GLB’s are recorded in Accounts payable, accrued expenses, and other liabilities and Future policy benefits in the Consolidated balance sheets. For GLB reinsurance, Chubb estimates fair value using an internal valuation model which includes current market information and estimates of policyholder behavior. All of the treaties contain claim limits, which are factored into the valuation model. The fair value depends on a number of factors, including interest rates, equity markets, credit risk, current account value, market volatility, expected annuitization rates and other policyholder behavior, and changes in policyholder mortality.
F-33
NOTES TO CONSOLIDATED FINANCIAL STATEMENTS
(continued)
Chubb Limited and Subsidiaries
The most significant policyholder behavior assumptions include lapse rates and the GMIB annuitization rates. Assumptions regarding lapse rates and GMIB annuitization rates differ by treaty, but the underlying methodologies to determine rates applied to each treaty are comparable.
A lapse rate is the percentage of in-force policies surrendered in a given calendar year. All else equal, as lapse rates increase, ultimate claim payments will decrease. In general, the base lapse function assumes low lapse rates (ranging from about
3 percent
to
9 percent
per annum) during the surrender charge period of the GMIB contract, followed by a “spike” lapse rate (ranging from about
6 percent
to
33 percent
per annum) in the year immediately following the surrender charge period, and then reverting to an ultimate lapse rate (generally around
10 percent
per annum), typically over a
2
-year period. This base rate is adjusted downward for policies with more valuable guarantees (policies with guaranteed values far in excess of their account values) by multiplying the base lapse rate by a factor ranging from
15 percent
to
75 percent
. Partial withdrawals and the impact of older policyholders with tax-qualified contracts (due to required minimum distributions) are also reflected in our modeling.
The GMIB annuitization rate is the percentage of policies for which the policyholder will elect to annuitize using the guaranteed benefit provided under the GMIB. All else equal, as GMIB annuitization rates increase, ultimate claim payments will increase, subject to treaty claim limits. All GMIB reinsurance treaties include claim limits to protect Chubb in the event that actual annuitization behavior is significantly higher than expected. In general, Chubb assumes that GMIB annuitization rates will be higher for policies with more valuable guarantees (policies with guaranteed values far in excess of their account values). In addition, we also assume that GMIB annuitization rates are higher in the first year immediately following the waiting period (the first year the policies are eligible to annuitize using the GMIB) in comparison to all subsequent years. We do not yet have fully credible annuitization experience for all clients.
The level of annuitization assumptions at
December 31, 2017
are as follows:
|
% of total GMIB guaranteed value
|
Year of GMIB eligibility
|
Maximum annuitization rate(s) (per year)
|
Maximum annuitization rates based on
|
||
|
67%
|
First year
|
2% - 52%
|
Actual Experience
|
||
|
Subsequent years
|
1% - 100%
|
||||
|
3%
|
First year
|
N/A
|
N/A
(1)
|
||
|
Subsequent years
|
12%, 100%
|
Weighted average
(2)
|
|||
|
30%
|
First year
|
25%, 56%
|
Weighted average
(2)
|
||
|
Subsequent years
|
12%, 36%
|
||||
(1)
Because all policies in this bracket are past the first year of eligibility, first year annuitization assumptions are no longer modeled.
(2)
Weighted average of two different annuitization rates.
The effect of changes in key market factors on assumed lapse and annuitization rates reflect emerging trends using data available from cedants. For treaties with limited experience, rates are established in line with data received from other ceding companies adjusted, as appropriate, with industry estimates. The model and related assumptions are regularly re-evaluated by management and enhanced, as appropriate, based upon additional experience obtained related to policyholder behavior and availability of updated information such as market conditions, market participant assumptions, and demographics of in-force annuities. Because of the significant use of unobservable inputs including policyholder behavior, GLB reinsurance is classified within Level 3.
In the fourth quarter of 2017, we completed a review of policyholder behavior related to annuitizations, partial withdrawals, lapses, and mortality for our variable annuity reinsurance business.
|
•
|
As annuitization experience continued to emerge, we refined our annuitization assumptions including age-based behavior, which generally lowered the annuitization rate. The change in annuitization assumptions decreased the fair value of GLB liabilities and generated a realized gain of approximately
$117 million
.
|
|
•
|
Reinsured policies allow for policyholders to make periodic withdrawals from their account values without lapsing the policy. The partial withdrawal results in a reduction to the associated guaranteed value that is either equal or proportional to the amount of the reduction in account value. Based on continued emerging experience, we refined our assumptions
|
F-34
NOTES TO CONSOLIDATED FINANCIAL STATEMENTS
(continued)
Chubb Limited and Subsidiaries
around the types of partial withdrawals according to their impact on guaranteed value. This resulted in an increase to the fair value of GLB liabilities generating a realized loss of approximately
$43 million
.
|
•
|
As lapse experience continued to emerge, we further refined our assumptions which resulted in a net increase to the fair value of GLB liabilities generating a realized loss of approximately
$9 million
.
|
|
•
|
We studied mortality experience for our variable annuity business for the first time this year and subsequently refined our mortality assumptions. The updated mortality rates increased the fair value of GLB liabilities generating a realized loss of approximately
$25 million
.
|
In addition to the updates described above, we updated aspects of our valuation model relating to interest rates during the year ended December 31, 2017. This resulted in a decrease to the fair value of GLB liabilities generating a realized gain of approximately
$94 million
.
During the year ended
December 31, 2017
, we also made minor technical refinements to the internal valuation model which resulted in no material impact on the financial statements.
Financial instruments measured at fair value on a recurring basis, by valuation hierarchy
|
December 31, 2017
|
Level 1
|
|
Level 2
|
|
Level 3
|
|
Total
|
|
|||||||
|
(in millions of U.S. dollars)
|
|||||||||||||||
|
Assets:
|
|||||||||||||||
|
Fixed maturities available for sale
|
|||||||||||||||
|
U.S. Treasury and agency
|
$
|
3,129
|
|
$
|
569
|
|
$
|
—
|
|
$
|
3,698
|
|
|||
|
Foreign
|
—
|
|
20,937
|
|
93
|
|
21,030
|
|
|||||||
|
Corporate securities
|
—
|
|
22,959
|
|
1,037
|
|
23,996
|
|
|||||||
|
Mortgage-backed securities
|
—
|
|
15,212
|
|
78
|
|
15,290
|
|
|||||||
|
States, municipalities, and political subdivisions
|
—
|
|
14,925
|
|
—
|
|
14,925
|
|
|||||||
|
3,129
|
|
74,602
|
|
1,208
|
|
78,939
|
|
||||||||
|
Equity securities
|
893
|
|
—
|
|
44
|
|
937
|
|
|||||||
|
Short-term investments
|
2,309
|
|
1,252
|
|
—
|
|
3,561
|
|
|||||||
|
Other investments
(1)
|
466
|
|
305
|
|
263
|
|
1,034
|
|
|||||||
|
Securities lending collateral
|
—
|
|
1,737
|
|
—
|
|
1,737
|
|
|||||||
|
Investment derivative instruments
|
18
|
|
—
|
|
—
|
|
18
|
|
|||||||
|
Other derivative instruments
|
1
|
|
—
|
|
—
|
|
1
|
|
|||||||
|
Separate account assets
|
2,635
|
|
99
|
|
—
|
|
2,734
|
|
|||||||
|
Total assets measured at fair value
(1)
|
$
|
9,451
|
|
$
|
77,995
|
|
$
|
1,515
|
|
$
|
88,961
|
|
|||
|
Liabilities:
|
|||||||||||||||
|
Investment derivative instruments
|
$
|
30
|
|
$
|
—
|
|
$
|
—
|
|
$
|
30
|
|
|||
|
Other derivative instruments
|
21
|
|
—
|
|
2
|
|
23
|
|
|||||||
|
GLB
(2)
|
—
|
|
—
|
|
204
|
|
204
|
|
|||||||
|
Total liabilities measured at fair value
|
$
|
51
|
|
$
|
—
|
|
$
|
206
|
|
$
|
257
|
|
|||
|
(1)
|
Excluded from the table above are partially-owned investments, investment funds, and limited partnerships of
$3,623 million
and other investments of
$15 million
at
December 31, 2017
measured using NAV as a practical expedient.
|
|
(2)
|
Our GLB reinsurance product meets the definition of a derivative instrument for accounting purposes and is accordingly carried at fair value. Excluded from the table above is the portion of the GLB derivative liability classified as Future policy benefits in the Consolidated balance sheets. Refer to Note
5
c
) for additional information.
|
F-35
NOTES TO CONSOLIDATED FINANCIAL STATEMENTS
(continued)
Chubb Limited and Subsidiaries
|
December 31, 2016
|
Level 1
|
|
Level 2
|
|
Level 3
|
|
Total
|
|
|||||||
|
(in millions of U.S. dollars)
|
|||||||||||||||
|
Assets:
|
|||||||||||||||
|
Fixed maturities available for sale
|
|||||||||||||||
|
U.S. Treasury and agency
|
$
|
2,175
|
|
$
|
695
|
|
$
|
—
|
|
$
|
2,870
|
|
|||
|
Foreign
|
—
|
|
21,366
|
|
74
|
|
21,440
|
|
|||||||
|
Corporate securities
|
—
|
|
23,468
|
|
681
|
|
24,149
|
|
|||||||
|
Mortgage-backed securities
|
—
|
|
13,962
|
|
45
|
|
14,007
|
|
|||||||
|
States, municipalities, and political subdivisions
|
—
|
|
17,649
|
|
—
|
|
17,649
|
|
|||||||
|
2,175
|
|
77,140
|
|
800
|
|
80,115
|
|
||||||||
|
Equity securities
|
773
|
|
—
|
|
41
|
|
814
|
|
|||||||
|
Short-term investments
|
1,757
|
|
1,220
|
|
25
|
|
3,002
|
|
|||||||
|
Other investments
(1)
|
384
|
|
259
|
|
225
|
|
868
|
|
|||||||
|
Securities lending collateral
|
—
|
|
1,092
|
|
—
|
|
1,092
|
|
|||||||
|
Investment derivative instruments
|
31
|
|
—
|
|
—
|
|
31
|
|
|||||||
|
Other derivative instruments
|
3
|
|
—
|
|
—
|
|
3
|
|
|||||||
|
Separate account assets
|
1,784
|
|
95
|
|
—
|
|
1,879
|
|
|||||||
|
Total assets measured at fair value
(1)
|
$
|
6,907
|
|
$
|
79,806
|
|
$
|
1,091
|
|
$
|
87,804
|
|
|||
|
Liabilities:
|
|||||||||||||||
|
Investment derivative instruments
|
$
|
54
|
|
$
|
—
|
|
$
|
—
|
|
$
|
54
|
|
|||
|
Other derivative instruments
|
—
|
|
—
|
|
13
|
|
13
|
|
|||||||
|
GLB
(2)
|
—
|
|
—
|
|
559
|
|
559
|
|
|||||||
|
Total liabilities measured at fair value
|
$
|
54
|
|
$
|
—
|
|
$
|
572
|
|
$
|
626
|
|
|||
|
(1)
|
Excluded from the table above are partially-owned investments, investment funds, and limited partnerships of
$3,626 million
and other investments of
$25 million
at
December 31, 2016
measured using NAV as a practical expedient.
|
|
(2)
|
Our GLB reinsurance product meets the definition of a derivative instrument for accounting purposes and is accordingly carried at fair value. Excluded from the table above is the portion of the GLB derivative liability classified as Future policy benefits in the Consolidated balance sheets. Refer to Note
5
c
) for additional information.
|
There were no transfers of financial instruments between Level 1 and Level 2 for the years ended December 31, 2017, 2016, and 2015.
Fair value of alternative investments
Alternative investments include investment funds, limited partnerships, and partially-owned investment companies measured at fair value using NAV as a practical expedient.
F-36
NOTES TO CONSOLIDATED FINANCIAL STATEMENTS
(continued)
Chubb Limited and Subsidiaries
The following table presents, by investment category, the expected liquidation period, fair value, and maximum future funding commitments of alternative investments:
|
December 31
|
December 31
|
||||||||||||||||
|
|
2017
|
2016
|
|||||||||||||||
|
(in millions of U.S. dollars)
|
Expected
Liquidation
Period of Underlying Assets
|
Fair Value
|
|
Maximum
Future Funding
Commitments
|
|
Fair Value
|
|
Maximum
Future Funding
Commitments
|
|
||||||||
|
Financial
|
5 to 9 Years
|
$
|
540
|
|
$
|
330
|
|
$
|
548
|
|
$
|
428
|
|
||||
|
Real Assets
|
3 to 7 Years
|
651
|
|
114
|
|
536
|
|
230
|
|
||||||||
|
Distressed
|
3 to 7 Years
|
289
|
|
141
|
|
485
|
|
179
|
|
||||||||
|
Private Credit
|
3 to 7 Years
|
187
|
|
327
|
|
236
|
|
259
|
|
||||||||
|
Traditional
|
3 to 15 Years
|
1,656
|
|
3,149
|
|
1,550
|
|
930
|
|
||||||||
|
Vintage
|
1 to 2 Years
|
30
|
|
—
|
|
21
|
|
14
|
|
||||||||
|
Investment funds
|
Not Applicable
|
270
|
|
—
|
|
251
|
|
—
|
|
||||||||
|
$
|
3,623
|
|
$
|
4,061
|
|
$
|
3,627
|
|
$
|
2,040
|
|
||||||
Included in all categories in the above table, except for Investment funds, are investments for which Chubb will never have the contractual option to redeem but receives distributions based on the liquidation of the underlying assets. Further, for all categories except for Investment funds, Chubb does not have the ability to sell or transfer the investments without the consent from the general partner of individual funds.
|
Investment Category
|
Consists of investments in private equity funds:
|
|
|
Financial
|
targeting financial services companies such as financial institutions and insurance services worldwide
|
|
|
Real Assets
|
targeting investments related to hard physical assets such as real estate, infrastructure, and natural resources
|
|
|
Distressed
|
targeting distressed corporate debt/credit and equity opportunities in the U.S.
|
|
|
Private Credit
|
targeting privately originated corporate debt investments including senior secured loans and subordinated bonds
|
|
|
Traditional
|
employing traditional private equity investment strategies such as buyout and growth equity globally
|
|
|
Vintage
|
made before 2002 or where the funds’ commitment periods had already expired
|
|
Investment funds
Chubb’s investment funds employ various investment strategies such as long/short equity and arbitrage/distressed. Included in this category are investments for which Chubb has the option to redeem at agreed upon value as described in each investment fund’s subscription agreement. Depending on the terms of the various subscription agreements, investment fund investments may be redeemed monthly, quarterly, semi-annually, or annually. If Chubb wishes to redeem an investment fund investment, it must first determine if the investment fund is still in a lock-up period (a time when Chubb cannot redeem its investment so that the investment fund manager has time to build the portfolio). If the investment fund is no longer in its lock-up period, Chubb must then notify the investment fund manager of its intention to redeem by the notification date prescribed by the subscription agreement. Subsequent to notification, the investment fund can redeem Chubb’s investment within several months of the notification. Notice periods for redemption of the investment funds range between
5
and
120
days. Chubb can redeem its investment funds without consent from the investment fund managers.
F-37
NOTES TO CONSOLIDATED FINANCIAL STATEMENTS
(continued)
Chubb Limited and Subsidiaries
Level 3 financial instruments
The fair values of assets and liabilities measured at fair value using significant unobservable inputs (Level 3) consist of various inputs and assumptions that management makes when determining fair value. Management analyzes changes in fair value measurements classified within Level 3 by comparing pricing and returns of our investments to benchmarks, including month-over-month movements, investment credit spreads, interest rate movements, and credit quality of securities.
The following table presents the significant unobservable inputs used in the Level 3 liability valuations. Excluded from the table below are inputs used to determine the fair value of Level 3 assets which are based on single broker quotes and contain no quantitative unobservable inputs developed by management.
|
(in millions of U.S. dollars, except for percentages)
|
Fair Value at
December 31, 2017
|
|
Valuation
Technique
|
Significant
Unobservable Inputs
|
Ranges
|
|||||
|
GLB
(1)
|
$
|
204
|
|
Actuarial model
|
Lapse rate
|
3% – 33%
|
||||
|
Annuitization rate
|
0% – 100%
|
|||||||||
|
(1)
|
Discussion of the most significant inputs used in the fair value measurement of GLB and the sensitivity of those assumptions is included within Note
4
a) Guaranteed living benefits.
|
The following tables present a reconciliation of the beginning and ending balances of financial instruments measured at fair value using significant unobservable inputs (Level 3):
|
|
Assets
|
|
Liabilities
|
|
|||||||||||||||||||||||||||
|
|
Available-for-Sale Debt Securities
|
Equity
securities
|
|
Short-term investments
|
|
Other
investments
|
|
Other derivative instruments
|
|
GLB
(2)
|
|
||||||||||||||||||||
|
Year Ended December 31, 2017
|
Foreign
|
|
Corporate
securities
(1)
|
|
MBS
|
|
|||||||||||||||||||||||||
|
(in millions of U.S. dollars)
|
|||||||||||||||||||||||||||||||
|
Balance, beginning of year
|
$
|
74
|
|
$
|
681
|
|
$
|
45
|
|
$
|
41
|
|
$
|
25
|
|
$
|
225
|
|
$
|
13
|
|
$
|
559
|
|
|||||||
|
Transfers into Level 3
|
—
|
|
231
|
|
50
|
|
—
|
|
—
|
|
—
|
|
—
|
|
9
|
|
|||||||||||||||
|
Transfers out of Level 3
|
(3
|
)
|
(93
|
)
|
—
|
|
—
|
|
—
|
|
—
|
|
(9
|
)
|
—
|
|
|||||||||||||||
|
Change in Net Unrealized Gains (Losses) included in OCI
|
3
|
|
(12
|
)
|
—
|
|
(1
|
)
|
—
|
|
6
|
|
—
|
|
—
|
|
|||||||||||||||
|
Net Realized Gains/Losses
|
—
|
|
—
|
|
—
|
|
2
|
|
—
|
|
—
|
|
(2
|
)
|
(364
|
)
|
|||||||||||||||
|
Purchases
|
84
|
|
521
|
|
8
|
|
24
|
|
16
|
|
56
|
|
—
|
|
—
|
|
|||||||||||||||
|
Sales
|
(59
|
)
|
(111
|
)
|
(1
|
)
|
(22
|
)
|
—
|
|
—
|
|
—
|
|
—
|
|
|||||||||||||||
|
Settlements
|
(6
|
)
|
(180
|
)
|
(24
|
)
|
—
|
|
(41
|
)
|
(24
|
)
|
—
|
|
—
|
|
|||||||||||||||
|
Balance, end of year
|
$
|
93
|
|
$
|
1,037
|
|
$
|
78
|
|
$
|
44
|
|
$
|
—
|
|
$
|
263
|
|
$
|
2
|
|
$
|
204
|
|
|||||||
|
Net Realized Gains/Losses Attributable to Changes in Fair Value at the Balance Sheet Date
|
$
|
(1
|
)
|
$
|
(2
|
)
|
$
|
—
|
|
$
|
(1
|
)
|
$
|
—
|
|
$
|
—
|
|
$
|
(2
|
)
|
$
|
(364
|
)
|
|||||||
|
(1)
|
Transfers into and Purchases in Level 3 primarily consist of privately-placed fixed income securities.
|
|
(2)
|
Our GLB reinsurance product meets the definition of a derivative instrument for accounting purposes and is accordingly carried at fair value. Excluded from the table above is the portion of the GLB derivative liability classified as Future policy benefits in the Consolidated balance sheets. Refer to Note
5
c
) for additional information.
|
F-38
NOTES TO CONSOLIDATED FINANCIAL STATEMENTS
(continued)
Chubb Limited and Subsidiaries
|
|
Liabilities
|
|
||||||||||||||||||||||||||||||
|
|
Available-for-Sale Debt Securities
|
Equity
securities
|
|
Short-term investments
|
|
Other
investments |
|
Other derivative instruments
|
|
GLB
(1)
|
|
|||||||||||||||||||||
|
Year Ended December 31, 2016
|
Foreign
|
|
Corporate
securities
|
|
MBS
|
|
||||||||||||||||||||||||||
|
(in millions of U.S. dollars)
|
||||||||||||||||||||||||||||||||
|
Balance, beginning of year
|
$
|
57
|
|
$
|
174
|
|
$
|
53
|
|
$
|
16
|
|
$
|
—
|
|
$
|
212
|
|
—
|
|
$
|
6
|
|
$
|
609
|
|
||||||
|
Transfers into Level 3
|
9
|
|
53
|
|
—
|
|
—
|
|
—
|
|
—
|
|
—
|
|
—
|
|
—
|
|
||||||||||||||
|
Transfers out of Level 3
|
(24
|
)
|
(10
|
)
|
—
|
|
—
|
|
(50
|
)
|
—
|
|
—
|
|
—
|
|
||||||||||||||||
|
Change in Net Unrealized Gains (Losses) included in OCI
|
1
|
|
15
|
|
(1
|
)
|
2
|
|
—
|
|
(2
|
)
|
—
|
|
—
|
|
||||||||||||||||
|
Net Realized Gains/Losses
|
(6
|
)
|
(13
|
)
|
—
|
|
1
|
|
—
|
|
1
|
|
5
|
|
(50
|
)
|
||||||||||||||||
|
Purchases
(2)
|
70
|
|
566
|
|
1
|
|
27
|
|
75
|
|
33
|
|
2
|
|
—
|
|
||||||||||||||||
|
Sales
|
(17
|
)
|
(59
|
)
|
(8
|
)
|
(5
|
)
|
—
|
|
—
|
|
—
|
|
—
|
|
||||||||||||||||
|
Settlements
|
(16
|
)
|
(45
|
)
|
—
|
|
—
|
|
—
|
|
(19
|
)
|
—
|
|
—
|
|
||||||||||||||||
|
Balance, end of year
|
$
|
74
|
|
$
|
681
|
|
$
|
45
|
|
$
|
41
|
|
$
|
25
|
|
$
|
225
|
|
$
|
13
|
|
$
|
559
|
|
||||||||
|
Net Realized Gains/Losses Attributable to Changes in Fair Value at the Balance Sheet Date
|
$
|
(5
|
)
|
$
|
(11
|
)
|
$
|
—
|
|
$
|
—
|
|
$
|
—
|
|
$
|
1
|
|
$
|
5
|
|
$
|
(50
|
)
|
||||||||
|
(1)
|
Our GLB reinsurance product meets the definition of a derivative instrument for accounting purposes and is accordingly carried at fair value. Excluded from the table above is the portion of the GLB derivative liability classified as Future policy benefits in the Consolidated balance sheets. The liability for GLB reinsurance was
$853 million
at
December 31, 2016
and
$888 million
at
December 31, 2015
, which includes a fair value derivative adjustment of
$559 million
and
$609 million
, respectively.
|
(2)
Includes acquired invested assets as a result of the Chubb Corp acquisition.
|
|
Assets
|
Liabilities
|
|||||||||||||||||||||||||
|
|
Available-for-Sale Debt Securities
|
Other
derivative
instruments
|
|
GLB
(1)
|
|
||||||||||||||||||||||
|
Year Ended December 31, 2015
|
Foreign
|
|
Corporate
securities
|
|
MBS
|
|
Equity
securities
|
|
Other
investments
|
|
|||||||||||||||||
|
(in millions of U.S. dollars)
|
|||||||||||||||||||||||||||
|
Balance, beginning of year
|
$
|
22
|
|
$
|
187
|
|
$
|
15
|
|
$
|
2
|
|
$
|
204
|
|
$
|
4
|
|
$
|
406
|
|
||||||
|
Transfers into Level 3
|
34
|
|
16
|
|
—
|
|
—
|
|
—
|
|
—
|
|
—
|
|
|||||||||||||
|
Transfers out of Level 3
|
—
|
|
—
|
|
—
|
|
—
|
|
—
|
|
—
|
|
—
|
|
|||||||||||||
|
Change in Net Unrealized Gains (Losses) included in OCI
|
(2
|
)
|
(1
|
)
|
—
|
|
3
|
|
(6
|
)
|
—
|
|
—
|
|
|||||||||||||
|
Net Realized Gains/Losses
|
(1
|
)
|
(4
|
)
|
—
|
|
(2
|
)
|
—
|
|
2
|
|
203
|
|
|||||||||||||
|
Purchases
|
15
|
|
52
|
|
41
|
|
13
|
|
33
|
|
—
|
|
—
|
|
|||||||||||||
|
Sales
|
(3
|
)
|
(28
|
)
|
(2
|
)
|
—
|
|
—
|
|
—
|
|
—
|
|
|||||||||||||
|
Settlements
|
(8
|
)
|
(48
|
)
|
(1
|
)
|
|
|
(19
|
)
|
—
|
|
|
|
|||||||||||||
|
Balance, end of year
|
$
|
57
|
|
$
|
174
|
|
$
|
53
|
|
$
|
16
|
|
$
|
212
|
|
$
|
6
|
|
$
|
609
|
|
||||||
|
Net Realized Gains/Losses Attributable to Changes in Fair Value at the Balance Sheet Date
|
$
|
(1
|
)
|
$
|
(2
|
)
|
$
|
—
|
|
$
|
(2
|
)
|
$
|
—
|
|
$
|
2
|
|
$
|
203
|
|
||||||
|
(1)
|
Our GLB reinsurance product meets the definition of a derivative instrument for accounting purposes and is accordingly carried at fair value. Excluded from the table above is the portion of the GLB derivative liability classified as Future policy benefits in the Consolidated balance sheets. The liability for GLB reinsurance was
$888 million
at December 31,
2015
and
$663 million
at December 31, 2014, which includes a fair value derivative adjustment of
$609 million
and $
406 million
, respectively.
|
b) Financial instruments disclosed, but not measured, at fair value
Chubb uses various financial instruments in the normal course of its business. Our insurance contracts are excluded from fair value of financial instruments accounting guidance, and therefore, are not included in the amounts discussed below.
The carrying values of cash, other assets, other liabilities, and other financial instruments not included below approximated their fair values.
F-39
NOTES TO CONSOLIDATED FINANCIAL STATEMENTS
(continued)
Chubb Limited and Subsidiaries
Investments in partially-owned insurance companies
Fair values for investments in partially-owned insurance companies are based on Chubb’s share of the net assets based on the financial statements provided by those companies and are excluded from the valuation hierarchy tables below.
Short- and long-term debt, repurchase agreements, and trust preferred securities
Where practical, fair values for short-term debt, long-term debt, repurchase agreements, and trust preferred securities are estimated using discounted cash flow calculations based principally on observable inputs including incremental borrowing rates, which reflect Chubb’s credit rating, for similar types of borrowings with maturities consistent with those remaining for the debt being valued.
The following tables present fair value, by valuation hierarchy, and carrying value of the financial instruments not measured at fair value:
|
December 31, 2017
|
Fair Value
|
Carrying Value
|
|
||||||||||||||||
|
(in millions of U.S. dollars)
|
Level 1
|
|
Level 2
|
|
Level 3
|
|
Total
|
|
|||||||||||
|
Assets:
|
|||||||||||||||||||
|
Fixed maturities held to maturity
|
|||||||||||||||||||
|
U.S. Treasury and agency
|
$
|
857
|
|
$
|
58
|
|
$
|
—
|
|
$
|
915
|
|
$
|
908
|
|
||||
|
Foreign
|
—
|
|
1,757
|
|
—
|
|
1,757
|
|
1,738
|
|
|||||||||
|
Corporate securities
|
—
|
|
3,184
|
|
35
|
|
3,219
|
|
3,159
|
|
|||||||||
|
Mortgage-backed securities
|
—
|
|
2,742
|
|
—
|
|
2,742
|
|
2,724
|
|
|||||||||
|
States, municipalities, and political subdivisions
|
—
|
|
5,841
|
|
—
|
|
5,841
|
|
5,806
|
|
|||||||||
|
Total assets
|
$
|
857
|
|
$
|
13,582
|
|
$
|
35
|
|
$
|
14,474
|
|
$
|
14,335
|
|
||||
|
Liabilities:
|
|||||||||||||||||||
|
Repurchase agreements
|
$
|
—
|
|
$
|
1,408
|
|
$
|
—
|
|
$
|
1,408
|
|
$
|
1,408
|
|
||||
|
Short-term debt
|
—
|
|
1,013
|
|
—
|
|
1,013
|
|
1,013
|
|
|||||||||
|
Long-term debt
|
—
|
|
12,332
|
|
—
|
|
12,332
|
|
11,556
|
|
|||||||||
|
Trust preferred securities
|
—
|
|
468
|
|
—
|
|
468
|
|
308
|
|
|||||||||
|
Total liabilities
|
$
|
—
|
|
$
|
15,221
|
|
$
|
—
|
|
$
|
15,221
|
|
$
|
14,285
|
|
||||
|
December 31, 2016
|
Fair Value
|
Carrying Value
|
|
||||||||||||||||
|
(in millions of U.S. dollars)
|
Level 1
|
|
Level 2
|
|
Level 3
|
|
Total
|
|
|||||||||||
|
Assets:
|
|||||||||||||||||||
|
Fixed maturities held to maturity
|
|||||||||||||||||||
|
U.S. Treasury and agency
|
$
|
555
|
|
$
|
106
|
|
$
|
—
|
|
$
|
661
|
|
$
|
655
|
|
||||
|
Foreign
|
—
|
|
667
|
|
—
|
|
667
|
|
640
|
|
|||||||||
|
Corporate securities
|
—
|
|
2,782
|
|
13
|
|
2,795
|
|
2,771
|
|
|||||||||
|
Mortgage-backed securities
|
—
|
|
1,428
|
|
—
|
|
1,428
|
|
1,393
|
|
|||||||||
|
States, municipalities, and political subdivisions
|
—
|
|
5,119
|
|
—
|
|
5,119
|
|
5,185
|
|
|||||||||
|
Total assets
|
$
|
555
|
|
$
|
10,102
|
|
$
|
13
|
|
$
|
10,670
|
|
$
|
10,644
|
|
||||
|
Liabilities:
|
|||||||||||||||||||
|
Repurchase agreements
|
$
|
—
|
|
$
|
1,403
|
|
$
|
—
|
|
$
|
1,403
|
|
$
|
1,403
|
|
||||
|
Short-term debt
|
—
|
|
503
|
|
—
|
|
503
|
|
500
|
|
|||||||||
|
Long-term debt
|
—
|
|
12,998
|
|
—
|
|
12,998
|
|
12,610
|
|
|||||||||
|
Trust preferred securities
|
—
|
|
456
|
|
—
|
|
456
|
|
308
|
|
|||||||||
|
Total liabilities
|
$
|
—
|
|
$
|
15,360
|
|
$
|
—
|
|
$
|
15,360
|
|
$
|
14,821
|
|
||||
F-40
NOTES TO CONSOLIDATED FINANCIAL STATEMENTS
(continued)
Chubb Limited and Subsidiaries
5
. Reinsurance
a) Consolidated reinsurance
Chubb purchases reinsurance to manage various exposures including catastrophe risks. Although reinsurance agreements contractually obligate Chubb's reinsurers to reimburse it for the agreed-upon portion of its gross paid losses, they do not discharge Chubb's primary liability. The amounts for net premiums written and net premiums earned in the Consolidated statements of operations are net of reinsurance. The following table presents direct, assumed, and ceded premiums:
|
Year Ended December 31
|
|||||||||||
|
(in millions of U.S. dollars)
|
2017
|
|
2016
|
2015
|
|||||||
|
Premiums written
|
|||||||||||
|
Direct
|
$
|
33,137
|
|
$
|
31,543
|
|
$
|
19,879
|
|
||
|
Assumed
|
3,239
|
|
3,440
|
|
3,932
|
|
|||||
|
Ceded
|
(7,132
|
)
|
(6,838
|
)
|
(6,098
|
)
|
|||||
|
Net
|
$
|
29,244
|
|
$
|
28,145
|
|
$
|
17,713
|
|
||
|
Premiums earned
|
|
|
|||||||||
|
Direct
|
$
|
32,782
|
|
$
|
31,811
|
|
$
|
19,355
|
|
||
|
Assumed
|
3,332
|
|
3,744
|
|
3,676
|
|
|||||
|
Ceded
|
(7,080
|
)
|
(6,806
|
)
|
(5,818
|
)
|
|||||
|
Net
|
$
|
29,034
|
|
$
|
28,749
|
|
$
|
17,213
|
|
||
Ceded losses and loss expenses incurred were
$5.5 billion
,
$4.1 billion
, and
$3.1 billion
for the years ended
December 31, 2017
,
2016
, and
2015
, respectively.
b) Reinsurance recoverable on ceded reinsurance
|
December 31
|
|
December 31
|
||||||
|
(in millions of U.S. dollars)
|
2017
|
|
2016
|
|||||
|
Reinsurance recoverable on unpaid losses and loss expenses
(1)
|
$
|
14,014
|
|
$
|
12,708
|
|
||
|
Reinsurance recoverable on paid losses and loss expenses
(1)
|
1,020
|
|
869
|
|
||||
|
Reinsurance recoverable on losses and loss expenses
(1)
|
$
|
15,034
|
|
$
|
13,577
|
|
||
|
Reinsurance recoverable on policy benefits
(1)
|
$
|
184
|
|
$
|
182
|
|
||
|
(1)
|
Net of a provision for uncollectible reinsurance.
|
The increase in reinsurance recoverable on loss and loss expenses was principally related to the California wildfires and other catastrophe losses in 2017.
We evaluate the financial condition of our reinsurers and potential reinsurers on a regular basis and also monitor concentrations of credit risk with reinsurers. The provision for uncollectible reinsurance is required principally due to the potential failure of reinsurers to indemnify Chubb, primarily because of disputes under reinsurance contracts and insolvencies. We have established provisions for amounts estimated to be uncollectible. At
December 31, 2017
and
2016
, the provision for uncollectible reinsurance was
$321
million and $
300
million, respectively.
F-41
NOTES TO CONSOLIDATED FINANCIAL STATEMENTS
(continued)
Chubb Limited and Subsidiaries
The following tables present a listing, at
December 31, 2017
, of the categories of Chubb's reinsurers:
|
December 31, 2017
|
Gross Reinsurance Recoverable on Loss and Loss Expenses
|
|
Provision for Uncollectible Reinsurance
|
|
% of Gross Reinsurance Recoverable
|
|
||||
|
(in millions of U.S. dollars, except for percentages)
|
||||||||||
|
Categories
|
||||||||||
|
Largest reinsurers
|
$
|
5,190
|
|
$
|
59
|
|
1.1
|
%
|
||
|
Other reinsurers rated A- or better
|
5,898
|
|
58
|
|
1.0
|
%
|
||||
|
Other reinsurers with ratings lower than A- or not rated
|
681
|
|
75
|
|
11.0
|
%
|
||||
|
Pools
|
577
|
|
15
|
|
2.6
|
%
|
||||
|
Structured settlements
|
550
|
|
16
|
|
2.9
|
%
|
||||
|
Captives
|
2,199
|
|
18
|
|
0.8
|
%
|
||||
|
Other
|
260
|
|
80
|
|
30.8
|
%
|
||||
|
Total
|
$
|
15,355
|
|
$
|
321
|
|
2.1
|
%
|
||
|
Largest Reinsurers
|
||
|
Berkshire Hathaway Insurance Group
|
Lloyd's of London
|
Swiss Re Group
|
|
HDI Group (Hannover Re)
|
Munich Re Group
|
|
|
Categories of Chubb's reinsurers
|
Comprises:
|
|
|
Largest reinsurers
|
• All groups of reinsurers or captives where the gross recoverable exceeds one percent of Chubb's total shareholders' equity.
|
|
|
Other reinsurers rated A- or better
|
• All reinsurers rated A- or better that were not included in the largest reinsurer category.
|
|
|
Other reinsurers rated lower than A- or not rated
|
• All reinsurers rated lower than A- or not rated that were not included in the largest reinsurer category.
|
|
|
Pools
|
• Related to Chubb's voluntary pool participation and Chubb's mandatory pool participation required by law in certain states.
|
|
|
Structured settlements
|
• Annuities purchased from life insurance companies to settle claims. Since we retain ultimate liability in the event that the life company fails to pay, we reflect the amounts as both a liability and a recoverable/receivable for GAAP purposes.
|
|
|
Captives
|
• Companies established and owned by our insurance clients to assume a significant portion of their direct insurance risk from Chubb; structured to allow clients to self-insure a portion of their reinsurance risk. It generally is our policy to obtain collateral equal to expected losses. Where appropriate, exceptions are granted but only with review and approval at a senior officer level. Excludes captives included in the largest reinsurer category.
|
|
|
Other
|
• Amounts recoverable that are in dispute or are from companies that are in supervision, rehabilitation, or liquidation.
|
|
The provision for uncollectible reinsurance is principally based on an analysis of the credit quality of the reinsurer and collateral balances. We establish the provision for uncollectible reinsurance for the Other category based on a case-by-case analysis of individual situations including the merits of the underlying matter, credit and collateral analysis, and consideration of our collection experience in similar situations.
F-42
NOTES TO CONSOLIDATED FINANCIAL STATEMENTS
(continued)
Chubb Limited and Subsidiaries
c
) Assumed life reinsurance programs involving minimum benefit guarantees under variable annuity contracts
The following table presents income and expenses relating to GMDB and GLB reinsurance. GLBs include GMIBs as well as some GMABs originating in Japan.
|
|
Year Ended December 31
|
||||||||||
|
(in millions of U.S. dollars)
|
2017
|
|
2016
|
|
2015
|
|
|||||
|
GMDB
|
|||||||||||
|
Net premiums earned
|
$
|
49
|
|
$
|
55
|
|
$
|
61
|
|
||
|
Policy benefits and other reserve adjustments
|
$
|
40
|
|
$
|
45
|
|
$
|
34
|
|
||
|
GLB
|
|||||||||||
|
Net premiums earned
|
$
|
110
|
|
$
|
118
|
|
$
|
121
|
|
||
|
Policy benefits and other reserve adjustments
|
105
|
|
52
|
|
45
|
|
|||||
|
Net realized gains (losses)
|
363
|
|
48
|
|
(203
|
)
|
|||||
|
Gain (loss) recognized in Net income
|
$
|
368
|
|
$
|
114
|
|
$
|
(127
|
)
|
||
|
Net cash received and other
|
65
|
|
79
|
|
98
|
|
|||||
|
Net decrease (increase) in liability
|
$
|
303
|
|
$
|
35
|
|
$
|
(225
|
)
|
||
Net realized gains (losses) in the table above include gains (losses) related to foreign exchange and fair value adjustments on insurance derivatives and exclude gains (losses) on S&P put options and futures used to partially offset the risk in the GLB reinsurance portfolio. Refer to Note 10 for additional information.
At
December 31, 2017
and
2016
, the reported liability for GMDB reinsurance was
$129
million and
$120
million, respectively. At
December 31, 2017
and
2016
, the reported liability for GLB reinsurance was
$550
million and
$853
million, respectively, which includes a fair value derivative adjustment of
$204 million
and
$559
million, respectively. Reported liabilities for both GMDB and GLB reinsurance are determined using internal valuation models. Such valuations require considerable judgment and are subject to significant uncertainty. The valuation of these products is subject to fluctuations arising from, among other factors, changes in interest rates, changes in equity markets, changes in credit markets, changes in the allocation of the investments underlying annuitants’ account values, and assumptions regarding future policyholder behavior. These models and the related assumptions are regularly reviewed by management and enhanced, as appropriate, based upon improvements in modeling assumptions and availability of updated information, such as market conditions and demographics of in-force annuities.
F-43
NOTES TO CONSOLIDATED FINANCIAL STATEMENTS
(continued)
Chubb Limited and Subsidiaries
Variable Annuity Net Amount at Risk
The net amount at risk is defined as the present value of future claim payments assuming policy account values and guaranteed values are fixed at the valuation date (
December 31, 2017
and
2016
, respectively) and reinsurance coverage ends at the earlier of the maturity of the underlying variable annuity policy or the reinsurance treaty. In addition, the following assumptions were used:
|
(in millions of U.S. dollars, except for percentages)
|
Net amount at risk
|
|||||||||||
|
Reinsurance covering
|
December 31, 2017
|
|
December 31, 2016
|
|
2017
Future claims discount rate
|
Other assumptions
|
Total claims at
100% mortality at
December 31, 2017
(1)
|
|
||||
|
GMDB Risk Only
|
$
|
279
|
|
$
|
341
|
|
4.00% - 4.50%
|
No lapses or withdrawals
|
$
|
189
|
|
|
|
Mortality according to 100% of the Annuity 2000 mortality table
|
||||||||||||
|
GLB Risk Only
|
$
|
691
|
|
$
|
800
|
|
4.25% - 4.75%
|
No deaths, lapses or withdrawals
|
N/A
|
|
||
|
Annuitization at a frequency most disadvantageous to Chubb
(2)
|
||||||||||||
|
Claim calculated using interest rates in line with rates used to calculate reserve
|
||||||||||||
|
Both Risks:
(3)
|
GMDB
|
$
|
81
|
|
$
|
88
|
|
4.25% - 4.75%
|
No lapses or withdrawals
|
$
|
18
|
|
|
Mortality according to 100% of the Annuity 2000 mortality table
|
||||||||||||
|
GLB
|
$
|
392
|
|
$
|
464
|
|
4.25% - 4.75%
|
Annuitization at a frequency most disadvantageous to Chubb
(2)
|
N/A
|
|
||
|
Claim calculated using interest rates in line with rates used to calculate reserve
|
||||||||||||
(1)
Takes into account all applicable reinsurance treaty claim limits.
(2)
Annuitization at a level that maximizes claims taking into account the treaty limits.
(3)
Covering both the GMDB and GLB risks on the same underlying policyholders.
The average attained age of all policyholders for all risk categories above, weighted by the guaranteed value of each reinsured policy, is approximately
70
years.
6
. Goodwill and Other intangible assets
At
December 31, 2017
and
2016
, Goodwill was $
15.5
billion and $
15.3
billion, respectively, and Other intangible assets were $
6.5
billion and $
6.8
billion, respectively.
a) Goodwill
The following table presents a roll-forward of Goodwill by segment:
|
(in millions of U.S. dollars)
|
North America Commercial P&C Insurance
|
|
North America Personal P&C Insurance
|
|
North America Agricultural Insurance
|
|
Overseas General Insurance
|
|
Global Reinsurance
|
|
Life Insurance
|
|
Chubb Consolidated
|
|
|||||||||||||
|
Balance at December 31, 2015
|
$
|
1,203
|
|
$
|
196
|
|
$
|
134
|
|
$
|
2,078
|
|
$
|
365
|
|
$
|
820
|
|
$
|
4,796
|
|
||||||
|
Acquisition of Chubb Corp
|
5,714
|
|
2,025
|
|
—
|
|
2,775
|
|
—
|
|
—
|
|
10,514
|
|
|||||||||||||
|
Foreign exchange revaluation and other
|
44
|
|
14
|
|
—
|
|
(36
|
)
|
—
|
|
—
|
|
22
|
|
|||||||||||||
|
Balance at December 31, 2016
|
$
|
6,961
|
|
$
|
2,235
|
|
$
|
134
|
|
|
$
|
4,817
|
|
$
|
365
|
|
$
|
820
|
|
$
|
15,332
|
|
|||||
|
Foreign exchange revaluation and other
|
15
|
|
5
|
|
—
|
|
187
|
|
—
|
|
2
|
|
209
|
|
|||||||||||||
|
Balance at December 31, 2017
|
$
|
6,976
|
|
$
|
2,240
|
|
$
|
134
|
|
$
|
5,004
|
|
$
|
365
|
|
$
|
822
|
|
$
|
15,541
|
|
||||||
F-44
NOTES TO CONSOLIDATED FINANCIAL STATEMENTS
(continued)
Chubb Limited and Subsidiaries
b) Other intangible assets
The majority of the Other intangible assets balance at
December 31, 2017
relates to the Chubb Corp acquisition and comprised of $
3.5
billion that are subject to amortization, principally Agency distribution relationships and renewal rights, and $
3.0
billion that are not subject to amortization, principally trademarks. This compares to $
3.8 billion
and $
3.0 billion
at December 31, 2016, respectively.
Amortization of purchased intangibles
Amortization expense related to purchased intangibles amounted to
$260 million
, $
19
million, and $
171
million for the years ended
December 31, 2017
,
2016
, and
2015
, respectively. The increase in amortization expense of purchased intangibles primarily reflects higher intangible amortization expense related to agency distribution relationships and renewal rights and lower amortization benefit from the fair value adjustment on Unpaid losses and loss expenses, both related to the Chubb Corp acquisition.
The following table presents, as of
December 31, 2017
, the expected estimated pre-tax amortization expense (benefit) of purchased intangibles, at current foreign currency exchange rates, for the next five years:
|
Associated with the Chubb Corp Acquisition
|
|||||||||||||||||||||||
|
For the Year Ending December 31
(in millions of U.S. dollars)
|
Agency distribution relationships and renewal rights
|
|
Internally developed technology
|
|
Fair value adjustment on Unpaid losses and loss expense
(1)
|
|
Total
|
|
Other intangible assets
|
|
Total Amortization of purchased intangibles
|
|
|||||||||||
|
2018
|
$
|
325
|
|
$
|
32
|
|
$
|
(102
|
)
|
$
|
255
|
|
$
|
83
|
|
$
|
338
|
|
|||||
|
2019
|
282
|
|
—
|
|
(63
|
)
|
219
|
|
75
|
|
294
|
|
|||||||||||
|
2020
|
241
|
|
—
|
|
(36
|
)
|
205
|
|
67
|
|
272
|
|
|||||||||||
|
2021
|
218
|
|
—
|
|
(20
|
)
|
198
|
|
61
|
|
259
|
|
|||||||||||
|
2022
|
198
|
|
—
|
|
(14
|
)
|
184
|
|
57
|
|
241
|
|
|||||||||||
|
Total
|
$
|
1,264
|
|
$
|
32
|
|
$
|
(235
|
)
|
$
|
1,061
|
|
$
|
343
|
|
$
|
1,404
|
|
|||||
|
(1)
|
In connection with the Chubb Corp acquisition, we recorded an increase to Unpaid losses and loss expenses acquired to adjust the carrying value of Chubb Corp's historical unpaid losses and loss expenses to fair value as of the acquisition date. This fair value adjustment amortizes through Amortization of purchased intangibles on the Consolidated statements of operations over a range of
5
to
17
years. The balance of the fair value adjustment on Unpaid losses and loss expense at December 31, 2017 was
$309 million
. Refer to Note 1(h) for additional information.
|
c) VOBA
The following table presents a roll-forward of VOBA:
|
(in millions of U.S. dollars)
|
2017
|
|
2016
|
|
2015
|
|
|||||
|
Balance, beginning of year
|
$
|
355
|
|
$
|
395
|
|
$
|
466
|
|
||
|
Amortization of VOBA
(1)
|
(35
|
)
|
(41
|
)
|
(42
|
)
|
|||||
|
Foreign exchange revaluation
|
6
|
|
1
|
|
(29
|
)
|
|||||
|
Balance, end of year
|
$
|
326
|
|
$
|
355
|
|
$
|
395
|
|
||
|
(1)
|
Recognized in Policy acquisition costs in the Consolidated statements of operations.
|
F-45
NOTES TO CONSOLIDATED FINANCIAL STATEMENTS
(continued)
Chubb Limited and Subsidiaries
The following table presents, as of December 31, 2017, the expected estimated pre-tax amortization expense related to VOBA for the next five years:
|
For the Year Ending December 31
|
VOBA
|
|
|
|
(in millions of U.S. dollars)
|
|||
|
2018
|
$
|
32
|
|
|
2019
|
27
|
|
|
|
2020
|
25
|
|
|
|
2021
|
22
|
|
|
|
2022
|
20
|
|
|
|
Total
|
$
|
126
|
|
7
. Unpaid losses and loss expenses
Chubb establishes reserves for the estimated unpaid ultimate liability for losses and loss expenses under the terms of its policies and agreements. Reserves include estimates for both claims that have been reported and for IBNR claims, and include estimates of expenses associated with processing and settling these claims. Reserves are recorded in Unpaid losses and loss expenses in the consolidated balance sheets. While we believe that our reserves for unpaid losses and loss expenses at
December 31, 2017
are adequate, new information or trends may lead to future developments in incurred loss and loss expenses significantly greater or less than the reserves provided. Any such revisions could result in future changes in estimates of losses or reinsurance recoverable and would be reflected in our results of operations in the period in which the estimates are changed.
The following table presents a reconciliation of Unpaid losses and loss expenses:
|
Year Ended December 31
|
|||||||||||
|
(in millions of U.S. dollars)
|
2017
|
|
2016
|
2015
|
|||||||
|
Gross unpaid losses and loss expenses, beginning of year
|
$
|
60,540
|
|
$
|
37,303
|
|
$
|
38,315
|
|
||
|
Reinsurance recoverable on unpaid losses
(1)
|
(12,708
|
)
|
(10,741
|
)
|
(11,307
|
)
|
|||||
|
Net unpaid losses and loss expenses, beginning of year
|
47,832
|
|
26,562
|
|
27,008
|
|
|||||
|
Acquisition of subsidiaries
|
—
|
|
21,402
|
|
417
|
|
|||||
|
Total
|
47,832
|
|
47,964
|
|
27,425
|
|
|||||
|
Net losses and loss expenses incurred in respect of losses occurring in:
|
|||||||||||
|
Current year
|
19,391
|
|
17,256
|
|
10,030
|
|
|||||
|
Prior years
(2)
|
(937
|
)
|
(1,204
|
)
|
(546
|
)
|
|||||
|
Total
|
18,454
|
|
16,052
|
|
9,484
|
|
|||||
|
Net losses and loss expenses paid in respect of losses occurring in:
|
|||||||||||
|
Current year
|
6,575
|
|
5,899
|
|
4,053
|
|
|||||
|
Prior years
|
10,873
|
|
9,816
|
|
5,612
|
|
|||||
|
Total
|
17,448
|
|
15,715
|
|
9,665
|
|
|||||
|
Foreign currency revaluation and other
|
327
|
|
(469
|
)
|
(682
|
)
|
|||||
|
Net unpaid losses and loss expenses, end of year
|
49,165
|
|
47,832
|
|
26,562
|
|
|||||
|
Reinsurance recoverable on unpaid losses
(1)
|
14,014
|
|
12,708
|
|
10,741
|
|
|||||
|
Gross unpaid losses and loss expenses, end of year
|
$
|
63,179
|
|
$
|
60,540
|
|
$
|
37,303
|
|
||
(1)
Net of provision for uncollectible reinsurance.
(2)
Relates to prior period loss reserve development only and excludes prior period development related to reinstatement premiums, expense adjustments, and earned premiums totaling
$108 million
,
$69 million
, and nil, for 2017, 2016, and 2015, respectively.
The increase in gross and net unpaid losses and loss expenses in 2017 primarily reflects the significant catastrophe events, principally from California wildfires, hurricanes Harvey, Irma, and Maria and the earthquakes in Mexico. The increase in gross
F-46
NOTES TO CONSOLIDATED FINANCIAL STATEMENTS
(continued)
Chubb Limited and Subsidiaries
and net unpaid losses and loss expenses in 2016 reflects the acquisition of Chubb Corp.
The loss development tables under section c) below, present Chubb’s historical incurred and paid claims development by broad product line through
December 31, 2017
, net of reinsurance, as well as the cumulative number of reported claims, IBNR balances, and other supplementary information.
The following table presents a reconciliation of the loss development tables to the liability for unpaid losses and loss expenses in the consolidated balance sheet:
|
Reconciliation of Reserve Balances to Liability for Unpaid Loss and Loss Expenses
|
||||
|
(in millions of U.S. dollars)
|
December 31, 2017
|
|
||
|
Presented in the loss development tables:
|
||||
|
North America Commercial P&C Insurance — Workers' Compensation
|
$
|
8,873
|
|
|
|
North America Commercial P&C Insurance — Liability
|
16,631
|
|
||
|
North America Commercial P&C Insurance — Other Casualty
|
1,789
|
|
||
|
North America Commercial P&C Insurance — Non-Casualty
|
2,398
|
|
||
|
North America Personal P&C Insurance
|
2,421
|
|
||
|
Overseas General Insurance — Casualty
|
6,026
|
|
||
|
Overseas General Insurance — Non-Casualty
|
2,549
|
|
||
|
Global Reinsurance — Casualty
|
1,340
|
|
||
|
Global Reinsurance — Non-Casualty
|
371
|
|
||
|
Excluded from the loss development tables:
|
||||
|
Other
|
4,302
|
|
||
|
Net unpaid loss and allocated loss adjustment expense
|
46,700
|
|
||
|
Ceded unpaid loss and allocated loss adjustment expense:
|
||||
|
North America Commercial P&C Insurance — Workers' Compensation
|
$
|
1,737
|
|
|
|
North America Commercial P&C Insurance — Liability
|
4,133
|
|
||
|
North America Commercial P&C Insurance — Other Casualty
|
813
|
|
||
|
North America Commercial P&C Insurance — Non-Casualty
|
1,336
|
|
||
|
North America Personal P&C Insurance
|
503
|
|
||
|
Overseas General Insurance — Casualty
|
2,550
|
|
||
|
Overseas General Insurance — Non-Casualty
|
1,269
|
|
||
|
Global Reinsurance — Casualty
|
76
|
|
||
|
Global Reinsurance — Non-Casualty
|
142
|
|
||
|
Other
|
1,628
|
|
||
|
Ceded unpaid loss and allocated loss adjustment expense
|
14,187
|
|
||
|
Unpaid loss and loss expense on other than short-duration contracts
(1)
|
810
|
|
||
|
Unpaid unallocated loss adjustment expenses
|
1,482
|
|
||
|
Unpaid losses and loss expenses
|
$
|
63,179
|
|
|
(1)
Primarily includes the claims reserve of our international A&H business and Life Insurance segment reserves.
F-47
NOTES TO CONSOLIDATED FINANCIAL STATEMENTS
(continued)
Chubb Limited and Subsidiaries
Business excluded from the loss development tables
“Other” shown in the reconciliation table above comprises businesses excluded from the loss development tables below:
|
•
|
North America Agricultural Insurance segment business, which is short-tailed with the majority of the liabilities expected to be resolved in the ensuing twelve months;
|
|
•
|
Corporate segment business, which includes run-off liabilities such as asbestos and environmental and other mass tort exposures and which impact accident years older than those shown in the exhibits below;
|
|
•
|
Life Insurance segment business, which is generally written using long-duration contracts; and
|
|
•
|
Certain subsets of our business due to data limitations or unsuitability to the development table presentation, including:
|
|
◦
|
We underwrite loss portfolio transfers at various times; by convention, all premium and losses associated with these transactions are recorded to the policy period of the transaction, even though the accident dates of the claims covered may be a decade or more in the past. We also underwrite certain high attachment, high limit, multiple-line and excess of aggregate coverages for large commercial clients. Changes in incurred loss and cash flow patterns are volatile and sufficiently different from those of typical insureds. This category includes the loss portfolio transfer of Fireman’s Fund personal lines run-off liabilities and Alternative Risk Solutions business within the North America Commercial P&C segment;
|
|
◦
|
2015 and prior paid history on a subset of previously acquired international businesses, within the Overseas General Insurance segment, due to limitations on the data prior to the acquisition;
|
|
◦
|
Reinsurance recoverable bad debt;
|
|
◦
|
Purchase accounting adjustments related to unpaid losses and loss expenses for Chubb Corp.
|
a) Description of Reserving Methodologies
Our recorded reserves represent management's best estimate of the provision for unpaid claims as of the balance sheet date. Management's best estimate is developed after collaboration with actuarial, underwriting, claims, legal, and finance departments and culminates with the input of reserve committees. Each business unit reserve committee includes the participation of the relevant parties from actuarial, finance, claims, and unit senior management and has the responsibility for finalizing, recommending and approving the estimate to be used as management's best estimate. Reserves are further reviewed by Chubb's Chief Actuary and senior management. The objective of such a process is to determine a single estimate that we believe represents a better estimate than any other and which is viewed by management to be the best estimate of ultimate loss settlements.
This estimate is based on a combination of exposure and experience-based actuarial methods (described below) and other considerations such as claims reviews, reinsurance recovery assumptions and/or input from other knowledgeable parties such as underwriting. Exposure-based methods are most commonly used on relatively immature origin years (i.e., the year in which the losses were incurred — “accident year” or “report year”), while experience-based methods provide a view based on the projection of loss experience that has emerged as of the valuation date. Greater reliance is placed upon experience-based methods as the pool of emerging loss experience grows and where it is deemed sufficiently credible and reliable as the basis for the estimate. In comparing the held reserve for any given origin year to the actuarial projections, judgment is required as to the credibility, uncertainty and inherent limitations of applying actuarial techniques to historical data to project future loss experience. Examples of factors that impact such judgments include, but are not limited to, the following:
|
•
|
nature and complexity of underlying coverage provided and net limits of exposure provided;
|
|
•
|
segmentation of data to provide sufficient homogeneity and credibility for loss projection methods;
|
|
•
|
extent of credible internal historical loss data and reliance upon industry information as required;
|
|
•
|
historical variability of actual loss emergence compared with expected loss emergence;
|
|
•
|
extent of emerged loss experience relative to the remaining expected period of loss emergence;
|
|
•
|
rate monitor information for new and renewal business;
|
|
•
|
facts and circumstances of large claims;
|
|
•
|
impact of applicable reinsurance recoveries; and
|
|
•
|
nature and extent of underlying assumptions.
|
We have actuarial staff within each of our business units who analyze loss reserves (including loss expenses) and regularly project estimates of ultimate losses and the corresponding indications of the required IBNR reserve. Our reserving approach is a comprehensive ground-up process using data at a detailed level that reflects the specific types and coverages of the diverse products written by our various operations. The data presented in this disclosure was prepared on a more aggregated basis and with a focus on changes in incurred loss estimates over time as well as associated cash flows. We note that data prepared on
F-48
NOTES TO CONSOLIDATED FINANCIAL STATEMENTS
(continued)
Chubb Limited and Subsidiaries
this basis may not demonstrate the full spectrum of characteristics that are evident in the more detailed level studied internally.
We perform an actuarial reserve review for each product line at least once a year. For most product lines, one or more standard actuarial reserving methods may be used to determine estimates of ultimate losses and loss expenses, and from these estimates, a single actuarial central estimate is selected. The actuarial central estimate is an input to the reserve committee process described above. For the few product lines that do not lend themselves to standard actuarial reserving methods, appropriate techniques are applied to produce the actuarial central estimates. For example, run-off asbestos and environmental liability estimates are better suited to the application of account-specific exposure-based analyses to best evaluate their associated aggregate reserve levels.
b) Standard actuarial reserving methods
Standard actuarial reserving methods include, but are not limited to, expected loss ratio, paid and reported loss development, and Bornhuetter-Ferguson methods. A general description of these methods is provided below. In addition to these standard methods, depending upon the product line characteristics and available data, we may use other recognized actuarial methods and approaches. Implicit in the standard actuarial methods that we generally utilize is the need for two fundamental assumptions: first, the pattern by which losses are expected to emerge over time for each origin year, and second the expected loss ratio for each origin year.
The expected loss ratio for any particular origin year is selected after consideration of a number of factors, including historical loss ratios adjusted for rate changes, premium and loss trends, industry benchmarks, the results of policy level loss modeling at the time of underwriting, and/or other more subjective considerations for the product line (e.g., terms and conditions) and external environment as noted above. The expected loss ratio for a given origin year is initially established at the start of the origin year as part of the planning process. This analysis is performed in conjunction with underwriters and management. The expected loss ratio method arrives at an ultimate loss estimate by multiplying the expected ultimate loss ratio by the corresponding premium base. This method is most commonly used as the basis for the actuarial central estimate for immature origin periods on product lines where the actual paid or reported loss experience is not yet deemed sufficiently credible to serve as the principal basis for the selection of ultimate losses. The expected loss ratio for a given origin year may be modified over time if the underlying assumptions differ from the original assumptions (e.g., the assessment of prior year loss ratios, loss trend, rate changes, actual claims, or other information).
Our selected paid and reported development patterns provide a benchmark against which the actual emerging loss experience can be monitored. Where possible, development patterns are selected based on historical loss emergence by origin year. For product lines where the historical data is viewed to have low statistical credibility, the selected development patterns also reflect relevant industry benchmarks and/or experience from similar product lines written elsewhere within Chubb. This most commonly occurs for relatively new product lines that have limited historical data or for high severity/low frequency portfolios where our historical experience exhibits considerable volatility and/or lacks credibility. The paid and reported loss development methods convert the selected loss emergence pattern to a set of multiplicative factors which are then applied to actual paid or reported losses to arrive at an estimate of ultimate losses for each period. Due to their multiplicative nature, the paid and reported loss development methods will leverage differences between actual and expected loss emergence. These methods tend to be utilized for more mature origin periods and for those portfolios where the loss emergence has been relatively consistent over time.
The Bornhuetter-Ferguson method is a combination of the expected loss ratio method and the loss development method, where the loss development method is given more weight as the origin year matures. This approach allows a logical transition between the expected loss ratio method which is generally utilized at earlier maturities and the loss development methods which are typically utilized at later maturities. We usually apply this method using reported loss data although paid data may also be used.
Short-tail business
Short-tail business generally describes product lines for which losses are typically known and paid shortly after the loss actually occurs. This would include, for example, most property, personal accident, and automobile physical damage policies that we write. Due to the short reporting and development pattern for these product lines, the uncertainty associated with our estimate of ultimate losses for any particular accident period diminishes relatively quickly as actual loss experience emerges. We typically assign credibility to methods that incorporate actual loss emergence, such as the paid and reported loss development and Bornhuetter-Ferguson methods, sooner than would be the case for long-tail lines at a similar stage of development for a given origin year. The reserving process for short-tail losses arising from catastrophic events typically involves an assessment by the claims department, in conjunction with underwriters and actuaries, of our exposure and estimated losses immediately following
F-49
NOTES TO CONSOLIDATED FINANCIAL STATEMENTS
(continued)
Chubb Limited and Subsidiaries
an event and then subsequent revisions of the estimated losses as our insureds provide updated actual loss information.
Long-tail business
Long-tail business describes lines of business for which specific losses may not be known/reported for some period and for which claims can take significant time to settle/close. This includes most casualty lines such as general liability, D&O, and workers' compensation. There are various factors contributing to the uncertainty and volatility of long-tail business. Among these are:
|
•
|
The nature and complexity of underlying coverage provided and net limits of exposure provided;
|
|
•
|
Our historical loss data and experience is sometimes too immature and lacking in credibility to rely upon for reserving purposes. Where this is the case, in our reserve analysis we may utilize industry loss ratios or industry benchmark development patterns that we believe reflect the nature and coverage of the underwritten business and its future development, where available. For such product lines, actual loss experience may differ from industry loss statistics as well as loss experience for previous underwriting years;
|
|
•
|
The difficulty in estimating loss trends, claims inflation (e.g., medical and judicial) and underlying economic conditions;
|
|
•
|
The need for professional judgment to estimate loss development patterns beyond that represented by historical data using supplemental internal or industry data, extrapolation, or a blend of both;
|
|
•
|
The need to address shifts in mix over time when applying historical paid and reported loss development patterns from older origin years to more recent origin years. For example, changes over time in the processes and procedures for establishing case reserves can distort reported loss development patterns or changes in ceded reinsurance structures by origin year can alter the development of paid and reported losses;
|
|
•
|
Loss reserve analyses typically require loss or other data be grouped by common characteristics in some manner. If data from two combined lines of business exhibit different characteristics, such as loss payment patterns, the credibility of the reserve estimate could be affected. Additionally, since casualty lines of business can have significant intricacies in the terms and conditions afforded to the insured, there is an inherent risk as to the homogeneity of the underlying data used in performing reserve analyses; and
|
|
•
|
The applicability of the price change data used to estimate ultimate loss ratios for most recent origin years.
|
As described above, various factors are considered when determining appropriate data, assumptions, and methods used to establish the loss reserve estimates for long-tail product lines. These factors may also vary by origin year for given product lines. The derivation of loss development patterns from data and the selection of a tail factor to project ultimate losses from actual loss emergence require considerable judgment, particularly with respect to the extent to which historical loss experience is relied upon to support changes in key reserving assumptions.
c) Loss Development Tables
The tables were designed to present business with similar risk characteristics which exhibit like development patterns and generally similar trends, in order to provide insight into the nature, amount, timing and uncertainty of cash flows related to our claims liabilities.
Each table follows a similar format and reflects the following:
|
•
|
The incurred loss triangle includes both reported case reserves and IBNR liabilities.
|
|
•
|
Both the incurred and paid loss triangles include allocated loss adjustment expense (i.e., defense and investigative costs particular to individual claims) but exclude unallocated loss adjustment expense (i.e., the costs associated with internal claims staff and third-party administrators).
|
|
•
|
The amounts in both triangles for the years ended
December 31, 2008
, to
December 31, 2016
and average historical claim duration as of
December 31, 2017
, are presented as supplementary information.
|
|
•
|
All data presented in the triangles is net of reinsurance recoverables.
|
|
•
|
The IBNR reserves shown to the right of each incurred loss development exhibit reflect the net IBNR recorded as of
December 31, 2017
.
|
|
•
|
The tables are presented retrospectively with respect to acquisitions where these are material and doing so is practicable. Most notably, the Chubb Corp acquisition is presented retrospectively. The unaudited consolidated data is presented solely for informational purposes and is not necessarily indicative of the consolidated data that might have been observed had the transactions been completed prior to the date indicated.
|
Historical dollar amounts are presented in this footnote on a constant-currency basis, which is achieved by assuming constant foreign exchange rates for all periods in the loss triangles, translating prior period amounts using the same local currency
F-50
NOTES TO CONSOLIDATED FINANCIAL STATEMENTS
(continued)
Chubb Limited and Subsidiaries
exchange rates as the current year end. The impact of this conversion is to show the change between periods exclusive of the effect of fluctuations in exchange rates, which would otherwise distort the change in incurred loss and cash flow patterns shown. The change in incurred loss shown will differ from other U.S. GAAP disclosures of incurred prior period reserve development amounts, which include the effect of fluctuations in exchanges rates.
We provided guidance above on key assumptions that should be considered when reviewing this disclosure and information relating to how loss reserve estimates are developed. We believe the information provided in the “Loss Development Tables” section of the disclosure is of limited use for independent analysis or application of standard actuarial estimations.
Cumulative Number of Reported Claims
Reported claim counts, on a cumulative basis, are provided to the far right of each paid loss development table. We generally consider a reported claim to be one claim per coverage per claimant. We exclude claims closed without payment. Use of the presented claim counts in analysis of company experience has significant limitations, including:
|
•
|
High deductible workers' compensation claim counts include claims below the applicable policy deductible.
|
|
•
|
Professional liability and certain other lines have a high proportion of claims reported which will be closed without any payment; shifts in total reported counts may not meaningfully impact reported and ultimate loss experience.
|
|
•
|
Claims for certain events and/or product lines, such as portions of assumed reinsurance and A&H business, are not reported on an individual basis, but rather in bulk and thus not available for inclusion in this disclosure. For certain A&H business, where bulk reporting affected only the oldest few accident years, presented claim counts for these years were estimated.
|
|
•
|
Each of the segments below typically has a mixture of primary and excess experience which has shifted over time.
|
Reported claim counts include open claims which have case reserves and exclude claims that have been incurred but not reported. As such the reported claims are consistent with reported losses, which can be calculated by subtracting incurred but not reported losses from incurred losses. Reported claim counts are inconsistent with losses in the incurred loss triangle, which include incurred but not reported losses, and are also inconsistent with losses in the paid loss triangle, which exclude case reserves.
North America Commercial P&C Insurance — Workers' Compensation — Long-tail
During the year ended December 31, 2017, we refined our loss development groupings based on the similarity of loss payout characteristics. The new groupings were applied consistently to all years presented.
This product line has a substantial geographic spread and a broad mix across industries. Types of coverage include risk management business predominantly with high deductible policies, loss sensitive business (i.e., retrospectively-rated policies), business fronted for captives, as well as excess and primary guaranteed cost coverages.
The triangle below shows all loss and allocated expense development for the workers' compensation product line. In our prior period development disclosure, we exclude any loss development where there is a directly related premium adjustment. For workers' compensation, changes in the exposure base due to payroll audits will drive changes in ultimate losses. In addition, we record involuntary pool assumptions (premiums and losses) on a lagged basis. Both of these items will influence the development in the triangle, particularly the first prior accident year, and are included in the reconciliation table presented on page F-65.
F-51
NOTES TO CONSOLIDATED FINANCIAL STATEMENTS
(continued)
Chubb Limited and Subsidiaries
|
North America Commercial P&C Insurance — Workers' Compensation — Long-tail (continued)
|
|||||||||||||||||||||||||||||||||||||||||||
|
Net Incurred Loss and Allocated Loss Adjustment Expenses
|
|||||||||||||||||||||||||||||||||||||||||||
|
Years Ended December 31
|
December 31 2017
|
|
|||||||||||||||||||||||||||||||||||||||||
|
(in millions of U.S. dollars)
|
Unaudited
|
Net IBNR Reserves
|
|
||||||||||||||||||||||||||||||||||||||||
|
Accident Year
|
2008
|
|
2009
|
|
2010
|
|
2011
|
|
2012
|
|
2013
|
|
2014
|
|
2015
|
|
2016
|
|
2017
|
|
2017
|
|
|||||||||||||||||||||
|
2008
|
$
|
1,084
|
|
$
|
1,042
|
|
$
|
1,043
|
|
$
|
1,037
|
|
$
|
1,036
|
|
$
|
1,010
|
|
$
|
1,009
|
|
$
|
1,004
|
|
$
|
986
|
|
$
|
993
|
|
$
|
214
|
|
||||||||||
|
2009
|
1,029
|
|
998
|
|
997
|
|
990
|
|
980
|
|
977
|
|
966
|
|
972
|
|
965
|
|
233
|
|
|||||||||||||||||||||||
|
2010
|
1,049
|
|
1,037
|
|
1,050
|
|
1,065
|
|
1,064
|
|
1,052
|
|
1,028
|
|
1,020
|
|
262
|
|
|||||||||||||||||||||||||
|
2011
|
1,037
|
|
1,030
|
|
1,046
|
|
1,049
|
|
1,053
|
|
1,022
|
|
1,012
|
|
294
|
|
|||||||||||||||||||||||||||
|
2012
|
1,050
|
|
1,011
|
|
1,030
|
|
1,040
|
|
1,011
|
|
989
|
|
326
|
|
|||||||||||||||||||||||||||||
|
2013
|
1,109
|
|
1,108
|
|
1,122
|
|
1,127
|
|
1,085
|
|
368
|
|
|||||||||||||||||||||||||||||||
|
2014
|
1,207
|
|
1,201
|
|
1,217
|
|
1,214
|
|
553
|
|
|||||||||||||||||||||||||||||||||
|
2015
|
1,282
|
|
1,259
|
|
1,271
|
|
631
|
|
|||||||||||||||||||||||||||||||||||
|
2016
|
1,367
|
|
1,367
|
|
806
|
|
|||||||||||||||||||||||||||||||||||||
|
2017
|
1,411
|
|
1,080
|
|
|||||||||||||||||||||||||||||||||||||||
|
Total
|
$
|
11,327
|
|
||||||||||||||||||||||||||||||||||||||||
|
Net Cumulative Paid Loss and Allocated Loss Adjustment Expenses
|
||||||||||||||||||||||||||||||||||||||||||
|
Years Ended December 31
|
December 31
2017
|
|
||||||||||||||||||||||||||||||||||||||||
|
(in millions of U.S. dollars)
|
Unaudited
|
Reported Claims
(in thousands)
|
|
|||||||||||||||||||||||||||||||||||||||
|
Accident Year
|
2008
|
|
2009
|
|
2010
|
|
2011
|
|
2012
|
|
2013
|
|
2014
|
|
2015
|
|
2016
|
|
2017
|
|
2017
|
|
||||||||||||||||||||
|
2008
|
$
|
124
|
|
$
|
275
|
|
$
|
371
|
|
$
|
439
|
|
$
|
503
|
|
$
|
546
|
|
$
|
578
|
|
$
|
607
|
|
$
|
632
|
|
$
|
651
|
|
333
|
|
||||||||||
|
2009
|
107
|
|
258
|
|
348
|
|
416
|
|
475
|
|
519
|
|
550
|
|
597
|
|
617
|
|
282
|
|
||||||||||||||||||||||
|
2010
|
123
|
|
300
|
|
411
|
|
493
|
|
551
|
|
592
|
|
617
|
|
641
|
|
304
|
|
||||||||||||||||||||||||
|
2011
|
119
|
|
294
|
|
411
|
|
484
|
|
533
|
|
567
|
|
595
|
|
287
|
|
||||||||||||||||||||||||||
|
2012
|
111
|
|
271
|
|
365
|
|
436
|
|
486
|
|
532
|
|
288
|
|
||||||||||||||||||||||||||||
|
2013
|
107
|
|
286
|
|
422
|
|
506
|
|
553
|
|
300
|
|
||||||||||||||||||||||||||||||
|
2014
|
113
|
|
295
|
|
410
|
|
484
|
|
337
|
|
||||||||||||||||||||||||||||||||
|
2015
|
116
|
|
301
|
|
418
|
|
339
|
|
||||||||||||||||||||||||||||||||||
|
2016
|
122
|
|
326
|
|
310
|
|
||||||||||||||||||||||||||||||||||||
|
2017
|
120
|
|
307
|
|
||||||||||||||||||||||||||||||||||||||
|
Total
|
$
|
4,937
|
|
|||||||||||||||||||||||||||||||||||||||
|
Net Liabilities for Loss and Allocated Loss Adjustment Expenses
|
||||
|
(in millions of U.S. dollars)
|
December 31, 2017
|
|
||
|
Accident years prior to 2008
|
$
|
2,483
|
|
|
|
All Accident years
|
$
|
8,873
|
|
|
|
Supplementary Information: (Favorable)/ Adverse Prior Period Development
|
||||
|
(in millions of U.S. dollars)
|
December 31, 2017
|
|
||
|
Accident years prior to 2008
|
$
|
(35
|
)
|
|
|
All Accident years
|
$
|
(108
|
)
|
|
F-52
NOTES TO CONSOLIDATED FINANCIAL STATEMENTS
(continued)
Chubb Limited and Subsidiaries
|
North America Commercial P&C Insurance — Workers' Compensation — Long-tail (continued)
|
|||||||||||||||||||||||||||||
|
Supplementary Information:
Average Annual Percentage Payout of Net Incurred Claims by Age, as of December 31, 2017
|
|||||||||||||||||||||||||||||
|
Age in Years
|
1
|
|
2
|
|
3
|
|
4
|
|
5
|
|
6
|
|
7
|
|
8
|
|
9
|
|
10
|
|
|||||||||
|
Percentage
|
10
|
%
|
16
|
%
|
10
|
%
|
7
|
%
|
5
|
%
|
4
|
%
|
3
|
%
|
3
|
%
|
2
|
%
|
2
|
%
|
|||||||||
North America Commercial P&C Insurance — Liability — Long-tail
During the year ended December 31, 2017, we refined our loss development groupings based on the similarity of loss payout characteristics. The new groupings were applied consistently to all years presented.
This line consists of primary and excess liability exposures, including medical liability, and professional lines, including directors and officers (D&O) liability, errors and omissions (E&O) liability, employment practices liability (EPL), fidelity bonds, and fiduciary liability.
The primary and excess liability business represents the largest part of these exposures. The former includes both monoline and commercial package liability. The latter includes a substantial proportion of commercial umbrella, excess and high excess business, where loss activity can produce significant volatility in the loss triangles at later ages within an accident year (and sometimes across years) due to the size of the limits afforded and the complex nature of the underlying losses.
This line includes management and professional liability products provided to a wide variety of clients, from national accounts to small firms along with private and not-for-profit organizations, distributed through brokers, agents, wholesalers and MGAs. Many of these coverages, particularly D&O and E&O, are typically written on a claims-made form. While most of the coverages are underwritten on a primary basis, there are significant amounts of excess exposure with large policy limits.
|
Net Incurred Loss and Allocated Loss Adjustment Expenses
|
|||||||||||||||||||||||||||||||||||||||||||
|
Years Ended December 31
|
December 31 2017
|
|
|||||||||||||||||||||||||||||||||||||||||
|
(in millions of U.S. dollars)
|
Unaudited
|
Net IBNR Reserves
|
|
||||||||||||||||||||||||||||||||||||||||
|
Accident Year
|
2008
|
|
2009
|
|
2010
|
|
2011
|
|
2012
|
|
2013
|
|
2014
|
|
2015
|
|
2016
|
|
2017
|
|
2017
|
|
|||||||||||||||||||||
|
2008
|
$
|
3,792
|
|
$
|
3,823
|
|
$
|
3,812
|
|
$
|
3,791
|
|
$
|
3,652
|
|
$
|
3,412
|
|
$
|
3,352
|
|
$
|
3,278
|
|
$
|
3,174
|
|
$
|
3,157
|
|
$
|
245
|
|
||||||||||
|
2009
|
3,798
|
|
3,783
|
|
3,770
|
|
3,743
|
|
3,642
|
|
3,392
|
|
3,316
|
|
3,244
|
|
3,103
|
|
250
|
|
|||||||||||||||||||||||
|
2010
|
3,578
|
|
3,583
|
|
3,601
|
|
3,559
|
|
3,419
|
|
3,250
|
|
3,128
|
|
3,107
|
|
423
|
|
|||||||||||||||||||||||||
|
2011
|
3,500
|
|
3,585
|
|
3,629
|
|
3,664
|
|
3,593
|
|
3,498
|
|
3,383
|
|
589
|
|
|||||||||||||||||||||||||||
|
2012
|
3,552
|
|
3,628
|
|
3,613
|
|
3,564
|
|
3,524
|
|
3,426
|
|
856
|
|
|||||||||||||||||||||||||||||
|
2013
|
3,546
|
|
3,541
|
|
3,542
|
|
3,532
|
|
3,430
|
|
1,090
|
|
|||||||||||||||||||||||||||||||
|
2014
|
3,535
|
|
3,585
|
|
3,674
|
|
3,717
|
|
1,526
|
|
|||||||||||||||||||||||||||||||||
|
2015
|
3,559
|
|
3,708
|
|
3,818
|
|
1,941
|
|
|||||||||||||||||||||||||||||||||||
|
2016
|
3,533
|
|
3,594
|
|
2,381
|
|
|||||||||||||||||||||||||||||||||||||
|
2017
|
3,386
|
|
2,994
|
|
|||||||||||||||||||||||||||||||||||||||
|
Total
|
$
|
34,121
|
|
||||||||||||||||||||||||||||||||||||||||
F-53
NOTES TO CONSOLIDATED FINANCIAL STATEMENTS
(continued)
Chubb Limited and Subsidiaries
|
North America Commercial P&C Insurance — Liability — Long-tail (continued)
|
||||||||||||||||||||||||||||||||||||||||||
|
Net Cumulative Paid Loss and Allocated Loss Adjustment Expenses
|
||||||||||||||||||||||||||||||||||||||||||
|
Years Ended December 31
|
December 31 2017
|
|
||||||||||||||||||||||||||||||||||||||||
|
(in millions of U.S. dollars)
|
Unaudited
|
Reported Claims
(in thousands)
|
|
|||||||||||||||||||||||||||||||||||||||
|
Accident Year
|
2008
|
|
2009
|
|
2010
|
|
2011
|
|
2012
|
|
2013
|
|
2014
|
|
2015
|
|
2016
|
|
2017
|
|
2017
|
|
||||||||||||||||||||
|
2008
|
$
|
147
|
|
$
|
580
|
|
$
|
1,110
|
|
$
|
1,643
|
|
$
|
1,992
|
|
$
|
2,323
|
|
$
|
2,558
|
|
$
|
2,657
|
|
$
|
2,753
|
|
$
|
2,836
|
|
21
|
|
||||||||||
|
2009
|
135
|
|
587
|
|
1,160
|
|
1,672
|
|
2,019
|
|
2,357
|
|
2,545
|
|
2,678
|
|
2,730
|
|
21
|
|
||||||||||||||||||||||
|
2010
|
126
|
|
611
|
|
1,108
|
|
1,559
|
|
1,893
|
|
2,259
|
|
2,426
|
|
2,527
|
|
20
|
|
||||||||||||||||||||||||
|
2011
|
160
|
|
652
|
|
1,209
|
|
1,805
|
|
2,214
|
|
2,476
|
|
2,659
|
|
20
|
|
||||||||||||||||||||||||||
|
2012
|
166
|
|
656
|
|
1,172
|
|
1,680
|
|
2,092
|
|
2,326
|
|
20
|
|
||||||||||||||||||||||||||||
|
2013
|
130
|
|
548
|
|
1,192
|
|
1,597
|
|
2,007
|
|
20
|
|
||||||||||||||||||||||||||||||
|
2014
|
164
|
|
679
|
|
1,250
|
|
1,804
|
|
21
|
|
||||||||||||||||||||||||||||||||
|
2015
|
138
|
|
605
|
|
1,206
|
|
23
|
|
||||||||||||||||||||||||||||||||||
|
2016
|
171
|
|
663
|
|
24
|
|
||||||||||||||||||||||||||||||||||||
|
2017
|
161
|
|
19
|
|
||||||||||||||||||||||||||||||||||||||
|
Total
|
$
|
18,919
|
|
|||||||||||||||||||||||||||||||||||||||
|
Net Liabilities for Loss and Allocated Loss Adjustment Expenses
|
||||
|
(in millions of U.S. dollars)
|
December 31, 2017
|
|
||
|
Accident years prior to 2008
|
$
|
1,429
|
|
|
|
All Accident years
|
$
|
16,631
|
|
|
|
Supplementary Information: (Favorable)/ Adverse Prior Period Development
|
||||
|
(in millions of U.S. dollars)
|
December 31, 2017
|
|
||
|
Accident years prior to 2008
|
$
|
(154
|
)
|
|
|
All Accident years
|
$
|
(434
|
)
|
|
|
Supplementary Information: Average Annual Percentage Payout of Net Incurred Claims by Age, as of December 31, 2017
|
|||||||||||||||||||||||||||||
|
Age in Years
|
1
|
|
2
|
|
3
|
|
4
|
|
5
|
|
6
|
|
7
|
|
8
|
|
9
|
|
10
|
|
|||||||||
|
Percentage
|
4
|
%
|
14
|
%
|
17
|
%
|
15
|
%
|
12
|
%
|
9
|
%
|
6
|
%
|
4
|
%
|
2
|
%
|
3
|
%
|
|||||||||
North America Commercial P&C Insurance — Other Casualty — Long-tail
During the year ended December 31, 2017, we refined our loss development groupings based on the similarity of loss payout characteristics. The new groupings were applied consistently to all years presented.
This product line consists of the remaining commercial casualty coverages such as automobile liability and aviation. There is also a small portion of commercial multi-peril (CMP) business in accident years
2014 and prior
. The paid and reported data are impacted by some catastrophe loss activity primarily on the CMP exposures just noted.
F-54
NOTES TO CONSOLIDATED FINANCIAL STATEMENTS
(continued)
Chubb Limited and Subsidiaries
|
North America Commercial P&C Insurance — Other-Casualty — Long-tail (continued)
|
|||||||||||||||||||||||||||||||||||||||||||
|
Net Incurred Loss and Allocated Loss Adjustment Expenses
|
|||||||||||||||||||||||||||||||||||||||||||
|
Years Ended December 31
|
December 31 2017
|
|
|||||||||||||||||||||||||||||||||||||||||
|
(in millions of U.S. dollars)
|
Unaudited
|
Net IBNR Reserves
|
|
||||||||||||||||||||||||||||||||||||||||
|
Accident Year
|
2008
|
|
2009
|
|
2010
|
|
2011
|
|
2012
|
|
2013
|
|
2014
|
|
2015
|
|
2016
|
|
2017
|
|
2017
|
|
|||||||||||||||||||||
|
2008
|
$
|
693
|
|
$
|
733
|
|
$
|
700
|
|
$
|
661
|
|
$
|
644
|
|
$
|
647
|
|
$
|
643
|
|
$
|
646
|
|
$
|
641
|
|
$
|
637
|
|
$
|
13
|
|
||||||||||
|
2009
|
594
|
|
584
|
|
550
|
|
531
|
|
488
|
|
454
|
|
447
|
|
445
|
|
441
|
|
2
|
|
|||||||||||||||||||||||
|
2010
|
610
|
|
604
|
|
598
|
|
543
|
|
503
|
|
475
|
|
477
|
|
489
|
|
33
|
|
|||||||||||||||||||||||||
|
2011
|
577
|
|
586
|
|
578
|
|
545
|
|
530
|
|
521
|
|
513
|
|
33
|
|
|||||||||||||||||||||||||||
|
2012
|
632
|
|
604
|
|
575
|
|
559
|
|
518
|
|
517
|
|
27
|
|
|||||||||||||||||||||||||||||
|
2013
|
526
|
|
530
|
|
522
|
|
515
|
|
468
|
|
60
|
|
|||||||||||||||||||||||||||||||
|
2014
|
592
|
|
581
|
|
579
|
|
594
|
|
147
|
|
|||||||||||||||||||||||||||||||||
|
2015
|
486
|
|
469
|
|
501
|
|
191
|
|
|||||||||||||||||||||||||||||||||||
|
2016
|
503
|
|
494
|
|
249
|
|
|||||||||||||||||||||||||||||||||||||
|
2017
|
531
|
|
387
|
|
|||||||||||||||||||||||||||||||||||||||
|
Total
|
$
|
5,185
|
|
||||||||||||||||||||||||||||||||||||||||
|
Net Cumulative Paid Loss and Allocated Loss Adjustment Expenses
|
||||||||||||||||||||||||||||||||||||||||||
|
Years Ended December 31
|
December 31 2017
|
|
||||||||||||||||||||||||||||||||||||||||
|
(in millions of U.S. dollars)
|
Unaudited
|
Reported Claims
(in thousands)
|
|
|||||||||||||||||||||||||||||||||||||||
|
Accident Year
|
2008
|
|
2009
|
|
2010
|
|
2011
|
|
2012
|
|
2013
|
|
2014
|
|
2015
|
|
2016
|
|
2017
|
|
2017
|
|
||||||||||||||||||||
|
2008
|
$
|
144
|
|
$
|
342
|
|
$
|
446
|
|
$
|
520
|
|
$
|
566
|
|
$
|
591
|
|
$
|
602
|
|
$
|
610
|
|
$
|
618
|
|
$
|
617
|
|
20
|
|
||||||||||
|
2009
|
70
|
|
206
|
|
287
|
|
337
|
|
374
|
|
402
|
|
414
|
|
423
|
|
428
|
|
15
|
|
||||||||||||||||||||||
|
2010
|
97
|
|
236
|
|
322
|
|
364
|
|
392
|
|
434
|
|
444
|
|
449
|
|
15
|
|
||||||||||||||||||||||||
|
2011
|
86
|
|
235
|
|
341
|
|
400
|
|
437
|
|
461
|
|
466
|
|
16
|
|
||||||||||||||||||||||||||
|
2012
|
69
|
|
223
|
|
319
|
|
386
|
|
435
|
|
470
|
|
16
|
|
||||||||||||||||||||||||||||
|
2013
|
69
|
|
197
|
|
271
|
|
348
|
|
385
|
|
18
|
|
||||||||||||||||||||||||||||||
|
2014
|
80
|
|
220
|
|
317
|
|
391
|
|
17
|
|
||||||||||||||||||||||||||||||||
|
2015
|
47
|
|
137
|
|
215
|
|
15
|
|
||||||||||||||||||||||||||||||||||
|
2016
|
52
|
|
146
|
|
15
|
|
||||||||||||||||||||||||||||||||||||
|
2017
|
66
|
|
13
|
|
||||||||||||||||||||||||||||||||||||||
|
Total
|
$
|
3,633
|
|
|||||||||||||||||||||||||||||||||||||||
|
Net Liabilities for Loss and Allocated Loss Adjustment Expenses
|
||||
|
(in millions of U.S. dollars)
|
December 31, 2017
|
|
||
|
Accident years prior to 2008
|
$
|
237
|
|
|
|
All Accident years
|
$
|
1,789
|
|
|
|
Supplementary Information: (Favorable)/ Adverse Prior Period Development
|
||||
|
(in millions of U.S. dollars)
|
December 31, 2017
|
|
||
|
Accident years prior to 2008
|
$
|
14
|
|
|
|
All Accident years
|
$
|
—
|
|
|
F-55
NOTES TO CONSOLIDATED FINANCIAL STATEMENTS
(continued)
Chubb Limited and Subsidiaries
|
North America Commercial P&C Insurance — Other-Casualty — Long-tail (continued)
|
|||||||||||||||||||||||||||||
|
Supplementary Information: Average Annual Percentage Payout of Net Incurred Claims by Age, as of December 31, 2017
|
|||||||||||||||||||||||||||||
|
Age in Years
|
1
|
|
2
|
|
3
|
|
4
|
|
5
|
|
6
|
|
7
|
|
8
|
|
9
|
|
10
|
|
|||||||||
|
Percentage
|
15
|
%
|
26
|
%
|
17
|
%
|
12
|
%
|
8
|
%
|
6
|
%
|
2
|
%
|
1
|
%
|
1
|
%
|
—
|
%
|
|||||||||
North America Commercial P&C Insurance — Non-Casualty — Short-tail
During the year ended December 31, 2017, we refined our loss development groupings based on the similarity of loss payout characteristics. The new groupings were applied consistently to all years presented.
This product line represents first party commercial product lines that are short-tailed in nature, such as property, inland marine, ocean marine, surety and A&H. There is a wide diversity of products, primary and excess coverages, and policy sizes. During this ten-year period, this product line was also impacted by natural catastrophes mainly in the 2008, 2012, and 2017 accident years.
|
Net Incurred Loss and Allocated Loss Adjustment Expenses
|
|||||||||||||||||||||||||||||||||||||||||||
|
Years Ended December 31
|
December 31 2017
|
|
|||||||||||||||||||||||||||||||||||||||||
|
(in millions of U.S. dollars)
|
Unaudited
|
Net IBNR Reserves
|
|
||||||||||||||||||||||||||||||||||||||||
|
Accident Year
|
2008
|
|
2009
|
|
2010
|
|
2011
|
|
2012
|
|
2013
|
|
2014
|
|
2015
|
|
2016
|
|
2017
|
|
2017
|
|
|||||||||||||||||||||
|
2008
|
$
|
1,999
|
|
$
|
1,941
|
|
$
|
1,916
|
|
$
|
1,901
|
|
$
|
1,890
|
|
$
|
1,881
|
|
$
|
1,877
|
|
$
|
1,865
|
|
$
|
1,863
|
|
$
|
1,859
|
|
$
|
5
|
|
||||||||||
|
2009
|
1,310
|
|
1,307
|
|
1,251
|
|
1,222
|
|
1,205
|
|
1,198
|
|
1,198
|
|
1,195
|
|
1,194
|
|
9
|
|
|||||||||||||||||||||||
|
2010
|
1,507
|
|
1,543
|
|
1,466
|
|
1,430
|
|
1,428
|
|
1,420
|
|
1,416
|
|
1,410
|
|
9
|
|
|||||||||||||||||||||||||
|
2011
|
1,963
|
|
1,938
|
|
1,881
|
|
1,859
|
|
1,839
|
|
1,843
|
|
1,838
|
|
15
|
|
|||||||||||||||||||||||||||
|
2012
|
2,034
|
|
1,918
|
|
1,884
|
|
1,866
|
|
1,861
|
|
1,848
|
|
11
|
|
|||||||||||||||||||||||||||||
|
2013
|
1,434
|
|
1,424
|
|
1,337
|
|
1,360
|
|
1,340
|
|
18
|
|
|||||||||||||||||||||||||||||||
|
2014
|
1,647
|
|
1,663
|
|
1,581
|
|
1,561
|
|
29
|
|
|||||||||||||||||||||||||||||||||
|
2015
|
1,737
|
|
1,746
|
|
1,650
|
|
83
|
|
|||||||||||||||||||||||||||||||||||
|
2016
|
1,911
|
|
1,888
|
|
168
|
|
|||||||||||||||||||||||||||||||||||||
|
2017
|
2,641
|
|
1,089
|
|
|||||||||||||||||||||||||||||||||||||||
|
Total
|
$
|
17,229
|
|
||||||||||||||||||||||||||||||||||||||||
F-56
NOTES TO CONSOLIDATED FINANCIAL STATEMENTS
(continued)
Chubb Limited and Subsidiaries
|
North America Commercial P&C Insurance — Non-Casualty — Short-tail (continued)
|
||||||||||||||||||||||||||||||||||||||||||
|
Net Cumulative Paid Loss and Allocated Loss Adjustment Expenses
|
||||||||||||||||||||||||||||||||||||||||||
|
Years Ended December 31
|
December 31 2017
|
|
||||||||||||||||||||||||||||||||||||||||
|
(in millions of U.S. dollars)
|
Unaudited
|
Reported Claims
(in thousands)
|
|
|||||||||||||||||||||||||||||||||||||||
|
Accident Year
|
2008
|
|
2009
|
|
2010
|
|
2011
|
|
2012
|
|
2013
|
|
2014
|
|
2015
|
|
2016
|
|
2017
|
|
2017
|
|
||||||||||||||||||||
|
2008
|
$
|
965
|
|
$
|
1,622
|
|
$
|
1,744
|
|
$
|
1,794
|
|
$
|
1,823
|
|
$
|
1,832
|
|
$
|
1,838
|
|
$
|
1,847
|
|
$
|
1,848
|
|
$
|
1,851
|
|
999
|
|
||||||||||
|
2009
|
620
|
|
1,035
|
|
1,125
|
|
1,149
|
|
1,163
|
|
1,171
|
|
1,179
|
|
1,181
|
|
1,181
|
|
1,125
|
|
||||||||||||||||||||||
|
2010
|
724
|
|
1,223
|
|
1,323
|
|
1,359
|
|
1,384
|
|
1,393
|
|
1,396
|
|
1,397
|
|
1,059
|
|
||||||||||||||||||||||||
|
2011
|
939
|
|
1,573
|
|
1,718
|
|
1,777
|
|
1,787
|
|
1,811
|
|
1,816
|
|
1,053
|
|
||||||||||||||||||||||||||
|
2012
|
715
|
|
1,577
|
|
1,698
|
|
1,766
|
|
1,795
|
|
1,822
|
|
1,037
|
|
||||||||||||||||||||||||||||
|
2013
|
651
|
|
1,138
|
|
1,237
|
|
1,285
|
|
1,311
|
|
1,074
|
|
||||||||||||||||||||||||||||||
|
2014
|
820
|
|
1,373
|
|
1,484
|
|
1,505
|
|
1,102
|
|
||||||||||||||||||||||||||||||||
|
2015
|
726
|
|
1,343
|
|
1,488
|
|
1,173
|
|
||||||||||||||||||||||||||||||||||
|
2016
|
846
|
|
1,504
|
|
1,293
|
|
||||||||||||||||||||||||||||||||||||
|
2017
|
979
|
|
1,175
|
|
||||||||||||||||||||||||||||||||||||||
|
Total
|
$
|
14,854
|
|
|||||||||||||||||||||||||||||||||||||||
|
Net Liabilities for Loss and Allocated Loss Adjustment Expenses
|
||||
|
(in millions of U.S. dollars)
|
December 31, 2017
|
|
||
|
Accident years prior to 2008
|
$
|
23
|
|
|
|
All Accident years
|
$
|
2,398
|
|
|
|
Supplementary Information: (Favorable)/ Adverse Prior Period Development
|
||||
|
(in millions of U.S. dollars)
|
December 31, 2017
|
|
||
|
Accident years prior to 2008
|
$
|
—
|
|
|
|
All Accident years
|
$
|
(188
|
)
|
|
|
Supplementary Information: Average Annual Percentage Payout of Net Incurred Claims by Age, as of December 31, 2017
|
|||||||||||||||||||||||||||||
|
Age in Years
|
1
|
|
2
|
|
3
|
|
4
|
|
5
|
|
6
|
|
7
|
|
8
|
|
9
|
|
10
|
|
|||||||||
|
Percentage
|
46
|
%
|
37
|
%
|
7
|
%
|
3
|
%
|
1
|
%
|
1
|
%
|
—
|
%
|
—
|
%
|
—
|
%
|
—
|
%
|
|||||||||
North America Personal P&C Insurance — Short-tail
Chubb provides personal lines coverages for high-net-worth individuals and families in North America including homeowners, automobile, valuable articles (including fine art), umbrella liability, and recreational marine insurance offered through independent regional agents and brokers. A portfolio acquired from Fireman’s Fund is presented on a prospective basis beginning in May of accident year
2015
. Reserves associated with prior accident periods were acquired through a loss portfolio transfer, which does not allow for a retrospective presentation. During this ten-year period, this segment was also impacted by natural catastrophes, mainly in 2008, 2012, and 2017 accident years.
F-57
NOTES TO CONSOLIDATED FINANCIAL STATEMENTS
(continued)
Chubb Limited and Subsidiaries
|
North America Personal P&C Insurance — Short-tail (continued)
|
|||||||||||||||||||||||||||||||||||||||||||
|
Net Incurred Loss and Allocated Loss Adjustment Expenses
|
|||||||||||||||||||||||||||||||||||||||||||
|
Years Ended December 31
|
December 31 2017
|
|
|||||||||||||||||||||||||||||||||||||||||
|
(in millions of U.S. dollars)
|
Unaudited
|
Net IBNR Reserves
|
|
||||||||||||||||||||||||||||||||||||||||
|
Accident Year
|
2008
|
|
2009
|
|
2010
|
|
2011
|
|
2012
|
|
2013
|
|
2014
|
|
2015
|
|
2016
|
|
2017
|
|
2017
|
|
|||||||||||||||||||||
|
2008
|
$
|
1,779
|
|
$
|
1,779
|
|
$
|
1,749
|
|
$
|
1,724
|
|
$
|
1,695
|
|
$
|
1,677
|
|
$
|
1,670
|
|
$
|
1,661
|
|
$
|
1,661
|
|
$
|
1,659
|
|
$
|
5
|
|
||||||||||
|
2009
|
1,611
|
|
1,598
|
|
1,568
|
|
1,554
|
|
1,545
|
|
1,538
|
|
1,538
|
|
1,534
|
|
1,533
|
|
7
|
|
|||||||||||||||||||||||
|
2010
|
1,870
|
|
1,878
|
|
1,855
|
|
1,838
|
|
1,834
|
|
1,830
|
|
1,825
|
|
1,822
|
|
9
|
|
|||||||||||||||||||||||||
|
2011
|
2,208
|
|
2,210
|
|
2,185
|
|
2,173
|
|
2,164
|
|
2,160
|
|
2,159
|
|
13
|
|
|||||||||||||||||||||||||||
|
2012
|
2,185
|
|
2,183
|
|
2,183
|
|
2,191
|
|
2,185
|
|
2,186
|
|
9
|
|
|||||||||||||||||||||||||||||
|
2013
|
1,860
|
|
1,888
|
|
1,896
|
|
1,899
|
|
1,924
|
|
41
|
|
|||||||||||||||||||||||||||||||
|
2014
|
2,205
|
|
2,206
|
|
2,192
|
|
2,145
|
|
29
|
|
|||||||||||||||||||||||||||||||||
|
2015
|
2,494
|
|
2,549
|
|
2,560
|
|
126
|
|
|||||||||||||||||||||||||||||||||||
|
2016
|
2,439
|
|
2,542
|
|
248
|
|
|||||||||||||||||||||||||||||||||||||
|
2017
|
3,034
|
|
725
|
|
|||||||||||||||||||||||||||||||||||||||
|
Total
|
$
|
21,564
|
|
||||||||||||||||||||||||||||||||||||||||
|
Net Cumulative Paid Loss and Allocated Loss Adjustment Expenses
|
||||||||||||||||||||||||||||||||||||||||||
|
Years Ended December 31
|
December 31 2017
|
|
||||||||||||||||||||||||||||||||||||||||
|
(in millions of U.S. dollars)
|
Unaudited
|
Reported Claims
(in thousands)
|
|
|||||||||||||||||||||||||||||||||||||||
|
Accident Year
|
2008
|
|
2009
|
|
2010
|
|
2011
|
|
2012
|
|
2013
|
|
2014
|
|
2015
|
|
2016
|
|
2017
|
|
2017
|
|
||||||||||||||||||||
|
2008
|
$
|
975
|
|
$
|
1,409
|
|
$
|
1,521
|
|
$
|
1,586
|
|
$
|
1,622
|
|
$
|
1,638
|
|
$
|
1,644
|
|
$
|
1,647
|
|
$
|
1,651
|
|
$
|
1,651
|
|
139
|
|
||||||||||
|
2009
|
887
|
|
1,236
|
|
1,347
|
|
1,439
|
|
1,486
|
|
1,503
|
|
1,513
|
|
1,521
|
|
1,523
|
|
125
|
|
||||||||||||||||||||||
|
2010
|
1,153
|
|
1,522
|
|
1,670
|
|
1,729
|
|
1,772
|
|
1,793
|
|
1,805
|
|
1,811
|
|
149
|
|
||||||||||||||||||||||||
|
2011
|
1,360
|
|
1,835
|
|
1,971
|
|
2,051
|
|
2,105
|
|
2,129
|
|
2,138
|
|
168
|
|
||||||||||||||||||||||||||
|
2012
|
1,176
|
|
1,806
|
|
1,957
|
|
2,063
|
|
2,117
|
|
2,149
|
|
173
|
|
||||||||||||||||||||||||||||
|
2013
|
1,043
|
|
1,504
|
|
1,687
|
|
1,786
|
|
1,843
|
|
126
|
|
||||||||||||||||||||||||||||||
|
2014
|
1,310
|
|
1,764
|
|
1,925
|
|
2,034
|
|
135
|
|
||||||||||||||||||||||||||||||||
|
2015
|
1,499
|
|
2,083
|
|
2,270
|
|
139
|
|
||||||||||||||||||||||||||||||||||
|
2016
|
1,453
|
|
2,051
|
|
140
|
|
||||||||||||||||||||||||||||||||||||
|
2017
|
1,698
|
|
123
|
|
||||||||||||||||||||||||||||||||||||||
|
Total
|
$
|
19,168
|
|
|||||||||||||||||||||||||||||||||||||||
|
Net Liabilities for Loss and Allocated Loss Adjustment Expenses
|
||||
|
(in millions of U.S. dollars)
|
December 31, 2017
|
|
||
|
Accident years prior to 2008
|
$
|
25
|
|
|
|
All Accident years
|
$
|
2,421
|
|
|
|
Supplementary Information: (Favorable)/ Adverse Prior Period Development
|
||||
|
(in millions of U.S. dollars)
|
December 31, 2017
|
|
||
|
Accident years prior to 2008
|
$
|
(10
|
)
|
|
|
All Accident years
|
$
|
76
|
|
|
F-58
NOTES TO CONSOLIDATED FINANCIAL STATEMENTS
(continued)
Chubb Limited and Subsidiaries
|
North America Personal P&C Insurance — Short-tail (continued)
|
|||||||||||||||||||||||||||||
|
Supplementary Information: Average Annual Percentage Payout of Net Incurred Claims by Age, as of December 31, 2017
|
|||||||||||||||||||||||||||||
|
Age in Years
|
1
|
|
2
|
|
3
|
|
4
|
|
5
|
|
6
|
|
7
|
|
8
|
|
9
|
|
10
|
|
|||||||||
|
Percentage
|
58
|
%
|
24
|
%
|
7
|
%
|
5
|
%
|
3
|
%
|
1
|
%
|
1
|
%
|
—
|
%
|
—
|
%
|
—
|
%
|
|||||||||
Overseas General Insurance — Casualty — Long-tail
During the year ended December 31, 2017, we refined our loss development groupings based on the similarity of loss payout characteristics. The new groupings were applied consistently to all years presented.
This product line is comprised of D&O liability, E&O liability, financial institutions (including crime/fidelity coverages), and non-U.S. general liability as well as aviation and political risk. Exposures are located around the world, including Europe, Latin America, and Asia. Approximately 40 percent of Chubb International’s business is generated by European accounts.
There is some U.S. exposure in Casualty from multinational accounts. The financial lines coverages are typically written on a claims-made form, while general liability coverages are typically on an occurrence basis and comprised of a mix of primary and excess businesses.
|
Net Incurred Loss and Allocated Loss Adjustment Expenses
|
|||||||||||||||||||||||||||||||||||||||||||
|
Years Ended December 31
|
December 31 2017
|
|
|||||||||||||||||||||||||||||||||||||||||
|
(in millions of U.S. dollars)
|
Unaudited
|
Net IBNR Reserves
|
|
||||||||||||||||||||||||||||||||||||||||
|
Accident Year
|
2008
|
|
2009
|
|
2010
|
|
2011
|
|
2012
|
|
2013
|
|
2014
|
|
2015
|
|
2016
|
|
2017
|
|
2017
|
|
|||||||||||||||||||||
|
2008
|
$
|
1,220
|
|
$
|
1,334
|
|
$
|
1,423
|
|
$
|
1,444
|
|
$
|
1,453
|
|
$
|
1,408
|
|
$
|
1,336
|
|
$
|
1,315
|
|
$
|
1,330
|
|
$
|
1,281
|
|
$
|
81
|
|
||||||||||
|
2009
|
1,284
|
|
1,425
|
|
1,474
|
|
1,485
|
|
1,482
|
|
1,365
|
|
1,257
|
|
1,256
|
|
1,202
|
|
76
|
|
|||||||||||||||||||||||
|
2010
|
1,231
|
|
1,311
|
|
1,358
|
|
1,430
|
|
1,365
|
|
1,312
|
|
1,183
|
|
1,178
|
|
97
|
|
|||||||||||||||||||||||||
|
2011
|
1,272
|
|
1,277
|
|
1,270
|
|
1,262
|
|
1,176
|
|
1,109
|
|
1,094
|
|
157
|
|
|||||||||||||||||||||||||||
|
2012
|
1,311
|
|
1,281
|
|
1,348
|
|
1,367
|
|
1,363
|
|
1,345
|
|
279
|
|
|||||||||||||||||||||||||||||
|
2013
|
1,289
|
|
1,284
|
|
1,284
|
|
1,330
|
|
1,270
|
|
314
|
|
|||||||||||||||||||||||||||||||
|
2014
|
1,295
|
|
1,366
|
|
1,377
|
|
1,388
|
|
506
|
|
|||||||||||||||||||||||||||||||||
|
2015
|
1,223
|
|
1,324
|
|
1,353
|
|
542
|
|
|||||||||||||||||||||||||||||||||||
|
2016
|
1,227
|
|
1,333
|
|
749
|
|
|||||||||||||||||||||||||||||||||||||
|
2017
|
1,229
|
|
968
|
|
|||||||||||||||||||||||||||||||||||||||
|
Total
|
$
|
12,673
|
|
||||||||||||||||||||||||||||||||||||||||
F-59
NOTES TO CONSOLIDATED FINANCIAL STATEMENTS
(continued)
Chubb Limited and Subsidiaries
|
Overseas General Insurance — Casualty — Long-tail (continued)
|
||||||||||||||||||||||||||||||||||||||||||
|
Net Cumulative Paid Loss and Allocated Loss Adjustment Expenses
|
||||||||||||||||||||||||||||||||||||||||||
|
Years Ended December 31
|
December 31 2017
|
|
||||||||||||||||||||||||||||||||||||||||
|
(in millions of U.S. dollars)
|
Unaudited
|
Reported Claims
(in thousands)
|
|
|||||||||||||||||||||||||||||||||||||||
|
Accident Year
|
2008
|
|
2009
|
|
2010
|
|
2011
|
|
2012
|
|
2013
|
|
2014
|
|
2015
|
|
2016
|
|
2017
|
|
2017
|
|
||||||||||||||||||||
|
2008
|
$
|
121
|
|
$
|
306
|
|
$
|
472
|
|
$
|
642
|
|
$
|
790
|
|
$
|
895
|
|
$
|
971
|
|
$
|
1,029
|
|
$
|
1,083
|
|
$
|
1,116
|
|
39
|
|
||||||||||
|
2009
|
123
|
|
341
|
|
524
|
|
667
|
|
763
|
|
824
|
|
896
|
|
993
|
|
1,020
|
|
39
|
|
||||||||||||||||||||||
|
2010
|
109
|
|
277
|
|
481
|
|
629
|
|
740
|
|
831
|
|
883
|
|
938
|
|
41
|
|
||||||||||||||||||||||||
|
2011
|
91
|
|
250
|
|
400
|
|
534
|
|
638
|
|
719
|
|
795
|
|
42
|
|
||||||||||||||||||||||||||
|
2012
|
77
|
|
254
|
|
443
|
|
598
|
|
714
|
|
856
|
|
42
|
|
||||||||||||||||||||||||||||
|
2013
|
90
|
|
272
|
|
432
|
|
584
|
|
727
|
|
42
|
|
||||||||||||||||||||||||||||||
|
2014
|
117
|
|
299
|
|
481
|
|
614
|
|
43
|
|
||||||||||||||||||||||||||||||||
|
2015
|
92
|
|
296
|
|
504
|
|
45
|
|
||||||||||||||||||||||||||||||||||
|
2016
|
127
|
|
328
|
|
45
|
|
||||||||||||||||||||||||||||||||||||
|
2017
|
99
|
|
34
|
|
||||||||||||||||||||||||||||||||||||||
|
Total
|
$
|
6,997
|
|
|||||||||||||||||||||||||||||||||||||||
|
Net Liabilities for Loss and Allocated Loss Adjustment Expenses
|
||||
|
(in millions of U.S. dollars)
|
December 31, 2017
|
|
||
|
Accident years prior to 2008
|
$
|
350
|
|
|
|
All Accident years
|
$
|
6,026
|
|
|
|
Supplementary Information: (Favorable)/ Adverse Prior Period Development
|
||||
|
(in millions of U.S. dollars)
|
December 31, 2017
|
|
||
|
Accident years prior to 2008
|
$
|
(13
|
)
|
|
|
All Accident years
|
$
|
(68
|
)
|
|
|
Supplementary Information: Average Annual Percentage Payout of Net Incurred Claims by Age, as of December 31, 2017
|
|||||||||||||||||||||||||||||
|
Age in Years
|
1
|
|
2
|
|
3
|
|
4
|
|
5
|
|
6
|
|
7
|
|
8
|
|
9
|
|
10
|
|
|||||||||
|
Percentage
|
8
|
%
|
15
|
%
|
14
|
%
|
12
|
%
|
10
|
%
|
8
|
%
|
6
|
%
|
6
|
%
|
3
|
%
|
3
|
%
|
|||||||||
Overseas General Insurance — Non-Casualty — Short-tail
During the year ended December 31, 2017, we refined our loss development groupings based on the similarity of loss payout characteristics. The new groupings were applied consistently to all years presented. In addition, the Overseas General segment disclosure has been enhanced to include some previously excluded international business as data became available. This includes historical experience for most acquisitions. The added business is principally Non-Casualty; personal automobile, property and surety lines in Latin America and Asia Pacific regions.
This product line is comprised of commercial fire, marine (predominantly cargo), surety, personal automobile (in Latin America, Asia Pacific and Japan), personal cell phones, personal residential (including high net worth), energy and construction. Latin America and Europe each make up about
35 percent
of the Chubb International non-casualty book. In general, these lines have relatively stable payment and reporting patterns although they are impacted by natural catastrophes mainly in the
2008
,
2010
,
2011
, and 2017 accident years.
F-60
NOTES TO CONSOLIDATED FINANCIAL STATEMENTS
(continued)
Chubb Limited and Subsidiaries
|
Overseas General Insurance — Non-Casualty — Short-tail (continued)
|
|||||||||||||||||||||||||||||||||||||||||||
|
Net Incurred Loss and Allocated Loss Adjustment Expenses
|
|||||||||||||||||||||||||||||||||||||||||||
|
Years Ended December 31
|
December 31 2017
|
|
|||||||||||||||||||||||||||||||||||||||||
|
(in millions of U.S. dollars)
|
Unaudited
|
Net IBNR Reserves
|
|
||||||||||||||||||||||||||||||||||||||||
|
Accident Year
|
2008
|
|
2009
|
|
2010
|
|
2011
|
|
2012
|
|
2013
|
|
2014
|
|
2015
|
|
2016
|
|
2017
|
|
2017
|
|
|||||||||||||||||||||
|
2008
|
$
|
1,609
|
|
$
|
1,608
|
|
$
|
1,563
|
|
$
|
1,547
|
|
$
|
1,553
|
|
$
|
1,527
|
|
$
|
1,524
|
|
$
|
1,519
|
|
$
|
1,508
|
|
$
|
1,504
|
|
$
|
25
|
|
||||||||||
|
2009
|
1,564
|
|
1,534
|
|
1,446
|
|
1,415
|
|
1,395
|
|
1,377
|
|
1,377
|
|
1,366
|
|
1,366
|
|
3
|
|
|||||||||||||||||||||||
|
2010
|
1,713
|
|
1,734
|
|
1,705
|
|
1,693
|
|
1,687
|
|
1,673
|
|
1,660
|
|
1,643
|
|
13
|
|
|||||||||||||||||||||||||
|
2011
|
1,950
|
|
2,035
|
|
1,978
|
|
1,939
|
|
1,920
|
|
1,908
|
|
1,901
|
|
7
|
|
|||||||||||||||||||||||||||
|
2012
|
1,775
|
|
1,764
|
|
1,723
|
|
1,667
|
|
1,661
|
|
1,650
|
|
34
|
|
|||||||||||||||||||||||||||||
|
2013
|
1,868
|
|
1,859
|
|
1,787
|
|
1,739
|
|
1,730
|
|
62
|
|
|||||||||||||||||||||||||||||||
|
2014
|
1,975
|
|
2,048
|
|
1,985
|
|
1,959
|
|
72
|
|
|||||||||||||||||||||||||||||||||
|
2015
|
2,111
|
|
2,243
|
|
2,195
|
|
157
|
|
|||||||||||||||||||||||||||||||||||
|
2016
|
2,164
|
|
2,148
|
|
19
|
|
|||||||||||||||||||||||||||||||||||||
|
2017
|
2,349
|
|
307
|
|
|||||||||||||||||||||||||||||||||||||||
|
Total
|
$
|
18,445
|
|
||||||||||||||||||||||||||||||||||||||||
|
Net Cumulative Paid Loss and Allocated Loss Adjustment Expenses
|
||||||||||||||||||||||||||||||||||||||||||
|
Years Ended December 31
|
December 31 2017
|
|
||||||||||||||||||||||||||||||||||||||||
|
(in millions of U.S. dollars)
|
Unaudited
|
Reported Claims
(in thousands)
|
|
|||||||||||||||||||||||||||||||||||||||
|
Accident Year
|
2008
|
|
2009
|
|
2010
|
|
2011
|
|
2012
|
|
2013
|
|
2014
|
|
2015
|
|
2016
|
|
2017
|
|
2017
|
|
||||||||||||||||||||
|
2008
|
$
|
646
|
|
$
|
1,218
|
|
$
|
1,360
|
|
$
|
1,428
|
|
$
|
1,451
|
|
$
|
1,461
|
|
$
|
1,469
|
|
$
|
1,477
|
|
$
|
1,477
|
|
$
|
1,484
|
|
539
|
|
||||||||||
|
2009
|
602
|
|
1,095
|
|
1,233
|
|
1,300
|
|
1,324
|
|
1,335
|
|
1,341
|
|
1,344
|
|
1,343
|
|
518
|
|
||||||||||||||||||||||
|
2010
|
698
|
|
1,276
|
|
1,480
|
|
1,543
|
|
1,583
|
|
1,596
|
|
1,603
|
|
1,604
|
|
561
|
|
||||||||||||||||||||||||
|
2011
|
793
|
|
1,520
|
|
1,728
|
|
1,786
|
|
1,817
|
|
1,832
|
|
1,841
|
|
579
|
|
||||||||||||||||||||||||||
|
2012
|
716
|
|
1,284
|
|
1,479
|
|
1,539
|
|
1,562
|
|
1,572
|
|
600
|
|
||||||||||||||||||||||||||||
|
2013
|
738
|
|
1,340
|
|
1,541
|
|
1,574
|
|
1,612
|
|
622
|
|
||||||||||||||||||||||||||||||
|
2014
|
800
|
|
1,497
|
|
1,715
|
|
1,782
|
|
594
|
|
||||||||||||||||||||||||||||||||
|
2015
|
901
|
|
1,638
|
|
1,873
|
|
627
|
|
||||||||||||||||||||||||||||||||||
|
2016
|
1,083
|
|
1,752
|
|
637
|
|
||||||||||||||||||||||||||||||||||||
|
2017
|
1,098
|
|
616
|
|
||||||||||||||||||||||||||||||||||||||
|
Total
|
$
|
15,961
|
|
|||||||||||||||||||||||||||||||||||||||
|
Net Liabilities for Loss and Allocated Loss Adjustment Expenses
|
||||
|
(in millions of U.S. dollars)
|
December 31, 2017
|
|
||
|
Accident years prior to 2008
|
$
|
65
|
|
|
|
All Accident years
|
$
|
2,549
|
|
|
|
Supplementary Information: (Favorable)/ Adverse Prior Period Development
|
||||
|
(in millions of U.S. dollars)
|
December 31, 2017
|
|
||
|
Accident years prior to 2008
|
$
|
(3
|
)
|
|
|
All Accident years
|
$
|
(141
|
)
|
|
F-61
NOTES TO CONSOLIDATED FINANCIAL STATEMENTS
(continued)
Chubb Limited and Subsidiaries
|
Overseas General Insurance — Non-Casualty — Short-tail (continued)
|
|||||||||||||||||||||||||||||
|
Supplementary Information: Average Annual Percentage Payout of Net Incurred Claims by Age, as of December 31, 2017
|
|||||||||||||||||||||||||||||
|
Age in Years
|
1
|
|
2
|
|
3
|
|
4
|
|
5
|
|
6
|
|
7
|
|
8
|
|
9
|
|
10
|
|
|||||||||
|
Percentage
|
44
|
%
|
35
|
%
|
11
|
%
|
4
|
%
|
2
|
%
|
1
|
%
|
—
|
%
|
—
|
%
|
—
|
%
|
—
|
%
|
|||||||||
Global Reinsurance
Chubb analyzes its Global Reinsurance business on a treaty year basis rather than on an accident year basis. Treaty year data was converted to an accident year basis for the purposes of this disclosure. Mix shifts are an important consideration in these product line groupings. As proportional business and excess of loss business have different earning and loss reporting and payment patterns, this change in mix will affect the cash flow patterns across the accident years. In addition, the shift from excess to proportional business over time will make the cash flow patterns of older and more recent years difficult to compare. In general, the proportional business will pay out more quickly than the excess of loss business, as such, using older years development patterns may overstate the ultimate loss estimates in more recent years.
Global Reinsurance — Casualty — Long-tail
During the year ended December 31, 2017, we refined our loss development groupings based on the similarity of loss payout characteristics. The new groupings were applied consistently to all years presented.
This product line includes proportional and excess coverages in general, automobile liability, professional liability, medical malpractice, workers' compensation and aviation, with exposures located around the world. In general, reinsurance exhibits less stable development patterns than primary business. In particular general casualty reinsurance and excess coverages are long-tailed and can be very volatile.
|
Net Incurred Loss and Allocated Loss Adjustment Expenses
|
|||||||||||||||||||||||||||||||||||||||||||
|
Years Ended December 31
|
December 31 2017
|
|
|||||||||||||||||||||||||||||||||||||||||
|
(in millions of U.S. dollars)
|
Unaudited
|
Net IBNR Reserves
|
|
||||||||||||||||||||||||||||||||||||||||
|
Accident Year
|
2008
|
|
2009
|
|
2010
|
|
2011
|
|
2012
|
|
2013
|
|
2014
|
|
2015
|
|
2016
|
|
2017
|
|
2017
|
|
|||||||||||||||||||||
|
2008
|
$
|
399
|
|
$
|
420
|
|
$
|
439
|
|
$
|
431
|
|
$
|
428
|
|
$
|
407
|
|
$
|
408
|
|
$
|
404
|
|
$
|
401
|
|
$
|
399
|
|
$
|
48
|
|
||||||||||
|
2009
|
319
|
|
351
|
|
363
|
|
370
|
|
366
|
|
347
|
|
331
|
|
320
|
|
316
|
|
24
|
|
|||||||||||||||||||||||
|
2010
|
401
|
|
421
|
|
432
|
|
443
|
|
432
|
|
426
|
|
416
|
|
402
|
|
55
|
|
|||||||||||||||||||||||||
|
2011
|
409
|
|
416
|
|
431
|
|
434
|
|
429
|
|
419
|
|
415
|
|
45
|
|
|||||||||||||||||||||||||||
|
2012
|
387
|
|
383
|
|
391
|
|
394
|
|
379
|
|
372
|
|
23
|
|
|||||||||||||||||||||||||||||
|
2013
|
321
|
|
327
|
|
330
|
|
330
|
|
331
|
|
41
|
|
|||||||||||||||||||||||||||||||
|
2014
|
333
|
|
334
|
|
340
|
|
343
|
|
46
|
|
|||||||||||||||||||||||||||||||||
|
2015
|
285
|
|
289
|
|
300
|
|
47
|
|
|||||||||||||||||||||||||||||||||||
|
2016
|
224
|
|
228
|
|
63
|
|
|||||||||||||||||||||||||||||||||||||
|
2017
|
214
|
|
121
|
|
|||||||||||||||||||||||||||||||||||||||
|
Total
|
$
|
3,320
|
|
||||||||||||||||||||||||||||||||||||||||
F-62
NOTES TO CONSOLIDATED FINANCIAL STATEMENTS
(continued)
Chubb Limited and Subsidiaries
|
Global Reinsurance — Casualty — Long-tail (continued)
|
||||||||||||||||||||||||||||||||||||||||||
|
Net Cumulative Paid Loss and Allocated Loss Adjustment Expenses
|
||||||||||||||||||||||||||||||||||||||||||
|
Years Ended December 31
|
December 31 2017
|
|
||||||||||||||||||||||||||||||||||||||||
|
(in millions of U.S. dollars)
|
Unaudited
|
Reported Claims
(in thousands)
|
|
|||||||||||||||||||||||||||||||||||||||
|
Accident Year
|
2008
|
|
2009
|
|
2010
|
|
2011
|
|
2012
|
|
2013
|
|
2014
|
|
2015
|
|
2016
|
|
2017
|
|
2017
|
|
||||||||||||||||||||
|
2008
|
$
|
33
|
|
$
|
77
|
|
$
|
131
|
|
$
|
176
|
|
$
|
220
|
|
$
|
253
|
|
$
|
277
|
|
$
|
295
|
|
$
|
305
|
|
$
|
315
|
|
1.209
|
|
||||||||||
|
2009
|
34
|
|
79
|
|
116
|
|
154
|
|
187
|
|
209
|
|
227
|
|
241
|
|
256
|
|
0.868
|
|
||||||||||||||||||||||
|
2010
|
56
|
|
125
|
|
179
|
|
221
|
|
249
|
|
274
|
|
292
|
|
307
|
|
0.795
|
|
||||||||||||||||||||||||
|
2011
|
70
|
|
146
|
|
195
|
|
236
|
|
267
|
|
291
|
|
311
|
|
0.660
|
|
||||||||||||||||||||||||||
|
2012
|
77
|
|
167
|
|
222
|
|
261
|
|
292
|
|
308
|
|
0.472
|
|
||||||||||||||||||||||||||||
|
2013
|
65
|
|
143
|
|
186
|
|
222
|
|
242
|
|
0.337
|
|
||||||||||||||||||||||||||||||
|
2014
|
92
|
|
185
|
|
218
|
|
249
|
|
0.400
|
|
||||||||||||||||||||||||||||||||
|
2015
|
90
|
|
159
|
|
191
|
|
0.304
|
|
||||||||||||||||||||||||||||||||||
|
2016
|
57
|
|
113
|
|
0.258
|
|
||||||||||||||||||||||||||||||||||||
|
2017
|
47
|
|
0.088
|
|
||||||||||||||||||||||||||||||||||||||
|
Total
|
$
|
2,339
|
|
|||||||||||||||||||||||||||||||||||||||
|
Net Liabilities for Loss and Allocated Loss Adjustment Expenses
|
||||
|
(in millions of U.S. dollars)
|
December 31, 2017
|
|
||
|
Accident years prior to 2008
|
$
|
359
|
|
|
|
All Accident years
|
$
|
1,340
|
|
|
|
Supplementary Information: (Favorable)/ Adverse Prior Period Development
|
||||
|
(in millions of U.S. dollars)
|
December 31, 2017
|
|
||
|
Accident years prior to 2008
|
$
|
(60
|
)
|
|
|
All Accident years
|
$
|
(72
|
)
|
|
|
Supplementary Information: Average Annual Percentage Payout of Net Incurred Claims by Age, as of December 31, 2017
|
|||||||||||||||||||||||||||||
|
Age in Years
|
1
|
|
2
|
|
3
|
|
4
|
|
5
|
|
6
|
|
7
|
|
8
|
|
9
|
|
10
|
|
|||||||||
|
Percentage
|
19
|
%
|
20
|
%
|
12
|
%
|
11
|
%
|
8
|
%
|
6
|
%
|
5
|
%
|
4
|
%
|
4
|
%
|
3
|
%
|
|||||||||
Global Reinsurance — Non-Casualty — Short-tail
During the year ended December 31, 2017, we refined our loss development groupings based on the similarity of loss payout characteristics. The new groupings were applied consistently to all years presented.
This product line includes property, property catastrophe, marine, credit/surety, A&H and energy. This product line is impacted by natural catastrophes, particularly in the 2008,
2011
and
2017
years. Of the non-catastrophe book, the mixture of business varies by year with approximately
72 percent
of loss on proportional treaties in Treaty Year
2008 and after
. This percentage has increased over time with the proportion being approximately
60 percent
from
2008
to 2012 growing to an average of
84 percent
from
2013
to 2017, with the remainder being written on an excess of loss basis.
F-63
NOTES TO CONSOLIDATED FINANCIAL STATEMENTS
(continued)
Chubb Limited and Subsidiaries
|
Global Reinsurance — Non-Casualty — Short-tail (continued)
|
|||||||||||||||||||||||||||||||||||||||||||
|
Net Incurred Loss and Allocated Loss Adjustment Expenses
|
Years Ended December 31
|
December 31 2017
|
|
||||||||||||||||||||||||||||||||||||||||
|
(in millions of U.S. dollars)
|
Unaudited
|
Net IBNR Reserves
|
|
||||||||||||||||||||||||||||||||||||||||
|
Accident Year
|
2008
|
|
2009
|
|
2010
|
|
2011
|
|
2012
|
|
2013
|
|
2014
|
|
2015
|
|
2016
|
|
2017
|
|
2017
|
|
|||||||||||||||||||||
|
2008
|
$
|
316
|
|
$
|
310
|
|
$
|
301
|
|
$
|
292
|
|
$
|
286
|
|
$
|
286
|
|
$
|
287
|
|
$
|
284
|
|
$
|
285
|
|
$
|
286
|
|
$
|
2
|
|
||||||||||
|
2009
|
141
|
|
172
|
|
152
|
|
150
|
|
144
|
|
141
|
|
139
|
|
139
|
|
139
|
|
3
|
|
|||||||||||||||||||||||
|
2010
|
200
|
|
235
|
|
224
|
|
218
|
|
222
|
|
224
|
|
225
|
|
225
|
|
5
|
|
|||||||||||||||||||||||||
|
2011
|
274
|
|
275
|
|
272
|
|
262
|
|
263
|
|
264
|
|
264
|
|
1
|
|
|||||||||||||||||||||||||||
|
2012
|
232
|
|
210
|
|
200
|
|
191
|
|
189
|
|
187
|
|
2
|
|
|||||||||||||||||||||||||||||
|
2013
|
163
|
|
160
|
|
149
|
|
143
|
|
144
|
|
5
|
|
|||||||||||||||||||||||||||||||
|
2014
|
163
|
|
179
|
|
179
|
|
182
|
|
9
|
|
|||||||||||||||||||||||||||||||||
|
2015
|
146
|
|
154
|
|
161
|
|
8
|
|
|||||||||||||||||||||||||||||||||||
|
2016
|
182
|
|
188
|
|
17
|
|
|||||||||||||||||||||||||||||||||||||
|
2017
|
396
|
|
82
|
|
|||||||||||||||||||||||||||||||||||||||
|
Total
|
$
|
2,172
|
|
||||||||||||||||||||||||||||||||||||||||
|
Net Cumulative Paid Loss and Allocated Loss Adjustment Expenses
|
Years Ended December 31
|
December 31 2017
|
|
|||||||||||||||||||||||||||||||||||||||
|
(in millions of U.S. dollars)
|
Unaudited
|
Reported Claims
(in thousands)
|
|
|||||||||||||||||||||||||||||||||||||||
|
Accident Year
|
2008
|
|
2009
|
|
2010
|
|
2011
|
|
2012
|
|
2013
|
|
2014
|
|
2015
|
|
2016
|
|
2017
|
|
2017
|
|
||||||||||||||||||||
|
2008
|
$
|
79
|
|
$
|
177
|
|
$
|
228
|
|
$
|
260
|
|
$
|
274
|
|
$
|
276
|
|
$
|
278
|
|
$
|
280
|
|
$
|
280
|
|
$
|
280
|
|
0.179
|
|
||||||||||
|
2009
|
52
|
|
106
|
|
122
|
|
129
|
|
132
|
|
134
|
|
134
|
|
134
|
|
134
|
|
0.114
|
|
||||||||||||||||||||||
|
2010
|
56
|
|
162
|
|
188
|
|
200
|
|
205
|
|
216
|
|
214
|
|
217
|
|
0.101
|
|
||||||||||||||||||||||||
|
2011
|
85
|
|
176
|
|
207
|
|
232
|
|
251
|
|
255
|
|
258
|
|
0.128
|
|
||||||||||||||||||||||||||
|
2012
|
44
|
|
129
|
|
156
|
|
166
|
|
172
|
|
177
|
|
0.113
|
|
||||||||||||||||||||||||||||
|
2013
|
46
|
|
103
|
|
121
|
|
131
|
|
133
|
|
0.119
|
|
||||||||||||||||||||||||||||||
|
2014
|
65
|
|
128
|
|
151
|
|
162
|
|
0.100
|
|
||||||||||||||||||||||||||||||||
|
2015
|
56
|
|
103
|
|
132
|
|
0.110
|
|
||||||||||||||||||||||||||||||||||
|
2016
|
57
|
|
132
|
|
0.168
|
|
||||||||||||||||||||||||||||||||||||
|
2017
|
191
|
|
0.205
|
|
||||||||||||||||||||||||||||||||||||||
|
Total
|
$
|
1,816
|
|
|||||||||||||||||||||||||||||||||||||||
|
Net Liabilities for Loss and Allocated Loss Adjustment Expenses
|
||||
|
(in millions of U.S. dollars)
|
December 31, 2017
|
|
||
|
Accident years prior to 2008
|
$
|
15
|
|
|
|
All Accident years
|
$
|
371
|
|
|
|
Supplementary Information: (Favorable)/ Adverse Prior Period Development
|
||||
|
(in millions of U.S. dollars)
|
December 31, 2017
|
|
||
|
Accident years prior to 2008
|
$
|
—
|
|
|
|
All Accident years
|
$
|
16
|
|
|
|
Supplementary Information: Average Annual Percentage Payout of Net Incurred Claims by Age, as of December 31, 2017
|
|||||||||||||||||||||||||||||
|
Age in Years
|
1
|
|
2
|
|
3
|
|
4
|
|
5
|
|
6
|
|
7
|
|
8
|
|
9
|
|
10
|
|
|||||||||
|
Percentage
|
34
|
%
|
38
|
%
|
14
|
%
|
7
|
%
|
4
|
%
|
2
|
%
|
—
|
%
|
1
|
%
|
—
|
%
|
—
|
%
|
|||||||||
F-64
NOTES TO CONSOLIDATED FINANCIAL STATEMENTS
(continued)
Chubb Limited and Subsidiaries
Prior Period Development — Supplementary Information
The following table presents a reconciliation of the loss development triangles above to prior period development:
|
Components of PPD
|
|||||||||||||||||||||||
|
Year Ended December 31, 2017
(in millions of U.S. dollars)
|
2008 - 2016 accident years (implied PPD per loss triangles)
|
|
Accident years prior to 2008
|
|
Other
(1)
|
|
PPD on loss reserves
|
|
RIPs, Expense adjustments, and earned premiums
|
|
Total
|
|
|||||||||||
|
(favorable)/unfavorable
|
|||||||||||||||||||||||
|
North America Commercial P&C Insurance
|
|
|
|
|
|||||||||||||||||||
|
Long-tail
|
$
|
(367
|
)
|
$
|
(175
|
)
|
$
|
(76
|
)
|
$
|
(618
|
)
|
$
|
56
|
|
$
|
(562
|
)
|
|||||
|
Short-tail
|
(188
|
)
|
—
|
|
3
|
|
(185
|
)
|
1
|
|
(184
|
)
|
|||||||||||
|
(555
|
)
|
(175
|
)
|
(73
|
)
|
(2)
|
(803
|
)
|
57
|
|
(746
|
)
|
|||||||||||
|
North America Personal P&C Insurance
(Short-tail)
|
86
|
|
(10
|
)
|
(7
|
)
|
69
|
|
—
|
|
69
|
|
|||||||||||
|
Overseas General Insurance
|
|
|
|
|
|||||||||||||||||||
|
Long-tail
|
(55
|
)
|
(13
|
)
|
(3
|
)
|
(71
|
)
|
—
|
|
(71
|
)
|
|||||||||||
|
Short-tail
|
(138
|
)
|
(3
|
)
|
(40
|
)
|
(181
|
)
|
—
|
|
(181
|
)
|
|||||||||||
|
(193
|
)
|
(16
|
)
|
(43
|
)
|
(3)
|
(252
|
)
|
—
|
|
(252
|
)
|
|||||||||||
|
Global Reinsurance
|
|
|
|
|
|||||||||||||||||||
|
Long-tail
|
(12
|
)
|
(60
|
)
|
1
|
|
(71
|
)
|
3
|
|
(68
|
)
|
|||||||||||
|
Short-tail
|
16
|
|
—
|
|
—
|
|
16
|
|
(7
|
)
|
9
|
|
|||||||||||
|
4
|
|
(60
|
)
|
1
|
|
(55
|
)
|
(4
|
)
|
(59
|
)
|
||||||||||||
|
Subtotal
|
$
|
(658
|
)
|
$
|
(261
|
)
|
$
|
(122
|
)
|
$
|
(1,041
|
)
|
$
|
53
|
|
$
|
(988
|
)
|
|||||
|
North America Agricultural Insurance (Short-tail)
|
$
|
(174
|
)
|
$
|
55
|
|
$
|
(119
|
)
|
||||||||||||||
|
Corporate (Long-tail)
|
278
|
|
—
|
|
278
|
|
|||||||||||||||||
|
Consolidated PPD
|
|
|
|
|
|
|
$
|
(937
|
)
|
$
|
108
|
|
$
|
(829
|
)
|
||||||||
(1)
Other includes the impact of foreign exchange.
(2)
Includes favorable development of
$55 million
related to our Alternative Risk Solutions business; the remaining difference relates to a number of other items, none of which are individually material.
(3)
Includes favorable development of
$35 million
related to International A&H business, the remaining difference relates to a number of other items, none of which are individually material.
Prior Period Development
The following table summarizes (favorable) and adverse prior period development (PPD) by segment. Long-tail lines include lines such as workers' compensation, general liability, and professional liability; while short-tail lines include lines such as most property lines, energy, personal accident, and agriculture. In 2017, we determined that the loss development classification for certain businesses, previously grouped within the short-tail column in the table below, would be more appropriately grouped within the long-tail column to better align with the classification of these businesses within our loss development triangles. We also determined that the loss development for certain other businesses should be reclassified from long-tail to short-tail. We updated our 2016 and 2015 amounts below to conform to the current year presentation and reclassified
$101 million
and
$46 million
, respectively, of net favorable development into long-tail from short-tail. These changes to the previously disclosed amounts have no impact to our financial condition and results of operations.
F-65
NOTES TO CONSOLIDATED FINANCIAL STATEMENTS
(continued)
Chubb Limited and Subsidiaries
|
Years Ended December 31
(in millions of U.S. dollars, except for percentages)
|
Long-tail
|
|
Short-tail
|
|
Total
|
|
% of beginning net unpaid reserves
(1)
|
|
||||||
|
2017
|
||||||||||||||
|
North America Commercial P&C Insurance
|
$
|
(562
|
)
|
$
|
(184
|
)
|
$
|
(746
|
)
|
1.6
|
%
|
|||
|
North America Personal P&C Insurance
|
—
|
|
69
|
|
69
|
|
0.1
|
%
|
||||||
|
North America Agricultural Insurance
|
—
|
|
(119
|
)
|
(119
|
)
|
0.2
|
%
|
||||||
|
Overseas General Insurance
|
(71
|
)
|
(181
|
)
|
(252
|
)
|
0.5
|
%
|
||||||
|
Global Reinsurance
|
(68
|
)
|
9
|
|
(59
|
)
|
0.1
|
%
|
||||||
|
Corporate
|
278
|
|
—
|
|
278
|
|
0.6
|
%
|
||||||
|
Total
|
$
|
(423
|
)
|
$
|
(406
|
)
|
$
|
(829
|
)
|
1.7
|
%
|
|||
|
2016
|
||||||||||||||
|
North America Commercial P&C Insurance
|
$
|
(693
|
)
|
$
|
(85
|
)
|
$
|
(778
|
)
|
1.6
|
%
|
|||
|
North America Personal P&C Insurance
|
—
|
|
27
|
|
27
|
|
0.1
|
%
|
||||||
|
North America Agricultural Insurance
|
—
|
|
(72
|
)
|
(72
|
)
|
0.2
|
%
|
||||||
|
Overseas General Insurance
|
(236
|
)
|
(187
|
)
|
(423
|
)
|
0.9
|
%
|
||||||
|
Global Reinsurance
|
(77
|
)
|
(1
|
)
|
(78
|
)
|
0.2
|
%
|
||||||
|
Corporate
|
189
|
|
—
|
|
189
|
|
0.4
|
%
|
||||||
|
Total
|
$
|
(817
|
)
|
$
|
(318
|
)
|
$
|
(1,135
|
)
|
2.4
|
%
|
|||
|
2015
|
||||||||||||||
|
North America Commercial P&C Insurance
|
$
|
(162
|
)
|
$
|
(102
|
)
|
$
|
(264
|
)
|
1.0
|
%
|
|||
|
North America Personal P&C Insurance
|
—
|
|
25
|
|
25
|
|
0.1
|
%
|
||||||
|
North America Agricultural Insurance
|
—
|
|
(45
|
)
|
(45
|
)
|
0.1
|
%
|
||||||
|
Overseas General Insurance
|
(192
|
)
|
(151
|
)
|
(343
|
)
|
1.3
|
%
|
||||||
|
Global Reinsurance
|
(109
|
)
|
(10
|
)
|
(119
|
)
|
0.4
|
%
|
||||||
|
Corporate
|
200
|
|
—
|
|
200
|
|
0.7
|
%
|
||||||
|
Total
|
$
|
(263
|
)
|
$
|
(283
|
)
|
$
|
(546
|
)
|
2.0
|
%
|
|||
(1)
Calculated based on the beginning of period consolidated net unpaid losses and loss expenses. For 2016, the percent of beginning net unpaid reserves is calculated inclusive of the net unpaid losses and loss expenses acquired in the Chubb Corp acquisition of
$21.4 billion
.
North America Commercial P&C Insurance
2017
North America Commercial P&C Insurance experienced net favorable PPD of
$746 million
, which was the net result of several underlying favorable and adverse movements, and was driven by the following principal changes:
|
•
|
Net favorable development of
$562 million
in long-tail business, primarily from:
|
|
•
|
Net favorable development of
$184 million
in our commercial excess and umbrella portfolios, primarily in accident years 2011 and prior, driven by lower than expected case activity and an increase in weighting towards experience-based methods. Large loss activity in accident year 2015 led to adverse development in that year, partially offsetting the favorable development in the older years;
|
|
•
|
Net favorable development of
$181 million
in our management liability portfolios, favorably impacting accident years 2012 and prior where paid and reported loss activity was lower than expected, partially offset by adverse development in accident years 2014 through 2016, mostly as a result of higher severity claim costs compared to prior expectations in certain lines or coverages;
|
|
•
|
Net favorable development of
$123 million
in our workers’ compensation businesses (including excess workers' compensation) with favorable development of
$57 million
in the 2016 accident year related to our annual assessment of multi-claimant events including industrial accidents. Consistent with prior years, we reviewed these potential exposures after the close of the accident year to allow for late reporting or identification of significant losses. Net favorable development of
$65 million
was principally due to lower than expected loss experience and updates to development patterns used in our loss projection methods, mainly impacting accident years 2013 and prior, and
|
F-66
NOTES TO CONSOLIDATED FINANCIAL STATEMENTS
(continued)
Chubb Limited and Subsidiaries
partially offset by smaller adverse development in the more recent prior accident years;
|
•
|
Net favorable development of
$32 million
in our professional Errors and Omissions (E&O) portfolios, primarily in the 2012 and 2013 accident years, arising from lower than expected reported loss activity, partially offset by claim-specific adverse development in other years;
|
|
•
|
Net favorable development of
$28 million
on several large multi-line prospective deals primarily impacting the 2012 and 2013 accident years, due to lower than expected reported loss activity. These structured deals typically cover large clients for multiple product lines and with varying loss limitations; this development is net of premium adjustments of
$26 million
tied to the loss performance of the particular deals;
|
|
•
|
Net favorable development of
$21 million
in our political risk portfolio, primarily impacting the 2013 accident year, principally due to reported experience below expectations and an increase in weighting towards experience-based methods; and
|
|
•
|
Net adverse development of
$21 million
in our auto liability lines, primarily in the 2012 through 2015 accident years, driven by higher than expected paid and reported experience.
|
|
•
|
Net favorable development of
$184 million
in short-tail business, primarily from:
|
|
•
|
Net favorable development of
$98 million
in our property and inland marine portfolios, impacting the 2012 through 2016 accident years, resulting from lower than expected loss emergence;
|
|
•
|
Net favorable development of
$45 million
in our surety business, primarily due to lower than expected claims severity in the 2015 accident year; and
|
|
•
|
Net favorable development of
$20 million
in our accident & health (A&H) business, primarily due to lower than expected loss emergence in the 2015 and 2016 accident years.
|
2016
North America Commercial P&C Insurance experienced net favorable PPD of
$778 million
, which was the net result of several underlying favorable and adverse movements, and was driven by the following principal changes:
|
•
|
Net favorable development of
$693 million
in long-tail business, primarily from:
|
|
•
|
Net favorable development of
$264 million
in our commercial excess and umbrella portfolios, primarily in accident years 2010 and prior, driven by lower than expected reported loss activity and an increase in weighting towards experience-based methods; in general, the severity of claims has been less than expected;
|
|
•
|
Net favorable development of
$220 million
in our management liability portfolios, where paid and reported loss activity was lower than expected. The majority of this favorable activity impacted accident years 2011 and prior. Partially offsetting this were smaller amounts of adverse development in the more recent accident years, mostly as a result of higher severity claim costs compared to prior expectations in some lines;
|
|
•
|
Net favorable development of
$141 million
in our workers’ compensation lines with favorable development of
$40 million
in the 2015 accident year related to our annual assessment of multi-claimant events including industrial accidents. Favorable development of
$92 million
driven by accident years 2012 and prior was principally due to lower than expected loss experience and revision to the basis for selecting development patterns used in our loss projection methods for select portfolios;
|
|
•
|
Favorable development of
$58 million
in our professional Errors & Omission (E&O) portfolios, primarily impacting the 2012 and prior accident years and arising from both lower than expected reported loss activity and re-assessments of remaining claim-specific liabilities for the older accident years; and
|
|
•
|
Net favorable development of
$21 million
in our political risk business, mainly due to favorable claim emergence in the 2012 accident year.
|
F-67
NOTES TO CONSOLIDATED FINANCIAL STATEMENTS
(continued)
Chubb Limited and Subsidiaries
|
•
|
Net favorable development of
$85 million
in short-tail business, primarily from our property and inland marine portfolios, impacting the 2014 and 2015 accident years, resulting from lower than expected loss emergence.
|
2015
North America Commercial P&C Insurance experienced net favorable PPD of
$264 million
, representing
1.0 percent
of the beginning consolidated net unpaid losses and loss expense reserves.
North America Personal P&C Insurance
2017
North America Personal P&C Insurance incurred net adverse PPD of
$69 million
, which was the net result of several underlying favorable and adverse movements, and was driven by the following principal changes:
|
•
|
Net adverse development of
$105 million
in our homeowners lines, primarily impacting the 2013 and 2016 accident years, due to higher than expected loss severity; and
|
|
•
|
Net favorable development of
$58 million
in our personal excess lines primarily impacting the 2014 accident year, due to lower than expected loss experience and an increased weighting towards experience-based methods.
|
2016
North America Personal P&C Insurance incurred net adverse PPD of
$27 million
,
i
n our homeowners and umbrella lines due to higher than expected loss emergence. Average loss severities were higher than expected, and to a lesser degree, reinsurance and other recoveries were lower than expected.
2015
North America Personal P&C Insurance incurred net adverse PPD of
$25 million
, representing
0.1 percent
of the beginning consolidated net unpaid losses and loss expense reserves.
North America Agricultural Insurance
North America Agricultural Insurance experienced net favorable development of
$119 million
,
$72 million
, and
$45 million
in 2017, 2016, and 2015, respectively. Actual claim development relates to our Multiple Peril Crop Insurance (MPCI) business and is favorable due to better than expected crop yield results in certain states at the prior year-end period (i.e., 2017 results based on crop yield results at year-end 2016).
Overseas General Insurance
2017
Overseas General Insurance experienced net favorable PPD of
$252 million
, which was the net result of several underlying favorable and adverse movements, and was driven by the following principal changes:
|
•
|
Net favorable development of
$71 million
in long-tail business, primarily from:
|
|
•
|
Net favorable development of
$34 million
in financial lines, with favorable development of
$124 million
in accident years 2013 and prior, resulting from lower than expected loss emergence including favorable development on specific, litigated claims, partially offset by adverse development of
$90 million
in accident years 2014 through 2016, primarily due to large loss experience in specific Directors and Officers (D&O) portfolios within the U.K., Continental Europe, and Australia and Financial Institutions lines in the U.K. and Continental Europe; and
|
|
•
|
Net favorable development of
$10 million
in casualty lines, with favorable development of
$69 million
in accident years 2013 and prior, resulting from lower than expected loss emergence, partially offset by adverse development of
$32 million
driven by a change in the discount rate in the U.K. (Ogden rate) impacting the 2016 and prior accident years and adverse development of
$27 million
in accident years 2014 to 2016, primarily due to large loss experience in U.K. excess lines and wholesale business.
|
|
•
|
Net favorable development of
$181 million
in short-tail business, primarily from:
|
|
•
|
Net favorable development of
$48 million
in A&H lines, primarily from favorable loss emergence in Asia Pacific and Continental Europe in accident years 2014 through 2016;
|
F-68
NOTES TO CONSOLIDATED FINANCIAL STATEMENTS
(continued)
Chubb Limited and Subsidiaries
|
•
|
Net favorable development of
$43 million
in technical and energy lines, primarily from favorable loss emergence in accident years 2014 through 2016 primarily in offshore and power generation where experience has been better than expected;
|
|
•
|
Favorable development of
$42 million
in marine, primarily in accident years 2015 and 2016, driven mainly by favorable cargo loss emergence, including favorable claim-specific loss settlements and recoveries; and
|
|
•
|
Favorable development of
$25 million
in property (excluding technical lines), primarily in accident years 2013 through 2015, driven mainly by favorable loss emergence, including claim-specific loss settlements in all regions except Asia Pacific, partially offset by adverse Asia Pacific large loss experience in accident year 2016.
|
2016
Overseas General Insurance experienced net favorable PPD of
$423 million
, which was the net result of several underlying favorable and adverse movements, and was driven by the following principal changes:
|
•
|
Net favorable development of
$236 million
in long-tail business, primarily from:
|
|
•
|
Net favorable development of
$177 million
, primarily in casualty and financial lines, with favorable development of
$266 million
in accident years 2012 and prior, resulting from lower than expected loss emergence, and adverse development of
$89 million
in accident years 2013 to 2015, primarily due to large loss experience in our D&O portfolio in Asia and financial lines in Europe;
|
|
•
|
Favorable development of
$28 million
in aviation lines due to lower than expected loss emergence and case-specific reserve reductions impacting accident years 2012 and prior; and
|
|
•
|
Favorable development of
$25 million
on an individual legacy liability case reserve take-down. This release follows a legal analysis completed in 2016, based on court opinion in the year and discussions with defense counsel, which concluded that these reserves were no longer required.
|
|
•
|
Net favorable development of
$187 million
in short-tail business, primarily from:
|
|
•
|
Favorable development of
$97 million
in property (including technical lines), primarily from favorable Continental Europe loss emergence in accident years 2012 through 2014;
|
|
•
|
Favorable development of
$43 million
in energy lines, driven by favorable loss emergence in accident years 2010 through 2014, primarily in offshore where experience on multi-year construction accounts has been better than expected, as well as a claims review of catastrophe impacts on underwriting years 2004 through 2008; and
|
|
•
|
Favorable development of
$28 million
in accident & health (A&H) lines related to development of claim reserves, due to lower than expected loss emergence, primarily in Asia Pacific and Continental Europe in accident years 2013 through 2015.
|
2015
Overseas General Insurance experienced net favorable PPD of
$343 million
, representing
1.3 percent
of the beginning consolidated net unpaid losses and loss expense reserves.
Global Reinsurance
2017
Global Reinsurance experienced net favorable PPD of
$59 million
, which was the net result of several underlying favorable and adverse movements, and was driven by the following principal changes:
|
•
|
Net favorable development of
$68 million
on long-tail lines of business, primarily from:
|
|
•
|
Net favorable development of
$67 million
in our casualty (excluding motor), professional liability, and medical malpractice lines, primarily from treaty years 2013 and prior, principally resulting from lower than expected loss emergence in the U.S. portfolios; and
|
F-69
NOTES TO CONSOLIDATED FINANCIAL STATEMENTS
(continued)
Chubb Limited and Subsidiaries
|
•
|
Net adverse development of
$10 million
in our motor and excess liability lines, primarily due to adverse development of
$9 million
driven by a change in the discount rate in the U.K. (Ogden rate) primarily impacting the 2015 and prior treaty years.
|
|
•
|
Net adverse development of
$9 million
in our short-tail business, none of which was significant individually or in the aggregate.
|
2016
Global Reinsurance experienced net favorable PPD of
$78 million
, which was the net result of several underlying favorable and adverse movements, and was driven by the following principal changes:
|
•
|
Net favorable development of
$42 million
in casualty lines primarily impacting treaty years 2011 and prior, principally resulting from lower than expected loss emergence; and
|
|
•
|
Net favorable development of
$30 million
in professional liability lines primarily impacting treaty years 2011 and prior due to lower than expected loss emergence.
|
2015
Global Reinsurance experienced net favorable PPD of
$119 million
, representing
0.4 percent
of the beginning consolidated net unpaid losses and loss expense reserves.
Corporate
2017
Corporate incurred adverse development of
$278 million
in long-tail lines, driven by the following principal changes:
|
•
|
Adverse development of
$239 million
in asbestos, environmental, and other run-off liabilities, driven primarily by resolution of a limited number of direct cases, increases in severity trends, somewhat greater than expected defense spending and increases in reported claims for certain assumed reinsurance portfolios; and
|
|
•
|
Adverse development of
$39 million
on unallocated loss adjustment expenses due to run-off operating expenses paid and incurred in 2017.
|
2016
Corporate incurred adverse development of
$189 million
in long-tail lines, driven by the following principal changes:
|
•
|
Adverse development of
$141 million
in asbestos, environmental, and other run-off liabilities primarily arose as a result of the annual review of individual accounts and case specific exposures, with account changes driven by recent frequency and severity trends, certain case specific settlements and higher than expected defense spending; and
|
|
•
|
Adverse development of
$48 million
on unallocated loss adjustment expenses due to run-off operating expenses paid and incurred in 2016.
|
2015
Corporate incurred adverse PPD of
$200 million
, representing
0.7 percent
of the beginning consolidated net unpaid losses and loss expense reserves.
F-70
NOTES TO CONSOLIDATED FINANCIAL STATEMENTS
(continued)
Chubb Limited and Subsidiaries
Asbestos and environmental (A&E)
Chubb's exposure to A&E claims principally arises out of liabilities acquired when it purchased Westchester Specialty in 1998, CIGNA's P&C business in 1999, and Chubb Corp in 2016. The following table presents a roll-forward of consolidated A&E loss reserves including allocated loss expense reserves for A&E exposures, and the provision for uncollectible paid and unpaid reinsurance recoverables:
|
Asbestos
|
Environmental
|
Total
|
|||||||||||||||||||||||
|
(in millions of U.S. dollars)
|
Gross
|
|
Net
|
|
Gross
|
|
|
Net
|
|
Gross
|
|
Net
|
|
||||||||||||
|
Balance at December 31, 2016
|
$
|
1,726
|
|
$
|
1,119
|
|
$
|
577
|
|
$
|
490
|
|
$
|
2,303
|
|
$
|
1,609
|
|
|||||||
|
Incurred activity
|
228
|
|
104
|
|
199
|
|
113
|
|
427
|
|
217
|
|
(1)
|
||||||||||||
|
Paid activity
|
(333
|
)
|
(172
|
)
|
(169
|
)
|
(127
|
)
|
(502
|
)
|
(299
|
)
|
|||||||||||||
|
Balance at December 31, 2017
|
$
|
1,621
|
|
$
|
1,051
|
|
$
|
607
|
|
$
|
476
|
|
$
|
2,228
|
|
$
|
1,527
|
|
|||||||
(1)
Excludes unallocated loss expenses and the net activity reflects third-party reinsurance other than the aggregate excess of loss reinsurance provided by National Indemnity Company (NICO) to Westchester Specialty (see Westchester Specialty section below).
The A&E net loss reserves including allocated loss expense reserves and provision for uncollectible reinsurance at December 31, 2017 and 2016 shown in the table above is comprised of:
|
December 31
|
|||||||
|
(in millions of U.S. dollars)
|
2017
|
|
2016
|
|
|||
|
Brandywine operations
|
$
|
849
|
|
$
|
760
|
|
|
|
Westchester Specialty
|
113
|
|
112
|
|
|||
|
Chubb Corp
|
486
|
|
657
|
|
|||
|
Other, mainly Overseas General Insurance
|
79
|
|
80
|
|
|||
|
Total
|
$
|
1,527
|
|
$
|
1,609
|
|
|
The incurred activity of
$217 million
in 2017 and
$164 million
in 2016 were primarily the result of our annual internal, ground-up review of A&E liabilities.
Brandywine Run-off entities
–
The Restructuring Plan and uncertainties relating to Chubb's ultimate Brandywine exposure
In
1996
, the Pennsylvania Insurance Commissioner approved a plan to restructure INA Financial Corporation and its subsidiaries (the Restructuring) which included the division of Insurance Company of North America (INA) into two separate corporations:
(1) An active insurance company that retained the INA name and continued to write P&C business; and
(2) An inactive run-off company, now called Century Indemnity Company (Century).
As a result of the division, predominantly all A&E and certain other liabilities of INA were ascribed to Century and extinguished, as a matter of Pennsylvania law, as liabilities of INA.
As part of the Restructuring, most A&E liabilities of various U.S. affiliates of INA were reinsured to Century. Century and certain other run-off companies having A&E and other liabilities were contributed to Brandywine Holdings.
The U.S.-based Chubb INA companies assumed two contractual obligations in respect of the Brandywine operations in connection with the Restructuring: a surplus maintenance obligation in the form of the excess of loss (XOL) agreement and a dividend retention fund obligation.
XOL Agreement
In 1996, in connection with the Restructuring, a Chubb INA insurance subsidiary provided reinsurance coverage to Century in the amount of
$800
million under an Aggregate Excess of Loss Reinsurance Agreement (XOL Agreement), triggerable if the statutory capital and surplus of Century falls below
$25
million or if Century lacks liquid assets with which to pay claims as they become due.
F-71
NOTES TO CONSOLIDATED FINANCIAL STATEMENTS
(continued)
Chubb Limited and Subsidiaries
Dividend Retention Fund
INA Financial Corporation established and funded a dividend retention fund (the Dividend Retention Fund) consisting of
$50
million plus investment earnings. The full balance of the Dividend Retention Fund was contributed to Century as of
December 31, 2002
. Under the Restructuring Order, while any obligation to maintain the Dividend Retention Fund is in effect, to the extent dividends are paid by INA Holdings Corporation to its parent, INA Financial Corporation, and to the extent INA Financial Corporation then pays such dividends to INA Corporation, a portion of those dividends must be withheld to replenish the principal of the Dividend Retention Fund to
$50
million. During 2011 and 2010,
$35 million
and
$15 million
, respectively, were withheld from such dividends and deposited into the Dividend Retention Fund as a result of dividends paid up to the INA Corporation. Pursuant to a 2011 amendment to the Restructuring Order, capital contributions from the Dividend Retention Fund to Century are not required until the XOL Agreement has less than
$200
million of capacity remaining on an incurred basis for statutory reporting purposes. The amount of the capital contribution shall be the lesser of the amount necessary to restore the XOL Agreement remaining capacity to
$200
million or the Dividend Retention Fund balance. In 2017, the Pennsylvania Department of Insurance approved a capital contribution of
$49 million
from the Dividend Retention Fund to Century in order to restore the XOL capacity to
$200 million
. The Dividend Retention Fund may not be terminated without prior written approval from the Pennsylvania Insurance Commissioner.
Effective
December 31, 2004
, Chubb INA contributed
$100
million to Century in exchange for a surplus note. After giving effect to the contribution and issuance of the surplus note, the statutory surplus of Century at
December 31, 2017
was
$25
million and
$672
million in statutory-basis losses have been ceded to the XOL Agreement on an inception-to-date basis. Century reports the amount ceded under the XOL Agreement in accordance with statutory accounting principles, which differ from GAAP by, among other things, allowing Century to discount its liabilities, including certain asbestos related and environmental pollution liabilities and Century's reinsurance payable to active companies. For GAAP reporting purposes, intercompany reinsurance recoverables related to the XOL are eliminated upon consolidation.
While Chubb believes it has no legal obligation to fund Century losses above the XOL limit of coverage, Chubb's consolidated results would nevertheless continue to include any losses above the limit of coverage for so long as the Brandywine companies remain consolidated subsidiaries of Chubb.
Certain active Chubb companies are primarily liable for asbestos, environmental, and other exposures that they have reinsured to Century. Accordingly, if Century were to become insolvent and placed into rehabilitation or liquidation, some or all of the recoverables due to these active Chubb companies from Century could become uncollectible. At
December 31, 2017
and
2016
, the aggregate reinsurance recoverables owed by Century to certain active Chubb companies were approximately
$1.4 billion
and
$1.2 billion
, respectively. Chubb believes the active company intercompany reinsurance recoverables, which relate to direct liabilities payable over many years, are not impaired. At both
December 31, 2017
and
2016
, Century's carried gross reserves (including reserves assumed from the active Chubb companies) were
$2.0
billion. Should Century's loss reserves experience adverse development in the future and should Century be placed into rehabilitation or liquidation, the reinsurance recoverables due from Century to certain active Chubb companies would be payable only after the payment in full of certain expenses and liabilities, including administrative expenses and direct policy liabilities. Thus, the intercompany reinsurance recoverables would be at risk to the extent of the shortage of assets remaining to pay these recoverables.
Westchester Specialty
–
impact of NICO contracts on Chubb’s run-off entities
As part of the Westchester Specialty acquisition in 1998, NICO provided a
75 percent
pro-rata share of
$1.0 billion
of reinsurance protection on losses and loss adjustment expenses incurred on or before December 31, 1996, in excess of a retention of
$721 million
. At
December 31, 2017
, the remaining unused incurred limit under the Westchester NICO agreement was
$409 million
.
8
. Taxation
Under current Swiss law, a resident company is subject to income tax at the federal, cantonal, and communal levels that is levied on net worldwide income. Income attributable to permanent establishments or real estate located abroad is excluded from the Swiss tax base. Chubb Limited is a holding company and, therefore, is exempt from cantonal and communal income tax. As a result, Chubb Limited is subject to Swiss income tax only at the federal level. Furthermore, participation relief (i.e., tax relief) is granted to Chubb Limited at the federal level for qualifying dividend income and capital gains related to the sale of qualifying participations (i.e., subsidiaries). It is expected that the participation relief will result in a full exemption of participation income from federal income tax. Chubb Limited is subject to an annual cantonal and communal capital tax on the taxable equity of Chubb Limited in Switzerland.
F-72
NOTES TO CONSOLIDATED FINANCIAL STATEMENTS
(continued)
Chubb Limited and Subsidiaries
Chubb has two Swiss operating subsidiaries, an insurance company, Chubb Insurance (Switzerland) Limited and a reinsurance company, Chubb Reinsurance (Switzerland) Limited. Both are subject to federal, cantonal, and communal income tax and to annual cantonal and communal capital tax.
Under current Bermuda law, Chubb Limited and its Bermuda subsidiaries are not required to pay any taxes on income or capital gains. If a Bermuda law were enacted that would impose taxes on income or capital gains, Chubb Limited and the Bermuda subsidiaries have received an undertaking from the Minister of Finance in Bermuda that would exempt such companies from Bermudian taxation until March 2035.
Income from Chubb's operations at Lloyd's is subject to United Kingdom (U.K.) corporation taxes. Lloyd's is required to pay U.S. income tax on U.S. connected income (U.S. income) written by Lloyd's syndicates. Lloyd's has a closing agreement with the Internal Revenue Service (IRS) whereby the amount of tax due on this business is calculated by Lloyd's and remitted directly to the IRS. These amounts are then charged to the accounts of Chubb's Corporate Members in proportion to their participation in the relevant syndicates. Chubb's Corporate Members are subject to this arrangement but, as U.K. domiciled companies, will receive U.K. corporation tax credits for any U.S. income tax incurred up to the value of the equivalent U.K. corporation income tax charge on the U.S. income.
Chubb Group Holdings and its respective subsidiaries are subject to income taxes imposed by U.S. authorities and file a consolidated U.S. tax return. As part of the Chubb Corp acquisition, immediately following the merger, Chubb Corp merged with and into Chubb INA Holdings Inc., and therefore, joined the Chubb Group Holdings consolidated return. Should Chubb Group Holdings pay a dividend to Chubb Limited, withholding taxes would apply. Currently, however, no withholding taxes are accrued with respect to such un-remitted earnings as management has no intention of remitting these earnings. Similarly, no taxes have been provided on the un-remitted earnings of certain foreign subsidiaries (Hong Kong and Korea life companies) as management has no intention of remitting these earnings.
The cumulative amount that would be subject to withholding tax, if distributed, as well as the determination of the associated tax liability are not practicable to compute; however, such amount would be material to Chubb. Certain international operations of Chubb are also subject to income taxes imposed by the jurisdictions in which they operate.
Chubb's domestic operations are in Switzerland, the jurisdiction where we are legally organized, incorporated, and registered.
The following table presents pre-tax income and the related provision for income taxes:
|
Year Ended December 31
|
|||||||||||
|
(in millions of U.S. dollars)
|
2017
|
|
2016
|
|
2015
|
|
|||||
|
Pre-tax income:
|
|||||||||||
|
Switzerland
|
$
|
527
|
|
$
|
766
|
|
$
|
469
|
|
||
|
Outside Switzerland
|
3,195
|
|
4,184
|
|
2,827
|
|
|||||
|
Total pre-tax income
|
$
|
3,722
|
|
$
|
4,950
|
|
$
|
3,296
|
|
||
|
Provision for income taxes
|
|||||||||||
|
Current tax expense:
|
|||||||||||
|
Switzerland
|
$
|
46
|
|
$
|
97
|
|
$
|
38
|
|
||
|
Outside Switzerland
|
313
|
|
727
|
|
266
|
|
|||||
|
Total current tax expense
|
359
|
|
824
|
|
304
|
|
|||||
|
Deferred tax expense (benefit):
|
|||||||||||
|
Switzerland
|
2
|
|
(27
|
)
|
4
|
|
|||||
|
Outside Switzerland
|
(500
|
)
|
18
|
|
154
|
|
|||||
|
Total deferred tax expense (benefit)
|
(498
|
)
|
(9
|
)
|
158
|
|
|||||
|
Provision for income taxes
|
$
|
(139
|
)
|
$
|
815
|
|
$
|
462
|
|
||
F-73
NOTES TO CONSOLIDATED FINANCIAL STATEMENTS
(continued)
Chubb Limited and Subsidiaries
The most significant jurisdictions contributing to the overall taxation of Chubb are calculated using the following rates in 2017: Switzerland
7.83 percent
, Bermuda
0.0 percent
, U.S.
35.0 percent
, and U.K.
19.0 percent
. Effective January 1, 2018, the U.S. corporate rate was reduced to 21 percent.
The following table presents a reconciliation of the difference between the provision for income taxes and the expected tax provision at the Swiss statutory income tax rate:
|
Year Ended December 31
|
|||||||||||
|
(in millions of U.S. dollars)
|
2017
|
|
2016
|
|
2015
|
|
|||||
|
Expected tax provision at Swiss statutory tax rate
|
$
|
291
|
|
$
|
388
|
|
$
|
258
|
|
||
|
Permanent differences:
|
|||||||||||
|
Taxes on earnings subject to rate other than Swiss statutory rate
|
263
|
|
582
|
|
193
|
|
|||||
|
Tax-exempt interest and dividends received deduction, net of proration
|
(199
|
)
|
(200
|
)
|
(32
|
)
|
|||||
|
Net withholding taxes
|
30
|
|
20
|
|
35
|
|
|||||
|
Excess tax benefit on share-based compensation
|
(48
|
)
|
—
|
|
—
|
|
|||||
|
Impact of 2017 Tax Act
|
(450
|
)
|
—
|
|
—
|
|
|||||
|
Corporate owned life insurance
|
(37
|
)
|
—
|
|
—
|
|
|||||
|
Other
|
11
|
|
25
|
|
8
|
|
|||||
|
Total provision for income taxes
|
$
|
(139
|
)
|
$
|
815
|
|
$
|
462
|
|
||
The following table presents the components of net deferred tax assets and liabilities:
|
December 31
|
|
December 31
|
|
||||
|
(in millions of U.S. dollars)
|
2017
|
|
2016
|
|
|||
|
Deferred tax assets:
|
|||||||
|
Loss reserve discount
|
$
|
715
|
|
$
|
1,269
|
|
|
|
Unearned premiums reserve
|
231
|
|
498
|
|
|||
|
Foreign tax credits
|
340
|
|
2,115
|
|
|||
|
Provision for uncollectible balances
|
45
|
|
72
|
|
|||
|
Loss carry-forwards
|
90
|
|
92
|
|
|||
|
Debt related amounts
|
77
|
|
219
|
|
|||
|
Compensation related amounts
|
260
|
|
449
|
|
|||
|
Cumulative translation adjustments
|
30
|
|
59
|
|
|||
|
Other, net
|
70
|
|
69
|
|
|||
|
Total deferred tax assets
|
1,858
|
|
4,842
|
|
|||
|
Deferred tax liabilities:
|
|||||||
|
Deferred policy acquisition costs
|
635
|
|
842
|
|
|||
|
Other intangible assets, including VOBA
|
1,437
|
|
2,352
|
|
|||
|
Un-remitted foreign earnings
|
66
|
|
2,001
|
|
|||
|
Investments
|
53
|
|
406
|
|
|||
|
Unrealized appreciation on investments
|
184
|
|
60
|
|
|||
|
Depreciation
|
83
|
|
91
|
|
|||
|
Total deferred tax liabilities
|
2,458
|
|
5,752
|
|
|||
|
Valuation allowance
|
99
|
|
78
|
|
|||
|
Net deferred tax assets (liabilities)
|
$
|
(699
|
)
|
$
|
(988
|
)
|
|
The 2017 Tax Act, enacted on December 22, 2017, among other things, reduces the U.S. federal income tax rate to
21 percent
from
35 percent
effective in 2018. We have not completed our assessment of the effects of the 2017 Tax Act; however, we have made our best estimate of those effects based on our current understanding of the provisions in the Act. Accordingly, we recorded
F-74
NOTES TO CONSOLIDATED FINANCIAL STATEMENTS
(continued)
Chubb Limited and Subsidiaries
a
$450 million
income tax transition benefit in the fourth quarter of 2017 on a provisional basis, principally reflecting the reduction in the U.S. corporate tax rate from
35 percent
to
21 percent
. This is comprised of a
$743 million
reduction in the deferred tax liabilities principally related to certain intangible assets, a
$371 million
reduction in net deferred tax assets related to other net assets, and a net benefit of
$78 million
related to the impact of excess foreign tax credits generated by the deemed repatriation rules and the impact of the reduced rate on our foreign branches. We have computed these amounts based on the best available information and our understanding of the 2017 Tax Act.
As we complete our analysis of the 2017 Tax Act, collect and prepare necessary data and interpret any additional guidance issued by the IRS, the Treasury Department and other standard setting agencies, we may make adjustments to the provisional amounts. Those adjustments may materially impact our provision for income taxes in the period in which the adjustments are made.
The valuation allowance of $
99
million at
December 31, 2017
, and $
78
million at
December 31, 2016
, reflects management's assessment, based on available information, that it is more likely than not that a portion of the deferred tax assets will not be realized due to the potential inability to utilize foreign tax credits in the U.S. and the inability of certain foreign subsidiaries to generate sufficient taxable income. Adjustments to the valuation allowance are made when there is a change in management's assessment of the amount of deferred tax assets that are realizable.
At
December 31, 2017
, Chubb has net operating loss carry-forwards of $
329
million which, if unused, will expire starting in 2018, and a foreign tax credit carry-forward in the amount of $
340
million which, if unused, will expire in the years 2022 through 2027.
The following table presents a reconciliation of the beginning and ending amount of gross unrecognized tax benefits:
|
December 31
|
|
December 31
|
|
||||
|
(in millions of U.S. dollars)
|
2017
|
|
2016
|
|
|||
|
Balance, beginning of year
|
$
|
17
|
|
$
|
16
|
|
|
|
Additions based on tax positions related to the current year
|
3
|
|
3
|
|
|||
|
Additions based on tax positions related to prior years
(1)
|
—
|
|
2
|
|
|||
|
Reductions for tax positions of prior years
|
(4
|
)
|
(4
|
)
|
|||
|
Reductions for the lapse of the applicable statutes of limitations
|
(3
|
)
|
—
|
|
|||
|
Balance, end of year
|
$
|
13
|
|
$
|
17
|
|
|
(1)
Assumed in connection with the Chubb Corp acquisition in 2016.
At
December 31, 2017
and
2016
, the total amount of unrecognized tax benefits that would affect the effective tax rate, if recognized, were
$13 million
and $
17 million
, respectively.
Chubb recognizes accruals for interest and penalties, if any, related to unrecognized tax benefits in income tax expense in the Consolidated statements of operations. For the years ended
December 31, 2017
,
2016
, and
2015
, tax-related interest expense (income) and penalties reported in the Consolidated statements of operations was
$1 million
for each of the three years. At
December 31, 2017
and
2016
, liabilities for tax-related interest and penalties in our Consolidated balance sheets were $
3
million and
$4 million
, respectively.
In September 2016, the IRS completed its examination of Chubb Group Holdings’ (formerly ACE Group Holdings) federal tax returns for the 2010-2012 tax years. No material adjustments resulted from this examination. During 2017, the IRS commenced its field examination of Chubb Group Holdings federal income tax returns for 2014 and 2015 and Chubb Corp’s federal tax return for 2014 which were still ongoing at December 31, 2017. It is reasonably possible that over the next twelve months, the amount of unrecognized tax benefits may change resulting from the re-evaluation of unrecognized tax benefits arising from examinations of taxing authorities and the closing of tax statutes of limitations. With few exceptions, Chubb is no longer subject to state and local and non-U.S. income tax examinations for years before 2010.
F-75
NOTES TO CONSOLIDATED FINANCIAL STATEMENTS
(continued)
Chubb Limited and Subsidiaries
9
. Debt
|
December 31
|
|
December 31
|
|
||||||
|
(in millions of U.S. dollars)
|
2017
|
|
2016
|
|
Early Redemption Option
|
||||
|
Repurchase agreements
(weighted average interest rate of 1.5% in 2017 and 0.8% in 2016)
|
$
|
1,408
|
|
|
$
|
1,403
|
|
None
|
|
|
Short-term debt
|
|||||||||
|
Chubb INA senior notes:
|
|||||||||
|
$500 million 5.7% due February 2017
|
$
|
—
|
|
$
|
500
|
|
Make-whole premium plus 0.20%
|
||
|
$300 million 5.8% due March 2018
|
300
|
|
—
|
|
Make-whole premium plus 0.35%
|
||||
|
$600 million 5.75% due May 2018
|
610
|
|
—
|
|
Make-whole premium plus 0.30%
|
||||
|
$100 million 6.6% due August 2018
|
103
|
|
—
|
|
None
|
||||
|
Total short-term debt
|
$
|
1,013
|
|
$
|
500
|
|
|||
|
Long-term debt
|
|||||||||
|
Chubb INA senior notes:
|
|||||||||
|
$300 million 5.8% due March 2018
|
$
|
—
|
|
$
|
300
|
|
Make-whole premium plus 0.35%
|
||
|
$600 million 5.75% due May 2018
|
—
|
|
635
|
|
Make-whole premium plus 0.30%
|
||||
|
$100 million 6.6% due August 2018
|
—
|
|
107
|
|
None
|
||||
|
$500 million 5.9% due June 2019
|
499
|
|
498
|
|
Make-whole premium plus 0.40%
|
||||
|
$1,300 million 2.3% due November 2020
|
1,296
|
|
1,294
|
|
Make-whole premium plus 0.15%
|
||||
|
$1,000 million 2.875% due November 2022
|
995
|
|
994
|
|
Make-whole premium plus 0.20%
|
||||
|
$475 million 2.7% due March 2023
|
472
|
|
471
|
|
Make-whole premium plus 0.10%
|
||||
|
$700 million 3.35% due May 2024
|
695
|
|
695
|
|
Make-whole premium plus 0.15%
|
||||
|
$800 million 3.15% due March 2025
|
795
|
|
794
|
|
Make-whole premium plus 0.15%
|
||||
|
$1,500 million 3.35% due May 2026
|
1,489
|
|
1,488
|
|
Make-whole premium plus 0.20%
|
||||
|
$100 million 8.875% due August 2029
|
100
|
|
100
|
|
None
|
||||
|
$200 million 6.8% due November 2031
|
254
|
|
257
|
|
Make-whole premium plus 0.25%
|
||||
|
$300 million 6.7% due May 2036
|
297
|
|
297
|
|
Make-whole premium plus 0.20%
|
||||
|
$800 million 6.0% due May 2037
|
971
|
|
980
|
|
Make-whole premium plus 0.20%
|
||||
|
$600 million 6.5% due May 2038
|
768
|
|
776
|
|
Make-whole premium plus 0.30%
|
||||
|
$475 million 4.15% due March 2043
|
469
|
|
469
|
|
Make-whole premium plus 0.15%
|
||||
|
$1,500 million 4.35% due November 2045
|
1,482
|
|
1,482
|
|
Make-whole premium plus 0.25%
|
||||
|
Chubb INA $1,000 million 6.375% capital securities due March 2067
(1)
|
964
|
|
962
|
|
Make-whole premium plus 0.25%-0.50%
|
||||
|
Other long-term debt (2.75% to 7.1% due December 2019 to September 2020)
|
10
|
|
11
|
|
None
|
||||
|
Total long-term debt
|
$
|
11,556
|
|
$
|
12,610
|
|
|||
|
Trust preferred securities
|
|||||||||
|
Chubb INA capital securities due April 2030
|
$
|
308
|
|
$
|
308
|
|
Redemption prices
(2)
|
||
|
(1)
|
6.375% interest rate through April 14, 2017; interest rate equal to three-month LIBOR rate plus 2.25% thereafter. The current interest rate at the time of this filing is
3.97%
.
|
|
(2)
|
Redemption prices are equal to accrued and unpaid interest to the redemption date plus the greater of (i) 100 percent of the principal amount thereof, or (ii) sum of present value of scheduled payments of principal and interest on the capital securities from the redemption date to April 1, 2030.
|
F-76
NOTES TO CONSOLIDATED FINANCIAL STATEMENTS
(continued)
Chubb Limited and Subsidiaries
a) Repurchase agreements
Chubb has executed repurchase agreements with certain counterparties under which Chubb agreed to sell securities and repurchase them at a future date for a predetermined price.
Short-term debt comprises the current maturities of our long-term debt instruments described below. These short-term debt instruments were reclassified from long-term debt during 2017 and are reflected in the table above.
c) Long-term debt
Certain of Chubb INA's senior notes and capital securities are redeemable at any time at Chubb INA's option subject to the provisions described in the table above. A "make-whole" premium is the present value of the remaining principal and interest discounted at the applicable U.S. Treasury rate. The senior notes and capital securities are also redeemable at par plus accrued and unpaid interest in the event of certain changes in tax law.
The senior notes do not have the benefit of any sinking fund. These senior unsecured notes are guaranteed on a senior basis by Chubb Limited and they rank equally with all of Chubb's other senior obligations. They also contain customary limitations on lien provisions as well as customary events of default provisions which, if breached, could result in the accelerated maturity of such senior debt.
We have outstanding $
1.0 billion
of unsecured junior subordinated capital securities at
December 31, 2017
, which were assumed by Chubb INA in connection with the Chubb Corp acquisition. Effective April 15, 2017, the interest rate on our
$1.0 billion
of unsecured junior subordinated capital securities converted to a floating rate, equal to the three-month LIBOR plus
2.25
percentage points. Previously, these capital securities carried interest at a rate of
6.375
percent. The current interest rate at the time of this filing on these securities is
3.97 percent
. The scheduled maturity date for these securities is April 15, 2037.
In August 2017, Chubb eliminated the Replacement Capital Covenant (RCC) associated with these capital securities which benefited the holders of the
6.8 percent
debentures due November 2031. The RCC was eliminated through a consent solicitation process whereby the holders of the
6.8 percent
debentures agreed to waive their rights under the RCC in exchange for a nominal fee. Chubb received the requisite number of consents required to eliminate the RCC and as a result, the RCC was terminated in August 2017.
d) Trust preferred securities
In March 2000, ACE Capital Trust II, a Delaware statutory business trust, publicly issued $
300
million of
9.7 percent
Capital Securities (the Capital Securities) due to mature in April 2030. At the same time, Chubb INA purchased $
9.2
million of common securities of ACE Capital Trust II. The sole assets of ACE Capital Trust II consist of $
309
million principal amount of
9.7 percent
Junior Subordinated Deferrable Interest Debentures (the Subordinated Debentures) issued by Chubb INA due to mature in April 2030.
Distributions on the Capital Securities are payable semi-annually and may be deferred for up to ten consecutive semi-annual periods (but no later than April 1, 2030). Any deferred payments would accrue interest compounded semi-annually if Chubb INA defers interest on the Subordinated Debentures. Interest on the Subordinated Debentures is payable semi-annually. Chubb INA may defer such interest payments (but no later than April 1, 2030), with such deferred payments accruing interest compounded semi-annually. The Capital Securities and the ACE Capital Trust II Common Securities will be redeemed upon repayment of the Subordinated Debentures.
Chubb Limited has guaranteed, on a subordinated basis, Chubb INA's obligations under the Subordinated Debentures, and distributions and other payments due on the Capital Securities. These guarantees, when taken together with Chubb's obligations under expense agreements entered into with ACE Capital Trust II, provide a full and unconditional guarantee of amounts due on the Capital Securities.
F-77
NOTES TO CONSOLIDATED FINANCIAL STATEMENTS
(continued)
Chubb Limited and Subsidiaries
10
. Commitments, contingencies, and guarantees
a) Derivative instruments
Foreign currency management
As a global company, Chubb entities transact business in multiple currencies. Our policy is to generally match assets, liabilities, and required capital for each individual jurisdiction in local currency, which would include the use of derivatives discussed below. We do not hedge our net asset non-U.S. dollar capital positions; however, we do consider economic hedging for planned cross border transactions.
Derivative instruments employed
Chubb maintains positions in derivative instruments such as futures, options, swaps, and foreign currency forward contracts for which the primary purposes are to manage duration and foreign currency exposure, yield enhancement, or to obtain an exposure to a particular financial market. Chubb also maintains positions in convertible securities that contain embedded derivatives. Investment derivative instruments are recorded in either Other assets (OA) or Accounts payable, accrued expenses, and other liabilities (AP), convertible bonds are recorded in Fixed maturities available for sale (FM AFS), and convertible equity securities are recorded in Equity securities (ES) in the Consolidated balance sheets. These are the most numerous and frequent derivative transactions. In addition, Chubb from time to time purchases to be announced mortgage-backed securities (TBAs) as part of its investing activities.
Under reinsurance programs covering GLBs, Chubb assumes the risk of GLBs, including GMIB and GMAB, associated with variable annuity contracts. The GMIB risk is triggered if, at the time the contract holder elects to convert the accumulated account value to a periodic payment stream (annuitize), the accumulated account value is not sufficient to provide a guaranteed minimum level of monthly income. The GMAB risk is triggered if, at contract maturity, the contract holder’s account value is less than a guaranteed minimum value. The GLB reinsurance product meets the definition of a derivative instrument. Benefit reserves in respect of GLBs are classified as Future policy benefits (FPB) while the fair value derivative adjustment is classified within AP. Chubb also generally maintains positions in exchange-traded equity futures contracts on equity market indices to limit equity exposure in the GMDB and GLB blocks of business.
All derivative instruments are carried at fair value with changes in fair value recorded in Net realized gains (losses) in the Consolidated statements of operations. None of the derivative instruments are designated as hedges for accounting purposes.
The following table presents the balance sheet locations, fair values of derivative instruments in an asset or (liability) position, and notional values/payment provisions of our derivative instruments:
|
December 31, 2017
|
December 31, 2016
|
|||||||||||||||||||||||||
|
Consolidated
Balance Sheet Location |
Fair Value
|
Notional
Value/ Payment Provision |
|
Fair Value
|
Notional
Value/ Payment Provision |
|
||||||||||||||||||||
|
Derivative Asset
|
|
Derivative (Liability)
|
|
Derivative Asset
|
|
Derivative (Liability)
|
|
|||||||||||||||||||
|
(in millions of U.S. dollars)
|
||||||||||||||||||||||||||
|
Investment and embedded derivative instruments:
|
||||||||||||||||||||||||||
|
Foreign currency forward contracts
|
OA / (AP)
|
$
|
14
|
|
$
|
(27
|
)
|
$
|
2,064
|
|
$
|
25
|
|
$
|
(50
|
)
|
$
|
2,220
|
|
|||||||
|
Cross-currency swaps
|
OA / (AP)
|
—
|
|
—
|
|
45
|
|
—
|
|
—
|
|
95
|
|
|||||||||||||
|
Options/Futures contracts on notes and bonds
|
OA / (AP)
|
4
|
|
(3
|
)
|
1,007
|
|
6
|
|
(4
|
)
|
2,344
|
|
|||||||||||||
|
Convertible securities
(1)
|
FM AFS/ES
|
5
|
|
—
|
|
6
|
|
2
|
|
—
|
|
7
|
|
|||||||||||||
|
$
|
23
|
|
$
|
(30
|
)
|
$
|
3,122
|
|
$
|
33
|
|
$
|
(54
|
)
|
$
|
4,666
|
|
|||||||||
|
Other derivative instruments:
|
||||||||||||||||||||||||||
|
Futures contracts on equities
(2)
|
OA / (AP)
|
$
|
—
|
|
$
|
(21
|
)
|
$
|
1,553
|
|
$
|
1
|
|
$
|
—
|
|
$
|
1,316
|
|
|||||||
|
Other
|
OA / (AP)
|
1
|
|
(2
|
)
|
75
|
|
2
|
|
(13
|
)
|
214
|
|
|||||||||||||
|
$
|
1
|
|
$
|
(23
|
)
|
$
|
1,628
|
|
$
|
3
|
|
$
|
(13
|
)
|
$
|
1,530
|
|
|||||||||
|
GLB
(3)
|
(AP) / (FPB)
|
$
|
—
|
|
$
|
(550
|
)
|
$
|
1,083
|
|
$
|
—
|
|
$
|
(853
|
)
|
$
|
1,264
|
|
|||||||
|
(1)
|
Includes fair value of embedded derivatives.
|
|
(2)
|
Related to GMDB and GLB blocks of business.
|
|
(3)
|
Includes both future policy benefits reserves and fair value derivative adjustment. Refer to Note
5
c
) for additional information. Note that the payment provision related to GLB is the net amount at risk. The concept of a notional value does not apply to the GLB reinsurance contracts.
|
F-78
NOTES TO CONSOLIDATED FINANCIAL STATEMENTS
(continued)
Chubb Limited and Subsidiaries
At
December 31, 2017
and
2016
, derivative liabilities of $
24 million
and
$10 million
, respectively, included in the table above were subject to a master netting agreement. The remaining derivatives included in the table above were not subject to a master netting agreement.
b) Secured borrowings
Chubb participates in a securities lending program operated by a third-party banking institution whereby certain assets are loaned to qualified borrowers and from which we earn an incremental return. At
December 31, 2017
and
2016
, our securities lending collateral was
$1,737 million
and
$1,092 million
, respectively, and our securities lending payable, reflecting our obligation to return the collateral plus interest, was
$1,737 million
and
$1,093 million
, respectively. The securities lending collateral can only be drawn down by Chubb in the event that the institution borrowing the securities is in default under the lending agreement. An indemnification agreement with the lending agent protects us in the event a borrower becomes insolvent or fails to return any of the securities on loan. The collateral is recorded in Securities lending collateral and the liability is recorded in Securities lending payable in the Consolidated balance sheets.
The following table presents the carrying value of collateral held under securities lending agreements by investment category and remaining contractual maturity of the underlying agreements:
|
Remaining contractual maturity
|
|||||||
|
December 31 2017
|
|
December 31 2016
|
|
||||
|
(in millions of U.S. dollars)
|
Overnight and Continuous
|
||||||
|
Collateral held under securities lending agreements:
|
|||||||
|
Cash
|
$
|
828
|
|
$
|
423
|
|
|
|
U.S. Treasury and agency
|
36
|
|
54
|
|
|||
|
Foreign
|
712
|
|
578
|
|
|||
|
Corporate securities
|
—
|
|
37
|
|
|||
|
Mortgage-backed securities
|
74
|
|
—
|
|
|||
|
Equity securities
|
87
|
|
—
|
|
|||
|
$
|
1,737
|
|
$
|
1,092
|
|
||
|
Gross amount of recognized liability for securities lending payable
|
$
|
1,737
|
|
$
|
1,093
|
|
|
|
Difference
(1)
|
$
|
—
|
|
$
|
(1
|
)
|
|
|
(1)
|
The carrying value of the securities lending collateral held is
$1 million
lower than the securities lending payable at December 31, 2016 due to accrued interest recorded in the securities lending payable.
|
At
December 31, 2017
and
2016
, our repurchase agreement obligations of
$1,408 million
and $
1,403 million
, respectively, were fully collateralized. In contrast to securities lending programs, the use of cash received is not restricted for the repurchase obligations. The fair value of the underlying securities sold remains in Fixed maturities available for sale, and the repurchase agreement obligation is recorded in Repurchase agreements in the Consolidated balance sheets.
F-79
NOTES TO CONSOLIDATED FINANCIAL STATEMENTS
(continued)
Chubb Limited and Subsidiaries
The following table presents the carrying value of collateral pledged under repurchase agreements by investment category and remaining contractual maturity of the underlying agreements:
|
Remaining contractual maturity
|
|||||||||||||||||||||||
|
December 31, 2017
|
December 31, 2016
|
||||||||||||||||||||||
|
Up to 30 Days
|
|
Greater than 90 Days
|
|
Up to 30 Days
|
|
Greater than 90 Days
|
|
Total
|
|
||||||||||||||
|
(in millions of U.S. dollars)
|
Total
|
|
|||||||||||||||||||||
|
Collateral pledged under repurchase agreements:
|
|||||||||||||||||||||||
|
Cash
|
$
|
—
|
|
$
|
—
|
|
$
|
—
|
|
$
|
—
|
|
$
|
1
|
|
$
|
1
|
|
|||||
|
U.S. Treasury and agency
|
9
|
|
230
|
|
239
|
|
230
|
|
10
|
|
240
|
|
|||||||||||
|
Mortgage-backed securities
|
369
|
|
826
|
|
1,195
|
|
339
|
|
881
|
|
1,220
|
|
|||||||||||
|
$
|
378
|
|
$
|
1,056
|
|
$
|
1,434
|
|
$
|
569
|
|
$
|
892
|
|
$
|
1,461
|
|
||||||
|
Gross amount of recognized liabilities for repurchase agreements
|
$
|
1,408
|
|
$
|
1,403
|
|
|||||||||||||||||
|
Difference
(1)
|
$
|
26
|
|
$
|
58
|
|
|||||||||||||||||
|
(1)
|
Per the repurchase agreements, the amount of collateral posted is required to exceed the amount of gross liability.
|
Potential risks exist in our secured borrowing transactions due to market conditions and counterparty exposure. With collateral that we pledge, there is a risk that the collateral may not be returned at the expiration of the agreement. If the counterparty fails to return the collateral, Chubb will have free use of the borrowed funds until our collateral is returned. In addition, we may encounter the risk that Chubb may not be able to renew outstanding borrowings with a new term or with an existing counterparty due to market conditions including a decrease in demand as well as more restrictive terms from banks due to increased regulatory and capital constraints. Should this condition occur, Chubb may seek alternative borrowing sources or reduce borrowings. Additionally, increased margins and collateral requirements due to market conditions would increase our restricted assets as we are required to provide additional collateral to support the transaction.
The following table presents net realized gains (losses) related to derivative instrument activity in the Consolidated statements of operations:
|
Year Ended December 31
|
|||||||||||
|
(in millions of U.S. dollars)
|
2017
|
|
2016
|
|
2015
|
|
|||||
|
Investment and embedded derivative instruments:
|
|||||||||||
|
Foreign currency forward contracts
|
$
|
9
|
|
$
|
(31
|
)
|
$
|
31
|
|
||
|
All other futures contracts and options
|
(21
|
)
|
(10
|
)
|
9
|
|
|||||
|
Convertible securities
(1)
|
1
|
|
8
|
|
(8
|
)
|
|||||
|
Total investment and embedded derivative instruments
|
$
|
(11
|
)
|
$
|
(33
|
)
|
$
|
32
|
|
||
|
GLB and other derivative instruments:
|
|||||||||||
|
GLB
(2)
|
$
|
364
|
|
$
|
53
|
|
$
|
(203
|
)
|
||
|
Futures contracts on equities
(3)
|
(261
|
)
|
(136
|
)
|
(8
|
)
|
|||||
|
Other
|
(5
|
)
|
(10
|
)
|
(14
|
)
|
|||||
|
Total GLB and other derivative instruments
|
$
|
98
|
|
$
|
(93
|
)
|
$
|
(225
|
)
|
||
|
$
|
87
|
|
$
|
(126
|
)
|
$
|
(193
|
)
|
|||
|
(1)
|
Includes embedded derivatives.
|
|
(2)
|
Excludes foreign exchange gains (losses) related to GLB.
|
|
(3)
|
Related to GMDB and GLB blocks of business.
|
F-80
NOTES TO CONSOLIDATED FINANCIAL STATEMENTS
(continued)
Chubb Limited and Subsidiaries
c) Derivative instrument objectives
(i) Foreign currency exposure management
A foreign currency forward contract (forward) is an agreement between participants to exchange specific foreign currencies at a future date. Chubb uses forwards to minimize the effect of fluctuating foreign currencies as discussed above.
(ii) Duration management and market exposure
Futures
Futures contracts give the holder the right and obligation to participate in market movements, determined by the index or underlying security on which the futures contract is based. Settlement is made daily in cash by an amount equal to the change in value of the futures contract times a multiplier that scales the size of the contract. Exchange-traded futures contracts on money market instruments, notes and bonds are used in fixed maturity portfolios to more efficiently manage duration, as substitutes for ownership of the money market instruments, bonds and notes without significantly increasing the risk in the portfolio. Investments in futures contracts may be made only to the extent that there are assets under management not otherwise committed.
Exchange-traded equity futures contracts are used to limit exposure to a severe equity market decline, which would cause an increase in expected claims and therefore, an increase in reserves for GMDB and GLB reinsurance business.
Options
An option contract conveys to the holder the right, but not the obligation, to purchase or sell a specified amount or value of an underlying security at a fixed price. Option contracts are used in the investment portfolio as protection against unexpected shifts in interest rates, which would affect the duration of the fixed maturity portfolio. By using options in the portfolio, the overall interest rate sensitivity of the portfolio can be reduced. Option contracts may also be used as an alternative to futures contracts in the synthetic strategy as described above.
The price of an option is influenced by the underlying security, expected volatility, time to expiration, and supply and demand.
The credit risk associated with the above derivative financial instruments relates to the potential for non-performance by counterparties. Although non-performance is not anticipated, in order to minimize the risk of loss, management monitors the creditworthiness of its counterparties and obtains collateral. The performance of exchange-traded instruments is guaranteed by the exchange on which they trade. For non-exchange-traded instruments, the counterparties are principally banks which must meet certain criteria according to our investment guidelines.
Cross-currency swaps
Cross-currency swaps are agreements under which two counterparties exchange interest payments and principal denominated in different currencies at a future date. We use cross-currency swaps to reduce the foreign currency and interest rate risk by converting cash flows back into local currency. We invest in foreign currency denominated investments to improve credit diversification and also to obtain better duration matching to our liabilities that is limited in the local currency market.
Other
Included within Other are derivatives intended to reduce potential losses which may arise from certain exposures in our insurance business. The economic benefit provided by these derivatives is similar to purchased reinsurance. For example, Chubb may enter into crop derivative contracts to protect underwriting results in the event of a significant decline in commodity prices.
(iii) Convertible security investments
A convertible security is a debt instrument or preferred stock that can be converted into a predetermined amount of the issuer’s equity. The convertible option is an embedded derivative within the host instruments which are classified in the investment portfolio as either available for sale or as an equity security. Chubb purchases convertible securities for their total return and not specifically for the conversion feature.
(iv) TBA
By acquiring TBAs, we make a commitment to purchase a future issuance of mortgage-backed securities. For the period between purchase of the TBAs and issuance of the underlying security, we account for our position as a derivative in the consolidated financial statements. Chubb purchases TBAs both for their total return and for the flexibility they provide related to our mortgage-backed security strategy.
F-81
NOTES TO CONSOLIDATED FINANCIAL STATEMENTS
(continued)
Chubb Limited and Subsidiaries
(v) GLB
Under the GLB program, as the assuming entity, Chubb is obligated to provide coverage until the expiration or maturity of the underlying deferred annuity contracts or the expiry of the reinsurance treaty. Premiums received under the reinsurance treaties are classified as premium. Expected losses allocated to premiums received are classified as Future policy benefits and valued similar to GMDB reinsurance. Other changes in fair value, principally arising from changes in expected losses allocated to expected future premiums, are classified as Net realized gains (losses). Fair value represents management’s estimate of an exit price and thus, includes a risk margin. We may recognize a realized loss for other changes in fair value due to adverse changes in the capital markets (e.g., declining interest rates and/or declining equity markets) and changes in actual or estimated future policyholder behavior (e.g., increased annuitization or decreased lapse rates) although we expect the business to be profitable. We believe this presentation provides the most meaningful disclosure of changes in the underlying risk within the GLB reinsurance programs for a given reporting period.
d) Concentrations of credit risk
Our investment portfolio is managed following prudent standards of diversification. Specific provisions limit the allowable holdings of a single issue and issuer. We believe that there are no significant concentrations of credit risk associated with our investments. Our three largest exposures by issuer at
December 31, 2017
, were Wells Fargo & Co., JP Morgan Chase & Co., and Anheuser-Busch InBev NV. Our largest exposure by industry at
December 31, 2017
was financial services.
We market our insurance and reinsurance worldwide primarily through insurance and reinsurance brokers. We assume a degree of credit risk associated with brokers with whom we transact business. No broker or one insured accounted for more than
10
percent of gross written premium for the years ended December 31, 2017, 2016, and 2015.
e) Fixed maturities
At
December 31, 2017
, we have commitments to purchase fixed income securities of
$1,020 million
over the next several years.
f) Other investments
At
December 31, 2017
, included in Other investments in the Consolidated balance sheet are investments in limited partnerships and partially-owned investment companies with a carrying value of
$3.4
billion. In connection with these investments, we have commitments that may require funding of up to
$4.1
billion over the next several years.
g) Letters of credit
On October 25, 2017, we replaced our
$1.5 billion
letter of credit/revolver facility that was set to expire in November 2017 with an amended and restated credit facility that provides for up to
$1.0 billion
of availability, all of which may be used for the issuance of letters of credit and for revolving loans. We have the ability to increase the capacity under our existing credit facility to
$2.0 billion
under certain conditions, but any such increase would not raise the sub-limit for revolving loans above
$1.0 billion
. The letter of credit facility required that we maintain certain financial covenants, all of which we met at
December 31, 2017
. At December 31, 2017, outstanding LOCs issued under this facility were
$250 million
.
h) Legal proceedings
Our insurance subsidiaries are subject to claims litigation involving disputed interpretations of policy coverages and, in some jurisdictions, direct actions by allegedly-injured persons seeking damages from policyholders. These lawsuits, involving claims on policies issued by our subsidiaries which are typical to the insurance industry in general and in the normal course of business, are considered in our loss and loss expense reserves. In addition to claims litigation, we are subject to lawsuits and regulatory actions in the normal course of business that do not arise from or directly relate to claims on insurance policies. This category of business litigation typically involves, among other things, allegations of underwriting errors or misconduct, employment claims, regulatory activity, or disputes arising from our business ventures. In the opinion of management, our ultimate liability for these matters could be, but we believe is not likely to be, material to our consolidated financial condition and results of operations.
F-82
NOTES TO CONSOLIDATED FINANCIAL STATEMENTS
(continued)
Chubb Limited and Subsidiaries
i) Lease commitments
We lease office space and equipment under operating leases which expire at various dates through 2033. Rent expense was $
211
million, $
209
million, and $
126
million for the years ended
December 31, 2017
,
2016
, and
2015
, respectively. Future minimum lease payments under the leases are expected to be as follows:
|
For the years ending December 31
|
|||
|
(in millions of U.S. dollars)
|
|||
|
2018
|
$
|
181
|
|
|
2019
|
153
|
|
|
|
2020
|
133
|
|
|
|
2021
|
114
|
|
|
|
2022
|
89
|
|
|
|
Thereafter
|
230
|
|
|
|
Total minimum future lease commitments
|
$
|
900
|
|
11
. Shareholders’ equity
a) Common Shares
All of Chubb’s Common Shares are authorized under Swiss corporate law. Though the par value of Common Shares is stated in Swiss francs, Chubb continues to use U.S. dollars as its reporting currency for preparing the consolidated financial statements. Under Swiss corporate law, we are generally prohibited from issuing Common Shares below their par value. If there were a need to raise common equity at a time when the trading price of Chubb's Common Shares is below par value, we would need in advance to obtain shareholder approval to decrease the par value of the Common Shares.
Dividend approval
At our May 2016 and 2015 annual general meetings, our shareholders approved an annual dividend for the following year of up to
$2.76
and
$2.68
per share, respectively, which was paid in four quarterly installments of
$0.69
per share and
$0.67
per share, respectively, at dates determined by the Board of Directors (Board) after the annual general meeting by way of a distribution from capital contribution reserves, transferred to free reserves for payment.
At our May 2017 annual general meeting, our shareholders approved an annual dividend for the following year of up to $
2.84
per share, expected to be paid in four quarterly installments of $
0.71
per share after the annual general meeting by way of distribution from capital contribution reserves, transferred to free reserves for payment. The Board will determine the record and payment dates at which the annual dividend may be paid until the date of the 2018 annual general meeting, and is authorized to abstain from distributing a dividend at its discretion. The first three quarterly installments each of $
0.71
per share, have been distributed by the Board as expected.
Dividend distributions
Under Swiss corporate law, dividends, including distributions through a reduction in par value (par value reduction), must be stated in Swiss francs though dividend payments are made by Chubb in U.S. dollars. Dividend distributions following Chubb's redomestication to Switzerland have generally been made by way of par value reduction (under the methods approved by our shareholders at our annual general meetings) and had the effect of reducing par value per Common Share each time a dividend was distributed. We may also issue dividends without subjecting them to withholding tax by way of distributions from capital contribution reserves and payment out of free reserves. We employed this method of dividends for the annual dividends approved in May 2015, 2016 and 2017 as noted above.
F-83
NOTES TO CONSOLIDATED FINANCIAL STATEMENTS
(continued)
Chubb Limited and Subsidiaries
The following table presents dividend distributions per Common Share in Swiss francs (CHF) and U.S. dollars (USD):
|
Year Ended December 31
|
||||||||||||||||||||
|
2017
|
|
2016
|
|
2015
|
|
|||||||||||||||
|
CHF
|
|
USD
|
|
CHF
|
|
USD
|
|
CHF
|
|
USD
|
|
|||||||||
|
Dividends - par value reduction
|
—
|
|
$
|
—
|
|
—
|
|
$
|
—
|
|
0.62
|
|
$
|
0.65
|
|
|||||
|
Dividends - distributed from capital contribution reserves
|
2.76
|
|
2.82
|
|
2.70
|
|
2.74
|
|
1.94
|
|
2.01
|
|
||||||||
|
Total dividend distributions per common share
|
2.76
|
|
$
|
2.82
|
|
2.70
|
|
$
|
2.74
|
|
2.56
|
|
$
|
2.66
|
|
|||||
b) Shares issued, outstanding, authorized, and conditional
|
Year Ended December 31
|
||||||||
|
2017
|
|
2016
|
|
2015
|
|
|||
|
Shares issued, beginning of year
|
479,783,864
|
|
342,832,412
|
|
342,832,412
|
|
||
|
Shares issued for Chubb Corp acquisition
|
—
|
|
136,951,452
|
|
—
|
|
||
|
Shares issued, end of year
|
479,783,864
|
|
479,783,864
|
|
342,832,412
|
|
||
|
Common Shares in treasury, end of year (at cost)
|
(15,950,685
|
)
|
(13,815,148
|
)
|
(18,268,971
|
)
|
||
|
Shares issued and outstanding, end of year
|
463,833,179
|
|
465,968,716
|
|
324,563,441
|
|
||
Increases in Common Shares in treasury are due to open market repurchases of Common Shares and the surrender of Common Shares to satisfy tax withholding obligations in connection with the vesting of restricted stock and the forfeiture of unvested restricted stock. Decreases in Common Shares in treasury are principally due to grants of restricted stock, exercises of stock options, and purchases under the Employee Stock Purchase Plan (ESPP).
Authorized share capital for general purposes
The Board has shareholder-approved authority as set forth in the Articles of Association to increase for general purposes Chubb's share capital from time to time until May 19, 2018, by the issuance of up to
200,000,000
fully paid up Common Shares, with a par value equal to the par value of Chubb's Common Shares as set forth in the Articles of Association at the time of any such issuance. Chubb intends to seek shareholder approval at its 2018 annual general meeting for a new pool of authorized share capital for general purposes to replace the existing
200,000,000
share pool when it expires.
Conditional share capital for bonds and similar debt instruments
Chubb's share capital may be increased through the issuance of a maximum of
33,000,000
fully paid up Common Shares (with a par value of CHF
24.15
as of December 31, 2017) through the exercise of conversion and/or option or warrant rights granted in connection with bonds, notes, or similar instruments, issued or to be issued by Chubb, including convertible debt instruments.
Conditional share capital for employee benefit plans
Chubb's share capital may be increased through the issuance of a maximum of
25,410,929
fully paid up Common Shares (with a par value of CHF
24.15
as of December 31, 2017) in connection with the exercise of option rights granted to any employee of Chubb, and any consultant, director, or other person providing services to Chubb.
c) Chubb Limited securities repurchases
From time to time, we repurchase shares as part of our capital management program and to partially offset potential dilution from the exercise of stock options and the granting of restricted stock under share-based compensation plans. Our Board of Directors has authorized share repurchase programs as follows:
|
•
|
$
1.5 billion
of Chubb Common Shares from January 1, 2015 through December 31, 2015
|
|
•
|
$
1.0 billion
of Chubb Common Shares from November 17, 2016 through December 31, 2017
|
|
•
|
$1.0 billion
of Chubb Common Shares from January 1, 2018 through December 31, 2018
|
Share repurchases may be in the open market, in privately negotiated transactions, block trades, accelerated repurchases and/or through option or other forward transactions.
F-84
NOTES TO CONSOLIDATED FINANCIAL STATEMENTS
(continued)
Chubb Limited and Subsidiaries
The following table presents repurchases of Chubb's Common Shares conducted in a series of open market transactions under the Board authorizations:
|
Year Ended December 31
|
|||||||||||
|
(in millions of U.S. dollars, except share data)
|
2017
|
|
2016
|
|
2015
|
|
|||||
|
Number of shares repurchased
|
5,866,612
|
|
—
|
|
6,677,663
|
|
|||||
|
Cost of shares repurchased
|
$
|
830
|
|
$
|
—
|
|
$
|
734
|
|
||
d) General restrictions
The holders of the Common Shares are entitled to receive dividends as approved by the shareholders. Holders of Common Shares are allowed
one
vote per share provided that, if the controlled shares of any shareholder constitute
ten percent
or more of the outstanding Common Shares of Chubb, only a fraction of the vote will be allowed so as not to exceed
ten percent
in aggregate. Entry of acquirers of Common Shares as shareholders with voting rights in the share register may be refused if it would confer voting rights with respect to
ten percent
or more of the registered share capital recorded in the commercial register.
12
. Share-based compensation
Chubb has share-based compensation plans which currently provide the Board the ability to grant awards of stock options, restricted stock, and restricted stock units to its employees, consultants, and members of the Board.
In connection with the Chubb Corp acquisition in 2016, we assumed outstanding equity awards consisting of service-based restricted stock units, performance-based restricted stock units, and stock options issued by Chubb Corp to employees and directors with a fair value of
$525 million
, of which
$323 million
is attributed to purchase consideration for the acquisition. These awards were generally granted with a 3-year vesting period, and the stock options generally have a 10-year term.
In May 2016, our shareholders approved the Chubb Limited 2016 Long-Term Incentive Plan (the 2016 LTIP), which replaced both the ACE Limited 2004 LTIP (the 2004 LTIP) and The Chubb Corporation Long-Term Incentive Plan (2014). The 2016 LTIP is substantially similar to the 2004 LTIP in its operation and the types of awards that may be granted. Under the 2016 LTIP, Common Shares of Chubb were authorized to be issued pursuant to awards made as stock options, stock appreciation rights, performance shares, performance units, restricted stock, and restricted stock units.
Chubb principally issues restricted stock grants and stock options on a graded vesting schedule. Chubb recognizes compensation cost for restricted stock and stock option grants with only service conditions that have a graded vesting schedule on a straight-line basis over the requisite service period for each separately vesting portion of the award as if the award was, in-substance, multiple awards. We incorporate an estimate of future forfeitures (
6.5
percent assumption used for grants made in 2017, 2016, and 2015) in determining compensation cost for both grants of restricted stock and stock options.
Chubb generally grants restricted stock and restricted stock units with a
4
-year vesting period, which vest in equal annual installments over the respective vesting period. The restricted stock is granted at market close price on the day of grant. Each restricted stock unit represents our obligation to deliver to the holder one Common Share upon vesting.
Under the 2016 LTIP,
19,500,000
Common Shares were authorized to be issued, in addition to any shares that have not been delivered pursuant to the 2004 LTIP and remain available for grant pursuant to the 2004 LTIP, including any shares covered by awards granted under the 2004 LTIP that are forfeited, expire or are canceled after the effective date of the 2016 LTIP without delivery of shares or which result in the forfeiture of the shares back to Chubb. At December 31, 2017, a total of
17,065,705
shares remain available for future issuance under the 2016 LTIP, which includes shares canceled or forfeited from the 2004 LTIP, in addition to common shares that were previously registered and authorized to be issued.
In May 2017, our shareholders approved an increase of
2,000,000
shares authorized to be issued under the Employee Stock Purchase Plan (ESPP), bringing the total shares authorized to
6,500,000
shares. At December 31, 2017, a total of
2,452,058
shares remain available for issuance under the ESPP.
Chubb generally issues Common Shares for the exercise of stock options, restricted stock, and purchases under the ESPP from un-issued reserved shares (conditional share capital) and Common Shares in treasury.
F-85
NOTES TO CONSOLIDATED FINANCIAL STATEMENTS
(continued)
Chubb Limited and Subsidiaries
The following table presents pre-tax and after-tax share-based compensation expense:
|
Year Ended December 31
|
|||||||||||
|
(in millions of U.S. dollars)
|
2017
|
|
2016
|
|
2015
|
|
|||||
|
Stock options and shares issued under ESPP:
|
|||||||||||
|
Pre-tax
|
$
|
41
|
|
$
|
33
|
|
$
|
31
|
|
||
|
After-tax
(1)
|
$
|
26
|
|
$
|
20
|
|
$
|
21
|
|
||
|
Restricted stock:
|
|||||||||||
|
Pre-tax
|
$
|
259
|
|
$
|
268
|
|
$
|
143
|
|
||
|
After-tax
|
$
|
151
|
|
$
|
167
|
|
$
|
84
|
|
||
|
(1)
|
Excludes windfall tax benefit for share-based compensation recognized as a direct adjustment to Additional paid-in capital of
$32 million
and
$26 million
for the years ended December 31, 2016 and 2015, respectively. Due to the adoption of new accounting guidance, windfall tax benefits for share-based compensation beginning in 2017 are recognized through Net income rather than Additional paid-in capital. The excess tax benefit recorded to Income tax expense in the Consolidated statement of operations was
$48 million
for the year ended December 31, 2017.
|
Unrecognized compensation expense related to the unvested portion of Chubb's employee share-based awards was
$345 million
at
December 31, 2017
, and is expected to be recognized over a weighted-average period of approximately
1
year.
Stock options
Both incentive and non-qualified stock options are principally granted at an option price per share equal to the grant date fair value of Chubb's Common Shares. Stock options are generally granted with a
3
-year vesting period and a
10
-year term. Stock options vest in equal annual installments over the respective vesting period, which is also the requisite service period.
Chubb's 2017 share-based compensation expense includes a portion of the cost related to the 2014 through 2017 stock option grants. Stock option fair value was estimated on the grant date using the Black-Scholes option-pricing model that uses the weighted-average assumptions noted below:
|
Year Ended December 31
|
||||||||
|
2017
|
|
2016
|
|
2015
|
|
|||
|
Dividend yield
|
2.0
|
%
|
2.3
|
%
|
2.3
|
%
|
||
|
Expected volatility
|
19.7
|
%
|
23.2
|
%
|
21.0
|
%
|
||
|
Risk-free interest rate
|
2.0
|
%
|
1.3
|
%
|
1.7
|
%
|
||
|
Expected life
|
5.8 years
|
|
5.6 years
|
|
5.8 years
|
|
||
The risk-free interest rate is based on the U.S. Treasury yield curve in effect at the time of grant. The expected life (estimated period of time from grant to exercise date) was estimated using the historical exercise behavior of employees. Expected volatility was calculated as a blend of (a) historical volatility based on daily closing prices over a period equal to the expected life assumption, (b) long-term historical volatility based on daily closing prices over the period from Chubb's initial public trading date through the most recent quarter, and (c) implied volatility derived from Chubb's publicly traded options.
F-86
NOTES TO CONSOLIDATED FINANCIAL STATEMENTS
(continued)
Chubb Limited and Subsidiaries
The following table presents a roll-forward of Chubb's stock options:
|
(Intrinsic Value in millions of U.S. dollars)
|
Number of Options
|
|
Weighted-Average Exercise Price
|
|
Weighted-Average Fair Value
|
|
Total Intrinsic Value
|
|
||||||
|
Options outstanding, December 31, 2014
|
9,623,986
|
|
$
|
69.06
|
|
|||||||||
|
Granted
|
1,892,641
|
|
$
|
114.78
|
|
$
|
18.49
|
|
||||||
|
Exercised
|
(1,457,580
|
)
|
$
|
60.88
|
|
$
|
72
|
|
||||||
|
Forfeited
|
(205,551
|
)
|
$
|
100.25
|
|
|||||||||
|
Options outstanding, December 31, 2015
|
9,853,496
|
|
$
|
78.40
|
|
|||||||||
|
Assumed in Chubb Corp Acquisition
|
339,896
|
|
$
|
77.83
|
|
$
|
36.07
|
|
||||||
|
Granted
|
1,929,616
|
|
$
|
118.39
|
|
$
|
21.52
|
|
||||||
|
Exercised
|
(1,728,949
|
)
|
$
|
66.65
|
|
$
|
99
|
|
||||||
|
Forfeited
|
(213,339
|
)
|
$
|
110.01
|
|
|||||||||
|
Options outstanding, December 31, 2016
|
10,180,720
|
|
$
|
87.29
|
|
|||||||||
|
Granted
|
2,079,522
|
|
$
|
139.00
|
|
$
|
22.97
|
|
||||||
|
Exercised
|
(1,632,629
|
)
|
$
|
73.53
|
|
$
|
111
|
|
||||||
|
Forfeited
|
(194,297
|
)
|
$
|
119.44
|
|
|||||||||
|
Options outstanding, December 31, 2017
|
10,433,316
|
|
$
|
99.20
|
|
$
|
490
|
|
||||||
|
Options exercisable, December 31, 2017
|
6,675,491
|
|
$
|
82.59
|
|
$
|
424
|
|
||||||
The weighted-average remaining contractual term was
6.2
years for stock options outstanding and
4.8
years for stock options exercisable at
December 31, 2017
. Cash received from the exercise of stock options for the year ended
December 31, 2017
was
$133 million
.
Restricted stock and restricted stock units
Grants of restricted stock and restricted stock units awarded under both the 2004 LTIP and 2016 LTIP typically have a 4-year vesting period, based on a graded vesting schedule. Chubb grants performance-based restricted stock to certain executives that vest based on tangible book value (shareholders' equity less goodwill and intangible assets, net of tax) per share growth compared to a defined group of peer companies. The performance-based stock awards comprise target awards which have four installments that vest annually based on the performance criteria, and premium awards, which are earned only if tangible book value per share growth over the cumulative 4-year period after the grant of the associated target awards exceeds a higher threshold compared to our peer group. Shares representing target awards are issued when the performance award is approved. They are subject to forfeiture if applicable performance criteria are not met. For awards granted prior to February 2014, shares representing premium awards were not issued at the time the target award was approved. Rather, they were subject to issuance following the 4-year performance period, if and to the extent the premium awards were earned. For awards granted in February 2014 and thereafter, premium awards have been issued subject to vesting if actually earned or forfeited if not earned at the end of the 4-year performance period.
The terms of performance-based restricted stock awards granted beginning in January 2017 were updated to now include a 3-year cliff vesting provision in place of the 4-year graded vesting period. In addition, these awards now include an additional vesting criteria based on the P&C combined ratio compared to a defined group of peer companies as well as an additional vesting provision based on total shareholder return (TSR) compared to a defined group of peer companies.
Chubb also grants restricted stock awards to non-management directors which vest at the following year's annual general meeting. The restricted stock is granted at market close price on the grant date. Each restricted stock unit represents our obligation to deliver to the holder one Common Share upon vesting. Chubb's 2017 share-based compensation expense includes a portion of the cost related to the restricted stock granted in the years 2013 through 2017.
F-87
NOTES TO CONSOLIDATED FINANCIAL STATEMENTS
(continued)
Chubb Limited and Subsidiaries
The following table presents a roll-forward of our restricted stock awards. Included in the roll-forward below are
22,013
restricted stock awards,
23,812
restricted stock awards, and
24,945
restricted stock awards that were granted to non-management directors during the years ended
December 31, 2017
,
2016
, and
2015
, respectively:
|
Service-based
Restricted Stock Awards and Restricted Stock Units
|
Performance-based
Restricted Stock Awards
and Restricted Stock Units
|
||||||||||||
|
Number of Shares
|
|
Weighted-Average Grant-Date Fair Value
|
|
Number of Shares
|
|
Weighted-Average Grant-Date Fair Value
|
|
||||||
|
Unvested restricted stock, December 31, 2014
|
3,837,097
|
|
$
|
83.60
|
|
378,690
|
|
$
|
90.87
|
|
|||
|
Granted
|
1,417,965
|
|
$
|
114.37
|
|
326,860
|
|
$
|
113.29
|
|
|||
|
Vested
|
(1,341,358
|
)
|
$
|
80.05
|
|
(110,340
|
)
|
$
|
98.70
|
|
|||
|
Forfeited
|
(424,535
|
)
|
$
|
87.36
|
|
—
|
|
$
|
—
|
|
|||
|
Unvested restricted stock, December 31, 2015
|
3,489,169
|
|
$
|
97.01
|
|
595,210
|
|
$
|
101.73
|
|
|||
|
Assumed in Chubb Corp Acquisition
|
3,706,639
|
|
$
|
111.02
|
|
—
|
|
$
|
—
|
|
|||
|
Granted
|
1,622,065
|
|
$
|
118.70
|
|
517,507
|
|
$
|
118.96
|
|
|||
|
Vested
|
(2,592,622
|
)
|
$
|
100.87
|
|
(181,548
|
)
|
$
|
102.43
|
|
|||
|
Forfeited
|
(420,125
|
)
|
$
|
109.42
|
|
—
|
|
$
|
—
|
|
|||
|
Unvested restricted stock, December 31, 2016
|
5,805,126
|
|
$
|
109.39
|
|
931,169
|
|
$
|
111.17
|
|
|||
|
Granted
|
1,707,094
|
|
$
|
139.18
|
|
267,282
|
|
$
|
138.90
|
|
|||
|
Vested
|
(2,646,084
|
)
|
$
|
107.73
|
|
(222,954
|
)
|
$
|
113.30
|
|
|||
|
Forfeited
|
(156,694
|
)
|
$
|
114.54
|
|
—
|
|
$
|
—
|
|
|||
|
Unvested restricted stock, December 31, 2017
|
4,709,422
|
|
$
|
121.16
|
|
975,497
|
|
$
|
118.28
|
|
|||
Prior to 2009, legacy ACE granted restricted stock units with a
1
-year vesting period to non-management directors. Delivery of Common Shares on account of these restricted stock units to non-management directors is deferred until after the date of the non-management directors' termination from the Board. Legacy Chubb Corp historically allowed directors and certain key employees of Chubb Corp and its subsidiaries to defer a portion of their compensation earned with respect to services performed in the form of deferred stock units. In addition, legacy Chubb Corp provides supplemental retirement benefits for certain employees through its Defined Contribution Excess Benefit Plan in the form of deferred shares of stock. The minimum vesting period under these legacy Chubb Corp deferred plans is 1-year and the maximum is 3-years. Employees and directors had the option to elect to receive their awards at a future specified date or upon their termination of service with Chubb. At
December 31, 2017
, there were
279,986
deferred restricted stock units.
ESPP
The ESPP gives participating employees the right to purchase Common Shares through payroll deductions during consecutive subscription periods at a purchase price of
85
percent of the fair value of a Common Share on the exercise date (Purchase Price). Annual purchases by participants are limited to the number of whole shares that can be purchased by an amount equal to
ten
percent of the participant's compensation or $
25,000
, whichever is less. The ESPP has two six-month subscription periods each year, the first of which runs between January 1 and June 30 and the second of which runs between July 1 and December 31. Legacy Chubb Corp employees were eligible to participate in the ESPP beginning in the July 1 to December 31 subscription period of 2016. The amounts collected from participants during a subscription period are used on the exercise date to purchase full shares of Common Shares. An exercise date is generally the last trading day of a subscription period. The number of shares purchased is equal to the total amount, at the exercise date, collected from the participants through payroll deductions for that subscription period, divided by the Purchase Price, rounded down to the next full share. Participants may withdraw from an offering before the exercise date and obtain a refund of amounts withheld through payroll deductions. Pursuant to the provisions of the ESPP, during the years ended December 31,
2017
,
2016
, and
2015
, employees paid
$34 million
, $
24
million, and $
18
million to purchase
271,185
shares,
211,492
shares, and
197,442
shares, respectively.
F-88
NOTES TO CONSOLIDATED FINANCIAL STATEMENTS
(continued)
Chubb Limited and Subsidiaries
13
. Postretirement benefits
Chubb provides postretirement benefits to eligible employees and their dependents through various defined contribution plans and defined benefit plans sponsored by Chubb. With the acquisition, Chubb assumed the outstanding pension and other postretirement benefit plan obligations of Chubb Corp, which consisted of several non-contributory defined benefit pension plans covering substantially all its employees, and several other postretirement benefit plans to retired employees. After the acquisition, Chubb also sponsors the defined contribution plans covering Chubb Corp employees.
Defined benefit pension plans
We maintain non-contributory defined benefit pension plans that cover certain employees located in the U.S., U.K., Canada, and various other statutorily required countries. We account for pension benefits using the accrual method. Benefits under these plans are based on employees' years of service and compensation during final years of service. All underlying plans are subject to periodic actuarial valuations by qualified actuarial firms using actuarial models to calculate the expense and liability for each plan. We use December 31 as the measurement date for our defined benefit pension plans.
Under the Chubb Corp plans, prior to 2001, benefits were generally based on an employee’s years of service and average compensation during the last five years of employment. Effective January 1, 2001, the formula for providing pension benefits was changed from the final average pay formula to a cash balance formula. Under the cash balance formula, a notional account is established for each employee, which is credited semi-annually with an amount equal to a percentage of eligible compensation based on age and years of service plus interest based on the account balance. Chubb Corp employees hired prior to 2001 will generally be eligible to receive vested benefits based on the higher of the final average pay or cash balance formulas.
Other postretirement benefit plans
We also assumed Chubb Corp other postretirement benefit plans, principally healthcare and life insurance, to retired employees, their beneficiaries, and covered dependents. Healthcare coverage is contributory. Retiree contributions vary based upon retiree’s age, type of coverage, and years of service requirements. Life insurance coverage is non-contributory. Chubb funds a portion of the healthcare benefits obligation where such funding can be accomplished on a tax-effective basis. Benefits are paid as covered expenses are incurred.
Amendments to U.S. Qualified and Excess Pension Plans and U.S. Retiree Healthcare Plan
On October 31, 2016, we harmonized and amended several of our U.S. retirement programs to create a unified retirement savings program. In 2020, we will transition from a traditional defined benefit pension program that had been in effect for certain employees to a defined contribution program. Additionally, after 2025, we plan to eliminate a subsidized U.S. retiree healthcare and life insurance plan that had been in place for certain employees. Both amendments required a remeasurement of the plan assets and benefit obligations with updated assumptions, including discount rates and the expected return on assets.
The plan amendments and related remeasurement of the obligation at October 31, 2016 resulted in a net decrease to the benefit obligations of
$496 million
as follows:
|
•
|
The amendment of the pension plan and excess pension plan resulted in a pre-tax curtailment gain of
$113 million
immediately recognized in income during the fourth quarter of 2016 as it reduced expected years of future service of active plan participants.
|
|
•
|
The amendment of the retiree healthcare plan resulted in a reduction in the obligation of
$383 million
, of which
$410 million
will be amortized as a reduction to expense over the next
4.5
years as it relates to benefits already accrued. During the fourth quarter of 2016 and for the year ended 2017, $
15 million
and
$89 million
, respectively, was amortized as a reduction to expense. Additionally, during 2017, the number of involuntary departures due to the Chubb integration met our established threshold for recognition in income. As a result, we recognized
$39 million
of accelerated amortization. At December 31, 2017, the remaining curtailment benefit balance was
$267 million
which will be amortized as a reduction to expense over the next 3.5 years.
|
F-89
NOTES TO CONSOLIDATED FINANCIAL STATEMENTS
(continued)
Chubb Limited and Subsidiaries
Obligations and funded status
The funded status of the pension and other postretirement benefit plans as well as the amounts recognized in Accumulated other comprehensive income at December 31, 2017 and 2016 was as follows:
|
Pension Benefits
|
Other Postretirement Benefits
|
||||||||||||||||||||||
|
2017
|
2016
|
2017
|
|
2016
|
|||||||||||||||||||
|
U.S. Plans
|
|
Non-U.S. Plans
|
|
U.S. Plans
|
|
Non-U.S. Plans
|
|
||||||||||||||||
|
(in millions of U.S. dollars)
|
|||||||||||||||||||||||
|
Benefit obligation, beginning of year
|
$
|
3,035
|
|
$
|
1,025
|
|
$
|
10
|
|
$
|
559
|
|
$
|
165
|
|
$
|
16
|
|
|||||
|
Acquisition of Chubb Corp
|
—
|
|
—
|
|
3,153
|
|
372
|
|
—
|
|
506
|
|
|||||||||||
|
Service cost
|
63
|
|
17
|
|
75
|
|
18
|
|
2
|
|
10
|
|
|||||||||||
|
Interest cost
|
105
|
|
27
|
|
103
|
|
30
|
|
4
|
|
17
|
|
|||||||||||
|
Actuarial loss (gain)
|
232
|
|
(4
|
)
|
131
|
|
204
|
|
(2
|
)
|
36
|
|
|||||||||||
|
Benefits paid
|
(132
|
)
|
(28
|
)
|
(79
|
)
|
(22
|
)
|
(14
|
)
|
(11
|
)
|
|||||||||||
|
Amendments
|
—
|
|
—
|
|
—
|
|
(9
|
)
|
(23
|
)
|
(410
|
)
|
|||||||||||
|
Curtailments
|
—
|
|
(32
|
)
|
(259
|
)
|
(7
|
)
|
2
|
|
—
|
|
|||||||||||
|
Settlements
|
(18
|
)
|
(8
|
)
|
(99
|
)
|
(7
|
)
|
—
|
|
—
|
|
|||||||||||
|
Foreign currency revaluation and other
|
—
|
|
80
|
|
—
|
|
(113
|
)
|
3
|
|
1
|
|
|||||||||||
|
Benefit obligation, end of year
|
$
|
3,285
|
|
$
|
1,077
|
|
$
|
3,035
|
|
$
|
1,025
|
|
$
|
137
|
|
$
|
165
|
|
|||||
|
Plan assets at fair value, beginning of year
|
$
|
2,765
|
|
$
|
962
|
|
$
|
9
|
|
$
|
564
|
|
$
|
159
|
|
$
|
—
|
|
|||||
|
Acquisition of Chubb Corp
|
—
|
|
—
|
|
2,473
|
|
315
|
|
—
|
|
138
|
|
|||||||||||
|
Actual return on plan assets
|
441
|
|
100
|
|
359
|
|
168
|
|
6
|
|
29
|
|
|||||||||||
|
Employer contributions
|
53
|
|
63
|
|
98
|
|
67
|
|
6
|
|
3
|
|
|||||||||||
|
Benefits paid
|
(132
|
)
|
(28
|
)
|
(79
|
)
|
(22
|
)
|
(14
|
)
|
(11
|
)
|
|||||||||||
|
Settlements
|
(18
|
)
|
(8
|
)
|
(95
|
)
|
(7
|
)
|
—
|
|
—
|
|
|||||||||||
|
Foreign currency revaluation and other
|
—
|
|
83
|
|
—
|
|
(123
|
)
|
—
|
|
—
|
|
|||||||||||
|
Plan assets at fair value, end of year
|
$
|
3,109
|
|
$
|
1,172
|
|
$
|
2,765
|
|
$
|
962
|
|
$
|
157
|
|
$
|
159
|
|
|||||
|
Funded status at end of year
|
$
|
(176
|
)
|
$
|
95
|
|
$
|
(270
|
)
|
$
|
(63
|
)
|
$
|
20
|
|
$
|
(6
|
)
|
|||||
|
Amounts recognized in Accumulated other comprehensive
income, not yet recognized in net periodic cost (benefit):
|
|||||||||||||||||||||||
|
Net actuarial loss (gain)
|
$
|
(227
|
)
|
$
|
82
|
|
$
|
(207
|
)
|
$
|
156
|
|
$
|
12
|
|
$
|
17
|
|
|||||
|
Prior service cost (benefit)
|
—
|
|
6
|
|
—
|
|
(2
|
)
|
(288
|
)
|
(395
|
)
|
|||||||||||
|
Total
|
$
|
(227
|
)
|
$
|
88
|
|
$
|
(207
|
)
|
$
|
154
|
|
$
|
(276
|
)
|
$
|
(378
|
)
|
|||||
The accumulated benefit obligation for the pension benefit plans was $
4.3 billion
and $
3.8 billion
at
December 31, 2017
and
2016
, respectively. The accumulated benefit obligation is the present value of pension benefits earned as of the measurement date based on employee service and compensation prior to that date. It differs from the pension benefit obligation in the table above in that the accumulated benefit obligation includes no assumptions regarding future compensation levels.
The net components of the funded status of the pension and other postretirement benefit plans are included in Accounts payable, accrued expenses, and other liabilities in the consolidated balance sheets.
Chubb’s funding policy is to contribute amounts that meet regulatory requirements plus additional amounts determined based on actuarial valuations, market conditions and other factors. All benefit plans satisfy minimum funding requirements of the Employee Retirement Income Security Act of 1974 (ERISA).
At December 31, 2017, we estimate that we will contribute $
28 million
to the pension plans and
$2 million
to the other postretirement benefits plan in 2018. The estimate is subject to change due to contribution decisions that are affected by various factors including our liquidity, market performance and management discretion.
F-90
NOTES TO CONSOLIDATED FINANCIAL STATEMENTS
(continued)
Chubb Limited and Subsidiaries
The weighted-average assumptions used to determine the projected benefit obligation were as follows:
|
Pension Benefits
|
||||||||
|
U.S. Plans
|
|
Non-U.S. Plans
|
|
Other Postretirement Benefits
|
|
|||
|
December 31, 2017
|
||||||||
|
Discount rate
|
3.59
|
%
|
2.76
|
%
|
2.77
|
%
|
||
|
Rate of compensation increase
|
4.00
|
%
|
3.46
|
%
|
N/A
|
|
||
|
December 31, 2016
|
||||||||
|
Discount rate
|
4.14
|
%
|
2.83
|
%
|
2.97
|
%
|
||
|
Rate of compensation increase
|
4.00
|
%
|
3.57
|
%
|
N/A
|
|
||
The components of net pension and other postretirement benefit costs reflected in Net income and other changes in plan assets and benefit obligations recognized in other comprehensive income were as follows:
|
Pension Benefits
|
Other Postretirement Benefits
|
||||||||||||||||||||||||||||||||||
|
U.S. Plans
|
Non-U.S. Plans
|
||||||||||||||||||||||||||||||||||
|
Year Ended December 31
|
2017
|
|
2016
|
|
2015
|
|
2017
|
|
2016
|
|
2015
|
|
2017
|
|
2016
|
|
2015
|
|
|||||||||||||||||
|
(in millions of U.S. dollars)
|
|||||||||||||||||||||||||||||||||||
|
Costs reflected in Net income:
|
|||||||||||||||||||||||||||||||||||
|
Service cost
|
$
|
63
|
|
$
|
75
|
|
$
|
—
|
|
$
|
17
|
|
$
|
18
|
|
$
|
6
|
|
$
|
2
|
|
$
|
10
|
|
$
|
1
|
|
||||||||
|
Interest cost
|
105
|
|
103
|
|
—
|
|
27
|
|
30
|
|
21
|
|
4
|
|
17
|
|
—
|
|
|||||||||||||||||
|
Expected return on plan assets
|
(189
|
)
|
(165
|
)
|
—
|
|
(42
|
)
|
(39
|
)
|
(29
|
)
|
(5
|
)
|
(8
|
)
|
—
|
|
|||||||||||||||||
|
Amortization of net actuarial loss (gain)
|
—
|
|
—
|
|
—
|
|
3
|
|
2
|
|
2
|
|
—
|
|
(1
|
)
|
(1
|
)
|
|||||||||||||||||
|
Amortization of prior service cost
|
—
|
|
—
|
|
—
|
|
—
|
|
(1
|
)
|
—
|
|
(89
|
)
|
(15
|
)
|
—
|
|
|||||||||||||||||
|
Curtailments
|
—
|
|
(117
|
)
|
—
|
|
(27
|
)
|
—
|
|
—
|
|
(37
|
)
|
—
|
|
—
|
|
|||||||||||||||||
|
Settlements
|
—
|
|
(2
|
)
|
—
|
|
—
|
|
1
|
|
1
|
|
—
|
|
—
|
|
—
|
|
|||||||||||||||||
|
Net periodic (benefit) cost
|
$
|
(21
|
)
|
$
|
(106
|
)
|
$
|
—
|
|
$
|
(22
|
)
|
$
|
11
|
|
$
|
1
|
|
$
|
(125
|
)
|
$
|
3
|
|
$
|
—
|
|
||||||||
|
Changes in plan assets and benefit obligations recognized in other comprehensive income
|
|||||||||||||||||||||||||||||||||||
|
Net actuarial loss (gain)
|
$
|
(21
|
)
|
$
|
(326
|
)
|
$
|
—
|
|
$
|
(57
|
)
|
$
|
49
|
|
$
|
(16
|
)
|
$
|
(3
|
)
|
$
|
17
|
|
$
|
—
|
|
||||||||
|
Prior service cost (benefit)
|
—
|
|
—
|
|
—
|
|
—
|
|
(8
|
)
|
1
|
|
(23
|
)
|
(395
|
)
|
—
|
|
|||||||||||||||||
|
Amortization of net actuarial loss
|
—
|
|
—
|
|
—
|
|
(3
|
)
|
—
|
|
—
|
|
—
|
|
—
|
|
—
|
|
|||||||||||||||||
|
Amortization of prior service cost
|
—
|
|
—
|
|
—
|
|
—
|
|
—
|
|
—
|
|
89
|
|
—
|
|
—
|
|
|||||||||||||||||
|
Curtailments
|
—
|
|
117
|
|
—
|
|
(6
|
)
|
—
|
|
—
|
|
39
|
|
—
|
|
—
|
|
|||||||||||||||||
|
Settlements
|
1
|
|
2
|
|
—
|
|
—
|
|
(1
|
)
|
—
|
|
—
|
|
—
|
|
—
|
|
|||||||||||||||||
|
Total (increase) decrease in other comprehensive income
|
$
|
(20
|
)
|
$
|
(207
|
)
|
$
|
—
|
|
$
|
(66
|
)
|
$
|
40
|
|
$
|
(15
|
)
|
$
|
102
|
|
$
|
(378
|
)
|
$
|
—
|
|
||||||||
The estimated net actuarial loss that will be amortized from AOCI into net periodic benefit costs in Net income for Non-U.S. pension plans during 2018 is
$1 million
. The estimated net prior service credit that will be amortized from AOCI into net periodic benefit cost in Net income during 2018 for U.S. other postretirement benefit plans is $
80 million
.
F-91
NOTES TO CONSOLIDATED FINANCIAL STATEMENTS
(continued)
Chubb Limited and Subsidiaries
The weighted-average assumptions used to determine the net periodic pension and other postretirement benefit costs were as follows:
|
Pension Benefits
|
||||||||
|
U.S. Plans
|
|
Non-U.S. Plans
|
|
Other Postretirement Benefits
|
|
|||
|
Year Ended December 31
|
||||||||
|
2017
|
||||||||
|
Discount rate in effect for determining service cost
|
4.20
|
%
|
3.55
|
%
|
2.84
|
%
|
||
|
Discount rate in effect for determining interest cost
|
3.53
|
%
|
2.61
|
%
|
2.44
|
%
|
||
|
Rate of compensation increase
|
4.00
|
%
|
3.57
|
%
|
N/A
|
|
||
|
Expected long-term rate of return on plan assets
|
7.00
|
%
|
4.23
|
%
|
3.00
|
%
|
||
|
2016
|
||||||||
|
Discount rate in effect for determining service cost
|
4.38
|
%
|
3.85
|
%
|
4.32
|
%
|
||
|
Discount rate in effect for determining interest cost
|
3.59
|
%
|
3.44
|
%
|
4.02
|
%
|
||
|
Rate of compensation increase
|
4.00
|
%
|
3.33
|
%
|
N/A
|
|
||
|
Expected long-term rate of return on plan assets
|
7.00
|
%
|
4.79
|
%
|
6.34
|
%
|
||
|
2015
|
||||||||
|
Discount rate
|
NM
|
|
3.51
|
%
|
NM
|
|
||
|
Rate of compensation increase
|
NM
|
|
3.09
|
%
|
NM
|
|
||
|
Expected long-term rate of return on plan assets
|
NM
|
|
4.81
|
%
|
NM
|
|
||
|
NM – not meaningful
|
||||||||
The weighted-average healthcare cost trend rate assumptions used to measure the expected cost of healthcare benefits were as follows:
|
U.S. Plans
|
Non-U.S. Plans
|
|||||||||||||
|
2017
|
|
2016
|
|
2015
|
|
2017
|
|
2016
|
|
|||||
|
Healthcare cost trend rate
|
7.01
|
%
|
7.28
|
%
|
6.50
|
%
|
6.61
|
%
|
6.61
|
%
|
||||
|
Rate to which the cost trend rate is assumed to decline (the ultimate trend rate)
|
4.50
|
%
|
4.50
|
%
|
4.50
|
%
|
4.50
|
%
|
4.50
|
%
|
||||
|
Year that the rate reaches the ultimate trend rate
|
2038
|
|
2038
|
|
2026
|
|
2029
|
|
2029
|
|
||||
The healthcare cost trend rate assumption has a significant effect on the amount of the accumulated other postretirement benefit obligation and the net other postretirement benefit cost reported. To illustrate, a one percent increase in the trend rate for each year would increase the accumulated other postretirement benefit obligation at
December 31, 2017
by approximately $
8 million
and the aggregate of the service and interest cost components of net other postretirement benefit cost for the year ended
December 31, 2017
by approximately $
1 million
. A one percent decrease in the trend rate for each year would decrease the accumulated other postretirement benefit obligation at
December 31, 2017
by approximately $
7 million
and the aggregate of the service and interest cost components of net other postretirement benefit cost for the year ended
December 31, 2017
by approximately $
1 million
.
F-92
NOTES TO CONSOLIDATED FINANCIAL STATEMENTS
(continued)
Chubb Limited and Subsidiaries
Plan Assets
The long term objective of the pension plan is to provide sufficient funding to cover expected benefit obligations, while assuming a prudent level of portfolio risk. The assets of the pension plan are invested, either directly or through pooled funds, in a diversified portfolio of predominately equity securities and fixed maturities. We seek to obtain a rate of return that over time equals or exceeds the returns of the broad markets in which the plan assets are invested. The target allocation of plan assets is
55
percent to
65
percent invested in equity securities (including certain other investments measured using NAV), with the remainder primarily invested in fixed maturities. We rebalance our pension assets to the target allocation as market conditions permit. We determined the expected long term rate of return assumption for each asset class based on an analysis of the historical returns and the expectations for future returns. The expected long term rate of return for the portfolio is a weighted aggregation of the expected returns for each asset class.
In order to minimize risk, the Plan maintains a listing of permissible and prohibited investments. In addition, the Plan has certain concentration limits and investment quality requirements imposed on permissible investments options. Investment risk is measured and monitored on an ongoing basis.
The following table presents the fair values of the pension plan assets, by valuation hierarchy. For additional information on how we classify these assets within the valuation hierarchy, refer to Note 4 to the Consolidated financial statements.
|
December 31, 2017
|
Pension Benefits
|
||||||||||||||
|
(in millions of U.S. dollars)
|
Level 1
|
|
Level 2
|
|
Level 3
|
|
Total
|
|
|||||||
|
U.S. Plans:
|
|||||||||||||||
|
Short-term investments
|
$
|
9
|
|
$
|
52
|
|
$
|
—
|
|
$
|
61
|
|
|||
|
U.S. Treasury and agency
|
446
|
|
79
|
|
—
|
|
525
|
|
|||||||
|
Foreign and corporate bonds
|
—
|
|
692
|
|
—
|
|
692
|
|
|||||||
|
Equity securities
|
1,154
|
|
—
|
|
—
|
|
1,154
|
|
|||||||
|
Total U.S. Plan assets
(1)
|
$
|
1,609
|
|
$
|
823
|
|
$
|
—
|
|
$
|
2,432
|
|
|||
|
Non-U.S. Plans:
|
|||||||||||||||
|
Short-term investments
|
$
|
5
|
|
$
|
—
|
|
$
|
—
|
|
$
|
5
|
|
|||
|
Foreign and corporate bonds
|
—
|
|
456
|
|
—
|
|
456
|
|
|||||||
|
Equity securities
|
122
|
|
492
|
|
—
|
|
614
|
|
|||||||
|
Total Non-U.S. Plan assets
(1)
|
$
|
127
|
|
$
|
948
|
|
$
|
—
|
|
$
|
1,075
|
|
|||
|
(1)
|
Excluded from the table above are $
677 million
and
$95 million
of other investments measured using NAV as a practical expedient related to the U.S. Plans and non-U.S. Plans respectively.
|
|
December 31, 2016
|
Pension Benefits
|
||||||||||||||
|
(in millions of U.S. dollars)
|
Level 1
|
|
Level 2
|
|
Level 3
|
|
Total
|
|
|||||||
|
U.S. Plans:
|
|||||||||||||||
|
Short-term investments
|
$
|
—
|
|
$
|
43
|
|
$
|
—
|
|
$
|
43
|
|
|||
|
U.S. Treasury and agency
|
206
|
|
112
|
|
—
|
|
318
|
|
|||||||
|
Foreign and corporate bonds
|
—
|
|
482
|
|
5
|
|
487
|
|
|||||||
|
Equity securities
|
728
|
|
—
|
|
—
|
|
728
|
|
|||||||
|
Derivative instruments
|
3
|
|
—
|
|
—
|
|
3
|
|
|||||||
|
Total U.S. Plan assets
(1)
|
$
|
937
|
|
$
|
637
|
|
$
|
5
|
|
$
|
1,579
|
|
|||
|
Non-U.S. Plans:
|
|||||||||||||||
|
Short-term investments
|
$
|
2
|
|
$
|
—
|
|
$
|
—
|
|
$
|
2
|
|
|||
|
Foreign and corporate bonds
|
—
|
|
435
|
|
—
|
|
435
|
|
|||||||
|
Equity securities
|
100
|
|
412
|
|
—
|
|
512
|
|
|||||||
|
Total Non-U.S. Plan assets
(1)
|
$
|
102
|
|
$
|
847
|
|
$
|
—
|
|
$
|
949
|
|
|||
|
(1)
|
Excluded from the table above are $
1.2 billion
and $
13 million
of other investments measured using NAV as a practical expedient related to the U.S. Plans and Non-U.S. Plans, respectively.
|
F-93
NOTES TO CONSOLIDATED FINANCIAL STATEMENTS
(continued)
Chubb Limited and Subsidiaries
We had other postretirement benefit plan assets of
$157 million
and
$159 million
at December 31, 2017 and 2016, respectively, all of which are held in equity securities and categorized as Level 1.
Assets classified within Level 3 were nil and
$5 million
at December 31, 2017 and 2016, respectively, and the change in the balance during the years ended December 31, 2017 and 2016 was insignificant.
Benefit payments were
$200 million
and
$213 million
for the years ended December 31,
2017
and
2016
, respectively. Expected future payments are as follows:
|
Pension
|
|||||||||||
|
For the years ending December 31
|
U.S. Plans
|
|
Non-U.S. Plans
|
|
Other Postretirement Benefits
|
|
|||||
|
(in millions of U.S. dollars)
|
|||||||||||
|
2018
|
$
|
129
|
|
$
|
23
|
|
$
|
17
|
|
||
|
2019
|
141
|
|
25
|
|
19
|
|
|||||
|
2020
|
148
|
|
29
|
|
20
|
|
|||||
|
2021
|
155
|
|
28
|
|
23
|
|
|||||
|
2022
|
163
|
|
27
|
|
25
|
|
|||||
|
2023-2027
|
881
|
|
159
|
|
44
|
|
|||||
Defined contribution plans (including 401(k))
Under these plans, employees' contributions may be supplemented by Chubb matching contributions based on the level of employee contribution. These contributions are invested at the election of each employee in one or more of several investment portfolios offered by a third-party investment advisor. Expenses for these plans totaled
$166 million
,
$150 million
, and
$117 million
for the years ended December 31,
2017
,
2016
, and
2015
, respectively.
14
. Other (income) expense
|
Year Ended December 31
|
|||||||||||
|
(in millions of U.S. dollars)
|
2017
|
|
2016
|
|
2015
|
|
|||||
|
Equity in net (income) loss of partially-owned entities
|
$
|
(418
|
)
|
$
|
(264
|
)
|
$
|
(113
|
)
|
||
|
(Gains) losses from fair value changes in separate account assets
(1)
|
(97
|
)
|
(11
|
)
|
19
|
|
|||||
|
One-time contribution to the Chubb Charitable Foundation
|
50
|
|
—
|
|
—
|
|
|||||
|
Federal excise and capital taxes
|
35
|
|
19
|
|
19
|
|
|||||
|
Other
|
30
|
|
34
|
|
24
|
|
|||||
|
Other (income) expense
|
$
|
(400
|
)
|
$
|
(222
|
)
|
$
|
(51
|
)
|
||
(1)
Related to (gains) losses from fair value changes in separate account assets that do not qualify for separate account reporting under GAAP.
Other (income) expense includes equity in net (income) loss of partially-owned entities, which includes our share of net (income) loss related to partially-owned investment companies (private equity) and partially-owned insurance companies. Also included in Other (income) expense are (Gains) losses from fair value changes in separate account assets that do not qualify for separate account reporting under GAAP. The offsetting movement in the separate account liabilities is included in Policy benefits in the Consolidated statements of operations. Certain federal excise and capital taxes incurred as a result of capital management initiatives are included in Other (income) expense as these are considered capital transactions and are excluded from underwriting results.
F-94
NOTES TO CONSOLIDATED FINANCIAL STATEMENTS
(continued)
Chubb Limited and Subsidiaries
15
. Segment information
Chubb operates through six business segments: North America Commercial P&C Insurance, North America Personal P&C Insurance, North America Agricultural Insurance, Overseas General Insurance, Global Reinsurance, and Life Insurance. These segments distribute their products through various forms of brokers, agencies, and direct marketing programs. All business segments have established relationships with reinsurance intermediaries.
|
•
|
The North America Commercial P&C Insurance segment includes the business written by Chubb divisions that provide property and casualty (P&C) insurance and services to large, middle market and small commercial businesses in the U.S., Canada, and Bermuda. This segment includes our retail divisions: Major Accounts, Commercial Insurance, including Small Commercial Insurance; and our wholesale and specialty divisions: Westchester and Chubb Bermuda. These divisions write a variety of coverages, including traditional commercial property, marine, general casualty, workers’ compensation, package policies, and risk management; specialty categories such as professional lines, marine, construction, environmental, medical, cyber risk, and excess casualty; as well as group accident and health (A&H) insurance.
|
|
•
|
The North America Personal P&C Insurance segment includes the business written by Chubb Personal Risk Services division, which comprises Chubb high net worth personal lines business and ACE Private Risk Services, with operations in the U.S. and Canada. This segment provides affluent and high net worth individuals and families with homeowners, automobile and collector cars, valuable articles (including fine arts), personal and excess liability, travel insurance, and recreational marine insurance and services.
|
|
•
|
The North America Agricultural Insurance segment includes the business written by Rain and Hail Insurance Service, Inc. which provides comprehensive multiple peril crop insurance (MPCI) and crop-hail insurance, and Chubb Agribusiness, which offers farm and ranch property as well as specialty P&C coverages, including commercial agriculture products.
|
|
•
|
The Overseas General Insurance segment includes the business written by two Chubb divisions that provide P&C insurance and services in the 51 countries and territories outside of North America where the company operates. Chubb International provides commercial P&C, A&H and traditional and specialty personal lines for large corporations, middle markets and small customers through retail brokers, agents and other channels locally around the world. Chubb Global Markets (CGM) provides commercial P&C excess and surplus lines and A&H through wholesale brokers in the London market and through Lloyd’s. These divisions write a variety of coverages, including traditional commercial P&C, specialty categories such as financial lines, marine, energy, aviation, political risk and construction risk, as well as group A&H and traditional and specialty personal lines.
|
|
•
|
The Global Reinsurance segment primarily includes the reinsurance business written by Chubb Tempest Re. Chubb Tempest Re provides a broad range of traditional and specialty reinsurance coverages to a diverse array of primary P&C companies.
|
|
•
|
The Life Insurance segment includes Chubb's international life operations written by Chubb Life, Chubb Tempest Life Re and the North American supplemental A&H and life business of Combined Insurance.
|
Corporate primarily includes the results of all run-off asbestos and environmental (A&E) exposures, our run-off Brandywine business, and our Westchester specialty operations for 1996 and prior years, and certain other run-off exposures. In addition, Corporate includes the results of our non-insurance companies including Chubb Limited, Chubb Group Management and Holdings Ltd., and Chubb INA Holdings Inc. Our exposure to A&E claims principally arises out of liabilities acquired when we purchased Westchester Specialty in 1998, CIGNA’s P&C business in 1999, and the Chubb Corp run-off business in 2016.
In addition, revenue and expenses managed at the corporate level, including realized gains and losses, interest expense, the non-operating income of our partially-owned entities, and income taxes are reported within Corporate. Chubb integration expenses and other merger-related expenses (both included in Chubb integration expenses in the Consolidated statements of operations), and the one-time benefit recorded in 2016 related to the harmonization of our U.S. pension plans, are also reported within Corporate. Chubb integration expenses are one-time costs that are directly attributable to the achievement of the annualized savings, including employee severance, third-party consulting fees, and systems integration expenses. Other merger-related expenses are one-time costs directly attributable to the merger, including rebranding, employee retention costs and other professional and legal fees related to the Chubb Corp acquisition. These items will not be allocated to the segment level as they are one-time in nature and are not related to the ongoing business activities of the segment. The Chief Executive Officer does not manage segment results or allocate resources to segments when considering these costs and they are therefore
F-95
NOTES TO CONSOLIDATED FINANCIAL STATEMENTS
(continued)
Chubb Limited and Subsidiaries
excluded from our definition of segment income. Therefore, segment income will only include underwriting income, net investment income, and other operating income and expense items such as each segment's share of the operating income (loss) related to partially-owned entities and miscellaneous income and expense items for which the segments are held accountable. Segment income also includes amortization of purchased intangibles related to business combination intangible assets acquired by the segment and other purchase accounting related intangible assets, including agency relationships, renewal rights, and client lists. The amortization of intangible assets purchased as part of the Chubb Corp acquisition is considered a Corporate cost as these are incurred by the overall company. We determined that this definition of segment income is appropriate and aligns with how the business is managed. As we progress through the integration and refine our processes as our business continues to evolve, we will evaluate and may further refine our segments and segment income measures.
For segment reporting purposes, certain items are presented in a different manner below than in the consolidated financial statements. Management uses underwriting income as the main measures of segment performance. Chubb calculates underwriting income by subtracting Losses and loss expenses, Policy benefits, Policy acquisition costs, and Administrative expenses from Net premiums earned. To calculate segment income, include Net investment income, Other (income) expense, and Amortization of purchased intangibles. For the North America Agricultural Insurance segment, management includes gains and losses on crop derivatives as a component of underwriting income. For example, for the year ended December 31, 2017, underwriting income in our North America Agricultural Insurance segment was $
392 million
. This amount includes $
7 million
of realized losses related to crop derivatives which are reported in Net realized gains (losses) in the Corporate column below.
For the Life Insurance segment, management includes Net investment income and (Gains) losses from fair value changes in separate account assets that do not qualify for separate account reporting under GAAP as components of Life Insurance underwriting income. For example, for the year ended December 31, 2017, Life Insurance underwriting income of $
263 million
includes Net investment income of $
313 million
and gains from fair value changes in separate account assets of $
97 million
. The gains from fair value changes in separate account assets are reported in Other (income) expense in the table below.
The following tables present the Statement of Operations by segment:
|
For the Year Ended December 31, 2017 (in millions of U.S. dollars)
|
North America Commercial P&C Insurance
|
|
North America Personal P&C Insurance
|
|
North America Agricultural Insurance
|
|
Overseas General Insurance
|
|
Global
Reinsurance
|
|
Life Insurance
|
|
Corporate
|
|
Chubb
Consolidated
|
|
|||||||||||||||
|
Net premiums written
|
$
|
12,028
|
|
$
|
4,533
|
|
$
|
1,516
|
|
$
|
8,341
|
|
$
|
685
|
|
$
|
2,141
|
|
$
|
—
|
|
$
|
29,244
|
|
|||||||
|
Net premiums earned
|
12,191
|
|
4,399
|
|
1,508
|
|
8,131
|
|
704
|
|
2,101
|
|
—
|
|
29,034
|
|
|||||||||||||||
|
Losses and loss expenses
|
8,287
|
|
3,265
|
|
1,036
|
|
4,281
|
|
561
|
|
739
|
|
285
|
|
18,454
|
|
|||||||||||||||
|
Policy benefits
|
—
|
|
—
|
|
—
|
|
—
|
|
—
|
|
676
|
|
—
|
|
676
|
|
|||||||||||||||
|
Policy acquisition costs
|
1,873
|
|
899
|
|
81
|
|
2,221
|
|
177
|
|
530
|
|
—
|
|
5,781
|
|
|||||||||||||||
|
Administrative expenses
|
981
|
|
264
|
|
(8
|
)
|
982
|
|
44
|
|
303
|
|
267
|
|
2,833
|
|
|||||||||||||||
|
Underwriting income (loss)
|
1,050
|
|
(29
|
)
|
399
|
|
647
|
|
(78
|
)
|
(147
|
)
|
(552
|
)
|
1,290
|
|
|||||||||||||||
|
Net investment income
|
1,961
|
|
226
|
|
25
|
|
610
|
|
273
|
|
313
|
|
(283
|
)
|
3,125
|
|
|||||||||||||||
|
Other (income) expense
|
1
|
|
4
|
|
2
|
|
(4
|
)
|
(1
|
)
|
(84
|
)
|
(318
|
)
|
(400
|
)
|
|||||||||||||||
|
Amortization expense of purchased intangibles
|
—
|
|
16
|
|
29
|
|
45
|
|
—
|
|
2
|
|
168
|
|
260
|
|
|||||||||||||||
|
Segment income (loss)
|
3,010
|
|
177
|
|
393
|
|
1,216
|
|
196
|
|
248
|
|
(685
|
)
|
4,555
|
|
|||||||||||||||
|
Net realized gains (losses) including OTTI
|
84
|
|
84
|
|
|||||||||||||||||||||||||||
|
Interest expense
|
607
|
|
607
|
|
|||||||||||||||||||||||||||
|
Chubb integration expenses
|
310
|
|
310
|
|
|||||||||||||||||||||||||||
|
Income tax benefit
|
(139
|
)
|
(139
|
)
|
|||||||||||||||||||||||||||
|
Net income (loss)
|
|
|
|
|
|
|
|
|
|
|
|
|
$
|
(1,379
|
)
|
$
|
3,861
|
|
|||||||||||||
F-96
NOTES TO CONSOLIDATED FINANCIAL STATEMENTS
(continued)
Chubb Limited and Subsidiaries
|
For the Year Ended December 31, 2016 (in millions of U.S. dollars)
|
North America Commercial P&C Insurance
|
|
North America Personal P&C Insurance
|
|
North America Agricultural Insurance
|
|
Overseas General Insurance
|
|
Global
Reinsurance |
|
Life Insurance
|
|
Corporate
|
|
Chubb
Consolidated |
|
|||||||||||||||
|
Net premiums written
|
$
|
11,740
|
|
$
|
4,153
|
|
$
|
1,328
|
|
$
|
8,124
|
|
$
|
676
|
|
$
|
2,124
|
|
$
|
—
|
|
$
|
28,145
|
|
|||||||
|
Net premiums earned
|
12,217
|
|
4,319
|
|
1,316
|
|
8,132
|
|
710
|
|
2,055
|
|
—
|
|
28,749
|
|
|||||||||||||||
|
Losses and loss expenses
|
7,439
|
|
2,558
|
|
893
|
|
4,005
|
|
325
|
|
663
|
|
169
|
|
16,052
|
|
|||||||||||||||
|
Policy benefits
|
—
|
|
—
|
|
—
|
|
—
|
|
—
|
|
588
|
|
—
|
|
588
|
|
|||||||||||||||
|
Policy acquisition costs
|
2,023
|
|
966
|
|
83
|
|
2,136
|
|
187
|
|
509
|
|
—
|
|
5,904
|
|
|||||||||||||||
|
Administrative expenses
|
1,125
|
|
363
|
|
(6
|
)
|
1,057
|
|
52
|
|
307
|
|
183
|
|
3,081
|
|
|||||||||||||||
|
Underwriting income (loss)
|
1,630
|
|
432
|
|
346
|
|
934
|
|
146
|
|
(12
|
)
|
(352
|
)
|
3,124
|
|
|||||||||||||||
|
Net investment income
|
1,860
|
|
207
|
|
20
|
|
600
|
|
263
|
|
283
|
|
(368
|
)
|
2,865
|
|
|||||||||||||||
|
Other (income) expense
|
(2
|
)
|
6
|
|
1
|
|
(11
|
)
|
(4
|
)
|
5
|
|
(217
|
)
|
(222
|
)
|
|||||||||||||||
|
Amortization expense (benefit) of purchased intangibles
|
—
|
|
19
|
|
29
|
|
48
|
|
—
|
|
3
|
|
(80
|
)
|
19
|
|
|||||||||||||||
|
Segment income (loss)
|
3,492
|
|
614
|
|
336
|
|
1,497
|
|
413
|
|
263
|
|
(423
|
)
|
6,192
|
|
|||||||||||||||
|
Net realized gains (losses) including OTTI
|
|
|
(145
|
)
|
(145
|
)
|
|||||||||||||||||||||||||
|
Interest expense
|
605
|
|
605
|
|
|||||||||||||||||||||||||||
|
Chubb integration expense
|
492
|
|
492
|
|
|||||||||||||||||||||||||||
|
Income tax expense
|
815
|
|
815
|
|
|||||||||||||||||||||||||||
|
Net income (loss)
|
|
|
|
|
|
|
|
|
|
|
|
|
$
|
(2,480
|
)
|
$
|
4,135
|
|
|||||||||||||
|
For the Year Ended December 31, 2015 (in millions of U.S. dollars)
|
North America Commercial P&C Insurance
|
|
North America Personal P&C Insurance
|
|
North America Agricultural Insurance
|
|
Overseas General Insurance
|
|
Global
Reinsurance
|
|
Life Insurance
|
|
Corporate
|
|
Chubb
Consolidated
|
|
|||||||||||||||
|
Net premiums written
|
$
|
5,715
|
|
$
|
1,192
|
|
$
|
1,346
|
|
$
|
6,634
|
|
$
|
828
|
|
$
|
1,998
|
|
$
|
—
|
|
$
|
17,713
|
|
|||||||
|
Net premiums earned
|
5,634
|
|
948
|
|
1,364
|
|
6,471
|
|
849
|
|
1,947
|
|
—
|
|
17,213
|
|
|||||||||||||||
|
Losses and loss expenses
|
3,661
|
|
590
|
|
1,088
|
|
3,052
|
|
290
|
|
601
|
|
202
|
|
9,484
|
|
|||||||||||||||
|
Policy benefits
|
—
|
|
—
|
|
—
|
|
—
|
|
—
|
|
543
|
|
—
|
|
543
|
|
|||||||||||||||
|
Policy acquisition costs
|
531
|
|
69
|
|
69
|
|
1,581
|
|
214
|
|
476
|
|
1
|
|
2,941
|
|
|||||||||||||||
|
Administrative expenses
|
621
|
|
123
|
|
1
|
|
997
|
|
49
|
|
291
|
|
188
|
|
2,270
|
|
|||||||||||||||
|
Underwriting income (loss)
|
821
|
|
166
|
|
206
|
|
841
|
|
296
|
|
36
|
|
(391
|
)
|
1,975
|
|
|||||||||||||||
|
Net investment income
|
1,032
|
|
25
|
|
23
|
|
534
|
|
300
|
|
265
|
|
15
|
|
2,194
|
|
|||||||||||||||
|
Other (income) expense
|
(7
|
)
|
2
|
|
1
|
|
(17
|
)
|
(6
|
)
|
23
|
|
(47
|
)
|
(51
|
)
|
|||||||||||||||
|
Amortization expense of purchased intangibles
|
—
|
|
78
|
|
30
|
|
61
|
|
—
|
|
2
|
|
—
|
|
171
|
|
|||||||||||||||
|
Segment income (loss)
|
1,860
|
|
111
|
|
198
|
|
1,331
|
|
602
|
|
276
|
|
(329
|
)
|
4,049
|
|
|||||||||||||||
|
Net realized gains (losses) including OTTI
|
|
|
|
|
|
|
|
|
|
|
(420
|
)
|
(420
|
)
|
|||||||||||||||||
|
Interest expense
|
|
|
|
|
|
|
|
|
|
|
300
|
|
300
|
|
|||||||||||||||||
|
Chubb Integration Expense
|
33
|
|
33
|
|
|||||||||||||||||||||||||||
|
Income tax expense
|
462
|
|
462
|
|
|||||||||||||||||||||||||||
|
Net income (loss)
|
|
|
|
|
|
|
$
|
(1,544
|
)
|
$
|
2,834
|
|
|||||||||||||||||||
Underwriting assets are reviewed in total by management for purposes of decision-making. Other than Unpaid losses and loss expenses, Reinsurance recoverables, Goodwill and Other intangible assets, Chubb does not allocate assets to its segments.
F-97
NOTES TO CONSOLIDATED FINANCIAL STATEMENTS
(continued)
Chubb Limited and Subsidiaries
The following table presents net premiums earned for each segment by line of business:
|
For the Year Ended December 31
|
|||||||||||
|
(in millions of U.S. dollars)
|
2017
|
|
2016
|
|
2015
|
|
|||||
|
North America Commercial P&C Insurance
|
|||||||||||
|
Property & other short-tail lines
|
$
|
1,899
|
|
$
|
1,963
|
|
$
|
1,040
|
|
||
|
Casualty & all other
|
9,554
|
|
9,552
|
|
4,175
|
|
|||||
|
A&H
|
738
|
|
702
|
|
419
|
|
|||||
|
Total North America Commercial P&C Insurance
|
12,191
|
|
12,217
|
|
5,634
|
|
|||||
|
North America Personal P&C Insurance
|
|||||||||||
|
Personal automobile
|
742
|
|
699
|
|
186
|
|
|||||
|
Personal homeowners
|
3,014
|
|
3,007
|
|
579
|
|
|||||
|
Personal other
|
643
|
|
613
|
|
183
|
|
|||||
|
Total North America Personal P&C Insurance
|
4,399
|
|
4,319
|
|
948
|
|
|||||
|
North America Agricultural Insurance
|
1,508
|
|
1,316
|
|
1,364
|
|
|||||
|
Overseas General Insurance
|
|||||||||||
|
Property & other short-tail lines
|
2,076
|
|
2,133
|
|
1,833
|
|
|||||
|
Casualty & all other
|
2,266
|
|
2,177
|
|
1,361
|
|
|||||
|
Personal lines
|
1,609
|
|
1,626
|
|
1,211
|
|
|||||
|
A&H
|
2,180
|
|
2,196
|
|
2,066
|
|
|||||
|
Total Overseas General Insurance
|
8,131
|
|
8,132
|
|
6,471
|
|
|||||
|
Global Reinsurance
|
|||||||||||
|
Property & other short-tail lines
|
132
|
|
118
|
|
155
|
|
|||||
|
Property catastrophe
|
198
|
|
185
|
|
219
|
|
|||||
|
Casualty & all other
|
374
|
|
407
|
|
475
|
|
|||||
|
Total Global Reinsurance
|
704
|
|
710
|
|
849
|
|
|||||
|
Life Insurance
|
|||||||||||
|
Life
|
980
|
|
1,002
|
|
931
|
|
|||||
|
A&H
|
1,121
|
|
1,053
|
|
1,016
|
|
|||||
|
Total Life Insurance
|
2,101
|
|
2,055
|
|
1,947
|
|
|||||
|
Total net premiums earned
|
$
|
29,034
|
|
$
|
28,749
|
|
$
|
17,213
|
|
||
The following table presents net premiums earned by geographic region. Allocations have been made on the basis of location of risk:
|
|
North America
|
|
Europe
(1)
|
|
Asia Pacific / Far East
|
|
Latin America
|
|
|||
|
2017
|
70
|
%
|
11
|
%
|
12
|
%
|
7
|
%
|
|||
|
2016
|
70
|
%
|
12
|
%
|
11
|
%
|
7
|
%
|
|||
|
2015
|
60
|
%
|
15
|
%
|
15
|
%
|
10
|
%
|
|||
(1)
Europe includes Eurasia and Africa region.
F-98
NOTES TO CONSOLIDATED FINANCIAL STATEMENTS
(continued)
Chubb Limited and Subsidiaries
16
. Earnings per share
|
Year Ended December 31
|
|||||||||||
|
(in millions of U.S. dollars, except share and per share data)
|
2017
|
|
2016
|
|
2015
|
|
|||||
|
Numerator:
|
|||||||||||
|
Net income
|
$
|
3,861
|
|
$
|
4,135
|
|
$
|
2,834
|
|
||
|
Denominator:
|
|||||||||||
|
Denominator for basic earnings per share:
|
|||||||||||
|
Weighted-average shares outstanding
|
467,145,716
|
|
462,519,789
|
|
325,589,361
|
|
|||||
|
Denominator for diluted earnings per share:
|
|||||||||||
|
Share-based compensation plans
|
4,051,185
|
|
3,429,610
|
|
3,246,017
|
|
|||||
|
Weighted-average shares outstanding
and assumed conversions
|
471,196,901
|
|
465,949,399
|
|
328,835,378
|
|
|||||
|
Basic earnings per share
|
$
|
8.26
|
|
$
|
8.94
|
|
$
|
8.71
|
|
||
|
Diluted earnings per share
|
$
|
8.19
|
|
$
|
8.87
|
|
$
|
8.62
|
|
||
|
Potential anti-dilutive share conversions
|
1,776,025
|
|
1,206,828
|
|
1,601,668
|
|
|||||
Excluded from weighted-average shares outstanding and assumed conversions is the impact of securities that would have been anti-dilutive during the respective years.
17
. Related party transactions
Starr Indemnity & Liability Company and its affiliates (collectively, Starr)
We have a number of agency and reinsurance agreements with Starr, the Chairman of which is related to a member of our senior management team. A number of these agreements pre-dated our acquisition of Chubb Corp; however, in connection with our acquisition of Chubb Corp on January 14, 2016, we obtained Chubb Corp’s pre-existing business with Starr, which included agency agreements and agreements in which Chubb Corp was a reinsurer to Starr. Our Board has reviewed and approved our arrangements with Starr.
We have agency, claims services and underwriting services agreements with various Starr subsidiaries. Under the agency agreements, we secure the ability to sell our insurance policies through Starr as one of our non-exclusive agents for writing policies, contracts, binders, or agreements of insurance or reinsurance. Under the claims services agreements, Starr adjusts the claims under policies and arranges for third party treaty and facultative agreements covering such policies. Under the underwriting services agreements, Starr underwrites insurance policies on our behalf and we agree to reinsure such policies to Starr under one or more quota reinsurance agreements.
Transactions generated under these agreements were as follows:
|
Year Ended December 31
|
|||||||||||
|
(in millions of U.S. dollars)
|
2017
|
|
2016
|
|
2015
|
|
|||||
|
Gross premiums written
|
$
|
464
|
|
$
|
658
|
|
$
|
305
|
|
||
|
Ceded premiums written
|
$
|
175
|
|
$
|
208
|
|
$
|
78
|
|
||
|
Commissions paid
|
$
|
101
|
|
$
|
145
|
|
$
|
60
|
|
||
|
Commissions received
|
$
|
37
|
|
$
|
56
|
|
$
|
19
|
|
||
|
Losses and loss expenses incurred
|
$
|
438
|
|
$
|
313
|
|
$
|
137
|
|
||
Certain agency agreements also contain a profit-sharing arrangement based on loss ratios, triggered if Starr underwrites a minimum of
$20 million
of annual program business net written premiums on our behalf. No profit share commission has been payable yet under this arrangement. Another agency agreement contains a profit-sharing arrangement based on the earned premiums for the business underwritten by Starr (excluding workers’ compensation) and the reinsurance recoveries associated with excess of loss reinsurance agreements placed by Starr for the business underwritten. No profit share commission under this arrangement has been payable yet.
F-99
NOTES TO CONSOLIDATED FINANCIAL STATEMENTS
(continued)
Chubb Limited and Subsidiaries
Reinsurance recoverable on losses and loss expenses due from Starr was
$557 million
and
$412 million
as of December 31, 2017 and 2016, respectively, and the amount of ceded reinsurance premium payable included in Insurance and reinsurance balances payable in the consolidated balance sheet was
$44 million
and
$72 million
, respectively.
ABR Re
We own
11.3 percent
of the common equity of ABR Reinsurance Capital Holdings Ltd. and warrants to acquire
0.5 percent
of additional equity. ABR Reinsurance Capital Holdings Ltd., is the parent company of ABR Reinsurance Ltd. (ABR Re), an independent reinsurance company. Through long-term arrangements, Chubb will be the sole source of reinsurance risks ceded to ABR Re, and BlackRock, Inc. will be ABR Re’s exclusive investment management service provider. As an investor, Chubb is expected to benefit from underwriting profit generated by ABR Re’s reinsuring a wide range of Chubb’s primary insurance business and the income and capital appreciation BlackRock, Inc. seeks to deliver through its investment management services. In addition, Chubb has entered into an arrangement with BlackRock, Inc. under which both Chubb and BlackRock, Inc. will be entitled to an equal share of the aggregate amount of certain fees, including underwriting and investment management performance related fees, in connection with their respective reinsurance and investment management arrangements with ABR Re.
ABR Re is a variable interest entity; however, Chubb is not the primary beneficiary and does not consolidate ABR Re because Chubb does not have the power to control and direct ABR Re’s most significant activities, including investing and underwriting. Our minority ownership interest is accounted for under the equity method of accounting. Chubb cedes premiums to ABR Re and recognizes the associated commissio
ns. At December 31, 2017 and 2016,
Chubb
ceded reinsurance premiums of $
342 million
and $
288 million
, respectively, and recognized ceded commissions of $
94 million
and $
66 million
, respectively. At December 31, 2017 and 2016, the amount of Reinsurance recoverable on losses and loss expenses was $
365 million
and $
148 million
, respectively, and the amount of ceded reinsurance premium payable included in Insurance and reinsurance balances payable in our Consolidated balance sheets was $
51 million
and $
53 million
, respectively.
18
. Statutory financial information
Our subsidiaries file financial statements prepared in accordance with statutory accounting practices prescribed or permitted by insurance regulators. Statutory accounting differs from GAAP in the reporting of certain reinsurance contracts, investments, subsidiaries, acquisition expenses, fixed assets, deferred income taxes, and certain other items. Some jurisdictions impose complex regulatory requirements on insurance companies while other jurisdictions impose fewer requirements. In some jurisdictions, we must obtain licenses issued by governmental authorities to conduct local insurance business. These licenses may be subject to reserves and minimum capital and solvency tests. Jurisdictions may impose fines, censure, and/or criminal sanctions for violation of regulatory requirements. The
2017
amounts below are based on estimates.
Chubb's insurance and reinsurance subsidiaries are subject to insurance laws and regulations in the jurisdictions in which they operate. These regulations include restrictions that limit the amount of dividends or other distributions, such as loans or cash advances, available to shareholders without prior approval of the local insurance regulatory authorities. The amount of dividends available to be paid in 2018 without prior approval totals
$5.8 billion
.
The statutory capital and surplus of our insurance subsidiaries met regulatory requirements for
2017
,
2016
, and
2015
. The minimum amounts of statutory capital and surplus necessary to satisfy regulatory requirements was
$23.9 billion
and $
22.2 billion
for December 31,
2017
and
2016
, respectively. These minimum regulatory capital requirements were significantly lower than the corresponding amounts required by the rating agencies which review Chubb’s insurance and reinsurance subsidiaries.
F-100
NOTES TO CONSOLIDATED FINANCIAL STATEMENTS
(continued)
Chubb Limited and Subsidiaries
The following tables present the combined statutory capital and surplus and statutory net income (loss) of our Property and casualty and Life subsidiaries:
|
December 31
|
|||||||
|
(in millions of U.S. dollars)
|
2017
|
|
2016
|
|
|||
|
Statutory capital and surplus
|
|||||||
|
Property and casualty
|
$
|
40,498
|
|
$
|
38,734
|
|
|
|
Life
|
$
|
1,507
|
|
$
|
1,225
|
|
|
|
Year Ended December 31
|
|||||||||||
|
(in millions of U.S. dollars)
|
2017
|
|
2016
|
|
2015
|
|
|||||
|
Statutory net income (loss)
|
|||||||||||
|
Property and casualty
|
$
|
8,123
|
|
$
|
6,903
|
|
$
|
2,712
|
|
||
|
Life
|
$
|
74
|
|
$
|
55
|
|
$
|
(148
|
)
|
||
Several insurance subsidiaries follow accounting practices prescribed or permitted by the jurisdiction of domicile that differ from the applicable local statutory practice. The application of prescribed or permitted accounting practices does not have a material impact on Chubb's statutory surplus and income. As prescribed by the Restructuring discussed previously in Note
7
, certain of our U.S. subsidiaries discount certain A&E liabilities, which increased statutory capital and surplus by approximately $
169 million
and
$155 million
at
December 31, 2017
and
2016
, respectively.
Federal Insurance Company (Federal), a direct subsidiary of Chubb INA Holdings Inc., has a permitted practice granted by the Indiana Department of Insurance that relates to its investments in foreign subsidiaries and affiliates. Under Statement of Statutory Accounting Principles No. 97, Investments in Subsidiary, Controlled and Affiliated Entities, A Replacement of SSAP No. 88, in order for a reporting entity to admit its investments in foreign subsidiaries and affiliates, audited financial statements of the subsidiary or affiliate must be obtained to support the carrying value. Such financial statements must be prepared in accordance with U.S. GAAP, or alternatively, in accordance with the local statutory requirements in the subsidiary’s or affiliate’s country of domicile, with an audited footnote reconciliation of net income and shareholder’s equity as reported to a U.S. GAAP basis. With the explicit permission of the Indiana Department of Insurance, Federal obtains audited financial statements for its admitted foreign subsidiaries and affiliates, which had an aggregate carrying value of $
156 million
and
$308 million
at December 31, 2017 and 2016, respectively, prepared in accordance with their respective local statutory requirements and supplemented with a separate unaudited reconciliation of shareholder’s equity as reported to a U.S. GAAP basis.
F-101
NOTES TO CONSOLIDATED FINANCIAL STATEMENTS
(continued)
Chubb Limited and Subsidiaries
19
. Information provided in connection with outstanding debt of subsidiaries
The following tables present condensed consolidating financial information at
December 31, 2017
and
December 31, 2016
, and for the years ended
December 31, 2017
,
2016
, and
2015
for Chubb Limited (Parent Guarantor) and Chubb INA Holdings Inc. (Subsidiary Issuer). The Subsidiary Issuer is an indirect 100 percent-owned subsidiary of the Parent Guarantor. The Parent Guarantor fully and unconditionally guarantees certain of the debt of the Subsidiary Issuer. Condensed consolidating financial information of the Parent Guarantor and Subsidiary Issuer are presented on the equity method of accounting. The revenues and expenses and cash flows of the subsidiaries of the Subsidiary Issuer are presented in the Other Chubb Limited Subsidiaries column on a combined basis.
Condensed Consolidating Balance Sheet at
December 31, 2017
|
(in millions of U.S. dollars)
|
Chubb Limited
(Parent
Guarantor)
|
|
Chubb INA
Holdings Inc.
(Subsidiary
Issuer)
|
|
Other Chubb
Limited
Subsidiaries
|
|
Consolidating
Adjustments and Eliminations
|
|
Chubb Limited
Consolidated
|
|
|||||||||
|
Assets
|
|||||||||||||||||||
|
Investments
|
$
|
—
|
|
$
|
168
|
|
$
|
102,276
|
|
$
|
—
|
|
$
|
102,444
|
|
||||
|
Cash
(1)
|
3
|
|
1
|
|
839
|
|
(115
|
)
|
728
|
|
|||||||||
|
Insurance and reinsurance balances receivable
|
—
|
|
—
|
|
10,820
|
|
(1,486
|
)
|
9,334
|
|
|||||||||
|
Reinsurance recoverable on losses and loss expenses
|
—
|
|
—
|
|
27,514
|
|
(12,480
|
)
|
15,034
|
|
|||||||||
|
Reinsurance recoverable on policy benefits
|
—
|
|
—
|
|
1,194
|
|
(1,010
|
)
|
184
|
|
|||||||||
|
Value of business acquired
|
—
|
|
—
|
|
326
|
|
—
|
|
326
|
|
|||||||||
|
Goodwill and other intangible assets
|
—
|
|
—
|
|
22,054
|
|
—
|
|
22,054
|
|
|||||||||
|
Investments in subsidiaries
|
41,909
|
|
51,165
|
|
—
|
|
(93,074
|
)
|
—
|
|
|||||||||
|
Due from subsidiaries and affiliates, net
|
9,639
|
|
—
|
|
—
|
|
(9,639
|
)
|
—
|
|
|||||||||
|
Other assets
|
3
|
|
287
|
|
20,701
|
|
(4,073
|
)
|
16,918
|
|
|||||||||
|
Total assets
|
$
|
51,554
|
|
$
|
51,621
|
|
$
|
185,724
|
|
$
|
(121,877
|
)
|
$
|
167,022
|
|
||||
|
Liabilities
|
|||||||||||||||||||
|
Unpaid losses and loss expenses
|
$
|
—
|
|
$
|
—
|
|
$
|
74,767
|
|
$
|
(11,588
|
)
|
$
|
63,179
|
|
||||
|
Unearned premiums
|
—
|
|
—
|
|
18,875
|
|
(3,659
|
)
|
15,216
|
|
|||||||||
|
Future policy benefits
|
—
|
|
—
|
|
6,331
|
|
(1,010
|
)
|
5,321
|
|
|||||||||
|
Due to subsidiaries and affiliates, net
|
—
|
|
9,432
|
|
207
|
|
(9,639
|
)
|
—
|
|
|||||||||
|
Affiliated notional cash pooling programs
(1)
|
—
|
|
115
|
|
—
|
|
(115
|
)
|
—
|
|
|||||||||
|
Repurchase agreements
|
—
|
|
—
|
|
1,408
|
|
—
|
|
1,408
|
|
|||||||||
|
Short-term debt
|
—
|
|
1,013
|
|
—
|
|
—
|
|
1,013
|
|
|||||||||
|
Long-term debt
|
—
|
|
11,546
|
|
10
|
|
—
|
|
11,556
|
|
|||||||||
|
Trust preferred securities
|
—
|
|
308
|
|
—
|
|
—
|
|
308
|
|
|||||||||
|
Other liabilities
|
382
|
|
1,411
|
|
18,848
|
|
(2,792
|
)
|
17,849
|
|
|||||||||
|
Total liabilities
|
382
|
|
23,825
|
|
120,446
|
|
(28,803
|
)
|
115,850
|
|
|||||||||
|
Total shareholders’ equity
|
51,172
|
|
27,796
|
|
65,278
|
|
(93,074
|
)
|
51,172
|
|
|||||||||
|
Total liabilities and shareholders’ equity
|
$
|
51,554
|
|
$
|
51,621
|
|
$
|
185,724
|
|
$
|
(121,877
|
)
|
$
|
167,022
|
|
||||
(1)
Chubb maintains two notional multicurrency cash pools (Pools) with a third-party bank. Refer to Note 1 f) for additional information. At
December 31, 2017
, the cash balance of one or more entities was negative; however, the overall Pool balances were positive.
F-102
NOTES TO CONSOLIDATED FINANCIAL STATEMENTS
(continued)
Chubb Limited and Subsidiaries
Condensed Consolidating Balance Sheet at
December 31, 2016
|
(in millions of U.S. dollars)
|
Chubb Limited
(Parent
Guarantor)
|
|
Chubb INA
Holdings Inc.
(Subsidiary
Issuer)
|
|
Other Chubb
Limited
Subsidiaries
|
|
Consolidating
Adjustments and Eliminations
|
|
Chubb Limited
Consolidated
|
|
|||||||||
|
Assets
|
|||||||||||||||||||
|
Investments
|
$
|
27
|
|
$
|
485
|
|
$
|
98,582
|
|
$
|
—
|
|
$
|
99,094
|
|
||||
|
Cash
(1)
|
1
|
|
1
|
|
1,965
|
|
(982
|
)
|
985
|
|
|||||||||
|
Insurance and reinsurance balances receivable
|
—
|
|
—
|
|
10,498
|
|
(1,528
|
)
|
8,970
|
|
|||||||||
|
Reinsurance recoverable on losses and loss expenses
|
—
|
|
—
|
|
24,496
|
|
(10,919
|
)
|
13,577
|
|
|||||||||
|
Reinsurance recoverable on policy benefits
|
—
|
|
—
|
|
1,153
|
|
(971
|
)
|
182
|
|
|||||||||
|
Value of business acquired
|
—
|
|
—
|
|
355
|
|
—
|
|
355
|
|
|||||||||
|
Goodwill and other intangible assets
|
—
|
|
—
|
|
22,095
|
|
—
|
|
22,095
|
|
|||||||||
|
Investments in subsidiaries
|
38,408
|
|
49,509
|
|
—
|
|
(87,917
|
)
|
—
|
|
|||||||||
|
Due from subsidiaries and affiliates, net
|
10,482
|
|
—
|
|
—
|
|
(10,482
|
)
|
—
|
|
|||||||||
|
Other assets
|
3
|
|
436
|
|
18,442
|
|
(4,353
|
)
|
14,528
|
|
|||||||||
|
Total assets
|
$
|
48,921
|
|
$
|
50,431
|
|
$
|
177,586
|
|
$
|
(117,152
|
)
|
$
|
159,786
|
|
||||
|
Liabilities
|
|||||||||||||||||||
|
Unpaid losses and loss expenses
|
$
|
—
|
|
$
|
—
|
|
$
|
70,683
|
|
$
|
(10,143
|
)
|
$
|
60,540
|
|
||||
|
Unearned premiums
|
—
|
|
—
|
|
18,538
|
|
(3,759
|
)
|
14,779
|
|
|||||||||
|
Future policy benefits
|
—
|
|
—
|
|
6,007
|
|
(971
|
)
|
5,036
|
|
|||||||||
|
Due to subsidiaries and affiliates, net
|
—
|
|
10,209
|
|
273
|
|
(10,482
|
)
|
—
|
|
|||||||||
|
Affiliated notional cash pooling programs
(1)
|
363
|
|
619
|
|
—
|
|
(982
|
)
|
—
|
|
|||||||||
|
Repurchase agreements
|
—
|
|
—
|
|
1,403
|
|
—
|
|
1,403
|
|
|||||||||
|
Short-term debt
|
—
|
|
500
|
|
—
|
|
—
|
|
500
|
|
|||||||||
|
Long-term debt
|
—
|
|
12,599
|
|
11
|
|
—
|
|
12,610
|
|
|||||||||
|
Trust preferred securities
|
—
|
|
308
|
|
—
|
|
—
|
|
308
|
|
|||||||||
|
Other liabilities
|
283
|
|
1,582
|
|
17,368
|
|
(2,898
|
)
|
16,335
|
|
|||||||||
|
Total liabilities
|
646
|
|
25,817
|
|
114,283
|
|
(29,235
|
)
|
111,511
|
|
|||||||||
|
Total shareholders’ equity
|
48,275
|
|
24,614
|
|
63,303
|
|
(87,917
|
)
|
48,275
|
|
|||||||||
|
Total liabilities and shareholders’ equity
|
$
|
48,921
|
|
$
|
50,431
|
|
$
|
177,586
|
|
$
|
(117,152
|
)
|
$
|
159,786
|
|
||||
|
(1)
|
Chubb maintains two notional multicurrency cash pools (Pools) with a third-party bank. Refer to Note 1 f) for additional information. At
December 31, 2016
, the cash balance of one or more entities was negative; however, the overall Pool balances were positive.
|
F-103
NOTES TO CONSOLIDATED FINANCIAL STATEMENTS
(continued)
Chubb Limited and Subsidiaries
Condensed Consolidating Statements of Operations and Comprehensive Income
|
For the Year Ended December 31, 2017
|
Chubb Limited
(Parent
Guarantor)
|
|
Chubb INA
Holdings Inc.
(Subsidiary
Issuer)
|
|
Other Chubb
Limited
Subsidiaries
|
|
Consolidating
Adjustments and Eliminations
|
|
Chubb Limited
Consolidated
|
|
|||||||||
|
(in millions of U.S. dollars)
|
|||||||||||||||||||
|
Net premiums written
|
$
|
—
|
|
$
|
—
|
|
$
|
29,244
|
|
$
|
—
|
|
$
|
29,244
|
|
||||
|
Net premiums earned
|
—
|
|
—
|
|
29,034
|
|
—
|
|
29,034
|
|
|||||||||
|
Net investment income
|
4
|
|
14
|
|
3,107
|
|
—
|
|
3,125
|
|
|||||||||
|
Equity in earnings of subsidiaries
|
3,640
|
|
2,424
|
|
—
|
|
(6,064
|
)
|
—
|
|
|||||||||
|
Net realized gains (losses) including OTTI
|
—
|
|
(25
|
)
|
109
|
|
—
|
|
84
|
|
|||||||||
|
Losses and loss expenses
|
—
|
|
—
|
|
18,454
|
|
—
|
|
18,454
|
|
|||||||||
|
Policy benefits
|
—
|
|
—
|
|
676
|
|
—
|
|
676
|
|
|||||||||
|
Policy acquisition costs and administrative expenses
|
75
|
|
40
|
|
8,499
|
|
—
|
|
8,614
|
|
|||||||||
|
Interest (income) expense
|
(332
|
)
|
847
|
|
92
|
|
—
|
|
607
|
|
|||||||||
|
Other (income) expense
|
(12
|
)
|
93
|
|
(481
|
)
|
—
|
|
(400
|
)
|
|||||||||
|
Amortization of purchased intangibles
|
—
|
|
—
|
|
260
|
|
—
|
|
260
|
|
|||||||||
|
Chubb integration expenses
|
32
|
|
69
|
|
209
|
|
—
|
|
310
|
|
|||||||||
|
Income tax expense (benefit)
|
20
|
|
(742
|
)
|
583
|
|
—
|
|
(139
|
)
|
|||||||||
|
Net income
|
$
|
3,861
|
|
$
|
2,106
|
|
$
|
3,958
|
|
$
|
(6,064
|
)
|
$
|
3,861
|
|
||||
|
Comprehensive income
|
$
|
4,718
|
|
$
|
3,075
|
|
$
|
4,430
|
|
$
|
(7,505
|
)
|
$
|
4,718
|
|
||||
Condensed Consolidating Statements of Operations and Comprehensive Income
|
For the Year Ended December 31, 2016
|
Chubb Limited
(Parent
Guarantor)
|
|
Chubb INA
Holdings Inc.
(Subsidiary
Issuer)
|
|
Other Chubb
Limited
Subsidiaries
|
|
Consolidating
Adjustments and Eliminations
|
|
Chubb Limited
Consolidated
|
|
|||||||||
|
(in millions of U.S. dollars)
|
|||||||||||||||||||
|
Net premiums written
|
$
|
—
|
|
$
|
—
|
|
$
|
28,145
|
|
$
|
—
|
|
$
|
28,145
|
|
||||
|
Net premiums earned
|
—
|
|
—
|
|
28,749
|
|
—
|
|
28,749
|
|
|||||||||
|
Net investment income
|
3
|
|
11
|
|
2,851
|
|
—
|
|
2,865
|
|
|||||||||
|
Equity in earnings of subsidiaries
|
3,901
|
|
2,555
|
|
—
|
|
(6,456
|
)
|
—
|
|
|||||||||
|
Net realized gains (losses) including OTTI
|
—
|
|
3
|
|
(148
|
)
|
—
|
|
(145
|
)
|
|||||||||
|
Losses and loss expenses
|
—
|
|
—
|
|
16,052
|
|
—
|
|
16,052
|
|
|||||||||
|
Policy benefits
|
—
|
|
—
|
|
588
|
|
—
|
|
588
|
|
|||||||||
|
Policy acquisition costs and administrative expenses
|
64
|
|
82
|
|
8,839
|
|
—
|
|
8,985
|
|
|||||||||
|
Interest (income) expense
|
(353
|
)
|
908
|
|
50
|
|
—
|
|
605
|
|
|||||||||
|
Other (income) expense
|
(25
|
)
|
35
|
|
(232
|
)
|
—
|
|
(222
|
)
|
|||||||||
|
Amortization of purchased intangibles
|
—
|
|
—
|
|
19
|
|
—
|
|
19
|
|
|||||||||
|
Chubb integration expenses
|
62
|
|
126
|
|
304
|
|
—
|
|
492
|
|
|||||||||
|
Income tax expense (benefit)
|
21
|
|
(416
|
)
|
1,210
|
|
—
|
|
815
|
|
|||||||||
|
Net income
|
$
|
4,135
|
|
$
|
1,834
|
|
$
|
4,622
|
|
$
|
(6,456
|
)
|
$
|
4,135
|
|
||||
|
Comprehensive income
|
$
|
4,556
|
|
$
|
2,001
|
|
$
|
5,045
|
|
$
|
(7,046
|
)
|
$
|
4,556
|
|
||||
F-104
NOTES TO CONSOLIDATED FINANCIAL STATEMENTS
(continued)
Chubb Limited and Subsidiaries
Condensed Consolidating Statements of Operations and Comprehensive Income (Loss)
|
For the Year Ended December 31, 2015
|
Chubb Limited
(Parent
Guarantor)
|
|
Chubb INA
Holdings Inc.
(Subsidiary
Issuer)
|
|
Other Chubb
Limited
Subsidiaries
|
|
Consolidating
Adjustments and Eliminations
|
|
Chubb Limited
Consolidated
|
|
|||||||||
|
(in millions of U.S. dollars)
|
|||||||||||||||||||
|
Net premiums written
|
$
|
—
|
|
$
|
—
|
|
$
|
17,713
|
|
$
|
—
|
|
$
|
17,713
|
|
||||
|
Net premiums earned
|
—
|
|
—
|
|
17,213
|
|
—
|
|
17,213
|
|
|||||||||
|
Net investment income
|
3
|
|
4
|
|
2,187
|
|
—
|
|
2,194
|
|
|||||||||
|
Equity in earnings of subsidiaries
|
2,673
|
|
1,038
|
|
—
|
|
(3,711
|
)
|
—
|
|
|||||||||
|
Net realized gains (losses) including OTTI
|
—
|
|
(9
|
)
|
(411
|
)
|
—
|
|
(420
|
)
|
|||||||||
|
Losses and loss expenses
|
—
|
|
—
|
|
9,484
|
|
—
|
|
9,484
|
|
|||||||||
|
Policy benefits
|
—
|
|
—
|
|
543
|
|
—
|
|
543
|
|
|||||||||
|
Policy acquisition costs and administrative expenses
|
63
|
|
28
|
|
5,120
|
|
—
|
|
5,211
|
|
|||||||||
|
Interest (income) expense
|
(32
|
)
|
302
|
|
30
|
|
—
|
|
300
|
|
|||||||||
|
Other (income) expense
|
(208
|
)
|
(4
|
)
|
161
|
|
—
|
|
(51
|
)
|
|||||||||
|
Amortization of purchased intangibles
|
—
|
|
—
|
|
171
|
|
—
|
|
171
|
|
|||||||||
|
Chubb Integration Expense
|
3
|
|
29
|
|
1
|
|
—
|
|
33
|
|
|||||||||
|
Income tax expense (benefit)
|
16
|
|
(349
|
)
|
795
|
|
—
|
|
462
|
|
|||||||||
|
Net income
|
$
|
2,834
|
|
$
|
1,027
|
|
$
|
2,684
|
|
$
|
(3,711
|
)
|
$
|
2,834
|
|
||||
|
Comprehensive income (loss)
|
$
|
908
|
|
$
|
(192
|
)
|
$
|
757
|
|
$
|
(565
|
)
|
$
|
908
|
|
||||
F-105
NOTES TO CONSOLIDATED FINANCIAL STATEMENTS
(continued)
Chubb Limited and Subsidiaries
Condensed Consolidating Statement of Cash Flows
|
For the Year Ended December 31, 2017
|
Chubb Limited
(Parent
Guarantor)
|
|
Chubb INA
Holdings Inc.
(Subsidiary
Issuer)
|
|
Other Chubb
Limited
Subsidiaries
|
|
Consolidating
Adjustments and Eliminations
|
|
Chubb Limited
Consolidated
|
|
|||||||||
|
(in millions of U.S. dollars)
|
|||||||||||||||||||
|
Net cash flows from operating activities
|
$
|
781
|
|
$
|
1,648
|
|
$
|
4,598
|
|
$
|
(2,524
|
)
|
$
|
4,503
|
|
||||
|
Cash flows from investing activities
|
|||||||||||||||||||
|
Purchases of fixed maturities available for sale
|
—
|
|
(9
|
)
|
(25,738
|
)
|
—
|
|
(25,747
|
)
|
|||||||||
|
Purchases of fixed maturities held to maturity
|
—
|
|
—
|
|
(352
|
)
|
—
|
|
(352
|
)
|
|||||||||
|
Purchases of equity securities
|
—
|
|
—
|
|
(173
|
)
|
—
|
|
(173
|
)
|
|||||||||
|
Sales of fixed maturities available for sale
|
—
|
|
99
|
|
13,156
|
|
—
|
|
13,255
|
|
|||||||||
|
Sales of equity securities
|
—
|
|
—
|
|
187
|
|
—
|
|
187
|
|
|||||||||
|
Maturities and redemptions of fixed maturities available for sale
|
—
|
|
29
|
|
10,396
|
|
—
|
|
10,425
|
|
|||||||||
|
Maturities and redemptions of fixed maturities held to maturity
|
—
|
|
—
|
|
879
|
|
—
|
|
879
|
|
|||||||||
|
Net change in short-term investments
|
—
|
|
189
|
|
(726
|
)
|
—
|
|
(537
|
)
|
|||||||||
|
Net derivative instruments settlements
|
—
|
|
(15
|
)
|
(250
|
)
|
—
|
|
(265
|
)
|
|||||||||
|
Other
|
—
|
|
(10
|
)
|
(104
|
)
|
—
|
|
(114
|
)
|
|||||||||
|
Net cash flows (used for) from investing activities
|
—
|
|
283
|
|
(2,725
|
)
|
—
|
|
(2,442
|
)
|
|||||||||
|
Cash flows from financing activities
|
|||||||||||||||||||
|
Dividends paid on Common Shares
|
(1,308
|
)
|
—
|
|
—
|
|
—
|
|
(1,308
|
)
|
|||||||||
|
Common Shares repurchased
|
—
|
|
—
|
|
(801
|
)
|
—
|
|
(801
|
)
|
|||||||||
|
Proceeds from issuance of repurchase agreements
|
—
|
|
—
|
|
2,353
|
|
—
|
|
2,353
|
|
|||||||||
|
Repayment of long-term debt
|
—
|
|
(500
|
)
|
(1
|
)
|
—
|
|
(501
|
)
|
|||||||||
|
Repayment of repurchase agreements
|
—
|
|
—
|
|
(2,348
|
)
|
—
|
|
(2,348
|
)
|
|||||||||
|
Proceeds from share-based compensation plans
|
—
|
|
—
|
|
151
|
|
—
|
|
151
|
|
|||||||||
|
Advances (to) from affiliates
|
892
|
|
(927
|
)
|
35
|
|
—
|
|
—
|
|
|||||||||
|
Dividends to parent company
|
—
|
|
—
|
|
(2,524
|
)
|
2,524
|
|
—
|
|
|||||||||
|
Net payments to affiliated notional cash pooling programs
(1)
|
(363
|
)
|
(504
|
)
|
—
|
|
867
|
|
—
|
|
|||||||||
|
Policyholder contract deposits
|
—
|
|
—
|
|
442
|
|
—
|
|
442
|
|
|||||||||
|
Policyholder contract withdrawals
|
—
|
|
—
|
|
(307
|
)
|
—
|
|
(307
|
)
|
|||||||||
|
Net cash flows used for financing activities
|
(779
|
)
|
(1,931
|
)
|
(3,000
|
)
|
3,391
|
|
(2,319
|
)
|
|||||||||
|
Effect of foreign currency rate changes on cash and cash equivalents
|
—
|
|
—
|
|
1
|
|
—
|
|
1
|
|
|||||||||
|
Net increase (decrease) in cash
|
2
|
|
—
|
|
(1,126
|
)
|
867
|
|
(257
|
)
|
|||||||||
|
Cash – beginning of year
(1)
|
1
|
|
1
|
|
1,965
|
|
(982
|
)
|
985
|
|
|||||||||
|
Cash – end of year
(1)
|
$
|
3
|
|
$
|
1
|
|
$
|
839
|
|
$
|
(115
|
)
|
$
|
728
|
|
||||
|
(1)
|
Chubb maintains two notional multi-currency cash pools (Pools) with a third-party bank. Refer to Note
1
f) for additional information. At
December 31, 2017
and
2016
, the cash balance of one or more entities was negative; however, the overall Pool balances were positive.
|
F-106
NOTES TO CONSOLIDATED FINANCIAL STATEMENTS
(continued)
Chubb Limited and Subsidiaries
Condensed Consolidating Statement of Cash Flows
|
For the Year Ended December 31, 2016
|
Chubb Limited
(Parent
Guarantor)
|
|
Chubb INA
Holdings Inc.
(Subsidiary
Issuer)
|
|
Other Chubb
Limited
Subsidiaries
|
|
Consolidating
Adjustments and Eliminations
|
|
Chubb Limited
Consolidated
|
|
|||||||||
|
(in millions of U.S. dollars)
|
|||||||||||||||||||
|
Net cash flows from operating activities
|
$
|
3,618
|
|
$
|
4,305
|
|
$
|
5,536
|
|
$
|
(8,167
|
)
|
$
|
5,292
|
|
||||
|
Cash flows from investing activities
|
|||||||||||||||||||
|
Purchases of fixed maturities available for sale
|
—
|
|
(156
|
)
|
(30,659
|
)
|
—
|
|
(30,815
|
)
|
|||||||||
|
Purchases of fixed maturities held to maturity
|
—
|
|
—
|
|
(282
|
)
|
—
|
|
(282
|
)
|
|||||||||
|
Purchases of equity securities
|
—
|
|
—
|
|
(146
|
)
|
—
|
|
(146
|
)
|
|||||||||
|
Sales of fixed maturities available for sale
|
—
|
|
66
|
|
16,611
|
|
—
|
|
16,677
|
|
|||||||||
|
Sales of equity securities
|
—
|
|
—
|
|
1,000
|
|
—
|
|
1,000
|
|
|||||||||
|
Maturities and redemptions of fixed maturities available for sale
|
—
|
|
66
|
|
9,283
|
|
—
|
|
9,349
|
|
|||||||||
|
Maturities and redemptions of fixed maturities held to maturity
|
—
|
|
—
|
|
958
|
|
—
|
|
958
|
|
|||||||||
|
Net change in short-term investments
|
—
|
|
7,943
|
|
4,407
|
|
—
|
|
12,350
|
|
|||||||||
|
Net derivative instruments settlements
|
—
|
|
(9
|
)
|
(159
|
)
|
—
|
|
(168
|
)
|
|||||||||
|
Acquisition of subsidiaries (net of cash acquired of $71)
|
—
|
|
(14,282
|
)
|
34
|
|
—
|
|
(14,248
|
)
|
|||||||||
|
Capital contribution
|
(2,330
|
)
|
(215
|
)
|
(2,330
|
)
|
4,875
|
|
—
|
|
|||||||||
|
Other
|
—
|
|
(3
|
)
|
13
|
|
—
|
|
10
|
|
|||||||||
|
Net cash flows used for investing activities
|
(2,330
|
)
|
(6,590
|
)
|
(1,270
|
)
|
4,875
|
|
(5,315
|
)
|
|||||||||
|
Cash flows from financing activities
|
|||||||||||||||||||
|
Dividends paid on Common Shares
|
(1,173
|
)
|
—
|
|
—
|
|
—
|
|
(1,173
|
)
|
|||||||||
|
Proceeds from issuance of repurchase agreements
|
—
|
|
—
|
|
2,310
|
|
—
|
|
2,310
|
|
|||||||||
|
Repayment of repurchase agreements
|
—
|
|
—
|
|
(2,311
|
)
|
—
|
|
(2,311
|
)
|
|||||||||
|
Proceeds from share-based compensation plans
|
—
|
|
—
|
|
167
|
|
—
|
|
167
|
|
|||||||||
|
Advances (to) from affiliates
|
404
|
|
(572
|
)
|
168
|
|
—
|
|
—
|
|
|||||||||
|
Dividends to parent company
|
—
|
|
—
|
|
(8,167
|
)
|
8,167
|
|
—
|
|
|||||||||
|
Capital contribution
|
—
|
|
2,330
|
|
2,545
|
|
(4,875
|
)
|
—
|
|
|||||||||
|
Net proceeds from (payments to) affiliated notional cash pooling programs
(1)
|
(519
|
)
|
530
|
|
—
|
|
(11
|
)
|
—
|
|
|||||||||
|
Policyholder contract deposits
|
—
|
|
—
|
|
522
|
|
—
|
|
522
|
|
|||||||||
|
Policyholder contract withdrawals
|
—
|
|
—
|
|
(253
|
)
|
—
|
|
(253
|
)
|
|||||||||
|
Other
|
—
|
|
(4
|
)
|
—
|
|
—
|
|
(4
|
)
|
|||||||||
|
Net cash flows (used for) from financing activities
|
(1,288
|
)
|
2,284
|
|
(5,019
|
)
|
3,281
|
|
(742
|
)
|
|||||||||
|
Effect of foreign currency rate changes on cash and cash equivalents
|
—
|
|
—
|
|
(25
|
)
|
—
|
|
(25
|
)
|
|||||||||
|
Net decrease in cash
|
—
|
|
(1
|
)
|
(778
|
)
|
(11
|
)
|
(790
|
)
|
|||||||||
|
Cash – beginning of year
(1)
|
1
|
|
2
|
|
2,743
|
|
(971
|
)
|
1,775
|
|
|||||||||
|
Cash – end of year
(1)
|
$
|
1
|
|
$
|
1
|
|
$
|
1,965
|
|
$
|
(982
|
)
|
$
|
985
|
|
||||
|
(1)
|
Chubb maintains two notional multi-currency cash pools (Pools) with a third-party bank. Refer to Note
1
f) for additional information. At
December 31, 2016
and
2015
, the cash balance of one or more entities was negative; however, the overall Pool balances were positive.
|
F-107
NOTES TO CONSOLIDATED FINANCIAL STATEMENTS
(continued)
Chubb Limited and Subsidiaries
Condensed Consolidating Statement of Cash Flows
|
For the Year Ended December 31, 2015
|
Chubb Limited
(Parent
Guarantor)
|
|
Chubb INA
Holdings Inc.
(Subsidiary
Issuer)
|
|
Other Chubb
Limited
Subsidiaries
|
|
Consolidating
Adjustments and Eliminations
|
|
Chubb Limited
Consolidated
|
|
|||||||||
|
(in millions of U.S. dollars)
|
|||||||||||||||||||
|
Net cash flows from operating activities
|
$
|
3,125
|
|
$
|
682
|
|
$
|
3,836
|
|
$
|
(3,779
|
)
|
$
|
3,864
|
|
||||
|
Cash flows from investing activities
|
|||||||||||||||||||
|
Purchases of fixed maturities available for sale
|
—
|
|
—
|
|
(16,053
|
)
|
(18
|
)
|
(16,071
|
)
|
|||||||||
|
Purchases of fixed maturities held to maturity
|
—
|
|
—
|
|
(62
|
)
|
—
|
|
(62
|
)
|
|||||||||
|
Purchases of equity securities
|
—
|
|
—
|
|
(158
|
)
|
—
|
|
(158
|
)
|
|||||||||
|
Sales of fixed maturities available for sale
|
—
|
|
—
|
|
10,814
|
|
—
|
|
10,814
|
|
|||||||||
|
Sales of equity securities
|
—
|
|
—
|
|
183
|
|
—
|
|
183
|
|
|||||||||
|
Maturities and redemptions of fixed maturities available for sale
|
—
|
|
—
|
|
6,567
|
|
—
|
|
6,567
|
|
|||||||||
|
Maturities and redemptions of fixed maturities held to maturity
|
—
|
|
—
|
|
669
|
|
—
|
|
669
|
|
|||||||||
|
Net change in short-term investments
|
—
|
|
(7,588
|
)
|
(628
|
)
|
—
|
|
(8,216
|
)
|
|||||||||
|
Net derivative instruments settlements
|
—
|
|
(9
|
)
|
(12
|
)
|
—
|
|
(21
|
)
|
|||||||||
|
Acquisition of subsidiaries (net of cash acquired of $629)
|
—
|
|
—
|
|
264
|
|
—
|
|
264
|
|
|||||||||
|
Capital contribution
|
(2,670
|
)
|
(625
|
)
|
(2,791
|
)
|
6,086
|
|
—
|
|
|||||||||
|
Other
|
—
|
|
(25
|
)
|
(256
|
)
|
18
|
|
(263
|
)
|
|||||||||
|
Net cash flows used for investing activities
|
(2,670
|
)
|
(8,247
|
)
|
(1,463
|
)
|
6,086
|
|
(6,294
|
)
|
|||||||||
|
Cash flows from financing activities
|
|||||||||||||||||||
|
Dividends paid on Common Shares
|
(862
|
)
|
—
|
|
—
|
|
—
|
|
(862
|
)
|
|||||||||
|
Common Shares repurchased
|
—
|
|
—
|
|
(758
|
)
|
—
|
|
(758
|
)
|
|||||||||
|
Proceeds from issuance of long-term debt
|
—
|
|
6,090
|
|
—
|
|
—
|
|
6,090
|
|
|||||||||
|
Proceeds from issuance of repurchase agreements
|
—
|
|
—
|
|
2,029
|
|
—
|
|
2,029
|
|
|||||||||
|
Repayment of long-term debt
|
—
|
|
(1,150
|
)
|
—
|
|
—
|
|
(1,150
|
)
|
|||||||||
|
Repayment of repurchase agreements
|
—
|
|
—
|
|
(2,027
|
)
|
—
|
|
(2,027
|
)
|
|||||||||
|
Proceeds from share-based compensation plans
|
—
|
|
—
|
|
131
|
|
—
|
|
131
|
|
|||||||||
|
Advances (to) from affiliates
|
(228
|
)
|
95
|
|
133
|
|
—
|
|
—
|
|
|||||||||
|
Dividends to parent company
|
—
|
|
—
|
|
(3,779
|
)
|
3,779
|
|
—
|
|
|||||||||
|
Capital contribution
|
—
|
|
2,791
|
|
3,295
|
|
(6,086
|
)
|
—
|
|
|||||||||
|
Net proceeds from (payments to) affiliated notional cash pooling programs
(1)
|
636
|
|
(220
|
)
|
—
|
|
(416
|
)
|
—
|
|
|||||||||
|
Policyholder contract deposits
|
—
|
|
—
|
|
503
|
|
—
|
|
503
|
|
|||||||||
|
Policyholder contract withdrawals
|
—
|
|
—
|
|
(221
|
)
|
—
|
|
(221
|
)
|
|||||||||
|
Other
|
—
|
|
(40
|
)
|
—
|
|
—
|
|
(40
|
)
|
|||||||||
|
Net cash flows (used for) from financing activities
|
(454
|
)
|
7,566
|
|
(694
|
)
|
(2,723
|
)
|
3,695
|
|
|||||||||
|
Effect of foreign currency rate changes on cash and cash equivalents
|
—
|
|
—
|
|
(145
|
)
|
—
|
|
(145
|
)
|
|||||||||
|
Net increase in cash
|
1
|
|
1
|
|
1,534
|
|
(416
|
)
|
1,120
|
|
|||||||||
|
Cash – beginning of year
(1)
|
—
|
|
1
|
|
1,209
|
|
(555
|
)
|
655
|
|
|||||||||
|
Cash – end of year
(1)
|
$
|
1
|
|
$
|
2
|
|
$
|
2,743
|
|
$
|
(971
|
)
|
$
|
1,775
|
|
||||
|
(1)
|
Chubb maintains two notional multi-currency cash pools (Pools) with a third-party bank. Refer to Note
1
f) for additional information. At December 31, 2015 and 2014, the cash balance of one or more entities was negative; however, the overall Pool balances were positive.
|
F-108
NOTES TO CONSOLIDATED FINANCIAL STATEMENTS
(continued)
Chubb Limited and Subsidiaries
20
. Condensed unaudited quarterly financial data
|
Three Months Ended
|
|||||||||||||||
|
March 31
|
|
June 30
|
|
September 30
|
|
December 31
|
|
||||||||
|
(in millions of U.S. dollars, except per share data)
|
2017
|
|
2017
|
|
2017
|
|
2017
|
|
|||||||
|
Net premiums earned
|
$
|
6,772
|
|
$
|
7,237
|
|
$
|
7,807
|
|
$
|
7,218
|
|
|||
|
Net investment income
|
745
|
|
770
|
|
813
|
|
797
|
|
|||||||
|
Net realized gains (losses) including OTTI
|
(7
|
)
|
101
|
|
(10
|
)
|
—
|
|
|||||||
|
Total revenues
|
$
|
7,510
|
|
$
|
8,108
|
|
$
|
8,610
|
|
$
|
8,015
|
|
|||
|
Losses and loss expenses
|
$
|
3,789
|
|
$
|
4,146
|
|
$
|
6,247
|
|
$
|
4,272
|
|
|||
|
Policy benefits
|
$
|
168
|
|
$
|
163
|
|
$
|
169
|
|
$
|
176
|
|
|||
|
Net income (loss)
|
$
|
1,093
|
|
$
|
1,305
|
|
$
|
(70
|
)
|
$
|
1,533
|
|
|||
|
Basic earnings (loss) per share
|
$
|
2.33
|
|
$
|
2.79
|
|
$
|
(0.15
|
)
|
$
|
3.29
|
|
|||
|
Diluted earnings (loss) per share
|
$
|
2.31
|
|
$
|
2.77
|
|
$
|
(0.15
|
)
|
$
|
3.27
|
|
|||
Net income for the three months ended September 30, 2017 included after-tax catastrophe losses of
$1.5 billion
. Net income for the three months ended December 31, 2017 included a one-time income tax transition benefit of
$450 million
related to the 2017 Tax Act. Refer to Note 8 for additional information.
|
Three Months Ended
|
|||||||||||||||
|
March 31
|
|
June 30
|
|
September 30
|
|
December 31
|
|
||||||||
|
(in millions of U.S. dollars, except per share data)
|
2016
|
|
2016
|
|
2016
|
|
2016
|
|
|||||||
|
Net premiums earned
|
$
|
6,597
|
|
$
|
7,405
|
|
$
|
7,688
|
|
$
|
7,059
|
|
|||
|
Net investment income
|
674
|
|
708
|
|
739
|
|
744
|
|
|||||||
|
Net realized gains (losses) including OTTI
|
(394
|
)
|
(216
|
)
|
100
|
|
365
|
|
|||||||
|
Total revenues
|
$
|
6,877
|
|
$
|
7,897
|
|
$
|
8,527
|
|
$
|
8,168
|
|
|||
|
Losses and loss expenses
|
$
|
3,674
|
|
$
|
4,254
|
|
$
|
4,269
|
|
$
|
3,855
|
|
|||
|
Policy benefits
|
$
|
126
|
|
$
|
146
|
|
$
|
155
|
|
$
|
161
|
|
|||
|
Net income
|
$
|
439
|
|
$
|
726
|
|
$
|
1,360
|
|
$
|
1,610
|
|
|||
|
Basic earnings per share
|
$
|
0.98
|
|
$
|
1.55
|
|
$
|
2.90
|
|
$
|
3.44
|
|
|||
|
Diluted earnings per share
|
$
|
0.97
|
|
$
|
1.54
|
|
$
|
2.88
|
|
$
|
3.41
|
|
|||
F-109
SUMMARY OF INVESTMENTS – OTHER THAN INVESTMENTS IN RELATED PARTIES
|
December 31, 2017 (in millions of U.S. dollars)
|
Cost or
Amortized Cost
|
|
Fair Value
|
|
Amount at Which Shown in the Balance Sheet
|
|
|||||
|
Fixed maturities available for sale
|
|||||||||||
|
U.S. Treasury and agency
|
$
|
3,701
|
|
$
|
3,698
|
|
$
|
3,698
|
|
||
|
Foreign
|
20,514
|
|
21,030
|
|
21,030
|
|
|||||
|
Corporate securities
|
23,453
|
|
23,996
|
|
23,996
|
|
|||||
|
Mortgage-backed securities
|
15,279
|
|
15,290
|
|
15,290
|
|
|||||
|
States, municipalities, and political subdivisions
|
14,888
|
|
14,925
|
|
14,925
|
|
|||||
|
Total fixed maturities available for sale
|
77,835
|
|
78,939
|
|
78,939
|
|
|||||
|
Fixed maturities held to maturity
|
|||||||||||
|
U.S. Treasury and agency
|
908
|
|
915
|
|
908
|
|
|||||
|
Foreign
|
1,738
|
|
1,757
|
|
1,738
|
|
|||||
|
Corporate securities
|
3,159
|
|
3,219
|
|
3,159
|
|
|||||
|
Mortgage-backed securities
|
2,724
|
|
2,742
|
|
2,724
|
|
|||||
|
States, municipalities, and political subdivisions
|
5,806
|
|
5,841
|
|
5,806
|
|
|||||
|
Total fixed maturities held to maturity
|
14,335
|
|
14,474
|
|
14,335
|
|
|||||
|
Equity securities
|
|||||||||||
|
Industrial, miscellaneous, and all other
|
737
|
|
937
|
|
937
|
|
|||||
|
Short-term investments
|
3,561
|
|
3,561
|
|
3,561
|
|
|||||
|
Other investments
(1)
|
4,331
|
|
4,586
|
|
4,586
|
|
|||||
|
Total investments - other than investments in related parties
|
$
|
100,799
|
|
$
|
102,497
|
|
$
|
102,358
|
|
||
(1)
Excludes
$86 million
of related party investments.
F-110
CONDENSED FINANCIAL INFORMATION OF REGISTRANT
BALANCE SHEETS (Parent Company Only)
|
December 31
|
|
December 31
|
|
||||
|
(in millions of U.S. dollars)
|
2017
|
|
2016
|
|
|||
|
Assets
|
|||||||
|
Investments in subsidiaries and affiliates on equity basis
|
$
|
41,909
|
|
$
|
38,408
|
|
|
|
Short-term investments
|
—
|
|
2
|
|
|||
|
Other investments, at cost
|
—
|
|
25
|
|
|||
|
Total investments
|
41,909
|
|
38,435
|
|
|||
|
Cash
|
3
|
|
1
|
|
|||
|
Due from subsidiaries and affiliates, net
|
9,639
|
|
10,482
|
|
|||
|
Other assets
|
3
|
|
3
|
|
|||
|
Total assets
|
$
|
51,554
|
|
$
|
48,921
|
|
|
|
Liabilities
|
|||||||
|
Affiliated notional cash pooling programs
(1)
|
$
|
—
|
|
$
|
363
|
|
|
|
Accounts payable, accrued expenses, and other liabilities
|
382
|
|
283
|
|
|||
|
Total liabilities
|
382
|
|
646
|
|
|||
|
Shareholders' equity
|
|||||||
|
Common Shares
|
11,121
|
|
11,121
|
|
|||
|
Common Shares in treasury
|
(1,944
|
)
|
(1,480
|
)
|
|||
|
Additional paid-in capital
|
13,978
|
|
15,335
|
|
|||
|
Retained earnings
|
27,474
|
|
23,613
|
|
|||
|
Accumulated other comprehensive income (loss)
|
543
|
|
(314
|
)
|
|||
|
Total shareholders' equity
|
51,172
|
|
48,275
|
|
|||
|
Total liabilities and shareholders' equity
|
$
|
51,554
|
|
$
|
48,921
|
|
|
|
(1)
Chubb maintains two notional multicurrency cash pools (Pools) with a third-party bank. Refer to Note 1 f) for additional information.
|
|||||||
|
The condensed financial information should be read in conjunction with the consolidated financial statements and notes thereto.
|
|||||||
F-111
CONDENSED FINANCIAL INFORMATION OF REGISTRANT
STATEMENTS OF OPERATIONS (Parent Company Only)
|
Year Ended December 31
|
|||||||||||
|
(in millions of U.S. dollars)
|
2017
|
|
2016
|
|
2015
|
|
|||||
|
Revenues
|
|||||||||||
|
Investment income, including interest income
|
$
|
336
|
|
$
|
356
|
|
$
|
35
|
|
||
|
Equity in net income of subsidiaries and affiliates
|
3,640
|
|
3,901
|
|
2,673
|
|
|||||
|
3,976
|
|
4,257
|
|
2,708
|
|
||||||
|
Expenses
|
|||||||||||
|
Administrative and other (income) expense
|
63
|
|
39
|
|
(145
|
)
|
|||||
|
Chubb integration expenses
|
32
|
|
62
|
|
3
|
|
|||||
|
Income tax expense
|
20
|
|
21
|
|
16
|
|
|||||
|
115
|
|
122
|
|
(126
|
)
|
||||||
|
Net income
|
$
|
3,861
|
|
$
|
4,135
|
|
$
|
2,834
|
|
||
|
Comprehensive income
|
$
|
4,718
|
|
$
|
4,556
|
|
$
|
908
|
|
||
|
The condensed financial information should be read in conjunction with the consolidated financial statements and notes thereto.
|
|||||||||||
F-112
CONDENSED FINANCIAL INFORMATION OF REGISTRANT
STATEMENTS OF CASH FLOWS (Parent Company Only)
|
Year Ended December 31
|
|||||||||||
|
(in millions of U.S. dollars)
|
2017
|
|
2016
|
|
2015
|
|
|||||
|
Net cash flows from operating activities
(1)
|
$
|
781
|
|
$
|
3,618
|
|
$
|
3,125
|
|
||
|
Cash flows from investing activities
|
|||||||||||
|
Capital contribution
|
—
|
|
(2,330
|
)
|
(2,670
|
)
|
|||||
|
Net cash flows used for investing activities
|
—
|
|
(2,330
|
)
|
(2,670
|
)
|
|||||
|
Cash flows from financing activities
|
|||||||||||
|
Dividends paid on Common Shares
|
(1,308
|
)
|
(1,173
|
)
|
(862
|
)
|
|||||
|
Advances (to) from affiliates
|
892
|
|
404
|
|
(228
|
)
|
|||||
|
Net proceeds from (payments to) affiliated notional cash pooling programs
(2)
|
(363
|
)
|
(519
|
)
|
636
|
|
|||||
|
Net cash flows used for financing activities
|
(779
|
)
|
(1,288
|
)
|
(454
|
)
|
|||||
|
Net increase in cash
|
2
|
|
—
|
|
1
|
|
|||||
|
Cash – beginning of year
|
1
|
|
1
|
|
—
|
|
|||||
|
Cash – end of year
|
$
|
3
|
|
$
|
1
|
|
$
|
1
|
|
||
(2)
Chubb maintains two notional multicurrency cash pools (Pools) with a third-party bank. Refer to Note 1 f) for additional information.
The condensed financial information should be read in conjunction with the consolidated financial statements and notes thereto.
F-113
SUPPLEMENTAL INFORMATION CONCERNING REINSURANCE
|
Premiums Earned
|
|||||||||||||||||||
|
For the years ended December 31, 2017, 2016, and 2015 (in millions of U.S. dollars, except for percentages)
|
Direct Amount
|
|
Ceded To Other Companies
|
|
Assumed From Other Companies
|
|
Net Amount
|
|
Percentage of Amount Assumed to Net
|
|
|||||||||
|
2017
|
|||||||||||||||||||
|
Property and Casualty
|
$
|
27,774
|
|
$
|
6,650
|
|
$
|
2,891
|
|
$
|
24,015
|
|
12
|
%
|
|||||
|
Accident and Health
|
4,167
|
|
349
|
|
221
|
|
4,039
|
|
5
|
%
|
|||||||||
|
Life
|
841
|
|
81
|
|
220
|
|
980
|
|
22
|
%
|
|||||||||
|
Total
|
$
|
32,782
|
|
$
|
7,080
|
|
$
|
3,332
|
|
$
|
29,034
|
|
11
|
%
|
|||||
|
2016
|
|||||||||||||||||||
|
Property and Casualty
|
$
|
26,919
|
|
$
|
6,407
|
|
$
|
3,284
|
|
$
|
23,796
|
|
14
|
%
|
|||||
|
Accident and Health
|
4,047
|
|
315
|
|
219
|
|
3,951
|
|
6
|
%
|
|||||||||
|
Life
|
845
|
|
84
|
|
241
|
|
1,002
|
|
24
|
%
|
|||||||||
|
Total
|
$
|
31,811
|
|
$
|
6,806
|
|
$
|
3,744
|
|
$
|
28,749
|
|
13
|
%
|
|||||
|
2015
|
|||||||||||||||||||
|
Property and Casualty
|
$
|
14,895
|
|
$
|
5,373
|
|
$
|
3,259
|
|
$
|
12,781
|
|
25
|
%
|
|||||
|
Accident and Health
|
3,684
|
|
351
|
|
168
|
|
3,501
|
|
5
|
%
|
|||||||||
|
Life
|
776
|
|
94
|
|
249
|
|
931
|
|
27
|
%
|
|||||||||
|
Total
|
$
|
19,355
|
|
$
|
5,818
|
|
$
|
3,676
|
|
$
|
17,213
|
|
21
|
%
|
|||||
F-114
SUPPLEMENTARY INFORMATION CONCERNING PROPERTY AND CASUALTY OPERATIONS
|
As of and for the years ended December 31, 2017, 2016, and 2015 (in millions of U.S. dollars)
|
|||||||||||||||||||||||||||||||||||||||||
|
Deferred Policy Acquisition Costs
|
Net Reserves for Unpaid Losses and Loss Expenses
|
|
Unearned Premiums
|
|
Net Premiums Earned
|
|
Net Investment Income
|
|
Net Losses and Loss Expenses Incurred Related to
|
Amortization of Deferred Policy Acquisition Costs
|
|
Net Paid Losses and Loss Expenses
|
|
Net Premiums Written
|
|
||||||||||||||||||||||||||
|
Current Year
|
|
Prior Year
|
|
||||||||||||||||||||||||||||||||||||||
|
2017
|
$
|
3,805
|
$
|
49,165
|
|
$
|
15,216
|
|
$
|
28,054
|
|
$
|
2,890
|
|
$
|
19,391
|
|
$
|
(937
|
)
|
$
|
5,519
|
|
$
|
17,448
|
|
$
|
28,225
|
|
||||||||||||
|
2016
|
$
|
3,537
|
$
|
47,832
|
|
$
|
14,779
|
|
$
|
27,747
|
|
$
|
2,656
|
|
$
|
17,256
|
|
$
|
(1,204
|
)
|
$
|
5,654
|
|
$
|
15,715
|
|
$
|
27,074
|
|
||||||||||||
|
2015
|
$
|
2,219
|
$
|
26,562
|
|
$
|
8,439
|
|
$
|
16,282
|
|
$
|
2,007
|
|
$
|
10,030
|
|
$
|
(546
|
)
|
$
|
2,692
|
|
$
|
9,665
|
|
$
|
16,734
|
|
||||||||||||
F-115
TABLE OF CONTENTS
Part IItem 1. BusinessNote 15 To The Consolidated Financial StatementsItem 1A. Risk FactorsItem 1B. Unresolved Staff CommentsItem 2. PropertiesItem 3. Legal ProceedingsItem 4. Mine Safety DisclosuresItem 4. Mine SafetyItem Not ApplicablePart IIItem 5. Market For Registrant's Common Equity, Related Stockholder Matters and Issuer Repurchases Of Equity SecuritiesItem 6. Selected Financial DataItem 7. Management's Discussion and Analysis Of Financial Condition and Results Of OperationsItem 7A. Quantitative and Qualitative Disclosures About Market RiskItem 8. Financial Statements and Supplementary DataItem 9. Changes in and Disagreements with Accountants on Accounting and Financial DisclosureItem 9A. Controls and ProceduresItem 9B. Other InformationPart IIIItem 10. Directors, Executive Officers and Corporate GovernanceItem 11. Executive CompensationItem 12. Security Ownership Of Certain Beneficial Owners and Management and Related Stockholder MattersItem 13. Certain Relationships and Related Transactions and Director IndependenceItem 14. Principal Accounting Fees and ServicesPart IVItem 15. Exhibits, Financial Statement SchedulesItem 16. Form 10-k Summary