Section 1: 10-K (ANNUAL REPORT)
UNITED STATES
SECURITIES AND EXCHANGE COMMISSION
Washington, D.C. 20549
FORM 10-K
ý
ANNUAL REPORT PURSUANT TO SECTION 13 OR 15(d) OF THE SECURITIES EXCHANGE ACT OF 1934
For the fiscal year ended December 31, 2018
OR
☐ TRANSITION REPORT PURSUANT TO SECTION 13 OR 15 (D) OF THE SECURITIES EXCHANGE ACT OF 1934
For the Transition Period from
to
Commission file number 001-38671
CAPITAL BANCORP, INC.
(Exact name of registrant as specified in its charter)
|
Maryland
|
52-2083046
|
|
|
(State or other jurisdiction of incorporation or organization)
|
(IRS Employer Identification No.)
|
|
|
2275 Research Boulevard, Suite 600,
Rockville, Maryland 20850
|
20850
|
|
|
(Address of principal executive offices)
|
(Zip Code)
|
|
(301) 468-8848
Registrant’s telephone number, including area code
Securities registered pursuant to Section 12(b) of the Act:
|
Common Stock, par value $0.01 per share
|
The Nasdaq Stock Market, LLC
|
|
|
(Title of Each Class)
|
(Name of Exchange on Which Registered)
|
|
Securities registered pursuant to Section 12(g) of the Act:
None
.
Indicate by check mark if the registrant is a well-known seasoned issuer, as defined in Rule 405 of the Securities Act. Yes ☐ No
ý
Indicate by check mark if the registrant is not required to file reports pursuant to Section 13 or Section 15(d) of the Act. Yes ☐ No
ý
Indicate by check mark whether the registrant (1) has filed all reports required to be filed by Section 13 or 15(d) of the Exchange Act of 1934 during the preceding 12 months (or for such shorter period that the registrant was required to file such reports), and (2) has been subject to such filing requirements for the past 90 days. Yes
ý
No ☐
Indicate by check mark whether the registrant has submitted electronically every Interactive Data File required to be submitted pursuant to Rule 405 of Regulation S-T (§232.405 of this chapter) during the preceding 12 months (or for such shorter period that the registrant was required to submit such files). Yes
ý
No ☐
Indicate by check mark if disclosure of delinquent filers pursuant to Item 405 of Regulation S-K (§ 229.405 of this chapter) is not contained herein, and will not be contained, to the best of registrant's knowledge, in definitive proxy or information statements incorporated by reference in Part III of this Form 10-K or any amendment to this Form 10-K. ☐
Indicate by check mark whether the registrant is a large accelerated filer, an accelerated filer, a non-accelerated filer, a smaller reporting company, or an emerging growth company. See definitions of “large accelerated filer,” “accelerated filer,” “smaller reporting company,” and “emerging growth company” in Rule 12b-2 of the Exchange Act.
|
Large accelerated filer
|
☐
|
Accelerated filer
|
☐
|
|
|
Non-accelerated filer
|
☐
|
(Do not check if a smaller reporting company)
|
Smaller reporting company
|
ý
|
|
Emerging growth company
|
ý
|
|||
If an emerging growth company, indicate by check mark if the registrant has elected not to use the extended transition period for complying with any new or revised financial accounting standards provided pursuant to Section 13(a) of the Exchange Act.
ý
Indicate by check mark whether the registrant is a shell company (as defined in Rule 12b-2 of the Exchange Act). Yes ☐ No
ý
At June 30, 2018 there was not a public market for the Registrant’s common stock. The aggregate market value of the voting and non-voting common equity held by non-affiliates of the Registrant as of December 31, 2018 was
$88,887,597
.
As of March 15, 2019, the Registrant had 13,711,365 shares of common stock outstanding.
DOCUMENTS INCORPORATED BY REFERENCE
The information required by Items 10, 11, 12, 13 and 14 of Part III of this Annual Report on Form 10-K will be found in the Company’s definitive proxy statement for its 2019 Annual Meeting of Stockholders, to be filed pursuant to Regulation 14A under the Securities Exchange Act of 1934, as amended, and such information is incorporated herein by this reference.
|
Capital Bancorp, Inc. and Subsidiaries
|
|
Annual Report on Form 10-K
|
|
Index
|
|
PART I
|
Page
|
|
|
Item 1.
|
Business
|
|
|
Item 1A.
|
Risk Factors
|
|
|
Item 1B.
|
Unresolved Staff Comments
|
|
|
Item 2.
|
Properties
|
|
|
Item 3.
|
Legal Proceedings
|
|
|
Item 4.
|
Mine Safety Disclosures
|
|
|
PART II
|
||
|
Item 5.
|
Market for the Registrant’s Common Equity, Related Stockholder Matters and Issuer Purchases of Equity Securities
|
|
|
Item 6
|
Selected Financial Data
|
|
|
Item 7.
|
Management’s Discussion and Analysis of Financial Condition and Results of Operations
|
|
|
Item 7A.
|
Quantitative and Qualitative Disclosures about Market Risk
|
|
|
Item 8.
|
Financial Statements and Supplementary Data
|
|
|
Item 9.
|
Changes in and Disagreements with Accountants on Accounting and Financial Disclosure
|
|
|
Item 9A.
|
Controls and Procedures
|
|
|
Item 9B.
|
Other Information
|
|
|
PART III
|
||
|
Item 10.
|
Directors, Executive Officers and Corporate Governance
|
|
|
Item 11.
|
Executive Compensation
|
|
|
Item 12.
|
Security Ownership of Certain Beneficial Owners and Management and Related Stockholder Matters
|
|
|
Item 13.
|
Certain Relationships and Related Transactions and Director Independence
|
|
|
Item 14.
|
Principal Accounting Fees and Services
|
|
|
PART IV
|
||
|
Item 15.
|
Exhibits, Financial Statement Schedules
|
|
|
SIGNATURES
|
||
|
2
|
||
CAUTIONARY NOTE REGARDING FORWARD-LOOKING STATEMENTS
This Annual Report on Form 10-K and oral statements made from time-to-time by our representatives contain “forward-looking statements” within the meaning of the Private Securities Litigation Reform Act of 1995 that are subject to risks and uncertainties. You should not place undue reliance on such statements because they are subject to numerous risks and uncertainties relating to our operations and the business environment in which we operate, all of which are difficult to predict and many of which are beyond our control. Forward-looking statements include information concerning our possible or assumed future results of operations, including descriptions of our business strategy, expectations, beliefs, projections, anticipated events or trends, growth prospects, financial performance, and similar expressions concerning matters that are not historical facts. These statements often include words such as “may,” “believe,” “expect,” “anticipate,” “potential,” “opportunity,” “intend,” “plan,” “estimate,” “could,” “project,” “seek,” “should,” “will,” or “would,” or the negative of these words and phrases or similar words and phrases.
These forward-looking statements are subject to risks and uncertainties that could cause actual results, performance or achievements to differ materially from those projected. These risks and uncertainties, some of which are beyond our control, include, but are not limited to:
|
•
|
economic conditions (including interest rate environment, government economic and monetary policies, the strength of global financial markets and inflation and deflation) that impact the financial services industry as a whole and/or our business;
|
|
•
|
the concentration of our business in the Washington, D.C. and Baltimore metropolitan areas and the effect of changes in the economic, political and environmental conditions on these markets;
|
|
•
|
our ability to prudently manage our growth and execute our strategy;
|
|
•
|
our plans to grow our commercial real estate and commercial business loan portfolios which may carry greater risks of non-payment or other unfavorable consequences;
|
•
adequacy of reserves, including our allowance for loan losses;
•
deterioration of our asset quality;
•
risks associated with our residential mortgage banking business;
|
•
|
risks associated with our OpenSky® credit card division, including compliance with applicable consumer finance and fraud prevention regulations;
|
|
•
|
results of examinations of us by our regulators, including the possibility that our regulators may, among other things, require us to increase our allowance for loan losses or to write-down assets;
|
|
•
|
the effectiveness of our internal control over financial reporting and our ability to remediate any future material weakness in our internal control over financial reporting;
|
|
•
|
changes in the value of collateral securing our loans;
|
|
•
|
our dependence on our management team and board of directors and changes in management and board composition;
|
|
•
|
liquidity risks associated with our business;
|
|
3
|
||
|
•
|
interest rate risk associated with our business, including sensitivity of our interest earning assets and interest bearing liabilities to interest rates, and the impact to our earnings from changes in interest rates;
|
|
•
|
our ability to maintain important deposit customer relationships and our reputation;
|
|
•
|
operational risks associated with our business;
|
|
•
|
strategic acquisitions we may undertake to achieve our goals;
|
|
•
|
the sufficiency of our capital, including sources of capital and the extent to which we may be required to raise additional capital to meet our goals;
|
|
•
|
fluctuations to the fair value of our investment securities that are beyond our control;
|
|
•
|
potential exposure to fraud, negligence, computer theft and cyber-crime;
|
|
•
|
the adequacy of our risk management framework;
|
|
•
|
our dependence on our information technology and telecommunications systems and the potential for any systems failures or interruptions;
|
|
•
|
our dependence upon outside third parties for the processing and handling of our records and data;
|
|
•
|
our ability to adapt to technological change;
|
|
•
|
our engagement in derivative transactions;
|
|
•
|
volatility and direction of market interest rates;
|
|
•
|
increased competition in the financial services industry, particularly from regional and national institutions;
|
|
•
|
our involvement from time to time in legal proceedings, examinations and remedial actions by regulators;
|
|
•
|
changes in the laws, rules, regulations, interpretations or policies relating to financial institution, accounting, tax, trade, monetary and fiscal matters;
|
|
•
|
the financial soundness of other financial institutions;
|
|
•
|
further government intervention in the U.S. financial system;
|
|
•
|
natural disasters and adverse weather, acts of terrorism, an outbreak of hostilities or other international or domestic calamities, and other matters beyond our control; and
|
|
•
|
other factors that are discussed in Item 1A. Risk Factors.
|
As you read and consider forward-looking statements, you should understand that these statements are not guarantees of performance or results. They involve risks, uncertainties and assumptions and can change as a result of many possible events or factors, not all of which are known to us or in our control. Although we believe that these forward-looking statements are based on reasonable assumptions, beliefs, and expectations, if a change occurs or our beliefs, assumptions, or expectations were incorrect, our business, financial condition, liquidity or results of operations may vary materially from those expressed in our forward-
|
4
|
||
looking statements. You should be aware that many factors could affect our actual financial results or results of operations and could cause actual results to differ materially from those in the forward-looking statements. These factors include those described under Item 1A. hereunder. You should keep in mind that any forward-looking statement made by us speaks only as of the date on which we make it. New risks and uncertainties arise from time to time, and it is impossible for us to predict these events or how they may affect us. We have no duty to, and do not intend to, and disclaim any obligation to, update or revise any industry information or forward-looking statements after the date on which they are made. In light of these risks and uncertainties, you should keep in mind that any forward-looking statement made in this document or elsewhere might not reflect actual results.
PART I
ITEM 1. BUSINESS
We are Capital Bancorp, Inc., a bank holding company and a Maryland corporation, operating primarily through our wholly owned subsidiary, Capital Bank, N.A., a commercial-focused community bank based in the Washington, D.C. and Baltimore metropolitan areas. We serve businesses, not-for-profit associations and entrepreneurs throughout the region. Capital Bank is headquartered in Rockville, Maryland and operates a branch-lite model through five commercial bank branches, four mortgage offices, one loan production office, a limited service branch, corporate offices and operations facilities located in key markets throughout our operating area. As of
December 31, 2018
, we had total assets of
$1.1 billion
,
total
loans held for investment of
$1.0 billion
, total deposits of
$955 million
, and total stockholders’ equity of
$115 million
.
Capital Bank currently operates three divisions: Commercial Banking, Church Street Mortgage, or CSM, and OpenSky®. Our Commercial Banking division operates in the Washington, D.C. and Baltimore metropolitan areas and focuses on providing personalized service to commercial clients throughout our area of operations. Church Street Mortgage and OpenSky® both leverage Capital Bank’s national banking charter to operate as national consumer business lines; Church Street Mortgage acts as our residential mortgage origination platform and OpenSky® provides nationwide, digitally-based, secured credit cards to under-banked populations and those looking to rebuild their credit scores.
In addition to the three divisions of Capital Bank, Church Street Capital, or CSC, also operates as a wholly owned subsidiary of Capital Bancorp, Inc. CSC originates and services a portfolio of mezzanine loans with certain characteristics that do not meet Capital Bank’s general underwriting standards and thereby command a higher rate of return. CSC typically retains 10% to 20% of the exposure related to these loans and continues to service them, thereby maintaining a close relationship with the customer. CSC sells participations for the remainder of the balance to other real estate investors (including certain of the Company’s and the Bank’s directors) and high net worth individuals.
All participations sold to directors were sold on terms no less favorable than terms generally available to unaffiliated third parties. For additional
information on participations sold to our directors, please see “Certain Relationships and Related Party Transactions—Loan Participations with the Bank.”
At
December 31, 2018
, the net portfolio of retained loans for CSC amounted to approximately
$2.6 million
. All of these loans were originated in our operating markets in the Washington, D.C. and Baltimore metropolitan areas.
In addition to its subsidiaries discussed above, Capital Bank, N.A. and Church Street Capital, Capital Bancorp, Inc. owns all of the stock of Capital Bancorp (MD) Statutory Trust I (the “Trust”). The Trust is a special purpose non-consolidated entity organized for the sole purpose of issuing trust preferred securities.
Commercial Banking Division
As of
December 31, 2018
, our Commercial Banking division accounted for approximately 94%, or $1.0 billion, of Capital Bank’s total assets. The Commercial Banking division operates out of three full service
|
5
|
||
banking locations in the Washington, D.C. Metropolitan Statistical Area (“MSA”) and its full service banking location of Columbia, Maryland in the Baltimore, Maryland MSA. Additionally, we have two loan production offices located throughout the Washington, D.C. and Baltimore metropolitan areas. Our Commercial Banking division’s nine commercial loan officers and three commercial real estate loan officers provide commercial and industrial, or C&I, commercial real estate and construction lending solutions to business clients in Capital Bank’s operating markets.
Construction lending is a core competency of our Commercial Banking division. Construction loans have increased from $100.8 million as of December 31, 2013 to
$157.6 million
as of
December 31, 2018
. However, as a percent of total gross loans, construction loans have decreased from 25% as of December 31, 2013 to
16%
as of
December 31, 2018
. Our construction loan portfolio provides Capital Bank with short duration and higher yield loans. Our construction lending is focused on commercial and residential construction projects within the Washington, D.C. and Baltimore-Columbia-Towson, Maryland metropolitan operating areas and not suburban subdivision tract development. Our construction lending team consists of long-term employees of Capital Bank who are responsible for sourcing and structuring all construction loans that are originated. Our team’s strong underwriting capabilities are demonstrated by the fact that we have had no charge-offs on our construction portfolio since 2013.
In addition to its loan officers, our Commercial Banking division currently has a team of ten business development officers concentrating on continuing to diversify Capital Bank’s funding sources away from wholesale funding and towards core deposit funding by focusing on core deposits and treasury management. These business development officers, in conjunction with our recently introduced incentive program based upon core deposit capture from lending customers, have successfully reduced Capital Bank’s net non-core funding dependence ratio from 24.1% at December 31, 2014 to
17.4%
at
December 31, 2018
. We expect that our deposit gathering teams will continue to help decrease our wholesale funding dependence through improved low-cost core funding.
Church Street Mortgage Division
Church Street Mortgage originates conventional and government-guaranteed residential mortgage loans on a national basis, for sale into the secondary market and in certain, limited circumstances for our loan portfolio. Loans sold into the secondary market are sold servicing released. Loans retained for our portfolio are generally adjustable rate mortgage loans on primary residences within Capital Bank’s operating markets to individuals who own businesses where Capital Bank may also pursue a commercial lending relationship and has a vested interest in maintaining full control of the lending relationship.
The following table presents, for the periods indicated, certain loan origination data for Church Street Mortgage.
|
Years Ended December 31,
|
||||||||||||||||||||
|
(Dollars are in thousands)
|
2018
|
2017
|
2016
|
2015
|
2014
|
|||||||||||||||
|
Mortgage Metrics:
|
||||||||||||||||||||
|
Loans held for sale originations
|
$
|
337,122
|
|
$
|
418,912
|
|
$
|
853,674
|
|
$
|
754,965
|
|
$
|
493,273
|
|
|||||
|
Loans held for sale proceeds net of mortgage banking revenue
|
$
|
344,940
|
|
$
|
441,960
|
|
$
|
844,464
|
|
$
|
759,350
|
|
$
|
470,534
|
|
|||||
|
Purchase volume as a % of originations
|
79.43
|
%
|
52.50
|
%
|
18.79
|
%
|
22.51
|
%
|
29.83
|
%
|
||||||||||
|
Gain on sale of loans
|
$
|
9,477
|
|
$
|
10,377
|
|
$
|
15,373
|
|
$
|
11,541
|
|
$
|
7,827
|
|
|||||
|
Gain on sale as a % of loans sold
|
2.75
|
%
|
2.01
|
%
|
1.82
|
%
|
1.52
|
%
|
1.66
|
%
|
||||||||||
Historically, Church Street Mortgage has relied heavily on refinance origination volume as opposed to purchase origination volume. For the years ended December 31, 2015 and 2016, purchase origination volume accounted for approximately 23% and 19%, respectively, of Church Street Mortgage’s origination volume. However, anticipating the potential end of the refinance trends based on the expected interest rate
|
6
|
||
environment as the Federal Reserve began increasing short-term interest rates, Church Street Mortgage initiated an effort to broaden its mortgage product suite (including starting its Community Lending Group focused on supporting first time home buyers and a group focused on originating loans conforming to the specifications of Fannie Mae’s HomeStyle® Renovation Mortgage program) and to focus on hiring mortgage loan officers concentrated on purchase origination volume. These efforts resulted in our successfully hiring 8 new mortgage loan officers during calendar year 2017 and transitioning from 19%
purchase origination volume for the year ended December 31, 2016 to
79%
purchase origination volume for the
year ended
December 31, 2018
.
Approximately
70%
of Church Street Mortgage’s originations by volume occur within Capital Bank’s operating markets in Maryland, Virginia and Washington, D.C. The remainder of originations are national in scope and occur primarily through a consumer direct channel utilizing consumer marketing, including through social media applications.
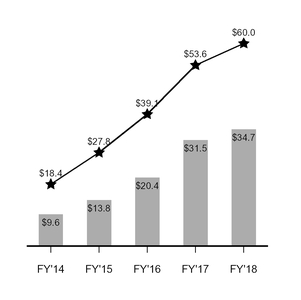
OpenSky® Secured Credit Card Division
The OpenSky® division provides secured credit cards (with a minimum initial deposit of $200 and maximum initial deposits of $3,000 per card and $5,000 per individual) on a nationwide basis to under-banked populations and those looking to rebuild their credit scores.
In order to obtain a credit card from us, the customer must select a credit line amount that they
are willing to secure with a matching deposit amount.
A deposit equal to the full credit limit of the card is made, using a debit card, check, wire or Western Union transfer, into a noninterest-bearing demand account with the Bank when the account is opened and the deposit is required to be maintained throughout the life of the card.
The customer’s funding of the deposit account as collateral is not a consideration in the credit card approval process, but is a prerequisite to activating the credit line. Credit card eligibility is based on identity and income verification. Once the customer’s deposit account has been funded, the credit line is activated and the collateral funds are generally available to absorb any losses on the account that may occur. As of
December 31, 2018
, approximately
11%
of our credit card portfolio was delinquent by 30 days or more. Based on our prior experience, approximately 20% of our new secured credit cards will experience a charge-off within the first year of issuance primarily due to the relative inexperience of this under-banked population in effectively managing credit card debt.
Additionally, using our proprietary scoring model, which considers credit score and repayment history (typically a minimum of six months of on-time repayments, but ultimately determined on a case-by-case basis), the Bank has recently begun to offer certain customers an unsecured line in excess of their secured line of credit. OpenSky® secured credit cards have floating interest rates, which are beneficial in a rising rate environment, and we believe the OpenSky® secured credit card product provides a counter-cyclical benefit as more people enter its target segment of credit rebuilders during an economic downturn. At
December 31, 2018
, we had
$2.1 million
of unsecured unused lines of credit and
$1.8 million
of outstanding unsecured credit card advances.
|
7
|
||
|
Credit Card Loans and Deposits ($ in millions)
|
Open Credit Card Accounts and
Average Monthly Account Openings
|
|

|

|
|
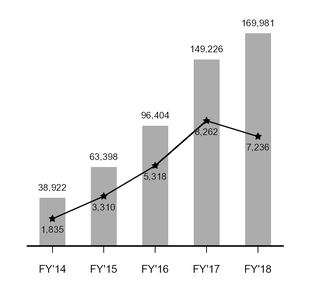
Capital Bank evaluates its OpenSky® customers using analytics that track consumer behaviors and score each customer on risk and behavior metrics. These real-time monitoring capabilities give our management insight into the credit trends of our portfolio on a consumer by consumer basis, allowing them to identify potential fraud situations and mitigate any associated losses quickly and efficiently, as well as to obtain insights into how to optimize the profitability and life cycle of each account. The model utilizes data proprietary to Capital Bank.
We have invested heavily in technology and systems to prevent and
detect fraudulent behavior and mitigate losses but such investments may not be adequate, and our systems may not adequately monitor or mitigate potential losses arising from these risks. See “Risk Factors—Risks Related to Our Business—Delinquencies and credit losses from our OpenSky® credit card division could adversely affect our business, financial condition and results of operations.”
OpenSky®’s cards operate on a fully digital and mobile platform with all marketing and application procedures conducted through its website or mobile application. Given the secured nature of the cards, credit checks are not required at the time of application, however, as each customer’s account ages, we obtain credit scores to baseline their improvement as an input into any decision to extend unsecured credit in the future.
|
8
|
||
Our Business Strategy
Regulations, technology and competition have fundamentally impacted the economics of the banking sector. We believe that by using technology-enabled strategies and advice-based solutions, we can deliver attractive shareholder returns in excess of our cost of capital. We have adopted the following strategies that we believe will continue to drive growth while maintaining consistent profitability and enhancing shareholder value:
Deliver premium advice-based solutions that drive organic loan and core deposit growth with corresponding superior net interest margin
|
•
|
Serve as financial partners to our customers, helping them to grow their businesses through advice-based financial solutions;
|
|
•
|
Endeavor to provide comprehensive loan and deposit solutions to our customers that are tailored to their needs;
|
|
•
|
Expand expertise in the non-profit, basic industries, fiduciary and community lending groups while building a greater presence in the government contracting sector;
|
|
•
|
Capitalize on market dislocation from recent in-market acquisitions to continue to attract top sales talent, like our Fiduciary Banking Team and the leader of our Business Banking group, and acquire new commercial banking relationships from local competitors; and
|
|
•
|
Selectively add banking centers where sales teams have already proved an ability to capture market share and leverage customer relationships.
|
Leverage technology to improve the customer experience and loyalty and deliver operational efficiencies
|
•
|
Use solution structuring and customized technology implementation as differentiators to add value to clients with complex needs and further our relationships within our existing customer base;
|
|
•
|
Deploy technologies that better support our lending associates and simplify our processes;
|
|
•
|
Maximize the potential of web-based and mobile banking applications to drive core funding while maintaining our branch-lite business model; and
|
|
•
|
Enhance cross-selling capabilities among our OpenSky®, Church Street Mortgage and Commercial Banking division customers.
|
Increase scale in our consumer fee based platforms through delivery of high value products and services
|
•
|
Utilize our customer acquisition system, Apollo, and leverage our investment in a new core processing system, together with our expertise in data, analytics and marketing, to deliver new products and services and grow our secured credit card business;
|
|
•
|
Retain OpenSky® customers that “graduate” from our secured credit product through the limited use of partially unsecured credit products; and
|
|
•
|
Expand our purchase-oriented mortgage loan sales both in-market and in adjacent markets through the hiring of high quality mortgage originators and continuing to improve on our direct to consumer marketing channels.
|
|
9
|
||
Pursue acquisitions opportunistically
|
•
|
Seek strategic acquisitions in the Washington, D.C., Baltimore, Maryland, and surrounding metropolitan areas;
|
|
•
|
Evaluate specialty finance company opportunities where we can add value through increasing interest and fee income and leveraging our management’s expertise and existing strategic assets; and
|
|
•
|
Use our management’s and Board’s expertise to structure transactions that minimize the integration and execution risk for the Bank.
|
Summary Demographic and Other Market Data
According to the U.S. Census Bureau, the Washington, D.C. and Baltimore, Maryland MSAs include the four wealthiest counties in the United States, as well as five of the 10 wealthiest counties. Overall, the Washington, D.C. MSA ranks first out of the largest 20 MSAs (ranked by population) in income levels with a current median household income of approximately $99,400, which is approximately 63% higher than the national average. Additionally, the Washington, D.C. MSA is currently the sixth largest MSA in the United States with a total population of more than 6.2 million people (and when combined with the Baltimore, Maryland MSA, the Washington, D.C. and Baltimore metropolitan areas are home to a population of more than 9.0 million). We expect our strategies to benefit from continued growth in population and high income of our market area’s residents.
|
State
|
Total
Population 2018 (Actual) |
Population
Change 2010-2018 |
Projected
Population Change 2018-2023 |
Median
Household Income 2018 |
HH Income
Change 2011-2018 |
Unemployment Rate
(May 2018) |
||||||||||||
|
Washington D.C. MSA
|
6,224,774
|
10.44
|
%
|
5.19
|
%
|
$
|
99,400
|
|
23.35
|
%
|
3.2
|
%
|
||||||
|
Baltimore, Maryland MSA
|
2,813,526
|
3.8
|
|
2.51
|
|
77,704
|
|
22.98
|
|
4.0
|
|
|||||||
|
State of Maryland
|
6,061,065
|
4.98
|
|
3.02
|
|
81,294
|
|
21.21
|
|
3.9
|
|
|||||||
|
District of Columbia
|
698,375
|
16.06
|
|
7.98
|
|
82,192
|
|
50.75
|
|
5.2
|
|
|||||||
|
Counties of Operation
(1)
|
2,341,222
|
10.06
|
|
5.02
|
|
100,613
|
|
26.74
|
|
3.5
|
|
|||||||
|
United States
|
326,533,070
|
5.76
|
|
3.5
|
|
61,045
|
|
22.76
|
|
3.6
|
|
|||||||
_______________
Source: S&P Global Market Intelligence, U.S. Bureau of Labor Statistics
|
(1)
|
Data consists of deposit-weighted average using county-level deposits.
|
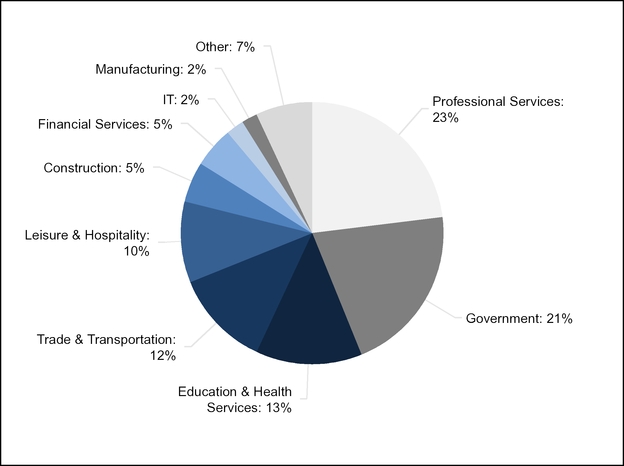
The Washington, D.C. MSA has a large and diversified economy, with an annual gross domestic product of nearly $510 billion, according to the Bureau of Economic Analysis. When combined with the Baltimore, Maryland MSA, the Washington, D.C. and Baltimore metropolitan areas in which we operate has a combined gross domestic product of more than $696 billion, and this combined GDP has grown approximately 19% between 2010 and 2016. The Washington, D.C. MSA is a desirable market for a broad range of companies in a variety of industries, including 15 companies from the 2017 Fortune 500 list, and four of the United States’ largest 100 private companies, according to the 2017 Forbes list of largest private companies by revenue. The following table provides an in-depth view of the distribution of employment within the Washington, D.C. MSA.
|
10
|
||
Washington, D.C. MSA Employment By Sector
_______________
Source: U.S. Bureau of Labor Statistics; Data as of February 2018
Note: Data not seasonally adjusted
As the home of the federal government, the broader Washington, D.C. region benefits from consistent population growth and remains well positioned to capitalize on any increase in government spending and infrastructure. Further, as banks in our market have experienced continued consolidation over the last few years, our opportunities to attract talented employees and capitalize on customer dislocation have increased.
With its strong demographic characteristics, scale and robust economic activity we believe that the Washington, D.C. and Baltimore metropolitan areas represent a strong geographic market for us to realize our continued growth strategies within our Commercial Banking division. The Washington, D.C. area serves as a regional, national and global center for several industries, including:
Government Contracting
|
•
|
The Washington, D.C. metro area received $70 billion in government contracting awards from October 2015 to September 2016, according to data from USASpending.gov. We expect the region to benefit from anticipated increases in government contract spending under the Trump administration.
|
|
11
|
||
|
•
|
According to the Annual Review of Government Contracting of the National Contract Management Association, Virginia, Maryland and the District of Columbia represent three of the top five markets in the United States for annual government contracts awarded in 2015.
|
|
•
|
The Washington, D.C. MSA is home to some of the largest defense contracting companies in the world, including Lockheed Martin (Bethesda, Maryland) and General Dynamics (Falls Church, Virginia).
|
Hospitality and Tourism
|
•
|
The Washington, D.C. MSA is home to three of the world’s largest hotel and resort chains, Marriott International, Inc. (Bethesda, Maryland), Hilton Worldwide Holdings Inc. (McLean, Virginia) and Host Hotels & Resorts, Inc. (Bethesda, Maryland).
|
|
•
|
Worldwide interest in Washington, D.C.’s monuments, museums, diverse neighborhoods drives a strong interest in tourism in the area. According to the Associated Press, the area was visited by more than 22 million domestic and international tourists in 2016. The high volume of tourists contributed to $7.3 billion of spending in the area in 2016, an increase of 2.8% from 2015. The tourism industry supports 74,000 jobs in Washington, D.C., according to Destination DC.
|
In addition to their diverse economies, we believe the Washington, D.C. and Baltimore, Maryland metropolitan areas provide a favorable environment for economic strength going forward. As the home of the federal government, the broader Washington, D.C. region benefits from consistent population growth and remains well positioned to capitalize on any increase in government spending and infrastructure. Further, as banks in our market have experienced continued consolidation over the last few years, our opportunities to attract talented employees and capitalize on customer dislocation have increased. Thirteen bank mergers in the Washington, D.C. and Baltimore, Maryland MSAs have been announced or completed since the start of 2016. With the shrinking number of locally headquartered community banks (seven of the top 10 banks in Washington, D.C. MSA by market share are not headquartered in the region), we believe that we have the ability to continue our historical growth by serving the middle market businesses and their owners in the Washington, D.C. and Baltimore, Maryland MSAs who prefer high quality service and local decision making that is unavailable at larger, out-of-market banking institutions.
With its unique demographic characteristics, scale and robust economic activity, we believe that the Washington, D.C. and Baltimore metropolitan areas are a strong geographic market in which we can realize our continued growth strategies for our Commercial Banking division.
Lending Activities
Overview
. We maintain a diversified loan portfolio of types of loan products and customer characteristics with a focus on variable rate, shorter term and higher yielding products. Our lending services cover residential and commercial real estate loans, both on an owner and non-owner-occupied basis, construction loans, commercial business loans and credit card lines (substantially all of which are secured by a deposit at the Bank in an amount equal to the full credit limit of the credit card). Lending activities originate from the efforts of our bankers, with an emphasis on lending to individuals, professionals, small- to medium-sized businesses and commercial companies located in our market areas.
|
12
|
||
The following table presents the composition of our total loan portfolio, by category, as of
December 31, 2018
.
LOAN PORTFOLIO COMPOSITION
|
Loan Composition
|
|||||||
|
(Dollars in thousands)
|
Amount
|
Percentage of
Total Loans |
|||||
|
Real estate:
|
|||||||
|
Residential
|
$
|
407,844
|
|
41
|
%
|
||
|
Commercial
|
278,691
|
|
28
|
|
|||
|
Construction
|
157,586
|
|
16
|
|
|||
|
Subtotal real estate
|
844,121
|
|
85
|
|
|||
|
Commercial
|
122,264
|
|
12
|
|
|||
|
Credit card
|
34,673
|
|
3
|
|
|||
|
Other consumer
|
1,202
|
|
—
|
|
|||
|
Total
|
$
|
1,002,260
|
|
100.0
|
%
|
||
Residential Real Estate Loans
. We offer one-to-four family mortgage loans primarily on owner-occupied primary residences and, to a lesser extent, investor owned residences. We also offer home equity lines of credit. Our residential real estate lending products are offered primarily to customers within our geographic markets. Our owner-occupied residential real estate loans usually have fixed rates for five or seven years and adjust on an annual basis after the initial term based on a typical maturity of 30 years. Our investor residential real estate loans are based on 25-year amortization terms with a balloon payment due after five years. The required minimum debt service coverage ratio is 1.15.
Commercial Real Estate Loans
. We offer real estate loans for commercial property that is owner-occupied as well as commercial property owned by real estate investors. Commercial loans that are secured by owner-occupied commercial real estate and primarily collateralized by operating cash flows are also included in this category of loans.
As of
December 31, 2018
, we had approximately
$128.9 million
of owner-occupied commercial real estate loans, representing approximately
46%
of our commercial real estate portfolio.
Commercial real estate loan terms are generally extended for 10 years or less and amortize generally over 25 years or less. The interest rates on our commercial real estate loans have initial fixed rate terms that adjust typically at 5 years and we routinely charge an origination fee for our services. We generally require personal guarantees from the principal owners of the business supported by a review of the principal owners’ personal financial statements and global debt service obligations. The real estate securing our existing commercial real estate loans includes a wide variety of property types, such as owner-occupied offices, warehouses, production facilities, office buildings, mixed-use residential/commercial property, retail centers and multifamily properties.
Construction Loans
. Our construction loan portfolio primarily includes loans to builders for the construction of single-family homes and condominium and townhouse conversions or renovations and, to a lesser extent, loans to individual clients for construction of owner-occupied single-family homes in our market areas. Construction loans are generally made with a term of 12 to 18 months. According to our underwriting standards, the ratio of loan principal to collateral value, as established by an independent appraisal, cannot exceed 75% for investor-owned and 80% for owner-occupied properties. Loan proceeds are disbursed based on the completion of certain milestones and only after the project has been inspected by an experienced construction lender or third-party inspector.
Commercial Business Loans
. In addition to our other loan products, we provide general commercial loans, including commercial lines of credit, working capital loans, term loans, equipment financing, letters of credit and other loan products, primarily in our target markets, that are underwritten based on each borrower’s ability to service debt from income. We typically take as collateral a lien on general business
|
13
|
||
assets including, among other things, available real estate, accounts receivable, promissory notes, inventory and equipment and we generally obtain a personal guaranty from the borrower or other principal. Other than lines of credit, our commercial loans generally have fixed interest rates and five or seven year terms depending on factors such as the type and size of the loan, the financial strength of the borrower/guarantor and the age, type and value of the collateral.
Credit Cards
. Through our OpenSky® credit card division, we provide credit cards on a nationwide basis to under-banked populations and those looking to rebuild their credit scores through a fully digital and mobile platform. Substantially all of the lines of credit are secured by a noninterest bearing demand account at the Bank in an amount equal to the full credit limit of the credit card. In addition, using our proprietary scoring model, which considers credit score and repayment history
(typically a minimum of six months of on-time repayments, but ultimately determined on a case-by-case basis) the Bank has recently begun to offer
certain customers an unsecured line in excess of their secured line of credit.
Other Consumer Loans
. To a very limited extent, we also make loans to individuals, including secured and unsecured installment and term loans, car loans and boat loans. We offer consumer loans as an accommodation to our existing customers and do not market consumer loans to persons who do not have a pre-existing relationship with us.
Credit Policies and Procedures
General
. We maintain asset quality through an emphasis on local market knowledge, long-term customer relationships, consistent and thorough underwriting for all loans and a conservative credit culture. Our lending policies do not provide for any loans that are highly speculative, subprime or that have high loan-to-value ratios. These components, together with active credit management, are the foundation of our credit culture.
We have a service-driven, relationship-based, business-focused credit culture, rather than a price-driven, transaction-based culture. Substantially all of our commercial loans are made to borrowers located or operating in our primary market areas with whom we have ongoing relationships across various product lines. We only have a limited number of loans secured by properties located in out-of-market areas.
Credit Concentrations
. We actively manage the composition of our loan portfolio, including credit concentrations. Our loan approval policies establish concentrations limits with respect to loan product types to enhance portfolio diversification. The Bank’s concentration management program couples quantitative data with a qualitative approach to provide an in-depth understanding of its loan portfolio concentrations. The Bank’s routine commercial real estate portfolio analysis includes concentration trends by portfolio product type, overall commercial real estate growth trends, pool correlations, risk rating trends, policy and/or underwriting exceptions, non-performing trends, stress testing, market and submarket analysis and changing economic conditions. The portfolio concentration limits set forth in Bank’s Credit Underwriting Guidelines are reviewed and approved by the Loan Committee of the Bank’s board of directors at least annually and are based on risk profile, strategic portfolio diversification goals, quality of the portfolio segment, overall budgeted growth goals and comparisons to peers of the Bank. Concentration levels are monitored by management and reported to the Bank’s board of directors monthly.
Loan Approval Process
. As of
December 31, 2018
, the Bank had a legal lending limit of approximately
$16.1 million
for loans secured without readily marketable collateral, and its “in-house” lending limit was
$12.5 million
as of such date. The Bank’s lending activities are governed by written underwriting policies and procedures that have been approved by the Loan Committee of the Bank’s board of directors. The policies provide several levels of delegated lending authority to the Management Loan Committee, the Credit Loan Committee and senior management and loan officers of the Bank. The lending authority hierarchy varies depending on loan amount, collateral type and total borrower exposure. A multi-tiered group level approach based on experience, capability and management position dictates lending authorities for senior management and loan officers.
|
14
|
||
We conduct weekly loan meetings, attended by substantially all of our loan officers, related loan production staff and credit administration staff at which asset quality and delinquencies are reviewed. Our evaluation and compensation program for our loan officers includes significant goals, such as the percentages of past due loans and charge-offs to total loans in the loan officer’s portfolio, that we believe motivate loan officers to focus on the origination and maintenance of high quality credits consistent with our strategic focus on asset quality.
It is our policy to discuss each loan that has one or more past due payment at our weekly
meetings with all lending personnel. Our policies require rapid notification of delinquency and prompt initiation of collection actions. Loan officers, credit administration personnel and senior management proactively support collection activities.
In accordance with our procedures, we perform annual asset reviews of our loan exposures in excess of $100,000. As part of these asset review procedures, we analyze recent financial statements of the property, borrower and any guarantor to determine the current level of occupancy, revenues and expenses and to investigate any deterioration in the value of the real estate collateral or in the borrower’s and any guarantor’s financial condition. Upon completion, we update the grade assigned to each loan. Loan officers are encouraged to bring potential credit issues to the attention of credit administration personnel. We maintain a list of loans that receive additional attention if we believe there may be a potential credit risk.
Loans in excess of $250,000 that are downgraded or classified undergo a detailed quarterly review by the Special Asset Committee of the Bank’s board of directors. This review includes an evaluation of market conditions, the property’s trends, the borrower and guarantor status, the level of reserves required and loan accrual status. Additionally, we periodically have an independent, third-party review performed on our loan grades and our credit administration functions. Finally, we perform an annual stress test of our loan portfolio during which we evaluate the impact of declining economic conditions on the portfolio based on previous recessionary periods. Management reviews these reports and presents them to the Loan Committee of the Bank’s board of directors. These asset review procedures provide management with additional information for assessing our asset quality. In addition, we perform frequent evaluations and regular monitoring of business and personal loans that are not secured by real estate.
Deposits
Our deposits serve as the primary funding source for lending, investing and other general banking purposes. We provide a full range of deposit products and services, including a variety of checking and savings accounts, certificates of deposit, money market accounts, debit cards, remote deposit capture, online banking, mobile banking, e-Statements, bank-by-mail and direct deposit services. We also offer business accounts and cash management services, including business checking and savings accounts and treasury management services. We solicit deposits through our relationship-driven team of dedicated and accessible bankers and through community-focused marketing. We also selectively seek to cross-sell deposit products at loan origination. We supplement our retail deposits with wholesale funding sources such as deposit listing services, CDARS and brokered deposits. We actively market our certificate of deposit products and rely primarily on competitive pricing policies to attract and retain these deposits. Our credit card customers are also a signification source of deposits.
Residential Mortgage Origination
We originate residential mortgages for sale on the secondary market through Church Street Mortgage, the mortgage division of our Bank. We have developed a scalable platform for mortgage originations within this division and believe that we have significant opportunities to grow the business. We sell substantially all mortgage loans we originate with servicing released to various investors in the secondary market. As a result of recent changes in the interest rate environment, our mortgage division is currently undergoing a transition from being heavily weighted toward refinance volume to being more weighted toward purchase volume and niche products with relatively higher margins. As part of this effort, we have recently established
|
15
|
||
our Community Lending Group, which focuses on first-time home buyers, and our Renovation Group, which focuses on originating renovation focused loans, within the division, as well as hiring several new originators focused primarily on purchase originations. At
December 31, 2018
, we had a dedicated team of
33
mortgage loan officers to service this line of business.
Investments
We manage our securities portfolio and cash to maintain adequate liquidity and to ensure the safety and preservation of invested principal, with a secondary focus on yield and returns. Specific goals of our investment portfolio are as follows:
|
•
|
to provide a ready source of balance sheet liquidity, ensuring adequate availability of funds to meet fluctuations in loan demand, deposit balances and other changes in balance sheet volumes and composition;
|
|
•
|
to serve as a means for diversification of our assets with respect to credit quality, maturity and other attributes; and
|
|
•
|
to serve as a tool for modifying our interest rate risk profile pursuant to our established policies.
|
Our investment portfolio is comprised primarily of U.S. government agency securities, high quality corporate debt, mortgage-backed securities backed by government-sponsored entities and equity securities.
Our investment policy is reviewed annually by our Asset/Liability Management Committee, or ALCO, and subsequently ratified by our board of directors. Overall investment goals are established by our board, CEO, CFO and members of our ALCO. Our board of directors has delegated the responsibility of monitoring our investment activities to our ALCO. Day-to-day activities pertaining to the securities portfolio are conducted under the supervision of our CFO. We actively monitor our investments on an ongoing basis to identify any material changes in our mix of securities. We also review our securities for potential impairment (other than temporary impairments) at least quarterly.
Competition
The banking and financial services industry is highly competitive, and we compete with a wide range of financial institutions within our markets, including local, regional and national commercial banks and credit unions. We also compete with mortgage companies, brokerage firms, consumer finance companies, mutual funds, securities firms, insurance companies, credit card companies, third-party payment processors, financial technology, or fintech, companies and other financial intermediaries for certain of our products and services. Some of our competitors are not subject to the regulatory restrictions and level of regulatory supervision applicable to us.
Interest rates on loans and deposits, as well as prices on fee-based services, are typically significant competitive factors within banking and financial services industry. Many of our competitors are much larger financial institutions that have greater financial resources than we do and compete aggressively for market share. These competitors attempt to gain market share through their financial product mix, pricing strategies and banking center locations. Other important competitive factors in our industry and markets include office locations and hours, quality of customer service, community reputation, continuity of personnel and services, capacity and willingness to extend credit, and ability to offer sophisticated banking products and services. While we seek to remain competitive with respect to fees charged, interest rates and pricing, we believe that our broad and sophisticated commercial banking product suite, our high quality customer service culture, our positive reputation and long-standing community relationships will enable us to compete successfully within our markets and enhance our ability to attract and retain customers.
|
16
|
||
Our Employees
As of
December 31, 2018
, we employed
204
full-time equivalent persons. None of our employees are represented by any collective bargaining unit or are parties to a collective bargaining agreement. We consider our relations with our employees to be good.
SUPERVISION AND REGULATION
General
We are extensively regulated under both federal and state law. These laws restrict permissible activities and investments and require compliance with various consumer protection provisions applicable to lending, deposit, brokerage, and fiduciary activities. They also impose capital adequacy requirements and conditions on a bank holding company’s, or BHC, ability to repurchase stock or to receive dividends from its subsidiary banks. We are subject to comprehensive examination and supervision by the Federal Reserve, and the Bank is subject to comprehensive examination and supervision by the Office of the Comptroller of the Currency, or the OCC. We are required to file with the Federal Reserve quarterly and annual reports and such additional information as the Federal Reserve may require pursuant to the
Bank Holding Company Act of 1956, as amended, or the
BHC Act. The Federal Reserve may conduct examinations of BHCs and their subsidiaries. The Bank’s deposits are insured by the Federal Deposit Insurance Corporation, or the FDIC, through the Deposit Insurance Fund, or DIF. As a result of this deposit insurance function, the FDIC also has certain supervisory authority and powers over the Bank as well as all other FDIC insured institutions. The Company’s and the Bank’s regulators generally have broad discretion to impose restrictions and limitations on our operations. Bank regulation is intended to protect depositors and consumers and not shareholders. This supervisory framework could materially impact the conduct and profitability of our activities.
To the extent that the following information describes statutory and regulatory provisions, it is qualified in its entirety by reference to the text of the particular statutory and regulatory provisions. Proposals to change the laws and regulations governing the banking industry are frequently raised at both the state and federal levels. The likelihood and timing of any changes in these laws and regulations, and the impact such changes may have on us, are difficult to ascertain. A change in applicable laws and regulations, or in the manner such laws or regulations are interpreted by regulatory agencies or courts, may have a material effect on our business, operations, and earnings.
Regulation of Capital Bancorp, Inc.
We are registered as a BHC under the BHC Act and are subject to regulation and supervision by the Federal Reserve. The BHC Act requires us to secure the prior approval of the Federal Reserve before we own or control, directly or indirectly, more than 5% of the voting shares or substantially all of the assets of any bank or thrift, or merge or consolidate with another bank or thrift holding company. Further, under the BHC Act, our activities and those of any nonbank subsidiary are limited to: (i) those activities that the Federal Reserve determines to be so closely related to banking as to be a proper incident thereto, and (ii) investments in companies not engaged in activities closely related to banking, subject to quantitative limitations on the value of such investments. Prior approval of the Federal Reserve may be required before engaging in certain activities. In making such determinations, the Federal Reserve is required to weigh the expected benefits to the public, such as greater convenience, increased competition, and gains in efficiency, against the possible adverse effects, such as undue concentration of resources, decreased or unfair competition, conflicts of interest, and unsound banking practices.
Subject to various exceptions, the BHC Act and the Change in Bank Control Act, together with related regulations, require Federal Reserve approval prior to any person or company acquiring “control” of a BHC. Control is conclusively presumed to exist if an individual or company acquires 25% or more of any class of voting securities of the BHC, and a rebuttable presumption arises if a person or company acquires 10% or
|
17
|
||
more, but less than 25%, of any class of voting securities and either: (i) the BHC has registered securities under Section 12 of the Securities Act of 1933, as amended, or the Securities Act; or (ii) no other person owns a greater percentage of that class of voting securities immediately after the transaction. As a policy matter, the Federal Reserve expects a company that proposes to acquire more than 7.5% but less than 25% of a class of voting securities to consult with the agency. The Federal Reserve Board may require the company to enter into passivity and, if other companies are making similar investments, anti-association commitments.
The BHC Act was substantially amended by the Gramm-Leach-Bliley Act, or the GLBA, which, among other things, permits a “financial holding company” to engage in a broader range of non-banking activities, and to engage on less restrictive terms in certain activities than were previously permitted. These expanded activities include securities underwriting and dealing, insurance underwriting and sales, and merchant banking activities. To become a financial holding company, a BHC must certify that it and all depository institutions that it controls are both “well capitalized” and “well managed” (as defined by federal law), and that all subsidiary depository institutions have at least a “satisfactory” CRA rating. At this time, we have not elected to become a financial holding company, nor do we expect to make such an election in the foreseeable future.
There are a number of restrictions imposed on us by law and regulatory policy that are designed to minimize potential loss to depositors and to the DIF in the event that a subsidiary depository institution should become insolvent. For example, federal law requires a BHC to serve as a source of financial strength to its subsidiary depository institutions and to commit resources to support such institutions in circumstances where it might not do so in the absence of the rule. The Federal Reserve also has the authority under the BHC Act to require a BHC to terminate any activity or to relinquish control of a non-bank subsidiary upon the Federal Reserve’s determination that such activity or control constitutes a serious risk to the financial soundness and stability of any bank subsidiary of the BHC.
Any capital loan by a BHC to a subsidiary depository institution is subordinate in right of payment to deposits and certain other indebtedness of the institution. In addition, in the event of the BHC’s bankruptcy, any commitment made by the BHC to a federal banking regulatory agency to maintain the capital of its subsidiary depository institution(s) will be assumed by the bankruptcy trustee and entitled to a priority of payment.
The Federal Deposit Insurance Act, or FDIA, provides that, in the event of the “liquidation or other resolution” of an insured depository institution, the claims of depositors of the institution (including the claims of the FDIC as a subrogee of insured depositors) and certain claims for administrative expenses of the FDIC as a receiver will have priority over other general unsecured claims against the institution. If an insured depository institution fails, insured and uninsured depositors, along with the FDIC, will have priority in payment ahead of unsecured, non-deposit creditors, including the institution’s holding company, with respect to any extensions of credit they have made to such insured depository institution.
Regulation of Capital Bank
The operations and investments of our Bank are subject to the supervision, examination, and reporting requirements of the National Bank Act and the regulations of the OCC as well as other federal banking statutes and regulations, including with respect to the level of reserves that our Bank must maintain against deposits, restrictions on the types, amount, and terms and conditions of loans it may originate, and limits on the types of other activities in which our Bank may engage and the investments that it may make. The OCC also has the power to prevent the continuance or development of unsafe or unsound banking practices or other violations of law. Because our Bank’s deposits are insured by the FDIC to the maximum extent provided by law, it is also subject to certain FDIC regulations, and the FDIC has backup examination authority and some enforcement powers over our Bank. If, as a result of an examination of our Bank, the regulators should determine that the financial condition, capital resources, asset quality, earnings prospects, management, liquidity or other aspects of the Bank’s operations are unsatisfactory or that the Bank or our management is
|
18
|
||
violating or has violated any law or regulation, various remedies are available to the regulators. Such remedies include the power to enjoin unsafe or unsound practices, require affirmative action to correct any conditions resulting from any violation or practice, issue an administrative order that can be judicially enforced, direct an increase in capital, to restrict growth, assess civil monetary penalties and remove officers and directors. The regulators also may request the FDIC to terminate the Bank’s deposit insurance.
Regulatory Relief Act
On May 24, 2018, President Trump signed into law the Regulatory Relief Act, which amends parts of the Dodd-Frank Wall Street Reform and Consumer Protection Act, or Dodd-Frank Act, as well as other laws that involve regulation of the financial industry. While the Regulatory Relief Act keeps in place fundamental aspects of the Dodd-Frank Act’s regulatory framework, it does change the regulatory framework for depository institutions with assets under $10 billion, such as the Bank, and for large depository institutions with assets over $50 billion. The legislation includes a number of provisions which are favorable to BHCs with total consolidated assets of less than $10 billion, such as the Company, and also makes changes to consumer mortgage and credit reporting regulations and to the authorities of the agencies that regulate the financial industry. A number of the provisions included in the Regulatory Relief Act require the federal banking agencies to either promulgate regulations or amend existing regulations, and it will likely take some time for these agencies to implement the necessary changes.
The following is a brief summary of select provisions of the Regulatory Relief Act which are not otherwise covered in other sections below.
Modified Process for Designating Systemically Important Financial Institutions
. The Regulatory Relief Act changes which BHCs will be designated as “Systemically Important Financial Institutions” or SIFIs. Prior to passage of the Regulatory Relief Act, all BHCs with assets exceeding $50 billion were automatically designated as SIFIs and were subject to the enhanced prudential standards, or EPS of the Dodd-Frank Act, which required these BHCs to undergo special stress tests, develop resolution plans, and maintain certain levels of liquidity and financial capacity to absorb losses. The Regulatory Relief Act raised the $50 billion “SIFI threshold” to $250 billion, but staggered the application of this change for certain institutions, based on the size of the BHC. Upon enactment, BHCs with total consolidated assets of less than $100 billion are no longer subject to the EPS of the Dodd-Frank Act. BHCs with total consolidated assets of more than $100 billion but less than $250 billion will no longer be subject to such requirements, beginning 18 months after the date of enactment. During the 18-month transition period, the Federal Reserve may exempt a BHC from any EPS requirement, and the Federal Reserve is also provided with discretionary authority to apply any EPS to a BHC within this asset category, subject to it following specified procedural requirements. BHCs with more than $250 billion in consolidated assets, as well as any domestic BHC that has been identified as a “global systemically important” BHC, remain fully subject to EPS. Because the Regulatory Relief Act does not amend the regulations that the federal banking agencies have promulgated to implement the EPS, it will likely take some time for these agencies to amend their regulations to account for the new thresholds included in the Regulatory Relief Act.
Many of the changes in the Regulatory Relief Act amend provisions of Dodd-Frank Act that apply at the BHC level, but not to subsidiary national banks or other insured depository institutions. The OCC and the FDIC have adopted their own counterparts to some EPS for the bank subsidiaries that they regulate, including recovery and resolution planning. The OCC and the FDIC will need to address whether they intend to take similar measures under their regulations and guidance to align asset thresholds with what is reflected in the Regulatory Relief Act.
Provisions that are Favorable to Community Banks
. There are a number of provisions in the Regulatory Relief Act that will have a favorable impact on community banks such as the Bank. These are briefly referenced below.
|
19
|
||
Elimination of Company-Run Stress Tests
. The Regulatory Relief Act exempts all banking organizations-including not only BHCs, but also depository institutions and savings and loan holding companies, or SLHCs, with less than $250 billion in total consolidated assets from the current requirement to conduct company-run stress tests. Banking organizations with $250 billion or more in total consolidated assets are still required to conduct company-run stress tests on a periodic basis but are no longer be required to do so on a semi-annual or annual basis.
Increase in Small BHC Policy Threshold
. The threshold for qualifying for the Federal Reserve’s “Small BHC Policy Statement”, or the Policy, is increased by the Regulatory Relief Act from $1 billion to $3 billion, provided the small BHC or SLHC is not engaged in significant non-banking activities, is not engaged in significant off-balance sheet activities and does not have a material amount of debt or equity registered with the Securities and Exchange Commission, or the SEC. The Federal Reserve retains the authority to exclude any BHC or SLHC from the Policy if such action is warranted for supervisory purposes. The Policy allows covered holding companies to operate with higher levels of debt than would normally be permitted. Also, holding companies that are subject to the Policy are exempt from the Federal Reserve’s consolidated risk-based and leverage capital rules and have less extensive regulatory reporting requirements than larger organizations. Specifically, they file semi-annual rather than quarterly reports. Companies that are subject to the Policy are not to pay dividends if their debt-to-equity ratio exceeds 1:1. In addition, the Federal Reserve expects that holding companies will retire all debt within 25 years and reduce debt to 30 percent or less of equity within 12 years of incurring the debt. The foregoing requirements are intended to ensure that the higher leverage the Policy allows does not pose an undue burden on subsidiary depository institutions. Finally, the Policy directs that each depository institution subsidiary of a covered holding company remain well-capitalized.
Increase in Asset Threshold for Requirement to Establish a Risk Committee
. The Regulatory Relief Act raises the asset threshold for the requirement that a publicly-traded BHC establish a risk committee from $10 billion to $50 billion or more in total consolidated assets.
Increase in Asset Threshold for Qualifying for an 18-Month Examination Cycle
. The Regulatory Relief Act increases the asset threshold for institutions qualifying for an 18-month on-site examination cycle from $1 billion to $3 billion in total consolidated assets.
Short Form Call Reports
. The Regulatory Relief Act requires the federal banking agencies to promulgate regulations allowing an insured depository institution with less than $5 billion in total consolidated assets (and that satisfies such other criteria as determined to be appropriate by the agencies) to submit a short-form call report for its first and third quarters of a calendar year.
Consumer Protection Enhancements
. The Regulatory Relief Act includes various provisions to address consumer protection challenges facing the credit reporting industry and borrowers in certain credit markets, specifically markets including active duty service members, veterans, and student loan borrowers. The Regulatory Relief Act subjects credit reporting agencies to additional requirements, including requirements to generally provide fraud alerts for consumer files for at least one year and to allow consumers to place security freezes on their credit reports.
The Regulatory Relief Act also allows consumers to request that information related to a default on a qualified private student loan be removed from a credit report if the borrower satisfies the requirements of a loan rehabilitation program offered by a private lender. The Regulatory Relief Act prohibits lenders from declaring automatic default in the case of death or bankruptcy of the co-signer of a student loan and requires lenders to release cosigners from obligations related to a student loan in the event of the death of the student borrower. In addition, credit reporting agencies will be required to exclude certain medical debt from veterans’ credit reports.
|
20
|
||
Transactions with Affiliates and Insiders
We are subject to federal laws, such as Sections 23A and 23B of the Federal Reserve Act, or FRA, that limit the size and number of the transactions that depository institutions may engage in with their affiliates. Under these provisions, transactions (such as loans or investments) by a bank with nonbank affiliates are generally limited to 10% of the bank’s capital and surplus for all covered transactions with any one affiliate, and 20% of capital and surplus for all covered transactions with all affiliates. Any extensions of credit to affiliates, with limited exceptions, must be secured by eligible collateral in specified amounts. Banks are also prohibited from purchasing any “low quality” assets from an affiliate. The Dodd-Frank Act generally enhanced the restrictions on transactions with affiliates under Section 23A and 23B of the FRA, including an expansion of the definition of “covered transactions” and an increase in the amount of time for which collateral requirements regarding covered credit transactions must be satisfied. Insider transaction limitations are expanded through the strengthening of restrictions on loans to insiders and the expansion of the types of transactions subject to the various limits, including derivatives transactions, repurchase agreements, reverse repurchase agreements and securities lending or borrowing transactions. The Federal Reserve has promulgated Regulation W, which codifies prior interpretations under Sections 23A and 23B of the FRA and provides interpretive guidance with respect to affiliate transactions. Affiliates of a bank include, among other entities, a bank’s BHC and companies that are under common control with the bank. We are considered to be an affiliate of the Bank.
We are also subject to restrictions on extensions of credit to our executive officers, directors, stockholders who own more than 10% of our common stock, and their related interests. These extensions of credit must be made on substantially the same terms, including interest rates and collateral, as those prevailing at the time for comparable transactions with third parties, and must not involve more than the normal risk of repayment or present other unfavorable features. Loans to such persons and certain affiliated entities of any of the foregoing may not exceed, together with all other outstanding loans to such person and affiliated entities, the institution’s loans-to-one-borrower limit. Federal regulations also prohibit loans above amounts prescribed by the appropriate federal banking agency to directors, executive officers, stockholders who own more than 10% of an institution, and their respective affiliates, unless such loans are approved in advance by a majority of the board of directors of the institution. Any “interested” director may not participate in the vote. The proscribed loan amount, which includes all other outstanding loans to such person, as to which such prior board of director approval is required, is the greater of $25,000 or 5% of capital and surplus up to $500,000. Furthermore, we are prohibited from engaging in asset purchases or sales transactions with our officers, directors, or principal stockholders unless the transaction is on market terms and, if the transaction represents greater than 10% of the capital and surplus of the Bank, a majority of the Bank’s disinterested directors has approved the transaction.
Indemnification payments to any director, officer or employee of either a bank or a BHC are subject to certain constraints imposed by the FDIC.
Incentive Compensation
Federal banking agencies have issued guidance on incentive compensation policies intended to ensure that the incentive compensation policies of banking organizations do not undermine the safety and soundness of such organizations by encouraging excessive risk-taking. The guidance, which covers all employees that have the ability to materially affect the risk profile of an organization, is based upon the key principles that a banking organization’s incentive compensation arrangements should (i) provide incentives that do not encourage risk-taking beyond the organization’s ability to effectively identify and manage risks, (ii) be compatible with effective internal controls and risk management, and (iii) be supported by strong corporate governance, including active and effective oversight by the organization’s board of directors. In accordance with the Dodd-Frank Act, the federal banking agencies prohibit incentive-based compensation arrangements that encourage inappropriate risk taking by covered financial institutions (generally institutions that have over $1 billion in assets) and are deemed to be excessive, or that may lead to material losses.
|
21
|
||
The Federal Reserve will review, as part of its standard, risk-focused examination process, the incentive compensation arrangements of banking organizations (such as the Company) that are not “large, complex banking organizations.” These reviews will be tailored to each organization based on the scope and complexity of the organization’s activities and the prevalence of incentive compensation arrangements. The findings of the supervisory initiatives will be included in reports of examination. Deficiencies will be incorporated into the organization’s supervisory ratings, which can affect the organization’s ability to make acquisitions and take other actions. Enforcement actions may be taken against a banking organization if its incentive compensation arrangements, or related risk-management control or governance processes, pose a risk to the organization’s safety and soundness and the organization is not taking prompt and effective measures to correct the deficiencies.
The scope and content of the U.S. banking regulators’ policies on executive compensation may continue to evolve in the near future. It cannot be determined at this time whether compliance with such policies will adversely affect the Company’s ability to hire, retain and motivate its key employees.
Deposit Insurance
Our deposits are insured up to applicable limits by the DIF of the FDIC. The DIF is the successor to the Bank Insurance Fund and the Savings Association Insurance Fund, which were merged in 2006. Deposit insurance is mandatory. We are required to pay assessments to the FDIC on a quarterly basis. The assessment amount is the product of multiplying the assessment base by the assessment amount.
The assessment base against which the assessment rate is applied to determine the total assessment due for a given period is the depository institution’s average total consolidated assets during the assessment period less average tangible equity during that assessment period. Tangible equity is defined in the assessment rule as Tier 1 Capital and is calculated monthly, unless the insured depository institution has less than $1 billion in assets, in which case the insured depository institution calculates Tier 1 Capital on an end-of-quarter basis. Parents or holding companies of other insured depository institutions are required to report separately from their subsidiary depository institutions.
The FDIC’s methodology for setting assessments for individual banks has changed over time, although the broad policy is that lower-risk institutions should pay lower assessments than higher-risk institutions. The FDIC now uses a methodology, known as the “financial ratios method,” that began to apply on July 1, 2016, in order to meet requirements of the Dodd-Frank Act. The statute established a minimum designated reserve ratio, or the DRR, for the DIF of 1.35% of the estimated insured deposits and required the FDIC to adopt a restoration plan should the reserve ratio fall below 1.35%. The financial ratios took effect when the DRR exceeded 1.15%. The FDIC declared that the DIF reserve ratio exceeded 1.15% by the end of the second quarter of 2016. Accordingly, beginning July 1, 2016, the FDIC began to use the financial ratios method. This methodology assigns a specific assessment rate to each institution based on the institution’s leverage capital, supervisory ratings, and information from the institution’s call report. Under this methodology, the assessment rate schedules used to determine assessments due from insured depository institutions become progressively lower when the reserve ratio in the DIF exceeds 2% and 2.5%.
In addition to the assessment for deposit insurance, insured depository institutions are required to make payments on bonds issued in the late 1980s by the Financing Corporation to recapitalize a predecessor deposit insurance fund. This payment is established quarterly and, for the
fourth
quarter in calendar year
2018
, equaled .32 basis points on assessable deposits.
The Dodd-Frank Act also raised the limit for federal deposit insurance to $250,000 for most deposit accounts and increased the cash limit of Securities Investor Protection Corporation protection from $100,000 to $250,000.
The FDIC has authority to increase insurance assessments. A significant increase in insurance assessments would likely have an adverse effect on our operating expenses and results of operations. We
|
22
|
||
cannot predict what insurance assessment rates will be in the future. Furthermore, deposit insurance may be terminated by the FDIC upon a finding that an insured depository institution has engaged in unsafe or unsound practices, is in an unsafe or unsound condition to continue operations, or has violated any applicable law, regulation, rule, order, or condition imposed by the FDIC.
Dividends
Capital Bancorp, Inc. is a legal entity separate and distinct from Capital Bank. Our ability to pay dividends and make other distributions depends in part upon the receipt of dividends from the Bank and is limited by federal and state law. The specific limits depend upon a number of factors, including the bank’s recent earnings, recent dividends, level of capital, and regulatory status. The regulators are authorized, and under certain circumstances are required, to determine that the payment of dividends or other distributions by a bank would be an unsafe or unsound practice and to prohibit that payment. For example, the FDIA generally prohibits a depository institution from making any capital distribution (including payment of a dividend) or paying any management fee to its parent holding company if the depository institution would thereafter be undercapitalized. Failure to satisfy the capital conservation buffer requirement may also result in limits on our ability to pay dividends. See “—Capital Adequacy Guidelines.”
A national bank generally may not withdraw, either in the form of a dividend or otherwise, any portion of its permanent capital and may not declare a dividend in excess of its retained net profits. Further, dividends that may be paid by a national bank without the express approval of the OCC are limited to an amount equal to the bank’s retained net profits for the preceding two calendar years plus retained net profits up to the date of any dividend declaration in the current calendar year. Retained net profits, as defined by the OCC, consist of net income, less dividends declared during the period. Dividend payments by the Bank in the future will require the generation of net income and could require regulatory approval if any proposed dividends are in excess of prescribed guidelines.
Capital Adequacy Guidelines
In December 2010, the Basel Committee on Banking Supervision released its final framework for strengthening international capital and liquidity regulation, or Basel III. Basel III requires banks to maintain a higher level of capital than previously required, with a greater emphasis on common equity. The Dodd-Frank Act imposed generally applicable capital requirements with respect to BHCs and their bank subsidiaries and mandated that the federal banking regulatory agencies adopt rules and regulations to implement the Basel III requirements.
Among other things, the Dodd-Frank Act requires the Federal Reserve to apply consolidated capital requirements to a BHC that are no less stringent than those currently applied to depository institutions. In July 2013, the federal banking agencies adopted a final rule, or the Basel III Final Rule, implementing these standards. Under the Basel III Final Rule, trust preferred securities are excluded from Tier I capital unless such securities were issued prior to May 19, 2010 by a BHC with less than $15 billion in assets, subject to certain limits. The Dodd-Frank Act additionally provides for countercyclical capital requirements so that the required amount of capital increases in times of economic expansion and decreases in times of economic contraction, consistent with safety and soundness. Under the Basel III Final Rule, which implements this concept, banks must maintain a capital conservation buffer consisting of additional common equity Tier 1 capital equal to 2.5% of risk-weighted assets above each of the required minimum capital levels in order to avoid limitations on paying dividends, engaging in share repurchases, and paying certain discretionary bonuses. This new capital conservation buffer requirement began to be phased in beginning in January 2016 at 0.625% of risk-weighted assets and will increase by this amount each year until fully implemented at 2.5% in January 2019. As of January 1, 2018, the capital conservation buffer had phased in to 1.875%.
For purposes of calculating risk-weighted assets, the federal banking agencies have promulgated risk-based capital guidelines designed to make regulatory capital requirements more sensitive to differences in risk profiles among banks, to account for off-balance sheet exposures, and to minimize disincentives for
|
23
|
||
holding liquid assets. Under these guidelines, assets and off-balance sheet items are assigned to broad risk categories, each with appropriate weights. The resulting capital ratios represent capital as a percentage of total risk-weighted assets and off-balance sheet items.
In addition, certain off-balance sheet items are assigned certain credit conversion factors to convert them to asset-equivalent amounts to which an appropriate risk-weighting will apply. Those computations result in the total risk-weighted assets. Most loans are assigned to the 100% risk category, except for performing first mortgage loans fully secured by residential property, which carry a 50% risk weighting. Most investment securities (including, primarily, general obligation claims of states or other political subdivisions of the United States) are assigned to the 20% category. Exceptions include municipal or state revenue bonds, which have a 50% risk weighting, and direct obligations of the United States Treasury or obligations backed by the full faith and credit of the United States government, which have a 0% risk weighting. In converting off-balance sheet items, direct credit substitutes, including general guarantees and standby letters of credit backing financial obligations, are given a 100% risk weighting. Transaction-related contingencies such as bid bonds, standby letters of credit backing non-financial obligations, and undrawn commitments (including commercial credit lines with an initial maturity of more than one year) have a 50% risk weighting. Short-term commercial letters of credit have a 20% risk weighting, and certain short-term unconditionally cancelable commitments have a 0% risk weighting.
Revised minimum capital standards for banks of our size took effect on January 1, 2015 with a phase-in period that generally extended through January 1, 2019 for certain of the changes.
Under the Basel III Final Rule, the minimum ratio of total capital to risk-weighted assets (including certain off-balance sheet activities, such as standby letters of credit) is 8%. The required ratio of “Tier 1 Capital” (consisting generally of stockholders’ equity and qualifying preferred stock, less certain goodwill items and other intangible assets) to risk-weighted assets rose to 6% from the earlier 4%. While there was previously no required ratio of “Common Equity Tier 1 Capital,” or CET1 (which generally consists of common stock, retained earnings, certain qualifying capital instruments issued by consolidated subsidiaries, and Accumulated Other Comprehensive Income, subject to certain adjustments) to risk-weighted assets, a required minimum ratio of 4.5% became effective on January 1, 2015 as well. The remainder of total capital, or Tier 2 Capital, may consist of (a) the allowance for loan losses of up to 1.25% of risk-weighted assets, (b) preferred stock not qualifying as Tier 1 Capital, (c) hybrid capital instruments, (d) perpetual debt, (e) mandatory convertible securities, and (f) certain subordinated debt and intermediate-term preferred stock up to 50% of Tier 1 Capital. Total Capital is the sum of Tier 1 Capital and Tier 2 Capital (which is included only to the extent of Tier 1 Capital), less reciprocal holdings of other banking organizations’ capital instruments, investments in unconsolidated subsidiaries, and any other deductions as determined by the appropriate regulator.
During 2018, banking organizations, including the Bank, were required to maintain a CET1 capital ratio of at least 6.375%, a Tier 1 capital ratio of at least 7.875%, and a total capital ratio of at least 9.875% to avoid limitations on capital distributions and certain discretionary incentive compensation payments. The requirements were fully phased-in on January 1, 2019, including the 2.5% capital conservation buffer, and the Bank is now required to meet a minimum Tier 1 leverage ratio of 4.0%, a minimum CET1 to risk-weighted assets ratio of 7%, a Tier 1 capital to risk-weighted assets ratio of 8.5% and a minimum total capital to risk-weighted assets ratio of 10.5%. In August of 2018 the Regulatory Relief Act directed the Federal Reserve Board to revise the Small BHC Policy Statement to raise the total consolidated asset limit in the Small BHC Policy Statement from $1 billion to $3 billion. The Company was previously required to comply with the minimum capital requirements on a consolidated basis; however, the Company continues to meet the conditions of the revised Small BHC Policy Statement and was, therefore, exempt from the consolidated capital requirements at December 31, 2018.
The Basel III Final Rule also established minimum leverage ratio requirements for banking organizations, calculated as the ratio of Tier 1 Capital to adjusted average consolidated assets. Prior to the effective date of the Basel III Final Rule, banks and BHCs meeting certain specified criteria, including having the highest
|
24
|
||
regulatory rating and not experiencing significant growth or expansion, were permitted to maintain a minimum leverage ratio of Tier 1 Capital to adjusted average quarterly assets equal to 3%. Other banks and BHCs generally were required to maintain a minimum leverage ratio between 4% and 5%. Under the Basel III Final Rule, as of January 1, 2015, the required minimum leverage ratio for all banks is 4%. As discussed under “—Prompt Corrective Action,” depository institutions and depository holding companies with less than $10 billion in total consolidated assets, such as the Company and the Bank, will be deemed to satisfy both the leverage and risk-based capital requirements, provided they satisfy a new “Community Bank Leverage Ratio” required to be promulgated by the federal banking agencies.
As an additional means of identifying problems in the financial management of depository institutions, the federal banking regulatory agencies have established certain non-capital safety and soundness standards for institutions for which they are the primary federal regulator. The standards relate generally to operations and management, asset quality, interest rate exposure, and executive compensation. The agencies are authorized to take action against institutions that fail to meet such standards.
The requirements of the Dodd-Frank Act are still in the process of being implemented over time and most will be subject to regulations implemented over the course of several years. In addition, the Regulatory Relief Act modifies a number of provisions in the Dodd-Frank Act, but are subject to implementing regulations. Given the uncertainty associated with the manner in which the provisions of the Dodd-Frank Act and the Regulatory Relief Act will be implemented by the various regulatory agencies and through regulations, the full extent of the impact such requirements will have on our operations is unclear. On August 25, 2017, the federal banking agencies proposed an extension of the transition period for application of the Basel III-based capital rules to certain investments. If the proposed extension of the transition period is finalized substantially as proposed in August 2017, the capital treatment proposed therein would remain effective until such time as the changes proposed in the new rule proposal would be finalized and effective. On September 27, 2017, the federal banking agencies proposed a rule intended to reduce the regulatory compliance burden, particularly on community banking organizations, by simplifying several requirements in the Basel III-based capital rules. Specifically, the proposed rule simplifies the capital treatment for certain acquisition, development, and construction loans, mortgage servicing assets, certain deferred tax assets, investments in the capital instruments of unconsolidated financial institutions, and minority interest. The Regulatory Relief Act addressed the capital treatment of certain acquisition, development and construction loans. See “—Commercial Real Estate Concentration Guidelines.”
In December 2017, the Basel Committee published standards that it described as the finalization of the Basel III post-crisis regulatory reforms, which standards are commonly referred to as Basel IV. Among other things, these standards revise the Basel Committee’s standardized approach for credit risk (including the recalibration of the risk weights and the introduction of new capital requirements for certain “unconditionally cancellable commitments,” such as unused credit card lines of credit) and provides a new standardized approach for operational risk capital. Under the Basel framework, these standards will generally be effective on January 1, 2022, with an aggregate output floor phasing in through January 1, 2027. Under the current U.S. capital rules, operational risk capital requirements and a capital floor apply only to advanced approaches institutions, and not to the Bank. The impact of Basel IV on us will depend on the manner in which it is implemented by the federal bank regulators.
Commercial Real Estate Concentration Guidelines
In December 2006, the federal banking regulators issued guidance entitled “Concentrations in Commercial Real Estate Lending, Sound Risk Management Practices” to address increased concentrations in commercial real estate, or CRE, loans. In addition, in December 2015, the federal bank agencies issued additional guidance entitled “Statement on Prudent Risk Management for Commercial Real Estate Lending.” Together, these guidelines describe the criteria the agencies will use as indicators to identify institutions potentially exposed to CRE concentration risk. An institution that has (i) experienced rapid growth in CRE lending, (ii) notable exposure to a specific type of CRE, (iii) total reported loans for construction, land development, and other land representing 100% or more of the institution’s capital, or (iv) total non-owner-
|
25
|
||
occupied CRE (including construction) loans representing 300% or more of the institution’s capital, and the outstanding balance of the institutions CRE portfolio has increased by 50% or more in the prior 36 months, may be identified for further supervisory analysis of the level and nature of its CRE concentration risk.
Currently, loans categorized as “high-volatility commercial real estate,” or HVCRE, loans are required to be assigned a 150% risk weight, and require additional capital support. HVCRE loans are defined to include any credit facility that finances or has financed the acquisition, development or construction of real property, unless it finances: 1-4 family residential properties; certain community development investments; agricultural land used or usable for, and whose value is based on, agricultural use; or commercial real estate projects in which (i) the loan to value is less than the applicable maximum supervisory loan to value ratio established by the bank regulatory agencies, (ii) the borrower has contributed cash or unencumbered readily marketable assets, or has paid development expenses out of pocket, equal to at least 15% of the appraised “as completed” value, (iii) the borrower contributes its 15% before the bank advances any funds and (iv) the capital contributed by the borrower, and any funds internally generated by the project, are contractually required to remain in the project until the facility is converted to permanent financing, sold or paid in full.
The Regulatory Relief Act prohibits federal banking agencies from assigning heightened risk weights to HVCRE exposures, unless the exposures are classified as HVCRE acquisition, development and construction loans. The Federal banking agencies issued a proposal in September 2017 to simplify the treatment of HVCRE and to create a new category of commercial real estate loans called “high-volatility acquisition, development or construction,” or HVADC, loans, with a lower risk weight of 130%. A significant difference between the Regulatory Relief Act and the agencies’ HVADC proposal arises from the Regulatory Relief Act’s preservation of the exemption for projects where the borrower has contributed at least 15% of the real property’s appraised “as completed” value.
At
December 31, 2018
, the Bank’s construction to total capital ratio was
143.4%
, its total non-owner occupied commercial real estate (including construction) to total capital ratio was
339.5%
and therefore exceeded the 100% and 300% regulatory guideline thresholds set forth in clauses (iii) and (iv) above. As a result, we are deemed to have a concentration in commercial real estate lending under applicable regulatory guidelines.
Prompt Corrective Action
In addition to the required minimum capital levels described above, federal law establishes a system of “prompt corrective actions” that federal banking agencies are required to take, and certain actions that they have discretion to take, based upon the capital category into which a federally regulated depository institution falls. Regulations set forth detailed procedures and criteria for implementing prompt corrective action in the case of any institution which is not adequately capitalized. Under the prompt corrective action rules, an institution is deemed “well capitalized” if its leverage ratio, Common Equity Tier 1 ratio, Tier 1 Capital ratio, and Total Capital ratio meet or exceed 5%, 6.5%, 8%, and 10%, respectively. An institution is deemed to be “adequately capitalized” or better if its leverage, Common Equity Tier 1, Tier 1, and Total Capital ratios meet or exceed the minimum federal regulatory capital requirements set forth in the Basel III Final Rule. An institution is “undercapitalized” if it fails to meet the minimum capital requirements. An institution is “significantly undercapitalized” if any one of its leverage, Common Equity Tier 1, Tier 1, and Total Capital ratios falls below 3%, 3%, 4%, and 6%, respectively, and “critically undercapitalized” if the institution has a ratio of tangible equity to total assets that is equal to or less than 2%.
The Regulatory Relief Act requires the federal banking agencies to promulgate a rule establishing a new “Community Bank Leverage Ratio,” or CBLR, of 8% to 10% for depository institutions and depository institution holding companies, including banks and BHCs, with less than $10 billion in total consolidated assets, such as the Company and the Bank. If such a depository institution or holding company maintains tangible equity in excess of this leverage ratio, it would be deemed in compliance with (1) the leverage and risk-based capital requirements promulgated by the federal banking agencies; (2) in the case of a depository institution, the capital ratio requirements to be considered “well capitalized” under the federal banking
|
26
|
||
agencies’ “prompt corrective action” regime; and (3) any other capital or leverage requirements to which the depository institution or holding company is subject, in each case, unless the appropriate federal banking agency determines otherwise based on the particular institution’s risk profile. The Regulatory Relief Act defines the CBLR differently from the leverage ratio used in determining a bank’s prompt corrective action status.
The prompt corrective action rules require an undercapitalized institution to file a written capital restoration plan, along with a performance guaranty by its holding company or a third party. In addition, an undercapitalized institution becomes subject to certain automatic restrictions, including a prohibition on payment of dividends and a limitation on asset growth and expansion in certain cases, a limitation on the payment of bonuses or raises to senior executive officers, and a prohibition on the payment of certain “management fees” to any “controlling person.” Institutions that are classified as undercapitalized are also subject to certain additional supervisory actions, including increased reporting burdens and regulatory monitoring; limitations on the institution’s ability to make acquisitions, open new branch offices or engage in new lines of business; obligations to raise additional capital; restrictions on transactions with affiliates; and restrictions on interest rates paid by the institution on deposits. In certain cases, banking regulatory agencies may require replacement of senior executive officers or directors, or sale of the institution to a willing purchaser. If an institution is deemed to be “critically undercapitalized” and continues in that category for 90 days, the statute requires, with certain narrowly limited exceptions, that the institution be placed in receivership.
An insured depository institution’s capital levels may have consequences outside the prompt corrective action regime. For example, only well-capitalized institutions may accept brokered deposits without restrictions on rates, while adequately capitalized institutions must seek a waiver from the FDIC to accept such deposits and are subject to rate restrictions. Well-capitalized institutions may be eligible for expedited treatment of certain applications, an advantage not available to other institutions.
As noted above, Basel III integrates the new capital requirements into the prompt corrective action category definitions. The following capital requirements have applied to the Bank since January 1, 2015.
|
Capital
Category
|
Total Risk-Based
Capital Ratio |
|
Tier 1 Risk-Based
Capital Ratio |
|
Common Equity
Tier 1 (CET1) Capital Ratio
|
|
Leverage Ratio
|
|
Tangible Equity
to Assets
|
|
Supplemental
Leverage Ratio
|
|
|
Well Capitalized
|
10% or greater
|
8% or greater
|
6.5% or greater
|
5% or greater
|
n/a
|
n/a
|
||||||
|
Adequately Capitalized
|
8% or greater
|
6% or greater
|
4.5% or greater
|
4% or greater
|
n/a
|
3% or greater
|
||||||
|
Undercapitalized
|
Less than 8%
|
Less than 6%
|
Less than 4.5%
|
Less than 4%
|
n/a
|
Less than 3%
|
||||||
|
Significantly Undercapitalized
|
Less than 6%
|
Less than 4%
|
Less than 3%
|
Less than 3%
|
n/a
|
n/a
|
||||||
|
Critically Undercapitalized
|
n/a
|
n/a
|
n/a
|
n/a
|
Less than 2%
|
n/a
|
||||||
As of
December 31, 2018
, the Bank was well capitalized according to the guidelines generally discussed above. As of
December 31, 2018
, the Company had a consolidated ratio of
14.2%
of total capital to risk-weighted assets, a consolidated ratio of
13.0%
of Tier 1 capital to risk-weighted assets, a consolidated ratio of
12.7%
of common equity Tier 1 capital, and a leverage ratio of
10.8%
, and the Bank had a ratio of
12.3%
of total capital to risk-weighted assets, a ratio of
11.0%
of common equity Tier 1 capital, a ratio of
11.0%
of Tier 1 capital to risk-weighted assets and a leverage ratio of
9.1%
.
Safety and Soundness Standards
The federal banking agencies have adopted guidelines designed to assist the federal banking agencies in identifying and addressing potential safety and soundness concerns before capital becomes impaired. The guidelines set forth operational and managerial standards relating to (i) internal controls, information systems and internal audit systems, (ii) loan documentation, (iii) credit underwriting, (iv) asset growth, (v) earnings and (vi) compensation, fees and benefits.
|
27
|
||
In addition, the federal banking agencies have adopted safety and soundness guidelines with respect to asset quality and for evaluating and monitoring earnings to ensure that earnings are sufficient for the maintenance of adequate capital and reserves. These guidelines provide six standards for establishing and maintaining a system to identify problem assets and prevent those assets from deteriorating. Under these standards, an insured depository institution should (i) conduct periodic asset quality reviews to identify problem assets, (ii) estimate the inherent losses in problem assets and establish reserves that are sufficient to absorb estimated losses, (iii) compare problem asset totals to capital, (iv) take appropriate corrective action to resolve problem assets, (v) consider the size and potential risks of material asset concentrations and (vi) provide periodic asset quality reports with adequate information for management and the board of directors to assess the level of asset risk.
Community Reinvestment Act
The CRA requires the federal banking regulatory agencies to assess all financial institutions that they regulate to determine whether these institutions are meeting the credit needs of the communities they serve, including their assessment area(s) (as established for these purposes in accordance with applicable regulations based principally on the location of branch offices). In addition to substantial penalties and corrective measures that may be required for a violation of certain fair lending laws, the federal banking agencies may take compliance with such laws and the CRA into account when regulating and supervising other activities and when reviewing applications for various purposes, including bank mergers and the establishment of new branch offices. Under the CRA, institutions are assigned a rating of “outstanding,” “satisfactory,” “needs to improve,” or “unsatisfactory.” An institution’s record in meeting the requirements of the CRA is based on a performance-based evaluation system, and is made publicly available and is taken into consideration in connection with any applications it files with federal regulators to engage in certain activities, including approval of a branch or other deposit facility, mergers and acquisitions, office relocations, or expansions into non-banking activities. Our Bank received a “satisfactory” rating in its most recent CRA evaluation.
Anti-Terrorism, Money Laundering Legislation and OFAC
The Bank is subject to the Bank Secrecy Act and the Uniting and Strengthening America by Providing Appropriate Tools Required to Intercept and Obstruct Terrorism Act of 2001, or the USA Patriot Act. These statutes and related rules and regulations impose requirements and limitations on specified financial transactions and accounts and other relationships intended to guard against money laundering and terrorism financing. The principal requirements for an insured depository institution include (i) establishment of an anti-money laundering program that includes training and audit components, (ii) establishment of a “know your customer” program involving due diligence to confirm the identities of persons seeking to open accounts and to deny accounts to those persons unable to demonstrate their identities, (iii) the filing of currency transaction reports for deposits and withdrawals of large amounts of cash, (iv) additional precautions for accounts sought and managed for non-U.S. persons and (v) verification and certification of money laundering risk with respect to private banking and foreign correspondent banking relationships. For many of these tasks a bank must keep records to be made available to its primary federal regulator. Anti-money laundering rules and policies are developed by a bureau within the U.S. Department of the Treasury, or the Treasury Department , the Financial Crimes Enforcement Network, but compliance by individual institutions is overseen by its primary federal regulator.
The Bank has established appropriate anti-money laundering and customer identification programs. The Bank also maintains records of cash purchases of negotiable instruments, files reports of certain cash transactions exceeding $10,000 (daily aggregate amount), and reports suspicious activity that might signify money laundering, tax evasion, or other criminal activities pursuant to the Bank Secrecy Act. The Bank otherwise has implemented policies and procedures to comply with the foregoing requirements.
The Treasury Department’s Office of Foreign Assets Control, or OFAC, is responsible for helping to ensure that U.S. entities do not engage in transactions with certain prohibited parties, as defined by various
|
28
|
||
Executive Orders and Acts of Congress. OFAC publishes lists of persons, organizations and countries suspected of aiding, harboring or engaging in terrorist acts, known as Specially Designated Nationals and Blocked Persons. If the Company or the Bank finds a name on any transaction, account or wire transfer that is on an OFAC list, the Company or the Bank must freeze or block such account or transaction, file a suspicious activity report, and notify the appropriate authorities.
Data Privacy and Cybersecurity
The GLBA and the implementing regulations issued by federal regulatory agencies require financial institutions (including banks, insurance agencies, and broker/dealers) to adopt policies and procedures regarding the disclosure of nonpublic personal information about their customers to non-affiliated third parties. In general, financial institutions are required to explain to customers their policies and procedures regarding the disclosure of such nonpublic personal information and, unless otherwise required or permitted by law, financial institutions are prohibited from disclosing such information except as provided in their policies and procedures. Specifically, the GLBA established certain information security guidelines that require each financial institution, under the supervision and ongoing oversight of its board of directors or an appropriate committee thereof, to develop, implement, and maintain a comprehensive written information security program designed to ensure the security and confidentiality of customer information, to protect against anticipated threats or hazards to the security or integrity of such information, and to protect against unauthorized access to or use of such information that could result in substantial harm or inconvenience to any customer.
Recent cyber-attacks against banks and other financial institutions that resulted in unauthorized access to confidential customer information have prompted the federal banking regulators to issue extensive guidance on cybersecurity. Among other things, financial institutions are expected to design multiple layers of security controls to establish lines of defense and ensure that their risk management processes address the risks posed by compromised customer credentials, including security measures to authenticate customers accessing internet-based services. A financial institution also should have a robust business continuity program to recover from a cyberattack and procedures for monitoring the security of third-party service providers that may have access to nonpublic data at the institution.
The Consumer Financial Protection Bureau
The Dodd-Frank Act created the Consumer Financial Protection Bureau, or the CFPB, which is an independent bureau with broad authority to regulate the consumer finance industry, including regulated financial institutions, non-banks and others involved in extending credit to consumers. The CFPB has authority through rulemaking, orders, policy statements, guidance, and enforcement actions to administer and enforce federal consumer financial laws, to oversee several entities and market segments not previously under the supervision of a federal regulator, and to impose its own regulations and pursue enforcement actions when it determines that a practice is unfair, deceptive, or abusive. The federal consumer financial laws and all of the functions and responsibilities associated with them, many of which were previously enforced by other federal regulatory agencies, were transferred to the CFPB on July 21, 2011. While the CFPB has the power to interpret, administer, and enforce federal consumer financial laws, the Dodd-Frank Act provides that the federal banking regulatory agencies continue to have examination and enforcement powers over the financial institutions that they supervise relating to the matters within the jurisdiction of the CFPB if such institutions have less than $10 billion in assets. The Dodd-Frank Act also gives state attorneys general the ability to enforce federal consumer protection laws.
Mortgage Loan Origination
The Dodd-Frank Act authorizes the CFPB to establish certain minimum standards for the origination of residential mortgages, including a determination of the borrower’s ability to repay. Under the Dodd-Frank Act and the implementing final rule adopted by the CFPB, or the ATR/QM Rule, which became effective on January 10, 2014, a financial institution may not make a residential mortgage loan to a consumer unless it
|
29
|
||
first makes a “reasonable and good faith determination” that the consumer has a “reasonable ability” to repay the loan. In addition, the ATR/QM Rule limits prepayment penalties and permits borrowers to raise certain defenses to foreclosure if they receive any loan other than a “qualified mortgage,” as defined by the CFPB. For this purpose, the ATR/QM Rule defines a “qualified mortgage” to include a loan with a borrower debt-to-income ratio of less than or equal to 43% or, alternatively, a loan eligible for purchase by Fannie Mae or Freddie Mac while they operate under federal conservatorship or receivership, and loans eligible for insurance or guarantee by the Federal Housing Administration, the Veterans Administration or the United States Department of Agriculture. Additionally, a qualified mortgage may not (i) contain excess upfront points and fees, (ii) have a term greater than 30 years or (iii) include interest only or negative amortization payments. The ATR/QM Rule specifies the types of income and assets that may be considered in the ability-to-repay determination, the permissible sources for verification, and the required methods of calculating the loan’s monthly payments.
The Regulatory Relief Act provides that for certain insured depository institutions and insured credit unions with less than $10 billion in total consolidated assets, mortgage loans that are originated and retained in portfolio will automatically be deemed to satisfy the “ability to repay” requirement. In order to qualify, the insured depository institutions and credit unions must meet conditions relating to prepayment penalties, points and fees, negative amortization, interest-only features and documentation.
The Regulatory Relief Act directs federal banking agencies to issue regulations exempting certain insured depository institutions and insured credit unions with assets of $10 billion or less from the requirement to establish escrow accounts in connection with certain residential mortgage loans.
Insured depository institutions and insured credit unions that originated fewer than 500 closed-end mortgage loans or 500 open-end lines of credit in each of the two preceding years are exempt from a subset of disclosure requirements (recently imposed by the CFPB) under the Home Mortgage Disclosure Act, or HMDA, provided they have received certain minimum CRA ratings in their most recent examinations.
The Regulatory Relief Act also directs the Comptroller of the Currency to conduct a study assessing the effect of the exemption described above on the amount of HMDA data available at the national and local level.
In addition, Section 941 of the Dodd-Frank Act amended the Securities Exchange Act of 1934, as amended, or the Exchange Act, to require sponsors of asset-backed securities, or ABS, to retain at least 5% of the credit risk of the assets underlying the securities and generally prohibits sponsors from transferring or hedging that credit risk. In October 2014, the federal banking regulatory agencies adopted a final rule to implement this requirement, or the Risk Retention Rule. Among other things, the Risk Retention Rule requires a securitizer to retain not less than 5% of the credit risk of any asset that the securitizer, through the issuance of an ABS, transfers, sells, or conveys to a third party; and prohibits a securitizer from directly or indirectly hedging or otherwise transferring the credit risk that the securitizer is required to retain. In certain situations, the final rule allows securitizers to allocate a portion of the risk retention requirement to the originator(s) of the securitized assets, if an originator contributes at least 20% of the assets in the securitization. The Risk Retention Rule also provides an exemption to the risk retention requirements for an ABS collateralized exclusively by Qualified Residential Mortgages, or QRMs, and ties the definition of a QRM to the definition of a “qualified mortgage” established by the CFPB for purposes of evaluating a consumer’s ability to repay a mortgage loan. The federal banking agencies have agreed to review the definition of QRMs in 2019, following the CFPB’s own review of its “qualified mortgage” regulation. For purposes of residential mortgage securitizations, the Risk Retention Rule took effect on December 24, 2015. For all other securitizations, the rule took effect on December 24, 2016.
The Volcker Rule
In December 2013, five federal financial regulatory agencies, including the Federal Reserve, adopted final rules implementing the so-called “Volcker Rule” embodied in Section 13 of the BHC Act, which was
|
30
|
||
added by the Dodd-Frank Act. In general, the Volcker Rule prohibits banking entities from (1) engaging in short-term proprietary trading for their own accounts, and (2) having certain ownership interests in, and relationships with, hedge funds or private equity funds, or covered funds. The Volcker Rule is intended to provide greater clarity with respect to both the extent of those primary prohibitions and the related exemptions and exclusions.
The Regulatory Relief Act creates an exemption from prohibitions on propriety trading, and relationships with certain investment funds for banking entities with (i) less than $10 billion in total consolidated assets, and (ii) trading assets and trading liabilities of less than 5% of its total consolidated assets. Currently, all banks are subject to these prohibitions pursuant to the Dodd-Frank Act. Any insured depository institution that is controlled by a company that itself exceeds these $10 billion and 5% thresholds would not qualify for the exemption. While the Company would be exempt from the prohibition on proprietary trading pursuant to the Regulatory Relief Act, the Company currently does not have any ownership interest in, or relationships with, hedge funds or private equity funds, or covered funds, or engage in any activities that would have previously subjected it to the Volcker Rule.
Other Provisions of the Dodd-Frank Act
The Dodd-Frank Act implements far-reaching changes across the financial regulatory landscape. In addition to the reforms previously mentioned, the Dodd-Frank Act also:
|
•
|
requires BHCs and banks to be both well capitalized and well managed in order to acquire banks located outside their home state and requires any BHC electing to be treated as a financial holding company to be both well managed and well capitalized;
|
|
•
|
eliminates all remaining restrictions on interstate banking by authorizing national and state banks to establish
de novo
branches in any state that would permit a bank chartered in that state to open a branch at that location; and
|
|
•
|
repeals Regulation Q, the federal prohibition on the payment of interest on demand deposits, thereby permitting depository institutions to pay interest on business transaction and other accounts.
|
A significant number of the rules and regulations mandated by the Dodd-Frank Act have been finalized. Given the uncertainty associated with both the manner in which the provisions of the Dodd-Frank Act will be implemented and the changes required by the Regulatory Relief Act, the full impact of new regulations and guidance on financial institutions’ operations is unclear.
Federal Home Loan Bank Membership
The Bank is a member of the FHLB. Each member of the FHLB is required to maintain a minimum investment in the Class B stock of the FHLB. The Board of Directors of the FHLB can increase the minimum investment requirements in the event it has concluded that additional capital is required to allow it to meet its own regulatory capital requirements. Any increase in the minimum investment requirements outside of specified ranges requires the approval of the Federal Housing Finance Agency. Because the extent of any obligation to increase the level of investment in the FHLB depends entirely upon the occurrence of a future event, we are unable to determine the extent of future required potential payments to the FHLB at this time. Additionally, in the event that a member financial institution fails, the right of the FHLB to seek repayment of funds loaned to that institution will take priority (a super lien) over the rights of all other creditors.
Tax Cuts and Jobs Act of 2017
|
31
|
||
In December 2017, the Tax Cuts and Jobs Act of 2017, or the Tax Act, was signed into law. The Tax Act includes a number of provisions that impact us, including the following:
|
•
|
Tax Rate
. The Tax Act replaces the graduated corporate tax rates applicable under prior law, which imposed a maximum tax rate of 35%, with a reduced 21% flat tax rate. Although the reduced tax rate generally should be favorable to us by resulting in increased earnings and capital, it will decrease the value of our existing deferred tax assets. G
enerally accepted accounting principles (“GAAP”)
requires that the impact of the provisions of the Tax Act be accounted for in the period of enactment, which was 2017. As a result, we recorded net income tax expense of $1.4 million related to this revaluation. Of this amount, $40 thousand of expense was attributable to our net deferred tax asset for unrealized losses on available for sale securities and cash flow hedge. In addition to adjusting the deferred tax asset for this item, we recorded an adjustment to accumulated other comprehensive income with a transfer to retained earnings.
|
|
•
|
Employee Compensation
. A “publicly held corporation” is not permitted to deduct compensation in excess of $1 million per year paid to certain employees. The Tax Act eliminates certain exceptions to the $1 million limit applicable under prior to law related to performance-based compensation, such as equity grants and cash bonuses that are paid only on the attainment of performance goals.
|
|
•
|
Business Asset Expensing
. The Tax Act allows taxpayers immediately to expense the entire cost (instead of only 50%, as under prior law) of certain depreciable tangible property and real property improvements acquired and placed in service after September 27, 2017 and before January 1, 2023 (with an additional year for certain property). This 100% “bonus” depreciation is phased out proportionately for property placed in service on or after January 1, 2023 and before January 1, 2027 (with an additional year for certain property).
|
|
•
|
Interest Expense
. The Tax Act limits a taxpayer’s annual deduction of business interest expense to the sum of (i) business interest income and (ii) 30% of “adjusted taxable income,” defined as a business’s taxable income without taking into account business interest income or expense, net operating losses, and, for 2018 through 2021, depreciation, amortization and depletion.
|
Other Laws and Regulations
Our operations are subject to several additional laws, some of which are specific to banking and others of which are applicable to commercial operations generally. For example, with respect to our lending practices, we are subject to the following laws and regulations, among several others:
|
•
|
Truth-In-Lending Act, governing disclosures of credit terms to consumer borrowers;
|
|
•
|
HMDA, requiring financial institutions to provide information to enable the public and public officials to determine whether a financial institution is fulfilling its obligation to help meet the housing needs of the community it serves;
|
|
•
|
Equal Credit Opportunity Act, prohibiting discrimination on the basis of race, creed, or other prohibited factors in extending credit;
|
|
•
|
Fair Credit Reporting Act of 1978, as amended by the Fair and Accurate Credit Transactions Act, governing the use and provision of information to credit reporting agencies, certain identity theft protections, and certain credit and other disclosures;
|
|
•
|
Fair Debt Collection Practices Act, governing the manner in which consumer debts may be collected by collection agencies;
|
|
32
|
||
|
•
|
Real Estate Settlement Procedures Act, requiring certain disclosures concerning loan closing costs and escrows, and governing transfers of loan servicing and the amounts of escrows in connection with loans secured by one-to-four family residential properties;
|
|
•
|
Rules and regulations established by the National Flood Insurance Program; and
|
|
•
|
Rules and regulations of the various federal agencies charged with the responsibility of implementing these federal laws.
|
Our deposit operations are subject to federal laws applicable to depository accounts, including:
|
•
|
Right to Financial Privacy Act, which imposes a duty to maintain confidentiality of consumer financial records and prescribes procedures for complying with administrative subpoenas of financial records;
|
|
•
|
Truth-In-Savings Act, requiring certain disclosures for consumer deposit accounts;
|
|
•
|
Electronic Funds Transfer Act and Regulation E of the Federal Reserve, which govern automatic deposits to and withdrawals from deposit accounts and customers’ rights and liabilities arising from the use of automated teller machines and other electronic banking services; and
|
|
•
|
Rules and regulations of the various federal agencies charged with the responsibility of implementing these federal laws.
|
We are also subject to a variety of laws and regulations that are not limited to banking organizations. For example, in lending to commercial and consumer borrowers, and in owning and operating our own property, we are subject to regulations and potential liabilities under state and federal environmental laws. In addition, we must comply with privacy and data security laws and regulations at both the federal and state level.
We are heavily regulated by regulatory agencies at the federal and state levels. Like most of our competitors, we have faced and expect to continue to face increased regulation and regulatory and political scrutiny, which creates significant uncertainty for us, as well as for the financial services industry in general.
Enforcement Powers
The federal regulatory agencies have substantial penalties available to use against depository institutions and certain “institution-affiliated parties.” Institution-affiliated parties primarily include management, employees, and agents of a financial institution, as well as independent contractors and consultants, such as attorneys, accountants, and others who participate in the conduct of the financial institution’s affairs. An institution can be subject to an enforcement action due to the failure to timely file required reports, the filing of false or misleading information, or the submission of inaccurate reports, or engaging in other unsafe or unsound banking practices. Civil penalties may be as high as $1,924,589 per day for violations.
The Financial Institution Reform Recovery and Enforcement Act provided regulators with greater flexibility to commence enforcement actions against institutions and institution-affiliated parties and to terminate an institution’s deposit insurance. It also expanded the power of banking regulatory agencies to issue regulatory orders. Such orders may, among other things, require affirmative action to correct any harm resulting from a violation or practice, including restitution, reimbursement, indemnification, or guarantees against loss. A financial institution may also be ordered to restrict its growth, dispose of certain assets, rescind agreements or contracts, or take other actions as determined by the ordering agency to be appropriate. The Dodd-Frank Act increases regulatory oversight, supervision and examination of banks, BHCs, and their respective subsidiaries by the appropriate regulatory agency.
Future Legislation and Regulation
|
33
|
||
Regulators have increased their focus on the regulation of the financial services industry in recent years, leading in many cases to greater uncertainty and compliance costs for regulated entities. Proposals that could substantially intensify the regulation of the financial services industry have been and may be expected to continue to be introduced in the United States Congress, in state legislatures, and by applicable regulatory authorities. These proposals may change banking statutes and regulations and our operating environment in substantial and unpredictable ways. If enacted, these proposals could increase or decrease the cost of doing business, limit or expand permissible activities or affect the competitive balance among banks, savings associations, credit unions, and other financial institutions. We cannot predict whether any of these proposals will be enacted and, if enacted, the effect that these proposals, or any implementing regulations, would have on our business, results of operations, or financial condition. See “Risk Factors —Risks Related to the Regulation of Our Industry Legislative and regulatory actions taken now or in the future may increase our costs and impact our business governance structure, financial condition or results of operations.”
ITEM 1A. RISK FACTORS.
Ownership of our common stock involves certain risks. The risks and uncertainties described below are not the only ones we face. You should carefully consider the risks described below, as well as all other information contained in this Annual Report on Form 10-K. Additional risks and uncertainties not presently known to us or that we currently deem immaterial may also impair our business operations. If any of these risks actually occurs, our business, financial condition or results of operations could be materially, adversely affected.
Risks Related to Our Business
As a business operating in the financial services industry, our business and operations may be adversely affected in numerous and complex ways by weak economic conditions.
Our business and operations, which primarily consist of lending money to clients in the form of loans, borrowing money from clients in the form of deposits and investing in securities, are sensitive to general business and economic conditions in the United States. If the U.S. economy weakens, our growth and profitability from our lending, deposit and investment operations could be constrained. Uncertainty about the federal fiscal policymaking process, the medium- and long-term fiscal outlook of the federal government and future tax rates is a concern for businesses, consumers and investors in the United States. In recent years there has been a gradual improvement in the U.S. economy as evidenced by a rebound in the housing market, lower unemployment and higher equity capital markets; however, economic growth has been uneven and opinions vary on the strength and direction of the economy. Uncertainties also have arisen regarding the potential for a reversal or renegotiation of international trade agreements, the effects of the
Tax Act
and the impact such actions and other policies the current administration may have on economic and market conditions.
Weak economic conditions are characterized by numerous factors, including deflation, fluctuations in debt and equity capital markets, a lack of liquidity and depressed prices in the secondary market for mortgage loans, increased delinquencies on mortgage, consumer and commercial loans, residential and commercial real estate price declines and lower home sales and commercial activity. The current economic environment is characterized by interest rates at near historically low levels, which impacts our ability to attract deposits and to generate attractive earnings through our loan and investment portfolios. All of these factors can individually or in the aggregate be detrimental to our business, and the interplay between these factors can be complex and unpredictable. Adverse economic conditions could have a material adverse effect on our business, financial condition and results of operations.
|
34
|
||
Our commercial business and operations are concentrated in the Washington, D.C. and Baltimore metropolitan areas and we are more sensitive than our more geographically diversified competitors to adverse changes in the local economy.
Unlike many of our larger competitors that maintain significant operations located outside our market area, substantially all of our commercial business clients are located and doing business in the Washington, D.C. and Baltimore metropolitan areas. As of
December 31, 2018
, approximately
93%
of our loans held for investment (measured by dollar amount) were made to borrowers who live or conduct business in the Washington, D.C. and Baltimore metropolitan areas. Therefore, our success depends upon the general economic conditions in this area, which we cannot predict with certainty. As a result, our operations and profitability may be more adversely affected by a local economic downturn in the Washington, D.C. and Baltimore metropolitan areas than those of larger, more geographically diverse competitors. A downturn in the local economy generally could make it more difficult for our borrowers to repay their loans and may lead to loan losses that are not offset by operations in other markets; it may also reduce the ability of our depositors to make or maintain deposits with us. For these reasons, any regional or local economic downturn that affects the Washington, D.C. and Baltimore metropolitan areas, or existing or prospective borrowers or depositors in the Washington, D.C. and Baltimore metropolitan areas could have a material adverse effect on our business, financial condition and results of operations. From time to time, our Bank may provide financing to clients who live or have companies or properties located outside our core markets. In such cases, we would face similar local market risk in those communities for these clients.
Our customers and businesses in the Washington, D.C. metropolitan area may be adversely impacted as a result of changes in government spending.
The Washington, D.C. metropolitan area is characterized by a significant number of businesses that are federal government contractors or subcontractors, or which depend on such businesses for a significant portion of their revenues. The impact of a decline in federal government spending, a reallocation of government spending to different industries or different areas of the country or a delay in payments to such contractors could have a ripple effect. Temporary layoffs, staffing freezes, salary reductions or furloughs of government employees or government contractors could have adverse impacts on other businesses in the Company’s market and the general economy of the greater Washington, D.C. metropolitan area, and may indirectly lead to a loss of revenues by the Company’s customers, including vendors and lessors to the federal government and government contractors or to their employees, as well as a wide variety of commercial and retail businesses. Accordingly, such potential federal government activities could lead to increases in past due loans, nonperforming loans, loan loss reserves and charge-offs, and to a corresponding decline in liquidity.
We may not be able to implement aspects of our growth strategy, which may adversely affect our ability to maintain our historical growth and earnings trends.
We have grown rapidly over the last several years, primarily through organic growth. We may not be able to execute on aspects of our expansion strategy, which may impair our ability to sustain our historical rate of growth or prevent us from growing at all. More specifically, we may not be able to generate sufficient new loans and deposits within acceptable risk and expense tolerances or obtain the personnel or funding necessary for additional growth. Various factors, such as economic conditions and competition with other financial institutions, may impede or prohibit the growth of our operations. Further, we may be unable to attract and retain experienced bankers, which could adversely affect our growth. The success of our strategy also depends on our ability to manage our growth effectively, which depends on a number of factors, including our ability to adapt our credit, operational, technology and governance infrastructure to accommodate expanded operations. If we are successful in continuing our growth, we cannot assure you that further growth would offer the same levels of potential profitability, or that we would be successful in controlling costs and maintaining asset quality in the face of that growth. Accordingly, an inability to maintain growth, or an inability to effectively manage growth, could have an adverse effect on our business, financial condition and results of operations.
|
35
|
||
We may not be able to measure and limit our credit risk adequately, which could lead to unexpected losses.
The primary component of our business involves making loans to customers. The business of lending is inherently risky, including risks that the principal of or interest on any loan will not be repaid in a timely manner or at all or that the value of any collateral supporting the loan will be insufficient to cover our outstanding exposure. These risks may be affected by the strength of the borrower’s business sector and local, regional and national market and economic conditions. Many of our loans are made to small- to medium-sized businesses that may be less able to withstand competitive, economic and financial pressures than larger borrowers. Our risk management practices, such as monitoring the concentration of our loans within specific industries, and our credit approval practices may not adequately reduce credit risk. Further, our credit administration personnel, policies and procedures may not adequately adapt to changes in economic or any other conditions affecting customers and the quality of the loan portfolio. A failure to measure and limit the credit risk associated with our loan portfolio effectively could lead to unexpected losses and have an adverse effect on our business, financial condition and results of operations.
Our allowance for loan losses may prove to be insufficient to absorb potential losses in our loan portfolio.
We maintain an allowance for loan losses that represents management’s judgment of probable losses and risks inherent in our loan portfolio. As of
December 31, 2018
, our allowance for loan losses totaled
$11.3 million
, which represents approximately
1.13%
of our total loans held for investment. The level of the allowance reflects management’s continuing evaluation of general economic conditions, diversification and seasoning of the loan portfolio, historic loss experience, identified credit problems, delinquency levels and adequacy of collateral. The determination of the appropriate level of our allowance for loan losses is inherently highly subjective and requires management to make significant estimates of and assumptions regarding current credit risks and future trends, all of which may undergo material changes. Inaccurate management assumptions, deterioration of economic conditions affecting borrowers, new information regarding existing loans, identification or deterioration of additional problem loans, acquisition of problem loans and other factors (including third-party review and analysis), both within and outside of our control, may require us to increase our allowance for loan losses. In addition, our regulators, as an integral part of their periodic examination, review our methodology for calculating, and the adequacy of, our allowance for loan losses and may direct us to make additions to the allowance based on their judgments about information available to them at the time of their examination. Further, if actual charge-offs in future periods exceed the amounts allocated to our allowance for loan losses, we may need additional provisions for loan losses to restore the adequacy of our allowance for loan losses. Finally, the measure of our allowance for loan losses depends on the adoption and interpretation of accounting standards. The Financial Accounting Standards Board, or FASB, has recently issued a new credit impairment model, the Current Expected Credit Loss, or CECL model, which will become applicable to us on January 1, 2020. CECL will require financial institutions to estimate and develop a provision for credit losses over the lifetime of the loan at origination, as opposed to reserving for incurred or probable losses up to the balance sheet date. Under the CECL model, credit deterioration would be reflected in the income statement in the period of origination or acquisition of the loan, with changes in expected credit losses due to further credit deterioration or improvement reflected in the periods in which the expectation changes. Accordingly, the CECL model could require financial institutions like the Bank to increase their allowances for loan losses. Moreover, the CECL model may create more volatility in our level of allowance for loan losses. If we are required to materially increase our level of allowance for loan losses for any reason, such increase could adversely affect our business, financial condition and results of operations.
The small- to medium-sized businesses that we lend to may have fewer resources to weather adverse business developments, which may impair our borrowers’ ability to repay loans.
As of
December 31, 2018
, we had approximately
$122.3 million
of commercial and industrial loans to businesses, which represents approximately
12%
of our total loan portfolio held for investment. Small- to medium-sized businesses frequently have smaller market shares than their competition, may be more
|
36
|
||
vulnerable to economic downturns, often need substantial additional capital to expand or compete and may experience substantial volatility in operating results, any of which may impair a borrower’s ability to repay a loan. In addition, the success of a small- and medium-sized business often depends on the management skills, talents and efforts of a small group of people, and the death, disability or resignation of one or more of these people could have an adverse effect on the business and its ability to repay its loan. If our borrowers are unable to repay their loans, our business, financial condition and results of operations could be adversely affected.
Our commercial real estate and real estate construction loan portfolio exposes us to credit risks that may be greater than the risks related to other types of loans.
As of
December 31, 2018
, approximately
$270.1 million
, or
27%
, of our total loans held for investment were nonresidential real estate loans (including owner-occupied commercial real estate loans) and approximately
$157.6 million
, or
16%
, of our total loans held for investment were construction loans. Further, as of
December 31, 2018
, our commercial real estate loans (excluding owner-occupied commercial real estate loans) totaled
340%
and our construction loans totaled
143%
of our total risk based capital, respectively. These loans typically involve repayment that depends upon income generated, or expected to be generated, by the property securing the loan in amounts sufficient to cover operating expenses and debt service. The availability of such income for repayment may be adversely affected by changes in the economy or local market conditions. These loans expose a lender to the risk of liquidating the collateral securing these loans in times where there may be significant fluctuation of commercial real estate values. Additionally, commercial real estate loans generally involve relatively large balances to single borrowers or related groups of borrowers. Unexpected deterioration in the credit quality of our commercial real estate loan portfolio could require us to increase our allowance for loan losses, which would reduce our profitability and could have an adverse effect on our business, financial condition and results of operations.
Construction loans also involve risks because loan funds are secured by a project under construction and the project is of uncertain value prior to its completion. It can be difficult to accurately evaluate the total funds required to complete a project, and construction lending often involves the disbursement of substantial funds with repayment dependent, in part, on the success of the ultimate project rather than the ability of a borrower or guarantor to repay the loan. If we are forced to foreclose on a project prior to completion, we may be unable to recover the entire unpaid portion of the loan. In addition, we may be required to fund additional amounts to complete a project, incur taxes, maintenance and compliance costs for a foreclosed property and may have to hold the property for an indeterminate period of time, any of which could adversely affect our business, financial condition and results of operations.
Because a significant portion of our loan portfolio held for investment is comprised of real estate loans, negative changes in the economy affecting real estate values and liquidity could impair the value of collateral securing our real estate loans and result in loan and other losses.
As of
December 31, 2018
, approximately
$844.1 million
, or
85%
, of our total loans held for investment were loans with real estate as a primary or secondary component of collateral. The market value of real estate can fluctuate significantly in a short period of time. As a result, adverse developments affecting real estate values and the liquidity of real estate in our primary markets could increase the credit risk associated with our loan portfolio, and could result in losses that adversely affect credit quality, financial condition and results of operations. Negative changes in the economy affecting real estate values and liquidity in our market areas could significantly impair the value of property pledged as collateral on loans and affect our ability to sell the collateral upon foreclosure without a loss or additional losses. Collateral may have to be sold for less than the outstanding balance of the loan, which could result in losses on such loans. Such declines and losses would have an adverse effect on our business, financial condition and results of operations. If real estate values decline, it is also more likely that we would be required to increase our allowance for loan losses, which would adversely affect our business, financial condition and results of operations.
|
37
|
||
A portion of our loan portfolio is comprised of commercial loans secured by receivables, inventory, equipment or other commercial collateral, the deterioration in value of which could expose us to credit losses.
As of
December 31, 2018
, approximately
$122.3 million
, or
12%
, of our total loans held for investment were commercial loans to businesses. In general, these loans are collateralized by general business assets, including, among other things, accounts receivable, inventory and equipment, and most are backed by a personal guaranty of the borrower or principal. These commercial loans are typically larger in amount than loans to individuals and, therefore, have the potential for larger losses on a single loan basis. Additionally, the repayment of commercial loans is subject to the ongoing business operations of the borrower. The collateral securing such loans generally includes movable property such as equipment and inventory, which may decline in value more rapidly than we anticipate exposing us to increased credit risk. Significant adverse changes in the economy or local market conditions in which our commercial lending customers operate could cause rapid declines in loan collectability and the values associated with general business assets resulting in inadequate collateral coverage that may expose us to credit losses and could adversely affect our business, financial condition and results of operations.
System failure or cybersecurity breaches of our network security could subject us to increased operating costs as well as litigation and other potential losses.
Our computer systems and network infrastructure could be vulnerable to hardware and cybersecurity issues. Our operations are dependent upon our ability to protect our computer equipment against damage from fire, power loss, telecommunications failure or a similar catastrophic event. We could also experience a breach by intentional or negligent conduct on the part of employees or other internal sources. Any damage or failure that causes an interruption in our operations could have an adverse effect on our financial condition and results of operations.
Our operations are also dependent upon our ability to protect our computer systems and network infrastructure, including our digital, mobile and internet banking activities, against damage from physical break-ins, cybersecurity breaches and other disruptive problems caused by the internet or other users. Such computer break-ins and other disruptions would jeopardize the security of information stored in and transmitted through our computer systems and network infrastructure, which may result in significant liability, damage our reputation and inhibit the use of our internet banking services by current and potential customers. We regularly add additional security measures to our computer systems and network infrastructure to mitigate the possibility of cybersecurity breaches, including firewalls and penetration testing. However, it is difficult or impossible to defend against every risk being posed by changing technologies as well as acts of cyber-crime. Increasing sophistication of cyber criminals and terrorists make keeping up with new threats difficult and could result in a system breach. Controls employed by our information technology department and cloud vendors could prove inadequate. A breach of our security that results in unauthorized access to our data could expose us to a disruption or challenges relating to our daily operations, as well as to data loss, litigation, damages, fines and penalties, significant increases in compliance costs and reputational damage, any of which could have an adverse effect on our business, financial condition and results of operations.
Our concentration of large loans to a limited number of borrowers may increase our credit risk.
Our growth over the last several years has been partially attributable to our ability to originate and retain large loans. In addition to regulatory limits to which the Bank is subject, we have established an internal policy limiting loans to one borrower, principal or guarantor based on “total exposure,” which represents the aggregate exposure of economically related borrowers for approval purposes; loans in excess of our internal limit require acknowledgment by the Loan Committee of the Bank’s board of directors. Many of these loans have been made to a small number of borrowers, resulting in a concentration of large loans to certain borrowers. As of
December 31, 2018
, our 10 largest borrowing relationships accounted for approximately
8%
of our total loan portfolio held for investment. Along with other risks inherent in these loans, such as the deterioration of the underlying businesses or property securing these loans, this high concentration of
|
38
|
||
borrowers presents a risk to our lending operations. If any one of these borrowers becomes unable to repay its loan obligations as a result of economic or market conditions, or personal circumstances, such as divorce or death, our non-accrual loans and our allowance for loan and lease losses could increase significantly, which could have a material adverse effect on our assets, business, cash flow, condition (financial or otherwise), liquidity, prospects and results of operations.
Appraisals and other valuation techniques we use in evaluating and monitoring loans secured by real property, other real estate owned and repossessed personal property may not accurately describe the net value of the asset.
In considering whether to make a loan secured by real property, we generally require an appraisal of the property. However, an appraisal is only an estimate of the value of the property at the time the appraisal is made and, as real estate values may change significantly in value in relatively short periods of time (especially in periods of heightened economic uncertainty), this estimate may not accurately describe the net value of the real property collateral after the loan is made. As a result, we may not be able to realize the full amount of any remaining indebtedness when we foreclose on and sell the relevant property. In addition, we rely on appraisals and other valuation techniques to establish the value of our other real estate owned, or OREO, and personal property that we acquire through foreclosure proceedings and to determine certain loan impairments. If any of these valuations are inaccurate, our combined and consolidated financial statements may not reflect the correct value of our OREO, and our allowance for loan losses may not reflect accurate loan impairments. This could have an adverse effect on our business, financial condition or results of operations.
We engage in lending secured by real estate and may be forced to foreclose on the collateral and own the underlying real estate, subjecting us to the costs and potential risks associated with the ownership of the real property, or consumer protection initiatives or changes in state or federal law may substantially raise the cost of foreclosure or prevent us from foreclosing at all.
Since we originate loans secured by real estate, we may have to foreclose on the collateral property to protect our investment and may thereafter own and operate such property, in which case we would be exposed to the risks inherent in the ownership of real estate. As of
December 31, 2018
, we held approximately
$142 thousand
in OREO that is currently marketed for sale. The amount that we, as a mortgagee, may realize after a default depends on factors outside of our control, including, but not limited to, general or local economic conditions, environmental cleanup liabilities, assessments, interest rates, real estate tax rates, operating expenses of the mortgaged properties, our ability to obtain and maintain adequate occupancy of the properties, zoning laws, governmental and regulatory rules, and natural disasters. Our inability to manage the amount of costs or size of the risks associated with the ownership of real estate, or writedowns in the value of OREO, could have an adverse effect on our business, financial condition and results of operations.
Additionally, consumer protection initiatives or changes in state or federal law may substantially increase the time and expense associated with the foreclosure process or prevent us from foreclosing at all. A number of states in recent years have either considered or adopted foreclosure reform laws that make it substantially more difficult and expensive for lenders to foreclose on properties in default. Additionally, federal regulators have prosecuted a number of mortgage servicing companies for alleged consumer law violations. If new state or federal laws or regulations are ultimately enacted that significantly raise the cost of foreclosure or raise outright barriers, such could have an adverse effect on our business, financial condition and results of operation.
A lack of liquidity could impair our ability to fund operations and adversely impact our business, financial condition and results of operations.
Liquidity is essential to our business. We rely on our ability to generate deposits and effectively manage the repayment and maturity schedules of our loans and investment securities, respectively, to ensure that we have adequate liquidity to fund our operations. An inability to raise funds through deposits, borrowings,
|
39
|
||
sales of our investment securities, sales of loans or other sources could have a substantial negative effect on our liquidity and our ability to continue our growth strategy.
Our most important source of funds is deposits. As of
December 31, 2018
, approximately
$377.5 million
,
or
39.5%
, of our total deposits were negotiable order of withdrawal, or NOW, savings and money market accounts. Historically our savings, money market deposit and NOW accounts have been stable sources of funds. However, these deposits are subject to potentially dramatic fluctuations in availability or price due to certain factors that may be outside of our control, such as a loss of confidence by customers in us or the banking sector generally, customer perceptions of our financial health and general reputation, increasing competitive pressures from other financial services firms for consumer or corporate customer deposits, changes in interest rates and returns on other investment classes, any of which could result in significant outflows of deposits within short periods of time or significant changes in pricing necessary to maintain current customer deposits or attract additional deposits, increasing our funding costs and reducing our net interest income and net income.
Additional liquidity is provided by our ability to borrow from the Federal Home Loan Bank of Atlanta, or the FHLB, and the Federal Reserve Bank of Richmond. We also may borrow funds from third-party lenders, such as other financial institutions. Our access to funding sources in amounts adequate to finance or capitalize our activities, or on terms that are acceptable to us, could be impaired by factors that affect us directly or the financial services industry or economy in general, such as disruptions in the financial markets or negative views and expectations about the prospects for the financial services industry. Our access to funding sources could also be affected by one or more adverse regulatory actions against us.
Any decline in available funding could adversely impact our ability to originate loans, invest in securities, meet our expenses or fulfill obligations such as repaying our borrowings or meeting deposit withdrawal demands, any of which could, in turn, have an adverse effect on our business, financial condition and results of operations.
Our liquidity could be adversely impacted by our use of wholesale funding sources, including certificates of deposit, and by potential limitations on our ability to obtain brokered deposits.
We utilize brokered deposits as a complementary funding source. We had
$115.3 million
, or
12%
of our total deposits, in “brokered deposit” accounts at
December 31, 2018
. A brokered deposit is a deposit that is obtained from or through the mediation or assistance of a deposit broker, which includes larger correspondent banks and securities brokerage firms. These deposit brokers attract deposits from individuals and companies whose deposit decisions are based almost exclusively on obtaining the highest interest rates. There are risks associated with using brokered deposits. In order to continue to maintain our level of brokered deposits, we may be forced to pay higher interest rates than contemplated by our asset-liability pricing strategy. In addition, banks that become less than “well capitalized” under applicable regulatory capital requirements may be restricted in their ability to accept, or prohibited from accepting, brokered deposits. If this funding source becomes more difficult to access, we will have to seek alternative funding sources in order to continue to fund our growth. This may include increasing our reliance on FHLB advances, attempting to attract non-brokered deposits and selling loans. There can be no assurance that brokered deposits will be available, or if available, sufficient to support our continued growth.
The maturity of brokered certificates of deposit could result in this funding source maturing at one time. Should this occur, it might be difficult to replace the maturing certificates with new brokered certificates of deposit. We have used brokers to obtain these deposits which results in depositors with whom we have no other relationships since these depositors are outside of our market, and there may not be a sufficient source of new brokered certificates of deposit at the time of maturity. In addition, upon maturity, brokers could require us to offer some of the highest interest rates in the country to retain these deposits, which would negatively impact our earnings.
|
40
|
||
In addition, we had
$99.4 million
, or
10%
of our deposits, in certificates of deposit of $250,000 and greater at
December 31, 2018
, of which
$61.0 million
, or
61%
, were due to mature within one year. These deposits are, like brokered deposits, generally interest rate sensitive. We also use listing service deposits that tend to be interest rate sensitive. As of
December 31, 2018
, our certificates of deposit from listing services amounted to
$78.9 million
or
8%
of our deposits. Consequently, these types of deposits may not provide the same stability to a bank’s deposit base as traditional local retail deposit relationships and our liquidity may be negatively affected if that funding source experiences supply difficulties due to loss of investor confidence or a flight to other investments.
We have several large depositor relationships, the loss of which could force us to fund our business through more expensive and less stable sources.
As of
December 31, 2018
, our 10 largest non-brokered depositors accounted for
$205.9
million in deposits, or approximately
22%
of our total deposits. Our board of directors, directly and indirectly, accounted for
$155.8 million
of deposits as of
December 31, 2018
. Withdrawals of deposits by any one of our largest depositors could force us to rely more heavily on borrowings and other sources of funding for our business and withdrawal demands, adversely affecting our net interest margin and results of operations. We may also be forced, as a result of any withdrawal of deposits, to rely more heavily on other, potentially more expensive and less stable funding sources. Consequently, the occurrence of any of these events could have a material adverse effect on our business, financial condition and results of operations.
Our mortgage banking division may not continue to provide us with significant noninterest income.
For the year ended
December 31, 2018
, the Bank originated
$337.1 million
and sold
$344.9 million
of residential mortgage loans net of mortgage banking revenue, and in 2017, the Bank originated
$418.9 million
and sold
$442.0 million
of residential mortgage loans net of mortgage banking revenue. The residential mortgage business is highly competitive and highly susceptible to changes in market interest rates, consumer confidence levels, employment statistics, the capacity and willingness of secondary market purchasers to acquire and hold or securitize loans, and other factors beyond our control. Additionally, in many respects, the traditional mortgage origination business is relationship-based, and dependent on the services of individual mortgage loan officers. The loss of services of one or more loan officers could have the effect of reducing the level of our mortgage production, or the rate of growth of production. As a result of these factors, we cannot be certain that we will be able to maintain or increase the volume or percentage of revenue or net income produced by the residential mortgage business.
We earn income by originating residential mortgage loans for resale in the secondary mortgage market, and disruptions in that market could reduce our operating income.
Historically, we have earned income by originating mortgage loans for sale in the secondary market. A historical focus of our loan origination and sales activities has been to enter into formal commitments and informal agreements with larger banking companies and mortgage investors. Under these arrangements, we originate single-family mortgages that are priced and underwritten to conform to previously agreed criteria before loan funding and are delivered to the investor shortly after funding. However, in the recent past, disruptions in the secondary market for residential mortgage loans have limited the market for, and liquidity of, most mortgage loans other than conforming Fannie Mae and Federal Home Loan Mortgage Corporation, or Freddie Mac, loans. The effects of these disruptions in the secondary market for residential mortgage loans may reappear.
In addition, because government-sponsored entities like Fannie Mae and Freddie Mac, which account for a substantial portion of the secondary market, are governed by federal law, any future changes in laws that significantly affect the activity of these entities could, in turn, adversely affect our operations. In September 2008, Fannie Mae and Freddie Mac were placed into conservatorship by the federal government. The federal government has for many years considered proposals to reform Fannie Mae and Freddie Mac, but the results
|
41
|
||
of any such reform and their impact on us are difficult to predict. To date, no reform proposal has been enacted.
These disruptions may not only affect us but also the ability and desire of mortgage investors and other banks to purchase residential mortgage loans that we originate. As a result, we may not be able to maintain or grow the income we receive from originating and reselling residential mortgage loans, which would reduce our operating income. Additionally, we hold certain mortgage loans that we originated for sale, increasing our exposure to interest rate risk and the value of the residential real estate that serves as collateral for the mortgage loan prior to sale.
Our financial condition, earnings and asset quality could be adversely affected if we are required to repurchase loans originated for sale by our mortgage banking division.
The Bank originates residential mortgage loans for sale to secondary market investors, subject to contractually specified and limited recourse provisions. Because the loans are intended to be originated within investor guidelines, using designated automated underwriting and product-specific requirements as part of the loan application, the loans sold have a limited recourse provision. In general, the Bank may be required to repurchase a previously sold mortgage loan or indemnify an investor if there is non-compliance with defined loan origination or documentation standards including fraud, negligence, material misstatement in the loan documents or non-compliance with applicable law. In addition, the Bank may have an obligation to repurchase a loan if the mortgagor has defaulted early in the loan term or return profits made should the loan prepay within a short period. The potential mortgagor early default repurchase period is up to approximately twelve months after sale of the loan to the investor. The recourse period for fraud, material misstatement, breach of representations and warranties, non-compliance with law or similar matters could be as long as the term of the loan. Mortgages subject to recourse are collateralized by single-family residential properties. Should such loan repurchases become a material issue, our earnings and asset quality could be adversely impacted, which could adversely impact business, financial condition and results of operations.
Delinquencies and credit losses from our OpenSky® credit card division could adversely affect our business, financial condition and results of operations.
Our OpenSky® division provides secured credit cards on a nationwide basis to under-banked populations and those looking to rebuild their credit scores. In order to obtain a credit card from us, the customer must select a credit line amount that they are willing to secure with a matching deposit amount. Available credit lines vary from a minimum of $200 to a maximum of $3,000 per card, with a maximum line of $5,000 available per individual.
Customers then fund a deposit account in an amount equal to the maximum credit line being extended using a debit card, check, wire or Western Union transfer. The customer’s funding of the deposit account as collateral is not a consideration in the credit card approval process, but is a prerequisite to activating the credit line. Credit card eligibility is based on identity and income verification. Our Apollo customer acquisition system includes decision engine software, which we license, to contact relevant third-party data services for identity and income verification. Once the customer’s deposit account has been funded, the credit line is activated and the collateral funds are available to absorb all losses on the account that may occur, except those stated below. As a result, except in those select circumstances identified below, all OpenSky® accounts are secured by deposits up to the amount of the maximum credit limit at the time of account verification.
Although OpenSky® credit cards are secured, losses may occur primarily as a result of fraud, when the account exceeds its established limit or if a cardholder ceases to maintain the account in good standing. Fraud, such as identity fraud, payment fraud and funding fraud (where an individual funds a card using information from someone they know well, such as a relative or roommate) can result in substantial losses. In the case of an OpenSky® account that is funded through fraud on the part of an applicant, we are required by applicable laws to refund the amount of the original deposit, and we charge off balances which were subsequently charged on the card. Customers exceeding established credit limits occurs due to certain VISA membership policies that allow cardholders to incur certain charges even if they exceed their card limits,
|
42
|
||
which include, but are not limited to, rental car charges, gas stations and hotel deposits. If an OpenSky® cardholder exceeds his or her credit limit as a result of purchases in one of these categories, we may incur losses for amounts in excess of the collateral deposited if the borrower is unable to repay such excess amounts. Finally, losses to our credit card portfolio may arise if cardholders cease to maintain the account in good standing with timely payments. For example, in the event a card becomes more than 120 days past due, the credit card balance is recovered against the corresponding deposit account and a charge-off is recorded for any related fees, accrued interest or other charges in excess of the deposit account balance. We have invested heavily in technology and systems to prevent and detect fraudulent behavior and mitigate losses but such investments may not be adequate, and our systems may not adequately monitor or mitigate potential losses arising from these risks.
As of
December 31, 2018
, OpenSky® credit card balances were
$34.7 million
, of which
$32.5 million
were fully secured. Total noninterest bearing collateral deposit account balances were
$60.0 million
as of the same date. As of
December 31, 2018
, approximately
11%
of our credit card portfolio was delinquent by 30 days or more. Based on our prior experience, approximately
19%
of our new secured credit cards will experience a charge-off within the first year of issuance primarily due to the relative inexperience of this under-banked population in effectively managing credit card debt.
Further, using our proprietary scoring model, which considers credit score and repayment history, the Bank has recently begun to offer certain customers an unsecured line in excess of their secured line of credit. At
December 31, 2018
, we had
$1.8 million
of unsecured unused lines of credit and
$2.1 million
of outstanding unsecured credit card advances.
A high credit loss rate (the rate at which we charge off uncollectible loans) on either our secured or unsecured portfolio could adversely impact our overall financial performance. We maintain an allowance for credit losses, which we believe to be adequate to cover credit losses inherent in our OpenSky® portfolio, but we cannot assure you that the allowance will be sufficient to cover actual credit losses.
If credit losses from our OpenSky® portfolio exceed our
allowance for credit losses, our revenues will be reduced by the excess of such credit losses.
The inability of our OpenSky® credit card division to continue its growth rate could adversely affect our earnings.
Our credit card portfolio has increased from
$9.6 million
at December 31, 2014 to
$34.7 million
at
December 31, 2018
and certain corresponding fees have been a significant portion of our income. We cannot assure you that we will be able to retain existing customers or attract new customers, or that we will be able to increase account balances for new or existing customers. Many factors could adversely affect our ability to retain or attract customers and our ability to grow account balances. These factors include general economic factors, competition, the effectiveness of our marketing initiatives, negative press reports regarding our industry or the Company, the general interest rate environment, our ability to recruit or replace experienced management and operations personnel, the availability of funding and delinquency and credit loss rates.
We expect the development and expansion of new credit card products and related cardholder service products to be an important contributor to our growth and earnings in the future. If we are unable to implement new cardholder products and features, our ability to grow will be negatively affected. Declining sales of cardholder service products would likely result in reduced income from fees.
Our business, financial condition and results of operations may be adversely affected by merchants’ increasing focus on the fees charged by credit card networks and by regulation and legislation impacting such fees.
Credit card interchange fees are generally one of the largest components of the costs that merchants pay in connection with the acceptance of credit cards and are a meaningful source of revenue for our OpenSky® division. Interchange fees are the subject of significant and intense global legal, regulatory and
|
43
|
||
legislative focus, and the resulting decisions, regulations and legislation may have an adverse impact on our business, financial condition and results of operations.
In addition to this regulatory activity, merchants are also seeking avenues to reduce interchange fees. During the past few years, merchants and their trade groups have filed numerous lawsuits against Visa, MasterCard, American Express and their card-issuing banks, claiming that their practices toward merchants, including interchange and similar fees, violate federal antitrust laws.
Some major retailers may have sufficient bargaining power to independently negotiate lower interchange fees with MasterCard and Visa, which could, in turn, result in lower interchange fees for us when our cardholders undertake purchase transactions with these retailers. In 2016, some of the largest merchants individually negotiated lower interchange rates with MasterCard and Visa. These and other merchants also continue to lobby aggressively for caps and restrictions on interchange fees and there can be no assurance that their efforts will not be successful or that they will not in the future bring legal proceedings against us or other credit card and debit card issuers and networks.
Beyond pursuing litigation, legislation and regulation, merchants may also promote forms of payment with lower fees, such as ACH-based payments, or seek to impose surcharges at the point of sale for use of credit or debit cards. New payment systems, particularly mobile-based payment technologies, could also gain widespread adoption and lead to issuer transaction fees or the displacement of credit card accounts as a payment method.
The heightened focus by merchants and regulatory and legislative bodies on the fees charged by credit and debit card networks, and the ability of certain merchants to negotiate discounts to interchange fees with MasterCard and Visa successfully or develop alternative payment systems could result in a reduction of interchange fees. Any resulting loss in income to us could have an adverse effect on our business, financial condition and results of operations.
By engaging in derivative transactions, we are exposed to additional credit and market risk.
As part of our mortgage banking activities, we enter into interest rate lock agreements with the consumer. These are commitments to originate loans at a specified interest rate and lock expiration which is set prior to closing. The Company has two options. We may choose to lock the loan and rate directly with an investor using a best effort commitment. This type of commitment has no negative impact to the Bank as long as the loan is closed and funded. Once settlement commences, this type of commitment typically contains a mandatory delivery. Secondly, the Bank may elect to protect the interest rate to the consumer and deliver the loan using short term mandatory commitments once the loan is closed. When the Company chooses this strategy, we hedge the risk by selling an offsetting short position of a mortgage backed security or MBS most correlated to the loan type an expiration. The hedged loan(s) and shorted MBS positions are recorded at fair value with changes in the mark to market recorded as mortgage banking revenue. Furthermore, the hedged interest rate locks and commitments to deliver loans to investors are considered derivatives. The market value of loans with best effort rate lock commitments are not readily ascertainable with precision because they are not actively traded in stand-alone market. The Company determines the fair value of rate lock commitments and delivery contracts by measuring the fair value of the underlying asset, which is impacted by current interest rates, and taking into consideration the probability that the rate lock commitments will close or will be funded.
Hedging interest rate risk is a complex process, requiring sophisticated models and routine monitoring. As a result of interest rate fluctuations, hedged assets and liabilities will appreciate or depreciate in market value. The effect of this unrealized appreciation or depreciation in assets (loans) will generally be offset by income or loss in the corresponding MBS derivative instruments that are linked to the hedged assets and liabilities. By engaging in derivative transactions, we are exposed to counterparty credit and market risk. If the counterparty fails to perform, credit risk exists to the extent of the fair value gain in the derivative. Market risk exists to the extent that interest rates change in ways that are significantly different from what was
|
44
|
||
modeled when we entered into the derivative transaction. The existence of credit and market risk associated with our derivative instruments could adversely affect our mortgage banking revenue and, therefore, could have a material adverse effect on our business, financial condition and results of operations.
We are subject to interest rate risk as fluctuations in interest rates may adversely affect our earnings.
The majority of our banking assets and liabilities are monetary in nature and subject to risk from changes in interest rates. Like most financial institutions, our earnings are significantly dependent on our net interest income, the principal component of our earnings, which is the difference between interest earned by us from our interest earning assets, such as loans and investment securities, and interest paid by us on our interest bearing liabilities, such as deposits and borrowings. We expect that we will periodically experience “gaps” in the interest rate sensitivities of our assets and liabilities, meaning that either our interest bearing liabilities will be more sensitive to changes in market interest rates than our interest earning assets, or vice versa. In either case, if market interest rates should move contrary to our position, this gap will negatively impact our earnings. The impact on earnings is more adverse when the slope of the yield curve flattens; that is, when short-term interest rates increase more than long-term interest rates or when long-term interest rates decrease more than short-term interest rates. Many factors impact interest rates, including governmental monetary policies, inflation, recession, changes in unemployment, the money supply, international economic weakness and disorder and instability in domestic and foreign financial markets. As of
December 31, 2018
, approximately
59%
of our interest earning assets and approximately
52%
of our interest bearing liabilities had a variable interest rate.
Interest rate increases often result in larger payment requirements for our borrowers, which increases the potential for default and could result in a decrease in the demand for loans. At the same time, the marketability of the property securing a loan may be adversely affected by any reduced demand resulting from higher interest rates. In a declining interest rate environment, there may be an increase in prepayments on loans as borrowers refinance their loans at lower rates. In addition, in a low interest rate environment, loan customers often pursue long-term fixed rate credits, which could adversely affect our earnings and net interest margin if rates later increase. Changes in interest rates also can affect the value of loans, securities and other assets. An increase in interest rates that adversely affects the ability of borrowers to pay the principal or interest on loans may lead to an increase in nonperforming assets and a reduction of income recognized, which could have an adverse effect on our results of operations and cash flows. Further, when we place a loan on nonaccrual status, we reverse any accrued but unpaid interest receivable, which decreases interest income. At the same time, we continue to incur costs to fund the loan, which is reflected as interest expense, without any interest income to offset the associated funding expense. Thus, an increase in the amount of nonperforming assets would have an adverse impact on net interest income. If short-term interest rates remain at their historically low levels for a prolonged period and assuming longer-term interest rates fall further, we could experience net interest margin compression as our interest earning assets would continue to reprice downward while our interest bearing liability rates could fail to decline in tandem. Such an occurrence would have an adverse effect on our net interest income and could have an adverse effect on our business, financial condition and results of operations.
Uncertainty about the future of LIBOR may adversely affect our business.
On July 27, 2017, the Chief Executive of the United Kingdom Financial Conduct Authority, which regulates LIBOR, announced that it intends to stop persuading or compelling banks to submit rates for the calibration of LIBOR to the administrator of LIBOR after 2021. The announcement indicates that the continuation of LIBOR on the current basis cannot and will not be guaranteed after 2021. It is impossible to predict whether and to what extent banks will continue to provide LIBOR submissions to the administrator of LIBOR or whether any additional reforms to LIBOR may be enacted in the United Kingdom or elsewhere. At this time, no consensus exists as to what rate or rates may become acceptable alternatives to LIBOR and it is impossible to predict the effect of any such alternatives on the value of LIBOR-based securities and variable rate loans, subordinated debentures, or other securities or financial arrangements, given LIBOR’s role in determining
|
45
|
||
market interest rates globally. Uncertainty as to the nature of alternative reference rates and as to potential changes or other reforms to LIBOR may adversely affect LIBOR rates and other interest rates. In the event that a published LIBOR rate is unavailable after 2021, the value of certain of the Company’s assets and liabilities could be adversely affected. Currently, the manner and impact of this transition and related developments, as well as the effect of these developments on our funding costs, securities portfolio and business, is uncertain.
We face strong competition from financial services companies and other companies that offer banking services.
We operate in the highly competitive financial services industry and face significant competition for customers from financial institutions located both within and beyond our principal markets. We compete with commercial banks, savings banks, credit unions, nonbank financial services companies and other financial institutions operating within or near the areas we serve. Additionally, certain large banks headquartered outside of our markets and large community banking institutions target the same customers we do. In addition, as customer preferences and expectations continue to evolve, technology has lowered barriers to entry and made it possible for banks to expand their geographic reach by providing services over the internet and for nonbanks to offer products and services traditionally provided by banks, such as automatic transfer and automatic payment systems. The banking industry is experiencing rapid changes in technology and, as a result, our future success will depend in part on our ability to address our customers’ needs by using technology. Customer loyalty can be influenced by a competitor’s new products, especially offerings that could provide cost savings or a higher return to the customer. Increased lending activity of competing banks following the recent downturn has also led to increased competitive pressures on loan rates and terms for high quality credits. We may not be able to compete successfully with other financial institutions in our markets, and we may have to pay higher interest rates to attract deposits, accept lower yields to attract loans and pay higher wages for new employees, resulting in lower net interest margins and reduced profitability.
Many of our non-bank competitors are not subject to the same extensive regulations that govern our activities and may have greater flexibility in competing for business. The financial services industry could become even more competitive as a result of legislative, regulatory and technological changes and continued consolidation. In addition, some of our current commercial banking customers may seek alternative banking sources as they develop needs for credit facilities larger than we may be able to accommodate. Our inability to compete successfully in the markets in which we operate could have an adverse effect on our business, financial condition or results of operations.
We are currently subject to certain pending litigation, and may be subject to litigation in the future.
From time to time we may be subject to various litigation matters incidental to the conduct of our business, including foreclosure proceedings, title disputes, commercial disputes, labor and employment disputes and securities class actions. See
Note 18 - Litigation, included in our Notes to Consolidated Financial Statements under Part II. Item 8
for a description of material legal actions in which we are currently involved.
We vigorously defend ourselves in all legal proceedings we are involved in; however, the outcome of litigation and other legal matters is always uncertain. Regardless of the outcome, legal proceedings can have an adverse impact on us because of legal fees and costs, diversion of management resources, and other factors, such as reputational damage. Determining whether reserves are required for any pending proceeding and the amount of any such reserves is a complex, fact-intensive process that requires significant judgment. Any material change in facts and circumstances in a proceeding could cause any reserves we have established to be inadequate. It is possible that a resolution of one or more such proceedings could result in us paying monetary awards, fines or penalties that could adversely affect our business, results of operations, and financial condition.
|
46
|
||
Risks Related to the Regulation of Our Industry
We operate in a highly regulated environment and the laws and regulations that govern our operations, corporate governance, executive compensation and accounting principles, or changes in them, or our failure to comply with them, could adversely affect us.
Banking is highly regulated under federal and state law. As such, we are subject to extensive regulation, supervision and legal requirements that govern almost all aspects of our operations. These laws and regulations are not intended to protect our shareholders. Rather, these laws and regulations are intended to protect customers, depositors, the Deposit Insurance Fund and the overall financial stability of the United States. These laws and regulations, among other matters, prescribe minimum capital requirements, impose limitations on the business activities in which we can engage, limit the dividend or distributions that the Bank can pay to the Company, restrict the ability of institutions to guarantee our debt and impose certain specific accounting requirements on us that may be more restrictive and may result in greater or earlier charges to earnings or reductions in our capital than GAAP would require. Compliance with laws and regulations can be difficult and costly, and changes to laws and regulations often impose additional operating costs. Our failure to comply with these laws and regulations, even if the failure follows good faith effort or reflects a difference in interpretation, could subject us to restrictions on our business activities, enforcement actions and fines and other penalties, any of which could adversely affect our results of operations, regulatory capital levels and the price of our securities. Further, any new laws, rules and regulations, such as the Dodd-Frank Act, could make compliance more difficult or expensive or otherwise adversely affect our business, financial condition and results of operations.
Legislative and regulatory actions taken now or in the future may increase our costs and impact our business, governance structure, financial condition or results of operations.
Economic conditions that contributed to the financial crisis in 2008, particularly in the financial markets, resulted in government regulatory agencies and political bodies placing increased focus and scrutiny on the financial services industry. The Dodd-Frank Act, which was enacted in 2010 in response to the financial crisis, significantly changed the regulation of financial institutions and the financial services industry. The Dodd-Frank Act and the regulations thereunder have affected both large and small financial institutions. The Dodd-Frank Act, among other things, imposed new capital requirements on bank holding companies; changed the base for Federal Deposit Insurance Corporation, or FDIC, insurance assessments to a bank’s average consolidated total assets minus average tangible equity, rather than upon its deposit base; permanently raised the current standard deposit insurance limit to $250,000; and expanded the FDIC’s authority to raise insurance premiums. The Dodd-Frank Act established the Consumer Financial Protection Bureau), or CFPB, as an independent entity within the Federal Reserve, which has broad rulemaking, supervisory and enforcement authority over consumer financial products and services, including deposit products, residential mortgages, home-equity loans and credit cards, and contains provisions on residential mortgage-related matters that address steering incentives, determinations as to a borrower’s ability to repay, prepayment penalties and disclosures to borrowers.
Although the applicability of certain elements of the Dodd-Frank Act is limited to institutions with more than $10 billion in assets, there can be no guarantee that such applicability will not be extended in the future or that regulators or other third parties will not seek to impose such requirements on institutions with less than $10 billion in assets, such as the Bank.
Compliance with the Dodd-Frank Act and its implementing regulations has and may continue to result in additional operating and compliance costs that could have a material adverse effect on our business, financial condition, results of operations and growth prospects.
On May 24, 2018, President Trump signed into law the “Economic Growth, Regulatory Relief and Consumer Protection Act,” or the Regulatory Relief Act, which amends parts of the Dodd-Frank Act, as well as other laws that involve regulation of the financial industry. While the Regulatory Relief Act keeps in place fundamental aspects of the Dodd-Frank Act’s regulatory framework, it does change the regulatory framework for depository institutions with assets under $10 billion, such as the Bank, as well as easing some requirements for larger depository institutions. As more fully discussed under “Supervision and Regulation- Regulatory
|
47
|
||
Relief Act,” the legislation includes a number of provisions which are favorable to bank holding companies, or BHCs, with total consolidated assets of less than $10 billion, such as the Company, and also makes changes to consumer mortgage and credit reporting regulations and to the authorities of the agencies that regulate the financial industry. Because a number of the provisions included in the Regulatory Relief Act require the federal banking agencies to undertake notice and comment rulemaking, it will likely take some time before these provisions are fully implemented.
Federal and state regulatory agencies frequently adopt changes to their regulations or change the manner in which existing regulations are applied. Regulatory or legislative changes to laws applicable to the financial industry, if enacted or adopted, may impact the profitability of our business activities, require more oversight or change certain of our business practices, including the ability to offer new products, obtain financing, attract deposits, make loans and achieve satisfactory interest spreads and could expose us to additional costs, including increased compliance costs. These changes also may require us to invest significant management attention and resources to make any necessary changes to operations to comply and could have an adverse effect on our business, financial condition and results of operations.
As a result of the Dodd-Frank Act and recent rulemaking, the Bank and the Company are subject to more stringent capital requirements.
In July 2013, the U.S. federal banking authorities approved the implementation of the Basel III regulatory capital reforms, or Basel III, and issued rules effecting certain changes required by the Dodd-Frank Act. Basel III is applicable to all U.S. banks that are subject to minimum capital requirements as well as to bank and saving and loan holding companies like us with consolidated assets of more than $1.0 billion. Basel III not only increases most of the required minimum regulatory capital ratios, it introduces a new common equity Tier 1 capital ratio and the concept of a capital conservation buffer. Basel III also expands the current definition of capital by establishing additional criteria that capital instruments must meet to be considered additional Tier 1 and Tier 2 capital. In order to be a “well-capitalized” depository institution under the new regime, an institution must maintain a common equity Tier 1 capital ratio of 6.5% or more; a Tier 1 capital ratio of 8% or more; a total capital ratio of 10% or more; and a Tier 1 leverage ratio of 5% or more. The Basel III capital rules became effective as applied to the Bank on January 1, 2015 and to the Company on January 1, 2018 with a phase-in period that generally extends through January 1, 2019 for many of the changes.
The failure to meet applicable regulatory capital requirements could result in one or more of our regulators placing limitations or conditions on our activities, including our growth initiatives, or restricting the commencement of new activities, and could affect customer and investor confidence, our costs of funds and FDIC insurance costs, our ability to pay dividends on our common stock, our ability to make acquisitions, and our business, results of operations and financial condition.
Federal banking agencies periodically conduct examinations of our business, including compliance with laws and regulations, and our failure to comply with any supervisory actions to which we are or become subject as a result of such examinations could adversely affect us.
As part of the bank regulatory process, the OCC and the Federal Reserve, periodically conduct examinations of our business, including compliance with laws and regulations. If, as a result of an examination, one of these federal banking agencies were to determine that the financial condition, capital resources, asset quality, earnings prospects, management, liquidity, asset sensitivity, risk management or other aspects of any of our operations have become unsatisfactory, or that the Company, the Bank or their respective management were in violation of any law or regulation, it may take a number of different remedial actions as it deems appropriate. These actions include the power to enjoin “unsafe or unsound” practices, to require affirmative actions to correct any conditions resulting from any violation or practice, to issue an administrative order that can be judicially enforced, to direct an increase in our capital levels, to restrict our growth, to assess civil monetary penalties against us, the Bank or their respective officers or directors, to remove officers and directors and, if it is concluded that such conditions cannot be corrected or there is an imminent risk of
|
48
|
||
loss to depositors, to terminate the Bank’s deposit insurance. If we become subject to such regulatory actions, our business, financial condition, results of operations and reputation could be adversely affected.
Monetary policies and regulations of the Federal Reserve could adversely affect our business, financial condition and results of operations.
In addition to being affected by general economic conditions, our earnings and growth are affected by the policies of the Federal Reserve. An important function of the Federal Reserve is to regulate the U.S. money supply and credit conditions. Among the instruments used by the Federal Reserve to implement these objectives are open market purchases and sales of securities by the Federal Reserve, adjustments of both the discount rate and the federal funds rate and changes in reserve requirements against bank deposits. These instruments are used in varying combinations to influence overall economic growth and the distribution of credit, bank loans, investments and deposits. Their use also affects interest rates charged on loans or paid on deposits.
The monetary policies and regulations of the Federal Reserve have had a significant effect on the operating results of commercial banks in the past and are expected to continue to do so in the future. Although we cannot determine the effects of such policies on us at this time, such policies could adversely affect our business, financial condition and results of operations.
Regulatory requirements affecting our loans secured by commercial real estate could limit our ability to leverage our capital and adversely affect our growth and profitability.
The federal bank regulatory agencies have indicated their view that banks with high concentrations of loans secured by commercial real estate are subject to increased risk and should implement robust risk management policies and maintain higher capital than regulatory minimums to maintain an appropriate cushion against loss that is commensurate with the perceived risk. Federal bank regulatory guidelines identify institutions potentially exposed to commercial real estate concentration risk as those that have (i) experienced rapid growth in commercial real estate lending, (ii) notable exposure to a specific type of commercial real estate, (iii) total reported loans for construction, land development and other land loans representing 100% or more of the institution’s capital, or (iv) total non-owner-occupied commercial real estate (including construction) loans representing 300% or more of the institution’s capital if the outstanding balance of the institution’s non-owner-occupied commercial real estate (including construction) loan portfolio has increased 50% or more during the prior 36 months. At
December 31, 2018
, the
Bank’s construction to total capital ratio was
143%
, its total non-owner occupied commercial real estate (including construction) to total capital ratio was
340%
and therefore
exceeded the 100% and 300% regulatory guideline thresholds set forth in clauses (iii) and (iv) above. As a result, we are deemed to have a concentration in commercial real estate lending under applicable regulatory guidelines. Because a significant portion of our loan portfolio depends on commercial real estate, a change in the regulatory capital requirements applicable to us or a decline in our regulatory capital could limit our ability to leverage our capital as a result of these policies, which could have a material adverse effect on our business, financial condition and results of operations.
We cannot guarantee that any risk management practices we implement will be effective to prevent losses relating to our commercial real estate portfolio. Management has implemented controls to monitor our commercial real estate lending concentrations, but we cannot predict the extent to which this guidance will impact our operations or capital requirements.
|
49
|
||
Risks Related to Ownership of Our Common Stock
T
he price of our common stock, like many of our peers, has fluctuated significantly over the recent past and may fluctuate significantly in the future, which may make it difficult for you to resell your shares of common stock at times or at prices you find attractive.
Stock price volatility may make it difficult for holders of our common stock to resell their common stock when desired and at desirable prices. There are many factors that may affect the market price and trading volume of our common stock, including, without limitation, the risks discussed elsewhere in this “Risk Factors” section and:
|
•
|
actual or anticipated fluctuations in our operating results, financial condition or asset quality;
|
|
•
|
changes in economic or business conditions;
|
|
•
|
the effects of, and changes in, trade, monetary and fiscal policies, including the interest rate policies of the Federal Reserve;
|
|
•
|
publication of research reports about us, our competitors or the financial services industry generally, or changes in, or failure to meet, securities analysts’ estimates of our financial and operating performance, or lack of research reports by industry analysts or ceasing of coverage;
|
|
•
|
operating and stock price performance of companies that investors deem comparable to us;
|
|
•
|
additional or anticipated sales of our common stock or other securities by us or our existing shareholders;
|
|
•
|
additions or departures of key personnel;
|
|
•
|
perceptions in the marketplace regarding our competitors or us;
|
|
•
|
significant acquisitions or business combinations, strategic partnerships, joint ventures or capital commitments by or involving our competitors or us;
|
|
•
|
other economic, competitive, governmental, regulatory or technological factors affecting our operations, pricing, products and services; and
|
|
•
|
other news, announcements or disclosures (whether by us or others) related to us, our competitors, our core markets or the financial services industry.
|
The stock market and, in particular, the market for financial institution stocks has experienced substantial fluctuations in recent years, which in many cases have been unrelated to the operating performance and prospects of particular companies. In addition, significant fluctuations in the trading volume in our common stock may cause significant price variations to occur. Increased market volatility may materially and adversely affect the market price of our common stock, which could make it difficult to sell your shares at the volume, prices and times desired.
The market price of our common stock could decline significantly due to actual or anticipated issuances or sales of our common stock in the future.
Our board of directors may determine from time to time that we need to raise additional capital by issuing additional shares of our common stock or other securities. We are not restricted from issuing additional shares of common stock, including securities that are convertible into or exchangeable for, or that represent the right to receive, common stock. Because our decision to issue securities in any future offering will depend on market conditions and other factors beyond our control, we cannot predict or estimate the amount, timing or nature of any future offerings, or the prices at which such offerings may be
|
50
|
||
effected. Such offerings could be dilutive to common shareholders. New investors also may have rights, preferences and privileges that are senior to, and that adversely affect, our then current common shareholders. Additionally, if we raise additional capital by making additional offerings of debt or preferred equity securities, upon liquidation of the Company, holders of our debt securities and shares of preferred stock, and lenders with respect to other borrowings, will receive distributions of our available assets prior to the holders of our common stock. Additional equity offerings may dilute the holdings of our existing shareholders or reduce the market price of our common stock, or both. Holder of our common stock are not entitled to preemptive rights or other protections against dilution.In addition, we may issue shares of our common stock or other securities from time to time as consideration for future acquisitions and investments and pursuant to compensation and incentive plans. If any such acquisition or investment is significant, the number of shares of our common stock, or the number or aggregate principal amount, as the case may be, of other securities that we may issue may be substantial. After expiration of the lock-up period described above, we may also grant registration rights covering those shares of our common stock or other securities in connection with any such acquisitions and investments.
We cannot predict the size of future issuances of our common stock or the effect, if any, that future issuances and sales of our common stock will have on the market price of our common stock. Sales of substantial amounts of our common stock (including shares of our common stock issued in connection with an acquisition or under a compensation or incentive plan), or the perception that such sales could occur, may adversely affect prevailing market prices for our common stock and could impair our ability to raise capital through future sales of our securities.
Our management and board of directors have significant control over our business.
As of
December 31, 2018
, our directors, directors of the Bank, our named executive officers and their respective family members and affiliated entities beneficially owned an aggregate of
5,726,681
shares, or
approximately
42%
of our issued and outstanding common stock. Consequently, our management and board of directors may be able to significantly affect the outcome of the election of directors and the potential outcome of other matters submitted to a vote of our shareholders, such as mergers, the sale of substantially all of our assets and other extraordinary corporate matters. The interests of these insiders could conflict with the interests of our other shareholders, including you.
The holders of our existing debt obligations, as well as debt obligations that may be outstanding in the future, will have priority over our common stock with respect to payment in the event of liquidation, dissolution or winding up and with respect to the payment of interest.
In the event of any liquidation, dissolution or winding up of the Company, our common stock would rank below all claims of debt holders against us. As of
December 31, 2018
we had outstanding approximately
$13.5 million
in aggregate principal amount of subordinated notes and
$2.1 million
in aggregate principal amount of junior subordinated debentures issued to a statutory trust that, in turn, issued $2.0 million of trust preferred securities. Payments of the principal and interest on the trust preferred securities are conditionally guaranteed by us. Our debt obligations are senior to our shares of common stock. As a result, we must make payments on our debt obligations before any dividends can be paid on our common stock. In the event of our bankruptcy, dissolution or liquidation, the holders of our debt obligations must be satisfied before any distributions can be made to the holders of our common stock. To the extent that we issue additional debt obligations, the additional debt obligations will be of equal rank with, or senior to, our existing debt obligations and senior to our shares of common stock.
We are dependent upon the Bank for cash flow, and the Bank’s ability to make cash distributions is restricted.
Our primary asset is Capital Bank. We depend upon the Bank for cash distributions (through dividends on the Bank’s common stock) that we use to pay our operating expenses and satisfy our obligations (including our subordinated debentures and our other debt obligations). Federal statutes, regulations and policies
|
51
|
||
restrict the Bank’s ability to make cash distributions to us. These statutes and regulations require, among other things, that the Bank maintain certain levels of capital in order to pay a dividend. Further, the OCC has the ability to restrict the Bank’s payment of dividends by supervisory action. If the Bank is unable to pay dividends to us, we may not be able to satisfy our obligations or, if applicable, pay dividends on our common stock.
Our future ability to pay dividends is subject to restrictions.
Holders of our common stock are only entitled to receive dividends when, as and if declared by our board of directors out of funds legally available for dividends.
We have not paid any cash dividends on our capital stock since inception and we do not plan to pay cash dividends in the foreseeable future.
Any declaration and payment of dividends on common stock in the future will depend on regulatory restrictions, our earnings and financial condition, our liquidity and capital requirements, the general economic climate, contractual restrictions, our ability to service any equity or debt obligations senior to our common stock and other factors deemed relevant by our board of directors. Furthermore, consistent with our strategic plans, growth initiatives, capital availability, projected liquidity needs and other factors, we have made, and will continue to make, capital management decisions and policies that could adversely affect the amount of dividends, if any, paid to our common shareholders.
The Federal Reserve has indicated that bank holding companies should carefully review their dividend policy in relation to the organization’s overall asset quality, current and prospective earnings and level, composition and quality of capital. The guidance provides that we inform and consult with the Federal Reserve prior to declaring and paying a dividend that exceeds earnings for the period for which the dividend is being paid or that could result in an adverse change to our capital structure, including interest on the subordinated debt obligations, the subordinated debentures underlying our trust preferred securities and our other debt obligations. If regularly scheduled payments on our outstanding junior subordinated debentures, held by our unconsolidated subsidiary trust, or our other debt obligations, are not made or are deferred, or dividends on any preferred stock we may issue are not paid, we will be prohibited from paying dividends on our common stock.
Provisions in our governing documents and Maryland law may have an anti-takeover effect, and there are substitutional regulatory limitations on changes of control of bank holding companies.
Our corporate organizational documents and provisions of federal and state law to which we are subject contain certain provisions that could have an anti-takeover effect and may delay, make more difficult or prevent an attempted acquisition that you may favor or an attempted replacement of our board of directors or management.
Our Amended and Restated Articles of Incorporation, or Articles, and our Amended and Restated Bylaws, or Bylaws, may have an anti-takeover effect and may delay, discourage or prevent an attempted acquisition or change of control or a replacement of our board of directors or management. Our governing documents and Maryland law include provisions that:
|
•
|
empower our board of directors, without shareholder approval, to issue our preferred stock, the terms of which, including voting power, are to be set by our board of directors;
|
|
•
|
divide our board of directors into three classes serving staggered three-year terms;
|
|
•
|
provide that directors may be removed from office (i) without cause but only upon a 66.67% vote of shareholders and (ii) for cause but only upon a majority shareholder vote;
|
|
•
|
eliminate cumulative voting in elections of directors;
|
|
•
|
permit our board of directors to alter, amend or repeal our Bylaws or to adopt new bylaws;
|
|
52
|
||
|
•
|
permit our board of directors to increase or decrease the number of authorized shares of our common stock and preferred stock;
|
|
•
|
require the request of holders of at least a majority of the outstanding shares of our capital stock entitled to vote at a meeting to call a special shareholders’ meeting;
|
|
•
|
require shareholders that wish to bring business before annual or special meetings of shareholders, or to nominate candidates for election as directors at our annual meeting of shareholders, to provide timely notice of their intent in writing; and
|
|
•
|
enable our board of directors to increase, between annual meetings, the number of persons serving as directors and to fill the vacancies created as a result of the increase by a majority vote of the directors present at a meeting of directors.
|
In addition, certain provisions of Maryland law may delay, discourage or prevent an attempted acquisition or change in control. Furthermore, banking laws impose notice, approval, and ongoing regulatory requirements on any shareholder or other party that seeks to acquire direct or indirect “control” of an FDIC-insured depository institution or its holding company. These laws include the BHC Act and the Change in Bank Control Act, or the CBCA. These laws could delay or prevent an acquisition.
Our common stock is not insured by any governmental entity.
Our common stock is not a deposit account or other obligation of any bank and is not insured by the FDIC or any other governmental entity. Investment in our common stock is subject to risk, including possible loss.
|
53
|
||
ITEM 1B UNRESOLVED STAFF COMMENTS
None.
ITEM 2. PROPERTIES
Our headquarters are currently located at 2275 Research Boulevard, Suite 600, Rockville, Maryland 20850. The following table summarizes pertinent details of our commercial bank branch locations, mortgage banking offices, loan production offices, or LPOs, and our credit card operations office. Our mortgage offices typically contain both origination and operations professionals.
|
Location
|
Owned/Leased
|
Lease Expiration
|
Type of office
|
|||
|
One Church Street
Suite 100
Rockville, MD 20850
|
Leased
|
6/30/24
|
Commercial Branch
|
|||
|
2275 Research Blvd.
Suite 600
Rockville, MD 20850
|
Sub-Leased
|
10/31/2024
|
Corporate
|
|||
|
1776 Eye Street
Washington, D.C. 20006
|
Leased
|
4/30/22
|
Commercial Branch
|
|||
|
6000 Executive Boulevard
Suite 101
North Bethesda, MD 20852
|
Leased
|
9/30/21
|
Commercial Branch
|
|||
|
6711 Columbia Gateway Drive
Suite 170
Columbia, MD 21046
|
Leased
|
5/31/22
|
Commercial Branch/Mortgage Office
|
|||
|
110 Gibraltar Road
Suite 130
Horsham, PA 19044
|
Leased
|
5/31/20
|
OpenSky® Operations
|
|||
|
185 Harry S. Truman Parkway
Suite 100
Annapolis, MD 21401
|
Leased
|
9/30/21
|
Mortgage Office
|
|||
|
14231 Jarrettsville Pike
Phoenix, MD 21131
|
Leased
|
2/29/20
|
Mortgage Office
|
|||
|
1801 E Jefferson St.
Rockville, MD 20852
|
Leased
|
8/31/19
|
Limited Service Branch
|
|||
|
818 Connecticut Ave
Suite 900
Washington, D.C. 20006
|
Sub-Leased
|
Month-to-month
|
LPO
|
|||
|
10700 Parkridge Boulevard
Suite 180
Reston, VA 20191
|
Leased
|
10/31/2023
|
Commercial Branch and Mortgage Office
|
|||
|
54
|
||
ITEM 3. LEGAL PROCEEDINGS.
From time to time, we are a party to various litigation matters incidental to our ordinary conduct of our business. We are not presently a party to any material legal proceedings other than as described in Note 18 - Litigation, included in our Notes to Consolidated Financial Statements under Part II. Item 8. Financial Statements and Supplementary Data.
ITEM 4. MINE SAFETY DISCLOSURES.
Not applicable.
|
55
|
||
PART II
ITEM 5. MARKET FOR THE REGISTRANT’S COMMON EQUITY, RELATED STOCKHOLDER MATTERS AND ISSUER PURCHASES OF EQUITY SECURITIES
Shareholder Information
The common stock of the Company has been publicly traded since September 2018 and is currently traded on the Nasdaq Global Select Market under the symbol CBNK. As of February 28, 2019, there were approximately
228
holders of record of our common stock.
On October 4, 2018, the Underwriters of the Company’s initial public offering, or IPO, that closed on September 28, 2018, exercised in full their option to purchase an additional 334,310 shares of common stock from the Company. The sale of additional shares of the Company’s common stock closed on October 4, 2018. The Company received proceeds of approximately $3.9 million from the sale of the additional shares after deducting underwriting discounts. After giving effect to the exercise of the Underwriters’ option, the Company sold a total of 1,834,310 shares of common stock and raised approximately $20.2 million in net proceeds at the completion of the IPO. There has been no material change in the planned use of proceeds from our IPO as described in our prospectus filed with the SEC on September 26, 2018 pursuant to Rule 424(b)(4) under the Securities Act.
Dividends
It is our policy to retain earnings, if any, to provide funds for use in our business. Although we have never declared or paid dividends on our common stock, our board of directors periodically reviews whether to declare or pay cash dividends taking into account, among other things, general business conditions, our financial results. future prospects, capital requirements, legal and regulatory restrictions, and such other factors as our board may deem relevant.
Our ability to pay dividends on our common stock is dependent on the Bank’s ability to pay dividends to the Company. Various statutory provisions restrict the amount of dividends that the Bank can pay without regulatory approval. For information on the statutory and regulatory limitations on the ability of the Company to pay dividends to its stockholders and on the Bank to pay dividends to the Company, see “Item 1. Business-Supervision and Regulation—Dividends” and “Item 7. Management’s Discussion and Analysis of Financial Condition and Results of Operations – Liquidity.”
Equity Compensation Plan Information
The following table provides information as of December 31, 2018, with respect to options and RSUs outstanding and shares available for future awards under the Company’s active equity incentive plans.
|
56
|
||
|
Plan Category
|
Number of Securities to be Issued Upon Exercise of Outstanding Options, Warrants and Rights
|
Weighted-Average Exercise Price of Outstanding Options, Warrants and Rights
|
Number of Securities Remaining Available for Future Issuance under Equity Compensation Plans (excluding securities reflected in column (a))
|
||||
|
(a)
|
(b)
|
(c)
|
|||||
|
Equity compensation plans approved by security holders:
|
|||||||
|
HCNB Bancorp, Inc. 2002 Stock Option Plan
|
803,510
|
|
$
|
7.47
|
|
—
|
|
|
Capital Bancorp, Inc. 2017 Stock and Incentive Compensation Plan
|
628,350
|
|
11.82
|
|
542,215
|
|
|
|
Equity compensation plans not approved by security holders
|
—
|
|
—
|
|
—
|
|
|
|
Total
|
1,431,860
|
|
$
|
9.38
|
|
542,215
|
|
Unregistered Sales and Issuer Repurchases of Common Stock
There were no unregistered sales of the Company’s stock during the fourth quarter of 2018. The Company did not repurchase any of its shares during the fourth quarter of 2018 and does not have any authorized share repurchase programs.
|
57
|
||
ITEM 6. SELECTED FINANCIAL DATA
You should read the following selected historical consolidated financial and other data in conjunction with our consolidated financial statements and related notes and the sections entitled “Management’s Discussion and Analysis of Financial Condition and Results of Operations” and “Capitalization” included elsewhere in this report. The following tables set forth selected historical consolidated financial and other data for the years ended December 31, 2018, 2017, 2016, 2015, and 2014. Selected financial data as of and for the years ended December 31, 2018 and 2017 have been derived from our audited financial statements included elsewhere in this report. We have derived the selected financial data as of and for the years ended December 31, 2016, 2015 and 2014 from our audited financial statements not included in this filing. T
he information presented in the table below has been adjusted to give effect to a four-for-one stock split of our common stock completed effective August 15, 2018. The effect of the stock split on outstanding shares and per share figures has been retroactively applied to all periods presented below.
Our historical results are not necessarily indicative of any future period. The performance ratios, asset quality and capital ratios, mortgage metrics and credit card portfolio metrics are unaudited and derived from our audited financial statements and other financial information as of and for the periods presented. Average balances have been calculated using daily averages. The selected historical consolidated financial and other data presented below contains certain financial measures that are not presented in accordance with accounting principles generally accepted in the United States and have not been audited. See “—GAAP Reconciliation and Management Explanation of Non-GAAP Financial Measures.”
|
Years Ended December 31,
|
||||||||||||||||||||
|
(Dollars are in thousands, except per share information)
|
2018
|
2017
|
2016
|
2015
|
2014
|
|||||||||||||||
|
Statement of Income Data:
|
||||||||||||||||||||
|
Total interest income
|
$
|
69,127
|
|
$
|
56,666
|
|
$
|
49,243
|
|
$
|
38,254
|
|
$
|
32,852
|
|
|||||
|
Total interest expense
|
11,239
|
|
7,755
|
|
6,484
|
|
4,578
|
|
3,135
|
|
||||||||||
|
Net interest income
|
57,888
|
|
48,911
|
|
42,759
|
|
33,676
|
|
29,717
|
|
||||||||||
|
Provision for loan losses
|
2,140
|
|
2,655
|
|
4,291
|
|
1,609
|
|
1,230
|
|
||||||||||
|
Total noninterest income
|
16,124
|
|
15,149
|
|
20,473
|
|
14,929
|
|
11,442
|
|
||||||||||
|
Total noninterest expense
|
54,123
|
|
47,306
|
|
43,380
|
|
34,817
|
|
28,821
|
|
||||||||||
|
Income before income taxes
|
17,749
|
|
14,099
|
|
15,561
|
|
12,179
|
|
11,108
|
|
||||||||||
|
Income tax expense
|
4,982
|
|
6,990
|
|
6,120
|
|
4,687
|
|
4,315
|
|
||||||||||
|
Net income
|
12,767
|
|
7,109
|
|
9,441
|
|
7,492
|
|
6,793
|
|
||||||||||
|
Net income, as adjusted
(1)
|
12,767
|
|
11,293
|
|
9,441
|
|
7,492
|
|
6,793
|
|
||||||||||
|
Balance Sheet Data:
|
||||||||||||||||||||
|
Cash and due from banks
|
$
|
10,431
|
|
$
|
8,189
|
|
$
|
4,827
|
|
$
|
4,129
|
|
$
|
3,849
|
|
|||||
|
Investment securities available for sale
|
46,932
|
|
54,029
|
|
47,985
|
|
39,175
|
|
39,393
|
|
||||||||||
|
Loans held for sale
|
18,526
|
|
26,344
|
|
49,167
|
|
38,878
|
|
42,659
|
|
||||||||||
|
Loans, net of unearned income
|
1,000,268
|
|
887,420
|
|
763,430
|
|
639,350
|
|
506,339
|
|
||||||||||
|
Core deposit intangible
|
—
|
|
—
|
|
—
|
|
17
|
|
39
|
|
||||||||||
|
Total assets
|
1,105,058
|
|
1,026,009
|
|
905,600
|
|
743,429
|
|
618,749
|
|
||||||||||
|
Total deposits
|
955,241
|
|
904,899
|
|
790,924
|
|
629,817
|
|
501,974
|
|
||||||||||
|
FHLB advances and repurchase agreements
|
5,332
|
|
13,260
|
|
15,659
|
|
23,440
|
|
47,988
|
|
||||||||||
|
Senior promissory note, due July 31, 2019
|
—
|
|
2,000
|
|
2,000
|
|
5,000
|
|
5,000
|
|
||||||||||
|
Subordinated debentures
|
15,393
|
|
15,361
|
|
15,327
|
|
18,629
|
|
7,062
|
|
||||||||||
|
Total liabilities
|
990,494
|
|
945,890
|
|
834,853
|
|
683,772
|
|
568,533
|
|
||||||||||
|
Total stockholders’ equity
|
114,564
|
|
80,119
|
|
70,748
|
|
59,657
|
|
50,216
|
|
||||||||||
|
Tangible common equity
(2)
|
114,564
|
|
80,119
|
|
70,748
|
|
59,640
|
|
50,177
|
|
||||||||||
|
58
|
||
|
Years Ended December 31,
|
||||||||||||||||||||
|
(Dollars are in thousands, except per share information)
|
2018
|
2017
|
2016
|
2015
|
2014
|
|||||||||||||||
|
Selected Performance Ratios:
|
||||||||||||||||||||
|
Return on average assets (ROAA)
|
1.22
|
%
|
0.74
|
%
|
1.13
|
%
|
1.10
|
%
|
1.25
|
%
|
||||||||||
|
Return on average assets, as adjusted
(1)
|
1.22
|
|
1.17
|
|
1.13
|
|
1.10
|
|
1.25
|
|
||||||||||
|
Return on average equity (ROAE)
|
13.94
|
|
9.29
|
|
14.39
|
|
13.90
|
|
14.84
|
|
||||||||||
|
Return on average equity, as adjusted
(1)
|
13.94
|
|
14.75
|
|
14.39
|
|
13.90
|
|
14.84
|
|
||||||||||
|
Return on average tangible common equity (ROATCE)
(2)(3)(4)
|
13.94
|
|
9.29
|
|
14.41
|
|
13.94
|
|
14.90
|
|
||||||||||
|
Return on average tangible common equity, as adjusted
(1)(2)
|
13.94
|
|
14.75
|
|
14.41
|
|
13.94
|
|
14.90
|
|
||||||||||
|
Net interest margin
(3)
|
5.59
|
|
5.12
|
|
5.18
|
|
5.02
|
|
5.59
|
|
||||||||||
|
Net interest margin, as adjusted
(1)(2)(3)
|
5.59
|
|
5.37
|
|
5.18
|
|
5.02
|
|
5.59
|
|
||||||||||
|
Net interest margin, excluding credit card portfolio
(3)
|
4.28
|
|
4.31
|
|
4.53
|
|
4.60
|
|
5.47
|
|
||||||||||
|
Noninterest income / average assets
|
1.54
|
|
1.57
|
|
2.46
|
|
2.20
|
|
2.11
|
|
||||||||||
|
Noninterest expense / average assets
|
5.18
|
|
4.90
|
|
5.21
|
|
5.12
|
|
5.32
|
|
||||||||||
|
Net operating expense / average assets
|
3.63
|
|
3.33
|
|
2.75
|
|
2.93
|
|
3.21
|
|
||||||||||
|
Efficiency ratio
(4)
|
73.13
|
|
73.85
|
|
68.60
|
|
71.63
|
|
70.02
|
|
||||||||||
|
Efficiency ratio, as adjusted
(1)(4)
|
73.13
|
|
67.79
|
|
68.60
|
|
71.63
|
|
70.02
|
|
||||||||||
|
Loan yield
(5)
|
7.16
|
|
6.44
|
|
6.45
|
|
6.18
|
|
6.74
|
|
||||||||||
|
Loan yield, excluding credit card portfolio
(5)
|
5.76
|
|
5.57
|
|
5.76
|
|
5.78
|
|
6.62
|
|
||||||||||
|
Per Share Data:
(6)
|
||||||||||||||||||||
|
Common shares issued and outstanding
|
13,672,479
|
|
11,537,196
|
|
11,144,696
|
|
10,225,780
|
|
9,562,820
|
|
||||||||||
|
Basic weighted average shares outstanding
|
12,116,459
|
|
11,261,132
|
|
10,963,132
|
|
9,620,080
|
|
9,427,396
|
|
||||||||||
|
Diluted weighted average shares outstanding
|
12,462,138
|
|
11,428,000
|
|
11,289,044
|
|
10,488,036
|
|
10,279,548
|
|
||||||||||
|
Basic earnings per share
|
$
|
1.05
|
|
$
|
0.63
|
|
$
|
0.86
|
|
$
|
0.78
|
|
$
|
0.72
|
|
|||||
|
Diluted earnings per share
(7)
|
1.02
|
|
0.62
|
|
0.84
|
|
0.74
|
|
0.69
|
|
||||||||||
|
Diluted earnings per share, as adjusted
(1)(2)(7)
|
1.02
|
|
0.99
|
|
0.84
|
|
0.74
|
|
0.69
|
|
||||||||||
|
Book value per share
|
8.38
|
|
6.94
|
|
6.35
|
|
5.83
|
|
5.25
|
|
||||||||||
|
Tangible book value per share
(2)
|
8.38
|
|
6.94
|
|
6.35
|
|
5.83
|
|
5.25
|
|
||||||||||
|
Non-Performing Assets:
|
||||||||||||||||||||
|
Non-performing loans
|
$
|
4,679
|
|
$
|
5,407
|
|
$
|
4,518
|
|
$
|
5,775
|
|
$
|
6,359
|
|
|||||
|
Troubled debt restructurings
|
284
|
|
3,811
|
|
941
|
|
2,422
|
|
2,768
|
|
||||||||||
|
Foreclosed real estate
|
142
|
|
93
|
|
90
|
|
203
|
|
454
|
|
||||||||||
|
Non-performing assets
|
4,821
|
|
5,500
|
|
4,608
|
|
5,978
|
|
6,813
|
|
||||||||||
|
Asset Quality Ratios:
|
||||||||||||||||||||
|
Non-performing assets / assets
|
0.44
|
%
|
0.54
|
%
|
0.51
|
%
|
0.80
|
%
|
1.10
|
%
|
||||||||||
|
Non-performing loans / loans
(8)
|
0.47
|
|
0.61
|
|
0.59
|
|
0.90
|
|
1.26
|
|
||||||||||
|
Non-performing assets / loans
(8)
+ foreclosed real estate
|
0.48
|
|
0.62
|
|
0.60
|
|
0.94
|
|
1.35
|
|
||||||||||
|
Net charge-offs (recoveries) to average loans
(8)
|
0.09
|
|
0.15
|
|
0.33
|
|
0.10
|
|
0.09
|
|
||||||||||
|
Allowance for loan losses to total loans
|
1.13
|
|
1.13
|
|
1.13
|
|
1.03
|
|
1.09
|
|
||||||||||
|
Allowance for loan losses to non-performing loans
|
241.72
|
|
185.57
|
|
190.32
|
|
113.83
|
|
86.97
|
|
||||||||||
|
59
|
||
|
Years Ended December 31,
|
||||||||||||||||||||
|
(Dollars are in thousands, except per share information)
|
2018
|
2017
|
2016
|
2015
|
2014
|
|||||||||||||||
|
Bank Capital Ratios:
|
||||||||||||||||||||
|
Tier 1 leverage ratio
|
9.06
|
%
|
8.55
|
%
|
8.86
|
%
|
9.51
|
%
|
9.44
|
%
|
||||||||||
|
Common equity tier 1 capital
|
11.00
|
|
10.78
|
|
11.12
|
|
11.35
|
|
n/a
|
|
||||||||||
|
Tier 1 risk-based capital
|
11.00
|
|
10.78
|
|
11.12
|
|
11.35
|
|
11.96
|
|
||||||||||
|
Total risk-based capital ratio
|
12.25
|
|
12.03
|
|
12.37
|
|
12.51
|
|
13.21
|
|
||||||||||
|
Common equity to total assets
|
8.89
|
|
8.46
|
|
8.94
|
|
9.38
|
|
8.98
|
|
||||||||||
|
Composition of Loans Held for Investment:
|
||||||||||||||||||||
|
Residential real estate
|
$
|
407,844
|
|
$
|
342,684
|
|
$
|
286,332
|
|
$
|
225,185
|
|
$
|
157,370
|
|
|||||
|
Commercial real estate
|
278,691
|
|
259,853
|
|
234,869
|
|
190,776
|
|
162,697
|
|
||||||||||
|
Construction real estate
|
157,586
|
|
144,932
|
|
134,540
|
|
129,304
|
|
111,618
|
|
||||||||||
|
Commercial
|
122,264
|
|
108,982
|
|
87,563
|
|
79,003
|
|
63,750
|
|
||||||||||
|
Credit card
|
34,673
|
|
31,507
|
|
20,446
|
|
13,812
|
|
9,562
|
|
||||||||||
|
Other consumer
|
1,202
|
|
1,053
|
|
1,157
|
|
2,233
|
|
1,624
|
|
||||||||||
|
Mortgage Metrics (CSM only):
|
||||||||||||||||||||
|
Origination of loans held for sale
|
$
|
337,122
|
|
$
|
418,912
|
|
$
|
853,674
|
|
$
|
754,965
|
|
$
|
493,273
|
|
|||||
|
Proceeds from loans held for sale, net of mortgage banking revenue
|
344,940
|
|
441,960
|
|
844,464
|
|
759,350
|
|
470,534
|
|
||||||||||
|
Purchase volume as a % of originations
|
79.43
|
%
|
52.50
|
%
|
18.79
|
%
|
22.51
|
%
|
29.83
|
%
|
||||||||||
|
Gain on sale of loans
|
$
|
9,477
|
|
$
|
10,377
|
|
$
|
15,373
|
|
$
|
11,541
|
|
$
|
7,827
|
|
|||||
|
Gain on sale as a % of loans sold
|
2.75
|
%
|
2.01
|
%
|
1.82
|
%
|
1.52
|
%
|
1.66
|
%
|
||||||||||
|
Credit Card Portfolio Metrics:
|
||||||||||||||||||||
|
Total active customer accounts
|
169,981
|
|
149,226
|
|
96,404
|
|
63,398
|
|
38,922
|
|
||||||||||
|
Total loans
|
$
|
34,673
|
|
$
|
31,507
|
|
$
|
20,446
|
|
$
|
13,812
|
|
$
|
9,562
|
|
|||||
|
Total deposits at the Bank
|
59,954
|
|
53,625
|
|
39,062
|
|
27,849
|
|
18,415
|
|
||||||||||
_______________
|
(1)
|
Presentation of this financial measure as of or for the year ended December 31, 2017 excludes the effects of certain non-recurring expenses incurred with the conversion of our credit card processing systems and the revaluation of our deferred tax assets due to the effects of the Tax Act. See “—GAAP Reconciliation and Management Explanation of Non-GAAP Financial Measures” for a reconciliation of this financial measure to its most comparable GAAP financial measure.
|
|
(2)
|
This financial measure is not recognized under GAAP and is therefore considered to be a non-GAAP measure. See “—GAAP Reconciliation and Management Explanation of Non-GAAP Financial Measures” for a reconciliation of this financial measure to its most comparable GAAP financial measure.
|
|
(3)
|
Net interest margin is a ratio calculated as net interest income divided by average interest earning assets for the same period.
|
|
(4)
|
Efficiency ratio is calculated by dividing noninterest expense by net interest income plus noninterest income.
|
|
(5)
|
Includes non-accrual loans and loans 90 days and more past due.
|
|
(6)
|
Gives effect to a four-for-one stock split of our common stock completed effective August 15, 2018. The effect of the stock split on outstanding shares and per share figures has been retroactively applied to all periods presented.
|
|
(7)
|
Calculations of diluted earnings per share before bargain purchase gain, diluted earnings per share and diluted earnings per share, as adjusted, include interest on convertible debt.
|
|
(8)
|
Loans exclude loans held for sale at each of the dates presented.
|
|
60
|
||
GAAP Reconciliation and Management Explanation of Non-GAAP Financial Measures
Our accounting and reporting policies conform to GAAP and the prevailing practices in the banking industry. However, we also evaluate our performance based on certain additional financial measures discussed in this report as being “non-GAAP financial measures.” We classify a financial measure as a non-GAAP financial measure if that financial measure excludes or includes amounts, or is subject to adjustments that have the effect of excluding or including amounts, that are not included or excluded, as the case may be, in the most directly comparable measure calculated and presented in accordance with GAAP as in effect from time to time in the United States in our statements of income, balance sheets or statements of cash flows. Non-GAAP financial measures do not include operating and other statistical measures or ratios that are calculated using exclusively financial measures presented in accordance with GAAP.
This report includes certain non-GAAP financial measures for the year ended December 31, 2017 in order to present our results of operations for that period on a basis consistent with our historical operations. During the fourth quarter of 2017, we undertook a conversion of our credit card portfolio system to further scale our OpenSky® credit card division. The one-time expense related to this data processing system conversion was approximately
$2.3 million
in the fourth quarter of 2017. As a result of the conversion, we refunded or did not charge our OpenSky® customers for 60 days of interest and applicable fees on their accounts, which resulted in a loss of revenue of approximately
$2.4 million
. This forbearance of certain interest and fees on customers
’
accounts was conducted in accordance with the safe harbor provisions of the Truth in Lending Act as implemented by Regulation Z.
The provisions of Regulation Z address, among other areas, open-end credit, such as credit cards or home equity lines, and closed-end credit, such as car loans or mortgages, as well as certain administrative matters such as a change to the payment address. In connection with the conversion of our credit card portfolio system, the address for the payment of principal, interest and fees related to our credit card portfolio was changed and, accordingly, we did not assess certain interest and fees on customers’ accounts for a period of 60 days during the fourth quarter of 2017 in accordance with the safe harbor provisions of Regulation Z.
We believe that these non-GAAP financial measures provide useful information to management and investors that is supplementary to our financial condition, results of operations and cash flows computed in accordance with GAAP. However, non-GAAP financial measures have a number of limitations, are not necessarily comparable to GAAP measures and should not be considered in isolation or viewed as a substitute for the most directly comparable or other financial measures calculated in accordance with GAAP. Moreover, the manner in which we calculate non-GAAP financial measures may differ from that of other companies reporting non-GAAP measures with similar names. You should understand how such other companies calculate their financial measures that may be similar or have names that are similar to the non-GAAP financial measures discussed herein when comparing such non-GAAP financial measures.
Our management uses the non-GAAP financial measures set forth below in its analysis of our performance.
|
•
|
“
Net interest margin, as adjusted” is a non-GAAP measure herein defined as net interest income, plus non-recurring foregone interest and fees, divided by average interest earning assets.
|
|
•
|
“
Net income, as adjusted” is a non-GAAP measure herein defined as net income, less
bargain purchase gain (net of taxes),
plus
non-recurring foregone interest and fees, plus non-recurring data processing expenses, plus non-recurring deferred tax revaluation and less the tax impact of conversion-related items.
|
|
•
|
“Efficiency ratio, as adjusted” is a non-GAAP measure herein defined as total non
interest expense, less non-recurring data processing expenses, divided by the sum of net interest income, noninterest income and non-recurring foregone interest and fees
.
|
|
61
|
||
|
•
|
“Diluted earnings per share, as adjusted” is a non-GAAP measure herein defined as
net income, less bargain purchase gain (net of taxes), plus non-recurring foregone interest and fees, plus non-recurring data processing expenses, plus non-recurring deferred tax revaluation, less the tax impact of conversion-related items,
divided by the diluted weighted average shares outstanding.
|
|
•
|
“
Return on average assets, as adjusted” is a non-GAAP measure herein defined as
net income, less bargain purchase gain (net of taxes), plus non-recurring foregone interest and fees, plus non-recurring data processing expenses, plus non-recurring deferred tax revaluation, less the tax impact of conversion-related items,
divided by average total assets.
|
|
•
|
“
Return on average equity, as adjusted” is a non-GAAP measure herein defined as
net income, less bargain purchase gain (net of taxes), plus non-recurring foregone interest and fees, plus non-recurring data processing expenses, plus non-recurring deferred tax revaluation, less the tax impact of conversion-related items,
divided by average total equity.
|
|
•
|
“Tangible common equity” is a non-GAAP measure defined as total stockholders’ equity, less intangible assets.
|
|
•
|
“R
eturn on average tangible common equity” is a non-GAAP measure herein defined as
net income, less bargain purchase gain (net of taxes), plus the amortization of intangible assets (net of taxes),
divided by average total equity net of average intangible assets.
|
|
•
|
“
Return on average tangible common equity, as adjusted” is a non-GAAP measure herein defined as
net income, less bargain purchase gain (net of taxes), plus non-recurring foregone interest and fees, plus non-recurring data processing expenses, plus non-recurring deferred tax revaluation, less the tax impact of conversion-related items,
plus the amortization of intangible assets (net of taxes),
divided by average total equity, net of average intangible assets.
|
|
•
|
“Tangible book value per share” is a non-GAAP measure defined as total stockholders’ equity, less intangible assets, divided by shares of common stock outstanding.
|
The following reconciliation table provides a more detailed analysis of these non-GAAP financial measures:
|
Years Ended December 31,
|
||||||||||||||||||||
|
(Dollars are in thousands, except per share information)
|
2018
|
2017
|
2016
|
2015
|
2014
|
|||||||||||||||
|
Net Interest Margin, as adjusted:
|
||||||||||||||||||||
|
Net interest income
|
$
|
57,888
|
|
$
|
48,911
|
|
$
|
42,759
|
|
$
|
33,676
|
|
$
|
29,717
|
|
|||||
|
Add: Non-recurring foregone interest and fees
|
—
|
|
2,370
|
|
—
|
|
—
|
|
—
|
|
||||||||||
|
Adjusted net interest income
|
57,888
|
|
51,281
|
|
42,759
|
|
33,676
|
|
29,717
|
|
||||||||||
|
Divide by average interest earning assets
|
1,035,731
|
|
955,479
|
|
825,676
|
|
671,275
|
|
531,505
|
|
||||||||||
|
Net interest margin, as adjusted
|
5.59
|
%
|
5.37
|
%
|
5.18
|
%
|
5.02
|
%
|
5.59
|
%
|
||||||||||
|
Net Income, as adjusted:
|
||||||||||||||||||||
|
Net income
|
$
|
12,767
|
|
$
|
7,109
|
|
$
|
9,441
|
|
$
|
7,492
|
|
$
|
6,793
|
|
|||||
|
Add: Non-recurring foregone interest and fees
|
—
|
|
2,370
|
|
—
|
|
—
|
|
—
|
|
||||||||||
|
Add: Non-recurring data processing expenses
|
—
|
|
2,275
|
|
—
|
|
—
|
|
—
|
|
||||||||||
|
Add: Non-recurring deferred tax revaluation
|
—
|
|
1,386
|
|
—
|
|
—
|
|
—
|
|
||||||||||
|
Less: Tax impact of conversion related items
(1)
|
—
|
|
(1,847
|
)
|
—
|
|
—
|
|
—
|
|
||||||||||
|
Net income, as adjusted
|
$
|
12,767
|
|
$
|
11,293
|
|
$
|
9,441
|
|
$
|
7,492
|
|
$
|
6,793
|
|
|||||
|
62
|
||
|
Years Ended December 31,
|
||||||||||||||||||||
|
(Dollars are in thousands, except per share information)
|
2018
|
2017
|
2016
|
2015
|
2014
|
|||||||||||||||
|
Efficiency Ratio, as adjusted:
|
||||||||||||||||||||
|
Total noninterest expense
|
$
|
54,123
|
|
$
|
47,306
|
|
$
|
43,380
|
|
$
|
34,817
|
|
$
|
28,821
|
|
|||||
|
Less: Non-recurring data processing expenses
|
—
|
|
2,275
|
|
—
|
|
—
|
|
—
|
|
||||||||||
|
Adjusted noninterest expense
|
54,123
|
|
45,031
|
|
43,380
|
|
34,817
|
|
28,821
|
|
||||||||||
|
Net interest income
|
57,888
|
|
48,911
|
|
42,759
|
|
33,676
|
|
29,717
|
|
||||||||||
|
Add: Noninterest income
|
16,124
|
|
15,149
|
|
20,473
|
|
14,929
|
|
11,442
|
|
||||||||||
|
Add: Non-recurring foregone interest and fees
|
—
|
|
2,370
|
|
—
|
|
—
|
|
—
|
|
||||||||||
|
Divide by adjusted revenue
|
74,012
|
|
66,430
|
|
63,232
|
|
48,605
|
|
41,159
|
|
||||||||||
|
Efficiency ratio, as adjusted
|
73.13
|
%
|
67.79
|
%
|
68.60
|
%
|
71.63
|
%
|
70.02
|
%
|
||||||||||
|
Diluted Earnings per Share, as adjusted:
|
||||||||||||||||||||
|
Net income, as adjusted
|
$
|
12,767
|
|
$
|
11,293
|
|
$
|
9,441
|
|
$
|
7,492
|
|
$
|
6,793
|
|
|||||
|
Add: Convertible debt interest expense
|
—
|
—
|
|
—
|
|
281
|
|
281
|
|
|||||||||||
|
Net income for diluted earnings per share, as adjusted
|
12,767
|
|
$
|
11,293
|
|
$
|
9,441
|
|
$
|
7,773
|
|
$
|
7,074
|
|
||||||
|
Diluted weighted average shares outstanding
(2)
|
12,462,138
|
11,428,000
|
|
11,289,044
|
|
10,488,036
|
|
10,279,548
|
|
|||||||||||
|
Diluted earnings per share, as adjusted
(2)
|
$
|
1.02
|
|
$
|
0.99
|
|
$
|
0.84
|
|
$
|
0.74
|
|
$
|
0.69
|
|
|||||
|
|
|
|
|
|
|
|
|
|||||||||||||
|
Return on Average Assets, as adjusted:
|
||||||||||||||||||||
|
Net income, as adjusted
|
$
|
12,767
|
|
$
|
11,293
|
|
$
|
9,441
|
|
$
|
7,492
|
|
$
|
6,793
|
|
|||||
|
Divide by average total assets
|
1,045,732
|
|
964,946
|
|
832,619
|
|
679,595
|
|
541,934
|
|
||||||||||
|
Return on average assets, as adjusted
|
1.22
|
%
|
1.17
|
%
|
1.13
|
%
|
1.10
|
%
|
1.25
|
%
|
||||||||||
|
Return on Average Equity, as adjusted:
|
||||||||||||||||||||
|
Net income, as adjusted
|
$
|
12,767
|
|
$
|
11,293
|
|
$
|
9,441
|
|
$
|
7,492
|
|
$
|
6,793
|
|
|||||
|
Divide by average total equity
|
91,590
|
|
76,543
|
|
65,590
|
|
53,883
|
|
45,775
|
|
||||||||||
|
Return on average equity, as adjusted
|
13.94
|
%
|
14.75
|
%
|
14.39
|
%
|
13.90
|
%
|
14.84
|
%
|
||||||||||
|
Tangible Common Equity:
|
||||||||||||||||||||
|
Total stockholders’ equity
|
$
|
114,564
|
|
$
|
80,119
|
|
$
|
70,748
|
|
$
|
59,657
|
|
$
|
50,216
|
|
|||||
|
Less: intangible assets
|
—
|
|
—
|
|
—
|
|
17
|
|
39
|
|
||||||||||
|
Tangible common equity
|
$
|
114,564
|
|
$
|
80,119
|
|
$
|
70,748
|
|
$
|
59,640
|
|
$
|
50,177
|
|
|||||
|
Return on Average Tangible Common Equity:
|
||||||||||||||||||||
|
Net income
|
$
|
12,767
|
|
$
|
7,109
|
|
$
|
9,441
|
|
$
|
7,492
|
|
$
|
6,793
|
|
|||||
|
Less: Bargain purchase gain, net of taxes
|
—
|
|
—
|
|
—
|
|
—
|
|
—
|
|
||||||||||
|
Add: Intangible asset amortization, net of taxes
|
—
|
|
—
|
|
10
|
|
14
|
|
20
|
|
||||||||||
|
Net income excluding intangible amortization, as adjusted
|
12,767
|
|
7,109
|
|
9,451
|
|
7,506
|
|
6,813
|
|
||||||||||
|
Average total equity
|
91,590
|
|
76,543
|
|
65,590
|
|
53,883
|
|
45,775
|
|
||||||||||
|
Less: average intangible assets
|
—
|
|
—
|
|
8
|
|
26
|
|
53
|
|
||||||||||
|
Divide by average tangible common equity
|
91,590
|
|
76,543
|
|
65,582
|
|
53,857
|
|
45,722
|
|
||||||||||
|
Return on average tangible common equity
|
13.94
|
%
|
9.29
|
%
|
14.41
|
%
|
13.94
|
%
|
14.90
|
%
|
||||||||||
|
63
|
||
|
Years Ended December 31,
|
||||||||||||||||||||
|
(Dollars are in thousands, except per share information)
|
2018
|
2017
|
2016
|
2015
|
2014
|
|||||||||||||||
|
Return on Average Tangible Common Equity, as adjusted:
|
||||||||||||||||||||
|
Net income, as adjusted
|
$
|
12,767
|
|
$
|
11,293
|
|
$
|
9,441
|
|
$
|
7,492
|
|
$
|
6,793
|
|
|||||
|
Add: Intangible asset amortization, net of taxes
|
—
|
—
|
|
10
|
|
14
|
|
20
|
|
|||||||||||
|
Net income excluding intangible amortization, as adjusted
|
12,767
|
|
11,293
|
|
9,451
|
|
7,506
|
|
6,813
|
|
||||||||||
|
Average total equity
|
91,590
|
|
76,543
|
|
65,590
|
|
53,883
|
|
45,775
|
|
||||||||||
|
Less: average intangible assets
|
—
|
|
—
|
|
8
|
|
26
|
|
53
|
|
||||||||||
|
Divide by average tangible common equity
|
91,590
|
|
76,543
|
|
65,582
|
|
53,857
|
|
45,722
|
|
||||||||||
|
Return on average tangible common equity, as adjusted
|
13.94
|
%
|
14.75
|
%
|
14.41
|
%
|
13.94
|
%
|
14.90
|
%
|
||||||||||
|
Tangible Book Value per Share:
|
||||||||||||||||||||
|
Total stockholders’ equity
|
$
|
114,564
|
|
$
|
80,119
|
|
$
|
70,748
|
|
$
|
59,657
|
|
$
|
50,216
|
|
|||||
|
Less: intangible assets
|
—
|
|
—
|
|
—
|
|
17
|
|
39
|
|
||||||||||
|
Tangible common equity
|
$
|
114,564
|
|
$
|
80,119
|
|
$
|
70,748
|
|
|
$
|
59,640
|
|
|
$
|
50,177
|
|
|||
|
Divide by shares of common stock outstanding
(2)
|
13,672,479
|
|
11,537,196
|
|
11,144,696
|
|
10,225,780
|
|
9,562,820
|
|
||||||||||
|
Tangible book value per share
(2)
|
$
|
8.38
|
|
$
|
6.94
|
|
$
|
6.35
|
|
$
|
5.83
|
|
$
|
5.25
|
|
|||||
_______________
|
(1)
|
Assumes an income tax rate of 39.75% for the year ended December 31, 2017, which is tax expense exclusive of the effect of the deferred tax revaluation.
|
|
(2)
|
Gives effect to a four-for-one stock split of our common stock completed effective August 15, 2018. The effect of the stock split on outstanding shares and per share figures has been retroactively applied to all periods presented.
|
|
64
|
||
ITEM 7. MANAGEMENT’S DISCUSSION AND ANALYSIS OF FINANCIAL CONDITION AND RESULTS OF OPERATIONS
The following discussion and analysis is intended as a review of significant factors affecting the Company’s financial condition and results of operations for the periods indicated. This discussion and analysis should be read in conjunction with the accompanying consolidated financial statements and the related notes.
The discussion and analysis contains forward-looking statements that involve risks, uncertainties and assumptions. Certain risks, uncertainties and other factors, including but not limited to those set forth under “Cautionary Note Regarding Forward-Looking Statements,” “Risk Factors” and elsewhere in this Form 10-K, may cause actual results to differ materially from those projected in the forward-looking statements. We assume no obligation to update any of these forward-looking statements
Results of Operations for the
Years Ended December 31, 2018
and
2017
Net Income
The following table sets forth the principal components of net income for the periods indicated.
|
Years Ended December 31,
|
||||||||||
|
(in thousands)
|
2018
|
2017
|
% Change
|
|||||||
|
Interest income
|
$
|
69,127
|
|
$
|
56,666
|
|
22.0
|
%
|
||
|
Interest expense
|
11,239
|
|
7,755
|
|
44.9
|
%
|
||||
|
Net interest income
|
57,888
|
|
48,911
|
|
18.4
|
%
|
||||
|
Provision for loan losses
|
2,140
|
|
2,655
|
|
(19.4
|
)%
|
||||
|
Net interest income after provision
|
55,748
|
|
46,256
|
|
20.5
|
%
|
||||
|
Noninterest income
|
16,124
|
|
15,149
|
|
6.4
|
%
|
||||
|
Noninterest expense
|
54,123
|
|
47,306
|
|
14.4
|
%
|
||||
|
Net income before income taxes
|
17,749
|
|
14,099
|
|
25.9
|
%
|
||||
|
Income tax expense
|
4,982
|
|
6,990
|
|
(28.7
|
)%
|
||||
|
Net income
|
$
|
12,767
|
|
$
|
7,109
|
|
79.6
|
%
|
||
Net income for
the year ended December 31, 2018
was
$12.8 million
, an increase of
$5.7 million
, or
79.6%
, from net income for
the year ended December 31, 2017
of
$7.1 million
. The increase was primarily due to nonrecurring items in
2017
including
$2.3 million
of nonrecurring data processing expenses due to a system conversion,
$2.4 million
of interest and fees waived on our credit card portfolio due to that system conversion, net the nonrecurring tax impact of
$1.8 million
on those items, and a nonrecurring tax expense of
$1.4 million
due to the revaluation of deferred tax assets as a result of the Tax Act.
Net Interest Income and Net Margin Analysis
We analyze our ability to maximize income generated from interest earning assets and control the interest expenses of our liabilities, measured as net interest income, through our net interest margin and net interest spread. Net interest income is the difference between the interest and fees earned on interest earning assets, such as loans and securities, and the interest expense
incurred in connection with
interest bearing liabilities, such as deposits and borrowings, which are used to fund those assets. Net interest margin is a ratio calculated as net interest income divided by average interest earning assets for the same period. Net interest spread is the difference between average interest rates earned on interest earning assets and average interest rates paid on interest bearing liabilities.
Changes in market interest rates and the interest rates we earn on interest earning assets or pay on
|
65
|
||
interest bearing liabilities, as well as in the volume and types of interest earning assets, interest bearing and noninterest bearing liabilities and stockholders’ equity, are usually the largest drivers of periodic changes in net interest income, net interest margin and net interest spread. Fluctuations in market interest rates are driven by many factors, including governmental monetary policies, inflation, deflation, macroeconomic developments, changes in unemployment, the money supply, political and international conditions and conditions in domestic and foreign financial markets. Periodic changes in the volume and types of loans in our loan portfolio are affected by, among other factors, economic and competitive conditions in the Washington, D.C. and Baltimore metropolitan areas, as well as developments affecting the real estate, technology, government services, hospitality and tourism and financial services sectors within our target markets and throughout the Washington, D.C. and Baltimore metropolitan areas. Our ability to respond to changes in these factors by using effective asset-liability management techniques is critical to maintaining the stability of our net interest income and net interest margin as our primary sources of earnings.
|
66
|
||
The following table shows the average outstanding balance of each principal category of our assets, liabilities and stockholders’ equity, together with the average yields on our assets and the average costs of our liabilities for the periods indicated. Such yields and cost are calculated by dividing income or expense by the average daily balances of the corresponding assets or liabilities for the same period.
AVERAGE BALANCE SHEET AND NET INTEREST ANALYSIS
|
Years Ended December 31,
|
||||||||||||||||||||||||||||||||
|
2018
|
2017
|
2016
|
||||||||||||||||||||||||||||||
|
(in thousands)
|
Average
Outstanding Balance |
Interest Income/
Expense |
Average
Yield/ Rate |
Average
Outstanding Balance |
Interest Income/
Expense |
Average
Yield/ Rate |
Average
Outstanding Balance |
Interest Income/
Expense |
Average
Yield/ Rate |
|||||||||||||||||||||||
|
Assets
|
||||||||||||||||||||||||||||||||
|
Interest earning assets:
|
||||||||||||||||||||||||||||||||
|
Interest bearing deposits
|
$
|
41,858
|
|
$
|
687
|
|
1.64
|
%
|
$
|
45,385
|
|
$
|
480
|
|
1.06
|
%
|
$
|
31,558
|
|
$
|
149
|
|
0.47
|
%
|
||||||||
|
Federal funds sold
|
1,537
|
|
27
|
|
1.79
|
%
|
1,451
|
|
14
|
|
0.96
|
%
|
1,159
|
|
5
|
|
0.41
|
%
|
||||||||||||||
|
Restricted investments
|
2,724
|
|
143
|
|
5.26
|
%
|
2,521
|
|
108
|
|
4.27
|
%
|
2,665
|
|
135
|
|
5.05
|
%
|
||||||||||||||
|
Investment securities
|
50,074
|
|
1,041
|
|
2.08
|
%
|
52,419
|
|
1,068
|
|
2.04
|
%
|
45,051
|
|
890
|
|
1.98
|
%
|
||||||||||||||
|
Loans
(1)(2)(3)
|
939,538
|
|
67,229
|
|
7.16
|
%
|
853,703
|
|
54,996
|
|
6.44
|
%
|
745,243
|
|
48,064
|
|
6.45
|
%
|
||||||||||||||
|
Total interest earning assets
|
1,035,731
|
|
69,127
|
|
6.67
|
%
|
955,479
|
|
56,666
|
|
5.93
|
%
|
825,676
|
|
49,243
|
|
5.96
|
%
|
||||||||||||||
|
Noninterest earning assets
|
10,001
|
|
9,467
|
|
6,943
|
|
||||||||||||||||||||||||||
|
Total assets
|
$
|
1,045,732
|
|
$
|
964,946
|
|
$
|
832,619
|
|
|||||||||||||||||||||||
|
Liabilities and Stockholders’ Equity
|
||||||||||||||||||||||||||||||||
|
Interest bearing liabilities:
|
||||||||||||||||||||||||||||||||
|
Interest bearing deposits
|
$
|
689,311
|
|
9,792
|
|
1.42
|
%
|
$
|
671,639
|
|
6,434
|
|
0.96
|
%
|
$
|
571,066
|
|
4,857
|
|
0.85
|
%
|
|||||||||||
|
Borrowed funds
|
34,558
|
|
1,447
|
|
4.19
|
%
|
32,893
|
|
1,321
|
|
4.02
|
%
|
47,436
|
|
1,627
|
|
3.43
|
%
|
||||||||||||||
|
Total interest bearing liabilities
|
723,869
|
|
11,239
|
|
1.55
|
%
|
704,532
|
|
7,755
|
|
1.10
|
%
|
618,502
|
|
6,484
|
|
1.05
|
%
|
||||||||||||||
|
Noninterest bearing liabilities:
|
||||||||||||||||||||||||||||||||
|
Noninterest bearing liabilities
|
9,828
|
|
|
|
|
|
8,164
|
|
|
|
|
|
7,002
|
|
||||||||||||||||||
|
Noninterest bearing deposits
|
220,445
|
|
|
|
|
|
175,707
|
|
|
|
|
|
141,525
|
|
||||||||||||||||||
|
Stockholders’ equity
|
91,590
|
|
|
|
|
|
76,543
|
|
|
|
|
|
65,590
|
|
||||||||||||||||||
|
Total liabilities and stockholders’ equity
|
$
|
1,045,732
|
|
|
|
|
|
$
|
964,946
|
|
|
|
|
|
$
|
832,619
|
|
|||||||||||||||
|
Net interest spread
(4)
|
|
|
5.12
|
%
|
|
|
4.83
|
%
|
4.91
|
%
|
||||||||||||||||||||||
|
Net interest income
|
$
|
57,888
|
|
$
|
48,911
|
|
$
|
42,759
|
|
|||||||||||||||||||||||
|
Net interest margin
(5)
|
5.59
|
%
|
5.12
|
%
|
5.18
|
%
|
||||||||||||||||||||||||||
|
Net interest margin excluding credit card portfolio
|
4.28
|
%
|
4.31
|
%
|
4.53
|
%
|
||||||||||||||||||||||||||
_______________
|
(1)
|
Includes loans held for sale.
|
|
(2)
|
Includes nonaccrual loans.
|
|
(3)
|
Interest income includes amortization of deferred loan fees, net of deferred loan costs.
|
|
(4)
|
Net interest spread is the difference between interest rates earned on interest earning assets and interest rates paid on interest bearing liabilities.
|
|
(5)
|
Net interest margin is a ratio calculated as net interest income divided by average interest earning assets for the same period.
|
|
67
|
||
The following table presents information regarding the dollar amount of changes in interest income and interest expense for the periods indicated for each major component of interest earning assets and interest bearing liabilities and distinguishes between the changes attributable to changes in volume and changes attributable to changes in interest rates. For purposes of this table, changes attributable to both rate and volume that cannot be segregated have been proportionately allocated to both volume and rate.
ANALYSIS OF CHANGES IN NET INTEREST INCOME
|
Year Ended December 31, 2018
|
Year Ended December 31, 2017
|
||||||||||||||||||||||
|
Compared to the
|
Compared to the
|
||||||||||||||||||||||
|
Year Ended December 31, 2017
|
Year Ended December 31, 2016
|
||||||||||||||||||||||
|
Change Due To
|
Interest Variance
|
Change Due To
|
Interest Variance
|
||||||||||||||||||||
|
(In thousands)
|
Volume
|
Rate
|
Volume
|
Rate
|
|||||||||||||||||||
|
Interest Income:
|
|||||||||||||||||||||||
|
Interest bearing deposits
|
$
|
(34
|
)
|
$
|
241
|
|
$
|
207
|
|
$
|
87
|
|
$
|
245
|
|
$
|
332
|
|
|||||
|
Federal funds sold
|
1
|
|
12
|
|
13
|
|
1
|
|
8
|
|
9
|
|
|||||||||||
|
Restricted stock
|
9
|
|
26
|
|
35
|
|
(7
|
)
|
(20
|
)
|
(27
|
)
|
|||||||||||
|
Investment securities
|
(49
|
)
|
22
|
|
(27
|
)
|
149
|
|
28
|
|
177
|
|
|||||||||||
|
Loans
|
5,821
|
|
6,412
|
|
12,233
|
|
6,987
|
|
(55
|
)
|
6,932
|
|
|||||||||||
|
Total interest income
|
5,748
|
|
6,713
|
|
12,461
|
|
7,217
|
|
206
|
|
7,423
|
|
|||||||||||
|
Interest Expense:
|
|||||||||||||||||||||||
|
Interest bearing deposits
|
174
|
|
3,184
|
|
3,358
|
|
918
|
|
659
|
|
1,577
|
|
|||||||||||
|
Borrowed funds
|
68
|
|
58
|
|
126
|
|
(691
|
)
|
385
|
|
(306
|
)
|
|||||||||||
|
Total interest expense
|
242
|
|
3,242
|
|
3,484
|
|
227
|
|
1,044
|
|
1,271
|
|
|||||||||||
|
Net interest income
|
$
|
5,506
|
|
$
|
3,471
|
|
$
|
8,977
|
|
$
|
6,990
|
|
$
|
(838
|
)
|
$
|
6,152
|
|
|||||
Net interest income increased by
$9.0 million
to
$57.9 million
for
the year ended December 31, 2018
compared to
the year ended December 31, 2017
. The Company’s total interest income included an increase in interest earning assets and seven market rate increases between March 15, 2017 and December 19, 2018. The year over year increase of total interest income was impacted by
$2.4 million
of interest and fees waived on our credit card portfolio in 2017 due to a system conversion. Average total interest earning assets were
$1.0 billion
for
the year ended December 31, 2018
compared with
$955.5 million
for
the year ended December 31, 2017
. The yield on those interest earning assets increased 74 basis points from
5.93%
for
2017
to
6.67%
for
2018
. The increase in the average balance of interest earning assets was driven almost entirely by growth in the average balance of the loan portfolio of
$85.8 million
, or
10%
, to
$939.5 million
for
the year ended December 31, 2018
compared to
$853.7 million
for
the year ended December 31, 2017
.
Average interest
bearing
liabilities increased by
$19.3 million
from
$704.5 million
for
the year ended December 31, 2017
to
$723.9 million
for
the year ended December 31, 2018
.
The increase was due to an increase in the average balance of interest bearing deposits of
$17.7 million
, or
3%
, and an increase in the average balance of borrowed funds of
$1.7 million
, or
5%
. Deposits are our primary funding source. The increase in the average balance of interest bearing deposits was primarily due to increases in certificates of deposit and money market accounts for
the year ended December 31, 2018
compared to
the year ended December 31, 2017
, and, to a lesser extent, NOW accounts. The average interest rate paid on interest bearing liabilities increased to
1.55%
for
2018
compared to
1.10%
for
2017
, while the average interest rate paid on interest bearing deposits increased
46
basis points and the average interest rate paid on borrowed funds decreased by
17
basis points. The increases in average interest rates reflect an increase in market interest rates between March 2017 and December 2018. For
the year ended December 31, 2018
, the Company’s net interest margin was
5.59%
and net interest spread was
5.12%
. For
the year ended December 31, 2017
, net interest margin was
5.12%
and net interest spread was
4.83%
. With the impact of the Company’s 2017 non-recurring foregone interest and fees of
$2.4 million
for the credit card portfolio, the net interest
|
68
|
||
margin as adjusted was
5.37%
for
the year ended December 31, 2017
, compared to
5.59%
for
the year ended December 31, 2018
, an increase of
22
basis points year over year.
Provision for Loan Losses
The provision for loan losses is a charge to income in order to bring our allowance for loan losses to a level deemed appropriate by management. For a description of the factors taken into account by our management in determining the allowance for loan losses see “Financial Condition—Allowance for Loan Losses.”
Our provision for loan losses amounted to
$2.1 million
for
the year ended December 31, 2018
and
$2.7 million
for
the year ended December 31, 2017
. Our allowance for loan losses as a percent of total loans remained steady at
1.13%
at
December 31, 2018
and
2017
. Charge-offs amounted to
$1.1 million
for
the year ended December 31, 2018
compared to $1.7 million for
the year ended December 31, 2017
. The credit card portfolio represented
74%
and
68%
, respectively, of total charge-offs.
Noninterest Income
Our primary sources of recurring noninterest income are service charges on deposit accounts, certain credit card fees, such as interchange fees and statement fees, and mortgage banking revenue. Noninterest income does not include (i) loan origination fees to the extent they exceed the direct loan origination costs, which are generally recognized over the life of the related loan as an adjustment to yield using the interest method or (ii) annual, renewal and late fees related to our credit card portfolio, which are generally recognized over the twelve month life of the related loan as an adjustment to yield using the interest method.
The following table presents, for the periods indicated, the major categories of noninterest income:
NONINTEREST INCOME
|
Years Ended December 31,
|
||||||||||
|
(in thousands)
|
2018
|
2017
|
% Change
|
|||||||
|
Noninterest income:
|
||||||||||
|
Service charges on deposit accounts
|
$
|
484
|
|
$
|
460
|
|
5.2
|
%
|
||
|
Credit card fees
|
6,048
|
|
4,014
|
|
50.7
|
%
|
||||
|
Mortgage banking revenue
|
9,477
|
|
10,377
|
|
(8.7
|
)%
|
||||
|
Loss on sale of securities
|
(2
|
)
|
—
|
|
—
|
%
|
||||
|
Loss on sale of foreclosed real estate
|
(21
|
)
|
(52
|
)
|
(59.6
|
)%
|
||||
|
Loss on disposal of premises and equipment
|
(276
|
)
|
(77
|
)
|
258.4
|
%
|
||||
|
Other fees and charges
|
414
|
|
427
|
|
(3.0
|
)%
|
||||
|
Total noninterest income
|
$
|
16,124
|
|
$
|
15,149
|
|
6.4
|
%
|
||
Noninterest income for the
the year ended December 31, 2018
was
$16.1 million
, a
$975 thousand
or
6%
increase compared to noninterest income of
$15.1 million
for
the year ended December 31, 2017
. Credit card fees increased
$2.0 million
, or
51%
, for the
year ended December 31, 2018
to
$6.0 million
compared to
$4.0 million
for
the year ended December 31, 2017
,
primarily as a result of an increase in outstanding cards from
149,226
at
December 31, 2017
to
169,981
at
December 31, 2018
. Mortgage
banking
revenue decreased
$900 thousand
, or
9%
, during
2018
to
$9.5 million
compared to
$10.4 million
for
2017
. In response to changing market conditions during 2017, we shifted our mortgage origination focus within Church Street Mortgage, which had been heavily dependent on refinance transactions, to purchase transactions, which have slightly higher rates and prices. Proceeds from the sale of loans held for sale amounted to
$354.4 million
for
the year ended December 31, 2018
compared to
$452.3 million
for
the year ended December 31, 2017
.
|
69
|
||
Noninterest Expense
Generally, noninterest expense is composed of all employee expenses and costs associated with operating our facilities, obtaining and retaining customer relationships and providing bank services. The largest component of noninterest expense is salaries and employee benefits. Noninterest expense also includes operational expenses, such as occupancy and equipment expenses, professional fees, advertising expenses, loan processing expenses and other general and administrative expenses, including FDIC assessments, communications, travel, meals, training, supplies and postage.
The following table presents, for the periods indicated, the major categories of noninterest expense:
NONINTEREST EXPENSE
|
Years Ended December 31,
|
||||||||||
|
(in thousands)
|
2018
|
2017
|
% Change
|
|||||||
|
Noninterest expense:
|
||||||||||
|
Salaries and employee benefits
|
$
|
25,164
|
|
$
|
23,819
|
|
5.6
|
%
|
||
|
Occupancy and equipment
|
4,319
|
|
3,829
|
|
12.8
|
%
|
||||
|
Professional services
|
2,124
|
|
1,874
|
|
13.3
|
%
|
||||
|
Data processing
|
14,184
|
|
9,621
|
|
47.4
|
%
|
||||
|
Advertising
|
1,460
|
|
1,922
|
|
(24.0
|
)%
|
||||
|
Loan processing
|
1,077
|
|
1,409
|
|
(23.6
|
)%
|
||||
|
Other real estate expense, net
|
28
|
|
32
|
|
(12.5
|
)%
|
||||
|
Other
|
5,767
|
|
4,800
|
|
20.1
|
%
|
||||
|
Total noninterest expense
|
$
|
54,123
|
|
$
|
47,306
|
|
14.4
|
%
|
||
Noninterest expense amounted to
$54.1 million
for
the year ended December 31, 2018
, an increase of
$6.8 million
, or
14%
, compared to
$47.3 million
for
the year ended December 31, 2017
. The increase was primarily due to an increase in data processing expenses and, to a lesser extent, increases in salaries and employee benefits, occupancy and equipment expenses, professional services and other expenses. During 2017, to further scale the business and enhance our capabilities, we converted our credit card processing system to a new vendor. Data processing costs will continue to be a significant expense due to the growth of our credit card, mortgage and commercial banking businesses. Salaries and employee benefits increased mainly due to additional personnel. Occupancy and equipment expenses increased due to additional software licensing fees related to our credit card platform, and rental expense associated with our new branch locations in Columbia, Maryland and Reston, Virginia. The increase in professional services was primarily due to audit and other outside services related to being a public company, and other expenses increased due to other credit card expenses.
Income Tax Expense
The amount of income tax expense we incur is influenced by our pre-tax income and our other nondeductible expenses. Deferred tax assets and liabilities are reflected at current income tax rates in effect for the period in which the deferred tax assets and liabilities are expected to be realized or settled. As changes in tax laws or rates are enacted, such as the Tax Act deferred tax assets and liabilities are adjusted through the provision for income taxes. Valuation allowances are established when necessary to reduce deferred tax assets to the amount expected to be realized.
Income tax expense was
$5.0 million
for 2018 compared to
$7.0 million
for
2017
. Our effective tax rates for those periods were
28%
and
50%
, respectively. Our effective tax rate decreased in 2018 primarily as a result of
the Tax Act, which includes a number of changes to existing U.S. tax laws that impact the Company, most notably a reduction of the U.S. corporate income tax rate to 21% for tax years beginning after December
|
70
|
||
31, 2017, as well as the significant charge of
$1.4 million
taken in
2017
to revalue deferred tax assets due to the Tax Act.
Financial Condition
As of
December 31, 2018
, our total assets increased
$79.0 million
from
December 31, 2017
to approximately
$1.1 billion
. Loans receivable and cash increased, while interest bearing deposits at other financial institutions, loans held for sale and securities decreased over that period. Deposits increased
$50.3 million
, and securities sold under agreements to repurchase decreased
$7.9 million
due mainly to transfers of customer deposits to interest bearing checking accounts. Stockholders’ equity increased
$34.4 million
, or
43%
, to
$114.6 million
at
December 31, 2018
, primarily due to our IPO which closed on September 28, 2018, including the exercise in full by the underwriters of their option to purchase an additional 334,310 shares of our common stock on October 4, 2018, and our
2018
net income.
Interest Bearing Deposits at Other Financial Institutions
As of
December 31, 2018
, interest bearing deposits at other financial institutions decreased
$18.4
million, or
45%
, to
$22.0
million from
$40.4
million at
December 31, 2017
. The decrease was primarily due to increased loan funding during the
year ended December 31, 2018
.
Securities
We use our securities portfolio to provide a source of liquidity, provide an appropriate return on funds invested, manage interest rate risk, meet collateral requirements and meet regulatory capital requirements.
Management classifies investment securities as either held to maturity or available for sale based on our intentions and the Company’s ability to hold such securities until maturity. In determining such classifications, securities that management has the positive intent and the Company has the ability to hold until maturity are classified as held to maturity and carried at amortized cost. All other securities are designated as available for sale and carried at estimated fair value with unrealized gains and losses included in shareholders’ equity on an after-tax basis. For the years presented, all securities were classified as available for sale.
Our investment portfolio decreased
13%
, or approximately
$7.1 million
, from
$54.0 million
at
December 31, 2017
, to
$46.9 million
at
December 31, 2018
primarily due to paydowns received on mortgage-backed securities. To supplement interest income earned on our loan portfolio, we invest in high quality mortgage-backed securities, government agency bonds, high quality municipal and corporate bonds.
The following tables summarize the contractual maturities and weighted-average yields of investment securities at
December 31, 2018
and the amortized cost and carrying value of those securities as of the indicated dates.
|
71
|
||
INVESTMENT PORTFOLIO
|
One Year or Less
|
More Than One Year Through Five Years
|
More Than Five Years Through 10 Years
|
More Than 10 Years
|
Total
|
|||||||||||||||||||||||||||||||||||
|
At December 31, 2018
|
Book Value
|
Weighted Average Yield
|
Book Value
|
Weighted Average Yield
|
Book Value
|
Weighted Average Yield
|
Book Value
|
Weighted Average Yield
|
Book Value
|
Fair Value
|
Weighted Average Yield
|
||||||||||||||||||||||||||||
|
(dollars in thousands)
|
|||||||||||||||||||||||||||||||||||||||
|
Securities Available for Sale:
|
|||||||||||||||||||||||||||||||||||||||
|
U.S. government-sponsored agencies
|
$
|
16,496
|
|
1.38
|
%
|
$
|
1,000
|
|
1.45
|
%
|
$
|
—
|
|
—
|
%
|
$
|
—
|
|
—
|
%
|
$
|
17,496
|
|
$
|
17,360
|
|
1.47
|
%
|
|||||||||||
|
Municipal
|
—
|
|
—
|
%
|
—
|
|
—
|
%
|
—
|
|
—
|
%
|
517
|
|
2.49
|
%
|
517
|
|
501
|
|
2.49
|
%
|
|||||||||||||||||
|
Corporate bonds
|
—
|
|
—
|
%
|
—
|
|
—
|
%
|
2,000
|
|
5.50
|
%
|
908
|
|
5.69
|
%
|
2,908
|
|
2,885
|
|
3.69
|
%
|
|||||||||||||||||
|
Mortgage-backed securities
|
2
|
|
5.53
|
%
|
—
|
|
—
|
%
|
13,279
|
|
1.38
|
%
|
13,555
|
|
2.76
|
%
|
26,836
|
|
26,186
|
|
2.23
|
%
|
|||||||||||||||||
|
Total
|
$
|
16,498
|
|
1.38
|
%
|
$
|
1,000
|
|
1.45
|
%
|
$
|
15,279
|
|
1.92
|
%
|
$
|
14,980
|
|
2.93
|
%
|
$
|
47,757
|
|
$
|
46,932
|
|
2.04
|
%
|
|||||||||||
|
December 31,
|
|||||||||||||||||||||||
|
2018
|
2017
|
2016
|
|||||||||||||||||||||
|
Book Value
|
Fair Value
|
Book Value
|
Fair Value
|
Book Value
|
Fair Value
|
||||||||||||||||||
|
(in thousands)
|
|||||||||||||||||||||||
|
Securities Available for Sale:
|
|||||||||||||||||||||||
|
U.S. government-sponsored agencies
|
$
|
17,496
|
|
$
|
17,360
|
|
$
|
17,489
|
|
$
|
17,370
|
|
$
|
17,480
|
|
$
|
17,468
|
|
|||||
|
Municipal
|
517
|
|
501
|
|
518
|
|
515
|
|
—
|
|
—
|
|
|||||||||||
|
Corporate bonds
|
2,908
|
|
2,885
|
|
3,060
|
|
3,077
|
|
3,060
|
|
3,079
|
|
|||||||||||
|
Mortgage-backed securities
|
26,836
|
|
26,186
|
|
33,310
|
|
33,067
|
|
27,490
|
|
27,438
|
|
|||||||||||
|
Total
|
$
|
47,757
|
|
$
|
46,932
|
|
$
|
54,377
|
|
$
|
54,029
|
|
$
|
48,030
|
|
$
|
47,985
|
|
|||||
Loan Portfolio
Our primary source of income is derived from interest earned on loans. Our loan portfolio consists of loans secured by real estate as well as commercial business loans, credit card loans, substantially all of which are secured by corresponding deposits at the Bank and, to a very limited extent, other consumer loans. Our loan customers primarily consist of small- to medium-sized businesses, professionals, real estate investors, small residential builders and individuals. Our owner-occupied and investment commercial real estate loans, residential construction loans and commercial business loans provide us with higher risk-adjusted returns, shorter maturities and more sensitivity to interest rate fluctuations, and are complemented by our relatively lower risk residential real estate loans to individuals. To a lesser but growing extent, our credit card portfolio supplements our traditional lending products with enhanced yields. Our lending activities are principally directed to our market area consisting of the Washington, D.C. and Baltimore metropolitan areas.
|
72
|
||
The following table summarizes our loan portfolio by type of loan as of the dates indicated:
COMPOSITION OF LOAN PORTFOLIO
|
December 31,
|
|||||||||||||||||||||||||||||||
|
2018
|
2017
|
2016
|
2015
|
2014
|
|||||||||||||||||||||||||||
|
(in thousands)
|
Amount
|
Percent
|
Amount
|
Percent
|
Amount
|
Percent
|
Amount
|
Percent
|
Amount
|
Percent
|
|||||||||||||||||||||
|
Real estate:
|
|||||||||||||||||||||||||||||||
|
Residential
|
$
|
407,844
|
|
41
|
%
|
$
|
342,684
|
|
39
|
%
|
286,332
|
|
37
|
%
|
225,185
|
|
35
|
%
|
157,370
|
|
31
|
%
|
|||||||||
|
Commercial
|
278,691
|
|
28
|
|
259,853
|
|
29
|
|
234,869
|
|
31
|
|
190,776
|
|
30
|
|
162,697
|
|
32
|
|
|||||||||||
|
Construction
|
157,586
|
|
16
|
|
144,932
|
|
16
|
|
134,540
|
|
18
|
|
129,304
|
|
20
|
|
111,618
|
|
22
|
|
|||||||||||
|
Commercial
|
122,264
|
|
12
|
|
108,982
|
|
12
|
|
87,563
|
|
11
|
|
79,003
|
|
12
|
|
63,750
|
|
13
|
|
|||||||||||
|
Credit card
|
34,673
|
|
3
|
|
31,507
|
|
4
|
|
20,446
|
|
3
|
|
13,812
|
|
2
|
|
9,562
|
|
2
|
|
|||||||||||
|
Other consumer
|
1,202
|
|
—
|
|
1,053
|
|
—
|
|
1,157
|
|
—
|
|
2,233
|
|
1
|
|
1,624
|
|
—
|
|
|||||||||||
|
Total gross loans
|
1,002,260
|
|
100
|
%
|
889,011
|
|
100
|
%
|
764,907
|
|
100
|
%
|
640,313
|
|
100
|
%
|
506,621
|
|
100
|
%
|
|||||||||||
|
Unearned income
|
(1,992
|
)
|
(1,591
|
)
|
(1,477
|
)
|
(963
|
)
|
(282
|
)
|
|||||||||||||||||||||
|
Total loans, net of unearned income
|
1,000,268
|
|
887,420
|
|
763,430
|
|
|
639,350
|
|
506,339
|
|
||||||||||||||||||||
|
Allowance for loan losses
|
(11,308
|
)
|
(10,033
|
)
|
(8,597
|
)
|
(6,573
|
)
|
(5,531
|
)
|
|||||||||||||||||||||
|
Total net loans
|
$
|
988,960
|
|
$
|
877,387
|
|
754,833
|
|
|
632,777
|
|
500,808
|
|
||||||||||||||||||
Residential Real Estate Loans
. We offer one-to-four family mortgage loans primarily on owner-occupied primary residences and, to a lesser extent, investor owned residences. Residential loans are originated through our commercial sales teams and our Church Street Mortgage division. Our residential loans also include home equity lines of credit. Our one-to-four family residential loans have a relatively small balance spread between many individual borrowers compared to our other loan categories. Our owner-occupied residential real estate loans usually have fixed rates for five or seven years and adjust on an annual basis after the initial term based on a typical maturity of 30 years. Our investor residential real estate loans are based on 25-year terms with a balloon payment due after five years. The required minimum debt service coverage ratio is 1.15. Residential real estate loans have represented a stable and growing portion of our loan portfolio. We intend to continue to emphasize residential real estate lending.
Commercial Real Estate Loans
. We originate both owner-occupied and non-owner-occupied commercial real estate loans. These loans may be more adversely affected by conditions in the real estate markets or in the general economy. Commercial loans that are secured by owner-occupied commercial real estate and primarily collateralized by operating cash flows are also included in this category of loans.
As of
December 31, 2018
, we had approximately
$129.1 million
of owner-occupied commercial real estate loans, representing approximately
46%
of our commercial real estate portfolio.
Commercial real estate loan terms are generally extended for 10 years or less and amortize generally over 25 years or less. The interest rates on our commercial real estate loans have initial fixed rate terms that adjust typically at 5 years and we routinely charge an origination fee for our services. We generally require personal guarantees from the principal owners of the business, supported by a review of the principal owners’ personal financial statements and global debt service obligations. The properties securing the portfolio are located primarily throughout our markets and are generally diverse in terms of type. This diversity helps reduce the exposure to adverse economic events that affect any single industry.
Construction Loans
. Our construction loans are offered within our Washington, D.C. and Baltimore, Maryland metropolitan operating areas to builders primarily for the construction of single-family homes and condominium and townhouse conversions or renovations and, to a lesser extent, to individuals. Our construction loans typically have terms of 12 to 18 months
with the goal of transitioning the borrowers to permanent financing or re-underwriting and selling into the secondary market through Church Street Mortgage. According to our underwriting standards, the ratio of loan principal to collateral value, as established by an independent appraisal, cannot exceed 75% for investor-owned and 80% for owner-occupied properties.
We conduct semi-annual stress testing of our construction loan portfolio and closely monitor underlying real estate conditions as well as our borrower’s trends of sales valuations as compared to underwriting valuations as part of our ongoing risk management efforts. We also closely
monitor our borrowers’ progress in construction buildout and strictly enforce our original underwriting guidelines for construction milestones and completion timelines.
|
73
|
||
Commercial Business Loans
. In addition to our other loan products, we provide general commercial loans, including commercial lines of credit, working capital loans, term loans, equipment financing, letters of credit and other loan products, primarily in our target markets, and underwritten based on each borrower’s ability to service debt from income. These loans are primarily made based on the identified cash flows of the borrower and secondarily, on the underlying collateral provided by the borrower. Most commercial business loans are secured by a lien on general business assets including, among other things, available real estate, accounts receivable, promissory notes, inventory and equipment, and we generally obtain a personal guaranty from the borrower or other principal.
Credit Cards
. Through our OpenSky® credit card division, we provide credit cards on a nationwide basis to under-banked populations and those looking to rebuild their credit scores through a fully digital and mobile platform. Substantially all of the lines of credit are secured by a noninterest bearing demand account at the Bank in an amount equal to the full credit limit of the credit card. In addition, using our proprietary scoring model, which considers credit score and repayment history
(typically a minimum of six months of on-time repayments, but ultimately determined on a case-by-case basis) the Bank has recently begun to offer
certain customers an unsecured line in excess of their secured line of credit.
Other Consumer Loans
. To a very limited extent and typically as an accommodation to existing customers, we offer personal consumer loans such as term loans, car loans or boat loans.
The repayment of loans is a source of additional liquidity for us. The following table details maturities and sensitivity to interest rate changes for our loan portfolio at
December 31, 2018
:
LOAN MATURITY AND SENSITIVITY TO CHANGES IN INTEREST RATES
|
As of December 31, 2018
|
|||||||||||||||
|
(in thousands)
|
Due in One Year
or Less |
Due in One to
Five Years |
Due After
Five Years |
Total
|
|||||||||||
|
Real estate:
|
|||||||||||||||
|
Residential
|
$
|
113,517
|
|
$
|
100,412
|
|
$
|
193,915
|
|
$
|
407,844
|
|
|||
|
Commercial
|
66,333
|
|
134,505
|
|
77,853
|
|
278,691
|
|
|||||||
|
Construction
|
147,072
|
|
10,514
|
|
—
|
|
157,586
|
|
|||||||
|
Commercial
|
61,724
|
|
48,615
|
|
11,925
|
|
122,264
|
|
|||||||
|
Credit card
|
34,673
|
|
—
|
|
—
|
|
34,673
|
|
|||||||
|
Other consumer
|
653
|
|
549
|
|
—
|
|
1,202
|
|
|||||||
|
Total loans
|
$
|
423,972
|
|
$
|
294,595
|
|
$
|
283,693
|
|
$
|
1,002,260
|
|
|||
|
Amounts with fixed rates
|
$
|
107,708
|
|
$
|
217,545
|
|
$
|
44,964
|
|
$
|
370,217
|
|
|||
|
Amounts with floating rates
|
$
|
316,264
|
|
$
|
77,050
|
|
$
|
238,729
|
|
$
|
632,043
|
|
|||
Nonperforming Assets
Loans are considered past due if the required principal and interest payments have not been received as of the date such payments were due. Loans are placed on nonaccrual status when, in management’s opinion, the borrower may be unable to meet payment obligations as they become due, as well as when required by regulatory provisions. Loans may be placed on nonaccrual status regardless of whether or not such loans are considered past due. In general, we place loans on nonaccrual status when they become 90 days past due. We also place loans on nonaccrual status if they are less than 90 days past due if the collection of principal or interest is in doubt. When interest accrual is discontinued, all unpaid accrued interest is reversed from income. Interest income is subsequently recognized only to the extent cash payments are received in excess of principal due. Loans are returned to accrual status when all the principal and interest amounts contractually due are brought current and future payments are, in management’s opinion, reasonably assured. Any loan which the Bank deems to be uncollectible, in whole or in part, is charged off to the extent of the anticipated loss. Consumer credit card balances are moved into the charge off queue after they become more than 90 days past due and are charged off not later than 120 days after they become past due. Loans that are past due for 180 days or more are charged off unless the loan is well secured and in the process of collection.
|
74
|
||
We believe our disciplined lending approach and focused management of nonperforming assets has resulted in sound asset quality and timely resolution of problem assets. We have several procedures in place to assist us in maintaining the overall quality of our loan portfolio. We have established underwriting guidelines to be followed by our bankers, and we also monitor our delinquency levels for any negative or adverse trends. There can be no assurance, however, that our loan portfolio will not become subject to increasing pressures from deteriorating borrower credit due to general economic conditions.
Nonperforming
loans decreased to
$4.7 million
, or
0.47%
of total loans, at
December 31, 2018
compared to
$5.4 million
, or
0.61%
of total loans, at
December 31, 2017
. Foreclosed real estate increased to
$142 thousand
as of
December 31, 2018
compared to
$93 thousand
as of
December 31, 2017
due to the foreclosure of a construction loan for $188 thousand and two non-owner occupied residential loans totaling $179 thousand in the aggregate. OREO of approximately
$357 thousand
was sold during 2018. Accruing restructured loans decreased $3.2 million between
December 31, 2017
and
December 31, 2018
primarily due to two restructured performing loans which were repaid in full in April 2018.
Total nonperforming assets were
$4.8
million at
December 31, 2018
compared to
$5.5 million
at
December 31, 2017
, or
0.44%
and
0.54%
, respectively, of corresponding total assets.
The following table presents information regarding nonperforming assets at the dates indicated:
NONPERFORMING ASSETS
|
December 31,
|
||||||||||||||||||
|
(in thousands)
|
2018
|
2017
|
2016
|
2015
|
2014
|
|||||||||||||
|
Nonaccrual loans
|
||||||||||||||||||
|
Real Estate:
|
||||||||||||||||||
|
Residential
|
$
|
2,207
|
|
$
|
1,828
|
|
1,822
|
|
$
|
2,392
|
|
2,440
|
|
|||||
|
Commercial
|
1,486
|
|
1,648
|
|
1,193
|
|
1,675
|
|
3,182
|
|
||||||||
|
Construction
|
—
|
|
499
|
|
—
|
|
—
|
|
—
|
|
||||||||
|
Commercial
|
749
|
|
1,067
|
|
750
|
|
936
|
|
673
|
|
||||||||
|
Accruing loans 90 or more days past due
|
237
|
|
365
|
|
753
|
|
772
|
|
64
|
|
||||||||
|
Total nonperforming loans
|
4,679
|
|
5,407
|
|
4,518
|
|
5,775
|
|
6,359
|
|
||||||||
|
Other real estate owned
|
142
|
|
93
|
|
90
|
|
203
|
|
454
|
|
||||||||
|
Total nonperforming assets
|
$
|
4,821
|
|
$
|
5,500
|
|
4,608
|
|
$
|
5,978
|
|
$
|
6,813
|
|
||||
|
Restructured loans-nonaccrual
|
$
|
284
|
|
$
|
592
|
|
941
|
|
$
|
2,155
|
|
$
|
2,300
|
|
||||
|
Restructured loans-accruing
|
$
|
—
|
|
$
|
3,219
|
|
—
|
|
$
|
267
|
|
$
|
468
|
|
||||
|
Nonperforming loans to total loans
|
0.47
|
%
|
0.61
|
%
|
0.59
|
%
|
0.90
|
%
|
1.26
|
%
|
||||||||
|
Nonperforming assets to total assets
|
0.44
|
%
|
0.54
|
%
|
0.51
|
%
|
0.80
|
%
|
1.10
|
%
|
||||||||
Potential Problem Loans
From a credit risk standpoint, we grade watchlist and problem loans into one of five categories: pass/watch, special mention, substandard, doubtful or loss. The classifications of loans reflect a judgment about the risks of default and loss associated with the loan. We review the ratings on credits regularly. Ratings are adjusted regularly to reflect the degree of risk and loss that our management believes to be appropriate for each credit. Our methodology is structured so that specific reserve allocations are increased in accordance with deterioration in credit quality (and a corresponding increase in risk and loss) or decreased in accordance with improvement in credit quality (and a corresponding decrease in risk and loss). Our lending policy requires the routine monitoring of weekly past due reports, daily overdraft reports, monthly maturing loans, monthly risk rating reports and internal loan review reports. The lending and credit management of the Bank remain actively engaged in weekly meetings to review loans rated pass/watch. The focus of each meeting is to identify and promptly determine any necessary required action with this loan population, which consists of loans that, although considered satisfactory and performing to terms, may exhibit special risk features that warrant management’s attention.
|
75
|
||
Loans that are deemed special mention, substandard, doubtful or loss are listed in the Bank’s Problem Loan Status Report. The Problem Loan Status Report provides a detailed summary of the borrower and guarantor status, loan accrual status, collateral evaluation and includes a description of the planned collection and administration program designed to mitigate the Bank’s risk of loss and remove the loan from problem status. The Special Asset Committee reviews the Problem Loan Status Report on a quarterly basis for borrowers with an overall loan exposure in excess of $250,000.
The Bank uses the following definitions for watch list risk ratings:
•
Pass/Watch
. Borrowers who are considered satisfactory and performing to terms, however exhibit special risk features such as declining earnings, strained cash flow, increasing leverage, and/or weakening fundamentals that indicate above average risk.
•
Special Mention
. A special mention loan has potential weaknesses deserving of management’s attention. If uncorrected, such weaknesses may result in deterioration of the repayment prospects for the asset or in our credit position at some future date.
•
Substandard
. A substandard loan is inadequately protected by the current financial condition and paying capacity of the obligor or of the collateral pledged, if any. Assets so classified have a well-defined weakness or weaknesses that jeopardize the liquidation of the debt. They are characterized by the distinct possibility that we will sustain some loss if deficiencies are not corrected. Loss potential, while existing in the aggregate amount of substandard assets, does not have to exist in individual assets that are classified as substandard.
•
Doubtful
. A doubtful loan has all weaknesses inherent in one classified as substandard, with the added characteristic that weaknesses make collection or liquidation in full, on the basis of existing facts, conditions, and values, highly questionable and improbable. The probability of loss is extremely high, but certain important and reasonably specific factors that may work to the advantage and strengthening of the asset exist. Therefore, its classification as an estimated loss is deferred until a more precise status may be determined by management. Pending factors include proposed merger, acquisition or liquidation procedures, capital injection, perfecting liens on additional collateral and refinancing plans.
•
Loss
. Credits rated as loss are charged-off. We have no expectation of the recovery of any payments in respect of credits rated as loss.
|
76
|
||
Loans not meeting the criteria above are considered to be pass-rated loans.
The following tables present the loan balances by category as well as risk rating. No assets were classified as loss during the periods presented.
LOAN CLASSIFICATION
|
(in thousands)
|
Pass
(1)
|
Special Mention
|
Substandard
|
Doubtful
|
Total
|
||||||||||||||
|
December 31, 2018
|
|||||||||||||||||||
|
Real estate:
|
|||||||||||||||||||
|
Residential
|
$
|
405,532
|
|
$
|
118
|
|
$
|
2,194
|
|
$
|
—
|
|
$
|
407,844
|
|
||||
|
Commercial
|
274,247
|
|
2,958
|
|
1,486
|
|
—
|
|
278,691
|
|
|||||||||
|
Construction
|
154,643
|
|
843
|
|
2,100
|
|
—
|
|
157,586
|
|
|||||||||
|
Commercial
|
117,670
|
|
3,844
|
|
750
|
|
—
|
|
122,264
|
|
|||||||||
|
Credit card
|
34,673
|
|
—
|
|
—
|
|
—
|
|
34,673
|
|
|||||||||
|
Other consumer
|
1,202
|
|
—
|
|
—
|
|
—
|
|
1,202
|
|
|||||||||
|
Total
|
$
|
987,967
|
|
$
|
7,763
|
|
$
|
6,530
|
|
$
|
—
|
|
$
|
1,002,260
|
|
||||
|
December 31, 2017
|
|||||||||||||||||||
|
Real estate:
|
|||||||||||||||||||
|
Residential
|
$
|
340,854
|
|
$
|
—
|
|
$
|
1,830
|
|
$
|
—
|
|
$
|
342,684
|
|
||||
|
Commercial
|
251,292
|
|
6,175
|
|
2,386
|
|
—
|
|
259,853
|
|
|||||||||
|
Construction
|
144,433
|
|
—
|
|
499
|
|
—
|
|
144,932
|
|
|||||||||
|
Commercial
|
101,868
|
|
5,730
|
|
1,384
|
|
—
|
|
108,982
|
|
|||||||||
|
Credit card
|
31,507
|
|
—
|
|
—
|
|
—
|
|
31,507
|
|
|||||||||
|
Other consumer
|
1,053
|
|
—
|
|
—
|
|
—
|
|
1,053
|
|
|||||||||
|
Total
|
$
|
871,007
|
|
$
|
11,905
|
|
$
|
6,099
|
|
$
|
—
|
|
$
|
889,011
|
|
||||
_______________
|
(1)
|
Category includes loans graded exceptional, very good, good, satisfactory and pass / watch.
|
At
December 31, 2018
, the recorded investment in impaired loans was
$4.4 million
,
$386 thousand
of which required a specific reserve of
$262 thousand
compared to a recorded investment in impaired loans of
$8.2 million
including
$366 thousand
requiring a specific reserve of
$60 thousand
at
December 31, 2017
. Of the
$8.2 million
of impaired loans at
December 31, 2017
, approximately $3.1 million was related to one loan relationship. The Bank received payment in full on the $3.1 million indebtedness in April 2018.
Impaired
loans also include certain loans that have been modified as troubled debt restructurings (“TDRs”). At
December 31, 2018
, the Company had
four
loans amounting to
$284 thousand
that were considered to be TDRs, compared to nine loans amounting to $3.8 million at
December 31, 2017
. The decline from
December 31, 2017
to
December 31, 2018
was largely due to one accruing TDR relationship amounting to $3.1 million that was paid in full during the period.
Allowance for Loan Losses
We maintain an allowance for loan losses that represents management’s best estimate of the loan losses and risks inherent in our loan portfolio. The amount of the allowance for loan losses should not be interpreted as an indication that charge-offs in future periods will necessarily occur in those amounts, or at all. In determining the allowance for loan losses, we estimate losses on specific loans, or groups of loans, where the probable loss can be identified and reasonably determined. The balance of the allowance for loan losses is based on internally assigned risk classifications of loans, historical loan loss rates, changes in the nature of our loan portfolio, overall portfolio quality, industry concentrations, delinquency trends, current economic factors and the estimated impact of current economic conditions on certain historical loan loss rates.
|
77
|
||
The following table presents a summary of changes in the allowance for loan losses for the periods and dates indicated:
ANALYSIS OF THE ALLOWANCE FOR LOAN LOSSES
|
For the Years Ended December 31,
|
||||||||||||||||||||
|
(in thousands)
|
2018
|
2017
|
2016
|
2015
|
2014
|
|||||||||||||||
|
Allowance for loan losses at beginning of period
|
$
|
10,033
|
|
$
|
8,597
|
|
$
|
6,573
|
|
$
|
5,531
|
|
$
|
4,735
|
|
|||||
|
Charge-offs:
|
||||||||||||||||||||
|
Real estate:
|
||||||||||||||||||||
|
Residential
|
(121
|
)
|
(190
|
)
|
(42
|
)
|
(13
|
)
|
(294
|
)
|
||||||||||
|
Commercial
|
(22
|
)
|
(312
|
)
|
(62
|
)
|
(154
|
)
|
(20
|
)
|
||||||||||
|
Construction
|
—
|
|
—
|
|
—
|
|
—
|
|
—
|
|
||||||||||
|
Commercial
|
(147
|
)
|
(25
|
)
|
(1,765
|
)
|
(263
|
)
|
(139
|
)
|
||||||||||
|
Credit card
|
(806
|
)
|
(1,124
|
)
|
(640
|
)
|
(230
|
)
|
—
|
|
||||||||||
|
Other consumer
|
—
|
|
—
|
|
—
|
|
—
|
|
—
|
|
||||||||||
|
Total charge-offs
|
(1,096
|
)
|
(1,651
|
)
|
(2,509
|
)
|
(660
|
)
|
(453
|
)
|
||||||||||
|
Recoveries:
|
||||||||||||||||||||
|
Real estate:
|
||||||||||||||||||||
|
Residential
|
3
|
|
—
|
|
7
|
|
—
|
|
6
|
|
||||||||||
|
Commercial
|
152
|
|
115
|
|
89
|
|
—
|
|
—
|
|
||||||||||
|
Construction
|
—
|
|
—
|
|
—
|
|
76
|
|
—
|
|
||||||||||
|
Commercial
|
34
|
|
3
|
|
8
|
|
17
|
|
13
|
|
||||||||||
|
Credit card
|
42
|
|
314
|
|
138
|
|
—
|
|
—
|
|
||||||||||
|
Other consumer
|
—
|
|
—
|
|
—
|
|
—
|
|
—
|
|
||||||||||
|
Total recoveries
|
231
|
|
432
|
|
242
|
|
93
|
|
19
|
|
||||||||||
|
Net charge-offs
|
(865
|
)
|
(1,219
|
)
|
(2,267
|
)
|
(567
|
)
|
(434
|
)
|
||||||||||
|
Provision for loan losses
|
2,140
|
|
2,655
|
|
4,291
|
|
1,609
|
|
1,230
|
|
||||||||||
|
Allowance for loan losses at period end
|
$
|
11,308
|
|
$
|
10,033
|
|
$
|
8,597
|
|
$
|
6,573
|
|
$
|
5,531
|
|
|||||
|
Allowance for loan losses to period end loans
|
1.13
|
%
|
1.13
|
%
|
1.13
|
%
|
1.03
|
%
|
1.09
|
%
|
||||||||||
|
Net charge-offs to average loans
|
0.09
|
%
|
0.15
|
%
|
0.33
|
%
|
0.10
|
%
|
0.09
|
%
|
||||||||||
Our allowance for loan losses at
December 31, 2018
and
December 31, 2017
was
$11.3
million and $10.0 million, respectively, or
1.13%
of loans for each respective period end. The allowance for loan losses at
December 31, 2018
included specific reserves of
$262 thousand
set aside for impaired loans. Our charge-offs for the
year ended December 31, 2018
were
$1.1 million
and were partially offset by recoveries of
$231
thousand. The allowance for loan losses at
December 31, 2017
included specific reserves of
$60 thousand
set aside for impaired loans. Our charge-offs for the year ended
December 31, 2017
were $1.7 million and were partially offset by recoveries of $432 thousand. The charge-offs for the years ended
December 31, 2018
and
2017
were primarily due to credit card charge-offs as a result of growth in our credit card portfolio and certain charges in excess of credit limits.
Although we believe that we have established our allowance for loan losses in accordance with GAAP and that the allowance for loan losses was adequate to provide for known and inherent losses in the portfolio at all times shown above, future provisions for loan losses will be subject to ongoing evaluations of the risks in our loan portfolio.
The following table shows the allocation of the allowance for loan losses among loan categories and certain other information as of the dates indicated. The total allowance is available to absorb losses from any loan category.
|
78
|
||
ANALYSIS OF THE ALLOWANCE FOR LOAN LOSSES
|
December 31,
|
|||||||||||||||||||||||||||||||
|
2018
|
2017
|
2016
|
2015
|
2014
|
|||||||||||||||||||||||||||
|
(in thousands)
|
Amount
|
Percent
(1)
|
Amount
|
Percent
(1)
|
Amount
|
Percent
(1)
|
Amount
|
Percent
(1)
|
Amount
|
Percent
(1)
|
|||||||||||||||||||||
|
Real estate:
|
|||||||||||||||||||||||||||||||
|
Residential
|
$
|
3,541
|
|
30
|
%
|
$
|
3,137
|
|
31
|
%
|
2,664
|
|
30
|
%
|
2,006
|
|
30
|
%
|
1,458
|
|
26
|
%
|
|||||||||
|
Commercial
|
3,003
|
|
27
|
|
2,860
|
|
29
|
|
2,682
|
|
31
|
|
2,111
|
|
32
|
|
1,967
|
|
36
|
|
|||||||||||
|
Construction
|
2,093
|
|
19
|
|
1,646
|
|
16
|
|
1,591
|
|
19
|
|
1,565
|
|
24
|
|
1,257
|
|
23
|
|
|||||||||||
|
Commercial
|
1,578
|
|
14
|
|
1,497
|
|
15
|
|
1,174
|
|
14
|
|
727
|
|
11
|
|
811
|
|
15
|
|
|||||||||||
|
Credit card
|
1,084
|
|
10
|
|
885
|
|
9
|
|
477
|
|
6
|
|
110
|
|
2
|
|
—
|
|
—
|
|
|||||||||||
|
Other consumer
|
9
|
|
—
|
|
8
|
|
—
|
|
9
|
|
—
|
|
53
|
|
1
|
|
38
|
|
—
|
|
|||||||||||
|
Total allowance for loan losses
|
$
|
11,308
|
|
100
|
%
|
$
|
10,033
|
|
100
|
%
|
8,597
|
|
100
|
%
|
6,572
|
|
100
|
%
|
5,531
|
|
100
|
%
|
|||||||||
_______________
|
(1)
|
Loan category as a percentage of total loans.
|
Deposits
Deposits are the major source of funding for the Company. We offer a variety of deposit products including NOW, savings, money market and time accounts all of which we actively market at competitive pricing. We generate deposits from our customers on a relationship basis and through the efforts of our commercial lending officers and our business banking officers. Our credit card customers are also a significant source of low cost deposits.
As of
December 31, 2018
, our credit card customers accounted for
$60.0 million
, or
25%
, of our total noninterest bearing deposit balances.
We supplement our deposits with wholesale funding sources such as the Certificate of Deposit Account Registry Service (“CDARS”) and brokered deposits.
Interest bearing deposits increased
$4.7 million
, or
0.67%
, from
December 31, 2017
to
December 31, 2018
primarily due to a limited number of large withdrawals in commercial money market accounts. During the same period, certificates of deposit increased
$18.1 million
or
31%
due mainly to two large public fund accounts. In order to fund the loan growth of the Bank, we built upon our prior success of focusing our strategic efforts
to grow core deposits through an expanded deposits sales force, incentives to our commercial loan team and increased marketing efforts.
The average rate paid on interest bearing deposits increased
46
basis points from
0.96%
for the year ended
December 31, 2017
to
1.42%
for the year ended
December 31, 2018
. Rates paid on certificates of deposit increased
57
basis points over the same period. The increase in the average rates was primarily due to increases in market interest rates.
The following table presents the average balances and average rates paid on deposits for the periods indicated:
COMPOSITION OF DEPOSITS
|
December 31,
|
||||||||||||||||||||
|
2018
|
2017
|
2016
|
||||||||||||||||||
|
(in thousands)
|
Average
Balance |
Average
Rate |
Average
Balance |
Average
Rate |
Average
Balance |
Average
Rate |
||||||||||||||
|
NOW accounts
|
$
|
72,523
|
|
0.29
|
%
|
$
|
69,455
|
|
0.22
|
%
|
$
|
50,628
|
|
0.21
|
%
|
|||||
|
Money market accounts
|
286,257
|
|
1.33
|
%
|
282,840
|
|
0.88
|
%
|
252,486
|
|
0.81
|
%
|
||||||||
|
Savings accounts
|
3,704
|
|
0.32
|
%
|
3,365
|
|
0.15
|
%
|
3,326
|
|
0.15
|
%
|
||||||||
|
Certificates of deposit
|
326,827
|
|
1.77
|
%
|
315,979
|
|
1.20
|
%
|
264,626
|
|
1.02
|
%
|
||||||||
|
Total interest bearing deposits
|
689,311
|
|
1.42
|
%
|
671,639
|
|
0.96
|
%
|
571,066
|
|
0.85
|
%
|
||||||||
|
Noninterest bearing demand accounts
|
220,445
|
|
175,707
|
|
141,525
|
|
||||||||||||||
|
Total deposits
|
$
|
909,756
|
|
1.08
|
%
|
$
|
847,346
|
|
0.76
|
%
|
$
|
712,591
|
|
0.68
|
%
|
|||||
|
79
|
||
The following table presents the maturities of our certificates of deposit as of
December 31, 2018
.
MATURITIES OF CERTIFICATES OF DEPOSIT
|
(in thousands)
|
Three
Months or Less |
Over
Three
Through
Six
Months
|
Over Six
Through
Twelve
Months
|
Over
Twelve
Months
|
Total
|
||||||||||||||
|
$100,000 or more
|
$
|
85,739
|
|
$
|
36,718
|
|
$
|
87,371
|
|
$
|
62,357
|
|
$
|
272,185
|
|
||||
|
Less than $100,000
|
21,242
|
|
13,378
|
|
20,379
|
|
8,288
|
|
63,287
|
|
|||||||||
|
Total
|
$
|
106,981
|
|
$
|
50,096
|
|
$
|
107,750
|
|
$
|
70,645
|
|
$
|
335,472
|
|
||||
Borrowings
We primarily utilize short-term and long-term borrowings to supplement deposits to fund our lending and investment activities, each of which is discussed below.
FHLB Advances
. The FHLB allows us to borrow up to 25% of our assets on a blanket floating lien status collateralized by certain securities and loans. As of
December 31, 2018
, approximately
$235.2 million
in real estate loans and
$6.7 million
in investment securities were pledged as collateral for our FHLB borrowings. We utilize these borrowings to meet liquidity needs and to fund certain fixed rate loans in our portfolio. As of
December 31, 2018
, we had
$2.0 million
in outstanding advances and
$185.6 million
in available borrowing capacity from the FHLB.
The following table sets forth certain information on our FHLB borrowings during the periods presented:
FHLB ADVANCES
|
Years Ended December 31,
|
||||||||||||
|
(in thousands)
|
2018
|
2017
|
2016
|
|||||||||
|
Amount outstanding at period-end
|
$
|
2,000
|
|
$
|
2,000
|
|
$
|
6,000
|
|
|||
|
Weighted average interest rate at period-end
|
4.26
|
%
|
4.26
|
%
|
3.03
|
%
|
||||||
|
Maximum month-end balance during the period
|
$
|
17,000
|
|
$
|
11,000
|
|
$
|
21,000
|
|
|||
|
Average balance outstanding during the period
|
$
|
8,101
|
|
$
|
4,910
|
|
$
|
16,516
|
|
|||
|
Weighted average interest rate during the period
|
2.83
|
%
|
3.23
|
%
|
1.53
|
%
|
||||||
Other borrowed funds
. The Company has also issued a senior promissory note, junior subordinated debentures and other subordinated notes. At
December 31, 2018
, these other borrowings amounted to
$15.4 million
.
On July 30, 2014, we issued a senior promissory note in an aggregate principal amount of $5.0 million, which was scheduled to mature on July 31, 2019. The senior promissory note was repaid during the first quarter of 2018.
At
December 31, 2018
, our junior subordinated debentures amounted to
$2.1 million
. The junior subordinated debentures were issued in June of 2006, mature on June 15, 2036, and may be redeemed prior to that date under certain circumstances. The principal amount of the debentures has not changed since issuance, and they accrue interest at a floating rate equal to the three-month LIBOR plus 1.87%.
On November 24, 2015, the Company issued $13.5 million in aggregate principal amount of subordinated notes with a maturity date of December 1, 2025. The notes may be redeemed prior to the maturity date under certain circumstances. The notes bear interest at 6.95% for the first five years, then adjust to the three-month LIBOR plus 5.33%.
Federal Reserve Bank of Richmond
. The Federal Reserve Bank of Richmond has an available borrower in custody arrangement which allows us to borrow on a collateralized basis. The Company’s borrowing capacity
|
80
|
||
under the Federal Reserve’s discount window program was
$13.1 million
as of
December 31, 2018
. Certain commercial loans are pledged under this arrangement. We maintain this borrowing arrangement to meet liquidity needs pursuant to our contingency funding plan. No advances were outstanding under this facility as of
December 31, 2018
.
The Company also has available lines of credit of
$28.0 million
with other correspondent banks at
December 31, 2018
, as well as access to certificate of deposit funding through a financial network which is limited to 15% of the Bank’s assets. The total outstanding lines of credit, or federal funds purchased from correspondent banks was
$2.0 million
at
December 31, 2018
.
The Company also sells securities under repurchase agreements to provide cash management services to commercial account customers. These borrowings totaled
$3.3 million
as of
December 31, 2018
.
|
81
|
||
Liquidity
Liquidity is defined as the Bank’s capacity to meet its cash and collateral obligations at a reasonable cost. Maintaining an adequate level of liquidity depends on the Bank’s ability to meet both expected and unexpected cash flows and collateral needs efficiently without adversely affecting either daily operations or the financial condition of the Bank. Liquidity risk is the risk that we will be unable to meet our obligations as they become due because of an inability to liquidate assets or obtain adequate funding. The Bank’s obligations, and the funding sources used to meet them, depend significantly on our business mix, balance sheet structure and the cash flow profiles of our on- and off-balance sheet obligations. In managing our cash flows, management regularly confronts situations that can give rise to increased liquidity risk. These include funding mismatches, market constraints on the ability to convert assets into cash or in accessing sources of funds (i.e., market liquidity) and contingent liquidity events. Changes in economic conditions or exposure to credit, market, operation, legal and reputational risks also could affect the Bank’s liquidity risk profile and are considered in the assessment of liquidity and asset/liability management.
Management has established a comprehensive management process for identifying, measuring, monitoring and controlling liquidity risk. Because of its critical importance to the viability of the Bank, liquidity risk management is fully integrated into our risk management processes. Critical elements of our liquidity risk management include: effective corporate governance consisting of oversight by the board of directors and active involvement by management; appropriate strategies, policies, procedures, and limits used to manage and mitigate liquidity risk; comprehensive liquidity risk measurement and monitoring systems (including assessments of the current and prospective cash flows or sources and uses of funds) that are commensurate with the complexity and business activities of the Bank; active management of intraday liquidity and collateral; an appropriately diverse mix of existing and potential future funding sources; adequate levels of highly liquid marketable securities free of legal, regulatory or operational impediments, that can be used to meet liquidity needs in stressful situations; comprehensive contingency funding plans that sufficiently address potential adverse liquidity events and emergency cash flow requirements; and internal controls and internal audit processes sufficient to determine the adequacy of the institution’s liquidity risk management process.
We expect funds to be available from a number of basic banking activity sources, including the core deposit base, the repayment and maturity of loans and investment security cash flows. Other potential funding sources include brokered certificates of deposit, deposit listing services, CDARS, borrowings from the FHLB and other lines of credit.
We did not have any borrowings outstanding with the Federal Reserve Bank of Richmond at
December 31, 2018
or
December 31, 2017
, and our borrowing capacity is limited only by eligible collateral. As of
December 31, 2018
, we had
$185.6
million of available borrowing capacity from the FHLB,
$13.1
million of available borrowing capacity from the Federal Reserve Bank of Richmond and available lines of credit of
$26.0
million with other correspondent banks. Cash and cash equivalents were
$34.7
million at
December 31, 2018
and $52.3 million at
December 31, 2017
. Accordingly, our liquidity resources were at sufficient levels to fund loans and meet other cash needs as necessary.
|
82
|
||
Capital Resources
Stockholders’ equity increased
$34.4
million for the
year ended December 31, 2018
compared to the year ended
December 31, 2017
. The Company’s IPO added approximately
$19.8
million of capital. Net income resulted in an increase to retained earnings of
$12.5
million as of
December 31, 2018
. Stock options exercised, shares issued as compensation, shares sold and stock-based compensation increased common stock and additional paid-in capital aggregately by
$2.3
million. This increase was offset by
$45
thousand, or 5,500 shares, repurchased and retired during 2018, and net unrealized losses on available for sale securities and cash flow hedging derivative of
$595 thousand
.
The Company uses several indicators of capital strength. The most commonly used measure is average common equity to average assets (computed as average equity divided by average total assets), which was
8.76%
at
December 31, 2018
and 7.93% at
December 31, 2017
.
The following table shows the return on average assets (computed as net income divided by average total assets), return on average equity (computed as net income divided by average equity) and average equity to average assets ratios for the years ended
December 31, 2018
and
2017
.
|
December 31, 2018
|
December 31, 2017
|
||||
|
Return on Average Assets
|
1.22
|
%
|
0.74
|
%
|
|
|
Return on Average Equity
|
13.94
|
%
|
9.29
|
%
|
|
|
Average Equity to Average Assets
|
8.76
|
%
|
7.93
|
%
|
|
The Bank is subject to various regulatory capital requirements administered by the federal banking agencies. Failure to meet minimum capital requirements can initiate certain mandatory and possibly additional discretionary actions by regulators that, if undertaken, could have a material effect on the Company’s financial statements. Under capital adequacy guidelines and the regulatory framework for prompt corrective action, the Bank must meet specific capital guidelines that involve quantitative measures of its assets, liabilities, and certain off-balance sheet items as calculated under regulatory accounting practices. The capital amounts and classifications are also subject to qualitative judgments by the regulators about components, risk weightings, and other factors.
Quantitative measures established by regulation to ensure capital adequacy require the Bank to maintain minimum ratios of common equity Tier 1, Tier 1, and total capital as a percentage of assets and off-balance sheet exposures, adjusted for risk weights ranging from 0% to 1250%. The Bank is also required to maintain capital at a minimum level based on quarterly average assets, which is known as the leverage ratio.
In July 2013, federal bank regulatory agencies issued a final rule that revised their risk-based capital requirements and the method for calculating risk-weighted assets to make them consistent with certain standards that were developed by Basel III and certain provisions of the Dodd-Frank Act. The final rule applies to all depository institutions and bank holding companies and savings and loan holding companies with total consolidated assets of more than $1 billion. The Bank was required to implement the new Basel III capital standards (subject to the phase-in for certain parts of the new rules) as of January 1, 2015.
In August of 2018 the Regulatory Relief Act directed the Federal Reserve Board to revise the Small BHC Policy Statement to raise the total consolidated asset limit in the Small BHC Policy Statement from $1 billion to $3 billion. The Company was previously required to comply with the minimum capital requirements on a consolidated basis; however, the Company continues to meet the conditions of the revised Small BHC Policy Statement and was, therefore, exempt from the consolidated capital requirements at December 31, 2018.
As of
December 31, 2018
, the Company and the Bank were in compliance with all applicable regulatory capital requirements to which they were subject, and the Bank was classified as “well capitalized” for purposes of the prompt corrective action regulations. As we deploy our capital and continue to grow our operations,
|
83
|
||
our regulatory capital levels may decrease depending on our level of earnings. However, we intend to monitor and control our growth in order to remain in compliance with all regulatory capital standards applicable to us.
The following table presents the regulatory capital ratios for the Company and the Bank as of the dates indicated.
|
(dollars in thousands)
|
Actual
|
Minimum Capital
Adequacy
|
To Be Well
Capitalized
|
Full Phase In
of Basel III
|
||||||||||||||||||||||||
|
December 31, 2018
|
Amount
|
Ratio
|
Amount
|
Ratio
|
Amount
|
Ratio
|
Amount
|
Ratio
|
||||||||||||||||||||
|
The Company
|
||||||||||||||||||||||||||||
|
Tier 1 leverage ratio (to average assets)
|
$
|
117,220
|
|
10.76
|
%
|
$
|
43,575
|
|
4.00
|
%
|
N/A
|
|
N/A
|
|
$
|
43,575
|
|
4.00
|
%
|
|||||||||
|
Tier 1 capital (to risk-weighted assets)
|
117,220
|
|
12.95
|
%
|
71,259
|
|
7.875
|
%
|
N/A
|
|
N/A
|
|
76,914
|
|
8.50
|
%
|
||||||||||||
|
Common equity tier 1 capital ratio (to risk-weighted assets)
|
115,158
|
|
12.73
|
%
|
57,686
|
|
6.375
|
%
|
N/A
|
|
N/A
|
|
63,341
|
|
7.00
|
%
|
||||||||||||
|
Total capital ratio (to risk-weighted assets)
|
117,231
|
|
12.96
|
%
|
89,356
|
|
9.875
|
%
|
N/A
|
|
N/A
|
|
95,012
|
|
10.50
|
%
|
||||||||||||
|
The Bank
|
||||||||||||||||||||||||||||
|
Tier 1 leverage ratio (to average assets)
|
$
|
96,122
|
|
9.06
|
%
|
$
|
42,445
|
|
4.00
|
%
|
$
|
53,056
|
|
5.00
|
%
|
$
|
42,445
|
|
4.00
|
%
|
||||||||
|
Tier 1 capital (to risk-weighted assets)
|
96,122
|
|
11.00
|
%
|
68,822
|
|
7.875
|
%
|
69,914
|
|
8.00
|
%
|
74,284
|
|
8.50
|
%
|
||||||||||||
|
Common equity tier 1 capital ratio (to risk-weighted assets)
|
96,122
|
|
11.00
|
%
|
55,713
|
|
6.375
|
%
|
56,805
|
|
6.50
|
%
|
61,175
|
|
7.00
|
%
|
||||||||||||
|
Total capital ratio (to risk-weighted assets)
|
107,061
|
|
12.25
|
%
|
86,301
|
|
9.875
|
%
|
87,393
|
|
10.00
|
%
|
91,763
|
|
10.50
|
%
|
||||||||||||
|
December 31, 2017
|
||||||||||||||||||||||||||||
|
The Company
|
||||||||||||||||||||||||||||
|
Tier 1 leverage ratio (to average assets)
|
$
|
82,428
|
|
8.10
|
%
|
$
|
40,724
|
|
4.00
|
%
|
N/A
|
|
N/A
|
|
$
|
40,724
|
|
4.00
|
%
|
|||||||||
|
Tier 1 capital (to risk-weighted assets)
|
82,428
|
|
10.18
|
%
|
58,717
|
|
7.25
|
%
|
N/A
|
|
N/A
|
|
68,841
|
|
8.50
|
%
|
||||||||||||
|
Common equity tier 1 capital ratio (to risk-weighted assets)
|
80,366
|
|
9.92
|
%
|
46,569
|
|
5.75
|
%
|
N/A
|
|
N/A
|
|
56,693
|
|
7.00
|
%
|
||||||||||||
|
Total capital ratio (to risk-weighted assets)
|
92,562
|
|
11.43
|
%
|
74,915
|
|
9.25
|
%
|
N/A
|
|
N/A
|
|
85,039
|
|
10.50
|
%
|
||||||||||||
|
The Bank
|
||||||||||||||||||||||||||||
|
Tier 1 leverage ratio (to average assets)
|
$
|
86,150
|
|
8.55
|
%
|
$
|
40,316
|
|
4.00
|
%
|
$
|
50,395
|
|
5.00
|
%
|
$
|
40,316
|
|
4.00
|
%
|
||||||||
|
Tier 1 capital (to risk-weighted assets)
|
86,150
|
|
10.78
|
%
|
57,928
|
|
7.25
|
%
|
63,920
|
|
8.00
|
%
|
67,915
|
|
8.50
|
%
|
||||||||||||
|
Common equity tier 1 capital ratio (to risk-weighted assets)
|
86,150
|
|
10.78
|
%
|
45,943
|
|
5.75
|
%
|
51,935
|
|
6.50
|
%
|
55,930
|
|
7.00
|
%
|
||||||||||||
|
Total capital ratio (to risk-weighted assets)
|
96,148
|
|
12.03
|
%
|
73,908
|
|
9.25
|
%
|
79,900
|
|
10.00
|
%
|
83,895
|
|
10.50
|
%
|
||||||||||||
|
84
|
||
Contractual Obligations
We have contractual obligations to make future payments on debt and lease agreements. While our liquidity monitoring and management consider both present and future demands for and sources of liquidity, the following table of contractual commitments focuses only on future obligations and summarizes our contractual obligations as of
December 31, 2018
.
CONTRACTUAL OBLIGATIONS
|
As of December 31, 2018
|
|||||||||||||||||||
|
(in thousands)
|
Due in One Year or Less
|
Due After One Through Three Years
|
Due After Three Through Five Years
|
Due After 5 Years
|
Total
|
||||||||||||||
|
FHLB advances
|
$
|
2,000
|
|
$
|
—
|
|
$
|
—
|
|
$
|
—
|
|
$
|
2,000
|
|
||||
|
Line of credit advances
|
2,000
|
|
—
|
|
—
|
|
—
|
|
2,000
|
|
|||||||||
|
Certificates of deposit $100,000 or more
|
209,828
|
|
61,611
|
|
746
|
|
—
|
|
272,185
|
|
|||||||||
|
Certificates of deposit less than $100,000
|
54,999
|
|
8,159
|
|
129
|
|
—
|
|
63,287
|
|
|||||||||
|
Subordinated debt
|
—
|
|
—
|
|
—
|
|
15,393
|
|
15,393
|
|
|||||||||
|
Total
|
$
|
268,827
|
|
$
|
69,770
|
|
$
|
875
|
|
$
|
15,393
|
|
$
|
354,865
|
|
||||
Off-Balance Sheet Items
In the normal course of business, we enter into various transactions that, in accordance with GAAP, are not included in our consolidated balance sheets. We enter into these transactions to meet the financing needs of our customers. These transactions include commitments to extend credit and issue letters of credit, which involve, to varying degrees, elements of credit risk and interest rate risk in excess of the amounts recognized in our consolidated balance sheets. Our exposure to credit loss is represented by the contractual amounts of these commitments. The same credit policies and procedures are used in making these commitments as for on-balance sheet instruments. We are not aware of any accounting loss to be incurred by funding these commitments, however we maintain an allowance for off-balance sheet credit risk which is recorded in other liabilities on the consolidated balance sheet.
Our commitments associated with outstanding letters of credit and commitments to extend credit expiring by period as of the date indicated are summarized below. Since commitments associated with letters of credit and commitments to extend credit may expire unused, the amounts shown do not necessarily reflect the actual future cash funding requirements.
CREDIT EXTENSION COMMITMENTS
|
December 31,
|
|||||||
|
(in thousands)
|
2018
|
2017
|
|||||
|
Unfunded lines of credit
|
$
|
209,209
|
|
$
|
180,698
|
|
|
|
Commitments to originate residential loans held for sale
|
647
|
|
4,138
|
|
|||
|
Letters of credit
|
6,216
|
|
6,759
|
|
|||
|
Total credit extension commitments
|
$
|
216,072
|
|
$
|
191,595
|
|
|
Unfunded lines of credit represent unused credit facilities to our current borrowers that represent no change in credit risk that exist in our portfolio. Letters of credit are conditional commitments issued by us to guarantee the performance of a customer to a third party. Lines of credit generally have variable interest rates. In the event of nonperformance by the customer in accordance with the terms of the agreement with
|
85
|
||
the third party, we would be required to fund the commitment. The maximum potential amount of future payments we could be required to make is represented by the contractual amount of the commitment. If the commitment is funded, we would be entitled to seek recovery from the client from the underlying collateral, which can include commercial real estate, physical plant and property, inventory, receivables, cash and/or marketable securities. Our policies generally require that letter of credit arrangements contain security and debt covenants similar to those contained in loan agreements and our credit risk associated with issuing letters of credit is essentially the same as the risk involved in extending loan facilities to our customers.
We minimize our exposure to loss under letters of credit and credit commitments by subjecting them to the same credit approval and monitoring procedures as we do for on-balance sheet instruments. The effect on our revenue, expenses, cash flows and liquidity of the unused portions of these letters of credit commitments cannot be precisely predicted because there is no guarantee that the lines of credit will be used.
Commitments to extend credit are agreements to lend funds to a customer, as long as there is no violation of any condition established in the contract, for a specific purpose. Commitments generally have variable interest rates, fixed expiration dates or other termination clauses and may require payment of a fee. Since many of the commitments are expected to expire without being fully drawn, the total commitment amounts disclosed above do not necessarily represent future cash requirements. We evaluate each customer’s creditworthiness on a case-by-case basis. The amount of collateral obtained, if considered necessary by us, upon extension of credit is based on management’s credit evaluation of the customer.
We enter into forward commitments for the delivery of mortgage loans in our current pipeline. Interest rate lock commitments are entered into in order to economically hedge the effect of changes in interest rates resulting from our commitments to fund the loans. These commitments to fund mortgage loans, to be sold into the secondary market, (interest rate lock commitments) and forward commitments for the future delivery of mortgage loans to third party investors are considered derivatives.
Impact of Inflation
Our consolidated financial statements and related notes included elsewhere in this report have been prepared in accordance with GAAP. GAAP requires the measurement of financial position and operating results in terms of historical dollars, without considering changes in the relative value of money over time due to inflation or recession.
Unlike many industrial companies, substantially all of our assets and liabilities are monetary in nature. As a result, interest rates have a more significant impact on our performance than the effects of general levels of inflation. Interest rates may not necessarily move in the same direction or in the same magnitude as the prices of goods and services. However, other operating expenses do reflect general levels of inflation.
|
86
|
||
ITEM 7A. QUANTITATIVE AND QUALITATIVE DISCLOSURES ABOUT MARKET RISK
Many assumptions are used to calculate the impact of interest rate fluctuations on our net interest income, such as asset prepayments, non-maturity deposit price sensitivity and decay rates, and key rate drivers. Because of the inherent use of these estimates and assumptions in the model, our actual results may, and most likely will, differ from our static earnings at risk (“EAR”) results. In addition, static EAR results do not include actions that our management may undertake to manage the risks in response to anticipated changes in interest rates or client behavior. For example, as part of our asset/liability management strategy, management has the ability to increase asset duration and decrease liability duration in order to reduce asset sensitivity, or to decrease asset duration and increase liability duration in order to increase asset sensitivity.
The following table summarizes the results of our EAR analysis in simulating the change in net interest income and fair value of equity over a 12-month horizon as of
December 31, 2018
:
IMPACT ON NET INTEREST INCOME UNDER A STATIC BALANCE SHEET, PARALLEL INTEREST RATE SHOCK
|
Earnings at Risk
|
-100 bps
|
Flat
|
+100 bps
|
+200 bps
|
+300 bps
|
|||||||||
|
December 31, 2018
|
(4.2
|
)%
|
0.0
|
%
|
4.3
|
%
|
8.5
|
%
|
12.8
|
%
|
||||
Utilizing an economic value of equity (“EVE”) approach, we analyze the risk to capital from the effects of various interest rate scenarios through a long-term discounted cash flow model. This measures the difference between the economic value of our assets and the economic value of our liabilities, which is a proxy for our liquidation value. While this provides some value as a risk measurement tool, management believes EAR is more appropriate in accordance with the going concern principle.
The following table illustrates the results of our EVE analysis as of
December 31, 2018
.
ECONOMIC VALUE OF EQUITY ANALYSIS UNDER A STATIC BALANCE SHEET, PARALLEL INTEREST RATE SHOCK
|
Economic Value of Equity
|
-100 bps
|
Flat
|
+100 bps
|
+200 bps
|
+300 bps
|
|||||||||
|
December 31, 2018
|
2.9
|
%
|
0.0
|
%
|
(3.5
|
)%
|
(7.7
|
)%
|
(12.0
|
)%
|
||||
|
87
|
||
Interest Rate Sensitivity and Market Risk
As a financial institution, our primary component of market risk is interest rate volatility. Our asset liability and funds management policy provides management with the guidelines for effective funds management, and we have established a measurement system for monitoring our net interest rate sensitivity position
.
We manage our sensitivity position within our established guidelines.
Fluctuations in interest rates will ultimately impact both the level of income and expense recorded on most of our assets and liabilities, and the market value of all interest earning assets and interest bearing liabilities, other than those that have a short term to maturity. Interest rate risk is the potential of economic losses due to future interest rate changes. These economic losses can be reflected as a loss of future net interest income and/or a loss of current fair market values. The objective is to measure the effect on net interest income and to adjust the balance sheet to minimize the inherent risk while at the same time maximizing income.
We manage our exposure to interest rates by structuring our balance sheet in the ordinary course of business. We do not enter into instruments such as leveraged derivatives, financial options or financial future contracts for the purpose of reducing interest rate risk. We do hedge the interest rate risks of our available for sale mortgage pipeline by using mortgage-backed securities short positions, and of our subordinated debentures by utilizing an interest rate swap. Based on the nature of our operations, we are not subject to foreign exchange or commodity price risk. We do not own any trading assets.
Our exposure to interest rate risk is managed by the Bank’s ALCO in accordance with policies approved by our board of directors. The committee formulates strategies based on appropriate levels of interest rate risk. In determining the appropriate level of interest rate risk, the committee considers the impact on earnings and capital on the current outlook on interest rates, potential changes in interest rates, regional economies, liquidity, business strategies and other factors. The committee meets regularly to review, among other things, the sensitivity of assets and liabilities to interest rate changes, the book and market values of assets and liabilities, unrealized gains and losses, purchase and sale activities, commitments to originate loans and the maturities of investments and borrowings. Additionally, the committee reviews liquidity, cash flow flexibility, maturities of deposits and consumer and commercial deposit activity. Management employs methodologies to manage interest rate risk, which include an analysis of relationships between interest earning assets and interest bearing liabilities and an interest rate shock simulation model.
The following table indicates that, for periods less than one year, rate-sensitive assets exceeded rate-sensitive liabilities, resulting in an asset-sensitive position. For a bank with an asset-sensitive position, or positive gap, rising interest rates would generally be expected to have a positive effect on net interest income, and falling interest rates would generally be expected to have the opposite effect.
|
88
|
||
INTEREST SENSITIVITY GAP
|
December 31, 2018
|
Within One Month
|
After One Month Through Three Months
|
After Three Through Twelve Months
|
Within One Year
|
Greater Than One Year or Non-Sensitive
|
Total
|
|||||||||||||||||
|
(in thousands)
|
|||||||||||||||||||||||
|
Assets
|
|||||||||||||||||||||||
|
Interest earning assets
|
|||||||||||||||||||||||
|
Loans
(1)
|
$
|
190,825
|
|
$
|
255,511
|
|
$
|
128,474
|
|
$
|
574,810
|
|
$
|
443,984
|
|
$
|
1,018,794
|
|
|||||
|
Securities
|
1,366
|
|
—
|
|
16,502
|
|
17,868
|
|
29,064
|
|
46,932
|
|
|||||||||||
|
Interest bearing deposits at other financial institutions
|
22,007
|
|
—
|
|
—
|
|
22,007
|
|
—
|
|
22,007
|
|
|||||||||||
|
Federal funds sold
|
2,285
|
|
—
|
|
—
|
|
2,285
|
|
—
|
|
2,285
|
|
|||||||||||
|
Total earning assets
|
$
|
216,483
|
|
$
|
255,511
|
|
$
|
144,976
|
|
$
|
616,970
|
|
$
|
473,048
|
|
$
|
1,090,018
|
|
|||||
|
Liabilities
|
|||||||||||||||||||||||
|
Interest bearing liabilities
|
|||||||||||||||||||||||
|
Interest bearing deposits
|
$
|
369,010
|
|
$
|
3,560
|
|
$
|
5,277
|
|
$
|
377,847
|
|
$
|
(339
|
)
|
$
|
377,508
|
|
|||||
|
Time deposits
|
19,117
|
|
52,445
|
|
169,616
|
|
241,178
|
|
94,294
|
|
335,472
|
|
|||||||||||
|
Total interest bearing deposits
|
388,127
|
|
56,005
|
|
174,893
|
|
619,025
|
|
93,955
|
|
712,980
|
|
|||||||||||
|
Securities sold under agreements to repurchase
|
3,332
|
|
—
|
|
—
|
|
3,332
|
|
—
|
|
3,332
|
|
|||||||||||
|
FHLB Advances
|
2,000
|
|
—
|
|
|
2,000
|
|
—
|
|
2,000
|
|
||||||||||||
|
Other borrowed funds
|
2,000
|
|
—
|
|
—
|
|
2,000
|
|
13,393
|
|
15,393
|
|
|||||||||||
|
Total interest bearing liabilities
|
$
|
395,459
|
|
$
|
56,005
|
|
$
|
174,893
|
|
$
|
626,357
|
|
$
|
107,348
|
|
$
|
733,705
|
|
|||||
|
Period gap
|
$
|
(178,976
|
)
|
$
|
199,506
|
|
$
|
(29,917
|
)
|
$
|
(9,387
|
)
|
$
|
365,700
|
|
$
|
356,313
|
|
|||||
|
Cumulative gap
|
$
|
(178,976
|
)
|
$
|
20,530
|
|
$
|
(9,387
|
)
|
$
|
(9,387
|
)
|
$
|
356,313
|
|
||||||||
|
Ratio of cumulative gap to total earning assets
|
(16.42
|
)%
|
1.88
|
%
|
(0.86
|
)%
|
(0.86
|
)%
|
32.69
|
%
|
|||||||||||||
|
(1)
|
Includes loans held for sale.
|
We use quarterly EAR simulations to assess the impact of changing interest rates on our earnings under a variety of scenarios and time horizons. These simulations utilize both instantaneous and parallel changes in the level of interest rates, as well as non-parallel changes such as changing slopes and twists of the yield curve. Static simulation models are based on current exposures and assume a constant balance sheet with no new growth. Dynamic simulation models are also utilized that rely on detailed assumptions regarding changes in existing lines of business, new business, and changes in management and client behavior.
We also use economic value-based methodologies to measure the degree to which the economic values of the Bank’s positions change under different interest rate scenarios. The economic-value approach focuses on a longer-term time horizon and captures all future cash flows expected from existing assets and liabilities. The economic value model utilizes a static approach in that the analysis does not incorporate new business; rather, the analysis shows a snapshot in time of the risk inherent in the balance sheet.
|
89
|
||
ITEM 8. FINANCIAL STATEMENTS AND SUPPLEMENTARY DATA
|
90
|
||

Report of Independent Registered Public Accounting Firm
To the Stockholders and the Board of Directors of Capital Bancorp, Inc.
Opinion on the Financial Statements
We have audited the accompanying consolidated balance sheets of Capital Bancorp, Inc. and Subsidiaries (the “Company”) as of
December 31, 2018
and
2017
, and the related consolidated statements of income, comprehensive income, changes in stockholders’ equity, and cash flows for the years then ended, and the related notes to the consolidated financial statements and schedules (collectively, the “consolidated financial statements”). In our opinion, the consolidated financial statements present fairly, in all material respects, the financial position of the Company as of
December 31, 2018
and
2017
, and the results of its operations and its cash flows for each of the years then ended, in conformity with accounting principles generally accepted in the United States of America.
Basis for Opinion
These financial statements are the responsibility of the Company’s management. Our responsibility is to express an opinion on the Company’s financial statements based on our audits. We are a public accounting firm registered with the Public Company Accounting Oversight Board (United States) (PCAOB) and are required to be independent with respect to the Company in accordance with U.S. federal securities laws and the applicable rules and regulations of the Securities and Exchange Commission and the PCAOB.
We conducted our audits in accordance with the standards of the PCAOB. Those standards require that we plan and perform the audit to obtain reasonable assurance about whether the consolidated financial statements are free of material misstatement, whether due to error or fraud. The Company is not required to have, nor were we engaged to perform, an audit of its internal control over financial reporting under PCAOB standards. As part of our audits we are required to obtain an understanding of internal control over financial reporting but not for the purpose of expressing an opinion on the effectiveness of the Company’s internal control over financial reporting under PCAOB standards. Accordingly, we express no such opinion.
Our audits included performing procedures to assess the risks of material misstatement of the financial statements, whe
ther due to error or fraud, and performing procedures that respond to those risks. Such procedures included examining, on a test basis, evidence regarding the amounts and disclosures in the financial statements. Our audits also included evaluating the accounting principles used and significant estimates made by management, as well as evaluating the overall presentation of the financial statements. We believe that our audits provide a reasonable basis for our opinion.
/s/ Elliott Davis, PLLC
We have served as the Company’s auditor since 2017.
Raleigh, North Carolina
April 1, 2019
elliottdavis.com
|
Capital Bancorp, Inc. and Subsidiaries
Consolidated Balance Sheets
As of December 31, 2018 and 2017
|
|
(dollars in thousands)
|
2018
|
2017
|
|||||
|
Assets
|
|||||||
|
Cash and due from banks
|
$
|
10,431
|
|
$
|
8,189
|
|
|
|
Interest bearing deposits at other financial institutions
|
22,007
|
|
40,356
|
|
|||
|
Federal funds sold
|
2,285
|
|
3,766
|
|
|||
|
Total cash and cash equivalents
|
34,723
|
|
52,311
|
|
|||
|
Investment securities available for sale
|
46,932
|
|
54,029
|
|
|||
|
Restricted investments
|
2,503
|
|
2,369
|
|
|||
|
Loans held for sale
|
18,526
|
|
26,344
|
|
|||
|
Loans receivable, net of allowance for loan losses of $11,308 and $10,033 at December 31, 2018 and 2017, respectively
|
988,960
|
|
877,387
|
|
|||
|
Premises and equipment, net
|
2,975
|
|
2,601
|
|
|||
|
Accrued interest receivable
|
4,462
|
|
3,867
|
|
|||
|
Deferred income taxes
|
3,654
|
|
3,381
|
|
|||
|
Foreclosed real estate
|
142
|
|
93
|
|
|||
|
Prepaid income taxes
|
90
|
|
1,532
|
|
|||
|
Other assets
|
2,091
|
|
2,095
|
|
|||
|
Total assets
|
$
|
1,105,058
|
|
$
|
1,026,009
|
|
|
|
Liabilities
|
|||||||
|
Deposits
|
|||||||
|
Noninterest bearing, including related party balances of $11,214 and $18,316 for the periods ended December 31, 2018 and 2017, respectively
|
$
|
242,259
|
|
$
|
196,635
|
|
|
|
Interest bearing, including related party balances of $144,624 and $159,656 for the periods ended December 31, 2018 and 2017, respectively
|
712,981
|
|
708,264
|
|
|||
|
Total deposits
|
955,240
|
|
904,899
|
|
|||
|
Securities sold under agreements to repurchase
|
3,332
|
|
11,260
|
|
|||
|
Federal funds purchased
|
2,000
|
|
—
|
|
|||
|
Federal Home Loan Bank advances
|
2,000
|
|
2,000
|
|
|||
|
Other borrowed funds
|
15,393
|
|
17,361
|
|
|||
|
Accrued interest payable
|
1,565
|
|
1,084
|
|
|||
|
Other liabilities
|
10,964
|
|
9,286
|
|
|||
|
Total liabilities
|
990,494
|
|
945,890
|
|
|||
|
Stockholders' equity
|
|||||||
|
Preferred stock, $.01 par value; 1,000,000 shares authorized; no shares issued or outstanding at December 31, 2018 and 2017
|
—
|
|
—
|
|
|||
|
Common stock, $.01 par value; 49,000,000 shares authorized; 13,672,479 and 11,537,196 issued and outstanding at December 31, 2018 and 2017, respectively
|
137
|
|
115
|
|
|||
|
Additional paid-in capital
|
49,321
|
|
27,051
|
|
|||
|
Retained earnings
|
65,701
|
|
53,200
|
|
|||
|
Accumulated other comprehensive loss
|
(595
|
)
|
(247
|
)
|
|||
|
Total stockholders' equity
|
114,564
|
|
80,119
|
|
|||
|
Total liabilities and stockholders' equity
|
$
|
1,105,058
|
|
$
|
1,026,009
|
|
|
|
See Notes to Consolidated Financial Statements
|
|
92
|
|
Capital Bancorp, Inc. and Subsidiaries
Consolidated Statements of Income
For the Years Ended December 31, 2018 and 2017
|
|
(dollars in thousands except per share data)
|
2018
|
2017
|
|||||
|
Interest income
|
|||||||
|
Loans, including fees
|
$
|
67,229
|
|
$
|
54,996
|
|
|
|
Investment securities available for sale
|
1,041
|
|
1,068
|
|
|||
|
Federal funds sold and other
|
857
|
|
602
|
|
|||
|
Total interest income
|
69,127
|
|
56,666
|
|
|||
|
Interest expense
|
|||||||
|
Deposits, including $1,727 and $1,172 paid to related parties for the years ended December 31, 2018 and 2017, respectively
|
9,792
|
|
6,434
|
|
|||
|
Borrowed funds
|
1,447
|
|
1,321
|
|
|||
|
Total interest expense
|
11,239
|
|
7,755
|
|
|||
|
Net interest income
|
57,888
|
|
48,911
|
|
|||
|
Provision for loan losses
|
2,140
|
|
2,655
|
|
|||
|
Net interest income after provision for loan losses
|
55,748
|
|
46,256
|
|
|||
|
Noninterest income
|
|||||||
|
Service charges on deposits
|
484
|
|
460
|
|
|||
|
Credit card fees
|
6,048
|
|
4,014
|
|
|||
|
Mortgage banking revenue
|
9,477
|
|
10,377
|
|
|||
|
Loss on sale of investment securities available for sale
|
(2
|
)
|
—
|
|
|||
|
Loss on sale of foreclosed real estate
|
(21
|
)
|
(52
|
)
|
|||
|
Loss on disposal of premises and equipment
|
(276
|
)
|
(77
|
)
|
|||
|
Other fees and charges
|
414
|
|
427
|
|
|||
|
Total noninterest income
|
16,124
|
|
15,149
|
|
|||
|
Noninterest expenses
|
|||||||
|
Salaries and employee benefits
|
25,164
|
|
23,819
|
|
|||
|
Occupancy and equipment
|
4,319
|
|
3,829
|
|
|||
|
Professional fees
|
2,124
|
|
1,874
|
|
|||
|
Data processing
|
14,184
|
|
9,621
|
|
|||
|
Advertising
|
1,460
|
|
1,922
|
|
|||
|
Loan processing
|
1,077
|
|
1,409
|
|
|||
|
Other real estate expenses, net
|
28
|
|
32
|
|
|||
|
Other operating
|
5,767
|
|
4,800
|
|
|||
|
Total noninterest expenses
|
54,123
|
|
47,306
|
|
|||
|
Income before income taxes
|
17,749
|
|
14,099
|
|
|||
|
Income tax expense
|
4,982
|
|
6,990
|
|
|||
|
Net income
|
$
|
12,767
|
|
$
|
7,109
|
|
|
|
Basic earnings per share
|
$
|
1.05
|
|
$
|
0.63
|
|
|
|
Diluted earnings per share
|
$
|
1.02
|
|
$
|
0.62
|
|
|
|
Weighted average common shares outstanding:
|
|||||||
|
Basic
|
12,116,459
|
|
11,261,132
|
|
|||
|
Diluted
|
12,462,138
|
|
11,428,000
|
|
|||
|
See Notes to Consolidated Financial Statements
|
|
93
|
|
Capital Bancorp, Inc. and Subsidiaries
Consolidated Statements of Comprehensive Income
For the Years Ended December 31, 2018 and 2017
|
|
Years Ended December 31,
|
|||||||
|
(in thousands)
|
2018
|
2017
|
|||||
|
Net income
|
$
|
12,767
|
|
$
|
7,109
|
|
|
|
Other comprehensive income (loss):
|
|||||||
|
Unrealized loss on investment securities available for sale
|
(479
|
)
|
(302
|
)
|
|||
|
Reclassification of realized loss on sale of investment securities available for sale
|
2
|
|
—
|
|
|||
|
Unrealized gain (loss) on cash flow hedging derivative
|
(1
|
)
|
13
|
|
|||
|
(478
|
)
|
(289
|
)
|
||||
|
Income tax benefit relating to the items above
|
130
|
|
114
|
|
|||
|
Other comprehensive loss
|
(348
|
)
|
(175
|
)
|
|||
|
Comprehensive income
|
$
|
12,419
|
|
$
|
6,934
|
|
|
|
See Notes to Consolidated Financial Statements
|
|
94
|
|
Capital Bancorp, Inc. and Subsidiaries
Consolidated Statements of Changes in Stockholders’ Equity
For the Years Ended December 31, 2018 and 2017
|
|
Common Stock
|
Additional
Paid-in Capital |
Retained
Earnings
|
Accumulated Other Comprehensive Loss
|
Total
Stockholders'
Equity
|
||||||||||||||||||
|
(dollars in thousands)
|
Shares
|
Amount
|
||||||||||||||||||||
|
Balance, December 31, 2016
|
11,144,696
|
|
$
|
111
|
|
$
|
24,617
|
|
$
|
46,050
|
|
$
|
(31
|
)
|
$
|
70,747
|
|
|||||
|
Net income
|
—
|
|
—
|
|
—
|
|
7,109
|
|
—
|
|
7,109
|
|
||||||||||
|
Unrealized loss on investment securities available for sale, net of income taxes
|
—
|
|
—
|
|
—
|
|
—
|
|
(183
|
)
|
(183
|
)
|
||||||||||
|
Unrealized gain on cash flow hedging derivative, net of income taxes
|
—
|
|
—
|
|
—
|
|
—
|
|
8
|
|
8
|
|
||||||||||
|
Reclassification of other comprehensive loss due to tax rate change
|
41
|
|
(41
|
)
|
—
|
|
||||||||||||||||
|
Stock options exercised, including tax benefit
|
358,332
|
|
4
|
|
1,664
|
|
—
|
|
—
|
|
1,668
|
|
||||||||||
|
Shares issued as compensation
|
102,660
|
|
1
|
|
775
|
|
—
|
|
—
|
|
776
|
|
||||||||||
|
Stock-based compensation
|
—
|
|
—
|
|
506
|
|
—
|
|
—
|
|
506
|
|
||||||||||
|
Shares repurchased and retired
|
(68,492
|
)
|
(1
|
)
|
(511
|
)
|
—
|
|
—
|
|
(512
|
)
|
||||||||||
|
Balance, December 31, 2017
|
11,537,196
|
|
$
|
115
|
|
$
|
27,051
|
|
$
|
53,200
|
|
$
|
(247
|
)
|
$
|
80,119
|
|
|||||
|
Net income
|
—
|
|
—
|
|
—
|
|
12,767
|
|
—
|
|
12,767
|
|
||||||||||
|
Unrealized loss on investment securities available for sale, net of income taxes
|
—
|
|
—
|
|
—
|
|
—
|
|
(346
|
)
|
(346
|
)
|
||||||||||
|
Unrealized loss on cash flow hedging derivative, net of income taxes
|
—
|
|
—
|
|
—
|
|
—
|
|
(2
|
)
|
(2
|
)
|
||||||||||
|
Stock options exercised, including tax benefit
|
230,894
|
|
2
|
|
1,307
|
|
(266
|
)
|
—
|
|
1,043
|
|
||||||||||
|
Shares issued as compensation
|
59,579
|
|
1
|
|
495
|
|
—
|
|
—
|
|
496
|
|
||||||||||
|
Stock-based compensation
|
—
|
|
—
|
|
570
|
|
—
|
|
—
|
|
570
|
|
||||||||||
|
Shares sold
|
16,000
|
|
—
|
|
198
|
|
—
|
|
—
|
|
198
|
|
||||||||||
|
Shares repurchased and retired
|
(5,500
|
)
|
—
|
|
(45
|
)
|
—
|
|
—
|
|
(45
|
)
|
||||||||||
|
Initial public offering, common stock issued, net of costs and underwriting discount of $3.2 million
|
1,834,310
|
|
19
|
|
19,745
|
|
—
|
|
—
|
|
19,764
|
|
||||||||||
|
Balance, December 31, 2018
|
13,672,479
|
|
$
|
137
|
|
$
|
49,321
|
|
$
|
65,701
|
|
$
|
(595
|
)
|
$
|
114,564
|
|
|||||
|
See Notes to Consolidated Financial Statements
|
|
95
|
|
Capital Bancorp, Inc. and Subsidiaries
Consolidated Statements of Cash Flows
For the Years Ended December 31, 2018 and 2017
|
|
(in thousands)
|
2018
|
2017
|
|||||
|
Cash flows from operating activities
|
|||||||
|
Net income
|
$
|
12,767
|
|
$
|
7,109
|
|
|
|
Adjustments to reconcile net income to net cash provided by operating activities:
|
|||||||
|
Provision for loan losses
|
2,140
|
|
2,655
|
|
|||
|
Provision for mortgage put-back reserve
|
106
|
|
115
|
|
|||
|
Provision for off balance sheet reserves
|
152
|
|
100
|
|
|||
|
Net amortization on investments
|
225
|
|
261
|
|
|||
|
Depreciation
|
1,085
|
|
983
|
|
|||
|
Stock-based compensation expense
|
570
|
|
506
|
|
|||
|
Director and employee compensation paid in Company stock
|
496
|
|
776
|
|
|||
|
Deferred income tax benefit
|
(141
|
)
|
(239
|
)
|
|||
|
Amortization of debt issuance expense
|
32
|
|
34
|
|
|||
|
Loss on sale of securities available for sale
|
2
|
|
—
|
|
|||
|
Losses on sales of foreclosed real estate
|
21
|
|
52
|
|
|||
|
Losses on disposal of premises and equipment
|
276
|
|
77
|
|
|||
|
Mortgage banking revenue
|
(9,477
|
)
|
(10,377
|
)
|
|||
|
Sales of loans held for sale
|
354,417
|
|
452,337
|
|
|||
|
Originations of loans held for sale
|
(337,122
|
)
|
(418,912
|
)
|
|||
|
Changes in assets and liabilities:
|
|||||||
|
Accrued interest receivable
|
(595
|
)
|
(654
|
)
|
|||
|
Prepaid income taxes and taxes payable
|
1,529
|
|
(393
|
)
|
|||
|
Other assets
|
4
|
|
913
|
|
|||
|
Accrued interest payable
|
481
|
|
307
|
|
|||
|
Other liabilities
|
1,334
|
|
(836
|
)
|
|||
|
Net cash provided by operating activities
|
28,302
|
|
34,814
|
|
|||
|
Cash flows from investing activities
|
|||||||
|
Purchases of securities available for sale
|
—
|
|
(12,810
|
)
|
|||
|
Proceeds from maturities, calls and principal paydowns of securities available for sale
|
6,044
|
|
6,203
|
|
|||
|
Proceeds from sale of securities available for sale
|
345
|
|
—
|
|
|||
|
Purchases of restricted investments
|
(134
|
)
|
(76
|
)
|
|||
|
Increase in loans receivable
|
(114,140
|
)
|
(126,290
|
)
|
|||
|
Net purchases of premises and equipment
|
(1,735
|
)
|
(1,422
|
)
|
|||
|
Proceeds from sales of foreclosed real estate
|
357
|
|
1,026
|
|
|||
|
Net cash used by investing activities
|
(109,263
|
)
|
(133,369
|
)
|
|||
|
See Notes to Consolidated Financial Statements
|
|
96
|
|
Capital Bancorp, Inc. and Subsidiaries
Consolidated Statements of Cash Flows
For the Years Ended December 31, 2018 and 2017
|
|
(in thousands)
|
2018
|
2017
|
|||||
|
Cash flows from financing activities
|
|||||||
|
Net increase (decrease) in:
|
|||||||
|
Noninterest bearing deposits
|
45,624
|
|
40,430
|
|
|||
|
Interest bearing deposits
|
4,717
|
|
73,545
|
|
|||
|
Securities sold under agreements to repurchase
|
(7,928
|
)
|
1,601
|
|
|||
|
Federal Home Loan Bank advances, net
|
—
|
|
(4,000
|
)
|
|||
|
Federal funds purchased
|
2,000
|
|
—
|
|
|||
|
Other borrowed funds
|
(2,000
|
)
|
—
|
|
|||
|
Repurchase of common stock
|
(45
|
)
|
(512
|
)
|
|||
|
Proceeds from exercise of stock options
|
1,043
|
|
1,668
|
|
|||
|
Proceeds from shares sold
|
198
|
|
—
|
|
|||
|
Proceeds from initial public offering, net
|
19,764
|
|
—
|
|
|||
|
Net cash provided by financing activities
|
63,373
|
|
112,732
|
|
|||
|
Net increase in cash and cash equivalents
|
(17,588
|
)
|
14,177
|
|
|||
|
Cash and cash equivalents, beginning of year
|
52,311
|
|
38,134
|
|
|||
|
Cash and cash equivalents, end of year
|
$
|
34,723
|
|
$
|
52,311
|
|
|
|
Noncash investing and financing activities:
|
|||||||
|
Loans transferred to foreclosed real estate
|
$
|
427
|
|
$
|
1,081
|
|
|
|
Change in unrealized gains on investments
|
$
|
(480
|
)
|
$
|
(302
|
)
|
|
|
Change in fair value of loans held for sale
|
$
|
4
|
|
$
|
225
|
|
|
|
Change in fair value of cash flow hedging derivative
|
$
|
(2
|
)
|
$
|
13
|
|
|
|
Change in corporate tax rate
|
$
|
—
|
|
$
|
(1,386
|
)
|
|
|
Cash paid during the period for:
|
|||||||
|
Taxes
|
$
|
2,655
|
|
$
|
7,993
|
|
|
|
Interest
|
$
|
10,758
|
|
$
|
7,448
|
|
|
|
See Notes to Consolidated Financial Statements
|
|
97
|
|
Capital Bancorp, Inc. and Subsidiaries
|
|
Annual Report on Form 10-K
|
|
Index
|
|
Capital Bancorp, Inc. and Subsidiaries
Notes to Consolidated Financial Statements
December 31, 2018 and 2017
|
|
Note 1 - Nature of Business and Basis of Presentation
|
Nature of operations:
Capital Bancorp, Inc., is a Maryland corporation and bank holding company (the “Company”) for Capital Bank, N.A. (the “Bank”). The Company's primary operations are conducted by the Bank, which operates branches in Rockville, Columbia and North Bethesda, Maryland, Reston, Virginia, and the District of Columbia. The Bank is principally engaged in the business of investing in commercial, real estate, and credit card loans and attracting deposits. We conduct mortgage business through Church Street Mortgage, our residential mortgage banking arm; and credit card business through OpenSky®, a secured, digitally-driven nationwide credit card platform.
The Bank also originates residential mortgages for sale in the secondary market. The Company formed Church Street Capital, LLC (“Church Street Capital”) in 2014 to provide short-term secured real estate financing to Washington, D.C. area investors and developers that may not meet all Bank credit criteria.
In addition, the Company owns all of the stock of Capital Bancorp (MD) Statutory Trust I (the “Trust”). The Trust is a special purpose non-consolidated entity organized for the sole purpose of issuing trust preferred securities.
The Company completed its initial public offering (“IPO”) of
2,563,046
shares of its common stock at a price to the public of
$12.50
per share,
1,834,310
shares of which were sold by the Company and
728,736
shares of which were sold by certain of the Company’s shareholders (the “selling shareholders”). The net proceeds to the Company from the IPO were
$19.8 million
after deducting the underwriting discount and offering expenses of
$3.2 million
. The Company did not receive any proceeds from the sales of shares by the selling shareholders.
Basis of presentation:
The accompanying consolidated financial statements include the activity of the Company and its wholly-owned subsidiaries, the Bank and Church Street Capital. All intercompany transactions have been eliminated in consolidation.
The Company reports its activities as a single business segment. In determining the appropriateness of segment definition, the Company considers components of the business about which financial information is available and regularly evaluated relative to resource allocation and performance assessment. The accompanying consolidated financial statements have been prepared in accordance with accounting principals generally accepted in the United States of America (“GAAP”), and conform to general practices within the banking industry.
On August 15, 2018, the Company completed a
four
-for-one stock split of the Company's authorized, issued, and outstanding common stock, par value
$.01
per share (the “Stock Split”). At the effective time of the Stock Split, each share of the Company's issued and outstanding common stock was automatically increased to four shares issued and outstanding. No fractional shares were issued in connection with the Stock Split. All share and share-related information presented in these consolidated financial statements have been retroactively adjusted to reflect the increased number of shares resulting from the Stock Split.
Significant Accounting Policies:
The preparation of consolidated financial statements in accordance with GAAP requires estimates and judgments that affect the reported amounts of assets, liabilities, revenues and expenses and related disclosures of contingent assets and liabilities. The basis of the estimates is on historical experience and on various other assumptions that are believed to be reasonable under current circumstances, results of which form the basis for making judgments about the carrying value of certain assets and liabilities that are
|
98
|
||
|
Capital Bancorp, Inc. and Subsidiaries
Notes to Consolidated Financial Statements
December 31, 2018 and 2017
|
|
Note 1 - Nature of Business and Basis of Presentation (continued)
|
not readily available from other sources. Estimates are evaluated on an ongoing basis. Actual results may differ from these estimates under different assumptions or conditions.
Cash and cash equivalents
For purposes of reporting cash flows, cash and cash equivalents include cash on hand, amounts due from banks, interest bearing deposits with banks and federal funds sold. Generally, federal funds are sold for one-day periods.
Investment securities
Investment securities are classified as available for sale and carried at fair value with unrealized gains and losses included in stockholders’ equity on an after-tax basis. Premiums and discounts on investment securities are amortized or accreted using the interest method. Changes in the fair value of debt securities available for sale are included in stockholder’s equity as unrealized gains and losses, net of the related tax effect. Unrealized losses are periodically reviewed to determine whether the loss represents an other than temporary impairment. Any unrealized losses judged to be other than a temporary impairment will be charged to income.
Loans held for sale
Mortgage loans originated and intended for sale are recorded at fair value, determined individually, as of the balance sheet date. Fair value is determined based on outstanding investor commitments, or in the absence of such commitments, based on current investor yield requirements. Gains and losses on loan sales are determined by the specific-identification method. The Company’s current practice is to sell residential mortgage loans on a servicing released basis, and, therefore, it has no intangible asset recorded for the value of such servicing. Interest on loans held for sale is credited to income based on the principal amounts outstanding.
Upon sale and delivery, loans are legally isolated from the Company and the Company has no ability to restrict or constrain the ability of third‑party investors to pledge or exchange the mortgage loans. The Company does not have the entitlement or ability to repurchase the mortgage loans or unilaterally cause third‑party investors to put the mortgage loans back to the Company. Unrealized and realized gains on loan sales are determined using the specific-identification method and are recognized through mortgage banking activity in the Consolidated Statements of Income.
The Company elected to measure loans held for sale at fair value to better align reported results with the underlying economic changes in value of the loans on the Company’s balance sheet.
Loans and the Allowance for Loan Losses
Loans are stated at the principal amount outstanding, adjusted for deferred origination fees, deferred origination costs, discounts on loans acquired, and the allowance for loan losses. Interest is accrued based on the loan principal balances and stated interest rates. Origination fees and costs are recognized as an adjustment to the related loan yield using approximate interest methods. The Company discontinues the accrual of interest when any portion of the principal and interest is 90 days past due and collateral is insufficient to discharge the debt in full. Generally, interest payments on nonaccrual loans are recorded as a reduction of the principal balance.
Loans are considered impaired when, based on current information, management believes the Company will not collect all principal and interest payments according to contractual terms. Generally, loans are
|
99
|
||
|
Capital Bancorp, Inc. and Subsidiaries
Notes to Consolidated Financial Statements
December 31, 2018 and 2017
|
|
Note 1 - Nature of Business and Basis of Presentation (continued)
|
reviewed for impairment when the risk grade for a loan is downgraded to a classified asset category. The loans are evaluated for appropriate classification, accrual, impairment, and troubled debt restructure status. If collection of principal is evaluated as doubtful, all payments are applied to principal.
A modification of a loan is considered a TDR when a borrower is experiencing financial difficulty and the modification constitutes a concession. The Company may consider interest rate reductions, changes to payment terms, extensions of maturities and/or principal reductions.
Loans are generally charged-off in part or in full when management determines the loan to be uncollectible. Factors for charge-off that may be considered include: repayments deemed to be projected beyond reasonable time frames, client bankruptcy and lack of assets, and/or collateral deficiencies.
The allowance for loan losses is estimated to adequately provide for probable future losses on existing loans. The allowance consists of specific and general components. For loans that are classified as impaired, an allowance is established when the collateral value, if the loan is collateral dependent, or the discounted cash flows of the impaired loan is lower than the carrying value of that loan. The general component covers pools of nonclassified loans and is based on historical loss experience adjusted for qualitative factors. There may be an unallocated component of the allowance, which reflects the margin of imprecision inherent in the underlying assumptions used in the method for estimating specific and general losses in the portfolio. Actual loan performance may differ from those estimates. A loss is recognized as a charge to the allowance when management believes that collection of the loan is unlikely. Collections of loans previously charged off are added to the allowance at the time of recovery.
We determine the allowance for loan losses based on the accumulation of various components that are calculated independently in accordance with ASC 450 for pools of loans, ASC 310 for Troubled Debt Restructuring, and ASC 310 for individually evaluated loans. The process for determining an appropriate allowance for loan losses is based on a comprehensive, well-documented, and consistently applied analysis of the loan portfolio. The analysis considers all significant factors that affect the collectibility of the portfolio and supports the credit losses estimated by this process. It is important to recognize that the related process, methodology, and underlying assumptions require a substantial degree of judgment.
Premises and equipment
Premises and equipment are stated at cost less accumulated depreciation and amortization over two to seven years. Depreciation and amortization are computed using the straight-line method over the estimated useful lives of the related property. Leasehold improvements are amortized over the estimated useful lives of the improvements, approximately
ten
years, or the term of the lease, whichever is less. Expenditures for maintenance, repairs, and minor replacements are charged to noninterest expenses as incurred.
Derivative Financial Instruments
The Company enters into commitments to fund residential mortgage loans (interest rate locks) with the intention of selling them in the secondary market. The Company also enters into forward sales agreements for certain funded loans and loan commitments. The Company records unfunded commitments intended for loans held for sale and forward sales agreements at fair value with changes in fair value recorded as a component of mortgage banking revenue. Loans originated and intended for sale in the secondary market are carried at fair value. For pipeline loans which are not pre-sold to an investor, the Company manages the interest rate risk on rate lock commitments by entering into forward sale contracts, whereby the Company obtains the right to deliver securities to investors in the future at a specified price. Such contracts are accounted for as derivatives and are recorded at fair value as derivative assets or liabilities, with changes in fair value recorded in mortgage banking revenue.
|
100
|
||
|
Capital Bancorp, Inc. and Subsidiaries
Notes to Consolidated Financial Statements
December 31, 2018 and 2017
|
|
Note 1 - Nature of Business and Basis of Presentation (continued)
|
The Company accounts for derivative instruments and hedging activities according to guidelines established in Financial Accounting Standards Board (“FASB”) Accounting Standards Codification (“ASC”) 815-10,
Accounting for Derivative Instruments and Hedging Activities
, as amended. The Company recognizes all derivatives as either assets or liabilities on the balance sheet and measures those instruments at fair value. Changes in fair value of derivatives designated and accounted for as cash flow hedges, to the extent they are effective as hedges, are recorded in other comprehensive income, net of deferred taxes. Any hedge ineffectiveness would be recognized in the income statement line item pertaining to the hedged item.
Fair Value Measurements
Fair value is the price that would be received to sell an asset or paid to transfer a liability in the principal or most advantageous market for an asset or liability in an orderly transaction between market participants at the measurement date. The degree of management judgment involved in determining the fair value of a financial instrument is dependent upon the availability of quoted market prices or observable market inputs. For financial instruments that are traded actively and have quoted market prices or observable market inputs, there is minimal subjectivity involved in measuring fair value. However, when quoted market prices or observable market inputs are not fully available, significant management judgment may be necessary to estimate fair value. In developing our fair value estimates, we maximize the use of observable inputs and minimize the use of unobservable inputs.
The fair value hierarchy defines Level 1 valuations as those based on quoted prices (unadjusted) for identical assets or liabilities in active markets. Level 2 valuations include inputs based on quoted prices for similar assets or liabilities in active markets, and inputs that are observable for the asset or liability, either directly or indirectly, for substantially the full term of the financial instrument. Level 3 valuations are based on at least one significant assumption not observable in the market, or significant management judgment or estimation, some of which may be internally developed.
Financial assets that are recorded at fair value on a recurring basis include investment securities available for sale, loans held for sale, and derivative financial instruments. Financial liabilities that are recorded at fair value on a recurring basis are comprised of derivative financial instruments. See the Fair Value note to our consolidated financial statements.
Income Taxes
Deferred tax assets and liabilities are determined based on the difference between the financial statement and tax bases of assets and liabilities, using enacted tax rates in effect for the year in which the differences are expected to reverse. Deferred tax assets are recognized when it is deemed more likely than not that the benefits of such deferred income taxes will be realized.
In December of 2017, President Trump signed the the Tax Cuts and Jobs Act of 2017, the (”Tax Act”) into law. While a reduction in the federal corporate income tax rate from 35% to 21% took effect in 2018, the enactment of the law in 2017 required the Company to revalue its deferred tax assets and liabilities as of
December 31, 2017
. This revaluation reduced the Company’s deferred tax asset by
$1.4 million
, which increased 2017 income tax expense by
$1.4 million
. Of this amount,
$40 thousand
of expense was attributable to the Company's net deferred tax asset for unrealized losses on available for sale securities and cash flow hedge. In addition to adjusting the deferred tax asset for this item, the Company recorded an adjustment to accumulated other comprehensive income with a transfer to retained earnings.
|
101
|
||
|
Capital Bancorp, Inc. and Subsidiaries
Notes to Consolidated Financial Statements
December 31, 2018 and 2017
|
|
Note 1 - Nature of Business and Basis of Presentation (continued)
|
Earnings per share:
Earnings per share is computed by dividing net income available to common stockholders by the weighted average number of shares outstanding. Diluted earnings per share is computed by dividing net income by the weighted average number of common shares outstanding, adjusted for the dilutive effect of stock options and restricted stock using the treasury stock method. At
December 31, 2018
and
2017
, there were
7,000
and
246,500
stock options, respectively, that were not included in the calculation as their effect would have been anti-dilutive. The following is a reconciliation of the numerators and denominators used in computing basic and diluted earnings per common share as adjusted for the Stock Split:
|
For the Years Ended December 31,
|
||||||||||||||||||||||
|
2018
|
2017
|
|||||||||||||||||||||
|
(dollars in thousands, except per share information)
|
Income
|
Weighted Average Shares
|
Per Share
Amount
|
Income
|
Weighted Average Shares
|
Per Share
Amount
|
||||||||||||||||
|
Basic EPS
|
||||||||||||||||||||||
|
Net income available to common stockholders
|
$
|
12,767
|
|
12,116,459
|
|
$
|
1.05
|
|
$
|
7,109
|
|
11,261,132
|
|
$
|
0.63
|
|
||||||
|
Effect of dilutive securities
|
—
|
|
345,679
|
|
—
|
|
166,868
|
|
||||||||||||||
|
Dilutive EPS per common share
|
$
|
12,767
|
|
12,462,138
|
|
$
|
1.02
|
|
$
|
7,109
|
|
11,428,000
|
|
$
|
0.62
|
|
||||||
Comprehensive income:
The Company reports as comprehensive income all changes in stockholders' equity during the year from sources other than stockholders. Other comprehensive income refers to all components (income, expenses, gains, and losses) of comprehensive income that are excluded from net income.
The Company's only two components of other comprehensive income are unrealized gains and losses on investment securities available for sale, net of income taxes, and unrealized gains and losses on cash flow hedges, net of income taxes. Information concerning the Company's accumulated other comprehensive income (loss) as of
December 31, 2018
, and
2017
are as follows (in thousands):
|
For the Years Ended December 31,
|
||||||||
|
(in thousands)
|
2018
|
2017
|
||||||
|
Unrealized losses on securities available for sale
|
$
|
(825
|
)
|
$
|
(348
|
)
|
||
|
Deferred tax benefit
|
227
|
|
97
|
|
||||
|
Other comprehensive loss, net of tax
|
(598
|
)
|
(251
|
)
|
||||
|
Unrealized gains on cash flow hedges
|
5
|
|
6
|
|
||||
|
Deferred tax expense
|
(2
|
)
|
(2
|
)
|
||||
|
Other comprehensive income, net of tax
|
3
|
|
4
|
|
||||
|
Total accumulated comprehensive loss
|
$
|
(595
|
)
|
$
|
(247
|
)
|
||
Recently issued accounting pronouncements:
In May 2014, the FASB issued guidance to change the recognition of revenue from contracts with customers. The core principle of the new guidance is that an entity should recognize revenue to reflect the transfer of goods and services to customers in an amount equal to the consideration the entity receives or expects to receive. The guidance became effective for the Company on January 1, 2018.
The Company applied the guidance using a modified retrospective approach. The Company’s revenue is comprised of net interest income and noninterest income. The scope of the guidance explicitly excludes net interest income as well as many other revenues for financial assets and liabilities including loans, leases,
|
102
|
||
|
Capital Bancorp, Inc. and Subsidiaries
Notes to Consolidated Financial Statements
December 31, 2018 and 2017
|
|
Note 1 - Nature of Business and Basis of Presentation (continued)
|
securities, and derivatives. Accordingly, the majority of our revenues were not affected. The Company performed an assessment of our revenue contracts related to revenue streams that are within the scope of the standard. Our accounting policies did not change materially since the principles of revenue recognition from the Accounting Standards Update (“ASU”) are largely consistent with existing practices and guidance applied by our businesses. The Company has not identified material changes to the timing or amount of revenue recognition for deposit service charges, credit card fees and mortgage banking fees. Deposit service charges are based on customer transaction activity and are recognized either daily or monthly when the activity occurs. Credit card fees are recognized monthly according to guidance for receivables and deferred fees. Revenue for mortgage banking is recognized monthly within the scope of other guidance for transfers and servicing, and derivatives and hedging. As such, the Company does not consider the guidance to have a material effect on its financial statements.
In January 2016, the FASB amended the Financial Instruments topic of the ASC to address certain aspects of recognition, measurement, presentation, and disclosure of financial instruments. The amendment became effective January 1, 2018 and did not have a material effect on the financial statements. As discussed in Note 16, the Company measured the fair value of its loan portfolio using an exit price notion as of
December 31, 2018
.
In February 2016, the FASB amended the Leases topic of the ASC to revise certain aspects of recognition, measurement, presentation, and disclosure of leasing transactions. The amendments will be effective for fiscal years beginning after December 15, 2018, including interim periods within those fiscal years.
In February 2016, the FASB issued guidance on leases. The standard requires a lessee to recognize assets and liabilities on the balance sheet for leases with lease terms greater than 12 months, and is effective for fiscal years after December 15, 2018. In July 2018, new guidance was issued to provide an additional transition method that allow entities to not apply this new guidance in the comparative periods presented in the financial statements and instead recognize a cumulative effect adjustment to the beginning retained earnings at the date of application.
The Company assessed this guidance and collected relevant terms for each of its lease agreements. The Company concluded that all of its leases will be classified as operating leases. The Company has estimated its Lease Liability and Right of Use Asset will be in the range of approximately
$4.9 million
to
$5.2 million
, with an expected reduction to retained earnings of approximately
$50 thousand
. The Company does not expect that the adoption of the new standard will have a material impact on its Consolidated Statements of Income.
In March 2016, the FASB amended the Revenue from Contracts with Customers topic of the Accounting Standards Codification to clarify the implementation guidance on principal versus agent considerations and address how an entity should assess whether it is the principal or the agent in contracts that include three or more parties. The amendments became effective for the Company on January 1, 2018 and did not have a material effect on its financial statements.
In June 2016, the FASB issued guidance to change the accounting for credit losses and modify the impairment model for certain debt securities. The amendments will be effective for the Company for reporting periods beginning after December 15, 2019. Early adoption is permitted for all organizations for periods beginning after December 15, 2018.
The Company will apply the amendments to the ASU through a cumulative-effect adjustment to retained earnings as of the beginning of the year of adoption. While early adoption is permitted beginning in first quarter 2019, the Company does not expect to elect that option. The Company is evaluating the impact of the ASU on the consolidated financial statements. In addition to our allowance for loan losses, the Company will also record an allowance for credit losses on debt securities instead of applying the impairment model
|
103
|
||
|
Capital Bancorp, Inc. and Subsidiaries
Notes to Consolidated Financial Statements
December 31, 2018 and 2017
|
|
Note 1 - Nature of Business and Basis of Presentation (continued)
|
currently utilized. The amount of the adjustments will be impacted by each portfolio’s composition and credit quality at the adoption date as well as economic conditions and forecasts at that time.
In February 2017, the FASB amended the Other Income Topic of the ASC to clarify the scope of the guidance on nonfinancial asset derecognition as well as the accounting for partial sales of nonfinancial assets. The amendments conform the derecognition guidance on nonfinancial assets with the model for transactions in the new revenue standard. The amendments became effective for the Company on January 1, 2018 and did not have a material effect on its financial statements.
In March 2017, the FASB amended the Receivables topic of the ASC to eliminate the current diversity in practice with respect to the amortization period for certain purchased callable debt securities held at a premium. The amendments in this update shorten the amortization period for the premium to the earliest call date. This guidance is effective for the Company beginning after December 15, 2019. Early adoption is permitted. The Company does not expect these amendments to have a material effect on its financial statements.
In May 2017, the FASB amended the requirements in the Compensation-Stock Compensation Topic of the ASC related to changes to the terms or conditions of a share-based payment award. The amendments provide guidance about which changes to the terms or conditions of a share-based payment award require an entity to apply modification accounting. The amendments were effective for the Company on January 1, 2018 and did not have a material effect on its financial statements.
In August 2017, the FASB amended the requirements of the Derivatives and Hedging Topic of the Accounting Standards Codification to improve the financial reporting of hedging relationships to better portray the economic results of an entity’s risk management activities in its financial statements. The amendments will be effective for the Company for interim and annual periods beginning after December 15, 2018. Early adoption is permitted. The Company does not expect these amendments to have a material effect on its financial statements.
In February 2018, the FASB amended the Income Statement – Reporting Comprehensive Income Topic of the ASC.
The amendments allow a reclassification from accumulated other comprehensive income to retained earnings for stranded tax effects resulting from the Tax Act.
The Company has early adopted this pronouncement by retrospective application to each period in which the effect of the change in the tax rate under the Tax Act is recognized. The impact of the reclassification from other comprehensive income to retained earnings was included in the Statement of Changes in Stockholders’ Equity as of December 31, 2017.
In March 2018, the FASB updated the Income Taxes Topic of the ASC. The amendments incorporate recent SEC guidance related to the income tax accounting implications of the Tax Cuts and Jobs Act. The amendments were effective upon issuance and did not have a material effect on its financial statements.
In June 2018, the FASB amended the Compensation-Stock Compensation Topic of the Accounting Standards Codification. The amendments expand the scope of Topic 718 to include share-based payment transactions for acquiring goods and services from nonemployees. The amendments are effective for fiscal years beginning after December 15, 2018, including interim periods within that fiscal year. Early adoption is permitted, but no earlier than an entity’s adoption date of Topic 606. The Company does not expect these amendments to have a material effect on its financial statements.
In August 2018, the FASB amended the Fair Value Measurement Topic 820 disclosure framework. These amendments include additions, removals and modifications to the fair value disclosure requirements in Topic 820, and are effective for all entities for fiscal years, and interim periods within those fiscal years, beginning
|
104
|
||
|
Capital Bancorp, Inc. and Subsidiaries
Notes to Consolidated Financial Statements
December 31, 2018 and 2017
|
|
Note 1 - Nature of Business and Basis of Presentation (continued)
|
after December 15, 2019. Early adoption is permitted on removed or modified disclosures. The Company does not expect these amendments to have a material effect on its financial statements.
Other accounting standards that have been issued or proposed by the FASB or other standards-setting bodies are not expected to have a material impact on the Company's financial position, results of operations or cash flows.
Reclassifications:
Certain reclassifications have been made to the amounts reported in prior periods to conform to the current period presentation. The reclassifications had no effect on net income or total stockholders' equity.
Note 2 - Cash and Cash Equivalents
Cash and cash equivalents include cash and due from banks, interest bearing deposits and federal funds sold. The Bank is required by regulation to maintain an average cash reserve balance based on a percentage of deposits. At
December 31, 2018
and
2017
, the requirements were satisfied by amounts on deposits with the Federal Reserve Bank and cash on hand.
Note 3 - Investment Securities
The amortized cost and estimated fair value of investment securities at
December 31, 2018
and
2017
are summarized as follows (in thousands):
|
Investment Securities Available for Sale
|
||||||||||||||||
|
Amortized
Cost
|
Unrealized
Gains
|
Unrealized
Losses
|
Fair
Value
|
|||||||||||||
|
(in thousands)
|
||||||||||||||||
|
December 31, 2018
|
||||||||||||||||
|
U.S. government-sponsored enterprises
|
$
|
17,496
|
|
$
|
—
|
|
$
|
(136
|
)
|
$
|
17,360
|
|
||||
|
Municipal
|
517
|
|
—
|
|
(16
|
)
|
501
|
|
||||||||
|
Corporate
|
2,908
|
|
28
|
|
(51
|
)
|
2,885
|
|
||||||||
|
Mortgage-backed securities
|
26,836
|
|
46
|
|
(696
|
)
|
26,186
|
|
||||||||
|
$
|
47,757
|
|
$
|
74
|
|
$
|
(899
|
)
|
$
|
46,932
|
|
|||||
|
December 31, 2017
|
||||||||||||||||
|
U.S. government-sponsored enterprises
|
$
|
17,489
|
|
$
|
1
|
|
$
|
(120
|
)
|
$
|
17,370
|
|
||||
|
Municipal
|
518
|
|
—
|
|
(3
|
)
|
515
|
|
||||||||
|
Corporate
|
3,060
|
|
67
|
|
(50
|
)
|
3,077
|
|
||||||||
|
Mortgage-backed securities
|
33,310
|
|
179
|
|
(422
|
)
|
33,067
|
|
||||||||
|
$
|
54,377
|
|
$
|
247
|
|
$
|
(595
|
)
|
$
|
54,029
|
|
|||||
Proceeds from sales of securities sold during the year ended
December 31, 2018
, were
$345 thousand
and resulted in aggregate realized losses of
$2 thousand
.
No
securities were sold during the year ended
December 31, 2017
.
|
105
|
||
|
Capital Bancorp, Inc. and Subsidiaries
Notes to Consolidated Financial Statements
December 31, 2018 and 2017
|
|
Note 3 - Investment Securities (continued)
|
Information related to unrealized losses in the investment portfolio as of
December 31, 2018
and
2017
are as follows (in thousands):
|
Investment Securities Unrealized Losses
|
||||||||||||||||||||||||
|
Less than 12 months
|
12 months or longer
|
Total
|
||||||||||||||||||||||
|
Fair
Value
|
Unrealized
Losses
|
Fair
Value
|
Unrealized
Losses
|
Fair
Value
|
Unrealized
Losses
|
|||||||||||||||||||
|
(in thousands)
|
||||||||||||||||||||||||
|
December 31, 2018
|
||||||||||||||||||||||||
|
U.S. government-sponsored enterprises
|
$
|
496
|
|
$
|
(2
|
)
|
$
|
16,864
|
|
$
|
(134
|
)
|
$
|
17,360
|
|
$
|
(136
|
)
|
||||||
|
Municipal
|
—
|
|
—
|
|
501
|
|
(16
|
)
|
501
|
|
(16
|
)
|
||||||||||||
|
Corporate
|
—
|
|
—
|
|
857
|
|
(51
|
)
|
857
|
|
(51
|
)
|
||||||||||||
|
Mortgage-backed securities
|
2,294
|
|
(7
|
)
|
21,037
|
|
(689
|
)
|
23,331
|
|
(696
|
)
|
||||||||||||
|
$
|
2,790
|
|
$
|
(9
|
)
|
$
|
39,259
|
|
$
|
(890
|
)
|
$
|
42,049
|
|
$
|
(899
|
)
|
|||||||
|
December 31, 2017
|
||||||||||||||||||||||||
|
U.S. government-sponsored enterprises
|
$
|
8,967
|
|
$
|
(26
|
)
|
$
|
7,906
|
|
$
|
(94
|
)
|
$
|
16,873
|
|
$
|
(120
|
)
|
||||||
|
Municipal
|
515
|
|
(3
|
)
|
—
|
|
—
|
|
515
|
|
(3
|
)
|
||||||||||||
|
Corporate
|
—
|
|
—
|
|
1,010
|
|
(50
|
)
|
1,010
|
|
(50
|
)
|
||||||||||||
|
Mortgage-backed securities
|
11,204
|
|
(165
|
)
|
13,645
|
|
(257
|
)
|
24,849
|
|
(422
|
)
|
||||||||||||
|
$
|
20,686
|
|
$
|
(194
|
)
|
$
|
22,561
|
|
$
|
(401
|
)
|
$
|
43,247
|
|
$
|
(595
|
)
|
|||||||
At
December 31, 2018
, there were
nine
U.S. government-sponsored enterprises securities,
two
corporate securities,
fifteen
mortgage-backed securities, and
one
municipal security that had been in a loss position for greater than twelve months. Management believes that all unrealized losses have resulted from temporary changes in the interest rates and current market conditions and not as a result of credit deterioration.
Management has the ability and the intent to hold these investment securities until maturity or until they recover in value.
A summary of pledged securities at
December 31, 2018
and
2017
are shown below:
|
Pledged Securities
|
||||||||||||||||
|
For the Years Ended December 31,
|
||||||||||||||||
|
2018
|
2017
|
|||||||||||||||
|
(in thousands)
|
Amortized
Cost
|
Fair
Value
|
Amortized
Cost
|
Fair
Value
|
||||||||||||
|
Securities sold under agreements to repurchase
|
$
|
16,032
|
|
$
|
15,862
|
|
$
|
14,405
|
|
$
|
14,475
|
|
||||
|
Federal Home Loan Bank advances
|
6,713
|
|
6,662
|
|
7,433
|
|
7,454
|
|
||||||||
|
$
|
22,745
|
|
$
|
22,524
|
|
$
|
21,838
|
|
$
|
21,929
|
|
|||||
|
106
|
||
|
Capital Bancorp, Inc. and Subsidiaries
Notes to Consolidated Financial Statements
December 31, 2018 and 2017
|
|
Note 3 - Investment Securities (continued)
|
Contractual maturities of U.S. government-sponsored enterprises and corporate securities at
December 31, 2018
and
2017
are shown below. Actual maturities will differ from contractual maturities because borrowers may have the right to call or prepay obligations with or without call or prepayment penalties.
|
Investment Securities - Contractual Maturities
|
||||||||||||||||
|
For the Years Ended December 31,
|
||||||||||||||||
|
2018
|
2017
|
|||||||||||||||
|
(in thousands)
|
Amortized
Cost
|
Fair
Value
|
Amortized
Cost
|
Fair
Value
|
||||||||||||
|
Within one year
|
$
|
16,496
|
|
$
|
16,377
|
|
$
|
—
|
|
$
|
—
|
|
||||
|
Over one to five years
|
1,000
|
|
983
|
|
17,489
|
|
17,370
|
|
||||||||
|
Over five to ten years
|
2,000
|
|
2,028
|
|
2,518
|
|
2,582
|
|
||||||||
|
Over ten years
|
1,425
|
|
1,358
|
|
1,060
|
|
1,010
|
|
||||||||
|
Mortgage-backed securities
(1)
|
26,836
|
|
26,186
|
|
33,310
|
|
33,067
|
|
||||||||
|
$
|
47,757
|
|
$
|
46,932
|
|
$
|
54,377
|
|
$
|
54,029
|
|
|||||
_______________
|
(1)
|
Mortgage-backed securities are due in monthly installments.
|
|
107
|
||
|
Capital Bancorp, Inc. and Subsidiaries
Notes to Consolidated Financial Statements December 31, 2018 and 2017 |
|
Note 4 - Loans Receivable
|
Major categories of loans are as follows:
|
Loan Categories
|
||||||||
|
For the Years Ended December 31,
|
||||||||
|
(in thousands)
|
2018
|
2017
|
||||||
|
Real estate:
|
||||||||
|
Residential
|
$
|
407,844
|
|
$
|
342,684
|
|
||
|
Commercial
|
278,691
|
|
259,853
|
|
||||
|
Construction
|
157,586
|
|
144,932
|
|
||||
|
Commercial
|
122,264
|
|
108,982
|
|
||||
|
Credit card
|
34,673
|
|
31,507
|
|
||||
|
Other consumer
|
1,202
|
|
1,053
|
|
||||
|
1,002,260
|
|
889,011
|
|
|||||
|
Deferred origination fees, net
|
(1,992
|
)
|
(1,591
|
)
|
||||
|
Allowance for loan losses
|
(11,308
|
)
|
(10,033
|
)
|
||||
|
Loans receivable, net
|
$
|
988,960
|
|
$
|
877,387
|
|
||
The Company makes loans to customers located primarily in the Washington, D.C. metropolitan area. Although the loan portfolio is diversified, its performance will be influenced by the regional economy. The Company’s loan categories are described below.
Residential Real Estate Loans
. One-to-four family mortgage loans are primarily on owner-occupied primary residences and, to a lesser extent, investor owned residences. Residential loans are originated through the commercial sales teams and Church Street Mortgage division. Residential loans also include home equity lines of credit. One-to-four family residential loans have a relatively small balance spread between many individual borrowers compared to our other loan categories. Owner-occupied residential real estate loans usually have fixed rates for
five
or
seven
years and adjust on an annual basis after the initial term based on a typical maturity of
30
years. Investor residential real estate loans are based on
25
-year terms with a balloon payment due after
five
years. The required minimum debt service coverage ratio is
1.15
. Residential real estate loans have represented a stable and growing portion of our loan portfolio. The emphasis will continue to be on residential real estate lending.
Commercial Real Estate Loans
. Commercial real estate loans are originated on owner-occupied and non-owner-occupied properties. These loans may be more adversely affected by conditions in the real estate markets or in the general economy. Commercial loans that are secured by owner-occupied commercial real estate and primarily collateralized by operating cash flows are also included in this category of loans.
As of
December 31, 2018
, there were approximately
$129.1 million
of owner-occupied commercial real estate loans, representing approximately
46%
of the commercial real estate portfolio.
Commercial real estate loan terms are generally extended for
10
years or less and amortize generally over
25
years or less. The interest rates on commercial real estate loans have initial fixed rate terms that adjust typically at
5
years and origination fees are routinely charged for services. Personal guarantees from the principal owners of the business are generally required, supported by a review of the principal owners’ personal financial statements and global debt service obligations. The properties securing the portfolio are located primarily throughout the Company’s markets and are generally diverse in terms of type. This diversity helps reduce the exposure to adverse economic events that affect any single industry.
Construction Loans
. Construction loans are offered within the Company’s Washington, D.C. and Baltimore, Maryland metropolitan operating areas to builders primarily for the construction of single-family homes and condominium and townhouse conversions or renovations and, to a lesser extent, to individuals. Construction loans typically have terms of
12
to
18
months
with the goal of transitioning the borrowers to permanent financing or re-underwriting and selling into the secondary market through Church Street Mortgage. According to underwriting standards, the ratio of loan principal to collateral value, as established by an independent appraisal, cannot exceed
75%
for investor-owned and
80%
for owner-occupied properties.
Semi-annual stress testing of
|
108
|
||
|
Capital Bancorp, Inc. and Subsidiaries
Notes to Consolidated Financial Statements
December 31, 2018 and 2017
|
|
Note 4 - Loans Receivable (continued)
|
the construction loan portfolio is conducted, and underlying real estate conditions are closely monitored as well as the borrower’s trends of sales valuations as compared to underwriting valuations as part of the ongoing risk management efforts.
The borrowers’ progress in construction buildout is closely monitored and the original underwriting guidelines for construction milestones and completion timelines are strictly enforced.
Commercial Business Loans
. In addition to other loan products, general commercial loans, including commercial lines of credit, working capital loans, term loans, equipment financing, letters of credit and other loan products are offered, primarily in target markets, and underwritten based on each borrower’s ability to service debt from income. These loans are primarily made based on the identified cash flows of the borrower and secondarily, on the underlying collateral provided by the borrower. Most commercial business loans are secured by a lien on general business assets including, among other things, available real estate, accounts receivable, promissory notes, inventory and equipment, and personal guaranties from the borrower or other principal are generally obtained.
Credit Cards
. Through the OpenSky® credit card division, credit cards on a nationwide basis to under-banked populations and those looking to rebuild their credit scores are provided through a fully digital and mobile platform. Substantially all of the lines of credit are secured by a noninterest bearing demand account at the Bank in an amount equal to the full credit limit of the credit card. In addition, using a proprietary scoring model, which considers credit score and repayment history
(typically a minimum of
six
months of on-time repayments, but ultimately determined on a case-by-case basis) the Bank has recently begun to offer
certain customers an unsecured line in excess of their secured line of credit.
Approximately
$32.5 million
and
$29.4 million
of the credit card balances were secured by savings deposits held by the Bank as of
December 31, 2018
and
2017
, respectively.
Other Consumer Loans
. To a very limited extent and typically as an accommodation to existing customers, personal consumer loans such as term loans, car loans or boat loans are offered.
Loans acquired through acquisitions are recorded at estimated fair value on their purchase date with no carryover of the related allowance for loan losses. In estimating the fair value of loans acquired, certain factors were considered, including the remaining lives of the acquired loans, payment history, estimated prepayments, estimated loss ratios, estimated value of the underlying collateral, and the net present value of cash flows expected. Discounts on loans that were not considered impaired at acquisition were recorded as an accretable discount, which will be recognized in interest income over the terms of the related loans. For loans considered to be impaired, the difference between the contractually required payments and expected cash flows was recorded as a nonaccretable discount. The remaining nonaccretable discounts on loans acquired were
$354 thousand
and
$601 thousand
as of
December 31, 2018
and
2017
, respectively. Loans with nonaccretable discounts had a carrying value of
$1.3 million
and
$1.5 million
as of
December 31, 2018
and
2017
, respectively.
The activity in the accretable discounts on loans acquired was as follows:
|
Accretable Discounts on Loans Acquired
|
||||||||
|
For the Years Ended December 31,
|
||||||||
|
(in thousands)
|
2018
|
2017
|
||||||
|
Accretable discount at beginning of period
|
$
|
543
|
|
$
|
676
|
|
||
|
Less: Accretion and payoff of loans
|
(105
|
)
|
(133
|
)
|
||||
|
Accretable discount at end of period
|
$
|
438
|
|
$
|
543
|
|
||
The allowance for loan losses consists of specific and general components. The specific component relates to loans that are individually classified as impaired. The general component covers non-impaired loans and is based on historical loss experience adjusted for current economic factors. The following tables present, by class
|
109
|
||
|
Capital Bancorp, Inc. and Subsidiaries
Notes to Consolidated Financial Statements
December 31, 2018 and 2017
|
|
Note 4 - Loans Receivable (continued)
|
and reserving methodology, the allocation of the allowance for loan losses and the gross investment in loans for the years ended
December 31, 2018
and
2017
.
|
Allowance for Loan Losses
|
||||||||||||||||||||||||||||||||||||
|
(in thousands)
|
Provision for
Loan Losses
|
Allowance for Loan Losses
Ending Balance Evaluated
for Impairment:
|
Outstanding Loan
Balances Evaluated
for Impairment:
|
|||||||||||||||||||||||||||||||||
|
December 31, 2018
|
Beginning
Balance
|
Charge-Offs
|
Recoveries
|
Ending
Balance
|
Individually
|
Collectively
|
Individually
|
Collectively
|
||||||||||||||||||||||||||||
|
Real estate:
|
||||||||||||||||||||||||||||||||||||
|
Residential
|
$
|
3,137
|
|
$
|
522
|
|
$
|
(121
|
)
|
$
|
3
|
|
$
|
3,541
|
|
$
|
—
|
|
$
|
3,541
|
|
$
|
2,120
|
|
$
|
405,724
|
|
|||||||||
|
Commercial
|
2,860
|
|
13
|
|
(22
|
)
|
152
|
|
3,003
|
|
—
|
|
3,003
|
|
1,486
|
|
277,205
|
|
||||||||||||||||||
|
Construction
|
1,646
|
|
447
|
|
—
|
|
—
|
|
2,093
|
|
—
|
|
2,093
|
|
—
|
|
157,586
|
|
||||||||||||||||||
|
Commercial
|
1,497
|
|
194
|
|
(147
|
)
|
34
|
|
1,578
|
|
262
|
|
1,316
|
|
749
|
|
121,515
|
|
||||||||||||||||||
|
Credit card
|
885
|
|
963
|
|
(806
|
)
|
42
|
|
1,084
|
|
—
|
|
1,084
|
|
—
|
|
34,673
|
|
||||||||||||||||||
|
Other consumer
|
8
|
|
1
|
|
—
|
|
—
|
|
9
|
|
—
|
|
9
|
|
—
|
|
1,202
|
|
||||||||||||||||||
|
$
|
10,033
|
|
$
|
2,140
|
|
$
|
(1,096
|
)
|
$
|
231
|
|
$
|
11,308
|
|
$
|
262
|
|
$
|
11,046
|
|
$
|
4,355
|
|
$
|
997,905
|
|
||||||||||
|
December 31, 2017
|
||||||||||||||||||||||||||||||||||||
|
Real estate:
|
||||||||||||||||||||||||||||||||||||
|
Residential
|
$
|
2,664
|
|
$
|
664
|
|
$
|
(191
|
)
|
$
|
—
|
|
$
|
3,137
|
|
$
|
—
|
|
$
|
3,137
|
|
$
|
1,766
|
|
$
|
340,918
|
|
|||||||||
|
Commercial
|
2,682
|
|
375
|
|
(312
|
)
|
115
|
|
2,860
|
|
—
|
|
2,860
|
|
4,293
|
|
255,560
|
|
||||||||||||||||||
|
Construction
|
1,591
|
|
55
|
|
—
|
|
—
|
|
1,646
|
|
—
|
|
1,646
|
|
627
|
|
144,305
|
|
||||||||||||||||||
|
Commercial
|
1,174
|
|
345
|
|
(25
|
)
|
3
|
|
1,497
|
|
60
|
|
1,437
|
|
1,544
|
|
107,438
|
|
||||||||||||||||||
|
Credit card
|
477
|
|
1,217
|
|
(1,124
|
)
|
315
|
|
885
|
|
—
|
|
885
|
|
—
|
|
31,507
|
|
||||||||||||||||||
|
Other consumer
|
9
|
|
(1
|
)
|
—
|
|
—
|
|
8
|
|
—
|
|
8
|
|
—
|
|
1,053
|
|
||||||||||||||||||
|
$
|
8,597
|
|
$
|
2,655
|
|
$
|
(1,652
|
)
|
$
|
433
|
|
$
|
10,033
|
|
$
|
60
|
|
$
|
9,973
|
|
$
|
8,230
|
|
$
|
880,781
|
|
||||||||||
|
110
|
||
|
Capital Bancorp, Inc. and Subsidiaries
Notes to Consolidated Financial Statements
December 31, 2018 and 2017
|
|
Note 4 - Loans Receivable (continued)
|
Past due loans, segregated by age and class of loans, as of
December 31, 2018
and
2017
were as follows:
|
Loans Past Due
|
Loans
30-89 Days
Past Due
|
Loans
90 or More
Days
Past Due
|
Total
Past Due
Loans
|
Current
Loans
|
Total
Loans
|
Accruing
Loans 90 or
More days
Past Due
|
Nonaccrual
Loans
|
|||||||||||||||||||||
|
(in thousands)
|
||||||||||||||||||||||||||||
|
December 31, 2018
|
||||||||||||||||||||||||||||
|
Real estate:
|
||||||||||||||||||||||||||||
|
Residential
|
$
|
1,070
|
|
$
|
2,081
|
|
$
|
3,151
|
|
$
|
404,693
|
|
$
|
407,844
|
|
$
|
235
|
|
$
|
2,207
|
|
|||||||
|
Commercial
|
1,746
|
|
1,431
|
|
3,177
|
|
275,514
|
|
278,691
|
|
—
|
|
1,486
|
|
||||||||||||||
|
Construction
|
—
|
|
—
|
|
—
|
|
157,586
|
|
157,586
|
|
—
|
|
—
|
|
||||||||||||||
|
Commercial
|
612
|
|
398
|
|
1,010
|
|
121,254
|
|
122,264
|
|
—
|
|
749
|
|
||||||||||||||
|
Credit card
|
3,771
|
|
2
|
|
3,773
|
|
30,900
|
|
34,673
|
|
2
|
|
—
|
|
||||||||||||||
|
Other consumer
|
—
|
|
—
|
|
—
|
|
1,202
|
|
1,202
|
|
—
|
|
—
|
|
||||||||||||||
|
$
|
7,199
|
|
$
|
3,912
|
|
$
|
11,111
|
|
$
|
991,149
|
|
$
|
1,002,260
|
|
$
|
237
|
|
$
|
4,442
|
|
||||||||
|
Acquired loans included above
|
$
|
521
|
|
$
|
488
|
|
$
|
1,009
|
|
$
|
7,275
|
|
$
|
8,284
|
|
$
|
235
|
|
$
|
582
|
|
|||||||
|
December 31, 2017
|
||||||||||||||||||||||||||||
|
Real estate:
|
||||||||||||||||||||||||||||
|
Residential
|
$
|
8,311
|
|
$
|
968
|
|
$
|
9,279
|
|
$
|
333,405
|
|
$
|
342,684
|
|
$
|
—
|
|
$
|
1,828
|
|
|||||||
|
Commercial
|
128
|
|
333
|
|
461
|
|
259,392
|
|
259,853
|
|
—
|
|
1,648
|
|
||||||||||||||
|
Construction
|
—
|
|
280
|
|
280
|
|
144,652
|
|
144,932
|
|
280
|
|
499
|
|
||||||||||||||
|
Commercial
|
1,219
|
|
911
|
|
2,130
|
|
106,852
|
|
108,982
|
|
—
|
|
1,067
|
|
||||||||||||||
|
Credit card
|
2,982
|
|
85
|
|
3,067
|
|
28,440
|
|
31,507
|
|
85
|
|
—
|
|
||||||||||||||
|
Other consumer
|
—
|
|
—
|
|
—
|
|
1,053
|
|
1,053
|
|
—
|
|
—
|
|
||||||||||||||
|
$
|
12,640
|
|
$
|
2,577
|
|
$
|
15,217
|
|
$
|
873,794
|
|
$
|
889,011
|
|
$
|
365
|
|
$
|
5,042
|
|
||||||||
|
Acquired loans included above
|
$
|
208
|
|
$
|
635
|
|
$
|
843
|
|
$
|
9,526
|
|
$
|
10,368
|
|
$
|
—
|
|
$
|
1,367
|
|
|||||||
|
111
|
||
|
Capital Bancorp, Inc. and Subsidiaries
Notes to Consolidated Financial Statements
December 31, 2018 and 2017
|
|
Note 4 - Loans Receivable (continued)
|
Impaired loans include loans acquired on which management has recorded a nonaccretable discount. Impaired loans as of
December 31, 2018
and
2017
were as follows:
|
Impaired Loans
|
||||||||||||||||||||||||||||
|
Unpaid
contractual
principal
balance
|
Recorded
investment
with no
allowance
|
Recorded
investment
with
allowance
|
Total
recorded
investment
|
Related
allowance
|
Average
recorded
investment
|
Interest
recognized
|
||||||||||||||||||||||
|
(in thousands)
|
||||||||||||||||||||||||||||
|
December 31, 2018
|
||||||||||||||||||||||||||||
|
Real estate
|
||||||||||||||||||||||||||||
|
Residential
|
$
|
2,411
|
|
$
|
2,120
|
|
$
|
—
|
|
$
|
2,120
|
|
$
|
—
|
|
$
|
2,564
|
|
$
|
28
|
|
|||||||
|
Commercial
|
1,551
|
|
1,486
|
|
—
|
|
1,486
|
|
—
|
|
1,591
|
|
—
|
|
||||||||||||||
|
Construction
|
32
|
|
—
|
|
—
|
|
—
|
|
—
|
|
140
|
|
—
|
|
||||||||||||||
|
Commercial
|
856
|
|
363
|
|
386
|
|
749
|
|
262
|
|
1,270
|
|
—
|
|
||||||||||||||
|
$
|
4,850
|
|
$
|
3,969
|
|
$
|
386
|
|
$
|
4,355
|
|
$
|
262
|
|
$
|
5,565
|
|
$
|
28
|
|
||||||||
|
Acquired loans included above
|
$
|
775
|
|
$
|
497
|
|
$
|
—
|
|
$
|
497
|
|
$
|
—
|
|
$
|
—
|
|
$
|
—
|
|
|||||||
|
December 31, 2017
|
||||||||||||||||||||||||||||
|
Real estate
|
||||||||||||||||||||||||||||
|
Residential
|
$
|
2,329
|
|
$
|
1,766
|
|
$
|
—
|
|
$
|
1,766
|
|
$
|
—
|
|
$
|
1,948
|
|
$
|
30
|
|
|||||||
|
Commercial
|
4,677
|
|
4,293
|
|
—
|
|
4,293
|
|
—
|
|
4,407
|
|
169
|
|
||||||||||||||
|
Construction
|
659
|
|
627
|
|
—
|
|
627
|
|
—
|
|
880
|
|
24
|
|
||||||||||||||
|
Commercial
|
1,824
|
|
1,178
|
|
366
|
|
1,544
|
|
60
|
|
1,600
|
|
48
|
|
||||||||||||||
|
$
|
9,489
|
|
$
|
7,864
|
|
$
|
366
|
|
$
|
8,230
|
|
$
|
60
|
|
$
|
8,835
|
|
$
|
271
|
|
||||||||
|
Acquired loans included above
|
$
|
2,149
|
|
$
|
1,366
|
|
$
|
—
|
|
$
|
1,366
|
|
$
|
—
|
|
$
|
1,553
|
|
$
|
1
|
|
|||||||
There were
$221 thousand
and
$503 thousand
, respectively, of loans secured by
one
to
four
family residential properties in the process of foreclosure as of
December 31, 2018
and
December 31, 2017
.
Credit quality indicators
As part of the ongoing monitoring of the credit quality of the Company’s loan portfolio, management tracks certain credit quality indicators including trends related to the risk grade of loans, the level of classified loans, net charge-offs, nonperforming loans, and the general economic conditions in the Company’s market.
The Company utilizes a risk grading matrix to assign a risk grade to each of its loans. A description of the general characteristics of loans characterized as classified is as follows:
Special Mention
A special mention loan has potential weaknesses that deserve management’s close attention. If left uncorrected, these potential weaknesses may result in deterioration of the repayment prospects for the asset or in the Company’s credit position at some future date. Special mention loans are not adversely classified and do not expose the Company to sufficient risk to warrant adverse classification.
Borrowers may exhibit poor liquidity and leverage positions resulting from generally negative cash flow or negative trends in earnings. Access to alternative financing may be limited to finance companies for business borrowers and may be unavailable for commercial real estate borrowers.
|
112
|
||
|
Capital Bancorp, Inc. and Subsidiaries
Notes to Consolidated Financial Statements
December 31, 2018 and 2017
|
|
Note 4 - Loans Receivable (continued)
|
Substandard
A substandard loan is inadequately protected by the current financial condition and paying capacity of the obligor or of the collateral pledged, if any. Substandard loans have a well-defined weakness, or weaknesses, that jeopardize the liquidation of the debt. They are characterized by the distinct possibility that the Company will sustain some loss if the deficiencies are not corrected.
Borrowers may exhibit recent or unexpected unprofitable operations, an inadequate debt service coverage ratio, or marginal liquidity and capitalization. These loans require more intense supervision by Company management.
Doubtful
A doubtful loan has all the weaknesses inherent as a substandard loan with the added characteristic that the weaknesses make collection or liquidation in full, on the basis of currently existing facts, conditions, and values, highly questionable and improbable.
The following table presents the balances of classified loans based on the risk grade. Classified loans include Special Mention, Substandard, and Doubtful loans:
|
Loan Classifications
|
|||||||||||||||||||
|
(in thousands)
|
Pass
(1)
|
Special Mention
|
Substandard
|
Doubtful
|
Total
|
||||||||||||||
|
December 31, 2018
|
|||||||||||||||||||
|
Real estate:
|
|||||||||||||||||||
|
Residential
|
$
|
405,532
|
|
$
|
118
|
|
$
|
2,194
|
|
$
|
—
|
|
$
|
407,844
|
|
||||
|
Commercial
|
274,247
|
|
2,958
|
|
1,486
|
|
—
|
|
278,691
|
|
|||||||||
|
Construction
|
154,643
|
|
843
|
|
2,100
|
|
—
|
|
157,586
|
|
|||||||||
|
Commercial
|
117,670
|
|
3,844
|
|
750
|
|
—
|
|
122,264
|
|
|||||||||
|
Credit card
|
34,673
|
|
—
|
|
—
|
|
—
|
|
34,673
|
|
|||||||||
|
Other consumer
|
1,202
|
|
—
|
|
—
|
|
—
|
|
1,202
|
|
|||||||||
|
Total
|
$
|
987,967
|
|
$
|
7,763
|
|
$
|
6,530
|
|
$
|
—
|
|
$
|
1,002,260
|
|
||||
|
December 31, 2017
|
|||||||||||||||||||
|
Real estate:
|
|||||||||||||||||||
|
Residential
|
$
|
340,854
|
|
$
|
—
|
|
$
|
1,830
|
|
$
|
—
|
|
$
|
342,684
|
|
||||
|
Commercial
|
251,292
|
|
6,175
|
|
2,386
|
|
—
|
|
259,853
|
|
|||||||||
|
Construction
|
144,433
|
|
—
|
|
499
|
|
—
|
|
144,932
|
|
|||||||||
|
Commercial
|
101,868
|
|
5,730
|
|
1,384
|
|
—
|
|
108,982
|
|
|||||||||
|
Credit card
|
31,507
|
|
—
|
|
—
|
|
—
|
|
31,507
|
|
|||||||||
|
Other consumer
|
1,053
|
|
—
|
|
—
|
|
—
|
|
1,053
|
|
|||||||||
|
Total
|
$
|
871,007
|
|
$
|
11,905
|
|
$
|
6,099
|
|
$
|
—
|
|
$
|
889,011
|
|
||||
________________________
(1)
Classification includes loans graded exceptional, very good, good, satisfactory and pass/watch
Impaired loans also include certain loans that have been modified in troubled debt restructurings (“TDRs”) where economic concessions have been granted to borrowers who have experienced or are expected to experience financial difficulties. These concessions typically result from the Company’s loss mitigation activities and could include reductions in the interest rate, payment extensions, forgiveness of principal, forbearance or other actions. Certain TDRs are classified as nonperforming at the time of restructure and may only be returned
|
113
|
||
|
Capital Bancorp, Inc. and Subsidiaries
Notes to Consolidated Financial Statements
December 31, 2018 and 2017
|
|
Note 4 - Loans Receivable (continued)
|
to performing status after considering the borrower’s sustained repayment performance for a reasonable period, generally six months. The status of TDRs is as follows:
|
Troubled Debt Restructurings
|
|||||||||||||||
|
Number of
Contracts
|
Recorded Investment
|
||||||||||||||
|
(dollars in thousands)
|
Performing
|
Nonperforming
|
Total
|
||||||||||||
|
December 31, 2018
|
|||||||||||||||
|
Real estate:
|
|||||||||||||||
|
Residential
|
3
|
|
$
|
—
|
|
$
|
145
|
|
$
|
145
|
|
||||
|
Commercial
|
1
|
|
—
|
|
139
|
|
139
|
|
|||||||
|
Total
|
4
|
|
$
|
—
|
|
$
|
284
|
|
$
|
284
|
|
||||
|
Acquired loans included above
|
3
|
|
$
|
—
|
|
$
|
145
|
|
$
|
145
|
|
||||
|
December 31, 2017
|
|||||||||||||||
|
Real estate:
|
|||||||||||||||
|
Residential
|
5
|
|
$
|
—
|
|
$
|
254
|
|
$
|
254
|
|
||||
|
Commercial
|
1
|
|
2,709
|
|
—
|
|
2,709
|
|
|||||||
|
Commercial
|
3
|
|
510
|
|
338
|
|
848
|
|
|||||||
|
Total
|
9
|
|
$
|
3,219
|
|
$
|
592
|
|
$
|
3,811
|
|
||||
|
Acquired loans included above
|
4
|
|
$
|
—
|
|
$
|
151
|
|
$
|
151
|
|
||||
During the
year ended December 31, 2018
, the Company had no new modified loans that were considered TDRs, and no defaulted loans over the last twelve months. Of the four loans designated as troubled debt restructing at
December 31, 2018
, three loans were due to changes in interest rates and payment terms, and one loan was due to a change in interest rate, payment terms and a principal reduction. At
December 31, 2017
, three loans were designated as troubled debt restructuring due to payment terms and extension of maturity, four loans due to changes in interest rates and payment terms, and two loans for extensions of maturity dates. There were
three
restructured loans charged off in the amount of
$291 thousand
, and
two
performing restructured loans paid off for
$3.2 million
during the
year ended December 31, 2018
.
|
114
|
||
|
Capital Bancorp, Inc. and Subsidiaries
Notes to Consolidated Financial Statements
December 31, 2018 and 2017
|
|
Note 4 - Loans Receivable (continued)
|
Outstanding loan commitments were as follows:
|
Loan Commitments
|
||||||||
|
For the Years Ended December 31,
|
||||||||
|
(in thousands)
|
2018
|
2017
|
||||||
|
Unused lines of credit
|
||||||||
|
Commercial
|
$
|
52,083
|
|
$
|
46,580
|
|
||
|
Commercial real estate
|
8,980
|
|
7,530
|
|
||||
|
Residential real estate
|
12,853
|
|
7,072
|
|
||||
|
Home equity
|
27,243
|
|
25,395
|
|
||||
|
Secured credit card
|
29,142
|
|
30,161
|
|
||||
|
Personal
|
126
|
|
148
|
|
||||
|
Construction commitments
|
||||||||
|
Residential real estate
|
72,424
|
|
56,463
|
|
||||
|
Commercial real estate
|
6,358
|
|
7,350
|
|
||||
|
$
|
209,209
|
|
$
|
180,699
|
|
|||
|
Commitments to originate residential loans held for sale
|
$
|
647
|
|
$
|
4,138
|
|
||
|
Letters of credit
|
$
|
6,216
|
|
$
|
6,759
|
|
||
Lines of credit are agreements to lend to a customer as long as there is no violation of any condition of the contract. Lines of credit generally have variable interest rates. Such lines do not represent future cash requirements because it is unlikely that all customers will draw upon their lines in full at any time. Loan commitments generally have variable interest rates, fixed expiration dates, and may require payment of a fee.
Letters of credit are conditional commitments issued by us to guarantee the performance of a customer to a third party. In the event of nonperformance by the customer in accordance with the terms of the agreement with the third party, we would be required to fund the commitment.
The Company's maximum exposure to credit loss in the event of nonperformance by the customer is the contractual amount of the credit commitment. Loan commitments and lines of credit are made on the same terms, including collateral, as outstanding loans. Management is not aware of any accounting loss to be incurred by funding these loan commitments. As of
December 31, 2018
and
December 31, 2017
respectively, the Company had an allowance for off-balance-sheet credit risk of
$1,053 thousand
and
$901 thousand
, recorded in other liabilities on the consolidated balance sheet.
The Company makes representations and warranties that loans sold to investors meet their program's guidelines and that the information provided by the borrowers is accurate and complete. In the event of a default on a loan sold, the investor may make a claim for losses due to document deficiencies, program compliance, early payment default, and fraud or borrower misrepresentations.
|
115
|
||
|
Capital Bancorp, Inc. and Subsidiaries
Notes to Consolidated Financial Statements
December 31, 2018 and 2017
|
|
Note 4 - Loans Receivable (continued)
|
The Company maintains a liability account for estimated reserves on off balance sheet items such as unfunded lines of credit. Activity for this accounts is as follows:
|
Off Balance Sheet Reserves
|
||||||||
|
For the Years Ended December 31,
|
||||||||
|
(in thousands)
|
2018
|
2017
|
||||||
|
Balance at beginning of period
|
$
|
901
|
|
$
|
801
|
|
||
|
Add: Provision
|
152
|
|
100
|
|
||||
|
Add: Recoveries
|
—
|
|
—
|
|
||||
|
Less: Charge-offs
|
—
|
|
—
|
|
||||
|
Balance at end of period
|
$
|
1,053
|
|
$
|
901
|
|
||
The Company maintains a reserve in other liabilities for potential losses on mortgage loans sold. Activity in this reserve is as follows for the periods presented:
|
Mortgage Loan Put-back Reserve
|
||||||||
|
For the Years Ended December 31,
|
||||||||
|
(in thousands)
|
2018
|
2017
|
||||||
|
Balance at beginning of period
|
$
|
457
|
|
$
|
442
|
|
||
|
Add: Provision
|
106
|
|
115
|
|
||||
|
Add: Recoveries
|
—
|
|
—
|
|
||||
|
Less: Charge-offs
|
(62
|
)
|
(100
|
)
|
||||
|
Balance at end of period
|
$
|
501
|
|
$
|
457
|
|
||
Note 5 - Premises and Equipment
Premises and equipment and the related depreciation and amortization consist of the following:
|
Premises and Equipment
|
||||||||
|
(in thousands)
|
2018
|
2017
|
||||||
|
Leasehold improvements
|
$
|
1,686
|
|
$
|
1,065
|
|
||
|
Furniture and equipment
|
4,430
|
|
4,107
|
|
||||
|
Vehicle
|
54
|
|
54
|
|
||||
|
Software
|
2,405
|
|
2,163
|
|
||||
|
Construction in progress
|
19
|
|
114
|
|
||||
|
8,594
|
|
7,503
|
|
|||||
|
Less: Accumulated depreciation and amortization
|
5,619
|
|
4,902
|
|
||||
|
Premises and equipment, net
|
$
|
2,975
|
|
$
|
2,601
|
|
||
|
Depreciation and amortization expense
|
$
|
1,085
|
|
$
|
983
|
|
||
|
116
|
||
|
Capital Bancorp, Inc. and Subsidiaries
Notes to Consolidated Financial Statements
December 31, 2018 and 2017
|
|
Note 6 - Derivative Financial Instruments
|
As part of its mortgage banking activities, the Company enters into interest rate lock commitments, which are commitments to originate loans whereby the interest rate on the loan is determined prior to funding and the customers have locked into that interest rate. The Company then either locks the loan and rate in with an investor and commits to deliver the loan if settlement occurs (Best Efforts) or commits to deliver the locked loan to an investor in a binding (Mandatory) delivery program. Certain loans under rate lock commitments are covered under forward sales contracts. Forward sales contracts are recorded at fair value with changes in fair value recorded in mortgage banking revenue. Interest rate lock commitments and commitments to deliver loans to investors are considered derivatives. The market value of interest rate lock commitments and best efforts contracts are not readily ascertainable with precision because they are not actively traded in stand-alone markets. The Company determines the fair value of rate lock commitments and delivery contracts by measuring the fair value of the underlying asset, which is impacted by current interest rates and takes into consideration the probability that the rate lock commitments will close or will be funded.
At
December 31, 2018
and
2017
, the Company had open forward sales agreements with notional values of
$25.0 million
and
$41.0 million
, respectively. At
December 31, 2018
and
2017
, the Company had open mandatory delivery commitments of
$4.3 million
and
$12.6 million
, respectively. The open forward delivery sales agreements are composed of forward sales of loans. The fair values of the open forward sales agreements were
$(253) thousand
and
$(42) thousand
at
December 31, 2018
and
2017
, respectively. The fair values of the open mandatory delivery commitments were
$59 thousand
and
$18 thousand
at
December 31, 2018
and
2017
, respectively.
Interest rate lock commitments totaled
$32.9 million
and
$56.9 million
at
December 31, 2018
and
2017
, respectively and included
$1.8 million
and
$6.2 million
of commitments that were made on a best efforts basis at
December 31, 2018
and
2017
, respectively. The fair values of these best efforts commitments were
$31 thousand
and
$102 thousand
at
December 31, 2018
and
2017
, respectively. The remaining hedged interest rate lock commitments totaling
$31.1 million
and
$50.7 million
at
December 31, 2018
and
2017
, had fair values of
$234 thousand
and
$108 thousand
, respectively. Loans held for sale include the portion of fair value remaining for hedged interest rate lock commitments related to closed loans, the fair value of open mandatory delivery commitments, and the fair value of best efforts commitments.
On January 7, 2015, the Company entered into an interest rate swap transaction with a notional amount of
$2 million
. The swap qualifies as a derivative and is designated as a hedging instrument. The swap fixes the interest rate the Company will pay on the floating rate junior subordinated debentures for
four
years beginning on March 16, 2015. Based on the notional amount, the Company pays the counter-party quarterly interest at a fixed rate of
3.493%
and the counter-party pays the Company interest at a rate of three‑month LIBOR plus
1.87%
. As of
December 31, 2018
and
2017
, the swap had a fair value of
$5 thousand
and
$7 thousand
, respectively. The unrealized loss, net of income tax, has been recorded in other comprehensive income. Management believes there is
no
hedge ineffectiveness as of
December 31, 2018
.
|
117
|
||
|
Capital Bancorp, Inc. and Subsidiaries
Notes to Consolidated Financial Statements
December 31, 2018 and 2017
|
|
Note 7 -
Interest Bearing Deposits
|
Major categories of interest bearing deposits are as follows:
|
Interest Bearing Deposits
|
||||||||
|
At December 31,
|
||||||||
|
(in thousands)
|
2018
|
2017
|
||||||
|
NOW accounts
|
$
|
85,747
|
|
$
|
74,663
|
|
||
|
Money market accounts
|
288,896
|
|
312,809
|
|
||||
|
Savings
|
2,866
|
|
3,450
|
|
||||
|
Certificates of deposit of $250,000 or more
|
99,412
|
|
74,930
|
|
||||
|
Other time deposits
|
236,060
|
|
242,412
|
|
||||
|
Total Interest Bearing Deposits
|
$
|
712,981
|
|
$
|
708,264
|
|
||
The aggregate amount of brokered certificates of deposit was
$76.1 million
and
$72.5 million
at
December 31, 2018
and
2017
, respectively. The aggregate amount of Certificate of Deposit Account Registry Service (“CDARS”) deposits was
$45.1 million
and
$61.0 million
at
December 31, 2018
and
2017
, respectively.
As of
December 31, 2018
, certificates of deposit mature as follows:
|
Maturities of Certificates of Deposit
|
||||
|
(in thousands)
|
||||
|
2019
|
$
|
241,195
|
|
|
|
2020
|
80,468
|
|
||
|
2021
|
12,924
|
|
||
|
2022
|
275
|
|
||
|
2023, and thereafter
|
610
|
|
||
|
$
|
335,472
|
|
||
Note 8 - Securities Sold Under Agreements to Repurchase
The Company sells securities under repurchase agreements to provide cash management services to commercial account customers. These borrowings are summarized as follows:
|
Securities Sold Under Agreements to Repurchase
|
||||||||
|
(dollars in thousands)
|
2018
|
2017
|
||||||
|
Average amount outstanding
|
$
|
10,596
|
|
$
|
9,684
|
|
||
|
Average rate paid during the year
|
1.38
|
%
|
0.15
|
%
|
||||
|
Maximum amount outstanding at month end
|
$
|
12,445
|
|
$
|
12,472
|
|
||
|
Investment securities pledged to secure the underlying agreements at year end:
|
||||||||
|
Amortized cost
|
$
|
16,032
|
|
$
|
14,405
|
|
||
|
Fair value
|
15,862
|
|
14,475
|
|
||||
|
118
|
||
|
Capital Bancorp, Inc. and Subsidiaries
Notes to Consolidated Financial Statements
December 31, 2018 and 2017
|
|
Note 9 - Borrowed Funds
|
As of
December 31, 2018
and
2017
, the Company was indebted as follows.
|
Borrowed Funds
|
||||||||||||||
|
|
2018
|
2017
|
||||||||||||
|
(dollars in thousands)
|
Balance
|
Interest
|
Balance
|
Interest
|
||||||||||
|
Pacific Coast Bankers Bank
|
2,000
|
|
3.28
|
%
|
—
|
|
—
|
%
|
||||||
|
Total - Federal funds purchased
|
$
|
2,000
|
|
—
|
|
|||||||||
|
FHLB advance due March 25, 2019
|
$
|
2,000
|
|
4.26
|
%
|
$
|
2,000
|
|
4.26
|
%
|
||||
|
Total - FHLB advances
|
$
|
2,000
|
|
$
|
2,000
|
|
|
|
||||||
|
Senior promissory note due July 31, 2019
|
—
|
|
—
|
%
|
2,000
|
|
5.50
|
%
|
||||||
|
Junior subordinated debentures due June 15, 2036
|
2,062
|
|
4.68
|
%
|
2,062
|
|
3.56
|
%
|
||||||
|
Other subordinated notes due December 1, 2025
|
13,500
|
|
6.95
|
%
|
13,500
|
|
6.95
|
%
|
||||||
|
Less: Unamortized debt issuance costs
|
(169
|
)
|
(201
|
)
|
||||||||||
|
Total - Other borrowed funds
|
$
|
15,393
|
|
$
|
17,361
|
|
|
|
||||||
Federal Home Loan Bank advances
The Federal Home Loan Bank advances require quarterly interest payments with principal and any remaining accrued interest due at maturity.
Senior promissory note
On July 30, 2014, the Company issued a
$5,000,000
senior promissory note (the “Note”) with a maturity date of July 31, 2019. The Company repaid
$3,000,000
on this note on July 30, 2016. On that date, the Note was amended and the interest rate was fixed at
5.00%
through September 30, 2017. Effective October 1, 2017, the Note was again amended to fix the interest rate at
5.50%
through March 31, 2018, and was paid off on March 30, 2018.
Junior subordinated debentures
In June 2006, the Company formed Capital Bancorp (MD) Statutory Trust I (the “Trust”) and on June 15, 2006, the Trust issued
2,000
floating Rate Capital Securities (the “Capital Securities”) with an aggregate liquidation value of
$2,000,000
to a third party in a private placement. Concurrent with the issuance of the Capital Securities, the Trust issued trust common securities to the Company in the aggregate liquidation value of
$62,000
.
The proceeds of the issuance of the Capital Securities and trust common securities were invested in the Company’s Floating Rate Junior Subordinated Deferrable Interest Debentures (the “Floating Rate Debentures”). The Floating Rate Debentures for the Trust will mature on June 15, 2036, which may be shortened if certain conditions are met (including the Company having received prior approval of the Board of Governors of the Federal Reserve System and any other required regulatory approvals). These Floating Rate Debentures, which are the only assets of the Trust, are subordinate and junior in right of payment to all present and future senior indebtedness (as defined in the Indenture dated June 15, 2006) of the Company. The Floating Rate Debentures for the Trust accrue interest at a floating rate equal to the three-month LIBOR plus
1.87%
, payable quarterly. As of
December 31, 2018
and
2017
, the rate for the Trust was
4.68%
and
3.56%
, respectively. The quarterly distributions on the Capital Securities will be paid at the same rate that interest is paid on the Floating Rate Debentures.
|
119
|
||
|
Capital Bancorp, Inc. and Subsidiaries
Notes to Consolidated Financial Statements
December 31, 2018 and 2017
|
|
Note 9 - Borrowed Funds
|
The Company has fully and unconditionally guaranteed the Trust’s obligation under the Capital Securities. The Trust must redeem the Capital Securities when the Floating Rate Debentures are paid at maturity or upon any earlier prepayment of the Floating Rate Debentures. The Floating Rate Debentures may be prepaid if certain events occur, including a change in the tax status or regulatory capital treatment of the Capital Securities, or a change in existing laws that requires the Trust to register as an investment company.
The junior subordinated debentures are treated as Tier 1 capital, to a limited extent, by the Federal Reserve.
Other subordinated notes
On November 24, 2015, the Company issued
$13,500,000
of subordinated notes. The notes mature on December 1, 2025. The notes bear interest at
6.95%
for the first five years, then adjust to the three‑month LIBOR plus
5.33%
adjusted on March 1, June 1, September 1, and December 1 of each year. Interest is payable quarterly. There were related debt issuance costs incurred totaling
$278,231
. The costs are amortized to interest expense through the maturity date of the notes.
Available lines of credit
The Company has available lines of credit of
$28,000,000
with other correspondent banks, and
$2,000,000
was outstanding with Pacific Coast Bankers Bank at
December 31, 2018
, and paid off on January 2, 2019.
The Company may borrow up to
25%
of its assets from the FHLB, based on collateral available to pledge to secure the borrowings. Borrowings from the FHLB are secured by a portion of the Company’s loan and/or investment portfolio. As of
December 31, 2018
and
2017
, the Company had pledged loans providing borrowing capacity of
$235.2 million
and
$78.8 million
, respectively. As of
December 31, 2018
and
2017
, the Company had pledged investment securities with a fair value of
$6.7 million
and
$7.5 million
, respectively, to the FHLB. As of
December 31, 2018
and
2017
, the Company had
$185.6 million
and
$84.1 million
, respectively, of available borrowing capacity from the FHLB.
As of
December 31, 2018
and
2017
, the Company had pledged commercial loans to the Federal Reserve Bank of Richmond to provide a borrowing capacity totaling
$13.1 million
and
$17.9 million
, respectively, under its discount window program. There were
no
advances outstanding under this facility as of
December 31, 2018
and
2017
.
Certificate of deposit funding through a financial network is limited to
15%
of the Bank’s assets, or approximately
$161.2 million
and
$152.4 million
as of
December 31, 2018
and
2017
, respectively.
Note 10 - Retirement Plan
The Company provides a defined contribution plan qualifying under Section 401(k) of the Internal Revenue Code to eligible employees. The Company contributes
3%
of eligible compensation on behalf of all full‑time employees up to limits prescribed by the Internal Revenue Code. The Company’s contribution to the plan was
$553,224
in 2018 and
$527,031
in 2017.
Note 11 - Related-Party Transactions
Certain executive officers and directors of the Company and Bank, and companies with which they are affiliated, are clients of and have banking transactions with the Company in the ordinary course of business.
|
120
|
||
|
Capital Bancorp, Inc. and Subsidiaries
Notes to Consolidated Financial Statements
December 31, 2018 and 2017
|
|
Note 11 - Related-Party Transactions (continued)
|
These transactions are conducted on substantially the same terms, including interest rates and collateral, as those prevailing at the time for comparable transactions with persons not related to the Company.
Activity in related-party loans during 2018 and 2017 is shown below:
|
Related Party Loans
|
||||||||
|
(in thousands)
|
2018
|
2017
|
||||||
|
Balance at beginning of year
|
$
|
16,268
|
|
$
|
13,529
|
|
||
|
Add: New loans
|
2,093
|
|
34,386
|
|
||||
|
Less: Amounts collected
|
(3,588
|
)
|
(36,447
|
)
|
||||
|
Add (deduct): Relationship changes
|
(1,552
|
)
|
4,800
|
|
||||
|
Balance at end of year
|
$
|
13,221
|
|
$
|
16,268
|
|
||
Deposits from officers and directors and their related interests were
$155.8 million
at December 31, 2018, and
$178.0 million
at December 31, 2017.
A director of the Company owns an interest in an entity from which the Company leases space for its Rockville, Maryland location. Payments made in accordance with the lease were
$566 thousand
and
$555 thousand
in 2018 and 2017, respectively.
Company directors, or their related interests, held
$1.4 million
of the senior promissory notes outstanding as of December 31, 2017. These notes were paid off on March 30, 2018.
Company directors, or their related interests, held
$1.0 million
of the convertible subordinated notes outstanding as of December 31, 2018 and 2017.
Company directors, or their related interests, held
$4.5 million
and
$7.1 million
of participation loans from the Bank as of
December 31, 2018
and 2017, respectively. Company and Bank directors, or their related interests, held
$2.0 million
and
$4.9 million
of participation loans from Church Street Capital as of December 31, 2018 and 2017, respectively.
Note 12 - Income Taxes
On December 22, 2017, the Tax Cuts and Jobs Act (the “2017 Tax Act”) became law. The 2017 Tax Act includes a number of changes to existing U.S. tax laws that impact the Company, most notably a reduction of the U.S. corporate income tax rate to 21 percent for tax years beginning after December 31, 2017.
The components of income tax expense are as follows:
|
Income Tax Expense
|
||||||||
|
For the Years Ended December 31,
|
||||||||
|
(in thousands)
|
2018
|
2017
|
||||||
|
Current
|
||||||||
|
Federal
|
$
|
3,696
|
|
$
|
4,612
|
|
||
|
State
|
1,427
|
|
1,231
|
|
||||
|
Total Current Expense
|
5,123
|
|
5,843
|
|
||||
|
Deferred tax benefit
|
(141
|
)
|
(239
|
)
|
||||
|
Change in corporate income tax rate
|
—
|
|
1,386
|
|
||||
|
Total Income Tax Expense
|
$
|
4,982
|
|
$
|
6,990
|
|
||
|
121
|
||
|
Capital Bancorp, Inc. and Subsidiaries
Notes to Consolidated Financial Statements
December 31, 2018 and 2017
|
|
Note 12 - Income Taxes (continued)
|
The components of the net deferred tax asset are:
|
Net Deferred Tax Asset
|
||||||
|
(in thousands)
|
2018
|
2017
|
||||
|
Deferred tax assets
|
||||||
|
Allowance for loan and credit losses
|
3,384
|
|
3,003
|
|
||
|
Reserve for recourse on mortgage loans sold
|
138
|
|
125
|
|
||
|
Nonaccrual interest
|
63
|
|
268
|
|
||
|
Foreclosed real estate write-downs
|
3
|
|
8
|
|
||
|
Stock-based compensation
|
239
|
|
188
|
|
||
|
Long-term incentive program (LTIP)
|
189
|
|
77
|
|
||
|
Core deposit intangible
|
24
|
|
26
|
|
||
|
Unrealized loss on investment securities available for sale
|
227
|
|
97
|
|
||
|
Net operating loss carryforward
|
244
|
|
212
|
|
||
|
4,511
|
|
4,004
|
|
|||
|
Deferred tax liabilities
|
||||||
|
Unrealized gain on cash flow hedging derivative
|
2
|
|
2
|
|
||
|
Unrealized gain on loans held for sale
|
51
|
|
9
|
|
||
|
Accumulated depreciation
|
516
|
|
399
|
|
||
|
Deferred casualty gain
|
1
|
|
1
|
|
||
|
Other
|
43
|
|
—
|
|
||
|
613
|
|
411
|
|
|||
|
Net deferred tax asset before valuation allowance
|
3,898
|
|
3,593
|
|
||
|
Less: Valuation allowance
|
244
|
|
212
|
|
||
|
Net deferred tax asset
|
3,654
|
|
3,381
|
|
||
The differences between the federal income tax rate and the effective tax rate for the Company are reconciled as follows:
|
Reconciliation of Federal Tax Rate to the Effective Rate
|
||||||
|
2018
|
2017
|
|||||
|
Statutory federal income tax rate
|
21.00
|
%
|
34.00
|
%
|
||
|
Increase (decrease) resulting from
|
||||||
|
State income taxes, net of federal income tax benefit
|
6.35
|
|
5.37
|
|
||
|
Nondeductible expenses
|
0.42
|
|
0.84
|
|
||
|
Tax exempt income
|
(0.04
|
)
|
(0.22
|
)
|
||
|
Change in corporate income tax rate
|
—
|
|
9.83
|
|
||
|
Other
|
0.34
|
|
(0.24
|
)
|
||
|
Effective Tax Rate
|
28.07
|
%
|
49.58
|
%
|
||
Deferred tax assets represent the future tax benefit of deductible differences and, if it is more likely than not that a tax asset will not be realized, a valuation allowance is required to reduce the net deferred tax assets to net realizable value. As of
December 31, 2018
, management has determined that it is more likely than not that the majority of the deferred tax asset from continuing operations will be realized. At
December 31, 2018
and
2017
, a valuation allowance of
$244,376
and
$212,367
was recognized, respectively, for a State of Maryland net operating loss carryforward that may not be realizable.
The Company does not have material uncertain tax positions and did not recognize any adjustments for unrecognized tax benefits. The Company remains subject to examination of income tax returns for the
|
122
|
||
|
Capital Bancorp, Inc. and Subsidiaries
Notes to Consolidated Financial Statements
December 31, 2018 and 2017
|
|
Note 12 - Income Taxes (continued)
|
years ending after December 31, 2015.
Note 13 - Capital Standards
The Bank is subject to various regulatory capital requirements administered by the federal banking agencies. Failure to meet minimum capital requirements can initiate certain mandatory, and possible additional, discretionary actions by the regulators that, if undertaken, could have a direct material effect on the Bank’s financial statements. Under capital adequacy guidelines and the regulatory framework for prompt corrective action, the Bank must meet specific capital guidelines that involve quantitative measures of the Bank’s assets, liabilities, and certain off-balance sheet items as calculated under regulatory accounting practices. The Bank’s capital amounts and classifications are also subject to qualitative judgments by the regulators about components, risk weightings, and other factors.
The Basel III Capital Rules became effective for the Bank on January 1, 2015 (subject to a phase‑in period for certain provisions). Quantitative measures established by the Basel III Capital Rules to ensure capital adequacy require the maintenance of minimum amounts and ratios (set forth in the following table) of Common Equity Tier 1 capital, Tier 1 capital, and Total capital (as defined in the regulations) to risk‑weighted assets (as defined), and of Tier 1 capital to adjusted quarterly average assets (as defined).
In connection with the adoption of the Basel III Capital Rules, the Bank elected to opt‑out of the requirement to include accumulated other comprehensive income in Common Equity Tier 1 capital. Common Equity Tier 1 capital for the Bank is reduced by goodwill and other intangible assets, net of associated deferred tax liabilities and subject to transition provisions.
Under the revised prompt corrective action requirements, as of January 1, 2015, insured depository institutions are required to meet the following in order to qualify as “well capitalized:” (1) a common equity Tier 1 risk‑based capital ratio of 6.5%; (2) a Tier 1 risk-based capital ratio of 8%; (3) a total risk‑based capital ratio of 10%; and (4) a Tier 1 leverage ratio of 5%. Management believes that, as of December 31, 2017, the Bank met all capital adequacy requirements under the Basel III Capital Rules on a fully phased‑in basis as if such requirements were fully in effect.
The implementation of the capital conservation buffer began on January 1, 2016, at the 0.625% level and will be phased in over a four-year period (increasing by that amount on each subsequent January 1, until it reaches 2.5% on January 1, 2019). The Basel III Capital Rules also provide for a “countercyclical capital buffer” that is applicable to only certain covered institutions and does not have any current applicability to the Bank.
The aforementioned capital conservation buffer is designed to absorb losses during periods of economic stress. Banking institutions with a ratio of Common Equity Tier 1 capital to risk‑weighted assets above the minimum but below the conservation buffer (or below the combined capital conservation buffer and countercyclical capital buffer, when the latter is applied) will face constraints on dividends, equity repurchases, and compensation based on the amount of the shortfall.
As of
December 31, 2018
the most recent notification from the OCC has categorized the Bank as well capitalized under the regulatory framework for prompt corrective action. To be categorized as well capitalized, the Bank must maintain ratios as set forth in the table. There have been no conditions or events since that notification that management believes have changed the Bank’s category.
The OCC, through formal or informal agreement, has the authority to require an institution to maintain higher capital ratios than those provided by statute, to be categorized as well capitalized under the regulatory framework for prompt corrective action.
|
123
|
||
|
Capital Bancorp, Inc. and Subsidiaries
Notes to Consolidated Financial Statements
December 31, 2018 and 2017
|
|
Note 13 - Capital Standards (continued)
|
The following table presents actual and required capital ratios as of
December 31, 2018
and
2017
for the Bank under the Basel III Capital Rules. The minimum required capital amounts presented include the minimum required capital levels as of
December 31, 2018
and
2017
based on the phase-in provisions of the Basel III Capital Rules. Capital levels required to be considered well capitalized are based upon prompt corrective action regulations, as amended to reflect the changes under the Basel III Capital Rules.
Based on recent changes to the Federal Reserve’s definition of a “Small Bank Holding Company” that increased the threshold to
$3 billion
in assets, the Company is not currently subject to separate minimum capital measurements. At such time as the Company reaches the
$3 billion
asset level, it will again be subject to capital measurements independent of the Bank. For comparison purposes, the Company’s ratios are presented in the following table as well, all of which would have exceeded the “well-capitalized” level had the Company been subject to separate capital minimums.
|
Regulatory Capital
|
||||||||||||||||||||||||||||
|
Actual
|
Minimum Capital
Adequacy
|
To Be Well
Capitalized
|
Full Phase In of Basel III
|
|||||||||||||||||||||||||
|
(Dollar amounts in thousands)
|
Amount
|
Ratio
|
Amount
|
Ratio
|
Amount
|
Ratio
|
Amount
|
Ratio
|
||||||||||||||||||||
|
December 31, 2018
|
||||||||||||||||||||||||||||
|
The Company
|
||||||||||||||||||||||||||||
|
Tier 1 leverage ratio (to average assets)
|
$
|
117,220
|
|
10.76
|
%
|
$
|
43,575
|
|
4.000
|
%
|
N/A
|
N/A
|
$
|
43,575
|
|
4.00
|
%
|
|||||||||||
|
Tier 1 capital (to risk-weighted assets)
|
117,220
|
|
12.95
|
%
|
71,259
|
|
7.875
|
%
|
N/A
|
N/A
|
76,914
|
|
8.50
|
%
|
||||||||||||||
|
Common equity tier 1 capital ratio (to risk-weighted assets)
|
115,158
|
|
12.73
|
%
|
57,686
|
|
6.375
|
%
|
N/A
|
N/A
|
63,341
|
|
7.00
|
%
|
||||||||||||||
|
Total capital ratio (to risk-weighted assets)
|
128,544
|
|
14.21
|
%
|
89,356
|
|
9.875
|
%
|
N/A
|
N/A
|
95,012
|
|
10.50
|
%
|
||||||||||||||
|
The Bank
|
||||||||||||||||||||||||||||
|
Tier 1 leverage ratio (to average assets)
|
$
|
96,122
|
|
9.06
|
%
|
$
|
42,445
|
|
4.000
|
%
|
$
|
53,056
|
|
5.00
|
%
|
$
|
42,445
|
|
4.00
|
%
|
||||||||
|
Tier 1 capital (to risk-weighted assets)
|
96,122
|
|
11.00
|
%
|
68,822
|
|
7.875
|
%
|
69,914
|
|
8.00
|
%
|
74,284
|
|
8.50
|
%
|
||||||||||||
|
Common equity tier 1 capital ratio (to risk-weighted assets)
|
96,122
|
|
11.00
|
%
|
55,713
|
|
6.375
|
%
|
56,805
|
|
6.50
|
%
|
61,175
|
|
7.00
|
%
|
||||||||||||
|
Total capital ratio (to risk-weighted assets)
|
107,061
|
|
12.25
|
%
|
86,301
|
|
9.875
|
%
|
87,393
|
|
10.00
|
%
|
91,763
|
|
10.50
|
%
|
||||||||||||
|
December 31, 2017
|
||||||||||||||||||||||||||||
|
The Company
|
||||||||||||||||||||||||||||
|
Tier 1 leverage ratio (to average assets)
|
$
|
82,428
|
|
8.10
|
%
|
$
|
40,724
|
|
4.000
|
%
|
N/A
|
N/A
|
$
|
40,724
|
|
4.00
|
%
|
|||||||||||
|
Tier 1 capital (to risk-weighted assets)
|
82,428
|
|
10.18
|
%
|
58,717
|
|
7.250
|
%
|
N/A
|
N/A
|
68,841
|
|
8.50
|
%
|
||||||||||||||
|
Common equity tier 1 capital ratio (to risk-weighted assets)
|
80,366
|
|
9.92
|
%
|
46,569
|
|
5.750
|
%
|
N/A
|
N/A
|
56,693
|
|
7.00
|
%
|
||||||||||||||
|
Total capital ratio (to risk-weighted assets)
|
92,562
|
|
11.43
|
%
|
74,915
|
|
9.250
|
%
|
N/A
|
N/A
|
85,039
|
|
10.50
|
%
|
||||||||||||||
|
The Bank
|
||||||||||||||||||||||||||||
|
Tier 1 leverage ratio (to average assets)
|
$
|
86,150
|
|
8.55
|
%
|
$
|
40,316
|
|
4.000
|
%
|
$
|
50,395
|
|
5.00
|
%
|
$
|
40,316
|
|
4.00
|
%
|
||||||||
|
Tier 1 capital (to risk-weighted assets)
|
86,150
|
|
10.78
|
%
|
57,928
|
|
7.250
|
%
|
63,920
|
|
8.00
|
%
|
67,915
|
|
8.50
|
%
|
||||||||||||
|
Common equity tier 1 capital ratio (to risk-weighted assets)
|
86,150
|
|
10.78
|
%
|
45,943
|
|
5.750
|
%
|
51,935
|
|
6.50
|
%
|
55,930
|
|
7.00
|
%
|
||||||||||||
|
Total capital ratio (to risk-weighted assets)
|
96,148
|
|
12.03
|
%
|
73,908
|
|
9.250
|
%
|
79,900
|
|
10.00
|
%
|
83,895
|
|
10.50
|
%
|
||||||||||||
|
124
|
||
|
Capital Bancorp, Inc. and Subsidiaries
Notes to Consolidated Financial Statements
December 31, 2018 and 2017
|
|
Note 14 - Stock-Based Compensation
|
Compensation cost is recognized for stock options and restricted stock awards issued to employees. Compensation cost is measured as the fair value of these awards on their date of grant. A Black-Scholes model is utilized to estimate the fair value of stock options, while the market price of the Company’s common stock at the date of grant is used as the fair value of restricted stock awards. Compensation cost is recognized over the required service period, generally defined as the vesting period for stock option awards and as the restriction period for restricted stock awards. For awards with graded vesting, compensation cost is recognized on a straight-line basis over the requisite service period for the entire award.
The expense recognition of employee stock option and restricted stock awards resulted in net expense of approximately
$723,711
and
$625,870
during the years ended
December 31, 2018
and
2017
, respectively.
All share and per common share amounts have been adjusted to reflect the Stock Split. Refer to Notes 1 and 21 for additional information.
Stock options:
In April 2002, the Company adopted a stock option plan. The plan provides for granting options to purchase shares of common stock to the directors and selected key employees of the Company and the Bank. The options granted to employees are intended to qualify as incentive stock options under Section 422 of the Internal Revenue Code. In August 2017, the Company’s stockholders approved an increase in the number of shares available for grant to
4,173,520
, of which
542,215
are available for future grant at
December 31, 2018
. Option prices are equal to or greater than the estimated fair value of the common stock at the date of grant. Options outstanding vest over a
four
-year period, whereby
25%
of the options become exercisable on each anniversary of the grant date.
Information with respect to options outstanding during the years ended
December 31, 2018
and
2017
is as follows:
|
Stock Options Outstanding
|
||||||||||||||
|
2018
|
2017
|
|||||||||||||
|
Shares
|
Weighted Average Exercise Price
|
Shares
|
Weighted Average Exercise Price
|
|||||||||||
|
Outstanding at beginning of year
|
1,363,444
|
|
$
|
8.01
|
|
1,599,976
|
|
$
|
6.36
|
|
||||
|
Add: Granted
|
373,750
|
|
11.44
|
|
260,600
|
|
12.38
|
|
||||||
|
Less: Exercised
|
(230,894
|
)
|
5.67
|
|
(358,332
|
)
|
4.65
|
|
||||||
|
Less: Retired on exercise
|
(37,240
|
)
|
5.07
|
|
—
|
|
—
|
|
||||||
|
Less: Expired/cancelled/forfeited
|
(37,200
|
)
|
7.34
|
|
(138,800
|
)
|
5.87
|
|
||||||
|
Outstanding at end of year
|
1,431,860
|
|
$
|
9.38
|
|
1,363,444
|
|
$
|
8.01
|
|
||||
|
Exercisable at end of year
|
643,610
|
|
$
|
7.78
|
|
644,472
|
|
$
|
6.47
|
|
||||
The weighted average fair value of options granted during the years ended
December 31, 2018
and
2017
, was
$2.56
and
$2.68
, respectively.
|
125
|
||
|
Capital Bancorp, Inc. and Subsidiaries
Notes to Consolidated Financial Statements
December 31, 2018 and 2017
|
|
Note 14 - Stock-Based Compensation (continued)
|
A summary of information about stock options outstanding is as follows:
|
Stock Option Summary
|
|||||||||||||||
|
Weighted Average Exercise Price
|
Average Remaining Life (years)
|
Outstanding Shares
|
Exercisable Shares
|
||||||||||||
|
December 31, 2018
|
|||||||||||||||
|
$
|
6.63
|
|
1.0
|
|
283,886
|
|
268,886
|
|
|||||||
|
7.50
|
|
2.0
|
|
297,348
|
|
207,898
|
|
||||||||
|
8.50
|
|
3.0
|
|
222,276
|
|
103,176
|
|
||||||||
|
11.38
|
|
5.0
|
|
354,750
|
|
—
|
|
||||||||
|
12.38
|
|
4.0
|
|
266,600
|
|
63,650
|
|
||||||||
|
12.80
|
|
4.8
|
|
7,000
|
|
—
|
|
||||||||
|
Total outstanding options
|
9.38
|
|
3.1
|
|
1,431,860
|
|
643,610
|
|
|||||||
|
Intrinsic value on December 31, 2018
|
$
|
3,178,491
|
|
$
|
2,399,743
|
|
|||||||||
|
|
|||||||||||||||
|
December 31, 2017
|
|||||||||||||||
|
$
|
5.00
|
|
1.0
|
|
211,952
|
|
211,952
|
|
|||||||
|
6.63
|
|
2.0
|
|
323,792
|
|
218,868
|
|
||||||||
|
7.50
|
|
3.0
|
|
328,900
|
|
154,100
|
|
||||||||
|
8.50
|
|
4.0
|
|
238,200
|
|
59,552
|
|
||||||||
|
12.38
|
|
5.0
|
|
260,600
|
|
—
|
|
||||||||
|
Total outstanding options
|
8.01
|
|
2.6
|
|
1,363,444
|
|
644,472
|
|
|||||||
|
Intrinsic value on December 31, 2017
|
$
|
5,951,363
|
|
$
|
4,271,277
|
|
|||||||||
The aggregate intrinsic value as presented in the preceding tables is calculated by determining the difference between the estimated fair value of the stock as of
December 31, 2018
and
2017
, and the exercise price of the option, then multiply by the number of options outstanding. Stock options with exercise prices greater than the estimated fair value of the stock are not included in this calculation.
At
December 31, 2018
, there was
$1,382,842
of total unrecognized compensation expense related to stock options to be recognized over the next
five
years. At December 31, 2017, there was
$996,283
of total unrecognized compensation expense related to nonvested stock options to be recognized over the next
four
years.
The intrinsic value of stock options exercised was
$1.3 million
and
$1.2 million
during the years ended
December 31, 2018
and
2017
, respectively.
The weighted average fair value of options granted during
2018
and
2017
were estimated using the Black-Scholes option-pricing model with the following weighted average assumptions:
|
Stock Option Pricing Assumptions
|
||||
|
2018
|
2017
|
|||
|
Dividend yield
|
0.00%
|
0.00%
|
||
|
Risk free interest rate
|
2.53%
|
2.20%
|
||
|
Expected volatility
|
18.94%
|
18.94%
|
||
|
Expected life in years
|
5
|
5
|
||
|
126
|
||
|
Capital Bancorp, Inc. and Subsidiaries
Notes to Consolidated Financial Statements
December 31, 2018 and 2017
|
|
Note 14 - Stock-Based Compensation (continued)
|
Restricted stock:
The Company from time-to-time also grants shares of restricted stock to key employees. These awards help align the interests of these employees with the interests of the stockholders of the Company by providing economic value directly related to increases in the value of the Company’s stock. These awards typically hold service requirements over various vesting periods. The value of the stock awarded is established as the fair market value of the stock at the time of the grant. The Company recognizes expense, equal to the total value of such awards, ratably over the vesting period of the stock grants.
All restricted stock agreements are conditioned upon continued employment. Termination of employment prior to a vesting date, as described below, would terminate any interest in non-vested shares. All restricted shares will fully vest in the event of change in control of the Company.
Nonvested restricted stock for the years ended
December 31, 2018
and
2017
is summarized in the following table.
|
Restricted Stock Summary
|
||||||||||||||
|
2018
|
2017
|
|||||||||||||
|
Shares
|
Weighted Average Grant-Date Fair Value
|
Shares
|
Weighted Average Grant-Date Fair Value
|
|||||||||||
|
Nonvested at beginning of year
|
42,000
|
|
$
|
8.66
|
|
52,000
|
|
$
|
7.45
|
|
||||
|
Add: Granted
|
12,000
|
|
12.38
|
|
10,000
|
|
12.38
|
|
||||||
|
Less: Vested
|
(16,000
|
)
|
7.50
|
|
(16,000
|
)
|
7.50
|
|
||||||
|
Less: Forfeited
|
—
|
|
—
|
|
(4,000
|
)
|
6.88
|
|
||||||
|
Nonvested at end of year
|
38,000
|
|
$
|
10.32
|
|
42,000
|
|
$
|
8.66
|
|
||||
The vesting schedule of restricted shares as of
December 31, 2018
is as follows:
|
Restricted Stock Vesting Schedule
|
|||
|
Year
|
Shares
|
||
|
2019
|
18,500
|
|
|
|
2020
|
5,500
|
|
|
|
2021
|
5,500
|
|
|
|
2022
|
5,500
|
|
|
|
2023
|
3,000
|
|
|
|
38,000
|
|
||
At
December 31, 2018
there was
$230 thousand
of total unrecognized compensation expense related to nonvested restricted stock. At December 31, 2017, there was
$244 thousand
of total unrecognized compensation expense related to nonvested restricted stock.
|
127
|
||
|
Capital Bancorp, Inc. and Subsidiaries
Notes to Consolidated Financial Statements
December 31, 2018 and 2017
|
|
Note 15 - Parent Company Financial Information
|
The balance sheets as of
December 31, 2018
and
2017
and statements of income and cash flows for the years then ended, for Capital Bancorp, Inc. (Parent only) are presented below.
All share and per common share amounts have been adjusted to reflect the Stock Split. Refer to Note 1 for additional information.
|
Parent Company Only Balance Sheets
|
||||||||
|
(in thousands)
|
2018
|
2017
|
||||||
|
Assets
|
||||||||
|
Cash and cash equivalents
|
$
|
3,768
|
|
$
|
798
|
|
||
|
Investment in Bank
|
95,524
|
|
85,898
|
|
||||
|
Investment in Church Street Capital
|
3,284
|
|
3,092
|
|
||||
|
Investment in Trust
|
62
|
|
62
|
|
||||
|
Loans receivable, net of allowance for loan losses of $208 and $44 at December 31, 2018 and 2017, respectively
|
27,032
|
|
7,208
|
|
||||
|
Accrued interest receivable
|
106
|
|
83
|
|
||||
|
Due from subsidiaries
|
54
|
|
—
|
|
||||
|
Prepaid income taxes
|
90
|
|
135
|
|
||||
|
Deferred income taxes
|
18
|
|
18
|
|
||||
|
Other assets
|
134
|
|
537
|
|
||||
|
$
|
130,072
|
|
$
|
97,831
|
|
|||
|
Liabilities and Stockholders’ Equity
|
||||||||
|
Borrowed funds
|
$
|
15,393
|
|
$
|
17,361
|
|
||
|
Accrued interest payable
|
81
|
|
82
|
|
||||
|
Due to subsidiaries
|
—
|
|
94
|
|
||||
|
Other liabilities
|
34
|
|
175
|
|
||||
|
15,508
|
|
17,712
|
|
|||||
|
Stockholders’ equity
|
||||||||
|
Common stock
|
137
|
|
115
|
|
||||
|
Additional paid-in capital
|
49,321
|
|
27,051
|
|
||||
|
Retained earnings
|
65,701
|
|
53,200
|
|
||||
|
Accumulated other comprehensive loss
|
(595
|
)
|
(247
|
)
|
||||
|
Total stockholders’ equity
|
114,564
|
|
80,119
|
|
||||
|
$
|
130,072
|
|
$
|
97,831
|
|
|||
|
128
|
||
|
Capital Bancorp, Inc. and Subsidiaries
Notes to Consolidated Financial Statements
December 31, 2018 and 2017
|
|
Note 15 - Parent Company Financial Information (continued)
|
|
Parent Company Only Statements of Income
|
||||||||
|
(in thousands)
|
2018
|
2017
|
||||||
|
Interest and dividend revenue
|
$
|
577
|
|
$
|
342
|
|
||
|
Dividend from Bank
|
4,250
|
|
2,450
|
|
||||
|
Total interest and dividend revenue
|
4,827
|
|
2,792
|
|
||||
|
Interest expense
|
1,071
|
|
1,148
|
|
||||
|
Net interest income
|
3,756
|
|
1,644
|
|
||||
|
Provision for loan losses
|
164
|
|
—
|
|
||||
|
Net interest income after provision for loan losses
|
3,592
|
|
1,644
|
|
||||
|
Noninterest income
|
8
|
|
3
|
|
||||
|
Noninterest expenses
|
(248
|
)
|
(137
|
)
|
||||
|
Income before income taxes
|
3,352
|
|
1,510
|
|
||||
|
Income tax benefit
|
188
|
|
308
|
|
||||
|
Income before undistributed net income of subsidiaries
|
3,540
|
|
1,818
|
|
||||
|
Equity in undistributed net income of subsidiaries
|
9,227
|
|
5,291
|
|
||||
|
Net income
|
$
|
12,767
|
|
$
|
7,109
|
|
||
|
129
|
||
|
Capital Bancorp, Inc. and Subsidiaries
Notes to Consolidated Financial Statements
December 31, 2018 and 2017
|
|
Note 15 - Parent Company Financial Information (continued)
|
|
Parent Company Only Statements of Cash Flows
|
|||||||
|
(in thousands)
|
2018
|
2017
|
|||||
|
Cash flows from operating activities
|
|||||||
|
Net Income
|
12,767
|
|
7,109
|
|
|||
|
Adjustments to reconcile net income to net cash provided by operating activities:
|
|||||||
|
Provision for loan losses
|
164
|
|
—
|
|
|||
|
Equity in undistributed income-subsidiary
|
(9,227
|
)
|
(6,380
|
)
|
|||
|
(Increase) decrease in receivable from subsidiary bank
|
(148
|
)
|
144
|
|
|||
|
Stock-based compensation expense
|
570
|
|
506
|
|
|||
|
Director and employee compensation paid in Company stock
|
496
|
|
776
|
|
|||
|
Deferred income tax benefit
|
(141
|
)
|
(239
|
)
|
|||
|
Amortization of debt issuance costs
|
32
|
|
34
|
|
|||
|
Changes in assets and liabilities:
|
|||||||
|
Accrued interest receivable
|
(23
|
)
|
(26
|
)
|
|||
|
Prepaid income taxes and taxes payable
|
45
|
|
69
|
|
|||
|
Other assets
|
(169
|
)
|
(443
|
)
|
|||
|
Accrued interest payable
|
(1
|
)
|
—
|
|
|||
|
Other liabilities
|
—
|
|
18
|
|
|||
|
Net cash provided by operating activities
|
4,365
|
|
1,568
|
|
|||
|
Cash flows from investing activities
|
|||||||
|
Net increase in loans receivable
|
(19,988
|
)
|
(3,558
|
)
|
|||
|
Capital injections to subsidiaries
|
(367
|
)
|
80
|
|
|||
|
Net cash provided by investing activities
|
(20,355
|
)
|
(3,478
|
)
|
|||
|
Cash flows from financing activities
|
|||||||
|
Repayment of debt
|
(2,000
|
)
|
—
|
|
|||
|
Repurchase of common stock
|
(45
|
)
|
(512
|
)
|
|||
|
Proceeds from exercise of stock options
|
1,043
|
|
1,668
|
|
|||
|
Proceeds from shares sold
|
198
|
|
—
|
|
|||
|
Proceeds from initial public offering, net
|
19,764
|
|
—
|
|
|||
|
Net cash provided by financing activities
|
18,960
|
|
1,156
|
|
|||
|
Net increase (decrease) in cash and cash equivalents
|
2,970
|
|
(754
|
)
|
|||
|
Cash and cash equivalents, beginning of year
|
798
|
|
1,552
|
|
|||
|
Cash and cash equivalents, end of year
|
$
|
3,768
|
|
$
|
798
|
|
|
|
130
|
||
|
Capital Bancorp, Inc. and Subsidiaries
Notes to Consolidated Financial Statements
December 31, 2018 and 2017
|
|
Note 16 -
Fair Value
|
Generally accepted accounting principles define fair value, establish a framework for measuring fair value, recommend disclosures about fair value, and establish a hierarchy for determining fair value measurement. The hierarchy includes three levels and is based upon the valuation techniques used to measure assets and liabilities. The three levels are as follows:
Level 1 - Inputs to the valuation method are quoted prices (unadjusted) for identical assets or liabilities in active markets;
Level 2 - Inputs to the valuation method include quoted prices for similar assets and liabilities in active markets, and inputs that are observable for the asset or liability, either directly or indirectly, for substantially the full term of the financial instrument; and
Level 3 - Inputs to the valuation method are unobservable and significant to the fair value measurement.
Fair value measurements on a recurring basi
s
Investment securities available for sale
- The fair values of the Company's investment securities available for sale are provided by an independent pricing service. The fair values of the Company's securities are determined based on quoted prices for similar securities under Level 2 inputs.
Loans held for sale
- The fair value of loans held for sale is determined using Level 2 inputs of quoted prices for a similar asset, adjusted for specific attributes of that loan.
Derivative financial instruments
- Derivative instruments used to hedge residential mortgage loans held for sale and the related interest rate lock commitments include forward commitments to sell mortgage loans and are reported at fair value utilizing Level 2 inputs. The fair values of derivative financial instruments are based on derivative market data inputs as of the valuation date and the underlying value of mortgage loans for rate lock commitments.
The interest rate swap is reported at fair value utilizing Level 2 inputs. The Company obtains dealer quotations to value its swap. For purposes of potential valuation adjustments to its derivative position, the Company evaluates the credit risk of its counterparty. Accordingly, the Company has considered factors such as the likelihood of default by the counterparty and the remaining contractual life, among other things, in determining if any fair value adjustment related to credit risk is required.
|
131
|
||
|
Capital Bancorp, Inc. and Subsidiaries
Notes to Consolidated Financial Statements
December 31, 2018 and 2017
|
|
Note 16 - Fair Value (continued)
|
The Company has categorized its financial instruments measured at fair value on a recurring basis as of
December 31, 2018
and
December 31, 2017
as follows:
|
Fair Value of Financial Instruments
|
||||||||||||||||
|
(in thousands)
|
Total
|
Level 1 Inputs
|
Level 2 Inputs
|
Level 3 Inputs
|
||||||||||||
|
December 31, 2018
|
||||||||||||||||
|
Investment securities available for sale
|
||||||||||||||||
|
U.S. government-sponsored enterprises
|
$
|
17,360
|
|
$
|
—
|
|
$
|
17,360
|
|
$
|
—
|
|
||||
|
Municipal
|
501
|
|
—
|
|
501
|
|
—
|
|
||||||||
|
Corporate
|
2,885
|
|
—
|
|
2,885
|
|
—
|
|
||||||||
|
Mortgage-backed securities
|
26,186
|
|
—
|
|
26,186
|
|
—
|
|
||||||||
|
$
|
46,932
|
|
$
|
—
|
|
$
|
46,932
|
|
$
|
—
|
|
|||||
|
Loans held for sale
|
$
|
18,526
|
|
$
|
—
|
|
$
|
18,526
|
|
$
|
—
|
|
||||
|
Derivative assets
|
$
|
112
|
|
$
|
—
|
|
$
|
112
|
|
$
|
—
|
|
||||
|
Derivative liabilities
|
$
|
253
|
|
$
|
—
|
|
$
|
253
|
|
$
|
—
|
|
||||
|
December 31, 2017
|
||||||||||||||||
|
Investment securities available for sale
|
||||||||||||||||
|
U.S. government-sponsored enterprises
|
$
|
17,370
|
|
$
|
—
|
|
$
|
17,370
|
|
$
|
—
|
|
||||
|
Municipal
|
516
|
|
—
|
|
516
|
|
—
|
|
||||||||
|
Corporate
|
3,076
|
|
—
|
|
3,076
|
|
—
|
|
||||||||
|
Mortgage-backed securities
|
33,067
|
|
—
|
|
33,067
|
|
—
|
|
||||||||
|
$
|
54,028
|
|
$
|
—
|
|
$
|
54,028
|
|
$
|
—
|
|
|||||
|
Loans held for sale
|
$
|
26,344
|
|
$
|
—
|
|
$
|
26,344
|
|
$
|
—
|
|
||||
|
Derivative assets
|
$
|
100
|
|
$
|
—
|
|
$
|
100
|
|
$
|
—
|
|
||||
|
Derivative liabilities
|
$
|
42
|
|
$
|
—
|
|
$
|
42
|
|
$
|
—
|
|
||||
Financial instruments recorded using FASB ASC 825-10
Under FASB ASC 825-10, the Company may elect to report most financial instruments and certain other items at fair value on an instrument-by-instrument basis with changes in fair value reported in net income. After the initial adoption, the election is made at the acquisition of an eligible financial asset, financial liability or firm commitment or when certain specified reconsideration events occur. The fair value election, with respect to an item, may not be revoked once an election is made.
The following table reflects the difference between the fair value carrying amount of loans held for sale, measured at fair value under FASB ASC 825-10, and the aggregate unpaid principal amount the Company is contractually entitled to receive at maturity:
|
Fair Value of Loans Held for Sale
|
||||||||
|
(in thousands)
|
||||||||
|
2018
|
2017
|
|||||||
|
Loans held for sale
|
||||||||
|
Aggregate fair value
|
$
|
18,526
|
|
$
|
26,344
|
|
||
|
Contractual principal
|
17,822
|
|
25,637
|
|
||||
|
Difference
|
$
|
704
|
|
$
|
707
|
|
||
As of
December 31, 2018
and
December 31, 2017
, the Company elected to account for loans held for sale at fair value to eliminate the mismatch that would occur by recording changes in market value on
|
132
|
||
|
Capital Bancorp, Inc. and Subsidiaries
Notes to Consolidated Financial Statements
December 31, 2018 and 2017
|
|
Note 16 - Fair Value (continued)
|
derivative instruments used to hedge loans held for sale while carrying the loans at the lower of cost or market.
Fair value measurements on a nonrecurring basis
Impaired loans
- The Company has measured impairment generally based on the fair value of the loan's collateral and discounted cash flow analysis. Fair value is generally determined based upon independent third-party appraisals of the properties, or discounted cash flows based upon the expected proceeds. These assets are included as Level 3 fair values. As of
December 31, 2018
and
December 31, 2017
,
the fair values consist of loan balances of
$4.4 million
and
$8.2 million
, with valuation allowances of
$262 thousand
and
$60 thousand
, respectively.
Foreclosed real estate
- The Company's foreclosed real estate is measured at fair value less cost to sell. Fair value was determined based on offers and/or appraisals. Cost to sell the real estate was based on standard market factors. The Company has categorized its foreclosed real estate as Level 3.
|
Fair Value of Impaired Loans and Foreclosed Real Estate
|
||||||||
|
(in thousands)
|
||||||||
|
2018
|
2017
|
|||||||
|
Impaired loans
|
||||||||
|
Level 1 Inputs
|
$
|
—
|
|
$
|
—
|
|
||
|
Level 2 Inputs
|
—
|
|
—
|
|
||||
|
Level 3 Inputs
|
4,093
|
|
8,170
|
|
||||
|
Total
|
$
|
4,093
|
|
$
|
8,170
|
|
||
|
Foreclosed real estate
|
||||||||
|
Level 1 Inputs
|
$
|
—
|
|
$
|
—
|
|
||
|
Level 2 Inputs
|
—
|
|
—
|
|
||||
|
Level 3 Inputs
|
142
|
|
93
|
|
||||
|
Total
|
$
|
142
|
|
$
|
93
|
|
||
The following table provides information describing the unobservable inputs used in Level 3 fair value measurements at
December 31, 2018
and
2017
:
|
Inputs
|
|||||
|
Valuation Technique
|
Unobservable Inputs
|
General Range of Inputs
|
|||
|
Impaired Loans
|
Appraised Value/Discounted Cash Flows
|
Discounts to appraisals or cash flows for estimated holding and/or selling costs
|
0 - 25%
|
||
|
Foreclosed Real Estate
|
Appraised Value/Comparable Sales
|
Discounts to appraisals for estimated holding and/or selling costs
|
0 - 25%
|
||
Fair value of financial instruments
Fair value information about financial instruments, whether or not recognized in the balance sheet, for which it is practical to estimate the value is based upon the characteristics of the instruments and relevant market information. Financial instruments include cash, evidence of ownership in an entity, or contracts that convey or impose on an entity that contractual right or obligation to either receive or deliver cash for another financial instrument.
|
133
|
||
|
Capital Bancorp, Inc. and Subsidiaries
Notes to Consolidated Financial Statements
December 31, 2018 and 2017
|
|
Note 16 - Fair Value (continued)
|
The information used to determine fair value is highly subjective and judgmental in nature and, therefore, the results may not be precise. Subjective factors include, among other things, estimates of cash flows, risk characteristics, credit quality, and interest rates, all of which are subject to change. Since the fair value is estimated as of the balance sheet date, the amounts that will actually be realized or paid upon settlement or maturity on these various instruments could be significantly different.
During the first quarter of 2018, the Company adopted ASU 2016-01, “Recognition and Measurement of Financial Assets and Liabilities.” The amendments included within this standard, which are applied prospectively, require the Company to disclose fair value of financial instruments measured at amortized cost on the balance sheet and to measure that fair value using an exit price notion. Prior to adopting the amendments included in the standard, the Company was allowed to measure fair value under an entry price notion. The entry price notion previously applied by the Company used a discounted cash flows technique to calculate the present value of expected future cash flows for a financial instrument. The exit price notion uses the same approach, but also incorporates other factors, such as enhanced credit risk, illiquidity risk, and market factors that sometimes exist in exit prices in dislocated markets.
As of
December 31, 2018
, the technique used by the Company to estimate the exit price of the loan portfolio consists of similar procedures to those used as of
December 31, 2017
, but with added emphasis on both illiquidity risk and credit risk not captured by the previously applied entry price notion. The fair value of the Company’s loan portfolio has always included a credit risk assumption in the determination of the fair value of its loans. This credit risk assumption is intended to approximate the fair value that a market participant would realize in a hypothetical orderly transaction. The Company’s loan portfolio is initially fair valued using a segmented approach. The Company divides its loan portfolio into the following categories: variable rate loans, impaired loans, and all other loans. The results are then adjusted to account for credit risk as described above. However, under the new guidance, the Company believes a further credit risk discount must be applied through the use of a discounted cash flow model to compensate for illiquidity risk, based on certain assumptions included within the discounted cash flow model, primarily the use of discount rates that better capture inherent credit risk over the lifetime of a loan. This consideration of enhanced credit risk provides an estimated exit price for the Company’s loan portfolio.
For variable-rate loans that reprice frequently and have no significant change in credit risk, fair values approximate carrying values. Fair values for impaired loans are estimated using discounted cash flow models or based on the fair value of the underlying collateral.
The fair value of cash and cash equivalents, interest bearing deposits at other financial institutions, federal funds sold and restricted investments is the carrying amount. Restricted stock includes equity of the Federal Reserve and other banker’s banks.
The fair value of noninterest bearing deposits and securities sold under agreements to repurchase is the carrying amount.
The fair value of checking and savings deposits, and money market accounts, is the amount payable on demand at the reporting date. Fair value of fixed maturity term accounts and individual retirement accounts is estimated using rates currently offered for accounts of similar remaining maturities.
The fair value of certificates of deposit in other financial institutions is estimated based on interest rates currently offered for deposits of similar remaining maturities.
The fair value of borrowings is estimated by discounting the value of contractual cash flows using current market rates for borrowings with similar terms and remaining maturities.
|
134
|
||
|
Capital Bancorp, Inc. and Subsidiaries
Notes to Consolidated Financial Statements
December 31, 2018 and 2017
|
|
Note 16 - Fair Value (continued)
|
The fair value of outstanding loan commitments, unused lines of credit, and letters of credit are not included in the table since the carrying value generally approximates fair value. These instruments generate fees that approximate those currently charged to originate similar commitments.
The table below presents the carrying amount, fair value, and placement in the fair value hierarchy of the Company’s financial instruments (in thousands).
|
Fair Value of Financial Assets and Liabilities
|
|||||||||||||||
|
December 31, 2018
|
December 31, 2017
|
||||||||||||||
|
(in thousands)
|
Carrying Amount
|
Fair Value
|
Carrying Amount
|
Fair Value
|
|||||||||||
|
Financial assets
|
|||||||||||||||
|
Level 1
|
|||||||||||||||
|
Cash and due from banks
|
$
|
10,431
|
|
$
|
10,431
|
|
$
|
8,189
|
|
$
|
8,189
|
|
|||
|
Interest bearing deposits at other financial institutions
|
22,007
|
|
22,007
|
|
40,356
|
|
40,356
|
|
|||||||
|
Federal funds sold
|
2,285
|
|
2,285
|
|
3,766
|
|
3,766
|
|
|||||||
|
Restricted investments
|
2,503
|
|
2,503
|
|
2,369
|
|
2,369
|
|
|||||||
|
Level 3
|
|||||||||||||||
|
Loans receivable, net
|
$
|
988,960
|
|
$
|
979,058
|
|
$
|
877,387
|
|
$
|
872,446
|
|
|||
|
Financial liabilities
|
|||||||||||||||
|
Level 1
|
|||||||||||||||
|
Noninterest bearing deposits
|
$
|
242,259
|
|
$
|
242,259
|
|
$
|
196,635
|
|
$
|
196,635
|
|
|||
|
Securities sold under agreements to repurchase
|
3,332
|
|
3,332
|
|
11,260
|
|
11,260
|
|
|||||||
|
Level 3
|
|||||||||||||||
|
Interest bearing deposits
|
712,981
|
|
711,876
|
|
708,264
|
|
702,930
|
|
|||||||
|
FHLB advances and other borrowed funds
|
19,393
|
|
19,447
|
|
19,361
|
|
19,413
|
|
|||||||
|
135
|
||
|
Capital Bancorp, Inc. and Subsidiaries
Notes to Consolidated Financial Statements
December 31, 2018 and 2017
|
|
Note 17 -
Lease Commitments
|
Certain agreements include options for the Company to renew for additional terms. Certain agreements require the payment of common area maintenance expenses, in addition to rent.
At
December 31, 2018
, the minimum rental commitment under the noncancellable leases is as follows:
|
Lease Commitments
|
||||
|
(in thousands)
|
||||
|
2019
|
$
|
1,089
|
|
|
|
2020
|
1,204
|
|
||
|
2021
|
1,187
|
|
||
|
2022
|
824
|
|
||
|
2023
|
712
|
|
||
|
After 2023
|
420
|
|
||
|
$
|
5,436
|
|
||
Rent expense was
$1.5 million
and
$1.4 million
for the years ended
December 31, 2018
and
2017
, respectively.
Note 18 - Litigation
The Bank, along with
two
other banking institutions, is a defendant in a lawsuit currently pending in the Circuit Court for Montgomery County, Maryland (Case No. 426478V). The
three
counts pled are (i) aiding and abetting fraudulent misrepresentation, (ii) aiding and abetting fraudulent concealment and (iii) abetting constructive fraud. The
three
defendants filed motions for summary judgment, which were each denied by the Circuit Court in mid-March 2019. The trial for this matter has been set for April 29, 2019 and mediation is scheduled for April 9, 2019.
The Bank and the other named defendants dispute plaintiff’s allegations, as well as plaintiff’s statements of the underlying factual circumstances, and believe these claims are without merit. The defendants plan to vigorously defend this case. The Bank has insurance policies that will provide coverage on this case, and the related insurance carrier has been advised of these claims. However, if the case is not settled and goes to trial where there is a finding of fraud, the Bank’s insurance carrier has issued a reservation of rights letter and may deny coverage. At this time, the Company cannot predict the outcome of this legal proceeding or estimate its impact on the Company’s financial condition or results of operations. However, based on discussions with outside legal counsel regarding the merits of this lawsuit, management believes there is a reasonable possibility that if there is an adverse judgment entered against the Bank, such judgment may be up to
$4.0 million
.
In addition to the lawsuit described above, the Company is involved in legal proceedings occurring in the ordinary course of business. Based on an assessment of the merits of the lawsuit described above by litigation counsel, management believes that neither the lawsuit described above nor any legal proceedings occurring in the ordinary course of business, individually or in the aggregate, will have a material adverse impact on the results of operations or financial condition of the Company.
|
136
|
||
|
Capital Bancorp, Inc. and Subsidiaries
Notes to Consolidated Financial Statements
December 31, 2018 and 2017
|
Note 19 - Quarterly Results of Operations (unaudited)
The following table presents condensed unaudited information relating to quarterly periods in
2018
and
2017
.
All share and per common share amounts have been adjusted to reflect the Stock Split. Refer to Note 1 for additional information.
|
Quarterly Results of Operations
|
||||||||||||||||||||||||||||||||
|
(in thousands)
|
||||||||||||||||||||||||||||||||
|
2018
|
2017
|
|||||||||||||||||||||||||||||||
|
Dec 31
|
Sep 30
|
Jun 30
|
Mar 31
|
Dec 31
|
Sep 30
|
Jun 30
|
Mar 31
|
|||||||||||||||||||||||||
|
Interest Income
|
$
|
18,238
|
|
$
|
17,447
|
|
$
|
16,778
|
|
$
|
16,664
|
|
$
|
14,679
|
|
$
|
15,003
|
|
$
|
14,211
|
|
$
|
12,773
|
|
||||||||
|
Interest Expense
|
3,348
|
|
2,955
|
|
2,657
|
|
2,279
|
|
2,117
|
|
2,044
|
|
1,866
|
|
1,728
|
|
||||||||||||||||
|
Net Interest Income
|
14,890
|
|
14,492
|
|
14,121
|
|
14,385
|
|
12,562
|
|
12,959
|
|
12,345
|
|
11,045
|
|
||||||||||||||||
|
Provision for Loan Losses
|
500
|
|
495
|
|
630
|
|
515
|
|
785
|
|
700
|
|
620
|
|
550
|
|
||||||||||||||||
|
Noninterest Income
|
3,466
|
|
4,240
|
|
4,340
|
|
4,078
|
|
3,024
|
|
4,901
|
|
4,342
|
|
2,883
|
|
||||||||||||||||
|
Noninterest Expense
|
13,094
|
|
13,900
|
|
13,529
|
|
13,600
|
|
13,385
|
|
12,180
|
|
11,387
|
|
10,355
|
|
||||||||||||||||
|
Income Before Provision for Income Taxes
|
4,762
|
|
4,337
|
|
4,302
|
|
4,348
|
|
1,416
|
|
4,980
|
|
4,680
|
|
3,023
|
|
||||||||||||||||
|
Provision for Income Taxes
|
1,276
|
|
1,190
|
|
1,158
|
|
1,358
|
|
2,062
|
|
1,941
|
|
1,822
|
|
1,164
|
|
||||||||||||||||
|
Net Income (Loss)
|
$
|
3,486
|
|
$
|
3,147
|
|
$
|
3,144
|
|
$
|
2,990
|
|
$
|
(646
|
)
|
$
|
3,039
|
|
$
|
2,858
|
|
$
|
1,859
|
|
||||||||
|
Basic earnings (losses) per common share
|
$
|
0.26
|
|
$
|
0.27
|
|
$
|
0.26
|
|
$
|
0.26
|
|
$
|
(0.06
|
)
|
$
|
0.27
|
|
$
|
0.26
|
|
$
|
0.17
|
|
||||||||
|
Diluted earnings (losses) per common share
|
$
|
0.25
|
|
$
|
0.26
|
|
$
|
0.26
|
|
$
|
0.25
|
|
$
|
(0.06
|
)
|
$
|
0.27
|
|
$
|
0.25
|
|
$
|
0.17
|
|
||||||||
Note 20 - Subsequent Events
Subsequent events are events or transactions that occur after the balance sheet date but before financial statements are issued. Recognized subsequent events are events or transactions that provide additional evidence about conditions that existed at the date of the balance sheet, including the estimates inherent in the process of preparing financial statements. Non-recognized subsequent events are events that provide evidence about conditions that did not exist at the date of the balance sheet but arose after that date.
|
137
|
||
ITEM 9. CHANGES IN AND DISAGREEMENTS WITH ACCOUNTANTS ON ACCOUNTING AND FINANCIAL DISCLOSURE
None.
ITEM 9A. CONTROLS AND PROCEDURES.
Evaluation of Disclosure Controls and Procedures
The Company’s management, including our Chief Executive Officer and Chief Financial Officer, have evaluated the effectiveness of our disclosure controls and procedures (as defined in Rule 13a-15(e) under the Exchange Act as of the end of the period covered by this report. Based upon that evaluation, our Chief Executive Officer and Chief Financial Officer concluded that our disclosure controls and procedures were effective to ensure that information required to be disclosed in the reports we file and submit under the Exchange Act is (i) recorded, processed, summarized and reported as and when required and (ii) accumulated and communicated to our management, including our Chief Executive Officer and the Chief Financial Officer, as appropriate to allow timely decisions regarding required disclosure.
Evaluation of Internal Control over Financial Reporting
This annual report does not include a report of management’s assessment regarding internal control over financial reporting or an attestation report of the Company’s independent registered public accounting firm due to a transition period established by rules of the SEC for newly public companies.
Changes in Internal Control over Financial Reporting
There has been no change in the Company’s internal control over financial reporting (as such term is defined in Rule 13a-15(f) under the Exchange Act) during the fourth quarter of 2018 to which this report relates that has materially affected, or is reasonably likely to materially affect, the Company’s internal control over financial reporting.
ITEM 9B. OTHER INFORMATION
None.
|
138
|
||
PART III
ITEM 10. DIRECTORS, EXECUTIVE OFFICERS AND CORPORATE GOVERNANCE
The information required by this Item with respect to our directors and certain corporate governance practices is contained in our Proxy Statement for our 2019 Annual Meeting of Shareholders (the “Proxy Statement”) to be filed with the SEC within 120 days after the end of the Company’s fiscal year ended December 31, 2018. Such information is incorporated herein by reference.
ITEM 11. EXECUTIVE COMPENSATION
The information required by this Item is incorporated herein by reference to our Proxy Statement to be filed with the SEC within 120 days after the end of the Company’s fiscal year ended December 31, 2018.
ITEM 12. SECURITY OWNERSHIP OF CERTAIN BENEFICIAL OWNERS AND MANAGMENT AND RELATED STOCKHOLDER MATTERS
The information required by this Item regarding security ownership of certain beneficial owners and management is incorporated by reference to our Proxy Statement to be filed with the SEC within 120 days after the end of the Company’s fiscal year ended December 31, 2018. Information relating to securities authorized for issuance under the Company’s equity compensation plans is included in Part II of this Annual Report on Form 10-K under “Item 5. Market for Registrant’s Common Equity, Related Shareholder Matters and Issuer Purchases of Equity Securities.”
ITEM 13. CERTAIN RELATIONSHIPS AND RELATED TRANSACTIONS, AND DIRECTOR INDEPENDENCE
The information required by this Item is incorporated herein by reference to our Proxy Statement to be filed with the SEC within 120 days after the end of the Company’s fiscal year ended December 31, 2018.
ITEM 14. PRINCIPAL ACCOUNTANT FEES AND SERVICES
The information required by this Item is incorporated herein by reference to our Proxy Statement to be filed with the SEC within 120 days after the end of the Company’s fiscal year ended December 31, 2018.
|
139
|
||
PART IV
ITEM 15. EXHIBITS AND FINANCIAL STATEMENT SCHEDULES
INDEX TO EXHIBITS
|
Exhibit Number
|
Description
|
||
|
3.1
|
|
Amended and Restated Articles of Incorporation (incorporated by reference to Exhibit 3.1 to the Company’s Form S-1 filed on August 31, 2018)
|
|
|
3.2
|
|
Amended and Restated Bylaws (incorporated by reference to Exhibit 3.2 to the Company’s Form S-1 filed on August 31, 2018)
|
|
|
10.1
|
|
Capital Bancorp, Inc. 2017 Stock and Incentive Compensation Plan (incorporated by reference to Exhibit 10.1 to the Company’s Form S-1 filed on August 31, 2018)
|
|
|
10.2
|
|
Form of Restricted Stock Award Agreement under the Capital Bancorp, Inc. 2017 Stock and Incentive Compensation Plan (incorporated by reference to Exhibit 10.2 to the Company’s Form S-1/A filed on September 17, 2018)
|
|
|
10.3
|
|
Form of Restricted Stock Unit Award Agreement under the Capital Bancorp, Inc. 2017 Stock and Incentive Compensation Plan (incorporated by reference to Exhibit 10.3 to the Company’s Form S-1/A filed on September 17, 2018)
|
|
|
10.4
|
|
Form of Incentive Stock Option Award Agreement under the Capital Bancorp, Inc. 2017 Stock and Incentive Compensation Plan (incorporated by reference to Exhibit 10.4 to the Company’s Form S-1/A filed on September 17, 2018)
|
|
|
10.5
|
|
Form of Non-Qualified Stock Option Award Agreement under the Capital Bancorp, Inc. 2017 Stock and Incentive Compensation Plan (incorporated by reference to Exhibit 10.5 to the Company’s Form S-1/A filed on September 17, 2018)
|
|
|
10.6
|
|
Form of Stock Appreciation Right Award Agreement under the Capital Bancorp, Inc. 2017 Stock and Incentive Compensation Plan (incorporated by reference to Exhibit 10.6 to the Company’s Form S-1/A filed on September 17, 2018)
|
|
|
10.7
|
|
Employment Agreement, effective January 1, 2019, by and among Capital Bancorp, Inc., Capital Bank, N.A. and Edward F. Barry (incorporated by reference to Exhibit 10.1 to the Company’s Form 8-K filed on January 10, 2019)
|
|
|
10.8
|
|
Employment Agreement dated January 1, 2013 between Capital Bank, N.A. and Scot R. Browning (incorporated by reference to Exhibit 10.7 to the Company’s Form S-1 filed on August 31, 2018)
|
|
|
23.1
|
|
||
|
31.1
|
|
||
|
31.2
|
|
|
|
|
32
|
|
||
|
101
|
|
The following materials from the Annual Report on Form 10-K of Capital Bancorp, Inc. for the year ended December 31, 2018, formatted in eXtensible Business Reporting Language (XBRL): (i) Consolidated Balance Sheets, (ii) Consolidated Statements of Income, (iii) Consolidated Statements of Comprehensive Income, (iv) Consolidated Statement of Changes in Shareholders’ Equity, (v) Consolidated Statements of Cash Flows and (vi) Notes to Unaudited Consolidated Financial Statements.
|
|
|
140
|
||
SIGNATURES
Pursuant to the requirements of Section 13 or 15(d) of the Securities Exchange Act of 1934, the Registrant has duly caused this report to be signed on its behalf by the undersigned, thereunto duly authorized.
CAPITAL BANCORP, INC.
By:
/s/ Edward F. Barry
Edward F. Barry
Chief Executive Officer
Dated: April 1, 2019
Pursuant to the requirements of the Securities Exchange Act of 1934, this report has been signed by the following persons on behalf of the Registrant and in the capacities and on the dates indicated.
|
141
|
||
|
Signature
|
Title
|
Date
|
|||
|
By:
|
/s/ Edward F. Barry
|
Chief Executive
Officer and Director
(Principal Executive Officer)
|
April 1, 2019
|
||
|
Edward F. Barry
|
|||||
|
By:
|
/s/ Alan W. Jackson
|
Executive Vice President and
Chief Financial Officer
(Principal Financial and Accounting Officer)
|
April 1, 2019
|
||
|
Alan W. Jackson
|
|||||
|
By:
|
/s/ Stephen N. Ashman
|
Chairman of the Board of Directors
|
April 1, 2019
|
||
|
Stephen N. Ashman
|
|||||
|
By:
|
/s/ C. Scott Brannan
|
Director
|
April 1, 2019
|
||
|
C. Scott Brannan
|
|||||
|
By:
|
/s/ Scot. R. Browning
|
Director
|
April 1, 2019
|
||
|
Scot R. Browning
|
|||||
|
By:
|
/s/ Joshua Bernstein
|
Director
|
April 1, 2019
|
||
|
Joshua Bernstein
|
|||||
|
By:
|
/s/ Michael Burke
|
Director
|
April 1, 2019
|
||
|
Michael Burke
|
|||||
|
By:
|
/s/ Randall. J. Levitt
|
Director
|
April 1, 2019
|
||
|
Randall J. Levitt
|
|||||
|
By:
|
/s/ Deborah Ratner Salzberg
|
Director
|
April 1, 2019
|
||
|
Deborah Ratner Salzberg
|
|||||
|
By:
|
/s/ Steven J. Schwartz
|
Director
|
April 1, 2019
|
||
|
Steven J. Schwartz
|
|||||
|
By:
|
/s/ James F. Whalen
|
Director
|
April 1, 2019
|
||
|
James F. Whalen
|
|||||
|
142
|
||
TABLE OF CONTENTS
Part IItem 1. BusinessItem 1A. Risk FactorsNote 18 - Litigation, Included in Our Notes To Consolidated Financial Statements Under Part II. Item 8Item 1B Unresolved Staff CommentsItem 2. PropertiesItem 3. Legal ProceedingsItem 4. Mine Safety DisclosuresPart IIItem 5. Market For The Registrant S Common Equity, Related Stockholder Matters and Issuer Purchases Of Equity SecuritiesItem 6. Selected Financial DataItem 7. Management S Discussion and Analysis Of Financial Condition and Results Of OperationsItem 7A. Quantitative and Qualitative Disclosures About Market RiskItem 8. Financial Statements and Supplementary DataNote 1 - Nature Of Business and Basis Of PresentationNote 1 - Nature Of Business and Basis Of Presentation (continued)Note 2 - Cash and Cash EquivalentsNote 3 - Investment SecuritiesNote 3 - Investment Securities (continued)Note 4 - Loans ReceivableNote 4 - Loans Receivable (continued)Note 5 - Premises and EquipmentNote 6 - Derivative Financial InstrumentsNote 7 - Interest Bearing DepositsNote 8 - Securities Sold Under Agreements To RepurchaseNote 9 - Borrowed FundsNote 10 - Retirement PlanNote 11 - Related-party TransactionsNote 11 - Related-party Transactions (continued)Note 12 - Income TaxesNote 12 - Income Taxes (continued)Note 13 - Capital StandardsNote 13 - Capital Standards (continued)Note 14 - Stock-based CompensationNote 14 - Stock-based Compensation (continued)Note 15 - Parent Company Financial InformationNote 15 - Parent Company Financial Information (continued)Note 16 - Fair ValueNote 16 - Fair Value (continued)Note 17 - Lease CommitmentsNote 18 - LitigationNote 19 - Quarterly Results Of Operations (unaudited)Note 20 - Subsequent EventsItem 9. Changes in and Disagreements with Accountants on Accounting and Financial DisclosureItem 9A. Controls and ProceduresItem 9B. Other InformationPart IIIItem 10. Directors, Executive Officers and Corporate GovernanceItem 11. Executive CompensationItem 12. Security Ownership Of Certain Beneficial Owners and Managment and Related Stockholder MattersItem 13. Certain Relationships and Related Transactions, and Director IndependenceItem 14. Principal Accountant Fees and ServicesPart IVItem 15. Exhibits and Financial Statement Schedules