CBOE GLOBAL MARKETS, INC.
10-Ks and 10-Qs
|
|
|
|
|
|
|
|
|
|
|
|
|
|
|
|
|
|
|
|
|
|
|
|
|
|
|
|
|
|
|
|
|
|
|
|
|
|
|
|
|
|
|
|
|
|
|
|
|
|
|
|
|
UNITED STATES
SECURITIES AND EXCHANGE COMMISSION
Washington, DC 20549
Form 10-K
|
ý
|
|
ANNUAL REPORT PURSUANT TO SECTION 13 OR 15(d) OF THE SECURITIES EXCHANGE ACT OF 1934
|
|
For the fiscal year ended December 31, 2016
|
||
|
or
|
||
|
o
|
|
TRANSITION REPORT PURSUANT TO SECTION 13 OR 15(d) OF THE SECURITIES EXCHANGE ACT OF 1934
|
|
For the transition period from to
|
||
Commission File No. 001-34774
CBOE HOLDINGS, INC.
(Exact name of registrant as specified in its charter)
|
Delaware
(State or other jurisdiction of
incorporation or organization)
|
|
20-5446972
(I.R.S. Employer
Identification Number)
|
|
400 South LaSalle Street
Chicago, Illinois
(Address of principal executive offices)
|
|
60605
(Zip Code)
|
Registrant's telephone number, including area code
(312) 786-5600
Securities registered pursuant to Section 12(b) of the Act:
|
Title of Each Class
|
|
Name of Exchange on Which Registered
|
|
Common Stock,
par value $0.01 per share
|
|
NASDAQ Global Select Market
|
Securities registered pursuant to Section 12(g) of the Act:
None
Indicate by check mark if the registrant is a well-known seasoned issuer, as defined in Rule 405 of the Securities Act. Yes
ý
No
o
Indicate by check mark if the registrant is not required to file reports pursuant to Section 13 or Section 15(d) of the Act. Yes
o
No
ý
Indicate by check mark whether the registrant (1) has filed all reports required to be filed by Section 13 or 15(d) of the Securities Exchange Act of 1934 during the preceding 12 months and (2) has been subject to such filing requirements for the past 90 days. Yes
ý
No
o
Indicate by check mark whether the registrant has submitted electronically and posted on its corporate website, if any, every Interactive Data File required to be submitted and posted pursuant to Rule 405 of Regulation S-T (§232.405 of this chapter) during the preceding 12 months (of for such shorter period that the registrant was required to submit and post such files). Yes
ý
No
o
Indicate by check mark if disclosure of delinquent filers pursuant to Item 405 of Regulation S-K is not contained herein, and will not be contained, to the best of registrant's knowledge, in definitive proxy or information statements incorporated by reference in Part III of this Form 10-K or any amendment to this Form 10-K.
ý
Indicate by check mark whether the registrant is a large accelerated filer, an accelerated filer, a non-accelerated filer, or a smaller reporting company. See the definitions of "large accelerated filer," "accelerated filer" and "smaller reporting company" in Rule 12b-2 of the Exchange Act. (Check One):
|
Large accelerated filer
ý
|
|
Accelerated filer
o
|
|
Non-accelerated filer
¨
(Do not check if a
smaller reporting company)
|
|
Smaller reporting company
o
|
Indicate by check mark whether the registrant is a shell company (as defined in Rule 12b-2 of the Act). Yes
o
No
ý
As of June 30, 2016, the aggregate market value of the Registrant's outstanding voting common equity held by non-affiliates was approximately
$5.4 billion
based on the closing price of
$66.62
per share of common stock.
The number of outstanding shares of the registrant's common stock as of
February 16, 2017
was
81,285,307
shares of common stock.
DOCUMENTS INCORPORATED BY REFERENCE
|
Documents
|
|
Form 10-K Reference
|
|
Portions of the Company's Proxy Statement for the 2017 Annual Meeting of Stockholders
|
|
Part III
|
TABLE OF CONTENTS
CBOE HOLDINGS, INC.
2016
FORM 10-K
|
|
|
|
Page
|
|
|
|
||
|
|
|||
|
|
|||
|
|
|||
|
|
|||
|
|
|||
|
|
|||
|
|
|
||
|
|
|||
|
|
|||
|
|
|||
|
|
|||
|
|
|||
|
|
|||
|
|
|||
|
|
|||
|
|
|
||
|
|
|||
|
|
|||
|
|
|||
|
|
|||
|
|
|||
|
|
|
||
|
|
|||
CERTAIN DEFINED TERMS
Throughout this document, unless otherwise specified or the context so requires:
|
•
|
"CBOE Holdings," "we," "us," "our" or "the Company" refers to CBOE Holdings, Inc. and its subsidiaries.
|
|
•
|
"CBOE" refers to Chicago Board Options Exchange, Incorporated, a wholly-owned subsidiary of CBOE Holdings, Inc.
|
|
•
|
"C2" refers to C2 Options Exchange, Incorporated, a wholly-owned subsidiary of CBOE Holdings, Inc.
|
|
•
|
"CFE" refers to CBOE Futures Exchange, LLC, a wholly-owned subsidiary of CBOE Holdings, Inc.
|
|
•
|
"CFTC" refers to the U.S. Commodity Futures Trading Commission.
|
|
•
|
"Consent Order" refers to the consent order that CBOE and C2 entered into with the SEC on June 11, 2013.
|
|
•
|
"FASB" refers to the Financial Accounting Standards Board.
|
|
•
|
"GAAP" refers to Generally Accepted Accounting Principles in the U.S.
|
|
•
|
"Our exchanges" refers to CBOE, C2 and CFE.
|
|
•
|
"SEC" refers to the U.S. Securities and Exchange Commission.
|
|
•
|
"SPX" refers to our S&P 500 Index exchange-traded options products.
|
|
•
|
"TPH" refers to either a Trading Permit Holder or Trading Privilege Holder.
|
|
•
|
"VIX" refers to the CBOE Volatility Index methodology.
|
TRADEMARK INFORMATION
CBOE
®
, Chicago Board Options Exchange
®
, CBOE Volatility Index
®
, CFE
®
, Livevol
®
, FLEX
®
, FLexible EXchange
®
,
Hybrid
®
, LEAPS
®
and VIX
®
are registered trademarks and BuyWrite
SM
, CBOE Futures Exchange
SM
, CBOE Vest
SM
, CBOE Options Institute
SM
, CBOE Russell 2000 Volatility Index
SM
, CBOE/CBOT 10-year U.S. Treasury Note Volatility Index
SM
and Weeklys
SM
are service marks of CBOE. C2
SM
and C2 Options Exchange
SM
are service marks of C2. Standard & Poor's
®
, S&P
®
, S&P 100
®
and S&P 500
®
are registered trademarks of Standard & Poor's Financial Services LLC and have been licensed for use by CBOE, C2 and CFE. Russell
®
, Russell 1000
®
and Russell 2000
®
are registered trademarks of Frank Russell Company, used under license. Dow Jones
®
, Dow Jones Industrial Average
®
, DJIA
®
and Dow Jones Indexes are registered trademarks or service marks of Dow Jones Trademark Holdings, LLC, used under license. MSCI, and the MSCI index names are service marks of MSCI Inc., used under license. FTSE
®
and the FTSE indexes are trademarks and service marks of FTSE International Limited, used under license. CBOT is a trademark of CME Group, Inc. ("CME"). CBOE has, with the permission of CME, used the CBOT trademark in CBOE/CBOT 10-year U.S. Treasury Note Volatility Index. CME makes no representation regarding the advisability of investing in any investment product that is based on such indexes. All other trademarks and service marks are the property of their respective owners.
1
FORWARD-LOOKING STATEMENTS
This Annual Report on Form 10-K contains forward-looking statements within the meaning of the Private Securities Litigation Reform Act of 1995 that involve a number of risks and uncertainties. You can identify these statements by forward-looking words such as "may," "might," "should," "expect," "plan," "anticipate," "believe," "estimate," "predict," "potential" or "continue," and the negative of these terms and other comparable terminology. All statements that reflect our expectations, assumptions or projections about the future other than statements of historical fact are forward-looking statements, including statements in "Business" and "Management's Discussion and Analysis of Financial Condition and Results of Operations." These forward-looking statements, which are subject to known and unknown risks, uncertainties and assumptions about us, may include projections of our future financial performance based on our growth strategies and anticipated trends in our business. These statements are only predictions based on our current expectations and projections about future events. There are important factors that could cause our actual results, level of activity, performance or achievements to differ materially from those expressed or implied by the forward-looking statements. In particular, you should consider the risks and uncertainties described under "Risk Factors" in this Annual Report.
While we believe we have identified material risks, these risks and uncertainties are not exhaustive. Moreover, we operate in a very competitive and rapidly changing environment. New risks and uncertainties emerge from time to time, and it is not possible to predict all risks and uncertainties, nor can we assess the impact of all factors on our business or the extent to which any factor, or combination of factors, may cause actual results to differ materially from those contained in any forward-looking statements.
Some factors that could cause actual results to differ include:
|
•
|
the loss of our right to exclusively list and trade certain index options and futures products;
|
|
•
|
economic, political and market conditions;
|
|
•
|
compliance with legal and regulatory obligations, including our obligations under the Consent Order;
|
|
•
|
increasing price competition in our industry;
|
|
•
|
decreases in trading volumes or a shift in the mix of products traded on our exchanges;
|
|
•
|
legislative or regulatory changes;
|
|
•
|
increasing competition by foreign and domestic entities;
|
|
•
|
our dependence on third party service providers;
|
|
•
|
our index providers' ability to maintain the quality and integrity of their indexes and to perform under our agreements;
|
|
•
|
our ability to operate our business without violating the intellectual property rights of others and the costs associated with protecting our intellectual property rights;
|
|
•
|
our ability to accommodate trading volume and transaction traffic, including significant increases, without failure or degradation of performance of our systems;
|
|
•
|
our ability to protect our systems and communication networks from security risks, including cyber-attacks;
|
|
•
|
the accuracy of our estimates and expectations;
|
|
•
|
our ability to maintain access fee revenues;
|
|
•
|
our ability to meet our compliance obligations, including managing potential conflicts between our regulatory responsibilities and our for-profit status;
|
|
•
|
the ability of our compliance and risk management methods to effectively monitor and manage our risks;
|
|
•
|
our ability to attract and retain skilled management and other personnel;
|
|
•
|
our ability to manage our growth and strategic acquisitions or alliances effectively;
|
|
•
|
restrictions imposed by our debt obligations;
|
|
•
|
the satisfaction of the conditions precedent to the consummation of our proposed acquisition of Bats Global Markets, Inc. (“Bats”), including, without limitation, the receipt of regulatory approvals on the terms desired or anticipated;
|
2
|
•
|
unanticipated difficulties or expenditures relating to the proposed transaction, including, without limitation, difficulties that result in the failure to realize expected synergies, efficiencies and cost savings from the proposed transaction within the expected time period (if at all), whether in connection with integration, combining trading platforms, broadening distribution of product offerings or otherwise;
|
|
•
|
our ability to maintain an investment grade credit rating;
|
|
•
|
risks relating to the value of our shares to be issued in the proposed transaction;
|
|
•
|
disruptions of our and Bats’ current plans, operations and relationships with market participants caused by the announcement and pendency of the proposed transaction; and
|
|
•
|
potential difficulties in our and Bats’ ability to retain employees as a result of the announcement and pendency of the proposed transaction.
|
For a detailed discussion of these and other factors that might affect our performance, see Part I, Item 1A. of this Report. We caution you not to place undue reliance on the forward-looking statements, which speak only as of the date of this filing.
3
Item 1.
Business
Overview
CBOE Holdings, Inc. is the holding company for Chicago Board Options Exchange, Incorporated, CBOE Futures Exchange, LLC, C2 Options Exchange, Incorporated and other subsidiaries, including our majority ownership in CBOE Vest Financial Group Inc. ("CBOE Vest").
The Company's principal business is operating markets that offer for trading options on various market indexes (index options), mostly on an exclusive basis, and futures contracts, as well as on non-exclusive "multiply-listed" options, such as options on the stocks of individual corporations (equity options) and options on other exchange-traded products (ETP options), such as exchange-traded funds (ETF options) and exchange-traded notes (ETN options). The Company operates CBOE, CFE and C2 as stand-alone exchanges, but reports the results of its operations in a single reporting segment.
CBOE is our primary options market and offers trading in listed options through a single system that integrates electronic trading and traditional open outcry trading on our trading floor in Chicago. This integration of electronic trading and traditional open outcry trading into a single exchange is known as our Hybrid trading model. CFE, our all-electronic futures exchange, offers trading of futures on the VIX Index and other products. C2 is our all-electronic exchange that also offers trading of listed options, and may operate with a different market model and fee structure than CBOE. All of our exchanges operate on our proprietary technology platform known as CBOE Command.
The following chart illustrates annual contract volume across the different categories of products traded at the Company for the periods indicated:
|
|
Annual Contract Volume
|
|||||||||||||
|
|
2016
|
2015
|
2014
|
2013
|
2012
|
|||||||||
|
Equities
|
364,373,339
|
|
392,982,051
|
|
488,580,906
|
|
433,777,204
|
|
494,289,301
|
|
||||
|
Indexes
|
433,256,044
|
|
408,281,695
|
|
406,454,861
|
|
372,647,443
|
|
304,339,908
|
|
||||
|
Exchange-traded products
|
326,740,299
|
|
320,997,251
|
|
379,742,163
|
|
341,023,209
|
|
311,792,122
|
|
||||
|
Total Options Volume
|
1,124,369,682
|
|
1,122,260,997
|
|
1,274,777,930
|
|
1,147,447,856
|
|
1,110,421,331
|
|
||||
|
Futures
|
60,176,526
|
|
51,671,188
|
|
50,615,435
|
|
40,193,447
|
|
23,892,931
|
|
||||
|
Total Contract Volume
|
1,184,546,208
|
|
1,173,932,185
|
|
1,325,393,365
|
|
1,187,641,303
|
|
1,134,314,262
|
|
||||
Our operating revenues are primarily driven by transaction fee revenues, which are generated on the contracts traded on our exchanges. In
2016
, approximately
70.5%
of our operating revenues were generated by transaction fee revenues.
Our principal executive offices are located at 400 South LaSalle Street, Chicago, Illinois 60605, and our telephone number is (312) 786-5600.
Our web site is
www.cboe.com
. Information contained on or linked through our web site is not incorporated by reference into this Annual Report on Form 10-K.
History
CBOE was founded in 1973 as a non-stock corporation owned by its members. CBOE was the first organized marketplace for the trading of standardized, exchange-traded options on equity securities. In 2004, CFE began operations as a futures exchange. CBOE Holdings was incorporated in the State of Delaware on August 15, 2006. In June 2010, CBOE demutualized, CBOE, CFE and C2 became wholly-owned subsidiaries of CBOE Holdings and CBOE Holdings completed its initial public offering. In October 2010, C2, the Company's all-electronic options exchange, initiated operations.
Pending Merger
CBOE Holdings and Bats Global Markets, Inc. (“Bats”) entered into an Agreement and Plan of Merger, dated as of September 25, 2016 (the “Merger Agreement”), providing, among other things, that, upon the terms and subject to the conditions set forth in the Merger Agreement, a wholly-owned subsidiary of CBOE Holdings will merge with and into Bats, with Bats surviving as a wholly-owned subsidiary of CBOE Holdings (the “Merger”). The Merger Agreement also provides that, immediately following the effective time of the Merger, Bats, as the surviving corporation from the Merger, will merge
4
with and into CBOE V, LLC (“Merger LLC”), a wholly-owned subsidiary of CBOE Holdings, Inc. (the “Subsequent Merger”), with Merger LLC surviving the Subsequent Merger as a wholly-owned subsidiary of CBOE Holdings.
Subject to the terms and conditions of the Merger Agreement, at the effective time of the Merger (the “Effective Time”), each share of voting common stock of Bats, par value $0.01 per share (“Bats Voting Common Stock”), and each share of non-voting common stock of Bats, par value $0.01 per share (“Bats Non-Voting Common Stock” and, together with the Bats Voting Common Stock, “Bats Common Stock”), issued and outstanding immediately prior to the Effective Time (other than shares held by CBOE Holdings, Bats or any of their respective subsidiaries, shares held by any holder of Bats Common Stock who is entitled to demand and properly demands appraisal of such shares under Delaware law and unvested restricted shares of Bats Common Stock granted under any Bats equity incentive plan) will convert into, at the election of the holder of such share, subject to proration and adjustment, either (i) 0.3201 of a share of common stock of CBOE Holdings, par value $0.01 per share (“CBOE Holdings Common Stock”), and $10.00 in cash (the “Mixed Consideration”), (ii) an amount of cash, without interest (the “Cash Consideration”), equal to the sum (rounded to two decimal places) of (a) $10.00 and (b) the product obtained by multiplying 0.3201 by the volume-weighted average price (rounded to four decimal places) of shares of CBOE Holdings Common Stock on the NASDAQ Stock Market LLC for the ten consecutive trading days ending on the second full trading day prior to the Effective Time (the “Closing VWAP”), or (iii) a number of shares of CBOE Holdings Common Stock (the “Stock Consideration”) equal to the sum of (a) 0.3201 and (b) the quotient (rounded to four decimal places) obtained by dividing $10.00 by the Closing VWAP. Holders of Bats Common Stock who do not make an election will receive the Mixed Consideration. The consideration to be paid to holders of Bats Common Stock electing to receive the Cash Consideration or the Stock Consideration in connection with the Merger is subject to automatic adjustment, as applicable, to ensure that the total amount of cash paid and the total number of shares of CBOE Holdings Common Stock issued in the Merger is the same as what would be paid and issued if all holders of Bats Common Stock were to receive the Mixed Consideration at the Effective Time.
The completion of the Merger is subject to certain conditions, including, among others, (i) adoption by Bats stockholders of the Merger Agreement, (ii) approval by CBOE Holdings stockholders of the issuance of CBOE Holdings common stock in connection with the Merger, (iii) the expiration or termination of the waiting period under the Hart-Scott-Rodino Antitrust Improvements Act ("HSR") and the receipt of all other regulatory approvals the failure to obtain which would make any of the transactions contemplated by the Merger Agreement illegal, including, without limitation, approval from the SEC, the Financial Industry Regulatory Authority ("FINRA") and the U.K. Financial Conduct Authority and (iv) other customary closing conditions. Early termination of the waiting period under the HSR was granted on November 18, 2016. CBOE Holdings and Bats received regulatory approvals by the SEC on December 19, 2016 and December 16, 2016, respectively, and FINRA granted approval on January 6, 2017. On January 17, 2017, Bats stockholders adopted the Merger Agreement and CBOE Holdings stockholders approved the issuance of CBOE Holdings common stock pursuant to the Merger Agreement. CBOE Holdings received regulatory approvals from the Dutch Central Bank and the United Kingdom's ("U.K.") Financial Conduct Authority (“FCA”) on February 2, 2017 and February 9, 2017, respectively. The Merger is expected to close on February 28, 2017.
Industry
Our primary business of offering exchange-traded options and futures contracts on financial instruments is part of the large global derivatives industry. Derivatives are financial contracts whose value is derived from an underlying asset or reference value. While derivatives exist on a wide range of underlying assets and references, we currently focus on offering derivatives products on individual stocks, indexes, exchange-traded funds, exchange-traded notes and various benchmarks related to trading and investment strategies. The global derivatives industry includes both exchanges and a large over-the-counter market. The most common types of derivatives are options, futures and swap contracts. These products allow for various types of risk to be isolated and transferred.
Options and Futures
Options represent a contract giving the buyer the right, but not the obligation, to buy or sell a specified quantity of an underlying security or index at a specific price for a specific period of time. Options provide investors a means for hedging, speculation and income generation, while at the same time providing leverage with respect to the underlying asset. Most options traded on U.S. securities exchanges and over-the-counter are on individual equities, market indexes and ETPs.
A futures contract is an agreement to buy or sell a particular commodity or financial instrument at a predetermined price at a specified time in the future. Futures are standardized, transferable, exchange-traded contracts that are settled by the delivery of the underlying asset or in cash by reference to the underlying asset or reference at a specified price and on a specified future date. Futures on CFE are settled in cash. Options on futures may also be listed for trading on futures exchanges.
5
Trading
In the listed options market, there are currently options contracts covering approximately 3,700 underlying stocks, indexes and ETPs, among other products. The presence of dedicated liquidity providers, including market-makers, is a key feature of the options market. Market-makers collectively provide continuous bids and offers for all listed options series.
Trends
Mix of Transaction Fees
Our proprietary products are those in which we have a property right or for which we have an exclusive license, and contribute almost all of our transaction fee revenues for index options and all of our transaction fee revenues for futures. Listed options on equities and ETPs currently may be listed on all options exchanges, while trading in our proprietary products is currently limited to our exchanges. Thus, our proprietary products are able to support a higher revenue per contract than multiply-listed products.
Over the past five years, our transaction fees generated by our futures and index options increased from approximately
57.5%
of total transaction fees in 2011 to approximately
88.2%
in
2016
. This increase is primarily due to increased trading volume and fees generated by our proprietary VIX options and futures and SPX options. More recently, average daily volume ("ADV") for our proprietary VIX options and futures and SPX options is up
8%
from 2015, led by trading in VIX futures, which is up
16%
from 2015.
Price Competition
The number of U.S. options exchanges that we compete with has more than doubled over the past eleven years, from five exchanges to fifteen, in large part due to existing exchange holding companies opening new exchanges that offer different markets and pricing models on existing technology. As the listed options business provides transaction processors with a new source of revenue for scalable systems, and offers greater margins than the equity trading business, we expect that our competitors, or new entrants into the exchange business, may continue to open new options exchanges.
The options exchanges that we compete with set fees and rebates to attract multiply-listed options business to their exchanges, which has reduced the net revenue per contract that we generate from multiply-listed options. Liquidity providers are attracted to markets primarily through the incentives for customer order flow, from which they can attempt to generate trading profits. Liquidity providers are also attracted by low transaction fees and credits to post liquidity. Order flow, particularly customer order flow, is the primary driver of multiply-listed options exchange volumes and in the past several years, the competition for this business has increased significantly, due in part to the role of firms known as consolidators, who operate both order execution and market making businesses, and collect customer order flow from originating brokers which they then route and execute as a service to that customer. These consolidators base their routing decisions, among other things, on best execution, technology, liquidity, service, pricing and other factors, including in some cases their ability to internalize order flow for potential trading profits. Some exchanges have structured their options businesses in partnership with established market participants, such as consolidators, and other order flow providers, while others offer specific payments for order flow, in addition to any economic incentives received from market-makers and other participants.
Regulatory Oversight
We are subject to regulation by the SEC and the CFTC and market participants may be subject to regulation by the SEC, the CFTC, the Board of Governors of the Federal Reserve, the U.S. Department of the Treasury and/or foreign regulators. Laws and regulations regarding our business and the business of market participants are frequently modified or changed. See "Regulatory Environment and Compliance" for more information on significant areas of regulation of us. As the number of legislative actions have increased, such as the implementation of Basel III, Dodd-Frank and the Collins Amendment to Dodd-Frank, some market participants have adjusted their businesses.
Competitive Strengths
We have established ourselves as a global leader and innovator in the options industry. We believe we are well positioned to further enhance our leadership position through several key competitive strengths:
|
•
|
Innovative Products and Services.
We have worked closely and collaboratively with market participants to introduce new products and services to meet the evolving needs of the derivatives industry, and plan to continue these efforts. Products we have developed include index options, options and futures on the VIX Index and other volatility indexes, short duration options, including Weeklys, FLexible EXchange Options ("FLEX options") and options strategy benchmark indexes.
|
6
We also connect with a growing customer base through trading and educational resources, including the world-renowned CBOE Options Institute, and we recently became the first U.S. options exchange to trade options during non-U.S. trading hours.
|
•
|
Strategic Relationships and Partnerships.
We have entered into licensing agreements with index providers under which we have rights to create volatility indexes and offer options and futures products on their indexes. We have also formed partnerships with key providers to develop new products and services. See "Strategic Relationships" and "Strategic Partnerships."
|
|
•
|
Leading Brand, Reputation and Market Position.
CBOE, the largest U.S. options exchange, based on both contract volume and notional value, and one of the largest options exchanges in the world, is an options market leader. As the creator of listed options and other significant products in the listed options industry, including the VIX Index and VIX futures and options, CBOE is a leading brand name in the options and volatility space.
|
Growth Strategy
We believe that the listed options and futures industry, especially with respect to volatility trading, has significant growth potential, including through new participants and products. Our mission is to be the leader in providing innovative products that facilitate and enhance trading in a global marketplace. We expect to further expand our business and increase our revenues and profitability by pursuing the following growth strategies:
|
•
|
Expand Customer Base.
We intend to continue our efforts to expand the use of our products domestically and internationally, by intensifying our business development efforts to target new retail investors and institutional investors, including pensions and endowments, and to inform them about how to trade our products, especially our proprietary products. We also intend to continue to offer investor education and wide educational resources for both retail and institutional customers through the CBOE Options Institute and through our comprehensive website, including through the annual CBOE Risk Management Conferences, now held in the U.S., Europe and Asia. Further, offering extended trading hours in our exclusive products is at the core of our international expansion effort. In addition to extended trading hours for VIX futures and SPX and VIX options, in 2016 we began overnight dissemination of values for the VIX Index. We opened an office in London and engaged a full-time consultant in Hong Kong in 2016 to further support our expanding international business development efforts.
|
|
•
|
Develop Innovative Products that Leverage and Complement Core Products.
We intend to license and create proprietary intellectual property to develop proprietary products that meet the needs of the derivatives industry, through both strategic relationships and internally developed products, while continuing to diversify our product line across asset classes. In 2016, we continued to leverage partnerships with index providers to extend our product offering with products such as SPX Weeklys with Monday and Wednesday expirations and Flex Options with Asian and Cliquet style settlements. In addition, we launched new products on certain Frank Russell Company and FTSE International Limited (together, "FTSE Russell") indexes that are solely listed for trading on CBOE in the U.S.
|
|
•
|
Offer Compelling Economic Model.
We have designed our fee schedule to provide benefits to market participants that concentrate their overall trading activity on CBOE, which we believe encourages market participants to increase their business with us. In our proprietary products, we offer discounts and incentives to certain participants based on relative volume and the use of selected strategies. In multiply-listed products, we offer incentive programs to attract customer order flow to help our market participants manage both the fixed and transaction-based costs of trading on CBOE. We regularly review the fee schedules for all of our exchanges to provide an industry-leading economic offering.
|
|
•
|
Continue to Enhance Our Trading Systems.
We recognize that the opportunity to participate in the growth of the derivatives market will be driven in great part by the trading functionality and systems capabilities that an exchange offers to market participants. We intend to use our strong in-house development capabilities and continued investment to further enhance and develop the functionality and capacity of our trading systems. In 2015, we began in-house custom development of our next generation of trading technology, CBOE Vector, a new platform designed with the end-user in mind, using the latest hardware and software technology in order to provide enhanced agility, speed, connectivity and risk controls. However, the launch of CBOE Vector on CFE is suspended due to the pending Merger.
|
|
•
|
Evaluate Strategic Opportunities that Leverage and Complement Core Business.
We evaluate strategic opportunities that we believe will enhance stockholder value. We specifically look for strategic opportunities beyond our current businesses that will capitalize on our core competencies and diversify our sources of revenue. We continue to form new alliances with various partners that leverage our strengths and enable us to diversify our
|
7
product and business lines across new regions and asset classes. In 2016, we made a majority investment in CBOE Vest, an investment manager focused on Target Outcome Investment strategies, and made a minority equity investment in Eris Exchange Holdings, LLC (“Eris”), a U.S. - based futures exchange group offering swap futures as a capital-efficient alternative to over-the-counter swaps.
In addition, we believe the recently announced Merger squarely fits into our growth strategy outlined above to develop unique products, expand our customer base and leverage alliances that complement our core business. Specifically, we believe that the Merger has the potential to significantly expand and diversify our product line across new asset classes, such as U.S. and European equities, ETF trading and global Foreign Currencies ("FX") products, broaden our reach with Bats’ market-leading European presence and increase our non-transactional revenue stream, while enabling us to streamline the combined company’s technology and enhance our strong growth and margin profile.
Products
Our exchanges provide a marketplace for the trading of options and futures contracts that meet criteria established in the rules of the respective exchange. The options contracts listed for trading include options on indexes, equities and ETPs. In addition, we provide a marketplace for trading futures contracts through CFE.
Types of Products
|
•
|
Index Options.
We offer trading in options on several different broad-based market indexes, including the VIX Index, a proprietary index that we developed and that has become a widely recognized measure of equity market volatility. The index options we list include some of the most widely recognized measures of the U.S. equities market, as discussed below.
|
|
•
|
Equity Options.
We offer trading in options on the stocks of over 3,100 corporations. The stocks underlying our individual equity options are listed on equity stock exchanges.
|
|
•
|
Options on ETPs.
We offer trading in options on over 600 ETFs and ETNs based on various domestic and foreign market indexes, as well as on volatility, commodities, currencies and fixed income instruments.
|
|
•
|
Futures.
We provide a marketplace for trading four futures products through CFE. CFE has focused on the trading of futures using the CBOE-created VIX methodology, but also provides trading in S&P 500 Variance futures.
|
Increased Flexibility
Over the past few years, we have expanded our offerings, and experienced increases in our existing offerings, that allow for customers to trade options on a number of different time horizons, allowing them to pinpoint their preferred timing. In addition to standard option terms, we also offer options with weekly, end of month and end of quarter expirations. Our Weeklys product in particular has seen rapid growth, especially in SPX, and in 2016 we added Monday and Wednesday expiring SPX Weeklys. We believe that the flexibility provided by these offerings allows us to meet the differing needs of our customers and increase trading volume.
Proprietary Products
The Company has developed several of its own proprietary indexes and index methodologies. These include volatility indexes based on various broad-based market indexes (such as the S&P 500, the S&P 100, the Russell 2000 and the DJIA), volatility indexes based on ETFs and individual stocks, the CBOE S&P 500 Implied Correlation Index, the CBOE S&P 500 Smile Index and a series of options strategy benchmarks, including BuyWrite, PutWrite and Collar indexes based on the S&P 500, Russell 2000 and BuyWrite indexes based on other broad-based market indexes. In addition to any transaction fee revenue generated on products created based on these indexes, we have licensed others to use some of these indexes to create products and have entered into agreements whereby we have granted others the rights to sub-license certain indexes. The Company generates revenue from both the calculation and dissemination of index values and from the licensing of our proprietary indexes.
These proprietary products are built both through our in-house research and development staff and our strategic relationships and license agreements with index providers. The following is a discussion of our strategic relationships and additional detail on our most frequently traded products, including SPX options and VIX options and futures.
Strategic Relationships
The Company has long-term business relationships with several providers of market indexes. We license their indexes as the basis for indexes, index options and other products. In some instances, these licenses provide us with the exclusive right to list certain products based on these indexes. Of particular note are the following:
8
|
•
|
S&P 500 and S&P 100 Indexes.
We have the exclusive right to offer options contracts on the S&P 500 Index and the S&P 100 Index as a result of a licensing arrangement with S&P OPCO LLC ("S&P"). Our license with S&P is through December 31, 2033, with an exclusive license to trade options on the S&P 500 Index through December 31, 2032. We are also authorized to use the S&P 500 Index and S&P 100 Index for the creation of CBOE volatility indexes, such as the VIX Index, and tradable products on those volatility indexes.
|
|
•
|
FTSE Russell Indexes.
Under our license agreement with FTSE Russell, CBOE has the exclusive right in the U.S. to offer options on more than two dozen FTSE Russell indexes, including the Russell 2000, FTSE GEIS (Global Equity Index Series), FTSE China 50, the Russell 1000, the Russell 1000 Value and the Russell 1000 Growth Indexes. We offer options on the Russell 2000 Index, Russell 1000, Russell 1000 Value and Russell 1000 Growth Indexes and in 2016 we launched trading options on the FTSE 100, FTSE China 50 and FTSE Emerging Indexes.
|
|
•
|
MSCI.
We have the exclusive right in the U.S. to offer options on six of MSCI's indexes, including the MSCI EAFE and the MSCI Emerging Markets Indexes, as a result of a licensing arrangement with MSCI Inc. We offer options on the MSCI EAFE and the MSCI Emerging Markets Indexes and in 2016 we broadened distribution of data on these indexes through CBOE’s Market Data Express, LLC ("MDX") service.
|
|
•
|
Dow Jones Industrial Average ("DJIA").
We have the exclusive right during standard U.S. trading hours to offer options contracts on the DJIA and certain other Dow Jones indexes through December 31, 2017 as a result of a licensing arrangement with S&P Dow Jones Indices, LLC. We are also authorized to use these indexes to create CBOE volatility indexes and trade options, futures and other products on these indexes.
|
SPX Options
The S&P 500 Index is an index comprised of 500 large-cap U.S. listed companies. It is one of the most commonly followed indexes, and is considered a bellwether for the U. S. economy. The options we offer on the S&P 500 Index are exclusive to CBOE and contribute substantially to our volumes and transaction fees. Because of its status as a bellwether, SPX is traded in a number of different trading strategies by customers with different goals, including pension funds hedging their equity exposure by buying put options, asset managers seeking enhanced returns by selling covered call options and hedge funds using risk-managed strategies to capture so-called “risk premia” embedded in option prices.
Over the past six years we have seen a significant increase in the number of SPX Weeklys contracts traded, one of our fastest growing products. As a percentage of total SPX contracts traded, the percentage of SPX Weeklys has increased from
2.2%
in 2010 to
37.8%
in 2016. We believe that traders are using this product to fine tune the timing of hedging strategies and maximize the risk premium in strategies that involve the sale of options, such as covered call writing.
Volatility Trading
CBOE pioneered the volatility trading space, with its introduction of the CBOE Volatility Index (the "VIX Index") in 1993. We introduced futures on the VIX Index in 2004 and options in 2006. The VIX Index is based on real-time prices of options on the S&P 500 Index and is designed to reflect investors' consensus view of future 30-day expected stock market volatility. Since we started offering these products, we have seen trading from a number of different customer segments utilizing a number of different trading strategies, including hedging extreme stock market declines, also known as “tail risk” hedging, and risk-managed strategies that seek to capture the relative price changes of expected volatility at different times in the future. We also offer VIX Weeklys options and futures to provide investors with opportunities and tools to trade volatility over a shorter-term.
While the trading volumes in options and futures on the VIX Index have increased over the past five years, trading volumes in these products are especially sensitive to market volatility, with increases in volume generally occurring along with spikes in volatility. While we believe that there will be continued intrinsic growth in our volatility products, significant changes in the levels of market volatility may significantly impact volumes in these products.
In addition to the VIX Index, we offer other products based on the VIX methodology, including futures on CBOE Russell 2000 Volatility Index and the CBOE/CBOT 10-year U.S. Treasury Note Volatility Index. CFE also lists futures on realized variance. While volumes in our non-VIX futures volatility products are not material to us, we continue to explore opportunities to expand our volatility product offerings, with respect to both new indexes and new asset classes.
FTSE Russell
The London Stock Exchange Group's ("LSEG") leading global index franchises, FTSE Russell indexes, represent a diverse group of domestic and global equities with international appeal: the Russell indexes include widely followed
9
benchmarks of U.S.-based stocks while the FTSE indexes focus primarily on global and emerging markets equity benchmarks that are widely used in the U.S. market. FTSE Russell indexes are among the largest and most widely used by investors in the U.S., and U.S. ETFs tracking FTSE Russell indexes comprise some of the most actively traded globally.
The options we offer on the FTSE Russell indexes, currently include the Russell 2000, Russell 1000, Russell 1000 Value, Russell 1000 Growth, FTSE Emerging, FTSE 100 and FTSE China 50 Indexes, and are exclusive to us. In 2016 we launched options on the FTSE Emerging, FTSE 100 and FTSE China 50 Indexes, enabling investors to target emerging U.K. and Chinese equity markets, respectively.
Strategic Partnerships
The Company also acquires interests in and forms partnerships with key providers to develop new products and services that are expected to capitalize on our core competencies and diversify our sources of revenue. Of particular note are the following:
|
•
|
CBOE Vest.
In 2016, we made a majority investment in CBOE Vest, an investment manager focused on Target Outcome Investment strategies. CBOE Vest launched in 2016 three new mutual funds, CBOE Vest S&P 500 Buffer Protect Strategy Fund, CBOE Vest Defined Distribution Strategy Fund and CBOE Vest S&P 500 Enhanced Growth Strategy Fund.
|
|
•
|
American Financial Exchange.
Environmental Financial Products, LLC and CBOE launched in 2015 the American Financial Exchange ("AFX"), an electronic marketplace for small and mid-sized banks to lend and borrow short-term funds. CBOE operates the web-accessible, electronic trade matching engine and also supports surveillance and membership services. In 2016, AFX launched a 30-day unsecured loan product and a new transaction-based interest rate benchmark, Ameribor.
|
|
•
|
Eris.
In 2016, we made a minority equity investment in Eris, a U.S.-based futures exchange group offering swap futures as a capital-efficient alternative to over-the-counter ("OTC") swaps. CBOE and Eris plan to develop new product solutions and indexes across asset classes that are expected to address the impact of international regulatory reforms, including Basel III, European swap clearing and trading mandates, and margin for un-cleared swaps. The companies also plan to collaborate to enhance distribution of Eris Interest Rate Swap Futures and related market data.
|
|
•
|
Curve Global.
We have a minority investment in CurveGlobal, a new interest rate derivatives venture of the LSEG and a number of major dealer banks. CurveGlobal, launched in 2016, offers trading in Short Term Interest Rate futures in Euribor and Short Sterling and Long Term Interest Rate futures in Bund, Bobl, Schatz and Gilts. The launch of CurveGlobal caters to banks and other market participants looking for more capital efficient ways to trade and hedge these products.
|
|
•
|
Social Market Analytics.
We entered into an exclusive licensing agreement in 2016 with Social Market Analytics (“SMA”) to develop a series of sentiment-based strategy benchmark indexes. We launched in August 2016, the CBOE-SMA Large Cap Index, a sentiment-based strategy benchmark index that measures short-term market momentum based on SMA’s social media metrics.
|
Options Exchanges' Market Participants
As discussed in more detail below, our options exchanges are designed to provide reliable, orderly, liquid and efficient marketplaces for the trading of options by market participants. Our options exchanges operate quote-driven auction markets that involve a number of different market participants.
Trading Permit Holders
Purchasing a monthly trading permit for the respective exchange conveys "Trading Permit Holder" status on that exchange to the permit holder.
A Trading Permit Holder on one of our options exchanges is allowed to enter orders, and quotes if it is a market-maker, into the trading system for that exchange. Trading Permit Holder entities can execute trades for their own accounts, for clearing firm accounts, for the accounts of other permit holders or for the accounts of customers.
Applicants for Trading Permit Holder Status
10
Applicants for Trading Permit Holder status must have adequate financial resources and credit to assume the responsibilities and privileges of a Trading Permit Holder. All Trading Permit Holders must abide by the rules and regulations of the applicable exchange, the provisions of the Securities Exchange Act of 1934 (the "Exchange Act") and the rules and regulations issued by the SEC.
Trading Permits and Participant Roles
The following types of trading permits entitle the holders to conduct business on the exchanges during the regular trading hours session in the applicable participant roles described below:
|
•
|
Market-Maker Trading Permit.
A market-maker trading permit entitles the holder to act as a market-maker who engages in trading our products either for its own account or for the account of his or her firm, but does not act as an agent representing orders for customers. Market-makers have quoting obligations in their appointed product classes. They are granted margin relief and must have a relationship with a clearing firm that will hold and guarantee their positions. The majority of trading permits in use on CBOE and C2 are used for market-making. There are additional classes of market-makers, namely Lead Market-Maker ("LMM") and Designated Primary Market-Maker ("DPM") that receive incentives for market-makers to provide competitive quotes. In addition, TPHs routing orders to CBOE may designate a Preferred Market-Maker.
|
|
•
|
Floor Broker Trading Permit.
A floor broker trading permit entitles the holder, known as a floor broker, to act as an individual who represents orders on the CBOE trading floor as an agent. Floor brokers generally do not trade for their own account, although they may represent their firms' proprietary account.
|
|
•
|
Electronic Access Permit ("EAP").
An EAP is a trading permit used by TPHs that need a separate access permit for a specific business function and is the most general type of access permit. EAP holders may be registered for one of the following: clearing TPHs; TPHs approved to transact business with the public; proprietary TPHs; and order service firms.
|
In addition, separate extended trading hours permits, market-maker trading permits and EAPs, generally entitle the holders to conduct business on CBOE during the extended trading hours session.
CFE Market Participants
Parties are required to apply and be approved as CFE TPHs and obtain a CFE trading permit in order to have trading privileges on CFE. TPHs on CFE are allowed to enter orders into CFE's trading system and can execute trades for their own accounts or for the accounts of customers.
Under its rules, CFE has the authority to establish market-maker programs and appoint one or more DPMs, LMMs or market-makers. CFE does not currently have a DPM, LMM or market-maker program in VIX futures with standard monthly expirations. CFE does have a DPM or LMM program for VIX futures with weekly expirations and CFE's other products.
Market Model
Algorithms
The matching algorithms used on our exchanges are the means by which trades are allocated to market participants. Our technology and the rules of our exchanges provide for a variety of different algorithms for matching buyers and sellers. We have the ability to apply different matching algorithms to different products in order to meet the needs of particular market segments. The setting of the matching algorithm affects the share of each trade that a market participant receives and is central to the opportunity and profit potential of market participants.
|
•
|
CBOE utilizes various matching algorithms in different listed options classes, with different combinations of customer priority, participation rights and pro-rata, modified pro-rata or price-time depending on the product.
|
|
•
|
C2's matching algorithm is pro-rata for all options classes.
|
|
•
|
CFE utilizes either a price-time priority algorithm or a price-time priority algorithm with participation rights for all futures.
|
Details on our technological capabilities, as well as key systems offerings available to customers, are described in "Technology."
Pricing
11
Each of our exchanges establishes a fee schedule that, among other things, sets the transaction fee for buying or selling options or futures contracts on the exchange and the connectivity and access fees for participating as a TPH on the exchange. In our proprietary products, we assess transaction fees on all participants, with the amount of the fee based on the market participant's role and the origin of the underlying order, and subject to discounts based on relative volume or trading strategies. In multiply-listed products, CBOE utilizes a pricing model in which transaction fees are charged to most professionals, including market-makers, but are not charged for most customer orders. Additionally, CBOE offers incentive programs to attract customer order flow, including certain payments for order flow and our volume incentive program ("VIP"), which pays credits to permit holders for executing certain types and levels of qualifying customer business at the exchange.
CFE utilizes a pricing model in which transaction fees vary depending on the type of market participant on whose behalf a trade is made and on whether the trade is executed through CFE’s central limit order book, or is a block trade. CFE also offers Day Trade and New Foreign Trader Incentive Programs that provide rebates on trades that qualify for the respective programs.
Each of the exchanges also currently charges a fee for trading permits that allow access to our exchanges. CBOE has a sliding scale for all market-maker trading permits used by affiliated TPHs and TPH organizations that satisfy certain requirements in our multiply-listed options classes.
Competition
CBOE is the single largest options exchange in the U.S. based on both total contract volume and notional value of contracts traded. The market share for all options traded on U.S. exchanges over the past five years for CBOE and C2, combined, has ranged from
27.1%
to
29.9%
annually. For
2016
, our market share was
27.7%
.
In our proprietary products, we compete against futures exchanges and swap execution facilities that offer similar products, as well as against financial market participants that offer similar over-the-counter derivatives. We also compete against certain multiply-listed options products, such as options on SPY, which offer some of the market exposure of our proprietary products such as options on SPX.
The multiply-listed options industry is extremely competitive and the competition has intensified. We expect this trend to continue. We compete with a number of entities on several different fronts, including the price, quality and speed of our trade execution, the functionality and ease of use of our trading platform, the range of our products and services, our technological innovation and adaption and our reputation. We compete in various ways with the thirteen other U.S. options exchanges.
The options exchanges frequently introduce new pricing models in order to attract additional trades to their exchanges. These pricing models include traditional pricing, maker-taker, and ownership benefits. See "Trends - Price Competition."
Our competitive challenge is to persuade broker-dealers to route options orders to our exchanges rather than to our competitors and to convince liquidity providers to concentrate their market-making activity on our exchanges. This is particularly true with respect to options on equities and ETPs. We compete through a variety of methods, including:
|
•
|
Offering a fee schedule that both attracts order flow and provides incentives to liquidity providers;
|
|
•
|
Providing advanced technology that offers broad functionality, low latency, fast execution, ease of use, scalability, reliability and security;
|
|
•
|
Offering participants access to a broad array of products and services, including proprietary products;
|
|
•
|
Offering market participants an efficient, transparent and liquid marketplace for trading options using our electronic trading system, CBOE Command, in either a hybrid (CBOE) or fully electronic (C2, CFE) market model;
|
|
•
|
Offering customers a deep, liquid market with opportunities for price improvement;
|
|
•
|
Facilitating payment for order flow through the administration of marketing fees;
|
|
•
|
Offering market participants potential participation rights for order flow that they direct or cause to be directed to our exchanges;
|
|
•
|
Maintaining close relationships and open communication channels with market participants; and
|
|
•
|
Providing brokers and their customers with a comprehensive source of information on options as well as extensive options education.
|
12
Technology
CBOE Command
CBOE Command, our in-house developed Java application with an infrastructure designed for high performance and low latency, supports trading on all of our exchanges. The platform supports trading nearly 24 hours, 5 days a week on CFE and supports an early morning trading session for SPX and VIX options on CBOE. The technology supports different products, different market models and multiple matching algorithms, as well as a fully integrated complex order book and several auction mechanisms. As mentioned above, CBOE is a hybrid exchange, combining features of screen-based and floor-based trading, while C2 and CFE are fully electronic.
CBOE Command supports both a quote-driven options market model where liquidity providers have quoting obligations and an order-driven market model for our futures exchange. CBOE and C2 market-makers, DPMs and LMMs typically stream hundreds of millions of quotes into CBOE Command each day. CBOE Command provides a number of risk controls geared towards both customers using our markets as well as liquidity providers quoting large numbers of options.
CBOE Command allows for a quick introduction of different types of derivative and securities products, including options, futures, options on futures and stock products. CBOE also offers CFLEX, our hybrid platform for trading FLEX options built on the CBOE Command platform.
CBOE Vector
In 2015, we began in-house custom development of CBOE Vector, our next generation of trading technology. This new platform is designed to provide streamlined access to a comprehensive array of options and volatility products and to the deeply liquid markets in which they trade.
The advanced architecture of the platform was designed to deliver best-in-class functionality, low latency, ease of use, improved connectivity and trading efficiency. The platform is engineered to provide greatly increased transaction speeds while handling constantly increasing message traffic and industry demand for additional functionality, such as risk controls. However, the launch of CBOE Vector on CFE is suspended due to the pending Merger.
Hybrid Trading Model
All CBOE products trade with an electronic and open-outcry component where both are integrated to function as a single market. Our Hybrid trading model is supported by state-of-the-art technology, including the CBOE Command trading platform. For our a.m.-settled SPX options, certain of the electronic trading features are differently configured to better suit the needs of customers in those products.
In general, CBOE market-makers stream their own individual quotes into the CBOE trading engine and, if on the floor, engage in open outcry transactions in their trading crowd. Our Hybrid trading model allows CBOE to offer the best of both electronic and open outcry trading models.
Market Data
Market data is sent to the Options Price Reporting Authority ("OPRA") and CBOE Streaming Markets ("CSM"), described below. Our exchanges generate valuable information regarding the prices of our products and the trading activity in our exchanges. For options, market data relating to price and size of market quotations and the price and size of trades is collected and consolidated by OPRA. OPRA disseminates the information for a fee to vendors who redistribute the data to brokers, investors and other persons or entities that use our markets or that monitor general market conditions. After costs are deducted, the fees collected are distributed among OPRA's exchange participants based on their cleared transactions pursuant to the OPRA Plan. As of December
2016
, our market data was available on approximately 137,000 terminals worldwide. See "Regulatory Environment and Compliance" for further information on OPRA.
Our subsidiary, MDX sells historical options data and real-time data index values. It also provides market data and market depth through CSM, a proprietary streaming data feed. In January 2017, MDX historical data subscriptions were transitioned to the CBOE Livevol Data Shop.
CBOE Livevol
In 2015, we acquired Livevol, Inc., which we subsequently renamed CBOE Livevol, Inc. ("CBOE Livevol"). CBOE Livevol provides equity and index options technology for professional and retail traders, which includes options strategy backtesting, trade analysis and volatility modeling technologies and historical data.
13
Disaster Recovery
We operate and maintain geographically diverse disaster recovery facilities for CBOE, C2 and CFE. We expect that the disaster recovery facilities can be up and running in a short period and work with our market participants to ensure that the marketplace can be quickly reopened. We continue to work to improve both the availability of our systems and our disaster recovery facilities, including through simulation testing.
Clearing System
The Options Clearing Corporation ("OCC") acts as the issuer, counterparty and guarantor for all options contracts traded on our options exchanges and other U.S. options exchanges. OCC fulfills these same functions for futures products traded on CFE. Upon execution of an options or futures trade, we transmit to OCC a record of all trading activity for clearing and settlement purposes.
Regulatory Environment and Compliance
The following discussion covers the more significant areas of regulation of us by the SEC and the CFTC.
Recent Developments
Laws and regulations regarding our business are frequently modified or changed, including in response to adverse financial conditions, to address perceived problems, new products, competition or at the request of market participants. The following is a summary of certain recent regulatory developments that may impact our business.
CFTC Core Principles
Dodd-Frank amended the core principles with which designated contract markets ("DCMs") like CFE must comply under the Commodity Exchange Act. As a result, CFE implemented a number of new rules, policies and procedures in relation to the new requirements. However, one aspect with respect to the amended core principles applicable to DCMs that remains pending relates to amended Core Principle 9. Core Principle 9 requires each DCM to provide a competitive, open and efficient market and mechanism for executing transactions that protects the price discovery process of trading in the DCM’s centralized market. CFTC regulations to implement Core Principle 9 remain pending and may address the extent to which a DCM may permit block trades and exchanges of derivatives for related positions in its products to occur through the DCM outside of the DCM’s centralized market. CFE cannot predict or estimate the extent to which these regulations may affect CFE or its operations.
Automated Trading
In November 2015, the CFTC issued a rulemaking proposal relating to automated trading on DCMs referred to as Regulation Automated Trading ("Regulation AT"). In November 2016, the CFTC issued a supplemental rulemaking proposal which included modifications to the original proposal. The rulemaking proposal proposes risk control and other requirements for (a) certain market participants that are defined as “AT Persons,” (b) executing futures commission merchants ("FCMs") and (c) DCMs.
Regulation AT is intended to reduce potential risks arising from electronic trading activity by requiring the implementation of risk controls such as maximum order message and maximum order size parameters, and the establishment of standards for the development, testing and monitoring of automated trading systems, among other requirements. Automated Trading Persons ("AT Persons") and executing FCMs would be required to submit annual certifications to DCMs attesting to their compliance with Regulation AT, and DCMs would be required to establish programs for the periodic review and evaluation of compliance with Regulation AT by AT Persons and executing FCMs. Regulation AT also proposes to require the registration of proprietary traders with direct electronic access to a DCM that have average daily trading volume of 20,000 contracts across all products and DCMs over a 6 month period and to require that these AT Persons become members of a registered futures association. In addition, Regulation AT is intended to foster transparency around DCM market-maker and trading incentive programs.
Although CFE may require additional resources to comply with the proposal if it were to be adopted by the CFTC, CFE does not expect that the proposal will have a material impact on CFE or its operations.
Systems Safeguards
In September 2016, the CFTC issued a final rule to amend its system safeguards rules for DCMs by enhancing and clarifying existing provisions relating to system safeguards, risk analysis and oversight, and cybersecurity testing, and adding new provisions concerning certain aspects of cybersecurity testing. The rule clarified the existing system safeguards rules for DCMs by specifying and defining the types of cybersecurity testing required to fulfill system safeguards testing obligations,
14
including vulnerability testing, penetration testing, controls testing, security incident response plan testing, and enterprise technology risk assessment. The rule also clarified the categories of risk analysis and oversight that statutorily-required programs of system safeguards-related risk analysis and oversight must address; system safeguards-related books and records obligations; the scope of system safeguards testing; internal reporting and review of testing results; and remediation of vulnerabilities and deficiencies. The provisions of the final rule have various compliance dates, most of which are one year from September 19, 2016, the effective date of the rule. Although CFE may require additional resources to comply with the final rule, CFE does not expect the rule to result in significant changes to its operations.
Compliance
Securities Industry-CBOE and C2
Federal securities laws have established a two-tiered system for the regulation of securities exchanges and market participants. The first tier consists of the SEC, which has primary responsibility for enforcing federal securities laws. The second tier consists of self-regulatory organizations ("SROs"), which are non-governmental entities that must register with and are regulated by the SEC. CBOE and C2 are SROs, each registered under Section 6 of the Exchange Act as a "national securities exchange" and are subject to oversight by the SEC.
SROs are an essential component of the regulatory scheme of the Exchange Act for providing fair and orderly markets and protecting investors. To be registered as a national securities exchange, an exchange must successfully undergo an application and review process with the SEC prior to beginning operations. Among other things, the SEC must determine that the SRO has the ability to comply with the Exchange Act and to enforce compliance by its members and persons associated with its members with the provisions of the Exchange Act, the rules and regulations thereunder and the rules of the exchange.
In general, an exchange SRO is responsible for operating its trading platforms consistent with its rules, and regulating its members, known as TPHs at CBOE and C2, through the adoption and enforcement of rules governing the business conduct of its members. The rules of the exchange must also assure fair representation of its members in the selection of its directors and administration of its affairs and, among other things, provide that one or more directors be representative of issuers or investors and not be associated with a member of the exchange or with a broker or dealer. Additionally, the rules of the exchange must be adequate to ensure fair dealing and to protect investors and may not impose any burden on competition not necessary or appropriate in furtherance of the purposes of the Exchange Act.
As registered national securities exchanges, virtually all facets of our CBOE and C2 exchange operations are subject to the SEC's oversight, as prescribed by the Exchange Act. The Exchange Act and the rules thereunder impose on us many regulatory and operational responsibilities, including the day-to-day responsibilities for market operations and broker-dealer oversight. Furthermore, as SROs, CBOE and C2 are potentially subject to regulatory or legal action by the SEC or other interested parties. The SEC also has broad enforcement powers to censure, fine, issue cease-and-desist orders, prohibit us from engaging in some of our businesses, suspend or revoke our designation as a registered securities exchange or to remove or censure any of our officers or directors who violate applicable laws or regulations.
As part of its regulatory oversight, the SEC conducts periodic reviews and inspections of exchanges, and CBOE and C2 have been subject to such routine reviews and inspections. To the extent such reviews and inspections result in regulatory or other changes, we may be required to modify the manner in which we conduct our business, which may adversely affect our business. We collect certain fees derived from our regulatory function and fines in connection with our disciplinary proceedings. Under the rules of each of our options exchanges, as required by the SEC, any revenue derived from the regulatory fees and fines cannot be used for non-regulatory purposes.
CBOE and C2 are also subject to the record keeping requirements of Section 17 of the Exchange Act, including the requirement pursuant to Section 17(b) of the Exchange Act to make certain records available to the SEC for examination.
Section 19 of the Exchange Act also provides that we must submit to the SEC proposed changes to any of CBOE's or C2's rules, including revisions of their certificates of incorporation and bylaws. The SEC will typically publish the proposal for public comment, following which the SEC may approve or disapprove the proposal, as it deems appropriate. The SEC's action is designed to ensure that CBOE's and C2's rules and procedures are consistent with the Exchange Act and the rules and regulations under the Exchange Act. Certain categories of rule changes, like fee changes, can be effective on filing, but the SEC retains the ability to suspend or reject such filings within a prescribed period of time.
In November 2015, the compliance date for Regulation Systems Compliance and Integrity (“Reg SCI”), SEC began rulemaking under the Exchange Act . Reg SCI requires “SCI Entities,” which includes SROs, like CBOE and C2, to comply with security and capacity requirements with respect to their systems and accompanying compliance procedures. As part of complying with Reg SCI, CBOE and C2 established written policies and procedures reasonably designed to provide for a resilient market in the event of a disruption. This includes, for example, each exchange ensuring that it has adequate disaster
15
recovery facilities that are geographically diverse from the exchange’s systems and that facilitate the ability to resume trading within specified timeframes when certain critical and non-critical SCI systems are rendered inoperable. It also requires timely and substantial notification to be made to the SEC in the event an exchange experiences certain system interruptions or interference. The SEC has also established various working groups of exchanges to focus on improving market resiliency, including regarding regulatory halts, trade nullification and additional market protections. As adopted, Reg SCI and the other SEC mandated working group initiatives are very complex, and, as such, compliance with rules may require significant resources.
Consent Order
On June 11, 2013, CBOE and C2 entered into a Consent Order with the SEC, under which CBOE and C2 were censured, ordered to cease and desist from violating certain sections of the Exchange Act, paid a fine of $6 million and agreed to complete certain undertakings. These undertakings included conducting a review of our regulatory programs, enterprise risk management and business influences on regulation, reviewing business practices to ensure compliance with the rules of the exchanges and implementing training programs for employees. We have certified to the completion of these undertakings. The Consent Order also requires on-going certifications by the Company's Chief Executive Officer and Chief Regulatory Officer until 2019.
CBOE Holdings
Certain aspects of CBOE Holdings are also subject to SEC oversight, including certain ownership and voting restrictions on its stockholders. The focus of the SEC's regulation of CBOE Holdings is to assure fair representation of Trading Permit Holders in the selection of CBOE and C2 directors, public participation in the governance of CBOE and C2 and that CBOE and C2 can satisfy their regulatory responsibilities under the Exchange Act. Furthermore, the SEC requires that CBOE Holdings give due regard to the preservation of the independence of the self-regulatory function of CBOE and C2 and to CBOE Holdings' obligations to investors and the general public. The SEC also requires that CBOE Holdings not take any actions that would interfere with the effectuation of any decisions by the board of directors of CBOE or C2 relating to their regulatory functions or the structure of the market that it regulates or that would interfere with the ability of the exchanges to carry out their responsibilities under the Exchange Act. To the extent that CBOE Holdings' business activities involve or relate to CBOE and C2, the officers and directors of CBOE Holdings may be deemed to be officers and directors of the exchanges for purposes of and subject to oversight under the federal securities laws. Accordingly, the SEC may exercise direct supervision and disciplinary authority over certain CBOE Holdings' activities and those activities may be subject to SEC approval and, in some cases, public notice and comment.
Futures Industry-CFE
The operations of CFE are subject to regulation by the CFTC under the Commodity Exchange Act. The Commodity Exchange Act generally requires that futures trading in the U.S. be conducted on a commodity exchange designated as a contract market by the CFTC under the Act. The Commodity Exchange Act and CFTC regulations establish criteria for an exchange to be designated as a contract market on which futures and futures options contracts may be traded. Designation as a contract market for the trading of a specified futures contract is non-exclusive. This means that the CFTC may designate additional exchanges as contract markets for trading the same or similar contracts.
CFE is a designated contract market that is subject to the oversight of the CFTC and to a variety of ongoing regulatory and reporting responsibilities under the Commodity Exchange Act. As a designated contract market, CFE is required to comply with the applicable core principles and regulations under the Commodity Exchange Act. CFE has surveillance and regulatory operations and procedures to monitor and enforce compliance by Trading Privilege Holders with CFE rules. If CFE fails to comply with applicable laws, rules or regulations, CFE may be subject to censure, fines, cease-and-desist orders, suspension of its business, removal of personnel or other sanctions, including revocation of CFE’s designation as a contract market.
Regulatory Responsibilities
Our exchanges are responsible for assessing the compliance of their TPHs with the respective exchange's rules and the applicable rules of the SEC and CFTC. The main activities that the exchanges, as applicable, are required to provide to measure compliance with these rules include:
|
•
|
surveillance designed to detect violations of exchange trading rules;
|
|
•
|
surveillance designed to detect violations of other SEC and CFTC rules;
|
|
•
|
the further investigation of matters deemed to be problematic;
|
|
•
|
the investigation of complaints about possible rule violations brought by customers, TPHs or other SROs; and
|
16
|
•
|
the examination of TPHs for compliance with rules such as those related to net capital, books and records, market access and other matters related to the TPHs' exchange business functions.
|
In order to ensure market integrity, we regulate and monitor our TPHs' trading activities by using both our employees and third parties under regulatory services agreements. See "Regulatory Agreements" below. Providing effective regulation is important for attracting and retaining the confidence and participation of market-makers, broker-dealers and institutional and retail investors.
We expend considerable time, financial resources and effort to ensure that the exchanges' rules and regulations conform to regulatory best practices within the securities and futures exchange industries and within the regulatory regime overseen by the SEC and CFTC, our primary regulators. In order to support our efforts and those of our market participants to comply with applicable law and our exchange rules, we developed a regulatory program to monitor market activity on our exchanges and entered into the regulatory services agreements described below.
CBOE, C2 and CFE are participants in the Intermarket Surveillance Group ("ISG"). ISG is an international information-sharing cooperative governed by a written agreement that provides for a comprehensive surveillance sharing arrangement. In addition to the agreement for confidential information sharing, the ISG provides a framework for the coordination of regulatory efforts among exchanges trading securities, commodity futures and related products to address potential intermarket manipulations and trading abuses.
As part of the self-regulatory process, formal disciplinary matters are reviewed by our Business Conduct Committee, which includes both market participants and public representatives.
We collect certain fees derived from our regulatory function and fines in connection with our disciplinary proceedings. Under the rules of each of CBOE and C2, as required by the SEC, any revenue derived from the regulatory fees and fines cannot be used for non-regulatory purposes.
Regulatory Agreements
CBOE, C2 and CFE have entered into agreements, some of which are pursuant to Section 17(d) of the Exchange Act, under which third parties have agreed to perform regulatory services to our markets. As discussed below, in certain instances, the third party has assumed the regulatory responsibility under Rule 17d-2, while in others, we retain the regulatory responsibility for the activities.
Regulatory Services Agreement with FINRA
On December 19, 2014, CBOE and C2 entered into an agreement with the Financial Industry Regulatory Authority ("FINRA") under which FINRA agreed to start providing regulatory services to CBOE and C2 on January 1, 2015. Under the agreement, FINRA performs the majority of the regulatory services for CBOE and C2. CBOE and C2 remain responsible for the regulation of their marketplaces, and retain the authority for bringing disciplinary actions against their TPHs.
Regulatory Services Agreement with NFA
The National Futures Association ("NFA") performs many regulatory functions for CFE pursuant to a Regulatory Services Agreement with CFE. CFE retains overall responsibility for the regulation of its marketplace. CFE also remains responsible for bringing disciplinary actions against TPHs. CFE is also a party to cooperative and regulatory information sharing agreements with other SROs and is a member of the ISG, described above.
Rule 17d-2 Agreements
Section 17(d) of the Exchange Act and the related Exchange Act rules permit SROs to allocate certain regulatory responsibilities to avoid duplicative oversight and regulation. Under Exchange Act Rule 17d-1, the SEC designates one SRO to be the Designated Examining Authority ("DEA") for each broker-dealer that is a member of more than one SRO. The DEA is responsible for the regulatory oversight of the financial responsibility aspects of that broker-dealer. We are the DEA for many of our members.
Exchange Act Rule 17d-2 permits SROs to enter into agreements, commonly called Rule 17d-2 agreements, which are approved by the SEC and concern the enforcement of rules applicable to all of those SROs and relating to members those SROs have in common. We have entered into Rule 17d-2 agreements under which FINRA is allocated responsibility for enforcing certain federal securities laws and CBOE and C2 rules that are common with FINRA rules. We have entered into other Rule 17d-2 agreements that allocate responsibility to each SRO, which may include CBOE and C2, for ensuring that their allocated common members comply with rules governing options sales practices, expiring exercise declarations, options position limits and large options position reporting and position adjustments.
17
ORSA Plan
The SEC approved a national market system ("NMS") plan named the Options Regulatory Surveillance Authority Plan ("ORSA Plan") with the purpose of permitting the U.S. securities options exchanges to act jointly in the administration, operation and maintenance of a regulatory system for the surveillance, investigation and detection of the unlawful use of undisclosed, material information in trading in one or more of their markets. Through the sharing of the costs of these regulatory activities and the sharing of the regulatory information generated under the ORSA Plan, the ORSA Plan is intended to enhance the effectiveness and efficiency with which the exchanges regulate their respective markets and the national market system for options and to avoid duplication of certain regulatory efforts. The ORSA policy committee had delegated the operation of the surveillance and investigative facility contemplated by the ORSA Plan to CBOE. The exchanges also entered into a Regulatory Services Agreement with CBOE, as service provider, pursuant to which CBOE performed certain regulatory and surveillance functions under the ORSA Plan and used its automated insider trading surveillance system to perform these functions on behalf of the exchanges. In 2015, the ORSA policy committee delegated the operation of the ORSA Plan facility to FINRA, and FINRA is the service provider under the Regulatory Services Agreement.
National Market System Plans
In addition to the ORSA Plan described above, CBOE and C2 are member participants of several other NMS plans, including the plans that are described below.
OPRA, CTA, CQ Plan and NASDAQ Unlisted Trading Privileges Plan
Like all U.S. options exchanges, CBOE and C2 are member exchanges in OPRA, a limited liability company. The OPRA limited liability company agreement sets forth a system for reporting options information that is administered by the member exchanges through OPRA, consisting of representatives of the member exchanges. OPRA is the designated securities information processor for market information that is generated through the trading of exchange-listed securities options in the U.S., and it disseminates certain core trading information, such as last sale reports and quotations. We also participate in the Consolidated Tape Association ("CTA"), the Consolidated Quotation Plan ("CQ Plan"), and the NASDAQ Unlisted Trading Privileges Plan, which perform analogous services for the U.S. equities market. NYSE Technologies, formerly the Securities Industry Automation Corporation, acts as the "processor" for OPRA, CTA and the CQ Plan. NASDAQ acts as the processor for the NASDAQ Unlisted Trading Privileges Plan.
Options Intermarket Linkage Plan
We are a party to the Options Order Protection and Locked/Crossed Market Plan, known as the Options Intermarket Linkage Plan, which is designed to prevent trade-throughs and facilitate the routing of orders between exchanges in furtherance of a national market system. The principal purposes of the plan are to promote price protection and to assure that brokers may execute investors' orders at the best market price, the "National Best Bid and Offer" ("NBBO"). The plan requires price protection of an exchange's best displayed bid or offer when the bid or offer is at the NBBO. Under the plan, direct exchange-to-exchange access through broker-dealers is used to transmit intermarket sweep orders similar to sweep orders that are available in the stock market under Regulation NMS. Undisplayed bids and offers and bids and offers at prices that are inferior to an exchange's best bid or offer do not receive protection under this plan.
Options Listing Procedures Plan and Symbology Plan
We are a party to the Options Listing Procedures Plan, which sets forth the procedures that the options exchanges must follow to list new options. We are also a party to the National Market System Plan for the selection and reservation of securities symbols.
Consolidated Audit Trail ("CAT")
In 2012, the SEC directed the SROs through a new regulation, to submit a plan to create, implement and maintain a consolidated audit trail ("CAT"), which would serve as a comprehensive audit trail of orders that will allow regulators to efficiently and accurately track all activity in Regulation NMS securities in the U.S. market. The regulation requires, among other things, that, upon implementation of a plan, data be reported to a central repository the following day by each exchange and broker-dealer. On November 15, 2016, the SEC approved a plan to implement CAT. There is a phased implementation over the next three years. We expect to begin reporting to the CAT in November 2017. The exchanges have incurred costs and the exchanges and their participants and may also incur additional significant costs related to the implementation of the CAT requirements.
Intellectual Property
18
We own or have rights to a number of intellectual property assets, including trademarks, service marks, domain names, trade names, copyrights, trade secrets and patents. While the majority of our intellectual property is protected under U.S. law, we have many intellectual property assets protected by laws in Europe, Asia and other parts of the world. We license some intellectual property assets to other entities. We attempt to protect our intellectual property rights, while respecting the legitimate intellectual property rights of others.
Employees
As of
December 31, 2016
, we employed
553
individuals. Of these employees,
258
were involved in systems development or operations and
121
were involved in direct support of trading operations. The remaining
174
employees provide financial, regulation, human resources, compliance, legal, planning and research, administrative and managerial support.
We have eight building engineers that are covered by a collective bargaining agreement, which expires on May 31, 2018, with the International Union of Operating Engineers Local 399, AFL-CIO. Management believes that we have strong relationships with our employees, and we have never experienced a work stoppage.
Executive Officers of CBOE Holdings
Set forth below is information regarding our executive officers and certain other key employees:
|
Name
|
Age
|
Position
|
||
|
Edward T. Tilly
|
53
|
|
Chief Executive Officer
|
|
|
Edward L. Provost
|
64
|
|
President and Chief Operating Officer
|
|
|
Alan J. Dean
|
62
|
|
Executive Vice President, Chief Financial Officer and Treasurer
|
|
|
Joanne Moffic-Silver
|
64
|
|
Executive Vice President, General Counsel and Corporate Secretary
|
|
|
Gerald T. O'Connell
|
65
|
|
Executive Vice President and Chief Information Officer
|
|
|
David S. Reynolds
|
63
|
|
Vice President and Chief Accounting Officer
|
|
Edward T. Tilly.
Mr. Tilly is our Chief Executive Officer. He has served in that capacity since May 2013. Prior to becoming CEO, Mr. Tilly served as President and Chief Operating Officer from November 2011, and Executive Vice Chairman from August 2006 until November 2011. He was a member of CBOE from 1989 until 2006, and served as Member Vice Chairman from 2004 through July 2006. Mr. Tilly serves on the board of directors of the OCC. He holds a B.A. degree in Economics from Northwestern University.
Edward L. Provost.
Mr. Provost became our President and Chief Operating Officer in May 2013. Prior to that, Mr. Provost served as Executive Vice President and Chief Business Development Officer. He served as the head of our Business Development Division since 2000 and has been employed at the Company since 1975. He holds a B.B.A. in Finance from Loyola University of Chicago and an M.B.A. from the University of Chicago Graduate School of Business.
Alan J. Dean.
Mr. Dean is our Executive Vice President, Chief Financial Officer and Treasurer. He has served in that capacity since 1988 and has been employed at the Company in the financial area since 1979. He is a certified public accountant, and he holds a B.S. degree in Accounting from Western Illinois University and an M.B.A. from Northwestern University's Kellogg Graduate School of Management.
Joanne Moffic-Silver.
Ms. Moffic-Silver is our Executive Vice President, General Counsel and Corporate Secretary. She has served in that capacity since 1997 and has been employed as an attorney at the Company since 1980. She is currently a member of the executive committee of the board of advisors of Northwestern University School of Law, a member of the Anti-Defamation League's Chicago/Upper Midwest Region Board, a member of the board of a not-for-profit education organization and a member of the Chicago Network. Ms. Moffic-Silver received her B.A. degree from the University of Wisconsin-Madison (Phi Beta Kappa). Ms. Moffic-Silver received her J.D. degree with honors from Northwestern University Pritzker School of Law.
Gerald T. O'Connell.
Mr. O'Connell is our Executive Vice President and Chief Information Officer. He has served in that capacity since 1993 and has been employed at the Company since 1984. He holds a B.S. degree in Mathematics from Lewis University and a J.D. degree from John Marshall Law School.
David S. Reynolds.
Mr. Reynolds is our Vice President and Chief Accounting Officer. He has served in that capacity since May 2009. Prior to that, Mr. Reynolds was with Hudson Highland Group, Inc., where he served in various roles including vice president, controller and chief accounting officer. From February 2005 to February 2007, Mr. Reynolds was vice president, controller and chief accounting officer of Bally Total Fitness Corporation. Prior to that, he spent twenty-two years in various
19
financial roles at Comdisco, Inc., rising to senior vice president and controller. Mr. Reynolds began his career at Ernst & Young. Mr. Reynolds is a certified public accountant and a certified cash manager. He is a graduate of Lehigh University where he obtained an M.B.A. and a B.S. in Finance.
Available Information
Our website is www.cboe.com. The Company files annual, quarterly and current reports, proxy statements and other information with the SEC under the Exchange Act. The Company makes available, free of charge, on its website its annual report on Form 10-K, quarterly reports on Form 10-Q, current reports on Form 8-K and amendments to those reports filed or furnished pursuant to Section 13(a) or 15(d) of the Exchange Act, as soon as reasonably practicable after such reports are electronically filed with, or furnished to, the SEC. The Company's reports filed with, or furnished to, the SEC are also available on the SEC's website at www.sec.gov.
In addition, we have posted on our website the charters for our (i) Audit Committee, (ii) Compensation Committee, and (iii) Nominating and Governance Committee, as well as our Code of Business Conduct and Ethics and Corporate Governance Guidelines. We will provide a copy of these documents without charge to stockholders upon written request to Investor Relations, CBOE Holdings Inc., 400 South LaSalle Street, Chicago, Illinois 60605. Our website and information included in or linked to our website are not part of this Form 10-K.
Item 1A.
Risk Factors
The risks and uncertainties described below are those that we believe are material at this time relating to our business and relating to the Merger. These risks and uncertainties, however, are not the only risks and uncertainties that we face. Additional risks and uncertainties not currently known to us or that we currently deem to be immaterial may also significantly impact us. Any of these risks and uncertainties may materially and adversely affect our business, financial condition or results of operations, liquidity, cash flows and the Merger.
Risks Relating to Our Business
Loss of our right to exclusively list and trade certain index options and futures could have a material adverse effect on our financial performance.
We hold exclusive licenses to list securities index options on the S&P 500 Index, the S&P 100 Index, the Russell 2000 Index, as well as others, granted to us by the owners of such indexes and based on which we have developed our proprietary VIX methodology. In
2016
, approximately
88.2%
of our transaction fees were generated by our futures and index options, the overwhelming majority of which were generated by our exclusively-licensed products and products based on the VIX methodology. The bulk of this revenue is attributable to our S&P 500 Index options and VIX Index options and futures. As a result, our operating revenues are dependent in large part on the exclusive licenses we hold for these products and our ability to maintain our exclusive VIX methodology.
There is a risk, with respect to each of our current exclusive licenses, that the owner of the index may not renew the license with us on an exclusive basis or at all. In the first event, we would be subject to multiple listing in the trading of what is now an exclusive index product, which could result in a loss of market share and negatively impact our profitability. In the second event, we could lose the right to list the index product entirely. The loss or limited use of any of our exclusive index licenses, especially for the S&P 500 Index, for any reason could have a material adverse effect on our business and profitability. See "Business—Products—Strategic Relationships" for a discussion of these licenses and their expiration dates.
In addition to the risks related to our exclusive licenses, if we are unable to retain exclusive proprietary rights in the VIX methodology, our volatility products could be subject to multiple listing, which could have a material adverse effect on us.
In addition, the European Parliament has adopted legislation that will require European exchanges to provide non-discriminatory access to benchmarks, like index options, and is considering other legislation that may impact the ability of European banks to trade our products. While similar legislation has not been proposed in the U.S., if it were passed, it could cause us to lose exclusivity in our internally developed and licensed index products. The adopted and proposed European legislation may impact our expansion activities in Europe, and may reduce the volume on our exchanges from international customers.
Furthermore, our competitors may succeed in providing a market for the trading of index-based or volatility products that are economically similar to those that we offer. It is also possible that a third party may offer trading in index-based products that are the same as those that are the subject of one of our exclusive licenses, but in a jurisdiction in which the index owner cannot require a license or in a manner otherwise not covered by our exclusive license.
20
The value of our exclusive licenses to list securities index options also depends on the continued ability of index owners to require licenses for the trading of options based on their indexes. Although we and the index owners have prevailed in legal actions challenging our rights to exclusively license indexes, we may be subject to changes in the law or other actions taken in the future that might impede our ability to exclusively offer trading in certain index options.
General economic conditions and other factors beyond our control could significantly reduce demand for our products and services and harm our business.
The volume of options and futures transactions and the demand for our products and services are directly affected by economic, political and market conditions in the U.S. and elsewhere in the world that are beyond our control, including:
|
•
|
broad trends in business and finance;
|
|
•
|
concerns over wavering institutional or retail confidence levels;
|
|
•
|
changes in government fiscal and monetary policy and foreign currency exchange rates;
|
|
•
|
the availability of short-term and long-term funding and capital;
|
|
•
|
the availability of alternative investment opportunities;
|
|
•
|
changes in the level of trading activity in underlying instruments;
|
|
•
|
changes and volatility in the prices of securities;
|
|
•
|
the level and volatility of interest rates;
|
|
•
|
unforeseen market closures or other disruptions in trading; and
|
|
•
|
concerns about terrorism and war.
|
General economic conditions affect options and futures trading in a variety of ways, from the availability of capital to investor confidence. The economic climate in recent years has been characterized by challenging business, economic and political conditions throughout the world. Adverse changes in the economy may have a negative impact on our revenues by causing a decline in trading volume. Significant declines in trading volumes or demand for market data may have a material adverse effect on our business, financial condition and operating results.
We operate in a highly regulated industry and may be subject to censures, fines and other legal proceedings if we fail to comply with legal and regulatory obligations.
CBOE and C2 are registered national securities exchanges and SROs, and, as such, are subject to comprehensive regulation by the SEC. CFE is a DCM registered with the CFTC and is subject to comprehensive regulation by the CFTC.
In addition to the requirements related to operating our markets imposed by the SEC and the CFTC, we also have certain responsibilities for regulating the TPHs that trade on our exchanges. While we have entered into agreements under which FINRA with respect to our options exchanges, and NFA with respect to our futures exchange, provide certain regulatory services, we retain responsibility for the regulation of our TPHs. See "Business—Regulatory Responsibilities."
Our ability to comply with applicable laws and rules is largely dependent on the establishment and maintenance of appropriate systems and procedures, our ability to attract and retain qualified personnel, the ability of FINRA and NFA to perform under the regulatory services agreements and our oversight of the work done by FINRA and NFA. The SEC and CFTC have broad powers to audit, investigate and enforce compliance and to punish noncompliance by SROs and DCMs, respectively, pursuant to applicable laws, rules and regulations.
If the SEC or CFTC were to find one of our programs of enforcement or compliance to be deficient, CBOE, C2 or CFE could be the subject of SEC or CFTC investigations and enforcement proceedings that may result in substantial sanctions, including revocation of an exchange's registration as a national securities exchange or DCM. Any such investigations or proceedings, whether successful or unsuccessful, could result in substantial costs, the diversion of resources, including management time, and potential harm to our reputation, which could have a material adverse effect on our business, results of operations or financial condition. In addition, CBOE, C2 or CFE may be required to modify or restructure their regulatory functions in response to any changes in the regulatory environment, or they may be required to rely on third parties to perform regulatory and oversight functions, each of which may require us to incur substantial expenses and may harm our reputation if our regulatory services are deemed inadequate.
21
Although CBOE Holdings itself is not an SRO, CBOE Holdings is subject to regulation by the SEC of activities that involve the options exchanges. Specifically, the SEC will exercise oversight over the governance of CBOE Holdings and its relationship with CBOE and C2. See "Business—Regulatory Responsibilities."
Our business may be adversely affected by price competition.
The business of operating options exchanges is characterized by intense price competition, especially with respect to transaction fees. The pricing model for trade execution for options has changed in response to competitive market conditions and our competitors have adjusted transaction fees and fee structures accordingly, including by opening new exchanges, which allow them to offer multiple pricing models that can appeal to different segments of market participants. These changes have resulted in significant pricing pressures on us, especially on transaction fees and incentives for multiply-listed products. As a result of these pricing pressures, our average rate per multiply-listed options contract may decrease. It is likely that this pressure will continue and even intensify as our competitors continue to seek to increase their share of trading by further reducing their transaction fees or by offering other financial incentives to order providers and liquidity providers to induce them to direct orders to their markets.
In addition, one or more competitors may engage in aggressive pricing strategies and significantly decrease or completely eliminate their profit margin for a period of time in order to capture a greater share of trading volume. Some order-providing firms on our exchanges have taken ownership positions in options exchanges that compete with us and such exchanges have given those firms added economic incentives to direct orders to them.
With respect to our proprietary products, we compete with futures exchanges and swap execution facilities that offer similar products and other financial market participants that offer over-the-counter derivatives. We also compete on price against certain multiply-listed options products, including SPY, that offer some of the features of our proprietary products.
We could lose a substantial percentage of our share of trading if we are unable to price transactions in a competitive manner. Also, our profits could decline if competitive pressures force us to reduce fees. If any of these events occur, our operating results and profitability could be adversely affected.
A significant portion of our operating revenues is generated by our transaction-based business. If the amount of trading volume on our exchanges decreases, or the product mix shifts to lower revenue products, our revenues from transaction fees will decrease.
In
2016
,
2015
and
2014
, approximately
70.5%
,
71.9%
and
70.9%
of our operating revenues, respectively, were generated by our transaction-based business. This business is dependent on our ability to attract and maintain order flow, both in absolute terms and relative to other market centers. Our total trading volumes could decline if our market participants reduce their trading activity for any reason, such as:
|
•
|
heightened capital requirements;
|
|
•
|
regulatory or legislative actions;
|
|
•
|
reduced access to capital required to fund trading activities; or
|
|
•
|
significant market disruptions.
|
Over the past few years, a number of legislative actions have been taken, both domestically and internationally, that may cause market participants to be subject to increased capital requirements and additional compliance burdens. These actions, including Basel III, Dodd-Frank and the Collins Amendment to Dodd-Frank, may cause market participants to reduce the number of trades they make on our exchanges.
In addition, the transaction fees generated are different based on type of product and other factors, including the type of customer and certain volume discounts. See "Management's Discussion and Analysis—Operating Revenues—Average revenue per contract." If the amount of our trading volume decreases, or the mix traded shifts to our lower revenue per contract products, our revenues from transaction fees will decrease. We can offer no assurance that we would be able to reduce our costs to match the amount of any such decrease.
Legislative or regulatory changes affecting the listed options or futures markets could have a material adverse effect on our business.
Changes in regulation by the SEC, CFTC, foreign regulators or other government action, including SEC approval of rule filings by other SROs or entities, including OCC, could materially affect our markets. In recent years, the securities and futures industries have been subject to significant regulatory changes as a result of increasing government and public scrutiny of the securities and futures industries. We have also experienced an increase in rulemaking and legislation that could affect our
22
business.
In 2010, Congress passed the Dodd-Frank Act and other legislation. While many of its requirements have been implemented or are in the process of being implemented, some of the provisions in Dodd-Frank that impact our markets require additional action by the SEC or the CFTC. Depending on how the SEC and CFTC interpret and implement these laws, exchanges like ours could be subject to increased competition and additional costs. We could also see reduced trading by our customers due to margin or other requirements placed on them.
Under the Collins Amendment to the Dodd-Frank Act, starting in 2015, large U.S. banks are required to compute their risk weighted assets, which include exchange-traded options and futures. This, and other rulemaking, may lead to further increases in capital requirements for U.S. bank holding companies, and bank subsidiaries involved in the trading and clearing of derivatives. These increased capital requirements may reduce trading in options and futures due to bank-affiliated clearing members and broker-dealers reducing their own trading, charging their customers more to trade, reducing the type or number of customers or withdrawing from the business of market-maker clearing.
In 2016, the SEC approved a plan to create, implement and maintain the CAT, which would serve as a comprehensive audit trail of orders that will allow regulators to efficiently and accurately track all activity in Regulation NMS securities in the U.S. market. In addition to increased regulatory obligations, implementation of the CAT could result in significant additional expenditures, including to implement any new technology to meet any plan's requirements.
Under European Union ("EU") regulations, European banks and other European financial institutions become subject to punitive capital charges if they transact options or futures through a non-qualifying clearinghouse. OCC, our clearinghouse for options and futures, is not currently recognized as a qualified clearinghouse by the EU. The current deadline for the EU to qualify foreign clearinghouses as equivalent is June 15, 2017. If the EU does not recognize OCC as a qualified clearinghouse by such date (or by a subsequent date in the event that the current deadline is extended), then European market participants that clear through OCC would become subject to punitive capital charges. As a result, we could experience the loss of a significant number of European market participants and a significant reduction in trading activity on our markets, which could have a material adverse effect on our business.
On June 23, 2016, the U.K. held a referendum in which voters approved an exit from the EU, commonly referred to as “Brexit.” As a result of the referendum, it is expected that the British government will begin negotiating the terms of the U.K.’s future relationship with the EU. The Brexit vote resulted in regulatory uncertainty throughout the region and could adversely affect business activity, political stability and economic conditions throughout Europe.
It is also possible that there will be additional legislative and regulatory changes or efforts in the environment in which we operate our businesses, although we cannot predict the nature of these changes or their impact on our business at this time. Actions on any of the specific regulatory issues currently under review in the U.S. and other proposals could have a material impact on our business. For a discussion of the regulatory environment in which we operate and proposed regulatory changes, see "Business—Regulatory Environment and Compliance."
In addition, Congress, the SEC, foreign regulators and other regulatory authorities could impose legislative or regulatory changes that could adversely impact the ability of our market participants to use our markets, or participate in the options or futures industry at all. Any such changes could result in the loss of a significant number of market participants or a reduction in trading activity on our markets, either of which could have a material adverse effect on our business. Changes or proposed changes in regulation may also result in additional costs of compliance and modification of market participants' trading activity on our exchanges.
Intense competition could materially adversely affect our market share and financial performance.
We compete with a number of entities on several different fronts, including the cost, quality and speed of our trade execution, functionality and ease of use of our trading platform, range of our products and services, our technological innovation and adaptation and our reputation. We compete with futures exchanges and swap execution facilities that offer comparable products and with the over-the-counter market with respect to our proprietary products. With respect to our multiply-listed products, our principal competitors are the thirteen other U.S. options exchanges. See the risk factor entitled "Our business may be adversely affected by price competition."
Most of the equity options and options on ETPs listed and traded on our exchanges are also listed and traded on other U.S. options exchanges. Changes we have implemented in response to competitive pressures may not be successful in maintaining or expanding our market share in those products in the future. Likewise, our future responses to these or other competitive developments may not be successful in maintaining or expanding our market share.
23
In addition, indexes underlying our products, including VIX and SPX, may be licensed for use in similar OTC options. Needs or preferences of investors could change leading to a migration to the market of some trades that today could be entered into on our exchanges. Options on ETFs and ETNs that have such licenses on these indexes are available for trading. As a result, trading in our products could decrease due to competitive pressures from these alternative products.
Some of our competitors and potential competitors have greater financial, marketing, technological, personnel and other resources than we do. These factors may enable them to develop similar or more innovative products, to offer lower transaction fees or better execution to their customers or to execute their business strategies more quickly or efficiently than we can.
Furthermore, our competitors may:
|
•
|
respond more quickly to competitive pressures;
|
|
•
|
develop products that compete with our products or are preferred by our customers;
|
|
•
|
develop and expand their technology and service offerings more efficiently;
|
|
•
|
provide better, more user-friendly and more reliable technology;
|
|
•
|
take greater advantage of acquisitions, alliances and other opportunities;
|
|
•
|
market, promote, bundle and sell their products and services more effectively;
|
|
•
|
leverage existing relationships with customers and alliance partners more effectively or exploit brand names to market and sell their services; and
|
|
•
|
exploit regulatory disparities between traditional, regulated exchanges and alternative markets, including over-the-counter markets, that benefit from a reduced regulatory burden and lower-cost business model.
|
The derivatives industry has witnessed both the consolidation of exchange holding companies and the growth in the number of exchanges, with a doubling of the number of options exchanges over the past decade. Consolidation or alliances among our competitors may achieve cost reductions or other increases in efficiency, which may allow them to offer better prices or services than we do. The increase to the number of competitors that we face may result in fragmentation of the market and a reduced market share for our exchanges.
If our products, markets, services and technology are not competitive, our financial condition and operating results would be materially harmed. A decline in our transaction fees or any loss of customers would lower our revenues, which would adversely affect our profitability. For a discussion of the competitive environment in which we operate, see "Business—Competition."
We depend on third party service providers for certain services that are important to our business. An interruption or cessation of such service by any third party could have a material adverse effect on our business.
We depend on a number of service providers, including clearing organizations such as OCC and its member clearing firms; securities information processors such as the CTA and OPRA; regulatory service providers such as FINRA and NFA; the host of our data center; and various vendors of communications and networking products and services. More specifically:
|
•
|
OCC is the sole provider of clearing on all of our exchanges. If it were unable to perform clearing services, or its clearing members were unable or unwilling to clear through OCC, transactions would likely not occur on our markets or there may be delays.
|
|
•
|
OPRA, UTP Securities Information Processor and the CTA consolidate market information such as last sale reports and quotations. If any of them were unable to provide this information for a sustained period of time, we may be unable to offer trading on our options markets.
|
|
•
|
We are heavily dependent on technology for our markets, including our data center, which is housed by a third party, and certain communications and networking products and services. If this technology is unavailable, and cannot be replaced in a short time period, we may be unable to operate our markets.
|
|
•
|
FINRA and NFA provide regulatory services for our options and futures exchanges, respectively, while we retain regulatory responsibilities for such services. If FINRA or NFA stopped providing services, or provided inadequate services, we may be subject to action by the SEC or CFTC, or may have limitations placed upon our markets.
|
We cannot provide assurance that any of these providers will be able to continue to provide these services in an efficient manner or that they will be able to adequately expand their services to meet our needs. An interruption or malfunction in or the cessation of an important service by a third party could cause us to halt trading in some or all of our products or our services, or
24
make us unable to conduct other aspects of our business. In addition, our inability to make alternative arrangements in a timely manner, or at all, could have a material adverse impact on our business, financial condition and operating results.
If one or more of the index providers from which we have licenses or service providers with respect to proprietary products fails to maintain the quality and integrity of their indexes or fails to perform under our agreements with them or if customer preferences change, revenues we generate from trading in these proprietary products may suffer.
We are a party to an increasing number of license agreements pursuant to which we may list for trading securities options on various indexes including license agreements that we have with S&P, for the S&P 500 Index and S&P 100 Index, S&P Dow Jones Indices, LLC, for the Dow Jones Industrial Average, LSEG, for more than two dozen FTSE Russell indexes, including the Russell 2000 Index, and MSCI Inc., for six MSCI indexes, including the MSCI EAFE Index and MSCI Emerging Markets Index. These license agreements provide, among other things, that we are authorized to list options on their indexes, and some of the resulting index options are among the most actively traded products at CBOE. The quality and integrity of each of these indexes are dependent on the ability of the index providers to maintain the index, including by means of the calculation and rebalancing of the index, and we are dependent on the index providers for a number of things, including the provision of index data to us. We also rely on index providers to enforce intellectual property rights against unlicensed uses of the indexes and uses of the indexes that infringe on our licenses, as further discussed in risk factor "We may not be able to protect our intellectual property rights." Furthermore, some of our agreements concerning our proprietary products provide for the parties to those agreements to provide important services to us. If any of our index providers are unable to maintain the quality and integrity of their indexes, or if any of the index providers or service providers fail to perform their obligations under the agreements, trading in these products, and therefore transaction fees we receive, may be adversely affected or we may not receive the financial benefits of the agreements that we negotiated.
If we are unable to fulfill our obligations under the Consent Order, it may have a significant adverse impact on our business.
In addition to entering into the Consent Order and agreeing to complete certain undertakings, we may be subject to additional investigations or proceedings by the SEC if the SEC were to find that we did not fulfill our obligations under the Consent Order. See "Business—Regulatory Environment and Compliance—Compliance—Consent Order." Any investigations or proceedings, whether successful or unsuccessful, could result in substantial costs, the diversion of resources, including management time, and potential harm to our reputation, which could have a material adverse effect on our business results of operations or financial condition.
We and our licensors may not be able to protect our respective intellectual property rights.
We rely on patent, trade secret, copyright and trademark laws, the law of the doctrine of misappropriation and contractual protections to protect our proprietary technology, proprietary index and futures products, index methodologies and other proprietary rights. In addition, we rely on the intellectual property rights of our licensors in connection with our listing of exclusively-licensed index and futures products. We and our licensors may not be able to prevent third parties from copying, or otherwise obtaining and using, our intellectual property without authorization, listing our proprietary or exclusively-licensed index products without licenses or otherwise infringing on our rights. We and our licensors may have to rely on litigation to enforce our intellectual property rights, determine the validity and scope of the proprietary rights of others or defend against claims of infringement or invalidity. We and our licensors may not be successful in this regard. Such litigation, whether successful or unsuccessful, could result in substantial costs to us, diversion of our resources or a reduction in our revenues, any of which could materially adversely affect our business.
Any infringement by us on patent rights of others could result in litigation and could have a material adverse effect on our operations.
Our competitors, as well as others, have obtained, or may obtain, patents that are related to our technology or the types of products and services we offer or plan to offer. We may not be aware of all patents containing claims that may pose a risk of infringement by our products, services or technologies. In addition, some patent applications in the U.S. are confidential until a patent is issued, and therefore we cannot evaluate the extent to which our products and services may be covered or asserted to be covered in pending patent applications. Thus, we cannot be sure that our products and services do not infringe on the rights of others or that others will not make claims of infringement against us. Claims of infringement are not uncommon in our industry. If one or more of our products, services or technologies were determined to infringe a patent held by another party, we may be required to pay damages, stop using, developing or marketing those products, services or technologies, obtain a license from the holders of the patents or redesign those products, services or technologies to avoid infringing the patent. If we were required to stop using, developing or marketing certain products, our business, results of operations and financial condition could be materially harmed. Moreover, if we were unable to obtain required licenses, we may not be able to redesign our
25
products, services or technologies to avoid infringement, which could materially adversely affect our business, results of operations or financial condition.
Computer and communications systems failures and capacity constraints could harm our reputation and our business.
We operate, monitor and maintain our computer systems and networks, including the systems that comprise CBOE Command, the platform for trading on our exchanges and CBOE Vector, the platform that we are developing that is expected to replace CBOE Command. If we are unable to operate, monitor or maintain these systems and networks, program them so that they operate correctly and maintain the integrity of their data, or successfully transition from the CBOE Command platform to the new CBOE Vector trading platform, it could have a material adverse effect on our ability to conduct our business. Although we have a back-up of trading and key corporate systems, the back-up systems or disaster recovery plans may prove to be inadequate in the event of a systems failure or cyber-security breach. There can be no guarantees that we will be able to open an efficient, transparent and liquid marketplace, if we can open at all.
With extended trading hours, we have to operate our systems longer and have fewer non-trading hours to address any potential concerns with the systems on which we rely.
Our systems may fail, in whole or in part, or may operate slowly, causing one or more of the following:
|
•
|
unanticipated disruption in service to our participants;
|
|
•
|
failures or delays during peak trading times or times of unusual market volatility;
|
|
•
|
slower response times and delays in trade execution and processing;
|
|
•
|
incomplete or inaccurate accounting, recording or processing of trades; and
|
|
•
|
distribution of inaccurate or untimely market data to participants who rely on this data in their trading activity.
|
Any of these events may cause:
|
•
|
a loss in transaction or other fees due to the inability to provide services for a time;
|
|
•
|
requests by market participants or others that we reimburse them for financial loss, either within the constraints of the limited liability provisions of our exchanges' rules or in excess of those amounts;
|
|
•
|
trading to diminish on our exchanges due to dissatisfaction with the platform; and
|
|
•
|
one or more of our regulators to investigate or take enforcement action against us.
|
As a consequence of any of these events, our business, financial condition and results of operations could suffer materially.
In addition to other measures, we test our systems to confirm whether they will be able to handle anticipated present and future peak trading activity or times of unusual market volatility. However, we cannot assure you that our estimates of future trading volume will be accurate or that our systems will always be able to accommodate actual trading volume without failure or degradation of performance.
We anticipate that we will need to continue to make significant investments in hardware, software and telecommunications infrastructure to accommodate the increases in traffic. If we cannot increase the capacity and capabilities of our systems to accommodate increasing trading activity and to execute our business strategy, our ability to maintain or expand our businesses would be adversely affected.
The computer systems and communication networks upon which we rely may be vulnerable to security risks and other disruptions.
The secure and reliable operation of our computer systems, our communications networks and the systems of our service providers and market participants, is a critical element of our operations. These systems and communications networks may be vulnerable to unauthorized access, including the improper access or disclosure of personally identifiable information, malware and other security problems, as well as to acts of terrorism, natural disasters and other events that are beyond our control. If our security measures are inadequate or if there are interruptions or malfunctions in our systems or communications networks, our business, financial condition and operating results could be materially impacted. We may be required to expend significant resources in the event of any real or threatened breaches in security or system failures, including to protect against threatened breaches and to alleviate harm caused by an actual breach, and may suffer harm to our reputation and litigation. Measures we implement for security and otherwise to provide for the confidentiality, integrity and reliability of our systems may prove to be
26
inadequate in preventing system failures or delays in our systems or communications networks, which could lower trading volume and have an adverse effect on our business, financial condition and operating results.
We may not be able to maintain operating revenues generated by making trading permits available in exchange for a fee.
The right to trade on our exchanges is made available through trading permits for which the user pays a fee. These fees accounted for
8.0%
of our operating revenues in
2016
. CBOE charges the highest relative trading permit rates in the options industry. We may face pressure from our customers to lower these rates or may see larger firms electing to use fewer permits to access our exchanges. If the demand for trading permits to our exchanges is less than historic levels or if we are unable to maintain permit rates, our ability to generate operating revenues through the granting of permits for trading access would be negatively impacted, which could adversely affect our profitability.
Potential conflicts of interest between our for-profit status and our regulatory responsibilities may adversely affect our business.
As a for-profit business with regulatory responsibilities, we are responsible for disciplining TPHs for violating our rules, including by imposing fines and sanctions. This may create a conflict of interest between our business interests and our regulatory responsibilities. Any failure by us to fulfill our regulatory obligations could significantly harm our reputation, increase regulatory scrutiny or cause the SEC or CFTC to take action against us, all of which could adversely affect our business, results of operations or financial condition.
Our compliance methods might not be effective and may result in outcomes that could adversely affect our financial condition and operating results.
As the parent company for SROs, we are responsible for maintaining exchanges that comply with securities and futures laws, SEC and CFTC regulations and the rules of the respective exchanges. Our ability to comply with applicable laws and rules is largely dependent on our policies and procedures designed to meet those compliance responsibilities, as well as our ability to attract and retain qualified personnel throughout the company. Our policies and procedures to identify, monitor and manage compliance risks may not be fully effective. Management of legal and regulatory risk requires policies and procedures to properly monitor, record and verify a large number of transactions and events. We cannot provide assurance that our policies and procedures will always be effective or that we will always be successful in monitoring or evaluating the compliance risks to which we are or may be exposed, or that our compliance and internal audit functions would be able to identify any such ineffectiveness. If these policies and procedures are not effective, we may be subject to monetary or other penalties by our regulators.
If our risk management methods are not effective, our business, reputation and financial results may be adversely affected.
We have methods to identify, monitor and manage our risks. If our methods are not effective or we are not successful in monitoring or evaluating the risks to which we are or may be exposed, our business, reputation, financial condition and operating results could be materially adversely affected. In addition, our insurance policies may not provide adequate coverage.
Misconduct by our TPHs or others could harm us.
We run the risk that our TPHs, other persons who use our markets or our employees may engage in fraud, market manipulation or other misconduct, which could result in regulatory sanctions and serious harm to our reputation, especially because we are the parent company of SROs. It is not always possible to deter misconduct or market manipulation, and the precautions we take to prevent and detect this activity may not be effective in all cases. In addition, misconduct or market manipulation by, or failures of, participants on our exchanges may discourage trading on our exchanges, which could reduce revenues.
If we fail to attract or retain highly skilled management and other employees, our business may be harmed.
Our future success depends in large part on our management team, which possesses extensive knowledge and managerial skill with respect to the critical aspects of our business. The failure to retain members of our management team could adversely affect our ability to manage our business effectively and execute our business strategy. Additionally, effective succession planning is also important to our long-term success. Failure to ensure effective transfer of knowledge and smooth transitions involving our management team and key employees could hinder our strategic planning and execution.
Our business is also dependent on highly skilled employees, especially those who provide specialized services to our clients and oversee our technology functions. Many of these employees have extensive knowledge and experience in highly technical and complex areas of the options trading industry. Because of the complexity and risks associated with our business and the specialized knowledge required to conduct this business effectively, and because the growth in our industry has increased demand for qualified personnel, many of our employees could find employment at other firms if they chose to do so,
27
particularly if we fail to continue to provide competitive levels of compensation. If we fail to retain our current employees, it would be difficult and costly to identify, recruit and train replacements needed to continue to conduct and expand our business. In particular, failure to retain and attract qualified systems personnel could result in systems errors. Consequently, our reputation may be harmed, we may incur additional costs and our profitability could decline.
We may not effectively manage our growth, which could materially harm our business.
Over the past five years, we have experienced significantly increased volume on our futures exchange, extended trading hours on our futures exchange and in SPX and VIX options and developed several proprietary products. We expect that our business will continue to grow, which may place a significant strain on our management, personnel, systems and resources. We must continually improve our operational, financial and regulatory systems and managerial controls and procedures, and may need to continue to expand, train and manage our workforce. We must also maintain close coordination among our technology, legal, accounting, finance, marketing, sales, regulatory and compliance functions. We cannot assure you that we will manage our growth effectively. If we fail to do so, our business could be materially harmed.
Our continued growth will require increased investment by us in technology, facilities, personnel, and financial and management systems and controls. It also will require expansion of our procedures for monitoring and assuring our compliance with applicable regulations, and we will need to integrate, train and manage a growing employee base. The expansion of our existing businesses, any expansion into new businesses and the resulting growth of our employee base will increase our need for internal audit and monitoring processes, which may be more extensive and broader in scope than those we have historically required. We may not be successful in identifying or implementing all of the processes that are necessary. Further, unless our growth results in an increase in our revenues that is proportionally greater than or equal to the increase in our costs associated with this growth, our operating margins will be adversely affected.
Our ability to implement or amend rules could be limited or delayed because of regulation, which could negatively affect our ability to implement needed changes.
Our options exchanges registered with the SEC must submit proposed rule changes to the SEC for its review and, in many cases, its approval. Even where a proposed rule change may be effective upon filing with the SEC, the SEC retains the right to suspend and disapprove such rule changes. Also, the CFTC may stay or disapprove rules that we file with it for CFE, our futures exchange. The rule review process can be lengthy and can significantly delay the implementation of proposed rule changes that we believe are necessary to the operation of our markets. If the SEC or CFTC delays or does not allow one of our exchanges to implement a rule change, this could negatively affect our ability to make needed changes or implement business activities.
Similarly, the SEC must approve amendments to our options exchange subsidiaries' certificates of incorporation and bylaws as well as certain amendments to the certificate of incorporation and bylaws of CBOE Holdings. The SEC may decide not to approve a proposed amendment or may delay such approval in a manner that could negatively affect our ability to make a desired change, which could prevent or delay us from improving the operations of our markets or recognize income from new products.
As one of the largest options exchanges in the world and the largest options exchange in the U.S., we may be at a greater risk for a cyber attack and other cyber security risks.
The frequency of cyber attacks is increasing in general, and a variety of threat actors have specifically targeted the financial services industry. At the date of this filing, we have no evidence of any material cases of data theft, corruption or destruction of data or compromised customer data. Security breaches may, among other consequences, lead to increased scrutiny by our regulators and have significant costs in terms of cash outlays, business disruption, revenue losses, internal labor, overhead and other expenses. Measures we implement to monitor the environment and protect our infrastructure against security breaches and misappropriation of our intellectual property assets may prove insufficient, which could cause us to lose market participants, experience lower trading volume, incur significant liabilities or have a negative impact on our competitive advantage.
Changes in the tax laws and regulations affecting us and our market participants could have a material adverse effect on our business.
Legislation may be proposed, both domestically and internationally, that could change the way that our market participants are taxed on the products they trade on our markets. If such proposals were to become law, they could have a negative impact on the options and futures industry and on us by making transactions more costly to market participants, which may reduce trading.
28
In 2015, the Internal Revenue Service issued final and temporary regulations under Section 871(m) that require dividend tax withholding for certain transactions completed by foreign persons that could result in a reduction in trading by such foreign persons, either by their choice or as a result of brokers refusing to execute certain option trades for such persons.
In addition to proposed tax changes that could affect our market participants, like other corporations, we are subject to taxes at the federal, state and local levels, as well as in non-U.S. jurisdictions. Changes in tax laws, regulations or policies could result in us having to pay higher taxes, which would in turn reduce our net income. There has been a trend toward states changing income tax laws to increase the apportionment factors on which state income taxes are based and becoming more aggressive asserting nexus over corporations that are not domiciled in the state. If state income tax laws change, or if states are successful asserting nexus against us, we may become subject to income taxes in additional states or at a higher rate in the states where income tax filing requirements exists. If this occurs, we may experience a higher effective state tax rate.
We selectively explore acquisition opportunities or strategic alliances relating to other businesses, products or technologies. We may not be successful in integrating other businesses, products or technologies with our business. Any such transaction also may not produce the results we anticipate, which could adversely affect us.
We selectively explore and pursue acquisition and other opportunities to strengthen our business and grow our company. We may enter into business combination transactions, make acquisitions or enter into strategic partnerships, joint ventures or alliances, any of which may be material. The market for acquisition targets and strategic alliances is highly competitive, which could make it more difficult to find appropriate merger or acquisition opportunities. If we are required to raise capital by incurring debt or issuing additional equity for any reason in connection with a strategic acquisition or investment, financing may not be available or the terms of such financing may not be favorable to us and our stockholders, whose interests may be diluted by the issuance of additional stock. See “Risk Factors — Risks Relating to the Merger” for additional discussion of our risks related to the Merger.
In 2016, we made a majority investment in CBOE Vest, an investment manager focused on Target Outcome Investment strategies, a minority investment in CurveGlobal, a new interest rate derivatives venture of the LSEG and a number of major dealer banks, and made a minority equity investment in Eris, a U.S. - based futures exchange group offering swap futures as a capital-efficient alternative to over-the-counter swaps. See also “Business-Strategic Partnership” for additional information regarding our strategic partnerships.
The process of integration may produce unforeseen regulatory issues and operating difficulties and expenditures and may divert the attention of management from the ongoing operation of our business and harm the reputation of the companies. We may not successfully achieve the integration objectives, and we may not realize the anticipated cost savings, revenue growth and synergies in full or at all, or it may take longer to realize them than expected, any of which could negatively impact our results of operations, financial condition or the market price of our common stock.
Any decision to pay dividends on our common stock is at the discretion of our board of directors and depends upon the earnings of our operating subsidiaries. Accordingly, there can be no guarantee that we will pay dividends to our stockholders.
We have paid quarterly dividends since the restructuring transaction and initial public offering and intend to continue paying regular quarterly dividends to our stockholders. However, any decision to pay dividends on our common stock will be at the discretion of the board of directors, which may determine not to declare dividends at all or at a reduced amount. The board's determination to declare dividends will depend upon our profitability and financial condition, contractual restrictions, restrictions imposed by applicable law and the SEC and other factors that the board deems relevant. As a holding company with no significant business operations of its own, CBOE Holdings depends entirely on distributions, if any, it may receive from its subsidiaries to meet its obligations and pay dividends to its stockholders. If these subsidiaries are not profitable, or even if they are and they determine to retain their profits for use in their businesses, we will be unable to pay dividends to our stockholders.
Certain provisions in our organizational documents could enable the board of directors to prevent or delay a change of control.
Our organizational documents contain provisions that could block actions that stockholders might find favorable, including discouraging, delaying or preventing a change of control or and unsolicited acquisition proposals for us. These include provisions:
|
•
|
prohibiting stockholders from acting by written consent;
|
|
•
|
requiring advance notice of director nominations and of business to be brought before a meeting of stockholders; and
|
|
•
|
limiting the persons who may call special stockholders' meetings.
|
29
In addition, our organizational documents include provisions that:
|
•
|
restrict any person from voting or causing the voting of shares of stock representing more than 20% of our outstanding voting capital stock; and
|
|
•
|
restrict any person from beneficially owning shares of stock representing more than 20% of the outstanding shares of our capital stock.
|
Furthermore, our board of directors has the authority to issue shares of preferred stock in one or more series and to fix the rights and preferences of these shares without stockholder approval. Any series of our preferred stock is likely to be senior to our common stock with respect to dividends, liquidation rights and, possibly, voting rights. The ability of the board of directors to issue preferred stock also could have the effect of discouraging unsolicited acquisition proposals, thus adversely affecting the market price of our common stock.
Delaware law makes it difficult for stockholders that have recently acquired a large interest in a corporation to cause the merger or acquisition of the corporation against the directors' wishes. Under Section 203 of the Delaware General Corporation Law, a Delaware corporation may not engage in any merger or other business combination with an interested stockholder for a period of three years following the date that the stockholder became an interested stockholder except in limited circumstances, including by approval of the corporation's board of directors.
Risks Relating to the Merger
Failure to complete the proposed Merger within the expected timeframe or at all could have a material adverse impact on our business, financial condition and results of operations.
There can be no assurance that the Merger will occur. The closing of the Merger is subject to certain conditions, including, among others, (i) the adoption of the Merger Agreement by the holders of at least a majority of the outstanding shares of Bats common stock entitled to vote thereon, (ii) approval of the issuance of shares of our common stock in the Merger by the holders of at least a majority of the shares of our common stock entitled to vote thereon and present in person or represented by proxy at the meeting of our stockholders called for such purpose, (iii) the expiration or earlier termination of the waiting period under the Hart-Scott-Rodino Antitrust Improvements Act of 1976, as amended, and regulatory approval by the SEC, Financial Industry Regulatory Authority and the U.K. Financial Conduct Authority, (iv) no court order or other legal restraint or prohibition preventing the consummation of the Merger or the Subsequent Merger or imposing a “burdensome effect” (as defined in the Merger Agreement) upon the consummation thereof, (v) the absence of any pending action commenced by a governmental or regulatory body wherein a judgment would reasonably be expected to prevent the consummation of the Merger or the Subsequent Merger or impose a burdensome effect upon the consummation thereof, (vi) receipt of tax opinions from counsel to each of us and Bats with respect to the treatment of the Merger and Subsequent Merger from a tax perspective, (vii) in the case of our obligation to effect the Merger, no exercise of appraisal rights by Bats stockholders holding more than 20% of the outstanding shares of Bats common stock, (viii) in the case of each party’s obligation to effect the Merger, the absence of a material adverse effect with respect to the other party since the date of the Merger Agreement and (ix) subject to materiality exceptions, the accuracy of the representations and warranties made by us, Merger Sub and Merger LLC, on the one hand, and Bats, on the other hand, and compliance by us, Merger Sub, Merger LLC and Bats in all material respects with our and their respective obligations under the Merger Agreement. Although certain of these conditions have been satisfied, there can be no assurance that the remaining conditions to the closing of the Merger will be satisfied in a timely matter or at all.
In particular, before the proposed transactions contemplated by the Merger Agreement, including the Merger, may be completed, various clearances and approvals must be obtained from certain regulatory and governmental authorities. These regulatory and governmental entities may impose conditions on the granting of such approvals. Such conditions and the process of obtaining regulatory approvals could have the effect of delaying completion of the Merger or of imposing additional costs or limitations on the combined company following the Merger. The regulatory approvals may not be received at all, may not be received in a timely fashion and may contain conditions on the completion of the Merger. However, if any such conditions impose a “burdensome effect” as defined in the Merger Agreement, the parties may not be obligated to complete the Merger, and either Bats or we may have the right to terminate the Merger Agreement. In addition, our and Bats’ obligations to complete the Merger are conditioned on the receipt of certain regulatory approvals or waiver by the other party of such condition.
Failure to complete the Merger could negatively impact our stock price and future businesses and financial results.
If the Merger is not completed, our ongoing business may be adversely affected, and we will be subject to several risks and consequences, including the following:
30
|
•
|
we may be required, under certain circumstances, to pay Bats a termination fee of $110 million or reimburse Bats’ expenses up to $10 million under the Merger Agreement;
|
|
•
|
we will be required to pay certain costs relating to the Merger, whether or not the Merger is completed, such as legal, accounting, financial advisory and printing fees;
|
|
•
|
under the Merger Agreement, we are subject to certain restrictions on the conduct of our business prior to completing the Merger that may adversely affect our ability to execute certain of our business strategies; and
|
|
•
|
matters relating to the Merger may require substantial commitments of time and resources by our management, which could otherwise have been devoted to other opportunities that may have been beneficial to us as an independent company and such commitments may impact future earnings of the combined company.
|
In addition, if the Merger is not completed, we may experience negative reactions from the financial markets and from our customers and employees. We also could be subject to litigation related to any failure to complete the Merger or to enforcement proceedings commenced against us to perform our obligations under the Merger Agreement. If the Merger is not completed, we cannot assure our stockholders that the risks described above will not materialize and will not materially adversely affect our business, financial results and stock prices.
The announcement and pendency of the Merger may adversely affect our business, financial condition and results of operations.
Uncertainty about the effect of the Merger on our employees, customers, and other parties may have an adverse effect on our business, financial condition and results of operation regardless of whether the Merger is completed. These risks to our business include the following, all of which could be exacerbated by a delay in the completion of the Merger:
|
•
|
the impairment of our ability to attract, retain and motivate our employees, including key personnel;
|
|
•
|
the diversion of significant management time and resources towards the completion of the Merger;
|
|
•
|
difficulties maintaining relationships with customers and other business partners;
|
|
•
|
delays or deferments of certain business decisions by our customers and other business partners;
|
|
•
|
the inability to pursue alternative business opportunities or make appropriate changes to our business because of requirements in the Merger Agreement that we conduct our business in the ordinary course of business consistent with past practice and not engage in certain kinds of transactions prior to the completion of the Merger;
|
|
•
|
litigation relating to the Merger and the costs related thereto; and
|
|
•
|
the incurrence of significant costs, expenses and fees for professional services and other transaction costs in connection with the Merger.
|
Our debt arrangements in connection with financing the Merger may decrease our business flexibility and adversely affect our financial results.
On December 15, 2016, we entered into a $1.0 billion senior unsecured delayed draw term loan facility. On January 12, 2017, we issued $650 million aggregate principal amount of our 3.650% Senior Notes due 2027. The proceeds from this delayed draw term loan facility and issuance of our senior notes, in addition to using cash on hand at CBOE Holdings and Bats, are expected to be used to finance a portion of the cash component of the Merger consideration, to refinance existing indebtedness of Bats and its subsidiaries and to pay related fees and expenses. In addition, on December 15, 2016, we entered into a $150 million revolving credit facility to be used for working capital and other general corporate purposes.
Prior to entering into the Merger Agreement, we did not have any indebtedness and were not subject to any financial covenants. The financial and other covenants to which we have agreed to in connection with the incurrence of the indebtedness, and the combined company’s increased indebtedness, may have the effect, among other things, of reducing the combined company’s flexibility to respond to changing business and economic conditions, thereby placing the combined company at a competitive disadvantage compared to competitors that have less indebtedness and making the combined company more vulnerable to general adverse economic and industry conditions. The combined company’s increased indebtedness will also
31
increase borrowing costs, and the covenants pertaining thereto may also limit the combined company’s ability to repurchase shares of our common stock, increase dividends or obtain additional financing to fund working capital, capital expenditures, acquisitions or general corporate requirements. The combined company will also be required to dedicate a larger portion of its cash flow from operations to payments on its indebtedness, thereby reducing the availability of its cash flow for other purposes, including working capital, capital expenditures and general corporate purposes.
The combined company’s ability to make payments on and to refinance its debt obligations and to fund planned capital expenditures will depend on its ability to generate cash from the combined company’s operations. This, to a certain extent, is subject to general economic, financial, competitive, legislative, regulatory and other factors that are beyond the combined company’s control.
The combined company may not be able to refinance any of its indebtedness on commercially reasonable terms, or at all. If the combined company cannot service its indebtedness, the combined company may have to take actions such as selling assets, seeking additional equity or reducing or delaying capital expenditures, strategic acquisitions, investments and alliances, any of which could impede the implementation of the combined company’s business strategy or prevent the combined company from entering into transactions that would otherwise benefit its business. Additionally, the combined company may not be able to effect such actions, if necessary, on commercially reasonable terms, or at all.
Any of the foregoing consequences could adversely affect the combined company’s financial results.
Deterioration in our credit profile may increase our costs of borrowing money.
Our long-term indebtedness is rated by S&P Global Ratings and Moody’s Investors Service. There is no assurance that we will maintain such credit ratings, since credit ratings may be lowered or withdrawn entirely by a rating agency if, in its judgment, the circumstances warrant. If a rating agency were to downgrade our rating below investment grade, our borrowing costs and the costs of the proposed transactions contemplated by the Merger Agreement would increase.
The Merger Agreement contains provisions that may discourage other companies from trying to acquire us.
The Merger Agreement contains provisions that apply both during the pendency of the Merger transaction with Bats as well as afterward should the Merger with Bats not be consummated that may discourage a third party from submitting a business combination proposal to us that might result in greater value to our stockholders than the Merger. These Merger Agreement provisions include a general prohibition on us from soliciting, or, subject to certain exceptions, entering into discussions with any third party regarding any acquisition proposal or offers for competing transactions. In addition, we may be required to pay Bats a $110 million termination fee and reimburse Bats for its expenses incurred in connection with the Merger in an aggregate amount not to exceed $10 million in certain circumstances involving acquisition proposals for competing transactions.
The price of our common stock might increase or decline prior to the completion of the Merger, which would change the value of the Merger consideration to be received by Bats stockholders pursuant to the Merger Agreement.
The market price of our
common stock at the time the Merger is completed may vary significantly from the price on the date of the Merger Agreement. On September 22, 2016, the last full trading day prior to media publications regarding the proposed Merger, our
common stock closed at $69.41 per share as reported on NASDAQ, and on September 23, 2016, the last full day of trading prior to the announcement of the Merger Agreement, our common stock closed at $70.30 per share as reported on NASDAQ. If the market price of our common stock increases above $70.30, the market value of the Merger consideration will be greater than $32.50 per share of Bats common stock.
The issuance of shares of our common stock to Bats stockholders pursuant to the Merger Agreement will substantially reduce the percentage ownership interests of our pre-existing stockholders.
Based on the number of shares of our common stock and Bats common stock outstanding on December 9, 2016, the record date for the two companies' special meetings of stockholders held in connection with the Merger, we expect to issue or reserve for issuance approximately 31.9 million shares of our common stock pursuant to the Merger Agreement (including shares of our common stock issuable to Bats stockholders pursuant to outstanding and unexercised options to purchase Bats common stock granted under any Bats equity incentive plan, whether vested or unvested, and outstanding awards of restricted Bats common stock granted under any Bats equity incentive plan). Based on these numbers, immediately following the completion of the Merger, our pre-existing stockholders and former Bats stockholders would own approximately 72% and 28% of the outstanding shares of our common stock, respectively. The Merger will have no effect on the number of shares of our
32
common stock owned by our existing stockholders. The issuance of approximately 31.9 million shares of our common stock to Bats stockholders and holders of equity incentive awards will cause a significant reduction in the relative percentage interests of our current stockholders in earnings, voting, liquidation value and book and market value.
The Merger will result in changes to the board of directors and management of the combined company that may affect the strategy of the combined company as compared to our strategy as a standalone company.
If the parties complete the Merger, the composition of our board of directors and our management team will change from our current board and management team. The board of directors of the combined company will consist of 14 members, including three individuals designated by Bats who are serving as Bats directors immediately prior to the effective time of the Merger. We will also have executive officers from both us and Bats. This new composition of our board of directors and our management team may affect the business strategy and operating decisions of the combined company upon the completion of the Merger.
We will incur significant transaction and integration costs in connection with the Merger.
We and Bats expect to incur a number of costs associated with completing the Merger and integrating the operations of the two companies. The substantial majority of these costs will be non-recurring expenses resulting from the Merger and will consist of transaction costs related to the Merger, facilities and systems consolidation costs and employment‑related costs. Additional unanticipated costs may be incurred in the integration of our businesses with Bats’ businesses. Although we expect that the elimination of duplicative costs, as well as the realization of other efficiencies related to the integration of the businesses, will offset incremental transaction and Merger-related costs over time, this net benefit may not be achieved in the near term, or at all.
We may not realize all of the anticipated benefits of the transactions contemplated by the Merger Agreement or such benefits may take longer to realize than expected.
The success of the Merger will depend, in part, on our ability to realize the anticipated benefits from combining our businesses with Bats’ businesses. Our ability to realize the anticipated benefits of the Merger will depend, to a large extent, on our ability to integrate our businesses with Bats’ businesses. The combination of two independent companies is a complex, costly and time-consuming process. As a result, the combined company will be required to devote significant management attention and resources to integrating our business practices and operations with those of Bats. The integration process may disrupt the business of either or both of the companies and, if implemented ineffectively, could preclude realization of the full benefits expected by us. The failure of the combined company to meet the challenges involved in integrating successfully our operations with those of Bats or otherwise to realize the anticipated benefits of the proposed transactions could cause an interruption of, or a loss of momentum in, the activities of the combined company and could seriously harm its results of operations. In addition, the overall integration of the two companies may result in material unanticipated problems, expenses, liabilities, competitive responses, loss of client relationships and diversion of management’s attention, and may cause the combined company’s stock price to decline. The difficulties of combining the operations of the companies include, among others:
|
•
|
unanticipated issues in integrating information technology, communications and other systems;
|
|
•
|
unforeseen expenses or delays associated with the integration or the Merger;
|
|
•
|
managing a significantly larger company;
|
|
•
|
the potential diversion of management focus and resources from other strategic opportunities and from operational matters, and potential disruption associated with the Merger;
|
|
•
|
maintaining employee morale and retaining key management and other key employees;
|
|
•
|
integrating two unique business cultures, which may prove to be incompatible;
|
|
•
|
the possibility of faulty assumptions underlying expectations regarding the integration process and expense synergies;
|
|
•
|
consolidating corporate and administrative infrastructures and eliminating duplicative operations;
|
|
•
|
coordinating geographically separate organizations;
|
33
|
•
|
changes in applicable laws and regulations;
|
|
•
|
managing costs or inefficiencies associated with integrating the operations of the combined company; and
|
|
•
|
making any necessary modifications to internal financial control standards to comply with the Sarbanes Oxley Act of 2002 and the rules and regulations promulgated thereunder.
|
Many of these factors will be outside of our control and any one of them could result in increased costs, decreases in the amount of expected revenues and diversion of management’s time and energy, which could materially impact our business, financial condition and results of operations. In addition, even if Bats’ and our operations are integrated successfully, we may not realize the full benefits of the proposed transactions, including the synergies, cost savings or growth opportunities that we expect. These benefits may not be achieved within the anticipated time frame, or at all. As a result, we cannot assure you that the combination of Bats with us
will result in the realization of the full benefits anticipated from the transactions contemplated by the Merger Agreement.
A failure to integrate successfully or a material disruption in information technology systems could adversely affect the combined company’s business and results of operations.
The combined company will rely extensively on its information technology systems. The failure of information technology systems to operate effectively, difficulty in integrating our information technology systems with Bats’ information technology systems, inconsistencies in standards, controls, procedures and policies and problems with transitioning to upgraded or replacement systems could adversely impact the business of the combined company. In addition, a number of our TPHs are not connected to Bats’ information technology platforms and will be required to complete the process of connecting to these platforms as part of the integration.
The process of integrating information technology systems may take longer, cost more and provide fewer synergies than initially anticipated. There may also be new regulations adopted during the transition period that require systems changes, which could divert attention away from integration process and cause delays. To the extent this occurs, the benefits of the proposed transaction may be reduced, delayed or may never come to fruition. Although Bats has experience with transitioning other businesses to its information technology platform, there are certain portions of our business, such as open outcry trading and complex order trading, that have not yet been addressed by Bats’ information technology platform.
We currently expect to complete the integration of our information technology systems with those of Bats in phases over a four-year period following the Merger. However, we may not be able to successfully achieve the transition on the timetable currently contemplated, and the transition may not be successful or could encounter various difficulties and unexpected issues. Any delays or issues that we encounter in the transition could have a material adverse effect on the businesses of the combined company and could negatively affect our reputation, which in turn could have a material adverse effect on the combined company’s overall business, results of operations and financial condition, as well as impair customer confidence in the combined company’s product offerings and overall services.
If the combined company is unable to manage its growth, its business and financial results could suffer.
The combined company’s future financial results will depend in part on its ability to manage its core businesses, including any growth that the combined company may be able to achieve. Over the past several years, we
and Bats have each engaged in the identification of, and competition for, growth and expansion opportunities. In order to achieve those initiatives, the combined company will need to, among other things, recruit, train, retain and effectively manage employees and expand its operations and financial control systems. If the combined company is unable to manage its businesses effectively and profitably, its business and financial results could suffer.
To be successful, the combined company must retain and motivate key employees, including those experienced with post-acquisition integration, and failure to do so could seriously harm the combined company.
The success of the combined company largely depends on the skills, experience and continued efforts of management and other key personnel. As a result, to be successful, the combined company must retain and motivate executives and other key employees. In particular, the combined company expects to benefit from the integration experience of certain Bats personnel. Certain key executives of Bats have executed offer letters with us to continue their employment following the Merger. However, these executives will continue to be at‑will employees, and the offer letters provide no assurance that these executives will remain with the combined company. Additionally, certain of our information technology employees will be
34
important to retain during the transition period to effectively manage our information technology platforms and to assist Bats in the process of integrating its information technology platform. If these personnel were to leave, the combined company may experience increased difficulty in the post-Merger integration process, maintenance of the current information technology platform and may not be able to adequately replace such personnel, which could have a material adverse effect on the combined company’s overall business, results of operations and financial condition.
Our and Bats’ employees may experience uncertainty about their future roles with the combined company until integration strategies for the combined company are announced or executed. These circumstances may adversely affect the combined company’s ability to retain key personnel. The combined company also must continue to motivate employees and maintain their focus on the strategies and goals of the combined company. Doing so may be difficult due to the uncertainties and challenges associated with post-Merger integration. If the combined company is unable to retain executives and other key employees, the roles and responsibilities of such executive officers and employees will need to be filled either by existing or new officers and employees, which may require the combined company to devote time and resources to identifying, hiring and integrating replacements for the departed executives and employees that could otherwise be used to integrate our and Bats’ businesses or otherwise pursue business opportunities. There can be no assurance that the combined company will be able to retain and motivate its employees in the same manner as we
and Bats have historically done.
The combined company may need to hire additional personnel in order to assist with the transition of our businesses to the Bats information technology platform. It may be difficult for the combined company to retain and recruit qualified employees in sufficient numbers, and if the combined company is unable to satisfy its needs for qualified and capable employees, its business and operating results could be adversely affected.
There is substantial competition for qualified and capable personnel in the technology space, which may make it difficult for the combined company to retain and recruit qualified employees in sufficient numbers. Increased difficulty in retaining or recruiting sufficient and qualified personnel by the combined company may lead to increased employment compensation costs, which could adversely affect the combined company’s results of operations. In addition, the increased number of employees may impose a significant administrative burden on the combined company. If the combined company is unable to retain and recruit highly qualified employees by offering competitive compensation, stable work environment and leadership opportunities now and in the future, the combined company’s business and operating results could be negatively impacted.
Bats generates a significant percentage of its total revenues from, and is provided with significant liquidity in its markets and other services by, entities who are affiliates of its significant stockholders, and there is no assurance that such entities will continue to generate such revenue or provide such liquidity and other services after the completion of the Merger.
Bats earns a significant percentage of its revenue from customers who are affiliates of its significant stockholders. In addition, Bats relies on certain entities who are affiliates of significant Bats stockholders to route orders that are not routed directly by Bats and to clear certain trades routed to other markets. The significant stockholders of Bats may not receive shares of our common stock in the Merger, or even if they do, their proportionate stake in the combined company will be significantly less than their stake in Bats prior to the Merger, so there may be less incentive for the affiliates of Bats’ significant stockholders to maintain their current business relationships with the combined company following the Merger at current levels or at all. If the affiliates of Bats’ significant stockholders do not remain customers following the Merger at current levels or at all or if any of the affiliates of Bats’ significant stockholders do not continue to route and clear trades as they did prior to the Merger, the combined company may experience decreased revenues and business interruptions, which could have a material adverse effect on the business, results of operations and financial condition of the combined company.
The combined company will record goodwill and intangible assets that could become impaired and adversely affect its results of operations and financial condition.
Accounting standards in the United States require that one party to the Merger be identified as the acquirer. In accordance with these standards, the Merger will be accounted for as an acquisition of Bats by us
and will follow the acquisition method of accounting for business combinations. The assets and liabilities of Bats will be consolidated with our assets and liabilities. The excess of the purchase price over the fair values of Bats’ assets and liabilities, if any, will be recorded as goodwill.
We will be required to assess goodwill and intangible assets for impairment at least annually. In the future we may take charges against earnings resulting from impairment. Any determination requiring the write off of a significant portion of our goodwill or other intangible assets could adversely affect our results of operations and financial condition.
35
The Merger may not be accretive and may cause dilution to our earnings per share, which may negatively affect the market price of our common stock.
We currently anticipate that the Merger will be accretive to adjusted earnings per share in the first year following the completion of the Merger. This expectation is based on preliminary estimates, which may materially change. We could also encounter additional transaction and integration‑related costs or other factors such as the failure to realize all of the benefits anticipated in the Merger. All of these factors could cause dilution to our earnings per share or decrease or delay the expected accretive effect of the Merger and cause a decrease in the price of our common stock.
The combined company will indirectly hold 100% of the issued share capital and voting rights in Bats Trading Limited (“BTL”) and its wholly owned subsidiary, Chi-X Europe Limited (“Chi-X Europe”). As a result, any person who holds, or has voting power with respect to, 10% or more of the outstanding shares of our common stock following the effective time of the Merger, will be subject to certain regulatory requirements under U.K. law.
A person that indirectly acquires control in a FCA entity is required to file a change in control notice with the FCA. Though both are FCA regulated entities, the statutorily prescribed change in control notification threshold for BTL is acquisition of voting power with respect to 20% or more of the issued share capital thereof. The change in control notification threshold for Chi-X Europe is acquisition of voting power with respect to 10% or more of the issued share capital thereof. Therefore, any person who holds, or has voting power with respect to, 10% or more of the outstanding shares of our common stock will be required to file a change in control notice in respect of Chi-X Europe and, if this holding is in excess of 20%, also for BTL. This obligation may discourage, delay or prevent accumulations of 10% or more of our common stock
.
Item 1B.
Unresolved Staff Comments
Not applicable.
Item 2.
Properties
Our principal offices are located at 400 South LaSalle Street, Chicago, Illinois 60605. Through our wholly-owned subsidiary, Chicago Options Exchange Building Corporation, we own the building in which our principal offices are located and occupy approximately 300,000 square feet of this building. In addition to our principal offices, we lease approximately 13,000 square feet, which includes office space, our data center and remote network operations.
We believe the space we occupy is sufficient to meet our current and expected future needs.
Item 3.
Legal Proceedings
As of
December 31, 2016
, the end of the period covered by this report, the Company was subject to the various legal proceedings and claims discussed below, as well as certain other legal proceedings and claims that have not been fully resolved and that have arisen in the ordinary course of business.
The Company reviews its legal proceedings and claims, regulatory reviews and inspections and other legal proceedings on an ongoing basis and follows appropriate accounting guidance when making accrual and disclosure decisions. The Company establishes accruals for those contingencies where the incurrence of a loss is probable and can be reasonably estimated, and we disclose the amount accrued and the amount of a reasonably possible loss in excess of the amount accrued, if such disclosure is necessary for our financial statements to not be misleading. The Company does not record liabilities when the likelihood that the liability has been incurred is probable, but the amount cannot be reasonably estimated, or when the liability is believed to be only reasonably possible or remote. The Company's assessment of whether a loss is reasonably possible or probable is based on its assessment of the ultimate outcome of the matter following all appeals.
As of
December 31, 2016
, the Company does not believe that there is a reasonable possibility that any material loss exceeding the amounts already recognized for these reviews, inspections or other legal proceedings, if any, has been incurred. While the consequences of certain unresolved proceedings are not presently determinable, the outcome of any litigation is inherently uncertain and an adverse outcome from certain matters could have a material effect on our earnings in any given reporting period. However, in the opinion of management, the ultimate liability is not expected to have a material effect on our financial position, liquidity or capital resources.
Lanier Litigation
On May 23, 2014, Harold R. Lanier sued 14 securities exchanges, including CBOE, in the United States District Court for the Southern District of New York (the "Court") on behalf of himself and a putative class consisting of all persons in the
36
United States who entered into contracts to receive market data through certain data plans at any time since May 19, 2008 to the present. The complaint alleged that the market data provided under the CQ Plan and CTA Plans was inferior to the data that the exchanges provided to those that directly receive other data from the exchanges, which the plaintiffs alleged is a breach of their “subscriber contracts” and a violation of the exchanges’ obligations under the CQ and CTA Plans. The plaintiffs sought monetary and injunctive relief. On May 30, 2014, Mr. Lanier filed two additional suits in the same Court, alleging substantially the same claims and requesting the same types of relief against the exchanges who participate in the UTP and the OPRA data plans. CBOE was a defendant in each of these suits, while C2 was only a defendant in the suit regarding the OPRA Plan. On April 28, 2015, the Court dismissed Lanier’s complaint with prejudice because it was preempted by the federal regulatory scheme and because the claims were precluded by the terms of the applicable subscriber agreements. Mr. Lanier appealed the orders dismissing each of his three cases and, on September 2, 2015, he filed his opening appellate briefs in those cases. The defendants’ response briefs were filed November 24, 2015 and briefing on the appeals has concluded. The oral arguments on the appeals were heard on March 3, 2016. On September 23, 2016, the Court of Appeals ruled in favor of the defendants and affirmed the Court’s dismissal of Lanier’s complaints with prejudice. On October 7, 2016, Lanier filed a petition for rehearing only in the action related to the OPRA Plan and the Court of Appeals ruling with respect to the other two complaints is now final. On November 4, 2016, the Court of Appeals denied the petition for rehearing in the case related to the OPRA Plan.
Other
As a self-regulatory organization under the jurisdiction of the SEC, with respect to CBOE and C2, and as a designated contract market under the jurisdiction of the CFTC, with respect to CFE, we are subject to routine reviews and inspections by the SEC and the CFTC.
We are also currently a party to various other legal proceedings in addition to those already mentioned. Management does not believe that the outcome of any of these other reviews, inspections or other legal proceedings will have a material impact on our consolidated financial position, results of operations or cash flows.
Item 4.
Mine Safety Disclosures
Not applicable.
37
Item 5.
Market for Registrant's Common Equity, Related Stockholder Matters and Issuer Purchases of Equity Securities
Common Stock
The Company's common stock is listed on the NASDAQ Global Select Market under the trading symbol CBOE. As of January 31, 2017, there were approximately 145 holders of record of our common stock.
The following table sets forth the high and low sales prices by quarter for shares of our common stock as reported on NASDAQ and cash dividends declared per quarter:
|
|
Price Range
|
Cash
Dividends Declared
per Share
|
|||||||||
|
Calendar Period
|
High
|
Low
|
|||||||||
|
2015
|
|
|
|
||||||||
|
First Quarter
|
$
|
68.00
|
|
$
|
56.57
|
|
$
|
0.21
|
|
||
|
Second Quarter
|
59.64
|
|
55.04
|
|
0.21
|
|
|||||
|
Third Quarter
|
67.22
|
|
57.41
|
|
0.23
|
|
|||||
|
Fourth Quarter
|
72.53
|
|
63.65
|
|
0.23
|
|
|||||
|
2016
|
|
|
|
||||||||
|
First Quarter
|
67.41
|
|
58.43
|
|
0.23
|
|
|||||
|
Second Quarter
|
66.95
|
|
61.22
|
|
0.23
|
|
|||||
|
Third Quarter
|
71.05
|
|
64.62
|
|
0.25
|
|
|||||
|
Fourth Quarter
|
77.29
|
|
61.58
|
|
0.25
|
|
|||||
|
2017
|
|||||||||||
|
Through February 16, 2017 (1)
|
80.47
|
|
72.54
|
|
0.25
|
|
|||||
(1) On February 16, 2017, the Company's board of directors declared a quarterly cash dividend of
$0.25
per share. The dividend is payable on March 24, 2017 to stockholders of record at the close of business on March 3, 2017.
Dividends
Each share of common stock, including restricted stock awards and restricted stock units, is entitled to receive dividend and dividend equivalents, respectively, if, as and when declared by the board of directors of the Company.
The Company’s expectation is to continue to pay dividends. The decision to pay a dividend, however, remains within the discretion of the Company's board of directors and may be affected by various factors, including our earnings, financial condition, capital requirements, level of indebtedness and other considerations our board of directors deems relevant. Future debt obligations and statutory provisions, among other things, may limit, or in some cases prohibit, our ability to pay dividends.
As a holding company, the Company's ability to declare and continue to pay dividends in the future with respect to its common stock will also be dependent upon the ability of its subsidiaries to pay dividends to it under applicable corporate law.
Recent Sales of Unregistered Securities
Not applicable.
Use of Proceeds
Not applicable.
Purchases of Equity Securities by the Issuer and Affiliated Purchasers
In 2011, the board of directors approved an initial authorization for the Company to repurchase shares of its outstanding common stock of $100 million and approved additional authorizations of $100 million in each of 2012, 2013, 2014, 2015, and February 2016 for a total authorization of $600 million. The program permits the Company to purchase shares through a variety of methods, including in the open market or through privately negotiated transactions, in accordance with applicable securities laws. It does not obligate the Company to make any repurchases at any specific time or situation.
38
Under the program, for the year ended
December 31, 2016
, the Company purchased
947,786
shares of common stock at an average cost per share of
$63.83
totaling
$60.5 million
. Since inception of the program through
December 31, 2016
, the Company has purchased
10,947,401
shares of common stock at an average cost per share of
$45.95
totaling
$503.0 million
.
As of
December 31, 2016
, the Company had
$97 million
of availability remaining under its existing share repurchase authorizations. As a result of our pending transaction with Bats, we were not active in our share repurchase program during the third and fourth quarters of 2016.
Stockholder Return Performance Graph
The following graph compares the cumulative total return provided to stockholders on our common stock since our initial public offering against the return of the S&P Midcap 400 Index and a customized peer group that includes CME Group Inc., Intercontinental Exchange Inc., NASDAQ, Inc. and CBOE Holdings.
An investment of $100, with reinvestment of all dividends, is assumed to have been made in our common stock, the index and the peer groups on December 31, 2011, and its performance is tracked on a annual basis through
December 31, 2016
.
39
Comparison of Cumulative Total Return of the
Company, Peer Groups, Industry Indexes and/or Broad Markets
COMPARISON OF 5 YEAR CUMULATIVE TOTAL RETURN*
Among CBOE Holdings, Inc., the S&P Midcap 400 Index
and a Peer Group
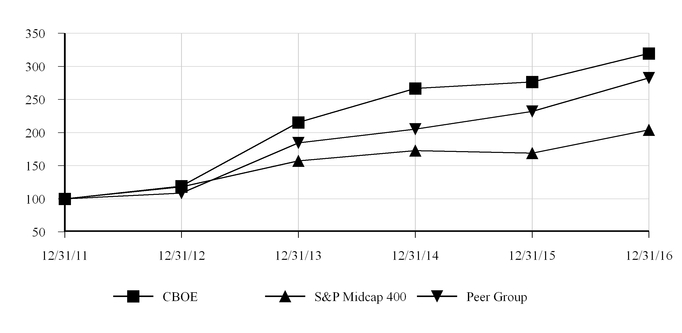
__________________________________________
* $100 invested on 12/31/11 in stock or index, including reinvestment of dividends.
Fiscal year ending December 31.
Copyright© 2017 Standard & Poor's, a division of S&P Global. All rights reserved.
|
12/2011
|
12/2012
|
12/2013
|
12/2014
|
12/2015
|
12/2016
|
|||||||
|
CBOE Holdings, Inc.
|
100
|
|
119.10
|
|
215.30
|
|
266.60
|
|
276.63
|
|
319.56
|
|
|
S&P Midcap 400
|
100
|
|
117.88
|
|
157.37
|
|
172.74
|
|
168.98
|
|
204.03
|
|
|
Peer Group
|
100
|
|
108.45
|
|
184.46
|
|
205.09
|
|
231.94
|
|
282.72
|
|
40
Item 6.
Selected Financial Data
The following table shows selected financial data of the Company that should be read together with "Management's Discussion and Analysis of Financial Condition and Results of Operations" and the Consolidated Financial Statements and corresponding notes included in Items 7 and 8, respectively, of this Form 10-K:
|
|
Year Ended December 31,
|
||||||||||||||||||
|
|
2016
|
2015
|
2014
|
2013
|
2012
|
||||||||||||||
|
|
(In thousands, except per share amounts)
|
||||||||||||||||||
|
Income Statement Data:
|
|
|
|
||||||||||||||||
|
Total operating revenues
|
$
|
656,946
|
|
$
|
634,545
|
|
$
|
617,225
|
|
$
|
572,050
|
|
$
|
512,338
|
|
||||
|
Total operating expenses
|
358,746
|
|
314,617
|
|
303,424
|
|
286,236
|
|
268,241
|
|
|||||||||
|
Operating income
|
298,200
|
|
319,928
|
|
313,801
|
|
285,814
|
|
244,097
|
|
|||||||||
|
Total other income/(expense)
|
8,404
|
|
4,096
|
|
(4,104
|
)
|
(2,158
|
)
|
(1,546
|
)
|
|||||||||
|
Income before income taxes
|
306,604
|
|
324,024
|
|
309,697
|
|
283,656
|
|
242,551
|
|
|||||||||
|
Income tax provision
|
120,884
|
|
119,001
|
|
119,983
|
|
107,657
|
|
85,156
|
|
|||||||||
|
Net income
|
$
|
185,720
|
|
$
|
205,023
|
|
$
|
189,714
|
|
$
|
175,999
|
|
$
|
157,395
|
|
||||
|
Net income allocated to common stockholders
|
$
|
184,945
|
|
$
|
204,125
|
|
$
|
188,392
|
|
$
|
173,863
|
|
$
|
155,254
|
|
||||
|
Net income per share allocated to common stockholders
|
|
|
|
||||||||||||||||
|
Basic
|
$
|
2.27
|
|
$
|
2.46
|
|
$
|
2.21
|
|
$
|
1.99
|
|
$
|
1.78
|
|
||||
|
Diluted
|
2.27
|
|
2.46
|
|
2.21
|
|
1.99
|
|
1.78
|
|
|||||||||
|
Cash dividends declared per share (1) (2)
|
0.96
|
|
0.88
|
|
0.78
|
|
1.16
|
|
1.29
|
|
|||||||||
|
Balance Sheet Data:
|
|
|
|
||||||||||||||||
|
Total assets
|
$
|
476,615
|
|
$
|
384,788
|
|
$
|
383,901
|
|
$
|
441,589
|
|
$
|
338,858
|
|
||||
|
Total liabilities
|
146,069
|
|
125,143
|
|
133,834
|
|
157,072
|
|
99,736
|
|
|||||||||
|
Redeemable noncontroling interests
|
12,600
|
|
—
|
|
—
|
|
—
|
|
—
|
|
|||||||||
|
Total stockholders' equity
|
317,946
|
|
259,645
|
|
250,067
|
|
284,517
|
|
239,122
|
|
|||||||||
|
Average daily volume by product (3)
|
|
|
|
||||||||||||||||
|
Equities
|
1,446
|
|
1,559
|
|
1,939
|
|
1,721
|
|
1,977
|
|
|||||||||
|
Indexes
|
1,719
|
|
1,620
|
|
1,613
|
|
1,479
|
|
1,217
|
|
|||||||||
|
Exchange-traded products
|
1,297
|
|
1,274
|
|
1,507
|
|
1,353
|
|
1,247
|
|
|||||||||
|
Total options average daily volume
|
4,462
|
|
4,453
|
|
5,059
|
|
|
4,553
|
|
|
4,441
|
|
|||||||
|
Futures
|
239
|
|
205
|
|
201
|
|
159
|
|
96
|
|
|||||||||
|
Total average daily volume
|
4,701
|
|
4,658
|
|
5,260
|
|
|
4,712
|
|
|
4,537
|
|
|||||||
__________________________________________
|
(1)
|
On December 11, 2012, the Company's board of directors declared a special cash dividend of $0.75 per share. This was in addition to the quarterly cash dividends which aggregated $0.54 per share for the year ended December 31, 2012.
|
|
(2)
|
On December 10, 2013, the Company's board of directors declared a special cash dividend of $0.50 per share. This was in addition to the quarterly cash dividends which aggregated $0.66 per share for the year ended December 31, 2013.
|
|
(3)
|
Average daily volume equals the total contracts traded during the period divided by the number of trading days in the period.
|
41
Item 7.
Management's Discussion and Analysis of Financial Condition and Results of Operations
General
Management's Discussion and Analysis of Financial Condition and Results of Operations ("MD&A") should be read in conjunction with the consolidated financial statements of the Company and the notes thereto included in Item 8 of this Annual Report on Form 10-K. The following discussion contains forward-looking statements. Actual results could differ materially from the results discussed in the forward-looking statements. See "Risk Factors" and "Forward-Looking Statements" above.
Overview
CBOE Holdings, Inc. is the holding company for Chicago Board Options Exchange, Incorporated, CBOE Futures Exchange, LLC, C2 Options Exchange, Incorporated and other subsidiaries, including our majority ownership in CBOE Vest Financial Group, Inc.
The Company's principal business is operating markets that offer for trading options on various market indexes (index options), mostly on an exclusive basis, and futures contracts, as well as on non-exclusive "multiply-listed" options, such as options on the stocks of individual corporations (equity options) and options on other exchange-traded products (ETP options), such as exchange-traded funds (ETF options) and exchange-traded notes (ETN options). The Company operates CBOE, CFE and C2 as stand-alone exchanges, but reports the results of its operations in a single reporting segment.
CBOE is our primary options market and offers trading in listed options through a single system that integrates electronic trading and traditional open outcry trading on our trading floor in Chicago. This integration of electronic trading and traditional open outcry trading into a single exchange is known as our Hybrid trading model. CFE, our all-electronic futures exchange, offers trading of futures on the VIX Index and other products. C2 is our all-electronic exchange that also offers trading of listed options, and may operate with a different market model and fee structure than CBOE. All of our exchanges operate on our proprietary technology platform known as CBOE Command.
Business Highlights
|
•
|
On September 25, 2016, CBOE Holdings and Bats entered into the Merger Agreement. The completion of the Merger is subject to certain conditions, including, among others, receipt of certain regulatory approvals. The Merger is expected to close on February 28, 2017. For more information, see "Business—Pending Merger" above.
|
|
•
|
In connection with entering into the Merger Agreement, we entered into a commitment letter relating to a $1.65 billion senior unsecured 364-day bridge loan facility. In lieu of entering into the bridge loan facility, CBOE Holdings entered into a term loan agreement and completed a notes offering, securing $1.65 billion to finance the cash portion of its pending acquisition of Bats as well as the repayment of Bats' existing indebtedness.
|
|
•
|
On December 15, 2016, we entered into a $1.0 billion senior unsecured delayed draw term loan facility and on January 12, 2017, we issued $650 million aggregate principal amount of our 3.650% Senior Notes due 2027.
|
|
•
|
On December 15, 2016, we entered into a $150 million revolving credit facility to be used for working capital and other general corporate purposes.
|
|
•
|
Transaction fees accounted for
70.5%
,
71.9%
and
70.9%
of total operating revenues for the years ended
December 31, 2016
,
2015
and
2014
, respectively.
|
|
•
|
Index options and futures contracts accounted for
88.2%
,
82.9%
and
81.8%
of our transaction fees for the years ended
December 31, 2016
,
2015
and
2014
, respectively.
|
|
•
|
Our share of total U.S. exchange-traded options contracts for the year ended
December 31, 2016
was
27.7%
, up from
27.1%
in
2015
and down from
29.9%
in
2014
.
|
|
•
|
Operating expenses were
54.7%
,
49.6%
and
49.2%
, of total operating revenues for the years ended
December 31, 2016
,
2015
and
2014
, respectively.
|
|
•
|
Compensation and benefits, representing our largest expense category, were
17.2%
,
16.7%
and
19.7%
, of total operating revenues for the years ended
December 31, 2016
,
2015
and
2014
, respectively.
|
|
•
|
Professional fees and outside services for the year ended
December 31, 2016
includes
$13.7 million
of acquisition-related costs, consisting mainly of legal and professional fees.
|
42
Business Strategy
We believe that the derivatives industry, especially the listed options and futures industry, has significant growth potential, including through new participants and products. We expect to further expand our business and increase our revenues and profitability by pursuing the following growth strategies:
|
•
|
We intend to continue our efforts to expand the use of our products domestically and internationally through extended trading hours in our exclusive index options and futures products and investor education.
|
|
•
|
We intend to continue developing innovative proprietary products that meet the needs of the derivatives industry and complement our core products, both through strategic relationships and internal development.
|
|
•
|
We have designed our fee schedule to provide economic benefits to market participants that concentrate their overall trading activity at our exchanges.
|
|
•
|
We intend to continue to enhance our trading platform by continuing to invest in enhancing and augmenting the functionality and capacity of our trading systems and by developing the next generation of trading technology, CBOE Vector. However, the launch of CBOE Vector on CFE is suspended due to the pending Merger.
|
|
•
|
We evaluate strategic opportunities that leverage and complement our core business and that we believe will enhance stockholder value.
|
In addition, we believe the recently announced Merger squarely fits into our growth strategy outlined above to develop unique products, expand our customer base and leverage alliances that complement our core business. Specifically, we believe that the Merger has the potential to significantly expand and diversify our product line across new asset classes, such as U.S. and European equities, ETF trading and global FX products, broaden our reach with Bats’ market-leading European presence and increase our non-transactional revenue stream, while enabling us to streamline the combined company’s technology and enhance our strong growth and margin profile.
Components of Operating Revenues
Transaction Fees
The primary and largest source of operating revenues is transaction fees. Transaction fees are a function of many variables with the main three being: (1) exchange fee rates; (2) trading volume mix (products traded); and (3) transaction mix between origin type. Because transaction fees are assessed on a per contract basis, transaction fee revenue is correlated to the volume of contracts traded on the Company's exchanges. While exchange fee rates are established by the Company, trading volume and transaction mix are influenced by a number of factors, including price competition, price volatility in the underlying securities and national and international economic and political conditions.
Revenue is recorded as transactions occur on a trade-date basis. The main products that trade on our exchanges are equity, index and ETP options and futures contracts.
|
•
|
Equity options reflect trading in options contracts on the stocks of individual companies.
|
|
•
|
Index options reflect trading in index options contracts on market indexes.
|
|
•
|
ETP options include ETF options that are options on baskets of stocks designed to generally track an index, but which trade like individual stocks, and ETN options that are options on senior, unsecured, unsubordinated debt securities issued by an underwriting bank.
|
|
•
|
Futures contracts are standardized, transferable, exchange-traded contracts that require delivery of a commodity, bond, currency, stock index or other benchmark interests at a specified price and on a specified future date, which are settled in cash.
|
Access Fees
Access fees represent fees assessed to Trading Permit and Privilege Holders for the opportunity to trade, including fees for trading-related functionality, on CBOE, C2 and CFE. The CBOE program contains a tier-based market-maker appointment system with different trading permits based on trading function and, in the case of market-makers, the assessment of a surcharge for certain CBOE proprietary products and sliding scales for all Market-Maker and Floor Broker Trading Permits held by affiliated Trading Permit Holders and TPH Organizations that are used in any options classes other than certain proprietary indexes. The number of trading permits made available is limited.
43
Exchange Services and Other Fees
To facilitate trading, the Company offers technology services, terminal and other equipment rentals, maintenance services, trading floor space and telecommunications services. Trading floor and equipment rentals are generally on a month-to-month basis. Facilities, systems services and other fees are generally monthly fee-based, although certain services are influenced by trading volume or other defined metrics, while others are based solely on demand. The revenues generated by Livevol for market data services and trading analytics platforms are also included in this line item.
Market Data Fees
Market data fees represent income derived from the sale of our transaction information through the Options Price Reporting Authority ("OPRA") and primarily through our subsidiary, Market Data Express, LLC ("MDX"). Through MDX, we sell historical options data, as well as real-time data for certain proprietary products and indexes. It also provides market data through CBOE Streaming Markets, a high-availability, low latency streaming data feed. OPRA is a limited liability company consisting of representatives of the member exchanges, including CBOE and C2, authorized by the SEC to provide consolidated options information. OPRA gathers market data from various options exchanges, including CBOE and C2, and, in turn, disseminates this data to third parties who pay fees to OPRA to access the data. Revenue generated by OPRA from the dissemination of market data is shared among OPRA members according to the number of total cleared options transactions by each of the member exchanges as calculated each quarter. OPRA is not consolidated with the Company.
Regulatory Fees
Regulatory fees are charged to Trading Permit Holders in support of our regulatory responsibilities as self-regulatory organizations under the Exchange Act. Regulatory fees include an Options Regulatory Fee under which fees are based on industry-wide customer volume of Trading Permit Holders and designated examining authority fees for certain Trading Permit Holders. This source of revenue could decline in the future if the number of customer contracts executed by Trading Permit Holders declines and rates are not increased or are decreased or if our costs to perform our regulatory responsibilities stabilize or decrease.
The SEC requires that the revenues derived from certain of the fees from our regulatory functions, some of which are included in this revenue category, and regulatory fines, must be used for regulatory purposes. Expenses related to our regulatory functions are included in our operating expenses, mainly in compensation and benefits in 2014 and professional fees and outside services starting in 2015 as a result of the transition of certain regulatory systems to FINRA.
Other Revenue
The following sub-categories are the sources of revenue within this category:
|
•
|
Revenue generated through various licensing agreements;
|
|
•
|
Revenue derived from fines assessed for rule violations;
|
|
•
|
Revenue associated with advertisements through our corporate web site,
www.cboe.com
;
|
|
•
|
Revenue generated from courses and seminars offered through CBOE's Options Institute;
|
|
•
|
Revenue generated through regulatory service agreements with other options exchanges (as of 2015, we no longer generated revenue from these regulatory service agreements);
|
|
•
|
Revenue generated through our order routing cancel fee (as of 2015, we waived order routing cancel fees) and position transfer fee;
|
|
•
|
Rental of commercial space in the lobby of our building; and
|
|
•
|
Other sources of revenue.
|
44
Components of Operating Expenses
Most of our expenses do not vary directly with changes in our trading volume except royalty fees and order routing.
Compensation and Benefits
Compensation and benefits are our most significant expenses and include salaries and benefits, stock-based compensation, incentive compensation, severance and employer taxes. Salaries and benefits represent our largest expense category and tend to be driven by both our staffing requirements and the general dynamics of the employment market. Stock-based compensation is a non-cash expense related to equity awards. Stock-based compensation can vary depending on the quantity and fair value of the award on the date of grant and the related service period.
Depreciation and Amortization
Depreciation and amortization expense results from the depreciation of long-lived assets purchased and the amortization of purchased and internally developed software.
Technology Support Services
Technology support services expense consists primarily of costs related to the maintenance of computer equipment supporting our system architecture, circuits supporting our wide area network, support for production software, fees paid to information vendors for displaying data and off-site system hosting fees.
Professional Fees and Outside Services
Professional fees and outside services consist primarily of consulting services, which include: the supplementation of staff for activities primarily related to systems development and maintenance, legal, regulatory and audit, tax advisory services and acquisition-related costs, consisting mainly of legal and professional fees.
Royalty Fees
Royalty fees primarily consist of license fees paid for the use of underlying indexes in our proprietary products usually based on contracts traded. The Company has licenses with the owners of the S&P 500 Index, S&P 100 Index and certain other S&P indexes, the DJIA, MSCI, FTSE Russell indexes and certain other index products. This category also includes fees related to the dissemination of market data related to S&P indexes and in prior years, certain fees paid to market participants for order flow that they directed or caused to be directed to our exchanges.
Order Routing
Order routing consists of market linkage expenses incurred to send certain orders to other exchanges. If a competing exchange quotes a better price, we route the customer's order to that exchange and pay certain of the associated costs. Regardless of whether the transaction is traded at our options exchanges, the order flow potential enhances our overall market position and participation and provides cost savings to customers.
Travel and Promotional Expenses
Travel and promotional expenses primarily consist of advertising, costs for special events, sponsorship of industry conferences, options education seminars and travel related expenses.
Facilities Costs
Facilities costs primarily consist of expenses related to owned and leased properties including rent, maintenance, utilities, real estate taxes and telecommunications costs.
Other Expenses
Other expenses represent costs necessary to support our operations but are not included in the above categories.
Other Income/(Expense)
Income and expenses incurred through activities outside of our core operations are considered non-operating and are classified as other income/(expense). These activities primarily include interest earned on the investing of excess cash, interest expense related to outstanding debt facilities, dividend income and equity earnings or losses from our investments in other business ventures.
45
Critical Accounting Policies and Estimates
The preparation of the Company's consolidated financial statements requires the Company to make estimates and judgments that affect the reported amounts of assets, liabilities, revenue and expenses, and related disclosure of contingent assets and liabilities. On an ongoing basis, the Company evaluates its estimates, including those related to areas that require a significant level of judgment or are otherwise subject to an inherent degree of uncertainty. The Company bases its estimates on historical experience, observance of trends in particular areas, information available from outside sources and various other assumptions that are believed to be reasonable under the circumstances. Information from these sources form the basis for making judgments about the carrying values of assets and liabilities that may not be readily apparent from other sources. Actual amounts may differ from these estimates under different assumptions or conditions.
We have identified the policies below as critical to our business operations and the understanding of our results of operations. The impact of, and any associated risks related to, these policies on our business operations is discussed throughout "Management's Discussion and Analysis of Financial Condition and Results of Operations." For a detailed discussion on the application of these and other accounting policies, see Note
1
to our consolidated financial statements and related notes included elsewhere in this Annual Report on Form 10-K.
Revenue Recognition
|
•
|
Transaction fees revenue is considered earned upon the execution of the trade recognized on a trade-date basis and presented net of applicable volume discounts. In the event liquidity providers prepay transaction fees, revenue is recognized based on the attainment of volume thresholds resulting in the amortization of the prepayment over the calendar year.
|
|
•
|
Access fee revenue is recognized during the period access is granted and assurance of collectability is provided.
|
|
•
|
Exchange services and other fees revenue is recognized during the period the service is provided.
|
|
•
|
Market data fees from OPRA are allocated based upon the share of total options transactions cleared for each of the OPRA members and is received quarterly. Revenue from our market data services is recognized in the period the data is provided.
|
|
•
|
Regulatory fees are recognized primarily on a trade-date basis.
|
Income Taxes
Deferred income taxes arise from temporary differences between the tax basis and book basis of assets and liabilities. The Company accounts for income taxes under the asset and liability method, which requires the recognition of deferred tax assets and liabilities for the expected future tax consequences of the events that have been included in the consolidated financial statements. Under this method, deferred tax assets and liabilities are determined based on the differences between the book and tax basis of assets and liabilities using enacted tax rates in effect for the year in which the differences are expected to be reversed. The effect of a change in tax rates on deferred tax assets and liabilities is recognized in the period that includes the enactment date. The Company files tax returns for federal, state and local income tax purposes. A valuation allowance is recognized if it is anticipated that some or all of a deferred tax asset may not be realized.
If the Company considers that a tax position is "more-likely-than-not" to be sustained upon audit, based solely on the technical merits of the position, it recognizes the tax benefit. The Company measures the tax benefit by determining the largest amount that is greater than 50% likely of being realized upon settlement, presuming that the tax position is examined by the appropriate taxing authority that has full knowledge of all relevant information. These assessments can be complex and require specific analysis to determine the impact of the position, as such the Company often obtains assistance from external advisors. The Company considers the information and arrives at the percentage to apply as a possible uncertain portion related to the position. To the extent that the Company's estimates change or the final tax outcome of these matters is different than the amounts recorded, such differences will impact the income tax provision in the period in which such determinations are made. Uncertain tax positions are classified as current only when the Company expects to pay cash within the next twelve months. Interest and penalties, if any, are recorded within the provision for income taxes in the Company's consolidated statements of income and are classified on the consolidated balance sheets with the related liability for unrecognized tax benefits.
Recent Accounting Pronouncements
In May 2014, the FASB issued ASU 2014-09,
Revenue from Contracts with Customers
. This standard outlines a single comprehensive model for entities to use in accounting for revenue arising from contracts with customers and supersedes most current revenue recognition guidance, including industry-specific guidance. In addition, the ASU provides guidance on accounting for certain revenue-related costs including when to capitalize costs associated with obtaining and fulfilling a
46
contract. ASU 2014-09 provides companies with two implementation methods. Companies can choose to apply the standard retrospectively to each prior reporting period presented (full retrospective application) or retrospectively with the cumulative effect of initially applying the standard as an adjustment to the opening balance of retained earnings of the annual reporting period that includes the date of initial application (modified retrospective application). This guidance is effective for annual reporting periods beginning after December 15, 2016, including interim periods within that reporting period. Early application is not permitted. The FASB deferred the effective date by one year to December 15, 2017 for annual reporting periods beginning after that date. Early adoption of the standard is permitted as of annual reporting periods beginning after December 15, 2016, including interim reporting periods within those annual periods. Based on our evaluation of the standard, we do not expect a material impact on our revenue recognition practices. A significant portion of our revenue is generated from fees associated primarily with the execution of a trade, transaction fees and regulatory fees, and revenue is recognized on the trade date as our performance obligation would be complete. The revenue components that are not primarily associated with the execution of a trade, market data fees and exchange service and other fees, are also not expected to be impacted by the adoption of the new standard. In most cases, our performance obligation is fulfilled on a monthly basis and does not require any additional requirements that would require performance beyond a monthly basis. Therefore we do not expect a material impact on our revenue recognition policies as a result of the adoption of the new standard which the Company is considering early adoption prior to the effective date.
In February 2016, the FASB issued ASU 2016-02,
Leases
. This update requires a lessee to recognize on the balance sheet a liability to make lease payments and a corresponding right-of-use asset. The guidance also requires certain qualitative and quantitative disclosures about the amount, timing and uncertainty of cash flows arising from leases. This update is effective for annual and interim periods beginning after December 15, 2018. Early adoption is permitted. The Company is in the process of evaluating this guidance, though we do not expect it will materially impact our consolidated balance sheets, statements of income, comprehensive income or cash flows.
In March 2016, the FASB issued ASU 2016-09,
Compensation — Stock Compensation
. This standard simplifies several aspects of the accounting for stock-based payment transactions, including the recognition of excess tax benefits and deficiencies, the classification of those excess tax benefits on the statement of cash flows, an accounting policy election for forfeitures, the amount an employer can withhold to cover income taxes and still qualify for equity classification and the classification of those taxes paid on the statement of cash flows. This update is effective for annual and interim periods beginning after December 15, 2016 and can be applied either prospectively, retrospectively or using a modified retrospective transition method, depending on the area covered in this update. Early adoption is permitted. The Company is in the process of evaluating this guidance, though we do not expect it will materially impact our consolidated balance sheets, statements of income, comprehensive income or cash flows.
In September 2016, the FASB issued ASU 2016-15,
Statement of Cash Flows (Topic 230) — Classification of Certain Cash Receipts and Cash Payments (a consensus of the FASB Emerging Issues Task Force).
This standard addresses stakeholders’ concerns regarding diversity in practice in how certain cash receipts and cash payments are presented and classified in the statement of cash flows under Topic 230, Statement of Cash Flows, and other Topics. In particular, ASU No. 2016-15 addresses eight specific cash flow issues in an effort to reduce this diversity in practice: (1) debt prepayment or debt extinguishment costs; (2) settlement of zero-coupon bonds; (3) contingent consideration payments made after a business combination; (4) proceeds from the settlement of insurance claims; (5) proceeds from the settlement of corporate-owned life insurance policies, including bank-owned life insurance policies; (6) distributions received from equity method investees; (7) beneficial interests in securitization transactions; and (8) separately identifiable cash flows and application of the predominance principle. For public business entities that are SEC filers, the amendments are effective for fiscal years beginning after December 15, 2017, and for interim periods within those fiscal years. Note that early adoption is permitted for all entities, including adoption during an interim period. The Company is in the process of evaluating this guidance, though we do not expect it will materially impact our consolidated balance sheets, statements of income, comprehensive income or cash flows.
In October 2016, the FASB issued ASU 2016-16,
Accounting for Income Taxes:Intra-Entity Transfers of Assets other than Inventory
. The standard requires that the income tax impact of intra-entity sales and transfers of property, except for inventory, be recognized when the transfer occurs. This update is effective for annual and interim periods beginning after December 15, 2017. Early adoption is permitted. The new standard should be applied by making a cumulative effect adjustment directly to retained earnings as of the beginning of period of adoption.The Company is in the process of evaluating this guidance, and considering early adoption, though we do not expect it will materially impact our consolidated balance sheets, statements of income, comprehensive income or cash flows.
47
Results of Operations
Year ended
December 31, 2016
compared to the year ended
December 31, 2015
Consolidated Results
The following summarizes financial performance for the year ended
December 31, 2016
compared to
2015
.
|
2016
|
2015
|
Inc./(Dec.)
|
Percent
Change
|
|||||||||||
|
|
(in millions, except per share amounts)
|
|
||||||||||||
|
Total operating revenues
|
$
|
656.9
|
|
$
|
634.5
|
|
$
|
22.4
|
|
3.5
|
%
|
|||
|
Total operating expenses
|
358.7
|
|
314.6
|
|
44.1
|
|
14.0
|
%
|
||||||
|
Operating income
|
298.2
|
|
319.9
|
|
(21.7
|
)
|
(6.8
|
)%
|
||||||
|
Total other income/(expense)
|
8.4
|
|
4.1
|
|
4.3
|
|
105.2
|
%
|
||||||
|
Income before income taxes
|
306.6
|
|
324.0
|
|
(17.4
|
)
|
(5.4
|
)%
|
||||||
|
Income tax provision
|
120.9
|
|
119.0
|
|
1.9
|
|
1.6
|
%
|
||||||
|
Net income
|
$
|
185.7
|
|
$
|
205.0
|
|
$
|
(19.3
|
)
|
(9.4
|
)%
|
|||
|
Net income allocated to common stockholders
|
$
|
184.9
|
|
$
|
204.1
|
|
$
|
(19.2
|
)
|
(9.4
|
)%
|
|||
|
Operating income percentage
|
45.4
|
%
|
50.4
|
%
|
|
|
|
|
||||||
|
Net income percentage
|
28.3
|
%
|
32.3
|
%
|
|
|
|
|
||||||
|
Diluted—net income per share allocated to common stockholders
|
$
|
2.27
|
|
$
|
2.46
|
|
|
|
|
|
||||
|
•
|
The increase in total operating revenues was primarily driven by higher transaction fees, exchange services and other fees, market data fees and regulatory fees, partially offset by lower access fees and other revenue.
|
|
•
|
The increase in total operating expenses was primarily driven by
higher compensation and benefits, professional fees and outside services, travel and promotional expense and royalty fees.
The increase in professional fees and outside services was mainly due to acquisition-related costs, which resulted in a lower operating margin for the year.
|
|
•
|
The increase in total other income/(expense) was primarily driven by proceeds from the settlement of litigation.
|
48
Operating Revenues
Total operating revenues for the year ended
December 31, 2016
increased
$22.4 million
, or
3.5%
, to
$656.9 million
from
$634.5 million
in the prior year. The following summarizes changes in total operating revenues for the year ended
December 31, 2016
compared to
2015
.
|
2016
|
2015
|
Inc./(Dec.)
|
Percent
Change
|
|||||||||||
|
|
(in millions)
|
|
||||||||||||
|
Transaction fees
|
$
|
463.3
|
|
$
|
456.0
|
|
$
|
7.3
|
|
1.6
|
%
|
|||
|
Access fees
|
52.3
|
|
53.3
|
|
(1.0
|
)
|
(1.8
|
)%
|
||||||
|
Exchange services and other fees
|
46.3
|
|
42.2
|
|
4.1
|
|
9.6
|
%
|
||||||
|
Market data fees
|
33.2
|
|
30.0
|
|
3.2
|
|
10.4
|
%
|
||||||
|
Regulatory fees
|
48.3
|
|
33.5
|
|
14.8
|
|
44.3
|
%
|
||||||
|
Other revenue
|
13.5
|
|
19.5
|
|
(6.0
|
)
|
(30.5
|
)%
|
||||||
|
Total operating revenues
|
$
|
656.9
|
|
$
|
634.5
|
|
$
|
22.4
|
|
3.5
|
%
|
|||
Transaction Fees
Transaction fees
increased
1.6%
to
$463.3 million
for the year ended
December 31, 2016
, representing
70.5%
of total operating revenues, compared with
$456.0 million
for the prior year period, or
71.9%
of total operating revenues. This increase was largely driven by a
0.9%
increase
in trading volume and a
0.8%
increase
in the average revenue per contract.
Average revenue per contract, discussed in more detail below, is impacted by our fee structure, which includes volume based incentive programs, mix of products traded, the account type (customer, firm, market-maker, etc.) and the manner in which a trade is executed. The implementation of fee changes, which may increase or decrease our average revenue per contract, is primarily to ensure that we are competitive in the options marketplace and to ultimately improve and continue to drive order flow to our exchanges. We cannot predict the trading patterns of exchange participants, which may be based on factors outside our control, but we can attempt to price our products at levels that are competitive in our market.
Trading volume is impacted by many factors, including: macroeconomic events, market volatility, regulatory actions or considerations, availability of capital, competition and pricing.
The following summarizes transaction fees by product category for
2016
compared to
2015
.
|
2016
|
2015
|
Inc./(Dec.)
|
Percent
Change
|
|||||||||||
|
|
(in millions)
|
|
||||||||||||
|
Equities
|
$
|
23.4
|
|
$
|
36.4
|
|
$
|
(13.0
|
)
|
(35.7
|
)%
|
|||
|
Indexes
|
307.7
|
|
290.3
|
|
17.4
|
|
6.0
|
%
|
||||||
|
Exchange-traded products
|
31.1
|
|
41.8
|
|
(10.7
|
)
|
(25.6
|
)%
|
||||||
|
Total options transaction fees
|
362.2
|
|
368.5
|
|
(6.3
|
)
|
(1.7
|
)%
|
||||||
|
Futures
|
101.1
|
|
87.5
|
|
13.6
|
|
15.6
|
%
|
||||||
|
Total transaction fees
|
$
|
463.3
|
|
$
|
456.0
|
|
$
|
7.3
|
|
1.6
|
%
|
|||
49
Trading Volume
Our average daily trading volume ("ADV") was
4.70
million contracts in
2016
,
up
0.9%
compared with
4.66
million for
2015
. Total trading days in
2016
and
2015
were
two hundred fifty-two
.
The following summarizes changes in total trading volume and ADV by product category for
2016
compared to
2015
.
|
|
2016
|
2015
|
Volume
Percent
Change
|
ADV
Percent
Change
|
|||||||||||||
|
|
Volume
|
ADV
|
Volume
|
ADV
|
|||||||||||||
|
|
(in millions)
|
|
|
||||||||||||||
|
Equities
|
364.3
|
|
1.44
|
|
393.0
|
|
1.56
|
|
(7.3
|
)%
|
(7.3
|
)%
|
|||||
|
Indexes
|
433.3
|
|
1.72
|
|
408.3
|
|
1.62
|
|
6.1
|
%
|
6.1
|
%
|
|||||
|
Exchange-traded products
|
326.7
|
|
1.30
|
|
321.0
|
|
1.27
|
|
1.8
|
%
|
1.8
|
%
|
|||||
|
Total options contracts
|
1,124.3
|
|
4.46
|
|
1,122.3
|
|
4.45
|
|
0.2
|
%
|
0.2
|
%
|
|||||
|
Futures contracts
|
60.2
|
|
0.24
|
|
51.7
|
|
0.21
|
|
16.5
|
%
|
16.5
|
%
|
|||||
|
Total contracts
|
1,184.5
|
|
4.70
|
|
1,174.0
|
|
4.66
|
|
0.9
|
%
|
0.9
|
%
|
|||||
The following provides the percentage of volume by product category for the years ended
December 31, 2016
and
2015
.
|
2016
|
2015
|
|||||
|
Equities
|
30.8
|
%
|
33.5
|
%
|
||
|
Indexes
|
36.6
|
%
|
34.8
|
%
|
||
|
Exchange-traded products
|
27.5
|
%
|
27.3
|
%
|
||
|
Futures
|
5.1
|
%
|
4.4
|
%
|
||
|
Total
|
100.0
|
%
|
100.0
|
%
|
||
Average revenue per contract
The average revenue per contract was
$0.391
in
2016
,
an increase
of
0.8%
compared with
$0.388
in
2015
. Average revenue per contract represents transaction fees divided by total contracts.
The following summarizes average revenue per contract by product category for
2016
compared to
2015
.
|
2016
|
2015
|
Percent
Change
|
||||||||
|
Equities
|
$
|
0.064
|
|
$
|
0.093
|
|
(31.2
|
)%
|
||
|
Indexes
|
0.710
|
|
0.711
|
|
(0.1
|
)%
|
||||
|
Exchange-traded products
|
0.095
|
|
0.130
|
|
(26.9
|
)%
|
||||
|
Total options average revenue per contract
|
0.322
|
|
0.328
|
|
(1.8
|
)%
|
||||
|
Futures
|
1.681
|
|
1.694
|
|
(0.8
|
)%
|
||||
|
Total average revenue per contract
|
$
|
0.391
|
|
$
|
0.388
|
|
0.8
|
%
|
||
Factors contributing to the change in total average revenue per contract for the year ended
December 31, 2016
compared to the same period in
2015
included:
|
•
|
Product mix—
We experienced a shift in overall product mix. As a percentage of total volume, equities decreased to
30.8%
from
33.5%
, indexes increased to
36.6%
from
34.8%
and futures increased to
5.1%
from
4.4%
. Equities represent our lowest average revenue per contract, while index options and futures generate our highest options average revenue per contract and our highest total average revenue per contract, respectively.
|
50
Exchange Services and Other Fees
Exchange services and other fees for the year ended
December 31, 2016
increased
9.6%
to
$46.3 million
from
$42.2 million
in the comparable period in the prior year. The increase was primarily a result of higher fees for technology services and revenue generated from Livevol, which was acquired on August 7, 2015.
Market Data Fees
Market data fees
increased
10.4%
to
$33.2 million
for the year ended
December 31, 2016
from
$30.0 million
in the prior year. For the years ended
December 31, 2016
and
2015
, income derived from our market data services totaled
$17.5 million
and
$16.0 million
, respectively. Revenue generated from our market data services, which provide current and historical options and futures data, increased
$1.5 million
, resulting primarily from an increase in subscribers and fees for certain market data services. For the years ended
December 31, 2016
and
2015
, OPRA income totaled
$15.7 million
and
$14.0 million
, respectively. Income derived from OPRA is allocated based on each exchange's share of total cleared options transactions. The Company's share of total cleared options transactions for the year ended
December 31, 2016
increased to
24.4%
from
23.3%
for the same period in
2015
and total distributable OPRA income increased compared to the prior year ended 2015.
Regulatory Fees
Regulatory fees
increased
44.3%
for the year ended
2016
to
$48.3 million
from
$33.5 million
in the same period in the prior year. The increase in regulatory fees is primarily the result of an increase in our options regulatory fees resulting from increased costs associated with the regulation of CBOE and C2 and other self-regulatory organization commitments.
Regulatory fees are primarily generated by the options regulatory fee that we charge on all Trading Permit Holder customer volume industry-wide. Under the rules of each of our options exchanges, as required by the SEC, any revenue derived from regulatory fees and fines cannot be used for non-regulatory purposes.
Other Revenue
Other revenue
decreased
$6.0 million
for the year ended
2016
to
$13.5 million
from
$19.5 million
in the same period in the prior year. The decrease in other revenue was primarily due to lower revenue from fines assessed for rule violations and, in 2015, the recognition of revenue to adjust for incorrect coding of transactions by an exchange participant related to prior periods.
Concentration of Revenue
All contracts traded on our exchanges must be cleared through clearing members of OCC. At
December 31, 2016
, there were
one hundred one
Trading Permit Holders that are clearing members of OCC. Two clearing members accounted for
42%
of transaction and other fees collected through OCC in
2016
. The next largest clearing member accounted for approximately
14%
of transaction and other fees collected through OCC. No one Trading Permit Holder using the clearing services of the top two clearing member firms represented more than
21%
of transaction and other fees collected through OCC, for the respective clearing member, in
2016
. Should a clearing member withdraw from CBOE, we believe the Trading Permit Holder portion of that clearing member's trading activity would likely transfer to another clearing member.
The two largest clearing members mentioned above clear the majority of the market-maker sides of transactions at CBOE, C2 and at all of the U.S. options exchanges. If either of these clearing members were to withdraw from the business of market-maker clearing and market-makers were unable to transfer to another clearing member, this could create significant disruption to the U.S. options markets, including ours.
Operating Expenses
Total operating expenses
increased
$44.1 million
, or
14.0%
, to
$358.7 million
for the year ended
2016
from
$314.6 million
in the year ago period, resulting from
higher compensation and benefits, professional fees and outside services, travel and promotional expense and royalty fees.
Expenses
increased
to
54.7%
of total operating revenues in the year ended
2016
compared with
49.6%
in the same period in
2015
.
The following summarizes changes in operating expenses for the year ended
December 31, 2016
compared to
2015
.
51
|
2016
|
2015
|
Inc./(Dec.)
|
Percent
Change
|
|||||||||||
|
|
(in millions)
|
|
||||||||||||
|
Compensation and benefits
|
$
|
113.2
|
|
$
|
105.9
|
|
$
|
7.3
|
|
6.8
|
%
|
|||
|
Depreciation and amortization
|
44.4
|
|
46.3
|
|
(1.9
|
)
|
(4.1
|
)%
|
||||||
|
Technology support services
|
22.4
|
|
20.7
|
|
1.7
|
|
8.7
|
%
|
||||||
|
Professional fees and outside services
|
78.5
|
|
50.1
|
|
28.4
|
|
56.9
|
%
|
||||||
|
Royalty fees
|
77.9
|
|
70.6
|
|
7.3
|
|
10.5
|
%
|
||||||
|
Order routing
|
0.9
|
|
2.3
|
|
(1.4
|
)
|
(60.8
|
)%
|
||||||
|
Travel and promotional expenses
|
11.0
|
|
8.9
|
|
2.1
|
|
22.1
|
%
|
||||||
|
Facilities costs
|
5.7
|
|
5.0
|
|
0.7
|
|
13.9
|
%
|
||||||
|
Other expenses
|
4.7
|
|
4.8
|
|
(0.1
|
)
|
(3.2
|
)%
|
||||||
|
Total operating expenses
|
$
|
358.7
|
|
$
|
314.6
|
|
$
|
44.1
|
|
14.0
|
%
|
|||
Compensation and Benefits
For the year ended
December 31, 2016
, compensation and benefits were
$113.2 million
, or
17.2%
of total operating revenues, compared with
$105.9 million
, or
16.7%
of total operating revenues, in the same period in
2015
. This represented
an increase
of
$7.3 million
, or
6.8%
, which primarily resulted from increased staffing levels, higher stock-based compensation, including accelerated stock-based compensation expense, and annual incentive compensation, which is aligned with our financial performance relative to our targets. The year ended
December 31, 2016
included
$0.9 million
of accelerated stock-based compensation expense, respectively, for certain officers and employees as a result of attaining certain age and service based requirements in our long-term incentive plan and award agreements.
Stock-based compensation expense, included in compensation and benefits expense, is expected to be approximately
$27.5 million
for 2017. This includes
$13.0 million
in accelerated stock-based compensation, approximately
$12.0 million
of which is expected to be recognized in the first quarter of 2017. The increase in accelerated stock-based compensation versus 2016, reflects a planned change in the retirement vesting schedule for equity award grants.
Depreciation and Amortization
Depreciation and amortization
decreased
by
$1.9 million
to
$44.4 million
for the year ended
December 31, 2016
compared with
$46.3 million
for the same period in
2015
. The decrease was primarily due to the the acceleration of depreciation for certain assets that have a shorter than expected useful life through June 30, 2016, partially offset by the amortization of intangible assets related to the acquisitions of Livevol and Vest.
Professional Fees and Outside Services
Expenses related to professional fees and outside services
increased
to
$78.5 million
for the year ended
December 31, 2016
from
$50.1 million
in the prior-year period, an increase of
$28.4 million
, which primarily resulted from higher legal and professional fees, primarily Bats acquisition-related costs totaling
$13.7 million
, and higher contract services related to certain regulatory services provided by FINRA and other self-regulatory organization commitments for CBOE and C2. In connection with the anticipated merger with Bats and the planned migration to the Bats trading platform and the suspension of CBOE Vector, our investment of $15.0 million related to the development of Vector, in 2017, could become obsolete or result in a shorter than expected useful life.
Royalty Fees
Royalty fees for the year ended
December 31, 2016
were
$77.9 million
compared with
$70.6 million
for the prior year period,
an increase
of
$7.3 million
, which primarily resulted from higher trading volume in licensed products.
Travel and promotional expenses
Travel and promotional expenses for the year ended
December 31, 2016
were
$11.0 million
compared with
$8.9 million
for the prior year period. The increase is primarily due to higher advertising expenses.
Operating Income
As a result of the items above, operating income in
2016
was
$298.2 million
compared to
$319.9 million
in
2015
,
a decrease
of
$21.7 million
.
52
Other Income
Other income totaled
$8.4 million
for the year ended
December 31, 2016
compared with
$4.1 million
for the same period in the prior year. The increase in other income in
2016
primarily resulted from higher projected dividend income from OCC, proceeds from the settlement of litigation and a gain on settlement of contingent consideration related to the acquisition of Livevol, partially offset by the amortization of expenses for the bridge loan facility related to the proposed acquisition of Bats.
Income before Income Taxes
As a result of the items above, income before income taxes in
2016
was
$306.6 million
compared to
$324.0 million
in
2015
,
a decrease
of
$17.4 million
.
Income Tax Provision
For the year ended
December 31, 2016
, the income tax provision was
$120.9 million
compared with
$119.0 million
for the same period in
2015
. The effective tax rate was
39.4%
and
36.7%
for the years ended
December 31, 2016
and
2015
, respectively. The lower effective tax rate in
2015
was primarily due to a
2015
decrease in unrecognized tax benefits for tax positions taken in prior years as a result of the expiration of applicable statutes of limitation and the effective settlement of uncertain tax positions.
Net Income
As a result of the items above, net income allocated to common stockholders in
2016
was
$184.9 million
compared to
$204.1 million
in
2015
,
a decrease
of
$19.2 million
. Basic and diluted net income per share allocated to common stockholders were
$2.27
and
$2.46
for the years ended
December 31, 2016
and
2015
, respectively.
Year ended
December 31, 2015
compared to the year ended
December 31, 2014
Consolidated Results
The following summarizes financial performance for the year ended
December 31, 2015
compared to
2014
.
|
2015
|
2014
|
Inc./(Dec.)
|
Percent
Change
|
|||||||||||
|
|
(in millions, except per share amounts)
|
|
||||||||||||
|
Total operating revenues
|
$
|
634.5
|
|
$
|
617.2
|
|
$
|
17.3
|
|
2.8
|
%
|
|||
|
Total operating expenses
|
314.6
|
|
303.4
|
|
11.2
|
|
3.7
|
%
|
||||||
|
Operating income
|
319.9
|
|
313.8
|
|
6.1
|
|
1.9
|
%
|
||||||
|
Total other income/(expense)
|
4.1
|
|
(4.1
|
)
|
8.2
|
|
199.8
|
%
|
||||||
|
Income before income taxes
|
324.0
|
|
309.7
|
|
14.3
|
|
4.6
|
%
|
||||||
|
Income tax provision
|
119.0
|
|
120.0
|
|
(1.0
|
)
|
(0.8
|
)%
|
||||||
|
Net income
|
$
|
205.0
|
|
$
|
189.7
|
|
$
|
15.3
|
|
8.1
|
%
|
|||
|
Net income allocated to common stockholders
|
$
|
204.1
|
|
$
|
188.4
|
|
$
|
15.7
|
|
8.4
|
%
|
|||
|
Operating income percentage
|
50.4
|
%
|
50.8
|
%
|
|
|
|
|
||||||
|
Net income percentage
|
32.3
|
%
|
30.7
|
%
|
|
|
|
|
||||||
|
Diluted—net income per share allocated to common stockholders
|
$
|
2.46
|
|
$
|
2.21
|
|
|
|
|
|
||||
|
•
|
The increase in total operating revenues was primarily driven by higher transaction fees, exchange services and other fees and other revenue, partially offset by lower access fees and regulatory fees.
|
|
•
|
The increase in total operating expenses was primarily driven by higher depreciation and amortization, technology support services, professional fees and outside services and royalty fees, partially offset by lower compensation and benefits.
|
|
•
|
The increase in total other income/(expense) was primarily driven by the dividend declared by OCC in December 2015. The prior year included an impairment charge related to our investment in IPXI Holdings, LLC ("IPXI").
|
53
Operating Revenues
Total operating revenues for the year ended
December 31, 2015
increased
$17.3 million
, or
2.8%
, to
$634.5 million
from
$617.2 million
in the prior year. The following summarizes changes in total operating revenues for the year ended
December 31, 2015
compared to
2014
.
|
2015
|
2014
|
Inc./(Dec.)
|
Percent
Change
|
|||||||||||
|
|
(in millions)
|
|
||||||||||||
|
Transaction fees
|
$
|
456.0
|
|
$
|
437.8
|
|
$
|
18.2
|
|
4.2
|
%
|
|||
|
Access fees
|
53.3
|
|
59.3
|
|
(6.0
|
)
|
(10.2
|
)%
|
||||||
|
Exchange services and other fees
|
42.2
|
|
38.0
|
|
4.2
|
|
11.0
|
%
|
||||||
|
Market data fees
|
30.0
|
|
30.4
|
|
(0.4
|
)
|
(1.4
|
)%
|
||||||
|
Regulatory fees
|
33.5
|
|
37.1
|
|
(3.6
|
)
|
(9.7
|
)%
|
||||||
|
Other revenue
|
19.5
|
|
14.6
|
|
4.9
|
|
34.0
|
%
|
||||||
|
Total operating revenues
|
$
|
634.5
|
|
$
|
617.2
|
|
$
|
17.3
|
|
2.8
|
%
|
|||
Transaction Fees
Transaction fees increased 4.2% to $456.0 million for the year ended December 31, 2015, representing 71.9% of total operating revenues, compared with $437.8 million for the prior year period, or 70.9% of total operating revenues. This increase was largely driven by a 17.6% increase in the average revenue per contract, partially offset by an 11.4% decrease in trading volume. The increase in average revenue per contract resulted primarily from a shift in volume mix of products traded, fee changes implemented in 2015 and lower volume discounts and incentives. As a percent of total trading volume, index options and futures contracts, which generate our highest options and overall average revenue per contract, respectively, accounted for 39.2% of trading volume for the year ended December 31, 2015, up from 34.5% during the same period in 2014.
54
The following summarizes transaction fees by product category for
2015
compared to
2014
.
|
2015
|
2014
|
Inc./(Dec.)
|
Percent
Change
|
|||||||||||
|
|
(in millions)
|
|
||||||||||||
|
Equities
|
$
|
36.4
|
|
$
|
37.2
|
|
$
|
(0.8
|
)
|
(2.1
|
)%
|
|||
|
Indexes
|
290.3
|
|
276.0
|
|
14.3
|
|
5.2
|
%
|
||||||
|
Exchange-traded products
|
41.8
|
|
42.4
|
|
(0.6
|
)
|
(1.5
|
)%
|
||||||
|
Total options transaction fees
|
368.5
|
|
355.6
|
|
12.9
|
|
3.6
|
%
|
||||||
|
Futures
|
87.5
|
|
82.2
|
|
5.3
|
|
6.5
|
%
|
||||||
|
Total transaction fees
|
$
|
456.0
|
|
$
|
437.8
|
|
$
|
18.2
|
|
4.2
|
%
|
|||
Trading Volume
Our average daily trading volume ("ADV") was 4.66 million contracts in 2015, down 11.4% compared with 5.26 million for 2014. Total trading days in 2015 and 2014 were two hundred fifty-two.
The following summarizes changes in total trading volume and ADV by product category for
2015
compared to
2014
.
|
|
2015
|
2014
|
Volume
Percent
Change
|
ADV
Percent
Change
|
|||||||||||||
|
|
Volume
|
ADV
|
Volume
|
ADV
|
|||||||||||||
|
|
(in millions)
|
|
|
||||||||||||||
|
Equities
|
393.0
|
|
1.56
|
|
488.6
|
|
1.94
|
|
(19.6
|
)%
|
(19.6
|
)%
|
|||||
|
Indexes
|
408.3
|
|
1.62
|
|
406.5
|
|
1.61
|
|
0.4
|
%
|
0.4
|
%
|
|||||
|
Exchange-traded products
|
321.0
|
|
1.27
|
|
379.7
|
|
1.51
|
|
(15.5
|
)%
|
(15.5
|
)%
|
|||||
|
Total options contracts
|
1,122.3
|
|
4.45
|
|
1,274.8
|
|
5.06
|
|
(12.0
|
)%
|
(12.0
|
)%
|
|||||
|
Futures contracts
|
51.7
|
|
0.21
|
|
50.6
|
|
0.20
|
|
2.1
|
%
|
2.1
|
%
|
|||||
|
Total contracts
|
1,174.0
|
|
4.66
|
|
1,325.4
|
|
5.26
|
|
(11.4
|
)%
|
(11.4
|
)%
|
|||||
The following provides the percentage of volume by product category for the years ended
December 31, 2015
and
2014
.
|
2015
|
2014
|
|||||
|
Equities
|
33.5
|
%
|
36.9
|
%
|
||
|
Indexes
|
34.8
|
%
|
30.7
|
%
|
||
|
Exchange-traded products
|
27.3
|
%
|
28.6
|
%
|
||
|
Futures
|
4.4
|
%
|
3.8
|
%
|
||
|
Total
|
100.0
|
%
|
100.0
|
%
|
||
Average Revenue Per Contract
The average revenue per contract was $0.388 in 2015, an increase of 17.6% compared with $0.330 in 2014. Average revenue per contract represents transaction fees divided by total contracts.
55
The following summarizes average revenue per contract by product category for
2015
compared to
2014
.
|
2015
|
2014
|
Percent
Change
|
||||||||
|
Equities
|
$
|
0.093
|
|
$
|
0.076
|
|
22.4
|
%
|
||
|
Indexes
|
0.711
|
|
0.679
|
|
4.7
|
%
|
||||
|
Exchange-traded products
|
0.130
|
|
0.112
|
|
16.1
|
%
|
||||
|
Total options revenue per contract
|
0.328
|
|
0.279
|
|
17.6
|
%
|
||||
|
Futures
|
1.694
|
|
1.623
|
|
4.4
|
%
|
||||
|
Total average revenue per contract
|
$
|
0.388
|
|
$
|
0.330
|
|
17.6
|
%
|
||
Factors contributing to the change in total average revenue per contract for the year ended
December 31, 2015
compared to the same period in
2014
included:
|
•
|
Product mix—
We experienced a shift in overall product mix. As a percentage of total volume, equities decreased to 33.5% from 36.9%, indexes increased to 34.8% from 30.7% and futures increased to 4.4% from 3.8%. Equities represent our lowest average revenue per contract, while index options and futures generate our highest options average revenue per contract and our highest total average revenue per contract, respectively.
|
|
•
|
Rate structure—
Our rate structure includes sliding scales, volume discounts, volume incentive programs and caps on fees as part of our effort to increase liquidity and market share in multiply-listed options. The increase in average revenue per contract across all product categories was primarily a result of fee changes implemented in 2015 and lower volume discounts and incentives.
|
Access Fees
Access fees for the year ended December 31, 2015 decreased to $53.3 million from $59.3 million in the comparable prior year period. The decrease in access fees was primarily due to a reduction in the number of trading permits.
Exchange Services and Other Fees
Exchange services and other fees for the year ended December 31, 2015 increased 11.0% to $42.2 million from $38.0 million in the comparable period in the prior year. The increase was primarily a result of higher fees for technology services and revenue generated from Livevol, which was acquired on August 7, 2015.
Market Data Fees
Market data fees decreased 1.4% to $30.0 million for the year ended December 31, 2015 from $30.4 million in the prior year. For the years ended December 31, 2015 and 2014, income derived from our market data services totaled $16.0 million and $15.4 million, respectively, and OPRA income totaled $14.0 million and $15.0 million, respectively. Revenue generated from our market data services increased $0.6 million, resulting primarily from an increase in subscribers and fees for certain market data services. The Company's share of total cleared options transactions for the period ended December 31, 2015 decreased to 23.3% from 24.9% for the same period in 2014 and total distributable OPRA income decreased compared to the prior year period resulting in lower revenue for the period ended December 31, 2015 compared to the same period in 2014.
Regulatory Fees
Regulatory fees decreased 9.7% for the year ended 2015 to $33.5 million from $37.1 million in the same period in the prior year. The decrease in regulatory fees was primarily the result of lower options regulatory fees and a decrease in regulatory fees received for other regulatory services.
Other Revenue
Other revenue increased $4.9 million for the year ended 2015 to $19.5 million from $14.6 million in the same period in the prior year. The increase in other revenue was primarily due to higher regulatory fines assessed for disciplinary actions and the recognition of revenue to adjust for incorrect coding of transactions by an exchange participant related to prior periods.
56
Operating Expenses
Total operating expenses increased $11.2 million, or 3.7%, to $314.6 million for the year ended 2015 from $303.4 million in the year ago period, resulting from higher depreciation and amortization, technology support services, professional fees and outside services and royalty fees, partially offset by lower compensation and benefits. Expenses increased to 49.6% of total operating revenues in the year ended 2015 compared with 49.2% in the same period in 2014.
The following summarizes changes in operating expenses for the year ended
December 31, 2015
compared to
2014
.
|
2015
|
2014
|
Inc./(Dec.)
|
Percent
Change
|
|||||||||||
|
|
(in millions)
|
|
||||||||||||
|
Compensation and benefits
|
$
|
105.9
|
|
$
|
121.7
|
|
$
|
(15.8
|
)
|
(13.0
|
)%
|
|||
|
Depreciation and amortization
|
46.3
|
|
39.9
|
|
6.4
|
|
15.9
|
%
|
||||||
|
Technology support services
|
20.7
|
|
19.2
|
|
1.5
|
|
7.7
|
%
|
||||||
|
Professional fees and outside services
|
50.1
|
|
32.0
|
|
18.1
|
|
56.6
|
%
|
||||||
|
Royalty fees
|
70.6
|
|
66.1
|
|
4.5
|
|
6.8
|
%
|
||||||
|
Order routing
|
2.3
|
|
4.1
|
|
(1.8
|
)
|
(43.8
|
)%
|
||||||
|
Travel and promotional expenses
|
8.9
|
|
9.0
|
|
(0.1
|
)
|
(0.7
|
)%
|
||||||
|
Facilities costs
|
5.0
|
|
5.7
|
|
(0.7
|
)
|
(12.6
|
)%
|
||||||
|
Other expenses
|
4.8
|
|
5.7
|
|
(0.9
|
)
|
(14.3
|
)%
|
||||||
|
Total operating expenses
|
$
|
314.6
|
|
$
|
303.4
|
|
$
|
11.2
|
|
3.7
|
%
|
|||
Compensation and Benefits
For the year ended December 31, 2015, compensation and benefits were $105.9 million, or 16.7% of total operating revenues, compared with $121.7 million, or 19.7% of total operating revenues, in the same period in 2014. This represented a decrease of $15.8 million, or 13.0%, which primarily resulted from lower stock-based compensation, a reduction in headcount and lower severance expense. The reduction in headcount and severance was primarily due to the transition of certain regulatory functions to FINRA which occurred in December 2014. The twelve months ended December 31, 2014 included $2.5 million of accelerated stock-based compensation expense for certain executives due to provisions contained in their employment arrangements.
Depreciation and Amortization
Depreciation and amortization increased by $6.4 million to $46.3 million for the year ended December 31, 2015 compared with $39.9 million for the same period in 2014. The increase in depreciation and amortization primarily resulted from capital spending to develop and enhance our trading platform and operations and the acceleration of depreciation for certain assets that have a shorter than expected useful life.
Professional Fees and Outside Services
Expenses related to professional fees and outside services increased to $50.1 million for the year ended December 31, 2015 from $32.0 million in the prior-year period, an increase of $18.1 million, which primarily resulted from higher contract services related to the transition of certain regulatory services for CBOE and C2 to FINRA which occurred in December 2014.
Royalty Fees
Royalty fees for the year ended December 31, 2015 were $70.6 million compared with $66.1 million for the prior year period, an increase of $4.5 million, which primarily resulted from higher trading volume in licensed products.
Operating Income
As a result of the items above, operating income in
2015
was
$319.9 million
compared to
$313.8 million
in
2014
,
an increase
of
$6.1 million
.
57
Other Income/(Expense)
Other income/(expense) reflected income of $4.1 million for the year ended December 31, 2015 compared with a loss of $4.1 million for the same period in the prior year. The income in 2015 primarily included the Company's share of equity earnings of Signal Trading Systems, LLC ("Signal") and the $3.4 million of dividend income declared by the OCC in December 2015. In 2014, the expense primarily included the Company's share of the operating losses of Signal and the impairment of our investment in IPXI, which totaled $3.0 million.
Income before Income Taxes
As a result of the items above, income before income taxes in
2015
was
$324.0 million
compared to
$309.7 million
in
2014
,
an increase
of
$14.3 million
.
Income Tax Provision
For the year ended December 31, 2015, the income tax provision was $119.0 million compared with $120.0 million for the same period in 2014. The effective tax rate was 36.7% and 38.7% for the years ended December 31, 2015 and 2014, respectively. The lower effective tax rate was primarily due to the recognition of a tax benefit associated with the release and expiration of uncertain tax positions.
Net Income
As a result of the items above, net income allocated to common stockholders in
2015
was
$204.1 million
compared to
$188.4 million
in
2014
,
an increase
of
$15.7 million
. Basic and diluted net income per share allocated to common stockholders were
$2.46
and
$2.21
for the years ended
December 31, 2015
and
2014
, respectively.
Liquidity and Capital Resources
Our cash requirements principally consist of funding operating expenses, capital expenditures, actual and anticipated quarterly and special dividend payments and common stock repurchases under the previously announced program. In addition, we will require significant capital in order to complete our proposed acquisition of Bats. In connection with the anticipated Merger, we have entered into several indebtedness arrangements in September 2016, December 2016 and in January 2017 to finance the Merger and fund our ongoing cash needs in 2017 and the combined company following the Merger, as further described below.
In connection with entering into the Merger Agreement, the Company entered into a commitment letter with Bank of America, N.A. and Merrill Lynch, Pierce, Fenner & Smith Incorporated (or any of its designated affiliates) (Bank of America, N.A., and other such financial institutions that accede as lender to such debt commitment letter in accordance with its terms are referred to herein as the “Lenders”), which provides that, subject to the satisfaction and waiver of certain conditions which are usual and customary for financing of this type, the Lenders are committed to provide debt financing for the purposes of funding (i) the cash consideration to be paid in the transactions contemplated by the Merger Agreement, (ii) the refinancing of certain existing indebtedness of Bats and its subsidiaries and (iii) related fees and expenses, which debt financing consists of a senior unsecured 364-day bridge loan facility in an aggregate principal amount of up to $1.65 billion to the extent the Company fails to generate gross cash proceeds in an aggregate principal amount of up to $1.65 billion from permanent financing including in the form of a senior unsecured term loan facility and the issuance of senior unsecured notes on or prior to the consummation of the transaction contemplated by the Merger Agreement. In lieu of entering into the bridge loan facility, the Company entered into a term loan agreement and completed a notes offering, as described below, securing $1.65 billion to finance the cash portion of its pending acquisition of Bats as well as the repayment of Bats' existing indebtedness.
Term Loan Agreement
On December 15, 2016, the Company, as borrower, entered into a Term Loan Credit Agreement (the “Term Loan Agreement”) with Bank of America, N.A., as administrative agent, certain lenders named therein (the “Term Lenders”), Merrill Lynch, Pierce, Fenner & Smith Incorporated, as sole lead arranger and sole bookrunner, Morgan Stanley MUFG Loan Partners, LLC, as syndication agent, and Citibank, N.A., PNC Bank, National Association and JPMorgan Chase Bank, N.A., as co-documentation agents.
The Term Loan Agreement provides for a senior unsecured delayed draw term loan facility (the “Term Loan Facility”) in an aggregate principal amount of $1.0 billion. We may also, subject to the agreement of the applicable Term Lenders, increase the commitments under the Term Loan Agreement by up to $500 million for a total of $1.5 billion. Proceeds from the Term
58
Loan Facility, if drawn, may be used to finance the Merger and to fund working capital needs and for other general corporate purposes. The availability of the commitments under the Term Loan Agreement is conditioned upon, among other things, confirmation that the Merger has been consummated, or will be consummated substantially concurrently with the extension of the loans under the Term Loan Agreement. As of December 31, 2016, we had not drawn upon the commitments in the Term Loan Agreement.
Commitments under the Term Loan Agreement will expire on the earlier of (i) the consummation of the Merger (after giving effect to the funding of the committed loans in accordance with and subject to the terms of the Term Loan Agreement), (ii) July 25, 2017 (or if the outside date is extended pursuant to the terms of the Merger Agreement, October 23, 2017), (iii) the closing of the Merger without using the loans under the Term Loan Agreement and (iv) the termination of the Merger Agreement in accordance with the terms thereof. Loans under the Term Loan Agreement, if drawn, will mature five years following the closing date of the Merger. The Term Loan Facility is unsecured and is not expected to be guaranteed by any subsidiary.
Loans under the Term Loan Agreement will bear interest, at our option, at either (i) the London Interbank Offered Rate (“LIBOR”) periodically fixed for an interest period (as selected by us) of one, two, three or six months plus a margin (based on our public debt ratings) ranging from 1.00 percent per annum to 1.75 percent per annum or (ii) a daily floating rate based on the agent’s prime rate (subject to certain minimums based upon the federal funds effective rate or LIBOR) plus a margin (based on our public debt ratings) ranging from zero percent per annum to 0.75 percent per annum. We will be required to pay a ticking fee to the agent for the account of the Term Lenders which will initially accrue at a rate (based on our public debt ratings) ranging from 0.10 percent per annum to 0.30 percent per annum multiplied by the undrawn aggregate commitments of the Term Lenders in respect of the Term Loan Facility, accruing during the period commencing on December 15, 2016 and ending on the earlier of (i) the date on which the loans are drawn and (ii) the termination of the commitments under the Term Loan Agreement in accordance with the terms thereof.
The Term Loan Agreement contains customary representations, warranties and affirmative and negative covenants for facilities of its type, including financial covenants, events of default and indemnification provisions in favor of the Term Lenders. The negative covenants include restrictions regarding the incurrence of liens, the incurrence of indebtedness by the our subsidiaries and fundamental changes, subject to certain exceptions in each case. The financial covenants require us to meet a quarterly financial test with respect to a minimum consolidated interest coverage ratio of not less than 4.00 to 1.00 and a maximum consolidated leverage ratio of not greater than 3.50 to 1.00. As of December 31, 2016, we had not drawn upon the commitments in the Term Loan Agreement.
Revolving Credit Agreement
On December 15, 2016, the Company, as borrower, entered into a Credit Agreement (the “Revolving Credit Agreement”) with Bank of America, N.A., as administrative agent and as swing line lender, certain lenders named therein (the “Revolving Lenders”), Merrill Lynch, Pierce, Fenner & Smith Incorporated, as sole lead arranger and sole bookrunner, Morgan Stanley MUFG Loan Partners, LLC, as syndication agent, and Citibank, N.A., PNC Bank, National Association and JPMorgan Chase Bank, N.A., as co-documentation agents.
The Revolving Credit Agreement provides for a senior unsecured $150 million five-year revolving credit facility (the “Revolving Credit Facility”) that includes a $25 million swing line sub-facility. We may also, subject to the agreement of the applicable lenders, increase the commitments under the Revolving Credit Facility by up to $100 million, for a total of $250 million. Subject to specified conditions, we may designate one or more of our subsidiaries as additional borrowers under the Revolving Credit Agreement provided that we guarantee all borrowings and other obligations of any such subsidiaries. As of December 31, 2016, no subsidiaries were designated as additional borrowers.
Funds borrowed under the Revolving Credit Agreement may be used to fund working capital and for other general corporate purposes. As of December 31, 2016, no borrowings were outstanding under the Revolving Credit Agreement. Accordingly, at December 31, 2016, $150 million of borrowing capacity was available for the purposes permitted by the Revolving Credit Agreement.
Loans under the Revolving Credit Agreement will bear interest, at our option, at either (i) LIBOR periodically fixed for an interest period (as selected by us) of one, two, three or six months plus a margin (based on our public debt ratings) ranging from 1.00 percent per annum to 1.75 percent per annum or (ii) a daily floating rate based on our prime rate (subject to certain minimums based upon the federal funds effective rate or LIBOR) plus a margin (based on our public debt ratings) ranging from zero percent per annum to 0.75 percent per annum.
59
Subject to certain conditions stated in the Revolving Credit Agreement, we may borrow, prepay and reborrow amounts under the Revolving Credit Facility at any time during the term of the Revolving Credit Agreement. The Revolving Credit Agreement will terminate and all amounts owing thereunder will be due and payable on December 15, 2021, unless the commitments are terminated earlier, either at our request or, if an event of default occurs, by the Revolving Lenders (or automatically in the case of certain bankruptcy-related events). The Revolving Credit Agreement contains customary representations, warranties and affirmative and negative covenants for facilities of its type, including financial covenants, events of default and indemnification provisions in favor of the Revolving Lenders. The negative covenants include restrictions regarding the incurrence of liens, the incurrence of indebtedness by our subsidiaries and fundamental changes, subject to certain exceptions in each case. The financial covenants require us to meet a quarterly financial test with respect to a minimum consolidated interest coverage ratio of not less than 4.00 to 1.00 and a maximum consolidated leverage ratio of not greater than 3.50 to 1.00. As of December 31, 2016, we had not drawn upon the Revolving Credit Agreement.
3.650% Senior Notes due 2027
On January 12, 2017, the Company entered into an indenture (the “Indenture”), by and between the Company and Wells Fargo Bank, National Association, as trustee (the “Trustee”), in connection with the issuance of $650 million aggregate principal amount of the Company’s 3.650% Senior Notes due 2027 (the “Notes”). The form and terms of the Notes were established pursuant to an Officer’s Certificate, dated as of January 12, 2017 (the “Officer’s Certificate”), supplementing the Indenture.
The Company intends to use a portion of the net proceeds from the Notes to fund, in part, the Merger, including the payment of related fees and expenses and the repayment of Bats’ existing indebtedness, and the remainder for general corporate purposes. The Notes mature on January 12, 2027 and bear interest at the rate of 3.650% per annum, payable semi-annually in arrears on January 12 and July 12 of each year, commencing July 12, 2017. The Notes are unsecured obligations of the Company and rank equally with all of the Company’s other existing and future unsecured, senior indebtedness, but are effectively junior to the Company’s secured indebtedness, to the extent of the value of the assets securing such indebtedness, and will not be the obligations of any of the Company’s subsidiaries.
The Company has the option to redeem some or all of the Notes, at any time in whole or from time to time in part, at the redemption prices set forth in the Officer’s Certificate. The Notes will be subject to a special mandatory redemption in the event that the Merger is not consummated on or prior to October 23, 2017 or, if prior to October 23, 2017, the Merger Agreement is terminated other than in connection with the consummation of the Merger and is not otherwise amended or replaced. In such an event, the Notes will be redeemed at a price equal to 101% of the aggregate principal amount thereof. The Company may also be required to offer to repurchase the Notes upon the occurrence of a Change of Control Triggering Event (as such term is defined in the Officer’s Certificate) at a repurchase price equal to 101% of the aggregate principal amount of Notes to be repurchased.
Cash Flows
Year Ended
December 31, 2016
Compared to the Year Ended
December 31, 2015
Operating Activities
Net cash provided by operating activities was
$229.6 million
and
$245.3 million
for the years ended
December 31, 2016
and
2015
, respectively. The decrease in net cash flows provided by operating activities was primarily due to lower net income.
Net cash provided by operating activities was
$43.8 million
higher than net income for the fiscal year ended
December 31, 2016
. The difference was mainly a result of
$44.4 million
in depreciation and amortization and the recognition of stock-based compensation totaling
$14.5 million
, accounts payable and accrued liabilities of
$19.8 million
, partially offset by increases in accounts receivable of
$7.4 million
and income taxes receivable of
$25.8 million
.
Investing Activities
Net cash flows used in investing activities totaled
$84.4 million
and
$79.4 million
for the years ended
December 31, 2016
and
2015
, respectively. Expenditures for capital and other assets totaled
$44.4 million
and
$39.3 million
for the years ended
December 31, 2016
and
2015
, respectively, primarily representing purchases of systems hardware and development of software to develop and enhance our trading platform and operations. In 2016, investing activities primarily represented our majority investment in Vest, which totaled
$14.3 million
, and other investments totaling
$23.3 million
, which primarily includes our investments in CurveGlobal and Eris.
60
In 2015, we also acquired a business, Livevol, which totaled
$3.0 million
and made investments totaling
$35.4 million
, which primarily reflects our $30.0 million contribution to OCC, as part of the capital plan and other minority investments.
Our future expenditures for capital and other assets are expected to be primarily driven by spending to enhance the company's systems, as well as ongoing investments in systems hardware and software that enhance trading technology. In connection with the anticipated merger with Bats and the planned migration to the Bats trading platform and the suspension of CBOE Vector, our investment of $15.0 million related to the development of Vector, in 2017, could become obsolete or result in a shorter than expected useful life.
Financing Activities
Net cash flows used in financing activities totaled
$150.1 million
and
$211.5 million
for the years ended
December 31, 2016
and
2015
, respectively. The
$61.4 million
decrease
in net cash flows used in financing activities resulted primarily from lower repurchases of common stock in 2016.
For the year ended
December 31, 2016
, net cash flows used in financing activities consisted of
$60.5 million
in common stock purchases under the Company's share repurchase program,
$78.5 million
for the payment of quarterly dividends,
$4.1 million
for other share repurchases, which consisted of common stock surrendered to satisfy employees' tax obligations upon the vesting of restricted stock and payments of financing fees in conjunction with the pending acquisition of Bats totaling $
8.1 million
.
Year Ended
December 31, 2015
Compared to the Year Ended
December 31, 2014
Operating Activities
Net cash provided by operating activities was
$245.3 million
and
$262.7 million
for the years ended December 31, 2015 and 2014, respectively. The decrease in net cash flows provided by operating activities was primarily due to lower deferred income taxes, income tax liability and stock-based compensation, higher accounts receivable and income taxes receivable, partially offset by higher net income and higher depreciation and amortization.
Net cash provided by operating activities was
$40.3 million
higher than net income for the fiscal year ended December 31, 2015. The difference was mainly a result of
$46.3 million
in depreciation and amortization and the recognition of stock-based compensation totaling
$12.2 million
, partially offset by increases in accounts receivable of
$4.8 million
and income taxes receivable of
$6.4 million
.
Investing Activities
Net cash flows used in investing activities totaled
$79.4 million
and
$52.1 million
for the years ended December 31, 2015 and 2014, respectively. Expenditures for capital and other assets totaled
$39.3 million
and
$50.2 million
for the years ended December 31, 2015 and 2014, respectively, primarily representing purchases of systems hardware and development of software to develop and enhance our trading platform and operations. We also acquired a business, Livevol, which totaled
$3.0 million
. Additionally, investments totaled
$35.4 million
in 2015, which primarily reflects our
$30 million
contribution to OCC, as part of the capital plan discussed below, and other minority investments.
Financing Activities
Net cash flows used in financing activities totaled
$211.5 million
and
$283.9 million
for the years ended December 31, 2015 and 2014, respectively. The
$72.4 million
decrease in net cash flows used in financing activities resulted primarily from a special dividend paid in 2014 totaling
$43.8 million
and lower repurchases of common stock in 2015.
For the year ended December 31, 2015, net cash flows used in financing activities consisted of
$132.2 million
in common stock purchases under the Company's share repurchase program,
$73.4 million
for the payment of quarterly dividends,
$3.2 million
for other share repurchases, which consisted of common stock surrendered to satisfy employees' tax obligations upon the vesting of restricted stock and the payment of outstanding debt in conjunction with the acquisition of Livevol totaling
$4.0 million
.
Dividends
The Company’s expectation is to continue to pay dividends. The decision to pay a dividend, however, remains within the discretion of the Company's board of directors and may be affected by various factors, including our earnings, financial condition, capital requirements, level of indebtedness and other considerations our board of directors deems relevant. Future debt obligations and statutory provisions, among other things, may limit, or in some cases prohibit, our ability to pay dividends.
61
Share Repurchase Program
In 2011, the Company's board of directors approved an initial authorization for the Company to repurchase shares of its outstanding common stock of $100 million and approved additional authorizations of $100 million in each of 2012, 2013, 2014, 2015, and February 2016 for a total authorization of $600 million. The program permits the Company to purchase shares through a variety of methods, including in the open market or through privately negotiated transactions, in accordance with applicable securities laws. It does not obligate the Company to make any repurchases at any specific time or situation.
For the year ended
December 31, 2016
, the Company purchased
947,786
shares of common stock at an average cost per share of
$63.83
, totaling
$60.5 million
in purchases under the program.
Since inception of the program, the Company purchased
10,947,401
shares of common stock at an average cost per share of
$45.95
, totaling
$503.0 million
in purchases under the program.
As of
December 31, 2016
, the Company had
$97 million
of availability remaining under its existing share repurchase authorizations.
OCC Capital Plan
In December 2014, OCC announced a newly-formed capital plan. The OCC capital plan was designed to strengthen OCC's capital base and facilitate its compliance with proposed SEC regulations for Systemically Important Financial Market Utilities ("SIFMUs") as well as international standards applicable to financial market infrastructures. On February 26, 2015, the SEC issued a notice of no objection to OCC's advance notice filing regarding the capital plan, and OCC and OCC’s existing exchange stockholders, which include CBOE, subsequently executed agreements effecting the capital plan. Under the plan, each of OCC's existing exchange stockholders agreed to contribute its pro-rata share, based on ownership percentage, of $150 million in equity capital, which would increase OCC's shareholders' equity, and to provide its pro rata share in replenishment capital, up to a maximum of $40 million per exchange stockholder, if certain capital thresholds are breached. OCC also adopted policies under the plan with respect to fees, customer refunds, and stockholder dividends, which envision an annual dividend payment to the exchange stockholders equal to the portion of OCC’s after-tax income that exceeds OCC’s capital requirements after payment of refunds to OCC’s clearing members (with such customer refunds generally to constitute 50% of the portion of OCC’s pre-tax income that exceeds OCC’s capital requirements).
On March 3, 2015, in accordance with the plan, CBOE contributed
$30 million
to OCC. On March 6, 2015, OCC informed CBOE that the SEC, acting though delegated authority, had approved OCC's proposed rule filing for the capital plan. The SEC approval order was stayed on March 13, 2015 automatically as a result of the initiation of petitions to review the order. On September 10, 2015, the SEC issued orders that discontinued the automatic stay of the approval order and granted the petitions for the SEC to review the approval order. On September 15, 2015, the petitioners filed motions to reinstitute the automatic stay. On February 11, 2016, based on a
de novo
review of the entire record, the SEC approved the proposed rule change implementing OCC's capital plan and dismissed the petitions for review and the petitioners' motions. Certain petitioners subsequently appealed the SEC approval order for the OCC capital plan to the U.S. Court of Appeals for the D.C. Circuit and moved to stay the SEC approval order. On February 23, 2016, the Court denied the petitioners’ motion to stay. The appeal of the SEC approval order remains pending. CBOE's contribution has been recorded under Investments in the balance sheet at
December 31, 2016
.
Off-Balance Sheet Arrangements
We currently do not have any relationships with unconsolidated entities or financial partnerships, often referred to as structured finance or special purpose entities, that have been established for the purpose of facilitating off-balance sheet arrangements or other contractually narrow or limited purposes.
Lease and Contractual Obligations
The Company currently leases additional office space, a data center and remote network operations center, with lease terms remaining from
3
months to
103
months as of
December 31, 2016
. In December 2014, we entered into an agreement with FINRA to provide certain regulatory services to the CBOE and C2 options markets. The agreement included the assignment of the office space CBOE leased for regulatory operations.
Total rent expense related to current and former lease obligations for the years ended
December 31, 2016
,
2015
and
2014
totaled
$4.4 million
,
$4.1 million
and
$3.8 million
, respectively. Future minimum payments under our operating leases and contractual obligations were as follows at
December 31, 2016
(in thousands):
62
|
Total(1)
|
Less than
1 year
|
1 - 3 years
|
3 - 5 years
|
More than 5 years
|
|||||||||||||||
|
Operating leases
|
$
|
3,247
|
|
$
|
1,182
|
|
$
|
749
|
|
$
|
406
|
|
$
|
910
|
|
||||
|
Contractual obligations (2)
|
201,274
|
|
34,306
|
|
62,329
|
|
43,135
|
|
61,504
|
|
|||||||||
|
Total
|
$
|
204,521
|
|
$
|
35,488
|
|
$
|
63,078
|
|
$
|
43,541
|
|
$
|
62,414
|
|
||||
(1) Gross unrecognized income tax liabilities, excluding interest and penalties, of
$41.9 million
are not included in the table due to uncertainty about the date of their settlement.
(2) Contractual obligations means an agreement to purchase goods or services that is enforceable and legally binding
and that specifies all significant terms, including: fixed or minimum quantities to be purchased; fixed, minimum or variable
price provisions; and the approximate timing of the transaction.
On January 12, 2017, the Company entered into an indenture, by and between the Company and Wells Fargo Bank, National Association, as trustee, in connection with the issuance of $650 million aggregate principal amount of the Company’s 3.650% Senior Notes due 2027. The Notes will be subject to a special mandatory redemption in the event that the Merger is not consummated on or prior to October 23, 2017 or, if prior to October 23, 2017, the Merger Agreement is terminated other than in connection with the consummation of the Merger and is not otherwise amended or replaced. In such an event, the Notes will be redeemed at a price equal to 101% of the aggregate principal amount thereof.
If the Merger Agreement is terminated under certain specified circumstances, CBOE Holdings may be required to pay
Bats a termination fee of $110 million and/or reimburse Bats’ expenses up to $10 million under the Merger Agreement.
Item 7A.
Quantitative and Qualitative Disclosure About Market Risk
We are exposed to market risk in the ordinary course of business. This market risk consists primarily of interest rate risk associated with our cash and cash equivalents. The Company does not trade options for its own account.
Interest Rate Risk
We have exposure to market risk for changes in interest rates relating to our cash and cash equivalents. As of
December 31, 2016
and
2015
, our cash and cash equivalents were
$97.3 million
and
$102.3 million
, respectively. We invest available cash in highly liquid, short-term investments, such as money market funds and U.S. Treasury securities. Our investment policy is to preserve capital and liquidity. A hypothetical three basis point decrease in short-term interest rates would decrease annual earnings by less than $75,000, assuming no change in the amount or composition of our cash and cash equivalents.
As of December 31, 2016, we had no long-term indebtedness. However, as discussed above, we intend to incur significant indebtedness in connection with the Merger, a portion of which is expected to be incurred at variable rates of interest. Accordingly, following the Merger, we expect to be exposed to the risk of increased interest rates unless we enter into offsetting hedging transactions.
Impact of Inflation
We have not been adversely affected by inflation as technological advances and competition have generally caused prices for hardware and software that we use for our electronic platforms to remain constant or decline. Since transactions on our exchanges are not governed by long-term contracts, we believe that any increases in inflation are unlikely to have a material adverse effect on us.
63
Item 8.
Financial Statements and Supplementary Data
INDEX TO CONSOLIDATED FINANCIAL STATEMENTS
|
|
Page
|
|
CBOE Holdings, Inc. and Subsidiaries:
|
|
64
REPORT OF INDEPENDENT REGISTERED PUBLIC ACCOUNTING FIRM
To the Board of Directors and Stockholders of
CBOE Holdings, Inc. and Subsidiaries
Chicago, Illinois
We have audited the accompanying consolidated balance sheets of CBOE Holdings, Inc. (the “Company”) as of
December 31, 2016
and
2015
, and the related consolidated statements of income, comprehensive income, stockholders’ equity, and cash flows for each of the three years in the period ended
December 31, 2016
. These financial statements are the responsibility of the Company’s management. Our responsibility is to express an opinion on these financial statements based on our audits.
We conducted our audits in accordance with the standards of the Public Company Accounting Oversight Board (United States). Those standards require that we plan and perform the audit to obtain reasonable assurance about whether the financial statements are free of material misstatement. An audit includes examining, on a test basis, evidence supporting the amounts and disclosures in the financial statements. An audit also includes assessing the accounting principles used and significant estimates made by management, as well as evaluating the overall financial statement presentation. We believe that our audits provide a reasonable basis for our opinion.
In our opinion, such consolidated financial statements present fairly, in all material respects, the financial position of CBOE Holdings, Inc. as of
December 31, 2016
and
2015
, and the results of their operations and their cash flows for each of the three years in the period ended
December 31, 2016
, in conformity with accounting principles generally accepted in the United States of America.
We have also audited, in accordance with the standards of the Public Company Accounting Oversight Board (United States), the Company’s internal control over financial reporting as of
December 31, 2016
, based on the criteria established in Internal Control-Integrated Framework (2013) issued by the Committee of Sponsoring Organizations of the Treadway Commission and our report dated
February 21, 2017
expressed an unqualified opinion on the Company’s internal control over financial reporting.
/s/ DELOITTE & TOUCHE LLP
Chicago, Illinois
February 21, 2017
65
REPORT OF INDEPENDENT REGISTERED PUBLIC ACCOUNTING FIRM
To the Board of Directors and Stockholders of
CBOE Holdings, Inc. and Subsidiaries
Chicago, Illinois
We have audited the internal control over financial reporting of CBOE Holdings, Inc. (the “Company”) as of
December 31, 2016
, based on criteria established in Internal Control-Integrated Framework (2013) issued by the Committee of Sponsoring Organizations of the Treadway Commission. The Company’s management is responsible for maintaining effective internal control over financial reporting and for its assessment of the effectiveness of internal control over financial reporting, included in the accompanying Management’s Annual Report on Internal Control over Financial Reporting. Our responsibility is to express an opinion on the Company’s internal control over financial reporting based on our audit.
We conducted our audit in accordance with the standards of the Public Company Accounting Oversight Board (United States). Those standards require that we plan and perform the audit to obtain reasonable assurance about whether effective internal control over financial reporting was maintained in all material respects. Our audit included obtaining an understanding of internal control over financial reporting, assessing the risk that a material weakness exists, testing and evaluating the design and operating effectiveness of internal control based on the assessed risk, and performing such other procedures as we considered necessary in the circumstances. We believe that our audit provides a reasonable basis for our opinion.
A company’s internal control over financial reporting is a process designed by, or under the supervision of, the company’s principal executive and principal financial officers, or persons performing similar functions, and effected by the company’s board of directors, management, and other personnel to provide reasonable assurance regarding the reliability of financial reporting and the preparation of financial statements for external purposes in accordance with generally accepted accounting principles. A company’s internal control over financial reporting includes those policies and procedures that (1) pertain to the maintenance of records that, in reasonable detail, accurately and fairly reflect the transactions and dispositions of the assets of the company; (2) provide reasonable assurance that transactions are recorded as necessary to permit preparation of financial statements in accordance with generally accepted accounting principles, and that receipts and expenditures of the company are being made only in accordance with authorizations of management and directors of the company; and (3) provide reasonable assurance regarding prevention or timely detection of unauthorized acquisition, use, or disposition of the company’s assets that could have a material effect on the financial statements.
Because of the inherent limitations of internal control over financial reporting, including the possibility of collusion or improper management override of controls, material misstatements due to error or fraud may not be prevented or detected on a timely basis. Also, projections of any evaluation of the effectiveness of the internal control over financial reporting to future periods are subject to the risk that the controls may become inadequate because of changes in conditions, or that the degree of compliance with the policies or procedures may deteriorate.
In our opinion, the Company maintained, in all material respects, effective internal control over financial reporting as of
December 31, 2016
, based on the criteria established in Internal Control-Integrated Framework (2013) issued by the Committee of Sponsoring Organizations of the Treadway Commission.
We have also audited, in accordance with the standards of the Public Company Accounting Oversight Board (United States), the consolidated financial statements as of and for the year ended
December 31, 2016
of the Company and our report dated
February 21, 2017
expressed an unqualified opinion on those financial statements.
/s/ DELOITTE & TOUCHE LLP
Chicago, Illinois
February 21, 2017
66
CBOE Holdings, Inc. and Subsidiaries
December 31, 2016
and
December 31, 2015
|
(in thousands, except share amounts)
|
December 31, 2016
|
December 31, 2015
|
|||||
|
Assets
|
|
|
|||||
|
Current Assets:
|
|
|
|||||
|
Cash and cash equivalents
|
$
|
97,298
|
|
$
|
102,253
|
|
|
|
Accounts receivable—net allowances of 2016 - $127 and 2015 - $150
|
69,902
|
|
62,535
|
|
|||
|
Marketing fee receivable
|
6,685
|
|
5,682
|
|
|||
|
Income taxes receivable
|
53,708
|
|
27,901
|
|
|||
|
Other prepaid expenses
|
5,360
|
|
5,122
|
|
|||
|
Deferred financing costs
|
1,958
|
|
—
|
|
|||
|
Other current assets
|
134
|
|
625
|
|
|||
|
Total Current Assets
|
235,045
|
|
204,118
|
|
|||
|
Investments
|
72,923
|
|
48,430
|
|
|||
|
Land
|
4,914
|
|
4,914
|
|
|||
|
Property and Equipment:
|
|
|
|||||
|
Construction in progress
|
173
|
|
885
|
|
|||
|
Building
|
77,026
|
|
70,531
|
|
|||
|
Furniture and equipment
|
138,837
|
|
144,597
|
|
|||
|
Less accumulated depreciation and amortization
|
(160,101
|
)
|
(155,653
|
)
|
|||
|
Total Property and Equipment—Net
|
55,935
|
|
60,360
|
|
|||
|
Goodwill
|
26,468
|
|
7,655
|
|
|||
|
Other Assets:
|
|
|
|||||
|
Intangible assets (less accumulated amortization --2016 - $1,894 and 2015 - $182)
|
8,666
|
|
2,378
|
|
|||
|
Software development work in progress
|
12,305
|
|
13,836
|
|
|||
|
Data processing software and other assets (less accumulated amortization of 2016 - $171,950; 2015 - $164,152)
|
50,675
|
|
43,097
|
|
|||
|
Deferred tax asset
|
3,494
|
|
—
|
|
|||
|
Deferred financing long-term
|
6,190
|
|
—
|
|
|||
|
Total Other Assets—Net
|
81,330
|
|
59,311
|
|
|||
|
Total
|
$
|
476,615
|
|
$
|
384,788
|
|
|
|
Liabilities, Redeemable Noncontrolling Interests and Stockholders’ Equity
|
|
|
|||||
|
Current Liabilities:
|
|
|
|||||
|
Accounts payable and accrued expenses
|
$
|
79,400
|
|
$
|
60,104
|
|
|
|
Marketing fee payable
|
7,218
|
|
6,141
|
|
|||
|
Deferred revenue and other liabilities
|
3,107
|
|
4,019
|
|
|||
|
Post-retirement benefit obligation - current
|
100
|
|
100
|
|
|||
|
Contingent consideration - current
|
—
|
|
2,000
|
|
|||
|
Income taxes payable
|
18
|
|
1,633
|
|
|||
|
Total Current Liabilities
|
89,843
|
|
73,997
|
|
|||
|
Long-term Liabilities:
|
|
|
|||||
|
Post-retirement benefit obligation - long-term
|
1,843
|
|
1,896
|
|
|||
|
Contingent consideration - long-term
|
—
|
|
1,379
|
|
|||
|
Income taxes liability
|
52,100
|
|
39,679
|
|
|||
|
Other long-term liabilities
|
2,283
|
|
2,883
|
|
|||
|
Deferred income taxes
|
—
|
|
5,309
|
|
|||
|
Total Long-term Liabilities
|
56,226
|
|
51,146
|
|
|||
|
Commitments and Contingencies
|
|
|
|||||
|
Total Liabilities
|
146,069
|
|
125,143
|
|
|||
|
Redeemable Noncontrolling Interests
|
12,600
|
|
—
|
|
|||
|
Stockholders' Equity:
|
|
|
|||||
|
Preferred stock, $0.01 par value: 20,000,000 shares authorized, no shares issued and outstanding at December 31, 2016 or 2015
|
—
|
|
—
|
|
|||
|
Common stock, $0.01 par value: 325,000,000 shares authorized; 92,950,065 issued and 81,285,307 outstanding at December 31, 2016; 92,738,803 issued and 82,088,549 outstanding at December 31, 2015
|
929
|
|
927
|
|
|||
|
Additional paid-in-capital
|
139,249
|
|
123,577
|
|
|||
|
Retained earnings
|
710,779
|
|
603,597
|
|
|||
|
Treasury stock at cost – 11,664,758 shares at December 31, 2016 and 10,650,254 shares at December 31, 2015
|
(532,249
|
)
|
(467,632
|
)
|
|||
|
Accumulated other comprehensive loss
|
(762
|
)
|
(824
|
)
|
|||
|
Total Stockholders' Equity
|
317,946
|
|
259,645
|
|
|||
|
Total
|
$
|
476,615
|
|
$
|
384,788
|
|
|
67
CBOE Holdings, Inc. and Subsidiaries
Years Ended
December 31, 2016
,
2015
and
2014
|
Year Ended
|
Year Ended
|
Year Ended
|
|||||||||
|
(in thousands, except per share amounts)
|
December 31, 2016
|
December 31, 2015
|
December 31, 2014
|
||||||||
|
Operating Revenues:
|
|
|
|
||||||||
|
Transaction fees
|
$
|
463,294
|
|
$
|
456,016
|
|
$
|
437,764
|
|
||
|
Access fees
|
52,358
|
|
53,295
|
|
59,332
|
|
|||||
|
Exchange services and other fees
|
46,261
|
|
42,209
|
|
38,042
|
|
|||||
|
Market data fees
|
33,159
|
|
30,034
|
|
30,447
|
|
|||||
|
Regulatory fees
|
48,321
|
|
33,489
|
|
37,083
|
|
|||||
|
Other revenue
|
13,553
|
|
19,502
|
|
14,557
|
|
|||||
|
Total Operating Revenues
|
656,946
|
|
634,545
|
|
617,225
|
|
|||||
|
Operating Expenses:
|
|
|
|
||||||||
|
Compensation and benefits
|
113,152
|
|
105,925
|
|
121,734
|
|
|||||
|
Depreciation and amortization
|
44,377
|
|
46,274
|
|
39,913
|
|
|||||
|
Technology support services
|
22,465
|
|
20,662
|
|
19,189
|
|
|||||
|
Professional fees and outside services
|
78,543
|
|
50,060
|
|
31,976
|
|
|||||
|
Royalty fees
|
77,953
|
|
70,574
|
|
66,110
|
|
|||||
|
Order routing
|
900
|
|
2,293
|
|
4,080
|
|
|||||
|
Travel and promotional expenses
|
10,971
|
|
8,982
|
|
9,046
|
|
|||||
|
Facilities costs
|
5,693
|
|
4,998
|
|
5,721
|
|
|||||
|
Other expenses
|
4,692
|
|
4,849
|
|
5,655
|
|
|||||
|
Total Operating Expenses
|
358,746
|
|
314,617
|
|
303,424
|
|
|||||
|
Operating Income
|
298,200
|
|
319,928
|
|
313,801
|
|
|||||
|
Other Income/(Expense):
|
|
|
|
||||||||
|
Investment and other income
|
12,984
|
|
3,692
|
|
113
|
|
|||||
|
Net income/(loss) from investments
|
1,167
|
|
447
|
|
(4,217
|
)
|
|||||
|
Interest and other borrowing costs
|
(5,747
|
)
|
(43
|
)
|
—
|
|
|||||
|
Total Other Income/(Expense)
|
8,404
|
|
4,096
|
|
(4,104
|
)
|
|||||
|
Income Before Income Taxes
|
306,604
|
|
324,024
|
|
309,697
|
|
|||||
|
Income tax provision
|
120,884
|
|
119,001
|
|
119,983
|
|
|||||
|
Net Income
|
185,720
|
|
205,023
|
|
189,714
|
|
|||||
|
Net loss attributable to noncontrolling interests
|
1,100
|
|
—
|
|
—
|
|
|||||
|
Net Income Excluding Noncontrolling Interests
|
186,820
|
|
205,023
|
|
189,714
|
|
|||||
|
Change in redemption value of noncontrolling interests
|
(1,100
|
)
|
—
|
|
—
|
|
|||||
|
Net Income allocated to participating securities
|
(775
|
)
|
(898
|
)
|
(1,322
|
)
|
|||||
|
Net Income Allocated to Common Stockholders
|
$
|
184,945
|
|
$
|
204,125
|
|
$
|
188,392
|
|
||
|
Net Income Per Share Allocated to Common Stockholders:
|
|
|
|
||||||||
|
Basic
|
$
|
2.27
|
|
$
|
2.46
|
|
$
|
2.21
|
|
||
|
Diluted
|
2.27
|
|
2.46
|
|
2.21
|
|
|||||
|
Weighted average shares used in computing income per share:
|
|
|
|
||||||||
|
Basic
|
81,432
|
|
83,081
|
|
85,406
|
|
|||||
|
Diluted
|
81,432
|
|
83,081
|
|
85,406
|
|
|||||
See notes to consolidated financial statements
68
CBOE Holdings, Inc. and Subsidiaries
Consolidated Statements of Comprehensive Income
Years Ended
December 31, 2016
,
2015
and
2014
|
Year Ended
|
Year Ended
|
Year Ended
|
|||||||||
|
(in thousands)
|
December 31, 2016
|
December 31, 2015
|
December 31, 2014
|
||||||||
|
|
|
|
|||||||||
|
Net Income
|
$
|
185,720
|
|
$
|
205,023
|
|
$
|
189,714
|
|
||
|
Other Comprehensive Income (Loss) - net of tax:
|
|||||||||||
|
Post retirement benefit obligation
|
62
|
|
(135
|
)
|
361
|
|
|||||
|
Comprehensive Income
|
185,782
|
|
204,888
|
|
190,075
|
|
|||||
|
Comprehensive loss attributable to noncontrolling interests
|
1,100
|
|
—
|
|
—
|
|
|||||
|
Comprehensive Income Excluding noncontrolling interests
|
186,882
|
|
204,888
|
|
190,075
|
|
|||||
|
Change in redemption value of noncontrolling interests
|
(1,100
|
)
|
—
|
|
—
|
|
|||||
|
Comprehensive income allocated to participating securities
|
(775
|
)
|
(898
|
)
|
(1,322
|
)
|
|||||
|
Comprehensive Income Allocated to Common Stockholders
|
$
|
185,007
|
|
$
|
203,990
|
|
$
|
188,753
|
|
||
See notes to consolidated financial statements
69
CBOE Holdings, Inc. and Subsidiaries
Years Ended
December 31, 2016
,
2015
and
2014
|
Year Ended
|
Year Ended
|
Year Ended
|
|||||||||
|
(in thousands)
|
December 31, 2016
|
December 31, 2015
|
December 31, 2014
|
||||||||
|
Cash Flows from Operating Activities:
|
|
|
|
||||||||
|
Net Income
|
$
|
185,720
|
|
$
|
205,023
|
|
$
|
189,714
|
|
||
|
Adjustments to reconcile net income to net cash flows from operating activities:
|
|
|
|
||||||||
|
Depreciation and amortization
|
44,377
|
|
46,274
|
|
39,913
|
|
|||||
|
Other amortization
|
78
|
|
81
|
|
87
|
|
|||||
|
Provision for deferred income taxes
|
(8,845
|
)
|
(8,282
|
)
|
(290
|
)
|
|||||
|
Gain on settlement of contingent consideration
|
(1,399
|
)
|
—
|
|
—
|
|
|||||
|
Stock-based compensation
|
14,503
|
|
12,181
|
|
15,577
|
|
|||||
|
Loss on disposition of property
|
9
|
|
617
|
|
662
|
|
|||||
|
Equity (gain)/loss in investments
|
(1,167
|
)
|
(811
|
)
|
1,217
|
|
|||||
|
Impairment of investment and other assets
|
—
|
|
118
|
|
3,000
|
|
|||||
|
Changes in assets and liabilities:
|
|
|
|
||||||||
|
Accounts receivable
|
(7,367
|
)
|
(4,847
|
)
|
(8,498
|
)
|
|||||
|
Marketing fee receivable
|
(1,003
|
)
|
5,015
|
|
(1,828
|
)
|
|||||
|
Income taxes receivable
|
(25,807
|
)
|
(6,398
|
)
|
536
|
|
|||||
|
Prepaid expenses
|
(213
|
)
|
(500
|
)
|
(615
|
)
|
|||||
|
Other current assets
|
491
|
|
799
|
|
1,745
|
|
|||||
|
Accounts payable and accrued expenses
|
19,841
|
|
1,550
|
|
5,888
|
|
|||||
|
Marketing fee payable
|
1,077
|
|
(5,095
|
)
|
1,794
|
|
|||||
|
Deferred revenue and other liabilities
|
(1,512
|
)
|
717
|
|
1,229
|
|
|||||
|
Post-retirement benefit obligations
|
(26
|
)
|
(19
|
)
|
(28
|
)
|
|||||
|
Income tax liability
|
12,421
|
|
(1,004
|
)
|
10,780
|
|
|||||
|
Income tax payable
|
(1,615
|
)
|
(141
|
)
|
1,774
|
|
|||||
|
Net Cash Flows Provided by Operating Activities
|
229,563
|
|
245,278
|
|
262,657
|
|
|||||
|
Cash Flows from Investing Activities:
|
|
|
|
||||||||
|
Capital and other assets expenditures
|
(44,402
|
)
|
(39,340
|
)
|
(50,154
|
)
|
|||||
|
Acquisition of a majority interest in a business, net of cash received
|
(14,257
|
)
|
(2,960
|
)
|
—
|
|
|||||
|
Payment of contingent consideration from acquisition
|
(1,980
|
)
|
—
|
|
—
|
|
|||||
|
Investments
|
(23,326
|
)
|
(35,386
|
)
|
(1,987
|
)
|
|||||
|
Other
|
(421
|
)
|
(1,735
|
)
|
3
|
|
|||||
|
Net Cash Flows Used in Investing Activities
|
(84,386
|
)
|
(79,421
|
)
|
(52,138
|
)
|
|||||
|
Cash Flows from Financing Activities:
|
|
|
|
||||||||
|
Payment of quarterly dividends
|
(78,538
|
)
|
(73,431
|
)
|
(66,999
|
)
|
|||||
|
Payment of special dividend
|
—
|
|
—
|
|
(43,831
|
)
|
|||||
|
Deferred financing costs
|
(8,148
|
)
|
—
|
|
—
|
|
|||||
|
Excess tax benefit from stock-based compensation
|
1,171
|
|
1,285
|
|
3,557
|
|
|||||
|
Purchase of common stock from employees
|
(4,119
|
)
|
(3,178
|
)
|
(8,332
|
)
|
|||||
|
Payment of outstanding debt in conjunction with acquisition of a business
|
—
|
|
(4,040
|
)
|
—
|
|
|||||
|
Purchase of common stock under announced program
|
(60,498
|
)
|
(132,167
|
)
|
(168,328
|
)
|
|||||
|
Net Cash Flows Used in Financing Activities
|
(150,132
|
)
|
(211,531
|
)
|
(283,933
|
)
|
|||||
|
Net Decrease in Cash and Cash Equivalents
|
(4,955
|
)
|
(45,674
|
)
|
(73,414
|
)
|
|||||
|
Cash and Cash Equivalents at Beginning of Period
|
102,253
|
|
147,927
|
|
221,341
|
|
|||||
|
Cash and Cash Equivalents at End of Period
|
$
|
97,298
|
|
$
|
102,253
|
|
$
|
147,927
|
|
||
|
Supplemental Disclosure of Cash Flow Information
|
|
|
|
||||||||
|
Cash paid for income taxes
|
$
|
142,056
|
|
$
|
133,460
|
|
$
|
103,976
|
|
||
|
Non-cash activities:
|
|
|
|
||||||||
|
Change in post-retirement benefit obligation
|
(104
|
)
|
220
|
|
(583
|
)
|
|||||
|
Unpaid liability to acquire equipment and software
|
—
|
|
2,756
|
|
2,769
|
|
|||||
|
Contingent consideration - current
|
—
|
|
2,000
|
|
—
|
|
|||||
|
Contingent consideration - long-term
|
—
|
|
1,379
|
|
—
|
|
|||||
See notes to consolidated financial statements
70
CBOE Holdings, Inc. and Subsidiaries
Consolidated Statements of Stockholders' Equity
Years Ended
December 31, 2016
,
2015
and
2014
|
(in thousands)
|
Preferred
Stock
|
Common
Stock
|
Additional
Paid-In
Capital
|
Retained
Earnings
|
Treasury Stock
|
Accumulated
Other
Comprehensive
Loss
|
Total
Stockholders'
Equity
|
Redeemable Noncontrolling Interests
|
|||||||||||||||||||||||
|
Balance-January 1, 2014
|
—
|
|
$
|
919
|
|
$
|
90,985
|
|
$
|
349,290
|
|
$
|
(155,627
|
)
|
$
|
(1,050
|
)
|
$
|
284,517
|
|
|||||||||||
|
Cash dividends on common stock of $0.78 per share
|
(66,999
|
)
|
(66,999
|
)
|
|||||||||||||||||||||||||||
|
Stock-based compensation
|
15,577
|
|
15,577
|
|
|||||||||||||||||||||||||||
|
Issuance of vested restricted stock granted to employees
|
7
|
|
(7
|
)
|
—
|
|
|||||||||||||||||||||||||
|
Excess tax benefits from stock-based compensation plan
|
3,557
|
|
3,557
|
|
|||||||||||||||||||||||||||
|
Purchase of common stock
|
(176,660
|
)
|
(176,660
|
)
|
|||||||||||||||||||||||||||
|
Net income
|
189,714
|
|
189,714
|
|
|||||||||||||||||||||||||||
|
Post-retirement benefit obligation adjustment—net of tax expense of $222
|
361
|
|
361
|
|
|||||||||||||||||||||||||||
|
Balance-December 31, 2014
|
—
|
|
926
|
|
110,112
|
|
472,005
|
|
(332,287
|
)
|
(689
|
)
|
250,067
|
|
—
|
|
|||||||||||||||
|
Cash dividends on common stock of $0.88 per share
|
(73,431
|
)
|
(73,431
|
)
|
|||||||||||||||||||||||||||
|
Stock-based compensation
|
12,181
|
|
12,181
|
|
|||||||||||||||||||||||||||
|
Issuance of vested restricted stock granted to employees
|
1
|
|
(1
|
)
|
—
|
|
|||||||||||||||||||||||||
|
Excess tax benefits from stock-based compensation plan
|
1,285
|
|
1,285
|
|
|||||||||||||||||||||||||||
|
Purchase of common stock
|
(135,345
|
)
|
(135,345
|
)
|
|||||||||||||||||||||||||||
|
Net income
|
205,023
|
|
205,023
|
|
|||||||||||||||||||||||||||
|
Post-retirement benefit obligation adjustment—net of tax benefit of $86
|
(135
|
)
|
(135
|
)
|
|||||||||||||||||||||||||||
|
Balance-December 31, 2015
|
—
|
|
927
|
|
123,577
|
|
603,597
|
|
(467,632
|
)
|
(824
|
)
|
259,645
|
|
—
|
|
|||||||||||||||
|
Cash dividends on common stock of $0.96 per share
|
(78,538
|
)
|
(78,538
|
)
|
|||||||||||||||||||||||||||
|
Stock-based compensation
|
14,503
|
|
14,503
|
|
|||||||||||||||||||||||||||
|
Issuance of vested restricted stock granted to employees
|
2
|
|
(2
|
)
|
—
|
|
|||||||||||||||||||||||||
|
Excess tax benefits from stock-based compensation plan
|
1,171
|
|
1,171
|
|
|||||||||||||||||||||||||||
|
Purchase of common stock
|
(64,617
|
)
|
(64,617
|
)
|
|||||||||||||||||||||||||||
|
Net Income excluding noncontrolling interests
|
186,820
|
|
186,820
|
|
|||||||||||||||||||||||||||
|
Increase due to acquiring majority of outstanding equity of Vest
|
—
|
|
12,600
|
|
|||||||||||||||||||||||||||
|
Net loss attributable to redeemable noncontrolling interest
|
—
|
|
(1,100
|
)
|
|||||||||||||||||||||||||||
|
Redemption value adjustment
|
(1,100
|
)
|
(1,100
|
)
|
1,100
|
|
|||||||||||||||||||||||||
|
Post-retirement benefit obligation adjustment—net of tax expense of $42
|
$
|
62
|
|
62
|
|
||||||||||||||||||||||||||
|
Balance-December 31, 2016
|
$
|
—
|
|
$
|
929
|
|
$
|
139,249
|
|
$
|
710,779
|
|
$
|
(532,249
|
)
|
$
|
(762
|
)
|
$
|
317,946
|
|
$
|
12,600
|
|
|||||||
See notes to consolidated financial statements.
71
CBOE HOLDINGS, INC. AND SUBSIDIARIES
NOTES TO CONSOLIDATED FINANCIAL STATEMENTS
For the years ended
December 31, 2016
,
2015
and
2014
1. SUMMARY OF SIGNIFICANT ACCOUNTING POLICIES
Nature of Business
—CBOE Holdings, Inc. ("CBOE Holdings" or the "Company") is the holding company of registered securities exchanges, subject to oversight by the Securities and Exchange Commission ("SEC"), and a designated contract market under the jurisdiction of the Commodity Futures Trading Commission ("CFTC"). The Company's principal business is operating markets that offer for trading exclusive options on various market indexes (index options) and futures contracts, as well as on non-exclusive "multiply-listed" options, such as options on the stocks of individual corporations (equity options) and options on other exchange-traded products (ETP options), such as exchange-traded funds (ETF options) and exchange-traded notes (ETN options), and certain other index options.
Basis of Presentation
—The consolidated financial statements include the accounts and results of operations of CBOE Holdings and its wholly-owned subsidiaries, including: Chicago Board Options Exchange, Incorporated ("CBOE"), CBOE Futures Exchange, LLC ("CFE"), C2 Options Exchange, Incorporated ("C2"), Market Data Express, LLC and Chicago Options Exchange Building Corporation. Inter-company balances and transactions have been eliminated in consolidation. The Company reports the results of its operations in
one
reporting segment.
Use of Estimates
—The preparation of consolidated financial statements in conformity with accounting principles generally accepted in the United States ("GAAP") requires management to make estimates and assumptions that affect the reported amounts of assets and liabilities, disclosures of contingent assets and liabilities and reported amounts of revenues and expenses. On an ongoing basis, management evaluates its estimates based upon historical experience, observance of trends, information available from outside sources and various other assumptions that are believed to be reasonable under the circumstances. Actual results may differ from these estimates under different conditions or assumptions.
Cash and Cash Equivalents
—Cash and cash equivalents include highly liquid investments with maturities of three months or less from the date of purchase. The Company places its cash and cash equivalents with highly-rated financial institutions, limits the amount of credit exposure with any one financial institution and conducts ongoing evaluations of the creditworthiness of the financial institutions with which it does business; therefore concentrations of credit risk are limited. There are no redemption restrictions on the Company's invested cash balances.
Accounts Receivable
—Accounts receivable consists primarily of transaction and regulatory fees from The Options Clearing Corporation ("OCC") and the Company's share of distributable revenue receivable from Options Price Reporting Authority ("OPRA"). Accounts receivable are primarily collected through OCC, and are with large, highly-rated clearing firms; therefore concentrations of credit risk are limited. The Company has no financing-related receivables.
Prepaid Expenses
—Prepaid expenses primarily consist of prepaid software maintenance and licensing expenses which are amortized over the respective periods.
Investments - Cost and Equity Method
—We use the cost method to account for a non-marketable equity investment in an entity that we do not control and for which we do not have the ability to exercise significant influence over an entity’s operating and financial policies. When we do not have a controlling financial interest in an entity but exercise significant influence over the entity's operating and financial policies, such investment is accounted for using the equity method. We recognize dividend income when declared.
Investments are periodically reviewed to determine whether any events or changes in circumstances indicate that the investments may be other than temporarily impaired. In the event of impairment, the Company would recognize a loss for the difference between the carrying amount and the estimated fair value of the investment.
Property and Equipment
—Property and equipment are carried at cost, net of accumulated depreciation. Depreciation is calculated using the straight-line method, generally over
five
to
forty
years. Leasehold improvements are amortized over the lesser of their estimated useful lives or the remaining term of the applicable leases.
Construction in progress is capitalized and carried at cost. Upon completion, the projects are placed in service and amortized over the appropriate useful lives, using the straight-line method commencing with the date the asset is placed in service.
Software Development Work in Progress and Data Processing Software and Other Assets
—The Company expenses software development costs as incurred during the preliminary project stage, while capitalizing costs incurred during the
72
CBOE HOLDINGS, INC. AND SUBSIDIARIES
NOTES TO CONSOLIDATED FINANCIAL STATEMENTS (Continued)
For the years ended December 31, 2016, 2015 and 2014
application development stage, which includes design, coding, installation and testing activities. Estimated useful lives are generally
three
to
ten
years for internally developed and other data processing software and generally are
five
years or less for other assets.
Goodwill and Intangible Assets
—Goodwill represents the excess of the purchase price of our acquisitions over the fair value of identifiable net assets acquired, including other identified intangible assets (See Note 2). We recognize specifically identifiable intangibles when a specific right or contract is acquired. Goodwill has been allocated to specific reporting units for purposes of impairment testing - core CBOE and CBOE Vest. Goodwill impairment testing is performed annually in the fiscal fourth quarter or more frequently if conditions exist that indicate that the asset may be impaired.
We also evaluate intangible assets for impairment annually in the fiscal fourth quarter or more frequently if conditions exist that indicate that the asset may be impaired. Such evaluation includes determining the fair value of the asset and comparing the fair value of the asset with its carrying value. If the fair value of the indefinite-lived intangible asset is less than its carrying value, an impairment loss is recognized in an amount equal to the difference.
For both goodwill and indefinite-lived impairment testing, we have the option to first perform a qualitative assessment to determine whether it is more likely than not that the fair value of a reporting unit or indefinite-lived intangible asset is less than its carrying amount. If we conclude that this is the case, we must perform additional testing of the asset or reporting unit. Otherwise, no further testing is necessary.
As of
December 31, 2016
, we had not identified any factors that would result in an impairment charge related to goodwill or intangible assets.
Employee Benefit Plans
—The funded status of a post retirement benefit plan is recognized in the Consolidated Balance Sheet and changes in that funded status are recognized in the year of change in other comprehensive income (loss). Plan assets and obligations are measured at year end. The Company recognizes changes in actuarial gains and losses and prior service costs in the year in which the changes occur through accumulated other comprehensive loss.
Business Combinations
—The Company accounts for business combinations using the acquisition method. The method requires the acquirer to recognize the assets acquired, liabilities assumed, and any non-controlling interest in the acquiree at the acquisition date, measured at their fair values as of that date. The Company may use independent valuation services to assist in determining the estimated fair values.
Commitments and Contingencies—Litigation
—The Company accrues loss contingencies when the loss is both probable and estimable. All legal costs incurred in connection with loss contingencies are expensed as service is provided.
Revenue Recognition
—Revenue recognition policies for specific sources of revenue are discussed below:
Transaction Fees:
Transaction fees are a function of three variables: (1) exchange fee rates; (2) trading volume; and (3) transaction mix between contract type. Transaction fees are assessed on a per contract basis and are considered earned upon the execution of a trade and are recognized on a trade date basis. Transaction fees are presented net of applicable volume discounts. In the event liquidity providers prepay for transaction fees, revenue is recognized based on the attainment of volume thresholds resulting in the amortization of the prepayment over the calendar year.
Access Fees:
Access fees represent fees assessed to Trading Permit Holders and Trading Privilege Holders for the opportunity to trade and use other related functions of CBOE, C2 and CFE. Access fees are recognized during the period the service is provided.
Exchange Services and Other Fees:
Exchange services and other fees include system services, trading floor charges and application revenue. Exchange services and other fees are recognized during the period the service is provided.
Market Data Fees:
Market data fees include OPRA income and fees generated from the Company's market data services. OPRA is a limited liability company consisting of representatives of the member exchanges and is authorized by the SEC to provide consolidated options information. The Company's market data services are provided through CBOE Streaming Markets ("CSM") and other services. OPRA income is allocated based upon the individual exchange's relative volume of total cleared options transactions. The Company receives monthly estimates of OPRA's distributable revenue (See Note
9
) and income is distributed on a quarterly basis. Company market data fees represent charges for current and historical options and futures data provided directly by the Company. Market data services are recognized in the period the data is provided.
73
CBOE HOLDINGS, INC. AND SUBSIDIARIES
NOTES TO CONSOLIDATED FINANCIAL STATEMENTS (Continued)
For the years ended December 31, 2016, 2015 and 2014
Regulatory Fees:
Regulatory fees are primarily based on the number of customer contracts traded on all U.S. options exchanges by Trading Permit Holders and are primarily recognized on a trade-date basis. Under the rules of each of our options exchanges, as required by the SEC, any revenue derived from regulatory fees and fines cannot be used for non-regulatory purposes.
Concentration of Revenue:
All contracts traded on our exchanges must be cleared through clearing members of OCC. At
December 31, 2016
, there were
one hundred one
Trading Permit Holders that are clearing members of OCC.
Two
clearing members accounted for
42%
of transaction and other fees collected through OCC in
2016
. The next largest clearing member accounted for approximately
14%
of transaction and other fees collected through the OCC. No one Trading Permit Holder using the clearing services of the top two clearing member firms represented more than
21%
of transaction and other fees collected through OCC, for the respective clearing member, in
2016
. Should a clearing member withdraw from CBOE, we believe the Trading Permit Holder portion of that clearing member's trading activity would likely transfer to another clearing member.
The two largest clearing members mentioned above clear the majority of the market-maker sides of transactions at CBOE, C2 and at all of the U.S. options exchanges. If either of these clearing members were to withdraw from the business of market-maker clearing and market-makers were unable to transfer to another clearing member, this could create significant disruption to the U.S. options markets, including ours.
Advertising Costs
—Advertising costs, including print advertising and production costs, product promotion campaigns and seminar, conference convention costs related to trade shows and other industry events and, in prior years, sponsorships with local professional sports organizations, are expensed as incurred or amortized over the respective period. The Company incurred advertising costs of
$6.0 million
,
$4.7 million
and
$4.3 million
for the years ended
December 31, 2016
,
2015
and
2014
, respectively. Advertising costs are included in travel and promotional expenses in the consolidated statements of income.
Stock-Based Compensation
—Stock-based compensation is based on the fair value of the award on the grant date and recognized over the related service period, net of estimated forfeitures. For performance based units, we use the Monte Carlo valuation model method to estimate the fair value of the award.
Income Taxes
—Deferred income taxes arise from temporary differences between the tax basis and book basis of assets and liabilities. A valuation allowance is recognized if it is anticipated that some or all of a deferred tax asset may not be realized.
The Company accounts for uncertainty in income taxes recognized in its consolidated financial statements by using a more-likely-than-not recognition threshold based solely on the technical merits of the position taken or expected to be taken. Interest and penalties are recorded within the provision for income taxes in the Company's consolidated statements of income and are classified on the consolidated balance sheets with the related liability for unrecognized tax benefits. See Note
12
for further discussion of the Company's income taxes.
Recent Accounting Pronouncements
—
In May 2014, the FASB issued ASU 2014-09,
Revenue from Contracts with Customers
. This standard outlines a single comprehensive model for entities to use in accounting for revenue arising from contracts with customers and supersedes most current revenue recognition guidance, including industry-specific guidance. In addition, the ASU provides guidance on accounting for certain revenue-related costs including when to capitalize costs associated with obtaining and fulfilling a contract. ASU 2014-09 provides companies with two implementation methods. Companies can choose to apply the standard retrospectively to each prior reporting period presented (full retrospective application) or retrospectively with the cumulative effect of initially applying the standard as an adjustment to the opening balance of retained earnings of the annual reporting period that includes the date of initial application (modified retrospective application). This guidance is effective for annual reporting periods beginning after December 15, 2016, including interim periods within that reporting period. Early application is not permitted. The FASB deferred the effective date by one year to December 15, 2017 for annual reporting periods beginning after that date. Early adoption of the standard is permitted as of annual reporting periods beginning after December 15, 2016, including interim reporting periods within those annual periods. Based on our evaluation of the standard, we do not expect a material impact on our revenue recognition practices. A significant portion of our revenue is generated from fees associated primarily with the execution of a trade, transaction fees and regulatory fees, and revenue is recognized on the trade date as our performance obligation would be complete. The revenue components that are not primarily associated with the execution of a trade, market data fees and exchange service and other fees, are also not expected to be impacted by the adoption of the new standard. In most cases, our performance obligation is fulfilled on a monthly basis and does not require any additional requirements that would require performance beyond a monthly basis. Therefore we do not expect a material impact on our revenue recognition policies as a result of the adoption of the new standard which the Company is considering early adoption prior to the effective date.
74
CBOE HOLDINGS, INC. AND SUBSIDIARIES
NOTES TO CONSOLIDATED FINANCIAL STATEMENTS (Continued)
For the years ended December 31, 2016, 2015 and 2014
In February 2016, the FASB issued ASU 2016-02,
Leases
. This update requires a lessee to recognize on the balance sheet a liability to make lease payments and a corresponding right-of-use asset. The guidance also requires certain qualitative and quantitative disclosures about the amount, timing and uncertainty of cash flows arising from leases. This update is effective for annual and interim periods beginning after December 15, 2018. Early adoption is permitted. The Company is in the process of evaluating this guidance, though we do not expect it will materially impact our consolidated balance sheets, statements of income, comprehensive income or cash flows.
In March 2016, the FASB issued ASU 2016-09,
Compensation — Stock Compensation
. This standard simplifies several aspects of the accounting for stock-based payment transactions, including the recognition of excess tax benefits and deficiencies, the classification of those excess tax benefits on the statement of cash flows, an accounting policy election for forfeitures, the amount an employer can withhold to cover income taxes and still qualify for equity classification and the classification of those taxes paid on the statement of cash flows. This update is effective for annual and interim periods beginning after December 15, 2016 and can be applied either prospectively, retrospectively or using a modified retrospective transition method, depending on the area covered in this update. Early adoption is permitted. The Company is in the process of evaluating this guidance, though we do not expect it will materially impact our consolidated balance sheets, statements of income, comprehensive income or cash flows.
In September 2016, the FASB issued ASU 2016-15,
Statement of Cash Flows (Topic 230) — Classification of Certain Cash Receipts and Cash Payments (a consensus of the FASB Emerging Issues Task Force).
This standard addresses stakeholders’ concerns regarding diversity in practice in how certain cash receipts and cash payments are presented and classified in the statement of cash flows under Topic 230, Statement of Cash Flows, and other Topics. In particular, ASU No. 2016-15 addresses eight specific cash flow issues in an effort to reduce this diversity in practice: (1) debt prepayment or debt extinguishment costs; (2) settlement of zero-coupon bonds; (3) contingent consideration payments made after a business combination; (4) proceeds from the settlement of insurance claims; (5) proceeds from the settlement of corporate-owned life insurance policies, including bank-owned life insurance policies; (6) distributions received from equity method investees; (7) beneficial interests in securitization transactions; and (8) separately identifiable cash flows and application of the predominance principle. For public business entities that are SEC filers, the amendments are effective for fiscal years beginning after December 15, 2017, and for interim periods within those fiscal years. Note that early adoption is permitted for all entities, including adoption during an interim period. The Company is in the process of evaluating this guidance, though we do not expect it will materially impact our consolidated balance sheets, statements of income, comprehensive income or cash flows.
In October 2016, the FASB issued ASU 2016-16,
Accounting for Income Taxes:Intra-Entity Transfers of Assets other than Inventory
. The standard requires that the income tax impact of intra-entity sales and transfers of property, except for inventory, be recognized when the transfer occurs. This update is effective for annual and interim periods beginning after December 15, 2017. Early adoption is permitted. The new standard should be applied by making a cumulative effect adjustment directly to retained earnings as of the beginning of period of adoption.The Company is in the process of evaluating this guidance, and considering early adoption, though we do not expect it will materially impact our consolidated balance sheets, statements of income, comprehensive income or cash flows.
2. ACQUISITION - GOODWILL AND INTANGIBLE ASSETS
CBOE Vest Financial Group Inc.
In January 2016, the Company, through its subsidiary CBOE Vest, LLC, acquired a majority of the outstanding equity of Vest, an asset management firm that provides options-based investments through structured protective strategies and innovative technology solutions which allows for enhanced integration of our proprietary products, strategy indexes and options expertise. The purchase price consisted of
$18.9 million
in cash, reflecting payments of
$14.9 million
to former stockholders and
$4.0 million
to Vest for newly issued shares, and represented an ownership interest of
60%
resulting in the consolidation of Vest operations. The purchase price was allocated to the assets acquired based on their fair values at the acquisition date. The allocation is identified below:
75
CBOE HOLDINGS, INC. AND SUBSIDIARIES
NOTES TO CONSOLIDATED FINANCIAL STATEMENTS (Continued)
For the years ended December 31, 2016, 2015 and 2014
|
(amounts in thousands)
|
||||
|
Purchase Price
|
$
|
18,900
|
|
|
|
Fair Value of Assets Acquired:
|
||||
|
Cash
|
$
|
4,700
|
|
|
|
Intangible assets
|
8,000
|
|
||
|
Goodwill
|
18,800
|
|
||
|
Total Assets Acquired
|
$
|
31,500
|
|
|
|
Redeemable noncontrolling interests
|
12,600
|
|
||
|
Net Assets Acquired
|
$
|
18,900
|
|
|
The remaining
40%
noncontrolling interest is held by the remaining Vest stockholders. The remaining Vest stockholders have a put option that can be exercised to Vest and Vest has a call option that can be exercised to the remaining stockholders. The put and call options can be exercised after
five
years though they could be accelerated by certain employment-related actions. The combination of the noncontrolling interest and a redemption feature resulted in a redeemable noncontrolling interest, which is classified outside of permanent equity on the consolidated balance sheet.
In addition to the tangible and intangible assets, goodwill totaling
$18.8 million
was recorded in connection with the acquisition. Goodwill was calculated as the excess of the consideration transferred over the net assets recognized and represents potential future economic benefits arising from other assets acquired that could not be individually identified and separately recognized. The goodwill is not expected to be deductible for tax purposes.
Vest - Intangible Assets
Intangible assets totaling
$8.0 million
were recorded in 2016 in connection with the acquisition of Vest and include: customer relationships, trade names, and technology. Intangible assets and related accumulated amortization consisted of the following as of
December 31, 2016
(in thousands):
|
As of December 31, 2016
|
Estimated Useful Lives
|
|||
|
Customer relationships
|
$
|
3,000
|
|
9 years
|
|
Trade names
|
1,000
|
|
7 years
|
|
|
Technology
|
4,000
|
|
5 years
|
|
|
Total Intangible Assets Acquired
|
8,000
|
|
||
|
Less accumulated amortization
|
1,276
|
|
||
|
Total Intangibles, net
|
$
|
6,724
|
|
|
76
CBOE HOLDINGS, INC. AND SUBSIDIARIES
NOTES TO CONSOLIDATED FINANCIAL STATEMENTS (Continued)
For the years ended December 31, 2016, 2015 and 2014
For the year ended
December 31, 2016
, amortization of Vest intangible assets was
$1.3 million
. The remaining weighted average useful lives of the intangible assets is
5.8 years
as of
December 31, 2016
. The future expected amortization expense from the intangible assets related to the Vest acquisition as of
December 31, 2016
is as follows (in thousands):
|
Year
|
Amortization expense
|
|||
|
2017
|
$
|
1,276
|
|
|
|
2018
|
1,276
|
|
||
|
2019
|
1,276
|
|
||
|
2020
|
1,276
|
|
||
|
2021
|
476
|
|
||
|
Total
|
$
|
5,580
|
|
|
Livevol - Intangible Assets
Intangible assets totaling
$2.6 million
recorded in 2015 in connection with the acquisition of Livevol included: customer relationships, trade names, existing technology, non-compete agreements and leasehold rights. Intangible assets and related accumulated amortization consisted of the following as of
December 31, 2016
(in thousands):
|
As of December 31, 2016
|
Estimated Useful Lives
|
|||
|
Customer relationships
|
$
|
910
|
|
13 years
|
|
Trade names
|
370
|
|
10 years
|
|
|
Technology
|
1,130
|
|
2-5 years
|
|
|
Other
|
150
|
|
1-4 years
|
|
|
Total
|
2,560
|
|
||
|
Less accumulated amortization
|
617
|
|
||
|
Total Intangibles, net
|
$
|
1,943
|
|
|
For the twelve months ended
December 31, 2016
, amortization of Livevol intangible assets was
$0.4 million
. The remaining weighted average useful lives of the intangible assets is
7.6 years
as of
December 31, 2016
. The future expected amortization expense from the intangible assets related to the Livevol acquisition as of
December 31, 2016
is as follows (in thousands):
|
Year
|
Amortization expense
|
|||
|
2017
|
379
|
|
||
|
2018
|
349
|
|
||
|
2019
|
309
|
|
||
|
2020
|
206
|
|
||
|
2021
|
107
|
|
||
|
Total
|
$
|
1,350
|
|
|
3. INVESTMENTS
77
CBOE HOLDINGS, INC. AND SUBSIDIARIES
NOTES TO CONSOLIDATED FINANCIAL STATEMENTS (Continued)
For the years ended December 31, 2016, 2015 and 2014
At
December 31, 2016
and
2015
, the Company's investments were comprised of the following (in thousands):
|
December 31, 2016
|
December 31, 2015
|
||||||
|
Equity Method
|
|||||||
|
Investment in Signal Trading Systems, LLC
|
$
|
12,409
|
|
$
|
12,185
|
|
|
|
Investment in CBOE Stock Exchange, LLC
|
—
|
|
—
|
|
|||
|
Total equity method investments
|
12,409
|
|
12,185
|
|
|||
|
Cost Method
|
|||||||
|
Investment in OCC
|
30,333
|
|
30,333
|
|
|||
|
Other cost method investments
|
30,181
|
|
5,912
|
|
|||
|
Total cost method investments
|
60,514
|
|
36,245
|
|
|||
|
Total Investments
|
$
|
72,923
|
|
$
|
48,430
|
|
|
Equity Method
The carrying amount of our equity method investments totaled
$12.4 million
and
$12.2 million
as of
December 31, 2016
and
2015
, respectively, and is included in Investments in our Consolidated Balance Sheet. Our equity method investments include our in investments in Signal Trading Systems, LLC ("Signal") and CBOE Stock Exchange, LLC ("CBSX").
In May 2010, CBOE acquired a
50%
interest in Signal from FlexTrade Systems, Inc. ("FlexTrade"). The joint venture develops and markets a multi-asset front-end order entry system, known as "Pulse," which has a particular emphasis on options trading. The Company assists in the development of the terminals and provides marketing services to the joint venture, which is accounted for under the equity method. We account for the investment in Signal under the equity method due to the substantive participating rights provided to the other limited liability company member, FlexTrade. In the twelve months ended
December 31, 2016
, the Company recorded contributions to Signal of
$2.0 million
and equity earnings in Signal of
$1.2 million
. Additionally, the Company received distributions from Signal of
$2.9 million
which reduced the carrying value of our investment.
The Company currently holds a
49.96%
equity interest in CBSX in return for non-cash property contributions. CBSX ceased trading operations on April 30, 2014. CBOE is responsible for the compliance and regulation of the CBSX marketplace. In addition, the Company has a services agreement under which it provides financial, accounting and technology support.
Cost method
The carrying amount of our cost method investments totaled
$60.5 million
and
$36.2 million
as of
December 31, 2016
and
2015
, respectively, and is included in Investments in our Consolidated Balance Sheet. We account for our cost-method investments primarily as a result of our inability to exercise significant influence over these investments. As of
December 31, 2016
, our cost method investments primarily reflect our
20%
investment in OCC and minority investments in American Financial Exchange ("AFX"), CurveGlobal and Eris Exchange Holdings, LLC ("Eris").
In December 2014, OCC announced a newly-formed capital plan. The OCC capital plan was designed to strengthen OCC's capital base and facilitate its compliance with proposed SEC regulations for Systemically Important Financial Market Utilities ("SIFMUs") as well as international standards applicable to financial market infrastructures. On February 26, 2015, the SEC issued a notice of no objection to OCC's advance notice filing regarding the capital plan, and OCC and OCC’s existing exchange stockholders, which include CBOE, subsequently executed agreements effecting the capital plan. Under the plan, each of OCC's existing exchange stockholders agreed to contribute its pro-rata share, based on ownership percentage, of $150 million in equity capital, which would increase OCC's shareholders' equity, and to provide its pro rata share in replenishment capital, up to a maximum of $40 million per exchange stockholder, if certain capital thresholds are breached. OCC also adopted policies under the plan with respect to fees, customer refunds, and stockholder dividends, which envision an annual dividend payment to the exchange stockholders equal to the portion of OCC’s after-tax income that exceeds OCC’s capital requirements after payment of refunds to OCC’s clearing members (with such customer refunds generally to constitute 50% of the portion of
78
CBOE HOLDINGS, INC. AND SUBSIDIARIES
NOTES TO CONSOLIDATED FINANCIAL STATEMENTS (Continued)
For the years ended December 31, 2016, 2015 and 2014
OCC’s pre-tax income that exceeds OCC’s capital requirements).
On March 3, 2015, in accordance with the plan, CBOE contributed
$30 million
to OCC. On March 6, 2015, OCC informed CBOE that the SEC, acting though delegated authority, had approved OCC's proposed rule filing for the capital plan. The SEC approval order was stayed on March 13, 2015 automatically as a result of the initiation of petitions to review the order. On September 10, 2015, the SEC issued orders that discontinued the automatic stay of the approval order and granted the petitions for the SEC to review the approval order. On September 15, 2015, the petitioners filed motions to reinstitute the automatic stay. On February 11, 2016, based on a
de novo
review of the entire record, the SEC approved the proposed rule change implementing OCC's capital plan and dismissed the petitions for review and the petitioners' motions. Certain petitioners subsequently appealed the SEC approval order for the OCC capital plan to the U.S. Court of Appeals for the D.C. Circuit and moved to stay the SEC approval order. On February 23, 2016, the Court denied the petitioners’ motion to stay. The appeal of the SEC approval order remains pending. CBOE's contribution has been recorded under Investments in the balance sheet at
December 31, 2016
.
In 2015, CBOE Holdings, through its subsidiary Loan Markets, LLC, acquired a minority interest in AFX, an electronic marketplace for small and mid-sized banks to lend and borrow short-term funds.
In January 2016, CBOE Holdings, through its subsidiary CBOE III, LLC, acquired a minority interest in CurveGlobal, an interest rate derivatives venture.
In May 2016, CBOE Holdings, through its subsidiary CBOE III, LLC, acquired a minority interest in Eris Exchange Holdings, LLC (“Eris”), the parent of a U.S. based futures exchange group.
4. DEBT
CBOE Holdings and Bats Global Markets, Inc. (“Bats”) entered into an Agreement and Plan of Merger, dated as of September 25, 2016 (the “Merger Agreement”), providing, among other things, that, upon the terms and subject to the conditions set forth in the Merger Agreement, a wholly-owned subsidiary of CBOE Holdings will merge with and into Bats, with Bats surviving as a wholly-owned subsidiary of CBOE Holdings (the “Merger”). The Merger Agreement also provides that, immediately following the effective time of the Merger, Bats, as the surviving corporation from the Merger, will merge with and into CBOE V, LLC (“Merger LLC”), a wholly-owned subsidiary of CBOE Holdings, Inc. (the “Subsequent Merger”), with Merger LLC surviving the Subsequent Merger as a wholly-owned subsidiary of CBOE Holdings. The following outlines the steps the Company has taken regarding short and long-term financing related to the Merger and acquiring funding available for general corporate purposes.
Bridge Facility
In connection with entering into the Merger Agreement, the Company entered into a commitment letter with Bank of America, N.A. and Merrill Lynch, Pierce, Fenner & Smith Incorporated (or any of its designated affiliates) (Bank of America, N.A., and other such financial institutions that accede as lender to such debt commitment letter in accordance with its terms are referred to herein as the “Lenders”), which provides that, subject to the satisfaction and waiver of certain conditions which are usual and customary for financing of this type, the Lenders are committed to provide debt financing for the purposes of funding (i) the cash consideration to be paid in the transactions contemplated by the Merger Agreement, (ii) the refinancing of certain existing indebtedness of Bats and its subsidiaries and (iii) related fees and expenses, which debt financing consists of a senior unsecured
364
-day bridge loan facility in an aggregate principal amount of up to $
1.65 billion
to the extent the Company fails to generate gross cash proceeds in an aggregate principal amount of up to $
1.65 billion
from permanent financing including in the form of a senior unsecured term loan facility and the issuance of senior unsecured notes on or prior to the consummation of the transaction contemplated by the Merger Agreement. The Company paid commitment and structuring fees of $
6.0 million
. Through December 31, 2016, we have amortized $
5.7 million
of these fees as a result of the Company entering into more permanent debt arrangements. In lieu of entering into the bridge loan facility, the Company entered into a term loan agreement and completed a notes offering, as described below, securing $
1.65 billion
to finance the cash portion of its pending acquisition of Bats as well as the repayment of Bats' existing indebtedness.
Term Loan Agreement
On December 15, 2016, the Company, as borrower, entered into a Term Loan Credit Agreement (the “Term Loan Agreement”) with Bank of America, N.A., as administrative agent, certain lenders named therein (the “Term Lenders”), Merrill Lynch, Pierce, Fenner & Smith Incorporated, as sole lead arranger and sole bookrunner, Morgan Stanley MUFG Loan Partners,
79
CBOE HOLDINGS, INC. AND SUBSIDIARIES
NOTES TO CONSOLIDATED FINANCIAL STATEMENTS (Continued)
For the years ended December 31, 2016, 2015 and 2014
LLC, as syndication agent, and Citibank, N.A., PNC Bank, National Association and JPMorgan Chase Bank, N.A., as co-documentation agents.
The Term Loan Agreement provides for a senior unsecured delayed draw term loan facility (the “Term Loan Facility”) in an aggregate principal amount of $
1.0 billion
. We may also, subject to the agreement of the applicable Term Lenders, increase the commitments under the Term Loan Agreement by up to $
500 million
for a total of $
1.5 billion
. Proceeds from the Term Loan Facility, if drawn, may be used to finance the Merger and to fund working capital needs and for other general corporate purposes. The availability of the commitments under the Term Loan Agreement is conditioned upon, among other things, confirmation that the Merger has been consummated, or will be consummated substantially concurrently with the extension of the loans under the Term Loan Agreement.
Commitments under the Term Loan Agreement will expire on the earlier of (i) the consummation of the Merger (after giving effect to the funding of the committed loans in accordance with and subject to the terms of the Term Loan Agreement), (ii) July 25, 2017 (or if the outside date is extended pursuant to the terms of the Merger Agreement, October 23, 2017), (iii) the closing of the Merger without using the loans under the Term Loan Agreement and (iv) the termination of the Merger Agreement in accordance with the terms thereof. Loans under the Term Loan Agreement, if drawn, will mature five years following the closing date of the Merger. The Term Loan Facility is unsecured and is not expected to be guaranteed by any subsidiary.
Loans under the Term Loan Agreement will bear interest, at our option, at either (i) the London Interbank Offered Rate (“LIBOR”) periodically fixed for an interest period (as selected by us) of one, two, three or six months plus a margin (based on our public debt ratings) ranging from
1.00
percent per annum to
1.75
percent per annum or (ii) a daily floating rate based on the agent’s prime rate (subject to certain minimums based upon the federal funds effective rate or LIBOR) plus a margin (based on our public debt ratings) ranging from
zero
percent per annum to
0.75
percent per annum. We will be required to pay a ticking fee to the agent for the account of the Term Lenders which will initially accrue at a rate (based on our public debt ratings) ranging from
0.10
percent per annum to
0.30
percent per annum multiplied by the undrawn aggregate commitments of the Term Lenders in respect of the Term Loan Facility, accruing during the period commencing on December 15, 2016 and ending on the earlier of (i) the date on which the loans are drawn and (ii) the termination of the commitments under the Term Loan Agreement in accordance with the terms thereof.
The Term Loan Agreement contains customary representations, warranties and affirmative and negative covenants for facilities of its type, including financial covenants, events of default and indemnification provisions in favor of the Term Lenders. The negative covenants include restrictions regarding the incurrence of liens, the incurrence of indebtedness by the our subsidiaries and fundamental changes, subject to certain exceptions in each case. The financial covenants require us to meet a quarterly financial test with respect to a minimum consolidated interest coverage ratio of not less than
4.00
to 1.00 and a maximum consolidated leverage ratio of not greater than
3.50
to 1.00. As of December 31, 2016, we had not drawn upon the commitments in the Term Loan Agreement.
Revolving Credit Agreement
On December 15, 2016, the Company, as borrower, entered into a Credit Agreement (the “Revolving Credit Agreement”) with Bank of America, N.A., as administrative agent and as swing line lender, certain lenders named therein (the “Revolving Lenders”), Merrill Lynch, Pierce, Fenner & Smith Incorporated, as sole lead arranger and sole bookrunner, Morgan Stanley MUFG Loan Partners, LLC, as syndication agent, and Citibank, N.A., PNC Bank, National Association and JPMorgan Chase Bank, N.A., as co-documentation agents.
The Revolving Credit Agreement provides for a senior unsecured $
150 million
five
-year revolving credit facility (the “Revolving Credit Facility”) that includes a $
25 million
swing line sub-facility. We may also, subject to the agreement of the applicable lenders, increase the commitments under the Revolving Credit Facility by up to $
100 million
, for a total of $
250 million
. Subject to specified conditions, we may designate one or more of our subsidiaries as additional borrowers under the Revolving Credit Agreement provided that we guarantee all borrowings and other obligations of any such subsidiaries. As of December 31, 2016, no subsidiaries were designated as additional borrowers.
Funds borrowed under the Revolving Credit Agreement may be used to fund working capital and for other general corporate purposes. As of December 31, 2016,
no
borrowings were outstanding under the Revolving Credit Agreement.
80
CBOE HOLDINGS, INC. AND SUBSIDIARIES
NOTES TO CONSOLIDATED FINANCIAL STATEMENTS (Continued)
For the years ended December 31, 2016, 2015 and 2014
Accordingly, at December 31, 2016, $
150 million
of borrowing capacity was available for the purposes permitted by the Revolving Credit Agreement.
Loans under the Revolving Credit Agreement will bear interest, at our option, at either (i) LIBOR periodically fixed for an interest period (as selected by us) of one, two, three or six months plus a margin (based on our public debt ratings) ranging from
1.00
percent per annum to
1.75
percent per annum or (ii) a daily floating rate based on our prime rate (subject to certain minimums based upon the federal funds effective rate or LIBOR) plus a margin (based on our public debt ratings) ranging from
zero
percent per annum to
0.75
percent per annum.
Subject to certain conditions stated in the Revolving Credit Agreement, we may borrow, prepay and reborrow amounts under the Revolving Credit Facility at any time during the term of the Revolving Credit Agreement. The Revolving Credit Agreement will terminate and all amounts owing thereunder will be due and payable on December 15, 2021, unless the commitments are terminated earlier, either at our request or, if an event of default occurs, by the Revolving Lenders (or automatically in the case of certain bankruptcy-related events). The Revolving Credit Agreement contains customary representations, warranties and affirmative and negative covenants for facilities of its type, including financial covenants, events of default and indemnification provisions in favor of the Revolving Lenders. The negative covenants include restrictions regarding the incurrence of liens, the incurrence of indebtedness by our subsidiaries and fundamental changes, subject to certain exceptions in each case. The financial covenants require us to meet a quarterly financial test with respect to a minimum consolidated interest coverage ratio of not less than
4.00
to 1.00 and a maximum consolidated leverage ratio of not greater than
3.50
to 1.00. As of December 31, 2016, we had not drawn upon the Revolving Credit Agreement.
3.650%
Senior Notes due 2027
On January 12, 2017, the Company entered into an indenture (the “Indenture”), by and between the Company and Wells Fargo Bank, National Association, as trustee (the “Trustee”), in connection with the issuance of $
650 million
aggregate principal amount of the Company’s
3.650%
Senior Notes due 2027 (the “Notes”). The form and terms of the Notes were established pursuant to an Officer’s Certificate, dated as of January 12, 2017 (the “Officer’s Certificate”), supplementing the Indenture.
The Company intends to use a portion of the net proceeds from the Notes to fund, in part, the Merger, including the payment of related fees and expenses and the repayment of Bats’ existing indebtedness, and the remainder for general corporate purposes. The Notes mature on January 12, 2027 and bear interest at the rate of
3.650%
per annum, payable semi-annually in arrears on January 12 and July 12 of each year, commencing July 12, 2017. The Notes are unsecured obligations of the Company and rank equally with all of the Company’s other existing and future unsecured, senior indebtedness, but are effectively junior to the Company’s secured indebtedness, to the extent of the value of the assets securing such indebtedness, and will not be the obligations of any of the Company’s subsidiaries.
The Company has the option to redeem some or all of the Notes, at any time in whole or from time to time in part, at the redemption prices set forth in the Officer’s Certificate. The Notes will be subject to a special mandatory redemption in the event that the Merger is not consummated on or prior to October 23, 2017 or, if prior to October 23, 2017, the Merger Agreement is terminated other than in connection with the consummation of the Merger and is not otherwise amended or replaced. In such an event, the Notes will be redeemed at a price equal to
101%
of the aggregate principal amount thereof. The Company may also be required to offer to repurchase the Notes upon the occurrence of a Change of Control Triggering Event (as such term is defined in the Officer’s Certificate) at a repurchase price equal to
101%
of the aggregate principal amount of Notes to be repurchased.
5. REDEEMABLE NONCONTROLLING INTEREST
Redeemable noncontrolling interests are reported on the consolidated balance sheets in mezzanine equity in "Redeemable Noncontrolling Interests." We recognize changes to the redemption value of redeemable noncontrolling interests as they occur and adjust the carrying value to equal the redemption value at the end of each reporting period. The resulting increases or decreases in the estimated redemption amount are affected by corresponding charges or credits against retained earnings, or in the absence of retained earnings, additional paid in capital. The redemption amounts have been estimated based
81
CBOE HOLDINGS, INC. AND SUBSIDIARIES
NOTES TO CONSOLIDATED FINANCIAL STATEMENTS (Continued)
For the years ended December 31, 2016, 2015 and 2014
on the fair value of the majority-owned subsidiary, determined based on a weighting of the discounted cash flow and other economic factors.
For the year ended
December 31, 2016
, the following reflects changes in our redeemable noncontrolling interests (in thousands):
|
Redeemable Noncontrolling Interest
|
|||
|
Balance as of January 1, 2016
|
$
|
—
|
|
|
Increase due to acquiring majority of outstanding equity of Vest
|
12,600
|
|
|
|
Net loss attributable to redeemable noncontrolling interest
|
(1,100
|
)
|
|
|
Redemption value adjustment
|
1,100
|
|
|
|
Balance as of December 31, 2016
|
$
|
12,600
|
|
6. ACCOUNTS PAYABLE AND ACCRUED LIABILITIES
At
December 31, 2016
and
2015
, accounts payable and accrued liabilities consisted of the following (in thousands):
|
2016
|
2015
|
||||||
|
Compensation and benefit related liabilities
|
$
|
25,505
|
|
$
|
23,304
|
|
|
|
Royalties
|
17,807
|
|
15,409
|
|
|||
|
Contract services
|
12,166
|
|
6,684
|
|
|||
|
Acquisition related (1)
|
6,856
|
|
—
|
|
|||
|
Accounts payable
|
6,466
|
|
1,762
|
|
|||
|
Purchase of common stock (2)
|
—
|
|
1,778
|
|
|||
|
Facilities
|
2,066
|
|
2,099
|
|
|||
|
Legal
|
1,052
|
|
1,536
|
|
|||
|
Market linkage
|
917
|
|
628
|
|
|||
|
Other
|
6,565
|
|
6,904
|
|
|||
|
Total
|
$
|
79,400
|
|
$
|
60,104
|
|
|
(1) As of
December 31, 2016
, this amount reflects professional fees and outside services associated with the proposed acquisition of Bats.
(2) Reflects shares purchased at the end of the period that are not settled until
three
trading days after the trade occurs. We were not active in our share repurchase program during the fourth quarter of 2016.
7. MARKETING FEE
The Company facilitates the collection and payment of marketing fees assessed on certain trades taking place at CBOE. Funds resulting from the marketing fees are made available to Designated Primary Market-Makers and Preferred Market-Makers as an economic inducement to route orders to CBOE. Pursuant to ASC 605-45,
Revenue Recognition—Principal Agent Considerations
, the Company reflects the assessments and payments on a net basis, with no impact on revenues or expenses.
As of
December 31, 2016
and
2015
, amounts assessed by the Company on behalf of others included in current assets totaled
$6.7 million
and
$5.7 million
, respectively, and payments due to others included in current liabilities totaled
$7.2 million
and
$6.1 million
, respectively.
82
CBOE HOLDINGS, INC. AND SUBSIDIARIES
NOTES TO CONSOLIDATED FINANCIAL STATEMENTS (Continued)
For the years ended December 31, 2016, 2015 and 2014
8. DEFERRED REVENUE
The following tables summarize the activity in deferred revenue for the years ended
December 31, 2016
and
2015
(in thousands):
|
Balance at
December 31, 2015 |
Cash
Additions
|
Revenue
Recognition
|
Balance at
December 31, 2016 |
||||||||||||
|
Liquidity provider sliding scale (1)
|
$
|
—
|
|
$
|
11,400
|
|
$
|
(11,400
|
)
|
$
|
—
|
|
|||
|
Other, net
|
4,019
|
|
11,333
|
|
(12,245
|
)
|
3,107
|
|
|||||||
|
Total deferred revenue
|
$
|
4,019
|
|
$
|
22,733
|
|
$
|
(23,645
|
)
|
$
|
3,107
|
|
|||
|
Balance at
December 31, 2014 |
Cash
Additions
|
Revenue
Recognition
|
Balance at
December 31, 2015 |
||||||||||||
|
Liquidity provider sliding scale (1)
|
$
|
|
|
$
|
14,400
|
|
$
|
(14,400
|
)
|
$
|
—
|
|
|||
|
Other, net
|
1,988
|
|
11,610
|
|
(9,579
|
)
|
4,019
|
|
|||||||
|
Total deferred revenue
|
$
|
1,988
|
|
$
|
26,010
|
|
$
|
(23,979
|
)
|
$
|
4,019
|
|
|||
(1) Liquidity providers are eligible to participate in the sliding scale program, which involves prepayment of transaction fees, and receive reduced fees based on the achievement of certain volume thresholds within a month. The prepayment of
2016
and
2015
transaction fees totaled
$11.4 million
and
$14.4 million
, respectively. These amounts were amortized and recorded ratably, as transaction fees over each respective year.
9. RELATED PARTIES
The Company collected transaction and other fees of
$573.8 million
,
$596.1 million
and
$687.5 million
in the years ended
December 31, 2016
,
2015
and
2014
, respectively, by drawing on accounts of CBOE and C2 market participants held at OCC. The amounts collected by OCC for CBOE included
$80.2 million
,
$95.7 million
and
$121.4 million
of marketing fees during the years ended
December 31, 2016
,
2015
and
2014
, respectively. Additionally, the Company collected transaction and other fees of
$124.2 million
,
$96.1 million
and
$84.7 million
in the years ended
December 31, 2016
,
2015
and
2014
, respectively, by drawing on accounts of CFE market participants held at OCC. The Company had a receivable due from OCC of
$59.8 million
and
$57.0 million
at
December 31, 2016
and
2015
, respectively.
OPRA is a limited liability company consisting of representatives of the member exchanges and is authorized by the SEC to provide consolidated options information. This information is provided by the exchanges and is sold to market data vendors, outside news services and customers. OPRA's operating income is distributed among the exchanges based on their relative volume of total cleared options transactions. The Company's share of OPRA operating income was
$15.7 million
,
$14.0 million
and
$15.1 million
during the years ended
December 31, 2016
,
2015
and
2014
, respectively. The Company had a receivable from OPRA of
$4.8 million
and
$3.7 million
at
December 31, 2016
and
2015
, respectively.
The Company incurred re-billable expenses on behalf of CBSX for expenses such as compensation and benefits, computer equipment and software of
$0.4 million
,
$0.1 million
and
$2.4 million
during the years ended
December 31, 2016
,
2015
and
2014
, respectively. These amounts are included as a reduction of the underlying expenses. The Company had an immaterial receivable balance at
December 31, 2016
and
2015
as a result of CBSX ceasing trading operations on April 30, 2014.
10. STOCK-BASED COMPENSATION
Stock-based compensation is based on the fair value of the award on the date of grant, which is recognized over the related service period, net of estimated forfeitures. The service period is the period over which the related service is performed, which is generally the same as the vesting period.
The Company's board of directors approved the amended and restated the CBOE Holdings, Inc. Long Term Incentive Plan (the "LTIP"), effective upon receiving stockholder approval, which was received at the May 19, 2016 annual meeting of
83
CBOE HOLDINGS, INC. AND SUBSIDIARIES
NOTES TO CONSOLIDATED FINANCIAL STATEMENTS (Continued)
For the years ended December 31, 2016, 2015 and 2014
stockholders, which increased shares issuable by
3 million
. The LTIP provides that an aggregate of
7,248,497
shares of the Company's common stock are reserved for issuance to participants under the LTIP.
The Compensation Committee of the Company's board of directors administers the LTIP and may designate any of the following as a participant under the LTIP: any officer or other employee of the Company or its affiliates or individuals engaged to become an officer or employee and non-employee directors of the Company. The LTIP permits the granting of non-qualified stock options, restricted stock, restricted stock units, incentive compensation awards or any combination of the foregoing. The Compensation Committee has the authority and complete discretion to prescribe, amend and rescind rules and regulations relating to the LTIP, select participants and to determine the form and terms of any awards.
On
February 19, 2016
, the Company granted
170,081
restricted stock units ("RSUs"), each of which entitles the holders to
one
share of common stock upon vesting, to certain officers and employees at a fair value of
$61.80
per share. The RSUs vest ratably over
three
years, with one-third vesting on each anniversary of the grant date, and vesting accelerates upon the occurrence of a change in control. Unvested RSUs will be forfeited if the officer or employee leaves the Company prior to the applicable vesting date, except in limited circumstances. The RSUs have no voting rights but entitle the holder to receive dividend equivalents.
In addition, on
February 19, 2016
, the Company granted
49,238
RSUs that are contingent on the achievement of performance conditions including
24,619
at a fair value of
$61.80
per RSU related to earnings per share during the performance period and
24,619
RSUs at a fair value of
$83.00
per RSU, related to total shareholder return during the performance period. The Company used the Monte Carlo valuation model method to estimate the fair value of the total shareholder return RSUs which incorporated the following assumptions: risk free interest rate (
.90%
), three-year volatility (
21.1%
) and three-year correlation with S&P 500 Index
(0.41)
. Each of these performance shares has a performance condition under which the number of units ultimately awarded will vary from
0%
to
200%
of the original grant, with each unit representing the contingent right to receive
one
share of our common stock. The vesting period for the RSUs contingent on the achievement of performance is three years. For each of the performance awards, the RSUs will be settled in shares of our common stock following vesting of the RSU assuming that the participant has been continuously employed during the vesting period, subject to acceleration in the event of a change in control of the Company or in the event of a participant’s earlier death or disability. Participants shall have no voting rights with respect to RSUs until the issuance of the shares of stock. Dividends are accrued by the Company and will be paid once the RSUs contingent on the achievement of performance conditions vest.
On
May 19, 2016
, the Company granted
20,553
shares of restricted stock, at a fair value of
$63.29
per share, to the non-employee members of the board of directors. The shares have a
one
-year vesting period and vesting accelerates upon the occurrence of a change in control of the Company. Unvested portions of the restricted stock will be forfeited if the director leaves the company prior to the applicable vesting date.
For the years ended
December 31, 2016
,
2015
and
2014
, the Company recognized
$14.5 million
,
$12.2 million
and
$15.6 million
, respectively, of stock-based compensation expense related to restricted stock. For the year ended
December 31, 2016
, the Company recorded
$0.9 million
of accelerated stock-based compensation expense, respectively, for certain officers and employees as a result of attaining certain age and service based requirements in our long-term incentive plan and award agreements. Stock-based compensation expense is included in compensation and benefits in the condensed consolidated statements of income.
As of
December 31, 2016
, the Company had unrecognized stock-based compensation expense of
$14.4 million
. The remaining unrecognized stock-based compensation is expected to be recognized over a weighted average period of 19.7 months.
84
CBOE HOLDINGS, INC. AND SUBSIDIARIES
NOTES TO CONSOLIDATED FINANCIAL STATEMENTS (Continued)
For the years ended December 31, 2016, 2015 and 2014
The activity in the Company's restricted stock and restricted stock units for the year ended
December 31, 2016
was as follows:
|
Number of Shares
of Restricted
Stock
|
Weighted Average
Grant-Date Fair
Value
|
|||||
|
Unvested restricted stock at January 1, 2016
|
456,570
|
|
$
|
55.70
|
|
|
|
Granted
|
241,681
|
|
64.10
|
|
||
|
Vested
|
(211,235
|
)
|
48.14
|
|
||
|
Forfeited
|
(6,421
|
)
|
64.50
|
|
||
|
Unvested restricted stock at December 31, 2016
|
480,595
|
|
$
|
63.64
|
|
|
11. EMPLOYEE BENEFITS
Employees are eligible to participate in the Chicago Board Options Exchange SMART Plan (“SMART Plan”). The SMART Plan is a defined contribution plan, which is qualified under Internal Revenue Code Section 401(k). In addition, eligible employees may participate in the Supplemental Employee Retirement Plan, Executive Retirement Plan and Deferred Compensation Plan. Each plan is a defined contribution plan that is non-qualified under Internal Revenue Code. Effective January 1, 2017, the Executive Retirement Plan is frozen to new executive officers and employees. The Company contributed
$5.5 million
,
$4.7 million
and
$6.0 million
to the defined contribution plans for each of the years ended
December 31, 2016
,
2015
and
2014
, respectively.
The Company has a post-retirement medical plan for certain former members of senior management. The Company recorded immaterial post-retirement benefits expense for the years ended
December 31, 2016
,
2015
and
2014
, resulting from the amortization of service costs and actuarial expense included in accumulated other comprehensive loss at
December 31, 2016
,
2015
and
2014
.
85
CBOE HOLDINGS, INC. AND SUBSIDIARIES
NOTES TO CONSOLIDATED FINANCIAL STATEMENTS (Continued)
For the years ended December 31, 2016, 2015 and 2014
12. INCOME TAXES
A reconciliation of the statutory federal income tax rate to the effective income tax rate for the years ended
December 31, 2016
,
2015
and
2014
is as follows:
|
2016
|
2015
|
2014
|
||||||
|
Statutory federal income tax rate
|
35.0
|
%
|
35.0
|
%
|
35.0
|
%
|
||
|
State income tax rate, net of federal income tax effect
|
4.5
|
|
4.4
|
|
3.5
|
|
||
|
Section 199 deductions
|
(2.6
|
)
|
(1.9
|
)
|
(1.7
|
)
|
||
|
Other, net
|
2.5
|
|
(0.8
|
)
|
1.9
|
|
||
|
Effective income tax rate
|
39.4
|
%
|
36.7
|
%
|
38.7
|
%
|
||
The components of income tax expense for the years ended
December 31, 2016
,
2015
and
2014
are as follows (in thousands):
|
2016
|
2015
|
2014
|
|||||||||
|
Current
|
|
|
|||||||||
|
Federal
|
$
|
107,083
|
|
$
|
103,344
|
|
$
|
95,946
|
|
||
|
State
|
22,646
|
|
23,939
|
|
24,327
|
|
|||||
|
Total current
|
129,729
|
|
127,283
|
|
120,273
|
|
|||||
|
Deferred
|
|
|
|||||||||
|
Federal
|
(7,633
|
)
|
(6,381
|
)
|
1,955
|
|
|||||
|
State
|
(1,212
|
)
|
(1,901
|
)
|
(2,245
|
)
|
|||||
|
Total deferred
|
(8,845
|
)
|
(8,282
|
)
|
(290
|
)
|
|||||
|
Total
|
$
|
120,884
|
|
$
|
119,001
|
|
$
|
119,983
|
|
||
At
December 31, 2016
and
2015
, the net deferred income tax asset/(liability) is as follows (in thousands):
|
2016
|
2015
|
||||||
|
Deferred tax assets
|
$
|
38,688
|
|
$
|
33,564
|
|
|
|
Deferred tax liabilities
|
(35,194
|
)
|
(38,873
|
)
|
|||
|
Net deferred income tax asset /(liability)
|
$
|
3,494
|
|
$
|
(5,309
|
)
|
|
86
CBOE HOLDINGS, INC. AND SUBSIDIARIES
NOTES TO CONSOLIDATED FINANCIAL STATEMENTS (Continued)
For the years ended December 31, 2016, 2015 and 2014
The tax effect of temporary differences giving rise to significant portions of deferred tax assets and liabilities at
December 31, 2016
and
2015
are presented below (in thousands):
|
2016
|
2015
|
||||||
|
Deferred tax assets:
|
|
|
|||||
|
Intangibles
|
$
|
32
|
|
$
|
38
|
|
|
|
Accrued compensation and benefits
|
16,317
|
|
15,406
|
|
|||
|
Property, equipment and technology, net
|
619
|
|
645
|
|
|||
|
Investment in affiliates
|
4,668
|
|
7,264
|
|
|||
|
Other
|
17,052
|
|
10,211
|
|
|||
|
Total deferred tax assets
|
38,688
|
|
33,564
|
|
|||
|
Deferred tax liabilities:
|
|
|
|||||
|
Property, equipment and technology, net
|
(32,312
|
)
|
(35,859
|
)
|
|||
|
Investment in affiliates
|
(1,724
|
)
|
(1,707
|
)
|
|||
|
Prepaid
|
(1,145
|
)
|
(1,303
|
)
|
|||
|
Other
|
(13
|
)
|
(4
|
)
|
|||
|
Total deferred tax liabilities
|
(35,194
|
)
|
(38,873
|
)
|
|||
|
Net deferred tax assets/(liabilities)
|
$
|
3,494
|
|
$
|
(5,309
|
)
|
|
The net deferred tax assets and deferred tax liabilities are classified as other assets and long-term liabilities in the Consolidated Balance Sheets at
December 31, 2016
and
2015
, respectively.
A reconciliation of the beginning and ending uncertain tax positions, excluding interest and penalties, is as follows (in thousands):
|
2016
|
2015
|
2014
|
|||||||||
|
Balance as of January 1
|
$
|
31,903
|
|
$
|
35,429
|
|
$
|
26,745
|
|
||
|
Gross increases on tax positions in prior period
|
8,801
|
|
70
|
|
2,828
|
|
|||||
|
Gross decreases on tax positions in prior period
|
(608
|
)
|
(4,245
|
)
|
(1,053
|
)
|
|||||
|
Gross increases on tax positions in current period
|
3,591
|
|
1,891
|
|
8,113
|
|
|||||
|
Lapse of statute of limitations
|
(1,816
|
)
|
(1,242
|
)
|
(1,204
|
)
|
|||||
|
Balance as of December 31
|
$
|
41,871
|
|
$
|
31,903
|
|
$
|
35,429
|
|
||
As of
December 31, 2016
,
2015
and
2014
, the Company had
$41.9 million
,
$31.9 million
and
$35.4 million
, respectively, of uncertain tax positions excluding interest and penalties, which, if recognized in the future, would affect the effective income tax rate. Reductions to uncertain tax positions from the lapse of the applicable statutes of limitations during the next twelve months are estimated to be approximately
$2.4 million
.
Estimated interest costs and penalties are classified as part of the provision for income taxes in the Company's consolidated statements of income and were
$2.5 million
,
$2.5 million
and
$2.1 million
for the periods ended
December 31, 2016
,
2015
and
2014
, respectively. Accrued interest and penalties were
$10.2 million
,
$7.7 million
and
$5.3 million
as of
December 31, 2016
,
2015
and
2014
, respectively.
The Company is subject to U.S. federal tax, and state and local taxes in various jurisdictions. The Company has open tax years from 2007 on for New York, 2008 on for Federal, 2010 on for New Jersey, and generally 2013 on for all other jurisdictions. The Internal Revenue Service is currently auditing 2010 and is looking at specific line items from 2008 to 2013 due to the filing by the Company of amended returns containing the recognition of certain credits and deductions. The Illinois Department of Revenue has informed the Company it will be auditing the 2013 and 2014 tax years, the New York State Department of Taxation and Finance is currently auditing the 2007 through 2014 tax years and the New Jersey Division of Taxation is currently auditing the 2010 through 2012 tax years.
87
CBOE HOLDINGS, INC. AND SUBSIDIARIES
NOTES TO CONSOLIDATED FINANCIAL STATEMENTS (Continued)
For the years ended December 31, 2016, 2015 and 2014
13. FAIR VALUE MEASUREMENTS
Fair value is the price that would be received upon the sale of an asset or paid upon the transfer of a liability in an orderly transaction between market participants at the measurement date and in the principal or most advantageous market for that asset or liability. The fair value should be calculated based on assumptions that market participants would use in pricing the asset or liability, not on assumptions specific to the entity. In addition, the fair value of liabilities should include consideration of non-performance risk, including the Company’s own credit risk.
The Company applied Financial Accounting Standards Board ("FASB") ASC 820,
Fair Value Measurement and Disclosure
, which provides guidance for using fair value to measure assets and liabilities by defining fair value and establishing the framework for measuring fair value. ASC 820 applies to financial and nonfinancial instruments that are measured and reported on a fair value basis. The three-level hierarchy of fair value measurements is based on whether the inputs to those measurements are observable or unobservable. Observable inputs reflect market data obtained from independent sources, while unobservable inputs reflect the Company’s market assumptions. The fair-value hierarchy requires the use of observable market data when available and consists of the following levels:
|
•
|
Level 1—Unadjusted inputs based on quoted markets for identical assets or liabilities.
|
|
•
|
Level 2—Observable inputs, either direct or indirect, not including Level 1, corroborated by market data or based upon quoted prices in non-active markets.
|
|
•
|
Level 3—Unobservable inputs that reflect management’s best assumptions of what market participants would use in valuing the asset or liability.
|
The Company has included a tabular disclosure for financial assets that are measured at fair value on a recurring basis in the consolidated balance sheet as of
December 31, 2016
and
2015
. The Company holds no financial liabilities that are measured at fair value on a recurring basis.
|
(amounts in thousands)
|
Level 1
|
Level 2
|
Level 3
|
Total
|
|||||||||||
|
Assets at fair value:
|
|
|
|
|
|||||||||||
|
Money market funds
|
$
|
67,500
|
|
—
|
|
—
|
|
$
|
67,500
|
|
|||||
|
Total assets at fair value at December 31, 2016
|
$
|
67,500
|
|
$
|
—
|
|
$
|
—
|
|
$
|
67,500
|
|
|||
|
(amounts in thousands)
|
Level 1
|
Level 2
|
Level 3
|
Total
|
|||||||||||
|
Assets at fair value:
|
|
|
|
|
|||||||||||
|
Money market funds
|
$
|
84,000
|
|
—
|
|
—
|
|
$
|
84,000
|
|
|||||
|
Total assets at fair value at December 31, 2015
|
$
|
84,000
|
|
$
|
—
|
|
$
|
—
|
|
$
|
84,000
|
|
|||
In 2015, CBOE Holdings, through its subsidiary Loan Markets, LLC, acquired a minority interest in AFX. The investment, measured at fair value on a non-recurring basis, is classified as level 3 as the fair value was based on both observable and unobservable inputs.
In January 2016, CBOE Holdings, through its subsidiary CBOE III, LLC, acquired a minority interest in CurveGlobal. The investment, measured at fair value on a non-recurring basis, is classified as level 3 as the fair value was based on both observable and unobservable inputs.
In May 2016, CBOE Holdings, through its subsidiary CBOE III, LLC, acquired a minority interest in Eris. The investment, measured at fair value on a non-recurring basis, is classified as level 3 as the fair value was based on both observable and unobservable inputs.
The Company has recorded contingent consideration of
$3.4 million
through June 30, 2016, categorized as level 3, which is based on management's estimate of the achievement by Livevol of certain performance targets at
nine
and
eighteen
months
88
CBOE HOLDINGS, INC. AND SUBSIDIARIES
NOTES TO CONSOLIDATED FINANCIAL STATEMENTS (Continued)
For the years ended December 31, 2016, 2015 and 2014
from the acquisition date. In September 2016, the Company settled the contingent consideration for
$2.0 million
resulting in a gain of
$1.4 million
which is recorded in other income.
14. SHARE REPURCHASE PROGRAM
In 2011, the Company's board of directors approved an initial authorization for the Company to repurchase shares of its outstanding common stock of $100 million and approved additional authorizations of $100 million in each of 2012, 2013, 2014, 2015, and February 2016 for a total authorization of $600 million. The program permits the Company to purchase shares through a variety of methods, including in the open market or through privately negotiated transactions, in accordance with applicable securities laws. It does not obligate the Company to make any repurchases at any specific time or situation.
Under the program, for the year ended
December 31, 2016
, the Company purchased
947,786
shares of common stock at an average cost per share of
$63.83
totaling
$60.5 million
. Since inception of the program through
December 31, 2016
, the Company has purchased
10,947,401
shares of common stock at an average cost per share of
$45.95
totaling
$503.0 million
.
As of
December 31, 2016
, the Company had
$97 million
of availability remaining under its existing share repurchase authorizations. As a result of our pending transaction with Bats, we were not active in our share repurchase program during the third and fourth quarters of 2016.
15. COMMITMENTS AND CONTINGENCIES
As of
December 31, 2016
, the end of the period covered by this report, the Company was subject to the various legal proceedings and claims discussed below, as well as certain other legal proceedings and claims that have not been fully resolved and that have arisen in the ordinary course of business.
The Company reviews its legal proceedings and claims, regulatory reviews and inspections and other legal proceedings on an ongoing basis and follows appropriate accounting guidance when making accrual and disclosure decisions. The Company establishes accruals for those contingencies where the incurrence of a loss is probable and can be reasonably estimated, and we disclose the amount accrued and the amount of a reasonably possible loss in excess of the amount accrued, if such disclosure is necessary for our financial statements to not be misleading. The Company does not record liabilities when the likelihood that the liability has been incurred is probable, but the amount cannot be reasonably estimated, or when the liability is believed to be only reasonably possible or remote. The Company's assessment of whether a loss is reasonably possible or probable is based on its assessment of the ultimate outcome of the matter following all appeals.
As of
December 31, 2016
, the Company does not believe that there is a reasonable possibility that any material loss exceeding the amounts already recognized for these reviews, inspections or other legal proceedings, if any, has been incurred. While the consequences of certain unresolved proceedings are not presently determinable, the outcome of any litigation is inherently uncertain and an adverse outcome from certain matters could have a material effect on our earnings in any given reporting period. However, in the opinion of management, the ultimate liability is not expected to have a material effect on our financial position, liquidity or capital resources.
Lanier Litigation
On May 23, 2014, Harold R. Lanier sued 14 securities exchanges, including CBOE, in the United States District Court for the Southern District of New York (the "Court") on behalf of himself and a putative class consisting of all persons in the United States who entered into contracts to receive market data through certain data plans at any time since May 19, 2008 to the present. The complaint alleged that the market data provided under the CQ Plan and CTA Plans was inferior to the data that the exchanges provided to those that directly receive other data from the exchanges, which the plaintiffs alleged is a breach of their “subscriber contracts” and a violation of the exchanges’ obligations under the CQ and CTA Plans. The plaintiffs sought monetary and injunctive relief. On May 30, 2014, Mr. Lanier filed two additional suits in the same Court, alleging substantially the same claims and requesting the same types of relief against the exchanges who participate in the UTP and the OPRA data plans. CBOE was a defendant in each of these suits, while C2 was only a defendant in the suit regarding the OPRA Plan. On April 28, 2015, the Court dismissed Lanier’s complaint with prejudice because it was preempted by the federal regulatory scheme and because the claims were precluded by the terms of the applicable subscriber agreements. Mr. Lanier appealed the orders dismissing each of his three cases and, on September 2, 2015, he filed his opening appellate briefs in those cases. The defendants’ response briefs were filed November 24, 2015 and briefing on the appeals has concluded. The oral arguments on the appeals were heard on March 3, 2016. On September 23, 2016, the Court of Appeals ruled in favor of the defendants and
89
CBOE HOLDINGS, INC. AND SUBSIDIARIES
NOTES TO CONSOLIDATED FINANCIAL STATEMENTS (Continued)
For the years ended December 31, 2016, 2015 and 2014
affirmed the Court’s dismissal of Lanier’s complaints with prejudice. On October 7, 2016, Lanier filed a petition for rehearing only in the action related to the OPRA Plan and the Court of Appeals ruling with respect to the other two complaints is now final. On November 4, 2016, the Court of Appeals denied the petition for rehearing in the case related to the OPRA Plan.
Other
As a self-regulatory organization under the jurisdiction of the SEC, with respect to CBOE and C2, and as a designated contract market under the jurisdiction of the CFTC, with respect to CFE, we are subject to routine reviews and inspections by the SEC and the CFTC.
We are also currently a party to various other legal proceedings in addition to those already mentioned. Management does not believe that the outcome of any of these other reviews, inspections or other legal proceedings will have a material impact on our consolidated financial position, results of operations or cash flows.
Leases and Other Obligations
The Company currently leases additional office space, a data center and remote network operations center, with lease terms remaining from
3
months to
103
months as of
December 31, 2016
. Total rent expense related to these lease obligations, reflected in technology support services and facilities costs line items on the Consolidated Statements of Income, for the years ended
December 31, 2016
,
2015
and
2014
were
$4.4 million
,
$4.1 million
and
$3.8 million
, respectively. Future minimum payments for our operating leases, contractual obligations and other liabilities are as follows at
December 31, 2016
(in thousands):
|
Year
|
Operating
Leases
|
Contractual Obligations
|
Total
|
||||||
|
2017
|
$
|
1,182
|
|
$
|
34,306
|
|
$
|
35,488
|
|
|
2018
|
541
|
|
31,158
|
|
31,699
|
|
|||
|
2019
|
208
|
|
31,171
|
|
31,379
|
|
|||
|
2020
|
200
|
|
22,935
|
|
23,135
|
|
|||
|
2021
|
206
|
|
20,200
|
|
20,406
|
|
|||
|
Total
|
$
|
2,337
|
|
$
|
139,770
|
|
$
|
142,107
|
|
16. NET INCOME PER COMMON SHARE
The computation of basic net income allocated to common stockholders is calculated by reducing net income for the period by dividends paid or declared and undistributed net income for the period that are allocated to participating securities to arrive at net income allocated to common stockholders. Net income allocated to common stockholders is divided by the weighted average number of common shares outstanding during the period to determine net income per share allocated to common stockholders.
The computation of diluted earnings per share is calculated by dividing net income allocated to common stockholders by the sum of the weighted average number of common shares outstanding plus all additional common shares that would have been outstanding if the potentially dilutive common shares had been issued. The dilutive effect is calculated using the more dilutive of the two-class or treasury stock method.
90
CBOE HOLDINGS, INC. AND SUBSIDIARIES
NOTES TO CONSOLIDATED FINANCIAL STATEMENTS (Continued)
For the years ended December 31, 2016, 2015 and 2014
The following table reconciles net income allocated to common stockholders and the number of shares used to calculate the basic and diluted net income per common share for the years ended
December 31, 2016
,
2015
and
2014
:
|
(in thousands, except per share amounts)
|
2016
|
2015
|
2014
|
||||||||
|
Basic EPS Numerator:
|
|
|
|
||||||||
|
Net Income
|
$
|
185,720
|
|
$
|
205,023
|
|
$
|
189,714
|
|
||
|
Loss attributable to noncontrolling interests
|
1,100
|
|
—
|
|
—
|
|
|||||
|
Net Income excluding noncontrolling interests
|
186,820
|
|
205,023
|
|
189,714
|
|
|||||
|
Change in redemption value of noncontrolling interests
|
(1,100
|
)
|
—
|
|
—
|
|
|||||
|
Earnings allocated to participating securities
|
(775
|
)
|
(898
|
)
|
(1,322
|
)
|
|||||
|
Net Income allocated to common stockholders
|
$
|
184,945
|
|
$
|
204,125
|
|
$
|
188,392
|
|
||
|
Basic EPS Denominator:
|
|
|
|
||||||||
|
Weighted average shares outstanding
|
81,432
|
|
83,081
|
|
85,406
|
|
|||||
|
Basic Net Income Per Common Share
|
$
|
2.27
|
|
$
|
2.46
|
|
$
|
2.21
|
|
||
|
Diluted EPS Numerator:
|
|
|
|
||||||||
|
Net Income
|
$
|
185,720
|
|
$
|
205,023
|
|
$
|
189,714
|
|
||
|
Loss attributable to noncontrolling interests
|
1,100
|
|
—
|
|
—
|
|
|||||
|
Net Income excluding noncontrolling interests
|
186,820
|
|
205,023
|
|
189,714
|
|
|||||
|
Change in redemption value of noncontrolling interests
|
(1,100
|
)
|
—
|
|
—
|
|
|||||
|
Earnings allocated to participating securities
|
(775
|
)
|
(898
|
)
|
(1,322
|
)
|
|||||
|
Net Income allocated to common stockholders
|
$
|
184,945
|
|
$
|
204,125
|
|
$
|
188,392
|
|
||
|
Diluted EPS Denominator:
|
|
|
|
||||||||
|
Weighted average shares outstanding
|
81,432
|
|
83,081
|
|
85,406
|
|
|||||
|
Dilutive common shares issued under stock program
|
—
|
|
—
|
|
—
|
|
|||||
|
Diluted Net Income Per Common Share
|
$
|
2.27
|
|
$
|
2.46
|
|
$
|
2.21
|
|
||
For the periods presented, the Company did not have shares of restricted stock or restricted stock units that would have an anti-dilutive effect on the computation of diluted net income per common share.
In order to complete the Company's proposed acquisition of Bats, shares of CBOE Holdings common stock are to be issued upon conversion of shares of Bats common stock in the Merger. Based on the number of shares of our common stock and Bats common stock outstanding on September 23, 2016, immediately following the completion of the Merger, our pre-existing stockholders and former Bats stockholders would own approximately
72%
and
28%
of the outstanding shares of our common stock, respectively. The Merger will have no effect on the number of shares of our common stock owned by our existing stockholders.
17. QUARTERLY DATA (unaudited)
|
Year ended December 31, 2016 (in thousands)
|
First
Quarter
|
Second
Quarter
|
Third
Quarter
|
Fourth
Quarter
|
Year
|
||||||||||||||
|
Operating revenues
|
$
|
162,330
|
|
$
|
163,329
|
|
$
|
156,207
|
|
$
|
175,080
|
|
$
|
656,946
|
|
||||
|
Operating expenses
|
82,849
|
|
85,362
|
|
90,557
|
|
99,978
|
|
358,746
|
|
|||||||||
|
Operating income
|
79,481
|
|
77,967
|
|
65,650
|
|
75,102
|
|
298,200
|
|
|||||||||
|
Net income
|
$
|
49,176
|
|
$
|
50,931
|
|
$
|
40,451
|
|
$
|
45,162
|
|
$
|
185,720
|
|
||||
|
Net income allocated to common stockholders
|
$
|
49,198
|
|
$
|
50,719
|
|
$
|
40,280
|
|
$
|
44,748
|
|
$
|
184,945
|
|
||||
|
Diluted—net income per share to common stockholders
|
$
|
0.60
|
|
$
|
0.62
|
|
$
|
0.50
|
|
$
|
0.55
|
|
$
|
2.27
|
|
||||
91
CBOE HOLDINGS, INC. AND SUBSIDIARIES
NOTES TO CONSOLIDATED FINANCIAL STATEMENTS (Continued)
For the years ended December 31, 2016, 2015 and 2014
|
Year ended December 31, 2015 (in thousands)
|
First
Quarter
|
Second
Quarter
|
Third
Quarter
|
Fourth
Quarter
|
Year
|
||||||||||||||
|
Operating revenues
|
$
|
142,839
|
|
$
|
148,725
|
|
$
|
187,035
|
|
$
|
155,946
|
|
$
|
634,545
|
|
||||
|
Operating expenses
|
73,286
|
|
75,355
|
|
85,925
|
|
80,051
|
|
314,617
|
|
|||||||||
|
Operating income
|
69,553
|
|
73,370
|
|
101,110
|
|
75,895
|
|
319,928
|
|
|||||||||
|
Net income
|
$
|
42,259
|
|
$
|
44,845
|
|
$
|
67,516
|
|
$
|
50,403
|
|
$
|
205,023
|
|
||||
|
Net income allocated to common stockholders
|
$
|
42,079
|
|
$
|
44,646
|
|
$
|
67,219
|
|
$
|
50,181
|
|
$
|
204,125
|
|
||||
|
Diluted—net income per share to common stockholders
|
$
|
0.50
|
|
$
|
0.54
|
|
$
|
0.81
|
|
$
|
0.61
|
|
$
|
2.46
|
|
||||
|
•
|
In the third and fourth quarters of 2016, the Company recognized
$8.6 million
and
$4.2 million
, respectively, in professional fees and outside services related to the planned acquisition of Bats.
|
|
•
|
In the fourth quarter of 2016, the Company recorded amortization of
$5.5 million
for expenses associated with a bridge loan facility related to the proposed acquisition of Bats.
|
|
•
|
In the third quarter of 2016, the Company recognized
$1.4 million
gain on settlement of contingent consideration.
|
|
•
|
In the second quarter of 2016, the Company recognized
$5.5 million
in investment and other income for a settlement of attorney fees and expenses relating to a litigation matter.
|
|
•
|
In the fourth quarter of
2015
, the Company recognized
$2.0 million
of revenue to adjust for incorrect coding of transactions by an exchange participant related to prior periods.
|
|
•
|
In the third quarter of
2015
, the Company recorded a
$4.3 million
tax benefit from the release of an uncertain tax provision related to research and development credits, which were effectively settled.
|
18. SUBSEQUENT EVENTS
On January 12, 2017, the Company issued $
650 million
aggregate principal amount of
3.650%
Senior Notes due 2027. See Note
(4)
Debt for more information.
On January 17, 2017, Bats stockholders adopted the Merger Agreement and CBOE Holdings stockholders approved the issuance of CBOE Holdings common stock pursuant to the Merger Agreement.
CBOE Holdings received regulatory approvals from the Dutch Central Bank and the United Kingdom's Financial Conduct Authority on February 2, 2017 and February 9, 2017, respectively.
On February 16, 2017, the Company's board of directors declared a quarterly cash dividend of
$0.25
per share. The dividend is payable on March 24, 2017 to stockholders of record at the close of business on March 3, 2017.
On February 16, 2017, the Company announced that the Merger is expected to close on February 28, 2017.
On February 19, 2017, the Company granted
292,775
RSUs to certain officers and employees at a fair value of
$80.40
per share, the closing price of the Company's stock on the grant date. The shares have a three year vesting period based on achievement of certain service, performance and/or market conditions and vesting accelerates upon the occurrence of a change in control of the Company or in the event of earlier death, disability or qualified retirement.
92
Item 9.
Changes in and Disagreements with Accountants on Accounting and Financial Disclosure
Not applicable.
Item 9A.
Controls and Procedures
(a) Evaluation of Disclosure Controls and Procedures
The Company's management, with the participation of its Chief Executive Officer and Chief Financial Officer, has evaluated the effectiveness of the Company's disclosure controls and procedures (as defined in Rule 13a-15(e) and Rule 15d-15(e) under the Securities Exchange Act of 1934 (the “Exchange Act”)) as of the end of the period covered by this report. Based upon that evaluation, the Company's Chief Executive Officer and Chief Financial Officer have concluded that, as of the end of such period, the Company's disclosure controls and procedures are effective.
b) Management's Annual Report on Internal Control over Financial Reporting
Management is responsible for establishing and maintaining adequate internal control over financial reporting. Our internal control system has been designed to provide reasonable assurance to management and the board of directors regarding the preparation and fair presentation of published financial statements.
Management assessed the effectiveness of the Company's internal control over financial reporting as of
December 31, 2016
. Management based its assessment on criteria for effective internal control over financial reporting described in Internal Control-Integrated Framework (2013) issued by the Committee of Sponsoring Organizations of the Treadway Commission. Management's assessment included evaluating the design of our internal control over financial reporting and testing the operational effectiveness of our internal control over financial reporting. The results of its assessment were reviewed with the audit committee of the board of directors.
Based on this assessment, management believes that, as of
December 31, 2016
, our internal control over financial reporting is effective.
The effectiveness of our internal control over financial reporting as of
December 31, 2016
has been audited by Deloitte & Touche LLP, an independent registered public accounting firm, as stated in their report on page
67.
There were no changes in the Company's internal control over financial reporting that occurred during the three months ended
December 31, 2016
that have materially affected, or are reasonably likely to materially affect, our internal control over financial reporting.
Item 9B.
Other Information
Not applicable
93
Item 10.
Directors, Executive Officers and Corporate Governance
Information relating to our executive officers is included on pages
18
of this Annual Report on Form 10-K. Information relating to our directors, including our audit committee and audit committee financial experts and the procedures by which stockholders can recommend director nominees, and our executive officers will be in our definitive Proxy Statement for our 2017 Annual Meeting of Stockholders planned to be held on May 18, 2017, which will be filed within 120 days of the end of our fiscal year ended
December 31, 2016
("
2017 Proxy Statement
") and is incorporated herein by reference.
Code of Ethics
We have adopted a Code of Business Conduct and Ethics that applies to our Chief Executive Officer, Chief Financial Officer and Chief Accounting Officer, as well as all other employees and directors. Our Code of Business Conduct and Ethics is available on our website at http://ir.cboe.com/governance.cfm. We will also provide a copy of the Code of Business Conduct and Ethics to stockholders at no charge upon written request.
Item 11.
Executive Compensation
Information relating to our executive officer and director compensation and the compensation committee of our board of directors will be in the
2017 Proxy Statement
and is incorporated herein by reference.
Item 12.
Security Ownership of Certain Beneficial Owners and Management and Related Stockholder Matters
Information relating to security ownership of certain beneficial owners of our common stock and information relating to the security ownership of our management will be in the
2017 Proxy Statement
and is incorporated herein by reference.
Item 13.
Certain Relationships and Related Transactions, and Director Independence
Information regarding certain relationships and related transactions and director independence will be in the
2017 Proxy Statement
and is incorporated herein by reference.
Item 14.
Principal Accountant Fees and Services
Information regarding principal accountant fees and services will be in the
2017 Proxy Statement
and is incorporated herein by reference.
94
Item 15.
Exhibits, Financial Statement Schedules
|
(a)
|
Documents filed as part of this report
|
(1)
Financial Statements
Our consolidated financial statements and the related reports of management and our independent registered public accounting firm which are required to be filed as part of this report are included in this Annual Report on Form 10-K beginning at page
65
. These consolidated financial statements are as follows:
|
•
|
Consolidated Balance Sheets as of
December 31, 2016
and
2015
|
|
•
|
Consolidated Statements of Income for the years ended
December 31, 2016
,
2015
and
2014
|
|
•
|
Consolidated Statements of Comprehensive Income for the years ended
December 31, 2016
,
2015
and
2014
|
|
•
|
Consolidated Statements of Cash Flows for the years ended
December 31, 2016
,
2015
and
2014
|
|
•
|
Consolidated Statements of Stockholders' Equity for the years ended
December 31, 2016
,
2015
and
2014
|
|
•
|
Notes to Consolidated Financial Statements
|
(2)
Financial Statement Schedules
The Company has not included any financial statement schedules because they are not applicable or the required information is included in the consolidated financial statements or notes thereto.
(3)
List of Exhibits
See (b) Exhibits below
|
(b)
|
Exhibits
|
95
|
Exhibit
No.
|
Description of Exhibit
|
||
|
2.1
|
|
Agreement and Plan of Merger, dated as of September 25, 2016, by and among CBOE Holdings, Inc., CBOE Corporation, CBOE V, LLC and Bats Global Markets, Inc., incorporated by reference to Exhibit 10.1 to the Company’s Current Report on Form 8-K (File No. 001-34774), filed on September 28, 2016.**
|
|
|
3.1
|
|
Second Amended and Restated Certificate of Incorporation of CBOE Holdings, Inc., incorporated by reference to Exhibit 3.1 to the Company's Annual Report on Form 10-K for the year ended December 31, 2015 (File No. 001-34774) filed on February 19, 2016.
|
|
|
3.2
|
|
Third Amended and Restated Bylaws of CBOE Holdings, Inc., incorporated by reference to Exhibit 3.1 to the Company's Current Report on Form 8-K (File No. 001-34774) filed on November 25, 2015.
|
|
|
4.1
|
|
Indenture, dated as of January 12, 2017, by and between the CBOE Holdings, Inc. and Wells Fargo Bank National Association, as trustee, incorporated by reference to Exhibit 4.1 to the Company’s Current Report on Form 8-K (File No. 001-34774), filed on January 12, 2017.
|
|
|
4.2
|
|
Officer’s Certificate, dated as of January 12, 2017, establishing the 3.650% Senior Notes due 2027 of CBOE Holdings, Inc., incorporated by reference to Exhibit 4.2 to the Company’s Current Report on Form 8-K (File No. 001-34774), filed on January 12, 2017.
|
|
|
4.3
|
|
Form of 3.650% Senior Notes due 2027 (included in Exhibit 4.2 hereto).
|
|
|
10.1
|
|
Restated License Agreement, dated November 1, 1994, by and between Standard & Poor's Financial Services LLC (as successor-in-interest to Standard & Poor's, a division of McGraw-Hill, Inc.) and the Chicago Board Options Exchange, Incorporated (the "S&P License Agreement"), incorporated by reference to Exhibit 10.1 to Amendment No. 6 to the Company's Registration Statement on Form S-4 (File No. 333-140574) filed on April 12, 2010.+
|
|
|
10.2
|
|
Amendment No. 1 to the S&P License Agreement, dated January 15, 1995, incorporated by reference to Exhibit 10.2 to Amendment No. 6 to the Company's Registration Statement on Form S-4 (File No. 333-140574) filed on April 12, 2010.+
|
|
|
10.3
|
|
Amendment No. 2 to the S&P License Agreement, dated April 1, 1998, incorporated by reference to Exhibit 10.3 to Amendment No. 6 to the Company's Registration Statement on Form S-4 (File No. 333-140574) filed on April 12, 2010.+
|
|
|
10.4
|
|
Amendment No. 3 to the S&P License Agreement, dated July 28, 2000, incorporated by reference to Exhibit 10.4 to Amendment No. 6 to the Company's Registration Statement on Form S-4 (File No. 333-140574) filed on April 12, 2010.+
|
|
|
10.5
|
|
Amendment No. 4 to the S&P License Agreement, dated October 27, 2000, incorporated by reference to Exhibit 10.5 to Amendment No. 6 to the Company's Registration Statement on Form S-4 (File No. 333-140574) filed on April 12, 2010.+
|
|
|
10.6
|
|
Amendment No. 5 to the S&P License Agreement, dated March 1, 2003, incorporated by reference to Exhibit 10.6 to Amendment No. 6 to the Company's Registration Statement on Form S-4 (File No. 333-140574) filed on April 12, 2010.+
|
|
|
10.7
|
|
Amended and Restated Amendment No. 6 to the S&P License Agreement, dated February 24, 2009, incorporated by reference to Exhibit 10.7 to Amendment No. 6 to the Company's Registration Statement on Form S-4 (File No. 333-140574) filed on April 12, 2010.+
|
|
|
10.8
|
|
Amended and Restated Amendment No. 7 to the S&P License Agreement, dated February 24, 2009, incorporated by reference to Exhibit 10.8 to Amendment No. 6 to the Company's Registration Statement on Form S-4 (File No. 333-140574) filed on April 12, 2010.+
|
|
|
10.9
|
|
Amendment No. 8 to the S&P License Agreement, dated January 9, 2005, incorporated by reference to Exhibit 10.9 to Amendment No. 6 to the Company's Registration Statement on Form S-4 (File No. 333-140574) filed on April 12, 2010.+
|
|
|
10.10
|
|
Amendment No. 10 to the S&P License Agreement, dated June 19, 2009, incorporated by reference to Exhibit 10.10 to Amendment No. 6 to the Company's Registration Statement on Form S-4 (File No. 333-140574) filed on April 12, 2010.+
|
|
|
10.11
|
|
Amendment No. 11 to the S&P License Agreement, dated as of April 29, 2010, incorporated by reference to Exhibit 10 to the Company's Current Report on Form 8-K (File No. 001-34774) filed on May 11, 2010.+
|
|
|
10.12
|
|
Chicago Board Options Exchange, Incorporated Executive Retirement Plan, incorporated by reference to Exhibit 10.13 to Amendment No. 4 to the Company's Registration Statement on Form S-4 (File No. 333-140574) filed on August 14, 2009.*
|
|
|
10.13
|
|
Amendments to the Chicago Board Options Exchange, Incorporated Executive Retirement Plan (Filed herewith).*
|
|
96
|
Exhibit
No.
|
Description of Exhibit
|
||
|
10.14
|
|
Chicago Board Options Exchange, Incorporated Supplemental Retirement Plan, incorporated by reference to Exhibit 10.14 to Amendment No. 4 to the Company's Registration Statement on Form S-4 (File No. 333-140574) filed on August 14, 2009.*
|
|
|
10.15
|
|
Chicago Board Options Exchange, Incorporated Deferred Compensation Plan for Officers, incorporated by reference to Exhibit 10.15 to Amendment No. 4 to the Company's Registration Statement on Form S-4 (File No. 333-140574) filed on August 14, 2009.*
|
|
|
10.16
|
|
Amendments to the Chicago Board Options Exchange, Incorporated Deferred Compensation Plan for Officers (Filed herewith).*
|
|
|
10.17
|
|
Amendment No. 1 to the Chicago Board Options Exchange, Incorporated Supplemental Retirement Plan, incorporated by reference to Exhibit 10.3 to the Company's Quarterly Report on Form 10-Q for the quarter ended September 30, 2010 (File No. 001-34774) filed on November 12, 2010.*
|
|
|
10.18
|
|
Amendments to the Chicago Board Options Exchange, Incorporated Supplemental Retirement Plan (Filed herewith).*
|
|
|
10.19
|
|
Amended and Restated CBOE Holdings, Inc. Long-Term Incentive Plan, incorporated by reference to Exhibit 10.20 to Amendment No. 4 to the Company's Registration Statement on Form S-1 (File No. 333-165393) filed on June 11, 2010.*
|
|
|
10.20
|
|
Form of Restricted Stock Award Agreement (for Executive Officers), incorporated by reference to Exhibit 10.1 to the Company's Quarterly Report on Form 10-Q for the quarter ended March 31, 2010 (File No. 001-34774) filed on June 11, 2010.*
|
|
|
10.21
|
|
Form of Restricted Stock Award Agreement (for Non-employee Directors), incorporated by reference to Exhibit 10.2 to the Company's Quarterly Report on Form 10-Q for the quarter ended March 31, 2010 (File No. 001-34774) filed on June 11, 2010.*
|
|
|
10.22
|
|
Amended and Restated CBOE Holdings, Inc. Executive Severance Plan, incorporated by reference to Exhibit 10.1 to the Company's Quarterly Report on Form 10-Q for the quarter ended March 31, 2015 (File No. 001-34774) filed on May 6, 2015.*
|
|
|
10.23
|
|
Form of Director Indemnification Agreement, incorporated by reference to Exhibit 10.1 to the Company's Current Report on Form 8-K (File No. 001-34774) filed on December 20, 2010.
|
|
|
10.24
|
|
Second Amended and Restated CBOE Holdings, Inc. Long-Term Incentive Plan, incorporated by reference to Exhibit 10.1 to the Company’s Current Report on Form 8-K (File No. 001-34774), filed on May 24, 2016.*
|
|
|
10.25
|
|
Amendment No. 1, dated August 22, 2011, to the Amended and Restated License Agreement, dated September 29, 2006, by and between CME Group Index Services LLC (as successor-in-interest to Dow Jones & Company, Inc.) and the Chicago Board Options Exchange, Incorporated, incorporated by reference to Exhibit 10.1 to the Company's Quarterly Report on Form 10-Q for the quarter ended September 30, 2011 (File No. 001-34774) filed on November 9, 2011.+
|
|
|
10.26
|
|
Amended and Restated Employment Agreement, by and among CBOE Holdings, Inc., Chicago Board Options Exchange, Incorporated and Edward T. Tilly, dated December 11, 2012, incorporated by reference to Exhibit 10.2 to the Company's Current Report on Form 8-K (File No. 001-34774) filed on December 12, 2012.*
|
|
|
10.27
|
|
Amendment No. 12, to the S&P License Agreement, dated March 9, 2013, incorporated by reference to Exhibit 10.1 to the Company's Quarterly Report on Form 10-Q (File no. 001-34774) filed on May 7, 2013. +
|
|
|
10.28
|
|
Form of Restricted Stock Unit Award Agreement (for Executive Officers) under the Amended and Restated CBOE Holdings, Inc. Long-term Incentive Plan, incorporated by reference to Exhibit 10.27 to the Company's Annual Report on Form 10-K for the year ended December 31, 2013 (File No. 001-34774) filed on February 21, 2014.*
|
|
|
10.29
|
|
Form of Restricted Stock Unit Award Agreement (relative total shareholder return) under the Amended and Restated CBOE Holdings, Inc. Long-term Incentive Plan, incorporated by reference to Exhibit 10.28 to the Company's Annual Report on Form 10-K for the year ended December 31, 2013 (File No. 001-34774) filed on February 21, 2014.*
|
|
|
10.30
|
|
Form of Restricted Stock Unit Award Agreement (earnings per share) under the Amended and Restated CBOE Holdings, Inc. Long-term Incentive Plan, incorporated by reference to Exhibit 10.29 to the Company's Annual Report on Form 10-K for the year ended December 31, 2013 (File No. 001-34774) filed on February 21, 2014.*
|
|
|
10.31
|
|
Form of 2016 Restricted Stock Unit Award Agreement (for Executive Officers) under the Amended and Restated CBOE Holdings, Inc. Long-term Incentive Plan, incorporated by reference to Exhibit 10.30 to the Company's Annual Report on Form 10-K for the year ended December 31, 2015 (File No. 001-34774) filed on February 19, 2016.*
|
|
|
10.32
|
|
Form of 2016 Restricted Stock Unit Award Agreement (relative total shareholder return) under the Amended and Restated CBOE Holdings, Inc. Long-term Incentive Plan, incorporated by reference to Exhibit 10.31 to the Company's Annual Report on Form 10-K for the year ended December 31, 2015 (File No. 001-34774) filed on February 19, 2016.*
|
|
97
|
Exhibit
No.
|
Description of Exhibit
|
||
|
10.33
|
|
Form of 2016 Restricted Stock Unit Award Agreement (earnings per share) under the Amended and Restated CBOE Holdings, Inc. Long-term Incentive Plan, incorporated by reference to Exhibit 10.32 to the Company's Annual Report on Form 10-K for the year ended December 31, 2015 (File No. 001-34774) filed on February 19, 2016.*
|
|
|
10.34
|
|
Form of 2017 Restricted Stock Unit Award Agreement (for Executive Officers) under the Second Amended and Restated CBOE Holdings, Inc. Long-term Incentive Plan (filed herewith).*
|
|
|
10.35
|
|
Form of 2017 Restricted Stock Unit Award Agreement (relative total shareholder return) under the Second Amended and Restated CBOE Holdings, Inc. Long-term Incentive Plan (filed herewith).*
|
|
|
10.36
|
|
Form of Restricted Stock Unit Award Agreement (3 Year Cliff Vest) under the Second Amended and Restated CBOE Holdings, Inc. Long-term Incentive Plan (filed herewith).*
|
|
|
10.37
|
|
Debt Commitment Letter, dated as of September 25, 2016, by and among CBOE Holdings, Inc., Bank of America, N.A. and Merrill Lynch, Pierce, Fenner & Smith Incorporated, incorporated by reference to Exhibit 10.1 to the Company’s Quarterly Report on Form 10-Q (File No. 001-34774), filed on November 8, 2016.
|
|
|
10.38
|
|
Form of Voting and Support Agreement between CBOE Holdings, Inc. and the directors and executive officers of Bats Global Markets, Inc., incorporated by reference to Exhibit 10.2 to the Company’s Current Report on Form 8-K (File No. 001-34774), filed on September 28, 2016.
|
|
|
10.39
|
|
Form of Voting and Support Agreement between Bats Global Markets, Inc. and the directors and executive officers of CBOE Holdings, Inc., incorporated by reference to Exhibit 10.3 to the Company’s Current Report on Form 8-K (File No. 001-34774), filed on September 28, 2016.
|
|
|
10.40
|
|
Term Loan Credit Agreement, dated as of December 15, 2016, by and among CBOE Holdings, Inc., Bank of America, N.A., as Administrative Agent, certain lenders named therein, Merrill Lynch, Pierce, Fenner & Smith Incorporated, as Sole Lead Arranger and Sole Bookrunner, Morgan Stanley MUFG Loan Partners, LLC, as Syndication Agent, and Citibank, N.A., PNC Bank, National Association and JPMorgan Chase Bank, N.A., as Co-Documentation Agents, incorporated by reference to Exhibit 10.1 to the Company’s Current Report on Form 8-K (File No. 001-34774), filed on December 20, 2016.
|
|
|
10.41
|
|
Credit Agreement, dated as of December 15, 2016, by and among CBOE Holdings, Inc., Bank of America, N.A., as Administrative Agent and as Swing Line Lender, certain lenders named therein, Merrill Lynch, Pierce, Fenner & Smith Incorporated, as Sole Lead Arranger and Sole Bookrunner, Morgan Stanley MUFG Loan Partners, LLC, as Syndication Agent, and Citibank, N.A., PNC Bank, National Association and JPMorgan Chase Bank, N.A., as Co-Documentation Agents, incorporated by reference to Exhibit 10.2 to the Company’s Current Report on Form 8-K (File No. 001-34774), filed on December 20, 2016.
|
|
|
21.1
|
|
Subsidiaries of CBOE Holdings, Inc. (filed herewith).
|
|
|
23.1
|
|
Consent of Independent Registered Public Accounting Firm (filed herewith).
|
|
|
24.1
|
|
Powers of Attorney (incorporated by reference to the signature page of this Annual Report on Form 10-K).
|
|
|
31.1
|
|
Certification of Chief Executive Officer pursuant to Rule 13a-14 (filed herewith).
|
|
|
31.2
|
|
Certification of Chief Financial Officer pursuant to Rule 13a-14 (filed herewith).
|
|
|
32.1
|
|
Certificate of Chief Executive Officer pursuant to Rule 13a-14(b) and Section 1350 of Chapter 63 of Title 18 of the United States Code (filed herewith).
|
|
|
32.2
|
|
Certificate of Chief Financial Officer pursuant to Rule 13a-14(b) and Section 1350 of Chapter 63 of Title 18 of the United States Code (filed herewith).
|
|
|
101.INS
|
|
XBRL Instance Document (filed herewith).
|
|
|
101.SCH
|
|
XBRL Taxonomy Extension Schema Document (filed herewith).
|
|
|
101.CAL
|
|
XBRL Taxonomy Extension Calculation Linkbase Document (filed herewith).
|
|
|
101.DEF
|
|
XBRL Taxonomy Extension Definition Linkbase (filed herewith).
|
|
|
101.LAB
|
|
XBRL Taxonomy Extension Label Linkbase Document (filed herewith).
|
|
|
101.PRE
|
|
XBRL Taxonomy Extension Presentation Linkbase Document (filed herewith).
|
|
*Indicates Management Compensatory Plan, Contract or Arrangement.
**Schedules have been omitted pursuant to Item 601(b)(2) of Regulation S-K. A copy of any omitted schedule will be furnished supplementally to the Securities and Exchange Commission upon request.
+Confidential treatment has been previously requested or granted to portions of these exhibits by the SEC.
98
SIGNATURES
Pursuant to the requirements of Section 13 or 15(d) of the Securities Exchange Act of 1934, the registrant has duly caused this Annual Report on Form 10-K to be signed on its behalf by the undersigned, thereunto duly authorized.
|
CBOE HOLDINGS, INC.
(Registrant)
|
||
|
By:
|
|
/s/ EDWARD T. TILLY
|
|
Edward T. Tilly
Chief Executive Officer
|
||
Date:
February 21, 2017
POWERS OF ATTORNEY
KNOW ALL PERSONS BY THESE PRESENTS, that each person whose signature appears below constitutes and appoints Edward T. Tilly, as attorney-in-fact and agent, with full power of substitution and re-substitution, to sign on his or her behalf, individually and in any and all capacities, including the capacities stated below, any and all amendments to this Annual Report on Form 10-K for the year ended
December 31, 2016
and to file the same, with all exhibits thereto, and other documents in connection therewith, with the Securities and Exchange Commission, granting to said attorney-in-fact and agent, full power and authority to do and perform each and every act and thing requisite and necessary to be done in and about the premises, as fully to all intents and purposes as he or she might or could do in person, hereby ratifying and confirming all that said attorney-in-fact and agent, or his substitute, may lawfully do or cause to be done by virtue hereof.
Pursuant to the requirements of the Securities Exchange Act of 1934, this report has been signed below by the following persons on behalf of the registrant and in the capacities on the dates indicated.
|
SIGNATURE
|
TITLE
|
DATE
|
||
|
|
|
|
||
|
/s/ EDWARD T. TILLY
|
Chief Executive Officer and Director
|
February 21, 2017
|
||
|
Edward T. Tilly
|
(Principal Executive Officer)
|
|||
|
/s/ ALAN J. DEAN
|
Executive Vice President, Chief Financial Officer and Treasurer
|
February 21, 2017
|
||
|
Alan J. Dean
|
(Principal Financial Officer)
|
|||
|
/s/ DAVID S. REYNOLDS
|
Vice President and Chief Accounting Officer
|
February 21, 2017
|
||
|
David S. Reynolds
|
(Principal Accounting Officer)
|
|||
|
/s/ WILLIAM J. BRODSKY
|
Chairman
|
February 21, 2017
|
||
|
William J. Brodsky
|
||||
|
/s/ JAMES R. BORIS
|
Director
|
February 21, 2017
|
||
|
James R. Boris
|
||||
|
/s/ FRANK E. ENGLISH, JR.
|
Director
|
February 21, 2017
|
||
|
Frank E. English, Jr.
|
||||
|
/s/ WILLIAM M. FARROW III
|
Director
|
February 21, 2017
|
||
|
William M. Farrow III
|
||||
|
/s/ EDWARD J. FITZPATRICK
|
Director
|
February 21, 2017
|
||
|
Edward J. Fitzpatrick
|
||||
99
|
SIGNATURE
|
TITLE
|
DATE
|
||
|
/s/ JANET P. FROETSCHER
|
Director
|
February 21, 2017
|
||
|
Janet P. Froetscher
|
||||
|
/s/ JILL R. GOODMAN
|
Director
|
February 21, 2017
|
||
|
Jill R. Goodman
|
||||
|
/s/ R. EDEN MARTIN
|
Director
|
February 21, 2017
|
||
|
R. Eden Martin
|
||||
|
/s/ RODERICK A. PALMORE
|
Director
|
February 21, 2017
|
||
|
Roderick A. Palmore
|
||||
|
/s/ SUSAN M. PHILLIPS
|
Director
|
February 21, 2017
|
||
|
Susan M. Phillips
|
||||
|
/s/ SAMUEL K. SKINNER
|
Director
|
February 21, 2017
|
||
|
Samuel K. Skinner
|
||||
|
/s/ CAROLE E. STONE
|
Director
|
February 21, 2017
|
||
|
Carole E. Stone
|
||||
|
/s/ EUGENE S. SUNSHINE
|
Director
|
February 21, 2017
|
||
|
Eugene S. Sunshine
|
||||
100
TABLE OF CONTENTS
Part IItem 1. BusinessItem 1A. Risk FactorsItem 1B. Unresolved Staff CommentsItem 2. PropertiesItem 3. Legal ProceedingsItem 4. Mine Safety DisclosuresPart IIItem 5. Market For Registrant's Common Equity, Related Stockholder Matters and Issuer Purchases Of Equity SecuritiesItem 6. Selected Financial DataItem 7. Management's Discussion and Analysis Of Financial Condition and Results Of OperationsItem 7A. Quantitative and Qualitative Disclosure About Market RiskItem 8. Financial Statements and Supplementary DataItem 9. Changes in and Disagreements with Accountants on Accounting and Financial DisclosureItem 9A. Controls and ProceduresItem 9B. Other InformationPart IIIItem 10. Directors, Executive Officers and Corporate GovernanceItem 11. Executive CompensationItem 12. Security Ownership Of Certain Beneficial Owners and Management and Related Stockholder MattersItem 13. Certain Relationships and Related Transactions, and Director IndependenceItem 14. Principal Accountant Fees and ServicesPart IVItem 15. Exhibits, Financial Statement Schedules