COMMUNITY BANK SYSTEM, INC.
10-Ks and 10-Qs
|
|
|
|
|
|
|
|
|
|
|
|
|
|
|
|
|
|
|
|
|
|
|
|
|
|
|
|
|
|
|
|
|
|
|
|
|
|
|
|
|
|
|
|
|
|
|
|
|
|
|
|
|
|
|
|
UNITED STATES SECURITIES AND EXCHANGE COMMISSION
Washington, D.C. 20549
FORM 10-K
|
|
☒ |
ANNUAL
REPORT
PURSUANT
TO SECTION 13 OR 15(d) OF THE SECURITIES EXCHANGE
ACT OF
1934
|
|
|
|
For the fiscal year ended
December 31, 2016
|
|
|
|
|
|
|
|
|
|
☐ |
TRANSITION REPORT PURSUANT TO SECTION 13 OR 15(d) OF THE SECURITIES EXCHANGE ACT OF 1934
|
|
|
|
For the transition period from
to
.
|
|
Commission File Number:
001-13695

(Exact name of registrant as specified in its charter)
|
Delaware
|
|
16‑1213679 |
|
(State or other jurisdiction of incorporation or organization)
|
|
(I.R.S. Employer Identification No.)
|
|
5790 Widewaters Parkway, DeWitt, New York
|
|
13214-1883 |
|
(Address of principal executive offices)
|
|
(Zip Code)
|
|
|
(315) 445‑2282
|
|
|
|
(Registrant's telephone number, including area code)
|
|
Securities registered pursuant of Section 12(b) of the Act:
|
Title of each class
|
Name of each exchange on which registered
|
|
Common Stock, Par Value $1.00 per share
|
New York Stock Exchange
|
Securities registered pursuant to Section 12(g) of the Act:
None
Indicate by check mark if the registrant is a well-known seasoned issuer, as defined in Rule 405 of the Securities Act. Yes
☒
No
☐
.
Indicate by check mark if the registrant is not required to file reports pursuant to Section 13 or Section 15(d) of the Act. Yes
☐
No
☒
.
Indicate by check mark whether the registrant (1) has filed all reports required to be filed by Section 13 or 15(d) of the Securities Exchange Act of 1934 during the preceding 12 months (or for such shorter period that the registrant was required to file such reports), and (2) has been subject to such filing requirements for the past 90 days. Yes
☒
No
☐
.
Indicate by check mark whether the registrant has submitted electronically and posted on its corporate Web site, if any, every Interactive Data File required to be submitted and posted pursuant to Rule 405 of Regulation S-T (
§
232.405 of this chapter) during the preceding 12 months (or for such shorter period that the registrant was required to submit and post such files). Yes
☒
No
☐
.
Indicate by check mark if disclosure of delinquent filers pursuant to Item 405 of Regulation S-K (
§
229.405 of this chapter) is not contained herein, and will not be contained, to the best of the registrant's knowledge, in definitive proxy or information statements incorporated by reference in Part III of this Form 10-K or any amendment of this Form 10-K.
☐
.
Indicate by check mark whether the registrant is a large accelerated filer, an accelerated filer, a non-accelerated filer, or a smaller reporting company. See definition of "large accelerated filer", "accelerated filer" and "smaller reporting company" in Rule 12b-2 of the Exchange Act.
| Large a ccelerated filer ☒ |
Accelerated filer
☐
|
Non-accelerated filer
☐
|
Smaller reporting company
☐
.
|
|
|
|
(Do not check if a smaller reporting company)
|
|
Indicate by check mark whether the registrant is a shell company (as defined in Rule 12b-2 of the Act). Yes
☐
No
☒
.
The aggregate market value of the common stock, $1.00 par value per share, held by non-affiliates of the registrant computed by reference to the closing price as of the close of business on June 30, 2016 (the registrant's most recently completed second fiscal quarter):
$1,765,509,358
.
The number of shares of the common stock, $1.00 par value per share, outstanding as of the close of business on January 31, 2017:
44,541,700
DOCUMENTS INCORPORATED BY REFERENCE.
Portions of the Definitive Proxy Statement for the Annual Meeting of the Shareholders to be held on May 17, 2017 (the "Proxy Statement") is incorporated by reference in Part III of this Annual Report on Form 10-K.
1 of 112
TABLE OF CONTENTS
|
PART I
|
Page
|
|
|
Item 1
|
Business__________________________________________________________________________________________________________________
|
3
|
|
Item 1A
|
Risk Factors _______________________________________________________________________________________________________________
|
13
|
|
Item 1B
|
Unresolved Staff Comments ___________________________________________________________________________________________________
|
19
|
|
Item 2
|
Properties_________________________________________________________________________________________________________________
|
19
|
|
Item 3
|
Legal Proceedings___________________________________________________________________________________________________________
|
20
|
|
Item 4
|
Mine Safety Disclosures______________________________________________________________________________________________________
|
20
|
|
Item 4A.
|
Executive Officers of the Registrant______________________________________________________________________________________________
|
20
|
|
PART II
|
||
|
Item 5
|
Market for Registrant's Common Equity, Related Stockholders Matters and Issuer Purchases of Equity Securities___________________________________
|
21
|
|
Item 6
|
Selected Financial Data_______________________________________________________________________________________________________
|
23
|
|
Item 7
|
Management's Discussion and Analysis of Financial Condition and Results of Operations____________________________________________________
|
25
|
|
Item 7A
|
Quantitative and Qualitative Disclosures about Market Risk___________________________________________________________________________
|
51
|
|
Item 8
|
Financial Statements and Supplementary Data:
|
|
|
Consolidated Statements of Condition_________________________________________________________________________________________
|
54
|
|
|
Consolidated Statements of Income___________________________________________________________________________________________
|
55
|
|
|
Consolidated Statements of Comprehensive Income_______________________________________________________________________________
|
56
|
|
|
Consolidated Statements of Changes in Shareholders' Equity________________________________________________________________________
|
57
|
|
|
Consolidated Statements of Cash Flows________________________________________________________________________________________
|
58
|
|
|
Notes to Consolidated Financial Statements_____________________________________________________________________________________
|
59
|
|
|
Report on Internal Control over Financial Reporting_______________________________________________________________________________
|
98
|
|
|
Report of Independent Registered Public Accounting Firm__________________________________________________________________________
|
99
|
|
|
Two Year Selected Quarterly Data______________________________________________________________________________________________
|
100
|
|
|
Item 9
|
Changes in and Disagreements with Accountants on Accounting and Financial Disclosure___________________________________________________
|
100
|
|
Item 9A.
|
Controls and Procedures_____________________________________________________________________________________________________
|
100
|
|
Item 9B.
|
Other Information___________________________________________________________________________________________________________
|
101
|
|
PART III
|
||
|
Item 10
|
Directors, Executive Officers and Corporate Governance______________________________________________________________________________
|
101
|
|
Item 11
|
Executive Compensation_____________________________________________________________________________________________________
|
101
|
|
Item 12
|
Security Ownership of Certain Beneficial Owners and Management and Related Stockholder Matters____________________________________________
|
101
|
|
Item 13
|
Certain Relationships and Related Transactions, and Director Independence______________________________________________________________
|
101
|
|
Item 14
|
Principal Accounting Fees and Services__________________________________________________________________________________________
|
101
|
|
PART IV
|
||
|
Item 15
|
Exhibits, Financial Statement Schedules__________________________________________________________________________________________
|
102
|
|
Item 16
|
Form 10-K Summary_________________________________________________________________________________________________________
|
105
|
|
Signatures
|
________________________________________________________________________________________________________________________
|
106
|
2
Part I
This Annual Report on Form 10-K contains certain forward-looking statements with respect to the financial condition, results of operations and business of Community Bank System, Inc. These forward-looking statements by their nature address matters that involve certain risks and uncertainties. Factors that may cause actual results to differ materially from those contemplated by such forward-looking statements are set forth herein under the caption "Forward-Looking Statements."
Community Bank System, Inc. (the "Company") was incorporated on April 15, 1983, under the Delaware General Corporation Law. Its principal office is located at 5790 Widewaters Parkway, DeWitt, New York 13214. The Company is a registered financial holding company which wholly-owns two significant subsidiaries: Community Bank, N.A. (the "Bank" or "CBNA"), and Benefit Plans Administrative Services, Inc. ("BPAS"). As of December 31, 2016, BPAS owns four subsidiaries: Benefit Plans Administrative Services, LLC ("BPA"), a provider of defined contribution plan administration services; BPAS Actuarial & Pension Services, LLC ("BPAS-APS") (formally known as Harbridge Consulting Group, LLC), a provider of actuarial and benefit consulting services; BPAS Trust Company of Puerto Rico, a Puerto Rican trust company; and Hand Benefits & Trust Company ("HB&T"), a provider of collective investment fund administration and institutional trust services. HB&T owns one subsidiary, Hand Securities, Inc. ("HSI"), an introducing broker-dealer. The Company also wholly-owns two unconsolidated subsidiary business trusts formed for the purpose of issuing mandatorily-redeemable preferred securities which are considered Tier I capital under regulatory capital adequacy guidelines.
The Bank's business philosophy is to operate as a community bank with local decision-making, principally in non-metropolitan markets, providing a broad array of banking and financial services to retail, commercial, and municipal customers. As of December 31, 2016, the Bank operates 193 full-service branches operating as Community Bank, N.A. throughout 35 counties of Upstate New York and six counties of Northeastern Pennsylvania, offering a range of commercial and retail banking services. The Bank owns the following operating subsidiaries: The Carta Group, Inc. ("Carta Group"), CBNA Preferred Funding Corporation ("PFC"), CBNA Treasury Management Corporation ("TMC"), Community Investment Services, Inc. ("CISI"), Nottingham Advisors, Inc. ("Nottingham"), OneGroup NY, Inc. ("OneGroup"), Oneida Wealth Management, Inc. ("OWM") and Oneida Preferred Funding II LLC ("OPFCII"). OneGroup is a full-service insurance agency offering personal and commercial property insurance and other risk management products and services. On August 19, 2016, the Company merged its insurance subsidiary CBNA Insurance Agency, Inc. ("CBNA Insurance") into OneGroup. PFC and OPFCII primarily act as investors in residential real estate loans and properties. TMC provides cash management, investment, and treasury services to the Bank. CISI, The Carta Group and OWM provide broker-dealer and investment advisory services. On April 22, 2016, the Company merged the activities of OWM into CISI. Nottingham provides asset management services to individuals, corporations, corporate pension and profit sharing plans, and foundations.
The Company maintains a website at communitybankna.com. Annual reports on Form 10-K, quarterly reports on Form 10-Q, current reports on Form 8-K, and amendments to those reports, are available on the Company's website free of charge as soon as reasonably practicable after such reports or amendments are electronically filed with or furnished to the Securities and Exchange Commission ("SEC"). The information posted on the website is not incorporated into or a part of this filing. Copies of all documents filed with the SEC can also be obtained by visiting the SEC's Public Reference Room at 100 F Street, NE, Washington, DC 20549, by calling the SEC at 1-800-SEC-0330 or by accessing the SEC's website at https://www.sec.gov.
Acquisition History (2012-2016)
Northeast Retirement Services, Inc.
On December 5, 2016, the Company announced that it had entered into a definitive agreement to acquire Northeast Retirement Services, Inc. ("NRS") and its subsidiary Global Trust Company ("GTC") headquartered in Woburn, Massachusetts for approximately $148 million in Company stock and cash. On February 3, 2017, the Company completed its acquisition of NRS and GTC. NRS was a privately held corporation focused on providing institutional transfer agency, master recordkeeping services, custom target date fund administration, trust product administration and customized reporting services to institutional clients. Its wholly-owned subsidiary, GTC, was chartered in the State of Maine in 2008, as a non-depository trust company which provides fiduciary services for collective investment trusts and other products. The acquisition will strengthen and complement the Company's existing employee benefit services businesses. Upon the completion of the merger, NRS is a wholly-owned subsidiary of BPAS and will operate as Northeast Retirement Services, LLC, a Delaware limited liability company. The initial accounting for the assets and liabilities assumed with this acquisition is incomplete as of the date of issuance of the financial statements due to the proximity of the acquisition date to the date of issuance.
3
Merchants Bancshares, Inc. –
Pending Acquisition
On October 24, 2016, the Company announced that it had entered into a definitive agreement to acquire Merchants Bancshares, Inc. ("Merchants"), parent company of Merchants Bank, a state chartered bank headquartered in South Burlington, Vermont, for approximately $362 million in Company stock and cash. The acquisition will extend the Company's footprint into the Vermont and Western Massachusetts markets. Upon the completion of the merger, the Bank will add 31 branch locations in Vermont and one location in Massachusetts with approximately $2.1 billion of assets, and deposits of $1.5 billion. The acquisition is expected to close during the second or third quarter of 2017, pending both regulatory and Merchants' shareholder approval. The Company expects to incur certain one-time, transaction-related costs in 2017.
WJL Agencies, Inc.
On January 4, 2016, the Company, through its subsidiary, CBNA Insurance, completed its acquisition of WJL Agencies, Inc. doing business as The Clark Insurance Agencies ("WJL"), an insurance agency operating in northern New York. The Company paid $0.6 million in cash for the intangible assets of the company. Goodwill in the amount of $0.3 million and intangible assets in the amount of $0.3 million were recorded in conjunction with the acquisition. The effects of the acquired assets and liabilities have been included in the consolidated financial statements since that date. On August 19, 2016, the Company merged together its insurance subsidiaries and as of that date, the activities of CBNA Insurance were merged into OneGroup.
Oneida Financial Corp.
On December 4, 2015, the Company completed its acquisition of Oneida Financial Corp. ("Oneida"), parent company of Oneida Savings Bank, headquartered in Oneida, New York for approximately $158 million in Company stock and cash, comprised of $56.3 million of cash and the issuance of 2.38 million common shares. Upon the completion of the merger, the Bank added 12 branch locations in Oneida and Madison counties and approximately $769 million of assets, including approximately $399 million of loans and $226 million of investment securities, along with $699 million of deposits. Through the acquisition of Oneida, the Company acquired OneGroup and OWM as wholly-owned subsidiaries primarily engaged in offering insurance and investment advisory services. These subsidiaries complement the Company's other non-banking financial services businesses. The effects of the acquired assets and liabilities have been included in the consolidated financial statements since that date.
EBS-RMSCO, Inc.
On January 1, 2014, BPAS-APS, formerly known as Harbridge Consulting Group LLC, completed its acquisition of a professional services practice from EBS-RMSCO, Inc., a subsidiary of The Lifetime Healthcare Companies ("EBS-RMSCO"). This professional services practice, which provides actuarial valuation and consulting services to clients who sponsor pension and post-retirement medical and welfare plans, enhanced the Company's participation in the Western New York marketplace.
Bank of America Branches
On December 13, 2013, the Bank completed its acquisition of eight retail branch-banking locations across its Northeast Pennsylvania markets from Bank of America, N.A. ("B of A"), acquiring approximately $1.1 million in loans and $303 million of deposits. The assumed deposits consisted of $220 million of checking, savings and money market accounts ("core deposits") and $83 million of time deposits. Under the terms of the purchase agreement, the Bank paid B of A a blended deposit premium of 2.4%, or approximately $7.3 million.
HSBC and First Niagara Branches
On July 20, 2012, the Bank completed its acquisition of 16 retail branches in central, northern and western New York from HSBC Bank USA, N.A. ("HSBC"), acquiring approximately $106 million in loans and approximately $697 million of deposits. The assumed deposits consisted primarily of core deposits and the acquired loans consisted of in-market performing loans, primarily residential real estate loans. Under the terms of the purchase agreement, the Bank paid First Niagara Bank, N.A. ("First Niagara"), who acquired HSBC's Upstate New York banking business and assigned its right to purchase the 16 branches to the Bank, a blended deposit premium of 3.4%, or approximately $24 million.
On September 7, 2012, the Bank completed its acquisition of three branches in central New York from First Niagara, acquiring approximately $54 million of loans and $101 million of deposits. The assumed deposits consisted primarily of core deposits and the acquired loans consisted of in-market performing loans, primarily residential real estate loans. Under the terms of the purchase agreement, the Bank paid a blended deposit premium of 3.1%, or approximately $3 million.
In support of the HSBC and First Niagara branch acquisitions, the Company completed a public common stock offering in late January 2012, raising $57.5 million through the issuance of 2.13 million shares of common stock. The net proceeds of the offering were approximately $54.9 million.
4
Services
Banking
The Bank is a community bank committed to the philosophy of serving the financial needs of customers in local communities. The Bank's branches are generally located in smaller towns and cities within its geographic market areas of Upstate New York and Northeastern Pennsylvania. The Company believes that the local character of its business, knowledge of the customers and their needs, and its comprehensive retail and business products, together with responsive decision-making at the branch and regional levels, enable the Bank to compete effectively in its geographic market. The Bank is a member of the Federal Reserve System ("FRB") and the Federal Home Loan Bank of New York ("FHLB"), and its deposits are insured by the Federal Deposit Insurance Corporation ("FDIC") up to applicable limits.
Employee Benefit Services
Through BPAS and its subsidiaries, the Company operates a national practice that
provides employee benefit trust, collective investment fund, retirement plan administration, actuarial, VEBA/HRA and health and welfare consulting services
to a diverse array of clients spanning the United States and Puerto Rico.
Wealth Management
Through the Bank, CISI, OWM, Carta Group, and Nottingham, the Company provides wealth management, retirement planning, higher educational planning, fiduciary, risk management, and personal financial planning services. The Company offers investment alternatives including stocks, bonds, mutual funds and advisory products.
Insurance Agency
Through OneGroup, the Company
offers personal and commercial property insurance and other risk management products and services. In addition, OneGroup offers employee benefit related services.
OneGroup
represents many leading insurance companies.
Segment Information
The Company has identified three reportable operating business segments: Banking, Employee Benefit Services, and All Other. Included in the All Other segment are the smaller Wealth Management and Insurance operations. Information about the Company's reportable business segments is included in Note U of the "Notes to Consolidated Financial Statements" filed herewith in Part II.
Competition
The banking and financial services industry is highly competitive in the New York and Pennsylvania markets. The Company competes actively for loans, deposits and customers with other national and state banks, thrift institutions, credit unions, retail brokerage firms, mortgage bankers, finance companies, insurance agencies, and other regulated and unregulated providers of financial services. In order to compete with other financial service providers, the Company stresses the community nature of its operations and the development of profitable customer relationships across all lines of business.
5
The table below summarizes the Bank's deposits and market share by the forty-one counties of New York and Pennsylvania in which it has customer facilities. Market share is based on deposits of all commercial banks, credit unions, savings and loan associations, and savings banks.
|
Number of
|
|||||||||||||||||||||||||
|
County
|
State
|
Deposits as of 6/30/2016
(1)
(000's omitted)
|
Market
Share
(1)
|
Branches
|
ATM's
|
Towns/ Cities
|
Towns Where Company
Has 1
st
or 2
nd
Market Position
|
||||||||||||||||||
|
Lewis
|
NY
|
$
|
198,077
|
75.70
|
%
|
4
|
4
|
3
|
3
|
||||||||||||||||
|
Franklin
|
NY
|
322,707
|
63.30
|
%
|
6
|
6
|
5
|
5
|
|||||||||||||||||
|
Hamilton
|
NY
|
54,393
|
54.98
|
%
|
2
|
2
|
2
|
2
|
|||||||||||||||||
|
Madison
|
NY
|
465,922
|
53.33
|
%
|
8
|
8
|
5
|
5
|
|||||||||||||||||
|
Allegany
|
NY
|
254,923
|
48.16
|
%
|
9
|
10
|
8
|
8
|
|||||||||||||||||
|
Cattaraugus
|
NY
|
405,535
|
42.84
|
%
|
10
|
11
|
7
|
6
|
|||||||||||||||||
|
Saint Lawrence
|
NY
|
430,746
|
37.27
|
%
|
13
|
11
|
11
|
10
|
|||||||||||||||||
|
Otsego
|
NY
|
355,965
|
34.69
|
%
|
10
|
9
|
6
|
5
|
|||||||||||||||||
|
Jefferson
|
NY
|
436,631
|
28.15
|
%
|
7
|
9
|
6
|
6
|
|||||||||||||||||
|
Seneca
|
NY
|
131,020
|
27.80
|
%
|
4
|
3
|
4
|
4
|
|||||||||||||||||
|
Clinton
|
NY
|
354,656
|
26.80
|
%
|
4
|
7
|
2
|
2
|
|||||||||||||||||
|
Yates
|
NY
|
95,300
|
25.70
|
%
|
3
|
2
|
2
|
1
|
|||||||||||||||||
|
Wyoming
|
PA
|
121,488
|
24.65
|
%
|
4
|
4
|
4
|
4
|
|||||||||||||||||
|
Schuyler
|
NY
|
48,371
|
24.43
|
%
|
1
|
1
|
1
|
1
|
|||||||||||||||||
|
Chautauqua
|
NY
|
349,177
|
22.87
|
%
|
12
|
12
|
10
|
7
|
|||||||||||||||||
|
Livingston
|
NY
|
176,354
|
22.51
|
%
|
5
|
6
|
5
|
4
|
|||||||||||||||||
|
Steuben
|
NY
|
187,672
|
18.31
|
%
|
8
|
8
|
7
|
4
|
|||||||||||||||||
|
Essex
|
NY
|
120,533
|
18.03
|
%
|
5
|
5
|
4
|
4
|
|||||||||||||||||
|
Wayne
|
NY
|
131,884
|
15.62
|
%
|
3
|
3
|
2
|
2
|
|||||||||||||||||
|
Delaware
|
NY
|
144,681
|
14.88
|
%
|
5
|
5
|
5
|
5
|
|||||||||||||||||
|
Ontario
|
NY
|
241,814
|
12.07
|
%
|
8
|
14
|
5
|
3
|
|||||||||||||||||
|
Oswego
|
NY
|
169,822
|
9.63
|
%
|
4
|
5
|
4
|
2
|
|||||||||||||||||
|
Tioga
|
NY
|
37,835
|
8.62
|
%
|
2
|
2
|
2
|
1
|
|||||||||||||||||
|
Oneida
|
NY
|
273,502
|
7.94
|
%
|
7
|
7
|
6
|
5
|
|||||||||||||||||
|
Lackawanna
|
PA
|
398,822
|
7.66
|
%
|
11
|
11
|
8
|
4
|
|||||||||||||||||
|
Herkimer
|
NY
|
46,717
|
7.55
|
%
|
1
|
1
|
1
|
1
|
|||||||||||||||||
|
Luzerne
|
PA
|
451,924
|
7.44
|
%
|
10
|
14
|
8
|
3
|
|||||||||||||||||
|
Chemung
|
NY
|
74,589
|
7.29
|
%
|
2
|
2
|
1
|
0
|
|||||||||||||||||
|
Susquehanna
|
PA
|
52,519
|
6.41
|
%
|
3
|
1
|
3
|
2
|
|||||||||||||||||
|
Schoharie
|
NY
|
23,327
|
5.38
|
%
|
1
|
1
|
1
|
0
|
|||||||||||||||||
|
Bradford
|
PA
|
46,941
|
4.19
|
%
|
2
|
2
|
2
|
1
|
|||||||||||||||||
|
Carbon
|
PA
|
40,002
|
4.07
|
%
|
2
|
2
|
2
|
1
|
|||||||||||||||||
|
Cayuga
|
NY
|
43,470
|
4.03
|
%
|
2
|
2
|
2
|
1
|
|||||||||||||||||
|
Washington
|
NY
|
19,194
|
2.67
|
%
|
1
|
0
|
1
|
1
|
|||||||||||||||||
|
Chenango
|
NY
|
22,852
|
2.38
|
%
|
2
|
2
|
1
|
0
|
|||||||||||||||||
|
Warren
|
NY
|
32,543
|
1.92
|
%
|
1
|
1
|
1
|
1
|
|||||||||||||||||
|
Onondaga
|
NY
|
151,245
|
1.55
|
%
|
4
|
4
|
4
|
1
|
|||||||||||||||||
|
Broome
|
NY
|
32,133
|
1.22
|
%
|
1
|
1
|
1
|
0
|
|||||||||||||||||
|
Ulster
|
NY
|
29,496
|
0.97
|
%
|
1
|
1
|
1
|
1
|
|||||||||||||||||
|
Erie
|
NY
|
117,828
|
0.29
|
%
|
4
|
4
|
3
|
2
|
|||||||||||||||||
|
Tompkins
|
NY
|
4,150
|
0.22
|
%
|
1
|
0
|
1
|
0
|
|||||||||||||||||
|
|
|
$
|
7,096,760
|
6.95
|
%
|
193
|
203
|
157
|
118
|
||||||||||||||||
| (1) Deposits and Market Share data as of June 30, 2016, the most recent information available from SNL Financial LLC. Deposit amounts include $138.9 million of intercompany balances that are eliminated upon consolidation. | |||||||||||||||||||||||||
6
Employees
As of December 31, 2016, the Company employed 2,222 full-time employees, 138 part-time employees and 139 temporary employees. None of the Company's employees are represented by a collective bargaining agreement. The Company offers a variety of employment benefits and considers its relationship with its employees to be good.
Supervision and Regulation
General
The banking industry is highly regulated with numerous statutory and regulatory requirements that are designed primarily for the protection of depositors and the financial system, and not for the purpose of protecting shareholders. Set forth below is a description of the material laws and regulations applicable to the Company and the Bank. This summary is not complete and the reader should refer to these laws and regulations for more detailed information. The Company's and the Bank's failure to comply with applicable laws and regulations could result in a range of sanctions and administrative actions imposed upon the Company and/or the Bank, including the imposition of civil money penalties, formal agreements and cease and desist orders. Changes in applicable law or regulations, and in their interpretation and application by regulatory agencies, cannot be predicted, and may have a material effect on the Company's business and results.
The Company and its subsidiaries are subject to the laws and regulations of the federal government and the states and jurisdictions in which they conduct business. The Company, as a bank holding company, is subject to extensive regulation, supervision and examination by the Board of Governors of the Federal Reserve System ("FRB") as its primary federal regulator. The Bank is a nationally-chartered bank and is subject to extensive regulation, supervision and examination by the Office of the Comptroller of the Currency ("OCC") as its primary federal regulator, and as to certain matters, the FRB, the Consumer Financial Protection Bureau ("CFPB"), and the Federal Deposit Insurance Corporation ("FDIC").
The Company is also subject to the jurisdiction of the SEC and is subject to disclosure and regulatory requirements under the Securities Act of 1933, as amended, and the Securities Exchange Act of 1934, as amended. The Company's common stock is listed on the New York Stock Exchange ("NYSE") and it is subject to NYSE's rules for listed companies. Affiliated entities, including BPAS, HB&T, HSI, BPAS Trust Company of Puerto Rico, Nottingham, CISI, OneGroup, Carta Group, and OWM are subject to the jurisdiction of certain state and federal regulators and self-regulatory organizations including, but not limited to, the SEC, the Texas Department of Banking, the Financial Industry Regulatory Authority ("FINRA"), Puerto Rico Office of the Commissioner of Financial Institutions, and state securities and insurance regulators.
The Company, the Bank, and their respective subsidiaries may be subject to the laws and regulations of the federal government and/or the various states in which they conduct business.
Federal Bank Holding Company Regulation
The Company is a bank holding company under the Bank Holding Company Act of 1956, (the "BHC Act"), and became a financial holding company effective September 30, 2015. As a bank holding company that has elected to become a financial holding company, the Company can affiliate with securities firms and insurance companies and engage in other activities that are "financial in nature" or "incidental" or "complementary" to activities that are financial in nature, as long as it continues to meet the eligibility requirements for financial holding companies (including requirements that the financial holding company and its depository institution subsidiary maintain their status as "well capitalized" and "well managed").
Generally, FRB approval is not required for the Company to acquire a company (other than a bank holding company, bank or savings association) engaged in activities that are financial in nature or incidental to activities that are financial in nature, as determined by the FRB. Prior notice to the FRB may be required, however, if the company to be acquired has total consolidated assets of $10 billion or more. Prior FRB approval is required before the Company may acquire the beneficial ownership or control of more than 5% of the voting shares or substantially all of the assets of a bank holding company, bank or savings association.
Because the Company is a financial holding company, if the Bank were to receive a rating under the Community Reinvestment Act of 1977, as amended ("CRA"), of less than Satisfactory, the Company will be prohibited, until the rating is raised to Satisfactory or better, from engaging in new activities or acquiring companies other than bank holding companies, banks or savings associations, except that the Company could engage in new activities, or acquire companies engaged in activities, that are considered "closely related to banking" under the BHC Act. In addition, if the FRB determines that the Company or the Bank is not well capitalized or well managed, the Company would be required to enter into an agreement with the FRB to comply with all applicable capital and management requirements and may contain additional limitations or conditions. Until corrected, the Company could be prohibited from engaging in any new activity or acquiring companies engaged in activities that are not closely related to banking, absent prior FRB approval.
7
Federal Reserve System Regulation
Because the Company is a bank holding company, it is subject to regulatory capital requirements and required by the FRB to, among other things, maintain cash reserves against its deposits. The Bank is under similar capital requirements administered by the OCC as discussed below. FRB policy has historically required a bank holding company to act as a source of financial and managerial strength to its subsidiary banks. The Dodd-Frank Wall Street Reform and Consumer Protection Act of 2010 (the "Dodd-Frank Act") codifies this historical policy as a statutory requirement. To the extent the Bank is in need of capital, the Company could be expected to provide additional capital, including borrowings from the FRB for such purpose. Both the Company and the Bank are subject to extensive supervision and regulation, which focus on, among other things, the protection of depositors' funds.
The FRB also regulates the national supply of bank credit in order to influence general economic conditions. These policies have a significant influence on overall growth and distribution of loans, investments and deposits, and affect the interest rates charged on loans or paid for deposits.
Fluctuations in interest rates, which may result from government fiscal policies and the monetary policies of the FRB, have a strong impact on the income derived from loans and securities, and interest paid on deposits and borrowings. While the Company and the Bank strive to model various interest rate changes and adjust our strategies for such changes, the level of earnings can be materially affected by economic circumstances beyond our control.
The Office of Comptroller of the Currency Regulation
The Bank is supervised and regularly examined by the OCC. The various laws and regulations administered by the OCC affect the Company's practices such as payment of dividends, incurring debt, and acquisition of financial institutions and other companies. It also affects the Bank's business practices, such as payment of interest on deposits, the charging of interest on loans, types of business conducted and the location of its offices. The OCC generally prohibits a depository institution from making any capital distributions, including the payment of a dividend, or paying any management fee to its parent holding company if the depository institution would become undercapitalized due to the payment. Undercapitalized institutions are subject to growth limitations and are required to submit a capital restoration plan to the OCC. The Bank is well capitalized under regulatory standards administered by the OCC. For additional information on our capital requirements see "Management's Discussion and Analysis of Financial Condition and Results of Operations – Shareholders' Equity" and Note P to the Financial Statements.
Federal Home Loan Bank
The Bank is a member of the FHLB, which provides a central credit facility primarily for member institutions for home mortgage and neighborhood lending. The Bank is subject to the rules and requirements of the FHLB, including the purchase of shares of FHLB activity-based stock in the amount of 4.5% of the dollar amount of outstanding advances and FHLB capital stock in an amount equal to the greater of $1,000 or the sum of 0.15% of the mortgage-related assets held by the Bank based upon the previous year-end financial information. The Bank was in compliance with the rules and requirements of the FHLB at December 31, 2016.
Deposit Insurance
Deposits of the Bank are insured up to the applicable limits by the Deposit Insurance Fund ("DIF") and are subject to deposit insurance assessments to maintain the DIF. The Dodd-Frank Act permanently increased the maximum amount of deposit insurance to $250,000 per deposit category, per depositor, per institution. A depository institution's DIF assessment is calculated by multiplying its assessment rate by the assessment base, which is defined as the average consolidated total assets less the average tangible equity of the depository institution. The initial base assessment rate is based on its capital level and supervisory ratings (its "CAMELS ratings"), certain financial measures to assess an institution's ability to withstand asset related stress and funding related stress and, in some cases, additional discretionary adjustments by the FDIC to reflect additional risk factors.
In October 2010, the FDIC adopted a DIF restoration plan to ensure that the fund reserve ratio reaches 1.35% by September 30, 2020, as required by the Dodd-Frank Act. At least semi-annually, the FDIC will update its loss and income projections for the fund and, if needed, will increase or decrease assessment rates, following notice-and-comment rulemaking if required. On June 30, 2016, the fund reserve ratio reached 1.15% and the assessment rate schedule was lowered. FDIC insurance expense totaled $3.7 million, $4.0 million and $3.9 million in 2016, 2015 and 2014, respectively.
Under the Federal Deposit Insurance Act, if the FDIC finds that an institution has engaged in unsafe and unsound practices, is in an unsafe or unsound condition to continue operations, or has violated any applicable law, regulation, rule, order or condition imposed by the FDIC, the FDIC may determine that such violation or unsafe or unsound practice or condition require the termination of deposit insurance.
8
Dodd-Frank Wall Street Reform and Consumer Protection Act of 2010
On July 21, 2010, the Dodd-Frank Act was signed into law, which resulted in significant changes to the banking industry. The provisions that have received the most public attention have been those that apply to financial institutions larger than the Company; however, the Dodd-Frank Act does contain numerous other provisions that affect all banks and bank holding companies and impacts how the Company and the Bank handle their operations. The Dodd-Frank Act requires various federal agencies, including those that regulate the Company and the Bank, to promulgate new rules and regulations and to conduct various studies and reports for Congress. The federal agencies have either completed or are in the process of completing these rules and regulations and have been given significant discretion in drafting such rules and regulations. Several of the provisions of the Dodd-Frank Act may have the consequence of increasing the Bank's expenses, decreasing its revenues, and changing the activities in which it chooses to engage. The specific impact of the Dodd-Frank Act on the Company's current activities or new financial activities the Company may consider in the future, the Company's financial performance, and the markets in which the Company operates depends on the manner in which the relevant agencies continue to develop and implement the required rules and regulations and the reaction of market participants to these regulatory developments.
Pursuant to FRB regulations mandated by the Dodd-Frank Act, effective October 1, 2011, interchange fees on debit card transactions are limited to a maximum of $0.21 per transaction plus 5 basis points of the transaction amount. A debit card issuer may recover an additional one cent per transaction for fraud prevention purposes if the issuer complies with certain fraud-related requirements prescribed by the FRB. Currently, the Company is exempt from the interchange fee cap under the "small issuer" exemption, which applies to any debit card issuer with total worldwide assets (including those of its affiliates) of less than $10 billion as of the end of the previous calendar year. In the event the Company's assets reach $10 billion or more, it will become subject to the interchange fee limitations beginning July 1 of the following year, and the fees the Company may receive for an electronic debit transaction will be capped at the statutory limit. The FRB also adopted requirements in the final rule that issuers include two unaffiliated networks for routing debit transactions that are applicable to the Company and the Bank.
The final rules issued by the FRB, SEC, OCC, FDIC, and Commodity Futures Trading Commission implementing Section 619 of the Dodd-Frank Act (commonly known as the Volcker Rule) prohibit insured depository institutions and companies affiliated with insured depository institutions from engaging in short-term proprietary trading of certain securities, derivatives, commodity futures and options on these instruments, for their own account. The final rules also impose limits on banking entities' investments in, and other relationships with, hedge funds or private equity funds. Banking entities with less than $10 billion in total consolidated assets, which generally have very little or no involvement in prohibited proprietary trading or investment activities in covered funds, do not have any compliance obligations under the final rule if they do not engage in any covered activities other than trading in certain government, agency, State or municipal obligations.
The CFPB rules implementing Section 1073 of the Dodd-Frank Act create a comprehensive new system of consumer protections for remittance transfers sent by consumers in the United States to individuals and businesses in foreign countries. The amendments provide new protections, including disclosure requirements, and error resolution and cancellation rights, to consumers who send remittance transfers to other consumers or businesses in a foreign country. The Bank has adopted policies and procedures to comply with the final foreign remittance transfer rules.
The scope and impact of many of the Dodd-Frank Act's provisions will continue to be determined over time, including as final regulations are issued and become effective. As a result, the Company cannot predict the ultimate impact of the Dodd-Frank Act on the Company or the Bank at this time, including the extent to which it could increase costs or limit the Company's ability to pursue business opportunities in an efficient manner, or otherwise adversely affect its business, financial condition and results of operations. Nor can the Company predict the impact or substance of other future legislation or regulation. However, it is expected that they at a minimum will increase the Company's and the Bank's operating and compliance costs. As rules and regulations continue to be implemented or issued, the Company may need to dedicate additional resources to ensure compliance, which may increase its costs of operations and adversely impact its earnings.
Capital Requirements
The Company and the Bank are required to comply with applicable capital adequacy standards established by the federal banking agencies. The risk-based capital standards that were applicable to the Company and the Bank through December 31, 2014 were based on the 1988 Capital Accord, known as Basel I ("Basel I"), of the Basel Committee on Banking Supervision (the "Basel Committee"). However, in July 2013, the FRB, the OCC and the FDIC approved final rules (the "New Capital Rules") establishing a new comprehensive capital framework for U.S. banking organizations. These rules went into effect for the Company and the Bank on January 1, 2015, subject to phase-in periods for certain components.
9
The New Capital Rules implement the Basel Committee's December 2010 capital framework (known as "Basel III") for strengthening international capital standards as well as certain provisions of the Dodd-Frank Act. The New Capital Rules substantially revise the risk-based capital requirements applicable to bank holding companies and depository institutions, including the Company and the Bank, compared to the previous U. S. Basel I risk-based capital rules. The New Capital Rules define the components of capital and address other issues affecting the numerator in banking institutions regulatory capital ratios and replace the Basel I risk-weighting approach, with a more risk-sensitive one based, in part, on the standardized approach set forth in "Basel II". The New Capital Rules also implement the requirements of Section 939A of the Dodd-Frank Act to remove references to credit ratings from the Federal banking agencies' rules.
The New Capital Rules, among other things: (i) introduces as a new capital measure "Common Equity Tier 1," ("CET1"), (ii) specify that Tier 1 capital consists of CET1 and "Additional Tier 1 capital" instruments meeting specified revised requirements, (iii) defines CET1 narrowly by requiring that most deductions/adjustments to regulatory capital measures be made to CET1 and not to the other components of capital, and (iv) expands the scope of the deductions from and adjustments to capital as compared to existing regulations. Under the New Capital Rules, the most common form of Additional Tier 1 capital is non-cumulative perpetual preferred stock, and the most common form of Tier 2 capital is subordinated notes and a portion of the allowance for loan and lease losses, in each case, subject to the New Capital Rules specific requirements.
Under the New Capital Rules, the minimum capital ratios as of January 1, 2015 are as follows:
|
·
|
4.5% CET1 to total risk-weighted assets;
|
|
·
|
6.0% Tier 1 capital (CET1 plus Additional Tier 1 capital) to total risk-weighted assets;
|
|
·
|
8.0% Total capital (Tier 1 Capital plus Tier 2 capital) to total risk-weighted assets;
|
|
·
|
4.0% Tier 1 capital to total adjusted quarterly average assets (known as "leverage ratio")
|
Beginning in 2016, the New Capital Rules required the Company and the Bank to maintain a "capital conservation buffer" composed entirely of CET1. When it is fully phased-in by the beginning of 2019, banking organizations will be required to maintain a minimum capital conservation buffer of 2.5% (CET1 to Total risk-weighted assets), in addition to the minimum risk-based capital ratios. Therefore, to satisfy both the minimum risk-based capital ratios and the capital conservation buffer, a banking organization will be required to maintain the following: (i) CET1 to total risk-weighted assets of at least 7%, (ii) Tier 1 capital to total risk-weighted assets of at least 8.5%, and (iii) Total capital (Tier 1 capital plus Tier 2 capital) to total risk-weighted assets of at least 10.5% by January 1, 2019, upon full phase-in of the capital conservation buffer. The capital conservation buffer is designed to absorb losses during periods of economic stress. Banking institutions that do not maintain a capital conservation buffer of 2.5% or more will face constraints on dividends, common share repurchases and incentive compensation based on the amount of the shortfall.
The New Capital Rules provide for a number of deductions from and adjustments to CET1. These include, for example, the requirement that mortgage servicing rights, deferred tax assets dependent upon future taxable income and significant investments in non-consolidated financial entities be deducted from CET1 to the extent that any one such category exceeds 10% of CET1 or all such categories in the aggregate exceed 15% of CET1. Under the general Basel I risk based capital rules, the effects of accumulated other comprehensive income or loss items included in shareholders' equity (for example, marks-to-market of securities held in the available for sale portfolio) were reversed for the purposes of determining regulatory capital. Under the New Capital Rules, the effects of certain accumulated other comprehensive income or loss items are not excluded; however, banks not using the advanced approaches, including the Company and the Bank, were permitted to, and in the case of the Company and the Bank they did, make a one-time permanent election to continue to exclude these items.
Consistent with the section 171 of the Dodd-Frank Act, the New Capital Rules allow certain bank holding companies to include certain hybrid securities, such as trust preferred securities, in Tier 1 capital if they had less than $15 billion in assets as of December 31, 2009 and the securities were issued before May 19, 2010. Accordingly, the trust preferred securities classified as long-term debt on the Company's balance sheet will be included as Tier 1 capital while they are outstanding, unless the Company completes an acquisition of a depository institution holding company that did not meet this criteria, or are acquired by such an organization, after January 1, 2014, at which time they would be subject to the stated phase-out requirements of the New Capital Rules and would be included as Tier 2 capital.
Implementation of the deductions and other adjustments to CET1 began on January 1, 2015 and will be phased-in over a 4-year period (beginning at 40% on January 1, 2015 and an additional 20% per year thereafter). The implementation of the capital conservation buffer began on January 1, 2016 at the 0.625% level and will be phased in over a four-year period (increasing by that amount on each subsequent January 1, until it reaches 2.5% on January 1, 2019).
10
With respect to the Bank, the New Capital Rules also revise the prompt corrective action ("PCA") regulations established pursuant to Section 38 of the Federal Deposit Insurance Act, by (i) introducing a CET1 ratio requirement for each capital category other than critically undercapitalized, with the required CET1 ratio being 6.5% for well-capitalized status; (ii) increasing the minimum Tier 1 capital ratio requirement for each capital category, with the minimum Tier 1 capital ratio for well-capitalized status being 8.0% (as compared to the current 6.0%); and (iii) eliminating the current provision that allows certain highly-rated banking organizations to maintain a 3.0% leverage ratio and still be adequately capitalized. The New Capital Rules do not change the Total risk-based PCA capital requirement for any capital category.
The New Capital Rules prescribe a new standardized approach for risk weighted-assets that expands the risk-weight categories from the current four Basel I-derived categories (0%, 20%, 50% and 100%) to a larger and more risk-sensitive number of categories, depending on the nature of the asset. The new risk-weight categories generally range from 0% for U.S. government and agency securities, to 1,250% for certain securitized exposures, and result in higher risk weights for a variety of asset categories. The standardized approach requires financial institutions to transition assets that are 90 days or more past due or on nonaccrual from their original risk weight to 150 percent. Additionally, loans designated as high volatility commercial real estate ("HVCRE") are assigned a risk-weighting of 150 percent.
Requirements to maintain higher levels of capital or to maintain higher levels of liquid assets could adversely impact the Company's net income and return on equity. The current requirements and the Company's actual capital levels are detailed in Note P of "Notes to Consolidated Financial Statements" filed in Part II, Item 8, "Financial Statements and Supplementary Data."
Consumer Protection Laws
In connection with its banking activities, the Bank is subject to a number of federal and state laws designed to protect borrowers and promote lending to various sectors of the economy. These laws include the Equal Credit Opportunity Act, GLB Act, the Fair Credit Reporting Act ("FCRA"), the Fair and Accurate Credit Transactions Act of 2003 ("FACT Act"), Electronic Funds Transfer Act, the Truth in Lending Act, the Home Mortgage Disclosure Act, the Dodd-Frank Act, the Real Estate Settlement Procedures Act, the Secure and Fair Enforcement for Mortgage Licensing Act ("SAFE"), and various state law counterparts.
The Dodd-Frank Act created the CFPB with broad powers to supervise and enforce consumer protection laws, including laws that apply to banks in order to prohibit unfair, deceptive or abusive practices. The CFPB has examination authority over all banks and savings institutions with more than $10 billion in assets. Until the Company exceeds this threshold, the OCC continues to exercise primary examination authority over the Bank with regard to compliance with federal consumer protection laws and regulations. The Dodd-Frank Act weakens the federal preemption rules that have been applicable to national banks and gives attorney generals for the states certain powers to enforce federal consumer protection laws. Further, under the Dodd-Frank Act, it is unlawful for any provider of consumer financial products or services to engage in any unfair, deceptive, or abusive acts or practice ("UDAAP"). A violation of the consumer protection and privacy laws, and in particular UDAAP, could have serious legal, financial, and reputational consequences.
In addition, the GLB Act requires all financial institutions to adopt privacy policies, restrict the sharing of nonpublic customer data with nonaffiliated parties and establishes procedures and practices to protect customer data from unauthorized access. In addition, the FCRA, as amended by the FACT Act, includes provisions affecting the Company, the Bank, and their affiliates, including provisions concerning obtaining consumer reports, furnishing information to consumer reporting agencies, maintaining a program to prevent identity theft, sharing of certain information among affiliated companies, and other provisions. The FACT Act requires persons subject to FCRA to notify their customers if they report negative information about them to a credit bureau or if they are granted credit on terms less favorable than those generally available. The FRB and the Federal Trade Commission have extensive rulemaking authority under the FACT Act, and the Company and the Bank are subject to the rules that have been created under the FACT Act, including rules regarding limitations on affiliate marketing and implementation of programs to identify, detect and mitigate certain identity theft red flags. The Bank is also subject to data security standards and data breach notice requirements issued by the OCC and other regulatory agencies. The Bank has created policies and procedures to comply with these consumer protection requirements.
The CFPB issued the final rules implementing the ability-to-repay and qualified mortgage (QM) provisions of the Truth in Lending Act, as amended by the Dodd-Frank Act (the "QM Rule"). The ability-to-repay provision requires creditors to make reasonable, good faith determinations that borrowers are able to repay their mortgages before extending the credit based on a number of factors and consideration of financial information about the borrower derived from reasonably reliable third-party documents. Under the Dodd-Frank Act and the QM Rule, loans meeting the definition of "qualified mortgage" are entitled to a presumption that the lender satisfied the ability-to-repay requirements. The presumption is a conclusive presumption/safe harbor for loans meeting the QM requirements, and a rebuttable presumption for higher-priced loans meeting the QM requirements. The definition of a "qualified mortgage" incorporates the statutory requirements, such as not allowing negative amortization or terms longer than 30 years. The QM Rule also adds an explicit maximum 43% debt-to-income ratio for borrowers if the loan is to meet the QM definition, though some mortgages that meet government-sponsored enterprises, Federal Housing Administration, and Veterans Administration underwriting guidelines may, for a period not to exceed seven years, meet the QM definition without being subject to the 43% debt-to-income limits. The Bank has created policies and procedures to comply with these consumer protection requirements.
11
USA Patriot Act
The Uniting and Strengthening America by Providing Appropriate Tools Required to Intercept and Obstruct Terrorism Act of 2001 ("USA Patriot Act") imposes obligations on U.S. financial institutions, including banks and broker-dealer subsidiaries, to implement policies, procedures and controls which are reasonably designed to detect and report instances of money laundering and the financing of terrorism. In addition, provisions of the USA Patriot Act require the federal financial institution regulatory agencies to consider the effectiveness of a financial institution's anti-money laundering activities when reviewing bank mergers and bank holding company acquisitions. The USA Patriot Act also encourages information-sharing among financial institutions, regulators, and law enforcement authorities by providing an exemption from the privacy provisions of the GLB Act for financial institutions that comply with the provision of the Act. Failure of a financial institution to maintain and implement adequate programs to combat money laundering and terrorist financing, or to comply with all of the relevant laws or regulations, could have serious legal, financial and reputational consequences for the institution. The Company has approved policies and procedures that are designed to comply with the USA Patriot Act and its regulations.
Office of Foreign Assets Control Regulation
The United States has imposed economic sanctions that affect transactions with designated foreign countries, nationals and others administrated by the Treasury's Office of Foreign Assets Control ("OFAC"). The OFAC administered sanctions can take many different forms; however, they generally contain one or more of the following elements: (i) restrictions on trade with or investment in a sanctioned country, entity or individual, including prohibitions against direct or indirect imports and exports and prohibitions on "U.S. persons" engaging in financial transactions relating to making investments, or providing investment related advice or assistance; and (ii) a blocking of assets in which the government or specially designated nationals have an interest, by prohibiting transfers of property subject to U.S. jurisdiction (including property in the possession or control of U.S. persons). Blocked assets (e.g., property and bank deposits) cannot be paid out, withdrawn, set off or transferred in any manner without a license from OFAC. Failure to comply with these sanctions could have serious legal, financial, and reputational consequences.
Sarbanes-Oxley Act of 2002
The Sarbanes-Oxley Act of 2002 ("Sarbanes-Oxley Act") implemented a broad range of corporate governance, accounting and reporting reforms for companies that have securities registered under the Securities Exchange Act of 1934, as amended. In particular, the Sarbanes-Oxley Act established, among other things: (i) new requirements for audit and other key Board of Directors committees involving independence, expertise levels, and specified responsibilities; (ii) additional responsibilities regarding the oversight of financial statements by the Chief Executive Officer and Chief Financial Officer of the reporting company; (iii) the creation of an independent accounting oversight board for the accounting industry; (iv) new standards for auditors and the regulation of audits, including independence provisions which restrict non-audit services that accountants may provide to their audit clients; (v) increased disclosure and reporting obligations for the reporting company and its directors and executive officers including accelerated reporting of company stock transactions; (vi) a prohibition of personal loans to directors and officers, except certain loans made by insured financial institutions on non-preferential terms and in compliance with other bank regulator requirements; and (vii) a range of new and increased civil and criminal penalties for fraud and other violations of the securities laws.
Electronic Fund Transfer Act
A federal banking rule under the Electronic Fund Transfer Act prohibits financial institutions from charging consumers fees for paying overdrafts on automated teller machines and one-time debit card transactions, unless a consumer consents, or opts in, to the overdraft service for those types of transactions. The new rule does not govern overdraft fees on the payment of checks and certain other forms of bill payments.
Community Reinvestment Act of 1977
Under the Community Reinvestment Act of 1977 ("CRA"), the Bank is required to help meet the credit needs of its communities, including low- and moderate-income neighborhoods. Although the Bank must follow the requirements of CRA, it does not limit the Bank's discretion to develop products and services that are suitable for a particular community or establish lending requirements or programs. In addition, the Equal Credit Opportunity Act and the Fair Housing Act prohibits discrimination in lending practices. The Bank's failure to comply with the provisions of the CRA could, at a minimum, result in regulatory restrictions on its activities and the activities of the Company. The Bank's failure to comply with the Equal Credit Opportunity Act and the Fair Housing Act could result in enforcement actions against it by its regulators as well as other federal regulatory agencies and the Department of Justice. The Bank's latest CRA rating was "Satisfactory".
The Bank Secrecy Act
The Bank Secrecy Act ("BSA") requires all financial institutions, including banks and securities broker-dealers, to, among other things, establish a risk-based system of internal controls reasonably designed to prevent money laundering and the financing of terrorism. The BSA includes a variety of recordkeeping and reporting requirements (such as cash and suspicious activity reporting), as well as due diligence/know-your-customer documentation requirements. The Company has established an anti-money laundering program and taken other appropriate measures in order to comply with BSA requirements.
12
There are risks inherent in the Company's business. The material risks and uncertainties that management believes affect the Company are described below. Adverse experience with these could have a material impact on the Company's financial condition and results of operations.
Changes in interest rates affect our profitability, assets and liabilities.
The Company's income and cash flow depends to a great extent on the difference between the interest earned on loans and investment securities, and the interest paid on deposits and borrowings. Interest rates are highly sensitive to many factors that are beyond the Company's control, including general economic conditions and policies of various governmental and regulatory agencies and, in particular, the FRB. Changes in monetary policy, including changes in interest rates, could influence not only the interest we receive on loans and securities and the amount of interest we pay on deposits and borrowings, but such changes could also affect (1) our ability to originate loans and obtain deposits, which could reduce the amount of fee income generated, (2) the fair value of our financial assets and liabilities and (3) the average duration of the Company's various categories of earning assets. If the interest rates paid on deposits and other borrowings increase at a faster rate than the interest rates received on loans and other investments, our net interest income could be adversely affected, which in turn could negatively affect our earnings. Earnings could also be adversely affected if the interest rates received on loans and other investments fall more quickly than the interest rates paid on deposits and other borrowings. Although management believes it has implemented effective asset and liability management strategies to reduce the potential effects of changes in interest rates on the results of operations, any substantial, unexpected, prolonged change in market interest rates could have a material adverse effect on the financial condition and results of operations.
The Company operates in a highly regulated environment and may be adversely affected by changes in laws and regulations or the interpretation and examination of existing laws and regulations.
The Company and its subsidiaries are subject to extensive state and federal regulation, supervision and legislation that govern nearly every aspect of its operations. The Company, as a bank holding company, is subject to regulation by the FRB and its banking subsidiary is subject to regulation by the OCC. These regulations affect deposit and lending practices, capital levels and structure, investment practices, dividend policy and growth. In addition, the non-bank subsidiaries are engaged in providing retirement plan administration, investment management and insurance brokerage services, which industries are also heavily regulated at both a state and federal level. Such regulators govern the activities in which the Company and its subsidiaries may engage. These regulatory authorities have extensive discretion in connection with their supervisory and enforcement activities, including the imposition of restrictions on the operation of a bank, the classification of assets by a bank and the adequacy of a bank's allowance for loan losses. Any change in such regulation and oversight, whether in the form of regulatory policy, regulations, legislation, interpretation or application, could have a material impact on the Company and its operations. Changes to the regulatory laws governing these businesses could affect the Company's ability to deliver or expand its services and adversely impact its operating and financial condition.
For example, the Dodd-Frank Act, enacted in July 2010, instituted major changes to the banking and financial institutions regulatory regimes based upon the performance of, and ultimate government intervention in, the financial services sector. To date, not all the rules required or expected to be implemented under the Dodd-Frank Act have been adopted and many of the rules that have been adopted are subject to interpretation or clarification. The implications of the Dodd-Frank Act for the Company's businesses continue to depend to a large extent on the implementation of the legislation by the FRB and other agencies as well as how market practices and structures change in response to the requirements of the Dodd-Frank Act. All of these changes in regulations could subject the Company, among other things, to additional costs and limit the types of financial services and products it can offer and/or increase the ability of non-banks to offer competing financial services and products.
The Company is also directly subject to the requirements of entities that set and interpret the accounting standards such as the Financial Accounting Standards Board, and indirectly subject to the actions and interpretations of the Public Company Accounting Oversight Board, which establishes auditing and related professional practice standards for registered public accounting firms and inspects registered firms to assess their compliance with certain laws, rules, and professional standards in public company audits. These regulations, along with the currently existing tax, accounting, securities, insurance, and monetary laws, regulations, rules, standards, policies and interpretations, control the methods by which financial institutions and their holding companies conduct business, engage in strategic and tax planning, implement strategic initiatives, and govern financial reporting.
The Company's failure to comply with laws, regulations or policies could result in civil or criminal sanctions and money penalties by state and federal agencies, and/or reputation damage, which could have a material adverse effect on the Company's business, financial condition and results of operations. See "Supervision and Regulation" for more information about the regulations to which the Company is subject.
13
If the Company's total consolidated assets were to reach $10 billion, it would become subject to additional regulation and increased supervision.
The Dodd-Frank Act imposes additional regulatory requirement on institutions with $10 billion or more in assets. The Company had $8.7 billion in assets as of December 31, 2016. The pending merger with Merchants will result in the Company having assets of $10 billion or more and will subject the Company to the following: (1) supervision, examination and enforcement by the CFPB with respect to consumer financial protection laws, (2) regulatory stress testing requirements, whereby the Company would be required to conduct an annual stress test using assumptions for baseline, adverse and severely adverse scenarios, (3) a modified methodology for calculating FDIC insurance assessments and potentially higher assessment rates as a result of institutions with $10 billion or more in assets being required to bear a greater portion of the cost of raising the reserve ratio to 1.35% as required by the Dodd-Frank Act, (4) limitations on interchange fees for debit card transactions, (5) heightened compliance standards under the Volcker Rule, and (6) enhanced supervision as a larger financial institution. The imposition of these regulatory requirements and increased supervision may require additional commitment of financial resources to regulatory compliance and may increase the Company's cost of operations. Further, the results of the stress testing process may lead the Company to retain additional capital or alter the mix of its capital components.
To ensure compliance with these heightened requirements when effective, the Company's regulators may require it to fully comply with these requirements or take actions to prepare for compliance even before the Company's or the Bank's total consolidated assets equal or exceed $10 billion. As a result, the Company may incur compliance-related costs before it might otherwise be required, including if the Company does not continue to grow at the rate it expects or at all. The Company's regulators may also consider its preparation for compliance with these regulatory requirements when examining its operations generally or considering any request for regulatory approval the Company may make, even requests for approvals on unrelated matters.
The Company may be subject to more stringent capital requirements.
As discussed above, Basel III and the Dodd-Frank Act require the federal banking agencies to establish stricter risk-based capital requirements and leverage limits for banks and bank holding companies. Under the legislation, the federal banking agencies are required to develop capital requirements that address systemically-risky activities. The capital rules must address, at a minimum, risks arising from significant volumes of activity in derivatives, securities products, financial guarantees, securities borrowing and lending and repurchase agreements; concentrations in assets for which reported values are based on models; and concentrations in market share for any activity that would substantially disrupt financial markets if the institutions were forced to unexpectedly cease the activity. These requirements, and any other new regulations, could adversely affect the Company's ability to pay dividends, or could require it to reduce business levels or to raise capital, including in ways that may adversely affect its results of operations or financial condition.
Regional economic factors may have an adverse impact on the Company's business.
The Company's main markets are located in the states of New York and Pennsylvania. Most of the Company's customers are individuals and small and medium-sized businesses which are dependent upon the regional economy. Accordingly, the local economic conditions in these areas have a significant impact on the demand for the Company's products and services as well as the ability of the Company's customers to repay loans, the value of the collateral securing loans and the stability of the Company's deposit funding sources. A prolonged economic downturn in these markets could negatively impact the Company.
The Company is subject to a variety of operational risks, including reputational risk, legal and compliance risk, the risk of fraud or theft by employees or outsiders, which may adversely affect the Company's business and results of operations.
The Company is exposed to many types of operational risks, including reputational risk, legal and compliance risk, the risk of fraud or theft by employees or outsiders, unauthorized transactions by employees, or operational errors, including clerical or record keeping errors or those resulting from faulty or disabled computer or telecommunications systems or disclosure of confidential proprietary information of its customers. Negative public opinion can result from actual or alleged conduct in any number of activities, including lending practices, sales practices, customer treatment, corporate governance and acquisitions and from actions taken by government regulators and community organizations in response to those activities. Negative public opinion can adversely affect the Company's ability to attract and keep customers and can expose the Company to litigation and regulatory action. Actual or alleged conduct by the Company can result in negative public opinion about its business.
If personal, nonpublic, confidential, or proprietary information of customers in the Company's possession were to be mishandled or misused, the Company could suffer significant regulatory consequences, reputational damage, and financial loss. Such mishandling or misuse could include, for example, if such information were erroneously provided to parties who are not permitted to have the information, either by fault of its systems, employees, or counterparties, or where such information is intercepted or otherwise inappropriately taken by third parties.
14
Because the nature of the financial services business involves a high volume of transactions, certain errors may be repeated or compounded before they are discovered and successfully rectified. The Company's necessary dependence upon automated systems to record and process transactions and the large transaction volumes may further increase the risk that technical flaws or employee tampering or manipulation of those systems will result in losses that are difficult to detect. The Company also may be subject to disruptions of our operating systems arising from events that are wholly or partially beyond its control (for example, computer viruses or electrical or telecommunications outages), which may give rise to disruption of service to customers and to financial loss or liability. The Company is further exposed to the risk that external vendors may be unable to fulfill their contractual obligations (or will be subject to the same risk of fraud or operational errors by their respective employees) and to the risk that business continuity and data security systems prove to be inadequate. The occurrence of any of these risks could result in a diminished ability to operate the Company's business, potential liability to clients, reputational damage, and regulatory intervention, which could adversely affect our business, financial condition, and results of operations, perhaps materially.
The financial services industry is highly competitive and creates competitive pressures that could adversely affect the Company's revenue and profitability.
The financial services industry in which the Company operates is highly competitive. The Company competes not only with commercial and other banks and thrifts, but also with insurance companies, mutual funds, hedge funds, securities brokerage firms and other companies offering financial services in the U.S., globally and over the Internet. The Company competes on the basis of several factors, including capital, access to capital, revenue generation, products, services, transaction execution, innovation, reputation and price. Over time, certain sectors of the financial services industry have become more concentrated, as institutions involved in a broad range of financial services have been acquired by or merged into other firms. These developments could result in the Company's competitors gaining greater capital and other resources, such as a broader range of products and services and geographic diversity. The Company may experience pricing pressures as a result of these factors and as some of its competitors seek to increase market share by reducing prices or paying higher rates of interest on deposits. Finally, technological change is influencing how individuals and firms conduct their financial affairs and changing the delivery channels for financial services, with the result that the Company may have to contend with a broader range of competitors including many that are not located within the geographic footprint of its banking office network.
Conditions in the insurance market could adversely affect the Company's earnings.
Revenue from insurance fees and commissions could be negatively affected by fluctuating premiums in the insurance markets or other factors beyond the Company's control. Other factors that affect insurance revenue are the profitability and growth of the Company's clients, the renewal rate of the current insurance policies, continued development of new product and services as well as access to new markets. The Company's insurance revenues and profitability may also be adversely affected by new laws and regulatory developments impacting the healthcare and insurance markets.
Changes in employee benefit regulations may reduce our profitability.
The Company provides products and services to certain employee benefit plans that are subject to ERISA or the Internal Revenue Code of 1986, as amended. The U.S. Congress has, from time to time, considered legislation relating to changes in ERISA to permit application of state law remedies, such as consequential and punitive damages, in lawsuits for wrongful denial of benefits, which, if adopted, could increase our liability for damages in future litigation. In addition, reductions in contribution levels to defined contribution plans may decrease our profitability.
In April 2016, the Department of Labor ("DOL") released its final fiduciary definition regulation package, which was scheduled to be phased in April 10, 2017 to January 1, 2018. However, on February 3, 2017 a memorandum was issued that will most likely delay the rules implementation by 180 days. The regulation broadens the definition of a fiduciary under ERISA to include persons providing investment advice to an employee benefit plan or an IRA for a fee or other compensation. The DOL also released two new prohibited transaction class exemptions and amendments to current prohibited transaction exemptions. Broker-dealers and advisors are in various stages of determining the implications of the regulations and changes to the regulations on their business models. Even with this fluid environment, our preliminary assessment of the new regulation's impact to our business and future financial results indicates the costs will not have a significant effect on our financial condition or results of operations. As the rules become applicable and are operationalized, we will assess what business impacts need to be addressed and how they affect the organization.
15
The allowance for loan losses may be insufficient.
The Company's business depends on the creditworthiness of its customers. The Company reviews the allowance for loan losses quarterly for adequacy considering economic conditions and trends, collateral values and credit quality indicators, including past charge-off experience and levels of past due loans and nonperforming assets. If the Company's assumptions prove to be incorrect, the Company's allowance for loan losses may not be sufficient to cover losses inherent in the Company's loan portfolio, resulting in additions to the allowance. Material additions to the allowance would materially decrease its net income. It is possible that over time the allowance for loan losses will be inadequate to cover credit losses in the portfolio because of unanticipated adverse changes in the economy, market conditions or events adversely affecting specific customers, industries or markets.
Changes in the equity markets could materially affect the level of assets under management and the demand for other fee-based services.
Economic downturns could affect the volume of income from and demand for fee-based services. Revenue from the wealth management and benefit plan administration businesses depends in large part on the level of assets under management and administration. Market volatility, and the potential to lead customers to liquidate investments, as well as lower asset values, can reduce the level of assets under management and administration and thereby decrease the Company's investment management and administration revenues.
Mortgage banking income may experience significant volatility.
Mortgage banking income is highly influenced by the level and direction of mortgage interest rates, and real estate and refinancing activity. In lower interest rate environments, the demand for mortgage loans and refinancing activity will tend to increase. This has the effect of increasing fee income, but could adversely impact the estimated fair value of the Company's mortgage servicing rights as the rate of loan prepayments increase. In higher interest rate environments, the demand for mortgage loans and refinancing activity will generally be lower. This has the effect of decreasing fee income opportunities.
The Company depends on dividends from its banking subsidiary for cash revenues, but those dividends are subject to restrictions.
The ability of the Company to satisfy its obligations and pay cash dividends to its shareholders is primarily dependent on the earnings of and dividends from the subsidiary bank. However, payment of dividends by the bank subsidiary is limited by dividend restrictions and capital requirements imposed by bank regulations. The ability to pay dividends is also subject to the continued payment of interest that the Company owes on its subordinated junior debentures. As of December 31, 2016, the Company had $102 million of subordinated junior debentures outstanding. The Company has the right to defer payment of interest on the subordinated junior debentures for a period not exceeding 20 quarters, although the Company has not done so to date. If the Company defers interest payments on the subordinated junior debentures, it will be prohibited, subject to certain exceptions, from paying cash dividends on the common stock until all deferred interest has been paid and interest payments on the subordinated junior debentures resumes.
Risks related to the Company's proposed merger with Merchants.
The Company and Merchants have operated and, until the completion of the merger, will continue to operate, independently. The success of the merger, including anticipated benefits and cost savings, will depend, in part, on the Company's and Merchants' ability to successfully combine and integrate the businesses of the Company and Merchants in a manner that permits growth opportunities and does not materially disrupt the existing customer relations or result in decreased revenues due to loss of customers. It is possible that the integration process could result in the loss of key employees, the disruption of either entity's ongoing businesses or inconsistencies in standards, controls, procedures and policies that adversely affect the combined entity's ability to maintain relationships with customers, depositors, clients and employees or to achieve the anticipated benefits and cost savings of the merger. If the combined company experiences difficulties with the integration process, the anticipated benefits of the merger may not be realized fully or at all, or may take longer to realize than expected.
The Company has incurred, and will continue to incur, substantial expenses in connection with the negotiation and completion of the transaction contemplated by the merger agreement with Merchants. If the merger is not completed, the Company would have to recognize these expenses without realizing the expected benefits of the merger. These circumstances could have an adverse effect on the Company's business, results of operations and stock price.
16
Before the merger may be completed, the Company must obtain approval from the OCC and the FRB. Other approvals, waivers or consents from regulators may also be required. These regulators may impose conditions on the completion of the merger or require changes to the terms of the merger. Although the Company and Merchants do not currently expect that any such conditions or changes would be imposed, there can be no assurance that they will not be, and such conditions or changes could have the effect of delaying or preventing completion of the merger or imposing additional costs on or limiting the revenues of the combined company following the merger, any of which might have an adverse effect on the combined company following the merger.
Before the merger may be completed, Merchants must obtain the requisite approval of its stockholders. There is no assurance that this approval will be obtained.
The risks presented by acquisitions could adversely affect the Company's financial condition and result of operations.
The business strategy of the Company includes growth through acquisition. Any other future acquisitions will be accompanied by the risks commonly encountered in acquisitions. These risks include among other things: obtaining timely regulatory approval, the difficulty of integrating operations and personnel, the potential disruption of our ongoing business, the inability of the Company's management to maximize its financial and strategic position, the inability to maintain uniform standards, controls, procedures and policies, and the impairment of relationships with employees and customers as a result of changes in ownership and management. Further, the asset quality or other financial characteristics of a company may deteriorate after the acquisition agreement is signed or after the acquisition closes.
A portion of the Company's loan portfolio is acquired and was not underwritten by the Company at origination.
At December 31, 2016, 10% of the loan portfolio was acquired and was not underwritten by the Company at origination, and therefore is not necessarily reflective of the Company's historical credit risk experience. The Company performed extensive credit due diligence prior to each acquisition and marked the loans to fair value upon acquisition, with such fair valuation considering expected credit losses that existed at the time of acquisition. Additionally, the Company evaluates the expected cash flows of these loans on a quarterly basis. However, there is a risk that credit losses could be larger than currently anticipated, thus adversely affecting earnings.
The Company may be required to record impairment charges related to goodwill, other intangible assets and the investment portfolio.
The Company may be required to record impairment charges in respect to goodwill, other intangible assets and the investment portfolio. Numerous factors, including lack of liquidity for resale of certain investment securities, absence of reliable pricing information for investment securities, the economic condition of state and local municipalities, adverse changes in the business climate, adverse actions by regulators, unanticipated changes in the competitive environment or a decision to change the operations or dispose of an operating unit could have a negative effect on the investment portfolio, goodwill or other intangible assets in future periods.
The Company's financial statements are based, in part, on assumptions and estimates, which, if conditions change, could cause unexpected losses in the future.
Pursuant to accounting principles generally accepted in the United States, the Company is required to use certain assumptions and estimates in preparing its financial statements, including in determining credit loss reserves, mortgage repurchase liability and reserves related to litigation, among other items. Certain of the Company's financial instruments, including available-for-sale securities and certain loans, among other items, require a determination of their fair value in order to prepare the Company's financial statements. Where quoted market prices are not available, the Company may make fair value determinations based on internally developed models or other means which ultimately rely to some degree on management judgment. Some of these and other assets and liabilities may have no direct observable price levels, making their valuation particularly subjective, as they are based on significant estimation and judgment. In addition, sudden illiquidity in markets or declines in prices of certain loans and securities may make it more difficult to value certain balance sheet items, which may lead to the possibility that such valuations will be subject to further change or adjustment. If assumptions or estimates underlying the Company's financial statements are incorrect, it may experience material losses.
17
Financial services companies depend on the accuracy and completeness of information about customers and counterparties.
In deciding whether to extend credit or enter into other transactions, the Company may rely on information furnished by or on behalf of customers and counterparties, including financial statements, credit reports and other financial information. The Company may also rely on representations of those customers, counterparties or other third parties, such as independent auditors, as to the accuracy and completeness of that information. Reliance on inaccurate or misleading financial statements, credit reports or other information could have a material adverse impact on business and, in turn, the Company's financial condition and results of operations.
The Company's information systems may experience an interruption or security breach.
The Company relies heavily on communications and information systems to conduct its business. The Company may be the subject of sophisticated and targeted attacks intended to obtain unauthorized access to assets or confidential information, destroy data, disable or degrade service, or sabotage systems, often through the introduction of computer viruses or malware, cyber-attacks and other means. Any failure, interruption or breach in security of these systems could result in failures or disruptions in the Company's online banking system, its general ledger, and its deposit and loan servicing and origination systems or other systems. Furthermore, if personal, confidential or proprietary information of customers or clients in the Company's possession were to be mishandled or misused, the Company could suffer significant regulatory consequences, reputational damage and financial loss. Such mishandling or misuse could include circumstances where, for example, such information was erroneously provided to parties who are not permitted to have the information, either by fault of the Company's systems, employees, or counterparties, or where such information was intercepted or otherwise inappropriately taken by third parties. The Company has policies and procedures designed to prevent or limit the effect of the possible failure, interruption or security breach of its information systems; however, any such failure, interruption or security breach could adversely affect the Company's business and results of operations through loss of assets or by requiring it to expend significant resources to correct the defect, as well as exposing the Company to customer dissatisfaction and civil litigation, regulatory fines or penalties or losses not covered by insurance.
The Company is exposed to fraud in many aspects of the services and products that it provides.
The Company offers a wide variety of products and services. When account credentials and other access tools are not adequately protected, risks and potential costs may increase. As (a) sales of these services and products expand, (b) those who are committing fraud become more sophisticated and more determined, and (c) banking services and product offerings expand, the Company's operational losses could increase.
The Company may be adversely affected by the soundness of other financial institutions.
Financial services institutions are interrelated as a result of trading, clearing, counterparty, or other relationships. The Company has exposure to many different industries and counterparties, and routinely execute transactions with counterparties in the financial services industry. Many of these transactions expose the Company to credit risk in the event of a default by a counterparty or client. In addition, credit risk may be exacerbated when the collateral held by the Company cannot be realized upon or is liquidated at prices not sufficient to recover the full amount of the credit or derivative exposure due to the Company. Any such losses could have a material adverse effect on the Company's financial condition and results of operations.
The Company is or may become involved in lawsuits, legal proceedings, information-gathering requests, investigations, and proceedings by governmental agencies or other parties that may lead to adverse consequences.
As a participant in the financial services industry, many aspects of the Company's business involve substantial risk of legal liability. The Company and its subsidiaries have been named or threatened to be named as defendants in various lawsuits arising from its or its subsidiaries' business activities (and in some cases from the activities of acquired companies). In addition, from time to time, the Company is, or may become, the subject of governmental and self-regulatory agency information-gathering requests, reviews, investigations and proceedings and other forms of regulatory inquiry, including by bank regulatory agencies, the SEC and law enforcement authorities. The results of such proceedings could lead to delays in or prohibition to acquire other companies, significant penalties, including monetary penalties, damages, adverse judgments, settlements, fines, injunctions, restrictions on the way in which the Company conducts its business, or reputational harm.
Although the Company establishes accruals for legal proceedings when information related to the loss contingencies represented by those matters indicates both that a loss is probable and that the amount of loss can be reasonably estimated, the Company does not have accruals for all legal proceedings where it faces a risk of loss. In addition, due to the inherent subjectivity of the assessments and unpredictability of the outcome of legal proceedings, amounts accrued may not represent the ultimate loss to the Company from the legal proceedings in question. Thus, the Company's ultimate losses may be higher than the amounts accrued for legal loss contingencies, which could adversely affect the Company's financial condition and results of operations.
18
The Company continually encounters technological change and the failure to understand and adapt to these changes could have a negative impact on the business.
The financial services industry is continually undergoing rapid technological change with frequent introductions of new technology-driven products and services. The effective use of technology increases efficiency and enables financial institutions to better serve customers and to reduce costs. The Company's future success depends, in part, upon its ability to address the needs of its customers by using technology to provide products and services that will satisfy customer demands, as well as to create additional efficiencies in the Company's operations. Many of the Company's competitors have substantially greater resources to invest in technological improvements. The Company may not be able to effectively implement new technology-driven products and services or be successful in marketing these products and services to its customers. Failure to successfully keep pace with technological changes affecting the financial services industry could have a material adverse impact on the Company's financial condition and results of operations.
Trading activity in the Company's common stock could result in material price fluctuations.
The market price of the Company's common stock may fluctuate significantly in response to a number of other factors including, but not limited to:
|
·
|
Changes in securities analysts' expectations of financial performance;
|
|
·
|
Volatility of stock market prices and volumes;
|
|
·
|
Incorrect information or speculation;
|
|
·
|
Changes in industry valuations;
|
|
·
|
Variations in operating results from general expectations;
|
|
·
|
Actions taken against the Company by various regulatory agencies;
|
|
·
|
Changes in authoritative accounting guidance by the Financial Accounting Standards Board or other regulatory agencies;
|
|
·
|
Changes in general domestic economic conditions such as inflation rates, tax rates, unemployment rates, oil prices, labor and healthcare cost trend rates, recessions, and changing government policies, laws and regulations; and
|
|
·
|
Severe weather, natural disasters, acts of war or terrorism and other external events.
|
The Company's ability to attract and retain qualified employees is critical to the success of its business, and failure to do so may have a materially adverse effect on the Company's performance.
The Company's employees are its most important resource, and in many areas of the financial services industry, competition for qualified personnel is intense. The imposition on the Company or its employees of certain existing and proposed restrictions or taxes on executive compensation may adversely affect the Company's ability to attract and retain qualified senior management and employees. If the Company provides inadequate succession planning, is unable to continue to retain and attract qualified employees, the Company's performance, including its competitive position, could have a materially adverse effect.
None
The Company's primary headquarters are located at 5790 Widewaters Parkway, Dewitt, New York, which is leased. In addition, the Company has 225 properties located in the counties identified in the table on page 6, of which 148 are owned and 77 are under lease arrangements. With respect to the Banking segment, the Company operates 193 full-service branches and eight facilities for back office banking operations. With respect to the Employee Benefit Services segment, the Company operates 13 customer service facilities, all of which are leased. With respect to the All Other segment, the Company operates 11 customer service facilities, nine of which are leased and two are owned. Some properties contain tenant leases or subleases.
Real property and related banking facilities owned by the Company at December 31, 2016 had a net book value of $79.5 million and none of the properties were subject to any material encumbrances. For the year ended December 31, 2016, the Company paid $5.8 million of rental fees for facilities leased for its operations. The Company believes that its facilities are suitable and adequate for the Company's current operations.
19
The Company and its subsidiaries are subject in the normal course of business to various pending and threatened legal proceedings in which claims for monetary damages are asserted. As of December 31, 2016, management, after consultation with legal counsel, does not anticipate that the aggregate ultimate liability arising out of litigation pending or threatened against the Company or its subsidiaries will be material to the Company's consolidated financial position. On at least a quarterly basis the Company assesses its liabilities and contingencies in connection with such legal proceedings. For those matters where it is probable that the Company will incur losses and the amounts of the losses can be reasonably estimated, the Company records an expense and corresponding liability in its consolidated financial statements. To the extent the pending or threatened litigation could result in exposure in excess of that liability, the amount of such excess is not currently estimable. The range of reasonably possible losses for matters where an exposure is not currently estimable or considered probable, beyond the existing recorded liabilities, is between $0 and $1 million in the aggregate. Although the Company does not believe that the outcome of pending litigation will be material to the Company's consolidated financial position, it cannot rule out the possibility that such outcomes will be material to the consolidated results of operations for a particular reporting period in the future.
Not Applicable
Item 4A.
Executive Officers of the Registrant
The executive officers of the Company and the Bank who are elected by the Board of Directors are as follows:
|
Name
|
Age
|
Position
|
|
Mark E. Tryniski
|
56
|
Director, President and Chief Executive Officer. Mr. Tryniski assumed his current position in August 2006. He served as Executive Vice President and Chief Operating Officer from March 2004 to July 2006 and as the Treasurer and Chief Financial Officer from June 2003 to March 2004. He previously served as a partner in the Syracuse office of PricewaterhouseCoopers LLP.
|
|
Scott Kingsley
|
52
|
Executive Vice President and Chief Financial Officer. Mr. Kingsley joined the Company in August 2004 in his current position. He served as Vice President and Chief Financial Officer of Carlisle Engineered Products, Inc., a subsidiary of the Carlisle Companies, Inc., from 1997 until joining the Company.
|
|
Brian D. Donahue
|
60
|
Executive Vice President and Chief Banking Officer. Mr. Donahue assumed his current position in August 2004. He served as the Bank's Chief Credit Officer from February 2000 to July 2004 and as the Senior Lending Officer for the Southern Region of the Bank from 1992 until June 2004.
|
|
George J. Getman
|
60
|
Executive Vice President and General Counsel. Mr. Getman assumed his current position in January 2008. Prior to joining the Company, he was a partner with Bond, Schoeneck & King, PLLC and served as corporate counsel to the Company.
|
20
Part II
The Company's common stock has been trading on the New York Stock Exchange under the symbol "CBU" since December 31, 1997. Prior to that, the common stock traded over-the-counter on the NASDAQ National Market under the symbol "CBSI" beginning on September 16, 1986. There were 44,541,700 shares of common stock outstanding on January 31, 2017, held by approximately 3,670 registered shareholders of record. The following table sets forth the high and low closing prices for the common stock, and the cash dividends declared with respect thereto, for the periods indicated. The prices do not include retail mark-ups, mark-downs or commissions.
|
Year / Qtr
|
High Price
|
Low Price
|
Quarterly Dividend
|
|||||||||
|
2016
|
||||||||||||
|
4
th
|
$
|
62.24
|
$
|
46.07
|
$
|
0.32
|
||||||
|
3
rd
|
$
|
48.11
|
$
|
39.96
|
$
|
0.32
|
||||||
|
2
nd
|
$
|
42.18
|
$
|
36.78
|
$
|
0.31
|
||||||
|
1
st
|
$
|
39.23
|
$
|
34.47
|
$
|
0.31
|
||||||
|
2015
|
||||||||||||
|
4
th
|
$
|
43.13
|
$
|
36.70
|
$
|
0.31
|
||||||
|
3
rd
|
$
|
39.80
|
$
|
34.21
|
$
|
0.31
|
||||||
|
2
nd
|
$
|
38.52
|
$
|
34.58
|
$
|
0.30
|
||||||
|
1
st
|
$
|
37.71
|
$
|
33.60
|
$
|
0.30
|
||||||
The Company has historically paid regular quarterly cash dividends on its common stock, and declared a cash dividend of $0.32 per share for the first quarter of 2017. The Board of Directors of the Company presently intends to continue the payment of regular quarterly cash dividends on the common stock, as well as to make payment of regularly scheduled dividends on the trust preferred stock when due, subject to the Company's need for those funds. However, because substantially all of the funds available for the payment of dividends by the Company are derived from the subsidiary Bank, future dividends will depend upon the earnings of the Bank, its financial condition, its need for funds and applicable governmental policies and regulations.
21
The following graph compares cumulative total shareholders returns on the Company's common stock over the last five fiscal years to the S&P 600 Commercial Banks Index, the NASDAQ Bank Index, the S&P 500 Index, and the KBW Regional Banking Index. Total return values were calculated as of December 31 of each indicated year assuming a $100 investment on December 31, 2011 and reinvestment of dividends.
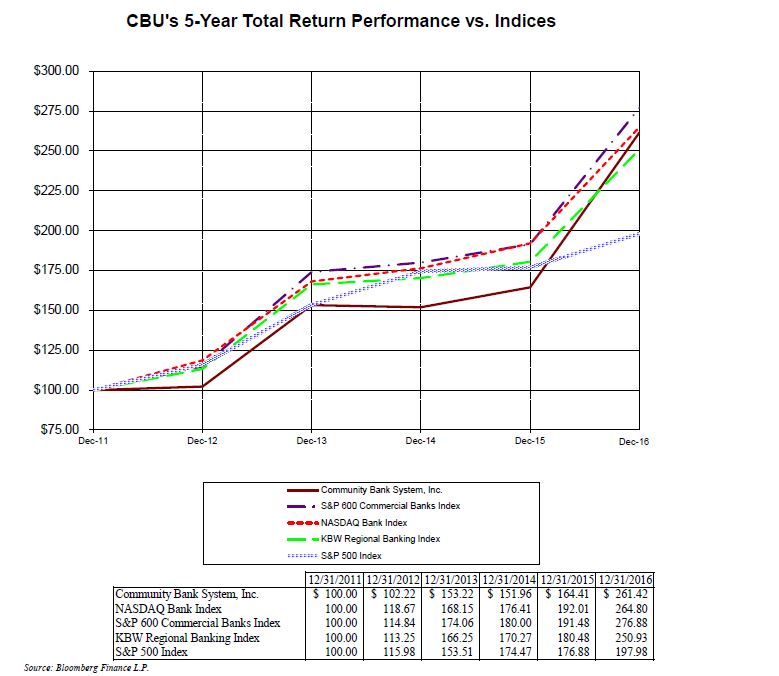
22
Equity Compensation Plan Information
The following table provides information as of December 31, 2016 with respect to shares of common stock that may be issued under the Company's existing equity compensation plans.
|
Plan Category
|
Number of Securities to be Issued upon Exercise of Outstanding Options, Warrants and Rights
(1)
|
Weighted-average Exercise Price
of Outstanding Options, Warrants and Rights
|
Number of Securities Remaining Available For Future Issuance Under Equity Compensation Plans (excluding securities reflected in the first column)
|
|||||||||
|
Equity compensation plans approved by security holders:
|
||||||||||||
|
1994 Long-term Incentive Plan
|
12,883
|
$
|
17.41
|
5,701
|
||||||||
|
2004 Long-term Incentive Plan
|
1,215,998
|
26.51
|
48,830
|
|||||||||
|
2014 Long-term Incentive Plan
|
780,941
|
27.80
|
889,482
|
|||||||||
|
Equity compensation plans not approved by security holders
|
0
|
0
|
0
|
|||||||||
|
Total
|
2,009,822
|
$
|
26.95
|
944,013
|
||||||||
| (1) The number of securities includes 253,830 shares of unvested restricted stock. | ||||||||||||
Stock Repurchase Program
At its December 2015 meeting, the Board approved a stock repurchase program authorizing the repurchase, at the discretion of senior management, of up to 2,200,000 shares of the Company's common stock, in accordance with securities laws and regulations, during a twelve-month period starting January 1, 2016. There were no treasury stock purchases made under this authorization in 2016. At its December 2016 meeting, the Board approved a new stock repurchase program authorizing the repurchase, at the discretion of senior management, of up to 2,200,000 shares of the Company's common stock, in accordance with securities laws and regulations, during a twelve-month period starting January 1, 2017. Any repurchased shares will be used for general corporate purposes, including those related to stock plan activities. The timing and extent of repurchases will depend on market conditions and other corporate considerations as determined at the Company's discretion.
The following table presents stock purchases made during the fourth quarter of 2016:
|
Issuer Purchases of Equity Securities
|
||||||||||||||||
|
Period
|
Total
Number of Shares Purchased
|
Average
Price Paid
Per share
|
Total Number of Shares Purchased as Part of
Publicly Announced
Plans or Programs
|
Maximum Number of Shares That May Yet be Purchased Under the Plans or Programs
|
||||||||||||
|
October 1-31, 2016
|
0
|
$
|
0
|
0
|
2,200,000
|
|||||||||||
|
November 1-30, 2016
(1)
|
50,952
|
54.14
|
0
|
2,200,000
|
||||||||||||
|
December 1-31, 2016
|
0
|
0
|
0
|
2,200,000
|
||||||||||||
|
Total
|
50,952
|
$
|
54.14
|
|||||||||||||
|
(1)
Included in the common shares repurchased were 91 shares acquired by the Company in connection with satisfaction of tax withholding obligations on vested restricted stock issued pursuant to the employee benefit plan and 50,861 shares acquired by the Company in connection with the administration of the Company's retirement plan. These shares were not repurchased as part of the publicly announced repurchase plan described above.
|
The following table sets forth selected consolidated historical financial data of the Company as of and for each of the years in the five-year period ended December 31, 2016. The historical information set forth under the captions "Income Statement Data" and "Balance Sheet Data" is derived from the audited financial statements while the information under the captions "Capital and Related Ratios", "Selected Performance Ratios" and "Asset Quality Ratios" for all periods is unaudited. All financial information in this table should be read in conjunction with the information contained in "Management's Discussion and Analysis of Financial Condition and Results of Operations" and with the Consolidated Financial Statements and the related notes thereto included elsewhere in this Annual Report on Form 10-K.
23
SELECTED CONSOLIDATED FINANCIAL INFORMATION
|
Years Ended December 31,
|
||||||||||||||||||||
|
(In thousands except per share data and ratios)
|
2016
|
2015
|
2014
|
2013
|
2012
|
|||||||||||||||
|
Income Statement Data:
|
||||||||||||||||||||
|
Loan interest income
|
$
|
211,467
|
$
|
187,743
|
$
|
185,527
|
$
|
188,197
|
$
|
192,710
|
||||||||||
|
Investment interest income
|
73,720
|
71,879
|
70,693
|
75,962
|
88,690
|
|||||||||||||||
|
Interest expense
|
11,291
|
11,202
|
11,792
|
26,065
|
50,976
|
|||||||||||||||
|
Net interest income
|
273,896
|
248,420
|
244,428
|
238,094
|
230,424
|
|||||||||||||||
|
Provision for loan losses
|
8,076
|
6,447
|
7,178
|
7,992
|
9,108
|
|||||||||||||||
|
Noninterest income
|
155,625
|
123,303
|
119,020
|
108,748
|
98,955
|
|||||||||||||||
|
Gain (loss) on investment securities & early
retirement of long-term borrowings, net
|
0
|
(4
|
)
|
0
|
(6,568
|
)
|
291
|
|||||||||||||
|
Acquisition expenses and litigation settlement
|
1,706
|
7,037
|
2,923
|
2,181
|
8,247
|
|||||||||||||||
|
Other noninterest expenses
|
265,142
|
226,018
|
223,657
|
219,074
|
203,510
|
|||||||||||||||
|
Income before income taxes
|
154,597
|
132,217
|
129,690
|
111,027
|
108,805
|
|||||||||||||||
|
Net income
|
103,812
|
91,230
|
91,353
|
78,829
|
77,068
|
|||||||||||||||
|
Diluted earnings per share
|
2.32
|
2.19
|
2.22
|
1.94
|
1.93
|
|||||||||||||||
|
Balance Sheet Data:
|
||||||||||||||||||||
|
Cash equivalents
|
$
|
24,243
|
$
|
21,931
|
$
|
12,870
|
$
|
11,288
|
$
|
84,415
|
||||||||||
|
Investment securities
|
2,784,392
|
2,847,940
|
2,512,974
|
2,218,725
|
2,818,527
|
|||||||||||||||
|
Loans
|
4,948,562
|
4,801,375
|
4,236,206
|
4,109,083
|
3,865,576
|
|||||||||||||||
|
Allowance for loan losses
|
(47,233
|
)
|
(45,401
|
)
|
(45,341
|
)
|
(44,319
|
)
|
(42,888
|
)
|
||||||||||
|
Intangible assets
|
480,844
|
484,146
|
386,973
|
390,499
|
387,134
|
|||||||||||||||
|
Total assets
|
8,666,437
|
8,552,669
|
7,489,440
|
7,095,864
|
7,496,800
|
|||||||||||||||
|
Deposits
|
7,075,954
|
6,873,474
|
5,935,264
|
5,896,044
|
5,628,039
|
|||||||||||||||
|
Borrowings
|
248,370
|
403,446
|
440,122
|
244,010
|
830,134
|
|||||||||||||||
|
Shareholders' equity
|
1,198,100
|
1,140,647
|
987,904
|
875,812
|
902,778
|
|||||||||||||||
|
Capital and Related Ratios:
|
||||||||||||||||||||
|
Cash dividends declared per share
|
$
|
1.26
|
$
|
1.22
|
$
|
1.16
|
$
|
1.10
|
$
|
1.06
|
||||||||||
|
Book value per share
|
26.96
|
26.06
|
24.24
|
21.66
|
22.78
|
|||||||||||||||
|
Tangible book value per share
(1)
|
17.12
|
15.90
|
15.63
|
12.80
|
13.72
|
|||||||||||||||
|
Market capitalization (in millions)
|
2,746
|
1,748
|
1,554
|
1,604
|
1,084
|
|||||||||||||||
|
Tier 1 leverage ratio
|
10.55
|
%
|
10.32
|
%
|
9.96
|
%
|
9.29
|
%
|
8.40
|
%
|
||||||||||
|
Total risk-based capital to risk-adjusted assets
|
19.10
|
%
|
18.08
|
%
|
18.75
|
%
|
17.57
|
%
|
16.20
|
%
|
||||||||||
|
Tangible equity to tangible assets
(1)
|
9.24
|
%
|
8.59
|
%
|
8.92
|
%
|
7.68
|
%
|
7.62
|
%
|
||||||||||
|
Dividend payout ratio
|
53.7
|
%
|
55.5
|
%
|
51.6
|
%
|
56.0
|
%
|
54.3
|
%
|
||||||||||
|
Period end common shares outstanding
|
44,437
|
43,775
|
40,748
|
40,431
|
39,626
|
|||||||||||||||
|
Diluted weighted-average shares outstanding
|
44,720
|
41,605
|
41,232
|
40,726
|
39,927
|
|||||||||||||||
|
Selected Performance Ratios:
|
||||||||||||||||||||
|
Return on average assets
|
1.20
|
%
|
1.17
|
%
|
1.23
|
%
|
1.09
|
%
|
1.08
|
%
|
||||||||||
|
Return on average equity
|
8.57
|
%
|
8.87
|
%
|
9.65
|
%
|
9.04
|
%
|
8.82
|
%
|
||||||||||
|
Net interest margin
|
3.71
|
%
|
3.73
|
%
|
3.91
|
%
|
3.91
|
%
|
3.88
|
%
|
||||||||||
|
Noninterest income/operating income (FTE)
|
35.4
|
%
|
32.1
|
%
|
31.4
|
%
|
30.0
|
%
|
28.6
|
%
|
||||||||||
|
Efficiency ratio
(2)
|
59.2
|
%
|
57.9
|
%
|
57.9
|
%
|
59.3
|
%
|
57.4
|
%
|
||||||||||
|
Asset Quality Ratios:
|
||||||||||||||||||||
|
Allowance for loan losses/total loans
|
0.95
|
%
|
0.95
|
%
|
1.07
|
%
|
1.08
|
%
|
1.11
|
%
|
||||||||||
|
Nonperforming loans/total loans
|
0.48
|
%
|
0.50
|
%
|
0.56
|
%
|
0.54
|
%
|
0.75
|
%
|
||||||||||
|
Allowance for loan losses/nonperforming loans
|
199
|
%
|
190
|
%
|
190
|
%
|
201
|
%
|
147
|
%
|
||||||||||
|
Loan loss provision/net charge-offs
|
129
|
%
|
101
|
%
|
117
|
%
|
122
|
%
|
108
|
%
|
||||||||||
|
Net charge-offs/average loans
|
0.13
|
%
|
0.15
|
%
|
0.15
|
%
|
0.17
|
%
|
0.23
|
%
|
||||||||||
|
(1)
The tangible book value per share and the tangible equity to tangible asset ratio excludes goodwill and identifiable intangible assets, adjusted for deferred tax liabilities generated from tax deductible goodwill. The ratio is not a financial measurement required by accounting principles generally accepted in the United States of America. However, management believes such information is useful to analyze the relative strength of the Company's capital position and is useful to investors in evaluating Company performance (See Table 20 for Reconciliation of GAAP to Non-GAAP Measures).
|
| (2) Efficiency ratio provides a ratio of operating expenses to operating income. It excludes intangible amortization, acquisition expenses, and litigation settlement from expenses and gains and losses on investment securities & early retirement of long-term borrowings from income while adding a fully-taxable equivalent adjustment. The efficiency ratio is not a financial measurement required by accounting principles generally accepted in the United States of America. However, the efficiency ratio is used by management in its assessment of financial performance specifically as it relates to noninterest expense control. Management also believes such information is useful to investors in evaluating Company performance. |
24
Item 7.
Management's Discussion and Analysis of Financial Condition and Results of Operations
This Management's Discussion and Analysis of Financial Condition and Results of Operations ("MD&A") primarily reviews the financial condition and results of operations of the Company for the past two years, although in some circumstances a period longer than two years is covered in order to comply with SEC disclosure requirements or to more fully explain long-term trends. The following discussion and analysis should be read in conjunction with the Selected Consolidated Financial Information beginning on page 23 and the Company's Consolidated Financial Statements and related notes that appear on pages 54 through 97. All references in the discussion to the financial condition and results of operations refer to the consolidated position and results of the Company and its subsidiaries taken as a whole.
Unless otherwise noted, all earnings per share ("EPS") figures disclosed in the MD&A refer to diluted EPS; interest income, net interest income, and net interest margin are presented on a fully tax-equivalent ("FTE") basis, which is a non-GAAP measure. The term "this year" and equivalent terms refer to results in calendar year 2016, "last year" and equivalent terms refer to calendar year 2015, and all references to income statement results correspond to full-year activity unless otherwise noted.
This MD&A contains certain forward-looking statements with respect to the financial condition, results of operations, and business of the Company. These forward-looking statements involve certain risks and uncertainties. Factors that may cause actual results to differ materially from those contemplated by such forward-looking statements are set herein under the caption "Forward-Looking Statements" on page 50.
Critical Accounting Policies
As a result of the complex and dynamic nature of the Company's business, management must exercise judgment in selecting and applying the most appropriate accounting policies for its various areas of operations. The policy decision process not only ensures compliance with the latest generally accepted accounting principles ("GAAP"), but also reflects management's discretion with regard to choosing the most suitable methodology for reporting the Company's financial performance. It is management's opinion that the accounting estimates covering certain aspects of the business have more significance than others due to the relative importance of those areas to overall performance, or the level of subjectivity in the selection process. These estimates affect the reported amounts of assets and liabilities as well as disclosures of revenues and expenses during the reporting period. Actual results could differ from these estimates. Management believes that the critical accounting estimates include:
|
·
|
Acquired loans – Acquired loans are initially recorded at their acquisition date fair values based on a discounted cash flow methodology that involves assumptions and judgments as to credit risk, prepayment risk, liquidity risk, default rates, loss severity, payment speeds, collateral values and discount rate.
|
Acquired loans deemed impaired at acquisition are recorded in accordance with ASC 310-30. The excess of undiscounted cash flows expected at acquisition over the estimated fair value is referred to as the accretable discount. The difference between contractually required payments at acquisition and the undiscounted cash flows expected to be collected at acquisition is referred to as the non-accretable discount, which represents estimated future credit losses and other contractually required payments that the Company does not expect to collect. Subsequent decreases in expected cash flows are recognized as impairments through a charge to the provision for credit losses resulting in an increase in the allowance for loan losses. Subsequent improvements in expected cash flows result in a recovery of previously recorded allowance for loan losses or a reversal of a corresponding amount of the non-accretable discount, which the Company then reclassifies as an accretable discount that is recognized into interest income over the remaining life of the loans using the interest method.
For acquired loans that are not deemed impaired at acquisition, the difference between the acquisition date fair value and the outstanding balance represents the fair value adjustment for a loan, and includes both credit and interest rate considerations. Subsequent to the purchase date, the methods used to estimate the allowance for loan losses for the acquired non-impaired loans is consistent with the policy described below. However, for loans collectively evaluated for impairment, the Company compares the net realizable value of the loans to the carrying value. The carrying value represents the net of the loan's unpaid principal balance and the remaining purchase discount or premium that has yet to be accreted into interest income. When the carrying value exceeds the net realizable value, an allowance for loan losses is recognized. For loans individually evaluated for impairment, a provision is recorded when the required allowance exceeds any remaining discount on the loan.
|
·
|
Allowance for loan losses – The allowance for loan losses reflects management's best estimate of probable loan losses in the Company's loan portfolio. Determination of the allowance for loan losses is inherently subjective. It requires significant estimates, including the amounts and timing of expected future cash flows on impaired loans, appraisal values of underlying collateral for collateralized loans, and the amount of estimated losses on pools of homogeneous loans which is based on historical loss experience and consideration of current economic trends, all of which may be susceptible to significant change.
|
25
|
·
|
Investment securities – Investment securities can be classified as held-to-maturity, available-for-sale or trading. The appropriate classification is based partially on the Company's ability to hold the securities to maturity and largely on management's intentions with respect to either holding or selling the securities. The classification of investment securities is significant since it directly impacts the accounting for unrealized gains and losses on securities. Unrealized gains and losses on available-for-sale securities are recorded in accumulated other comprehensive income or loss, as a separate component of shareholders' equity, and do not affect earnings until realized. The fair values of investment securities are generally determined by reference to quoted market prices, where available. If quoted market prices are not available, fair values are based on quoted market prices of comparable instruments, or a discounted cash flow model using market estimates of interest rates and volatility. Investment securities with significant declines in fair value are evaluated to determine whether they should be considered other-than-temporarily impaired ("OTTI"). An unrealized loss is generally deemed to be other-than-temporary and a credit loss is deemed to exist if the present value of the expected future cash flows is less than the amortized cost basis of the debt security. The credit loss component of an other-than-temporary impairment write-down is recorded in current earnings, while the remaining portion of the impairment loss is recognized in other comprehensive income (loss), provided the Company does not intend to sell the underlying debt security, and it is not likely that the Company will be required to sell the debt security prior to recovery of the full value of its amortized cost basis. During 2013, the Company sold certain held-to-maturity securities and consequently did not use the held-to-maturity classification in 2014, 2015 or 2016.
|
|
·
|
Retirement benefits - The Company provides defined benefit pension benefits to eligible employees and retirees and post-retirement health and life insurance benefits to certain eligible retirees. The Company also provides deferred compensation and supplemental executive retirement plans for selected current and former employees. Expense under these plans is charged to current operations and consists of several components of net periodic (benefit) cost based on various actuarial assumptions regarding future experience under the plans, including, but not limited to, discount rate, rate of future compensation increases, mortality rates, future health care costs and the expected return on plan assets.
|
|
·
|
Provision for income taxes – The Company is subject to examinations from various taxing authorities. Such examinations may result in challenges to the tax return treatment applied by the Company to specific transactions. Management believes that the assumptions and judgments used to record tax-related assets or liabilities have been appropriate. Should tax laws change or the taxing authorities determine that management's assumptions were inappropriate, an adjustment may be required which could have a material effect on the Company's results of operations.
|
|
·
|
Intangible assets – As a result of acquisitions, the Company carries goodwill and identifiable intangible assets. Goodwill represents the cost of acquired companies in excess of the fair value of net assets at the acquisition date. Goodwill is evaluated at least annually, or when business conditions suggest impairment may have occurred. Should impairment occur, goodwill will be reduced to its carrying value through a charge to earnings. Core deposits and other identifiable intangible assets are amortized to expense over their estimated useful lives. The determination of whether or not impairment exists is based upon discounted cash flow modeling techniques that require management to make estimates regarding the amount and timing of expected future cash flows. It also requires them to select a discount rate that reflects the current return requirements of the market in relation to present risk-free interest rates, required equity market premiums, and company-specific performance and risk metrics, all of which are susceptible to change based on changes in economic and market conditions and other factors. Future events or changes in the estimates used to determine the carrying value of goodwill and identifiable intangible assets could have a material impact on the Company's results of operations.
|
A summary of the accounting policies used by management is disclosed in Note A, "Summary of Significant Accounting Policies", starting on page 59.
Supplemental Reporting of Non-GAAP Results of Operations
The Company consistently provides supplemental reporting of its results on a "net operating" or "tangible" basis, from which the amortization of core deposits and other intangible assets (and the related goodwill, core deposit intangible and other intangible asset balances, net of applicable deferred tax amounts), special charges and recoveries, acquisition expenses and deferred tax liabilities are excluded. Reconciliations of GAAP amounts with corresponding non-GAAP amounts are presented in Table 20.
Executive Summary
The Company's business philosophy is to operate as a community bank with local decision-making, principally in non-metropolitan markets, providing a broad array of banking and financial services to retail, commercial and municipal customers. The Company's banking subsidiary is Community Bank, N.A. (the "Bank" or "CBNA").
26
The Company's core operating objectives are: (i) grow the branch network, primarily through a disciplined acquisition strategy and certain selective de novo expansions, (ii) build profitable loan and deposit volume using both organic and acquisition strategies, (iii) increase the noninterest component of total revenue through development of banking-related fee income, growth in existing financial services business units, and the acquisition of additional financial services and banking businesses, and (iv) utilize technology to deliver customer-responsive products and services and to improve efficiencies.
Significant factors reviewed by management to evaluate achievement of the Company's operating objectives and its operating results and financial condition include, but are not limited to: net income and earnings per share; return on assets and equity; net interest margins; noninterest revenues; noninterest expenses; asset quality; loan and deposit growth; capital management; performance of individual banking and financial services units; performance of specific product lines and customers; liquidity and interest rate sensitivity; enhancements to customer products and services and their underlying performance characteristics; technology advancements; market share; peer comparisons; and the performance of recently acquired businesses.
The Company reported net income and earnings per share for the year ended December 31, 2016 that were 13.8% and 5.9%, respectively, above the prior year amounts. The increase in net income was due primarily to the earnings generated by the acquired Oneida businesses as well as organic growth. Contributing to the increase in net income was an increase in net interest income, higher noninterest income and lower acquisition-related expenses. Offsetting these items were an increase in the provision for loan loss, increased operating expenses, a higher effective tax rate and an increase in weighted average diluted shares outstanding, including the impact of the issuance of 2.38 million shares as part of the consideration for the Oneida acquisition.
The Company experienced year-over-year growth in average interest-earning assets, reflective of the addition of loans from the Oneida acquisition in December 2015, as well as solid organic loan growth. Average deposits increased in 2016 as compared to 2015, reflective of organic growth in core deposits and the impact of the Oneida transaction. Average external borrowings in 2016 decreased from 2015 reflective of the use of the net liquidity from the Oneida acquisition to reduce overnight borrowings.
Asset quality in 2016 remained stable and favorable in comparison to averages for peer financial organizations. As compared to the end of 2015, loan nonperforming ratios and the total loan net charge-off ratio at December 31, 2016 were improved while the total loan delinquency ratio was up slightly year-over-year.
Net Income and Profitability
Net income for 2016 was $103.8 million, an increase of $12.6 million, or 13.8%, from 2015's earnings. Earnings per share for 2016 was $2.32, up $0.13, or 5.9%, from 2015's results. The 2016 results included $1.7 million, or $0.03 per share, of acquisition expenses related to the Merchants and NRS acquisitions. The 2015 results included $7.0 million, or $0.11 per share, of acquisition expenses related to the Oneida acquisition that was completed in December of 2015.
Net income for 2015 was $91.2 million, a decrease of $0.1 million, or 0.1%, from 2014's earnings, while earnings per share for 2015 was $2.19, down $0.03, or 1.4%, from 2014's results. The 2015 results included the aforementioned acquisition expenses. The 2014 results included a $2.8 million, or $0.05 per share, litigation settlement charge.
Table 1: Condensed Income Statements
|
|
Years Ended December 31,
|
|||||||||||||||||||
|
(000's omitted, except per share data)
|
2016
|
2015
|
2014
|
2013
|
2012
|
|||||||||||||||
|
Net interest income
|
$
|
273,896
|
$
|
248,420
|
$
|
244,428
|
$
|
238,094
|
$
|
230,424
|
||||||||||
|
Provision for loan losses
|
8,076
|
6,447
|
7,178
|
7,992
|
9,108
|
|||||||||||||||
|
(Loss)/Gain on sales of investment securities, net
|
0
|
(4
|
)
|
0
|
80,768
|
291
|
||||||||||||||
|
Loss on debt extinguishments
|
0
|
0
|
0
|
87,336
|
0
|
|||||||||||||||
|
Noninterest income
|
155,625
|
123,303
|
119,020
|
108,748
|
98,955
|
|||||||||||||||
|
Acquisition expenses and litigation settlement
|
1,706
|
7,037
|
2,923
|
2,181
|
8,247
|
|||||||||||||||
|
Other noninterest expenses
|
265,142
|
226,018
|
223,657
|
219,074
|
203,510
|
|||||||||||||||
|
Income before taxes
|
154,597
|
132,217
|
129,690
|
111,027
|
108,805
|
|||||||||||||||
|
Income taxes
|
50,785
|
40,987
|
38,337
|
32,198
|
31,737
|
|||||||||||||||
|
Net income
|
$
|
103,812
|
$
|
91,230
|
$
|
91,353
|
$
|
78,829
|
$
|
77,068
|
||||||||||
|
|
||||||||||||||||||||
|
Diluted weighted average common shares outstanding
|
44,720
|
41,605
|
41,232
|
40,726
|
39,927
|
|||||||||||||||
|
Diluted earnings per share
|
$
|
2.32
|
$
|
2.19
|
$
|
2.22
|
$
|
1.94
|
$
|
1.93
|
||||||||||
27
The Company operates in three business segments: Banking, Employee Benefit Services and All Other. The banking segment provides a wide array of lending and depository-related products and services to individuals, businesses and municipal enterprises. In addition to these general intermediation services, the Banking segment provides treasury management solutions, capital financing products and payment processing services. Employee Benefit Services, consisting of BPAS and its subsidiaries,
provides the following on a national basis: employee benefit trust services; collective investment fund; retirement plan and VEBA/HRA and health savings account plan administration services; actuarial services; and healthcare consulting services. BPAS services approximately 3,800 retirement plans and more than 400,000 plan participants. In addition, BPAS employs nearly 350 professionals, and operates from 10 offices located in New York, New Jersey, Pennsylvania, Texas and Puerto Rico. The All Other segment is comprised of wealth management and insurance services. Wealth management activities include trust services provided by the personal trust unit of CBNA, investment products and services provided by CISI, OWM and The Carta Group, and asset advisory services provided by Nottingham. The insurance services activities include the offerings of personal and commercial property insurance and other risk management products and services provided by OneGroup. For additional financial information on the Company's segments, refer to Note U – Segment Information in the Notes to Consolidated Financial Statements.
The primary factors explaining 2016 earnings performance are discussed in the remaining sections of this document and are summarized as follows:
BANKING
|
·
|
Net interest income increased $25.4 million, or 10.2%. This was the result of a $668.4 million increase in average earning assets, partially offset by a two basis point decrease in the net interest margin. Average loans grew $593.8 million related to both the Oneida acquisition and organic growth. Also contributing to the growth in interest-earning assets was a $74.6 million increase in the average book value of investments, including cash equivalents, partially offset by a six basis-point decrease in the average yield on investments. Average interest-bearing deposits increased $671.7 million due to the Oneida acquisition and organic core deposit growth, partially offset by the continued trend of declining time deposit balances. Borrowing interest expense decreased as a result of a decrease in average balances of $241.9 million, or 47.1%, compared to the prior year, partially offset by a blended rate that was 64 basis points higher than the prior year.
|
|
·
|
The loan loss provision of $8.1 million increased $1.6 million, or 25.3%, from the prior year level. Net charge‑offs of $6.2 million were $0.1 million less than 2015. This resulted in an annual net charge-off ratio (net charge-offs / total average loans) of 0.13%, which was two basis points lower than the prior year. Nonperforming loans as a percentage of total loans and nonperforming assets as a percentage of loans and other real estate owned, each decreased two basis points compared to December 31, 2015 levels, and remain better than levels for the Company's peers. Additional information on trends and policy related to asset quality is provided in the asset quality section on pages 41 through 45.
|
|
·
|
Banking noninterest income for 2016 of $66.1 million increased by $8.4 million from 2015's level, primarily due to new deposit relationships from both acquired and organic sources, increased debit card-related revenues and $1.6 million in nonrecurring insurance-related gains, partially offset by the continuing trend of lower utilization of overdraft protection programs and other deposit-related services.
|
|
·
|
Total banking noninterest expenses, including acquisition expenses, increased $9.3 million, or 5.0%, in 2016 to $194.0 million, primarily reflective of a full year of expenses related to an expanded branch network and other acquired activities from the Oneida acquisition, and continued investment in risk management capabilities and technology and data processing costs. Excluding acquisition expenses, banking noninterest expenses increased $15.2 million, or 8.6%, again reflective of expanded operations resulting from the Oneida acquisition.
|
EMPLOYEE BENEFIT SERVICES
|
·
|
Employee benefit services noninterest income for 2016 of $48.3 million increased $1.5 million, or 3.2%, from the prior year level, benefiting from a combination of new client generation, activities acquired with the Oneida transaction and expanded service offerings.
|
|
·
|
Employee benefit services noninterest expenses for 2016 totaled $37.8 million. This represented an increase from 2015 of $2.0 million, or 5.7%, and was attributable to the continued buildout of resources to support an expanding revenue base.
|
ALL OTHER (WEALTH MANAGEMENT AND INSURANCE SERVICES)
|
·
|
Wealth management and insurance services noninterest income for 2016 was $43.7 million; an increase of $22.8 million from the prior year level. The increase was primarily due to the addition of the OneGroup and OWM businesses in conjunction with the Oneida acquisition.
|
|
·
|
Wealth management and insurance services noninterest expenses of $37.6 million increased $22.8 million from 2015 primarily due to the acquisition of OneGroup and OWM, and increased personnel costs associated with growth initiatives.
|
28
Selected Profitability and Other Measures
Return on average assets, return on average equity, dividend payout and equity to asset ratios for the years indicated are as follows:
Table 2: Selected Ratios
|
|
2016
|
2015
|
2014
|
|||||||||
|
Return on average assets
|
1.20
|
%
|
1.17
|
%
|
1.23
|
%
|
||||||
|
Return on average equity
|
8.57
|
%
|
8.87
|
%
|
9.65
|
%
|
||||||
|
Dividend payout ratio
|
53.7
|
%
|
55.5
|
%
|
51.6
|
%
|
||||||
|
Average equity to average assets
|
13.99
|
%
|
13.16
|
%
|
12.75
|
%
|
||||||
As displayed in Table 2, the return on average assets ratio increased while the return on average equity ratio decreased in 2016, as compared to 2015. The increase in return on average assets was the result of an increase in net income, reflective of the full year impact of the Oneida transaction and a decrease in acquisition expenses, which outpaced the increase in average assets. The decrease in the return on average equity ratio was the result of the aforementioned increase in net income being outpaced by the increase in average equity, due primarily to the full year impact of the issuance of common stock as consideration in the Oneida transaction, a higher average after tax investment market value adjustment and strong earnings retention. Both return ratios decreased in 2015 as compared to 2014. The decreases in return on average assets and return on average equity were the result of a decrease in net income, due primarily to acquisition charges related to the Oneida transaction, while both average assets and average equity increased.
The dividend payout ratio for 2016 decreased 1.8% from 2015 as net income increased 13.8% from 2015 while dividends declared increased 10.0%, a result of a 3.3% increase in the dividends declared per share in addition to an increase in the shares outstanding due to the issuance of shares as partial consideration in the Oneida transaction and the issuance of shares in connection with the administration of the Company's 401(k) plan and employee stock plan. The dividend payout ratio for 2015 increased 3.9% from 2014 as net income decreased slightly from 2014 while dividends declared increased 7.5%, as a result of a 5.2% increase in the dividends declared per share in addition to an increase in the shares outstanding due to the shares issued in conjunction with the employee stock plan and as consideration in the Oneida transaction.
The average equity to average assets ratio continued to increase as the growth in common shareholders' equity outpaced the growth in assets. During 2016, average equity increased at a rate of 17.8% while average assets increased at a rate of 10.8%, while in 2015 average equity rose 8.6% and average assets grew 5.3% in comparison to 2014.
Net Interest Income
Net interest income is the amount by which interest and fees on earning assets (loans, investments and cash equivalents) exceeds the cost of funds, which consists primarily of interest paid to the Company's depositors and interest on external borrowings. Net interest margin is the difference between the yield on interest earning assets and the cost of interest-bearing liabilities as a percentage of earning assets.
As disclosed in Table 3, net interest income (with nontaxable income converted to a fully tax-equivalent basis) totaled $283.9 million in 2016, an increase of $23.0 million, or 8.8%, from the prior year. The increase is a result of a $668.4 million, or 9.6%, increase in average interest-earning assets and a one basis point decrease in the average rate on interest-bearing liabilities, partially offset by a four basis point decline in the average yield on interest-earning assets and a $429.8 million increase in average interest-bearing liabilities. As reflected in Table 4, the favorable impact of the lower rate on interest-bearing liabilities ($0.8 million) and the increase in interest-earning assets ($25.8 million) were partially offset by a $2.7 million unfavorable impact from the decrease in the yield on interest-earning assets and the increase in interest-bearing liabilities ($0.9 million).
The 2016 net interest margin decreased two basis points to 3.71% from the 3.73% reported in 2015. The decrease was attributable to a four basis point decrease in the earning-asset yield, partially offset by a one basis point decrease in the cost of interest-bearing liabilities. The 4.34% yield on loans decreased eight basis points in 2016 as compared to 4.42% in 2015, due to new loan volume for certain products carrying lower yields than the loans maturing or being prepaid in the continued low rate environment. The yield on investments, including cash equivalents, decreased from 3.05% in 2015 to 2.99% in 2016. This is reflective of the purchase of lower-yielding securities at various times throughout the last 24 months, as well as the effect certain changes in state tax rates had on the fully tax-equivalent adjustment. The cost of interest-bearing liabilities was 0.20% during 2016 as compared to 0.21% for 2015. The decreased cost primarily reflects the shift of customer deposits from higher cost time and money market deposits into non-interest bearing and lower cost checking and savings.
29
The net interest margin in 2015 decreased 18 basis points to 3.73% from 3.91% reported in 2014. The decrease was attributable to a 20 basis point decrease in earning-asset yield, partially offset by a two basis point decrease in the cost of interest-bearing liabilities. The yield on loans decreased seven basis points in 2015 to 4.42% from 4.49% in 2014, due to new loan volume carrying lower yields in the continued low-rate environment than the loans maturing or being prepaid, a proportionally higher mix of shorter term adjustable rate business loans, as well as promotional rates and shorter blended maturity terms on new originations or fixed rate home equity loans. The yield on investments, including cash equivalents, decreased from 3.42% in 2014 to 3.05% in 2015. This is reflective of the purchase of lower-yielding Treasury securities at various times throughout the last 24 months, as well as the effect certain changes in state tax rates had on the fully tax-equivalent adjustment. The cost of interest-bearing liabilities was 0.21% during 2015 as compared to 0.23% for 2014. The decreased cost primarily reflects the larger proportion of funding being provided by lower-rate overnight borrowings. Additionally, the proportion of customer deposits in higher cost time and money market deposits declined 2.5 percentage points in 2015, while the percentage of deposits in non-interest bearing and lower cost checking and savings accounts correspondingly increased.
As shown in Table 3, total FTE-basis interest income increased by $23.1 million, or 8.5%, in 2016 in comparison to 2015. Table 4 indicates that a higher average earning-asset balance created $25.8 million of incremental interest income. As mentioned previously, this was partially offset by a lower average yield on earning assets that had a negative impact of $2.7 million. Average loans increased $593.8 million, or 13.8%, in 2016, a result of organic and acquired growth in all loan portfolios, with the Oneida acquisition accounting for $364.2 million of the total growth. FTE-basis loan interest income and fees increased $22.5 million, or 11.9%, in 2016 as compared to 2015, attributable to the higher average balances, partially offset by an eight basis point decrease in the loan yield.
Investment interest income (FTE basis) in 2016 was $0.6 million, or 0.7%, higher than the prior year as a result of a $74.6 million, or 2.8%, higher average book basis balance (including cash equivalents) for 2016 versus the prior year. This was partially offset by a six basis point decrease in the average investment yield from 3.05% to 2.99% including the impact of changes in state tax structures. During most of 2016, market interest rates continued to be low, and as a result, cash flows from higher rate maturing investments were reinvested at lower interest rates. The investments purchased during 2016 had a weighted average yield of 2.27% as compared to 2015 purchases which had a weighted average yield of 2.46%.
Total interest income in 2015 increased $0.3 million, or 0.1%, from 2014's level.
Table 4 indicates that the lower average yield on earning assets had a negative impact of $13.6 million. This was partially offset by a higher average earning-asset balance that created $13.9 million of incremental interest income. Average loans increased $131.3 million, or 3.2%, in 2015, a result of organic and acquired growth in all loan portfolios, with the Oneida acquisition accounting for $24.9 million of the total growth. FTE-basis loan interest income and fees increased $2.8 million, or 1.5%, in 2015 as compared to 2014, attributable to the higher average balances, partially offset by a seven basis point decrease in loan yields. On a FTE basis, investment interest income, including interest on cash equivalents, totaled $82.5 million in 2015, $2.5 million, or 2.9%, lower than the prior year as a result of a 37 basis point decrease in the average investment yield from 3.42% to 3.05% that includes the effect of changes in the state tax structures. Average investments for 2015, including cash equivalents, were $217.2 million higher than 2014, reflective of investment purchases made in the first half of the year in anticipation of liquidity to be received from the Oneida acquisition.
Total interest expense increased by $0.1 million, or 0.8%, to $11.3 million in 2016. As shown in Table 4, lower interest rates on interest-bearing liabilities resulted in a decrease in interest expense of $0.8 million, while higher deposit balances resulted in a $0.9 million increase in interest expense. Interest expense as a percentage of average earning assets for 2016 decreased one basis point to 0.15%. The rate on interest-bearing deposits decreased two basis points to 0.13% as rates have held relatively steady in all interest-bearing categories throughout 2016 and 2015, as well as the change in deposit mix to a lower proportion of time deposit products. The rate on external borrowings increased 64 basis points to 1.46% in 2016, a result of lower-rate overnight FHLB borrowings becoming a smaller proportion of this funding component. Total average funding balances (deposits and borrowings) in 2016 increased $635.6 million, or 9.5%. Average deposits increased $877.5 million, of which approximately $654.1 million was attributable to the Oneida acquisition, with the remaining $223.4 million attributable to organic deposit growth. Consistent with the Company's funding mix objective and customers' unwillingness to commit to less liquid instruments in the low rate environment, average core deposit balances increased $864.3 million to 89.3% of total average deposits compared to 88% in 2015, while time deposits increased at a slower rate of $13.2 million year-over-year representing 10.7% of total average deposits for 2016 compared to 12.0% in 2015. Average external borrowings decreased $241.9 million in 2016 as compared to the prior year, reflective of the pay down of overnight FHLB borrowings with liquidity from the Oneida acquisition and organic deposit growth.
30
Total interest expense decreased by $0.6 million to $11.2 million in 2015 as compared to 2014. As shown in Table 4, lower interest rates on interest-bearing liabilities resulted in decreasing interest expense by $1.0 million, while higher external borrowing balances accounted for $0.4 million more interest expense. Interest expense as a percentage of average earning assets for 2015 decreased two basis points to 0.16%. The rate on interest-bearing deposits decreased two basis points to 0.15% as rates have declined or held steady in all interest-bearing categories throughout 2015 and 2014, as well as the change in deposit mix to a lower proportion of time deposit products. The rate on external borrowings decreased seven basis points to 0.82% in 2015 primarily due to lower-rate FHLB overnight borrowings being a larger proportion of the balance. In 2015, total average funding increased $289.9 million or 4.6%. Average deposits increased $181.5 million, of which approximately $53.1 million was attributable to the Oneida acquisition, with the remaining $128.4 million attributable to organic deposit growth. Consistent with the Company's funding mix objective and customers' unwillingness to commit to less liquid instruments in the low rate environment, average core deposit balances increased $288.8 million, while average time deposits declined $107.3 million year-over-year. Average external borrowings increased $108.4 million in 2015 as compared to the prior year, reflective of the funding of the pre-investment of expected net liquidity from the Oneida acquisition.
The following table sets forth information related to average interest-earning assets and interest-bearing liabilities and their associated yields and rates for the years ended December 31, 2016, 2015 and 2014. Interest income and yields are on a fully tax-equivalent basis using marginal income tax rates of 38.2% in 2016, 38.3% in 2015 and 38.7% in 2014. Average balances are computed by totaling the daily ending balances in a period and dividing by the number of days in that period. Loan interest income and yields include loan fees. Average loan balances include nonaccrual loans and loans held for sale.
|
Year Ended December 31, 2016
|
Year Ended December 31, 2015
|
Year Ended December 31, 2014
|
||||||||||||||||||||||||||||||||||
|
(000's omitted except yields and rates)
|
Average Balance
|
Interest
|
Avg. Yield/Rate Paid
|
Average Balance
|
Interest
|
Avg. Yield/Rate Paid
|
Average Balance
|
Interest
|
Avg. Yield/Rate Paid
|
|||||||||||||||||||||||||||
|
Interest-earning assets:
|
||||||||||||||||||||||||||||||||||||
|
Cash equivalents
|
$
|
19,062
|
$
|
89
|
0.47
|
%
|
$
|
13,543
|
$
|
32
|
0.23
|
%
|
$
|
9,701
|
$
|
21
|
0.21
|
%
|
||||||||||||||||||
|
Taxable investment securities
(1)
|
2,177,589
|
56,113
|
2.58
|
%
|
2,071,095
|
53,282
|
2.57
|
%
|
1,834,430
|
52,268
|
2.85
|
%
|
||||||||||||||||||||||||
|
Nontaxable investment securities
(1)
|
579,986
|
26,924
|
4.64
|
%
|
617,418
|
29,205
|
4.73
|
%
|
640,737
|
32,737
|
5.11
|
%
|
||||||||||||||||||||||||
|
Loans (net of unearned discount)
(2)
|
4,881,905
|
212,022
|
4.34
|
%
|
4,288,091
|
189,507
|
4.42
|
%
|
4,156,840
|
186,727
|
4.49
|
%
|
||||||||||||||||||||||||
|
Total interest-earning assets
|
7,658,542
|
295,148
|
3.85
|
%
|
6,990,147
|
272,026
|
3.89
|
%
|
6,641,708
|
271,753
|
4.09
|
%
|
||||||||||||||||||||||||
|
Noninterest-earning assets
|
1,001,525
|
824,417
|
782,195
|
|||||||||||||||||||||||||||||||||
|
Total assets
|
$
|
8,660,067
|
$
|
7,814,564
|
$
|
7,423,903
|
||||||||||||||||||||||||||||||
|
Interest-bearing liabilities:
|
||||||||||||||||||||||||||||||||||||
|
Interest checking, savings and money
market deposits
|
$
|
4,712,212
|
4,121
|
0.09
|
%
|
$
|
4,053,761
|
3,598
|
0.09
|
%
|
$
|
3,867,818
|
3,614
|
0.09
|
%
|
|||||||||||||||||||||
|
Time deposits
|
750,944
|
3,204
|
0.43
|
%
|
737,734
|
3,373
|
0.46
|
%
|
845,035
|
4,576
|
0.54
|
%
|
||||||||||||||||||||||||
|
FHLB borrowings
|
169,769
|
1,017
|
0.60
|
%
|
411,694
|
1,694
|
0.41
|
%
|
303,295
|
1,125
|
0.37
|
%
|
||||||||||||||||||||||||
|
Subordinated debt held by unconsolidated
subsidiary trusts
|
102,158
|
2,949
|
2.89
|
%
|
102,133
|
2,537
|
2.48
|
%
|
102,116
|
2,477
|
2.43
|
%
|
||||||||||||||||||||||||
|
Total interest-bearing liabilities
|
5,735,083
|
11,291
|
0.20
|
%
|
5,305,322
|
11,202
|
0.21
|
%
|
5,118,264
|
11,792
|
0.23
|
%
|
||||||||||||||||||||||||
|
Noninterest-bearing liabilities:
|
||||||||||||||||||||||||||||||||||||
|
Noninterest checking deposits
|
1,558,548
|
1,352,683
|
1,249,807
|
|||||||||||||||||||||||||||||||||
|
Other liabilities
|
154,916
|
128,521
|
109,206
|
|||||||||||||||||||||||||||||||||
|
Shareholders' equity
|
1,211,520
|
1,028,038
|
946,626
|
|||||||||||||||||||||||||||||||||
|
Total liabilities and shareholders' equity
|
$
|
8,660,067
|
$
|
7,814,564
|
$
|
7,423,903
|
||||||||||||||||||||||||||||||
|
Net interest earnings
|
$
|
283,857
|
$
|
260,824
|
$
|
259,961
|
||||||||||||||||||||||||||||||
|
Net interest spread
|
3.65
|
%
|
3.68
|
%
|
3.86
|
%
|
||||||||||||||||||||||||||||||
|
Net interest margin on interest-earning
assets
|
3.71
|
%
|
3.73
|
%
|
3.91
|
%
|
||||||||||||||||||||||||||||||
|
Fully tax-equivalent adjustment
|
$
|
9,961
|
$
|
12,404
|
$
|
15,533
|
||||||||||||||||||||||||||||||
|
(1)
Averages for investment securities are based on historical cost and the yields do not give effect to changes in fair value that is reflected as a component of shareholders' equity and deferred taxes.
|
|
(2)
Includes nonaccrual loans. The impact of interest and fees not recognized on nonaccrual loans was immaterial.
|
31
As discussed above, the change in net interest income (fully tax-equivalent basis) may be analyzed by segregating the volume and rate components of the changes in interest income and interest expense for each underlying category.
Table 4: Rate/Volume
|
2016 Compared to 2015
|
2015 Compared to 2014
|
|||||||||||||||||||||||
|
Increase (Decrease) Due to Change in
(1)
|
Increase (Decrease) Due to Change in
(1)
|
|||||||||||||||||||||||
|
(000's omitted)
|
Volume
|
Rate
|
Net Change
|
Volume
|
Rate
|
Net Change
|
||||||||||||||||||
|
Interest earned on:
|
||||||||||||||||||||||||
|
Cash equivalents
|
$
|
17
|
$
|
40
|
$
|
57
|
$
|
9
|
$
|
2
|
$
|
11
|
||||||||||||
|
Taxable investment securities
|
2,745
|
86
|
2,831
|
6,369
|
(5,355
|
)
|
1,014
|
|||||||||||||||||
|
Nontaxable investment securities
|
(1,746
|
)
|
(535
|
)
|
(2,281
|
)
|
(1,162
|
)
|
(2,370
|
)
|
(3,532
|
)
|
||||||||||||
|
Loans (net of unearned discount)
|
25,840
|
(3,325
|
)
|
22,515
|
5,833
|
(3,053
|
)
|
2,780
|
||||||||||||||||
|
Total interest-earning assets
(2)
|
25,782
|
(2,660
|
)
|
23,122
|
13,897
|
(13,624
|
)
|
273
|
||||||||||||||||
|
Interest paid on:
|
||||||||||||||||||||||||
|
Interest checking, savings and money market deposits
|
577
|
(54
|
)
|
523
|
170
|
(186
|
)
|
(16
|
)
|
|||||||||||||||
|
Time deposits
|
59
|
(228
|
)
|
(169
|
)
|
(540
|
)
|
(663
|
)
|
(1,203
|
)
|
|||||||||||||
|
Short-term borrowings
|
(1,250
|
)
|
573
|
(677
|
)
|
436
|
133
|
569
|
||||||||||||||||
|
Long-term borrowings
|
1
|
411
|
412
|
0
|
60
|
60
|
||||||||||||||||||
|
Total interest-bearing liabilities
(2)
|
874
|
(785
|
)
|
89
|
420
|
(1,010
|
)
|
(590
|
)
|
|||||||||||||||
|
Net interest earnings
(2)
|
$
|
24,784
|
$
|
(1,751
|
)
|
$
|
23,033
|
$
|
13,302
|
$
|
(12,439
|
)
|
$
|
863
|
||||||||||
|
(1)
The change in interest due to both rate and volume has been allocated to volume and rate changes in proportion to the relationship of the absolute dollar amounts of change in each.
|
|
(2)
Changes due to volume and rate are computed from the respective changes in average balances
and rates of the totals; they are not a summation of the changes of the components.
|
Noninterest Income
The Company's sources of noninterest income are of four primary types: 1) general banking services related to loans, deposits and other core customer activities typically provided through the branch network and electronic banking channels (performed by CBNA); 2) employee benefit services (performed by BPAS); 3) wealth management services, comprised of trust services (performed by the trust unit within CBNA), investment products and services (performed by CISI, The Carta Group and OWM) and asset management services (performed by Nottingham); and 4) insurance products and services (performed by OneGroup). Additionally, the Company has periodic transactions, most often net gains or losses from the sale of investment securities and prepayment of debt instruments.
Table 5: Noninterest Income
|
|
Years Ended December 31,
|
|||||||||||
|
(000's omitted except ratios)
|
2016
|
2015
|
2014
|
|||||||||
|
Employee benefit services
|
$
|
46,628
|
$
|
45,388
|
$
|
42,580
|
||||||
|
Deposit service charges and fees
|
29,061
|
28,087
|
29,379
|
|||||||||
|
Electronic banking
|
25,781
|
22,263
|
21,156
|
|||||||||
|
Insurance services
|
23,149
|
3,352
|
1,450
|
|||||||||
|
Wealth management services
|
19,776
|
16,856
|
16,420
|
|||||||||
|
Other banking revenues
|
9,140
|
5,656
|
6,576
|
|||||||||
|
Mortgage banking
|
2,090
|
1,701
|
1,459
|
|||||||||
|
Subtotal
|
155,625
|
123,303
|
119,020
|
|||||||||
|
Loss on sales of investment securities, net
|
0
|
(4
|
)
|
0
|
||||||||
|
Total noninterest income
|
$
|
155,625
|
$
|
123,299
|
$
|
119,020
|
||||||
|
|
||||||||||||
|
Noninterest income/operating income (FTE basis)
(1)
|
35.4
|
%
|
32.1
|
%
|
31.4
|
%
|
||||||
|
(1)
For purposes of this ratio noninterest income excludes gains (losses) on sales of investment securities. Operating income is defined as net interest income on a fully-tax equivalent basis, plus noninterest income, excluding gains (losses) on sales of investment securities.
|
32
As displayed in Table 5, total noninterest income, excluding losses on securities sales, increased by $32.3 million, or 26.2%, to $155.6 million in 2016 as compared to 2015. The increase was comprised of growth in revenue from the Company's financial services businesses, driven primarily by the acquisition of OneGroup and OWM, increased debit card-related income, increased employee benefit service fees, increased deposit service fees and $1.6 million in nonrecurring insurance-related gains, partially offset by lower fees from account overdraft protection programs continuing the trend of lower utilization of overdraft protection programs and a decline in certain other deposit-related services. Noninterest income, excluding security losses increased by $4.3 million, or 3.6%, to $123.3 million in 2015 as compared to 2014, comprised of growth in revenue from the Company's financial services businesses and increased debit card-related income, partially offset by lower banking fees due to the continuing trend of lower utilization of overdraft protection programs and a decline in certain other deposit-related services.
Noninterest income as a percent of operating income (FTE basis) was 35.4% in 2016, up 3.3 percentage points from the prior year. The current year increase was due to the 26.2% increase in noninterest income mentioned above, while net interest income (FTE basis) increased at a slower pace of 8.8%. The increase in this ratio from 2014 to 2015 of 0.7 percentage points was driven by a 3.6% increase in noninterest income, primarily the result of solid organic growth in the financial services businesses and strong growth in debit card related income, while net interest income increased at a rate of 0.3%.
The largest portion of the Company's recurring noninterest income is the wide variety of fees earned from general banking services generally provided through the branch network and electronic banking channels, which totaled $64.0 million in 2016, an increase of $8.0 million, or 14.2%, from the prior year. The increase was driven by the addition of new deposit relationships from both acquired and organic sources, as well as increased debit card-related revenues and $1.6 million in nonrecurring insurance-related gains, partially offset by the continuing trend of lower utilization of overdraft protection programs and other deposit-related services. Fees from general banking services were $56.0 million in 2015, a decrease of $1.1 million, or 1.9%, from 2014. The decrease was driven by the continuing trend of lower utilization of overdraft protection programs and other deposit-related services as well as smaller annual dividends from retail insurance programs that more than offset the addition of new deposit relationships from both acquired and organic sources, as well as solid growth in debit card-related revenue. Electronic banking revenue grew $1.1 million due in large part to a continued concerted effort to increase the penetration and utilization of consumer debit and credit cards.
Mortgage banking income consists of realized gains or losses from the sale of residential mortgage loans and the origination of mortgage loan servicing rights, unrealized gains and losses on residential mortgage loans held for sale and related commitments, mortgage loan servicing fees, and other mortgage loan-related fee income earned on sold consumer mortgages. In 2016, mortgage banking revenue of $2.1 million increased $0.4 million from the revenue generated in 2015, which increased $0.2 million from 2014. Residential mortgage loans sold to investors, primarily the Fannie Mae, in 2016 totaled $45.9 million as compared to $35.5 million and $25.7 million during 2015 and 2014, respectively. Residential mortgage loans held for sale and recorded at fair value at December 31, 2016 and 2015 totaled $2.4 million and $0.9 million, respectively. Realization of the unrealized gains or losses on consumer mortgage loans held for sale and the related commitments, as well as future revenue generation from mortgage banking activities, will be dependent on market conditions and long-term interest rate trends.
As disclosed in Table 5, noninterest income from financial services (revenues from employee benefit services, wealth management services and insurance services) increased $24.0 million, or 36.5%, in 2016 to $89.6 million. In 2016, financial services revenue accounted for 58% of total noninterest income, as compared to 53% in 2015. Employee benefit services generated revenue of $46.6 million in 2016 that reflected growth of $1.2 million, or 2.7%, driven by a combination of new client generation, activities acquired with the Oneida transaction and expanded service offerings. Employee benefit services revenue of $45.4 million in 2015 was $2.8 million higher than 2014's results, primarily driven by a combination of new client generation and expanded service offerings.
Wealth management and insurance services revenues increased $22.7 million, or 112%, in 2016 primarily from the acquisition of OneGroup, which was the main driver of the $19.8 million increase in insurance-related revenues. CISI revenue increased $2.3 million with a full year of acquired OWM and Carta Group activities providing $2.8 million in additional revenue over the prior year. Nottingham revenue was consistent with the prior year, and personal trust revenue increased $0.6 million due primarily to trust relationships added through the Oneida acquisition. Wealth management and insurance services revenue increased $2.3 million, or 13.1%, in 2015 primarily from the acquisition of OneGroup in December 2015, which increased insurance-related revenues by $1.9 million and the acquisition of OWM and Carta Group, which increased wealth management related revenues by $0.6 million.
33
Assets under administration decreased $0.3 billion to $17.8 billion for the employee benefit services segment in 2016 as compared to 2015 due to outflows in response to broad market shifts in the fourth quarter of 2016. Assets under management increased $0.2 billion to $4.9 billion for the wealth management businesses at year end 2016 as compared to one year earlier due to the addition of new client assets. Assets under administration within the Company's employee benefit services segment decreased $0.1 billion to $18.1 billion at the end of 2015 from $18.2 billion at year-end 2014, primarily due to lower equity market valuations. Assets under management with the Company's wealth management services segment increased $0.9 billion to $4.7 billion at the end of 2015 from $3.8 billion at year-end 2014 due to the addition of OWM and new client assets.
In December 2015, the Company sold $221.1 million of investment securities that were part of the Oneida acquisition, realizing a nominal amount of loss. There were no sales of investment securities in 2016 or 2014.
Noninterest Expenses
As shown in Table 6, noninterest expenses of $266.8 million in 2016 were $33.8 million, or 14.5%, higher than 2015, primarily due to the expenses associated with operating an expanded branch network and other business activities acquired with the Oneida transaction, as well as non-recurring acquisition expenses related to the Oneida acquisition and the Company's pending Merchants transaction and recently completed NRS transactions. Noninterest expenses in 2015 increased $6.5 million, or 2.9%, from 2014 to $233.1 million and included non-recurring acquisition expenses as well as incremental operating expenses from the Oneida acquisition.
Operating expenses (excluding acquisition expenses, litigation settlement charges and amortization of intangible assets) as a percent of average assets for 2016 was 3.00%, an increase of 15 basis points from 2.85% in 2015 and five basis points higher than 2.95% in 2014. The increase in this ratio for 2016 was due to a 16.8% increase in operating expenses, primarily a result of a full year of expanded operations due to the Oneida acquisition, while average assets grew by 10.8% due to organic loan growth and the Oneida acquisition, reflecting the impact of the acquired Oneida financial services business that do not carry as high a level of earning assets as banking operations. The decrease in this ratio for 2015 was due to a 1.4% increase in operating expenses, primarily a result of expanded operations due to the Oneida acquisition in December 2015, while average assets grew by 5.3% due to organic loan growth, investment purchases, and the Oneida acquisition.
The efficiency ratio, a performance measurement tool widely used by banks, is defined by the Company as operating expenses (excluding acquisition expenses, litigation settlement charges and intangible amortization) divided by operating income (fully tax‑equivalent net interest income plus noninterest income, excluding net securities gains and losses and insurance-related recoveries). Lower ratios are correlated to higher operating efficiency. In 2016, the efficiency ratio was 1.3 percentage points higher than 2015 as the 16.8% increase in operating expenses, as defined above, grew at a faster pace than the 14.4% increase in operating income, comprised of an 8.8% increase in net interest income and a 26.2% increase in noninterest income. This ratio was also impacted by a higher proportion of business being generated by financial services due primarily to the Oneida acquisition, which by their nature carry higher efficiency ratios. The ratio for 2015 was equal to the 2014 ratio as the 1.4% increase in operating expenses, as defined above, was offset by a 1.4% increase in operating income.
Table 6: Noninterest Expenses
|
|
Years Ended December 31,
|
|||||||||||
|
(000's omitted)
|
2016
|
2015
|
2014
|
|||||||||
|
Salaries and employee benefits
|
$
|
151,647
|
$
|
126,356
|
$
|
123,077
|
||||||
|
Occupancy and equipment
|
30,078
|
27,593
|
27,948
|
|||||||||
|
Data processing and communications
|
34,501
|
30,430
|
29,294
|
|||||||||
|
Amortization of intangible assets
|
5,479
|
3,663
|
4,287
|
|||||||||
|
Legal and professional fees
|
8,455
|
6,813
|
7,247
|
|||||||||
|
Office supplies and postage
|
7,274
|
6,476
|
6,270
|
|||||||||
|
Business development and marketing
|
7,484
|
7,204
|
7,125
|
|||||||||
|
FDIC insurance premiums
|
3,671
|
3,962
|
3,899
|
|||||||||
|
Acquisition expenses and litigation settlement
|
1,706
|
7,037
|
2,923
|
|||||||||
|
Other
|
16,553
|
13,521
|
14,510
|
|||||||||
|
Total noninterest expenses
|
$
|
266,848
|
$
|
233,055
|
$
|
226,580
|
||||||
|
|
||||||||||||
|
Operating expenses
(1)
/average assets
|
3.00
|
%
|
2.85
|
%
|
2.95
|
%
|
||||||
|
Efficiency ratio
|
59.2
|
%
|
57.9
|
%
|
57.9
|
%
|
||||||
|
(1)
Operating expenses are total noninterest expenses excluding acquisition expenses, litigation settlement charges and amortization of intangible assets. See Table 20 for Reconciliation of GAAP to Non-GAAP Measures.
|
||||||||||||
34
Total salaries and employee benefits increased $25.3 million, or 20.0%, in 2016, due to the impact of annual merit increases and higher pension costs, as well as the full year impact of the addition of approximately 275 employees from the Oneida acquisition in December 2015. Salaries and employee benefits increased $3.3 million, or 2.7%, in 2015, due to the impact of annual merit increases as well as the aforementioned addition of employees from the Oneida acquisition in December and higher pension costs, partially offset by lower incentive payments in 2015 based on the achievement of the Company's annual business objectives. Total full-time equivalent staff at the end of 2016 was 2,262 compared to 2,182 at December 31, 2015 and 1,945 at the end of 2014.
Retirement plan expense in 2016 increased $1.5 million due to increased participation in the Company's 401(k) and defined benefit pension plans primarily as a result of the Oneida acquisition. Last year's retirement plan expense increased $1.8 million from 2014's level due to changes in actuarial assumptions, including a decrease in the discount rate from 5.0% to 4.5%, and increased participation in the Company's 401(k) Plan. The three assumptions that have the largest impact on the calculation of annual pension expense are the discount rate utilized, the rate applied to future compensation increases and the expected rate of return on plan assets. See Note K to the financial statements for further information about the pension plan.
Total non-personnel noninterest expenses, excluding one-time acquisition expenses, and litigation settlement charges, increased $13.8 million, or 13.9%, in 2016, mostly reflective of the additional costs associated with the acquired Oneida business activities. Increases in occupancy and equipment, data processing and communications, amortization of intangible assets, legal and professional fees, office supplies and postage, business development and marketing and other expenses, all primarily a result of the aforementioned additional costs associated with acquired Oneida business activities, were only partially offset by a decrease in FDIC insurance premiums resulting from a change in the structure of the FDIC assessment rate schedule in the third quarter of 2016. Total non-personnel noninterest expenses, excluding one-time acquisition expenses, and litigation settlement charges, decreased $0.9 million, or 0.9%, in 2015 as decreases in occupancy and equipment, amortization of intangible assets, legal and professional fees and other expenses were only partially offset by increases in data processing and communications and business development and marketing. Excluding expenses related to the retail branches acquired from Oneida, non-personnel noninterest expenses as defined above declined $1.6 million as occupancy and equipment decreased $0.5 million, amortization of intangible assets decreased $0.9 million, legal and professional fees decreased $0.4 million and other expenses declined $0.8 million, partially offset by an increase in data processing and communications.
Acquisition expenses for 2016 totaled $1.7 million, including $0.3 million associated with the Oneida acquisition, and $0.9 million and $0.5 million associated with the Company's pending Merchants transaction and recently completed NRS acquisition, respectively. Acquisition expenses for 2015 totaled $7.0 million and were associated with the Oneida transaction. Acquisition expenses and litigation settlement charges totaled $2.9 million in 2014 comprised of $0.1 million of acquisition expenses related to the EBS-RMSCO acquisition and a $2.8 million litigation settlement charge pertaining to a class action lawsuit involving the sufficiency of consumer notice requirements for certain of the Company's collateral recovery activities. The Company contested the allegations and asserted affirmative defenses to the claims, however, the settlement the Company was able to achieve was, in its judgment, a superior outcome for the shareholders when measured against the risks and resources required for litigation.
The Company continually evaluates all aspects of its operating expense structure and is diligent about identifying opportunities to improve operating efficiencies. The Company divested itself of one branch location in 2016 and consolidated six of its branch offices during the second half of 2014. This realignment reduced market overlap, further strengthened its branch network, and reflects management's focus on achieving long-term performance improvements through proactive, strategic decision making.
Income Taxes
The Company estimates its income tax expense based on the amount it expects to owe the respective taxing authorities, plus the impact of deferred tax items. Taxes are discussed in more detail in Note I of the Consolidated Financial Statements beginning on page 77. Accrued taxes represent the net estimated amount due or to be received from taxing authorities. In estimating accrued taxes, management assesses the relative merits and risks of the appropriate tax treatment of transactions, taking into account statutory, judicial and regulatory guidance in the context of the Company's tax position. If the final resolution of taxes payable differs from its estimates due to regulatory determination or legislative or judicial actions, adjustments to tax expense may be required.
The effective tax rate for 2016 was 32.8%, compared to 31.0% in 2015 and 29.6% in 2014, reflective of higher proportional levels of income being generated from fully taxable sources and certain legislated changes to state tax rates and structures.
35
Shareholders' Equity
Shareholders' equity ended 2016 at $1.20 billion, up $57.5 million, or 5.0%, from one year earlier. This increase reflects net income of $103.8 million, $10.6 million from the issuance of shares through employee stock plan, $8.9 million for treasury stock issued to the Company's 401(k) plan and $4.8 million from stock-based compensation. These increases were partially offset by common stock dividends declared of $55.7 million, an $11.4 million decrease in accumulated other comprehensive income, and treasury stock purchases of $3.5 million. The change in other comprehensive income was comprised of a $14.7 million decrease due to changes in the unrealized gains and losses in the Company's available-for-sale investment portfolio, due principally to the rise in long-term interest rates at the end of 2016, partially offset by a positive $3.3 million adjustment to the funded status of the Company's employee retirement plans. Excluding accumulated other comprehensive income in both 2016 and 2015, shareholders' equity rose by $68.8 million, or 6.1%. Shares outstanding increased by 0.7 million during the year due to share issuances under the employee stock plan and to the Company's 401(k) plan.
Shareholders' equity ended 2015 at $1.14 billion, up $152.7 million, or 15.5%, from one year earlier. This increase reflects $102.2 million related to stock issued in connection with the Oneida acquisition, net income of $91.2 million, $9.8 million from the issuance of shares through employee stock plans, $16.6 million for treasury stock issued to the Company's 401(k) benefit plan, and $4.2 million from stock-based compensation. These increases were partially offset by common stock dividends declared of $50.6 million, an $11.5 million decrease in accumulated other comprehensive income, and treasury stock purchases of $9.1 million. The change in other comprehensive income was comprised of a $6.9 million decrease due to changes in the unrealized gains and losses in the Company's available-for-sale investment portfolio, due principally to the rise in long-term interest rates at the end of 2015, as well as a negative $4.6 million adjustment to the funded status of the Company's employee retirement plans. Excluding accumulated other comprehensive income in both 2015 and 2014, shareholders' equity rose by $164.2 million, or 17.2%. Shares outstanding increased by 3.0 million during the year as 2.4 million were issued in conjunction with the Oneida acquisition and 0.9 million were added through employee stock plans, partially offset by 0.3 million that were repurchased as treasury shares.
The Company's ratio of ending Tier 1 capital to adjusted quarterly average assets (or Tier 1 leverage ratio), the primary measure for which regulators have established a 5% minimum for an institution to be considered "well-capitalized," increased 23 basis points to end the year at 10.55%. This was the result of an 8.8% increase in Tier 1 capital, while fourth quarter average adjusted net assets (excludes investment market value adjustment, and a portion of intangible assets net of related deferred tax liabilities) increased at a slower 6.4% rate. For additional financial information on the Company's regulatory capital, refer to Note P – Regulatory Matters in the Notes to Consolidated Financial Statements. The tangible equity-to-tangible assets ratio (a non-GAAP measure) was 9.24% at the end of 2016 versus 8.59% one year earlier (See Table 20 for Reconciliation of GAAP to Non-GAAP Measures). The increase was due to tangible common shareholders' equity increasing at a faster pace than tangible assets, primarily as a result of capital growth through net income generation and retention. The Company manages organic and acquired growth in a manner that enables it to continue to maintain and grow its capital base and maintain its ability to take advantage of future strategic growth opportunities.
Cash dividends declared on common stock in 2016 of $55.7 million represented an increase of 10.0% over the prior year. This growth was a result of the increase in outstanding shares as noted above and a $0.04 increase in dividends per share for the year. Dividends per share for 2016 of $1.26 represents a 3.3% increase from $1.22 in 2015, a result of quarterly dividends per share increasing from $0.30 to $0.31 (a 3.3% increase) during the third quarter of 2015 and from $0.31 to $0.32 (a 3.2% increase) in the third quarter of 2016. The 2016 increase in quarterly dividends marked the 24
rd
consecutive year of dividend increases for the Company. The dividend payout ratio for this year was 53.7% compared to 55.5% in 2015, and 51.6% in 2014. The dividend payout ratio decreased during 2016 because net income increased 13.8% from 2015 while dividends declared increased 10.0%. The payout ratio increased during 2015 because dividends declared increased 7.5% while net income decreased 0.1%.
Liquidity
Liquidity risk is a measure of the Company's ability to raise cash when needed at a reasonable cost and minimize any loss. The Bank maintains appropriate liquidity levels in both normal operating environments as well as stressed environments. The Company must be capable of meeting all obligations to its customers at any time and, therefore, the active management of its liquidity position remains an important management objective. The Bank has appointed the Asset Liability Committee ("ALCO") to manage liquidity risk using policy guidelines and limits on indicators of potential liquidity risk. The indicators are monitored using a scorecard with three risk level limits. These risk indicators measure core liquidity and funding needs, capital at risk and change in available funding sources. The risk indicators are monitored using such statistics as the core basic surplus ratio, unencumbered securities to average assets, free loan collateral to average assets, loans to deposits, deposits to total funding and borrowings to total funding ratios.
36
Given the uncertain nature of our customers' demands as well as the Company's desire to take advantage of earnings enhancement opportunities, the Company must have adequate sources of on- and off-balance sheet funds available that can be utilized in time of need. Accordingly, in addition to the liquidity provided by balance sheet cash flows, liquidity must be supplemented with additional sources such as credit lines from correspondent banks and borrowings from the FHLB and the Federal Reserve Bank of New York ("Federal Reserve"). Other funding alternatives may also be appropriate from time to time, including wholesale and retail repurchase agreements, large certificates of deposit and the brokered CD market. The primary source of non-deposit funds is FHLB overnight advances, of which $146.2 million was outstanding at December 31, 2016.
The Bank's primary sources of liquidity are its liquid assets, as well as unencumbered securities that can be used to collateralize additional funding. At December 31, 2016, the Bank had $173.9 million of cash and cash equivalents of which $24.2 million are interest-earning deposits held at the Federal Reserve, FHLB and other correspondent banks. The Bank also had $1.2 billion in unused FHLB borrowing capacity based on the Company's quarter-end collateral levels. Additionally, the Company has $1.2 billion of unencumbered securities that could be pledged at the FHLB or Federal Reserve to obtain additional funding. There is $25 million available in unsecured lines of credit with other correspondent banks at year end.
The Company's primary approach to measuring short-term liquidity is known as the Basic Surplus/Deficit model. It is used to calculate liquidity over two time periods: first, the amount of cash that could be made available within 30 days (calculated as liquid assets less short-term liabilities as a percentage of average assets); and second, a projection of subsequent cash availability over an additional 60 days. As of December 31, 2016, this ratio was 13.4% for 30-days and 13.3% for 90-days, excluding the Company's capacity to borrow additional funds from the FHLB and other sources. There is a sufficient amount of liquidity given the Company's internal policy requirement of 7.5%.
A sources and uses statement is used by the Company to measure intermediate liquidity risk over the next twelve months. As of December 31, 2016, there is more than enough liquidity available during the next year to cover projected cash outflows. In addition, stress tests on the cash flows are performed in various scenarios ranging from high probability events with a low impact on the liquidity position to low probability events with a high impact on the liquidity position. The results of the stress tests as of December 31, 2016 indicate the Bank has sufficient sources of funds for the next year in all simulated stressed scenarios.
To measure longer-term liquidity, a baseline projection of loan and deposit growth for five years is made to reflect how liquidity levels could change over time. This five-year measure reflects ample liquidity for loan and other asset growth over the next five years.
Though remote, the possibility of a funding crisis exists at all financial institutions. Accordingly, management has addressed this issue by formulating a Liquidity Contingency Plan, which has been reviewed and approved by both the Company's Board of Directors and the Company's ALCO. The plan addresses the actions that the Company would take in response to both a short-term and long-term funding crisis.
A short-term funding crisis would most likely result from a shock to the financial system, either internal or external, which disrupts orderly short-term funding operations. Such a crisis would likely be temporary in nature and would not involve a change in credit ratings. A long-term funding crisis would most likely be the result of drastic credit deterioration at the Company. Management believes that both potential circumstances have been fully addressed through detailed action plans and the establishment of trigger points for monitoring such events.
37
Intangible Assets
The changes in intangible assets by reporting segment for the year ended December 31, 2016 are summarized as follows:
Table 7: Intangible Assets
|
(000's omitted)
|
Balance at December 31, 2015
|
Additions
|
Amortization
|
Impairment
|
Balance at December 31, 2016
|
|||||||||||||||
|
Banking Segment
|
||||||||||||||||||||
|
Goodwill
|
$
|
439,052
|
$
|
1,818
|
$
|
0
|
$
|
0
|
$
|
440,870
|
||||||||||
|
Core deposit intangibles
|
9,789
|
0
|
2,682
|
0
|
7,107
|
|||||||||||||||
|
Total Banking Segment
|
448,841
|
1,818
|
2,682
|
0
|
447,977
|
|||||||||||||||
|
Employee Benefit Services Segment
|
||||||||||||||||||||
|
Goodwill
|
8,019
|
0
|
0
|
0
|
8,019
|
|||||||||||||||
|
Other intangibles
|
1,086
|
0
|
420
|
0
|
666
|
|||||||||||||||
|
Total Employee Benefit Services Segment
|
9,105
|
0
|
420
|
0
|
8,685
|
|||||||||||||||
|
All Other Segment
|
||||||||||||||||||||
|
Goodwill
|
16,181
|
72
|
0
|
0
|
16,253
|
|||||||||||||||
|
Other intangibles
|
10,019
|
287
|
2,377
|
0
|
7,929
|
|||||||||||||||
|
Total All Other Segment
|
26,200
|
359
|
2,377
|
0
|
24,182
|
|||||||||||||||
|
Total
|
$
|
484,146
|
$
|
2,177
|
$
|
5,479
|
$
|
0
|
$
|
480,844
|
||||||||||
Intangible assets at the end of 2016 totaled $480.8 million, a decrease of $3.3 million from the prior year due to $5.5 million of amortization during the year, partially offset by an additional $1.6 million of intangible assets recorded in the first quarter of 2016 arising from adjustments made to fair value estimates for the Oneida acquisition and the purchase of other intangibles amounting to $0.6 million. Intangible assets consist of goodwill and the calculated value of core deposits and customer relationships that arise from acquisitions. Goodwill represents the excess cost of an acquisition over the fair value of the net assets acquired. Goodwill at December 31, 2016 totaled $465.1 million, comprised of $440.9 million related to banking acquisitions and $24.2 million arising from the acquisition of financial services businesses. Goodwill is subject to periodic impairment analysis to determine whether the carrying value of the identified businesses exceeds their fair value, which would necessitate a write-down of goodwill. The Company completed its goodwill impairment analyses during the first quarters of 2016 and 2015 and no adjustments were necessary for the banking or financial services businesses. The impairment analyses were based upon discounted cash flow modeling techniques that require management to make estimates regarding the amount and timing of expected future cash flows. It also requires the selection of discount rates that reflect the current return characteristics of the market in relation to present risk-free interest rates, estimated equity market premiums and company-specific performance and risk indicators. Management believes that there is a low probability of future impairment with regard to the goodwill associated with its whole-bank, branch and financial services business acquisitions.
Core deposit intangibles represent the value of acquired non-time deposits in excess of funding that could have been obtained in the capital markets. Core deposit intangibles are amortized on either an accelerated or straight-line basis over periods ranging from eight to twenty years. The recognition of customer relationship intangibles was determined based on a methodology that calculates the present value of the projected future net income derived from the acquired customer base. These customer relationship intangibles are being amortized on an accelerated basis over periods ranging from seven to twelve years.
38
Loans
The Company's loans outstanding, by type, as of December 31 are as follows:
Table 8: Loans Outstanding
|
(000's omitted)
|
2016
|
2015
|
2014
|
2013
|
2012
|
|||||||||||||||
|
Consumer mortgage
|
$
|
1,819,701
|
$
|
1,769,754
|
$
|
1,613,384
|
$
|
1,582,058
|
$
|
1,448,415
|
||||||||||
|
Business lending
|
1,490,076
|
1,497,271
|
1,262,484
|
1,260,364
|
1,233,944
|
|||||||||||||||
|
Consumer indirect
|
1,044,972
|
935,760
|
833,968
|
740,002
|
647,518
|
|||||||||||||||
|
Consumer direct
|
191,815
|
195,076
|
184,028
|
180,139
|
171,474
|
|||||||||||||||
|
Home equity
|
401,998
|
403,514
|
342,342
|
346,520
|
364,225
|
|||||||||||||||
|
Gross loans
|
4,948,562
|
4,801,375
|
4,236,206
|
4,109,083
|
3,865,576
|
|||||||||||||||
|
Allowance for loan losses
|
(47,233
|
)
|
(45,401
|
)
|
(45,341
|
)
|
(44,319
|
)
|
(42,888
|
)
|
||||||||||
|
Loans, net of allowance for loan losses
|
$
|
4,901,329
|
$
|
4,755,974
|
$
|
4,190,865
|
$
|
4,064,764
|
$
|
3,822,688
|
||||||||||
|
Daily average of total gross loans
|
$
|
4,881,905
|
$
|
4,288,091
|
$
|
4,156,840
|
$
|
3,954,515
|
$
|
3,628,006
|
||||||||||
As disclosed in Table 8 above, gross loans outstanding of $4.9 billion as of December 31, 2016 increased $147.2 million, or 3.1%, compared to December 31, 2015 reflecting organic growth in the consumer mortgage and consumer indirect portfolios attributable to the low interest rate environment and continued business development efforts, partially offset by decreases in the business lending, the consumer direct and home equity portfolios. Gross loans outstanding of $4.8 billion as of December 31, 2015 increased $565.2 million, or 13.3%, compared to December 31, 2014 as a result of organic and acquired growth in all of the lending portfolios. Excluding loans acquired from Oneida, loans increased $172.5 million, or 4.1%, driven by improvement in customer demand, the continued low interest rate environment and proactive business development efforts.
The compounded annual growth rate ("CAGR") for the Company's total loan portfolio between 2011 and 2016 was 7.4%, with approximately 60% of the total growth for the period attributable to organic growth and 40% attributable to acquired balances. The greatest overall expansion occurred in consumer installment loans, which grew at an 11.9% CAGR. The consumer mortgage portfolio grew at a compounded annual growth rate of 8.4% from 2011 to 2016. The business lending segment grew at a CAGR of 4.0% driven in most part by acquisitions during the five year period. The home equity lending segment grew at a compounded annual growth rate of 4.4% from 2011 to 2016, including the impact from acquisitions.
The weighting of the components of the Company's loan portfolio enables it to be highly diversified. Approximately 70% of loans outstanding at the end of 2016 were made to consumers borrowing on an installment, line of credit or residential mortgage loan basis. The business lending portfolio is also broadly diversified by industry type as demonstrated by the following distributions at year-end 2016: commercial real estate (24%), restaurant & lodging (13%), healthcare (11%), general services (9%), retail trade (8%), agriculture (7%), manufacturing (7%), construction (5%), wholesale trade (5%) and motor vehicle and parts dealers (5%). A variety of other industries with less than a 3% share of the total portfolio comprise the remaining 6%.
The consumer mortgage loans include no exposure to Alt-A or other higher-risk mortgage products and are comprised of fixed (96%) and adjustable rate (4%) residential lending. Volume in this portion of the Company's loan portfolio has been strong over the last few years due to historically low long-term interest rates and comparatively stable real estate valuations in the Company's primary markets. Consumer mortgages increased $49.9 million, or 2.8%, in 2016 and does not include $45.9 million of longer-term, fixed-rate residential mortgages that Company originated and sold, principally to Fannie Mae. Consumer mortgages increased $156.4 million, or 9.7%, in 2015 and does not include $35.5 million of longer-term, fixed-rate residential mortgages that Company originated and sold, principally to Fannie Mae. Excluding loans acquired in the Oneida transaction, the consumer mortgage portfolio grew $25.8 million, or 1.6% in 2015. The Company's solid performance is a reflection of the high quality profile of its portfolio and its ability to successfully meet customer needs. Market interest rates, expected duration, and the Company's overall interest rate sensitivity profile continue to be the most significant factors in determining whether the Company chooses to retain versus sell and service portions of its new consumer mortgage generation.
39
The combined total of general-purpose business lending to commercial, industrial, non-profit and municipal customers, mortgages on commercial property and dealer floor plan financing is characterized as the Company's business lending activity. The business lending portfolio decreased $7.2 million, or 0.5%, in 2016 as contractual and unscheduled principal reductions outpaced new loan volume. The portfolio increased $234.8 million, or 18.6%, in 2015. Excluding loans from the Oneida acquisition, the portfolio grew $83.7 million, or 6.6% in 2015. Highly competitive conditions continue to prevail in the small and middle market commercial segments in which the Company primarily operates. The Company maintains its commitment to generating growth in its business portfolio in a manner that adheres to its twin goals of maintaining strong asset quality and producing profitable margins. The Company continues to invest in additional personnel, technology, and business development resources to further strengthen its capabilities in this important product category.
The following table shows the maturities and type of interest rates for business and construction loans as of December 31, 2016:
Table 9: Maturity Distribution of Business and Construction Loans
(1)
|
(000's omitted)
|
Maturing in One Year or Less
|
Maturing After One but Within Five Years
|
Maturing After Five Years
|
Total
|
||||||||||||
|
Commercial, financial and agricultural
|
$
|
202,930
|
$
|
430,374
|
$
|
825,332
|
$
|
1,458,636
|
||||||||
|
Real estate – construction
|
36,556
|
0
|
0
|
36,556
|
||||||||||||
|
Total
|
$
|
239,486
|
$
|
430,374
|
$
|
825,332
|
$
|
1,495,192
|
||||||||
|
Fixed interest rates
|
$
|
47,637
|
$
|
194,156
|
$
|
138,455
|
$
|
380,248
|
||||||||
|
Floating or adjustable interest rates
|
191,849
|
236,218
|
686,877
|
1,114,944
|
||||||||||||
|
Total
|
$
|
239,486
|
$
|
430,374
|
$
|
825,332
|
$
|
1,495,192
|
||||||||
| (1) Scheduled repayments are reported in the maturity category in which the payment is due. |
Consumer installment loans, both those originated directly (such as personal installment loans and lines of credit), and indirectly (originated predominantly in automobile, marine and recreational vehicle dealerships), increased $106.0 million, or 9.4%, from one year ago. In 2015 the portfolio increased $112.8 million, or 11.1%, from the year earlier period. Excluding loans from the Oneida acquisition, the portfolio increased $54.3 million, or 5.3% in 2015. The volume of new and used vehicle sales to upper-tier credit profile customers in the Company's primary markets has improved in recent years. The Company is focused on maintaining the solid profitability produced by its in-market and contiguous market indirect portfolio, while continuing to pursue its disciplined, long-term approach to expanding its dealer network. However, the increasingly competitive nature of this market has resulted in aggressive pricing and incentives that have caused some compression of indirect loan spreads, particularly in the automobile segment.
Home equity loans decreased $1.5 million, or 0.4%, from the end of 2015, due in part to home equity loans being paid off or down as part of the heightened level of consumer mortgage refinancing that in some cases are used to pay down or pay off home equity balances in the continued low rate environment. Home equity loans increased $61.2 million, or 17.9%, from the end of 2014, due primarily to the $52.5 million of loans acquired from Oneida. Excluding those loans, the portfolio increased $8.7 million, or 2.5%, as mortgage refinance activity slowed and historically low rate offerings stimulated demand for the home equity product.
40
Asset Quality
The following table presents information regarding nonperforming assets as of December 31:
Table 10: Nonperforming Assets
|
(000's omitted)
|
2016
|
2015
|
2014
|
2013
|
2012
|
|||||||||||||||
|
Nonaccrual loans
|
||||||||||||||||||||
|
Consumer mortgage
|
$
|
13,684
|
$
|
12,790
|
$
|
15,323
|
$
|
12,560
|
$
|
11,286
|
||||||||||
|
Business lending
|
5,063
|
6,567
|
2,780
|
4,555
|
13,691
|
|||||||||||||||
|
Consumer indirect
|
0
|
0
|
10
|
14
|
0
|
|||||||||||||||
|
Consumer direct
|
0
|
15
|
20
|
4
|
8
|
|||||||||||||||
|
Home equity
|
1,872
|
2,356
|
2,598
|
2,340
|
1,375
|
|||||||||||||||
|
Total nonaccrual loans
|
20,619
|
21,728
|
20,731
|
19,473
|
26,360
|
|||||||||||||||
|
Accruing loans 90+ days delinquent
|
||||||||||||||||||||
|
Consumer mortgage
|
1,385
|
1,805
|
2,397
|
1,338
|
1,818
|
|||||||||||||||
|
Business lending
|
145
|
126
|
350
|
164
|
247
|
|||||||||||||||
|
Consumer indirect
|
169
|
102
|
82
|
755
|
73
|
|||||||||||||||
|
Consumer direct
|
58
|
51
|
36
|
117
|
71
|
|||||||||||||||
|
Home equity
|
1,319
|
111
|
241
|
181
|
539
|
|||||||||||||||
|
Total accruing loans 90+ days delinquent
|
3,076
|
2,195
|
3,106
|
2,555
|
2,748
|
|||||||||||||||
|
Nonperforming loans
|
||||||||||||||||||||
|
Consumer mortgage
|
15,069
|
14,595
|
17,720
|
13,898
|
13,104
|
|||||||||||||||
|
Business lending
|
5,208
|
6,693
|
3,130
|
4,719
|
13,938
|
|||||||||||||||
|
Consumer indirect
|
169
|
102
|
92
|
769
|
73
|
|||||||||||||||
|
Consumer direct
|
58
|
66
|
56
|
121
|
79
|
|||||||||||||||
|
Home equity
|
3,191
|
2,467
|
2,839
|
2,521
|
1,914
|
|||||||||||||||
|
Total nonperforming loans
|
23,695
|
23,923
|
23,837
|
22,028
|
29,108
|
|||||||||||||||
|
Other real estate (OREO)
|
1,966
|
2,088
|
1,855
|
5,060
|
4,788
|
|||||||||||||||
|
Total nonperforming assets
|
$
|
25,661
|
$
|
26,011
|
$
|
25,692
|
$
|
27,088
|
$
|
33,896
|
||||||||||
|
|
||||||||||||||||||||
|
Nonperforming loans / total loans
|
0.48
|
%
|
0.50
|
%
|
0.56
|
%
|
0.54
|
%
|
0.75
|
%
|
||||||||||
|
Legacy nonperforming loans / legacy total loans
(1)
|
0.42
|
%
|
0.49
|
%
|
0.52
|
%
|
0.49
|
%
|
0.71
|
%
|
||||||||||
|
Nonperforming assets / total loans and other real estate
|
0.52
|
%
|
0.54
|
%
|
0.61
|
%
|
0.66
|
%
|
0.88
|
%
|
||||||||||
|
Delinquent loans (30 days old to nonaccruing) to total loans
|
1.19
|
%
|
1.16
|
%
|
1.46
|
%
|
1.49
|
%
|
1.92
|
%
|
||||||||||
|
Loan loss provision to net charge-offs
|
129
|
%
|
101
|
%
|
117
|
%
|
122
|
%
|
108
|
%
|
||||||||||
|
Legacy loan loss provision to net charge-offs
(1)
|
130
|
%
|
86
|
%
|
125
|
%
|
134
|
%
|
116
|
%
|
||||||||||
|
(1)
Legacy loans exclude loans acquired after January 1, 2009.
|
||||||||||||||||||||
The Company places a loan on nonaccrual status when the loan becomes 90 days past due, or sooner if management concludes collection of interest is doubtful, except when, in the opinion of management, it is well-collateralized and in the process of collection. As shown in Table 10 above, nonperforming loans, defined as nonaccruing loans and accruing loans 90 days or more past due, ended 2016 at $23.7 million, a decrease of $0.2 million from one year earlier. The ratio of nonperforming loans to total loans at December 31, 2016 decreased two basis points from the prior year to 0.48%. Excluding nonperforming acquired loans, the ratio of nonperforming loans to total loans at the end of 2016 was 0.42%, a decrease of seven basis points from the prior year. The ratio of nonperforming assets (which includes other real estate owned, or "OREO", in addition to nonperforming loans) to total loans plus OREO decreased to 0.52% at year-end 2016, down two basis points from one year earlier. The Company's success at keeping these ratios at favorable levels throughout varying economic conditions was the result of continued focus on maintaining strict underwriting standards, early problem recognition, and effective collection and recovery efforts. At December 31, 2016 OREO was comprised of five commercial real estate properties with a total value of $0.8 million and 24 residential properties with a total value of $1.2 million. This compares to four commercial real estate properties with a total value of $0.6 million and 27 residential properties with a total value of $1.5 million at December 31, 2015.
41
Approximately 64% of nonperforming loans at December 31, 2016 are related to the consumer mortgage portfolio. Collateral values of residential properties within the Company's market area have remained relatively stable over the past several years. Additionally, improved process efficiency and economic conditions, including lower unemployment levels, have positively impacted consumers and have resulted in lower nonperforming mortgage ratios in 2015 and 2016. Approximately 22% of the nonperforming loans at December 31, 2016 are related to the business lending portfolio, which is comprised of business loans broadly diversified by industry type. The level of nonperforming
business loans has decreased from the prior year and
is below the Company's longer-term average results as a proportion of total loans due to general economic improvements, effective problem loan management and maintenance of strict underwriting standards. The remaining 14% percent of nonperforming loans relate to consumer installment and home equity loans. The allowance for loan losses to nonperforming loans ratio, a general measure of coverage adequacy, was 199% at the end of 2016 compared to 190% at year-end 2015 and 190% at December 31, 2014, reflective of a larger proportional increase in the level of the allowance for loan losses than in nonperforming loans. Excluding acquired loans, the ratio of allowance for legacy loans to nonperforming legacy loans was 245% at the end of 2016, compared to 212% at year-end 2015 and 221% at December 31, 2014.
Members of the Company's senior management, special asset officers, and lenders review all delinquent and nonaccrual loans and OREO regularly in order to identify deteriorating situations, monitor known problem credits and discuss any needed changes to collection efforts, if warranted. Based on the group's consensus, a relationship may be assigned a special assets officer or other senior lending officer to review the loan, meet with the borrowers, assess the collateral and recommend an action plan. This plan could include foreclosure, restructuring loans, issuing demand letters or other actions. The Company's larger criticized credits are also reviewed on at least a quarterly basis by senior credit administration management, as well as special assets officers and senior commercial lending management to monitor their status and discuss relationship management plans. Commercial lending management reviews the entire criticized business loan portfolio on a monthly basis.
Total delinquencies, defined as loans 30 days or more past due or in nonaccrual status, finished the current year at 1.19% of total loans outstanding, compared to 1.16% at the end of 2015. As of year-end 2016, delinquency ratios for business lending, consumer installment loans, consumer mortgages and home equity loans were 0.65%, 1.30%, 1.54%, and 1.30%, respectively, and reflected improvement in business loan delinquencies over prior year levels, while year-end delinquency rates in the consumer categories increased. These measures were 0.78%, 1.20%, 1.49%, and 1.04%, respectively, as of December 31, 2015. Delinquency levels, particularly in the 30 to 89 days category, tend to be somewhat volatile due to their measurement at a point in time, and therefore management believes that it is useful to evaluate this ratio over a longer time period. The average quarter-end delinquency ratio for total loans in 2016 was 1.09%, as compared to an average of 1.16% in 2015, and 1.32% in 2014, reflective of management's continued focus on maintaining strict underwriting standards, as well as the effective utilization of its collection capabilities.
Loans are considered modified in a troubled debt restructuring ("TDR") when, due to a borrower's financial difficulties, the Company makes one or more concessions to the borrower that it would not otherwise consider. These modifications primarily include, among others, an extension of the term of the loan or granting a period with reduced or no principal and/or interest payments, which can be recaptured through payments made over the remaining term of the loan or at maturity. Historically, the Company has created very few TDRs. Regulatory guidance by the OCC requires certain loans that have been discharged in Chapter 7 bankruptcy to be reported as TDRs. In accordance with this guidance, loans that have been discharged in Chapter 7 bankruptcy but not reaffirmed by the borrower are classified as TDRs, irrespective of payment history or delinquency status, even if the repayment terms for the loan have not been otherwise modified and the Company's lien position against the underlying collateral remains unchanged. Pursuant to that guidance, the Company records a charge-off equal to any portion of the carrying value that exceeds the net realizable value of the collateral. As of December 31, 2016, the Company had 56 loans totaling $1.8 million considered to be nonaccruing TDRs and 158 loans totaling $3.7 million considered to be accruing TDRs. This compares to 55 loans totaling $1.9 million considered to be nonaccruing TDRs and 183 loans totaling $4.3 million considered to be accruing TDRs at December 31, 2015.
42
The changes in the allowance for loan losses for the last five years are as follows:
Table 11: Allowance for Loan Losses Activity
|
Years Ended December 31,
|
||||||||||||||||||||
|
(000's omitted except for ratios)
|
2016
|
2015
|
2014
|
2013
|
2012
|
|||||||||||||||
|
|
||||||||||||||||||||
|
Allowance for loan losses at beginning of period
|
$
|
45,401
|
$
|
45,341
|
$
|
44,319
|
$
|
42,888
|
$
|
42,213
|
||||||||||
|
Charge-offs:
|
||||||||||||||||||||
|
Consumer mortgage
|
647
|
1,374
|
1,075
|
1,012
|
1,004
|
|||||||||||||||
|
Business lending
|
1,969
|
2,249
|
1,596
|
3,671
|
5,654
|
|||||||||||||||
|
Consumer indirect
|
7,643
|
6,714
|
6,784
|
4,544
|
5,407
|
|||||||||||||||
|
Consumer direct
|
1,706
|
1,490
|
1,595
|
1,954
|
1,694
|
|||||||||||||||
|
Home equity
|
218
|
244
|
765
|
650
|
423
|
|||||||||||||||
|
Total charge-offs
|
12,183
|
12,071
|
11,815
|
11,831
|
14,182
|
|||||||||||||||
|
Recoveries:
|
||||||||||||||||||||
|
Consumer mortgage
|
115
|
80
|
205
|
36
|
59
|
|||||||||||||||
|
Business lending
|
616
|
877
|
750
|
692
|
1,295
|
|||||||||||||||
|
Consumer indirect
|
4,168
|
3,943
|
3,773
|
3,488
|
3,551
|
|||||||||||||||
|
Consumer direct
|
901
|
722
|
846
|
1,034
|
821
|
|||||||||||||||
|
Home equity
|
139
|
62
|
85
|
20
|
23
|
|||||||||||||||
|
Total recoveries
|
5,939
|
5,684
|
5,659
|
5,270
|
5,749
|
|||||||||||||||
|
Net charge-offs
|
6,244
|
6,387
|
6,156
|
6,561
|
8,433
|
|||||||||||||||
|
Provision for loan losses
|
8,039
|
6,349
|
7,497
|
7,358
|
8,715
|
|||||||||||||||
|
Provision for acquired impaired loans
|
37
|
98
|
(319
|
)
|
634
|
393
|
||||||||||||||
|
Allowance for loan losses at end of period
|
$
|
47,233
|
$
|
45,401
|
$
|
45,341
|
$
|
44,319
|
$
|
42,888
|
||||||||||
|
Allowance for loan losses / total loans
|
0.95
|
%
|
0.95
|
%
|
1.07
|
%
|
1.08
|
%
|
1.11
|
%
|
||||||||||
|
Allowance for legacy loan losses / total legacy loans
(1)
|
1.02
|
%
|
1.05
|
%
|
1.14
|
%
|
1.15
|
%
|
1.21
|
%
|
||||||||||
|
Allowance for loan losses / nonperforming loans
|
199
|
%
|
190
|
%
|
190
|
%
|
201
|
%
|
147
|
%
|
||||||||||
|
Allowance for legacy loans / nonperforming legacy loans
(1)
|
245
|
%
|
212
|
%
|
221
|
%
|
234
|
%
|
171
|
%
|
||||||||||
|
Net charge-offs to average loans outstanding:
|
||||||||||||||||||||
|
Consumer mortgage
|
0.03
|
%
|
0.08
|
%
|
0.05
|
%
|
0.06
|
%
|
0.07
|
%
|
||||||||||
|
Business lending
|
0.09
|
%
|
0.11
|
%
|
0.07
|
%
|
0.24
|
%
|
0.36
|
%
|
||||||||||
|
Consumer indirect
|
0.35
|
%
|
0.33
|
%
|
0.38
|
%
|
0.16
|
%
|
0.31
|
%
|
||||||||||
|
Consumer direct
|
0.40
|
%
|
0.41
|
%
|
0.40
|
%
|
0.52
|
%
|
0.54
|
%
|
||||||||||
|
Home equity
|
0.02
|
%
|
0.05
|
%
|
0.20
|
%
|
0.18
|
%
|
0.12
|
%
|
||||||||||
|
Total loans
|
0.13
|
%
|
0.15
|
%
|
0.15
|
%
|
0.17
|
%
|
0.23
|
%
|
||||||||||
|
(1)
Legacy loans exclude loans acquired after January 1, 2009.
|
||||||||||||||||||||
As displayed in Table 11 above, total net charge-offs in 2016 were $6.2 million, $0.1 million less than the prior year due to lower levels of net charge-offs in the business lending, consumer mortgage and home equity portfolios, partially offset by higher net charge-offs in the consumer indirect and consumer direct portfolios. Net charge-offs in 2015 were $0.2 million more than 2014 due to higher net charge-offs in the business lending, consumer mortgage, and consumer direct portfolios, partially offset by lower levels of net charge-offs in the consumer indirect and home equity portfolios.
Due to the significant increases in average loan balances over time as a result of acquisition and organic growth, management believes that net charge-offs as a percent of average loans ("net charge-off ratio") offers the most meaningful representation of charge-off trends. The total net charge-off ratio of 0.13% for 2016 was two basis points lower than the 0.15% ratio from 2015 and 2014. Gross charge-offs as a percentage of average loans was 0.25% in 2016, as compared to 0.28% in 2015, and 0.28% in 2014, evidence of management's continued focus on maintaining strict underwriting standards. Continued strong recovery efforts were evidenced by recoveries of $5.9 million in 2016, representing 49% of average gross charge-offs for the latest two years, compared to 48% in both 2015 and 2014.
43
Business loan net charge-offs decreased slightly in 2016, totaling $1.4 million, or 0.09% of average business loans outstanding versus $1.4 million, or 0.11% of the average outstanding balance in 2015, reflective of the Company's disciplined risk management and underwriting standards. Consumer installment loan net charge-offs increased to $4.3 million this year from $3.5 million in 2015, with a net charge-off ratio of 0.36% in 2016 and 0.34% in 2015. This is reflective of the nearly 22% growth in balances since the end of 2014, higher levels of gross charge-offs of consumer installment loans in 2016 as compared to 2015 and lower market resale valuations for certain asset classes that hindered consumer installment recovery efforts. The dollar amount of consumer mortgage net charge-offs decreased $0.8 million in 2016, with the net charge-off ratio decreasing five basis points to 0.03%. Home equity net charge-offs decreased $0.1 million to $0.1 million in 2016 while the net charge-off ratio decreased three basis points to 0.02%.
Management continually evaluates the credit quality of the Company's loan portfolio and conducts a formal review of the adequacy of the allowance for loan losses on a quarterly basis. The two primary components of the loan review process that are used to determine proper allowance levels are specific and general loan loss allocations. Measurement of specific loan loss allocations is typically based on expected future cash flows, collateral values and other factors that may impact the borrower's ability to repay. Impaired loans with outstanding balances that are greater than $0.5 million are evaluated for specific loan loss allocations. Consumer mortgages, consumer installment and home equity loans are considered smaller balance homogeneous loans and are evaluated collectively. The Company considers a loan to be impaired when, based on current information and events, it is probable that the Company will be unable to collect all principal and interest according to the contractual terms of the loan agreement or the loan is delinquent 90 days or more.
The second component of the allowance establishment process, general loan loss allocations, is composed of two calculations that are computed on the five main loan segments: consumer mortgage, business lending, consumer indirect, consumer direct, and home equity. The first calculation determines an allowance level based on the latest 36 months of historical net charge-off data for each loan category (business loans exclude balances with specific loan loss allocations). The second calculation is qualitative and takes into consideration eight qualitative environmental factors: levels and trends in delinquencies and impaired loans; levels of and trends in charge-offs and recoveries; trends in volume and terms of loans; effects of any changes in risk selection and underwriting standards, and other changes in lending policies, procedure, and practices; experience, ability, and depth of lending management and other relevant staff; national and local economic trends and conditions; industry conditions; and effects of changes in credit concentrations. The allowance levels computed from the specific and general loan loss allocation methods are combined with unallocated allowances, if any, to derive the required allowance for loan losses to be reflected on the Consolidated Statement of Condition. As it has in prior periods, the Company strives to refine and enhance its loss evaluation and estimation processes continually.
The loan loss provision is calculated by subtracting the previous period allowance for loan losses, net of the interim period net charge-offs, from the current required allowance level. This provision is then recorded in the income statement for that period. Members of senior management and the Audit Committee of the Board of Directors review the adequacy of the allowance for loan losses quarterly. Management is committed to continually improving the credit assessment and risk management capabilities of the Company and has dedicated the resources necessary to ensure advancement in this critical area of operations.
Acquired loans are recorded at their acquisition date fair values and, therefore, are excluded from the calculation of loan loss reserves as of the acquisition date. To the extent there is a decrease in the present value of cashflows from the acquired impaired loans after the date of acquisition, the Company records a provision for potential losses. During the year ended December 31, 2016, an additional $0.03 million of provision for loan losses related to acquired impaired loans was recorded. During the year ended December 31, 2015, an additional $0.1 million provision for loan loss related to acquired impaired loans was recorded. During the year ended December 31, 2014, the Company reversed $0.3 million of its provision for loan losses related to acquired impaired loans as the value received at closure for certain loans was greater than the value for which they were being carried on the books.
For acquired loans that are not deemed impaired at acquisition, a fair value adjustment is recorded that includes both credit and interest rate considerations. Subsequent to the purchase date, the methods utilized to estimate the required allowance for loan losses for these loans is similar to originated loans, however, the Company records a provision for loan losses only when the required allowance exceeds any remaining purchased discounts. During 2016, the Company recorded a provision for loan losses on acquired non-impaired loans of $0.8 million. For full year 2015, the Company recorded a provision for loan losses on acquired non-impaired loans of $1.0 million, primarily for the Oneida commercial portfolio where the net fair value of the pool was deemed greater than its par value at acquisition. During 2014, the Company recorded a provision for loan losses on acquired non-impaired loans of $0.6 million.
44
The allowance for loan losses increased to $47.2 million at the end 2016 from $45.4 million as of year-end 2015. The $1.8 million increase was primarily due to organic growth, partially offset by improved credit quality. The allowance for legacy loan losses increased $1.7 million as growth in the loan portfolio was partially offset by changes in the composition of the loan portfolio associated with unscheduled principal reductions in the business lending portfolio. The ratio of the allowance for loan losses to total loans of 0.95% for year-end 2016 was consistent with 2015 and was 12 basis points below the 1.07% ratio for 2014, primarily due to consistent credit quality. The ratio of allowance for legacy loan losses to total legacy loans decreased three basis points to 1.02% for 2016 as compared 2015. Management believes the year-end 2016 allowance for loan losses to be adequate in light of the probable losses inherent in the Company's loan portfolio.
The loan loss provision for legacy loans of $7.2 million in 2016, was $1.9 million more than the prior year, and reflects management's assessment of the probable losses in the loan portfolio, as discussed above. The loan loss provision as a percentage of average loans was 0.17% in 2016 as compared to 0.15% in 2015 and 0.17% in 2014. The loan loss provision was 129% of net charge-offs this year versus 101% in 2015 and 117% in 2014, reflective of the assessed risk in the overall portfolio.
The following table sets forth the allocation of the allowance for loan losses by loan category as of the end of the years indicated, as well as the proportional share each category is to total loans. This allocation is based on management's assessment, as of a given point in time, of the risk characteristics of each of the component parts of the total loan portfolio and is subject to changes when the risk factors of each component part change. The allocation is not indicative of either the specific amounts of the loan categories in which future charge-offs may be taken, nor should it be taken as an indicator of future loss trends. The allocation of the allowance to each category does not restrict the use of the allowance to absorb losses in any category.
Table 12: Allowance for Loan Losses by Loan Type
|
2016
|
2015
|
2014
|
2013
|
2012
|
||||||||||||||||||||||||||||||||||||
|
(000's omitted except for ratios)
|
Allowance
|
Loan Mix
|
Allowance
|
Loan Mix
|
Allowance
|
Loan Mix
|
Allowance
|
Loan Mix
|
Allowance
|
Loan Mix
|
||||||||||||||||||||||||||||||
|
Consumer mortgage
|
$
|
10,094
|
36.8
|
%
|
$
|
10,198
|
36.8
|
%
|
$
|
10,286
|
38.1
|
%
|
$
|
8,994
|
38.5
|
%
|
$
|
7,070
|
37.5
|
%
|
||||||||||||||||||||
|
Business lending
|
17,220
|
30.0
|
%
|
15,749
|
31.0
|
%
|
15,787
|
29.7
|
%
|
17,507
|
30.5
|
%
|
18,013
|
31.6
|
%
|
|||||||||||||||||||||||||
|
Consumer indirect
|
13,782
|
21.1
|
%
|
12,422
|
19.5
|
%
|
11,544
|
19.7
|
%
|
10,248
|
18.0
|
%
|
9,606
|
16.7
|
%
|
|||||||||||||||||||||||||
|
Consumer direct
|
2,979
|
3.9
|
%
|
2,997
|
4.1
|
%
|
3,083
|
4.3
|
%
|
3,181
|
4.4
|
%
|
3,303
|
4.4
|
%
|
|||||||||||||||||||||||||
|
Home equity
|
2,399
|
8.1
|
%
|
2,666
|
8.4
|
%
|
2,701
|
8.1
|
%
|
1,830
|
8.4
|
%
|
1,451
|
9.4
|
%
|
|||||||||||||||||||||||||
|
Acquired impaired loans
|
108
|
0.1
|
%
|
168
|
0.2
|
%
|
173
|
0.1
|
%
|
530
|
0.2
|
%
|
779
|
0.4
|
%
|
|||||||||||||||||||||||||
|
Unallocated
|
651
|
1,201
|
1,767
|
2,029
|
2,666
|
|||||||||||||||||||||||||||||||||||
|
Total
|
$
|
47,233
|
100.0
|
%
|
$
|
45,401
|
100.0
|
%
|
$
|
45,341
|
100.0
|
%
|
$
|
44,319
|
100.0
|
%
|
$
|
42,888
|
100.0
|
%
|
||||||||||||||||||||
As demonstrated in Table 12 above and discussed previously, business lending and consumer installment by their nature carries higher credit risk than residential real estate, and as a result these loans carry allowance for loan losses that cover a higher percentage of their total portfolio balances. The unallocated allowance is maintained for inherent losses in the portfolio that is not reflected in the historical loss ratios, model imprecision, and for acquired loan portfolios in the process of being fully integrated at year-end. The unallocated allowance decreased from $1.8 million at year-end 2014 to $1.2 million at year-end 2015 to $0.7 million at December 31, 2016 due in part to the full integration of the acquired Oneida loan portfolio. The general declines in the unallocated portion of the allowance, as well as changes in year-over-year allowance allocations reflect management's continued refinement of its loss estimation techniques. However, given the inherent imprecision in the many estimates used in the determination of the allocated portion of the allowance, management deliberately remained cautious and conservative in establishing the overall allowance for loan losses. Management considers the allocated and unallocated portions of the allowance for loan losses to be prudent and reasonable. Furthermore, the Company's allowance for loan loss is general in nature and is available to absorb losses from any loan category.
45
Funding Sources
The Company utilizes a variety of funding sources to support the earning-asset base as well as to achieve targeted growth objectives. Overall funding is comprised of three primary sources that possess a variety of maturity, stability, and price characteristics; deposits of individuals, partnerships and corporations (nonpublic deposits), municipal deposits that are collateralized for amounts not covered by FDIC insurance (public funds), and external borrowings. The average daily amount of deposits and the average rate paid on each of the following deposit categories are summarized below for the years indicated:
Table 13: Average Deposits
|
2016
|
2015
|
2014
|
||||||||||||||||||||||
|
(000's omitted, except rates)
|
Average Balance
|
Average Rate Paid
|
Average Balance
|
Average Rate Paid
|
Average Balance
|
Average Rate Paid
|
||||||||||||||||||
|
Noninterest checking deposits
|
$
|
1,558,548
|
0.00
|
%
|
$
|
1,352,683
|
0.00
|
%
|
$
|
1,249,807
|
0.00
|
%
|
||||||||||||
|
Interest checking deposits
|
1,631,560
|
0.03
|
%
|
1,429,450
|
0.03
|
%
|
1,334,745
|
0.03
|
%
|
|||||||||||||||
|
Regular savings deposits
|
1,303,814
|
0.07
|
%
|
1,106,127
|
0.08
|
%
|
1,039,173
|
0.08
|
%
|
|||||||||||||||
|
Money market deposits
|
1,776,838
|
0.16
|
%
|
1,518,184
|
0.15
|
%
|
1,493,900
|
0.16
|
%
|
|||||||||||||||
|
Time deposits
|
750,944
|
0.43
|
%
|
737,734
|
0.46
|
%
|
845,035
|
0.54
|
%
|
|||||||||||||||
|
Total deposits
|
$
|
7,021,704
|
0.10
|
%
|
$
|
6,144,178
|
0.11
|
%
|
$
|
5,962,660
|
0.14
|
%
|
||||||||||||
As displayed in Table 13, average total deposits in 2016 increased $877.5 million, or 14.3%, from the prior year comprised of a $864.3 million, or 16.0%, increase in core deposits, and a $13.2 million, or 1.8%, increase in time deposits. Excluding the impact of the Oneida acquisition, average deposits increased $223.5 million, or 3.7%, as compared to 2015. Consistent with the Company's focus on expanding core account relationships and reduced customer demand for time deposits, average non-acquired, non-time ("core") deposit balances grew $316.1 million, or 5.9%, as compared to 2015 while non-acquired time deposits balances declined $92.6 million, or 12.7%. This shift in mix also reflects the diminished rate differential between core and time deposits in the low interest rate environment and contributed to the lower the cost of deposits, including the impact of non-interest checking deposits, to 0.10% in 2016 as compared to 0.11% for 2015.
Total average deposits for 2015 equaled $6.14 billion, up $181.5 million, or 3.0%, from 2014. Excluding the impact of the Oneida acquisition, average deposits increased $128.4 million, or 2.2%, as compared to 2014. Average core deposit balances grew $244.9 million, or 4.8%, as compared to 2014 while non-acquired time deposits balances declined $116.6 million, or 13.8%. The cost of deposits, including the impact of non-interest checking deposits, decreased to 0.11% in 2015 as compared to 0.14% for 2014.
Nonpublic, core deposits are frequently considered to be a bank's most attractive source of funding because they are generally stable, do not need to be collateralized, have a relatively low cost, generate solid fee income, and provide a strong customer base for which a variety of loan, deposit and other financial service-related products can be cross-sold. The Company's funding composition continues to benefit from a high level of nonpublic deposits, which reached an all-time high in 2016 with an average balance of $6.05 billion, an increase of $599.3 million, or 11.0%, over the comparable 2015 period. Excluding the impact of the Oneida acquisition, average nonpublic deposits increased $126.4 million during 2016.
Full-year average public fund deposits increased $278.2 million, or 40.0%, during 2016 to $974.1 million. Excluding the impact of the Oneida acquisition, average public fund deposits increased $97.1 million, or 14.2%, during 2016. Public fund deposit balances tend to be more volatile than nonpublic deposits because they are heavily impacted by the seasonality of tax collection and fiscal spending patterns, as well as the longer-term financial position of the local government entities, which can change from year to year. However, the Company has many strong, long-standing relationships with municipal entities throughout its markets and the diversified core deposits held by these customers have provided an attractive and comparatively stable funding source over an extended time period. The Company is required to collateralize all local government deposits in excess of FDIC coverage with marketable securities from its investment portfolio. Because of this stipulation, as well as the competitive bidding nature of municipal time deposits, management considers this funding source to share some of the attributes of external borrowings.
46
The mix of average deposits has been changing throughout the last several years. The weighting of core (noninterest checking, interest checking, savings, and money market accounts) has increased, while time deposits' weighting has decreased. This change in deposit mix reflects the Company's focus on expanding core account relationships and customers' preference for unrestricted accounts in the current low rate environment. The average balance for time deposit accounts decreased from 12.0% of total average deposits in 2015 to 10.7% of total average deposits for 2016. Correspondingly, average core deposit balances have increased from 88.0% in 2015 to 89.3% in 2016. This shift in mix, combined with lower average offered interest rates resulted in the cost of interest-bearing deposits to decline to 0.13% in 2016, as compared to 0.15% in 2015 and 0.17% in 2014. The total cost of deposit funding, which includes noninterest-bearing deposits, also declined in 2016 to 0.10%, versus 0.11% in 2015, benefiting from the 15.2% increase in average non-interest bearing checking balances.
The remaining maturities of time deposits in amounts of $250,000 or more outstanding as of December 31 are as follows:
Table 14: Maturity of Time Deposits $250,000 or More
|
(000's omitted)
|
2016
|
2015
|
||||||
|
Less than three months
|
$
|
14,221
|
$
|
18,970
|
||||
|
Three months to six months
|
10,832
|
11,147
|
||||||
|
Six months to one year
|
17,089
|
17,212
|
||||||
|
Over one year
|
9,082
|
8,101
|
||||||
|
Total
|
$
|
51,224
|
$
|
55,430
|
||||
Borrowing sources for the Company include the FHLB, Federal Reserve, and other correspondent banks, as well as access to the brokered CD and repurchase markets through established relationships with primary market security dealers. The Company also had $102.2 million in floating-rate subordinated debt outstanding at the end of 2016 that is held by unconsolidated subsidiary trusts.
As shown in Table 15, year-end 2016 external borrowings totaled $248.4 million, a decrease of $155.0 million from the $403.4 million outstanding at the end of 2015 as the liquidity from the Oneida acquisition and deposit growth was used to pay down overnight borrowings. Overnight advances from the FHLB were used to fund the purchase of investment securities and cover other liquidity needs during 2016 and 2015. External borrowings averaged $271.9 million, or 3.7% of total funding sources for 2016, as compared to $513.8 million, or 7.7% of total funding sources for 2015. This ratio decreased due to the Company utilizing FHLB overnight advances during the first half of 2015 to fund the pre-investment liquidity expected to be received from the Oneida acquisition. As shown in Table 15, at the end of 2016 the Company had $146.2 million, or 59% of external borrowings, that had remaining terms of one year or less as compared to 75% of external borrowings maturing within one year at December 31, 2015.
As displayed in Table 3 on page 31, after a decrease in the percentage of funding from deposits in 2015 due to borrowings used to fund pre-investment activity conducted early in the year, the percentage of funding from deposits increased in 2016 due to the pay down of borrowings after the Oneida acquisition was completed. The percentage of average funding derived from deposits was 96.3% in 2016 as compared to 92.3% in 2015 and 93.6% in 2014. During 2016, average borrowings decreased 47.1% while average deposits increased 14.3%.
The following table summarizes the outstanding balance of borrowings of the Company as of December 31:
Table 15: Borrowings
|
(000's omitted, except rates)
|
2016
|
2015
|
2014
|
|||||||||
|
FHLB overnight advance
|
$
|
146,200
|
$
|
301,300
|
$
|
338,000
|
||||||
|
Subordinated debt held by unconsolidated subsidiary trusts
|
102,170
|
102,146
|
102,122
|
|||||||||
|
Balance at end of period
|
$
|
248,370
|
$
|
403,446
|
$
|
440,122
|
||||||
|
Daily average during the year
|
$
|
271,927
|
$
|
513,827
|
$
|
405,411
|
||||||
|
Maximum month-end balance
|
$
|
414,648
|
$
|
701,338
|
$
|
521,211
|
||||||
|
Weighted-average rate during the year
|
1.46
|
%
|
0.82
|
%
|
0.89
|
%
|
||||||
|
Weighted-average year-end rate
|
1.70
|
%
|
1.05
|
%
|
0.79
|
%
|
||||||
47
The following table shows the contractual maturities of various obligations as of December 31, 2016:
Table 16: Maturities of Contractual Obligations
|
(000's omitted)
|
Maturing Within One Year or Less
|
Maturing After One Year but Within Three Years
|
Maturing After Three Years but Within Five Years
|
Maturing After Five Years
|
Total
|
|||||||||||||||
|
FHLB overnight advance
|
$
|
146,200
|
$
|
0
|
$
|
0
|
$
|
0
|
$
|
146,200
|
||||||||||
|
Subordinated debt held by unconsolidated subsidiary trusts
|
0
|
0
|
0
|
102,527
|
102,527
|
|||||||||||||||
|
Interest on borrowings
|
3,159
|
6,294
|
6,294
|
44,159
|
59,906
|
|||||||||||||||
|
Operating leases
|
6,078
|
10,614
|
6,955
|
7,297
|
30,944
|
|||||||||||||||
|
Total
|
$
|
155,437
|
$
|
16,908
|
$
|
13,249
|
$
|
153,983
|
$
|
339,577
|
||||||||||
Financial Instruments with Off-Balance Sheet Risk
The Company is a party to financial instruments with off-balance-sheet risk in the normal course of business to meet the financing needs of its customers. These financial instruments consist primarily of commitments to extend credit and standby letters of credit. Commitments to extend credit are agreements to lend to customers, generally having fixed expiration dates or other termination clauses that may require payment of a fee. These commitments consist principally of unused commercial and consumer credit lines. Standby letters of credit generally are contingent upon the failure of the customer to perform according to the terms of an underlying contract with a third party. The credit risks associated with commitments to extend credit and standby letters of credit are essentially the same as that involved with extending loans to customers and are subject to normal credit policies. Collateral may be required based on management's assessment of the customer's creditworthiness. The fair value of these commitments is considered immaterial for disclosure purposes.
The contractual amounts of these off-balance sheet financial instruments as of December 31 were as follows:
Table 17: Off-Balance Sheet Financial Instruments
|
(000's omitted)
|
2016
|
2015
|
||||||
|
Commitments to extend credit
|
$
|
773,442
|
$
|
811,442
|
||||
|
Standby letters of credit
|
22,656
|
19,053
|
||||||
|
Total
|
$
|
796,098
|
$
|
830,495
|
||||
Investments
The objective of the Company's investment portfolio is to hold low-risk, high-quality earning assets that provide favorable returns and provide another effective tool to actively manage its asset/liability position in order to maximize future net interest income opportunities. This must be accomplished within the following constraints: (a) implementing certain interest rate risk management strategies which achieve a relatively stable level of net interest income; (b) providing both the regulatory and operational liquidity necessary to conduct day-to-day business activities; (c) considering investment risk-weights as determined by the regulatory risk-based capital guidelines; and (d) generating a favorable return without undue compromise of the other requirements.
The carrying value of the Company's investment portfolio ended 2016 at $2.78 billion, a decrease of $63.5 million, or 2.2%, from the end of 2015. The book value (excluding unrealized gains and losses) of the portfolio decreased $39.5 million from December 31, 2015, and the unrealized holding gain on the available-for-sale securities decreased $24.0 million. During 2016, the Company purchased $8.6 million of obligations of state and political subdivisions at an average yield of 4.24% and $57.4 million of
government agency mortgage-backed securities
at an average rate of 2.20%. Offsetting these purchases were $109.6 million of maturities, calls and collections.
The carrying value of the Company's investment portfolio increased $335.0 million during 2015 to end the year at $2.85 billion. The book value of available-for-sale investments increased $344.4 million from December 31, 2014. During 2015, the Company purchased $398.2 million of U.S. Treasury and agency securities at an average yield of 1.96%, $86.3 million of obligations of state and political subdivisions at an average yield of 4.00%, and $18.5 million of
government agency mortgage-backed securities
at an average rate of 2.47%. Offsetting these purchases were $169.5 million of maturities, calls and collections. Additionally, $225.7 million of investment securities were acquired as part of the Oneida transaction, of which $221.1 million were subsequently sold.
48
The investment portfolio has limited credit risk due to the composition continuing to heavily favor U.S. Treasury debentures, U.S. Agency mortgage-backed pass-throughs, U.S. Agency CMOs and municipal bonds. The U.S. Treasury debentures, U.S. Agency mortgage-backed pass-throughs and U.S. Agency CMOs are all AAA-rated (highest possible rating) by Moody's and AA+ by Standard and Poor's. The majority of the municipal bonds are A-rated or higher. The portfolio does not include any private label mortgage-backed securities (MBSs) or private label collateralized mortgage obligations. The overall mix of securities within the portfolio over the last year has changed, with an increase in the proportion of U.S. Treasury and Agency securities and government agency mortgage-backed securities, and a decrease in the proportion of obligations of state and political subdivisions and other securities.
The net pre-tax unrealized market value gain on the available-for-sale investment portfolio as of December 31, 2016 was $41.8 million, as compared to $65.8 million one year earlier. This decrease is indicative of the interest rate movements during the respective time periods and the changes in the size and composition of the portfolio.
The following table sets forth the amortized cost and market value for the Company's investment securities portfolio:
Table 18: Investment Securities
|
2016
|
2015
|
2014
|
||||||||||||||||||||||
|
(000's omitted)
|
Amortized Cost/Book Value
|
Fair Value
|
Amortized Cost/Book Value
|
Fair Value
|
Amortized Cost/Book Value
|
Fair Value
|
||||||||||||||||||
|
Available-for-Sale Portfolio:
|
||||||||||||||||||||||||
|
U.S. Treasury and agency securities
|
$
|
1,876,358
|
$
|
1,902,762
|
$
|
1,866,819
|
$
|
1,899,978
|
$
|
1,479,134
|
$
|
1,517,733
|
||||||||||||
|
Obligations of state and political subdivisions
|
582,655
|
594,990
|
640,455
|
666,883
|
645,398
|
671,903
|
||||||||||||||||||
|
Government agency mortgage-backed securities
|
232,657
|
235,230
|
205,220
|
210,865
|
228,971
|
237,728
|
||||||||||||||||||
|
Corporate debt securities
|
5,716
|
5,687
|
16,672
|
16,680
|
26,803
|
27,091
|
||||||||||||||||||
|
Government agency collateralized mortgage obligations
|
9,225
|
9,535
|
12,862
|
13,308
|
17,330
|
18,025
|
||||||||||||||||||
|
Marketable equity securities
|
252
|
452
|
250
|
399
|
250
|
445
|
||||||||||||||||||
|
Total available-for-sale portfolio
|
2,706,863
|
2,748,656
|
2,742,278
|
2,808,113
|
2,397,886
|
2,472,925
|
||||||||||||||||||
|
Other Securities:
|
||||||||||||||||||||||||
|
FHLB common stock
|
12,191
|
12,191
|
19,317
|
19,317
|
19,553
|
19,553
|
||||||||||||||||||
|
Federal Reserve Bank common stock
|
19,781
|
19,781
|
16,050
|
16,050
|
16,050
|
16,050
|
||||||||||||||||||
|
Other equity securities
|
3,764
|
3,764
|
4,460
|
4,460
|
4,446
|
4,446
|
||||||||||||||||||
|
Total other securities
|
35,736
|
35,736
|
39,827
|
39,827
|
40,049
|
40,049
|
||||||||||||||||||
|
Total
|
$
|
2,742,599
|
$
|
2,784,392
|
$
|
2,782,105
|
$
|
2,847,940
|
$
|
2,437,935
|
$
|
2,512,974
|
||||||||||||
The following table sets forth as of December 31, 2016, the maturities of investment debt securities and the weighted-average yields of such securities, which have been calculated on the cost basis, weighted for scheduled maturity of each security:
Table 19: Maturities of Investment Debt Securities
|
(000's omitted, except rates)
|
Maturing Within One Year or Less
|
Maturing After One Year But Within Five Years
|
Maturing After Five Years But Within Ten Years
|
Maturing After Ten Years
|
Total Amortized Cost/Book Value
|
|||||||||||||||
|
Available-for-Sale Portfolio:
|
||||||||||||||||||||
|
U.S. Treasury and agency securities
|
$
|
0
|
$
|
768,791
|
$
|
1,107,567
|
$
|
0
|
$
|
1,876,358
|
||||||||||
|
Obligations of state and political subdivisions
|
34,986
|
151,935
|
194,589
|
201,145
|
582,655
|
|||||||||||||||
|
Government agency mortgage-backed securities
(2)
|
4
|
842
|
27,744
|
204,067
|
232,657
|
|||||||||||||||
|
Corporate debt securities
|
3,008
|
2,708
|
0
|
0
|
5,716
|
|||||||||||||||
|
Government agency collateralized mortgage obligations
(2)
|
0
|
17
|
986
|
8,222
|
9,225
|
|||||||||||||||
|
Available-for-sale portfolio
|
$
|
37,998
|
$
|
924,293
|
$
|
1,330,886
|
$
|
413,434
|
$
|
2,706,611
|
||||||||||
|
Weighted-average yield
(1)
|
2.42
|
%
|
2.27
|
%
|
2.51
|
%
|
3.34
|
%
|
2.55
|
%
|
||||||||||
|
(1)
Weighted-average yields are an arithmetic computation of income (not fully tax-equivalent adjusted) divided by book balance; they may differ from the yield to maturity, which considers the time value of money.
|
| (2) Mortgage-backed securities and collateralized mortgage obligations are listed based on the contractual maturity. Actual maturities will differ from contractual maturities because borrowers may have the right to call or prepay certain obligations with or without penalties |
49
Impact of Inflation and Changing Prices
The Company's financial statements have been prepared in terms of historical dollars, without considering changes in the relative purchasing power of money over time due to inflation. Unlike most industrial companies, virtually all of the assets and liabilities of a financial institution are monetary in nature. As a result, interest rates have a more significant impact on a financial institution's performance than the effect of general levels of inflation. Interest rates do not necessarily move in the same direction or in the same magnitude as the prices of goods and services. Notwithstanding this, inflation can directly affect the value of loan collateral, real estate in particular.
New Accounting Pronouncements
See
"New Accounting Pronouncements
" Section of Note A of the notes to the consolidated financial statements on page 64 for recently issued accounting pronouncements applicable to the Company that have not yet been adopted.
Forward-Looking Statements
This document contains comments or information that constitute forward-looking statements (within the meaning of the Private Securities Litigation Reform Act of 1995), which involve significant risks and uncertainties. Actual results may differ materially from the results discussed in the forward-looking statements. Moreover, the Company's plans, objectives and intentions are subject to change based on various factors (some of which are beyond the Company's control). Factors that could cause actual results to differ from those discussed in the forward-looking statements include: (1) risks related to credit quality, interest rate sensitivity and liquidity; (2) the strength of the U.S. economy in general and the strength of the local economies where the Company conducts its business; (3) the effect of, and changes in, monetary and fiscal policies and laws, including interest rate policies of the Board of Governors of the Federal Reserve System; (4) inflation, interest rate, market and monetary fluctuations; (5) the timely development of new products and services and customer perception of the overall value thereof (including features, pricing and quality) compared to competing products and services; (6) changes in consumer spending, borrowing and savings habits; (7) technological changes and implementation and financial risks associated with transitioning to new technology-based systems involving large multi-year contracts; (8)
the ability of the Company to maintain the security of its financial, accounting, technology, data processing and other operating systems and facilities; (9) any acquisitions or mergers that might be considered or consummated by the Company and the costs and factors associated therewith, including differences in the actual financial results of the acquisition or merger compared to expectations and the realization of anticipated cost savings and revenue enhancements; (10) the ability to maintain and increase market share and control expenses; (11) the nature, timing and effect of changes in banking regulations or other regulatory or legislative requirements affecting the respective businesses of the Company and its subsidiaries, including changes in laws and regulations concerning taxes, accounting, banking, risk management, securities and other aspects of the financial services industry, specifically the Dodd-Frank Wall Street Reform and Consumer Protection Act of 2010; (12) changes in the Company's organization, compensation and benefit plans and in the availability of, and compensation levels for, employees in its geographic markets; (13) the outcome of pending or future litigation and government proceedings; (14) other risk factors outlined in the Company's filings with the SEC from time to time; and (15) the success of the Company at managing the risks of the foregoing.
The foregoing list of important factors is not all-inclusive. Such forward-looking statements speak only as of the date on which they are made and the Company does not undertake any obligation to update any forward-looking statement, whether written or oral, to reflect events or circumstances after the date on which such statement is made. If the Company does update or correct one or more forward-looking statements, investors and others should not conclude that the Company will make additional updates or corrections with respect thereto or with respect to other forward-looking statements.
50
Reconciliation of GAAP to Non-GAAP Measures
Table 20: GAAP to Non-GAAP Reconciliations
|
(000's omitted)
|
2016
|
2015
|
2014
|
2013
|
2012
|
|||||||||||||||
|
Income statement data
|
||||||||||||||||||||
|
Core operating expenses, revenues & Efficiency Ratio
|
||||||||||||||||||||
|
Noninterest expenses (GAAP)
|
$
|
266,848
|
$
|
233,055
|
$
|
226,580
|
$
|
221,255
|
$
|
211,757
|
||||||||||
|
Acquisition expenses
|
(1,706
|
)
|
(7,037
|
)
|
(123
|
)
|
(2,181
|
)
|
(5,747
|
)
|
||||||||||
|
Amortization of intangibles
|
(5,479
|
)
|
(3,663
|
)
|
(4,287
|
)
|
(4,469
|
)
|
(4,607
|
)
|
||||||||||
|
Litigation settlement
|
0
|
0
|
(2,800
|
)
|
0
|
(2,500
|
)
|
|||||||||||||
|
Core operating expenses (non-GAAP) - numerator
|
$
|
259,663
|
$
|
222,355
|
$
|
219,370
|
$
|
214,605
|
$
|
198,903
|
||||||||||
|
Tax-equivalent net interest income
|
283,857
|
260,824
|
259,961
|
253,154
|
247,330
|
|||||||||||||||
|
Noninterest revenues
|
155,625
|
123,299
|
119,020
|
102,180
|
99,246
|
|||||||||||||||
|
Insurance-related recovery
|
(950
|
)
|
0
|
0
|
0
|
0
|
||||||||||||||
|
Loss (Gain) on sale of investments & early retirement
of long-term borrowings, net
|
0
|
4
|
0
|
6,568
|
(291
|
)
|
||||||||||||||
|
Core operating revenues (non-GAAP) - denominator
|
$
|
438,532
|
$
|
384,127
|
$
|
378,981
|
$
|
361,902
|
$
|
346,285
|
||||||||||
|
Efficiency ratio (non-GAAP)
|
59.2
|
%
|
57.9
|
%
|
57.9
|
%
|
59.3
|
%
|
57.4
|
%
|
||||||||||
|
(000's omitted)
|
2016
|
2015
|
2014
|
2013
|
2012
|
|||||||||||||||
|
Balance sheet data
|
||||||||||||||||||||
|
Net tangible equity-to-assets ratio at period end
|
||||||||||||||||||||
|
Shareholders' equity (GAAP)
|
$
|
1,198,100
|
$
|
1,140,647
|
$
|
987,904
|
$
|
875,812
|
$
|
902,778
|
||||||||||
|
Intangible assets
|
(480,844
|
)
|
(484,146
|
)
|
(386,973
|
)
|
(390,499
|
)
|
(387,134
|
)
|
||||||||||
|
Deferred taxes on goodwill
|
43,504
|
39,724
|
35,842
|
32,339
|
27,947
|
|||||||||||||||
|
Tangible common equity (non-GAAP) - numerator
|
$
|
760,760
|
$
|
696,225
|
$
|
636,773
|
$
|
517,652
|
$
|
543,591
|
||||||||||
|
Total assets (GAAP)
|
$
|
8,666,437
|
$
|
8,552,669
|
$
|
7,489,440
|
$
|
7,095,864
|
$
|
7,496,800
|
||||||||||
|
Intangible assets
|
(480,844
|
)
|
(484,146
|
)
|
(386,973
|
)
|
(390,499
|
)
|
(387,134
|
)
|
||||||||||
|
Deferred taxes on goodwill
|
43,504
|
39,724
|
35,842
|
32,339
|
27,947
|
|||||||||||||||
|
Tangible assets (non-GAAP) - denominator
|
$
|
8,229,097
|
$
|
8,108,247
|
$
|
7,138,309
|
$
|
6,737,704
|
$
|
7,137,613
|
||||||||||
|
Net tangible equity-to-assets ratio at period end
(non-GAAP)
|
9.24
|
%
|
8.59
|
%
|
8.92
|
%
|
7.68
|
%
|
7.62
|
%
|
||||||||||
Item 7A. Quantitative and Qualitative Disclosures about Market Risk
Market risk is the risk of loss in a financial instrument arising from adverse changes in market rates, prices or credit risk. Credit risk associated with the Company's loan portfolio has been previously discussed in the asset quality section of the MD&A. Management believes that the tax risk of the Company's municipal investments associated with potential future changes in statutory, judicial and regulatory actions is minimal. Treasury, agency, mortgage-backed and CMO securities issued by government agencies comprise 78% of the total portfolio and are currently rated AAA by Moody's Investor Services and AA+ by Standard & Poor's. Municipal and corporate bonds account for 22% of the total portfolio, of which, 98% carry a minimum rating of A-. The remaining 2% of the portfolio is comprised of other investment grade securities. The Company does not have material foreign currency exchange rate risk exposure. Therefore, almost all the market risk in the investment portfolio is related to interest rates.
51
The ongoing monitoring and management of both interest rate risk and liquidity, in the short and long term time horizons is an important component of the Company's asset/liability management process, which is governed by limits established in the policies reviewed and approved annually by the Company's Board of Directors. The Board of Directors delegates responsibility for carrying out the policies to the ALCO, which meets each month. The committee is made up of the Company's senior management as well as regional and line-of-business managers who oversee specific earning asset classes and various funding sources. As the Company does not believe it is possible to reliably predict future interest rate movements, it has maintained an appropriate process and set of measurement tools, which enables it to identify and quantify sources of interest rate risk in varying rate environments. The primary tool used by the Company in managing interest rate risk is income simulation.
While a wide variety of strategic balance sheet and treasury yield curve scenarios are tested on an ongoing basis, the following reflects the Company's projected net interest income sensitivity over the subsequent twelve months based on:
|
·
|
Asset and liability levels using December 31, 2016 as a starting point.
|
|
·
|
There are assumed to be conservative levels of balance sheet growth, low-to-mid single digit growth in loans and deposits, while using the cash flows from investment contractual maturities and prepayments to repay short-term capital market borrowings or reinvest into securities or cash equivalents.
|
|
·
|
The prime rate and federal funds rates are assumed to move up over a 12-month period while moving the long end of the treasury curve to spreads over the three month treasury that are more consistent with historical norms (normalized yield curve). In the -50 basis point model, the prime and federal funds rates move lower in the first quarter of year one while moving the long end of the curve to levels over the three month treasury using spreads at a time when the yield curve was flat. Deposit rates are assumed to move in a manner that reflects the historical relationship between deposit rate movement and changes in the federal funds rate.
|
|
·
|
Cash flows are based on contractual maturity, optionality, and amortization schedules along with applicable prepayments derived from internal historical data and external sources.
|
Net Interest Income Sensitivity Model
|
Change in interest rates
|
Calculated annualized increase
(decrease) in projected net interest
income at December 31, 2016
|
||
|
+200 basis points
|
($3,294,000)
|
|
|
|
+100 basis points
|
($1,538,000)
|
|
|
|
-50 basis points
|
($2,699,000)
|
|
The modeled net interest income (NII) decreases in rising rate environments from the flat rate scenario. The decrease is largely a result of assumed deposit and funding costs increasing faster than the repricing of corresponding assets. In the short term (year one) the assumed increase of deposit rates in the rising rate environment temporarily outweighs the benefit of earning asset yields increasing to higher levels. However, over a longer time period (years two and beyond), the growth in NII improves in the rising rate environments as lower yielding assets mature and are replaced at higher rates.
In the falling rate environment scenario, the Bank shows interest rate risk exposure to lower short term rates and also a flatter yield curve. Net interest income declines during the first twelve months largely due to lower assumed rates on adjustable and variable rate assets. Corresponding deposit rates are assumed to remain constant. Despite federal funds trading between 0.50% and 0.75%, the Company believes both short-term rates and long-term treasury rates could potentially fall further in this scenario, and thus, the model includes the impact of this lower treasury rate scenario.
The analysis does not represent a Company forecast and should not be relied upon as being indicative of expected operating results. These hypothetical estimates are based upon numerous assumptions: the nature and timing of interest rate levels (including yield curve shape), prepayments on loans and securities, deposit decay rates, pricing decisions on loans and deposits, reinvestment/replacement of asset and liability cash flows, and other factors. While the assumptions are developed based upon current economic and local market conditions, the Company cannot make any assurances as to the predictive nature of these assumptions, including how customer preferences or competitor influences might change. Furthermore, the sensitivity analysis does not reflect actions that the ALCO might take in responding to or anticipating changes in interest rates.
52
The following consolidated financial statements and independent registered public accounting firm's report of Community Bank System, Inc. are contained on pages 54 through 97 of this item.
|
·
|
Consolidated Statements of Condition,
|
December 31, 2016 and 2015
|
·
|
Consolidated Statements of Income,
|
Years ended December 31, 2016, 2015, and 2014
|
·
|
Consolidated Statements of Comprehensive Income,
|
Years ended December 31, 2016, 2015, and 2014
|
·
|
Consolidated Statements of Changes in Shareholders' Equity,
|
Years ended December 31, 2016, 2015, and 2014
|
·
|
Consolidated Statements of Cash Flows,
|
Years ended December 31, 2016, 2015, and 2014
|
·
|
Notes to Consolidated Financial Statements,
|
December 31, 2016
|
·
|
Management's Report on Internal Control Over Financial Reporting
|
|
·
|
Report of Independent Registered Public Accounting Firm
|
Quarterly Selected Data (Unaudited) for 2016 and 2015 are contained on page 100.
53
|
COMMUNITY BANK SYSTEM, INC.
|
||||||||
|
CONSOLIDATED STATEMENTS OF CONDITION
|
||||||||
|
(In Thousands, Except Share Data)
|
||||||||
|
December 31,
|
||||||||
|
|
2016
|
2015
|
||||||
|
Assets:
|
||||||||
|
Cash and cash equivalents
|
$
|
173,857
|
$
|
153,210
|
||||
|
Available-for-sale investment securities (cost of $
2,706,863
and $2,742,278, respectively)
|
2,748,656
|
2,808,113
|
||||||
|
Other securities, at cost
|
35,736
|
39,827
|
||||||
|
Loans held for sale, at fair value
|
2,416
|
932
|
||||||
|
Loans
|
4,948,562
|
4,801,375
|
||||||
|
Allowance for loan losses
|
(47,233
|
)
|
(45,401
|
)
|
||||
|
Net loans
|
4,901,329
|
4,755,974
|
||||||
|
Goodwill
|
465,142
|
463,252
|
||||||
|
Core deposit intangibles, net
|
7,107
|
9,789
|
||||||
|
Other intangibles, net
|
8,595
|
11,105
|
||||||
|
Intangible assets, net
|
480,844
|
484,146
|
||||||
|
Premises and equipment, net
|
112,318
|
114,434
|
||||||
|
Accrued interest and fees receivable
|
31,093
|
25,904
|
||||||
|
Other assets
|
180,188
|
170,129
|
||||||
|
Total assets
|
$
|
8,666,437
|
$
|
8,552,669
|
||||
|
Liabilities:
|
||||||||
|
Noninterest-bearing deposits
|
$
|
1,646,039
|
$
|
1,499,616
|
||||
|
Interest-bearing deposits
|
5,429,915
|
5,373,858
|
||||||
|
Total deposits
|
7,075,954
|
6,873,474
|
||||||
|
Borrowings
|
146,200
|
301,300
|
||||||
|
Subordinated debt held by unconsolidated subsidiary trusts
|
102,170
|
102,146
|
||||||
|
Accrued interest and other liabilities
|
144,013
|
135,102
|
||||||
|
Total liabilities
|
7,468,337
|
7,412,022
|
||||||
|
Commitments and contingencies (See Note N)
|
||||||||
|
Shareholders' equity:
|
||||||||
|
Preferred stock, $1.00 par value, 500,000 shares authorized, 0 shares issued
|
0
|
0
|
||||||
|
Common stock, $1.00 par value, 75,000,000 shares authorized; 44,950,352 and
|
||||||||
|
44,442,568 shares issued, respectively
|
44,950
|
44,443
|
||||||
|
Additional paid-in capital
|
545,775
|
528,015
|
||||||
|
Retained earnings
|
614,692
|
566,591
|
||||||
|
Accumulated other comprehensive income
|
7,843
|
19,235
|
||||||
|
Treasury stock, at cost (512,937 and 667,708 shares, respectively)
|
(15,160
|
)
|
(17,637
|
)
|
||||
|
Total shareholders' equity
|
1,198,100
|
1,140,647
|
||||||
|
Total liabilities and shareholders' equity
|
$
|
8,666,437
|
$
|
8,552,669
|
||||
The accompanying notes are an integral part of the consolidated financial statements.
54
|
CONSOLIDATED STATEMENTS OF INCOME
|
||||||||||||
|
(In Thousands, Except Per-Share Data)
|
||||||||||||
|
Years Ended December 31,
|
||||||||||||
|
|
2016
|
2015
|
2014
|
|||||||||
|
Interest income:
|
||||||||||||
|
Interest and fees on loans
|
$
|
211,467
|
$
|
187,743
|
$
|
185,527
|
||||||
|
Interest and dividends on taxable investments
|
56,201
|
52,871
|
50,247
|
|||||||||
|
Interest and dividends on nontaxable investments
|
17,519
|
19,008
|
20,446
|
|||||||||
|
Total interest income
|
285,187
|
259,622
|
256,220
|
|||||||||
|
Interest expense:
|
||||||||||||
|
Interest on deposits
|
7,325
|
6,971
|
8,191
|
|||||||||
|
Interest on borrowings
|
1,017
|
1,694
|
1,124
|
|||||||||
|
Interest on subordinated debt held by unconsolidated subsidiary trusts
|
2,949
|
2,537
|
2,477
|
|||||||||
|
Total interest expense
|
11,291
|
11,202
|
11,792
|
|||||||||
|
Net interest income
|
273,896
|
248,420
|
244,428
|
|||||||||
|
Provision for loan losses
|
8,076
|
6,447
|
7,178
|
|||||||||
|
Net interest income after provision for loan losses
|
265,820
|
241,973
|
237,250
|
|||||||||
|
Noninterest income:
|
||||||||||||
|
Deposit service fees
|
58,595
|
52,747
|
52,756
|
|||||||||
|
Other banking revenues
|
7,477
|
4,960
|
5,814
|
|||||||||
|
Employee benefit services
|
46,628
|
45,388
|
42,580
|
|||||||||
|
Insurance services
|
23,149
|
3,352
|
1,450
|
|||||||||
|
Wealth management services
|
19,776
|
16,856
|
16,420
|
|||||||||
|
Loss on sales of investment securities, net
|
0
|
(4
|
)
|
0
|
||||||||
|
Total noninterest income
|
155,625
|
123,299
|
119,020
|
|||||||||
|
Noninterest expenses:
|
||||||||||||
|
Salaries and employee benefits
|
151,647
|
126,356
|
123,077
|
|||||||||
|
Occupancy and equipment
|
30,078
|
27,593
|
27,948
|
|||||||||
|
Data processing and communications
|
34,501
|
30,430
|
29,294
|
|||||||||
|
Amortization of intangible assets
|
5,479
|
3,663
|
4,287
|
|||||||||
|
Legal and professional fees
|
8,455
|
6,813
|
7,247
|
|||||||||
|
Office supplies and postage
|
7,274
|
6,476
|
6,270
|
|||||||||
|
Business development and marketing
|
7,484
|
7,204
|
7,125
|
|||||||||
|
FDIC insurance premiums
|
3,671
|
3,962
|
3,899
|
|||||||||
|
Acquisition expenses
|
1,706
|
7,037
|
123
|
|||||||||
|
Other expenses
|
16,553
|
13,521
|
17,310
|
|||||||||
|
Total noninterest expenses
|
266,848
|
233,055
|
226,580
|
|||||||||
|
Income before income taxes
|
154,597
|
132,217
|
129,690
|
|||||||||
|
Income taxes
|
50,785
|
40,987
|
38,337
|
|||||||||
|
Net income
|
$
|
103,812
|
$
|
91,230
|
$
|
91,353
|
||||||
|
Basic earnings per share
|
$
|
2.34
|
$
|
2.21
|
$
|
2.24
|
||||||
|
Diluted earnings per share
|
$
|
2.32
|
$
|
2.19
|
$
|
2.22
|
||||||
|
Cash dividends declared per share
|
$
|
1.26
|
$
|
1.22
|
$
|
1.16
|
||||||
The accompanying notes are an integral part of the consolidated financial statements.
55
|
COMMUNITY BANK SYSTEM, INC.
|
||||||||||||
|
CONSOLIDATED STATEMENTS OF COMPREHENSIVE INCOME
|
||||||||||||
|
(In Thousands)
|
||||||||||||
|
Years Ended December 31,
|
||||||||||||
|
|
2016
|
2015
|
2014
|
|||||||||
|
Pension and other post retirement obligations:
|
||||||||||||
|
Amortization of actuarial losses/(gains) included in net periodic pension cost, gross
|
$
|
5,514
|
$
|
(7,236
|
)
|
$
|
(13,904
|
)
|
||||
|
Tax effect
|
(2,108
|
)
|
2,774
|
5,374
|
||||||||
|
Amortization of actuarial losses/(gains) included in net periodic pension cost, net
|
3,406
|
(4,462
|
)
|
(8,530
|
)
|
|||||||
|
Amortization of prior service cost included in net periodic pension cost, gross
|
(136
|
)
|
(170
|
)
|
(1,698
|
)
|
||||||
|
Tax effect
|
52
|
65
|
657
|
|||||||||
|
Amortization of prior service cost included in net periodic pension cost, net
|
(84
|
)
|
(105
|
)
|
(1,041
|
)
|
||||||
|
Other comprehensive income/(loss) related to pension and other post retirement obligations, net of taxes
|
3,322
|
(4,567
|
)
|
(9,571
|
)
|
|||||||
|
Unrealized (losses)gains on securities:
|
||||||||||||
|
Net unrealized holding (losses)/gains arising during period, gross
|
(24,042
|
)
|
(9,209
|
)
|
106,040
|
|||||||
|
Tax effect
|
9,328
|
2,289
|
(39,203
|
)
|
||||||||
|
Net unrealized holding (losses)/gains arising during period, net
|
(14,714
|
)
|
(6,920
|
)
|
66,837
|
|||||||
|
Reclassification adjustment for net losses included in net income, gross
|
0
|
4
|
0
|
|||||||||
|
Tax effect
|
0
|
(2
|
)
|
0
|
||||||||
|
Reclassification adjustment for net losses included in net income, net
|
0
|
2
|
0
|
|||||||||
|
Other comprehensive (loss)/income related to unrealized (losses)/gains on
available-for-sale securities, net of taxes
|
(14,714
|
)
|
(6,918
|
)
|
66,837
|
|||||||
|
Other comprehensive (loss)/income, net of tax
|
(11,392
|
)
|
(11,485
|
)
|
57,266
|
|||||||
|
Net income
|
103,812
|
91,230
|
91,353
|
|||||||||
|
Comprehensive income
|
$
|
92,420
|
$
|
79,745
|
$
|
148,619
|
||||||
|
As of December 31,
|
||||||||||||
|
2016
|
2015
|
2014
|
||||||||||
|
Accumulated Other Comprehensive Income By Component:
|
||||||||||||
|
Unrealized loss for pension and other postretirement obligations
|
$
|
(28,969
|
)
|
$
|
(34,347
|
)
|
$
|
(26,941
|
)
|
|||
|
Tax effect
|
11,008
|
13,064
|
10,225
|
|||||||||
|
Net unrealized loss for pension and other postretirement obligations
|
(17,961
|
)
|
(21,283
|
)
|
(16,716
|
)
|
||||||
|
Unrealized gain on available-for-sale securities
|
41,793
|
65,835
|
75,039
|
|||||||||
|
Tax effect
|
(15,989
|
)
|
(25,317
|
)
|
(27,603
|
)
|
||||||
|
Net unrealized gain on available-for-sale securities
|
25,804
|
40,518
|
47,436
|
|||||||||
|
Accumulated other comprehensive income
|
$
|
7,843
|
$
|
19,235
|
$
|
30,720
|
||||||
The accompanying notes are an integral part of the consolidated financial statements.
56
| COMMUNITY BANK SYSTEM, INC. | ||||||||||||||||||||||||||||
| CONSOLIDATED STATEMENTS OF CHANGES IN SHAREHOLDERS' EQUITY | ||||||||||||||||||||||||||||
| Years ended December 31, 2014, 2015 and 2016 | ||||||||||||||||||||||||||||
| (In Thousands, Except Share Data) | ||||||||||||||||||||||||||||
|
Common Stock
|
Additional Paid-in Capital
|
Accumulated | ||||||||||||||||||||||||||
|
Shares Outstanding
|
Amount Issued
|
Retained Earnings
|
Other Comprehensive (Loss)/Income
|
Treasury Stock
|
Total
|
|||||||||||||||||||||||
|
Balance at December 31, 2013
|
40,431,318
|
$
|
41,213
|
$
|
396,528
|
$
|
481,732
|
$
|
(26,546
|
)
|
$
|
(17,115
|
)
|
$
|
875,812
|
|||||||||||||
|
Net income
|
91,353
|
91,353
|
||||||||||||||||||||||||||
|
Other comprehensive income, net of tax
|
57,266
|
57,266
|
||||||||||||||||||||||||||
|
Dividends declared:
|
||||||||||||||||||||||||||||
|
Common, $1.16 per share
|
(47,100
|
)
|
(47,100
|
)
|
||||||||||||||||||||||||
|
Common stock issued under
employee stock plan,
including tax benefits of $2,068
|
399,013
|
393
|
8,891
|
133
|
9,417
|
|||||||||||||||||||||||
|
Stock-based compensation
|
3,993
|
3,993
|
||||||||||||||||||||||||||
|
Treasury stock purchased
|
(123,000
|
)
|
(4,368
|
)
|
(4,368
|
)
|
||||||||||||||||||||||
|
Treasury stock issued to benefit plan
|
40,390
|
572
|
959
|
1,531
|
||||||||||||||||||||||||
|
Balance at December 31, 2014
|
40,747,721
|
41,606
|
409,984
|
525,985
|
30,720
|
(20,391
|
)
|
987,904
|
||||||||||||||||||||
|
Net income
|
91,230
|
91,230
|
||||||||||||||||||||||||||
|
Other comprehensive loss, net of tax
|
(11,485
|
)
|
(11,485
|
)
|
||||||||||||||||||||||||
|
Dividends declared:
|
||||||||||||||||||||||||||||
|
Common, $1.22 per share
|
(50,624
|
)
|
(50,624
|
)
|
||||||||||||||||||||||||
|
Common stock issued under
employee stock plan,
including tax benefits of $2,297
|
458,817
|
459
|
9,315
|
9,774
|
||||||||||||||||||||||||
|
Stock-based compensation
|
4,201
|
4,201
|
||||||||||||||||||||||||||
|
Stock issued for acquisition
|
2,377,329
|
2,378
|
99,824
|
102,202
|
||||||||||||||||||||||||
|
Treasury stock purchased
|
(265,230
|
)
|
(9,126
|
)
|
(9,126
|
)
|
||||||||||||||||||||||
|
Treasury stock issued to benefit plan
|
456,223
|
4,691
|
11,880
|
16,571
|
||||||||||||||||||||||||
|
Balance at December 31, 2015
|
43,774,860
|
44,443
|
528,015
|
566,591
|
19,235
|
(17,637
|
)
|
1,140,647
|
||||||||||||||||||||
|
Net income
|
103,812
|
103,812
|
||||||||||||||||||||||||||
|
Other comprehensive loss, net of tax
|
(11,392
|
)
|
(11,392
|
)
|
||||||||||||||||||||||||
|
Dividends declared:
|
||||||||||||||||||||||||||||
|
Common, $1.26 per share
|
(55,711
|
)
|
(55,711
|
)
|
||||||||||||||||||||||||
|
Common stock issued under
employee stock plan,
including tax benefits of $3,091
|
507,784
|
507
|
10,036
|
10,543
|
||||||||||||||||||||||||
|
Stock-based compensation
|
4,783
|
4,783
|
||||||||||||||||||||||||||
|
Treasury stock purchased
|
(67,826
|
)
|
(3,470
|
)
|
(3,470
|
)
|
||||||||||||||||||||||
|
Treasury stock issued to benefit plan
|
222,597
|
2,941
|
5,947
|
8,888
|
||||||||||||||||||||||||
|
Balance at December 31, 2016
|
44,437,415
|
$
|
44,950
|
$
|
545,775
|
$
|
614,692
|
$
|
7,843
|
$
|
(15,160
|
)
|
$
|
1,198,100
|
||||||||||||||
The accompanying notes are an integral part of the consolidated financial statements.
57
|
COMMUNITY BANK SYSTEM, INC.
|
||||||||||||
|
|
||||||||||||
|
(In Thousands of Dollars)
|
Years Ended December 31,
|
|||||||||||
|
|
2016
|
2015
|
2014
|
|||||||||
|
Operating activities:
|
||||||||||||
|
Net income
|
$
|
103,812
|
$
|
91,230
|
$
|
91,353
|
||||||
|
Adjustments to reconcile net income to net cash provided by operating activities:
|
||||||||||||
|
Depreciation
|
14,398
|
13,132
|
13,082
|
|||||||||
|
Amortization of intangible assets
|
5,479
|
3,663
|
4,287
|
|||||||||
|
Net (accretion)/amortization on securities, loans and borrowings
|
(4,405
|
)
|
(3,289
|
)
|
(3,533
|
)
|
||||||
|
Stock-based compensation
|
4,783
|
4,201
|
3,993
|
|||||||||
|
Provision for loan losses
|
8,076
|
6,447
|
7,178
|
|||||||||
|
Provision for deferred income taxes
|
13,066
|
10,716
|
7,461
|
|||||||||
|
Amortization of mortgage servicing rights
|
518
|
409
|
444
|
|||||||||
|
Income from bank-owned life insurance policies
|
(1,505
|
)
|
(1,086
|
)
|
(1,037
|
)
|
||||||
|
Loss on sales of investment securities, net
|
0
|
4
|
0
|
|||||||||
|
Net gain on sale of loans and other assets
|
(837
|
)
|
(180
|
)
|
(154
|
)
|
||||||
|
Change in other assets and liabilities
|
(12,124
|
)
|
(8,784
|
)
|
(970
|
)
|
||||||
|
Net cash provided by operating activities
|
131,261
|
116,463
|
122,104
|
|||||||||
|
Investing activities:
|
||||||||||||
|
Proceeds from sales of available-for-sale investment securities
|
0
|
221,136
|
0
|
|||||||||
|
Proceeds from maturities of available-for-sale investment securities
|
109,638
|
169,562
|
137,282
|
|||||||||
|
Proceeds from maturities of other securities
|
8,703
|
1,790
|
13
|
|||||||||
|
Purchases of available-for-sale investment securities
|
(65,966
|
)
|
(503,000
|
)
|
(310,517
|
)
|
||||||
|
Purchases of other securities
|
(4,612
|
)
|
0
|
(7,500
|
)
|
|||||||
|
Net change in loans
|
(159,871
|
)
|
(176,754
|
)
|
(137,207
|
)
|
||||||
|
Cash received/(paid) for acquisitions, net of cash acquired of $0, $81,772, and $0,
respectively
|
(575
|
)
|
25,505
|
(924
|
)
|
|||||||
|
Settlement of bank owned life insurance policies
|
3,127
|
0
|
1,097
|
|||||||||
|
Purchases of premises and equipment, net
|
(12,442
|
)
|
(12,400
|
)
|
(13,376
|
)
|
||||||
|
Net cash used in investing activities
|
(121,998
|
)
|
(274,161
|
)
|
(331,132
|
)
|
||||||
|
Financing activities:
|
||||||||||||
|
Net change in deposits
|
202,480
|
238,969
|
39,220
|
|||||||||
|
Net change in borrowings, net of payments of $0, $0 and $13
|
(155,100
|
)
|
(36,700
|
)
|
196,087
|
|||||||
|
Issuance of common stock
|
10,543
|
9,774
|
9,417
|
|||||||||
|
Purchase of treasury stock
|
(3,470
|
)
|
(9,126
|
)
|
(4,368
|
)
|
||||||
|
Sale of treasury stock
|
8,888
|
16,571
|
1,531
|
|||||||||
|
Cash dividends paid
|
(55,048
|
)
|
(49,273
|
)
|
(46,178
|
)
|
||||||
|
Tax benefits from share-based payment arrangements
|
3,091
|
2,297
|
2,068
|
|||||||||
|
Net cash provided by financing activities
|
11,384
|
172,512
|
197,777
|
|||||||||
|
Change in cash and cash equivalents
|
20,647
|
14,814
|
(11,251
|
)
|
||||||||
|
Cash and cash equivalents at beginning of year
|
153,210
|
138,396
|
149,647
|
|||||||||
|
Cash and cash equivalents at end of year
|
$
|
173,857
|
$
|
153,210
|
$
|
138,396
|
||||||
|
Supplemental disclosures of cash flow information:
|
||||||||||||
|
Cash paid for interest
|
$
|
11,268
|
$
|
11,252
|
$
|
11,937
|
||||||
|
Cash paid for income taxes
|
32,239
|
28,891
|
29,457
|
|||||||||
|
Supplemental disclosures of noncash financing and investing activities:
|
||||||||||||
|
Dividends declared and unpaid
|
14,268
|
13,605
|
12,254
|
|||||||||
|
Transfers from loans to other real estate
|
2,612
|
3,943
|
2,546
|
|||||||||
|
Acquisitions:
|
||||||||||||
|
Common stock issued
|
0
|
102,202
|
0
|
|||||||||
|
Fair value of assets acquired, excluding acquired cash and intangibles
|
0
|
675,025
|
64
|
|||||||||
|
Fair value of liabilities assumed
|
0
|
700,574
|
0
|
|||||||||
The accompanying notes are an integral part of the consolidated financial statements.
58
COMMUNITY BANK SYSTEM, INC.
NOTE A: SUMMARY OF SIGNIFICANT ACCOUNTING POLICIES
Nature of Operations
Community Bank System, Inc. (the "Company") is a registered financial holding company which wholly-owns two significant consolidated subsidiaries: Community Bank, N.A. (the "Bank" or "CBNA"), and Benefit Plans Administrative Services, Inc. ("BPAS"). As of December 31, 2016, BPAS owns four subsidiaries: Benefit Plans Administrative Services, LLC ("BPA"), a provider of defined benefit contribution plan administration services; BPAS Actuarial & Pension Services, LLC ("BPAS-APS") (formally known as Harbridge Consulting Group, LLC), a provider of actuarial and benefit consulting services; BPAS Trust Company of Puerto Rico, a Puerto Rican trust company; and Hand Benefits & Trust Company ("HB&T"), a provider of collective investment fund administration and institutional trust services. HB&T owns one subsidiary, Hand Securities Inc. ("HSI"), an introducing broker-dealer. The Company also wholly-owns two unconsolidated subsidiary business trusts formed for the purpose of issuing mandatorily-redeemable preferred securities which are considered Tier I capital under regulatory capital adequacy guidelines (see Note P).
As of December 31, 2016, the Bank operated 193 full service branches under the Community Bank, N.A. name throughout 35 counties of Upstate New York and six counties of Northeastern Pennsylvania offering a range of commercial and retail banking services. The Bank owns the following operating subsidiaries: The Carta Group, Inc. ("Carta Group"), CBNA Preferred Funding Corporation ("PFC"), CBNA Treasury Management Corporation ("TMC"), Community Investment Services, Inc. ("CISI"), Nottingham Advisors, Inc. ("Nottingham"), OneGroup NY, Inc. ("OneGroup"), Oneida Wealth Management, Inc. ("OWM"), and Oneida Preferred Funding II LLC ("OPFC II"). OneGroup is a full-service insurance agency offering personal and commercial property insurance and other risk management products and services. On August 19, 2016, the Company merged its insurance subsidiary CBNA Insurance Agency, Inc. ("CBNA Insurance") into OneGroup. PFC and OPFC II primarily act as investors in residential real estate loans and properties. TMC provides cash management, investment, and treasury services to the Bank. CISI, The Carta Group and OWM provide broker-dealer and investment advisory services. On April 22, 2016, the Company merged the activities of OWM into CISI. Nottingham provides asset management services to individuals, corporations, corporate pension and profit sharing plans, and foundations.
Principles of Consolidation
The consolidated financial statements include the accounts of the Company and its subsidiaries. All intercompany accounts and transactions have been eliminated in consolidation.
Variable Interest Entities ("VIE") are legal entities in which equity investors do not have the characteristics of a controlling financial interest or do not have sufficient equity at risk for the legal entities to finance its activities without additional subordinated financial support. VIEs may be required to be consolidated by a company if it is determined the company is the primary beneficiary of a VIE. The primary beneficiary of a VIE is the enterprise that has: (1) the power to direct the activities of the VIE that most significantly impact the VIE's economic performance, and (2) the obligation to absorb losses of the VIE that could potentially be significant to the VIE or the right to receive benefits of the VIE that could potentially be significant to the VIE. The Company's VIE's are described in more detail in Note T to the consolidated financial statements.
Critical Accounting Estimates in the Preparation of Financial Statements
The preparation of financial statements in conformity with accounting principles generally accepted in the United States of America requires management to make estimates and assumptions that affect the reported amounts of assets and liabilities and disclosure of contingent assets and liabilities at the date of the financial statements and the reported amounts of revenues and expenses during the reporting period. Actual results could differ from those estimates. Critical accounting estimates include the allowance for loan losses, actuarial assumptions associated with the pension, post-retirement and other employee benefit plans, the provision for income taxes, investment valuation and other-than-temporary impairment, the carrying value of goodwill and other intangible assets, and acquired loan valuations.
Risk and Uncertainties
In the normal course of its business, the Company encounters economic and regulatory risks. There are three main components of economic risk: interest rate risk, credit risk and market risk. The Company is subject to interest rate risk to the degree that its interest-bearing liabilities mature or reprice at different speeds, or on different basis, from its interest-earning assets. The Company's primary credit risk is the risk of default on the Company's loan portfolio that results from the borrowers' inability or unwillingness to make contractually required payments. Market risk reflects potential changes in the value of collateral underlying loans, the fair value of investment securities, and loans held for sale.
The Company is subject to regulations of various governmental agencies. These regulations can change significantly from period to period. The Company also undergoes periodic examinations by the regulatory agencies which may subject it to further changes with respect to asset valuations, amounts of required loan loss allowances, and operating restrictions resulting from the regulators' judgments based on information available to them at the time of their examinations.
59
Revenue Recognition
The Company recognizes income on an accrual basis. CISI, OWM and Carta Group recognize fee income when investment and insurance products are sold to customers. Nottingham provides asset management services to brokerage firms and clients and recognizes income ratably over the contract period during which service is performed. Revenue from BPA's administration and recordkeeping services is recognized ratably over the service contract period. Revenue from consulting and actuarial services is recognized when services are rendered. OneGroup recognizes commission revenue at the later of
the effective date of the insurance policy, or the date on which the policy premium is billed to the customer. At that date, the earnings process has been completed and the impact of refunds for policy cancellations can be reasonably estimated to establish reserves. The reserve for policy cancellations is based upon historical cancellation experience adjusted for known circumstances.
All intercompany revenue and expense among related entities are eliminated in consolidation.
Cash and Cash Equivalents
For purposes of reporting cash flows, cash and cash equivalents include cash on hand, amounts due from banks, and highly liquid investments with original maturities of less than 90 days. The carrying amounts reported in the balance sheet for cash and cash equivalents approximate those assets' fair values.
Investment Securities
The Company can classify its investments in debt and equity securities as trading, held-to-maturity, or available-for-sale. Held-to-maturity securities are those for which the Company has the positive intent and ability to hold until maturity, and are reported at amortized cost. The Company did not use the held-to-maturity classification in 2015 or 2016. Securities classified as available-for-sale are reported at fair value with net unrealized gains and losses reflected as a separate component of shareholders' equity, net of applicable income taxes. None of the Company's investment securities have been classified as trading securities at December 31, 2016. Certain equity securities are stated at cost and include restricted stock of the Federal Reserve Bank of New York ("Federal Reserve") and Federal Home Loan Bank of New York ("FHLB").
Fair values for investment securities are based upon quoted market prices, where available. If quoted market prices are not available, fair values are based upon quoted market prices of comparable instruments, or a discounted cash flow model using market estimates of interest rates and volatility.
The Company conducts an assessment of all securities in an unrealized loss
position to determine if other-than-temporary impairment ("OTTI") exists on a quarterly basis. An unrealized loss exists when the current fair value of an individual security is less than its amortized cost basis. The OTTI assessment considers the security structure, recent security collateral performance metrics, if applicable, external credit ratings, failure of the issuer to make scheduled interest or principal payments, judgment about and expectations of future performance, and relevant independent industry research, analysis, and forecasts. The severity of the impairment and the length of time the security has been impaired is also considered in the assessment. The assessment of whether an OTTI decline exists is performed on each security, regardless of the classification of the security as available-for-sale or held-to-maturity, and involves a high degree of subjectivity and judgment that is based on the information available to management at a point in time.
An OTTI loss must be recognized for a debt security in an unrealized loss position if there is intent to sell the security or it is more likely than not the Company will be required to sell the security prior to recovery of its amortized cost basis. In this situation, the amount of loss recognized in income is equal to the difference between the fair value and the amortized cost basis of the security. Even if management does not have the intent, and it is not more likely than not that the Company will be required to sell the securities, an evaluation of the expected cash flows to be received is performed to determine if a credit loss has occurred. For debt securities, a critical component of the evaluation for OTTI is the identification of credit-impaired securities, where the Company does not expect to receive cash flows sufficient to recover the entire amortized cost basis of the security. In the event of a credit loss, only the amount of impairment associated with the credit loss would be recognized in income. The portion of the unrealized loss relating to other factors, such as liquidity conditions in the market or changes in market interest rates, is recorded in accumulated other comprehensive loss.
Equity securities are also evaluated to determine whether the unrealized loss is expected to be recoverable based on whether evidence exists to support a realizable value equal to or greater than the amortized cost basis. If it is probable that the amortized cost basis will not be recovered, taking into consideration the estimated recovery period and the ability to hold the equity security until recovery, OTTI is recognized in earnings equal to the difference between the fair value and the amortized cost basis of the security.
The specific identification method is used in determining the realized gains and losses on sales of investment securities and OTTI charges. Premiums and discounts on securities are amortized and accreted, respectively, on the interest method basis over the period to maturity or estimated life of the related security. Purchases and sales of securities are recognized on a trade date basis.
60
Loans
Loans are stated at unpaid principal balances, net of unearned income. Mortgage loans held for sale are carried at fair value and are included in loans held for sale on the balance sheet. Fair values for variable rate loans that reprice frequently are based on carrying values. Fair values for fixed rate loans are estimated using discounted cash flows and interest rates currently being offered for loans with similar terms to borrowers of similar credit quality. The carrying amount of accrued interest approximates its fair value.
Interest on loans is accrued and credited to operations based upon the principal amount outstanding. Nonrefundable loan fees and related direct costs are deferred and included in the loan balances where they are amortized over the life of the loan as an adjustment to loan yield using the effective yield method. Premiums and discounts on purchased loans are amortized using the effective yield method over the life of the loans.
Acquired loans
Acquired loans are initially recorded at their acquisition date fair values. The carryover of allowance for loan losses is prohibited as any credit losses in the loans are included in the determination of the fair value of the loans at the acquisition date. Fair values for acquired loans are based on a discounted cash flow methodology that involves assumptions and judgments as to credit risk, prepayment risk, liquidity risk, default rates, loss severity, payment speeds, collateral values and discount rate.
Acquired impaired loans
Acquired loans that have evidence of deterioration in credit quality since origination and for which it is probable, at acquisition, that the Company will be unable to collect all contractually required payments are accounted for as impaired loans under ASC 310-30. The excess of undiscounted cash flows expected at acquisition over the estimated fair value is referred to as the accretable discount and is recognized into interest income over the remaining life of the loans using the interest method. The difference between contractually required payments at acquisition and the undiscounted cash flows expected to be collected at acquisition is referred to as the non-accretable discount. The non-accretable discount represents estimated future credit losses and other contractually required payments that the Company does not expect to collect. Subsequent decreases in expected cash flows are recognized as impairments through a charge to the provision for credit losses resulting in an increase in the allowance for loan losses. Subsequent improvements in expected cash flows result in a recovery of previously recorded allowance for loan losses or a reversal of a corresponding amount of the non-accretable discount, which the Company then reclassifies as an accretable discount that is recognized into interest income over the remaining life of the loans using the interest method.
Acquired loans that met the criteria for non-accrual of interest prior to acquisition may be considered performing upon acquisition, regardless of whether the customer is contractually delinquent, if the Company can reasonably estimate the timing and amount of the expected cash flows on such loans and if the Company expects to fully collect the new carrying value of the loans. As such, the Company may no longer consider the loan to be non-accrual or non-performing and may accrue interest on these loans, including the impact of any accretable discount.
Acquired non-impaired loans
Acquired loans that do not meet the requirements under ASC 310-30 are considered acquired non-impaired loans. The difference between the acquisition date fair value and the outstanding balance represents the fair value adjustment for a loan and includes both credit and interest rate considerations. Fair value adjustments may be discounts (or premiums) to a loan's cost basis and are accreted (or amortized) to net interest income (or expense) over the loan's remaining life in accordance with ASC 310-20. Fair value adjustments for revolving loans are accreted (or amortized) using a straight line method. Term loans are accreted (or amortized) using the constant effective yield method.
Subsequent to the purchase date, the methods used to estimate the allowance for loan losses for the acquired non-impaired loans is consistent with the policy described below. However, the Company compares the net realizable value of the loans to the carrying value, for loans collectively evaluated for impairment. The carrying value represents the net of the loan's unpaid principal balance and the remaining purchase discount (or premium) that has yet to be accreted (or amortized) into interest income (or interest expense). When the carrying value exceeds the net realizable value, an allowance for loan losses is recognized.
Impaired and Other Nonaccrual Loans
The Company places a loan on nonaccrual status when the loan becomes 90 days past due (or sooner, if management concludes collection is doubtful), except when, in the opinion of management, it is well-collateralized and in the process of collection. A loan may be placed on nonaccrual status earlier than ninety days past due if there is deterioration in the financial position of the borrower or if other conditions of the loan so warrant. When a loan is placed on nonaccrual status, uncollected accrued interest is reversed against interest income and the amortization of nonrefundable loan fees and related direct costs is discontinued. Interest income during the period the loan is on nonaccrual status is recorded on a cash basis after recovery of principal is reasonably assured. Nonaccrual loans are returned to accrual status when management determines that the borrower's performance has improved and that both principal and interest are collectible. This generally requires a sustained period of timely principal and interest payments and a well-documented credit evaluation of the borrower's financial condition.
61
A loan is considered modified in a troubled debt restructuring ("TDR") when, due to a borrower's financial difficulties, the Company makes a concession(s) to the borrower that it would not otherwise consider. These modifications may include, among others, an extension for the term of the loan, or granting a period when interest–only payments can be made with the principal payments and interest caught up over the remaining term of the loan or at maturity. Generally, a nonaccrual loan that has been modified in a TDR remains on nonaccrual status for a period of 12 months to demonstrate that the borrower is able to meet the terms of the modified loan. If the borrower's ability to meet the revised payment schedule is uncertain, the loan remains on nonaccrual status.
Regulatory guidance issued by the OCC requires certain loans that have been discharged in Chapter 7 bankruptcy to be reported as TDRs. In accordance with this new guidance, loans that have been discharged in Chapter 7 bankruptcy but not reaffirmed by the borrower are classified as TDRs, irrespective of payment history or delinquency status, even if the repayment terms for the loan have not been otherwise modified and the Company's lien position against the underlying collateral remains unchanged. Pursuant to that guidance, the Company records a charge-off equal to any portion of the carrying value that exceeds the net realizable value of the collateral.
Commercial loans greater than $0.5 million are evaluated individually for impairment. A loan is considered impaired, based on current information and events, if it is probable that the Company will be unable to collect the scheduled payments of principal or interest when due according to the contractual terms of the loan agreement. The measurement of impaired loans is generally based upon the present value of expected future cash flows or the fair value of the collateral, if the loan is collateral-dependent.
The Company's charge-off policy by loan type is as follows:
|
·
|
Business lending loans are generally charged-off to the extent outstanding principal exceeds the fair value of estimated proceeds from collection efforts, including liquidation of collateral. The charge-off is recognized when the loss becomes reasonably quantifiable.
|
|
·
|
Consumer installment loans are generally charged-off to the extent outstanding principal balance exceeds the fair value of collateral, and are recognized by the end of the month in which the loan becomes 90 days past due.
|
|
·
|
Consumer mortgage and home equity loans are generally charged-off to the extent outstanding principal exceeds the fair value of the property, less estimated costs to sell, and are recognized when the loan becomes 180 days past due.
|
Allowance for Loan Losses
Management continually evaluates the credit quality of the Company's loan portfolio, and performs a formal review of the adequacy of the allowance for loan losses on a quarterly basis. The allowance reflects management's best estimate of probable losses inherent in the loan portfolio. Determination of the allowance is subjective in nature and requires significant estimates. The Company's allowance methodology consists of two broad components - general and specific loan loss allocations.
The general loan loss allocation is composed of two calculations that are computed on five main loan segments: business lending, consumer installment - direct, consumer installment - indirect, home equity and consumer mortgage. The first calculation is quantitative and determines an allowance level based on the latest 36 months of historical net charge-off data for each loan class (commercial loans exclude balances with specific loan loss allocations). The second calculation is qualitative and takes into consideration eight qualitative environmental factors: levels and trends in delinquencies and impaired loans; levels of and trends in charge-offs and recoveries; trends in volume and terms of loans; effects of any changes in risk selection and underwriting standards, and other changes in lending policies, procedures, and practices; experience, ability, and depth of lending management and other relevant staff; national and local economic trends and conditions; industry conditions; and effects of changes in credit concentrations. A component of the qualitative calculation is the unallocated allowance for loan loss. The qualitative and quantitative calculations are added together to determine the general loan loss allocation. The specific loan loss allocation relates to individual commercial loans that are both greater than $0.5 million and in a nonaccruing status with respect to interest. Specific loan losses are based on discounted estimated cash flows, including any cash flows resulting from the conversion of collateral or collateral shortfalls. The allowance levels computed from the specific and general loan loss allocation methods are combined with unallocated allowances and allowances needed for acquired loans to derive the total required allowance for loan losses to be reflected on the Consolidated Statement of Condition.
Loan losses are charged off against the allowance, while recoveries of amounts previously charged off are credited to the allowance. A provision for loan losses is charged to operations based on management's periodic evaluation of factors previously mentioned.
Intangible Assets
Intangible assets include core deposit intangibles, customer relationship intangibles and goodwill arising from acquisitions. Core deposit intangibles and customer relationship intangibles are amortized on either an accelerated or straight-line basis over periods ranging from seven to 20 years. The initial and ongoing carrying value of goodwill and other intangible assets is based upon discounted cash flow modeling techniques that require management to make estimates regarding the amount and timing of expected future cash flows. It also requires use of a discount rate that reflects the current return requirements of the market in relation to present risk-free interest rates, required equity market premiums, peer volatility indicators, and company-specific risk indicators.
62
The Company evaluates goodwill for impairment on an annual basis, or more often if events or circumstances indicate there may be impairment. The implied fair value of a reporting unit's goodwill is compared to its carrying amount and the impairment loss is measured by the excess of the carrying value over fair value. The fair value of each reporting unit is compared to the carrying amount of that reporting unit in order to determine if impairment is indicated.
Premises and Equipment
Premises and equipment are stated at cost less accumulated depreciation. Computer software costs that are capitalized only include external direct costs of obtaining and installing the software. The Company has not developed any internal use software. Depreciation is calculated using the straight-line method over the estimated useful lives of the assets. Useful lives range from three to 10 years for equipment; three to seven years for software and hardware; and 10 to 40 years for building and building improvements. Land improvements are depreciated over 20 years and leasehold improvements are amortized over the shorter of the term of the respective lease plus any optional renewal periods that are reasonably assured or life of the asset. Maintenance and repairs are charged to expense as incurred.
Other Real Estate
Other real estate owned is comprised of properties acquired through foreclosure, or by deed in lieu of foreclosure. These assets are carried at fair value less estimated costs of disposal. At foreclosure, if the fair value, less estimated costs to sell, of the real estate acquired is less than the Company's recorded investment in the related loan, a write-down is recognized through a charge to the allowance for loan losses. Any subsequent reduction in value is recognized by a charge to income. Operating costs associated with the properties are charged to expense as incurred. At December 31, 2016 and 2015, other real estate amounted to $2.0 million and $2.1 million, respectively, and is included in other assets.
Mortgage Servicing Rights
Originated mortgage servicing rights are recorded at their fair value at the time of sale of the underlying loan, and are amortized in proportion to and over the period of estimated net servicing income or loss. The Company uses a valuation model that calculates the present value of future cash flows to determine the fair value of servicing rights. In using this valuation method, the Company incorporates assumptions that market participants would use in estimating future net servicing income, which includes estimates of the servicing cost per loan, the discount rate, and prepayment speeds. The carrying value of the originated mortgage servicing rights is included in other assets and is evaluated quarterly for impairment using these same market assumptions. The amount of impairment recognized is the amount by which the carrying value of the capitalized servicing rights for a stratum exceeds estimated fair value. Impairment is recognized through a valuation allowance.
Treasury Stock
Repurchases of shares of the Company's common stock are recorded at cost as a reduction of shareholders' equity. Reissuance of shares of treasury stock is recorded at average cost.
Income Taxes
The Company and its subsidiaries file a consolidated federal income tax return. Provisions for income taxes are based on taxes currently payable or refundable as well as deferred taxes that are based on temporary differences between the tax basis of assets and liabilities and their reported amounts in the financial statements. Deferred tax assets and liabilities are reported in the financial statements at currently enacted income tax rates applicable to the period in which the deferred tax assets and liabilities are expected to be realized or settled.
Benefits from tax positions should be recognized in the financial statements only when it is more likely than not that the tax position will be sustained upon examination by the appropriate taxing authority having full knowledge of all relevant information. A tax position meeting the more-likely-than-not recognition threshold should be measured at the largest amount of benefit for which the likelihood of realization upon ultimate settlement exceeds 50 percent.
Retirement Benefits
The Company provides defined benefit pension benefits to eligible employees and post-retirement health and life insurance benefits to certain eligible retirees. The Company also provides deferred compensation and supplemental executive retirement plans for selected current and former employees, officers, and directors. Expense under these plans is charged to current operations and consists of several components of net periodic benefit cost based on various actuarial assumptions regarding future experience under the plans, including discount rate, rate of future compensation increases and expected return on plan assets.
Assets Under Management or Administration
Assets held in fiduciary or agency capacities for customers are not included in the accompanying consolidated statements of condition as they are not assets of the Company. All fees associated with providing asset management services are recorded on an accrual basis of accounting and are included in noninterest income.
Advertising
Advertising costs amounting to approximately $3.9 million, $3.6 million and $3.2 million for the years ending December 31, 2016, 2015 and 2014, respectively, are nondirect response in nature and expensed as incurred.
63
Earnings Per Share
Using the two-class method, basic earnings per common share is computed based upon net income available to common shareholders divided by the weighted average number of common shares outstanding during each period, which excludes the outstanding unvested restricted stock. Diluted earnings per share is computed using the weighted average number of common shares determined for the basic earnings per common share computation plus the dilutive effect of stock options using the treasury stock method. Stock options where the exercise price is greater than the average market price of common shares were not included in the computation of earnings per diluted share as they would have been anti-dilutive.
Stock-based Compensation
Companies are required to measure and record compensation expense for stock options and other share-based payments on the instruments' fair value on the date of grant. Stock-based compensation expense is recognized ratably over the requisite service period for all awards (see Note L).
Fair Values of Financial Instruments
The Company determines fair values based on quoted market values where available or on estimates using present values or other valuation techniques. Those techniques are significantly affected by the assumptions used, including the discount rate and estimates of future cash flows. In that regard, the derived fair value estimates cannot be substantiated by comparison to independent markets and, in many cases, could not be realized in immediate settlement of the instrument. Certain financial instruments and all nonfinancial instruments are excluded from this disclosure requirement. Accordingly, the aggregate fair value amounts presented do not represent the underlying value of the Company. The fair values of investment securities, loans, deposits, and borrowings have been disclosed in Note R.
Reclassifications
Certain reclassifications have been made to prior years' balances to conform to the current year presentation.
New Accounting Pronouncements
In May 2014, the FASB issued ASU No. 2014-09,
Revenue from Contracts with Customers (Topic 606)
. This new guidance supersedes the revenue recognition requirements in ASC 605, Revenue Recognition, and is based on the principle that revenue is recognized to depict the transfer of goods or services to customers in an amount that reflects consideration to which the entity expects to be entitled in exchange for those goods and services. The ASU also requires additional disclosure about the nature, amount, timing and uncertainty of revenue and cash flows arising from customer contracts, including significant judgments and changes in judgments and assets recognized from costs incurred to obtain or fulfill a contract. This guidance is effective for the Company for annual and interim periods beginning after December 15, 2017, and should be applied either retrospectively to each prior reporting period presented or retrospectively with the cumulative effect of initially applying this guidance recognized at the date of initial application. The Company's implementation efforts include the identification of revenue within the scope of the guidance, as well as evaluation of revenue contracts. The Company's review is ongoing, and the Company will continue to evaluate any impact as additional guidance is issued and as our internal assessment progresses.
In January 2016, the FASB issued ASU 2016-01,
Financial Instruments - Overall (Subtopic 825-10): Recognition and Measurement of Financial Assets and Financial Liabilities.
This guidance addresses certain aspects of recognition, measurement, presentation and disclosure of financial instruments. The primary focus of this guidance is to supersede the guidance to classify equity securities with readily determinable fair values into different categories (trading or available-for-sale) and requires equity securities to be measured at fair value with changes in the fair value recognized through net income. This guidance requires adoption through a cumulative-effect adjustment to the balance sheet as of the beginning of the fiscal year of adoption. This ASU is effective for fiscal years beginning after December 15, 2017, including interim periods within those fiscal years. Early adoption is permitted for all companies in any interim or annual period.
The Company is currently evaluating the effect the guidance will have on the Company's consolidated financial statements.
In February 2016, the FASB issued ASU 2016-02,
Leases (Topic 842)
. This new guidance supersedes the lease requirements in
Topic 840, Leases
and is based on the principle that a lessee should recognize in the statement of financial position a liability to make lease payments (the lease liability) and a right-of-use asset representing its right to use the underlying asset for the lease term. The accounting applied by a lessor is largely unchanged from that applied under the previous guidance. In addition, the guidance requires an entity to separate the lease components from the nonlease components in a contract. The ASU requires disclosures about the amount, timing, and judgments related to a reporting entity's accounting for leases and related cash flows. The standard is required to be applied to all leases in existence as of the date of adoption using a modified retrospective transition approach. This guidance is effective for fiscal years beginning after December 15, 2018, including interim periods within those fiscal years. Early adoption is permitted for all companies in any interim or annual period. The Company occupies certain offices and uses certain equipment under non-cancelable operating lease agreements, which currently are not reflected in its consolidated statement of condition. The Company expects to recognize lease liabilities and right of use assets associated with these lease agreements; however, the extent of the impact on the Company's consolidated financial statements is currently under evaluation.
64
In March 2016, the FASB issued ASU 2016-09,
Compensation – Stock Compensation (Topic 718)
. The amendments simplify several aspects of the accounting for share-based payment transactions, including the income tax consequences, classification of awards as either equity or liabilities and classification on the statement of cash flows. The new guidance requires all excess tax benefits and tax deficiencies be recognized as income tax expense or benefit in the income statement. The tax effects of exercised or vested awards should be treated as discrete items in the reporting period in which they occur. This guidance requires certain amendments to be applied through a cumulative-effect adjustment to equity as of the beginning of the fiscal period in which the guidance is adopted while other amendments are required to be applied retrospectively or prospectively. This ASU is effective for fiscal periods beginning after December 15, 2016, and interim periods within those annual periods. The Company expects adoption of the guidance will result in increased volatility to reported income tax expense related to excess tax benefits and tax deficiencies for share-based payment transactions; however, the actual amounts recognized in tax expense will be dependent on the amount of share-based transactions entered into and the Company's stock price on the date of exercise or vesting.
In June 2016, the FASB issued ASU No. 2016-13,
Financial Instruments – Credit Losses (Topic 326)
. This new guidance significantly changes how entities will measure credit losses for most financial assets and certain other instruments that are not measured at fair value through net income. This ASU will replace the "incurred loss" model under existing guidance with an "expected loss" model for instruments measured at amortized cost, and require entities to record allowances for available-for-sale debt securities rather than reduce the carrying amount, as they do today under the other-than-temporary impairment model. This ASU also simplifies the accounting model for purchased credit-impaired debt securities and loans. This guidance requires adoption through a cumulative-effect adjustment to retained earnings as of the beginning of the first reporting period in which the guidance is adopted. This ASU is effective for fiscal years beginning after December 15, 2019, including interim periods within those fiscal years. Early adoption is permitted for all companies as of fiscal years beginning after December 15, 2018, including interim periods within those fiscal years. The Company is currently evaluating the impact the guidance will have on the Company's consolidated financial statements, and expects an increase in the allowance for credit losses resulting from the change to expected losses for the estimated life of the financial asset, including an allowance for debt securities. The amount of the increase in the allowance for credit losses resulting from the new guidance will be impacted by the portfolio composition and asset quality at the adoption date, as well as economic conditions and forecasts at the time of adoption.
In August 2016, the FASB issued ASU No. 2016-15,
Statement of Cash Flows (Topic 230)
. The amendments provide guidance on the following eight specific cash flow issues: 1) debt prepayment or debt extinguishment costs; 2) settlement of zero-coupon debt instruments or other debt instruments with coupon interest rates that are insignificant in relation to the effective interest rate of the borrowing; 3) contingent consideration payments made after a business combination; 4) proceeds from the settlement of insurance claims; 5) proceeds from the settlement of corporate-owned life insurance policies, including bank-owned life insurance policies; 6) distributions received from equity method investees; 7) beneficial interests in securitization transactions; and 8) separately identifiable cash flows and application of the predominance principle. This ASU is effective for fiscal years beginning after December 31, 2017, including interim periods within those fiscal years. Early adoption is permitted, including adoption in an interim period. As this guidance only affects the classification within the statement of cash flows, this ASU is not expected to have a material impact on the Company's consolidated financial statements.
In January 2017, the FASB issued ASU No. 2017-04,
Intangibles-Goodwill and Other (Topic 350)
. The amendments simplify how an entity is required to test goodwill for impairment by eliminating the requirement to measure a goodwill impairment loss by comparing the implied fair value of a reporting unit's goodwill with the carrying amount of that goodwill. Instead, an entity will perform its goodwill impairment test by comparing the fair value of a reporting unit with its carrying amount, and recognize an impairment charge for the amount by which the carrying amount of the reporting unit exceeds its fair value. Impairment loss recognized under this new guidance will be limited to the goodwill allocated to the reporting unit. This ASU is effective prospectively for the Company for annual or interim goodwill impairment tests in fiscal years beginning after December 15, 2019. Early adoption is permitted for interim or annual goodwill impairment tests performed on testing dates after January 1, 2017. This ASU is not expected to have a material impact on the Company's consolidated financial statements.
NOTE B: ACQUISITIONS
Subsequent Event – Northeast Retirement Services, Inc.
On February 3, 2017, the Company completed its acquisition of Northeast Retirement Services, Inc. ("NRS") and its subsidiary Global Trust Company ("GTC") headquartered in Woburn, Massachusetts (see Note V).
Pending Acquisition – Merchants Bancshares, Inc.
On October 24, 2016, the Company announced that it had entered into a definitive agreement to acquire Merchants Bancshares, Inc. ("Merchants"), parent company of Merchants Bank headquartered in South Burlington, Vermont, for approximately $362 million in Company stock and cash. The acquisition will extend the Company's footprint into the Vermont and Western Massachusetts markets. Upon the completion of the merger, Community Bank will add 31 branch locations in Vermont and one location in Massachusetts with approximately $2.1 billion of assets, and deposits of $1.5 billion. The acquisition is expected to close during the second or third quarter of 2017, pending both customary regulatory and Merchants shareholder approval. The Company expects to incur certain one-time, transaction-related costs in 2017.
65
On January 4, 2016, the Company, through its subsidiary, CBNA Insurance, completed its acquisition of WJL Agencies Inc. doing business as The Clark Insurance Agencies ("WJL"), an insurance agency operating in northern New York. The Company paid $0.6 million in cash for the intangible assets of the company. Goodwill in the amount of $0.3 million and intangible assets in the amount of $0.3 million were recorded in conjunction with the acquisition. The effects of the acquired assets and liabilities have been included in the consolidated financial statements since that date. On August 19, 2016, the Company merged together its insurance subsidiaries and as of that date, the activities of CBNA Insurance were merged into OneGroup.
On December 4, 2015, the Company completed its acquisition of Oneida Financial Corp. ("Oneida"), parent company of Oneida Savings Bank, headquartered in Oneida, New York for approximately $158 million in Company stock and cash, comprised of $56.3 million of cash and the issuance of 2.38 million common shares. Upon the completion of the merger, the Bank added 12 branch locations in Oneida and Madison counties and approximately $769 million of assets, including approximately $399 million of loans and $226 million of investment securities, along with $699 million of deposits. Through the acquisition of Oneida, the Company acquired OneGroup and OWM as wholly-owned subsidiaries primarily engaged in offering insurance and investment advisory services. These subsidiaries complement the Company's other non-banking financial services businesses. The effects of the acquired assets and liabilities have been included in the consolidated financial statements since that date.
On January 1, 2014, the Company, through its subsidiary, BPAS-APS (formerly known as Harbridge Consulting Group, LLC), completed its acquisition of a professional services practice from EBS-RMSCO, Inc., a subsidiary of The Lifetime Healthcare Companies ("EBS-RMSCO"). This professional services practice, which provides actuarial valuation and consulting services to clients who sponsor pension and post-retirement medical and welfare plans, enhanced the Company's participation in the Western New York marketplace. The effects of the acquired assets and liabilities have been included in the consolidated financial statements since that date.
The assets and liabilities assumed in the acquisitions were recorded at their estimated fair values based on management's best estimates using information available at the dates of the acquisition, and are subject to adjustment based on updated information not available at the time of acquisition. During the first quarter of 2016, the carrying amount of other assets decreased by $0.9 million and other liabilities increased by $0.7 million as a result of adjustments made to fair value estimates recorded for the Oneida acquisition. Other assets decreased as a result of new information obtained related to the fair value calculation of loans partially offset by a decrease in the fair value adjustment made to accounts receivable for uncollectible accounts as actual cash receipts exceed anticipated cash receipts. Other liabilities increased as a result of updated information related to deferred taxes. Goodwill increased $1.6 million as a result of these changes in fair value estimates.
The above referenced acquisitions expanded the Company's geographical presence in New York and management expects that the Company will benefit from greater geographic diversity and the advantages of other synergistic business development opportunities. The following table summarizes the estimated fair value of the assets acquired and liabilities assumed.
|
(000s omitted)
|
2016
|
2015
|
2014
|
|||||||||
|
Consideration paid:
|
||||||||||||
|
Cash
|
$
|
575
|
$
|
56,266
|
$
|
924
|
||||||
|
Community Bank System, Inc. common stock
|
0
|
102,202
|
0
|
|||||||||
|
Total net consideration paid
|
575
|
158,468
|
924
|
|||||||||
|
Recognized amounts of identifiable assets
acquired and liabilities assumed:
|
||||||||||||
|
Cash and cash equivalents
|
0
|
81,772
|
0
|
|||||||||
|
Investment securities
|
0
|
225,729
|
0
|
|||||||||
|
Loans
|
0
|
399,422
|
0
|
|||||||||
|
Premises and equipment
|
0
|
22,212
|
0
|
|||||||||
|
Accrued interest receivable
|
0
|
1,133
|
0
|
|||||||||
|
Other assets
|
0
|
26,529
|
163
|
|||||||||
|
Core deposit intangibles
|
0
|
2,570
|
0
|
|||||||||
|
Other intangibles
|
288
|
9,994
|
578
|
|||||||||
|
Deposits
|
0
|
(699,241
|
)
|
0
|
||||||||
|
Other liabilities
|
0
|
(1,333
|
)
|
0
|
||||||||
|
Total identifiable assets (liabilities), net
|
288
|
68,787
|
741
|
|||||||||
|
Goodwill
|
$
|
287
|
$
|
89,681
|
$
|
183
|
||||||
66
Acquired loans that have evidence of deterioration in credit quality since origination and for which it is probable, at acquisition, that the Company will be unable to collect all contractually required payments were aggregated by comparable characteristics and recorded at fair value without a carryover of the related allowance for loan losses. Cash flows for each loan were determined using an estimate of credit losses and an estimated rate of prepayments. Projected monthly cash flows were then discounted to present value using a market-based discount rate. The excess of the undiscounted expected cash flows over the estimated fair value is referred to as the "accretable yield" and is recognized into interest income over the remaining lives of the acquired loans.
The following is a summary of the loans acquired from Oneida at the date of acquisition:
|
(000's omitted)
|
Acquired Impaired Loans
|
Acquired
Non-Impaired Loans
|
Total
Acquired
Loans
|
|||||||||
|
Contractually required principal and interest at acquisition
|
$
|
5,138
|
$
|
484,937
|
$
|
490,075
|
||||||
|
Contractual cash flows not expected to be collected
|
(1,977
|
)
|
(4,833
|
)
|
(6,810
|
)
|
||||||
|
Expected cash flows at acquisition
|
3,161
|
480,104
|
483,265
|
|||||||||
|
Interest component of expected cash flows
|
(341
|
)
|
(83,502
|
)
|
(83,843
|
)
|
||||||
|
Fair value of acquired loans
|
$
|
2,820
|
$
|
396,602
|
$
|
399,422
|
||||||
The fair value of checking, savings and money market deposit accounts acquired were assumed to approximate the carrying value as these accounts have no stated maturity and are payable on demand. Certificate of deposit accounts were valued at the present value of the certificates' expected contractual payments discounted at market rates for similar certificates.
The core deposit intangibles and other intangibles related to the EBS-RMSCO, Oneida and WJL acquisitions are being amortized using an accelerated method over their estimated useful life of approximately eight years. The goodwill, which is not amortized for book purposes, was assigned to the Banking and All Other segments for the Oneida acquisition, the Employee Benefit Services segment for the EBS-RMSCO acquisition, and to the All Other segment for WJL. The goodwill arising from the EBS-RMSCO and WJL deals is deductible for tax purposes. Goodwill arising from the Oneida acquisition is not deductible for tax purposes.
Direct costs related to the acquisitions were expensed as incurred. Merger and acquisition integration-related expenses amount to $1.7 million, $7.0 million and $0.1 million during 2016, 2015 and 2014, respectively, and have been separately stated in the Consolidated Statements of Income.
Supplemental Pro Forma Financial Information
The following unaudited condensed pro forma information assumes the Oneida acquisition had been completed as of January 1, 2014 for the year ended December 31, 2015 and December 31, 2014. The table below has been prepared for comparative purposes only and is not necessarily indicative of the actual results that would have been attained had the acquisition occurred as of the beginning of the years presented, nor is it indicative of the Company's future results. Furthermore, the unaudited pro forma information does not reflect management's estimate of any revenue-enhancing opportunities nor anticipated cost savings or the impact of conforming certain acquiree accounting policies to the Company's policies that may have occurred as a result of the integration and consolidation of the acquisitions.
The pro forma information set forth below reflects adjustments related to (a) certain purchase accounting fair value adjustments; and (b) amortization of customer lists and core deposit intangibles. Expenses totaling $14.0 million related to conversion of systems and other costs of integration, as well as certain one-time costs, are excluded from the pro forma year ended December 31, 2015 and were included in the pro forma year ended December 31, 2014.
|
Actual since Acquisition Through
|
Pro Forma (Unaudited)
Year Ended December 31,
|
|||||||||||
|
(000's omitted)
|
December 31, 2015
|
2015
|
2014
|
|||||||||
|
Total revenue, net of interest expense
|
$
|
3,667
|
$
|
426,541
|
$
|
416,713
|
||||||
|
Net income (loss)
|
(3,905
|
)
|
96,894
|
85,665
|
||||||||
67
NOTE C: INVESTMENT SECURITIES
The amortized cost and estimated fair value of investment securities as of December 31 are as follows:
|
2016
|
2015
|
|||||||||||||||||||||||||||||||
|
(000's omitted)
|
Amortized Cost
|
Gross Unrealized Gains
|
Gross Unrealized Losses
|
Estimated Fair Value
|
Amortized Cost
|
Gross Unrealized Gains
|
Gross Unrealized Losses
|
Estimated Fair Value
|
||||||||||||||||||||||||
|
Available-for-Sale Portfolio:
|
||||||||||||||||||||||||||||||||
|
U.S. Treasury and agency securities
|
$
|
1,876,358
|
$
|
28,522
|
$
|
2,118
|
$
|
1,902,762
|
$
|
1,866,819
|
$
|
35,186
|
$
|
2,027
|
$
|
1,899,978
|
||||||||||||||||
|
Obligations of state and political subdivisions
|
582,655
|
13,389
|
1,054
|
594,990
|
640,455
|
26,487
|
59
|
666,883
|
||||||||||||||||||||||||
|
Government agency mortgage-backed securities
|
232,657
|
5,040
|
2,467
|
235,230
|
205,220
|
6,906
|
1,261
|
210,865
|
||||||||||||||||||||||||
|
Corporate debt securities
|
5,716
|
2
|
31
|
5,687
|
16,672
|
66
|
58
|
16,680
|
||||||||||||||||||||||||
|
Government agency collateralized mortgage obligations
|
9,225
|
310
|
0
|
9,535
|
12,862
|
446
|
0
|
13,308
|
||||||||||||||||||||||||
|
Marketable equity securities
|
252
|
200
|
0
|
452
|
250
|
163
|
14
|
399
|
||||||||||||||||||||||||
|
Total available-for-sale portfolio
|
$
|
2,706,863
|
$
|
47,463
|
$
|
5,670
|
$
|
2,748,656
|
$
|
2,742,278
|
$
|
69,254
|
$
|
3,419
|
$
|
2,808,113
|
||||||||||||||||
|
Other Securities:
|
||||||||||||||||||||||||||||||||
|
Federal Home Loan Bank common stock
|
$
|
12,191
|
$
|
12,191
|
$
|
19,317
|
$
|
19,317
|
||||||||||||||||||||||||
|
Federal Reserve Bank common stock
|
19,781
|
19,781
|
16,050
|
16,050
|
||||||||||||||||||||||||||||
|
Other equity securities
|
3,764
|
3,764
|
4,460
|
4,460
|
||||||||||||||||||||||||||||
|
Total other securities
|
$
|
35,736
|
$
|
35,736
|
$
|
39,827
|
$
|
39,827
|
||||||||||||||||||||||||
A summary of investment securities that have been in a continuous unrealized loss position for less than or greater than twelve months is as follows:
As of December 31, 2016
|
Less than 12 Months
|
12 Months or Longer
|
Total
|
||||||||||||||||||||||||||||||||||
|
(000's omitted)
|
#
|
Fair Value
|
Gross Unrealized Losses
|
#
|
Fair Value
|
Gross Unrealized Losses
|
#
|
Fair Value
|
Gross Unrealized Losses
|
|||||||||||||||||||||||||||
|
Available-for-Sale Portfolio:
|
||||||||||||||||||||||||||||||||||||
|
U.S. Treasury and agency securities
|
13
|
$
|
449,242
|
$
|
2,118
|
0
|
$
|
0
|
$
|
0
|
13
|
$
|
449,242
|
$
|
2,118
|
|||||||||||||||||||||
|
Obligations of state and political subdivisions
|
197
|
102,106
|
1,054
|
0
|
0
|
0
|
197
|
102,106
|
1,054
|
|||||||||||||||||||||||||||
|
Government agency mortgage-backed securities
|
57
|
83,862
|
1,637
|
15
|
21,788
|
830
|
72
|
105,650
|
2,467
|
|||||||||||||||||||||||||||
|
Corporate debt securities
|
1
|
2,677
|
31
|
0
|
0
|
0
|
1
|
2,677
|
31
|
|||||||||||||||||||||||||||
|
Government agency collateralized mortgage obligations
|
0
|
0
|
0
|
2
|
2
|
0
|
2
|
2
|
0
|
|||||||||||||||||||||||||||
|
Total available-for-sale investment portfolio
|
268
|
$
|
637,887
|
$
|
4,84
0
|
17
|
$
|
21,790
|
$
|
830
|
285
|
$
|
659,677
|
$
|
5,67
0
|
|||||||||||||||||||||
As of December 31, 2015
|
Less than 12 Months
|
12 Months or Longer
|
Total
|
||||||||||||||||||||||||||||||||||
|
(000's omitted)
|
#
|
Fair Value
|
Gross Unrealized Losses
|
#
|
Fair Value
|
Gross Unrealized Losses
|
#
|
Fair Value
|
Gross Unrealized Losses
|
|||||||||||||||||||||||||||
|
Available-for-Sale Portfolio:
|
||||||||||||||||||||||||||||||||||||
|
U.S. Treasury and agency securities
|
9
|
$
|
353,844
|
$
|
2,027
|
0
|
$
|
0
|
$
|
0
|
9
|
$
|
353,844
|
$
|
2,027
|
|||||||||||||||||||||
|
Obligations of state and political subdivisions
|
18
|
8,804
|
34
|
2
|
735
|
25
|
20
|
9,539
|
59
|
|||||||||||||||||||||||||||
|
Government agency mortgage-backed securities
|
17
|
24,178
|
161
|
19
|
30,103
|
1,100
|
36
|
54,281
|
1,261
|
|||||||||||||||||||||||||||
|
Corporate debt securities
|
1
|
3,024
|
0
|
1
|
2,710
|
58
|
2
|
5,734
|
58
|
|||||||||||||||||||||||||||
|
Government agency collateralized mortgage obligations
|
0
|
0
|
0
|
2
|
3
|
0
|
2
|
3
|
0
|
|||||||||||||||||||||||||||
|
Marketable equity securities
|
1
|
87
|
14
|
0
|
0
|
0
|
1
|
87
|
14
|
|||||||||||||||||||||||||||
|
Total available-for-sale investment portfolio
|
46
|
$
|
389,937
|
$
|
2,236
|
24
|
$
|
33,551
|
$
|
1,183
|
70
|
$
|
423,488
|
$
|
3,419
|
|||||||||||||||||||||
68
The unrealized losses reported pertaining to securities issued by the U.S. government and its sponsored entities, include treasuries, agencies, and mortgage-backed securities issued by Ginnie Mae, Fannie Mae, and Freddie Mac which are currently rated AAA by Moody's Investor Services, AA+ by Standard & Poor's and are guaranteed by the U.S. government. The majority of the obligations of state and political subdivisions and corporations carry a credit rating of A or better. Additionally, a majority of the obligations of state and political subdivisions carry a secondary level of credit enhancement. The Company does not intend to sell these securities, nor is it more likely than not that the Company will be required to sell these securities prior to recovery of the amortized cost. The unrealized losses in the portfolios are primarily attributable to changes in interest rates. As such, management does not believe any individual unrealized loss as of December 31, 2016 represents OTTI.
The amortized cost and estimated fair value of debt securities at December 31, 2016, by contractual maturity, are shown below. Expected maturities will differ from contractual maturities because borrowers may have the right to call or prepay obligations with or without call or prepayment penalties. Securities not due at a single maturity date are shown separately.
|
Available-for-Sale
|
||||||||
|
(000's omitted)
|
Amortized Cost
|
Fair Value
|
||||||
|
Due in one year or less
|
$
|
37,994
|
$
|
38,212
|
||||
|
Due after one through five years
|
923,434
|
939,357
|
||||||
|
Due after five years through ten years
|
1,302,156
|
1,319,913
|
||||||
|
Due after ten years
|
201,145
|
205,957
|
||||||
|
Subtotal
|
2,464,729
|
2,503,439
|
||||||
|
Government agency mortgage-backed securities
|
232,657
|
235,230
|
||||||
|
Government agency collateralized mortgage obligations
|
9,225
|
9,535
|
||||||
|
Total
|
$
|
2,706,611
|
$
|
2,748,204
|
||||
Cash flow information on investment securities for the years ended December 31 is as follows:
|
(000's omitted)
|
2016
|
2015
|
2014
|
|||||||||
|
Gross gains on sales of investment securities
|
$
|
0
|
$
|
3
|
$
|
0
|
||||||
|
Gross losses on sales of investment securities
|
0
|
7
|
0
|
|||||||||
Investment securities with a carrying value of $1.865 billion and $1.750 billion at December 31, 2016 and 2015, respectively, were pledged to collateralize certain deposits and borrowings
.
NOTE D: LOANS
The segments of the Company's loan portfolio are disaggregated into the following classes that allow management to monitor risk and performance:
|
·
|
Consumer mortgages consist primarily of fixed rate residential instruments, typically 10 – 30 years in contractual term, secured by first liens on real property.
|
|
·
|
Business lending is comprised of general purpose commercial and industrial loans including, but not limited to agricultural-related and dealer floor plans, as well as mortgages on commercial property.
|
|
·
|
Consumer indirect consists primarily of installment loans originated through selected dealerships and are secured by automobiles, marine and other recreational vehicles.
|
|
·
|
Consumer direct consists of all other loans to consumers such as personal installment loans and lines of credit.
|
|
·
|
Home equity products are consumer purpose installment loans or lines of credit most often secured by a first or second lien position on residential real estate with terms up to 30 years.
|
The balances of these classes at December 31 are summarized as follows:
|
(000's omitted)
|
2016
|
2015
|
||||||
|
Consumer mortgage
|
$
|
1,819,701
|
$
|
1,769,754
|
||||
|
Business lending
|
1,490,076
|
1,497,271
|
||||||
|
Consumer indirect
|
1,044,972
|
935,760
|
||||||
|
Consumer direct
|
191,815
|
195,076
|
||||||
|
Home equity
|
401,998
|
403,514
|
||||||
|
Gross loans, including deferred origination costs
|
4,948,562
|
4,801,375
|
||||||
|
Allowance for loan losses
|
(47,233
|
)
|
(45,401
|
)
|
||||
|
Loans, net of allowance for loan losses
|
$
|
4,901,329
|
$
|
4,755,974
|
||||
69
The Company had approximately $22.8 million and $20.0 million of net deferred loan origination costs included in gross loans as of December 31, 2016 and 2015, respectively.
Certain directors and executive officers of the Company, as well as associates of such persons, are loan customers. Loans to these individuals were made in the ordinary course of business under normal credit terms and do not have more than a normal risk of collection. Following is a summary of the aggregate amount of such loans during 2016 and 2015.
|
(000's omitted)
|
2016
|
2015
|
||||||
|
Balance at beginning of year
|
$
|
11,337
|
$
|
8,928
|
||||
|
New loans
|
4,959
|
5,138
|
||||||
|
Payments
|
(5,346
|
)
|
(2,729
|
)
|
||||
|
Balance at end of year
|
$
|
10,950
|
$
|
11,337
|
||||
Acquired loans
Acquired loans are recorded at fair value as of the date of purchase with no allowance for loan loss. The outstanding principal balance and the related carrying amount of acquired loans included in the Consolidated Statement of Condition at December 31 are as follows:
|
(000's omitted)
|
2016
|
2015
|
||||||
|
Credit impaired acquired loans:
|
||||||||
|
Outstanding principal balance
|
$
|
6,354
|
$
|
8,339
|
||||
|
Carrying amount
|
5,553
|
7,299
|
||||||
|
Non-impaired acquired loans:
|
||||||||
|
Outstanding principal balance
|
497,308
|
620,942
|
||||||
|
Carrying amount
|
489,807
|
610,355
|
||||||
|
Total acquired loans:
|
||||||||
|
Outstanding principal balance
|
503,662
|
629,281
|
||||||
|
Carrying amount
|
495,360
|
617,654
|
||||||
The outstanding balance related to credit impaired acquired loans was $6.6 million and $8.5 million at December 31, 2016 and 2015, respectively. The changes in the accretable discount related to the credit impaired acquired loans are as follows:
|
(000's omitted)
|
2016
|
2015
|
||||||
|
Balance at beginning of year
|
$
|
810
|
$
|
705
|
||||
|
Oneida acquisition
|
0
|
341
|
||||||
|
Accretion recognized
|
(455
|
)
|
(552
|
)
|
||||
|
Net reclassification to accretable from nonaccretable
|
143
|
316
|
||||||
|
Balance at end of year
|
$
|
498
|
$
|
810
|
||||
Credit Quality
Management monitors the credit quality of its loan portfolio on an ongoing basis. Measurement of delinquency and past due status are based on the contractual terms of each loan. Past due loans are reviewed on a monthly basis to identify loans for non-accrual status. The following is an aged analysis of the Company's past due loans by class as of December 31, 2016:
Legacy Loans
(excludes loans acquired after January 1, 2009)
|
(000's omitted)
|
Past Due
30 - 89
days
|
90+ Days Past Due and
Still Accruing
|
Nonaccrual
|
Total
Past Due
|
Current
|
Total Loans
|
||||||||||||||||||
|
Consumer mortgage
|
$
|
11,379
|
$
|
1,180
|
$
|
11,352
|
$
|
23,911
|
$
|
1,635,849
|
$
|
1,659,760
|
||||||||||||
|
Business lending
|
3,921
|
145
|
3,811
|
7,877
|
1,269,789
|
1,277,666
|
||||||||||||||||||
|
Consumer indirect
|
13,883
|
166
|
0
|
14,049
|
1,000,776
|
1,014,825
|
||||||||||||||||||
|
Consumer direct
|
1,549
|
58
|
0
|
1,607
|
180,315
|
181,922
|
||||||||||||||||||
|
Home equity
|
1,250
|
414
|
1,437
|
3,101
|
315,928
|
319,029
|
||||||||||||||||||
|
Total
|
$
|
31,982
|
$
|
1,963
|
$
|
16,600
|
$
|
50,545
|
$
|
4,402,657
|
$
|
4,453,202
|
||||||||||||
70
Acquired Loans
(includes loans acquired after January 1, 2009)
|
(000's omitted)
|
Past Due
30 - 89
days
|
90+ Days Past Due and
Still Accruing
|
Nonaccrual
|
Total
Past Due
|
Acquired Impaired
(1)
|
Current
|
Total Loans
|
|||||||||||||||||||||
|
Consumer mortgage
|
$
|
1,539
|
$
|
205
|
$
|
2,332
|
$
|
4,076
|
$
|
0
|
$
|
155,865
|
$
|
159,941
|
||||||||||||||
|
Business lending
|
528
|
0
|
1,252
|
1,780
|
5,553
|
205,077
|
212,410
|
|||||||||||||||||||||
|
Consumer indirect
|
231
|
3
|
0
|
234
|
0
|
29,913
|
30,147
|
|||||||||||||||||||||
|
Consumer direct
|
231
|
0
|
0
|
231
|
0
|
9,662
|
9,893
|
|||||||||||||||||||||
|
Home equity
|
778
|
905
|
435
|
2,118
|
0
|
80,851
|
82,969
|
|||||||||||||||||||||
|
Total
|
$
|
3,307
|
$
|
1,113
|
$
|
4,019
|
$
|
8,439
|
$
|
5,553
|
$
|
481,368
|
$
|
495,360
|
||||||||||||||
|
(1)
Acquired impaired loans were not classified as nonperforming assets as the loans are considered to be performing under ASC 310-30. As a result interest income, through the accretion of the difference between the carrying amount of the loans and the expected cashflows, is being recognized on all acquired impaired loans.
|
The following is an aged analysis of the Company's past due loans by class as of December 31, 2015:
Legacy Loans
(excludes loans acquired after January 1, 2009)
|
(000's omitted)
|
Past Due
30 - 89
days
|
90+ Days Past Due and
Still Accruing
|
Nonaccrual
|
Total
Past Due
|
Current
|
Total Loans
|
||||||||||||||||||
|
Consumer mortgage
|
$
|
10,482
|
$
|
1,411
|
$
|
11,394
|
$
|
23,287
|
$
|
1,558,171
|
$
|
1,581,458
|
||||||||||||
|
Business lending
|
4,442
|
126
|
5,381
|
9,949
|
1,223,679
|
1,233,628
|
||||||||||||||||||
|
Consumer indirect
|
11,575
|
102
|
0
|
11,677
|
878,662
|
890,339
|
||||||||||||||||||
|
Consumer direct
|
1,414
|
51
|
1
|
1,466
|
176,585
|
178,051
|
||||||||||||||||||
|
Home equity
|
1,093
|
111
|
2,029
|
3,233
|
297,012
|
300,245
|
||||||||||||||||||
|
Total
|
$
|
29,006
|
$
|
1,801
|
$
|
18,805
|
$
|
49,612
|
$
|
4,134,109
|
$
|
4,183,721
|
||||||||||||
Acquired Loans
(includes loans acquired after January 1, 2009)
|
(000's omitted)
|
Past Due
30 - 89
days
|
90+ Days Past Due and
Still Accruing
|
Nonaccrual
|
Total
Past Due
|
Acquired Impaired
(1)
|
Current
|
Total Loans
|
|||||||||||||||||||||
|
Consumer mortgage
|
$
|
1,373
|
$
|
394
|
$
|
1,396
|
$
|
3,163
|
$
|
0
|
$
|
185,133
|
$
|
188,296
|
||||||||||||||
|
Business lending
|
535
|
0
|
1,186
|
1,721
|
7,299
|
254,623
|
263,643
|
|||||||||||||||||||||
|
Consumer indirect
|
245
|
0
|
0
|
245
|
0
|
45,176
|
45,421
|
|||||||||||||||||||||
|
Consumer direct
|
140
|
0
|
14
|
154
|
0
|
16,871
|
17,025
|
|||||||||||||||||||||
|
Home equity
|
636
|
0
|
327
|
963
|
0
|
102,306
|
103,269
|
|||||||||||||||||||||
|
Total
|
$
|
2,929
|
$
|
394
|
$
|
2,923
|
$
|
6,246
|
$
|
7,299
|
$
|
604,109
|
$
|
617,654
|
||||||||||||||
|
(1)
Acquired impaired loans were not classified as nonperforming assets as the loans are considered to be performing under ASC 310-30. As a result interest income, through the accretion of the difference between the carrying amount of the loans and the expected cashflows, is being recognized on all acquired impaired loans.
|
The Company uses several credit quality indicators to assess credit risk in an ongoing manner. The Company's primary credit quality indicator for its business lending portfolio is an internal credit risk rating system that categorizes loans as "pass", "special mention", or "classified". Credit risk ratings are applied individually to those classes of loans that have significant or unique credit characteristics that benefit from a case-by-case evaluation. In general, the following are the definitions of the Company's credit quality indicators:
|
Pass
|
The condition of the borrower and the performance of the loans are satisfactory or better.
|
| Special Mention | The condition of the borrower has deteriorated although the loan performs as agreed. |
| Classified | The condition of the borrower has significantly deteriorated and the performance of the loan could further deteriorate if deficiencies are not corrected. |
| Doubtful |
The condition of the borrower has deteriorated to the point that collection of the balance is improbable based on current facts and conditions.
|
71
The following table shows the amount of business lending loans by credit quality category:
|
December 31, 2016
|
December 31, 2015
|
|||||||||||||||||||||||
|
(000's omitted)
|
Legacy
|
Acquired
|
Total
|
Legacy
|
Acquired
|
Total
|
||||||||||||||||||
|
Pass
|
$
|
1,051,005
|
$
|
162,165
|
$
|
1,213,170
|
$
|
1,048,364
|
$
|
219,374
|
$
|
1,267,738
|
||||||||||||
|
Special mention
|
135,602
|
29,690
|
165,292
|
124,768
|
20,007
|
144,775
|
||||||||||||||||||
|
Classified
|
90,585
|
15,002
|
105,587
|
60,181
|
16,963
|
77,144
|
||||||||||||||||||
|
Doubtful
|
474
|
0
|
474
|
315
|
0
|
315
|
||||||||||||||||||
|
Acquired impaired
|
0
|
5,553
|
5,553
|
0
|
7,299
|
7,299
|
||||||||||||||||||
|
Total
|
$
|
1,277,666
|
$
|
212,410
|
$
|
1,490,076
|
$
|
1,233,628
|
$
|
263,643
|
$
|
1,497,271
|
||||||||||||
All other loans are underwritten and structured using standardized criteria and characteristics, primarily payment performance, and are normally risk rated and monitored collectively on a monthly basis. These are typically loans to individuals in the consumer categories and are delineated as either performing or nonperforming. Performing loans include current, 30 – 89 days past due and acquired impaired loans. Nonperforming loans include 90+ days past due and still accruing and nonaccrual loans. The following tables detail the balances in all loan categories except for business lending at December 31, 2016:
Legacy loans
(excludes loans acquired after January 1, 2009)
|
(000's omitted)
|
Consumer
Mortgage
|
Consumer Indirect
|
Consumer Direct
|
Home Equity
|
Total
|
|||||||||||||||
|
Performing
|
$
|
1,647,228
|
$
|
1,014,659
|
$
|
181,864
|
$
|
317,178
|
$
|
3,160,929
|
||||||||||
|
Nonperforming
|
12,532
|
166
|
58
|
1,851
|
14,607
|
|||||||||||||||
|
Total
|
$
|
1,659,760
|
$
|
1,014,825
|
$
|
181,922
|
$
|
319,029
|
$
|
3,175,536
|
||||||||||
Acquired loans
(includes loans acquired after January 1, 2009)
|
(000's omitted)
|
Consumer
Mortgage
|
Consumer Indirect
|
Consumer Direct
|
Home Equity
|
Total
|
|||||||||||||||
|
Performing
|
$
|
157,404
|
$
|
30,144
|
$
|
9,893
|
$
|
81,629
|
$
|
279,070
|
||||||||||
|
Nonperforming
|
2,537
|
3
|
0
|
1,340
|
3,880
|
|||||||||||||||
|
Total
|
$
|
159,941
|
$
|
30,147
|
$
|
9,893
|
$
|
82,969
|
$
|
282,950
|
||||||||||
The following table details the balances in all other loan categories at December 31, 2015:
Legacy loans
(excludes loans acquired after January 1, 2009)
|
(000's omitted)
|
Consumer
Mortgage
|
Consumer Indirect
|
Consumer Direct
|
Home Equity
|
Total
|
|||||||||||||||
|
Performing
|
$
|
1,568,653
|
$
|
890,237
|
$
|
177,999
|
$
|
298,105
|
$
|
2,934,994
|
||||||||||
|
Nonperforming
|
12,805
|
102
|
52
|
2,140
|
15,099
|
|||||||||||||||
|
Total
|
$
|
1,581,458
|
$
|
890,339
|
$
|
178,051
|
$
|
300,245
|
$
|
2,950,093
|
||||||||||
Acquired loans
(includes loans acquired after January 1, 2009)
|
(000's omitted)
|
Consumer
Mortgage
|
Consumer Indirect
|
Consumer Direct
|
Home Equity
|
Total
|
|||||||||||||||
|
Performing
|
$
|
186,506
|
$
|
45,421
|
$
|
17,011
|
$
|
102,942
|
$
|
351,880
|
||||||||||
|
Nonperforming
|
1,790
|
0
|
14
|
327
|
2,131
|
|||||||||||||||
|
Total
|
$
|
188,296
|
$
|
45,421
|
$
|
17,025
|
$
|
103,269
|
$
|
354,011
|
||||||||||
72
All loan classes are collectively evaluated for impairment except business lending, as described in Note A. A summary of individually evaluated impaired loans as of December 31, 2016 and 2015 is as follows:
|
(000's omitted)
|
2016
|
2015
|
||||||
|
Loans with allowance allocation
|
$
|
1,109
|
$
|
0
|
||||
|
Loans without allowance allocation
|
556
|
2,376
|
||||||
|
Carrying balance
|
1,665
|
2,376
|
||||||
|
Contractual balance
|
3,340
|
3,419
|
||||||
|
Specifically allocated allowance
|
477
|
0
|
||||||
|
Average impaired loans
|
4,683
|
2,922
|
||||||
|
Interest income recognized
|
0
|
0
|
||||||
In the course of working with borrowers, the Company may choose to restructure the contractual terms of certain loans. In this scenario, the Company attempts to work-out an alternative payment schedule with the borrower in order to optimize collectability of the loan. Any loans that are modified are reviewed by the Company to identify if a troubled debt restructuring ("TDR") has occurred, which is when, for economic or legal reasons related to a borrower's financial difficulties, the Company grants a concession to the borrower that it would not otherwise consider. Terms may be modified to fit the ability of the borrower to repay in line with its current financial standing and the restructuring of the loan may include the transfer of assets from the borrower to satisfy the debt, a modification of loan terms, or a combination of the two. With regard to determination of the amount of the allowance for loan losses, troubled debt restructured loans are considered to be impaired. As a result, the determination of the amount of allowance for loan losses related to impaired loans for each portfolio segment within TDRs is the same as detailed previously.
In accordance with clarified guidance issued by the OCC, loans that have been discharged in Chapter 7 bankruptcy but not reaffirmed by the borrower, are classified as TDRs, irrespective of payment history or delinquency status, even if the repayment terms for the loan have not been otherwise modified. The Company's lien position against the underlying collateral remains unchanged. Pursuant to that guidance, the Company records a charge-off equal to any portion of the carrying value that exceeds the net realizable value of the collateral. The amount of loss incurred in 2016, 2015 and 2014 was immaterial.
TDRs less than $0.5 million are collectively included in the general loan loss allocation and the qualitative review, if necessary. Commercial loans greater than $0.5 million are individually evaluated for impairment, and if necessary, a specific allocation of the allowance for loan losses is provided.
Information regarding TDRs as of December 31, 2016 and December 31, 2015 is as follows
|
December 31, 2016
|
December 31, 2015
|
|||||||||||||||||||||||||||||||||||||||||||||||
|
(000's omitted)
|
Nonaccrual
|
Accruing
|
Total
|
Nonaccrual
|
Accruing
|
Total
|
||||||||||||||||||||||||||||||||||||||||||
|
#
|
Amount
|
#
|
Amount
|
#
|
Amount
|
#
|
Amount
|
#
|
Amount
|
#
|
Amount
|
|||||||||||||||||||||||||||||||||||||
|
Consumer mortgage
|
36
|
$
|
1,520
|
45
|
$
|
1,956
|
81
|
$
|
3,476
|
37
|
$
|
1,472
|
54
|
$
|
2,486
|
91
|
$
|
3,958
|
||||||||||||||||||||||||||||||
|
Business lending
|
6
|
91
|
5
|
690
|
11
|
781
|
8
|
217
|
6
|
737
|
14
|
954
|
||||||||||||||||||||||||||||||||||||
|
Consumer indirect
|
0
|
0
|
78
|
771
|
78
|
771
|
0
|
0
|
77
|
691
|
77
|
691
|
||||||||||||||||||||||||||||||||||||
|
Consumer direct
|
0
|
0
|
23
|
65
|
23
|
65
|
0
|
0
|
32
|
37
|
32
|
37
|
||||||||||||||||||||||||||||||||||||
|
Home equity
|
14
|
221
|
7
|
216
|
21
|
437
|
10
|
203
|
14
|
301
|
24
|
504
|
||||||||||||||||||||||||||||||||||||
|
Total
|
56
|
$
|
1,832
|
158
|
$
|
3,698
|
214
|
$
|
5,530
|
55
|
$
|
1,892
|
183
|
$
|
4,252
|
238
|
$
|
6,144
|
||||||||||||||||||||||||||||||
The following table presents information related to loans modified in a TDR during the years ended December 31, 2016 and 2015. Of the loans noted in the table below, all loans for the years ended December 31, 2016 and December 31, 2015, were modified due to a Chapter 7 bankruptcy as described previously. The financial effects of these restructurings were immaterial.
|
December 31, 2016
|
December 31, 2015
|
|||||||||||||||
|
(000's omitted)
|
#
|
Amount
|
#
|
Amount
|
||||||||||||
|
Consumer mortgage
|
9
|
$
|
597
|
21
|
$
|
1,374
|
||||||||||
|
Business lending
|
0
|
0
|
3
|
67
|
||||||||||||
|
Consumer indirect
|
33
|
459
|
35
|
349
|
||||||||||||
|
Consumer direct
|
3
|
51
|
6
|
11
|
||||||||||||
|
Home equity
|
3
|
50
|
6
|
63
|
||||||||||||
|
Total
|
48
|
$
|
1,157
|
71
|
$
|
1,864
|
||||||||||
73
Allowance for Loan Losses
The allowance for loan losses is general in nature and is available to absorb losses from any loan type despite the analysis below. The following presents by class the activity in the allowance for loan losses:
|
(000's omitted)
|
Consumer Mortgage
|
Business Lending
|
Consumer Indirect
|
Consumer Direct
|
Home Equity
|
Unallocated
|
Acquired Impaired
|
Total
|
||||||||||||||||||||||||
|
Balance at
December 31, 2014
|
$
|
10,286
|
$
|
15,787
|
$
|
11,544
|
$
|
3,083
|
$
|
2,701
|
$
|
1,767
|
$
|
173
|
$
|
45,341
|
||||||||||||||||
|
Charge-offs
|
(1,374
|
)
|
(2,146
|
)
|
(6,714
|
)
|
(1,490
|
)
|
(244
|
)
|
0
|
(103
|
)
|
(12,071
|
)
|
|||||||||||||||||
|
Recoveries
|
80
|
877
|
3,943
|
722
|
62
|
0
|
0
|
5,684
|
||||||||||||||||||||||||
|
Provision
|
1,206
|
1,231
|
3,649
|
682
|
147
|
(566
|
)
|
98
|
6,447
|
|||||||||||||||||||||||
|
Balance at
December 31, 2015
|
10,198
|
15,749
|
12,422
|
2,997
|
2,666
|
1,201
|
168
|
45,401
|
||||||||||||||||||||||||
|
Charge-offs
|
(647
|
)
|
(1,872
|
)
|
(7,643
|
)
|
(1,706
|
)
|
(218
|
)
|
0
|
(97
|
)
|
(12,183
|
)
|
|||||||||||||||||
|
Recoveries
|
115
|
616
|
4,168
|
901
|
139
|
0
|
0
|
5,939
|
||||||||||||||||||||||||
|
Provision
|
428
|
2,727
|
4,835
|
787
|
(188
|
)
|
(550
|
)
|
37
|
8,076
|
||||||||||||||||||||||
|
Balance at
December 31, 2016
|
$
|
10,094
|
$
|
17,220
|
$
|
13,782
|
$
|
2,979
|
$
|
2,399
|
$
|
651
|
$
|
108
|
$
|
47,233
|
||||||||||||||||
NOTE E: PREMISES AND EQUIPMENT
Premises and equipment consist of the following at December 31:
|
(000's omitted)
|
2016
|
2015
|
||||||
|
Land and land improvements
|
$
|
22,585
|
$
|
22,191
|
||||
|
Bank premises
|
116,663
|
112,011
|
||||||
|
Equipment and construction in progress
|
80,527
|
80,684
|
||||||
|
Premises and equipment, gross
|
219,775
|
214,886
|
||||||
|
Accumulated depreciation
|
(107,457
|
)
|
(100,452
|
)
|
||||
|
Premises and equipment, net
|
$
|
112,318
|
$
|
114,434
|
||||
NOTE F: GOODWILL AND IDENTIFIABLE INTANGIBLE ASSETS
The gross carrying amount and accumulated amortization for each type of identifiable intangible asset are as follows:
|
December 31, 2016
|
December 31, 2015
|
|||||||||||||||||||||||
|
(000's omitted)
|
Gross Carrying Amount
|
Accumulated Amortization
|
Net Carrying Amount
|
Gross Carrying Amount
|
Accumulated Amortization
|
Net Carrying Amount
|
||||||||||||||||||
|
Amortizing intangible assets:
|
||||||||||||||||||||||||
|
Core deposit intangibles
|
$
|
39,688
|
$
|
(32,581
|
)
|
$
|
7,107
|
$
|
39,688
|
$
|
(29,899
|
)
|
$
|
9,789
|
||||||||||
|
Other intangibles
|
17,853
|
(9,258
|
)
|
8,595
|
17,565
|
(6,460
|
)
|
11,105
|
||||||||||||||||
|
Total amortizing intangibles
|
$
|
57,541
|
$
|
(41,839
|
)
|
$
|
15,702
|
$
|
57,253
|
$
|
(36,359
|
)
|
$
|
20,894
|
||||||||||
The estimated aggregate amortization expense for each of the five succeeding fiscal years ended December 31 is as follows:
|
2017
|
$
|
4,413
|
||
|
2018
|
3,566
|
|||
|
2019
|
2,782
|
|||
|
2020
|
2,119
|
|||
|
2021
|
1,531
|
|||
|
Thereafter
|
1,291
|
|||
|
Total
|
$
|
15,702
|
74
Shown below are the components of the Company's goodwill at December 31, 2016 and 2015:
|
(000's omitted)
|
Year Ended December 31, 2014
|
Activity
|
Year Ended December 31, 2015
|
Activity
|
Year Ended December 31, 2016
|
|||||||||||||||
|
Goodwill
|
$
|
379,998
|
$
|
88,078
|
$
|
468,076
|
$
|
1,890
|
$
|
469,966
|
||||||||||
|
Accumulated impairment
|
(4,824
|
)
|
0
|
(4,824
|
)
|
0
|
(4,824
|
)
|
||||||||||||
|
Goodwill, net
|
$
|
375,174
|
$
|
88,078
|
$
|
463,252
|
$
|
1,890
|
$
|
465,142
|
||||||||||
During the first quarter of 2016, the Company performed its annual internal valuation of goodwill and impairment analysis by comparing the fair value of each reporting unit to its carrying value. Results of the valuations indicate there was no goodwill impairment. There were no events between the date of the valuation and year end that warranted additional analysis.
Mortgage Servicing Rights
Under certain circumstances, the Company sells consumer residential mortgage loans in the secondary market and typically retains the right to service the loans sold. Generally, the Company's residential mortgage loans sold to third parties are sold on a non-recourse basis. Upon sale, a mortgage servicing right ("MSR") is established, which represents the current fair value of future net cash flows expected to be realized for performing the servicing activities. The Company stratifies these assets based on predominant risk characteristics, namely expected term of the underlying financial instruments, and uses a valuation model that calculates the present value of future cash flows to determine the fair value of servicing rights. MSRs are recorded in other assets at the lower of the initial capitalized amount, net of accumulated amortization or fair value. Mortgage loans serviced for others are not included in the accompanying consolidated statements of condition.
The following table summarizes the changes in carrying value of MSRs and the associated valuation allowance:
|
(000's omitted)
|
2016
|
2015
|
||||||
|
Carrying value before valuation allowance at beginning of period
|
$
|
1,472
|
$
|
1,089
|
||||
|
Additions
|
481
|
403
|
||||||
|
Oneida acquisition
|
0
|
389
|
||||||
|
Amortization
|
(518
|
)
|
(409
|
)
|
||||
|
Carrying value before valuation allowance at end of period
|
1,435
|
1,472
|
||||||
|
Valuation allowance balance at beginning of period
|
0
|
0
|
||||||
|
Impairment charges
|
(226
|
)
|
(133
|
)
|
||||
|
Impairment recoveries
|
226
|
133
|
||||||
|
Valuation allowance balance at end of period
|
0
|
0
|
||||||
|
Net carrying value at end of period
|
$
|
1,435
|
$
|
1,472
|
||||
|
Fair value of MSRs at end of period
|
$
|
1,928
|
$
|
1,962
|
||||
|
Principal balance of loans sold during the year
|
$
|
45,852
|
$
|
35,491
|
||||
|
Principal balance of loans serviced for others
|
$
|
365,374
|
$
|
377,909
|
||||
|
Custodial escrow balances maintained in connection with loans serviced for others
|
$
|
5,603
|
$
|
5,700
|
||||
The following table summarizes the key economic assumptions used to estimate the value of the MSRs at December 31:
|
2016
|
2015
|
|
|
Weighted-average contractual life (in years)
|
20.8
|
19.9
|
|
Weighted-average constant prepayment rate (CPR)
|
15.1%
|
14.9%
|
|
Weighted-average discount rate
|
3.5%
|
3.3%
|
Deposits consist of the following at December 31:
|
(000's omitted)
|
2016
|
2015
|
||||||
|
Noninterest checking
|
$
|
1,646,039
|
$
|
1,499,616
|
||||
|
Interest checking
|
1,644,029
|
1,575,379
|
||||||
|
Savings
|
1,303,851
|
1,255,027
|
||||||
|
Money market
|
1,778,907
|
1,738,904
|
||||||
|
Time
|
703,128
|
804,548
|
||||||
|
Total deposits
|
$
|
7,075,954
|
$
|
6,873,474
|
||||
75
The approximate maturities of time deposits at December 31, 2016 are as follows:
|
(000's omitted)
|
All Accounts
|
Accounts $250,000
or Greater
|
||||||
|
2017
|
$
|
492,000
|
$
|
42,142
|
||||
|
2018
|
103,698
|
1,713
|
||||||
|
2019
|
48,096
|
2,337
|
||||||
|
2020
|
32,774
|
2,717
|
||||||
|
2021
|
26,208
|
2,315
|
||||||
|
Thereafter
|
352
|
0
|
||||||
|
Total
|
$
|
703,128
|
$
|
51,224
|
||||
Outstanding borrowings at December 31 are as follows:
|
(000's omitted)
|
2016
|
2015
|
||||||
|
FHLB overnight advance
|
$
|
146,200
|
$
|
301,300
|
||||
|
Subordinated debt held by unconsolidated subsidiary trusts,
|
||||||||
|
net of discount of $357 and $381, respectively
|
102,170
|
102,146
|
||||||
|
Total borrowings
|
$
|
248,370
|
$
|
403,446
|
||||
FHLB advances are collateralized by a blanket lien on the Company's residential real estate loan portfolio and various investment securities.
Borrowings at December 31, 2016 have contractual maturity dates as follows:
|
(000's omitted, except rate)
|
Carrying Value
|
Weighted-average Rate at
December 31, 2016
|
||||||
|
January 3, 2017
|
$
|
146,200
|
0.74
|
%
|
||||
|
July 31, 2031
|
24,850
|
4.47
|
%
|
|||||
|
December 15, 2036
|
77,320
|
2.61
|
%
|
|||||
|
Total
|
$
|
248,370
|
1.70
|
%
|
||||
The weighted-average interest rate on borrowings for the years ended December 31, 2016 and 2015 was 1.46% and 0.82%, respectively.
The Company sponsors two business trusts, Community Statutory Trust III and Community Capital Trust IV, of which 100% of the common stock is owned by the Company. The trusts were formed for the purpose of issuing company-obligated mandatorily redeemable preferred securities to third-party investors and investing the proceeds from the sale of such preferred securities solely in junior subordinated debt securities of the Company. The debentures held by each trust are the sole assets of that trust. Distributions on the preferred securities issued by each trust are payable quarterly at a rate per annum equal to the interest rate being earned by the trust on the debentures held by that trust and are recorded as interest expense in the consolidated financial statements. The preferred securities are subject to mandatory redemption, in whole or in part, upon repayment of the debentures. The Company has entered into agreements which, taken collectively, fully and unconditionally guarantee the preferred securities subject to the terms of each of the guarantees. The terms of the preferred securities of each trust are as follows:
|
Trust
|
Issuance Date
|
Par Amount
|
Interest Rate
|
Maturity Date
|
Call Price
|
|
III
|
7/31/2001
|
$24.5 million
|
3 month LIBOR plus 3.58% (4.47%)
|
7/31/2031
|
Par
|
|
IV
|
12/8/2006
|
$75 million
|
3 month LIBOR plus 1.65% (2.61%)
|
12/15/2036
|
Par
|
76
NOTE I: INCOME TAXES
The provision for income taxes for the years ended December 31 is as follows:
|
(000's omitted)
|
2016
|
2015
|
2014
|
|||||||||
|
Current:
|
||||||||||||
|
Federal
|
$
|
32,829
|
$
|
27,663
|
$
|
30,006
|
||||||
|
State and other
|
4,890
|
2,608
|
870
|
|||||||||
|
Deferred:
|
||||||||||||
|
Federal
|
11,444
|
9,604
|
6,867
|
|||||||||
|
State and other
|
1,622
|
1,112
|
594
|
|||||||||
|
Provision for income taxes
|
$
|
50,785
|
$
|
40,987
|
$
|
38,337
|
||||||
Components of the net deferred tax liability, included in other liabilities, as of December 31 are as follows:
|
(000's omitted)
|
2016
|
2015
|
||||||
|
Allowance for loan losses
|
$
|
18,366
|
$
|
17,791
|
||||
|
Employee benefits
|
6,311
|
6,633
|
||||||
|
Debt extinguishment
|
299
|
613
|
||||||
|
Other, net
|
5,202
|
9,704
|
||||||
|
Deferred tax asset
|
30,178
|
34,741
|
||||||
|
Investment securities
|
32,839
|
38,314
|
||||||
|
Tax-deductible goodwill
|
43,504
|
39,724
|
||||||
|
Loan origination costs
|
8,228
|
7,295
|
||||||
|
Depreciation
|
71
|
886
|
||||||
|
Mortgage servicing rights
|
548
|
565
|
||||||
|
Pension
|
18,194
|
14,807
|
||||||
|
Deferred tax liability
|
103,384
|
101,591
|
||||||
|
Net deferred tax liability
|
$
|
(73,206
|
)
|
$
|
(66,850
|
)
|
||
The Company has determined that no valuation allowance is necessary as it is more likely than not that the gross deferred tax assets will be realized through carryback of future deductions to taxable income in prior years, future reversals of existing temporary differences, and through future taxable income.
A reconciliation of the differences between the federal statutory income tax rate and the effective tax rate for the years ended December 31 is shown in the following table:
|
|
2016
|
2015
|
2014
|
|
Federal statutory income tax rate
|
35.0%
|
35.0%
|
35.0%
|
|
Increase (reduction) in taxes resulting from:
|
|||
|
Tax-exempt interest
|
(4.0)
|
(5.0)
|
(5.4)
|
|
State income taxes, net of federal benefit
|
2.7
|
1.8
|
0.7
|
|
Other
|
(0.9)
|
(0.8)
|
(0.7)
|
|
Effective income tax rate
|
32.8%
|
31.0%
|
29.6%
|
A reconciliation of the unrecognized tax benefits for the years ended December 31 is shown in the following table:
|
(000's omitted)
|
2016
|
2015
|
2014
|
|||||||||
|
Unrecognized tax benefits at beginning of year
|
$
|
127
|
$
|
162
|
$
|
138
|
||||||
|
Changes related to:
|
||||||||||||
|
Positions taken during the current year
|
0
|
0
|
24
|
|||||||||
|
Lapse of statutes of limitations
|
(35
|
)
|
(35
|
)
|
0
|
|||||||
|
Unrecognized tax benefits at end of year
|
$
|
92
|
$
|
127
|
$
|
162
|
||||||
77
As of December 31, 2016, the total amount of unrecognized tax benefits that would impact the Company's effective tax rate if recognized is $0.1 million. It is reasonably possible that the amount of unrecognized tax benefits could change in the next twelve months as a result of various examinations and expiration of statutes of limitations on prior tax returns.
The Company's policy is to recognize interest and penalties related to unrecognized tax benefits as part of income taxes in the consolidated statement of income. The accrued interest related to tax positions was immaterial.
The Company's federal and state income tax returns are routinely subject to examination from various governmental taxing authorities. Such examinations may result in challenges to the tax return treatment applied by the Company to specific transactions. Management believes that the assumptions and judgment used to record tax-related assets or liabilities have been appropriate. Future examinations by taxing authorities of the Company's federal or state tax returns could have a material impact on the Company's results of operations. The Company's federal income tax returns for years after 2012 may still be examined by the Internal Revenue Service. New York State income tax returns for years after 2012 may still be examined by the New York Department of Taxation and Finance. It is not possible to estimate when those examinations may be completed.
NOTE J: LIMITS ON DIVIDENDS AND OTHER REVENUE SOURCES
The Company's ability to pay dividends to its shareholders is largely dependent on the Bank's ability to pay dividends to the Company. In addition to the capital requirements discussed below, the circumstances under which the Bank may pay dividends are limited by federal statutes, regulations, and policies. For example, as a national bank, the Bank must obtain the approval of the Office of the Comptroller of the Currency ("OCC") for payments of dividends if the total of all dividends declared in any calendar year would exceed the total of the Bank's net profits, as defined by applicable regulations, for that year, combined with its retained net profits for the preceding two years. Furthermore, the Bank may not pay a dividend in an amount greater than its undivided profits then on hand after deducting its losses and bad debts, as defined by applicable regulations. At December 31, 2016, the Bank had approximately $57.6 million in undivided profits legally available for the payment of dividends.
In addition, the Board of Governors of the Federal Reserve System ("FRB") and the OCC are authorized to determine under certain circumstances that the payment of dividends would be an unsafe or unsound practice and to prohibit payment of such dividends. The FRB has indicated that banking organizations should generally pay dividends only out of current operating earnings.
There are also statutory limits on the transfer of funds to the Company by its banking subsidiary, whether in the form of loans or other extensions of credit, investments or assets purchases. Such transfer by the Bank to the Company generally is limited in amount to 10% of the Bank's capital and surplus, or 20% in the aggregate. Furthermore, such loans and extensions of credit are required to be collateralized in specific amounts.
78
NOTE K: BENEFIT PLANS
Pension and post-retirement plans
The Company provides a qualified defined benefit pension to eligible employees and retirees, other post-retirement health and life insurance benefits to certain retirees, an unfunded supplemental pension plan for certain key executives, and an unfunded stock balance plan for certain of its nonemployee directors. Using a measurement date of December 31, the following table shows the funded status of the Company's plans reconciled with amounts reported in the Company's consolidated statements of condition:
|
Pension Benefits
|
Post-retirement Benefits
|
|||||||||||||||
|
(000's omitted)
|
2016
|
2015
|
2016
|
2015
|
||||||||||||
|
Change in benefit obligation:
|
||||||||||||||||
|
Benefit obligation at the beginning of year
|
$
|
127,134
|
$
|
127,513
|
$
|
1,918
|
$
|
2,256
|
||||||||
|
Service cost
|
4,106
|
3,324
|
0
|
0
|
||||||||||||
|
Interest cost
|
5,624
|
5,506
|
82
|
87
|
||||||||||||
|
Plan amendment / acquisition
|
22
|
2,395
|
0
|
0
|
||||||||||||
|
Participant contributions
|
0
|
0
|
516
|
509
|
||||||||||||
|
Deferred actuarial (gain)/loss
|
(1,628
|
)
|
(2,091
|
)
|
174
|
(45
|
)
|
|||||||||
|
Benefits paid
|
(8,174
|
)
|
(9,513
|
)
|
(884
|
)
|
(889
|
)
|
||||||||
|
Benefit obligation at end of year
|
127,084
|
127,134
|
1,806
|
1,918
|
||||||||||||
|
Change in plan assets:
|
||||||||||||||||
|
Fair value of plan assets at beginning of year
|
172,026
|
177,865
|
0
|
0
|
||||||||||||
|
Actual return of plan assets
|
14,402
|
1,125
|
0
|
0
|
||||||||||||
|
Participant contributions
|
0
|
0
|
516
|
509
|
||||||||||||
|
Employer contributions
|
2,146
|
616
|
368
|
380
|
||||||||||||
|
Plan acquisition
|
0
|
1,933
|
0
|
0
|
||||||||||||
|
Benefits paid
|
(8,174
|
)
|
(9,513
|
)
|
(884
|
)
|
(889
|
)
|
||||||||
|
Fair value of plan assets at end of year
|
180,400
|
172,026
|
0
|
0
|
||||||||||||
|
Over/(Under) funded status at year end
|
$
|
53,316
|
$
|
44,892
|
$
|
(1,806
|
)
|
$
|
(1,918
|
)
|
||||||
|
Amounts recognized in the consolidated statement of condition were:
|
||||||||||||||||
|
Other assets
|
$
|
64,709
|
$
|
56,361
|
$
|
0
|
$
|
0
|
||||||||
|
Other liabilities
|
(11,393
|
)
|
(11,469
|
)
|
(1,806
|
)
|
(1,918
|
)
|
||||||||
|
Amounts recognized in accumulated other comprehensive income (loss) ("AOCI") were:
|
||||||||||||||||
|
Net loss
|
$
|
28,323
|
$
|
34,016
|
$
|
183
|
$
|
4
|
||||||||
|
Net prior service cost (credit)
|
2,264
|
2,307
|
(1,801
|
)
|
(1,980
|
)
|
||||||||||
|
Pre-tax AOCI
|
30,587
|
36,323
|
(1,618
|
)
|
(1,976
|
)
|
||||||||||
|
Taxes
|
(11,622
|
)
|
(13,815
|
)
|
614
|
751
|
||||||||||
|
AOCI at year end
|
$
|
18,965
|
$
|
22,508
|
$
|
(1,004
|
)
|
$
|
(1,225
|
)
|
||||||
The benefit obligation for the defined benefit pension plan was $115.7 million as of December 31, 2016 and 2015, and the fair value of plan assets as of December 31, 2016 and 2015 was $180.4 million and $172.0 million, respectively. Effective December 31, 2015, the State Bank of Chittenango pension plan was merged into the Community Bank System, Inc. Pension Plan and the combined plan was revalued.
The Company has unfunded supplemental pension plans for certain key active and retired executives. The projected benefit obligation for the unfunded supplemental pension plan for certain key executives was $11.3 million for 2016 and $11.4 million for 2015, respectively. The Company also has an unfunded stock balance plan for certain of its nonemployee directors. The projected benefit obligation for the unfunded stock balance plan was $0.1 million for 2016 and $0.1 million for 2015, respectively. The plan was frozen effective December 31, 2009.
Effective December 31, 2009, the Company terminated its post-retirement medical program for current and future employees. Remaining plan participants will include only existing retirees as of December 31, 2010. This change was accounted for as a negative plan amendment and a $3.5 million, net of income taxes, benefit for prior service was recognized in AOCI in 2009. This negative plan amendment is being amortized over the expected benefit utilization period of remaining plan participants.
79
Amounts recognized in accumulated other comprehensive income, net of tax, for the year ended December 31, are as follows:
|
Pension Benefits
|
Post-retirement Benefits
|
|||||||||||||||
|
(000's omitted)
|
2016
|
2015
|
2016
|
2015
|
||||||||||||
|
Prior service (credit)/cost
|
$
|
(26
|
)
|
$
|
(5
|
)
|
$
|
110
|
$
|
110
|
||||||
|
Net (gain) loss
|
(3,517
|
)
|
4,482
|
111
|
(20
|
)
|
||||||||||
|
Total
|
$
|
(3,543
|
)
|
$
|
4,477
|
$
|
221
|
$
|
90
|
|||||||
The estimated costs, net of tax, that will be amortized from accumulated other comprehensive (income) loss into net periodic (income) cost over the next fiscal year are as follows:
|
(000's omitted)
|
Pension Benefits
|
Post-retirement Benefits
|
||||||
|
Prior service cost/(credit)
|
$
|
55
|
$
|
(179
|
)
|
|||
|
Net loss
|
1,010
|
6
|
||||||
|
Total
|
$
|
1,065
|
$
|
(173
|
)
|
|||
The weighted-average assumptions used to determine the benefit obligations as of December 31 are as follows:
|
Pension Benefits
|
Post-retirement Benefits
|
|||||
|
2016
|
2015
|
2016
|
2015
|
|||
|
Discount rate
|
4.50%
|
4.70%
|
4.40%
|
4.70%
|
||
|
Expected return on plan assets
|
7.00%
|
7.00%
|
N/A
|
N/A
|
||
|
Rate of compensation increase
|
3.50%
|
3.50%
|
N/A
|
N/A
|
||
The net periodic benefit cost as of December 31 is as follows:
|
Pension Benefits
|
Post-retirement Benefits
|
|||||||||||||||||||||||
|
(000's omitted)
|
2016
|
2015
|
2014
|
2016
|
2015
|
2014
|
||||||||||||||||||
|
Service cost
|
$
|
4,106
|
$
|
3,324
|
$
|
3,530
|
$
|
0
|
$
|
0
|
$
|
0
|
||||||||||||
|
Interest cost
|
5,624
|
5,506
|
5,271
|
82
|
87
|
102
|
||||||||||||||||||
|
Expected return on plan assets
|
(11,842
|
)
|
(12,169
|
)
|
(11,922
|
)
|
0
|
0
|
0
|
|||||||||||||||
|
Plan amendment
|
20
|
0
|
0
|
0
|
0
|
0
|
||||||||||||||||||
|
Amortization of unrecognized net loss/(gain)
|
1,508
|
1,466
|
(307
|
)
|
(5
|
)
|
(13
|
)
|
(7
|
)
|
||||||||||||||
|
Amortization of prior service cost
|
43
|
8
|
5
|
(179
|
)
|
(179
|
)
|
(179
|
)
|
|||||||||||||||
|
Net periodic (benefit)
|
$
|
(541
|
)
|
$
|
(1,865
|
)
|
$
|
(3,423
|
)
|
$
|
(102
|
)
|
$
|
(105
|
)
|
$
|
(84
|
)
|
||||||
Prior service costs in which all or almost all of the plan's participants are fully eligible for benefits under the plan are amortized on a straight-line basis over the expected future working years of all active plan participants. Unrecognized gains or losses are amortized using the "corridor approach", which is the minimum amortization required. Under the corridor approach, the net gain or loss in excess of 10 percent of the greater of the projected benefit obligation or the market-related value of the assets is amortized on a straight-line basis over the expected future working years of all active plan participants.
The weighted-average assumptions used to determine the net periodic pension cost for the years ended December 31 are as follows:
|
Pension Benefits
|
Post-retirement Benefits
|
|||||||
|
2016
|
2015
|
2014
|
2016
|
2015
|
2014
|
|||
|
Discount rate
|
4.70%
|
4.50%
|
5.00%
|
4.70%
|
4.50%
|
4.80%
|
||
|
Expected return on plan assets
|
7.00%
|
7.00%
|
7.00%
|
N/A
|
N/A
|
N/A
|
||
|
Rate of compensation increase
|
3.50%
|
3.50%
|
3.50%
|
N/A
|
N/A
|
N/A
|
||
80
The amount of benefit payments that are expected to be paid over the next ten years are as follows:
|
(000's omitted)
|
Pension Benefits
|
Post-retirement Benefits
|
||||||
|
2017
|
$
|
7,225
|
$
|
145
|
||||
|
2018
|
7,320
|
143
|
||||||
|
2019
|
7,504
|
141
|
||||||
|
2020
|
7,752
|
138
|
||||||
|
2021
|
7,914
|
136
|
||||||
|
2022-2026
|
41,823
|
636
|
||||||
The payments reflect future service and are based on various assumptions including retirement age and form of payment (lump-sum versus annuity). Actual results may differ from these estimates.
The assumed discount rate is used to reflect the time value of future benefit obligations. The discount rate was determined based upon the yield on high-quality fixed income investments expected to be available during the period to maturity of the pension benefits. This rate is sensitive to changes in interest rates. A decrease in the discount rate would increase the Company's obligation and future expense while an increase would have the opposite effect. The expected long-term rate of return was estimated by taking into consideration asset allocation, reviewing historical returns on the type of assets held and current economic factors. Based on the Company's anticipation of future experience under the defined benefit pension plan, the mortality tables used to determine future benefit obligations under the plan were updated as of December 31, 2016 to the RP-2014 Mortality Table for annuitants and non-annuitants, adjusted backward to 2006 with Scale MP-2014, and then adjusted for mortality improvements with the Scale MP-2016 mortality improvement scale on a generational basis. The appropriateness of the assumptions is reviewed annually.
Plan Assets
The investment objective for the defined benefit pension plan is to achieve an average annual total return over a five-year period equal to the assumed rate of return used in the actuarial calculations. At a minimum performance level, the portfolio should earn the return obtainable on high quality intermediate-term bonds. The Company's perspective regarding portfolio assets combines both preservation of capital and moderate risk-taking. Asset allocation favors equities, with a target allocation of approximately 60% equity securities and 40% fixed income securities and money market funds. Due to the volatility in the market, the target allocation is not always desirable and asset allocations will fluctuate between acceptable ranges. Prohibited transactions include purchase of securities on margin, uncovered call options, and short sale transactions.
The fair values of the Company's defined benefit pension plan assets at December 31, 2016 by asset category are as follows:
|
Asset category (000's omitted)
|
Quoted Prices
in Active
Markets for Identical Assets
Level 1
|
Significant Observable Inputs
Level 2
|
Significant Unobservable Inputs
Level 3
|
Total
|
||||||||||||
|
Money Market Accounts
|
$
|
103
|
$
|
8,048
|
$
|
0
|
$
|
8,151
|
||||||||
|
Equity securities:
|
||||||||||||||||
|
U.S. large-cap
|
43,235
|
0
|
0
|
43,235
|
||||||||||||
|
U.S mid/small cap
|
19,032
|
0
|
0
|
19,032
|
||||||||||||
|
CBSI stock
|
7,417
|
0
|
0
|
7,417
|
||||||||||||
|
International
|
27,064
|
0
|
0
|
27,064
|
||||||||||||
|
96,748
|
0
|
0
|
96,748
|
|||||||||||||
|
Fixed income securities:
|
||||||||||||||||
|
Government securities
|
25,375
|
5,863
|
0
|
31,238
|
||||||||||||
|
Investment grade bonds
|
15,253
|
0
|
0
|
15,253
|
||||||||||||
|
High yield
(a)
|
16,615
|
0
|
0
|
16,615
|
||||||||||||
|
57,243
|
5,863
|
0
|
63,106
|
|||||||||||||
|
Other investments
(b)
|
12,023
|
58
|
0
|
12,081
|
||||||||||||
|
Total
(c)
|
$
|
166,117
|
$
|
13,969
|
$
|
0
|
$
|
180,086
|
||||||||
81
The fair values of the Company's defined benefit pension plan assets at December 31, 2015 by asset category are as follows:
|
Asset category (000's omitted)
|
Quoted Prices
in Active
Markets for Identical Assets
Level 1
|
Significant Observable Inputs
Level 2
|
Significant Unobservable Inputs
Level 3
|
Total
|
||||||||||||
|
Money Market Accounts
|
$
|
2,240
|
$
|
5,750
|
$
|
0
|
$
|
7,990
|
||||||||
|
Equity securities:
|
||||||||||||||||
|
U.S. large-cap
|
34,985
|
0
|
0
|
34,985
|
||||||||||||
|
U.S mid/small cap
|
12,354
|
0
|
0
|
12,354
|
||||||||||||
|
CBSI stock
|
8,393
|
0
|
0
|
8,393
|
||||||||||||
|
International
|
28,136
|
0
|
0
|
28,136
|
||||||||||||
|
83,868
|
0
|
0
|
83,868
|
|||||||||||||
|
Fixed income securities:
|
||||||||||||||||
|
Government securities
|
31,397
|
6,488
|
0
|
37,885
|
||||||||||||
|
Investment grade bonds
|
14,517
|
0
|
0
|
14,517
|
||||||||||||
|
High yield
(a)
|
17,365
|
0
|
0
|
17,365
|
||||||||||||
|
63,279
|
6,488
|
0
|
69,767
|
|||||||||||||
|
Other investments
(b)
|
9,937
|
63
|
0
|
10,000
|
||||||||||||
|
Total
(c)
|
$
|
159,324
|
$
|
12,301
|
$
|
0
|
$
|
171,625
|
||||||||
|
(a) This category is exchange-traded funds representing a diversified index of high yield corporate bonds.
|
|
(b) This category is comprised of exchange-traded funds and mutual funds holding non-traditional investment classes including private equity funds
and alternative exchange funds.
|
|
(c) Excludes dividends and interest receivable totaling $0.3 million and $0.4 million at December 31, 2016 and 2015, respectively.
|
The valuation techniques used to measure fair value for the items in the table above are as follows:
|
·
|
Money market funds - Managed portfolios, including commercial paper and other fixed income securities issued by U.S. and foreign corporations, asset-backed commercial paper, U.S. government securities, obligations of foreign governments and U.S. and foreign banks, which are valued at the closing price reported on the market on which the underlying securities are traded.
|
|
·
|
Equity securities and other investments – Mutual funds, equity securities and common stock of the Company which are valued at the quoted market price of shares held at year-end.
|
|
·
|
Fixed income securities - U.S. Treasuries, municipal bonds and notes, government sponsored entities, and corporate debt valued at the closing price reported on the active market on which the individual securities are traded or for municipal bonds and notes based on quoted prices for similar assets in the active market.
|
The Company makes contributions to its funded qualified pension plan as required by government regulation or as deemed appropriate by management after considering the fair value of plan assets, expected return on such assets, and the value of the accumulated benefit obligation. The Company made a $1.53 million contribution to the State Bank of Chittenango pension plan in 2016. The Company made a $2.9 million contribution to its defined benefit pension plan in 2017. The Company funds the payment of benefit obligations for the supplemental pension and post-retirement plans because such plans do not hold assets for investment.
Tupper Lake National Bank ("TLNB"), acquired in 2007, participated in the Pentegra Defined Benefit Plan for Financial Institutions ("Pentegra DB Plan"), a multi-employer tax qualified defined benefit pension plan. The identification number and plan number of the Pentegra DB Plan are 13-5645888 and 333, respectively. All employees of TLNB who met minimum service requirements participated in the plan. As of June 30, 2015, the Pentegra DB Plan had total assets of $3.3 billion, actuarial present value of accumulated benefits of $3.3 billion and was at least 80 percent funded. The assets of the multi-employer plan may be used to satisfy obligations of any of the employers participating in the plan. As a result, contributions made by the Company may be used to provide benefits to participants of other participating employers. Contributions for 2016, 2015 and 2014 were approximately $0.05 million, $0.03 million, and $0.06 million, respectively. Contributions made by the Company to the Pentegra DB Plan do not represent more than 5% of contributions made to the Pentegra DB Plan.
The assumed health care cost trend rate used in the post-retirement health plan at December 31, 2016 was 7.50% for the pre-65 participants and 5.80% for the post-65 participants for medical costs and 10.5% for prescription drugs. The rate to which the cost trend rate is assumed to decline (the ultimate trend rate) and the year that the rate reaches the ultimate trend rate is 3.89% and 2075, respectively.
82
Assumed health care cost trend rates impact the amounts reported for the health care plan. A one-percentage-point increase or decrease in the trend rate would increase the service and interest cost components by nominal amounts.
401(k) Employee Stock Ownership Plan
The Company has a 401(k) Employee Stock Ownership Plan in which employees can contribute from 1% to 90% of eligible compensation, with the first 3% being eligible for a 100% matching contribution in the form of Company common stock and the next 3% being eligible for a 50% matching contributions in the form of Company common stock. The expense recognized under this plan for the years ended December 31, 2016, 2015 and 2014 was $4.3 million, $3.6 million, and $3.4 million, respectively. Effective January 1, 2010, the defined benefit pension plan was modified to a new plan design that includes an interest credit contribution to be made to the 401(k) plan. The expense recognized for this interest credit contribution for the years ended December 31, 2016, 2015, and 2014 was $0.7 million, $1.1 million, and $0.9 million, respectively.
The Company acquired the Oneida Savings Bank 401(k) Savings Plan and the Oneida Savings Bank Employee Stock Ownership Plan with the Oneida acquisition. Effective January 26, 2016, the Oneida Savings Bank 401(k) Savings Plan was merged into and became part of the Community Bank System, Inc. 401(k) Employee Stock Ownership Plan, and effective March 16, 2016, the Oneida Savings Bank Employee Stock Ownership plan was merged into and became part of the Community Bank System, Inc. 401(k) Employee Stock Ownership Plan.
Other Deferred Compensation Arrangements
In addition to the supplemental pension plans for certain executives, the Company has nonqualified deferred compensation arrangements for several former directors, officers and key employees. All benefits provided under these plans are unfunded and payments to plan participants are made by the Company. At December 31, 2016 and 2015, the Company has recorded a liability of $3.2 million and $3.6 million, respectively. The expense recognized under these plans for the years ended December 31, 2016, 2015, and 2014 was approximately $0.03 million, $0.1 million, and $0.3 million, respectively.
Deferred Compensation Plan for Directors
Directors may defer all or a portion of their director fees under the Deferred Compensation Plan for Directors. Under this plan, there is a separate account for each participating director which is credited with the amount of shares that could have been purchased with the director's fees as well as any dividends on such shares. On the distribution date, the director will receive common stock equal to the accumulated share balance in their account. As of December 31, 2016 and 2015, there were 154,013 and 151,672 shares credited to the participants' accounts, for which a liability of $4.0 million and $3.8 million was accrued, respectively. The expense recognized under the plan for the years ended December 31, 2016, 2015 and 2014, was $0.2 million, $0.2 million, and $0.2 million, respectively.
The Company has a long-term incentive program for directors, officers and employees. Under this program, the Company initially authorized four million shares of Company common stock for the grant of incentive stock options, nonqualified stock options, restricted stock awards, and retroactive stock appreciation rights. The long-term incentive program was amended effective May 25, 2011 and May 14, 2014 to authorize an additional 900,000 shares and 1,000,000 shares of Company common stock, respectively, for the grant of incentive stock options, nonqualified stock options, restricted stock awards, and retroactive stock appreciation rights. As of December 31, 2016, the Company has authorization to grant up to approximately 0.9 million additional shares of Company common stock for these instruments. The nonqualified (offset) stock options in its Director's Stock Balance Plan vest and become exercisable immediately and expire one year after the date the director retires or two years in the event of death. The remaining options have a ten-year term, and vest and become exercisable on a grant-by-grant basis, ranging from immediate vesting to ratably over a five-year period.
83
Activity in this long-term incentive program is as follows:
|
Stock Options
|
||||||||
|
|
Outstanding
|
Weighted-average Exercise Price of Shares
|
||||||
|
Outstanding at December 31, 2014
|
2,151,776
|
$
|
25.92
|
|||||
|
Granted
|
293,242
|
35.36
|
||||||
|
Exercised
|
(469,730
|
)
|
22.42
|
|||||
|
Forfeited
|
(5,987
|
)
|
30.21
|
|||||
|
Outstanding at December 31, 2015
|
1,969,301
|
28.15
|
||||||
|
Granted
|
330,383
|
38.02
|
||||||
|
Exercised
|
(525,298
|
)
|
25.12
|
|||||
|
Forfeited
|
(18,394
|
)
|
34.47
|
|||||
|
Outstanding at December 31, 2016
|
1,755,992
|
30.85
|
||||||
|
Exercisable at December 31, 2016
|
959,638
|
$
|
26.94
|
|||||
The following table summarizes the information about stock options outstanding under the Company's stock option plan at December 31, 2016:
|
Options outstanding
|
Options exercisable
|
|||||||||||||||||||||
|
Range of Exercise Price
|
Shares
|
Weighted-average
Exercise
Price
|
Weighted- average
Remaining
Life (years)
|
Shares
|
Weighted-average
Exercise
Price
|
|||||||||||||||||
|
$
|
0.00 – $18.00
|
44,436
|
$
|
17.70
|
2.22
|
44,436
|
$
|
17.70
|
||||||||||||||
|
$
|
18.001 – $23.00
|
267,307
|
19.06
|
1.97
|
267,307
|
19.06
|
||||||||||||||||
|
$
|
23.001 – $28.00
|
159,662
|
26.28
|
5.54
|
159,536
|
26.28
|
||||||||||||||||
|
$
|
28.001 – $29.00
|
203,365
|
28.78
|
5.22
|
153,369
|
28.78
|
||||||||||||||||
|
$
|
29.001 – $30.00
|
254,826
|
29.79
|
6.21
|
144,226
|
29.79
|
||||||||||||||||
|
$
|
30.001 – $40.00
|
826,396
|
37.08
|
8.31
|
190,764
|
37.06
|
||||||||||||||||
|
TOTAL
|
1,755,992
|
$
|
30.85
|
6.28
|
959,638
|
$
|
26.94
|
|||||||||||||||
The weighted-average remaining contractual term of outstanding and exercisable stock options at December 31, 2016 is 6.28 years and 4.89 years, respectively. The aggregate intrinsic value of outstanding and exercisable stock options at December 31, 2016 is $54.3 million and $33.4 million, respectively.
The Company recognized stock-based compensation expense related to incentive and non-qualified stock options of $2.2 million, $1.8 million and $2.0 million for the years ended December 31, 2016, 2015 and 2014, respectively. A related income tax benefit was recognized of $0.8 million, $0.7 million and $0.9 million for the 2016, 2015 and 2014 years, respectively. Compensation expense related to restricted stock vesting recognized in the income statement for 2016, 2015 and 2014 was approximately $2.4 million, $2.2 million and $2.0 million, respectively.
Management estimated the fair value of options granted using the Black-Scholes option-pricing model. This model was originally developed to estimate the fair value of exchange-traded equity options, which (unlike employee stock options) have no vesting period or transferability restrictions. As a result, the Black-Scholes model is not necessarily a precise indicator of the value of an option, but it is commonly used for this purpose. The Black-Scholes model requires several assumptions, which management developed based on historical trends and current market observations.
|
2016
|
2015
|
2014
|
||||||||||
|
Weighted-average Fair Value of Options Granted
|
$
|
7.90
|
$
|
7.48
|
$
|
8.38
|
||||||
|
Assumptions:
|
||||||||||||
|
Weighted-average expected life (in years)
|
6.50
|
6.50
|
6.50
|
|||||||||
|
Future dividend yield
|
3.43
|
%
|
3.40
|
%
|
3.70
|
%
|
||||||
|
Share price volatility
|
30.00
|
%
|
30.34
|
%
|
30.71
|
%
|
||||||
|
Weighted-average risk-free interest rate
|
1.72
|
%
|
1.73
|
%
|
2.69
|
%
|
||||||
84
Unrecognized stock-based compensation expense related to non-vested stock options totaled $4.4 million at December 31, 2016. The weighted-average period over which this unrecognized expense would be recognized is 3.2 years. The total fair value of stock options vested during 2016, 2015, and 2014 were $2.1 million, $1.9 million and $1.9 million, respectively.
During the 12 months ended December 31, 2016 and 2015, proceeds from stock option exercises totaled $12.0 million and $10.4 million, respectively, and the related tax benefits from exercise were approximately $2.7 million and $2.1 million, respectively. During the twelve months ended December 31, 2016 and 2015, approximately 0.4 million shares were issued in connection with stock option exercises each year. The total intrinsic value of options exercised during 2016, 2015 and 2014 were $10.3 million, $7.6 million and $5.7 million, respectively.
A summary of the status of the Company's unvested restricted stock awards as of December 31, 2016, and changes during the twelve months ended December 31, 2016 and 2015, is presented below:
|
Restricted
Shares
|
Weighted-average
grant date fair value
|
|||||||
|
Unvested at December 31, 2014
|
245,721
|
$
|
26.13
|
|||||
|
Awards
|
60,519
|
35.39
|
||||||
|
Forfeitures
|
(874
|
)
|
32.43
|
|||||
|
Vestings
|
(59,055
|
)
|
28.35
|
|||||
|
Unvested at December 31, 2015
|
246,311
|
27.85
|
||||||
|
Awards
|
148,240
|
27.04
|
||||||
|
Forfeitures
|
(42,394
|
)
|
17.49
|
|||||
|
Vestings
|
(98,327
|
)
|
25.64
|
|||||
|
Unvested at December 31, 2016
|
253,830
|
$
|
29.98
|
|||||
Unrecognized stock-based compensation expense related to unvested restricted stock totaled $5.7 million at December 31, 2016, which will be recognized as expense over the next five years. The weighted-average period over which this unrecognized expense would be recognized is 4.7 years. The total fair value of restricted stock vested during 2016, 2015, and 2014 were $2.5 million, $1.7 million and $1.6 million, respectively.
NOTE M: EARNINGS PER SHARE
The two class method is used in the calculations of basic and diluted earnings per share. Under the two class method, earnings available to common shareholders for the period are allocated between common shareholders and participating securities according to dividends declared and participation rights in undistributed earnings. The Company has determined that all of its outstanding non-vested stock awards are participating securities as of December 31, 2016.
Basic earnings per share are computed based on the weighted-average of the common shares outstanding for the period. Diluted earnings per share are based on the weighted-average of the shares outstanding and the assumed exercise of stock options during the year. The dilutive effect of options is calculated using the treasury stock method of accounting. The treasury stock method determines the number of common shares that would be outstanding if all the dilutive options (those where the average market price is greater than the exercise price) were exercised and the proceeds were used to repurchase common shares in the open market at the average market price for the applicable time period. There were approximately 0.3 million, 0.3 million and 0.2 million weighted-average anti-dilutive stock options outstanding at December 31, 2016, 2015 and 2014, respectively, which were not included in the computation below.
85
The following is a reconciliation of basic to diluted earnings per share for the years ended December 31, 2016, 2015 and 2014.
|
(000's omitted, except per share data)
|
2016
|
2015
|
2014
|
|||||||||
|
Net income
|
$
|
103,812
|
$
|
91,230
|
$
|
91,353
|
||||||
|
Income attributable to unvested stock-based compensation awards
|
(550
|
)
|
(453
|
)
|
(456
|
)
|
||||||
|
Income available to common shareholders
|
$
|
103,262
|
$
|
90,777
|
$
|
90,897
|
||||||
|
Weighted-average common shares outstanding - basic
|
44,091
|
40,996
|
40,548
|
|||||||||
|
Basic earnings per share
|
$
|
2.34
|
$
|
2.21
|
$
|
2.24
|
||||||
|
Net income
|
$
|
103,812
|
$
|
91,230
|
$
|
91,353
|
||||||
|
Income attributable to unvested stock-based compensation awards
|
(550
|
)
|
(453
|
)
|
(456
|
)
|
||||||
|
Income available to common shareholders
|
$
|
103,262
|
$
|
90,777
|
$
|
90,897
|
||||||
|
Weighted-average common shares outstanding
|
44,091
|
40,996
|
40,548
|
|||||||||
|
Assumed exercise of stock options
|
394
|
405
|
481
|
|||||||||
|
Weighted-average common shares outstanding – diluted
|
44,485
|
41,401
|
41,029
|
|||||||||
|
Diluted earnings per share
|
$
|
2.32
|
$
|
2.19
|
$
|
2.22
|
||||||
|
Cash dividends declared per share
|
$
|
1.26
|
$
|
1.22
|
$
|
1.16
|
||||||
At its December 2015 meeting, the Board approved a stock repurchase program authorizing the repurchase of up to 2.2 million shares of the Company's common stock, in accordance with securities laws and regulations, through December 31, 2016. At its December 2016 meeting, the Board approved a similar program for 2017, authorizing the repurchase of up to 2.2 million shares of the Company's common stock through December 31, 2017. Any repurchased shares will be used for general corporate purposes, including those related to stock plan activities. The timing and extent of repurchases will depend on market conditions and other corporate considerations as determined at the Company's discretion. There were no stock repurchases pursuant to the announced plan in 2016. During 2015 and 2014, the Company repurchased approximately 0.3 million and 0.1 million, respectively, shares of its common stock in open market transactions.
NOTE N: COMMITMENTS, CONTINGENT LIABILITIES AND RESTRICTIONS
The Company is a party to financial instruments with off-balance-sheet risk in the normal course of business to meet the financing needs of its customers. These financial instruments consist primarily of commitments to extend credit and standby letters of credit. Commitments to extend credit are agreements to lend to customers, generally having fixed expiration dates or other termination clauses that may require payment of a fee. These commitments consist principally of unused commercial and consumer credit lines. Standby letters of credit generally are contingent upon the failure of the customer to perform according to the terms of an underlying contract with a third party. The credit risks associated with commitments to extend credit and standby letters of credit are essentially the same as that involved with extending loans to customers and are subject to the Company's normal credit policies. Collateral may be obtained based on management's assessment of the customer's creditworthiness. The fair value of the standby letters of credit is immaterial for disclosure.
The contract amounts of commitments and contingencies are as follows at December 31:
|
(000's omitted)
|
2016
|
2015
|
||||||
|
Commitments to extend credit
|
$
|
773,442
|
$
|
811,442
|
||||
|
Standby letters of credit
|
22,656
|
19,053
|
||||||
|
Total
|
$
|
796,098
|
$
|
830,495
|
||||
The Company has unused lines of credit of $25.0 million at December 31, 2016. The Company has unused borrowing capacity of approximately $1.2 billion through collateralized transactions with the FHLB and $26.0 million through collateralized transactions with the Federal Reserve.
The Company is required to maintain a reserve balance, as established by the Federal Reserve. The required average total reserve for the 14-day maintenance period of December 22, 2016 through January 4, 2017 was
$82.8 million,
with $64.9 million represented by cash on hand and the remaining $17.9 million was required to be on deposit with the Federal Reserve.
86
The Company and its subsidiaries are subject in the normal course of business to various pending and threatened legal proceedings in which claims for monetary damages are asserted. As of December 31, 2016, management, after consultation with legal counsel, does not anticipate that the aggregate ultimate liability arising out of litigation pending or threatened against the Company or its subsidiaries will be material to the Company's consolidated financial position. On at least a quarterly basis the Company assesses its liabilities and contingencies in connection with such legal proceedings. For those matters where it is probable that the Company will incur losses and the amounts of the losses can be reasonably estimated, the Company records an expense and corresponding liability in its consolidated financial statements. To the extent the pending or threatened litigation could result in exposure in excess of that liability, the amount of such excess is not currently estimable. The range of reasonably possible losses for matters where an exposure is not currently estimable or considered probable, beyond the existing recorded liabilities, is between $0 and $1 million in the aggregate. Although the Company does not believe that the outcome of pending litigation will be material to the Company's consolidated financial position, it cannot rule out the possibility that such outcomes will be material to the consolidated results of operations for a particular reporting period in the future.
NOTE O: LEASES
The Company leases buildings, office space, and equipment under agreements that expire in various years. Rental expense included in operating expenses amounted to $5.8 million, $5.4 million and $5.3 million in 2016, 2015 and 2014, respectively. The future minimum rental commitments as of December 31, 2016 for all non-cancelable operating leases are as follows:
|
2017
|
$
|
6,078
|
||
|
2018
|
5,574
|
|||
|
2019
|
5,040
|
|||
|
2020
|
3,857
|
|||
|
2021
|
3,098
|
|||
|
Thereafter
|
7,297
|
|||
|
Total
|
$
|
30,944
|
The Company and the Bank are subject to various regulatory capital requirements administered by federal banking agencies. Failure to meet minimum capital requirements can initiate certain mandatory and possibly additional discretionary actions by regulators that, if undertaken, could have a direct material effect on the Company's financial statements. Under capital adequacy guidelines and the regulatory framework for prompt corrective action, the Company and the Bank must meet specific capital guidelines that involve quantitative measures of the Company's and the Bank's assets, liabilities, and certain off-balance sheet items as calculated under regulatory accounting practices. The Company's and the Bank's capital amounts and classification are also subject to qualitative judgments by the regulators about components, risk weightings, and other factors. Management believes, as of December 31, 2016, that the Company and Bank meet all applicable capital adequacy requirements.
Basel III Transitional rules became effective for the Company on January 1, 2015 with all of the requirements being phased in over a multi-year schedule, and fully phased in by January 1, 2019. Beginning in 2016, the Company and the Bank are required to maintain a "capital conservation buffer," composed entirely of common equity Tier 1 capital, in addition to minimum risk-based capital ratios. The required capital conservation buffer for 2016 is 0.625%.
Therefore, to satisfy both the minimum risk-based capital ratios and the capital conservation buffer in 2016, the Company and the Bank must maintain: (i) Common equity Tier 1 capital to total risk-weighted assets of at least 5.125%, (ii) Tier 1 capital to total risk-weighted assets of at least 6.625%, and (iii) Total capital (Tier 1 capital plus Tier 2 capital) to total risk-weighted assets of at least 8.625%.
As of December 31, 2016 and 2015, the amounts, ratios and requirements for the Company are presented below calculated under the Basel III Standardized Transitional Approach. As of December 31, 2016, the most recent notification from the OCC categorized the Company and Bank as "well capitalized" under the regulatory framework for prompt corrective action.
87
|
For capital adequacy
|
To be well-capitalized
|
|||||||||||||||||||||||||||||||
|
For capital adequacy
|
purposes plus Capital
|
under prompt
|
||||||||||||||||||||||||||||||
|
Actual
|
purposes
|
Conservation Buffer
|
corrective action
|
|||||||||||||||||||||||||||||
|
(000's omitted)
|
Amount
|
Ratio
|
Amount
|
Ratio
|
Amount
|
Ratio
|
Amount
|
Ratio
|
||||||||||||||||||||||||
|
Community Bank System, Inc.:
|
||||||||||||||||||||||||||||||||
|
2016
|
||||||||||||||||||||||||||||||||
|
Tier 1 Leverage ratio
|
$
|
858,347
|
10.55
|
%
|
$
|
325,438
|
4.00
|
%
|
$
|
406,798
|
5.00
|
%
|
||||||||||||||||||||
|
Tier 1 risk-based capital
|
858,347
|
18.10
|
%
|
284,583
|
6.00
|
%
|
$
|
314,228
|
6.625
|
%
|
379,445
|
8.00
|
%
|
|||||||||||||||||||
|
Total risk-based capital
|
905,996
|
19.10
|
%
|
379,445
|
8.00
|
%
|
409,089
|
8.625
|
%
|
474,306
|
10.00
|
%
|
||||||||||||||||||||
|
Common equity tier 1 capital
|
759,199
|
16.01
|
%
|
213,438
|
4.50
|
%
|
243,082
|
5.125
|
%
|
308,299
|
6.50
|
%
|
||||||||||||||||||||
|
2015
|
||||||||||||||||||||||||||||||||
|
Tier 1 Leverage ratio
|
$
|
788,717
|
10.32
|
%
|
$
|
305,761
|
4.00
|
%
|
$
|
382,201
|
5.00
|
%
|
||||||||||||||||||||
|
Tier 1 risk-based capital
|
788,717
|
17.09
|
%
|
276,886
|
6.00
|
%
|
369,181
|
8.00
|
%
|
|||||||||||||||||||||||
|
Total risk-based capital
|
834,539
|
18.08
|
%
|
369,181
|
8.00
|
%
|
461,477
|
10.00
|
%
|
|||||||||||||||||||||||
|
Common equity tier 1 capital
|
689,528
|
14.94
|
%
|
207,664
|
4.50
|
%
|
299,960
|
6.50
|
%
|
|||||||||||||||||||||||
|
Community Bank, N.A.:
|
||||||||||||||||||||||||||||||||
|
2016
|
||||||||||||||||||||||||||||||||
|
Tier 1 Leverage ratio
|
$
|
672,633
|
8.30
|
%
|
$
|
324,080
|
4.00
|
%
|
$
|
405,099
|
5.00
|
%
|
||||||||||||||||||||
|
Tier 1 risk-based capital
|
672,633
|
14.28
|
%
|
282,662
|
6.00
|
%
|
$
|
312,106
|
6.625
|
%
|
376,883
|
8.00
|
%
|
|||||||||||||||||||
|
Total risk-based capital
|
720,282
|
15.29
|
%
|
376,883
|
8.00
|
%
|
406,327
|
8.625
|
%
|
471,104
|
10.00
|
%
|
||||||||||||||||||||
|
Common equity tier 1 capital
|
672,578
|
14.28
|
%
|
211,997
|
4.50
|
%
|
241,441
|
5.125
|
%
|
306,217
|
6.50
|
%
|
||||||||||||||||||||
|
2015
|
||||||||||||||||||||||||||||||||
|
Tier 1 Leverage ratio
|
$
|
673,443
|
8.88
|
%
|
$
|
303,256
|
4.00
|
%
|
$
|
379,070
|
5.00
|
%
|
||||||||||||||||||||
|
Tier 1 risk-based capital
|
673,443
|
14.65
|
%
|
275,739
|
6.00
|
%
|
367,652
|
8.00
|
%
|
|||||||||||||||||||||||
|
Total risk-based capital
|
719,265
|
15.65
|
%
|
367,652
|
8.00
|
%
|
459,565
|
10.00
|
%
|
|||||||||||||||||||||||
|
Common equity tier 1 capital
|
673,326
|
14.65
|
%
|
206,804
|
4.50
|
%
|
298,717
|
6.50
|
%
|
|||||||||||||||||||||||
NOTE Q: PARENT COMPANY STATEMENTS
The condensed balance sheets of the parent company at December 31 are as follows:
|
(000's omitted)
|
2016
|
2015
|
||||||
|
Assets:
|
||||||||
|
Cash and cash equivalents
|
$
|
151,127
|
$
|
97,317
|
||||
|
Investment securities
|
3,628
|
3,576
|
||||||
|
Investment in and advances to:
|
||||||||
|
Bank subsidiary
|
1,116,554
|
1,117,419
|
||||||
|
Non-bank subsidiaries
|
35,566
|
30,643
|
||||||
|
Other assets
|
10,345
|
9,996
|
||||||
|
Total assets
|
$
|
1,317,220
|
$
|
1,258,951
|
||||
|
Liabilities and shareholders' equity:
|
||||||||
|
Accrued interest and other liabilities
|
$
|
16,950
|
$
|
16,158
|
||||
|
Borrowings
|
102,170
|
102,146
|
||||||
|
Shareholders' equity
|
1,198,100
|
1,140,647
|
||||||
|
Total liabilities and shareholders' equity
|
$
|
1,317,220
|
$
|
1,258,951
|
||||
88
The condensed statements of income of the parent company for the years ended December 31 is as follows:
|
(000's omitted)
|
2016
|
2015
|
2014
|
|||||||||
|
Revenues:
|
||||||||||||
|
Dividends from subsidiaries:
|
||||||||||||
|
Bank subsidiary
|
$
|
89,000
|
$
|
70,000
|
$
|
57,200
|
||||||
|
Non-bank subsidiaries
|
1,750
|
6,000
|
3,900
|
|||||||||
|
Interest and dividends on investments
|
102
|
94
|
88
|
|||||||||
|
Total revenues
|
90,852
|
76,094
|
61,188
|
|||||||||
|
Expenses:
|
||||||||||||
|
Interest on borrowings
|
2,949
|
2,537
|
2,477
|
|||||||||
|
Acquisition expenses
|
429
|
0
|
0
|
|||||||||
|
Other expenses
|
11
|
19
|
37
|
|||||||||
|
Total expenses
|
3,389
|
2,556
|
2,514
|
|||||||||
|
Income before tax benefit and equity in undistributed net income of subsidiaries
|
87,463
|
73,538
|
58,674
|
|||||||||
|
Income tax benefit/(expense)
|
866
|
(572
|
)
|
581
|
||||||||
|
Income before equity in undistributed net income of subsidiaries
|
88,329
|
72,966
|
59,255
|
|||||||||
|
Equity in undistributed net income of subsidiaries
|
15,483
|
18,264
|
32,098
|
|||||||||
|
Net income
|
$
|
103,812
|
$
|
91,230
|
$
|
91,353
|
||||||
|
Other comprehensive (loss)/income, net of tax:
|
||||||||||||
|
Other comprehensive income/(loss) related to pension and
other post retirement obligations
|
3,322
|
(4,567
|
)
|
(9,571
|
)
|
|||||||
|
Other comprehensive (loss)/income related to unrealized
(losses)/gains on available-for-sale securities
|
(14,714
|
)
|
(6,918
|
)
|
66,837
|
|||||||
|
Other comprehensive (loss)/income
|
(11,392
|
)
|
(11,485
|
)
|
57,266
|
|||||||
|
Comprehensive income
|
$
|
92,420
|
$
|
79,745
|
$
|
148,619
|
||||||
89
The statements of cash flows of the parent company for the years ended December 31 is as follows:
|
(000's omitted)
|
2016
|
2015
|
2014
|
|||||||||
|
Operating activities:
|
||||||||||||
|
Net income
|
$
|
103,812
|
$
|
91,230
|
$
|
91,353
|
||||||
|
Adjustments to reconcile net income to net cash provided by operating activities
|
||||||||||||
|
Equity in undistributed net income of subsidiaries
|
(15,483
|
)
|
(18,264
|
)
|
(32,098
|
)
|
||||||
|
Net change in other assets and other liabilities
|
(215
|
)
|
(27
|
)
|
(479
|
)
|
||||||
|
Net cash provided by operating activities
|
88,114
|
72,939
|
58,776
|
|||||||||
|
Investing activities:
|
||||||||||||
|
Proceeds from sale of investment securities
|
0
|
0
|
3
|
|||||||||
|
Cash received for acquisitions, net of cash acquired of $0, $81,772, and $0,
respectively
|
0
|
25,505
|
0
|
|||||||||
|
Capital contributions to subsidiaries
|
0
|
(80,231
|
)
|
0
|
||||||||
|
Net cash (used in) provided by investing activities
|
0
|
(54,726
|
)
|
3
|
||||||||
|
Financing activities:
|
||||||||||||
|
Issuance of common stock
|
15,326
|
13,975
|
13,410
|
|||||||||
|
Purchase of treasury stock
|
(3,470
|
)
|
(9,126
|
)
|
(4,368
|
)
|
||||||
|
Sale of treasury stock
|
8,888
|
16,571
|
1,531
|
|||||||||
|
Cash dividends paid
|
(55,048
|
)
|
(49,273
|
)
|
(46,178
|
)
|
||||||
|
Net cash used in financing activities
|
(34,304
|
)
|
(27,853
|
)
|
(35,605
|
)
|
||||||
|
Change in cash and cash equivalents
|
53,81
0
|
(9,640
|
)
|
23,174
|
||||||||
|
Cash and cash equivalents at beginning of year
|
97,317
|
106,957
|
83,783
|
|||||||||
|
Cash and cash equivalents at end of year
|
$
|
151,127
|
$
|
97,317
|
$
|
106,957
|
||||||
|
Supplemental disclosures of cash flow information:
|
||||||||||||
|
Cash paid for interest
|
$
|
2,909
|
$
|
2,523
|
$
|
2,473
|
||||||
|
Supplemental disclosures of noncash financing activities
|
||||||||||||
|
Dividends declared and unpaid
|
$
|
14,268
|
$
|
13,605
|
$
|
12,254
|
||||||
|
Capital contributions to subsidiaries
|
0
|
76,461
|
0
|
|||||||||
|
0
|
102,202
|
0
|
||||||||||
NOTE R: FAIR VALUE
Accounting standards allow entities an irrevocable option to measure certain financial assets and financial liabilities at fair value. Unrealized gains and losses on items for which the fair value option has been elected are reported in earnings. The Company has elected to value mortgage loans held for sale at fair value in order to more closely match the gains and losses associated with loans held for sale with the gains and losses on forward sales contracts. Accordingly, the impact on the valuation will be recognized in the Company's consolidated statement of income. All mortgage loans held for sale are current and in performing status.
Accounting standards establish a framework for measuring fair value and require certain disclosures about such fair value instruments. It defines fair value as the price that would be received to sell an asset or paid to transfer a liability in an orderly transaction between market participants at the measurement date (i.e. exit price). Inputs used to measure fair value are classified into the following hierarchy:
|
·
|
Level 1 – Quoted prices in active markets for identical assets or liabilities.
|
|
·
|
Level 2 – Quoted prices in active markets for similar assets or liabilities, or quoted prices for identical or similar assets or liabilities in markets that are not active, or inputs other than quoted prices that are observable for the asset or liability.
|
|
·
|
Level 3 – Significant valuation assumptions not readily observable in a market.
|
90
A financial instrument's categorization within the valuation hierarchy is based upon the lowest level of input that is significant to the fair value measurement. The following tables set forth the Company's financial assets and liabilities that were accounted for at fair value on a recurring basis. There were no transfers between any of the levels for the periods presented.
|
December 31, 2016
|
||||||||||||||||
|
(000's omitted)
|
Level 1
|
Level 2
|
Level 3
|
Total Fair Value
|
||||||||||||
|
Available-for-sale investment securities:
|
||||||||||||||||
|
U.S. Treasury and agency securities
|
$
|
1,902,762
|
$
|
0
|
$
|
0
|
$
|
1,902,762
|
||||||||
|
Obligations of state and political subdivisions
|
0
|
594,990
|
0
|
594,990
|
||||||||||||
|
Government agency mortgage-backed securities
|
0
|
235,230
|
0
|
235,230
|
||||||||||||
|
Corporate debt securities
|
0
|
5,687
|
0
|
5,687
|
||||||||||||
|
Government agency collateralized mortgage obligations
|
0
|
9,535
|
0
|
9,535
|
||||||||||||
|
Marketable equity securities
|
452
|
0
|
0
|
452
|
||||||||||||
|
Total available-for-sale investment securities
|
1,903,214
|
845,442
|
0
|
2,748,656
|
||||||||||||
|
Mortgage loans held for sale
|
0
|
2,416
|
0
|
2,416
|
||||||||||||
|
Commitments to originate real estate loans for sale
|
0
|
0
|
54
|
54
|
||||||||||||
|
Forward sales commitments
|
0
|
3
|
0
|
3
|
||||||||||||
|
Total
|
$
|
1,903,214
|
$
|
847,861
|
$
|
54
|
$
|
2,751,129
|
||||||||
|
December 31, 2015
|
||||||||||||||||
|
(000's omitted)
|
Level 1
|
Level 2
|
Level 3
|
Total Fair Value
|
||||||||||||
|
Available-for-sale investment securities:
|
||||||||||||||||
|
U.S. Treasury and agency securities
|
$
|
1,899,978
|
$
|
0
|
$
|
0
|
$
|
1,899,978
|
||||||||
|
Obligations of state and political subdivisions
|
0
|
666,883
|
0
|
666,883
|
||||||||||||
|
Government agency mortgage-backed securities
|
0
|
210,865
|
0
|
210,865
|
||||||||||||
|
Corporate debt securities
|
0
|
16,680
|
0
|
16,680
|
||||||||||||
|
Government agency collateralized mortgage obligations
|
0
|
13,308
|
0
|
13,308
|
||||||||||||
|
Marketable equity securities
|
399
|
0
|
0
|
399
|
||||||||||||
|
Total available-for-sale investment securities
|
1,900,377
|
907,736
|
0
|
2,808,113
|
||||||||||||
|
Mortgage loans held for sale
|
0
|
932
|
0
|
932
|
||||||||||||
|
Commitments to originate real estate loans for sale
|
0
|
0
|
117
|
117
|
||||||||||||
|
Forward sales commitments
|
0
|
(37
|
)
|
0
|
(37
|
)
|
||||||||||
|
Total
|
$
|
1,900,377
|
$
|
908,631
|
$
|
117
|
$
|
2,809,125
|
||||||||
The valuation techniques used to measure fair value for the items in the table above are as follows:
|
·
|
Available for sale investment securities – The fair value of available-for-sale investment securities is based upon quoted prices, if available. If quoted prices are not available, fair values are measured using quoted market prices for similar securities or model-based valuation techniques. Level 1 securities include U.S. Treasury obligations and marketable equity securities that are traded by dealers or brokers in active over-the-counter markets. Level 2 securities include U.S. agency securities, mortgage-backed securities issued by government-sponsored entities, municipal securities and corporate debt securities that are valued by reference to prices for similar securities or through model-based techniques in which all significant inputs, such as reported trades, trade execution data, LIBOR swap yield curve, market prepayment speeds, credit information, market spreads, and security's terms and conditions, are observable. See Note C for further disclosure of the fair value of investment securities.
|
|
·
|
Mortgage loans held for sale – Mortgage loans held for sale are carried at fair value, which is determined using quoted secondary-market prices of loans with similar characteristics and, as such, have been classified as a Level 2 valuation. The unpaid principal value of mortgage loans held for sale at December 31, 2016 is approximately $2.4 million. The unrealized gain on mortgage loans held for sale of approximately $2,000 was recognized in other banking services in the Consolidated Statement of Income for the year ended December 31, 2016.
|
91
|
·
|
Forward sales commitments – The Company enters into forward sales commitments to sell certain residential real estate loans. Such commitments are considered to be derivative financial instruments and, therefore, are carried at estimated fair value in the other asset or other liability section of the consolidated balance sheet. The fair value of these forward sales commitments is primarily measured by obtaining pricing from certain government-sponsored entities and reflects the underlying price the entity would pay the Company for an immediate sale on these mortgages. As such, these instruments are classified as Level 2 in the fair value hierarchy.
|
|
·
|
Commitments to originate real estate loans for sale – The Company enters into various commitments to originate residential real estate loans for sale. Such commitments are considered to be derivative financial instruments and, therefore, are carried at estimated fair value in the other asset or other liability section of the consolidated balance sheet. The estimated fair value of these commitments is determined using quoted secondary market prices obtained from certain government-sponsored entities. Additionally, accounting guidance requires the expected net future cash flows related to the associated servicing of the loan to be included in the fair value measurement of the derivative. The expected net future cash flows are based on a valuation model that calculates the present value of estimated net servicing income. The valuation model incorporates assumptions that market participants would use in estimating future net servicing income. Such assumptions include estimates of the cost of servicing loans, appropriate discount rate and prepayment speeds. The determination of expected net cash flows is considered a significant unobservable input contributing to the Level 3 classification of commitments to originate real estate loans for sale.
|
The changes in Level 3 assets measured at fair value on a recurring basis are summarized in the following tables:
|
For the Year Ending December 31,
|
||||||||
|
2016
|
2015
|
|||||||
|
(000's omitted)
|
Commitments
to Originate
Real Estate
Loans for Sale
|
Commitments
to Originate
Real Estate
Loans for Sale
|
||||||
|
Beginning balance
|
$
|
117
|
$
|
185
|
||||
|
Total (losses)/gains included in earnings
(1)
|
(1,234
|
)
|
(808
|
)
|
||||
|
Commitments to originate real estate loans held for sale, net
|
1,171
|
740
|
||||||
|
Ending balance
|
$
|
54
|
$
|
117
|
||||
|
(1)
Amounts included in earnings associated with the commitments to originate real estate loans for sale are reported as a component of other banking services in the Consolidated Statement of Income.
|
||||||||
Assets and liabilities measured on a non-recurring basis:
|
December 31, 2016
|
December 31, 2015
|
|||||||||||||||||||||||||||||||
|
(000's omitted)
|
Level 1
|
Level 2
|
Level 3
|
Total Fair Value
|
Level 1
|
Level 2
|
Level 3
|
Total Fair Value
|
||||||||||||||||||||||||
|
Impaired loans
|
$
|
0
|
$
|
0
|
$
|
633
|
$
|
633
|
$
|
0
|
$
|
0
|
$
|
1,765
|
$
|
1,765
|
||||||||||||||||
|
Other real estate owned
|
0
|
0
|
1,966
|
1,966
|
0
|
0
|
2,088
|
2,088
|
||||||||||||||||||||||||
|
Total
|
$
|
0
|
$
|
0
|
$
|
2,599
|
$
|
2,599
|
$
|
0
|
$
|
0
|
$
|
3,853
|
$
|
3,853
|
||||||||||||||||
Loans are generally not recorded at fair value on a recurring basis. Periodically, the Company records nonrecurring adjustments to the carrying value of loans based on fair value measurements for partial charge-offs of the uncollectible portions of those loans. Nonrecurring adjustments also include certain impairment amounts for collateral-dependent loans calculated when establishing the allowance for credit losses. Such amounts are generally based on the fair value of the underlying collateral supporting the loan and, as a result, the carrying value of the loan less the calculated valuation amount does not necessarily represent the fair value of the loan. Real estate collateral is typically valued using independent appraisals or other indications of value based on recent comparable sales of similar properties or assumptions generally observable in the marketplace, adjusted for non-observable inputs. Thus, the resulting nonrecurring fair value measurements are generally classified as Level 3. Estimates of fair value used for other collateral supporting commercial loans generally are based on assumptions not observable in the marketplace and, therefore, such valuations classify as Level 3. At December 31, 2016, there were two impaired loans recorded at the fair value of the underlying collateral.
92
Other real estate owned ("OREO") is valued at the time the loan is foreclosed upon and the asset is transferred to OREO. The value is based primarily on third party appraisals, less estimated costs to sell. The appraisals are sometimes further discounted based on management's historical knowledge, changes in market conditions from the time of valuation, and/or management's expertise and knowledge of the customer and customer's business. Such discounts are significant, ranging from 9% to 97% at December 31, 2016, and result in a Level 3 classification of the inputs for determining fair value. OREO is reviewed and evaluated on at least a quarterly basis for additional impairment and adjusted accordingly, based on the same factors identified above. The Company recovers the carrying value of OREO through the sale of the property. The ability to affect future sales prices is subject to market conditions and factors beyond the Company's control and may impact the estimated fair value of a property.
Originated mortgage servicing rights are recorded at their fair value at the time of sale of the underlying loan, and are amortized in proportion to and over the estimated period of net servicing income. The fair value of mortgage servicing rights is based on a valuation model incorporating inputs that market participants would use in estimating future net servicing income. Such inputs include estimates of the cost of servicing loans, appropriate discount rate, and prepayment speeds and are considered to be unobservable and contribute to the Level 3 classification of mortgage servicing rights. In accordance with GAAP, the Company must record impairment charges, on a nonrecurring basis, when the carrying value of a stratum exceeds its estimated fair value. Impairment is recognized through a valuation allowance. There is no valuation allowance at December 31, 2016 as the fair value of mortgage servicing rights of approximately $1.9 million exceeded the carrying value of approximately $1.4 million.
The Company evaluates goodwill for impairment on an annual basis, or more often if events or circumstances indicate there may be impairment. The fair value of each reporting unit is compared to the carrying amount of that reporting unit in order to determine if impairment is indicated. If so, the implied fair value of the reporting unit's goodwill is compared to its carrying amount and the impairment loss is measured by the excess of the carrying value of the goodwill over fair value of the goodwill. In such situations, the Company performs a discounted cash flow modeling technique that requires management to make estimates regarding the amount and timing of expected future cash flows of the assets and liabilities of the reporting unit that enable the Company to calculate the implied fair value of the goodwill. It also requires use of a discount rate that reflects the current return expectation of the market in relation to present risk-free interest rates, expected equity market premiums, peer volatility indicators and company-specific risk indicators. The Company did not recognize an impairment charge during 2016 or 2015.
The significant unobservable inputs used in the determination of fair value of assets classified as Level 3 on a recurring or non-recurring basis as of December 31, 2016 are as follows:
|
(000's omitted)
|
Fair Value
|
Valuation Technique
|
Significant Unobservable Inputs
|
Significant Unobservable Input Range
(Weighted Average)
|
||||||
|
Other real estate owned
|
$
|
1,966
|
Fair value of collateral
|
Estimated cost of disposal/market adjustment
|
9.0% - 97.0% (29.6
|
%)
|
||||
|
Impaired loans
|
633
|
Fair value of collateral
|
Estimated cost of disposal/market adjustment
|
15.0% - 50.0% (36.5
|
%)
|
|||||
|
Commitments to originate
real estate loans for sale
|
54
|
Discounted cash flow
|
Embedded servicing value
|
1
|
%
|
|||||
The significant unobservable inputs used in the determination of fair value of assets classified as Level 3 on a recurring or non-recurring basis as of December 31, 2015 are as follows:
|
(000's omitted)
|
Fair Value
|
Valuation Technique
|
Significant Unobservable Inputs
|
Significant Unobservable Input Range
(Weighted Average)
|
||||||
|
Other real estate owned
|
$
|
2,088
|
Fair value of collateral
|
Estimated cost of disposal/market adjustment
|
5.3% - 74.0% (27.7
|
%)
|
||||
|
Impaired loans
|
1,765
|
Fair value of collateral
|
Estimated cost of disposal/market adjustment
|
9.0% - 20.0% (17.9
|
%)
|
|||||
|
Commitments to originate
real estate loans for sale
|
117
|
Discounted cash flow
|
Embedded servicing value
|
1
|
%
|
|||||
The Company determines fair values based on quoted market values, where available, estimates of present values, or other valuation techniques. Those techniques are significantly affected by the assumptions used, including, but not limited to, the discount rate and estimates of future cash flows. In that regard, the derived fair value estimates cannot be substantiated by comparison to independent markets and, in many cases, may not be realized in immediate settlement of the instrument. Certain financial instruments and all nonfinancial instruments are excluded from fair value disclosure requirements. Accordingly, the aggregate fair value amounts presented do not represent the underlying value of the Company.
93
The carrying amounts and estimated fair values of the Company's other financial instruments that are not accounted for at fair value at December 31, 2016 and 2015 are as follows:
|
December 31, 2016
|
December 31, 2015
|
|||||||||||||||
|
(000's omitted)
|
Carrying Value
|
Fair Value
|
Carrying Value
|
Fair Value
|
||||||||||||
|
Financial assets:
|
||||||||||||||||
|
Net loans
|
$
|
4,901,329
|
4,935,140
|
$
|
4,755,974
|
$
|
4,808,856
|
|||||||||
|
Financial liabilities:
|
||||||||||||||||
|
Deposits
|
7,075,954
|
7,071,191
|
6,873,474
|
6,871,098
|
||||||||||||
|
Borrowings
|
146,200
|
146,200
|
301,300
|
301,300
|
||||||||||||
|
Subordinated debt held by unconsolidated subsidiary trusts
|
102,170
|
90,144
|
102,146
|
84,680
|
||||||||||||
The following is a further description of the principal valuation methods used by the Company to estimate the fair values of its financial instruments.
Loans have been classified as a Level 3 valuation. Fair values for variable rate loans that reprice frequently are based on carrying values. Fair values for fixed rate loans are estimated using discounted cash flows and interest rates currently being offered for loans with similar terms to borrowers of similar credit quality.
Deposits have been classified as a Level 2 valuation. The fair value of demand deposits, interest-bearing checking deposits, savings accounts and money market deposits is the amount payable on demand at the reporting date. The fair value of time deposit obligations are based on current market rates for similar products.
Borrowings have been classified as a Level 2 valuation. The fair value of FHLB overnight advances is the amount payable on demand at the reporting date. Fair values for long-term borrowings are estimated using discounted cash flows and interest rates currently being offered on similar borrowings, and are immaterial as of the reporting dates.
Subordinated debt held by unconsolidated subsidiary trusts have been classified as a Level 2 valuation. The fair value of subordinated debt held by unconsolidated subsidiary trusts are estimated using discounted cash flows and interest rates currently being offered on similar securities.
Other financial assets and liabilities – Cash and cash equivalents have been classified as a Level 1 valuation, while accrued interest receivable and accrued interest payable have been classified as a Level 2 valuation. The fair values of each approximate the respective carrying values because the instruments are payable on demand or have short-term maturities and present relatively low credit risk and interest rate risk.
NOTE S: DERIVATIVE INSTRUMENTS
The Company is party to derivative financial instruments in the normal course of its business to meet the financing needs of its customers and to manage its own exposure to fluctuations in interest rates. These financial instruments have been limited to commitments to originate real estate loans held for sale and forward sales commitments. The Company does not hold or issue derivative financial instruments for trading or other speculative purposes.
The Company enters into forward sales commitments for the future delivery of residential mortgage loans, and interest rate lock commitments to fund loans at a specified interest rate. The forward sales commitments are utilized to reduce interest rate risk associated with interest rate lock commitments and loans held for sale. Changes in the estimated fair value of the forward sales commitments and interest rate lock commitments subsequent to inception are based on changes in the fair value of the underlying loan resulting from the fulfillment of the commitment and changes in the probability that the loan will fund within the terms of the commitment, which is affected primarily by changes in interest rates and the passage of time. At inception and during the life of the interest rate lock commitment, the Company includes the expected net future cash flows related to the associated servicing of the loan as part of the fair value measurement of the interest rate lock commitments. These derivatives are recorded at fair value, which were immaterial at December 31, 2016. The effect of the changes to these derivatives for the year then ended was also immaterial.
94
NOTE T: VARIABLE INTEREST ENTITIES
The Company's wholly-owned subsidiaries, Community Statutory Trust III and Community Capital Trust IV, are VIEs for which the Company is not the primary beneficiary. Accordingly, the accounts of these entities are not included in the Company's consolidated financial statements. See further information regarding Community Statutory Trust III and Community Capital Trust IV in Note H: Borrowings.
In connection with the Company's acquisition of Oneida, the Company acquired OPFC II which holds a 50% membership interest in 706 North Clinton, LLC ("706 North Clinton"), an entity formed for the purpose of acquiring and rehabilitating real property. The real property held by 706 North Clinton is principally occupied by subsidiaries of the Company. The Company analyzed the operating agreement and capital structure of 706 North Clinton and determined that it was the primary beneficiary and therefore should consolidate 706 North Clinton in its financial statements. This conclusion was based on the determination that the Company has a de facto agency relationship because of the financing arrangement between the other member of 706 North Clinton and the Bank which provides OPFC II with both the power to direct the activities of 706 North Clinton and the obligation to absorb any losses of 706 North Clinton.
The carrying amount of the assets and liabilities of 706 North Clinton and the classification of these assets and liabilities in the Company's Consolidated Statements of Financial Condition at December 31 is as follows:
|
(000's omitted)
|
2016
|
2015
|
||||||
|
Cash and cash equivalents
|
$
|
30
|
$
|
42
|
||||
|
Premises and equipment, net
|
6,429
|
6,592
|
||||||
|
Other assets
|
0
|
9
|
||||||
|
Total assets
|
$
|
6,459
|
$
|
6,643
|
||||
|
Accrued interest and other liabilities / Total liabilities
|
$
|
1
|
$
|
5
|
||||
In addition to the assets and liabilities of 706 North Clinton, the minority interest in 706 North Clinton of $3.23 million at December 31, 2016 is included in the Company's Consolidated Statement of Financial Condition. The creditors of 706 North Clinton do not have a claim on the general assets of the Company. The Company's maximum loss exposure net of minority interest in 706 North Clinton is approximately $4.8 million as of December 31, 2016, including a $1.6 million loss exposure related to the financing agreement between the other member of 706 North Clinton and the Bank.
95
NOTE U: SEGMENT INFORMATION
Operating segments are components of an enterprise, which are evaluated regularly by the "chief operating decision maker" in deciding how to allocate resources and assess performance. The Company's chief operating decision maker is the President and Chief Executive Officer of the Company. The Company has identified Banking, Employee Benefit Services and All Other as its reportable operating business segments. CBNA operates the Banking segment that provides full-service banking to consumers, businesses, and governmental units in northern, central, and western New York as well as northeast Pennsylvania. Employee Benefit Services, which includes BPA, BPAS-APS (formerly Harbridge Consulting Group, LLC), BPAS Trust Company of Puerto Rico and HB&T,
provides employee benefit trust, collective investment fund, retirement plan administration, actuarial, VEBA/HRA, and health and welfare consulting services. The All Other segment is comprised of; (a) wealth
management services including trust services provided by the personal trust unit within the Bank, broker-dealer and investment advisory services provided by CISI, OWM, and The Carta Group, and asset management provided by Nottingham, and (b) full-service insurance, risk management and employee benefit services provided by OneGroup. The accounting policies used in the disclosure of business segments are the same as those described in the summary of significant accounting policies (See Note A).
Information about reportable segments and reconciliation of the information to the consolidated financial statements follows:
|
(000's omitted)
|
Banking
|
Employee Benefit Services
|
All Other
|
Eliminations
|
Consolidated
Total
|
|||||||||||||||
|
2016
|
||||||||||||||||||||
|
Net interest income
|
$
|
273,542
|
$
|
162
|
$
|
192
|
$
|
0
|
$
|
273,896
|
||||||||||
|
Provision for loan losses
|
8,076
|
0
|
0
|
0
|
8,076
|
|||||||||||||||
|
Noninterest income
|
66,059
|
48,261
|
43,747
|
(2,442
|
)
|
155,625
|
||||||||||||||
|
Amortization of intangible assets
|
2,682
|
420
|
2,377
|
0
|
5,479
|
|||||||||||||||
|
Other operating expenses
|
191,268
|
37,337
|
35,206
|
(2,442
|
)
|
261,369
|
||||||||||||||
|
Income before income taxes
|
$
|
137,575
|
$
|
10,666
|
$
|
6,356
|
$
|
0
|
$
|
154,597
|
||||||||||
|
Assets
|
$
|
8,598,057
|
$
|
38,742
|
$
|
71,428
|
$
|
(41,790
|
)
|
$
|
8,666,437
|
|||||||||
|
Goodwill
|
$
|
440,870
|
$
|
8,019
|
$
|
16,253
|
$
|
0
|
$
|
465,142
|
||||||||||
|
2015
|
||||||||||||||||||||
|
Net interest income
|
$
|
248,167
|
$
|
132
|
$
|
121
|
$
|
0
|
$
|
248,420
|
||||||||||
|
Provision for loan losses
|
6,447
|
0
|
0
|
0
|
6,447
|
|||||||||||||||
|
Noninterest income
|
57,704
|
46,784
|
20,967
|
(2,156
|
)
|
123,299
|
||||||||||||||
|
Amortization of intangible assets
|
2,803
|
515
|
345
|
0
|
3,663
|
|||||||||||||||
|
Other operating expenses
|
181,865
|
35,218
|
14,465
|
(2,156
|
)
|
229,392
|
||||||||||||||
|
Income before income taxes
|
$
|
114,756
|
$
|
11,183
|
$
|
6,278
|
$
|
0
|
$
|
132,217
|
||||||||||
|
Assets
|
$
|
8,513,228
|
$
|
35,011
|
$
|
70,067
|
$
|
(65,637
|
)
|
$
|
8,552,669
|
|||||||||
|
Goodwill
|
$
|
439,052
|
$
|
8,019
|
$
|
16,181
|
$
|
0
|
$
|
463,252
|
||||||||||
|
2014
|
||||||||||||||||||||
|
Net interest income
|
$
|
244,243
|
$
|
92
|
$
|
93
|
$
|
0
|
$
|
244,428
|
||||||||||
|
Provision for loan losses
|
7,178
|
0
|
0
|
0
|
7,178
|
|||||||||||||||
|
Noninterest income
|
58,565
|
43,701
|
18,634
|
(1,880
|
)
|
119,020
|
||||||||||||||
|
Amortization of intangible assets
|
3,438
|
647
|
202
|
0
|
4,287
|
|||||||||||||||
|
Other operating expenses
|
178,472
|
32,846
|
12,855
|
(1,880
|
)
|
222,293
|
||||||||||||||
|
Income before income taxes
|
$
|
113,720
|
$
|
10,300
|
$
|
5,670
|
$
|
0
|
$
|
129,690
|
||||||||||
|
Assets
|
$
|
7,463,379
|
$
|
31,513
|
$
|
15,635
|
$
|
(21,087
|
)
|
$
|
7,489,440
|
|||||||||
|
Goodwill
|
$
|
364,495
|
$
|
8,019
|
$
|
2,660
|
$
|
0
|
$
|
375,174
|
||||||||||
96
NOTE V: SUBSEQUENT EVENTS
Companies are required to evaluate events and transactions that occur after the balance sheet date but before the date the financial statements are issued, or available to be issued in the case of non-public entities. They must recognize in the financial statements the effect of all events or transactions that provide additional evidence of conditions that existed at the balance sheet date, including the estimates inherent in the financial preparation process. Entities do not recognize the impact of events or transactions that provide evidence about conditions that did not exist at the balance sheet date but arose after that date.
On February 3, 2017, the Company completed its acquisition of Northeast Retirement Services, Inc. ("NRS") and its subsidiary Global Trust Company ("GTC") headquartered in Woburn, Massachusetts for approximately $148 million in Company stock and cash. NRS was a privately held corporation focused on providing institutional transfer agency, master recordkeeping services, custom target date fund administration, trust product administration and customized reporting services to institutional clients. Its wholly-owned subsidiary, GTC, was chartered in the State of Maine in 2008, as a non-depository trust company which provides fiduciary services for collective investment trusts and other products. The acquisition will strengthen and complement the Company's existing employee benefit services businesses. Upon the completion of the merger, NRS is a wholly-owned subsidiary of BPAS and will operate as Northeast Retirement Services, LLC, a Delaware limited liability company. The initial accounting for the assets and liabilities assumed with this acquisition is incomplete as of the date of issuance of the financial statements due to the proximity of the acquisition date to the date of issuance.
97
Report on Internal Control Over Financial Reporting
Our management is responsible for establishing and maintaining adequate internal control over financial reporting, as such term is defined in Exchange Act Rule 13a-15(f). Under the supervision and with the participation of our management, including our principal executive officer and principal financial officer, we conducted an evaluation of the effectiveness of our internal control over financial reporting based on the framework in
Internal Control – Integrated Framework (2013)
issued by the Committee of Sponsoring Organizations of the Treadway Commission. Based on our evaluation, management concluded that our internal control over financial reporting was effective as of December 31, 2016.
The consolidated financial statements of the Company have been audited by PricewaterhouseCoopers LLP, an independent registered public accounting firm that was engaged to express an opinion as to the fairness of presentation of such financial statements. PricewaterhouseCoopers LLP was also engaged to audit the effectiveness of the Company's internal control over financial reporting. The report of PricewaterhouseCoopers LLP follows this report.
Community Bank System, Inc.
By: /s/ Mark E. Tryniski
Mark E. Tryniski,
President, Chief Executive Officer and Director
By: /s/ Scott Kingsley
Scott Kingsley,
Treasurer and Chief Financial Officer
98
Report of Independent Registered Public Accounting Firm
To the Board of Directors and Shareholders of
Community Bank System, Inc.
In our opinion, the accompanying consolidated statements of condition and the related consolidated statements of income, comprehensive income, changes in shareholders' equity, and cash flows present fairly, in all material respects, the financial position of Community Bank System, Inc. and its subsidiaries at December 31, 2016 and December 31, 2015, and the results of their operations and their cash flows for each of the three years in the period ended December 31, 2016 in conformity with accounting principles generally accepted in the United States of America. Also in our opinion, the Company maintained, in all material respects, effective internal control over financial reporting as of December 31, 2016, based on criteria established in
Internal Control - Integrated Framework (2013)
issued by the Committee of Sponsoring Organizations of the Treadway Commission (COSO). The Company's management is responsible for these financial statements, for maintaining effective internal control over financial reporting and for its assessment of the effectiveness of internal control over financial reporting, included in the accompanying Management's Annual Report on Internal Control over Financial Reporting. Our responsibility is to express opinions on these financial statements and on the Company's internal control over financial reporting based on our integrated audits. We conducted our audits in accordance with the standards of the Public Company Accounting Oversight Board (United States). Those standards require that we plan and perform the audits to obtain reasonable assurance about whether the financial statements are free of material misstatement and whether effective internal control over financial reporting was maintained in all material respects. Our audits of the financial statements included examining, on a test basis, evidence supporting the amounts and disclosures in the financial statements, assessing the accounting principles used and significant estimates made by management, and evaluating the overall financial statement presentation. Our audit of internal control over financial reporting included obtaining an understanding of internal control over financial reporting, assessing the risk that a material weakness exists, and testing and evaluating the design and operating effectiveness of internal control based on the assessed risk. Our audits also included performing such other procedures as we considered necessary in the circumstances. We believe that our audits provide a reasonable basis for our opinions.
A company's internal control over financial reporting is a process designed to provide reasonable assurance regarding the reliability of financial reporting and the preparation of financial statements for external purposes in accordance with generally accepted accounting principles. A company's internal control over financial reporting includes those policies and procedures that (i) pertain to the maintenance of records that, in reasonable detail, accurately and fairly reflect the transactions and dispositions of the assets of the company; (ii) provide reasonable assurance that transactions are recorded as necessary to permit preparation of financial statements in accordance with generally accepted accounting principles, and that receipts and expenditures of the company are being made only in accordance with authorizations of management and directors of the company; and (iii) provide reasonable assurance regarding prevention or timely detection of unauthorized acquisition, use, or disposition of the company's assets that could have a material effect on the financial statements.
Because of its inherent limitations, internal control over financial reporting may not prevent or detect misstatements. Also, projections of any evaluation of effectiveness to future periods are subject to the risk that controls may become inadequate because of changes in conditions, or that the degree of compliance with the policies or procedures may deteriorate.
/s/PricewaterhouseCoopers LLP
Buffalo, New York
March 1, 2017
99
TWO YEAR SELECTED QUARTERLY DATA (Unaudited)
|
2016 Results
|
4th
|
3rd
|
2nd
|
1
st
|
||||||||||||||||
|
(000's omitted, except per share data)
|
Quarter
|
Quarter
|
Quarter
|
Quarter
|
Total
|
|||||||||||||||
|
Net interest income
|
$
|
70,246
|
$
|
68,463
|
$
|
68,306
|
$
|
66,881
|
$
|
273,896
|
||||||||||
|
Provision for loan losses
|
2,640
|
1,790
|
2,305
|
1,341
|
8,076
|
|||||||||||||||
|
Net interest income after provision for loan losses
|
67,606
|
66,673
|
66,001
|
65,540
|
265,820
|
|||||||||||||||
|
Noninterest income
|
38,620
|
39,952
|
38,772
|
38,281
|
155,625
|
|||||||||||||||
|
Noninterest expenses
|
66,597
|
66,226
|
66,356
|
67,669
|
266,848
|
|||||||||||||||
|
Income before income taxes
|
39,629
|
40,399
|
38,417
|
36,152
|
154,597
|
|||||||||||||||
|
Income taxes
|
13,237
|
13,239
|
12,560
|
11,749
|
50,785
|
|||||||||||||||
|
Net income
|
$
|
26,392
|
$
|
27,160
|
$
|
25,857
|
$
|
24,403
|
$
|
103,812
|
||||||||||
|
Basic earnings per share
|
$
|
0.59
|
$
|
0.61
|
$
|
0.58
|
$
|
0.55
|
$
|
2.34
|
||||||||||
|
Diluted earnings per share
|
$
|
0.59
|
$
|
0.61
|
$
|
0.58
|
$
|
0.55
|
$
|
2.32
|
||||||||||
|
2015 Results
|
4th
|
3rd
|
2nd
|
1
st
|
||||||||||||||||
|
(000's omitted, except per share data)
|
Quarter
|
Quarter
|
Quarter
|
Quarter
|
Total
|
|||||||||||||||
|
Net interest income
|
$
|
64,989
|
$
|
62,363
|
$
|
61,228
|
$
|
59,840
|
$
|
248,420
|
||||||||||
|
Provision for loan losses
|
3,327
|
1,906
|
591
|
623
|
6,447
|
|||||||||||||||
|
Net interest income after provision for loan losses
|
61,662
|
60,457
|
60,637
|
59,217
|
241,973
|
|||||||||||||||
|
Noninterest income
|
33,148
|
31,386
|
29,719
|
29,046
|
123,299
|
|||||||||||||||
|
Noninterest expenses
|
64,980
|
56,079
|
56,048
|
55,948
|
233,055
|
|||||||||||||||
|
Income before income taxes
|
29,830
|
35,764
|
34,308
|
32,315
|
132,217
|
|||||||||||||||
|
Income taxes
|
9,759
|
10,742
|
10,468
|
10,018
|
40,987
|
|||||||||||||||
|
Net income
|
$
|
20,071
|
$
|
25,022
|
$
|
23,840
|
$
|
22,297
|
$
|
91,230
|
||||||||||
|
Basic earnings per share
|
$
|
0.48
|
$
|
0.61
|
$
|
0.58
|
$
|
0.55
|
$
|
2.21
|
||||||||||
|
Diluted earnings per share
|
$
|
0.47
|
$
|
0.60
|
$
|
0.58
|
$
|
0.54
|
$
|
2.19
|
||||||||||
None
Evaluation of Disclosure Controls and Procedures
The Company maintains disclosure controls and procedures, as defined in Rule 13a -15(e) and 15d – 15(e) under the Securities Exchange Act of 1934, as amended, designed to: (i) record, process, summarize, and report within the time periods specified in the SEC's rules and forms, and (ii) accumulate and communicate to management, including the principal executive and principal financial officers, as appropriate, to allow timely decisions regarding disclosure. Based on evaluation of the Company's disclosure controls and procedures, with the participation of the Chief Executive Officer ("CEO") and the Chief Financial Officer ("CFO"), the CEO and CFO have concluded that, as of the end of the period covered by this Annual Report on Form 10-K, these disclosure controls and procedures were effective as of December 31, 2016.
Management's Annual Report on Internal Control over Financial Reporting
Management's annual report on internal control over financial reporting is included under the heading "Report on Internal Control Over Financial Reporting" at Item 8 of this Annual Report on Form 10-K.
Report of the Registered Public Accounting Firm
The report of the Company's registered public accounting firm is included under the heading "Report of the Independent Registered Public Accounting Firm" at Item 8 of this Annual Report on Form 10-K.
100
Changes in Internal Control over Financial Reporting
The Company continually assesses the adequacy of its internal control over financial reporting and enhances its controls in response to internal control assessments, and internal and external audit and regulatory recommendations. No change in internal control over financial reporting during the quarter ended December 31, 2016 has materially affected, or is reasonably likely to materially affect, the Company's internal control over financial reporting.
Because of its inherent limitations, internal control over financial reporting may not prevent or detect misstatements. Also, projections of any evaluation of effectiveness to future periods are subject to the risk that controls may become inadequate due to changes in conditions, or that the degree of compliance with the policies or procedures may deteriorate.
None
Part III
The information concerning the Directors of the Company required by this Item 10 is incorporated herein by reference to the sections entitled "Nominees for Director and Directors Continuing in Office" in the Company's Definitive Proxy Statement for its 2017 Annual Meeting of Shareholders, which will be filed with the SEC on or about March 31, 2017 (the "Proxy Statement"). The information concerning executive officers of the Company required by this Item 10 is presented in Item 4A of this Annual Report on Form 10-K. Disclosure of compliance with Section 16(a) of the Securities Exchange Act of 1934, as amended, by the Company's directors and executive officers is incorporated by reference to the section entitled "Section 16(a) Beneficial Ownership Reporting Compliance" in the Proxy Statement. In addition, information concerning Audit Committee and Audit Committee Financial Expert is included in the Proxy Statement under the caption "Audit Committee Report" and is incorporated herein by reference.
The Company has adopted a code of ethics that applies to its principal executive officer, principal financial officer, principal accounting officer or controller, or persons performing similar functions. The text of the code of ethics is posted on the Company's website at
www.communitybankna.com
,
and is available free of charge in print to any person who requests it. The Company intends to satisfy the requirements under Item 5.05 of Form 8-K regarding an amendment to, or a waiver from, the code of ethics that relates to certain elements thereof, by posting such information on its website referenced above.
The information required by this Item 11 is incorporated herein by reference to the section entitled "Compensation of Executive Officers" in the Company's Proxy Statement.
The information required by this Item 12 is incorporated herein by reference to the section entitled "Nominees for Director and Directors Continuing in Office" in the Company's Proxy Statement.
The information required by this Item 13 is incorporated herein by reference to the sections entitled "Corporate Governance" and "Transactions with Related Parties" in the Company's Proxy Statement.
The information required by this Item 14 is incorporated herein by reference to the section entitled "Audit Fees" in the Company's Proxy Statement.
101
Part IV
(a) Documents filed as part of this report
(1)
All
financial
statements
. The following consolidated financial statements of Community Bank System, Inc. and subsidiaries are included in Item 8:
|
-
|
Consolidated Statements of Condition,
|
| December 31, 2016 and 2015 | |
| - | Consolidated Statements of Income, |
| Years ended December 31, 2016, 2015, and 2014 | |
| - |
Consolidated Statements of Comprehensive Income,
|
| Years ended December 31, 2016, 2015, and 2014 | |
| - | Consolidated Statements of Changes in Shareholders' Equity, |
| Years ended December 31, 2016, 2015, and 2014 | |
| - | Consolidated Statement of Cash Flows, |
| Years ended December 31, 2016, 2015, and 2014 | |
| - | Notes to Consolidated Financial Statements, |
| December 31, 2016 | |
| - | Report of Independent Registered Public Accounting Firm |
| - | Quarterly selected data, |
| Years ended December 31, 2016 and 2015 (unaudited) |
(2)
Financial statement schedules
. Schedules are omitted since the required information is either not applicable or shown elsewhere in the financial statements.
(3)
Exhibits
. The exhibits filed as part of this report and exhibits incorporated herein by reference to other documents are listed below:
|
2.1
|
Assignment, Purchase and Assumption Agreement, dated as of January 19, 2012, by and among Community Bank, N.A. and First Niagara Bank, N.A. Incorporated by reference to Exhibit 2.1 to the Current Report on Form 8-K filed on January 20, 2012 (Registration No. 001-13695).
|
|
2.2
|
Purchase and Assumption Agreement, dated as of January 19, 2012, by and among Community Bank, N.A. and First Niagara Bank, N.A. Incorporated by reference to Exhibit 2.2 to the Current Report on Form 8-K filed on January 20, 2012 (Registration No. 001-13695).
|
|
2.3
|
Assignment, Purchase and Assumption Agreement, dated as of January 19, 2012, by and between Community Bank, N.A. and First Niagara Bank, N.A., as amended as restated as of July 19, 2012. Incorporated by reference to Exhibit No. 99.1 to the Current Report on Form 8-K filed on July 24, 2012 (Registration No. 001-13695).
|
|
2.4
|
Amendment No. 1 to Purchase and Assumption Agreement, dated as of September 6, 2012, by and among Community Bank, N.A. and First Niagara Bank, N.A. Incorporated by reference to Exhibit 99.1 to the Current Report on Form 8-K filed on September 13, 2012 (Registration No. 001-13695).
|
|
2.5
|
Purchase and Assumption Agreement, dated as of July 23, 2013, by and between Community Bank, N.A. and Bank of America, N.A. Incorporated by reference to Exhibit No. 2.1 to the Current Report on Form 8-K filed on July 26, 2013 (Registration No. 001-13695).
|
|
2.6
|
Agreement and Plan of Merger, dated as of February 24, 2015, by and between Community Bank System, Inc. and Oneida Financial Corp. Incorporated by reference to Exhibit 2.1 to the Current Report on Form 8-K filed on February 25, 2015 (Registration No. 001-13695).
|
102
|
2.7
|
Agreement and Plan of Merger, dated as of October 22, 2016, by and between Community Bank System, Inc. and Merchants Bancshares, Inc. Incorporated by reference to Exhibit 2.1 to the Current Report on Form 8-K filed on October 27, 2016 (Registration No. 001-13695).
|
|
|
2.8
|
Agreement and Plan of Merger, dated as of December 2, 2016, by and among Community Bank System, Inc., Northeast Retirement Services, Inc., Cohiba Merger Sub, LLC and Shareholder Representative Services LLC. Incorporated by reference to Exhibit 2.1 to the Current Report on Form 8-K filed on December 8, 2016 (Registration No. 001-13695).
|
|
|
3.1
|
Certificate of Incorporation of Community Bank System, Inc., as amended. Incorporated by reference to Exhibit No. 3.1 to the Registration Statement on Form S-4 filed on October 20, 2000 (Registration No. 333-48374).
|
|
|
3.2
|
Certificate of Amendment of Certificate of Incorporation of Community Bank System, Inc. Incorporated by reference to Exhibit No. 3.1 to the Quarterly Report on Form 10-Q filed on May 7, 2004 (Registration No. 001-13695).
|
|
|
3.3
|
Certificate of Amendment of Certificate of Incorporation of Community Bank System, Inc. Incorporated by reference to Exhibit No. 3.1 to the Quarterly Report on Form 10-Q filed on August 9, 2013 (Registration No. 001-13695).
|
|
|
3.4
|
Bylaws of Community Bank System, Inc., amended July 18, 2007. Incorporated by reference to Exhibit 3.2 to the Current Report on Form 8-K filed on July 24, 2007 (Registration No. 001-13695).
|
|
|
4.1
|
Form of Common Stock Certificate. Incorporated by reference to Exhibit No. 4.1 to the Amendment No. 1 to the Registration Statement on Form S-3 filed on September 29, 2008 (Registration No. 333-153403).
|
|
| 10.1 | Indenture, dated as of December 8, 2006, between Community Bank System, Inc. and Wilmington Trust Company, as trustee. Incorporated by reference to Exhibit No. 4.1 to the Current Report on Form 8-K filed on December 12, 2006 (Registration No. 001-13695). | |
| 10.2 | Amended and Restated Declaration of Trust, dated as of December 8, 2006, among Community Bank System, Inc., as sponsor, Wilmington Trust Company, as Delaware trustee, Wilmington Trust Company, as institutional trustee, and Mark E. Tryniski, Scott A. Kingsley, and Joseph J. Lemchak as administrators. Incorporated by reference to Exhibit 10.1 to the Current Report on Form 8-K filed on December 12, 2006 (Registration No. 001-13695). | |
| 10.3 | Guarantee Agreement, dated as of December 8, 2006, between Community Bank System, Inc., as guarantor, and Wilmington Trust Company, as guarantee trustee. Incorporated by reference to Exhibit 10.1 to the Form 8-K filed on December 12, 2006 (Registration No. 001-13695). | |
| 10.4 | Employment Agreement, effective January 1, 2015, by and between Community Bank System, Inc., Community Bank, N.A., and Mark E. Tryniski. Incorporated by reference to Exhibit No. 10.1 to the Current Report on Form 8-K filed on January 2, 2015 (Registration No. 001-13695). (2) | |
| 10.5 | Supplemental Retirement Plan Agreement, effective as of December 31, 2008, by and among Community Bank, N.A., Community Bank System, Inc., and Mark E. Tryniski. Incorporated by reference to Exhibit No. 10.2 to the Current Report on Form 8-K filed on March 19, 2009 (Registration No. 001-13695). (2) | |
103
|
10.6
|
Employment Agreement, dated as of January1, 2017, by and among Community Bank System, Inc., Community Bank N.A., and Scott Kingsley. Incorporated by reference to Exhibit No. 10.1 to the Current Report on Form 8-K filed on January 6, 2017 (Registration No. 001-13695).
(2)
|
|
10.7
|
Supplemental Retirement Plan Agreement, effective September 29, 2009, by and between Community Bank System Inc., Community Bank, N.A., and Scott Kingsley. Incorporated by reference to Exhibit No. 10.1 to the Current Report on Form 8-K filed on October 1, 2009 (Registration No. 001-13695).
(2)
|
|
10.8
|
Employment Agreement, dated as of March 11, 2016, by and between Community Bank System, Inc., Community Bank N.A., and Brian D. Donahue. Incorporated by reference to Exhibit No. 10.1 to the Current Report on Form 8-K filed on March 16, 2016 (Registration No. 001-13695).
(2)
|
|
10.9
|
Supplemental Retirement Plan Agreement, dated as of October 18, 2013, by and between Community Bank System Inc., Community Bank, N.A., and Brian D. Donahue. Incorporated by reference to Exhibit No. 10.2 to the Current Report on Form 8-K filed on October 23, 2013 (Registration No. 001-13695).
(2)
|
|
10.10
|
Employment Agreement, dated as of January1, 2017, by and among Community Bank System, Inc., Community Bank N.A., and George J. Getman. Incorporated by reference to Exhibit No. 10.2 to the Current Report on Form 8-K filed on January 6, 2017 (Registration No. 001-13695).
(2)
|
|
10.11
|
Supplemental Retirement Plan Agreement, dated as of October 18, 2013, by and among Community Bank System, Inc., Community Bank, N.A., and George J. Getman. Incorporated by reference to Exhibit 10.3 to the Current Report on Form 8-K filed on October 23, 2013 (Registration No. 001-13695).
(2)
|
|
10.12
|
Employment Agreement, dated as of March 11, 2016, by and among Community Bank System, Inc., Community Bank N.A., and Joseph F. Serbun. Incorporated by reference to Exhibit No. 10.2 to the Current Report on Form 8-K filed on March 16, 2016 (Registration No. 001-13695).
(2)
|
|
10.13
|
Pre-2005 Supplemental Retirement Agreement, effective December 31, 2004, by and between Community Bank System, Inc., Community Bank, N.A., and Sanford Belden. Incorporated by reference to Exhibit No. 10.3 to the Annual Report on Form 10-K filed on March 15, 2005 (Registration No. 001-13695).
(2)
|
|
10.14
|
Post-2004 Supplemental Retirement Agreement, effective January 1, 2005, by and between Community Bank System, Inc., Community Bank, N.A., and Sanford Belden. Incorporated by reference to Exhibit No. 10.2 to the Annual Report on Form 10-K filed on March 15, 2005 (Registration No. 001-13695).
(2)
|
|
10.15
|
Supplemental Retirement Plan Agreement, effective March 26, 2003, by and between Community Bank System Inc. and Thomas McCullough. Incorporated by reference to Exhibit No. 10.11 to the Annual Report on Form 10-K filed on March 12, 2004 (Registration No. 001-13695).
(2)
|
|
10.16
|
2004 Long-Term Incentive Compensation Program, as to be amended. Incorporated by reference to Exhibit No. 99.1 to the Registration Statement on Form S-8 filed on December 19, 2012 (Registration No. 001-13695).
(2)
|
|
10.17
|
2014 Long-Term Incentive Plan. Incorporated by reference to Appendix A to the Definitive Proxy Statement on Schedule 14A filed on April 4, 2014 (Registration No. 001-13695).
(2)
|
|
10.18
|
Stock Balance Plan for Directors, as amended. Incorporated by reference to Annex I to the Definitive Proxy Statement on Schedule 14A filed on March 31, 1998 (Registration No. 001-13695).
(2)
|
|
10.19
|
Deferred Compensation Plan for Directors, as amended. Incorporated by reference to Annex I to the Definitive Proxy Statement on Schedule 14A filed on March 31, 1998 (Registration No. 001-13695).
(2)
|
104
|
10.20
|
Community Bank System, Inc. Pension Plan Amended and Restated as of January 1, 2004. Incorporated by reference to Exhibit No. 10.27 to the Annual Report on Form 10-K filed on March 15, 2005 (Registration No. 001-13695).
(2)
|
|
10.21
|
Amendment #1 to the Community Bank System, Inc. Pension Plan, as amended and restated as of January 1, 2004 ("Plan"). Incorporated by reference to Exhibit No. 10.27 to the Annual Report on Form 10-K filed on March 15, 2005 (Registration No. 001-13695).
(2)
|
|
10.22
|
Amendment #1 to the Deferred Compensation Plan For Certain Executive Employees of Community Bank System, Inc., as amended and restated as of January 1, 2002. Incorporated by reference to Exhibit No. 10.33 to the Annual Report on Form 10-K filed on March 15, 2005 (Registration No. 001-13695).
(2)
|
|
10.23
|
Community Bank System, Inc. 401(k) Employee Stock Ownership Plan, dated as of December 20, 2011. Incorporated by reference to Exhibit 4.5 to the Registration Statement on Form S-8 filed on December 20, 2013 (Registration No. 001-13695).
(2)
|
|
14.1
|
Community Bank System, Inc., Code of Ethics. Incorporated by reference to Exhibit No. 1 to the Annual Report on Form 10-K filed on March 15, 2005 (Registration No. 001-13695).
|
|
21.1
|
Subsidiaries of Registrant.
(1)
|
|
23.1
|
Consent of PricewaterhouseCoopers LLP.
(1)
|
|
31.1
|
Certification of Mark E. Tryniski, President and Chief Executive Officer of the Registrant, pursuant to Rule 13a-15(e) or Rule 15d-15(e) under the Securities Exchange Act of 1934, as adopted pursuant to Section 302 of the Sarbanes-Oxley Act of 2002.
(1)
|
|
31.2
|
Certification of Scott Kingsley, Treasurer and Chief Financial Officer of the Registrant, pursuant to Rule 13a-15(e) or Rule 15d-15(e) under the Securities Exchange Act of 1934, as adopted pursuant to Section 302 of the Sarbanes-Oxley Act of 2002.
(1)
|
|
32.1
|
Certification of Mark E. Tryniski, President and Chief Executive Officer of the Registrant, pursuant to 18 U.S.C. Section 1350, as adopted pursuant to Section 906 of the Sarbanes-Oxley Act of 2002.
(3)
|
|
32.2
|
Certification of Scott Kingsley, Treasurer and Chief Financial Officer of the Registrant, pursuant to 18 U.S.C. Section 1350, as adopted pursuant to Section 906 of the Sarbanes-Oxley Act of 2002.
(3)
|
|
101
|
Interactive data files pursuant to Rule 405 of Regulation S-T: (i) the Consolidated Statements of Condition, (ii) the Consolidated Statements of Income, (iii) the Consolidated Statements of Comprehensive Income, (iv) the Consolidated Statements of Changes in Stockholders' Equity, (v) the Consolidated Statements of Cash Flows, and (vi) the Notes to Consolidated Financial Statements tagged as blocks of text and in detail.
(4)
|
(1) Filed herewith.
(2) Denotes management contract or compensatory plan or arrangement.
(3) Furnished herewith.
(4) XBRL (Extensible Business Reporting Language) information is furnished and not filed or a part of a registration statement or prospectus for purposes of sections 11 or 12 of the Securities Act of 1933, is deemed not filed for purposes of section 18 of the Securities Exchange Act of 1934, and otherwise is not subject to liability under these sections.
B.
Not applicable
C.
Not applicable.
None
105
SIGNATURES
Pursuant to the requirements of Section 13 or 15(d) of the Securities Exchange Act of 1934, the registrant has duly caused this report to be signed on its behalf by the undersigned, thereunto duly authorized.
COMMUNITY BANK SYSTEM, INC.
By:
/s/ Mark E. Tryniski
Mark E. Tryniski
President and Chief Executive Officer
March 1, 2017
Pursuant to the requirements of the Securities and Exchange Act of 1934, this report has been signed below by the following persons on behalf of the registrant and in the capacities indicated on the 1
st
day of March 2017.
By:
/s/ Mark E. Tryniski
Mark E. Tryniski
President, Chief Executive Officer and Director
(Principal Executive Officer)
By:
/s/ Scott Kingsley
Scott Kingsley
Treasurer and Chief Financial Officer
(Principal Financial Officer and Principal Accounting Officer)
Directors:
|
/s/ Brian R. Ace
|
/s/ John Parente
|
|
Brian R. Ace, Director
|
John Parente, Director
|
|
/s/ Mark J. Bolus
|
/s/ Sally A. Steele
|
|
Mark J. Bolus, Director
|
Sally A. Steele, Director and Chair of the
Board of Directors
|
|
/s/ Nicholas A. DiCerbo
|
/s/ John F. Whipple, Jr.
|
|
Nicholas A. DiCerbo, Director
|
John F. Whipple Jr., Director
|
|
/s/ Neil E. Fesette
|
/s/ Michael R. Kallet
|
|
Neil E. Fesette, Director
|
Michael R. Kallet, Director
|
|
/s/ James A. Gabriel
|
/s/ Eric E. Stickels
|
|
James A. Gabriel, Director
|
Eric E. Stickels, Director
|
|
/s/ Edward S. Mucenski
|
|
|
Edward S. Mucenski, Director
|
|
106
TABLE OF CONTENTS
Part IItem 1. BusinessItem 1A. Risk FactorsItem 1B. Unresolved Staff CommentsItem 2. PropertiesItem 3. Legal ProceedingsItem 4. Mine Safety DisclosuresItem 4A. Executive Officers Of The RegistrantPart IIItem 5. Market For The Registrant's Common Equity, Related Stockholder Matters and Issuer Purchases Of Equity SecuritiesItem 6. Selected Financial DataItem 7. Management's Discussion and Analysis Of Financial Condition and Results Of OperationsItem 7A. Quantitative and Qualitative Disclosures About Market RiskItem 8. Financial Statements and Supplementary DataItem 9. Changes in and Disagreements with Accountants on Accounting and Financial DisclosureItem 9A. Controls and ProceduresItem 9B. Other InformationPart IIIItem 10. Directors, Executive Officers and Corporate GovernanceItem 11. Executive CompensationItem 12. Security Ownership Of Certain Beneficial Owners and Management and Related Stockholder MattersItem 13. Certain Relationships and Related Transactions and Director IndependenceItem 14. Principal Accounting Fees and ServicesPart IVItem 15. Exhibits, Financial Statement SchedulesItem 16. Form 10-k Summary