United States
Securities and Exchange Commission
Washington, D.C. 20549
FORM 20-F
(MarkOne)
¨
REGISTRATION STATEMENT PURSUANT TO SECTION 12(b) OR (g) OF THE SECURITIES EXCHANGE ACT OF 1934
OR
☒ ANNUAL REPORT PURSUANT TO SECTION 13 OR 15(d) OF THE SECURITIES EXCHANGE ACT OF 1934
For the fiscal year ended December 31, 2017
OR
¨
TRANSITION REPORT PURSUANT TO SECTION 13 OR 15(d) OF THE SECURITIES EXCHANGE ACT OF 1934
OR
¨
SHELL COMPANY REPORT PURSUANT TO SECTION 13 OR 15(d) OF THE SECURITIES EXCHANGE ACT OF 1934
Commission file number 1-37791
COCA-COLA EUROPEAN PARTNERS PLC
(Exact name of Registrant as specified in its charter)
England and Wales
(Jurisdiction of incorporation or organization)
Bakers Road, Uxbridge, UB8 1EZ, United Kingdom
(Address of principal executive offices)
Contact
(+44 (0)1895 231 313, Secretariat@ccep.com, Bakers Road, Uxbridge, UB8 1EZ, United Kingdom)
Securities registered or to be registered pursuant to Section 12(b) of the Act:
|
Title of each class
|
|
Name on each exchange on which registered
|
|
Ordinary Shares of €0.01 each
|
|
New York Stock Exchange
|
Securities registered or to be registered pursuant to Section 12(g) of the Act: None.
Securities for which there is a reporting obligation pursuant to Section 15(d) of the Act: None.
Indicate the number of outstanding shares of each of the issuer’s classes of capital or common stock as of the close of the period covered by the annual report: 484,586,428 Ordinary Shares of €0.01 each
Indicate by check mark if the registrant is a well-known seasoned issuer, as defined in Rule 405 of the Securities Act Yes ☒ No ☐
If this Report is an annual or transition report, indicate by check mark if the registrant is not required to file reports pursuant to Section 13 or 15(d) of the Securities Exchange Act of 1934 Yes ☐ No ☒
Indicate by check mark whether the registrant (1) has filed all reports required to be filed by Section 13 or 15(d) of the Securities Exchange Act of 1934 during the preceding 12 months (or for such shorter period that the registrant was required to file such reports), and (2) has been subject to such filing requirements for the past 90 days: Yes ☒ No ☐
Indicate by check mark whether the registrant has submitted electronically and posted on its corporate Web site, if any, every Interactive Data File required to be submitted and posted pursuant to Rule 405 of Regulation S-T(§232.405 of this chapter) during the preceding 12 months (or for such shorter period that the registrant was required to submit and post such files). Yes ☒ No ☐
Indicate by check mark whether the registrant is a large accelerated filer, an accelerated filer, a non-accelerated filer, or an emerging growth company. See definition of large accelerated filer,"accelerated filer, and "emerging growth company" in Rule 12b-2 of the Exchange Act.
|
Large accelerated filer
|
☒
|
Accelerated filer
|
☐
|
Non-accelerated filer
|
☐
|
|
Emerging growth company
|
☐
|
||||
Indicate by check mark which basis of accounting the registrant has used to prepare the financial statements included in this filing.
|
U.S. GAAP
|
☐
|
International Financial Reporting Standards as issued by the International Accounting Standards Board
|
☒
|
Other
|
☐
|
If “Other” has been checked to the previous question indicate by check mark which financial statement item the registrant has elected to follow: Item 17 ☐ Item 18 ☐
If this is an annual report, indicated by check mark whether the registrant is a shell company (as defined in Rule 12b-2 of the Exchange Act). Yes ☐ No ☒

|
P a g e |
ii
|
|
TABLE OF CONTENTS
|
|||
|
INTRODUCTION
|
|||
|
AT A GLANCE
|
|||
|
STRATEGIC REPORT
|
|||
|
CHAIRMAN’S LETTER
|
|||
|
CEO’S LETTER
|
|||
|
STRATEGY
|
|||
|
PERFORMANCE INDICATORS
|
|||
|
BUSINESS MODEL
|
|||
|
BUSINESS AND FINANCIAL REVIEW
|
|||
|
SUSTAINABILITY
|
|||
|
PRINCIPAL RISKS
|
|||
|
RISK FACTORS
|
|||
|
VIABILITY STATEMENT
|
|||
|
GOVERNANCE AND DIRECTORS’ REPORT
|
|||
|
CHAIRMAN’S INTRODUCTION TO GOVERNANCE AND DIRECTORS’ REPORT
|
|||
|
BOARD OF DIRECTORS
|
|||
|
SENIOR MANAGEMENT
|
|||
|
CORPORATE GOVERNANCE REPORT
|
|||
|
NOMINATION COMMITTEE CHAIRMAN’S LETTER
|
|||
|
NOMINATION COMMITTEE REPORT
|
|||
|
AUDIT COMMITTEE CHAIRMAN’S LETTER
|
|||
|
AUDIT COMMITTEE REPORT
|
|||
|
DIRECTORS’ REMUNERATION REPORT
|
|||
|
STATEMENT FROM THE REMUNERATION COMMITTEE CHAIRMAN
|
|||
|
OVERVIEW OF THE REMUNERATION POLICY
|
|||
|
2017 REMUNERATION AT A GLANCE
|
|||
|
ANNUAL REPORT ON REMUNERATION
|
|||
|
DIRECTORS’ REPORT
|
|||
|
DIRECTORS’ RESPONSIBILITIES STATEMENT
|
|||
|
FINANCIAL STATEMENTS
|
|||
|
INDEPENDENT AUDITORS’ REPORTS
|
|||
|
CONSOLIDATED FINANCIAL STATEMENTS
|
|||
|
NOTES TO THE CONSOLIDATED FINANCIAL STATEMENTS
|
|||
|
COMPANY FINANCIAL STATEMENTS
|
|||
|
NOTES TO THE COMPANY FINANCIAL STATEMENTS
|
|||
|
OTHER INFORMATION
|
|||
|
OTHER GROUP INFORMATION
|
|||
|
FORM 20-F TABLE OF CROSS REFERENCES
|
|||
|
EXHIBITS
|
|||
|
GLOSSARY
|
|||
|
USEFUL ADDRESSES
|
|||
None of the websites referred to in this Annual Report on Form 20-F for the year ended 31 December 2017 (the Form 20-F), including where a link is provided, nor any of the information contained on such websites is incorporated by reference in the Form 20-F.
|
|
P a g e |
1
|
Welcome to the Coca-Cola European Partners plc 2017 Annual Report
DELIGHTING CUSTOMERS AND CONSUMERS
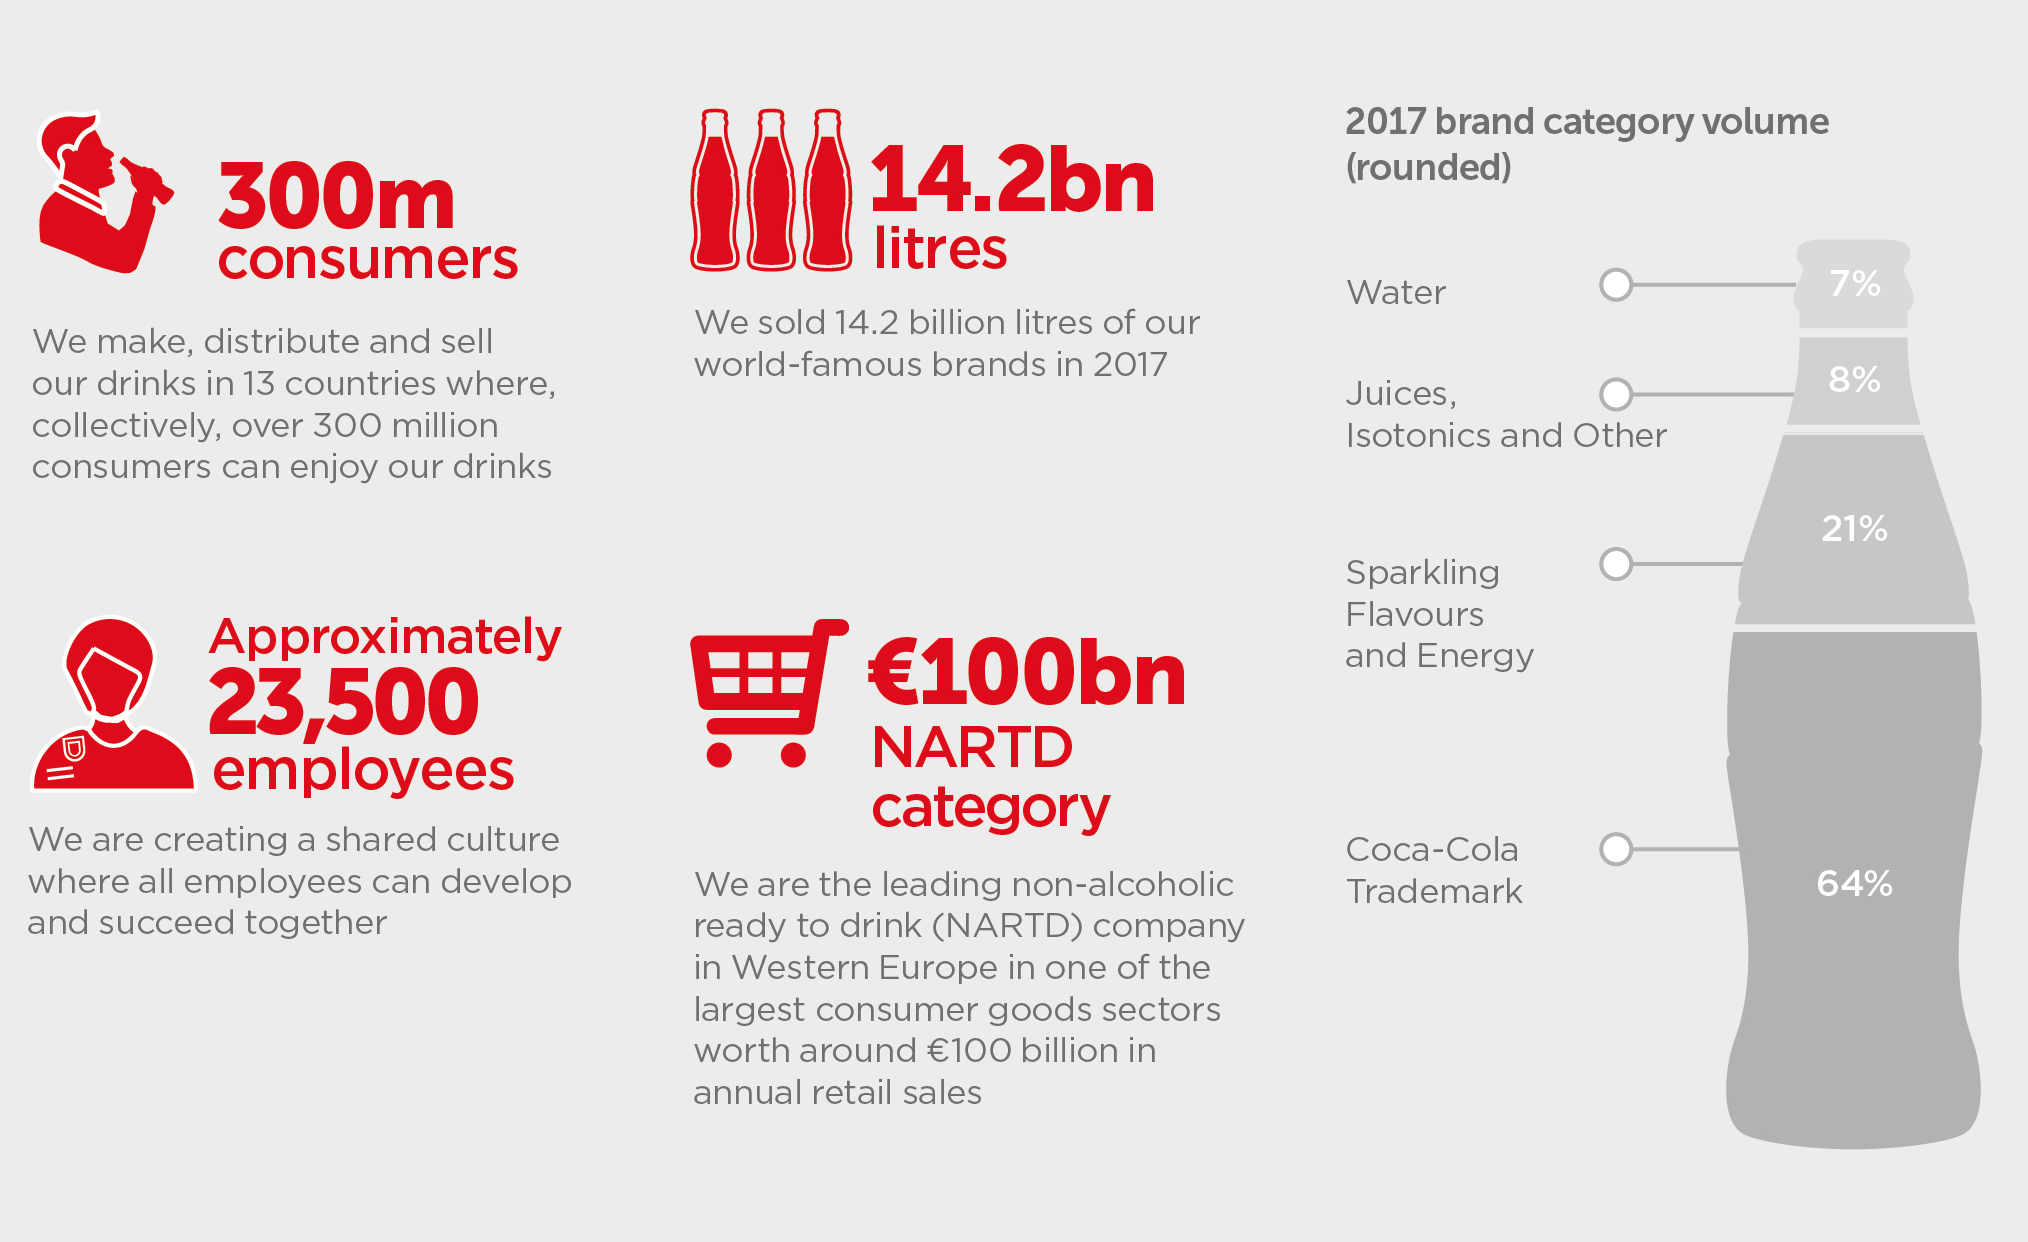
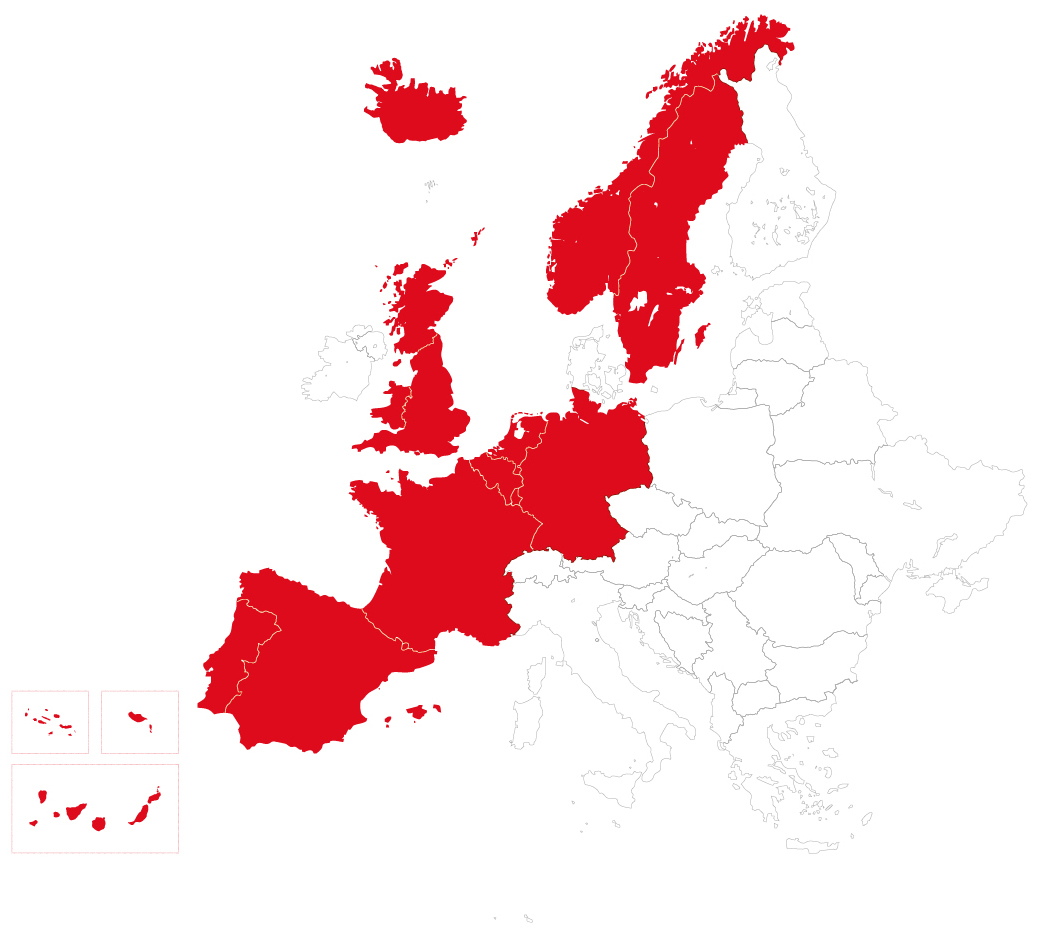
Coca-Cola European Partners is a leading consumer goods company and the world’s largest independent Coca-Cola bottler by revenue, operating in 13 countries and employing around 23,500 people. We are proud of our strong heritage in Western Europe and, as Coca-Cola European Partners, we are establishing a compelling track record and platform for profitable growth through our combined experience, scale and reach.
Over 300 million people can enjoy our drinks in Western Europe and, working together with The Coca-Cola Company, we are leading the way in our markets, offering consumers a greater choice of drinks with reduced or no sugar, holding ourselves accountable for our packaging and expanding the contribution we make to society. We are taking action on sustainability to build a better future, for people and for the planet. We work closely with customers to understand their needs and priorities and develop tailored strategies to deliver shared value.
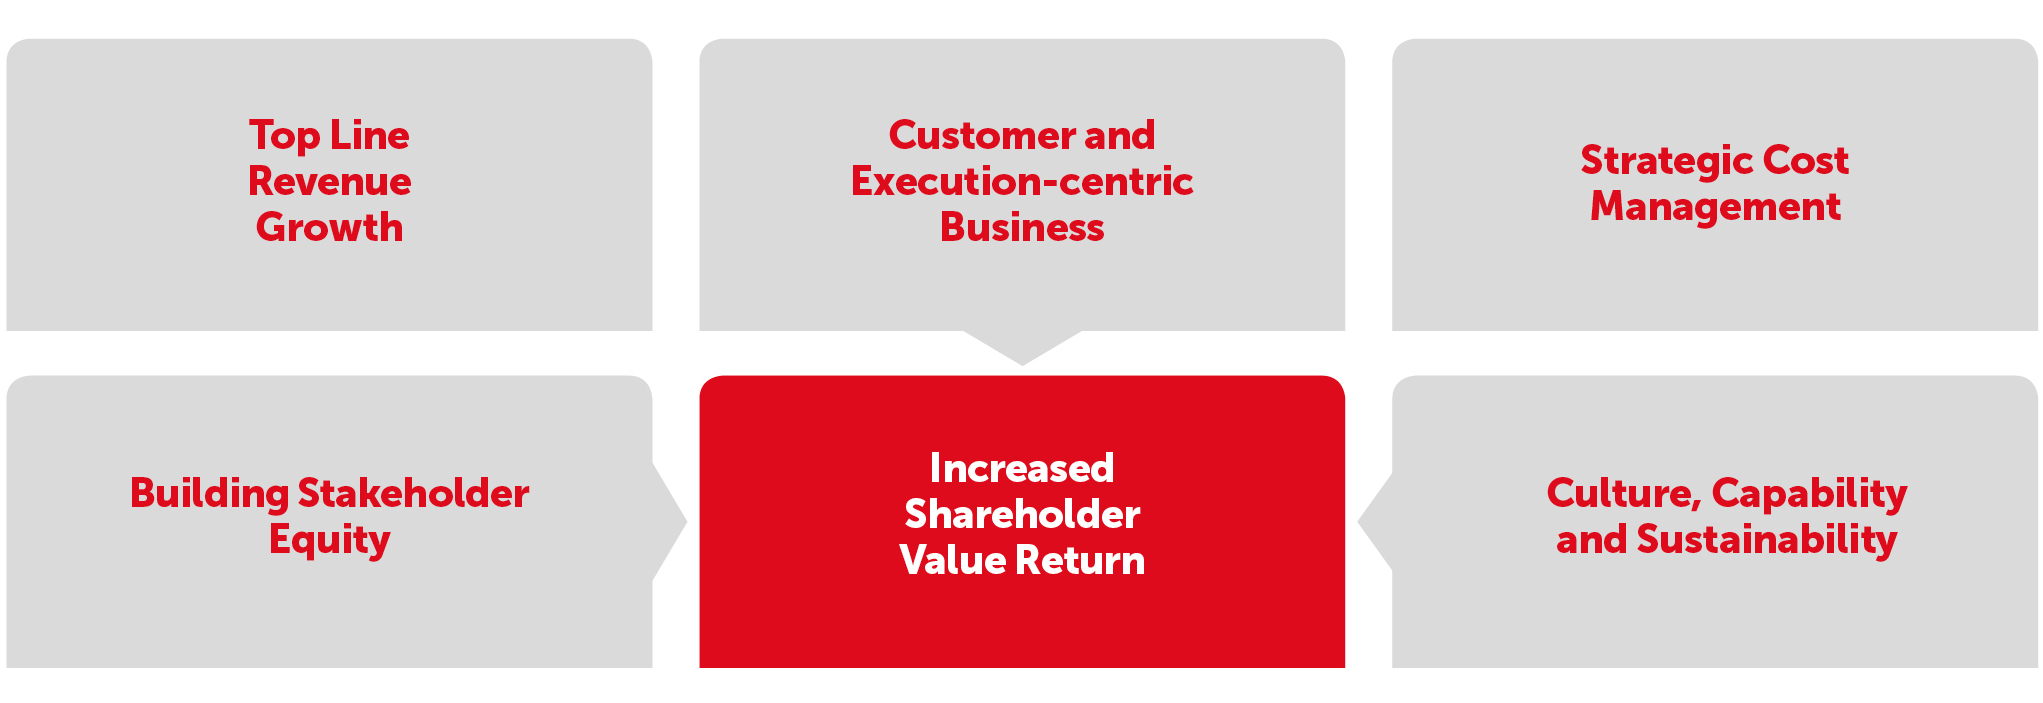
In our first 18 months, we have become a leading consumer goods company capable of delivering long-term growth, and we are on a journey to be the world’s most sustainable and valuable Coca-Cola bottler creating increased shareholder value.
|
|
P a g e |
2
|
GREAT BEVERAGES, SERVICE AND PEOPLE
We are the world’s largest independent Coca-Cola bottler and one of Europe’s leading consumer goods companies
At our core, we provide customers and consumers with great beverages and great service, creating shared and sustainable value.
We look at our business through two lenses: consumer categories and customer channels.
In each category, we are meeting changing consumer preferences by expanding our offering and re-shaping our portfolio to offer a wider range of drinks including more low/no-sugar brands and more innovative packages.
In each channel, we are collaborating with customers to drive joint value creation through unparalleled execution, having the right product available at the right price across more outlets and occasions.
We are focused on delivering world-class customer service to existing customers and expanding the range of customers we serve. This will include building new relationships in the e-commerce and leisure channels and with institutions.
|
|
P a g e |
3
|
Achieving sustainable growth
Our goal is to deliver long-term and sustainable growth and create shared value. To do this, we are:
|
•
|
Investing in our existing portfolio and launching new brands with scale and impact to offer a drink for every taste and occasion
|
|
•
|
Working closely with existing and new customers to reach more consumers in more outlets
|
|
•
|
Improving our route to market so our products are more available and visible to consumers
|
Our growth culture
Focus on customers & front line
We do everything we can to help the front line team develop our business and delight our customers.
Passion for growth
We show our determination to grow the business, take accountability and develop ourselves.
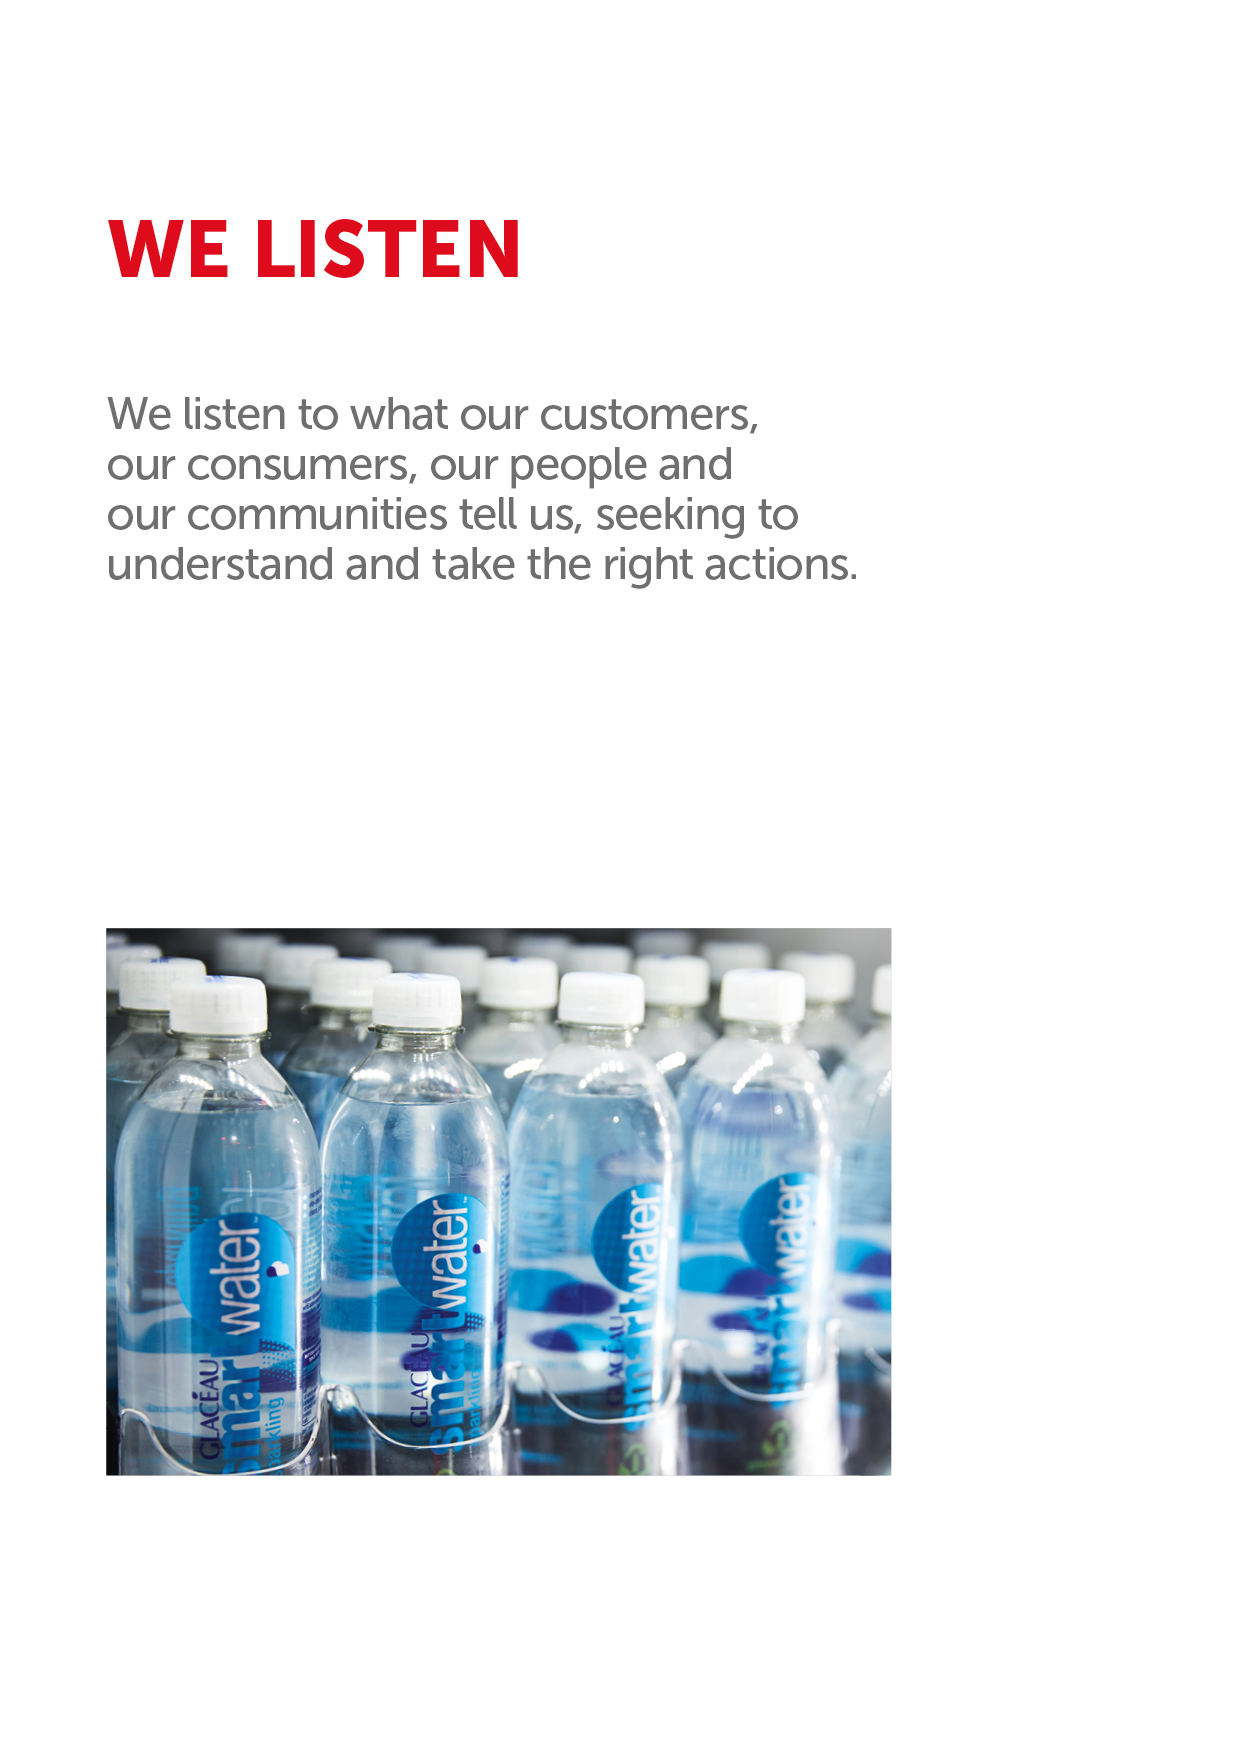
Listening & caring
We listen to what our colleagues, customers, consumers and communities tell us – seeking to understand and take the right actions.
Empowered to win together
We work together to win, encouraging diverse ideas and supporting people at every level to make decisions.
Execute with speed & agility
We move quickly, find ways to remove barriers and make things happen.
Our relationship with The Coca-Cola Company (TCCC)
Over the last year we have strengthened our relationship with TCCC, developing a shared long-term plan to create value and a joint sustainability action plan for Western Europe.
TCCC makes and sells concentrates, beverage bases and syrups to bottling operations, owns the brands and is responsible for consumer brand marketing. We license these brands and purchase the concentrate to sell, make and distribute the packaged beverages to our customers and vending partners, who then retail our products to consumers. We work closely with our customers to execute localised strategies based on a vision for growth that is shared with TCCC.

|
|
P a g e |
6
|
CHAIRMAN’S LETTER
I am proud of what we have achieved in our first 18 months. We have delivered consistent profitable growth and shared value for Coca-Cola European Partners (CCEP), our customers, partners, employees and shareholders.
In 2017, CCEP has established itself as a leading consumer goods company and made great progress in setting the foundations for long-term sustainable growth.
Western Europe remains a dynamic market, with ongoing political, social and economic changes. 2017 has ushered in new governments in some of the countries in which we operate, increased governance requirements for businesses, and, in our own industry, an evolved retail landscape through customer mergers, increased regulation and changes in shoppers’ habits.
While our business is realistic about these challenges, CCEP is well positioned to take advantage of the opportunities that come with change.
Footprint for growth
We have made clear choices about CCEP’s strategy and operating model, putting the customer at the heart of everything we do and focusing on the front line where we can have the greatest impact in the market.
We have increased investment in key areas of the business. This includes putting the best coolers in the right places so consumers can enjoy our drinks wherever they are. Our production and distribution network has also been improved to support our growing range of products.
We continued to invest in our sales force to make sure it remains a powerful competitive strength, particularly through harnessing new technology. We have improved our route to market so our products are more visible and available and deepened relationships with world class customer management.
We are working closely with our partners, particularly The Coca-Cola Company, to be a total beverage company, offering consumers a drink for every occasion including low and no-sugar options. Last year, this included the launch of new brands, such as Royal Bliss, as well as innovations that helped grow existing strong brands, like trademark Coca-Cola, Fanta and Monster. In premium water and tea, we introduced new brands and will expand existing brands geographically, including Honest and GLACÉAU Smartwater.
Sustainable future
We are also working hard with our partners to make and sell our brands in a responsible and sustainable way. In November, CCEP and The Coca-Cola Company in Western Europe launched an ambitious new sustainability action plan, This is Forward. You can read the plan in full at www.ccep.com/pages/thisisforward. I am proud of the plan which sets out a clear direction of how we intend to work together, using the strength of our businesses and our brands to build a better future.
The plan is based on three priority actions on drinks, packaging and society, which are underpinned by three supporting actions that are core to our business operations: climate, water and supply chain. There are 21 goals, each one identified and developed in the context of the global challenges that face our communities, our society and our business today.
While ambitious, our action plan builds upon 10 years of focused work on sustainability across Western Europe. Importantly, our sustainability action plan, is the result of listening to our stakeholders - including governments, Non-Governmental Organisations, customers, suppliers - as well as thousands of consumers and employees, to ensure we deliver the changes that matter most to all of us.
|
|
P a g e |
7
|
Strength in people
CCEP’s employees continue a proud legacy in Western Europe and combine expert, local knowledge with a passion for our brands and business. I am grateful for their dedication and all they do every day to serve our customers and communities.
I would also like to thank my fellow Directors who have brought their wisdom and leadership to bear on all aspects of our business. I would particularly like to express my gratitude to Francisco Ruiz de la Torre Esporrín and Sandy Douglas, both of whom are stepping down to dedicate more time to their other roles. Francisco brought a fresh perspective and Sandy a wealth of experience of the Coca-Cola system, particularly drawing from the North American bottling business. I am pleased to welcome Álvaro Gómez-Trénor Aguilar and Francisco Crespo Benítez to the Board.
With the Board, I have had the opportunity to visit plants and markets in Spain, Great Britain and Germany. I have also enjoyed taking part in an Accelerate Performance programme for all our leaders, which has been designed to embed our new culture and strategy with company leaders. I have also been on the panel at major diversity network events in Great Britain and France. I have been consistently impressed with the quality and engagement of our people and the progress we are making together.
We are committed to being a company where people are proud to work and where success is strengthened through mutual growth. I believe we have the right team in place to do this. Under the leadership of Damian Gammell and his executive team, we are creating a culture that is agile and flexible, and values diversity and inclusion.
Finally, I would like to thank all of our shareholders for their support. 2018 will build on the strong progress we have made as CCEP. We will continue to listen to and work closely with all our partners and stakeholders to ensure we can accelerate our performance and the value we create together.
Sol Daurella
Chairman
“I am proud of what we have achieved in our first 18 months. We have delivered consistent profitable growth and shared value for CCEP, our customers, partners, employees and shareholders.”

|
|
P a g e |
8
|
CEO’S LETTER
This is an exciting time to be a leader in the non-alcoholic ready to drink category in Western Europe. The demand for innovation in great tasting drinks, packages and brands has never been greater, and Coca-Cola European Partners (CCEP) is ready to meet the consumer challenges and opportunities.
Our goal is clear: to work closely with new and existing customers to make even more great beverages available to more consumers, creating long-term sustainable and profitable growth. We made good progress in 2017, delivering comparable revenue growth of 1.5%.
With the creation of CCEP, we are uniquely positioned to do this through our local footprint and unrivalled sales force. We are able to operate with scale across 13 countries where we make, sell and distribute our products. At the same time, we support a wide range of customer outlets across Western Europe.
Our success is built on three fundamental elements: our portfolio of great brands, the great service and execution we provide to our customers, and our great people who make this happen every day.
A drink for every taste and occasion
Together with our partners at The Coca-Cola Company, our goal is to create a portfolio of beverages that caters for every taste and occasion. We are delivering on this through innovation and growth in leading brands, including Coca-Cola trademark brands, while also bringing new beverages to market.
2017 demonstrates this strategy is creating value. Coca-Cola Zero Sugar continues to be popular with consumers, with volume growth of approximately 15% in 2017. We are also giving consumers more choice across a range of popular brands by introducing new flavours, low or no-sugar variants, and contemporary and sustainable packaging in a variety of sizes.
In May 2017, we relaunched Fanta with a new logo, new recipe and new bottle. We built on a successful launch with a fun and engaging Halloween campaign, limited edition packaging and in-store execution. Sparkling flavours and energy grew 4% in volume in 2017, driven in part by Fanta’s success.
Our presence in energy and emerging drinks segments, such as ready to drink tea, is also growing. Monster, supported by the exciting partnership with Lewis Hamilton, contributed to 16% volume growth in energy in the final quarter of 2017. We also are increasing our presence in adult sparkling drinks, with the launch of Royal Bliss in Spain, the Finley brand in several markets, and the relaunch of Schweppes in Great Britain.
In 2018, we will continue this strategy, supporting the growth of our core brands and further new product development, including the expansion of the Honest and GLACÉAU Smartwater brands in our markets, and the launch of Fuze tea and AdeZ - a plant based smoothie with nuts, seeds and fruit.
Winning with customers
Our focus on value creation starts with our customers, who we put at the heart of every aspect of our business. CCEP will be known for world class customer management and we have a relentless focus on great execution store by store and street by street.
At the forefront of this is our 6,000 strong sales force, which now visits 12 outlets a day on average. In 2017, our focus has been on empowering our sales force to create more value from each visit, through new technology and merchandising. We placed an additional 138,000 coolers into more outlets and increased our coverage of important channels outside grocery, including hotels, restaurants, cafes, institutions and offices.
|
|
P a g e |
9
|
This will continue in 2018, as will efforts to improve our route to market, by working more closely with wholesalers and other partners to better support the growth of all our customers. We are also working with new digital platforms, such as online ordering and customer portals, to improve service and availability.
Delivering sustainable growth
I am confident that the people who work for CCEP and the entrepreneurial culture that is emerging will accelerate our performance. We have invested in developing the capabilities and behaviours that are fundamental to our future success. Our focus is on instilling agile ways of working, creating an environment where people are empowered to win together, and inspiring a passion for growth.
Our stakeholders also have big expectations of how we do business and we are holding ourselves accountable for the impact we have on society. Together with The Coca-Cola Company in Western Europe, our new sustainability action plan advances the progress we are making to reduce sugar in our drinks, recover and recycle our packaging, and be a force for good in our communities.
Our performance in 2017 demonstrates that we are making the right strategic choices. We delivered against all key metrics set out in our financial framework to generate profitable growth and create value for shareholders. This is made possible by our close alignment with The Coca-Cola Company and the support from our experienced leadership team and Board of Directors.
With a solid strategy for long-term growth and a great team, our focus for 2018 is to maintain this momentum, continuing to give customers and consumers the great service and great beverages they want.
Thank you for investing in CCEP. I look forward to continuing our journey with you in 2018.
Damian Gammell
Chief Executive Officer
“Our success is built on three fundamental elements: our portfolio of great brands, the great service and execution we provide to our customers, and our great people who make this happen.”

|
|
P a g e |
10
|
STRATEGY
We are making clear choices to increase our focus on the customer and expand our portfolio to become a total beverage company. This is central to our journey to becoming a great company and the world’s best bottler and key to our ultimate objective: long-term and sustainable growth.
Great beverages
We are committed to delivering sustainable revenue growth from our Coca-Cola trademark drinks, through new flavours, mini cans and premium glass bottles. In 2017 we relaunched Fanta with a new logo, a new recipe and new flavours and we will do the same for Sprite in 2018. We will also continue to expand our portfolio into new categories, launching products - like Fuze and AdeZ - with scale and impact.
Great service
We work closely with existing customers, creating long-term plans for shared value creation. At the same time, we will continue to grow the number of customers and outlets we reach so our great products are always within reach of consumers. That also means improving our route to market by working with wholesalers and developing new ways of bringing our products to the consumer.
Great people
Central to achieving our ambitions is the creation of a culture and environment that empowers everyone in our business to be successful. We will harness efficiencies and share best practice across Coca-Cola European Partners but we are locally led and will always cater for the specific demands of our markets.
We will move quickly and focus on progress over perfection. We will encourage diverse ideas and support people in every part of the business to make decisions. We will listen to what customers, consumers, colleagues and communities tell us so we can take the right actions.
Action on sustainability
This is Forward is our sustainability action plan and a critical part of our long-term business strategy. It has been developed jointly with The Coca-Cola Company in Western Europe. It sets out how we will grow our business in a responsible and sustainable way and how we intend to play a meaningful role in helping to address many of the key societal issues that people are most concerned about. We have made bold leadership commitments on drinks, packaging and society and supporting commitments on water, supply chain and climate.
|
|
P a g e |
11
|
PERFORMANCE INDICATORS
Tracking our performance in 2017
|
Revenue*
|
||||
|
€11.1 billion
|
||||
|
Operating profit*
|
Free cash flow*
|
Diluted earnings per share*
|
||
|
€1.5 billion
on a comparable basis
|
€1.0 billion
|
€2.12
on a comparable basis
|
||
|
Lost time incident rate
|
Water use ratio
|
Energy use ratio
|
||
|
1.23
Calculations based upon number of lost time incidents in 2017 per 100 full time equivalent employees.
|
1.61
litres of water used/litre of product produced
Calculations based upon total water usage of our manufacturing sites, based upon site invoice data, divided by the total number of litres produced in 2017.
|
0.32
MJ/litre of product produced
Calculations based upon total energy usage of our manufacturing sites, based upon monthly site invoice and meter data, divided by the total number of litres of product produced in 2017.
|
||
*Refer to page 21 for a reconciliation of GAAP to non-GAAP figures
|
|
P a g e |
12
|
BUSINESS MODEL
We create long-term and sustainable value by making, distributing and selling the world’s most loved drinks and delivering excellent service to our customers. Our success is made possible by our culture and the passion and commitment of our employees.

|
|
P a g e |
13
|
We source raw materials...
We use raw materials such as water, sugar beet, coffee, juices and syrup to make our drinks.
We also rely on packaging materials like PET, pulp and paper to make our packaging.
We require all our suppliers to meet our strict targets around
workplace policies and practices, health and safety, ethics and human rights, environmental protection and business integrity.
As part of our sustainability action plan we’ll make sure 100% of our main agricultural ingredients and raw materials come from sustainable sources by 2020.
...to make the great tasting drinks consumers want
Our manufacturing sites make and bottle our wide range of drinks. We are constantly improving our manufacturing facilities and investing in new technologies to make them more efficient and safer for our employees. 93% of the drinks we sell are produced and marketed in the country in which they are consumed.
We make sure our drinks get to customers when they need them
Working with logistics partners and our own logistics and distribution teams to get our products to customers in the most efficient and sustainable way possible.
We work closely with our customers who sell our drinks to consumers
We work with a huge range of customers – from small local shops to sports stadiums and your favourite bar – so consumers can enjoy one of our great products wherever they are and whenever they want. We also provide coolers and vending machines so people can find our drinks on the go. We work closely with large retail chains, like supermarkets and wholesalers.
We work with local and national partners to collect our packaging
Although all of our bottles and cans are 100% recyclable – they don’t always end up being recycled.
We are determined to do more and lead the way towards a circular economy where 100% of our packaging can be collected, reused or recycled, and where none of it ends up as litter or in the oceans.
The resources and relationships we rely on
Our customers
We strive to be our customers’ preferred partner and create value together through our response to changing consumer and shopper preferences and retail trends. We are uniquely close to our customers, with thousands of our employees calling on our customers every day. Our operating model is customer-centric and focused on the front line, and we aim to deliver the strongest execution and reach a broad range of outlets in the marketplace, all the while making it easier to do business with us.
Our employees
Our success depends on our people – growth for our business goes hand in hand with growth for our employees. We respect each other and support a workplace where people with different perspectives belong, are heard and have equal opportunity. We build the engagement and development of our employees into our business plans, enabling a diverse and local workforce that contributes to the communities where we operate. We also make long-term investments in technology and facilities that equip our people for success.
Our franchisors
We conduct our business primarily under agreements with The Coca-Cola Company and a limited number of other franchisors. These agreements generally give us the exclusive right to sell, distribute and, in most cases, make beverages in approved packaging in specified territories. We have shared long-term growth plans that enable us to create value together.
Our suppliers
Our suppliers are critical partners for our business. We believe collaboration and innovation throughout our supply chain are essential in advancing our sustainable growth. We work with a network of about 19,000 suppliers across our markets, covering commodities and services such as ingredients, packaging, energy, equipment, building and facilities, fleet and logistics services, sales and marketing services, IT and telecoms, general administration and professional services.
Our communities
We recognise the economic, social and environmental impact our business has on our communities, and we seek to make a positive contribution to society building on our strong local heritage and presence. Continued success is critical for the people who work for us and the communities in which we operate. We work with them to find solutions and create opportunities for the future.
|
|
P a g e |
14
|
BUSINESS AND FINANCIAL REVIEW
Our business
Coca-Cola European Partners plc (CCEP) is the largest independent Coca-Cola bottler by revenue, operating in 13 countries and employing around 23,500 people. We are proud of our strong heritage in Western Europe, and as CCEP, we are establishing a compelling track record and platform for profitable growth through our combined experience, scale and reach.
CCEP was created on 28 May 2016 through the Merger of Coca-Cola Enterprises, Inc., (CCE), Coca-Cola Erfrischungsgetränke A.G. (CCEG) and Coca-Cola Iberian Partners, S.L.U. (CCIP). CCEP is a publicly traded UK domiciled company listed on Euronext Amsterdam, New York Stock Exchange, Euronext London and the continuous market of the Spanish Stock exchange (ticker symbol: CCE).
Over 300 million people can enjoy our drinks in Western Europe, and working together with The Coca-Cola Company, we are leading the way in our markets, offering consumers a greater choice of drinks with reduced or no sugar, holding ourselves accountable for our packaging and expanding the contribution we make to society. We are taking action on sustainability by using our business to build a better future, for people and for the planet. We work closely with customers to understand their needs and priorities and develop tailored strategies to deliver shared value.
In our first 18 months, we have become a leading consumer goods company capable of delivering long-term growth, and we are on a journey to be the world’s most sustainable and valuable Coca-Cola bottler creating increased shareholder value.
Note regarding the presentation of non-GAAP financial information
We use certain alternative performance measures (non-GAAP performance measures) to make financial, operating and planning decisions and to evaluate and report performance. We believe these measures provide useful information to investors, and as such, where clearly identified, we have included certain alternative performance measures in this document to allow investors to better analyse our business performance and allow for greater comparability. To do so, where indicated, we have given effect to the Merger as if it had occurred at the beginning of 2016, thereby including the financial results of CCE, CCEG (Germany) and CCIP (Iberia) along with other adjustments as described below. We have also excluded items affecting the comparability of period-over-period financial performance as described in the tables below.
The alternative performance measures included herein should be read in conjunction with and do not replace the directly reconcilable GAAP measure.
Additionally, we provide certain forward-looking non-GAAP financial Information, which management uses for planning and measuring performance. We are not able to reconcile forward looking non-GAAP measures to reported measures without unreasonable efforts because it is not possible to predict with a reasonable degree of certainty the actual impact or exact timing of items that may impact comparability throughout 2018.
For purposes of this document, the following terms are defined:
‘
As reported
’ includes the financial results of CCE only, as the accounting predecessor, for all periods prior to 27 May 2016 and combined CCEP (CCE, Germany and Iberia) for the period from 28 May 2016 for all periods presented after that date.
‘
Comparable
’ represents results excluding items impacting comparability during the periods presented. Items impacting comparability include restructuring charges, merger and integration related costs, out of period mark-to-market impact of hedges, litigation provisions and net tax items relating to rate and law changes. Such items are excluded from our comparable results in order to provide a better understanding of business performance and allow for greater comparability. Additionally, for periods prior to 27 May 2016, comparable includes the results of CCE, Germany and Iberia as if the Merger had occurred at the beginning of 2016 along with acquisition accounting and the additional debt financing costs incurred by CCEP in connection with the Merger. Comparable volume is also adjusted for selling days.
‘
Fx-neutral
’ represents the comparable results excluding the impact of foreign exchange rate changes during the periods presented. Foreign exchange impact is calculated by recasting current year results at prior year exchange rates.
‘
Free cash flow
’ is defined as net cash flows from operations, less capital expenditures and interest paid, plus proceeds from capital disposals. Management utilises free cash flow as a measure of the Group’s cash generation from operating activities, taking into account investments in property, plant and equipment and non-discretionary interest payments.
|
|
P a g e |
15
|
‘
Adjusted EBITDA
’ is defined as profit after tax plus taxes, net finance costs, non-operating items, depreciation, amortisation and adjusted for items impacting comparability. Management utilises Adjusted EBITDA and the ratio of net debt to Adjusted EBITDA to evaluate operating performance in the context of the Group’s targeted financial leverage.
|
Key financial measures
(A)
Unaudited, fx impact calculated by recasting current year results at prior year rates
|
Year Ended 31 December 2017
|
|||||||||||||||||
|
€ million
|
% change vs. prior year
|
|||||||||||||||||
|
As Reported
|
Comparable
|
Fx-Impact
|
|
As Reported
|
|
Comparable
|
|
Fx-Impact
|
|
Comparable fx‑neutral
|
|
|||||||
|
Revenue
|
11,062
|
11,055
|
(142
|
)
|
21.0
|
%
|
1.5
|
%
|
(1.5
|
)%
|
3.0
|
%
|
||||||
|
Cost of sales
|
6,772
|
6,739
|
(85
|
)
|
21.5
|
%
|
2.0
|
%
|
(1.5
|
)%
|
3.5
|
%
|
||||||
|
Operating expenses
|
3,030
|
2,838
|
(31
|
)
|
12.5
|
%
|
(2.5
|
)%
|
(1.0
|
)%
|
(1.5
|
)%
|
||||||
|
Operating profit
|
1,260
|
1,478
|
(26
|
)
|
48.0
|
%
|
9.0
|
%
|
(1.5
|
)%
|
10.5
|
%
|
||||||
|
Profit after taxes
|
688
|
1,035
|
(19
|
)
|
25.5
|
%
|
13.0
|
%
|
(2.0
|
)%
|
15.0
|
%
|
||||||
|
Diluted earnings per share (€)
|
1.41
|
2.12
|
(0.04
|
)
|
(0.5
|
)%
|
13.0
|
%
|
(2.0
|
)%
|
15.0
|
%
|
||||||
(A)
See page 21 for reconciliation of As Reported to Comparable financial information
Financial highlights
|
•
|
Full-year diluted earnings per share were €1.41 on a reported basis or €2.12 on a comparable basis, including a negative currency translation impact of €0.04.
|
|
•
|
Full-year reported revenue totalled €11.1 billion, up 21.0%, or up 3.0% on a comparable and fx-neutral basis. Volume was up 0.5% on a comparable basis.
|
|
•
|
Full-year reported operating profit totalled €1.3 billion, or €1.5 billion on a comparable basis, up 9.0%, or up 10.5% on a comparable and fx-neutral basis.
|
|
•
|
Net cash flows from operating activities were €1.6 billion. Full-year free cash flow was €1.0 billion.
*
|
|
•
|
We remain on track to achieve pre-tax savings of €315 million to €340 million through synergies by mid-2019.
|
*
Refer to page 19 for a reconciliation between net cash flows from operating activities and free cash flow.
Operational review
In our first full year as Coca-Cola European Partners, we have started to realise the growth opportunities created by the Merger and, importantly, exceeded our initial guidance for revenue, operating profit, diluted earnings per share, and free cash flow. Our strong performance in 2017 enabled us to accelerate investment behind our brand portfolio, our field sales teams, our route-to-market and our digital capabilities. We are confident of making further progress, underpinned by a number of exciting growth opportunities ahead of us and continued investments in our business.
Key operating factors for the year included solid revenue growth driven by revenue per case growth coupled with 0.5% volume growth. Operating margins improved as we maintained gross margin and as we continue to realise post-Merger synergy benefits. We benefited from growth in our sugar-free portfolio, a strong innovation pipeline and a focus on driving joint value for our customers across all channels.
Full-year 2017 diluted earnings per share were €1.41 on a reported basis, or €2.12 on a comparable basis. Currency translation had a negative impact of €0.04 on comparable diluted earnings per share for the year ended 31 December 2017. Full-year reported operating profit totalled €1.3 billion, up 48.0%, driven by the inclusion of Germany, Iberia and Iceland. Comparable operating profit was €1.5 billion, up 9.0%, or up 10.5% on a comparable and fx-neutral basis.
Revenue
Full-year 2017 reported revenue totalled €11.1 billion, up 21.0%, or up 3.0% on a comparable and fx-neutral basis. Revenue per unit case grew 2.5% on a comparable and fx-neutral basis and volume increased 0.5% on a comparable basis.
|
|
P a g e |
16
|
|
Revenue
In millions of €, except per case data which is calculated prior to rounding
|
Year ended
|
||||||||
|
31 December 2017
|
|
31 December 2016
|
|
% Change
|
|
||||
|
As reported
|
11,062
|
|
9,133
|
|
21.0
|
%
|
|||
|
Adjust: Total items impacting comparability
(A)
|
(7
|
)
|
1,732
|
|
(100.5
|
)%
|
|||
|
Comparable
|
11,055
|
|
10,865
|
|
1.5
|
%
|
|||
|
Adjust: Impact of fx changes
|
142
|
|
n/a
|
|
(1.5
|
)%
|
|||
|
Comparable & fx-neutral
|
11,197
|
|
10,865
|
|
3.0
|
%
|
|||
|
Revenue per unit case
|
4.46
|
|
4.35
|
|
2.5
|
%
|
|||
|
(A)
|
Amounts include items impacting comparability during the periods presented. Additionally, for periods prior to 27 May 2016, amounts include the results of Germany and Iberia as if the Merger had occurred at the beginning of the presented period.
|
On a territory basis for full-year 2017, Iberia revenues were up 3.0%, and revenue in Germany was up 2.5%. Revenue in Great Britain grew 4.5% on an fx-neutral basis, and on a reported basis, revenue declined 2.5%, driven by a decline of the British pound versus the euro. Revenue in France was up 0.5% for the year, and revenue in the Northern European territories (Belgium, Luxembourg, the Netherlands, Norway, Sweden and Iceland) was up 4.5%, led by Belgium/Luxembourg and the Netherlands.
|
Year ended
|
||||||||||
|
Revenue by geography
Comparable
|
31 December 2017
% of Total
|
|
31 December 2016
% of Total
|
|
Revenue % Change
|
|
||||
|
Spain/Portugal/Andorra
(A)
|
24.5
|
%
|
24.0
|
%
|
3.0
|
%
|
||||
|
Germany
|
20.0
|
%
|
20.0
|
%
|
2.5
|
%
|
||||
|
Great Britain
|
18.5
|
%
|
19.0
|
%
|
(2.5
|
)%
|
||||
|
France/Monaco
|
16.5
|
%
|
16.5
|
%
|
0.5
|
%
|
||||
|
Belgium/Luxembourg/Netherlands
|
13.0
|
%
|
13.0
|
%
|
2.0
|
%
|
||||
|
Norway
|
3.5
|
%
|
4.0
|
%
|
1.5
|
%
|
||||
|
Sweden
|
3.0
|
%
|
3.0
|
%
|
1.0
|
%
|
||||
|
Iceland
(B)
|
1.0
|
%
|
0.5
|
%
|
150.5
|
%
|
||||
|
Total
|
100.0
|
%
|
100.0
|
%
|
1.5
|
%
|
||||
|
(A)
|
Spain/Portugal/Andorra is also referred to as Iberia.
|
|
(B)
|
Iceland was acquired in July 2016.
|
|
Comparable volume - selling day shift
In millions of unit cases, prior period volume recast using current year selling days
(A)
|
Year ended
|
||||||||
|
31 December 2017
|
|
31 December 2016
|
|
% Change
|
|
||||
|
Volume
|
2,510
|
|
2,502
|
|
0.5%
|
|
|||
|
Impact of selling day shift
|
n/a
|
|
(7
|
)
|
n/a
|
|
|||
|
Pro forma comparable volume
|
2,510
|
|
2,495
|
|
0.5
|
%
|
|||
|
(A)
|
A unit case equals approximately 5.678 litres or 24 8-ounce servings, a typical volume measure used in our industry.
|
On a brand basis for full-year 2017, volume for sparkling brands was up 0.5%. Coca-Cola trademark brands decreased 0.5%, with growth of approximately 15.0% in Coca-Cola Zero Sugar offset by declines in other trademark brands. Sparkling flavours and energy grew 4.0% with continued strong growth in energy and solid growth in Fanta, Vio and Royal Bliss. Still brands increased 1.0%,with increases in juice, isotonics and other of 2.5% being offset by water brands being down 1.5%.
|
Year ended
|
||||||||||
|
Comparable volume by brand category
Adjusted for selling day shift
|
31 December 2017
% of Total
|
|
31 December 2016
% of Total
|
|
% Change
|
|
||||
|
Sparkling
|
85.0
|
%
|
85.5
|
%
|
0.5
|
%
|
||||
|
Coca-Cola trademark
|
63.5
|
%
|
64.5
|
%
|
(0.5
|
)%
|
||||
|
Sparkling flavours and energy
|
21.5
|
%
|
21.0
|
%
|
4.0
|
%
|
||||
|
Stills
|
15.0
|
%
|
14.5
|
%
|
1.0
|
%
|
||||
|
Juice, isotonics and other
|
8.0
|
%
|
7.5
|
%
|
2.5
|
%
|
||||
|
Water
|
7.0
|
%
|
7.0
|
%
|
(1.5
|
)%
|
||||
|
Total
|
100.0
|
%
|
100.0
|
%
|
0.5
|
%
|
||||
|
|
P a g e |
17
|
Cost of sales
Full-year 2017 reported cost of sales were €6.8 billion, up 21.5%, driven by the inclusion of Germany, Iberia and Iceland. Comparable cost of sales was €6.7 billion, up 2.0%, or up 3.5% on a comparable and fx-neutral basis. Full-year cost of sales per unit case increased 3.0% on a comparable and fx-neutral basis, driven by channel, brand and package mix, and manufacturing costs, as well as year-over-year cost increases in key inputs, principally concentrate and sweetener. This was partially offset by benefits from our synergy programmes.
|
Cost of sales
In millions of €, except per case data which is calculated prior to rounding
|
Year ended
|
||||||||
|
31 December 2017
|
|
31 December 2016
|
|
% Change
|
|
||||
|
As reported
|
6,772
|
|
5,584
|
|
21.5
|
%
|
|||
|
Adjust: Total items impacting comparability
(A)
|
(33
|
)
|
1,011
|
|
(103.5
|
)%
|
|||
|
Comparable
|
6,739
|
|
6,595
|
|
2.0
|
%
|
|||
|
Adjust: Impact of fx changes
|
85
|
|
n/a
|
|
(1.5
|
)%
|
|||
|
Comparable & fx-neutral
|
6,824
|
|
6,595
|
|
3.5
|
%
|
|||
|
Cost of sales per unit case
|
2.72
|
|
2.64
|
|
3.0
|
%
|
|||
|
(A)
|
Amounts include items impacting comparability during the periods presented. Additionally, for periods prior to 27 May 2016, amounts include the results of Germany and Iberia as if the Merger had occurred at the beginning of the presented period.
|
Operating expenses
Full-year 2017 reported operating expenses were €3.0 billion, up 12.5%, driven by the inclusion of Germany, Iberia and Iceland. Comparable operating expenses were €2.8 billion, down 2.5%, or down 1.5% on a comparable and fx-neutral basis, primarily driven by synergy benefits and a continued focus on managing expenses.
|
Operating expenses
In millions of € except % change
|
Year ended
|
||||||||
|
31 December 2017
|
|
31 December 2016
|
|
% Change
|
|
||||
|
As reported
|
3,030
|
|
2,698
|
|
12.5
|
%
|
|||
|
Adjust: Total items impacting comparability
(A)
|
(192
|
)
|
213
|
|
(190.0
|
)%
|
|||
|
Comparable
|
2,838
|
|
2,911
|
|
(2.5
|
)%
|
|||
|
Adjust: Impact of fx changes
|
31
|
|
n/a
|
|
(1.0
|
)%
|
|||
|
Comparable & fx-neutral
|
2,869
|
|
2,911
|
|
(1.5
|
)%
|
|||
|
(A)
|
Amounts include items impacting comparability during the periods presented. Additionally, for periods prior to 27 May 2016, amounts include the results of Germany and Iberia as if the Merger had occurred at the beginning of the presented period.
|
Restructuring and synergy programme
During the full-year 2017, we recognised restructuring charges totalling €235 million. These charges principally related to proposed restructuring activities under our Integration and Synergy Programme including those related to supply chain improvements such as network optimisation, productivity initiatives, continued facility rationalisation in Germany, end to end supply chain organisational design, and cold drink operational practices and facilities. Our proposed restructuring activities also include the transfer of Germany and Iberia transactional related activities to our shared services centre in Sofia, Bulgaria, streamlining of our HR organisation, and other central function initiatives. Since the Merger we have recognised restructuring charges totalling €495 million.
We remain on track to achieve pre-tax run rate savings of €315 million to €340 million through synergies by mid-2019. Since the Merger, we have achieved €155 million in synergies and expect to have realised approximately 75% of our total target by year-end 2018. Restructuring cash costs to achieve these synergies are expected to be approximately 2 1/4 times expected savings and includes cash costs associated with pre-transaction close accruals.
US tax reform
The US Tax Cuts and Jobs Act (the US Tax Act) was enacted on 22 December 2017 and represents a significant change to the US tax code. While CCEP is a UK listed and tax resident entity, it has a number of subsidiaries outside the UK, including a US incorporated holding company that is wholly owned by Coca-Cola European Partners plc. Based on the applicable provisions of the US Tax Act, during the fourth quarter of 2017, we recorded a non-recurring book tax expense of €320 million, which included an estimated book tax expense of approximately €125 million related to the transition from a worldwide to territorial tax system and a reduction in deferred tax assets of approximately €195 million primarily due to the elimination of foreign tax credits. We do not currently expect an increase in cash taxes as a result of any provision of the US Tax Act and while we continue to assess the situation, at this stage, we do not anticipate any impact on our effective tax rate going forward.
|
|
P a g e |
18
|
Financial position
|
In millions of €
|
As at
|
|||||
|
31 December 2017
|
|
31 December 2016
|
|
|||
|
Assets
|
||||||
|
Non-current assets
|
14,880
|
|
15,143
|
|
||
|
Current assets
|
3,314
|
|
3,425
|
|
||
|
Total assets
|
18,194
|
|
18,568
|
|
||
|
Liabilities
|
||||||
|
Non-current liabilities
|
8,222
|
|
8,355
|
|
||
|
Current liabilities
|
3,287
|
|
3,752
|
|
||
|
Total liabilities
|
11,509
|
|
12,107
|
|
||
|
Total equity
|
6,685
|
|
6,461
|
|
||
|
Total equity and liabilities
|
18,194
|
|
18,568
|
|
||
Total non-current assets decreased €263 million, or 1.5%, from €15.1 billion at 31 December 2016 to €14.9 billion at 31 December 2017. This change was partially driven by a decrease in deferred tax assets of €218 million mainly related to US tax law changes enacted prior to year-end. Property, plant and equipment reduced by €156 million which was offset by increases in intangible assets and goodwill of €40 million and €93 million, respectively, relating primarily to the finalisation of acquisition accounting for Germany and Iberia and currency effects during the period.
Total current assets decreased €111 million, or 3.0%, from €3.4 billion at 31 December 2016 to €3.3 billion at 31 December 2017. This change was primarily driven by a decrease of €23 million in inventories and €128 million in trade accounts receivable resulting from working capital initiatives.
Total non-current liabilities decreased by €133 million, or 1.5%, from €8.4 billion at 31 December 2016 to €8.2 billion at 31 December 2017. This change was mainly driven by a reduction of €116 million in employee benefit liabilities primarily due to the actual return on underlying assets exceeding actuarial estimates, a reduction in non-current borrowings of €88 million reflecting early repayments on a term loan of €300 million, foreign exchange movements on our US denominated debt and issuance of €350 million floating-rate notes, offset by an increase in our derivative liabilities of €92 million, relating to US denominated debt.
Total current liabilities decreased €465 million, or 12.5%, from €3.8 billion at 31 December 2016 to €3.3 billion at 31 December 2017. This change was primarily driven by the repayment of €300 million Eurobond notes in November 2017 and €500 million floating rate notes in December 2017, offset by commercial paper issuances of €250 million. This reduction was offset by an increase in trade and other payables of €115 million, primarily due to working capital initiatives.
Liquidity and capital management
Liquidity
Liquidity risk is actively managed to ensure we have sufficient funds to satisfy our commitments as they fall due. Our sources of capital include, but are not limited to, cash flows from operations, public and private issuances of debt securities and bank borrowings. We believe our operating cash flow, cash on hand and available short-term and long-term capital resources are sufficient to fund our working capital requirements, scheduled borrowing payments, interest payments, capital expenditures, benefit plan contributions, income tax obligations and dividends to shareholders. Counterparties and instruments used to hold cash and cash equivalents are continuously assessed, with a focus on preservation of capital and liquidity.
We have amounts available for borrowing under a €1.5 billion multi-currency credit facility with a syndicate of 10 banks. This credit facility matures in 2021 and is for general corporate purposes and supporting our working capital needs. Based on information that is currently available, there is no indication that the financial institutions participating in this facility would be unable to fulfil their commitments to CCEP as at the date of this report. Our current credit facility contains no financial covenants that would impact our liquidity or access to capital. As at 31 December 2017, we had no amounts drawn under this credit facility.
Free cash flow generation was strong during 2017, with €1.0 billion generated in the year. This reflects our dedicated efforts to improve working capital where we have improved our total cash conversion cycle by over 10 days and have achieved over €250 million of working capital benefits throughout 2017. We also maintained our prudent capex approach and continued to challenge ourselves when managing restructuring costs.
|
|
P a g e |
19
|
|
Free cash flow
(A)
In millions of €
|
Year Ended
|
||
|
31 December 2017
|
|
||
|
Net cash flows from operating activities
|
1,623
|
|
|
|
Less: Purchases of property, plant and equipment
|
(484
|
)
|
|
|
Less: Purchases of capitalised software
|
(36
|
)
|
|
|
Less: Interest paid
|
(94
|
)
|
|
|
Add: Disposals of property, plant and equipment
|
32
|
|
|
|
Free cash flow
|
1,041
|
|
|
|
(A)
|
Free cash flow is defined as net cash flows from operations, less capital expenditures and interest paid, plus proceeds from capital disposals.
|
Capital management
The primary objective of our capital management strategy is to ensure strong credit ratings and to maintain appropriate capital ratios in order to support our business and maximise shareholder value. Our credit ratings are periodically reviewed by rating agencies. Currently, our long-term ratings from Moody’s and Standard & Poor’s (S&P) are A3 and BBB+ respectively. The ratings outlook from Moody’s and S&P are stable. Changes in the operating results, cash flows or financial position could impact the ratings assigned by the various rating agencies. We regularly assess debt and equity capital levels against our stated policy for capital structure. Our capital structure is managed and, as appropriate, adjusted in light of changes in economic conditions and our financial policy.
|
Net debt
In millions of €
|
As at
|
Credit Ratings
|
|||||
|
31 December 2017
|
|
As of 14 March 2018
|
Moody’s
|
Standard & Poor’s
|
|||
|
Total borrowings
|
5,748
|
|
Long-term rating
|
A3
|
BBB+
|
||
|
Add: Fx impact of non-EUR borrowings
|
66
|
|
Outlook
|
Stable
|
Stable
|
||
|
Adjusted total borrowings
|
5,814
|
|
Note: Our credit ratings can be materially influenced by a number of factors including, but not limited to, acquisitions, investment decisions and working capital management activities of TCCC and/or changes in the credit rating of TCCC.
|
||||
|
Less: Cash and cash equivalents
|
(360
|
)
|
|||||
|
Net debt
|
5,454
|
|
|||||
The ratio of net debt to Adjusted EBITDA is used by investors, analysts and credit rating agencies to analyse our operating performance in the context of targeted financial leverage, and as such, we provide a reconciliation of this measure. Net debt enables investors to see the economic effect of total borrowings, related foreign exchange impact and cash and cash equivalents in total and is calculated as being the net of cash and cash equivalents and currency adjusted borrowings. Adjusted EBITDA is calculated as EBITDA, before adding back items impacting the comparability of year-over-year financial performance.
Adjusted EBITDA does not reflect our cash expenditures, or future requirements for capital expenditures or contractual commitments. Further, Adjusted EBITDA does not reflect changes in, or cash requirements for, our working capital needs, and although depreciation and amortisation are non-cash charges, the assets being depreciated and amortised are likely to be replaced in the future and Adjusted EBITDA does not reflect cash requirements for such replacements.
|
|
P a g e |
20
|
|
Adjusted EBITDA
In millions of €
|
Year Ended
|
||
|
31 December 2017
|
|
||
|
Reported profit after tax
|
688
|
|
|
|
Taxes
|
471
|
|
|
|
Finance costs, net
|
100
|
|
|
|
Non-operating items
|
1
|
|
|
|
Reported operating profit
|
1,260
|
|
|
|
Depreciation and amortisation
|
490
|
|
|
|
Reported EBITDA
|
1,750
|
|
|
|
Items impacting comparability:
|
|||
|
Merger effects
(A)
|
(20
|
)
|
|
|
Mark-to-market effects
(B)
|
(6
|
)
|
|
|
Restructuring Charges
(C)
|
218
|
|
|
|
Merger and Integration Related Costs
(D)
|
4
|
|
|
|
Litigation provision
(E)
|
5
|
|
|
|
Adjusted EBITDA
|
1,951
|
|
|
|
Net debt to EBITDA
|
3.1
|
||
|
Net debt to Adjusted EBITDA
|
2.8
|
||
|
(A)
|
Adjustments to reflect Germany and Iberia financial results as if the Merger had occurred at the beginning of each period (if applicable), the impact of acquisition accounting including final fair values of the acquired inventory, property, plant, and equipment and intangibles from Germany and Iberia, final acquisition accounting related adjustments and associated impact on depreciation and amortisation expense, and additional debt financing cost incurred by CCEP in connection with the Merger.
|
|
(B)
|
Amounts represent the net out-of-period mark-to-market impact of non-designated commodity hedges.
|
|
(C)
|
Amounts represent restructuring charges related to business transformation activities, excluding accelerated depreciation included in the depreciation and amortisation line.
|
|
(D)
|
Amounts represent costs associated with the Merger to form CCEP.
|
|
(E)
|
Amount represents a provision recorded for ongoing litigation.
|
Dividends
In March 2017, the Board increased our quarterly dividend by more than 20% to €0.21 per share. For the full year 2017, our dividend per share represented approximately 40% of our comparable diluted earnings per share. In February 2018, the Board declared a further increase in the quarterly dividend to €0.26 per share, equivalent to an annualised dividend of €1.04 per share. This is in line with our commitment to deliver long-term value to shareholders.
Looking forward
For 2018, we expect revenue growth in a low single-digit range, with both operating profit and earnings per share growth of between 6% and 7%. Each of these growth figures is on a comparable and fx-neutral basis when compared to 2017 comparable results. This revenue growth guidance excludes the accounting impact of incremental soft drinks industry taxes. These taxes are expected to add approximately 2% to 3% to revenue growth and approximately 4% to cost of goods growth. At recent rates, currency translation would have a negligible impact on 2018 full-year diluted earnings per share.
We expect 2018 free cash flow* in the range of €850 million to €900 million, including the expected benefit from improved working capital offset by the impact of restructuring and integration costs. Capital expenditures are expected to be approximately €525 million to €575 million, including approximately €75 million of capital expenditures related to synergies. Weighted-average cost of debt is expected to be approximately 2%. The comparable effective tax rate for 2018 is expected to be approximately 25%.
We remain on track to achieve pre-tax run-rate savings of €315 million to €340 million through synergies by mid-2019. Further, we expect to have realised approximately 75% of the target by year-end 2018. Restructuring cash costs to achieve these synergies are expected to be approximately 2 1/4 times expected savings and includes cash costs associated with pre-transaction close accruals. Given these factors, currency exchange rates, and our outlook for 2018, we expect year-end net debt to Adjusted EBITDA* for 2018 to be towards the low-end of our target range of 2.5 to 3 times. As a result, during 2018, we expect to continue to evaluate returning incremental cash to shareholders.
*Refer to note regarding the presentation of non-GAAP financial information.
|
|
P a g e |
21
|
Supplementary financial information – income statement full year
The following provides a summary reconciliation of CCEP’s reported and comparable results for the full year ended 31 December 2017 and 31 December 2016:
|
Full-year 2017
Unaudited, in millions of € except per share data which is calculated prior to rounding
|
As Reported
|
|
Items Impacting Comparability
|
Comparable
|
|
|||||||||||||
|
Merger effects
(A)
|
Mark-to-market effects
(B)
|
Restructuring charges
(C)
|
Merger and integration related costs
(D)
|
Litigation provision
(E)
|
Net tax items
(F)
|
CCEP
|
|
|||||||||||
|
Revenue
|
11,062
|
|
(7
|
)
|
—
|
|
—
|
|
—
|
|
—
|
|
—
|
|
11,055
|
|
||
|
Cost of sales
|
6,772
|
|
27
|
|
6
|
|
(66
|
)
|
—
|
|
—
|
|
—
|
|
6,739
|
|
||
|
Gross profit
|
4,290
|
|
(34
|
)
|
(6
|
)
|
66
|
|
—
|
|
—
|
|
—
|
|
4,316
|
|
||
|
Operating expenses
|
3,030
|
|
(14
|
)
|
—
|
|
(169
|
)
|
(4
|
)
|
(5
|
)
|
—
|
|
2,838
|
|
||
|
Operating profit
|
1,260
|
|
(20
|
)
|
(6
|
)
|
235
|
|
4
|
|
5
|
|
—
|
|
1,478
|
|
||
|
Total finance costs, net
|
100
|
|
—
|
|
—
|
|
—
|
|
—
|
|
(1
|
)
|
—
|
|
99
|
|
||
|
Non-operating items
|
1
|
|
—
|
|
—
|
|
—
|
|
—
|
|
—
|
|
—
|
|
1
|
|
||
|
Profit before taxes
|
1,159
|
|
(20
|
)
|
(6
|
)
|
235
|
|
4
|
|
6
|
|
—
|
|
1,378
|
|
||
|
Taxes
|
471
|
|
(4
|
)
|
(2
|
)
|
70
|
|
1
|
|
1
|
|
(194
|
)
|
343
|
|
||
|
Profit after taxes
|
688
|
|
(16
|
)
|
(4
|
)
|
165
|
|
3
|
|
5
|
|
194
|
|
1,035
|
|
||
|
Diluted earnings per share (€)
|
1.41
|
|
2.12
|
|
||||||||||||||
|
Diluted shares outstanding
|
489
|
|
||||||||||||||||
|
Full-year 2016
Unaudited, in millions € except per share data which is calculated prior to rounding
|
As Reported
|
|
Items Impacting Comparability
|
Comparable
|
|
|||||||||||
|
Merger effects
(A)
|
Mark-to-market effects
(B)
|
Restructuring charges
(C)
|
Merger and integration related costs
(D)
|
Net tax items
(F)
|
CCEP
|
|
||||||||||
|
Revenue
|
9,133
|
|
1,732
|
|
—
|
|
—
|
|
—
|
|
—
|
|
10,865
|
|
||
|
Cost of sales
|
5,584
|
|
1,006
|
|
18
|
|
(13
|
)
|
—
|
|
—
|
|
6,595
|
|
||
|
Gross profit
|
3,549
|
|
726
|
|
(18
|
)
|
13
|
|
—
|
|
—
|
|
4,270
|
|
||
|
Operating expenses
|
2,698
|
|
911
|
|
17
|
|
(547
|
)
|
(168
|
)
|
—
|
|
2,911
|
|
||
|
Operating profit
|
851
|
|
(185
|
)
|
(35
|
)
|
560
|
|
168
|
|
—
|
|
1,359
|
|
||
|
Total finance costs, net
|
123
|
|
12
|
|
—
|
|
—
|
|
(5
|
)
|
—
|
|
130
|
|
||
|
Non-operating items
|
9
|
|
(1
|
)
|
—
|
|
—
|
|
—
|
|
—
|
|
8
|
|
||
|
Profit before taxes
|
719
|
|
(196
|
)
|
(35
|
)
|
560
|
|
173
|
|
—
|
|
1,221
|
|
||
|
Taxes
|
170
|
|
(29
|
)
|
(9
|
)
|
156
|
|
39
|
|
(23
|
)
|
304
|
|
||
|
Profit after taxes
|
549
|
|
(167
|
)
|
(26
|
)
|
404
|
|
134
|
|
23
|
|
917
|
|
||
|
Diluted earnings per share (€)
|
1.42
|
|
1.88
|
|
||||||||||||
|
Reported diluted shares outstanding
|
385
|
|
||||||||||||||
|
Adjust: Capital structure share impact related to the Merger
|
103
|
|
||||||||||||||
|
Comparable diluted shares outstanding
|
488
|
|
||||||||||||||
|
(A)
|
Adjustments to reflect Germany and Iberia financial results as if the Merger had occurred at the beginning of each period (if applicable), the impact of acquisition accounting including final fair values of the acquired inventory, property, plant, and equipment and intangibles from Germany and Iberia, final acquisition accounting related adjustments and associated impact on depreciation and amortisation expense, and additional debt financing cost incurred by CCEP in connection with the Merger.
|
|
(B)
|
Amounts represent the net out-of-period mark-to-market impact of non-designated commodity hedges.
|
|
(C)
|
Amounts represent restructuring charges related to business transformation activities.
|
|
(D)
|
Amounts represent costs associated with the Merger to form CCEP.
|
|
(E)
|
Amount represents a provision recorded for ongoing litigation.
|
|
(F)
|
Amounts represent the deferred tax impact related to income tax rate and law changes. The amount in 2017 principally represents the net book tax impact of US tax reform.
|
|
|
P a g e |
22
|
SUSTAINABILITY
Action on sustainability
In 2017, together with The Coca-Cola Company in Western Europe, we launched This is Forward - our joint sustainability action plan. This is Forward builds upon many years of work in sustainability and is a critical part of Coca-Cola European Partners’ (CCEP) long-term business strategy. It sets out how we will grow our business in a responsible and sustainable way and how we intend to play a meaningful role in addressing key societal issues.
This is Forward has been developed following extensive consultation with over 100 of our key stakeholders - including governments, Non-Governmental Organisations (NGOs), customers, suppliers, as well as 12,000 consumers across six countries and over 1,000 of our own employees.
Our plan outlines the actions that we are taking on major societal issues - including health and nutrition, packaging and economic development; as well as continuing to address climate change and water scarcity and drive sustainability within our supply chain.
Reporting and transparency
Being accountable and transparent is central to the way in which we operate. We report our progress against our sustainability action plan in our annual Stakeholder Progress Report, which will be published in May 2018, and will be available at https://www.ccep.com/pages/thisisforward. Our Stakeholder Progress Report is being produced in accordance with the GRI Standards: Core Option.
The following are some of the highlights of our progress in 2017:
Action on Drinks
Together with The Coca-Cola Company, we are evolving our business to be a total beverage company, in line with changing consumer tastes, lifestyles and shopping habits. In order to offer consumers an even greater choice of drinks with reduced sugar, we are working with The Coca-Cola Company, and other brand owners, to introduce recipes that reduce the sugar across many of our existing brands, and are introducing new low and no-sugar variants of both existing and new brands. For example, we are introducing drinks such as Honest Tea, and purified water, such as GLACÉAU Smartwater, across our territories.
We aim to reduce the sugar in our soft drinks by 10% between 2015 and 2020. In 2017, we reduced the sugar in our soft drinks by 4.2% from our 2015 baseline, and by 9.3% since 2010.
Action on Packaging
We are taking Action on Packaging and are determined to lead the way towards a circular economy where 100% of our packaging can be collected, reused or recycled, and where none of it ends up as litter or in the oceans. In particular, together with The Coca-Cola Company we aim to ensure that all of our packaging is recyclable or reusable. In addition, we want to make sure that at least 50% of the material we use for our PET bottles comes from recycled plastic (rPET) by 2025. In Great Britain, we aim to achieve this rPET target by 2020. We have also begun to engage with local and national partners to ensure that 100% of our packaging can be collected by 2025. In all of our markets in Western Europe, we are partners in local household collection or deposit return schemes and we aim to lead the way in driving a step-change in packaging collection, especially in markets where recycling rates have stalled. This includes work with organisations such as Valpak in Great Britain, Citeo in France and FostPlus in Belgium.
Action on Society
Community
In 2017, we continued to act as a force for good in our communities by supporting initiatives across our territories that help young people gain the employability, skills and confidence they need to succeed. These include programmes such as the GIRA programme in Spain, where for the past five years, we have supported the social skills and employability of young people and women; as well as the Passport to Employment programme in France, which provides interview training and mentoring support for young people from underprivileged backgrounds.
Diversity and equal opportunities employment
We aim to foster a diverse and inclusive culture in our business, and focus our efforts across all areas of diversity, including gender, generations, cultural diversity, disability and sexual orientation. One of our key This is Forward actions will be to aim for women to hold at least 40% of our management positions by 2025. In 2017, 32.6% of management positions were held by women.
|
|
P a g e |
23
|

CCEP is an equal opportunities employer and decisions on recruitment, development, training and promotion and other employment related issues are made solely on the grounds of individual ability, achievement, expertise and conduct. We act in line with these principles on a non-discriminatory basis, without regard to race, colour, nationality, culture, ethnic origin, religion, belief, gender, sexual orientation, age, disability or any other reason not related to job performance or prohibited by applicable law. In cases where employees are injured or disabled during employment with the Group, support is provided to those employees and workplace adjustments are made as appropriate in respect of their duties and working environment, supporting recovery and continued employment.
Table 1 indicates our workforce diversity, as of 31 December 2017.
Table 1: Workforce diversity
|
Men
|
Women
|
|
|
Total Employees (including part-time employees and employees on leave of absence)
|
18,076
76.8%
|
5,475
23.2%
|
|
Leadership (including ELT - Senior Manager Grade)
(A)(B)
|
1,336
67.4%
|
645
32.6%
|
|
Board of Directors
|
14
82.4%
|
3
17.6%
|
|
Directors of Subsidiary Companies
(B)
|
53
79.1%
|
14
20.9%
|
|
(A)
|
Does not include Iceland.
|
|
(B)
|
12 female and 43 male directors of subsidiary companies are also included in the workforce diversity figures for leadership.
|
|
|
P a g e |
24
|
Action on Water
We aim to handle water with the care it deserves across our business and value chain. In 2017, 100% of our manufacturing operations had Source Water Protection Plans in place, and we have made significant progress against our target to reduce our water use in manufacturing by 20% by 2025. In 2017, we reduced our water use by 11.78% versus a 2010 baseline, through the use of water-saving technologies and processes, resulting in a water use ratio of 1.61 litres/litre of product sold. Together with The Coca-Cola Company, we have also continued to replenish the water we use in areas of water stress, by partnering with organisations such as WWF.
Action on Supply Chain
We are working to source our main ingredients and raw materials sustainably and responsibly - so that 100% of our main agricultural ingredients and raw materials come from sustainable sources by 2020. We track our progress through our suppliers’ compliance with our Supplier Guiding Principles (SGPs) and our Sustainable Agriculture Guiding Principles (SAGPs). We are also working to embed sustainability, ethics and human rights within our supply chain. Respect for human rights is fundamental to the sustainability of CCEP and the communities in which we operate. CCEP’s Human Rights Policy is guided by international human rights principles encompassed in the Universal Declaration of Human Rights, the International Labour Organisation’s Declaration on Fundamental Principles and Rights at Work, the United Nations Global Compact and the United Nations Guiding Principles on Business and Human Rights.
In 2017, we published our first response to the UK Modern Slavery Act, and will publish further updates on our progress on embedding human rights and sustainability in our supply chain in our 2017 Stakeholder Progress Report.
Action on Climate
We aim to halve our direct carbon emissions by 2025 and purchase 100% renewable electricity by 2020. We also aim to reduce our GHG emissions across our value chain. Our new carbon reduction targets have been validated by the Science-Based Targets Initiative (SBTI) as being aligned with the expectations of climate science and the Paris Climate Agreement.
In 2017, we reduced the carbon footprint of our core business operations (which includes our manufacturing,
distribution and cold drink equipment) by 45.3% versus 2010, and 4.09% versus 2016. In 2017, 87.5% of the electricity that we purchased was from renewable sources, and we used 0.32 megajoules of energy per litre of product produced.
CCEP’s Corporate Social Responsibility Committee of the Board has responsibility for sustainability matters, including climate change. Risks related to climate change, water scarcity, marine litter and resource scarcity have been identified as one of CCEP’s risk factors (as disclosed in the Strategic Report on page 31) and the responsibility for overseeing CCEP’s response to these risks has been integrated into CCEP’s overall Enterprise Risk Management framework.
Greenhouse gas emissions - core business operations (scope 1, 2 and 3)
Details of the scope 1, scope 2, and scope 3 greenhouse gas (GHG) emissions in tonnes of CO
2
equivalent from activities for which the Group is responsible during the calendar year ended 31 December 2017 are set out in table 2. These are calculated in accordance with the WRI/WBCSD Greenhouse Gas Protocol, using an operational consolidation approach to determine organisational boundaries.
We disclose the scope 1, 2, and 3 emissions which make up our core business operations. We consider our core business operations to include our manufacturing, cold drink equipment and transportation. More details about our GHG emissions, including the GHG emissions in our value chain (including our ingredients and packaging), will be contained in CCEP’s Stakeholder Report, to be published in May 2018. Additional scope 3 figures will also be included in our 2018 CDP response.
In 2017, we achieved a 7.5% reduction in our scope 1 and 2 carbon emissions versus those in 2016; and a 57.8% reduction versus our 2010 baseline, using a market based scope 2 approach.
Intensity ratios
GHG emissions (scope 1 & 2) per litre of product produced (market based scope 2 approach): 19.64
g/litre of product produced.
GHG emissions (scope 1 & 2) per euro of revenue (market based scope 2 approach): 22.46 g/euro of revenue.
Table 2: GHG emissions
|
Emission sources
|
2016
|
|
2017
|
|
|
|
Scope 1
(tonnes CO
2
e)
|
Direct emissions (e.g. fuel used in manufacturing, own vehicle fleet, as well as process and fugitive emissions)
|
240,233
|
|
229,657
|
|
|
Scope 2 (location based)
(tonnes CO
2
e)
|
Indirect emissions (e.g. electricity)
|
190,310
|
|
191,046
|
|
|
Scope 2 (market based)
(tonnes CO
2
e)
|
28,399
|
|
18,829
|
|
|
|
Scope 3
(tonnes CO
2
e)
|
Third party emissions included in our core business operations, including those related to our cold-drink equipment, third party transportation and distribution, and business travel
|
1,149,130
|
|
1,111,261
|
|
|
|
P a g e |
25
|
Note on sources of data and calculation methodologies
Under the WRI/WBCSD Greenhouse Gas (GHG) Protocol, we measure our emissions in three ‘scopes’, except for CO
2
e emissions from biologically sequestered carbon, which is reported separately. Please note that prior year data for 2016 in table 2 above has been restated from last year due to more accurate data coming available.
Data is consolidated from a number of sources across our business and is analysed centrally. We use a variety of methodologies to gather our emissions data and measure each part of our operational carbon footprint, including natural gas and purchased electricity data, refrigerant gas losses, CO
2
fugitive gas losses and transport fuel, water supply, waste water and waste management. We use emission factors relevant to the source data including UK Department for Business, Environment and Industrial Strategy (BEIS) 2017 and IEA 2015 emission factors.
Scope 1 figures include: direct sources of emissions such as the fuel we use for manufacturing and our own vehicles plus our process and fugitive emissions.
Scope 2 figures include: indirect sources of emissions such as the purchased electricity we use at our sites. We report against this on both a location based and a market based approach.
Scope 3 figures include: indirect sources associated with the electricity used by our cold drinks and coffee equipment at our customers’ premises, our employee business travel by rail and air, emissions related to the supply of water and treatment of wastewater, emissions from the treatment of waste, fuel used by our third party distributors, and other energy related emissions not already accounted for under scope 1 and 2 (e.g. emissions from well-to-tank and transmission and distribution). Additional scope 3 figures from our ingredients and packaging will be reflected in our 2017 Stakeholder Progress Report, and will also be included in our 2018 CDP response.
Approximately 1.55% of our operational carbon footprint is based on estimated emissions (e.g. leased offices where energy invoices are not available). Our scope 1 and 2 emissions are independent of any greenhouse gas trades.
The figures for 2017 in table 2, along with selected information in CCEP’s forthcoming Stakeholder Report, are subject to independent assurance by DNV GL in accordance with the ISAE 3000 standard. The full assurance statement with DNV GL’s scope of work, and basis of conclusion, will be published in CCEP’s 2017 Stakeholder Progress Report.
Recognition
Coca-Cola European Partners is rated against a number of major sustainability benchmarks, and we are committed to being a leader in sustainability in the beverage industry. In 2017, we were proud to have been listed on the Dow Jones Sustainability Index (DJSI) World and DJSI European Indices, and to have been named as a member of the CDP Climate and Water A-Lists. We are also members of other sustainability indices, including FTSE4Good and Corporate Knights 100 Most Sustainable Corporations.
Anti corruption and anti bribery
CCEP’s ethics and compliance programme is based upon our commitment to conduct our operations in a lawful and ethical manner, upon the integrity of each of our employees. Our ethics and compliance programme is overseen by CCEP’s Audit Committee, and is applicable to our employees, our officers and our directors. It also supports how we work with our customers, suppliers and third parties. In 2017, our Board approved a new CCEP Code of Conduct (CoC), which aligns to applicable key regulations and legislations. The CoC covers items including share dealing, anti corruption, data protection, environmental regulation and managing gifts and hospitality. Our CoC will apply to all employees, following consultation with works councils in each of the countries where we operate. Following the launch of the CoC in each country, employees will also receive training on the CoC, and may receive specific training on certain topics, for example, share dealing, anti corruption, data privacy, if applicable to their role. We also expect our customers and suppliers to respect the business principles in our CoC, and we reflect and communicate these principles to our suppliers through our Supplier Guiding Principles. In 2017, we received no fines for CoC violations.
At CCEP, retaliation for whistleblowing is prohibited. In each of our territories, we have established a way for employees to raise concerns about breaches to their local CoCs. This includes processes for employees to contact a line manager, and provides information through a dedicated complaints channel. Potential violations of our CoC are dealt with by local CoC Committees, chaired by the VP Legal for each Business Unit. CCEP’s Chief Compliance Officer has Company wide oversight of all potential CoC violations, provided through monthly local CoC Committee updates. An overview of all reported incidents is also provided to the Audit Committee. We also disclose reported violations of our CoC, by type, including on any issues of bribery and corruption, in our annual Stakeholder Progress Report.
|
|
P a g e |
26
|
PRINCIPAL RISKS
Effective management of risk is essential to the execution of our strategy, achievement of shareholder value, protection of brand reputation and good governance.
Our approach to risk
The Directors recognise that our risk management programme is essential to understand the nature, scope, potential likelihood and impact of enterprise wide risks and to manage them effectively, responding appropriately to the changing risk profile of our operating environment. The Directors believe a strong risk culture with a well-defined risk management programme within Coca-Cola European Partners (CCEP) will ensure risk informed business decisions are taken and risks are actively managed throughout our business.
To ensure that the Directors have sufficient visibility of the principal risks that could have an impact on CCEP’s strategic priorities and how they are being monitored and managed, CCEP has an enterprise wide risk management programme. The approach has two complementary elements: a top down strategic view of risk at the enterprise level and a bottom up tactical view of risk at the operational level. Our risk governance framework includes a Compliance and Risk Committee comprised of members of our Executive Leadership Team (ELT) and other senior leaders where risks are reported and reviewed. Sub-committees at the local Business Unit (BU) level are in place to manage local operational risks. In 2018, other elements of our Enterprise Risk Management are being developed and the risk management programme is being integrated providing a holistic view on the total risk landscape at CCEP.
Our ELT completed a horizon scanning exercise to identify material loss and incident scenarios (Black Swans and Grey Rhinos). This will be an exercise completed regularly at this level. The results of this exercise are reflected in our Principal Risks.
Our Enterprise Risk Management function is led by the Chief Compliance Officer who reports to the General Counsel and Company Secretary. They provide support and expertise to all Business Units and functions across the organisation. The Chief Compliance Officer also manages incident management, business continuity, ethics and compliance and security so has a holistic view of risk management across our business.
Our strategic enterprise wide risk assessment has resulted in identification of CCEP’s enterprise risks and an understanding of how they are being managed. The most impactful of the identified risks form the Principal Risks detailed below. As part of the strategic enterprise Risk Assessment process a risk survey is issued to our top leaders to obtain their feedback, then Board and Audit Committee members and members of the ELT are interviewed. The results of the Strategic Risk Assessment and the Principal Risks were reviewed by the Audit Committee and the Board of Directors in December 2017.
This year, to complement the top down strategic risk view, bottom up risk assessments have been performed to understand operational risks within each of our Business Units and functions. Each Business Unit has a local Compliance and Risk Committee reporting to its leadership team to review risks and incidents and to ensure risk management is incorporated into day to day business operations.
The Board considers the level of risk it is prepared to accept in order to deliver CCEP’s strategic objectives. This will be documented in our internal risk appetite statement which will describe both our current and our desired levels of acceptable risk. The Company engaged external risk management expertise to support the design, implementation and execution of our risk management programme.
Principal Risks
The summary of our Principal Risks is based on the information obtained from the 2018 Strategic Enterprise Risk Assessment.
CCEP now has a prior year benchmark against which to compare, therefore commentary has been included on whether each risk exposure has increased, decreased or remained unchanged.
Set out on the following pages are the principal risks and uncertainties that could materially and adversely affect our business or could cause our actual results to differ materially from the results contemplated by the forward-looking statements contained in this report and other public statements we make. The Directors have carried out a robust assessment of the principal risks facing CCEP; however the list on the following pages is not intended to include all risks that could ultimately impact our business and is presented in no particular order.
|
|
P a g e |
27
|
|
Principal Risk
|
Definition and impact
|
Key mitigation
|
Change in risk
|
||
|
Changing Consumer Preferences and the Health Impact of Soft Drinks
|
We distribute products containing sugar, alternative sweeteners and other ingredients which are increasingly viewed negatively by consumers, public health and government officials, and Non-Governmental Organisations (NGOs) as a result of factors such as healthy lifestyle campaigns, increased media scrutiny and greater awareness through social media. This exposes us to the risk that we will be unable to counteract this negative category perception effectively or evolve our product portfolio quickly enough to satisfy changes in consumer preferences. As a result, consumer preferences may continue to shift towards less valuable beverage segments and we could experience sustained decline in sales volume which could impact our financial results and business performance.
|
•
|
Reducing calorie content of our products, through:
|
Increasing
|
|
|
°
|
Product and pack innovation and reformulation
|
||||
|
°
|
Managing our product mix in favour of no and low calorie products
|
||||
|
•
|
EU wide soft drink industry calorie reduction commitment within trade association Union of European Soft Drinks Associations
|
||||
|
•
|
Dialogue with government representatives, NGOs, local communities and customers
|
||||
|
•
|
Employee communication and education
|
||||
|
•
|
On-pack communication of product and nutritional information
|
||||
|
•
|
Responsible sales and marketing
|
||||
|
Legal and Regulatory Intervention
|
Our products contain certain ingredients (e.g. sugar and alternative sweeteners) and packaging components and are distributed through various channels that are subject to governmental oversight. This exposes us to the risk of regulatory changes that may adversely impact our business. As a result, we could face new or higher taxes, stricter sales and marketing controls, or other punitive actions from regulators or legislative bodies that negatively impact our licence to operate.
|
•
|
Continued packaging sustainability programme focusing on:
|
Stayed the same
|
|
|
°
|
Continued drive towards higher collection and recycling rates
|
||||
|
°
|
Use of recycled and renewable materials
|
||||
|
•
|
Continuous monitoring and implementation
|
||||
|
•
|
Measures set out above in relation to changing consumer preferences and the health impact of soft drinks
|
||||
|
Business Integration and Synergy Savings
|
We have a business integration agenda, synergy savings commitment, cultural integration and other initiatives to generate growth, which exposes us to the risk of ineffective implementation, a diversion of management's focus away from our core business, not delivering the full benefits of a single organisation and declining employee engagement. As a result, we may not realise value creation from these initiatives or execute our business plans effectively, and we may experience damage to our corporate reputation, a decline in our share price, industrial action and disruption to our operations.
|
•
|
Dedicated integration management office with leads in all BUs and Functions
|
Stayed the same
|
|
|
•
|
Continuation of governance routines
|
||||
|
•
|
Regular integration review ensuring effective steering, high visibility and quick decision making
|
||||
|
•
|
Effective project management methodology
|
||||
|
•
|
Regular ELT and Board reviews and approvals
|
||||
|
Cyber and Social Engineering Attacks
|
We rely upon a complex IT landscape, using both internally and externally provided systems which are potentially vulnerable to the increasing prevalence of security and cyber threats, as well as user behaviour. This threat profile is dynamically changing as potential attackers’ skill and tools advance. This exposes us to the risk of unauthorised data access, compromised data accuracy and confidentiality, and the loss of system operation. As a result, we could experience disruption to operations, regulatory intervention, or damage to our Company reputation.
|
•
|
Proactive monitoring of cyber threats, performing risk assessments and implementing preventive measures
|
Increasing
|
|
|
•
|
Business awareness and training on information security
|
||||
|
•
|
Business continuity and disaster recovery programmes
|
||||
|
•
|
A programme to find and resolve vulnerabilities is in place
|
||||
|
Market
|
Our success in the market is impacted by a number of factors including the actions taken by our competitors and our ability to build strong customer relationships and to realise price increases. This exposes us to the risk that market forces may limit our ability to execute our business plans effectively. As a result, we may be unable to expand margins, increase market share, or negotiate with customers effectively.
|
•
|
Shopper insights and price elasticity assessments
|
Stayed the same
|
|
|
•
|
Pack and product innovation
|
||||
|
•
|
Promotional strategy
|
||||
|
•
|
Commercial policy
|
||||
|
•
|
Collaborative category planning with customers
|
||||
|
•
|
Growth centric customer investment policies
|
||||
|
•
|
Aligned customer and CCEP business development plans
|
||||
|
•
|
Diversification of portfolio and customer base
|
||||
|
•
|
Realistic budgeting routines and targets
|
||||
|
•
|
Investment in key account development and category planning
|
||||
|
|
P a g e |
28
|
|
Principal Risk
|
Definition and impact
|
Key mitigation
|
Change in risk
|
||
|
Economic and Political Conditions
|
We operate in the fast moving consumer goods industry that is sensitive to market conditions, such as commodity price volatility, inflation, and political instability, which exposes us to the risk of an adverse impact on CCEP and our consumers, driving a reduction of spend within our category. As a result, we could experience reduced demand for our products, fail to meet our growth priorities and our reputation could be adversely impacted.
|
•
|
Diversified product portfolio and the geographic diversity of our operations assist in mitigating the Group’s exposure to any localised economic risk
|
Stayed the same
|
|
|
•
|
Our flexible business model allows us to adapt our portfolio to suit our customers’ changing needs during economic downturns
|
||||
|
•
|
We regularly update our forecast of business results and cash flows and, where necessary, rebalance capital investments
|
||||
|
Relationship with TCCC and Other Franchisors
|
We conduct our business primarily under agreements with The Coca-Cola Company (TCCC) and other franchisors, which exposes us to the risk of misaligned incentives or strategy, particularly during periods of low category growth. As a result, TCCC or other franchisors could act adversely to our interests with respect to our business relationship.
|
•
|
TCCC and bottler agreements
|
Decreasing
|
|
|
•
|
Incidence pricing agreement
|
||||
|
•
|
Aligned long range planning and annual business planning processes
|
||||
|
•
|
Ongoing pan-European and local routines between CCEP and franchise partners
|
||||
|
•
|
Positive relationships at all levels
|
||||
|
Product Quality
|
We must adhere to strict food safety requirements to ensure our beverages are safe for consumption, while at the same time producing a wide range of products, which exposes us to the risk of failing to meet, or being perceived as failing to meet, the necessary standards resulting in compromised product quality. As a result, we could experience damage to our brand reputation and witness declining consumer sentiment towards our products.
|
•
|
TCCC standards and audits
|
Stayed the same
|
|
|
•
|
Hygiene regimes at plants
|
||||
|
•
|
Total quality monitoring programme
|
||||
|
•
|
Robust management systems
|
||||
|
•
|
ISO certification
|
||||
|
•
|
Internal governance audits
|
||||
|
•
|
Quality monitoring plan
|
||||
|
•
|
Customer and consumer monitoring and feedback
|
||||
|
•
|
Incident management and crisis resolution
|
||||
These are our Principal Risks. However we are aware of our other operational risks, such as health and safety of our employees, which are regularly monitored, mitigated and addressed as part of our daily routines. A detailed discussion of the principal and other risks follows on pages 29 to 38.
Internal control procedures and risk management
The Board has overall responsibility for the Company’s system of internal control and for reviewing its adequacy and effectiveness. Such a system is designed to manage rather than eliminate the risk of failure to achieve business objectives, and aims to provide reasonable but not absolute assurance against material misstatement. In order to discharge that responsibility in a manner that ensures compliance with laws and regulations and promote effective and efficient operations, the Board has established an organisational structure with clear operating procedures, lines of responsibility and delegated authority.
The Audit Committee reviews the adequacy and effectiveness of the Company’s internal control policies and procedures for the identification, assessment and reporting of risks.
The Company’s internal control procedures include Board approval for significant projects, transactions and corporate actions. All major expenditures require either senior management or Board approval at the appropriate stages of each transaction. A system of regular reporting covering both technical progress of such matters and the state of the Company’s financial affairs provides appropriate information to management to facilitate control. The Board reviews, identifies, evaluates and manages the significant risks that face the Company.
The Company has developed a Group wide approach to risk management and internal control activities and the reporting of them. The principal risks and uncertainties that could impact the Group’s strategic priorities are set out above, together with a discussion on the following pages of risk factors that the Group takes into account and the Company’s Viability Statement.
|
|
P a g e |
29
|
RISK FACTORS
Set out below is a more detailed discussion of the principal risks and other risks facing our business which could adversely impact us. Additional risks not currently known to us or that we currently deem to be immaterial may also adversely affect our business and financial condition.
Risks Relating to Changing Consumer Preferences and the Health Impact of Soft Drinks
Concerns about health and wellness, including obesity, could have an adverse effect on demand for some of the products of Coca-Cola European Partners (CCEP), and consequently on CCEP’s financial performance.
CCEP is dependent on consumer demand for its products and brands, and changes in consumer preferences toward products or brands not carried by CCEP can negatively affect CCEP’s sales. Consumers and public health and government officials are highly concerned about the public health consequences of obesity, particularly among young people. In this regard, the EU Commission and EU Member States are driving the food and drinks industry to reduce the amount of sugar in products. In February 2017, the Union of European Soft Drinks Associations announced a further commitment to reduce by another 10% sugar in soft drinks from 2015 to 2020. Some researchers, health advocates, and dietary guidelines are suggesting that consumption of sugar-sweetened beverages is a primary cause of increased obesity rates and are encouraging consumers to reduce or eliminate consumption of such products. Increasing public concern about obesity and additional governmental regulations concerning the marketing, labelling, packaging, or sale of sugar-sweetened beverages may reduce demand for, or increase the cost of, CCEP’s sugar-sweetened beverages.
Health and wellness trends have resulted in an increased desire for more low calorie soft drinks, water, enhanced water, isotonics, energy drinks, teas, and beverages with natural sweeteners. CCEP’s failure to provide a sufficient range of these types of products or otherwise satisfy changing consumer preferences relating to non-alcoholic beverages could adversely affect CCEP’s business and financial results.
Risks Relating to Legal and Regulatory Intervention
Legislative or regulatory changes (including changes to tax laws) that affect CCEP’s products, distribution, or packaging could reduce demand for its products or increase CCEP’s costs.
CCEP’s business model depends on the availability of its various products and packages in multiple channels and locations to satisfy the needs and preferences of its customers and consumers.
Laws that restrict CCEP’s ability to distribute products in certain channels and locations, as well as laws that require deposits for certain types of packages, or those that limit CCEP’s ability to design new packages or market certain packages, could negatively impact CCEP’s financial results. In addition, taxes or other charges imposed on the sale of certain of CCEP’s products could increase costs or cause consumers to purchase fewer of CCEP’s products. Many countries in Europe, including territories in which CCEP operates, are evaluating the implementation of, or increase in, such taxes. For example, Belgium, Portugal and Norway all increased the excise taxes on certain of CCEP’s products effective 1 January 2018. We will see a levy on sugared soft drinks in the UK from April 2018, and a new tax modulated by sugar levels on our products in France from July 2018. Scotland has also announced that it will introduce a deposit return system (DRS) for beverage packaging in the coming years and the Netherlands are considering the extension of their existing DRS to cover small sized drinks packaging. Consultations on DRS in the rest of GB and France are also underway or planned.
Additional taxes levied on CCEP could harm CCEP’s financial results.
CCEP’s tax filings for various periods will be subject to audit by tax authorities in most jurisdictions in which CCEP does business. These audits may result in assessments of additional taxes, as well as interest and/or penalties, and could affect CCEP’s financial results.
|
|
P a g e |
30
|
Changes in tax laws, regulations, court rulings, related interpretations, and tax accounting standards in countries in which CCEP operates may adversely affect CCEP’s financial results.
Additionally, amounts CCEP may need to repatriate for the payment of dividends, share repurchases, interest on debt, salaries and other costs may be subject to additional taxation when repatriated.
CCEP may be exposed to risks in relation to compliance with anti-corruption laws, corporate criminal offence, General Data Protection Regulation (GDPR) and regulations and economic sanctions programmes.
The Company and its subsidiaries are required to comply with the laws and regulations of the various jurisdictions in which they conduct business, as well as certain laws of other jurisdictions, including the US. In particular, CCEP’s operations are subject to anti corruption laws and other key regulations, such as, among others, the US Foreign Corrupt Practices Act of 1977 (the FCPA), the United Kingdom Bribery Act of 2010 (the Bribery Act), the new Corporate Criminal Offence provisions, GDPR and economic sanctions programmes, including those administered by the United Nations, the EU and the Office of Foreign Assets Control of the US Department of the Treasury (OFAC), and regulations set forth under the US Comprehensive Iran Accountability Divestment Act.
Data Protection is in the spotlight because of the upcoming European GDPR. CCEP is currently preparing for the GDPR requirements that will come into force on 25
May 2018. We believe that the existing data privacy compliance programmes in the countries where we operate are updated where needed to comply with the GDPR as well with the local data privacy laws.
A GDPR data breach could lead to fines of up to 4% of CCEP’s global annual turnover and in addition have an impact on CCEP’s reputation.
The FCPA prohibits providing anything of value to foreign officials for the purposes of obtaining or retaining business or securing any improper business advantage. CCEP may deal with both governments and state owned business enterprises, the employees of which are considered foreign officials for purposes of the FCPA. The provisions of the Bribery Act extend beyond bribery of foreign public officials, cover both public and private sector bribery and are more onerous than the FCPA in a number of respects, including jurisdiction, non-exemption of facilitation payments and penalties. While CCEP does not currently operate in jurisdictions that are subject to territorial sanctions imposed by OFAC or other relevant sanctions authorities, such economic sanctions programmes will restrict CCEP’s ability to engage or confirm business dealings with certain sanctioned countries and with sanctioned parties.
Violations of the above and more generally all applicable anti corruption and sanctions laws and regulations are punishable by civil penalties, including fines, denial of export privileges, injunctions, asset seizures, debarment from government contracts (and termination of existing contracts) and revocations or restrictions of licences, as well as criminal fines and imprisonment.
In addition, any major violations could have an impact on CCEP’s reputation and consequently on its ability to win future business.
The Company and its subsidiaries have been working on harmonising, improving and updating their anti corruption compliance programme including policies, processes and procedures to ensure compliance, to continuously improve systems of internal controls and remedy any weaknesses identified. There can be no assurance, however, that the policies and procedures will be followed at all times, or effectively detect and prevent violations of the applicable laws by CCEP’s employees, consultants, agents or partners. As a result of any such violation, CCEP could be subject to penalties and material adverse consequences on its business, financial condition or results of operations.
Changes in law could affect CCEP’s status as a foreign corporation for US federal income tax purposes or limit the US tax benefits from CCEP engaging in certain transactions.
A corporation generally is considered a tax resident in the jurisdiction of its organisation or incorporation for US federal income tax purposes. Because CCEP is incorporated under the laws of England and Wales, it would generally be classified as a non-US corporation (and therefore a non-US tax resident) under these rules. However, section 7874 of the US Internal Revenue Code of 1986, as amended (the IRC), provides an exception under which a non-US incorporated entity may, in certain circumstances, be treated as a US corporation for US federal income tax purposes.
Under current law CCEP expects to be treated as a non-US corporation for US federal income tax purposes. However, section 7874 of the IRC and the related US Treasury Regulations are complex and there is limited guidance as to their application. In addition, changes to section 7874 of the IRC or the US Treasury Regulations promulgated thereunder could adversely affect CCEP’s status as a foreign corporation for US federal tax purposes, and any such changes could have prospective or retroactive application. If CCEP were to be treated as a US corporation for US federal income tax purposes, it could be subject to materially greater US tax liability than currently contemplated as a non-US corporation.
|
|
P a g e |
31
|
Future changes to US, UK and other tax laws to which CCEP is subject could adversely affect CCEP.
The US Congress, HMRC, the Organisation for Economic Co-operation and Development and other government agencies in jurisdictions where CCEP and its affiliates will conduct business have had an extended focus on issues related to the taxation of multinational corporations. One example is in the area of “base erosion and profit shifting”, including situations where payments are made between affiliates from a jurisdiction with high tax rates to a jurisdiction with lower tax rates. As a result, the tax laws in the US, the UK and other countries in which CCEP and its affiliates do business could change on a prospective or retroactive basis. Any such changes could adversely affect CCEP and its affiliates and there is no assurance that CCEP will be able to maintain any particular worldwide effective corporate tax rate.
CCEP may be subject to US federal tax withholding as a result of the subscription for CCEP shares in exchange for property.
If certain US Treasury regulations were applicable, CCEP could be treated as having received a distribution as a result of the subscription for CCEP shares by a US company. The amount of such deemed distribution could be substantial, and would be subject to US withholding tax (at a rate of 5%) under the United Kingdom-United States Tax Treaty. CCEP does not believe that such regulations apply under the particular facts and circumstances of the Merger. There can be no assurance, however, that the US Internal Revenue Service will not take a contrary view.
US federal income tax reform could adversely affect us.
On 22 December 2017, the US enacted the Tax Cuts and Jobs Act (the US Tax Act) which implements a broad range of changes to the IRC. The US Tax Act, among other things, includes changes to US federal tax rates, imposes significant additional limitations on the deductibility of interest and net operating losses, allows for the expensing of certain capital expenditures, and puts into effect a number of changes impacting operations outside the US including, but not limited to, the imposition of a one-time tax on accumulated post-1986 deferred foreign income that has not previously been subject to tax, and modifications to the treatment of certain intercompany transactions.
While CCEP is a UK listed and tax resident entity, we have a number of subsidiaries outside the UK, including a US incorporated holding company that is wholly owned by the Company. CCEP has analysed and accounted for the effects of this new legislation in its 2017 consolidated financial statements. However, the amounts recorded are based on the most recently available information and the impact of the tax legislation may ultimately differ from these amounts, possibly materially, due to, among other things, changes in interpretations and assumptions made, additional guidance that may be issued and future actions taken by CCEP as a result of the tax legislation.
Refer to Note 19 of the consolidated financial statements for further details about the accounting impacts of the US Tax Act.
CCEP may be affected by legal and regulatory responses to global issues such as resource scarcity, marine litter, water scarcity, and climate change.
Political and scientific consensus indicates that increased concentrations of carbon dioxide and other greenhouse gases (GHG), which can be attributed in part to the emissions generated from businesses such as CCEP’s, are leading to gradual rises in global average temperatures. This is influencing global weather patterns and extreme weather conditions around the world. Climate change may also exacerbate water scarcity and cause a further deterioration of water quality in affected regions. Decreased agricultural productivity in certain regions of the world as a result of changing weather patterns may limit the availability, or increase the cost, of key raw materials that CCEP uses to produce its products. Additionally, increased frequency of extreme weather events linked to climate change such as storms or floods in CCEP’s territories could have adverse impacts on CCEP’s facilities and distribution network, leading to an increased risk of business disruption.
Concern over climate change, including global warming, has led to legislative and regulatory initiatives directed at limiting GHG emissions. The territories in which CCEP operates have in place a variety of voluntary commitments to reduce GHG emissions in which CCEP participates. Proposals that would impose mandatory requirements on GHG emissions and reduction and reporting continue to be considered by policy makers. Furthermore, climate laws that, directly or indirectly, affect CCEP’s production, distribution, packaging, cost of raw materials, fuel, ingredients, and water could impact CCEP’s business and financial results.
Population growth and increased consumption of goods and services places heightened pressure on the world’s finite natural resources - such as oil, coal and gas - and has also led to a significant increase in waste and pollution, including from plastic and packaging. Although the vast majority of our bottles and cans are fully recyclable, they are not always collected for recycling across our territories, and can end up as litter or marine litter. Concern over the issues of resource scarcity, litter, and marine litter has led to the development of legislative and regulatory initiatives which aim to increase recycling and reuse and reduce packaging waste in our territories. Failure to engage sufficiently with stakeholders to address concerns about packaging and recycling could result in higher costs through packaging taxes, damage to corporate reputation or investor confidence and a reduction of consumer acceptance of our products and/or packaging.
|
|
P a g e |
32
|
Water, which is the primary ingredient in all of CCEP’s products, is vital to its manufacturing processes and is needed to produce the agricultural ingredients that are essential to its business. While water is generally regarded as abundant in Europe, it is a limited resource in many parts of the world, affected by overexploitation, growing population, increasing demand for food products, increasing pollution, poor management, and the effects of climate change. Water scarcity and a deterioration in the quality of available water sources in CCEP’s territories, or its supply chain, even if temporary, may result in increased production costs or capacity constraints, which could adversely affect its ability to produce and sell its beverages and increase its costs.
In November 2017, in partnership with The Coca-Cola Company, CCEP released a new sustainability action plan, This is Forward, including targets to reduce GHG emissions and water impacts across our operations and our value chain. Our GHG emissions targets have been confirmed as being aligned with the expectations of climate science. These targets will be delivered through a variety of initiatives that are already in progress, including initiatives to drive energy and water efficiency, use renewable electricity and low-carbon technologies at our manufacturing sites, and reduce the energy use of our cold drink equipment. CCEP also set new targets on packaging to ensure that at least 50% of the material we use for our PET bottles comes from recycled plastic, to ensure that all of our packaging is recyclable or reusable, and to collect 100% of our packaging by 2025.
Commitments to reduce GHG emissions related to its business operations and potential forthcoming regulatory requirements and stakeholder expectations will necessitate CCEP’s investment in technologies that improve the energy efficiency of its operations and reduce the GHG emissions related to its packaging, cold drinks equipment and transportation. In general, the cost of these types of investments is greater than investments in less energy efficient technologies, and the period of return is often longer. Although CCEP believes these investments will provide long-term benefits, there is a risk that CCEP may not achieve its desired returns.
Risks Relating to Business Integration and Synergy Savings
CCEP may not realise the cost savings, synergies and other benefits expected from the integration. In addition, the integration could cause business disruption.
Since its creation in May 2016, CCEP has been devoting significant management attention and resources to integrating its business practices and operations. The remaining stages of the integration programme to 2019 may disrupt the business of CCEP and, even if implemented successfully, could preclude realisation of the full benefits expected. The failure of CCEP to meet the challenges involved in successfully integrating its operations could cause an interruption of some of the activities of CCEP and could have a material adverse effect on its operations. In addition, the ongoing
integration programme may result in material unanticipated problems, expenses, liabilities, competitive responses, loss of customer relationships, and diversion of management’s attention, and may cause CCEP’s stock price to decline. The risks associated with the integration programme include, among others:
|
•
|
Managing a significantly larger company
|
|
•
|
Coordinating geographically separate organisations
|
|
•
|
The potential diversion of management focus and resources from other strategic opportunities and from operational matters
|
|
•
|
Maintaining employee morale
|
|
•
|
The possibility of assumptions underlying expectations regarding the integration process proving to be incorrect
|
|
•
|
Issues in achieving anticipated operating efficiencies, business opportunities and growth prospects
|
|
•
|
Changes in applicable laws and regulations
|
|
•
|
Changes in tax laws (including under applicable tax treaties) and regulations or to the interpretation of such tax laws or regulations by the governmental authorities
|
|
•
|
Managing costs or inefficiencies associated with integrating the operations of CCEP
|
|
•
|
Unforeseen expenses or delays associated with the integration
|
|
•
|
Industrial action in territories where change is being implemented, our Marseille site, in France, has had strikes and as a result significant work stoppage
|
CCEP may have difficulty attracting, motivating and retaining executives and other key employees.
CCEP’s success depends in part upon its ability to retain people who were key employees of Coca-Cola Enterprises, Inc. (CCE), Coca-Cola Iberian Partners, S.A. (CCIP) and Coca-Cola Erfrischungsgetränke GmbH (CCEG). If there is an unexpected departure of key employees, CCEP’s business may be harmed and the integration may be more difficult. Furthermore, CCEP may have to incur significant costs in identifying, hiring and retaining replacements for departing employees and may lose significant expertise and talent relating to the business, and CCEP’s ability to realise the anticipated benefits of the Merger may be adversely affected. In addition, there could be disruptions to, or distractions for, the workforce and management associated with activities of labour unions or works councils or integrating employees into CCEP. Accordingly, no assurance can be given that CCEP will be able to attract or retain its employees to the same extent that CCE, CCIP and CCEG were able to attract or retain their own employees in the past, or that CCEP will have the benefit of the ongoing employment of current employees following the integration.
|
|
P a g e |
33
|
There are significant costs involved to realise the synergies.
CCEP continues to incur fees and costs related to formulating and implementing integration plans, including facilities and systems’ consolidation costs and employment related costs. CCEP tracks and reports in detail these costs highlighting variances to original plans. The variances to the planned incurrence of these costs may impact CCEP’s business, financial condition and results of operations.
Miscalculation of CCEP’s need for infrastructure investment could impact its financial results.
Projected requirements of CCEP’s infrastructure investments, including cold drink equipment, fleet, technology, and production equipment, may differ from actual levels if CCEP’s volume growth or product demands are not as anticipated. CCEP’s infrastructure investments are anticipated to be long-term in nature, and it is possible that investments may not generate the expected return due to future changes in the marketplace. Significant changes from CCEP’s expected need for and/or returns on these infrastructure investments could adversely affect CCEP’s financial results.
Technology failures could disrupt CCEP’s operations and negatively impact CCEP’s business.
CCEP relies extensively on information technology systems to process, transmit, store and protect electronic information. For example, CCEP’s production and distribution facilities and inventory management all utilise information technology to maximise efficiencies and minimise costs.
Furthermore, a significant portion of the communications between CCEP’s personnel, customers, and suppliers depends on information technology. CCEP’s information technology systems may be vulnerable to a variety of interruptions due to events that may be beyond CCEP’s control including, but not limited to, natural disasters, telecommunications failures, additional security issues, and other technology failures. The technology and information security processes and disaster recovery plans that CCEP have in place may not be adequate or implemented properly to ensure that CCEP’s operations are not disrupted. In addition, a miscalculation of the level of investment needed to ensure CCEP’s technology solutions are current and up to date as technology advances and evolves could result in disruptions in CCEP’s business should the software, hardware, or maintenance of such items become out-of-date or obsolete. Furthermore, when CCEP implements new systems and/or upgrades existing system modules (e.g. SAP), there is a risk that CCEP’s business may be temporarily disrupted during the period of implementation.
Risks Relating to Cyber and Social Engineering Attacks
The occurrence of cyber incidents, or a deficiency in CCEP’s cyber-security, could negatively impact its business by causing a disruption to its operations, a compromise or corruption of its confidential information, and/or damage to its brand image, all of which could negatively impact its financial results.
A cyber incident is considered to be any adverse event that threatens the confidentiality, integrity, or availability of our data or information systems. More specifically, a cyber incident is an intentional attack or an unintentional event that can include gaining unauthorised access to systems to disrupt operations, corrupt data, or steal confidential information through terrorist attacks, computer viruses and hackers. As reliance on technology increases, so will the risks posed to CCEP’s systems, both internal and those it may outsource to a third party provider. CCEP’s three primary risks that could result from the occurrence of a cyber incident include operational interruption, damage to brand image, and private data exposure.
Risks Relating to the Market
CCEP may not be able to respond successfully to changes in the marketplace.
CCEP operates in the highly competitive beverage industry and faces strong competition from other general and speciality beverage companies. CCEP’s response to continued and increased competitor and customer consolidations and marketplace competition may result in lower than expected net pricing of its products.
Changes in CCEP’s relationships with large customers may adversely impact CCEP’s financial results.
A significant amount of CCEP’s volume is sold through large retail chains, including supermarkets and wholesalers, many of which are becoming more consolidated and may, at times, seek to use their purchasing power to improve their profitability through lower prices, increased emphasis on generic and other private label brands, and/or increased promotional programmes. Additionally, competition from hard-discount retailers and online retailers continue to challenge traditional retail outlets, which can increase the pressure on all customer margins, which may then be reflected in pressure on suppliers such as CCEP. In addition, at times, a customer may choose to temporarily stop selling certain CCEP products as a result of a dispute CCEP may be having with that customer. These factors, as well as others, could have a negative impact on the availability of CCEP’s products, as well as its profitability.
|
|
P a g e |
34
|
Risks Relating to Economic and Political Conditions
The deterioration of global and local economic conditions could adversely affect CCEP’s business and/or the market price of the Company’s Shares.
The performance of CCEP is closely linked to the economic cycle in the countries, regions and cities where we operate. Normally, robust economic growth in the areas in which CCEP operates results in greater demand for products, while slow economic growth or economic contraction adversely affects demand for certain products and otherwise adversely affect CCEP’s sales. For example, economic forces may cause consumers to purchase more private label brands, which are generally sold at a price point lower than CCEP’s products, or to defer or forego purchases of beverage products altogether. Additionally, consumers that do purchase CCEP’s products may choose to shift away from purchasing higher margin products and packages. Adverse economic conditions could also increase the likelihood of customer delinquencies and bankruptcies, which would increase the risk of uncollectability of certain accounts. Each of these factors could adversely affect CCEP’s revenue, price realisation, gross margins, and/or CCEP’s overall financial condition and operating results and/or the market price of the Company’s Shares.
Economic growth, globally and in the EU, has recovered since the 2008 financial crisis but concerns remain about future interest rate increases, and there is continuing uncertainty about the ultimate resolution of the Eurozone crisis. Sovereign debt concerns, whether real or perceived, could result in limitation of the availability of capital in impacted territories, which may restrict CCEP’s liquidity and negatively impact its financial results. Continuing disruptions in the global economy and in the global markets may, therefore, have a material adverse effect on CCEP’s business, results of operations and financial condition and/or the market price of the Company’s Shares.
Moreover, even in the absence of a market downturn, CCEP will be exposed to substantial risk stemming from volatility in areas such as consumer spending and capital markets conditions, which affect the business and economic environment and, consequently, may affect the size and profitability of CCEP’s business and/or the market price of the Company’s Shares.
In addition to the international economic situation, political uncertainty could also affect CCEP. Growth of anti EU political parties, as well as emerging political forces in member states of the EU with alternative economic policies and priorities, and concerns about independence movements within the EU, could affect the economic situation in the Eurozone and could have a material adverse effect on CCEP’s business, results of operations, financial condition and cash flows.
Increases in costs, limitation of supplies, or lower than expected quality, of raw materials could harm CCEP’s financial results.
If there are increases in the costs of raw materials, ingredients, or packaging materials, such as aluminium, steel, sugar, PET (plastic), fuel, or other cost items, and CCEP is unable to pass the increased costs on to its customers in the form of higher prices, CCEP’s financial results could be adversely affected. CCEP uses supplier pricing agreements and derivative financial instruments to manage volatility and market risk with respect to certain commodities. Generally, these hedging instruments establish the purchase price for these commodities in advance of the time of delivery. These pricing positions are taken in line with the Board’s agreed risk policy and the impact of these positions are known and forecasted in CCEP’s financial results. This may lock CCEP into prices that are ultimately greater or lower than the actual market price at the time of delivery.
Due to the increased volatility in commodity prices and tightness of the capital and credit markets, certain of CCEP’s suppliers have restricted CCEP’s ability to hedge prices through supplier agreements. As a result, CCEP has expanded, and expects it will continue to expand, its non-designated hedging programmes.
If suppliers of raw materials, ingredients, packaging materials, or other cost items are affected by strikes, adverse weather conditions, speculation, abnormally high demand, governmental controls, new taxes, national emergencies, natural disasters, insolvency, or other events, and CCEP is unable to obtain the materials from an alternate source, CCEP’s cost of sales, revenues, and ability to manufacture and distribute product could be adversely affected.
Additionally, lower than expected quality of delivered raw materials, ingredients, packaging materials, or finished goods could lead to a disruption in CCEP’s operations as CCEP seeks to substitute these items for ones that conform to its established standards or if CCEP is required to replace under-performing suppliers.
Changes in interest rates or CCEP’s debt rating could harm CCEP’s financial results and financial position.
CCEP is subject to interest rate risk, and changes in CCEP’s debt rating could have a material adverse effect on interest costs and debt financing sources. CCEP’s debt rating can be materially influenced by factors, including its financial performance, acquisitions, and investment decisions, as well as capital management activities of The Coca-Cola Company (TCCC) and/or changes in the debt rating of TCCC.
|
|
P a g e |
35
|
Changes in the stability of the euro could significantly impact CCEP’s financial results and ultimately hinder its competitiveness in the marketplace.
There are concerns regarding the short and long-term stability of the euro and its ability to serve as a single currency for a number of individual countries. These concerns could lead individual countries to revert, or threaten to revert, to local currencies, or, in more extreme circumstances, to exit from the EU, and the Eurozone may be dissolved entirely. Should this occur, the assets CCEP holds in a country that reintroduces local currency could be subject to significant changes in value when expressed in euro. Furthermore, the full or partial dissolution of the euro, the exit of one or more EU member states from the EU or the full dissolution of the EU could cause significant volatility and disruption to the global economy, which could impact CCEP’s financial results, including its ability to access capital at acceptable financing costs, the availability of supplies and materials, and the demand for CCEP’s products. Finally, if it becomes necessary for CCEP to conduct its business in additional currencies, it would be subjected to additional earnings volatility as amounts in these currencies are translated into euros.
The UK’s exit from the EU could impact CCEP’s profits.
CCEP faces potential risks associated with the UK’s vote to leave the European Union and its negotiations of the terms of its leaving. This action could materially and adversely affect the operational, regulatory, currency, insurance and tax regime to which CCEP is currently subject. It could also result in prolonged uncertainty regarding aspects of the UK economy and damage customers’ and investors’ confidence. The effect of these risks, were they to materialise, could be to increase operating costs for CCEP, restrict the movement of capital and the mobility of personnel, and may also materially affect CCEP’s tax position or business, results of operation and financial position.
Political instability in Catalonia and Spain could impact CCEP’s operations and profits.
CCEP is exposed to risks associated with political instability in Catalonia and potential impact on the Spanish economy.
In October 2017, the local Catalan government declared unilaterally the independence to initiate the separation from Spain. As a consequence, the central Spanish government has ceased the power of the Catalan government and called for elections in Catalonia in December 2017. The elections were held and as a consequence the parties in favour of the independence will form the government in Catalonia again.
The situation could continue to result in prolonged political, social, economic and operational uncertainty for CCEP, its customers and consumers. Areas with potential impact are tourism, private consumption and regulation.
Although unlikely, activities like strikes and continuous demonstrations could trigger the interruption or delay of CCEP´s production and distribution of products.
Default by or failure of one or more of CCEP’s counterparty financial institutions could cause CCEP to incur losses.
CCEP is exposed to the risk of default by, or failure of, counterparty financial institutions with which it will do business. This risk may be heightened during economic downturns and periods of uncertainty in the financial markets. If one of CCEP’s counterparties were to become insolvent or file for bankruptcy, its ability to recover amounts owed from or held in accounts with such counterparty may be limited. In the event of default by or failure of one or more of its counterparties, CCEP could incur losses, which could negatively impact its results of operations and financial condition.
Risks Relating to the Relationship with TCCC and Other Franchisors
CCEP’s business success, including its financial results, depends upon CCEP’s relationship with TCCC and other franchisors.
More than 90% of our revenue for the year ended 31 December 2017 was derived from the distribution of beverages under agreements with TCCC. We sell, make and distribute products of TCCC through fixed term bottling agreements with TCCC, which typically include the following terms:
|
•
|
CCEP purchases its entire requirement of concentrates and syrups for Coca-Cola trademark beverages (sparkling beverages bearing the trademark “Coca-Cola” or the “Coke” brand name) and allied beverages (beverages of TCCC or its subsidiaries that are sparkling beverages, but not Coca-Cola trademark beverages or energy drinks) from TCCC at prices, terms of payment, and other terms and conditions of supply determined from time to time by TCCC at its sole discretion.
|
|
•
|
There are no limits on the prices that TCCC may charge for concentrate, except TCCC maintains current effective concentrate incidence at the same levels that CCE, CCIP and CCEG had in place before the Merger, provided certain specific mutually agreed metrics are achieved.
|
|
•
|
Much of the marketing and promotional support that CCEP receives from TCCC is at TCCC’s discretion. Programmes may contain requirements, or be subject to conditions, established by TCCC that CCEP may not be able to achieve or satisfy. The terms of most of the marketing programmes do not and will not contain an express obligation for TCCC to participate in future programmes or continue past levels of payments into the future.
|
|
|
P a g e |
36
|
|
•
|
CCEP’s bottling agreements with TCCC are for fixed terms, and most of them are renewable only at the discretion of TCCC at the conclusion of their terms. A decision by TCCC not to renew a fixed term bottling agreement at the end of its term could substantially and adversely affect CCEP’s financial results.
|
|
•
|
CCEP is obligated to maintain sound financial capacity to perform its duties, as required and determined by TCCC at its sole discretion. These duties include, but are not limited to, making certain investments in marketing activities to stimulate the demand for products in CCEP’s territories and making infrastructure improvements to ensure CCEP’s facilities and distribution network are capable of handling the demand for these beverages.
|
Disagreements with TCCC concerning business issues may lead TCCC to act adversely to CCEP’s interests with respect to the relationships described above.
Risks Relating to Product Quality
If CCEP, TCCC or other licensors and bottlers of products CCEP distributes are unable to maintain a positive brand image or if product liability claims or product recalls are brought against CCEP, TCCC, or other licensors and bottlers of products CCEP distributes, CCEP’s business, financial results, and brand image may be negatively affected.
CCEP’s success will depend on its, TCCC’s and other licensors’ products having a positive brand image with customers and consumers. Product quality issues, real or perceived, or allegations of product contamination, even if false or unfounded, could tarnish the image of the affected brands and cause customers and consumers to choose other products. CCEP could be liable if the consumption of its products causes injury or illness. CCEP could also be required to recall products if they become or are perceived to become contaminated or are damaged or mislabelled. A significant product liability or other product related legal judgement against CCEP or a widespread recall of its products could negatively impact CCEP’s business, financial results, and brand image.
Additionally, adverse publicity surrounding health and wellness concerns, water usage, customer disputes, labour relations, product ingredients, packaging recovery and the environmental impact of products could negatively affect CCEP’s overall reputation and its products’ acceptance by its customers and consumers, even when the publicity results from actions occurring outside CCEP’s territory or control. Similarly, if product quality related issues arise from products not manufactured by CCEP but imported into a CCEP territory, CCEP’s reputation and consumer goodwill could be damaged.
Furthermore, through the increased use of social media, individuals and Non-Governmental Organisations will have the ability to disseminate their opinions regarding the safety or healthiness of CCEP’s products or CCEP’s financial or tax position to an increasingly wide audience at a faster pace. CCEP’s failure to effectively respond to any negative opinions in a timely manner could harm the perception of its brands and damage its reputation, regardless of the validity of the statements.
Other Risks
CCEP’s business is vulnerable to products being imported from outside its territories, which adversely affect CCEP’s sales.
The territories in which CCEP operates are susceptible to the import of products manufactured by bottlers from countries outside CCEP’s territories where prices and costs are lower. In the case of such imports from members of the European Economic Area (EEA), CCEP will generally be prohibited from taking actions to stop such imports.
Adverse weather conditions could limit the demand for CCEP’s products.
CCEP’s sales are significantly influenced by weather conditions in the markets in which CCEP operates. In particular, due to the seasonality of CCEP’s business, cold or wet weather during the summer months may have a negative impact on the demand for CCEP’s products and contribute to lower sales, which could have an adverse effect on CCEP’s financial results.
Global or regional catastrophic events could impact CCEP’s business and financial results.
CCEP’s business may be affected by major natural disasters, large scale terrorist acts, especially those occurring in CCEP’s territories or other major industrialised countries, loss of key employees, the outbreak or escalation of armed hostilities or widespread outbreaks of infectious disease. Such events in the geographic regions in which CCEP does business could have a material impact on CCEP’s sales volume, cost of sales, earnings, and overall financial condition.
Legal judgements obtained, or claims made, against CCEP’s vendors or suppliers could impact their ability to provide CCEP with agreed upon products and services, which could negatively impact CCEP’s business and financial results.
Many of CCEP’s outside vendors will supply services, information, processes, software, or other deliverables that rely on certain intellectual property rights or other proprietary information. To the extent these vendors face legal claims brought by other third parties challenging those rights or information, CCEP’s vendors could be required to pay significant settlements or even discontinue use of the deliverables furnished to CCEP. These outcomes could require CCEP to change vendors or develop replacement solutions, which could result in significant inefficiencies within CCEP’s business, or higher costs, and ultimately could negatively impact CCEP’s financial results.
|
|
P a g e |
37
|
Litigation or legal proceedings could expose us to significant liabilities and damage our reputation.
CCEP is a party to various litigation claims and legal proceedings. It evaluates these litigation claims and legal proceedings to assess the likelihood of unfavourable outcomes and to estimate, if possible, the amount of potential losses. Based on these assessments and estimates, CCEP establishes reserves and/or discloses the relevant litigation claims or legal proceedings, as appropriate. These assessments and estimates are based on the information available to management at the time and involve a significant amount of management judgement. As a result, actual outcomes or losses may differ materially from those envisioned by management’s current assessments and estimates. In addition, CCEP has bottling and other business operations in markets with strong legal compliance environments. CCEP’s policies and procedures require strict compliance with all laws and regulations applicable to its business operations, including those prohibiting improper payments to government officials. Those policies are supported by leadership and tone from the top, a compliance culture and training. Nonetheless, CCEP cannot guarantee that its policies, procedures and related training programmes will always ensure full compliance by its personnel with all applicable legal requirements. Improper conduct by CCEP’s personnel could damage its reputation or lead to litigation or legal proceedings that could result in civil or criminal penalties, including substantial monetary fines as well as disgorgement of profits.
Increases in the cost of employee benefits, including pension retirement benefits, could impact CCEP’s financial results and cash flow.
Unfavourable changes in the cost of CCEP’s employee benefits, including pension retirement benefits and employee healthcare, could materially impact CCEP’s financial condition or results of operations. CCEP sponsors a number of defined benefit pension plans. Estimates of the amount and timing of CCEP’s future funding obligations for defined benefit pension plans are based upon various assumptions, including discount rates, mortality assumptions and long-term asset returns. In addition, the amount and timing of pension funding can be influenced by funding requirements, negotiations with pension trustee boards or action of other governing bodies.
If CCEP is unable to renew existing labour bargaining agreements on satisfactory terms, if CCEP experiences employee strikes or work stoppages, or if changes are made to employment laws or regulations, CCEP’s business and financial results could be negatively impacted.
The majority of CCEP’s employees are covered by collectively bargained labour agreements in the countries in which it currently operates. Most of these agreements do not expire. However, wage rates must be renegotiated at various dates through 2018. CCEP currently believes that it will be able to renegotiate subsequent agreements on satisfactory terms.
If CCEP is unable to maintain labour bargaining agreements on satisfactory terms, or if it experiences major employee strikes or work stoppages, or if changes are made to employment laws or regulations, its financial results could be negatively impacted. The terms and conditions of existing or renegotiated agreements could also increase the cost to CCEP of fully implementing any operations changes, or otherwise affect its ability to do so.
In the last three years, CCEP’s operations in Spain have experienced labour unrest and work stoppages that have had a negative impact on its operations. After a long legal process, the matter is now closed from a legal perspective. There are still some small labour unrests but they are generally limited only to the Fuenlabrada site.
The maintenance of multiple exchange listings may adversely affect liquidity in the market for the Company’s Shares.
The multiple listings of the Shares on the New York Stock Exchange, Euronext Amsterdam and Euronext London and on the Spanish Stock Exchanges may split trading between exchanges, which may adversely affect the liquidity of the shares in one or more markets.
|
|
P a g e |
38
|
TCCC and Olive Partners, S.A. (Olive Partners) hold a significant interest in CCEP and their interests may differ from or conflict with those of CCEP’s public shareholders.
Approximately 18% and 34% of the Company’s Shares are owned by European Refreshments (a wholly-owned subsidiary of TCCC) and Olive Partners respectively, and each of TCCC and Olive Partners possesses sufficient voting power to have a significant influence over all matters requiring shareholder approval. As a result, the Company’s public shareholders have more limited influence over matters presented to the Company’s shareholders for approval, including, subject to the Articles of Association of the Company and the Shareholders’ Agreement, election and removal of directors, and change in control transactions. The interests of TCCC and/or Olive Partners may not always align with the interests of other CCEP shareholders. If the shares owned by European Refreshments and Olive Partners were voted in the same manner on any shareholder proposal, they would control the outcome on any proposal that requires a simple majority vote of the Company’s shareholders and, whether or not they vote in the same manner on a shareholder proposal, other shareholders will have more limited influence over proposals that require a shareholder vote and proposals that require approval of Board members appointed under the terms of the Shareholders’ Agreement. A majority of the members of the Board are independent and the Board understands its duties to all shareholders.
|
|
P a g e |
39
|
VIABILITY STATEMENT
In accordance with provision C2.2 of the UK Corporate Governance Code (the Code), the Directors assessed the viability of the Group over a period of three years, which corresponds to the Group’s long-range planning cycle.
The assessment conducted considered the Group’s prospects related to revenue, operating profit, EBITDA, and free cash flow. The Directors considered the maturity dates for the Group’s debt obligations and its access to public and private debt markets, including its committed multi-currency credit facility. The Directors also carried out a robust review and analysis of the principal risks facing the Group including those risks that could materially and adversely affect the Group’s business model, future performance, solvency, and liquidity.
Stress testing was performed on a number of scenarios including different estimates for operating income and free cash flow. Among other considerations, these scenarios incorporated the potential downside impact of the Group’s principal risks including those related to:
|
•
|
Changing consumer preferences and the health impact of soft drinks
|
|
•
|
Regulatory intervention such as sugar taxes
|
|
•
|
The risk of a significant product quality issue or recall
|
|
•
|
The Group’s ability to successfully integrate and deliver synergy savings
|
Based on the Group’s current financial position, stable cash generation, and access to liquidity, the Directors concluded that the Group is well positioned effectively to manage its principal risk and potential downside impact of such risk materialising to ensure solvency and liquidity over the assessment period. From a qualitative perspective, the Directors also took into consideration the Group’s past experience of managing through adverse conditions and the Group’s strong relationship and position within the Coca-Cola system. The Directors considered the extreme measures the Group could take in the event of crisis including decreasing or stopping non-essential capital investment, decreasing or stopping shareholder dividends, renegotiating commercial terms with customers and suppliers or selling non-essential assets.
Based upon the assessment performed, the Directors confirm that they have a reasonable expectation the Group will be able to continue in operation and meet all its liabilities as they fall due over the three year period covered by this assessment.


|
|
P a g e |
42
|
CHAIRMAN’S INTRODUCTION
I am pleased to present our Governance and Directors’ Report for 2017.
I strongly believe that a robust governance framework is essential to managing a business successfully and your Board is committed to complying with the high standards of corporate governance set out in the UK Corporate Governance Code (the Code). This report explains how Coca-Cola European Partners (CCEP) applies the principles of the Code.
Your Board
As Chairman of the Board, it is my responsibility to lead and create conditions for the Board and its Committees to be effective. I consider self-assessment to be essential to this process, both in building an effective Board that works well together, and to draw the best from each Director.
Our first effectiveness review took place in March 2017 and, led by Tom Johnson, our Senior Independent Director, the Directors readily participated in an open and constructive dialogue focusing on how the Directors work together, identifying ways to improve the Board’s performance and key goals for the future.
The Directors were very much aligned in their assessment last year. They agreed that very good progress had been made in bringing together the directors from three organisations with the two additional Independent Non-executive Directors (INEDs) into a well-functioning single Board. You can read more about the results of the Board assessment in the Corporate Governance Report on pages 60 to 61.
We have asked an independent, external facilitator to assist us with the 2018 effectiveness review and intend to do so again at least every three years in future.
With the help of the Company Secretary, we kept a keen focus on what is important, making effective use of Board Committees and pre-read materials in order to maximise the Directors’ discussion time in Board meetings. In addition, I ensure each Director is able to voice their views. Harnessing the cognitive diversity of the Directors results in better decisions.
While still a relatively new Board, it is clear that there is genuine respect between the Directors, helping the Board to find an effective way of working together faster than expected, enabling the Board rapidly to become efficient and effective.
Governance in practice
During the year, the Board worked hard in finalising a clear strategy aligned to CCEP’s business model, underpinned by strong business plans and a rapid transformation programme. The Board also maintained focus on good governance and the management or mitigation of risks to ensure delivery of value to our shareholders.
The Directors held an off-site strategy session in July 2017 when they assessed the longer term enterprise level strategy as well as scrutinising and debating more detailed proposals for the near term. Damian Gammell, our Chief Executive Officer, discusses the key growth imperatives which resulted from these discussions on pages 8 to 9 and there is further detail about our Group strategy in the Strategy section on page 10.
The Board believes long-term sustainability is essential to our business and agreed a long-term sustainability action plan, This is Forward, outlined on pages 22 to 25.
We also approved CCEP’s Remuneration Policy, a summary of which is set out on page 76, set ourselves targets to drive talent and diversity and rolled out CCEP’s new purpose and culture initiative, which I discuss further below.
As well as focusing on strategy, the Board also ensured that the structures and frameworks introduced last year were strengthened and tested and developed practices to comply with new legislative and regulatory requirements. These included our statement of compliance with the UK’s Modern Slavery Act 2015, adoption of CCEP’s Code of Conduct, the Group’s tax strategy and our statement on gender pay, all of which may be viewed on our website www.ccep.com.
Within the organisation, we have
tested and improved our enterprise risk management programme, agreed Group policies, reviewed and monitored practices relating to the health and safety of our people, identified our stakeholders and, in particular, considered the right way to ensure the voice of our people is heard by the Board.
We continue to strengthen our corporate governance but are pleased that our efforts in putting a robust governance framework in place were recognised by the Institute of Chartered Secretaries & Administrators at the end of 2017.
Succession
During the year, there was a possibility that we might need to find a replacement for one of our INEDs and we engaged JCA, external recruitment consultants, to identify a pool of potential candidates. With the assistance of the Company Secretary and the Nomination Committee, we will use an agreed skills matrix for the Board evaluation in 2018 to underpin our succession planning. The skills matrix will be reviewed annually.
We are also building a strong internal and external pipeline to ensure effective succession management for our most critical leadership positions, by mapping candidates against our success profile and undertaking detailed reviews of the suitability, readiness and development required for internal candidates for both the CEO and Executive Leadership Team (ELT) roles. We have selected Korn Ferry to support us with this initiative.
|
|
P a g e |
43
|
Culture
We aim to grow our business by understanding our customers better and by enabling our people to execute new ideas to increase performance and engagement.
We plan to do this by creating an inclusive culture to attract, motivate and retain a highly diverse workforce reflective of the communities we operate in, while enabling our people to reach their full potential to achieve the best results. With this aim in mind, we rolled out the Accelerate Performance programme to the top 500 leaders of the Group. The programme emphasises the importance of aligning culture to the Company’s purpose and embedding a passion for delivering growth. Participants are briefed on the Company’s strategy and the behaviours required to develop the desired culture. We are also galvanising our leaders to action, supported by awareness and capability training, as well as strong internal engagement.
Diversity
Our customers, employees and other stakeholders represent a cross section of the communities in which we operate and are infinitely varied. As a result, the Board was deliberately formed of individuals with diversity of thought and perspectives, as well as a broad range of capabilities and experience identified as prerequisites for their roles. Please see page 44 for details.
The Board has spent time considering with management how best to drive an inclusive culture and the appropriate targets to encourage diversity. Our ultimate goal for gender diversity is gender parity. As an interim target to achieving this goal, we intend to have women make up 33% of the Board by 2020. We also intend that by 2025 women should represent 40% of our senior managers, compared to 32.6% at the end of 2017. To achieve these ambitious targets, we are promoting a diverse and inclusive culture throughout the organisation.
Stakeholders
CCEP’s wider societal responsibilities mean it is attentive to a broad set of stakeholders. The Board regularly considers views of key stakeholders and encourages the development of strong relationships with them. We consider this to be important to maintaining our licence to operate.
The Board ensures that, both directly and through its Committees, it is aware of the position of relevant stakeholders.
“I strongly believe that a robust governance framework is essential to managing a business successfully”
Please refer to www.ccep.com to understand the ways in which we communicate with our stakeholders and for details of initiatives being undertaken to meet our corporate responsibilities.
Outlook
Looking ahead to 2018, your Board will monitor changes in corporate governance requirements and consider how to improve our governance for the benefit of CCEP and its stakeholders.
Sol Daurella
Chairman
15 March 2018

|
|
P a g e |
44
|
Board of Directors
DIVERSE, EXPERIENCED AND KNOWLEDGEABLE
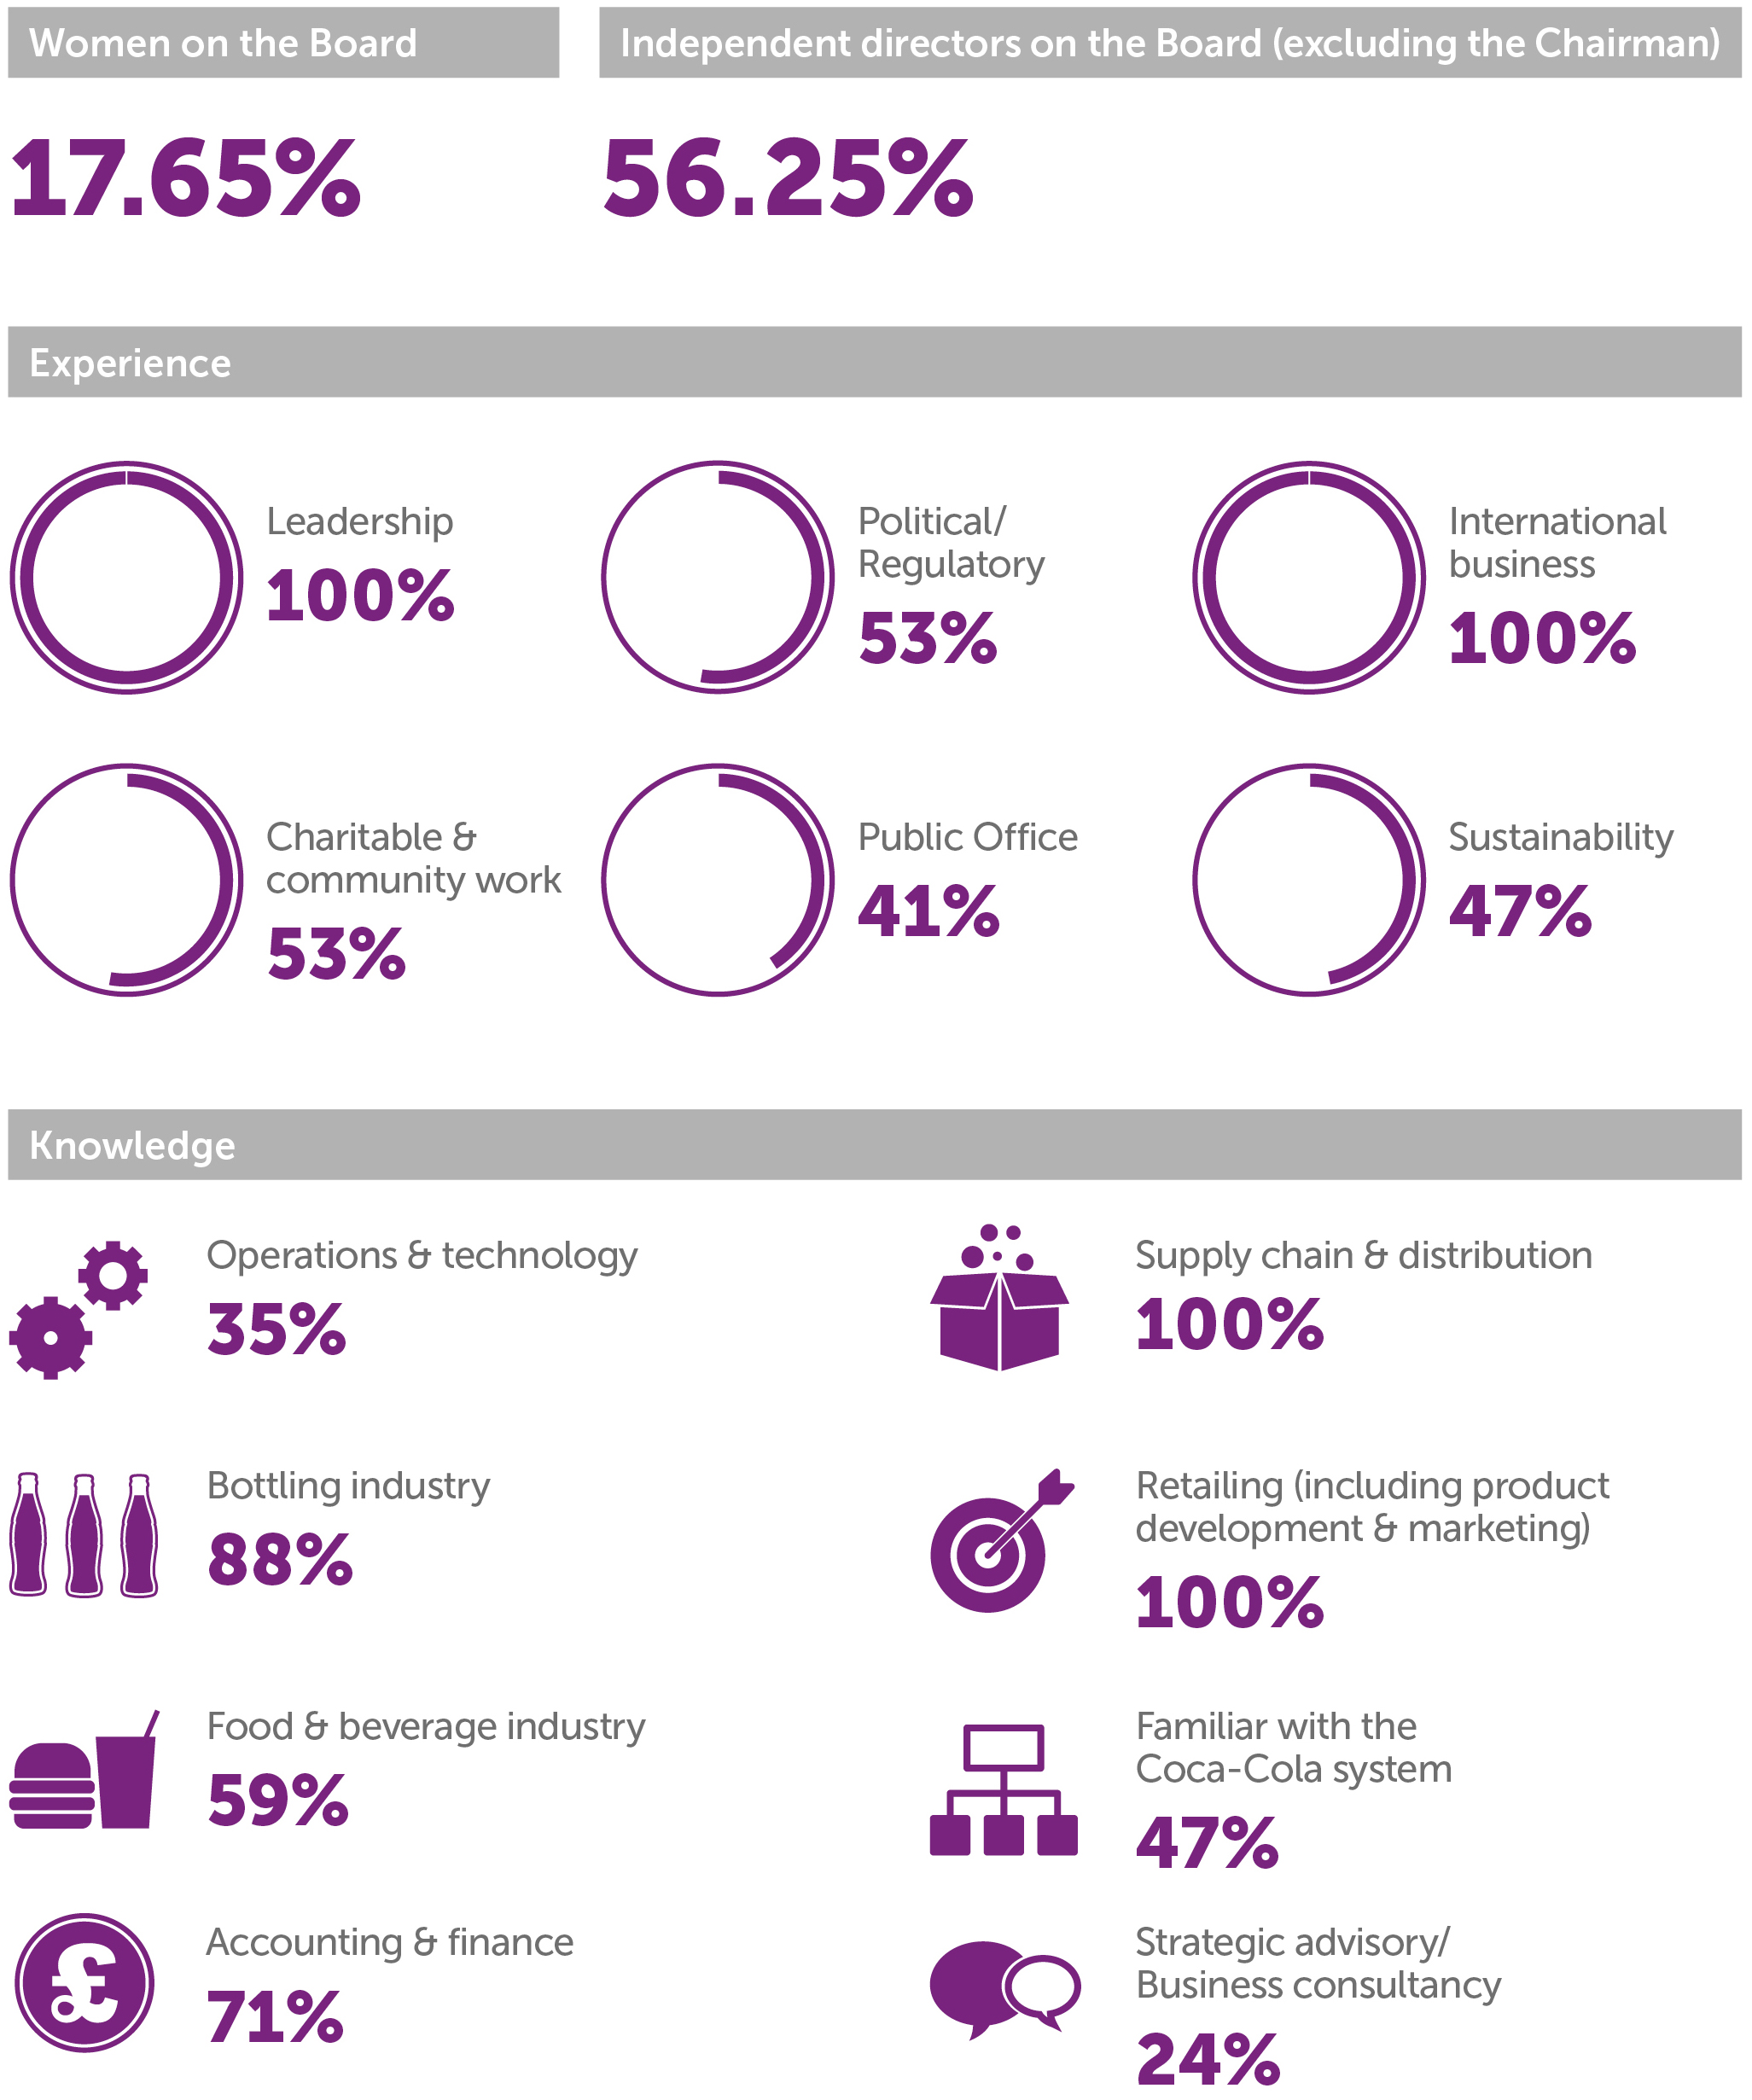
|
|
P a g e |
45
|
DIRECTORS’ BIOGRAPHIES

|

|
|
Sol Daurella
Chairman
N
Member
AT
Member
|
Damian Gammell
Chief Executive Officer
|
|
Date appointed to the Board:
May 2016
|
Date appointed to the Board:
December 2016
|
|
Independent:
No
|
Independent:
No
|
|
Key strengths/experience:
•
Experienced director of public companies operating in an international environment
•
A deep understanding of FMCG and our markets
•
Extensive experience at Coca-Cola bottling companies
•
Strong international strategic and commercial skills
|
Key strengths/experience:
•
Strategy development and execution experience
•
Vision, customer focus and transformational leadership
•
Developing people and teams
•
25 years of leadership experience and in-depth understanding of the NARTD industry and within the Coca-Cola system
|
|
Key external commitments:
Co-Chairman and member of the Executive Committee of Cobega, S.A., Executive Chairman of Olive Partners, S.A., Co-Chairman of Grupo Cacaolat, S.L., director of Equatorial Bottling Company, S.L., director and a member of the Appointments and Remuneration Committees of Banco Santander
|
Key external commitments:
None
|
|
Previous roles:
Various roles at the Daurella family’s Coca-Cola bottling business, director of Banco de Sabadell, Ebro Foods and Acciona
|
Previous roles:
A number of senior executive roles in the Coca-Cola system, also Managing Director and Group President of Efes Soft Drinks, and President and CEO of Anadolu Efes S.K.
|
Full biographies are available on ccep.com
|
Key
|
|
|
Affiliated Transaction Committee
|
AT
|
|
Audit Committee
|
A
|
|
Corporate Social Responsibility Committee
|
C
|
|
Nomination Committee
|
N
|
|
Remuneration Committee
|
R
|
|
Committee Chairman
|
|
|
|
P a g e |
46
|

|

|
|
Jan Bennink
Non-executive Director
AT
Chairman
N
Member
|
José Ignacio Comenge Sánchez-Real
Non-executive Director
AT
Member
|
|
Date appointed to the Board:
May 2016
|
Date appointed to the Board:
May 2016
|
|
Independent:
Yes
|
Independent:
No
|
|
Key strengths/experience:
•
Chairman/CEO of multinational public companies
•
Extensive experience in FMCG, including the food and beverage industry
•
Thorough understanding of global and Western European markets
•
Strong strategic, marketing and sales experience relevant to the beverage industry
|
Key strengths/experience:
•
Extensive experience of the Coca-Cola system
•
Broad board experience across industries and sectors
•
Knowledgeable about the industry in our key market of Iberia
•
Insights in formulating strategy drawn from leadership roles in varied sectors
|
|
Key external commitments:
None
|
Key external commitments:
Director of Olive Partners, S.A., ENCE Energía y Celulosa, S.A., Companía Vinícola del Norte de Espana, S.A., Ebro Foods S.A., Barbosa & Almeida SGPS, S.A., Azora, S.A., Mendibea 2002, S.L. and Rexam Beverage Can Iberica, S.L.
|
|
Previous roles:
CEO of Royal Numico N.V., Executive Chairman of Sara Lee Corporation, Chairman and CEO of DE Masterblenders 1753 N.V., director of Boots Company plc, Dalli-Werke GmbH & Co KG and Kraft Foods Inc. and a member of the Advisory Board of ABN Amro Bank
|
Previous roles:
Senior roles in the Coca-Cola system, AXA, S.A., Aguila and Heineken Spain, Vice-Chairman and CEO of MMA Insurance
|

|

|
|
Francisco Crespo Benítez
Non-executive Director
C
Member
|
Christine Cross
Non-executive Director
A
Member
R
Chairman
|
|
Date appointed to the Board:
March 2018
|
Date appointed to the Board:
May 2016
|
|
Independent:
No
|
Independent:
Yes
|
|
Key strengths/experience:
•
Extensive experience of working in the Coca-Cola system
•
Deep understanding of integrated global marketing and corporate strategy
•
Proven track record of leading customer and commercial teams
•
Possesses a strong network at The Coca-Cola Company (TCCC)
|
Key strengths/experience:
•
In-depth experience working in the food and beverage industry
•
Consults on international business strategy, marketing and business development
•
Global perspective on CCEP’s activities
•
Experience of chairing remuneration committees
|
|
Key external commitments:
Senior Vice President and Chief Growth Officer of TCCC
|
Key external commitments:
Director of Christine Cross Ltd, Sonae - SGPS, S.A., Hilton Food Group plc, Pollen Estate and Fenwick Limited
|
|
Previous roles:
Involvement with Coca-Cola system throughout his career, including as President of TCCC’s Mexico and South Latin business units, President of the Coca-Cola Foundation in Chile, Director and Vice President respectively of the American Chambers in Chile and Argentina, and also served on the boards of Zurich and Zurich Compañía de Seguros, S.A. in Mexico.
|
Previous roles:
Director of Brambles Limited, Kathmandu Holdings Limited,
Tesco PLC, Next plc, Woolworths (Au) plc, Sobeys (Ca) plc, Plantasgen, Fairmont Hotels Group plc, Premier Foods plc, Taylor Wimpey plc
|
|
|
P a g e |
47
|

|

|
|
Javier Ferrán
Non-executive Director
A
Member
AT
Member
|
Irial Finan
Non-executive Director
N
Member
R
Member
|
|
Date appointed to the Board:
May 2016
|
Date appointed to the Board:
April 2016
|
|
Independent:
Yes
|
Independent:
No
|
|
Key strengths/experience:
•
Extensive experience in consumer brands and sales and marketing within the beverage industry
•
Broad strategic understanding of the sector
•
Deep experience of international commercial matters
•
Financial and operational background
|
Key strengths experience:
•
Extensive international management experience
•
Strong track record of growing businesses
•
Extensive experience of working in the Coca-Cola system
•
International strategy
•
Possesses a strong network at TCCC
|
|
Key external commitments:
Partner at Lion Capital LLP, Chairman of Diageo plc and director of Associated British Foods plc
|
Key external commitments:
Director Coca-Cola Bottlers Japan Inc. and the Smurfit Kappa Group plc
|
|
Previous roles:
President and CEO of Bacardi Limited and director of SABMiller plc, William Grant & Sons Ltd and Desigual, S.L.U.
|
Previous roles:
Director and senior roles in the Coca-Cola system throughout his career including as CEO of Coca-Cola HBC AG, President of Bottling Investments Group, Executive Vice President of TCCC and director of Coca-Cola FEMSA and G2G Trading
|

|

|
|
Álvaro Gómez-Trénor Aguilar
Non-executive Director
|
L. Phillip Humann
Non-executive Director
N
Chairman
|
|
Date appointed to the Board:
March 2018
|
Date appointed to the Board:
May 2016
|
|
Independent:
No
|
Independent:
Yes
|
|
Key strengths/experience:
•
Broad knowledge of working in the food and beverage industry
•
Extensive understanding of the Coca-Cola system, particularly in Iberia
•
Expertise in finance and investment banking
•
Strategic and investment advisor to businesses in varied sectors
|
Key strengths/experience:
•
Extensive experience as a director of major companies both within and outside the Coca-Cola system
•
Expertise in banking and finance
•
Leadership and consensus-building skills
•
Understanding of the consumer goods and services industries
|
|
Key external commitments:
Director of Olive Partners, S.A., Global Omnium (Aguas de Valencia, S.A.) and Sinensis Seed Capital SCR de RC, S.A.
|
Key external commitments:
Equifax Inc., and Haverty Furniture Companies, Inc.
|
|
Previous roles:
Various board appointments in the Coca-Cola system, including as President of Begano, S.A., director and chairman of the audit committee of Coca-Cola Iberian Partners, S.A., as well as key executive roles in Grupo Pas and Garcon Vallvé & Contreras
|
Previous roles:
Director of Coca-Cola Enterprises, Inc. and Chairman of the Board of SunTrust Banks, Inc.
|
|
|
P a g e |
48
|

|

|
|
Orrin H. Ingram II
Non-executive Director
A
Member
N
Member
|
Thomas H. Johnson
Non-executive Director and Senior Independent Director
C
Member
R
Member
|
|
Date appointed to the Board:
May 2016
|
Date appointed to the Board:
May 2016
|
|
Independent:
Yes
|
Independent:
Yes
|
|
Key strengths/experience:
•
Executive experience in the wholesale, distribution, consumer goods and transportation services industries
•
A broad perspective on CCEP’s operations
•
Former director of a global distributor
•
Strong strategic understanding
|
Key strengths/experience:
•
Chair and CEO of international public companies
•
Manufacturing and distribution expertise
•
Extensive international management experience in Europe
•
Investment experience
|
|
Key external commitments:
President and Chief Executive Officer of Ingram Industries Inc. and Ingram Marine Group
|
Key external commitments:
Chief Executive Officer of the Taffrail Group, LLP and director of Universal Corporation
|
|
Previous roles:
Various positions with Ingram Materials Company, Ingram Barge Company and Co-President of Ingram Industries, a director of Ingram Micro Inc. and Coca-Cola Enterprises, Inc. and FirstBank
|
Previous roles:
Chairman and CEO of Chesapeake Corporation, director of
Coca-Cola Enterprises, Inc., GenOn Corporation, Mirant Corporation, ModusLink Global Solutions, Inc., Superior Essex Inc. and Tumi, Inc.
|

|

|
|
Alfonso Líbano Daurella
Non-executive Director
C
Chairman
|
Véronique Morali
Non-executive Director
A
Member
C
Member
|
|
Date appointed to the Board:
May 2016
|
Date appointed to the Board:
May 2016
|
|
Independent:
No
|
Independent:
Yes
|
|
Key strengths/experience:
•
Developed the Daurella family’s association with the Coca-Cola system
•
Detailed knowledge of the Coca-Cola system
•
Insight to CCEP’s impact on communities from experience as trustee or director of charitable and public organisations
•
Experienced corporate social responsibility committee chair
|
Key strengths/experience:
•
Commercial, governmental and political insights, including in France where CCEP has significant operations
•
Extensive international financial services experience
•
Proven commitment to the diversity agenda
|
|
Key external commitments:
Co-Vice Chairman and member of the Executive Committee of Cobega, S.A., director of Olive Partners, S.A. and Cobega Invest, S.L., Chairman of Equatorial Coca-Cola Bottling Company, S.L., Daba, S.A., Grupo Cacaolat, S.L., Vice-Chairman of MECC Soft Drinks DMCC and President of GEEF European Family Business
|
Key external commitments:
Chairman of Fimalac Développement, Chief Officer of WEBEDIA, director and Vice-Chairman of the Fitch Group, Inc., director of Publicis Groupe and the Rothschild Group
|
|
Previous roles:
Various roles at the Daurella family’s Coca-Cola bottling business, Director and Chairman of the Quality & CRS Committee of Coca-Cola Iberian Partners, S.A., a member of the Board of the American Chamber of Commerce in Spain
|
Previous roles:
Director of Coca-Cola Enterprises, Inc., CEO of Alcatel-Lucent, director of SNCF and Tesco PLC, Inspector General of the Ministry of Finance of the French Civil Service
|
|
|
P a g e |
49
|

|

|
|
Mario Rotllant Solá
Non-executive Director
R
Member
|
Garry Watts
Non-executive Director
A
Chairman
R
Member
|
|
Date appointed to the Board:
May 2016
|
Date appointed to the Board:
April 2016
|
|
Independent:
No
|
Independent:
Yes
|
|
Key strengths/experience:
•
Deep understanding of the Coca-Cola system
•
Extensive international experience in the food and beverage industry
•
Experience of dealing with regulatory and political bodies
•
Experience of chairing a remuneration committee
|
Key strengths/experience:
•
Extensive business experience in Western Europe and the UK
•
Served as executive and non-executive director in a broad variety of sectors
•
Financial expertise, experience and skills
•
Previously chaired the audit committee of a sizeable company
|
|
Key external commitments:
Vice-Chairman of Olive Partners, S.A., Co-Chairman and member of the Executive Committee of Cobega, S.A., Chairman of the North Africa Bottling Company, Chairman of the Advisory Board of Banco Santander, S.A. in Catalonia and a director of Equatorial Coca-Cola Bottling Company, S.L. and Copesco Sefrisa
|
Key external commitments:
Chairman of Spire Healthcare Group plc, BTG plc and Foxtons Group plc
|
|
Previous roles:
Second Vice-Chairman and member of the Executive Committee and Chairman of the Appointment & Remuneration Committee of
Coca-Cola Iberian Partners, S.A.
|
Previous roles:
Audit partner at KPMG LLP, CFO of Medeva plc, CEO of SSL International, director of Coca-Cola Enterprises, Inc., Deputy Chairman and Audit Committee Chairman of Stagecoach Group plc
|

|
Other Board members during the year were:
Francisco Ruiz de la Torre Esporrín, resigned on 7 March 2018
J. Alexander (Sandy) M. Douglas Jr, resigned on 7 March 2018
|
|
Curtis R. Welling
Non-executive Director
AT
Member
C
Member
|
|
|
Date appointed to the Board:
May 2016
|
|
|
Independent:
Yes
|
|
|
Key strengths/experience:
•
Finance and business leadership skills
•
Skilled evaluator of business performance and plans
•
Experience of the financial services and securities industries
•
Perspective on the impact of CCEP’s business on communities
|
|
|
Key external commitments:
Director of Apjet and a member of the faculty of Dartmouth College’s Amos Tuck School of Business
|
|
|
Previous roles:
Director of Sapient Corporation, President and CEO of AmeriCares Foundation, CEO of Princeton eCom Corporation, SG Cowen Securities Corporation and a director of Coca-Cola Enterprises, Inc.
|
|
|
|
P a g e |
50
|
SENIOR MANAGEMENT
The senior management plus Damian Gammell constitute the members of the Executive Leadership Team (ELT). Full biographies are available on ccep.com.
|
Nik Jhangiani
Chief Financial Officer
Appointed in May 2016
|
Ron Lewis
Chief Supply Chain Officer
Appointed May 2016
|
|
Nik has more than 25 years of finance experience, including 17 years within the Coca‑Cola system, latterly as Senior Vice President and CFO for Coca-Cola Enterprises, Inc.. Nik started his career in New York at accountancy firm Deloitte & Touche before spending two years at Bristol-Myers Squibb as International Senior Internal Auditor. He then joined the Colgate-Palmolive Company in New York where he was appointed Group Financial Director for the Nigerian operations, before moving to The Coca-Cola Company (TCCC) in Atlanta. He is a CPA.
|
Ron is an experienced supply chain leader who leads the end to end supply chain for CCEP. He is familiar with the Coca-Cola system, having served in a number of supply chain and procurement roles, including Vice President and Chief Procurement Officer for Coca-Cola Enterprises, Inc.. He has also served as a director of ZICO, and Southeastern Containers. Previously, Ron worked for Mars Inc. and Cargill Inc.
|
|
Clare Wardle
General Counsel and Company Secretary
Appointed July 2016
|
Lauren Sayeski
Chief Public Affairs and Communications Officer
Appointed May 2016
|
|
Clare leads Legal, Risk, Compliance, Security and Company Secretariat. Prior to joining Coca-Cola European Partners (CCEP), she was Group General Counsel at Kingfisher plc, Commercial Director, General Counsel and Company Secretary at Tube Lines and held senior roles at the Royal Mail Group. She began her career as a barrister before moving to Hogan Lovells. Clare is non-executive chairman of Basketball England, and a director of Lee/Fitzgerald Architects and Modern Pentathlon GB.
|
Lauren leads CCEP’s strategic engagement with media, policymakers, civil society and community stakeholders. Lauren has worked in the Coca-Cola system for over 12 years in roles across the spectrum of public affairs and communications. She has served on transaction teams for the 2010 sale of Coca-Cola Enterprises’ North American operations to TCCC and, most recently, on the Merger to create CCEP.
|
|
Peter Brickley
Chief Information Officer
Appointed November 2016
|
Victor Rufart
Chief Strategy Officer
Appointed October 2016
|
|
Peter leads the business solutions, support services and technology infrastructure at CCEP, including steering CCEP’s investments in technology solutions. Peter has over 20 years’ experience leading technology for global businesses including Heineken, Centrica and BAT. More recently, he was Global CIO and Managing Director of Global Business Services at SABMiller. Peter is also non-executive chairman of Newbury Building Society.
|
Victor leads business strategy, integration management and business transformation. Prior to joining CCEP, he was CEO of Coca-Cola Iberian Partners, S.A. and spent 25 years at Cobega, S.A.. While with Cobega, S.A., he held a number of senior roles including Director of New Business, Head of Finance, advisor in the formation of the Equatorial Coca‑Cola Bottling Company and Head of Tax Planning.
|
|
Nick Wall
Chief Human Resources Officer
Appointed May 2017
|
Francesc Cosano
General Manager, Iberian Business Unit
Appointed May 2016
|
|
Nick heads CCEP’s HR function, having previously worked within the Coca-Cola system for 30 years, including several international positions. Nick was most recently Senior Vice President of HR for TCCC’s Bottling Investment Group. He started his career with TCCC in Ireland and has since worked for TCCC in HR leadership roles in bottling, concentrate operations, business units and corporate offices. Prior to joining TCCC, he was with Pfizer Inc, in Ireland.
|
Francesc leads CCEP’s Business Unit in Spain, Portugal and Andorra. He was previously Operations Director then Managing Director of Coca-Cola Iberian Partners, S.A.. He has been part of the Coca-Cola system for 30 years, in a number of sales management positions and ultimately as Sales Director then Deputy General Manager. He has also worked as Regional Director for the Leche Pascual, S.A. group, in Anglo Española de Distribución, S.A..
|
|
Leendert den Hollander
General Manager, Great Britain Business Unit
Appointed May 2016
|
Ben Lambrecht
General Manager, France Business Unit
Appointed May 2016
|
|
Leendert is responsible for CCEP’s Business Unit in Great Britain, having been Vice President & General Manager of Coca-Cola Enterprises Great Britain. Previously, he was CEO of Young’s Seafood and Managing Director at Findus Group Ltd. Earlier in his career, Leendert spent 15 years at Procter & Gamble in senior marketing positions. Leendert is Vice President of the British Soft Drinks Association and a member of the Leadership Council of the Institute of Grocery Distribution.
|
Ben is responsible for CCEP’s Business Unit in France, having worked in the Coca-Cola system in various leadership positions for more than 20 years, latterly as Vice President & General Manager France of Coca-Cola Enterprises, Inc.. Ben’s career began at KPMG, followed by several years in other companies including Biscuits Delacre. Ben is a director of the French Soft Drinks Association (Boissons Rafraîchissantes de France) and of the French Food Association (Association Nationale de l’Industrie Alimentaire).
|
|
Frank Molthan
General Manager, Germany Business Unit
Appointed May 2016
|
Stephen Moorhouse
General Manager, Northern Europe Business Unit
Appointed May 2016
|
|
Frank leads CCEP’s Business Unit in Germany and has 30 years’ experience in Germany’s Coca-Cola system. He started his career at Coca-Cola bottling operations in Schleswig-Holstein and North Rhine-Westphalia. He has held a range of regional and commercial leadership roles, latterly as HR Director for Coca-Cola Germany. He is also Managing Director of Coca-Cola Deutschland Verkauf GmbH and Co. KG.
|
Stephen is responsible for CCEP’s Business Unit in Northern Europe and has 15 years’ experience of the Coca-Cola system, leading operations and the supply chain in Belgium, Luxembourg, the Netherlands, Sweden and Norway. In addition, he took over responsibility for Iceland last year. Stephen has held a number of senior executive roles throughout Europe. Prior to joining, he worked overseas for the Swire Group in the US and Asia/Pacific.
|
|
|
P a g e |
51
|
UK CORPORATE GOVERNANCE CODE – INDEX TO DISCLOSURES
|
Page(s)
|
|||
|
Statement of compliance
|
Compliance with the UK Corporate Governance Code (the Code)
|
52
|
|
|
Differences between the Code and the New York Stock Exchange (NYSE) corporate governance rules
|
53
|
||
|
Leadership
|
Headed by an effective board
|
54 to 63
|
|
|
Clear division of responsibilities at the head of the company
|
54
|
||
|
Chairman responsible for leadership of the board
|
54
|
||
|
Non-executive directors constructively challenge and help develop strategy
|
54, 56, 58
|
||
|
Effectiveness
|
Appropriate balance of skills, experience, independence and knowledge of the company
|
56
|
|
|
Formal, rigorous and transparent appointment procedure
|
52, 66
|
||
|
Directors allocate sufficient time to the company
|
61
|
||
|
Director induction and training
|
61 to 62
|
||
|
Supply of information to the board
|
54, 55, 62
|
||
|
Annual evaluation of the board
|
60 to 61
|
||
|
Director re-election
|
61
|
||
|
Relations with shareholders
|
Dialogue with shareholders
|
63
|
|
|
Use of general meetings
|
63
|
||
|
Accountability
|
Fair, balanced and understandable assessment of the company’s position and prospects
|
93
|
|
|
The nature and extent of principal risks accepted to achieve strategic objectives
|
26 to 28
|
||
|
Application of the corporate reporting and risk management and internal control principles
|
28
|
||
|
Remuneration
|
Executive directors’ remuneration designed to promote the long-term success of the company
|
77 to 87
|
|
|
Procedure for developing policy on executive remuneration and for fixing remuneration packages of individual directors
|
76
|
||
A table providing references to the pages containing information required to be disclosed in the Form 20-F may be found on page 198.
|
|
P a g e |
52
|
CORPORATE GOVERNANCE REPORT
Statement of compliance
The governance framework of the Company is set out in the Company’s Articles of Association and the Shareholders’ Agreement. These provide a high level framework for the affairs and governance of the Company and set out the Company’s relationships with its stakeholders including its shareholders. The Company’s Articles of Associations are available on the Company’s website http://ir.ccep.com/corporate-governance/governance-documents.
Statement of compliance with the UK Corporate Governance Code (the Code)
As a company with a standard listing of ordinary shares on the Official List, the Code does not apply to Coca-Cola European Partners (CCEP). However, the Company has chosen to follow the Code on a comply or explain basis. This report therefore describes the Company’s corporate governance structure and explains how, during the year ended 31 December 2017, the Company applied the April 2016 edition of the Code issued by the Financial Reporting Council (the FRC). A copy of the Code can be found on the FRC website at https://www.frc.org.uk/Our-Work/Codes-Standards/Corporate-governance/UK-Corporate-Governance-Code.aspx.
As noted in the 2016 Annual Report, there continue to be a number of instances where the Company’s corporate practices vary from the recommendations under the Code.
|
•
|
The Code in provision A.3.1 recommends that the chairman should, on appointment, be independent. Sol Daurella was not, at the time of her appointment, independent within the meaning of the Code. However the Company gains immensely from her broad knowledge of, and her long-term commitment to, the Coca-Cola system. She has considerable experience and leadership skills gained as a director and chief executive officer of large institutions, public and private, in several sectors.
|
|
•
|
The Remuneration Committee does not have sole authority to determine the compensation of the CEO or the Chairman as recommended by provision D.2.2 of the Code. Rather, the terms of the compensation of the CEO and the total individual compensation of the Non-executive Directors (NEDs) and the Chairman are determined by the entire Board upon the recommendation of the Remuneration Committee. The Board as a whole (excluding the individual whose compensation is the subject of determination) will determine compensation following a full and rigorous analysis and debate. However, the Board does benefit from having a strong Remuneration Committee and, to date, the Board has followed its recommendations.
|
|
•
|
In accordance with the terms of the Shareholders’ Agreement, for so long as the proportion of equity owned by Olive Partners, S.A. (Olive Partners) is at least 15%, the Remuneration Committee will be required to include at least one Director nominated by Olive Partners and for so long as the proportion of equity owned by European Refreshments (an indirect subsidiary of The Coca-Cola Company (TCCC)) is at least 10%, the Remuneration Committee will be required to include at least one Director nominated by European Refreshments. The Remuneration Committee will not, therefore, be comprised solely of Independent Non-executive Directors (INEDs) (as referred to in provision D.2.1 of the Code), but will have three INEDs and therefore a majority of INEDs. The Directors nominated by Olive Partners and European Refreshments bring their deep understanding of all aspects of the Group’s markets to the Remuneration Committee, which is chaired by an independent chairman with a range of experience.
|
The Code recommends in main principle B.7 that all directors should be submitted for re-election at regular intervals and in provision B.7.1 that directors should be subject to election by shareholders at the first Annual General Meeting (AGM) after their appointment, and to re-election thereafter at intervals of no more than three years. In this respect:
|
•
|
The Chairman, Sol Daurella, will not be subject to election during the nine year period after completion of the Merger for as long as she holds office in accordance with the Articles. The extended term of the Chairman is in recognition of Olive Partners’ significant shareholding in CCEP and on account of her significant experience and knowledge in the beverage industry; and
|
|
•
|
Of the INEDs who were appointed to the Company’s Board on completion of the Merger (the Initial INEDs), three Initial INEDs will stand for election at the Company’s AGM in 2019 and each AGM thereafter, an additional three Initial INEDs will stand for election at the Company’s AGM to be held in 2020 and each AGM thereafter and, finally, the remaining three Initial INEDs will stand for election at the AGM to be held in 2021 and each AGM thereafter. The determination of which Directors will stand for election in each year will be made at a later date. These arrangements were put in place to ensure proper representation for public shareholders and to ensure that the Initial INEDS will continue to have significant influence over the strategic direction and operation of CCEP during the transition and integration period following completion of the Merger.
|
|
|
P a g e |
53
|
Differences between the Code and the New York Stock Exchange (NYSE) corporate governance rules
The Company is classed a foreign private issuer (FPI) for the purposes of the applicable rules of the NYSE. As such, and because it follows UK corporate governance practices, it is exempt from most of the NYSE rules that apply to domestic US listed companies. However, the Company is required to provide an annual written affirmation to the NYSE of its compliance with applicable NYSE rules. The Company is also required to disclose any significant differences between its corporate governance practices and those followed by domestic US companies listed on the NYSE. These significant differences are set out below:
|
•
|
Director independence: NYSE rules require the majority of the board to be independent. The Code requires at least half of the Board (excluding the Chairman) to be independent. The NYSE rules contain different tests from the Code for determining whether a director is independent. The independence of the Company’s NEDs is reviewed by the Board on an annual basis. The Board takes into account the guidance in the Code and the criteria the Company has established for determining independence. Accordingly, it has determined that a majority of the Board is independent, without explicitly taking into consideration the independence requirements outlined in the NYSE rules.
|
|
•
|
Board Committees: the Company has a number of Committees that are broadly comparable in purpose and composition to those required by NYSE rules for domestic US companies. However, as described in this report, not all members of all these Committees are INEDs. Each Committee has its own terms of reference (broadly equivalent to a charter document) which can be found in the corporate governance section of the investors section of the Company’s website at http://ir.ccep.com. A summary of the terms of reference, role and activities of each of the Audit Committee and the Remuneration Committee can be found in the Committees’ respective reports. The Remuneration Committee’s terms of reference include having responsibility for matters relating to remuneration policy, share-based incentive plans and employee benefit plans and its implementation of the remuneration policy is set out in more detail in its report.
|
|
•
|
Audit Committee: more information about the Company’s Audit Committee is set out in that Committee’s report, including compliance with the requirements of Rule 10A-3 under the US Securities Exchange Act of 1934, as amended, and Section 303A.06 of the NYSE rules. The Audit Committee is comprised only of INEDs (complying with the NYSE rules). However the responsibilities of the Audit Committee (except for applicable mandatory responsibilities under the Sarbanes-Oxley Act) follow the Code’s recommendations, rather than the NYSE rules, although they are
|
broadly comparable. One of the NYSE’s additional requirements for the Audit Committee states that at least one member of the Audit Committee is to have accounting or related financial management expertise. The Board has determined that Garry Watts possesses such expertise and is the audit committee financial expert as defined in Item 16A of Form 20-F.
|
•
|
Corporate Governance Guidelines: the NYSE rules require domestic US companies to adopt and disclose corporate governance guidelines. There is no equivalent recommendation in the Code but the Nomination Committee has included within its terms of reference the annual review of the corporate governance guidelines.
|
|
•
|
Shareholder approval of equity compensation plans: the NYSE rules for US companies require that shareholders must be given the opportunity to vote on all equity compensation plans and material revisions to those plans. The Company complies with UK requirements that are similar to the NYSE rules. However, the Board does not explicitly take into consideration the NYSE’s detailed definition of what are considered “material revisions”.
|
|
•
|
Code of Conduct: the NYSE rules require that US companies adopt and disclose a code of business conduct and ethics for directors, officers and employees. The Code of Conduct that currently applies to all Directors and the senior financial officers of the Group can be found in the corporate governance section of the Company’s website at
http://ir.ccep.com/corporate-governance/code-of-conduct. If the Board amends or waives the provisions of the Code of Conduct, details of the amendment or waiver will appear at www.ccep.com; no such amendment or waiver has been made or given to date. During 2017, the Board approved a new Code of Conduct and the process of harmonisation of the codes of conduct that applied to other employees in the different companies that make up the Group commenced. At the date of this report the process has been completed for all the countries in which we operate, except for Germany where consultation with the works council continues. The Company however considers that these separate codes of conduct and related policies address the matters specified in the NYSE rules with respect to codes of conduct for US companies.
|
|
•
|
NED meetings: NYSE rules require non-management Directors to meet regularly without management and independent directors to meet separately at least once a year. The Code requires NEDs to meet without the Chairman present at least annually to appraise the Chairman’s performance. There are regular meetings between the INEDs and also regular meetings of NEDs without management present.
|
|
|
P a g e |
54
|
Leadership
Roles and responsibilities of the Board
The Board focuses primarily upon strategic and policy issues and is responsible for the Group’s long-term success. It sets the Group’s strategy, oversees the allocation of resources and monitors the performance of the Group. It is responsible for effective risk assessment and management.
In order to retain control of key decisions and ensure there is a clear division of responsibilities, the Board adopted a schedule of matters which are reserved for its decision alone. These are key matters determining the purpose, value and structure of the business including:
|
•
|
Strategic decisions
|
|
•
|
Approval of annual and long-term business plans
|
|
•
|
Suspension, cessation or abandonment of any material activity of the Group
|
|
•
|
Material acquisitions and disposals
|
|
•
|
Approvals relating to listings, change of listing venue or cancellation of listings
|
|
•
|
Change of the country of incorporation of the Company
|
|
•
|
Amendment or repeal of the constitution of the Company
|
|
•
|
Material commitment or arrangement of the Group outside the normal course of business and/or not specifically identified in the annual business plan
|
|
•
|
Any material variation, modification or waiver of any right or claim under the Merger transaction documents
|
Ultimate responsibility for the management of the Group rests with the Board, and both the Executive Director and NEDs share the same duties and are subject to the same constraints. However, there are varying roles on the Board, as shown in table 1. In line with the principles of the Code, a clear division of responsibilities between the Chairman and the CEO is set out in writing and was reviewed during the formation of the Company.
Meeting attendance
The Board had five meetings during the year and in addition a strategy day which all members of the Executive Leadership Team (ELT) attended.
The members of the Board and Committees are expected to attend each meeting. If, however, a Director is unable to attend a scheduled meeting, or additional meeting called on short notice, they receive the papers in advance and relay their comments to the Chairman for communication at the meeting. The Chairman follows up after the meeting with those not able to attend regarding the discussion had and decisions taken. In the early years of the Company newly appointed Directors will not have had the amount of advance notice of meetings that is customary, sometimes resulting in unavoidable prior commitments restricting attendance at the Company’s meetings.
Attendance during 2017 is set out in table 2.
Table 1: Roles on the Board
|
Role
|
Responsibilities
|
|
Chairman
|
The Chairman is responsible for the overall operation, leadership and governance of the Board, setting the tone and style of Board discussions, and creating the conditions for overall Board and individual Director effectiveness.
|
|
Chief Executive Officer (CEO)
|
The CEO is responsible for executive management of the Group’s business, consistent with the strategy and commercial objectives agreed by the Board.
|
|
Senior Independent Director (SID)
|
The SID is responsible for advising and providing additional support to the Chairman and can also act as an alternative contact for shareholders and an intermediary for other NEDs.
|
|
Non-executive Directors (NEDs)
|
NEDs provide strong, external insight to the Board and its Committees, and have a wealth of experience and business knowledge from other sectors and industries upon which to draw.
|
|
Company Secretary
|
The Company Secretary is responsible for ensuring that good quality information flows from executive management to the Board and its Committees. The Company Secretary also advises the Board on legal, compliance and corporate governance matters and facilitates the induction and ongoing training of Directors.
|
|
|
P a g e |
55
|
Table 2: Meeting attendance by Board and Committee members
(A)
|
Independent or Director nominated by Olive Partners or ER
(B)
|
Board of Directors
|
Affiliated Transaction Committee
|
Audit Committee
|
CSR Committee
|
Nomination Committee
|
Remuneration Committee
|
|
|
Chairman
|
|||||||
|
Sol Daurella
|
Nominated by Olive Partners
|
5 (5)
|
5 (5)
|
5 (5)
|
|||
|
Executive Director
|
|||||||
|
Damian Gammell
|
Chief Executive Officer
|
5 (5)
|
|||||
|
Non-executive Directors
|
|||||||
|
Jan Bennink
|
Independent
|
5 (5)
|
5 (5)
|
5 (5)
|
|||
|
José Ignacio de Comenge Sànchez-Real
|
Nominated by Olive Partners
|
5 (5)
|
5 (5)
|
||||
|
Christine Cross
|
Independent
|
5 (5)
|
5 (5)
|
5 (5)
|
|||
|
J. Alexander M. Douglas, Jr
|
Nominated by ER
|
5 (5)
|
5 (5)
|
||||
|
Javier Ferrán
|
Independent
|
5 (5)
|
5 (5)
|
5 (5)
|
|||
|
Irial Finan
|
Nominated by ER
|
5 (5)
|
5 (5)
|
5 (5)
|
|||
|
L. Phillip Humann
|
Independent
|
5 (5)
|
5 (5)
|
||||
|
Orrin H. Ingram II
|
Independent
|
5 (5)
|
5 (5)
|
5 (5)
|
|||
|
Thomas H. Johnson
|
Independent
|
5 (5)
|
5 (5)
|
5 (5)
|
|||
|
Alfonso Líbano Daurella
|
Nominated by Olive Partners
|
5 (5)
|
5 (5)
|
||||
|
Véronique Morali
|
Independent
|
5 (5)
|
5 (5)
|
4 (5)
(C)
|
|||
|
Mario Rotllant Solà
|
Nominated by Olive Partners
|
5 (5)
|
5 (5)
|
||||
|
Francisco Ruiz de la Torre Esporrín
|
Nominated by Olive Partners
|
5 (5)
|
|||||
|
Garry Watts
|
Independent
|
5 (5)
|
5 (5)
|
5 (5)
|
|||
|
Curtis R. Welling
|
Independent
|
4 (5)
(D)
|
4 (5)
(D)
|
4 (5)
(D)
|
|||
(A)
The maximum number of meetings in the period during which the individual was a Board or Committee member is shown in brackets.
|
(B)
|
Nominated pursuant to the Articles of Association and terms of the Shareholders’ Agreement.
|
(C)
Ms Morali was not able to attend a meeting of the Corporate Social Responsibility Committee due to a long-held prior engagement.
(D)
Mr Welling was not able to attend meetings held in March 2017 due to a long-held prior engagement.
We have good cross-membership of Board Committees to ensure that there is communication of relevant subjects discussed in one Committee to the others. Details are set out in figure 1.
In addition, the Chairman attends all Board Committee meetings and, as is good practice, the Chairman of the Audit Committee sits on the Remuneration Committee and the Chairman of the Remuneration Committee sits on the Audit Committee. Both are INEDs and therefore bring their experience and knowledge of the activities of each Committee to bear when considering critical areas of judgement.
This means that, for example, they are in a position to consider carefully the impact of incentive arrangements on the Group’s risk profile and to ensure the Group’s Remuneration Policy and programme are structured to accord with the long-term objectives and risk appetite of the Company.
The Company Secretary also ensures that all Directors are informed of the work of the Board Committees by making all papers, presentations, minutes and briefings available on a secure platform.
|
|
P a g e |
56
|
Figure 1: Board Committee cross membership
|
Audit Committee
|
Nomination Committee
|
Remuneration Committee
|
Corporate Social Responsibility Committee
|
|
|
Affiliated Transactions Committee
|
1
|
2
|
—
|
1
|
|
Corporate Social Responsibility Committee
|
1
|
—
|
1
|
|
|
Remuneration Committee
|
2
|
1
|
||
|
Nomination Committee
|
1
|
|||
Governance structure
The Board delegates certain matters to its five Committees. Due to the size of the Board, the Board Committees play an essential role in addressing the detailed work within their remit and report back to the Board.
Figure 2 shows the interaction between the Board and its stakeholders and the Chief Executive Officer, who in turn is supported by the ELT.
Each of the five Committees has written terms of reference, which are reviewed at least annually. These are available to view on the Company’s website http://ir.ccep.com/corporate-governance/governance-documents.
Activities of the Board
The Board has a programme that ensures it addresses all matters within its remit. During 2017, the Board met five times and also attended a one day strategy meeting. Members of the ELT also attended. Subjects covered during the strategy day included the long range plan to 2020 regarding sources of growth, investments and financial outlook, as well as consideration of the future European consumer and customer landscape and strategies covering portfolio, markets, sustainability, cost management and talent, diversity and inclusion.
As part of its regular business, the Board considered regular updates from the CEO, Chief Financial Officer (CFO) and other senior executives to assess the performance of the Group against its strategy, approved business plans, received regular reports on progress of the integration of the business and realisation of identified synergies, oversaw major expenditure decisions and reviewed governance matters. Key highlights of the Board’s 2017 activities and priorities are set out in table 3.
Effectiveness
Composition of the Board
At the date of this report, the Board comprises 17 Directors: the Chairman, the CEO, nine INEDs and six other NEDs. It was determined on formation of the Company that the structure, size and composition of the Board meets the needs of the Company’s business, while the Board’s skills, experience, independence, knowledge and diversity ensure that a variety of views are considered and that a range of opinions are taken into account. The Nomination Committee keeps both matters under regular review. For further information on the work of the Nomination Committee, please see pages 65 to 67. The Directors’ biographies appear on pages 45 to 49.
The terms of appointment for each NED are available for inspection at the Company’s registered office. These will also be available for inspection at the AGM.
Independence of Non-executive Directors
The Board considers the independence of each of the NEDs each year against the requirements specified in the Code and in SEC Rule 10A-3. In order to be considered independent, a NED should be independent of management and free from any business relationship or circumstance which could materially interfere with the exercise of objective, unfettered and independent judgement.
Excluding the Chairman, six of our Directors are appointed either by Olive Partners or European Refreshments, so cannot be considered independent. However, the Board has determined that Jan Bennink, Christine Cross, Javier Ferrán, L. Phillip Humann, Orrin H. Ingram II, Thomas H. Johnson, Véronique Morali, Garry Watts and Curtis R. Welling remain independent. Consequently, both the majority of Directors and the majority of NEDs are independent.
Damian Gammell, as an Executive Director, is not deemed independent due to his executive responsibilities for the Group. He does not hold any other directorships.
|
|
P a g e |
57
|
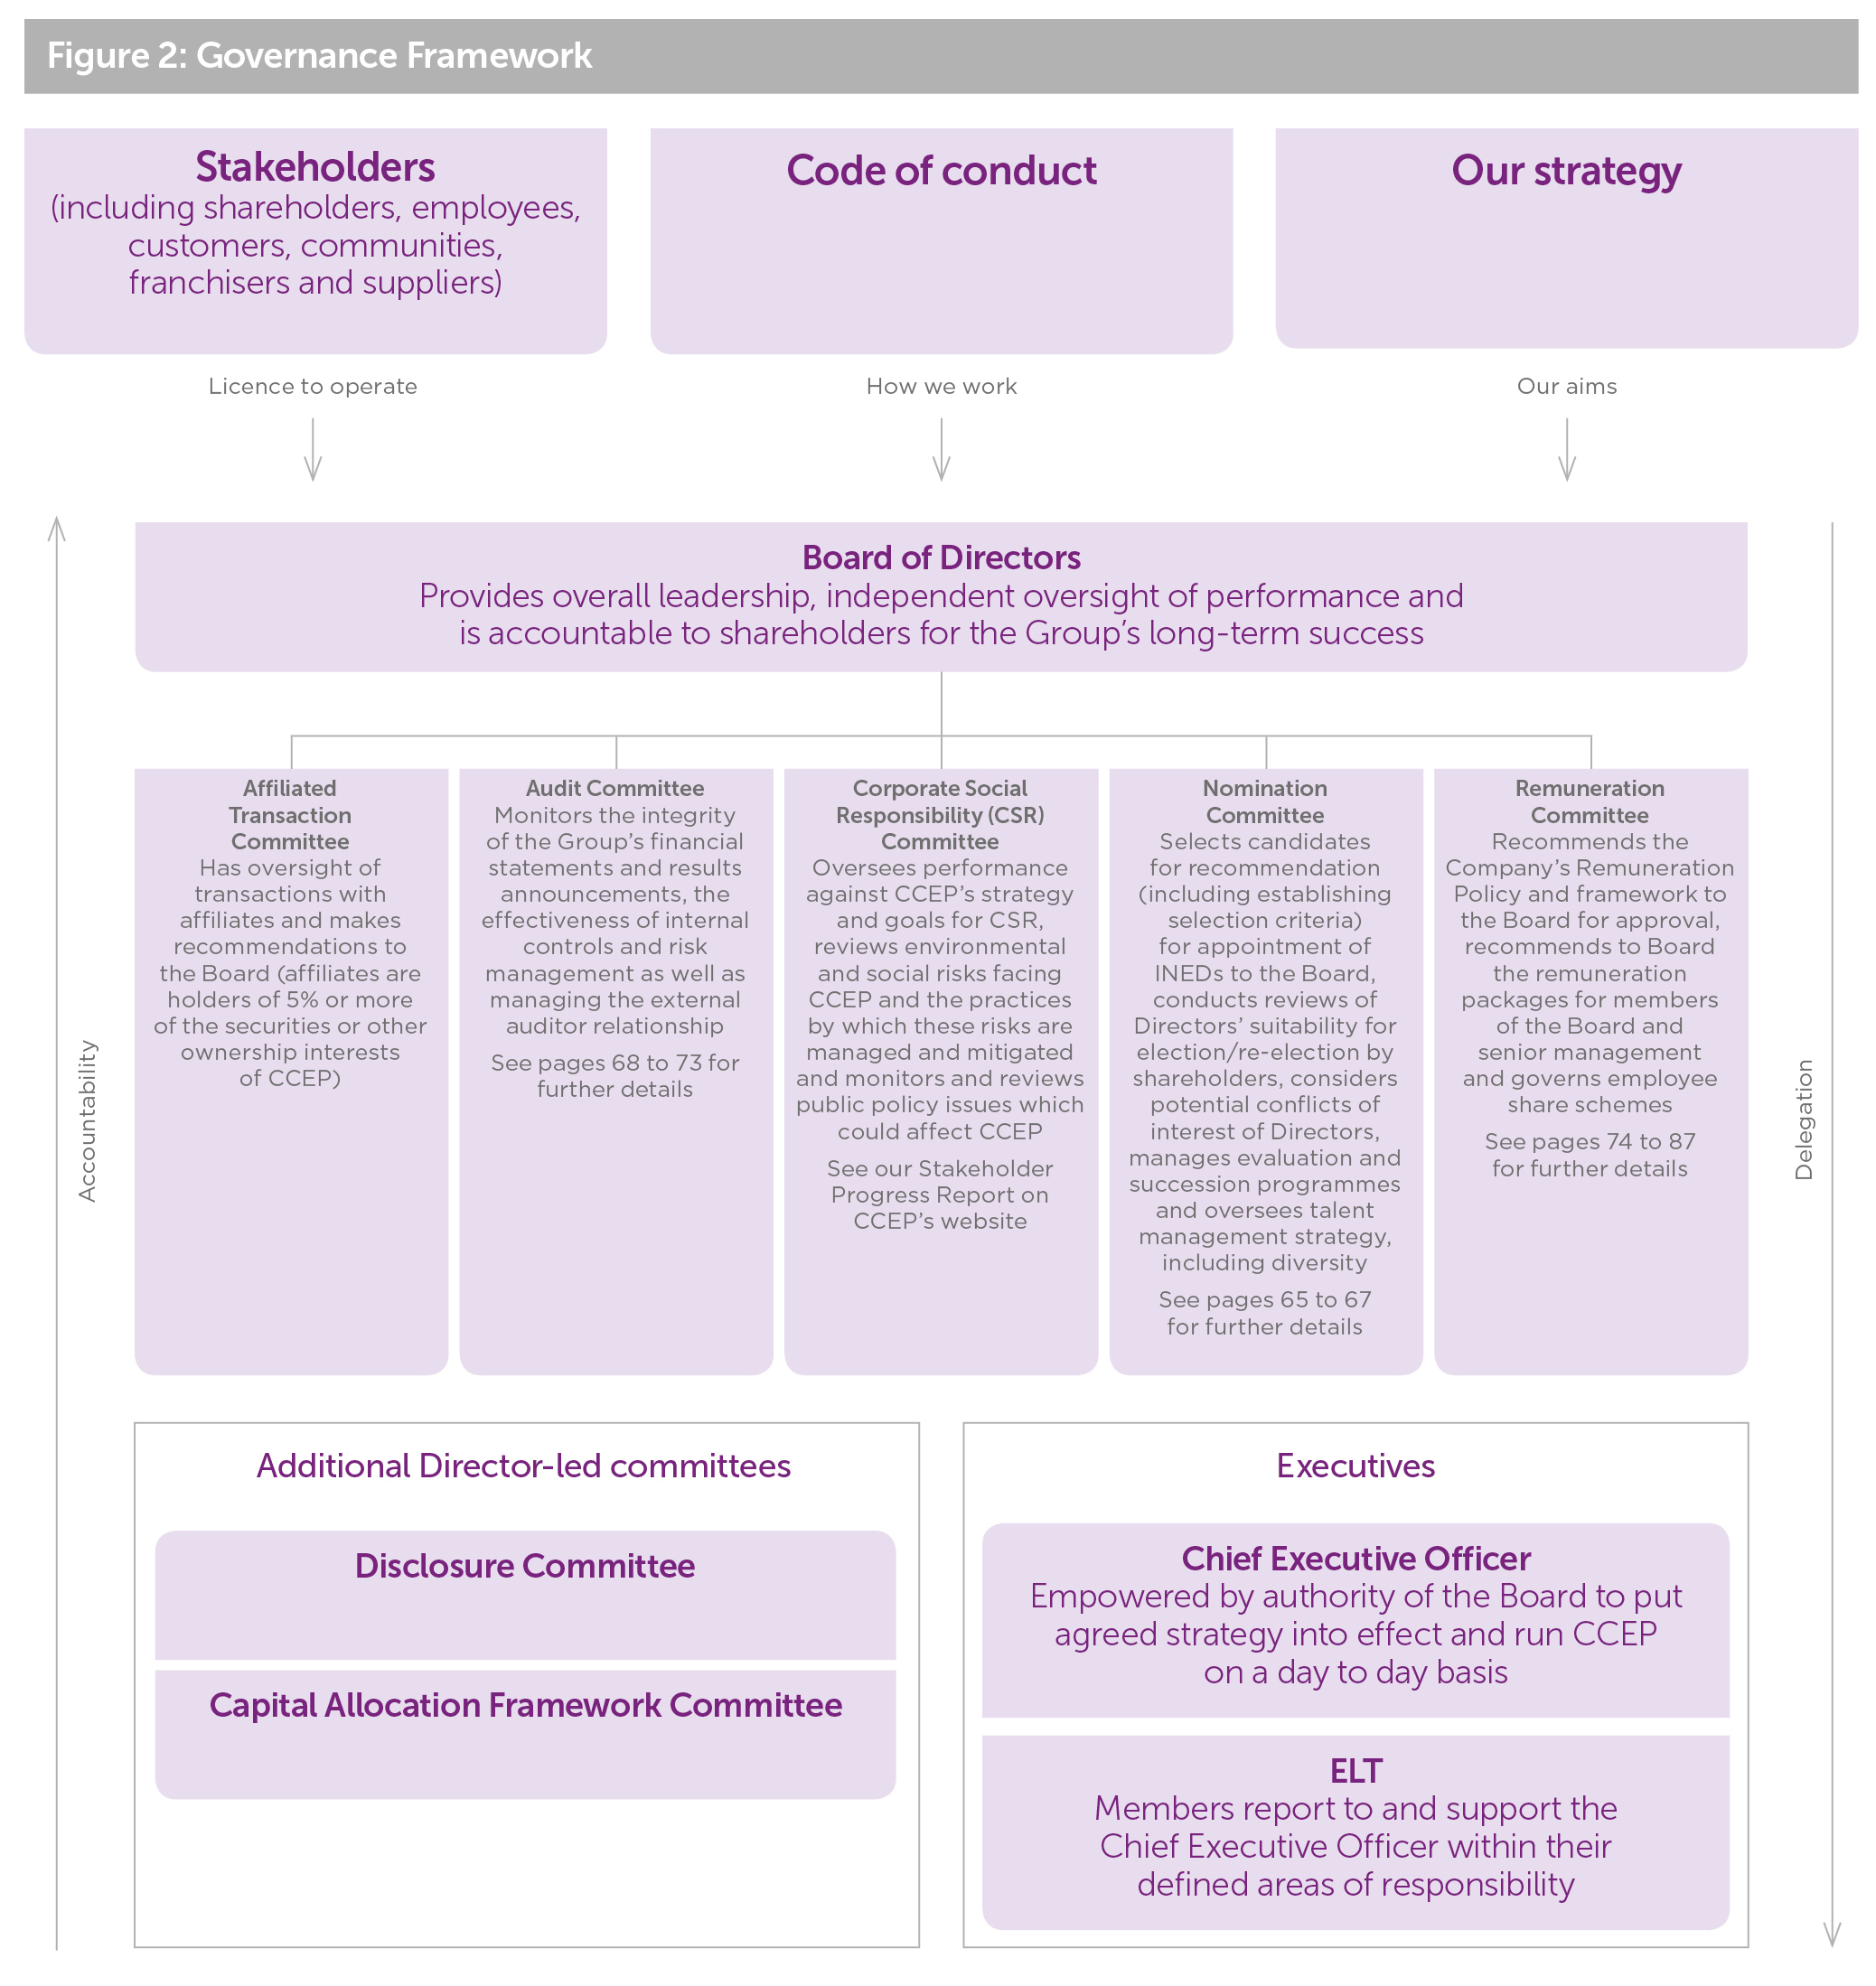
|
|
P a g e |
58
|
Table 3: Board activities in 2017
|
Activity
|
Links to strategy
|
Principal risks
|
|
|
Strategy and growth
•
Agreed the key strategic priorities for CCEP in 2017
•
Continuous monitoring of progress on the transformation agenda
•
Agreed the key areas for capital allocation including leverage, cost of capital, criteria for investment, future mergers and acquisition activity, the approach to dividends and possible share buybacks
•
Reviewed results of an audit of culture and agreed how to roll out the tone from the top in the businesses
•
Assessed various acquisition opportunities and pipeline
•
Approved the 2018 annual business plan
|
A, C & D
|
1 - 8
|
|
|
Performance and integration
•
Approval of the 2017 and long range business plans
•
Participated in deep dives concerning the Group’s operations in Iberia and Great Britain, plans to enhance the Group’s shared service centre’s reporting and analytical capabilities and an overview of the Company’s business in the Northern Europe Business Unit (NEBU)
•
Considered product innovation programmes and the organisation of the supply chain to ensure safety, quality, service and sustainability
•
Explored the options for the set-up of a procurement hub
|
B & E
|
1 - 8
|
|
|
Sustainability
•
Obtained input from stakeholders, including governments, non-governmental organisations, customers, suppliers, and trade organisations such as the Union of European Soft Drinks Association (UNESDA), regarding the development of This is Forward, CCEP’s joint sustainability action plan with TCCC
•
Determined CCEP’s position on sugar and sweeteners used by CCEP and reviewed brands that drive health and consumer preference
•
Reviewed CCEP’s new holistic packaging strategy, including packaging design, innovation and collection, and supported plans to identify ways to enable CCEP to achieve 100% recovery of packaging by 2025
•
Agreed a new community strategy with TCCC for Western Europe
•
Reviewed governance options including the establishment of an internal community steering group to oversee CCEP’s community investments
•
Supported the drive of a safety culture in CCEP
•
Debated how to meet challenges presented by tax increases on sugar, soda and confectionery in Europe
|
B, D & E
|
1, 2, 3, 4
|
|
|
People
•
Debated draft profiles and desired skills matrices to support formulation of succession plans for members of the Board, including the CEO
•
Appointed search consultants to assist in identifying possible future Directors
•
Scrutinised and participated in talent management programmes to identify high potential candidates for Board and ELT positions
•
Debated and approved the corporate culture, focused on delivery of our strategy
•
Agreed actions designed to develop a diverse and inclusive culture
•
Approved and updated objectives on diversity including cognitive diversity, inclusion and apprenticeships
•
Considered gender pay gap information
•
Discussed approach to the voice of the employee being heard by the Board, including extending the role of the Nomination Committee
|
E
|
2 & 3
|
|
|
KEY
|
||||
|
Strategic goals
(see page 10)
|
Principal risks
(see pages 27 to 28)
|
|||
|
Top line revenue growth
|
A
|
Change in consumer preferences and the health impact of soft drinks
|
1
|
|
|
Customer and execution-centric business
|
B
|
Legal and regulatory intervention
|
2
|
|
|
Strategic cost management
|
C
|
Business integration and synergy savings
|
3
|
|
|
Building stakeholder equity
|
D
|
Market
|
4
|
|
|
Culture, capability and sustainability
|
E
|
Cyber and social engineering attacks
|
5
|
|
|
Economic and political conditions
|
6
|
|||
|
Relationship with TCCC and other franchisors
|
7
|
|||
|
Product quality
|
8
|
|||
|
|
P a g e |
59
|
|
Activity
|
Links to strategy
|
Principal risks
|
|
|
Financial and risk management
•
Determination of CCEP’s long-term viability
•
Reviewed and approved CCEP’s financial results together with interim dividend payments
•
Debated and approved CCEP’s risk appetite for 2017 and regularly reviewed its risk profile
•
Discussed anti-bribery, Brexit and risk reviews
•
Assessed the effectiveness of the whistleblowing hotline, case management and training
•
Received detailed briefings on developments in infrastructure technology, business capability, digital and information security in order to inform CCEP’s approach in these areas
•
Assessed reports on unexpected, new and potentially high impact risks
•
Approved significant capital expenditure proposals
|
A - E
|
1 - 7
|
|
|
Governance and reporting
•
Assessed codes of conduct and approved a revised code of conduct for application to the Group
•
Considered the requirements for compliance under the UK Modern Slavery Act and approved CCEP’s 2017 modern slavery statement
•
Approved and published Our Approach to Tax
•
Debated feedback received from the review of the effectiveness of the Board and its Committees undertaken in early 2017 and agreed actions for improvement
•
Considered regular updates from the Chairmen of its Committees
•
Appraised and approved revisions to Board governance guidelines and Committees’ terms of reference
•
Reviewed and approved the 2016 Annual Report and Form 20-F and the 2017 AGM Notice of Meeting, subject to final sign-off by sub-committee
•
Reviewed stakeholders of the Company to enable engagement on their views
•
Approved the Board expenses policy and changes to the chart of authority and policy on the control and disclosure of inside information
|
A - E
|
2, 4, 6 & 7
|
|
|
KEY
|
||||
|
Strategic goals
(see page 10)
|
Principal risks
(see pages 27 to 28)
|
|||
|
Top line revenue growth
|
A
|
Change in consumer preferences and the health impact of soft drinks
|
1
|
|
|
Customer and execution-centric business
|
B
|
Legal and regulatory intervention
|
2
|
|
|
Strategic cost management
|
C
|
Business integration and synergy savings
|
3
|
|
|
Building stakeholder equity
|
D
|
Market
|
4
|
|
|
Culture, capability and sustainability
|
E
|
Cyber and social engineering attacks
|
5
|
|
|
Economic and political conditions
|
6
|
|||
|
Relationship with TCCC and other franchisors
|
7
|
|||
|
Product quality
|
8
|
|||
|
|
P a g e |
60
|
Diversity
Board members have a range of backgrounds, skills, experiences and nationalities, reflecting a breadth of diversity beyond gender (as can be seen from their biographies on pages 44 to 49).
The Board intends to increase its diversity further as the opportunities arise to do so and has in particular committed to have women make up 33% of Directors by 2020. The Board’s diversity policy can be found on the Company’s website http://ir.ccep.com/corporate-governance/overview, embedded within the criteria for the selection of INEDs.
Our culture of diversity and inclusion is important to the Group. A breakdown of our current employee gender diversity at various levels across the Group is on pages 22 - 23 together with our aspirational targets for 2025.
Further information on how our policy on diversity influences the selection of members of our Board and ELT can be found in the Nomination Committee Report on pages 65 to 67.
Board evaluation
As noted in the 2016 Annual Report, the first review of the performance and effectiveness of the Board, its Committees and individual Directors took place in early 2017.
The reviews were conducted using an online questionnaire developed following discussions between the Chairman, the Senior Independent Director, the Company Secretary and the external facilitator, Lintstock Limited, an independent governance advisory firm that does not do any other work for the Group. Responses to the questionnaire were collated and the output was used by the Senior Independent Director in his individual meetings with Directors as part of the evaluation process. The Senior Independent Director also led a performance review of the Chairman, taking into account the views of the other Directors.
The general feeling among members of the Board was that very good progress had been made. The creation of a well-functioning single board, including two INEDs who were new to the Coca-Cola system and the Group, had also come about faster than expected.
The reviews indicated that the Board, its Committees, the Chairman and each of the Directors are working efficiently and effectively. The results were discussed in detail by the Board in an open and constructive debate and areas for focus and improvements were identified and agreed. These are set out in table 4 together with the actions taken to address them.
|
|
P a g e |
61
|
Table 4:
2017 Board evaluation findings and actions
|
Time management
|
Board support
|
Risk management and internal control
|
Succession planning and people management
|
Priorities for strategic development
|
|
|
2017 findings
|
Improve the efficiency of the Board to make the best use of its time
|
Reinforce good working practices
|
Further develop performance in risk management and oversight
|
Assess the appropriateness of the structure of the Group at senior levels
|
Establish a clear business strategy for maximising the success of the business
|
|
Actions undertaken in 2017
|
•
Made better use of Committees to undertake pre-work to allow the Board more time for discussion of priority items
•
Received clear and more detailed pre-reading materials so that views can be formed ahead of meetings
•
Prioritised and allocated time to agenda items
•
Provided presentations from the ELT as well as the CEO
|
•
Introduced an online portal for the review of Board and Committee papers
•
Developed a forward-looking schedule of agenda items
•
Adopted a template for Board papers to help Directors to identify matters requiring decisions or to query
•
Provided readily accessible training materials
|
•
Directors committed to spend more time on risk management and oversight in order to obtain a more rounded view
•
Implemented the new CCEP risk framework across the organisation and ensured it was actively used in business planning and decision making
|
•
Obtained greater exposure to the ELT in order to evaluate them
•
Promoted the establishment of a robust talent management programme
by the Nomination Committee
•
Drove employee engagement and a culture that aligns with the strategy
•
Addressed succession plans, with an eye towards diversity and inclusion
|
•
During 2017, the Board focused on the testing and development of the strategy including product portfolio, marketing and advertising support, human resources and organisational design, financial policy objectives, and IT and digital strategies
•
Set up a sub-committee to review the capital allocation framework and report with its proposals twice a year
|
The Board has commenced planning for the 2018 reviews of performance and effectiveness and has appointed Independent Board Evaluation as the independent facilitator. It will continue to keep its procedures under review to ensure their effectiveness. It will also monitor and assess how it spends its time so that it can continue to improve and refine the focus and balance of its meetings.
Re-election of Directors
The Board has determined that Directors shall stand for re-election at each AGM of CCEP, subject to continued satisfactory performance. Exceptions are the Chairman and the INEDs in respect of their initial terms of office set out in the Shareholders’ Agreement and detailed on page 52. A NED who has served a term of nine years on the Board of CCEP will automatically be deemed no longer independent unless the Board unanimously resolves otherwise and his or her re-election is supported by shareholders of the Company.
Following the individual performance assessments, the Board is satisfied that each Director continues to perform effectively, allocates sufficient time for their duties, and remains fully committed to their role in the Company.
The Code requires that the Chairman’s significant commitments are included in the Annual Report. These are set out in her biography on page 45.
Induction and training
A comprehensive induction programme was made available to the new Directors, tailored to the requirements of the individual Director and phased to allow feedback and further customisation of meetings and other development activities.
The induction programme includes routine fact finding questionnaires regarding personal information, related party interests and conflict of interests. The new Director is also provided with information about Group policies, procedures to meet legal and regulatory requirements. A typical induction pack will include:
|
•
|
Information on the role, responsibilities and attributes of an effective board
|
|
•
|
Director’s duties
under the UK Companies Act 2006
|
|
•
|
The responsibilities of a Person Discharging Managerial Responsibility under the EU Market Abuse Regulation
|
|
•
|
Board calendar and general information
|
|
•
|
Governance documents, policies and procedures
|
|
•
|
Terms of reference and guidelines
|
|
•
|
CCEP’s share dealing code and the Board of Directors expenses policy
|
|
|
P a g e |
62
|
As part of their induction, new Directors meet with CCEP employees across the regions in which we operate. This includes site visits, typically hosted by one of our ELT, to allow our Directors to familiarise themselves with the regional and local leadership teams and to discuss a wide range of topics.
Training and development opportunities in specific aspects of the Company’s businesses are regularly provided to NEDs. Set out in table 5 is the programme for 2017.
Board support
Board meetings are scheduled at least two years in advance and ad hoc meetings are arranged when required according to the needs of the business. The Board also has a programme which sets out the standing items for every meeting, key periodic activities such as approval of results, AGM documentation, business plans and assessment of evaluation results, as well as matters for more detailed focus owing to their significance to the Company. Comprehensive briefing papers are circulated to all Directors more than one week before each meeting.
The meeting papers are delivered electronically via a secure portal accessible remotely. The delivery of papers is made in real time, which enables the Directors to review them via an efficient and easily transportable medium. A resource centre within the portal provides access to useful information about the Group, including corporate governance guidance, training materials, business reports and briefings, the annual business plan, strategy information and analysis reports.
Each Director has access to the advice and services of the Company Secretary. There is also an agreed procedure whereby Directors may take independent professional advice at the Company’s expense in the furtherance of their duties.
Board meetings are held in a variety of locations, reflecting the international nature of our business. In 2018 these meetings are scheduled to be held in France and the Netherlands, as well as in the UK. Holding meetings outside the UK enables all Board members to gain a greater appreciation of some of the different countries in which the Group operates.
Table 5: NED training and development programme
|
Form of training
|
Purpose
|
Subject
|
|
Briefings
|
Focused on in-depth studies of matters of topical interest to CCEP as well as on relevant commercial, legal and regulatory developments
|
Separate deep dives regarding:
•
The GB, Iberian, French and German operations
•
The shared service centre
•
The supply chain
•
An overview of the business in NEBU
•
The IT strategy project
|
|
Development sessions
|
To address requests from Directors
|
•
Distribution and route to market
•
Health and wellbeing
•
Consumer insights, including fast moving consumer goods
Background from the finance sector
•
Mergers and acquisitions
•
Digital competency
|
|
Site visits
|
Visits to Group businesses, factories and commercial outlets to enhance knowledge of CCEP operations and meet employees, suppliers and customers
|
•
Barcelona, Spain
•
Frankfurt, Germany
•
Manchester and London, UK
|
|
External speakers
|
To receive insights from experts and engage with stakeholders
|
•
José María Álvarez-Pallete López, Chairman and CEO of Telefonica
•
James Quincey, President and Chief Executive Officer TCCC
•
Francisco Crespo Benitez, President of TCCC’s Mexico business unit
•
Sherland Ventures: 2020 vision of retailing and implications for CCEP markets
•
Faith Popcorn’s BrainReserve: Futurevision 2027 - meet your next consumer
•
Dan Sayre, President of the Western Europe business unit (WEBU), TCCC
•
John Amaechi on the importance of diversity
|
|
|
P a g e |
63
|
Conflicts of interest
Under its terms of reference the Nomination Committee considers issues involving potential conflicts of interest of Directors and members of Committees. A number of potential conflicts of interest that certain Board members have were set out in the Prospectus.
Sol Daurella is the Co-Chairman and member of the Executive Committee of, Cobega, S.A. (Cobega), as well as a shareholder of Cobega. Alfonso Líbano Daurella is Co-Vice Chairman and member of the Executive Committee of, as well as a shareholder of Cobega. Mario Rotllant Solá is Co-Chairman and a member of the Executive Committee of Cobega. Sol Daurella and Alfonso Líbano Daurella are indirect shareholders of Grupo Norte de Distribucion, S.L., a subsidiary of Cobega that has a commercial agreement with CCEP for the distribution of Coca-Cola products. In addition, Sol Daurella and Alfonso Líbano Daurella are indirect shareholders of Daufood U. Lda., a subsidiary of Cobega that has a commercial agreement with CCEP for the purchase of products. Delivra, S.L. and Gadisven, S.A., both subsidiaries of Cobega, provide equipment maintenance services to CCEP. CCEP also currently has agreements in place for the supply of products to Gadivsen, S.A., the vending company. Sol Daurella and Alfonso Líbano Daurella also hold, through Cobega, an interest in Norinvest Consumo, S.L. (Norinvest). Norinvest has a lease agreement in place with Norbega S.A., a subsidiary of CCEP.
Irial Finan and Francisco Crespo Benítez (like J. Alexander M. Douglas, Jr before his resignation) also hold various roles within (including as employees of) TCCC.
Véronique Morali is the chairman of Fimalac Developpement (Fimalac), the parent company of the international financial services organisation, Fitch Group, a financial services holding company. She is also chief officer of WEBEDIA, the digital division of Fimalac. In addition, Véronique serves as director and Vice-Chairman, Fitch Group, Inc. (USA) and Fitch Group (USA). The Fitch Group may, in future, provide credit rating and research services to the Company or the Group.
The Board believes that the system it has in place for reporting situational conflicts (situations where a Director has an interest that conflicts, or may possibly conflict, with the interests of the Company) is operating effectively.
Accountability
Due to practice over time, disclosures of compliance with provisions of the Accountability section of the Code are located elsewhere in annual reports. Table 6 sets out where each respective disclosure may be found.
Relations with shareholders
The Board recognises the importance of regular engagement with both existing and potential shareholders. During 2017, the Board, the ELT and the investor relations team worked together to ensure regular engagement with existing and potential shareholders. This took the form of results announcements, conference calls or web casts, and presentations, conferences and meetings across Europe and the US. Additionally, investors are invited to participate in conferences calls following the announcement of the Company’s quarterly results.
Recognising the importance of our investors, our CEO, CFO and the investor relations team engage with them throughout the year to ensure our strategy and performance are clearly understood, and that their views and market sentiment is clearly communicated within the Company. The Board, in particular, receives regular updates on the views of shareholders and the investor relations programme at each Board meeting.
The investor relations section of our website enables the effective distribution of information to the market. This includes quarterly results, annual reports, presentations and archived web casts, other announcements and shareholder information and services.
Annual General Meeting
The Board and the ELT continue to consider the AGM a key date in our annual shareholder engagement programme. In 2017, members of the Board and the ELT attended the AGM to discuss the resolutions in the Notice of Meeting, the business, and any other questions shareholders might have. We were pleased that shareholders holding 92.64% of the issued shares voted and all resolutions were passed.
The 2018 AGM of the Company will be held on Thursday 31 May 2018 at 22 Duchess Mews, London W1G 9DT at 11.00am. A full description of the business to be conducted at the meeting will be set out in the Notice of AGM, available from the Company’s website from the time of its posting to shareholders in April 2018.
As last year, the Chairman, Senior Independent Director and Committee Chairmen plan to attend the AGM, providing shareholders with the opportunity to question them about issues relating to the Group, either during the meeting or informally afterwards. They are also available to shareholders for discussion throughout the year on matters under their areas of responsibility, by contacting the Company Secretary.
Please also refer to ccep.com
for information about on engagement with all stakeholders.
|
|
P a g e |
64
|
Table 6: Disclosure of compliance with provisions of the Accountability section of the Code
|
Items located elsewhere in the 2017 Annual Report
|
Page(s)
|
|
Directors’ responsibility statement
|
92 to 93
|
|
Directors’ statement that they consider the annual report and accounts, taken as a whole, to be fair, balanced and understandable
|
93
|
|
Statement by the external auditor of its reporting responsibilities
|
104
|
|
The Group’s business model
|
12 to 13
|
|
Group strategy
|
10
|
|
Going concern statement
|
91
|
|
Assessment of the Group’s principal risks
|
27 to 28
|
|
Viability statement
|
39
|
|
Risk management and internal control systems and the Board’s review of their effectiveness
|
28
|
|
Audit Committee Report
|
68 to 73
|
|
|
P a g e |
65
|
NOMINATION COMMITTEE CHAIRMAN’S LETTER

|
“It is important that our talent management plans support our strategy of growth. Our whole workforce has a part to play in this, not just our leaders. We must ensure we are positioned to deliver.”
|
Dear Shareholder
I am pleased to report on the work of the Nomination Committee during 2017. A brief summary of our activities during 2017 is provided in table 1 on page 66,with additional details on some of these activities provided in the Nomination Committee Report. I have also highlighted a couple of key areas of focus below.
The members of the Committee and details of their attendance at meetings can be found in the Corporate Governance Report on page 55.
A brief overview of our responsibilities can be found in figure 2 on page 57 of the Corporate Governance Report.
Independent Non-executive Director succession
In May 2017 we announced that Garry Watts would step down from the Board at the end of September 2017 to dedicate more time to his other roles. Following a change in his circumstances, and taking into account the importance of maintaining an appropriate balance of skills and experience on the Board, we recommended to the Board that Garry be asked to remain as a Director for a further period of time. The Board accepted this recommendation and we are very pleased that Garry agreed to remain as a Director and withdrew his resignation.
The Committee also reviewed the selection criteria for Independent Non-executive Directors. It recommended revised criteria to the Board to take into account, among other things, the desirability of a diverse Board.
People
It is important that our talent management plans support our strategy of growth. Our whole workforce has a part to play in this, not just our leaders. We must ensure we are positioned to deliver. We have therefore spent time this year focusing on these plans, including considering the role our leaders play. We also reviewed the programme of engagement with both our leaders and the wider workforce regarding our strategy, purpose and expected behaviours. In addition, we provided input to the diversity and inclusion strategic framework and roadmap. More details are provided in the Nomination Committee Report.
Availability to shareholders
I will be available at our Annual General Meeting to answer any questions on the work of the Committee.
L. Phillip Humann
Chairman of the Nomination Committee
15 March 2018
|
|
P a g e |
66
|
NOMINATION COMMITTEE REPORT
Nomination Committee activities
During 2017 the key matters considered by the Committee included those set out in table 1. The involvement of the Committee in each matter is described in more detail in the rest of the Nomination Committee Report.
Table 1: Matters considered by the Nomination Committee during 2017
|
Activity
|
|
People
•
Director succession plans, especially for Independent Non-executive Directors (INEDs)
•
INED succession criteria
•
Executive Leadership Team succession plans and development
•
Talent management plans
•
Culture development
•
Diversity and inclusion
|
|
Governance
•
Board guidelines on significant corporate governance principles
•
Evaluation of the Board and its Committees - feedback from 2017 process and planning for 2018 process
•
Terms of reference
|
The Committee met five times during the year. Attendance at its meetings is set out in the Corporate Governance Report on page 55.
The Board
Independent Non-executive Director succession
The Board was constituted on completion of the Merger in May 2016 and so, in the absence of any external factors such as the need to manage the impact of other commitments, we do not expect to see material turnover in INEDs until the end of the first three year terms. More detail about the appointments of Directors is provided in the Corporate Governance Report on page 52, the Directors’ Report on page 88 and in the summary of the main provisions of the Company’s Articles of Association in the section of the Annual Report entitled Other Group Information on page 182.
Despite this timeframe, we consider it important to ensure the orderly succession of INEDs given the importance of maintaining an appropriate balance of skills and experience on the Board. We have therefore commenced planning for a managed succession of INEDs. The first three INEDs will stand for re-election at the Annual General Meeting in 2019.
We previously developed selection criteria for the appointment of INEDs. They ensure we are ready to deal with any casual vacancies and set the tone for our approach to recruitment at a senior level. Further, they provide a framework for the consideration of succession planning in the longer term. In addition, we will use an agreed matrix of skills required on the Board to ensure we maintain the correct balance as Directors are replaced.
The current INED selection criteria, as approved by the Board, are available on the CCEP website http://ir.ccep.com/corporate-governance/governance-documents. They reflect the importance of selecting candidates who can effectively give voice to stakeholder interests, particularly to facilitate the discharge of the Board’s duties under section 172 of the Companies Act 2006. They also include a target to have at least 33% female Directors by 2020, and a requirement to take into account the recommendations of the Parker Review.
We undertook a review of the skills and experience required on the Board to support its future plans. This review took into account the INED selection criteria, which were amended to take account of the proposals of the Parker Review’s Beyond One by ‘21 report.
During the year, Garry Watts announced his intention to step down from the Board at the end of September 2017 to dedicate more time to his other roles. We engaged JCA, external recruitment consultants (who the Company does not use for any other services), to identify a pool of potential candidates. However, following a change in his circumstances, we considered the benefits of retaining Garry’s skills and experience on the Board, particularly in light of his role as Audit Committee Chairman. We recommended to the Board that Garry be asked to remain as a Director for a further period of time, which the Board accepted. We are very pleased that Garry agreed to remain as a Director and withdrew his resignation, and are pleased that he will continue in his role as Audit Committee Chairman.
Diversity on the Board
We recognise the importance of cognitive diversity to good decision making. This is driven by diversity of background, including gender and ethnic diversity, and so express reference to it is included in the INED selection criteria. In particular in succession planning, we are mindful of the Board’s stated target within the INED selection criteria to have 33% of the Directors being female by 2020, especially given female representation on the Board currently stands at 17.6%.
As noted above, the INEDS are each expected to serve for a minimum of three years from Merger. As a result, the opportunity to apply the INED selection criteria has not yet arisen. Olive Partners, S.A. (Olive Partners) and European Refreshments (ER) each nominated new directors to the Board in early March 2018, in place of directors who stepped down. In both cases they replaced male directors with male directors. As a result, there have been no changes to the diversity of the Board during the year.
More information about our approach to diversity on the Board is provided in the Corporate Governance Report on page 60, while more information about our approach to diversity in the Group is provided in the Sustainability section of the Strategic Report on pages 22 to 23.
|
|
P a g e |
67
|
New appointments to the Board
In early March 2018, in accordance with the Company’s Articles of Association and the Shareholders’ Agreement, Olive Partners nominated Álvaro Gómez-Trénor Aguilar to replace Francisco Ruiz de la Torre Esporrín and ER nominated Francisco Crespo Benítez to replace J. Alexander (Sandy) M. Douglas Jr as Directors of the Company. Each of Álvaro Gómez-Trénor Aguilar and Francisco Crespo Benítez will complete a detailed induction, in line with the programme set out in the Corporate Governance Report on pages 61 to 62.
Executive Leadership Team
Succession planning
Over the course of our meetings in 2017, we have received detailed information from management regarding the succession plans for the Executive Leadership Team (ELT). We considered the plans, which cover both emergency and planned succession processes, and provided feedback and suggestions for their evolution. Discussions with management included consideration of potential successors to the ELT and the creation of a programme of external evaluation and development for potential ELT successors. Korn Ferry was appointed to support the ELT succession processes and in the development of succession criteria in connection with the appointment of Executive Directors to the Board.
Our people
We oversee the approach to succession planning and talent management, including diversity, for the whole organisation.
Talent management
Our talent plans need to support our strategy of growth. We worked with management to ensure they are fit for purpose. The skills, experience and behaviours we require of all our leaders, including and beyond the ELT, were discussed and considered along with the plans needed to support the development of the leaders and workforce of the future. We reviewed management’s revised approach to performance management and improvement, which will ensure a focus on the future and accelerating performance.
Engagement
A programme of engagement with both our leaders and the wider workforce was developed to share our strategy, our purpose and the behaviours we expect of our people. We reviewed the details of this programme with management.
Further information on the variety of ways we engage with our people, enabling communication flows both from and to the Board, is provided in the Directors’ Report on page 91.
Diversity and inclusion
We are committed to increasing diversity and inclusion throughout the organisation and to supporting the development and promotion of talented individuals regardless of gender, sexuality, nationality and race or ethnicity. We received details of the Company’s diversity and inclusion strategic framework and roadmap, which we reviewed with management and on which we provided feedback and suggestions for its development.
We agreed a target to have 40% of our management positions held by women by 2025. We encourage the plans for development of an inclusive workplace seeking to recruit actively from all sections of the community.
Information regarding the diversity of the organisation as a whole is provided in the Sustainability section of the Strategic Report on page 23.
Evaluation and independence
At the start of each year, we instigate the process of evaluating the performance of the Board and its Committees over the course of the prior year. In planning the evaluation process to be undertaken in early 2017, we considered the need to drive the effective working of the Board. We carried out a valuable exercise supported by Lintstock. Further details of the evaluation exercise undertaken in early 2017, including the outcomes, are provided in the Corporate Governance Report on pages 60 to 61.
For 2018, we particularly considered how the evaluation process could support the Board as it looks to the future, rather than simply reflecting on past performance. We made recommendations to the Board accordingly, including recommending the appointment of an independent external facilitator for the process. The Board agreed with our recommendations and appointed Independent Board Evaluation to facilitate the evaluation process in 2018.
Confirmation of which of the Non-executive Directors are determined to be independent is also provided in the Corporate Governance Report on page 56.
L. Phillip Humann
Chairman of the Nomination Committee
15 March 2018
|
|
P a g e |
68
|
Chairman’s Letter
AUDIT COMMITTEE CHAIRMAN’S LETTER

|
“The establishment of robust governance routines and a strong focus on internal controls and risk management have played a critical role in the successful integration of the Group.”
|
Dear Shareholder
I am pleased to present the report of the Audit Committee for the year ended 31 December 2017 in accordance with the UK Corporate Governance Code (the Code). The report describes how we have discharged our responsibilities under the Code and monitored the effectiveness of the Group’s financial reporting, internal control systems and risk management.
During 2017, the Committee has met five times and discussed a range of topics, as set out in more detail in our report. The Committee comprises five Directors as set out in the Corporate Governance Report. Only members of the Committee are entitled to attend meetings, however the Chief Executive Officer, Chief Financial Officer, Group Financial Controller, other senior members of the Finance department, the internal auditor, the Company Secretary and other members of senior management are normally invited. The external auditor always attends meetings and the Committee holds private meetings with both the internal and external auditors throughout the year.
As well as the regular review of Committee matters relating to the financial reporting cycle, in this, the Group’s first full year, the Committee remained focused on overseeing the integration of the Group including key areas related to financial reporting and accounting, internal audit and control, ethics and compliance, enterprise risk management and business continuity management. The Committee is satisfied with the Group’s progress as it relates to these key areas and highlights several major achievements during 2017 including a successful first year of compliance with Section 404 of the Sarbanes-Oxley Act of 2002 (the SOX Act), the finalisation of acquisition accounting, the transition of substantially all transactional activities from Germany to the Group’s Shared Services Centre, the launch of a Group wide Code of Conduct covering all employees, and the Group’s first enterprise wide risk assessment.
As we look toward 2018, the Committee will continue its focus on the Group’s integration and will also spend time reviewing the Group’s approach to the General Data Protection Regulation (GDPR), the Group’s IT transition roadmap and cybersecurity, and the further development of the Group’s enterprise risk management and compliance programmes. The Committee will also monitor the Group’s adoption of IFRS 15, “Revenue from Contracts with Customers”, and IFRS 9, “Financial Instruments”, which are both effective for the Group from 1 January 2018, and the implementation of IFRS 16, “Leases”, which is effective for the Group from 1 January 2019.
I will be available at our Annual General Meeting to answer any questions about the work of the Committee.
Garry Watts
Chairman of the Audit Committee
15 March 2018
|
|
P a g e |
69
|
AUDIT COMMITTEE REPORT
Role of the Audit Committee
The key duties and responsibilities of the Audit Committee are set out in its terms of reference which are available on the Company’s website http://ir.ccep.com/corporate-governance/governance-documents. These include:
|
•
|
Monitoring and reviewing the integrity of the annual financial statements of the Group and other periodic announcements relating to the Group’s financial performance
|
|
•
|
Monitoring and reviewing the Group’s viability statement and its going concern assumption
|
|
•
|
As requested by the Board, reviewing the contents of the Annual Report and providing advice on whether it presents a fair, balanced and understandable assessment of the Group’s performance, business model and strategy
|
|
•
|
In accordance with English law, making recommendations to the Board for it to put to the shareholders for approval at the annual general meeting regarding the appointment, reappointment and removal of the Group’s external auditors
|
|
•
|
Agreeing the scope of both the internal and the external auditors’ annual audit programmes and reviewing their output
|
|
•
|
Monitoring and reviewing the external auditor’s independence and objectivity and their effectiveness
|
|
•
|
Monitoring and reviewing the effectiveness of the Group’s internal auditors
|
|
•
|
Monitoring the effectiveness of the Group’s internal controls, risk management programme and disclosure controls and procedures
|
|
•
|
Providing governance and oversight of the Group’s compliance programmes including those related to fraud, anti bribery, and anti corruption regulations, operational and financial risk assessments, which are part of the broader enterprise risk management programme, and the Group’s business continuity management programme
|
|
•
|
Reviewing the adequacy and security of the Group’s whistleblowing policy and other arrangements for its employees and contractors to raise concerns, in confidence, about possible wrongdoing in financial reporting or other matters
|
|
•
|
Assisting the Board in fulfilling its oversight and responsibilities relating to processes and controls for annual and long-term business planning, dividend and capital structure, tax matters and capital expenditure
|
The Committee consists of five independent Directors and has significant experience and competence relevant to the sector, fast-moving consumer goods, in which the Group operates. In accordance with the New York Stock Exchange (NYSE) rules for foreign private
issuers (FPIs), the Group follows UK practice in relation to corporate governance. However, FPIs are required to have an audit committee that satisfies the requirements of the SEC Rule 10A-3. The Group’s Audit Committee satisfies these independence requirements and the Board has determined that the Chairman of the Committee, Garry Watts, may be regarded as an audit committee financial expert as defined in Item 16A of Form 20-F. The attendance of Directors at meetings held during 2017 of the Committees of which they are members, including the Audit Committee, is shown in the table in the Corporate Governance Report on page 55.
Activities of the Audit Committee during the year
Table 1 provides an overview of the key agenda items discussed at each meeting of Audit Committee during 2017.
Financial reporting, significant financial issues and material judgements
The Committee undertook a formal review of each of the Group’s financial statements and associated announcements. As part of each review, the Committee considered the significant accounting principles, policies and practices applied, their appropriateness, the financial reporting issues concerned and the significant judgements made. The Committee also reviewed and considered the Group’s alternative performance measures in each of the Group’s associated announcements. The Committee confirmed that each of the adjusting items was in conformity with the Group’s policy on alternative performance measures and did not take exception to any of the adjusting amounts. The Committee also reviewed to its satisfaction the adequacy of the Group’s disclosures regarding the use of alternative performance measures.
In relation to this Annual Report, Committee members undertook a review of a developed draft and suggested a number of enhancements that were then implemented to improve the Annual Report so that the Committee could confirm to the Board that in its assessment the Annual Report is fair, balanced and understandable. The Committee spent considerable time reviewing and assessing the processes undertaken by management to support the Group’s Viability Statement. In particular, the Committee reviewed the results of management’s scenario modelling and the stress testing of these models. The Viability Statement can be found on page 39.
Throughout the period under review, the Committee considered the work of, and reports from, several management functions including finance, legal, and IT, together with reports from the internal and external auditors on their findings.
|
|
P a g e |
70
|
Table 1: Key agenda items discussed by the Audit Committee
|
March
2017
|
May
2017
|
July
2017
|
October
2017
|
December 2017
|
|
|
Standing matters
|
|||||
|
•
Earnings release/financial report
(A)
|
X
|
X
|
—
|
X
|
X
|
|
•
Accounting and reporting matters
|
X
|
X
|
X
|
X
|
X
|
|
•
SOX 404 internal controls
|
X
|
X
|
X
|
X
|
X
|
|
•
External auditor update
|
X
|
X
|
X
|
X
|
X
|
|
•
Internal auditor update
|
X
|
X
|
X
|
X
|
X
|
|
•
Legal matters
|
X
|
X
|
X
|
X
|
X
|
|
•
Ethics and compliance
|
X
|
X
|
X
|
X
|
X
|
|
•
Business continuity management
|
X
|
X
|
X
|
X
|
X
|
|
•
Enterprise risk management
|
X
|
X
|
X
|
X
|
X
|
|
•
Capital review and approvals
|
X
|
X
|
X
|
X
|
X
|
|
•
Dividend review
(A)
|
X
|
X
|
—
|
X
|
—
|
|
Other topics
|
|||||
|
•
IT/cybersecurity update
(B)
|
X
|
—
|
—
|
—
|
—
|
|
•
Synergy audit and certification
|
—
|
X
|
—
|
—
|
—
|
|
•
Treasury and tax deep dive
|
—
|
X
|
—
|
—
|
—
|
|
•
General Data Protection Regulation
|
—
|
X
|
X
|
—
|
—
|
|
•
SOX 404 framework deep dive
|
—
|
—
|
X
|
—
|
—
|
|
•
Risk appetite discussion
|
—
|
—
|
X
|
—
|
—
|
|
•
Germany shared services transition
|
—
|
—
|
X
|
—
|
—
|
|
•
Tax update
|
—
|
—
|
X
|
—
|
—
|
|
•
Insurance and risk deep dive
|
—
|
—
|
—
|
X
|
—
|
|
•
Debt financing review
|
—
|
—
|
—
|
X
|
X
|
|
•
Spain VAT refund review
|
—
|
—
|
—
|
—
|
X
|
|
•
Review of committee terms of reference
|
X
|
—
|
—
|
—
|
—
|
|
•
EY independence & non-audit services policy
|
—
|
—
|
—
|
—
|
X
|
|
(A)
|
The Board held a telephonic session to review and discuss the Group’s 2017 Half Year report and second quarter dividend.
|
|
(B)
|
IT/cybersecurity updates were provided to the full Board in October and December.
|
|
|
P a g e |
71
|
The significant issues in relation to financial statements that the Committee considered during 2017 are summarised in the following table. In summary, the Committee concluded after discussion that the judgements and estimates made on each of the issues it considered were appropriate and acceptable.
|
Accounting Area
|
Key Financial Impacts
|
Audit Committee Considerations
|
|
Deductions from revenue and sales incentives
|
Total cost of customer marketing programmes in 2017:
€2.9 billion
Accrual at 31 December 2017:
€648 million
|
The Group participates in various programmes and arrangements with customers designed to increase the sale of products. Among the programmes are arrangements under which allowances can be earned by customers for attaining agreed-upon sales levels or for participating in specific marketing programmes. For customer incentives that must be earned, management must make estimates related to the contractual terms, customer performance and sales volume to determine the total amounts earned. There are significant judgements and estimates used at each reporting date to ensure the proper deduction from revenue has been recorded. Actual amounts ultimately paid may be different from estimates. At each reporting date, the Committee received information regarding the amount of customer marketing spend of the Group along with period end accruals. The Committee also discussed and challenged management on key judgments and estimates applied during the period and any relevant information on significant or abnormal movements in accrual balances, if applicable.
|
|
Tax accounting
and reporting
|
2017 book tax expense:
€471 million
2017 cash taxes:
€247 million
2017 comparable effective tax rate:
25%
VAT receivable at 31 December 2017:
€273 million
|
The Group evaluated a number of tax matters during the year, including those associated with the potential impacts of new legislative developments in the US and in Europe on CCEP’s effective tax rate, the deferred tax inventory, direct and indirect tax provisions in all jurisdictions and potential transfer pricing exposure. Throughout the year, the Committee received information from management on the critical aspects of tax matters affecting the Group, considered the information received, and gained an understanding of the level of risk involved with each significant conclusion. In particular, the Committee received a detailed understanding of the Group’s analysis of the various accounting impacts of the US Tax Reform and Jobs Act. Additionally, the Committee received information on the Group’s outstanding VAT receivables in Spain and gained a more detailed understanding about the background and legalities of the amounts to be refunded. The Committee also considered and provided input on the Group’s disclosures regarding these and other tax matters.
|
|
Asset impairment analysis
|
Franchise intangible assets with indefinite lives:
€8.1 billion
Goodwill:
€2.5 billion
|
The Group performs an annual impairment test of goodwill and intangible assets with indefinite lives, or more frequently if impairment indicators are present. The testing is performed at a cash generating unit (CGU) level, which for the Group are based on geography and generally represent the individual territories in which the Group operates. The Group did not record any impairment charges as a result of the tests conducted in 2017. The Committee received information from management on the impairment analysis performed focusing on the most critical assumptions such as the terminal growth rate and the discount rate. The Committee also discussed with management the key assumptions utilised for the Group’s Germany CGU. The Committee reviewed and challenged a sensitivity analysis provided by management to understand the impact of changes in key assumptions, mainly the discount rate. The Committee was satisfied with the assumptions utilised by the Group and also considered and reviewed the Group’s disclosures about its impairment testing.
|
|
Restructuring
accounting
|
Restructuring cost recorded in 2017:
€235 million
Restructuring provision at 31 December 2017:
€216 million
|
As the Group continues its integration and synergy programme, significant restructuring provisions were recorded during the year. Throughout the year, the Committee received regular updates from management on the status of restructuring programmes including cost incurred and synergy tracking. Additionally, during 2017, the Committee received a report from an external audit regarding the validation of synergies captured to date and a report from internal audit on the Group’s key processes and governance for tracking and monitoring restructuring activities. The Committee was satisfied with the outputs of both reports. The Committee also reviewed the Group’s restructuring provision balance as at 31 December 2017 and disclosures in the financial statements.
|
|
|
P a g e |
72
|
External audit
The Committee reviews and makes recommendations to the Board with regard to the reappointment of the external auditor. In doing so, the Committee takes into account auditor independence and audit partner rotation. Ernst & Young LLP were appointed as external auditor to the Company in 2016 and the lead audit partner is Karl Havers. The Committee confirms voluntary compliance with the provisions of the Statutory Audit Services for Large Companies Market Investigation (Mandatory Use of Competitive Tender Processes and Audit Committee Responsibilities) Order 2014, as published by the UK Competition and Markets Authority.
During the year, the Committee agreed the approach to and scope of the audit work to be undertaken by the external auditor. The Committee also reviewed and agreed the terms of engagement, and areas of responsibility and the work to be undertaken by the external auditor, and agreed the fees payable in respect of the 2017 audit work. Details of the amounts paid to the external auditor for their audit services are given in Note 16 to the accounts. In addition, the external auditor provided the Committee with a schedule of each matter on which there was an initial difference between them and management in relation to the accounting treatment, and the final decisions on these issues.
The Committee also considered the effectiveness and independence of the external auditor. In consideration of its effectiveness, the Committee reviewed the experience and expertise of the audit team, the fulfilment of the agreed audit plan and any variations to it, feedback from the Group’s businesses and the contents of the external audit report. In considering the independence of the external auditor, the Committee received a statement of independence from the auditor, a report describing their arrangements to identify, report and manage any conflicts of interest, and reviewed the extent of non-audit services provided to the Group. The Committee confirmed its satisfaction with the effectiveness and independence of the external auditor.
The Committee has recommended to the Board that Ernst & Young LLP be proposed for reappointment by shareholders as the Group’s external auditor at the forthcoming Annual General Meeting. As a result of its work during the year, the Committee has concluded that it acted in accordance with the Committee’s terms of reference and has ensured the independence and objectivity of the external auditor.
The Group has a policy on the use of its external auditor for non-audit work and this is regularly reviewed. The external auditor is precluded from engaging in non-audit services that would compromise their independence or violate any laws or regulations affecting their appointment as external auditor. The approval of the Chairman of the Committee is required prior to awarding contracts for non-audit services to the external auditor, where in excess of specified amounts.
The Committee reviewed and approved the scope of non-audit services provided by the external auditor to ensure that there was no impairment of independence and objectivity, and subsequently monitored the non-audit work performed to ensure it was within policy guidelines.
Internal audit
The Committee approved and reviewed internal audit’s audit plan for 2017 and agreed its budget and resource requirements. The internal audit function consists of approximately 20 full time professional audit staff based in London, Berlin, Madrid and Sofia, covering a range of disciplines and business expertise. The Committee received and discussed, at least quarterly, regular reports from the Chief Audit Executive summarising audit findings and recommendations and describing actions taken by management to address any shortfalls. It also reviewed progress on implementation of recommendations.
As determined by a risk based approach to audit planning, areas of assurance focus during 2017 included: management of deductions from revenue, restructuring accounting, business integration and transition activities as well as the security of information systems. A significant proportion of the internal audit’s resources was allocated to an extensive testing of the Group’s internal control system in support of management’s opinion over the design and operating effectiveness of internal controls over financial reporting in accordance with the requirements of the SOX Act.
At the end of 2017, internal audit participated in the Group’s enterprise risk assessment and developed a three year strategic audit plan that aims to address major strategic, operational, financial and compliance risks. The plan was presented to and approved by the Committee at its December meeting.
In 2018, internal audit’s focus areas will include: aspects of revenue recognition and rebate management, field sales and cold drink services, product quality management, implementation of new accounting standards, procurement processes, security of information systems as well as reviews of major capital and transformation projects, and SOX 404 controls testing.
|
|
P a g e |
73
|
Internal control and risk management
The Committee is responsible for monitoring the effectiveness of the Group’s internal controls, compliance with the Code, and the requirements of the SOX Act, specifically Sections 302 and 404, as it applies to a US foreign private issuer listed on a US exchange. During 2017, the Group completed a successful first year of compliance with Section 404 of the SOX Act, which included initial compliance for CCIP (Iberia) and its subsidiaries, which prior to the Merger, were not previously subjected to the rigorous requirements of Section 404. The Group’s internal control over financial reporting was deemed to be designed and operating effectively as at 31 December 2017. This is a significant achievement for the Group and demonstrates the Group’s and the Committee’s commitment to having a strong internal control environment. The Committee will continue to monitor the progress of the Group’s internal control framework harmonisation efforts, remediation of any internal control deficiencies, and will also focus in 2018 on the internal control implications of the Group’s IT roadmap, and continued integration and transition activities.
Further information about the Group’s risk management and internal control processes is set out on pages 26 to 28. The overall enterprise risk management framework, including the Board’s appetite for risk and the underlying process for capturing and reporting risk and control data, will continue to be developed in 2018 and to be reviewed by the Board and its committees.
Whistleblowing hotline
The Committee has oversight of the adequacy and security of the Group’s whistleblowing policy and other arrangements for its employees and contractors to raise concerns, in confidence, about possible wrongdoing in financial reporting or other matters. These can be made via an independent and confidential service, where employees or contractors can report any concerns.
Looking forward into 2018
The Audit Committee, like the other Committees of the Board, has a process for planning its future meeting agendas and a schedule of topics to be considered in the course of the next 12 months. In addition to the routine responsibilities of the Committee, during 2018, we expect to focus on a number of key items including the following:
|
•
|
Compliance with the new General Data Protection Regulation (GDPR) no later than May 2018
|
|
•
|
Monitoring of restructuring and integration activity, including the transition of transactional processing activities from Germany and Iberia to the Group’s shared services centre
|
|
•
|
The implementation of IFRS 16, “Leases”, which is effective for the Group from 1 January 2019
|
|
•
|
IT matters, including the Group’s IT transition roadmap and cybersecurity
|
|
•
|
The further development of the Group’s enterprise risk management framework and compliance programmes
|
Garry Watts
Chairman of the Audit Committee
15 March 2018
|
|
P a g e |
74
|
Directors’ Remuneration Report
STATEMENT FROM THE REMUNERATION COMMITTEE CHAIRMAN

|
“We have made good progress against our strategic goals during 2017, resulting in above target performance in respect of all financial metrics linked to remuneration outcomes.”
|
Dear Shareholder
On behalf of the Board, I am pleased to present the Directors’ Remuneration Report for Coca-Cola European Partners plc (the Group) for the year ended 31 December 2017. This includes a summary of our Remuneration Policy which was approved by shareholders at our 2017 Annual General Meeting (AGM) and our Annual Report on Remuneration, which will be subject to an advisory vote at our 2018 AGM.
Context for executive remuneration at CCEP
As set out in my letter last year, following the Merger, the Remuneration Committee spent a considerable amount of time developing our Remuneration Policy and we were pleased that this was approved by over 90% of our shareholders.
The Remuneration Policy is designed to be simple, transparent and incentivise the delivery of the business strategy in a manner which aligns the interests of management and shareholders. This alignment is reflected through the significant focus on variable remuneration which sets stretching performance targets against the Company’s key financial performance indicators outlined on page 11 of our Strategic Report.
Work during the year has also focused on cascading the Remuneration Policy through the organisation in order to foster the development of talent and succession, which has been a particular objective this year.
Remuneration outcomes for 2017
Annual bonus
We have made good progress against our strategic goals during 2017 and have started to realise the growth opportunities created by the Merger. This has resulted in above target performance being delivered in respect of all three financial metrics used to assess performance under the annual bonus (operating profit, revenue and operating free cash flow).
Based on performance against each of the financial metrics, the overall Business Performance Factor achieved was 1.27x target which, combined with an Individual Performance Factor for Damian Gammell of 1.15x, resulted in an total bonus payment of 146% of target, which equates to 61% of his maximum opportunity or 219% of salary.
It should be noted that there was an underspend in restructuring costs during the year in comparison to the original budget. This was primarily a result of changes in budget assumptions that were unforeseen at the time the budget was set.
To ensure that the bonus outcome was a fair reflection of the underlying performance of the business, the Committee determined that the bonus outcome should not be artificially inflated as a result of this underspend and adjusted the performance calculation accordingly.
This resulted in a reduction to the formulaic bonus pay-out with a decrease in the Business Performance Factor from 1.74x to 1.27x and a reduction in the overall bonus from 83% of maximum to 61% of maximum. Further details are provided on page 79.
Long-term incentives
Damian Gammell had no long-term incentive awards vesting in the year that were subject to performance conditions for the year ending 31 December 2017. However, the second tranches of Restricted Stock Units (RSUs) and share option awards that were made prior to the Merger, in November 2015, did vest during the year. Full details of these awards are provided on page 82.
Damian Gammell was granted an award under the Long-Term Incentive Plan (LTIP) in March 2017 which will vest in March 2020 subject to the achievement of stretching Earnings Per Share (EPS) and Return On Invested Capital (ROIC) targets. Further details of this award are provided on page 80.
|
|
P a g e |
75
|
Implementation of Remuneration Policy in 2018
Our strategic priorities remain unchanged as we continue to focus on delivering growth aligned with our three year plan. The remuneration framework developed last year continues to support this strategy and, therefore, the Remuneration Policy will be operated on a very similar basis in 2018 as it was during 2017.
Base salary
Damian Gammell received a base salary increase of 2.6% effective 1 April 2018 aligned with the average increase provided to the wider UK workforce.
Pension
Damian Gammell will continue to receive an annual payment of £30,000 (2.7% of salary) in lieu of participation in the Company’s pension scheme. This is aligned with the policy for all other employees throughout the organisation who receive a payment in lieu of company pension contributions.
Annual bonus
The financial measures for the 2018 annual bonus plan will remain aligned with our core objectives as stated on page 76 focusing on operating profit (50%), revenue (30%) and operating free cash flow (20%). The individual performance multiplier for Damian Gammell will be assessed on the same basis as for all other members of the Executive Leadership Team. This assessment will focus on the delivery of five objectives aligned to the five pillars of our strategic framework as well as the delivery of personal development objectives. No changes have been made to the bonus opportunity, which remains at 150% of salary for target performance and 360% of salary for maximum performance.
Long-term incentive
LTIP awards will be made in accordance with the Remuneration Policy with a target award of 250% of salary and a maximum award of 500% of salary. Awards will continue to be subject to stretching EPS and ROIC performance targets each with an equal weighting. Further details of these targets are provided on page 85.
Share ownership guideline
To provide further alignment with shareholders, Damian Gammell is required to hold shares equivalent to 300% of his base salary, including for a period of one year after cessation of employment. He is required to build up to this level within five years of appointment. Damian currently has a holding of 212% of salary and is therefore on track to meet this guideline within the required timeframe.
2018 AGM and shareholder engagement
I would like to thank shareholders again for the feedback provided during 2017 as we developed our Remuneration Policy and for their support in approving it at our 2017 AGM. We continue to value the feedback provided by our shareholders and are committed to maintaining an open dialogue with our major shareholders.
As outlined above, as our Remuneration Policy was only approved last year, we do not propose to make any significant changes to our remuneration arrangements at present. However, the Remuneration Committee is committed to ensuring that the Remuneration Policy and its implementation remains compliant with all legislative requirements as they come into force, and is aligned with evolving best practice, while continuing to take account of our overarching remuneration philosophy and delivering value to our shareholders.
Consequently, during 2018, the Remuneration Committee will pay close attention to any reforms implemented by the UK Government and will also review our general approach following the publication of the revised Corporate Governance Code which is expected later this year.
Finally, I would like to note that the transparency and equality of pay across all grades, gender and geographies remains a key focus of the business and is a regular item on the Remuneration Committee agenda.
I hope we continue to receive your support in respect of our Annual Report on Remuneration at our forthcoming AGM.
Christine Cross
Chairman of the Remuneration Committee
15 March 2018
|
|
P a g e |
76
|
OVERVIEW OF THE REMUNERATION POLICY

|
|
P a g e |
77
|
2017 REMUNERATION AT A GLANCE
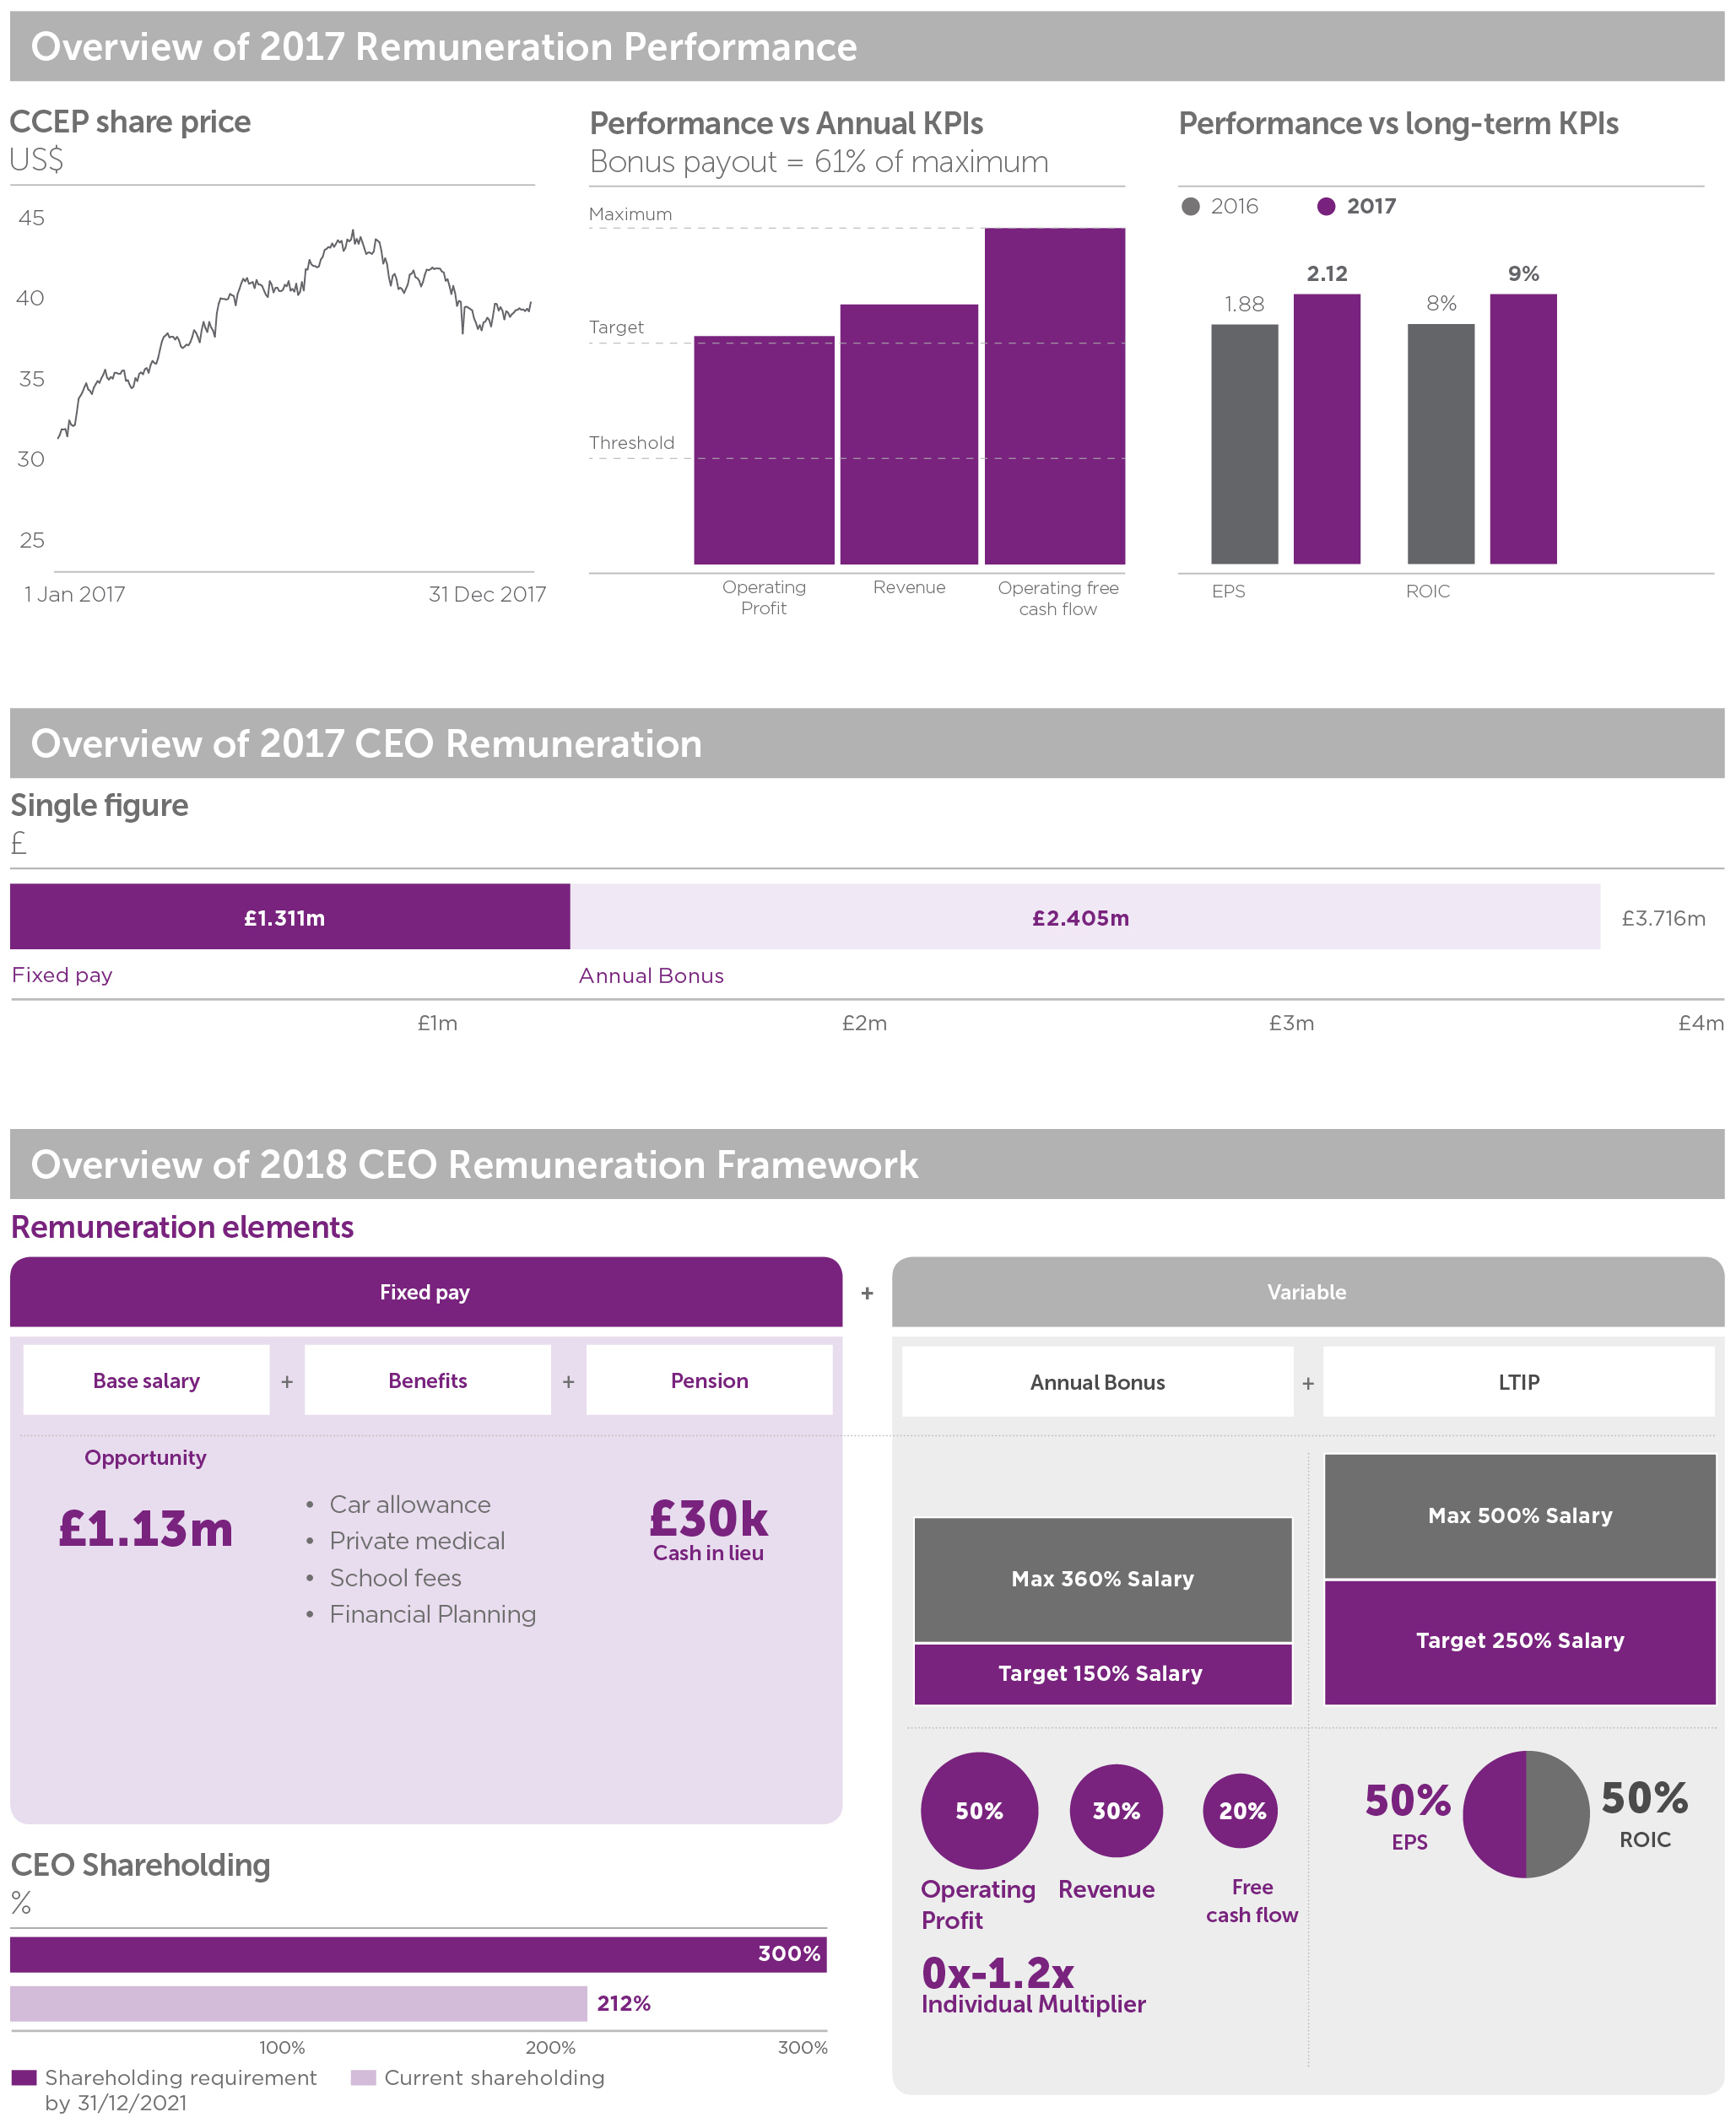
|
|
P a g e |
78
|
ANNUAL REPORT ON REMUNERATION
Remuneration outcomes for 2017
The following pages set out information in respect of remuneration received by Directors for the financial year ending 31 December 2017. Prior year figures have also been shown for the period from Admission (28 May 2016) up until 31 December 2016. Sections of the report that are audited have been highlighted.
Single figure table for Executive Directors (audited)
|
Individual
|
Year
|
Salary (£000)
|
Taxable benefits (£000)
|
Annual bonus (£000)
|
Long-term incentives (£000)
|
Pension (£000)
|
Total remuneration (£000)
|
|
Damian Gammell
|
2017
|
1,100
|
185
|
2,405
|
0
|
26
|
3,716
|
|
2016
(A)
|
9
|
2
|
16
|
0
|
0
|
27
|
|
|
(A)
|
Damian Gammell was appointed as Chief Executive Officer and joined the Board on 29 December 2016. Figures shown above for 2016 are therefore for the period in which he served as an Executive Director (i.e. 29 Dec - 31 Dec: 3/366 days).
|
Notes to the single figure table for Executive Directors (audited)
Base salary
Damian Gammell’s base salary was set at £1,100,000 per year upon his appointment to the Board on 29 December 2016. No increase to his salary was made during 2017.
Taxable benefits
During the year, Damian Gammell, received the following main benefits: car allowance (£14,000), financial planning allowance (£10,000), schooling allowance (£75,000 on a post-tax basis), and international private medical coverage (£20,000).
Pension
The pension provisions that apply to Damian Gammell are aligned to all other UK employees. Damian elected to receive a cash allowance in lieu of participation in the pension scheme which equates to a payment of £30,000 from the Company inclusive of employer National Insurance costs (i.e. the actual benefit received by Damian is less than £30,000 per year).
Annual bonus
Overview of CCEP’s annual bonus design
The 2017 CCEP annual bonus plan was designed following the completion of the Merger to incentivise the delivery of the business strategy and comprised the following elements:
Business Performance Factor (BPF)
- provides alignment with our core objectives to deliver strong financial performance against our main financial performance indicators of:
|
•
|
Operating profit (50%)
|
|
•
|
Revenue (30%)
|
|
•
|
Operating free cash flow (20%)
|
Individual Performance Factor (IPF)
- individual objectives were also set for Damian Gammell aligned with our strategic objectives for the year. These included:
|
•
|
Embedding a new CCEP culture
|
|
•
|
Driving further diversity in the organisation
|
|
•
|
Delivering against the Group’s stated synergy savings target
|
In line with the Remuneration Policy, Damian Gammell had a target bonus opportunity of 150% of salary. Actual payments could range from zero to a maximum of 360% of salary depending on the extent to which both business and individual performance measures were achieved.
|
Target bonus
(150% of base salary)
|
x
|
BPF
(0x to 2.0x)
|
x
|
IPF
(0x to 1.2x)
|
=
|
Final bonus outcome
(0% salary to 360% salary)
|
|
|
P a g e |
79
|
2017 annual bonus outcome - BPF
During the year, the Company has made good progress in respect of delivering its key strategic objectives. The Group delivered another four consecutive quarters of operating profit growth and full-year revenue growth alongside very strong cash performance. This is reflected in above target performance being delivered under each of the financial elements of the annual bonus.
|
Measures
|
Weighting
|
|
Performance Targets
(A)
|
Performance Outcome
|
|||||
|
Threshold (0.25x multiplier)
|
Target (1.0x multiplier)
|
Maximum (2.0x multiplier)
|
Actual outcome
(B)
|
Multiplier achieved
|
|||||
|
Operating profit
(C)
|
50
|
%
|
€949m
|
€1,116m
|
€1,250m
|
€1,123m
|
1.05x
|
||
|
Revenue
(D)
|
30
|
%
|
€10,820m
|
€11,127m
|
€11,373m
|
€11,161m
|
1.14x
|
||
|
Operating Free cash flow
(E)
|
20
|
%
|
€1,035m
|
€1,202m
|
€1,336m
|
€1,376m
|
2.00x
|
||
|
Total
|
100
|
%
|
1.27x
|
||||||
(A)
All targets set on a constant currency basis at budgeted foreign exchange rates. Refer to page 85 for definition of targets.
(B)
Actual Outcome is provided only to assess performance against Performance Targets for the purpose of calculating the Business Performance Factor (BPF) relating to the annual bonus.
(C)
Comparable Operating Profit (refer to page 21) adjusted for budgeted restructuring (see below) and other items, at 2017 budgeted foreign exchange rates.
(D)
Revenue (refer to page 21), at 2017 budgeted foreign exchange rates.
(E)
Comparable Operating Profit (refer to page 21) including depreciation and amortisation and adjusting for capital expenditures and proceeds from sale of property, plant and equipment, budgeted restructuring cash expenditures (see below) and changes in operating working capital, at 2017 budgeted foreign exchange rates.
As outlined in the Remuneration Committee Chairman’s letter, the restructuring expense included in the definition of the operating profit measure and the cash restructuring expense included in the operating free cash flow measure were based on a number of assumptions that were difficult to budget for at the time the targets were set. A number of variances to these assumptions have occurred during the year resulting in the actual restructuring costs for the year being lower than those included in the budget.
To ensure that management did not benefit from any underspend in restructuring costs that arose purely as a result of a change in assumptions, the Committee determined that in calculating the bonus outcome, all restructuring expenses in respect of the operating profit measure and all cash restructuring costs in respect of the operating free cash flow measure should be held at budgeted rates. This resulted in a reduction to the formulaic bonus pay-out with a decrease in the Business Performance Factor from 1.74x to 1.27x.
2017 annual bonus outcome - IPF
The Remuneration Committee assessed Damian Gammell’s performance against a number of individual performance objectives in determining an appropriate IPF. Overall, the Committee determined that Damian performed very strongly as the leader of the business during 2017 and awarded in IPF of 1.15x. This strong performance included: successfully leading the continued integration of the business, building a strong leadership team, setting a clear strategy and making significant positive changes across the portfolio.
|
|
P a g e |
80
|
Further details of some of the specific objectives achieved are included in the table below:
|
Objective
|
Achievements
|
|
Deliver synergy savings
|
•
Synergy savings target for 2017 was met and CCEP remains on track to deliver pre-tax savings of €315m to €340m through synergies by mid-2019
|
|
Embedding a new CCEP culture
|
•
Damian has actively led and supported the implementation and roll-out of the new CCEP culture, leading to a significant impact on the understanding of CCEP key strategies and culture throughout the business
|
|
•
Over 350 senior leaders of the business have taken part in Accelerate Performance workshops to embed the new culture throughout the organisation
|
|
|
Driving further diversity through the organisation
|
•
Developed diversity and inclusion plans across each Business Unit and function with clear goals
|
|
•
Board endorsement for CCEP wide gender diversity target
|
|
|
Ensure that safety and wellbeing are priorities of the business
|
•
Lost time accident rate reduced significantly to 1.23
|
|
Delivery of the sustainability and packaging strategy approved by the Board
|
•
Full execution of this strategy has been delivered through the launch of the This is Forward programme
|
2017 annual bonus outcome - Calculation
Based on the level of performance achieved as set out above, this resulted in a bonus payment to Damian Gammell of £2.405 million:
|
Target bonus
(150% of base salary)
|
x
|
BPF
(1.27x)
|
x
|
IPF
(1.15x)
|
=
|
Final bonus outcome
(219% salary)
|
Long-term incentives
Awards vesting for performance in respect of 2017
Damian Gammell had no long-term incentive awards vesting in the year that were subject to performance conditions for the period ending 31 December 2017. Full details of all outstanding awards are shown on page 82.
Awards granted in 2017
A conditional award was made under the CCEP Long-Term Incentive Plan to Damian Gammell on 27 March 2017, prior to the current Remuneration Policy coming into effect.
This award comprised two elements: (i) a target award of 250% of salary aligned with the forward looking Remuneration Policy, in respect of Damian’s role as CEO of CCEP; and (ii) an additional transitional award with a target value of 120% of salary in recognition of Damian’s previous services and LTI opportunity as COO of Coca-Cola Enterprises, Inc. during 2016, for which he did not receive an award due to the timing of the Merger.
The first awards to be made fully under the new Remuneration Policy will be made in March 2018, further details of which are provided on page 85.
Further details of the award made in March 2017 are set out below:
|
Individual
|
Date of award
|
Maximum number of shares under award
|
Closing share price at date of award
|
Face value
|
Performance period
|
Normal vesting date
|
|
Damian Gammell
|
27/03/2017
|
267,400
|
$37.78
|
$10,102,372
|
1 Jan 2017 - 31 Dec 2019
|
28/03/2020
|
|
|
P a g e |
81
|
The vesting of awards is subject to the achievement of the following performance targets:
|
Measure
|
Definition
|
Weighting
|
Vesting level
(C)
|
||
|
25%
|
50%
|
100%
|
|||
|
EPS
(A)
|
Compound annual growth over the three year period to FY 2019
|
50%
|
4.0% p.a.
|
8.7% p.a.
|
12.0% p.a.
|
|
ROIC
(B)
|
ROIC achieved in the final year of the performance period (FY 2019)
|
50%
|
8.8%
|
10.4%
|
11.5%
|
|
(A)
|
Comparable and on a tax and currency neutral basis
|
(B)
ROIC calculated as comparable operating profit after tax, on a tax and currency neutral basis, divided by the average of opening and closing invested capital for the year. Invested capital is calculated as the addition of borrowings and equity less cash and cash equivalents.
|
(C)
|
Straight line vesting between each vesting level.
|
Historical TSR performance and Chief Executive Remuneration outcomes
The chart below compares the Total Shareholder Return (TSR) performance of the Company from Admission up until 31 December 2017 with the TSR of both the Euronext 100 and the S&P 500. These indices have been chosen as recognised equity market indices of companies of a similar size, complexity and global reach as the Company.
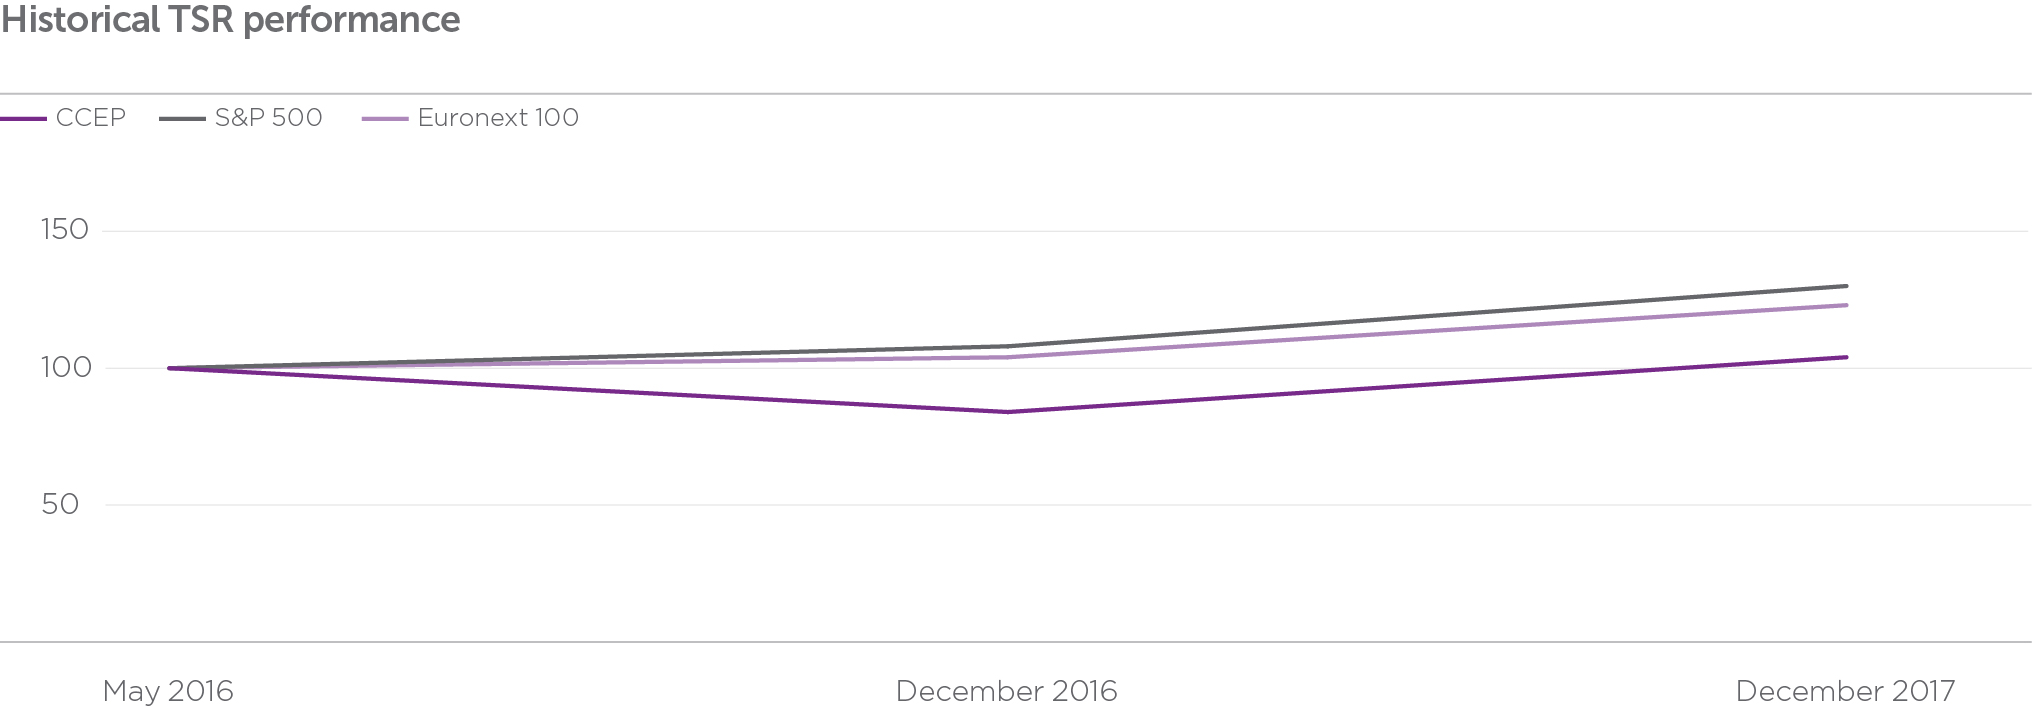
The following table summarises the historical total remuneration of the CEO’s single figure of total remuneration and annual bonus payout as a percentage of the maximum opportunity over this period:
|
2016
(A)
|
|
2016
(A)
|
|
2017
|
|
|
|
John Brock
|
|
Damian Gammell
|
|
Damian Gammell
|
|
|
|
CEO single figure of remuneration (‘000)
|
$3,890
|
|
£27
|
|
£3,716
|
|
|
Annual bonus payout (as a % of maximum opportunity)
|
31.23
|
%
|
40.6
|
%
|
60.7
|
%
|
|
LTI vesting (as a % of maximum opportunity)
|
N/A
|
|
N/A
|
|
N/A
|
|
|
(A)
|
The figures for 2016 are in respect of the period for which each individual served as CEO during the year. John Brock served as CEO from 29 May to 28 December 2016. Damian Gammell served as CEO from 29 December to 31 December 2016.
|
Requirements related to year on year changes
As the Company was listed in May 2016, details in respect of the percentage change in remuneration of the CEO and the relative importance of the spend on pay are not applicable this year as we have not yet completed two full financial years to compare on a like-for-like basis.
Payments to past Directors (audited)
As disclosed fully in last year’s Annual Report on Remuneration, payments were made to John Brock during the year in accordance with the rights and obligations set out in Mr Brock’s employment agreement as a result of his retirement following the change in control.
Payments for loss of office (audited)
There were no payments for loss of office during the year.
|
|
P a g e |
82
|
Statement of Directors’ share ownership and share interests (audited)
Interests of the CEO
As stated above, the CEO is required to hold 300% of his base salary in Company Shares. The guideline is expected to be met within five years of appointment. Until the guideline is met, 50% of any vested shares from incentive awards (post-tax) have to be retained. The guideline continues to apply for one year following termination of employment.
Share ownership requirements and the number of Shares held by Damian Gammell are set out in the table below.
Interests of the CEO
|
Interests in shares at 31 December 2017
|
|
Interests in share incentive schemes subject to performance conditions at 31 December 2017
(A)(B)
|
|
Interests in share incentive schemes not subject to performance conditions at 31 December 2017
(A)(C)
|
|
Interests in share option schemes
(A) (B)
|
|
Share ownership requirement as a % of salary
|
|
Share ownership as a % of salary achieved at 31 December 2017
(D)
|
|
|
|
Damian Gammell
|
39,145
|
|
267,400
|
|
99,300
|
|
324,643
|
|
300
|
%
|
212
|
%
|
(A)
For further details of these interests, please refer to the outstanding awards table below.
(B)
Do not count towards achievement of the share ownership guideline.
(C)
Count towards achievement of the share ownership guideline on an assumed net of tax basis.
(D)
The Company’s share ownership policy stipulates that the Remuneration Committee will translate the percentage of base salary requirement (300%) into a number of shares, using base salary (£1.1m), average of the high and low share price on the NYSE ($31.97), and the currency exchange rate (GBP/USD FX of 1:1.25604) on 1 December 2016. This results in a share ownership requirement for Damian Gammell of 129,651 shares.
Details of CEO outstanding awards
|
Director and grant date
|
Form of award
|
Exercise price
|
Number of shares subject to awards at 31 December 2016
|
|
Granted during the year
|
|
Vested during the year
|
|
Exercised during the year
|
|
Lapsed during the year
|
|
Number of shares subject to awards at 31 December 2017
|
|
End of performance period
|
Vesting date
|
Exercise period end
|
|
Damian Gammell
|
|||||||||||||||||
|
02.11.15
|
RSU
(A)
|
N/A
|
58,500
|
|
—
|
|
19,500
|
|
N/A
|
|
—
|
|
39,000
|
|
N/A
|
12.10.18
|
N/A
|
|
05.11.15
|
PSU
(B)
|
N/A
|
63,000
|
|
—
|
|
—
|
|
N/A
|
|
—
|
|
63,000
|
|
31.12.16
|
30.04.19
|
N/A
|
|
05.11.15
|
Options
(C)
|
$39.00
|
216,429
|
|
—
|
|
108,214
|
|
—
|
|
—
|
|
108,215
|
|
N/A
|
05.11.18
|
05.11.25
|
|
27.03.17
|
PSU
(D)
|
N/A
|
—
|
|
267,400
|
|
—
|
|
N/A
|
|
—
|
|
267,400
|
|
31.12.19
|
28.03.20
|
N/A
|
|
(A)
|
Restricted Stock Unit award vests in three tranches. First tranche (19,500) vested on 12 October 2016. Second tranche (19,500) vested on 12 October 2017. Final tranche (39,000) will vest on 12 October 2018.
|
|
(B)
|
Performance Share Unit - the performance condition was satisfied at target on 31 December 2016. Award will vest on 30 April 2019.
|
|
(C)
|
Options vest in three equal tranches. First tranche (108,214) vested on 5 November 2016. Second tranche (108,214) vested on 5 November 2017. Final tranche (108,215) will vest on 5 November 2018. All options remain unexercised.
|
|
(D)
|
Performance Share Unit - details of award set out on page 80. The number of shares shown is the maximum number of shares that may vest if the performance targets are met in full.
|
|
|
P a g e |
83
|
Interests of other Directors
The table below provides details of the share interests of each Non-executive Director either through direct ownership or connected persons
|
Interests in shares at 31 December 2017
|
|
|
Sol Daurella
(A)
|
32,312,263
|
|
Jan Bennink
|
27,200
|
|
José Ignacio Comenge Sánchez-Real
(A)
|
7,728,413
|
|
Christine Cross
|
0
|
|
J. Alexander M. Douglas, Jr
|
0
|
|
Javier Ferrán
|
0
|
|
Irial Finan
|
0
|
|
L. Phillip Humann
|
50,203
|
|
Orrin H. Ingram II
|
10,000
|
|
Thomas H. Johnson
|
10,000
|
|
Alfonso Líbano Daurella
(A)
|
6,493,803
|
|
Véronique Morali
|
0
|
|
Mario Rotllant Solá
|
0
|
|
Francisco Ruiz de la Torre Esporrín
|
0
|
|
Garry Watts
|
10,000
|
|
Curtis R. Welling
|
10,000
|
|
(A)
|
Shares held indirectly through Olive Partners, S.A. (Olive Partners).
|
Dilution levels
The terms of the Company’s share plans set limits on the number of newly issued shares that may be issued to satisfy awards. In accordance with guidance from the Investment Association, these limits restrict overall dilution under all plans to under 10% of the Company’s issued share capital over a 10 year period in relation to the Company’s issued share capital, with a further limitation of 5% in any 10 year period on discretionary plans.
|
|
P a g e |
84
|
Single Figure table for Non-executive Directors (audited)
The following table sets out the total fees and taxable benefits received by the Chairman and Non-executive Directors for the year ended 31 December 2017. The fees shown in respect of 2016 are from the date of the Company’s Admission (28 May 2016) up until 31 December 2016.
|
2017 (£’000)
|
2016 (£’000)
|
||||||||
|
Individual
|
Base fee
|
Chairman/ Committee fees
|
Taxable benefits (A)
|
Total fees
|
Base fee
|
Chairman/ Committee fees
|
Taxable benefits
(A)
|
Total fees
|
|
|
Sol Daurella
|
550
|
25
|
6
|
581
|
321
|
15
|
6
|
342
|
|
|
Jan Bennink
|
80
|
45
|
6
|
131
|
47
|
26
|
5
|
78
|
|
|
José Ignacio Comenge Sánchez-Real
|
80
|
15
|
6
|
101
|
47
|
9
|
4
|
60
|
|
|
Christine Cross
(B)
|
80
|
50
|
5
|
135
|
47
|
37
|
3
|
50
|
|
|
J. Alexander M. Douglas, Jr
|
80
|
10
|
7
|
97
|
47
|
6
|
5
|
58
|
|
|
Javier Ferrán
|
80
|
30
|
6
|
116
|
47
|
18
|
3
|
67
|
|
|
Irial Finan
|
80
|
25
|
6
|
111
|
47
|
15
|
6
|
67
|
|
|
L. Phillip Humann
|
80
|
20
|
11
|
111
|
47
|
12
|
7
|
66
|
|
|
Orrin H. Ingram II
|
80
|
25
|
8
|
113
|
47
|
15
|
4
|
65
|
|
|
Thomas H. Johnson
|
110
|
25
|
14
|
149
|
64
|
15
|
8
|
86
|
|
|
Alfonso Líbano Daurella
|
80
|
20
|
6
|
106
|
47
|
12
|
10
|
69
|
|
|
Véronique Morali
|
80
|
25
|
9
|
114
|
47
|
15
|
10
|
71
|
|
|
Mario Rotllant Solá
|
80
|
15
|
6
|
101
|
47
|
9
|
5
|
61
|
|
|
Francisco Ruiz de la Torre Esporrín
|
80
|
0
|
6
|
86
|
47
|
0
|
5
|
52
|
|
|
Garry Watts
|
80
|
50
|
4
|
134
|
47
|
29
|
2
|
77
|
|
|
Curtis R. Welling
|
80
|
25
|
8
|
113
|
47
|
15
|
6
|
68
|
|
|
(A)
|
Taxable benefits mainly relate to travel and accommodation costs in respect of attendance at Board meetings with FX rates used as at the date of the transaction. 2016 benefit figures have been updated to reflect the current agreement with HMRC, secured during 2017, in respect of taxable benefits relating to the 2016 financial year.
|
|
(B)
|
Chairman / Committee fees for 2016 have been updated to reflect payments that were made in 2017 in respect of duties performed in 2016.
|
Implementation of Remuneration Policy for 2018
Base salary
Damian Gammell received a 2.6% salary increase with effect from 1 April 2018 in line with the average increase provided to the wider UK workforce.
|
Individual
|
2017 salary
|
2018 salary (effective from 1 April)
|
% increase
|
|
Damian Gammell
|
£1,100,000
|
£1,128,600
|
2.6%
|
Taxable benefits
No significant changes to the provision of benefits are proposed for 2018. The main benefits for Damian Gammell will continue to include allowances in respect of: a car, financial planning and schooling, as well as private healthcare.
Pension
No changes are proposed in respect of the pension provision for Damian Gammell. He will continue to receive a cash allowance of £30,000 (inclusive of employer National Insurance contributions) in lieu of participation in the pension scheme.
|
|
P a g e |
85
|
Annual bonus
No changes have been made to the structure of the annual bonus plan for 2018 and the opportunity for Damian Gammell will remain unchanged at 150% of salary for target performance and 360% for maximum performance.
Performance will continue to be assessed against financial and individual performance measures on a multiplicative basis as set out on page 78. The financial measures and relative weightings will also remain unchanged:
|
Measure
|
Definition
|
Weighting
|
|
Operating Profit
|
Comparable Operating Profit including restructuring expenses, on a currency neutral basis
|
50%
|
|
Revenue
|
Revenue on a currency neutral basis
|
30%
|
|
Operating Free Cash Flow
|
Comparable Operating Profit before depreciation and amortisation and adjusting for capital expenditures, proceeds from sale of property, plant and equipment, restructuring cash expenditures and changes in operating working capital, on a constant currency basis.
|
20%
|
In determining the Individual Performance Factor for Damian Gammell for 2018 he will be assessed against five individual objectives which are focused on the five pillars of our strategic framework as well as the delivery of personal development objectives. This approach is consistent with that taken for all senior leaders of the business.
The five objectives are as follows:
|
•
|
Driving top line revenue growth
|
|
•
|
Improving the customer experience
|
|
•
|
Strategic cost management
|
|
•
|
Building stakeholder equity
|
|
•
|
Leading the development of the CCEP culture, talent and diversity
|
The actual financial targets are not disclosed prospectively as they are deemed commercially sensitive. It is intended that they will be disclosed in next year’s Annual Remuneration Report. A description of individual performance including specific quantitative measures (where appropriate) will also be disclosed in next year’s Annual Remuneration Report.
Long-term incentive
Damian Gammell’s long-term incentive opportunity for 2018 will be aligned with the limits set out in the Remuneration Policy. He will be made a target award of 250% of salary and may receive up to 2x this target award if the maximum performance targets are achieved.
Performance will be assessed against the following EPS and ROIC targets over a three year period, each with an equal weighting. Targets have been set at stretching levels taking into account both the Company’s long-term plan and external forecasts.
|
Measure
|
Definition
|
Weighting
|
Vesting level
(C)
|
||
|
25%
|
100%
|
200%
|
|||
|
EPS
(A)
|
Compound annual growth over the three year period to FY 2020
|
50%
|
4.0%
|
7.5%
|
11.0%
|
|
ROIC
(B)
|
ROIC achieved in the final year of the performance period (FY 2020)
|
50%
|
9.5%
|
11.0%
|
12.5%
|
|
(A)
|
Comparable and on a tax and currency neutral basis.
|
|
(B)
|
ROIC calculated as comparable operating profit after tax, on a tax and currency neutral basis, divided by the average of opening and closing invested capital for the year. Invested capital is calculated as the addition of borrowings and equity less cash and cash equivalents.
|
|
(C)
|
Straight line vesting between each vesting level.
|
|
|
P a g e |
86
|
Chairman and Non-executive Director fees
No changes have been made to the fees of the Chairman and Non-executive Directors which are as set out in the table below:
|
Role
|
Fees
|
|
|
Chairman
|
£550,000
|
|
|
Non-executive Directors’ basic fee
|
£80,000
|
|
|
Additional fee for Senior Independent Director
|
£30,000
|
|
|
Additional fee for Committee Chairman:
|
Audit, Remuneration and ATC
|
£35,000
|
|
Nomination and CSR
|
£20,000
|
|
|
Additional fee for Committee Membership:
|
Audit, Remuneration and ATC
|
£15,000
|
|
Nomination and CSR
|
£10,000
|
|
The Remuneration Committee
The terms of the compensation of the CEO and fees for the Non-executive Directors and Chairman are determined by the entire Board upon the recommendation of the Remuneration Committee. The Remuneration Committee also has the responsibility of approving the Remuneration Policy and setting the remuneration for each member of the Executive Leadership Team reporting to the CEO. The Remuneration Committee’s terms of reference were approved on 17 May 2016 and can be found in the corporate governance section within the Investors section of our website at http://ir.ccep.com.
Remuneration Committee members and attendance
In line with the Shareholders’ Agreement, the Remuneration Committee has five members including three independent Non-executive Directors, one Director nominated by Olive Partners and one Director nominated by European Refreshments (an indirect subsidiary of The Coca-Cola Company). The Committee met five times during the year, with attendance as follows:
|
Attendance
|
|
|
Christine Cross (Chairman of the Remuneration Committee)
|
5/5
|
|
Irial Finan (European Refreshments nominated Director)
|
5/5
|
|
Tom Johnson
|
5/5
|
|
Mario Rotllant Solá (Olive Partners nominated Director)
|
5/5
|
|
Garry Watts
|
5/5
|
|
|
P a g e |
87
|
Remuneration Committee key activities
The table below provides an overview of the key agenda items discussed at each meeting of the Remuneration Committee during 2017:
|
Meeting date
|
Key agenda items
|
|
March 2017 (2 meetings)
|
•
Determine performance outcomes for 2016 annual bonus
|
|
•
Determination of financial performance targets for the 2017 annual bonus and LTIP awards
|
|
|
•
2017 Executive Leadership Team (ELT) objectives
|
|
|
•
Granting of 2017 LTIP awards
|
|
|
•
Review of Remuneration Policy and Annual Report on Remuneration
|
|
|
•
Pension arrangements for high earners in the UK
|
|
|
•
Remuneration Committee performance review
|
|
|
May 2017
|
•
Annual pension review
|
|
•
Review of terms of reference
|
|
|
•
Advisor performance review
|
|
|
October 2017
|
•
Corporate governance update
|
|
•
Treatment of legacy German cash long-term incentive awards
|
|
|
•
Gender pay review
|
|
|
•
Review of international mobility programmes
|
|
|
December 2017
|
•
Review of first draft of the Annual Report on Remuneration
|
|
•
Update on 2017 annual bonus performance
|
|
|
•
Base pay design for 2018
|
|
|
•
Annual bonus and LTIP design for 2018
|
|
|
•
2018 ELT objectives
|
|
Support for the Remuneration Committee
During the year, Deloitte LLP (Deloitte) provided the Remuneration Committee with external advice on executive remuneration. Deloitte is a member of the Remuneration Consultants Group and has voluntarily signed up to the Remuneration Consultants’ Code of Conduct in relation to executive remuneration consulting in the UK. The Remuneration Committee is satisfied that the engagement partner and team which provides advice to the Remuneration Committee do not have connections with the Company that may impair their independence. During 2017, the wider Deloitte firm also provided CCEP with unrelated tax and consultancy services, including employment tax and financial advisory services.
Total fees received by Deloitte in relation to the remuneration advice provided to the Remuneration Committee during the year amounted to £28,600 based on the required time commitment.
The Chairman, the CEO, the CFO, and the Chief Human Resources Officer attended meetings by invitation of the Remuneration Committee in order to provide the Remuneration Committee with additional context or information, except where their own remuneration was discussed.
Summary of voting outcomes at the 2017 AGM
The table below shows how shareholders voted in respect of the Remuneration Policy and Annual Report on Remuneration at the AGM held on 22 June 2017:
|
Resolution
|
Votes For (%)
|
Votes Against (%)
|
Number of votes Withheld
|
|
Approval of the Annual Report on Remuneration
|
99.90%
|
0.10%
|
50,488
|
|
Approval of the Remuneration Policy
|
90.27%
|
9.73%
|
152,723
|
This Directors’ Remuneration Report is approved by the Board and signed on its behalf by
Christine Cross
Chairman of the Remuneration Committee
15 March 2018
|
|
P a g e |
88
|
DIRECTORS’ REPORT
The Directors present their report together with the audited consolidated financial statements of the Group and of the Company, Coca-Cola European Partners plc (CCEP), registered in England and Wales number 9717350, for the year ended 31 December 2017.
This report has been prepared in accordance with the applicable information disclosure requirements of the Companies Act 2006 (the Companies Act), the Listing Rules (the LRs), the Disclosure Guidance and Transparency Rules (the DTRs) and the Statutory Audit Services for Large Companies Market Investigation (Mandatory Use of Competitive Tender Processes and Audit Committee Responsibilities) Order 2014, as published by the UK Competition and Markets Authority (with which the Company complies voluntarily). In addition, this document has been prepared taking into account the applicable requirements of the US Securities Exchange Commission for a foreign private issuer.
As permitted by legislation, the information and disclosures that are required under the Companies Act, the LRs and the DTRs that are included elsewhere in the Annual Report and are incorporated into this report by reference are set out in table 1 on page 89.
This Directors’ Report and the Strategic Report contained on pages 6 to 39 together represent the management report for the purpose of compliance with DTR 4.1.8R.
Directors
Those who served as Directors during the year ended 31 December 2017 and as at the date of this Annual Report are listed, along with brief biographies for those Directors in position as at the date of this Annual Report, on pages 45 to 49.
Further information on the remuneration of, and contractual arrangements for, the current Executive and Non-executive Directors is set out in the Directors’ Remuneration Report on pages 74 to 87 and in the Directors and Senior Management section of Other Group Information on page 173.
Appointment and replacement of Directors
In accordance with the Company’s Articles of Association (the Articles), Directors may be appointed by ordinary resolution of the shareholders or by the Board. Under the Articles, Olive Partners, S.A. (Olive Partners) and European Refreshments (ER), a wholly owned subsidiary of The Coca-Cola Company (TCCC), each have the right to nominate a specified number of Directors if their respective equity proportions are above a certain percentage of the Company’s issued shares. The majority of the Directors on the Board must be independent. A proposed replacement for an Independent Non-executive Director (INED) must be nominated by the Nomination Committee and approved by the Board.
Each of the Directors, except the initial Chairman and the initial INEDs, shall retire at each Annual General Meeting (AGM) and, if eligible, may offer themselves for re-election. This year, it is expected that all Directors in office as at the date of this Annual Report, except the Chairman and the INEDs, will stand for re-election at the AGM. The Board considers that each of the Directors standing for re-election continues to be effective and that each of them demonstrates a strong commitment to their role.
More information about the appointment and removal of Directors is set out in the Corporate Governance Report on page 52 and in the summary of the main provisions of the Articles in the section of the Annual Report entitled Other Group Information on page 182.
Powers of Directors
Subject to the provisions of relevant legislation, the Articles and any directions given by a special resolution of the shareholders, the Board may exercise all the powers of the Company and may delegate authorities to committees and management as it sees fit. More information about the powers of Directors is set out in the Roles and responsibilities of the Board section of the Corporate Governance Report on page 54.
|
|
P a g e |
89
|
Table 1: Information and disclosures included elsewhere in the Annual Report
|
Disclosure
|
Section of Annual Report
|
Page(s)
|
|
Names of Directors during the year
|
Board of Directors
|
45 to 49
|
|
Review of performance, financial position and likely future developments
|
Strategic Report
|
6 to 39
|
|
Dividends
|
Dividends section of the Strategic Report and Note 15 to the consolidated financial statements
|
20 and 141
|
|
Principal risks and uncertainties
|
Principal risks and uncertainties section of the Strategic Report
|
26 to 28
|
|
Events occurring after the reporting period
|
Note 25 to the consolidated financial statements
|
160
|
|
Financial instruments and financial risk management
|
Notes 11 and 23 to the consolidated financial statements
|
129 to 132
and 156 to 158
|
|
Cash balances and borrowings
|
Notes 9 and 12 to the consolidated financial statements
|
127
and 132 to 134
|
|
Employment of disabled persons
|
Sustainability section of the Strategic Report
|
22 to 23
|
|
Greenhouse gas emissions
|
Sustainability section of the Strategic Report
|
24 to 25
|
|
Responsibility statement
|
Directors’ Responsibilities Statement
|
92 to 93
|
Summaries of the roles and responsibilities of the main Committees of the Board can be found in:
|
•
|
The Corporate Governance Report (on page 57)
|
|
•
|
The Nomination Committee Report (from page 66)
|
|
•
|
The Audit Committee Report (from page 69)
|
|
•
|
The Directors’ Remuneration Report (from page 78)
|
The detailed roles and responsibilities of the Committees are contained in their terms of reference, which can be found on the CCEP website http://ir.ccep.com/corporate-governance/governance-documents.
Directors’ indemnity arrangements
Each Director who served on the Board during 2017 and to the date of this Annual Report had the benefit of a qualifying third party deed of indemnity. The Company has also purchased and maintained directors’ and officers’ liability insurance for the benefit of Directors and officers of the Company and its subsidiaries throughout 2017 and to the date of this Annual Report.
Amendment of Articles of Association
The Company may make amendments to the Articles by way of special resolution in accordance with the Companies Act.
Political donations
The Group made no political donations and incurred no political expenditure during 2017 (2016: nil). Our policy is not to make political donations or incur political expenditure in the EU of the type covered by the Companies Act, and we have no current intentions to change this policy. However, as a result of the wide definitions in the Companies Act, there is some uncertainty over whether some normal expenditure and business activities that might not be considered to be political donations or political expenditure in the usual sense could be caught. We will, therefore, seek shareholder approval to enable the Group to make donations or incur expenditure in the EU on a precautionary basis to avoid any unintentional breach of the relevant laws and regulations.
Shares
Share capital
The Company’s share capital consists entirely of ordinary shares with a nominal value of €0.01 (Shares), all of which are fully paid up and rank equally in all respects. Details of the Company’s issued share capital, including changes during the year, are set out in Note 15 to the consolidated financial statements on page 140.
Details of the markets on which the Company’s Shares are admitted to trading are provided in the Nature of trading market section in Other Group Information on page 173.
|
|
P a g e |
90
|
Rights and obligations attaching to Shares
The rights and obligations attaching to the Company’s Shares, in addition to those conferred on their holders by law, are set out in the Articles, which are available on the CCEP website http://ir.ccep.com/corporate-governance/governance-documents. In addition, a summary of the main provisions of the Articles is provided in the section of this Report entitled Other Group Information on pages 179 to 182.
In summary, the Shares have attached to them full voting, dividend and capital distribution (including winding up) rights and rank equally in respect of any such dividend or distribution. Every holder present in person or by proxy at general meetings of the Company may exercise one vote on a poll per Share held.
The Shares of the Company are, upon issuance, fully paid and free from all liens, equities, charges, encumbrances and other interest of the Company and not subject to calls of any kind.
Restrictions on transfer of securities
Shares are freely transferable and free from all liens and from any restriction on the right of transfer, subject to generally applicable restrictions imposed by applicable laws and regulations. Each of ER and Olive Partners is, however, subject to certain restrictions on the disposal or acquisition of the Company’s Shares under the terms of the Shareholders’ Agreement.
Rights under employee share plans
Shares acquired through CCEP’s employee share plans rank equally with all other Shares in issue and have no special rights. Shares held in trust on behalf of participants in the UK Employee Share Plan and the Belgian and Luxembourg Share Savings Plan are voted by the trustee, Link Market Services Trustees Limited, as directed by the plan participants.
Significant shareholdings
Table 2 shows the interests in Shares of which the Company had been notified, in accordance with the DTRs, as at the year end and as at the date of this Annual Report. The percentages disclosed were calculated at the date on which the relevant disclosures were made in accordance with the DTRs. The shareholders detailed in table 2 have the same voting rights at a general meeting of the Company as all other shareholders.
Table 2: Interests in Shares of which the Company has been notified
|
Shareholder
|
Percentage of total voting rights
|
Number of total voting rights
|
|
Cobega, S.A.
(A)
|
34.4%
|
166,128,987
|
|
TCCC
(B)
|
18.21%
|
87,950,640
|
|
The Capital Group Companies, Inc.
(C)
|
5.0266%
|
24,357,484
|
(A)
Held indirectly through its 55.6% owned subsidiary, Olive Partners.
(B)
Held indirectly through ER.
(C)
The Capital Group Companies, Inc. (Capital Group) notified us on 12 September 2017 of its interest, in accordance with the DTRs (when its interest increased to above 5%). This was the first such notification received by us from Capital Group. It notified us of changes in its interest on 17 November 2017 (when its interest decreased to below 5%) and on 8 December 2017 (when its interest increased to above 5%). On 14 February 2018, Capital World Investors filed a Schedule 13G with the SEC confirming an interest in 25,273,254 Shares, representing 5.2% of the issued Shares; this change would not have required a notification under the DTRs.
Own share purchases
At the AGM held in 2017, shareholders granted authority for the Company to purchase up to 48,385,633 Shares in the market, representing 10% of its issued Shares as at 5
May 2017. The Directors confirmed on seeking this authority that they had no intention of exercising it, other than to offset the dilutive effect of the issues of new Shares under the Company’s employee share plans.
No Shares were purchased pursuant to this authority during 2017 or to the date of this Annual Report. This authority will expire at the forthcoming AGM and the Company will seek shareholder approval for an authority to undertake on-market and off-market purchases at this year’s AGM.
Change of control
There are a number of agreements that take effect, alter or terminate upon a change of control of the Company following a takeover bid, such as bank loan agreements, employee share plans and some IT provider agreements. None of these are deemed to be significant in terms of their potential impact on the business of the Group as a whole, except for:
|
•
|
The bottling agreements entered into between TCCC, the Company and the bottling subsidiaries of the Company
|
|
•
|
Two bank credit facilities agreements under which the total aggregate amount outstanding could be a maximum of €2.5 billion
|
|
|
P a g e |
91
|
There are no agreements in place with any Director or officer that would provide compensation for loss of office or employment resulting from a takeover, except that provisions of the Company’s employee share plans may cause awards granted under such schemes to vest on a takeover.
Research and development
CCEP invests in the development of innovative solutions, digital capabilities and advanced analytics to drive simplification of applications and platforms to support and grow its business.
Employee involvement
Employee communication
CCEP is committed to communicating clearly, transparently and in a timely manner with its employees and their representatives. All employees have access to news and information in local languages about CCEP, its leadership, performance and plans via intranet sites, printed materials and meetings with management. Through these channels, as well as through CCEP’s published results, CCEP’s management updates the workforce on both overall and local performance.
CCEP also meets regularly with the European, national and local works councils, and trade unions as appropriate, that represent the Group’s employees. When required, CCEP engages in consultation with employees and their representatives in an effective dialogue around proposed measures prior to making decisions. This process is managed via the appropriate elected representative bodies at national and/or local levels. CCEP is committed to having a constructive and meaningful dialogue. During consultation, employee representatives have the opportunity to ask questions, share views, propose alternatives and formulate opinions on proposals before a final decision is taken by management.
Share ownership
Additionally, many employees participate in incentive programmes or share ownership schemes that are tied to Company performance, giving them a direct vested interest in the Group’s results. Details of the incentive programmes and share ownership schemes are provided in the Share-based payments awards section of Share capital in Other Group Information on page 174.
In the UK, we offer an Employee Share Plan (ESP) that provides a tax efficient mechanism for employees to become shareholders through salary sacrifice arrangements. Approximately 66% of eligible employees participated in the ESP as at 31 December 2017. As the ESP is subject to certain statutory limits, we also offer UK employees a mechanism that enables them to acquire more shares out of their post-tax pay and hold them via a nominee.
Independent auditor
Disclosure of information to auditors
Each person who is a Director at the date of approval of this report confirms that:
|
•
|
so far as he or she is aware, there is no relevant audit information (as defined by section 418 of the
Companies
Act) of which the Company’s auditor is unaware; and
|
|
•
|
each Director has taken all the reasonable steps that he or she ought to have taken as a Director in order to make himself or herself aware of any relevant audit information and to establish that the Company’s auditor is aware of that information.
|
Auditor reappointment
The Company’s independent auditor, Ernst & Young LLP, has expressed its willingness to continue in office and resolutions for its reappointment and to authorise the Audit Committee to determine its remuneration will be proposed at the forthcoming AGM.
Going concern
The Directors have prepared cash flow forecasts for the Group for a period in excess of 12 months from the date of approval of the 2017 financial statements. These forecasts reflect an assessment of current and future end market conditions and their impact on the Group’s future trading performance. The forecasts show that the Group will be able to operate within the current committed debt facilities and show continued compliance with the Company’s financial covenants. On the basis of the exercise described above and the Group’s available committed debt facilities, the Directors consider that the Group and Company have adequate resources to continue in operational existence for a period of at least 12 months from the date of signing these accounts. Accordingly, they continue to adopt a going concern basis in preparing the financial statements of the Group and the Company.
The Directors’ Report has been approved by the Board and is signed on its behalf by
Clare Wardle
Company Secretary
15 March 2018
|
|
P a g e |
92
|
DIRECTORS’ RESPONSIBILITIES STATEMENT
Responsibility for preparing financial statements
The Directors are responsible for preparing the Annual Report and the financial statements in accordance with applicable law and regulations.
UK company law requires the Directors to prepare financial statements for each financial year. Under that law the Directors are required to prepare group financial statements in accordance with International Financial Reporting Standards (IFRSs) as adopted by the European Union and Article 4 of the IAS Regulations and have elected to prepare the parent company financial statements in accordance with United Kingdom Generally Accepted Accounting Practice (United Kingdom accounting standards and applicable law) including FRS 101 “Reduced Disclosure Framework”. In preparing the consolidated group financial statements the Directors have also elected to comply with IFRSs as issued by the International Accounting Standards Board (IASB).
Under section 393 of the Companies Act 2006 (the Companies Act), the Directors must not approve the accounts unless they are satisfied that they give a true and fair view of the state of affairs of the Company and of the profit or loss of the Company for that period.
In preparing the Company financial statements, the Directors are required to:
|
•
|
Select suitable accounting policies and apply them consistently
|
|
•
|
Make judgements and accounting estimates that are reasonable and prudent
|
|
•
|
Follow applicable UK Accounting Standards (except where any departures from this requirement are explained in the notes to the parent company financial statements)
|
|
•
|
Prepare the financial statements on the going concern basis unless it is inappropriate to presume that the Company will continue in business
|
In preparing the Group financial statements in accordance with IAS 1, “Presentation of Financial Statements”, the Directors are required to:
|
•
|
Select suitable accounting policies and apply them consistently
|
|
•
|
Present information, including accounting policies, in a manner that provides relevant, reliable, comparable and understandable information
|
|
•
|
Provide additional disclosures when compliance with the specific requirements in IFRS are insufficient to enable users to understand the impact of particular transactions, other events and conditions on the entity’s financial performance
|
|
•
|
Make an assessment of the Group’s ability to continue as a going concern
|
The Directors are responsible for keeping adequate accounting records that are sufficient to show and explain the Company’s transactions and disclose with reasonable accuracy at any time the financial position of the Company and enable them to ensure that the financial statements comply with the Companies Act. They are responsible for safeguarding the assets of the Company and hence for taking reasonable steps for the prevention and detection of fraud and other irregularities.
The Directors are responsible for the maintenance and integrity of the corporate and financial information included on the Company’s website. Legislation, regulation and practice in the UK governing the preparation and dissemination of financial statements may differ from legislation, regulation and practice in other jurisdictions.
|
|
P a g e |
93
|
Responsibility statement
The Directors, whose names and functions are set out on pages 45 to 49, confirm that to the best of their knowledge:
|
•
|
the financial statements, prepared in accordance with the relevant financial reporting framework, give a true and fair view of the assets, liabilities, financial position and profit or loss of the Company and the undertakings included in the consolidation taken as a whole;
|
|
•
|
the management report includes a fair review of the development and performance of the business and the position of the Company and the undertakings included in the consolidation taken as a whole, together with a description of the principal risks and uncertainties they face; and
|
|
•
|
the Annual Report and financial statements, taken as a whole are fair, balanced and understandable and provide the information necessary for shareholders to assess the Company’s position and performance, business model and strategy.
|
By order of the Board
Clare Wardle
Company Secretary
15 March 2018


|
|
P a g e |
96
|
INDEPENDENT AUDITOR’S REPORT TO THE MEMBERS OF COCA-COLA EUROPEAN PARTNERS PLC
Report on the financial statements
Opinion
In our opinion:
|
•
|
Coca-Cola European Partners plc’s Group financial statements and Parent company financial statements (the financial statements) give a true and fair view of the state of the group’s and of the parent company’s affairs as at 31 December 2017 and of the group’s profit for the year then ended;
|
|
•
|
the group financial statements have been properly prepared in accordance with International Financial Reporting Standards (IFRSs) as adopted by the European Union;
|
|
•
|
the parent company financial statements been properly prepared in accordance with United Kingdom accounting standards including FRS 101 “Reduced Disclosure Framework; and
|
|
•
|
the financial statements have been prepared in accordance with the requirements of the Companies Act 2006 and, as regards the group financial statements, Article 4 of the IAS Regulation.
|
We have audited the financial statements of Coca-Cola European Partners plc which comprise:
|
Group
|
Parent company
|
|
Consolidated income statement for the year then ended
|
Statement of financial position as at 31 December 2017
|
|
Consolidated statement of comprehensive income for the year then ended
|
Statement of changes in equity for the year then ended
|
|
Consolidated statement of financial position as at 31 December 2017
|
Related notes 1 to 14 to the financial statements including a summary of significant accounting policies
|
|
Consolidated statement of cash flows for the year then ended
|
|
|
Consolidated statement of changes in equity for the year then ended
|
|
|
Related notes 1 to 26 to the consolidated financial statements including a summary of significant accounting policies
|
|
The financial reporting framework that has been applied in their preparation is applicable law and International Financial Reporting Standards (IFRSs) as adopted by the European Union and; as explained in the accounting policies set out in the Group Financial Statements, the Group, in addition to complying with its legal obligation to apply IFRS as adopted by the EU, has also applied IFRS as issued by the IASB. In our opinion, the Consolidated Financial Statements comply with IFRS as issued by the IASB. The financial reporting framework that has been applied in the preparation of the Parent company financial statements is applicable law and United Kingdom Accounting Standards, including FRS 101 “Reduced Disclosure Framework”.
Basis for opinion
We conducted our audit in accordance with International Standards on Auditing (UK) (ISAs (UK)) and applicable law. Our responsibilities under those standards are further described in the Auditor’s responsibilities for the audit of the financial statements section of our report below. We are independent of the group and parent company in accordance with the ethical requirements that are relevant to our audit of the financial statements in the UK, including the FRC’s Ethical Standard as applied to listed public interest entities, and we have fulfilled our other ethical responsibilities in accordance with these requirements.
We believe that the audit evidence we have obtained is sufficient and appropriate to provide a basis for our opinion.
Use of our report
This report is made solely to the company’s members, as a body, in accordance with Chapter 3 of Part 16 of the Companies Act 2006. Our audit work has been undertaken so that we might state to the company’s members those matters we are required to state to them in an auditor’s report and for no other purpose. To the fullest extent permitted by law, we do not accept or assume responsibility to anyone other than the company and the company’s members as a body, for our audit work, for this report, or for the opinions we have formed.
This page does not form part of Coca-Cola European Partners plc Annual Report on Form 20-F for the year ended 31 December 2017 as filed with the SEC
|
|
P a g e |
97
|
Conclusions relating to principal risks, going concern and viability statement
We have nothing to report in respect of the following information in the Annual Report, in relation to which the ISAs (UK) require us to report to you whether we have anything material to add or draw attention to:
|
•
|
the disclosures in the annual report set out on page 27 that describe the principal risks and explain how they are being managed or mitigated;
|
|
•
|
the directors’ confirmation set out on page 26 in the annual report that they have carried out a robust assessment of the principal risks facing the entity, including those that would threaten its business model, future performance, solvency or liquidity;
|
|
•
|
the directors’ statement set out on page 91 in the financial statements about whether they considered it appropriate to adopt the going concern basis of accounting in preparing them, and their identification of any material uncertainties to the entity’s ability to continue to do so over a period of at least twelve months from the date of approval of the financial statements;
|
|
•
|
whether the directors’ statement in relation to going concern required under the Listing Rules in accordance with Listing Rule 9.8.6R(3) is materially inconsistent with our knowledge obtained in the audit; or
|
|
•
|
the directors’ explanation set out on page 90 in the annual report as to how they have assessed the prospects of the entity, over what period they have done so and why they consider that period to be appropriate, and their statement as to whether they have a reasonable expectation that the entity will be able to continue in operation and meet its liabilities as they fall due over the period of their assessment, including any related disclosures drawing attention to any necessary qualifications or assumptions.
|
Overview of our audit approach
|
Key audit matters
|
•
Aspects of Revenue Recognition
•
Taxation: recoverability of deferred tax assets and uncertain tax positions
•
Carrying value of goodwill and indefinite lived intangibles
|
|
Audit scope
|
•
We performed an audit of the complete financial information of six components and audit procedures on specific balances for a further six components.
•
The components where we performed full or specific audit procedures accounted for 94% of profit before taxation, 91% of revenue and 96% of total assets.
|
|
•
Overall group materiality of €58 million which represents 5% of group profit before taxation.
|
|
Key audit matters
Key audit matters are those matters that, in our professional judgement, were of most significance in our audit of the financial statements of the current period and include the most significant assessed risks of material misstatement (whether or not due to fraud) that we identified. These matters included those which had the greatest effect on: the overall audit strategy, the allocation of resources in the audit; and directing the efforts of the engagement team. These matters were addressed in the context of our audit of the financial statements as a whole, and in our opinion thereon, and we do not provide a separate opinion on these matters.
This page does not form part of Coca-Cola European Partners plc Annual Report on Form 20-F for the year ended 31 December 2017 as filed with the SEC
|
|
P a g e |
98
|
|
Risk
|
Our response to the risk
|
Key observations communicated to the Audit Committee
|
|
Aspects of revenue recognition (2017: €2.9 billion, 2016: €2.5 billion)
Refer to the Audit Committee Report (page 69); Accounting policies (page 158); and Note 13 of the Consolidated Financial Statements (page 134) The Group participates in various programmes and arrangements with customers referred to as customer marketing programmes and sales incentives, which are recorded as deductions from revenue. These totalled €2.9 billion for the year ended 31 December 2017 (2016: €2.5 billion). The types of programmes are disclosed in Note 1 to the financial statements. Our audit risk is related to manipulation of revenues through the measurement of the customer marketing allowances. We focus on the areas where management applies judgement, where the processing is either manual or more complex, and where the quantum of agreements is high.
Our assessment of the risk remained broadly unchanged compared to 2016.
|
We performed full audit procedures over this risk area in nine components, which covered 98% of the risk amount.
We walked through and tested the design and operating effectiveness of controls, including IT controls, in place within the customer marketing programmes process. We were able to take a controls-reliance approach over the process in all locations. We confirmed the existence and the terms of a sample of customer marketing programmes by obtaining evidence of deal documentation. We tested the completeness and valuation of balance sheet amounts recognised in trade and other payables by reviewing post-period end settlement. We also performed a ‘look-back’ analysis of prior period balance sheet amounts to validate that these amounts were appropriately settled. We tested settlement of customer marketing programmes balances throughout the year on a sample basis and performed cut-off testing procedures including review of post period end settlements. When estimation was inherent in the calculation of accruals, we challenged assumptions inherent in the calculation of the accrual by testing deals to settlement. We tested the assumptions utilised in the calculations, including consideration of any changes in the business environment that would warrant changes in the methodology utilised from prior year and the presence of any contrary evidence. In nine full and specific scope components, we performed correlation analysis between sales, accounts receivable, and cash utilising journal data to identify and test unusual and unexpected journals. We obtained and inspected documentation for any material unusual or unexpected journals which were made. We reviewed management’s disclosure in respect of customer marketing programme amounts recorded in the income statement and statement of financial position. |
Customer marketing agreements are appropriately recognised in the income statement and balance sheet, and the related disclosures included in the financial statements are appropriate.
|
This page does not form part of Coca-Cola European Partners plc Annual Report on Form 20-F for the year ended 31 December 2017 as filed with the SEC
|
|
P a g e |
99
|
|
Risk
|
Our response to the risk
|
Key observations communicated to the Audit Committee
|
|
Carrying value of goodwill and indefinite lived intangibles (2017: €10,629 million, 2016: €10,430 million)
Refer to the Audit Committee Report (page 69); Accounting policies (page 114); and Note 5 of the Consolidated Financial Statements (page 120). We focus on this area due to the materiality of the account balances and because the directors’ assessment of ‘value in use’ of the Group’s Cash Generating Units (CGUs) involves judgement about the future results of the business, long term growth rates and the discount rates applied to future cash flow forecasts. We note that in accordance with IAS 36, management has disclosed that a reasonably possible change in discount rates and long term growth rate assumptions could lead to impairment in some CGUs where no impairment is currently recognised. |
We performed audit procedures on all impairment models relating to material cash generating units. Our audit procedures were performed by the Group audit team.
We walked through and tested the design and operating effectiveness of controls, including IT controls, in place within the impairment review process. We were able to take a controls-reliance approach over the process. Our audit procedures included the evaluation of management’s assumptions used in their impairment models. The assumptions to which the models were most sensitive and most likely to lead to impairment were:
•
Discount rate;
•
Gross and operating margins; and
•
Terminal growth rate.
We corroborated management’s assumptions with reference to historical data and, where applicable, external benchmarks.
We examined those CGUs with lower available headroom more closely, of those the most significant CGU was Germany, where we also
•
critically assessed management`s historical accuracy in determining assumptions by comparing actual results with previously forecasted results,
•
considered any contrary evidence available for the assumptions, and
•
performed additional sensitivity analysis on the significant management judgements to assess whether a reasonably possible change in certain assumptions to which the model is most sensitive could lead to an impairment charge.
We tested the integrity of models with the assistance of our own specialists and carried out audit procedures on management’s sensitivity calculations.
We performed testing on the accounting for synergy benefits and expenses for compliance with the requirements of IAS 36.
We reviewed the appropriateness of the related disclosures provided in the Group financial statements including review for completeness of the disclosures regarding those CGUs with material goodwill balances and where a reasonably possible change in certain variables could lead to impairment charges.
|
We agree with management’s conclusion that no impairment is required. We consider management’s estimates to be appropriate, with all assumptions within an acceptable range.
We concluded that the related disclosures provided in the Consolidated Financial Statements are appropriate. |
This page does not form part of Coca-Cola European Partners plc Annual Report on Form 20-F for the year ended 31 December 2017 as filed with the SEC
|
|
P a g e |
100
|
|
Risk
|
Our response to the risk
|
Key observations communicated to the Audit Committee
|
|
Taxation: recoverability of deferred tax assets and uncertain tax positions
Refer to the Audit Committee Report (page 69); Accounting policies (page 114); and Note 19 of the Consolidated Financial Statements (page 147). The Group is subject to income tax in numerous jurisdictions including the US, where the Tax Cuts and Jobs Act was enacted on 22 December 2017. The Group is also involved in various legal proceedings relating to tax matters.
We focused our audit effort on recoverability of deferred tax assets (2017:€56 million, 2016: €274 million) which are recorded primarily within Spain, Germany and the US, as well as the uncertain tax positions arising from the ongoing tax audits within the group, specifically within Spain and at the pan-European level. Recognition and accounting of deferred tax assets was considered to be a judgemental area due to ongoing changes in certain jurisdictions’ profitability and business models, as well as the enactment of US tax reform.
|
Audit procedures over this risk area were performed in part by the primary team, as well as by full scope component teams with Primary Team oversight.
We walked through and tested the design and operating effectiveness of controls, including IT controls, in place to mitigate the risks within each process. We were able to take a controls-reliance approach over the process in all locations.
We inspected management’s assessment of the recoverability of deferred tax assets by considering recent changes in tax legislation, expected sources of income and the timeframe required to utilise the deferred tax asset. We challenged management’s assumptions on expected profitability projections with the assistance of our own specialists and carried out audit procedures on management’s sensitivity calculations. Assisted by our US tax specialists, we obtained and inspected analyses prepared by management related to the enactment of US tax reform, including the supporting calculations and assessment of recoverability of related deferred tax assets, to test the adjustments and provisions booked as a result of this legislation. Assisted by our tax specialists, we tested the material tax positions taken by the group in each significant jurisdiction (Spain and Germany) and at the pan-European level in the context of local tax law. We also reviewed correspondence with tax authorities and considered the status of any tax audits, historic and current.
We have obtained management’s assessment of risk from legal proceedings in relation to the tax position and have obtained the legal documentation which supports each position.
We have tested the recoverability of VAT receivable recorded in Iberia to supporting documentation (2017: €235 million, 2016: €179 million). We reviewed the appropriateness of the related disclosures provided in the Group financial statements including the disclosure of tax balances subject to ongoing disputes.
|
We concluded that tax balances are appropriately recognised by the Group.
We concluded that the tax disclosures provided in the Consolidated Financial Statements are appropriate. |
In the prior year, our auditor’s report included a key audit matter in relation to Purchase Price accounting, including testing for impairment of goodwill balances, following the material acquisitions in the year. In the current year, this matter has been modified due to the absence of material acquisitions or changes in the fair values from the provisional amounts disclosed in the Group`s 2016 Consolidated Financial statements. Due to the material goodwill balances that remain on the balance sheet, we have retained a key audit matter relating to the carrying value of goodwill and indefinite lived intangibles.
There have been no changes to other key audit matters since the prior year.
An overview of the scope of our audit
Tailoring the scope
Our assessment of audit risk, our evaluation of materiality and our allocation of performance materiality determine our audit scope for each entity within the Group. Taken together, this enables us to form an opinion on the consolidated financial statements. We take into account size, risk profile, the organisation of the group and effectiveness of group-wide controls, changes in the business environment and other factors when assessing the level of work to be performed at each entity.
In assessing the risk of material misstatement to the Group financial statements, and to ensure we had adequate quantitative coverage of significant accounts in the financial statements, of the 76 reporting components of the Group (51 of which are trading components), we selected 12 components covering entities within Great Britain, Spain, Germany, France, Belgium, Netherlands and Luxembourg, which represent the principal business units within the Group.
Of the 12 components selected, we performed an audit of the complete financial information of 7 components (“full scope components”) which were selected based on their size or risk characteristics. For the remaining 5 components (“specific scope components”), we performed audit procedures on specific accounts within that component that we considered had the potential for the greatest impact on the significant accounts in the financial statements either because of the size of these accounts or their risk profile.
This page does not form part of Coca-Cola European Partners plc Annual Report on Form 20-F for the year ended 31 December 2017 as filed with the SEC
|
|
P a g e |
101
|
The table below illustrates the coverage obtained from the work performed by our audit teams.
|
Number
|
% Group adjusted
Profit before tax
2017
|
|
% Group adjusted
Profit before tax
2016
(G)
|
|
% Group Revenue 2017
|
|
% Group Revenue 2016
|
|
% Total assets 2017
|
|
% Total assets 2016
|
|
See Note
|
|||
|
Full scope
|
7
|
88
|
%
|
105
|
%
|
78
|
%
|
90
|
%
|
91
|
%
|
96
|
%
|
(B) (C) (D)
|
||
|
Specific scope
|
5
|
6
|
%
|
(15
|
)%
|
13
|
%
|
—
|
%
|
5
|
%
|
(2
|
)%
|
(A) (B) (C) (E)
|
||
|
Full and specific scope coverage
|
12
|
94
|
%
|
90
|
%
|
91
|
%
|
90
|
%
|
96
|
%
|
94
|
%
|
|||
|
Remaining components
|
32
|
6
|
%
|
10
|
%
|
9
|
%
|
10
|
%
|
4
|
%
|
6
|
%
|
(C) (D) (F)
|
||
|
Total Reporting components
|
44
|
100%
|
|
100
|
%
|
100%
|
|
100
|
%
|
100%
|
|
100
|
%
|
|||
___________________________
Notes
|
(A)
|
The specific scope components relates to the two corporate entities whose activities include the Group’s treasury management and consolidation adjustments and three trading entities.
|
|
(B)
|
The Group audit risk in relation to tax was subject to audit procedures at each of the full and specific scoped locations.
|
|
(C)
|
The Group audit risk in relation to Aspects of Revenue Recognition was subject to full scope audit procedures in six components, specific scope audit procedures in three components, and review scope procedures in two components that were performed by the group audit team.
|
|
(D)
|
The Group audit risk in relation to carrying value of goodwill and intangible assets was subject to audit procedures across the Group performed by the group audit team.
|
|
(E)
|
The audit scope of these components may not have included testing of all significant accounts of the component but will have contributed to the coverage of significant accounts tested for the Group. Significant accounts that were not subject to the specific scope audit were subjected to testing of group-wide controls and analytical review.
|
|
(F)
|
Of the remaining 37 components that together represent 7% of the Group’s profit before tax, none are individually greater than 5% of the Group’s profit before tax. For the four trading components within this category, we defined two as ‘review scope’ components for which we performed specified procedures on revenue. For the remaining components in this category, we performed other procedures, including testing of group-wide controls, analytical review, testing of consolidation journals and intercompany eliminations, and foreign currency translation recalculations to respond to any potential risks of material misstatement to the Group financial statements.
|
|
(G)
|
In 2016 performance materiality was determined based on profit before taxation adjusted for non-recurring amounts relating to Merger-related costs and amortisation of the inventory fair value adjustment. In 2017 we determined materiality for the Group based on the profit before taxation.
|
Changes from the prior year
For our 2017 integrated audit we reduced the scope of three components from full scope to specific scope. This is due to the dilution of their share of Group`s results.
Involvement with component teams
In establishing our overall approach to the Group audit, we determined the type of work that needed to be undertaken at each of the components by us, as the primary audit engagement team, or by component auditors from other EY global network firms operating under our instruction. Of the seven full scope components, audit procedures were performed on six of these directly by the component audit team. For the three specific scope components where the work was performed by component auditors, we determined the appropriate level of involvement to enable us to determine that sufficient audit evidence had been obtained as a basis for our opinion on the Group as a whole.
The Group audit team continued to follow a programme of planned visits that has been designed to ensure that the Senior Statutory Auditor visits all full scope audit locations at least once in the year. During the current year’s audit cycle, visits were undertaken by the primary audit team to the component teams in Great Britain, France, Belgium, Spain and Germany. We also visited Bulgaria, which is the shared service centre location which contributed to the audits of a number of components. These visits involved meetings with component teams to discuss and direct their audit approach, reviewing and understanding the significant audit findings in response to the risk areas including aspects of revenue recognition and taxation, holding meetings with local management, undertaking market tours and obtaining updates on local regulatory matters including tax, pensions, restructuring and legal. The primary team interacted regularly with the component teams where appropriate during various stages of the audit, reviewed key working papers and were responsible for the scope and direction of the audit process. This, together with the additional procedures performed at Group level, gave us appropriate evidence for our opinion on the Group financial statements. The Group audit team attended all component audit closing meetings.
This page does not form part of Coca-Cola European Partners plc Annual Report on Form 20-F for the year ended 31 December 2017 as filed with the SEC
|
|
P a g e |
102
|
Our application of materiality
We apply the concept of materiality in planning and performing the audit, in evaluating the effect of identified misstatements on the audit and in forming our audit opinion.
Materiality
The magnitude of an omission or misstatement that, individually or in the aggregate, could reasonably be expected to influence the economic decisions of the users of the financial statements. Materiality provides a basis for determining the nature and extent of our audit procedures.
We determined materiality for the Group to be € 58 million (2016: € 46 million), which is 5% of profit before taxation (2016: 5.2% of profit before taxation adjusted for non-recurring amounts relating to Merger-related costs and amortisation of the inventory fair value adjustment). We believe that profit before taxation provides us with most relevant performance measure to the stakeholders of Coca-Cola European Partners plc.
We determined materiality for the Parent Company to be €169 million (2016: €322 million), which is 1% of shareholders` equity (2016: 2% of shareholders` equity).
During the course of our audit, we reassessed initial materiality and increased the materiality level based on actual results. We did not change our materiality measure of 5% of profit before tax.
Performance materiality
The application of materiality at the individual account or balance level. It is set at an amount to reduce to an appropriately low level the probability that the aggregate of uncorrected and undetected misstatements exceeds materiality.
On the basis of our risk assessments, together with our assessment of the Group’s overall control environment, our judgement was that performance materiality was 75% (2016: 50%) of our planning materiality, namely €43.5 million (2016: €23 million). In the prior year we set performance materiality at 50% as it was the first reporting cycle for Coca-Cola European Partners plc. We reviewed any misstatements identified in our 2016 group audit to assess their potential recurrence in 2017 (which would affect the percentage of group performance materiality we utilised to determine the extent of our audit procedures). Based on the nature of the adjustments identified last year and the stabilised structure of the finance environment within the group, we concluded the likelihood of material misstatements would be lower in the current year and, hence, we set performance materiality at 75%.
Audit work at component locations for the purpose of obtaining audit coverage over significant financial statement accounts is undertaken based on a percentage of total performance materiality. The performance materiality set for each component is based on the relative scale and risk of the component to the Group as a whole and our assessment of the risk of misstatement at that component. In the current year, the range of performance materiality allocated to components was €8.7 million to €21.8 million (2016: €6.9 million to €11.5 million).
Reporting threshold
An amount below which identified misstatements are considered as being clearly trivial.
We agreed with the Audit Committee that we would report to them all uncorrected audit differences in excess of €2.9 million (2016: €2.3 million), which is set at 5% of planning materiality, as well as differences below that threshold that, in our view, warranted reporting on qualitative grounds.
We evaluate any uncorrected misstatements against both the quantitative measures of materiality discussed above and in light of other relevant qualitative considerations in forming our opinion.
Other information
The other information comprises the information included in the annual report, including Strategic Report set out on pages 4-39, Governance and Directors` report set out on pages 40-92, Other Group Information set out on pages 172-197, other than the financial statements and our auditor’s report thereon. The directors are responsible for the other information.
Our opinion on the financial statements does not cover the other information and, except to the extent otherwise explicitly stated in this report, we do not express any form of assurance conclusion thereon.
In connection with our audit of the financial statements, our responsibility is to read the other information and, in doing so, consider whether the other information is materially inconsistent with the financial statements or our knowledge obtained in the audit or otherwise appears to be materially misstated. If we identify such material inconsistencies or apparent material misstatements, we are required to determine whether there is a material misstatement in the financial statements or a material misstatement of the other information. If, based on the work we have performed, we conclude that there is a material misstatement of the other information, we are required to report that fact.
We have nothing to report in this regard.
This page does not form part of Coca-Cola European Partners plc Annual Report on Form 20-F for the year ended 31 December 2017 as filed with the SEC
|
|
P a g e |
103
|
In this context, we also have nothing to report in regard to our responsibility to specifically address the following items in the other information and to report as uncorrected material misstatements of the other information where we conclude that those items meet the following conditions:
|
•
|
Fair, balanced and understandable set out on page 92 - the statement given / the explanation as to why the annual report does not include a statement by the directors that they consider the annual report and financial statements taken as a whole is fair, balanced and understandable and provides the information necessary for shareholders to assess the Group’s performance, business model and strategy, is materially inconsistent with our knowledge obtained in the audit; or
|
|
•
|
Audit committee reporting set out on page 69 - the section describing the work of the audit committee does not appropriately address matters communicated by us to the audit committee / the explanation as to why the annual report does not include a section describing the work of the audit committee is materially inconsistent with our knowledge obtained in the audit; or
|
|
•
|
Directors’ statement of compliance with the UK Corporate Governance Code set out on page 52 - the parts of the directors’ statement required under the Listing Rules relating to the company’s compliance with the UK Corporate Governance Code containing provisions specified for review by the auditor in accordance with Listing Rule 9.8.10R (2) do not properly disclose a departure from a relevant provision of the UK Corporate Governance Code.
|
Opinions on other matters prescribed by the Companies Act 2006
In our opinion, the part of the directors’ remuneration report to be audited has been properly prepared in accordance with the Companies Act 2006.
In our opinion, based on the work undertaken in the course of the audit:
|
•
|
the information given in the strategic report and the directors’ report for the financial year for which the financial statements are prepared is consistent with the financial statements and those reports have been prepared in accordance with applicable legal requirements;
|
|
•
|
the information about internal control and risk management systems in relation to financial reporting processes and about share capital structures, given in compliance with rules 7.2.5 and 7.2.6 in the Disclosure Rules and Transparency Rules sourcebook made by the Financial Conduct Authority (the FCA Rules), is consistent with the financial statements and has been prepared in accordance with applicable legal requirements; and
|
|
•
|
information about the company’s corporate governance code and practices and about its administrative, management and supervisory bodies and their committees complies with rules 7.2.2, 7.2.3 and 7.2.7 of the FCA Rules.
|
Matters on which we are required to report by exception
In the light of the knowledge and understanding of the group and the parent company and its environment obtained in the course of the audit, we have not identified material misstatements in
|
•
|
the strategic report or the directors’ report; or
|
|
•
|
the information about internal control and risk management systems in relation to financial reporting processes and about share capital structures, given in compliance with rules 7.2.5 and 7.2.6 of the FCA Rules.
|
We have nothing to report in respect of the following matters in relation to which the Companies Act 2006 requires us to report to you if, in our opinion:
|
•
|
a
dequate accounting records have not been kept by the parent company, or returns adequate for our audit have not been received from branches not visited by us; or
|
|
•
|
the parent company financial statements and the part of the Directors’ Remuneration Report to be audited are not in agreement with the accounting records and returns; or
|
|
•
|
certain disclosures of directors’ remuneration specified by law are not made; or
|
|
•
|
we have not received all the information and explanations we require for our audit; or
|
|
•
|
a Corporate Governance Statement has not been prepared by the Group.
|
Responsibilities of directors
As explained more fully in the directors’ responsibilities statement set out on page 92, the directors are responsible for the preparation of the financial statements and for being satisfied that they give a true and fair view, and for such internal control as the directors determine is necessary to enable the preparation of financial statements that are free from material misstatement, whether due to fraud or error.
In preparing the financial statements, the directors are responsible for assessing the group and parent company’s ability to continue as a going concern, disclosing, as applicable, matters related to going concern and using the going concern basis of accounting unless the directors either intend to liquidate the group or the parent company or to cease operations, or have no realistic alternative but to do so.
This page does not form part of Coca-Cola European Partners plc Annual Report on Form 20-F for the year ended 31 December 2017 as filed with the SEC
|
|
P a g e |
104
|
Auditor’s responsibilities for the audit of the financial statements
Our objectives are to obtain reasonable assurance about whether the financial statements as a whole are free from material misstatement, whether due to fraud or error, and to issue an auditor’s report that includes our opinion. Reasonable assurance is a high level of assurance, but is not a guarantee that an audit conducted in accordance with ISAs (UK) will always detect a material misstatement when it exists. Misstatements can arise from fraud or error and are considered material if, individually or in the aggregate, they could reasonably be expected to influence the economic decisions of users taken on the basis of these financial statements.
Explanation as to what extent the audit was considered capable of detecting irregularities, including fraud
The objectives of our audit, in respect to fraud, are; to identify and assess the risks of material misstatement of the financial statements due to fraud; to obtain sufficient appropriate audit evidence regarding the assessed risks of material misstatement due to fraud, through designing and implementing appropriate responses; and to respond appropriately to fraud or suspected fraud identified during the audit. However, the primary responsibility for the prevention and detection of fraud rests with both those charged with governance of the entity and management.
Our approach was as follows:
|
•
|
We obtained an understanding of the legal and regulatory frameworks that are applicable to the group and determined that the most significant are:
|
|
•
|
those that relate to the form and content of the financial statements, such as the Group accounting policy, International Financial Reporting Standards (IFRS), the UK Companies Act 2006 and the UK Corporate Governance Code;
|
|
•
|
those that relate to the accrual or recognition of expenses for taxation such as various country specific tax codes in which the Group has operations;
|
|
•
|
those that relate to the accrual or recognition of expenses for pension costs, as well as the treatment of its employees, such as labour agreements in countries where the Group operates;
|
|
•
|
We understood how Coca-Cola European Partners plc is complying with those frameworks by observing the oversight of those charged with governance, the culture of honesty and ethical behaviour and a strong emphasis placed on fraud prevention, which may reduce opportunities for fraud to take place, and fraud deterrence, which could persuade individuals not to commit fraud because of the likelihood of detection and punishment.
|
|
•
|
We assessed the susceptibility of the group’s financial statements to material misstatement, including how fraud might occur by making an assessment of the key fraud risks to the group and the manner in which such risks may manifest themselves in practice, based on our previous knowledge of the Group as well as an assessment of the current business environment.
|
|
•
|
Based on this understanding we designed our audit procedures to identify non-compliance with such laws and regulations. Where the risk was considered to be higher, we performed audit procedures to address each identified fraud risk. These procedures included testing manual journals and were designed to provide reasonable assurance that the financial statements were free of fraud or error. We evaluated the design and operational effectiveness of controls put in place to address the risks identified, or that otherwise prevent, deter and detect fraud. We also considered performance targets and their influence on efforts made by management to manage earnings.
|
A further description of our responsibilities for the audit of the financial statements is located on the Financial Reporting Council’s website at https://www.frc.org.uk/auditorsresponsibilities. This description forms part of our auditor’s report.
This page does not form part of Coca-Cola European Partners plc Annual Report on Form 20-F for the year ended 31 December 2017 as filed with the SEC
|
|
P a g e |
105
|
Other matters we are required to address
|
•
|
We were appointed by the company on 22 June 2016 to audit the financial statements for the year ending 31 December 2016 and subsequent financial periods.
|
The period of total uninterrupted engagement including previous renewals and reappointments is 2 years, covering the years ending 31 December 2016 to 31 December 2017.
|
•
|
The non-audit services prohibited by the FRC’s Ethical Standard were not provided to the group or the parent company and we remain independent of the group and the parent company in conducting the audit
|
|
•
|
The audit opinion is consistent with the additional report to the Audit Committee.
|
Karl Havers (Senior statutory auditor)
for and on behalf of Ernst & Young LLP, Statutory Auditor
London
15 March 2018
Notes:
|
(A)
|
The maintenance and integrity of the Coca-Cola European Partners plc web site is the responsibility of the directors; the work carried out by the auditors does not involve consideration of these matters and, accordingly, the auditors accept no responsibility for any changes that may have occurred to the financial statements since they were initially presented on the web site.
|
|
(B)
|
Legislation in the United Kingdom governing the preparation and dissemination of financial statements may differ from legislation in other jurisdictions.
|
This page does not form part of Coca-Cola European Partners plc Annual Report on Form 20-F for the year ended 31 December 2017 as filed with the SEC
|
|
P a g e |
106
|
REPORT OF INDEPENDENT REGISTERED PUBLIC ACCOUNTING FIRM
To the Shareholders and the Board of Directors of Coca-Cola European Partners plc
Opinion on the Financial Statements
We have audited the accompanying consolidated statement of financial position of Coca-Cola European Partners plc (the “Company”) as of 31 December 2017 and 2016, the related consolidated statements of income, comprehensive income, statement of changes in equity and cash flows for each of the two years in the period ended 31 December 2017 and the related notes (collectively referred to as the “consolidated financial statements”). In our opinion, the consolidated financial statements present fairly, in all material respects, the consolidated financial position of the Company at 31 December 2017 and 2016, and the consolidated results of its operations and its cash flows for each of the two years in the period ended 31 December 2017, in conformity with International Financial Reporting Standards as issued by the International Accounting Standards Board.
We also have audited, in accordance with the standards of the Public Company Accounting Oversight Board (United States) (PCAOB), the Company's internal control over financial reporting as of 31 December 2017, based on criteria established in Internal Control-Integrated Framework issued by the Committee of Sponsoring Organizations of the Treadway Commission (“2013 framework”) and our report dated 15
March 2018 expressed an unqualified opinion thereon.
Basis for Opinion
These financial statements are the responsibility of the Company's management. Our responsibility is to express an opinion on the Company’s financial statements based on our audits. We are a public accounting firm registered with the PCAOB and are required to be independent with respect to the Company in accordance with the US federal securities laws and the applicable rules and regulations of the Securities and Exchange Commission and the PCAOB.
We conducted our audits in accordance with the standards of the PCAOB. Those standards require that we plan and perform the audit to obtain reasonable assurance about whether the financial statements are free of material misstatement, whether due to error or fraud. Our audits included performing procedures to assess the risks of material misstatement of the financial statements, whether due to error or fraud, and performing procedures that respond to those risks. Such procedures included examining, on a test basis, evidence regarding the amounts and disclosures in the financial statements. Our audits also included evaluating the accounting principles used and significant estimates made by management, as well as evaluating the overall presentation of the financial statements. We believe that our audits provide a reasonable basis for our opinion.
/s/ Ernst & Young LLP
We have served as the Company’s auditor since 2016.
London, United Kingdom
15 March 2018
|
|
P a g e |
107
|
REPORT OF INDEPENDENT REGISTERED PUBLIC ACCOUNTING FIRM
To the Shareholders and the Board of Directors of Coca-Cola European Partners plc
We have audited the accompanying consolidated statements of income, comprehensive income, changes in equity and cash flows of Coca-Cola European Partners plc (successor to Coca-Cola Enterprises, Inc.) for the year ended 31 December 2015. These financial statements are the responsibility of the Company’s management. Our responsibility is to express an opinion on these financial statements based on our audit.
We conducted our audit in accordance with the standards of the Public Company Accounting Oversight Board (United States). Those standards require that we plan and perform the audit to obtain reasonable assurance about whether the financial statements are free of material misstatement. We were not engaged to perform an audit of the Company’s internal control over financial reporting. Our audit included consideration of internal control over financial reporting as a basis for designing audit procedures that are appropriate in the circumstances, but not for the purpose of expressing an opinion on the effectiveness of the Company’s internal control over financial reporting. Accordingly, we express no such opinion. An audit also includes examining, on a test basis, evidence supporting the amounts and disclosures in the financial statements, assessing the accounting principles used and significant estimates made by management, and evaluating the overall financial statement presentation. We believe that our audit provides a reasonable basis for our opinion.
In our opinion, the financial statements referred to above present fairly, in all material respects, the consolidated results of operations and cash flows of Coca-Cola European Partners plc for the year ended 31 December 2015, in conformity with International Financial Reporting Standards as issued by the International Accounting Standards Board.
/s/ Ernst & Young LLP
Atlanta, Georgia
11 April 2017
|
|
P a g e |
108
|
REPORT OF INDEPENDENT REGISTERED PUBLIC ACCOUNTING FIRM
To the Shareholders and the Board of Directors of Coca-Cola European Partners plc
Opinion on Internal Control over Financial Reporting
We have audited Coca-Cola European Partners plc’s internal control over financial reporting as of 31 December 2017, based on criteria established in Internal Control-Integrated Framework issued by the Committee of Sponsoring Organizations of the Treadway Commission (“2013 framework”), (the COSO criteria). In our opinion, Coca-Cola European Partners plc (the “Company”) maintained, in all material respects, effective internal control over financial reporting as of 31 December 2017, based on the COSO criteria.
We also have audited, in accordance with the standards of the Public Company Accounting Oversight Board (United States) (PCAOB), the accompanying consolidated statement of financial position of the Company as of 31 December 2017 and 2016, the related consolidated statements of income, comprehensive income, statement of changes in equity and cash flows for each of the two years in the period ended 31 December 2017 and the related notes and our report dated 15 March 2018 expressed an unqualified opinion thereon.
Basis for Opinion
The Company’s management is responsible for maintaining effective internal control over financial reporting and for its assessment of the effectiveness of internal control over financial reporting included in the accompanying Annual Report on Form 20-F. Our responsibility is to express an opinion on the Company’s internal control over financial reporting based on our audit. We are a public accounting firm registered with the PCAOB and are required to be independent with respect to the Company in accordance with the US federal securities laws and the applicable rules and regulations of the Securities and Exchange Commission and the PCAOB.
We conducted our audit in accordance with the standards of the PCAOB. Those standards require that we plan and perform the audit to obtain reasonable assurance about whether effective internal control over financial reporting was maintained in all material respects.
Our audit included obtaining an understanding of internal control over financial reporting, assessing the risk that a material weakness exists, testing and evaluating the design and operating effectiveness of internal control based on the assessed risk, and performing such other procedures as we considered necessary in the circumstances. We believe that our audit provides a reasonable basis for our opinion.
Definition and Limitations of Internal Control Over Financial Reporting
A company’s internal control over financial reporting is a process designed to provide reasonable assurance regarding the reliability of financial reporting and the preparation of financial statements for external purposes in accordance with generally accepted accounting principles. A company’s internal control over financial reporting includes those policies and procedures that (1) pertain to the maintenance of records that, in reasonable detail, accurately and fairly reflect the transactions and dispositions of the assets of the company; (2) provide reasonable assurance that transactions are recorded as necessary to permit preparation of financial statements in accordance with generally accepted accounting principles, and that receipts and expenditures of the company are being made only in accordance with authorisations of management and directors of the company; and (3) provide reasonable assurance regarding prevention or timely detection of unauthorized acquisition, use, or disposition of the company’s assets that could have a material effect on the financial statements.
Because of its inherent limitations, internal control over financial reporting may not prevent or detect misstatements. Also, projections of any evaluation of effectiveness to future periods are subject to the risk that controls may become inadequate because of changes in conditions, or that the degree of compliance with the policies or procedures may deteriorate.
/s/ Ernst & Young LLP
London, United Kingdom
15 March 2018
|
|
P a g e |
109
|
Coca-Cola European Partners plc
CONSOLIDATED INCOME STATEMENT
|
Year Ended
|
||||||||||
|
31 December 2017
|
|
|
31 December 2016
|
|
|
31 December 2015
|
|
|||
|
Note
|
€ million
|
|
€ million
|
|
€ million
|
|
||||
|
Revenue
|
11,062
|
|
9,133
|
|
6,329
|
|
||||
|
Cost of sales
|
16
|
(6,772
|
)
|
(5,584
|
)
|
(4,017
|
)
|
|||
|
Gross profit
|
4,290
|
|
3,549
|
|
2,312
|
|
||||
|
Selling and distribution expenses
|
16
|
(2,124
|
)
|
(1,615
|
)
|
(919
|
)
|
|||
|
Administrative expenses
|
16
|
(906
|
)
|
(1,083
|
)
|
(634
|
)
|
|||
|
Operating profit
|
1,260
|
|
851
|
|
759
|
|
||||
|
Finance income
|
17
|
48
|
|
31
|
|
24
|
|
|||
|
Finance costs
|
17
|
(148
|
)
|
(154
|
)
|
(134
|
)
|
|||
|
Total finance costs, net
|
(100
|
)
|
(123
|
)
|
(110
|
)
|
||||
|
Non-operating items
|
(1
|
)
|
(9
|
)
|
(5
|
)
|
||||
|
Profit before taxes
|
1,159
|
|
719
|
|
644
|
|
||||
|
Taxes
|
19
|
(471
|
)
|
(170
|
)
|
(131
|
)
|
|||
|
Profit after taxes
|
688
|
|
549
|
|
513
|
|
||||
|
Basic earnings per share (€)
|
4
|
1.42
|
|
1.45
|
|
2.23
|
|
|||
|
Diluted earnings per share (€)
|
4
|
1.41
|
|
1.42
|
|
2.19
|
|
|||
The accompanying notes are an integral part of these consolidated financial statements.
|
|
P a g e |
110
|
Coca-Cola European Partners plc
|
Year Ended
|
||||||||||
|
31 December 2017
|
|
31 December 2016
|
|
31 December 2015
|
|
|||||
|
Note
|
€ million
|
|
€ million
|
|
€ million
|
|
||||
|
Profit after taxes
|
688
|
|
549
|
|
513
|
|
||||
|
Components of other comprehensive income (loss):
|
||||||||||
|
Items that may be subsequently reclassified to the income statement:
|
||||||||||
|
Foreign currency translations:
|
||||||||||
|
Pretax activity, net
|
(111
|
)
|
(186
|
)
|
(185
|
)
|
||||
|
Tax effect
|
—
|
|
—
|
|
—
|
|
||||
|
Foreign currency translation
|
(111
|
)
|
(186
|
)
|
(185
|
)
|
||||
|
Net investment hedges:
|
||||||||||
|
Pretax activity, net
|
—
|
|
(66
|
)
|
134
|
|
||||
|
Tax effect
|
27
|
|
22
|
|
(46
|
)
|
||||
|
Net investment hedges, net of tax
|
11, 19
|
27
|
|
(44
|
)
|
88
|
|
|||
|
Cash flow hedges:
|
||||||||||
|
Pretax activity, net
|
—
|
|
(11
|
)
|
16
|
|
||||
|
Tax effect
|
—
|
|
2
|
|
(5
|
)
|
||||
|
Cash flow hedges, net of tax
|
—
|
|
(9
|
)
|
11
|
|
||||
|
(84
|
)
|
(239
|
)
|
(86
|
)
|
|||||
|
Items that will not be subsequently reclassified to the income statement:
|
||||||||||
|
Pension plan remeasurements:
|
||||||||||
|
Pretax activity, net
|
91
|
|
(65
|
)
|
(50
|
)
|
||||
|
Tax effect
|
(18
|
)
|
14
|
|
|
—
|
|
|||
|
Pension plan remeasurements, net of tax
|
14
|
73
|
|
(51
|
)
|
(50
|
)
|
|||
|
73
|
|
(51
|
)
|
(50
|
)
|
|||||
|
Other comprehensive loss for the period, net of tax
|
(11
|
)
|
(290
|
)
|
(136
|
)
|
||||
|
Comprehensive income for the period
|
677
|
|
259
|
|
377
|
|
||||
The accompanying notes are an integral part of these consolidated financial statements.
|
|
P a g e |
111
|
Coca-Cola European Partners plc
|
31 December 2017
|
|
31 December 2016
|
|
||||
|
|
Note
|
|
€ million
|
|
€ million
|
|
|
|
ASSETS
|
|||||||
|
Non-current:
|
|||||||
|
Intangible assets
|
5
|
8,384
|
|
8,344
|
|
||
|
Goodwill
|
5
|
2,520
|
|
2,427
|
|
||
|
Property, plant and equipment
|
6
|
3,837
|
|
3,993
|
|
||
|
Non-current derivative assets
|
11
|
2
|
|
35
|
|
||
|
Deferred tax assets
|
19
|
56
|
|
274
|
|
||
|
Other non-current assets
|
81
|
|
70
|
|
|||
|
Total non-current assets
|
14,880
|
|
15,143
|
|
|||
|
Current:
|
|||||||
|
Current derivative assets
|
11
|
20
|
|
23
|
|
||
|
Current tax assets
|
19
|
25
|
|
16
|
|
||
|
Inventories
|
7
|
650
|
|
673
|
|
||
|
Amounts receivable from related parties
|
18
|
75
|
|
95
|
|
||
|
Trade accounts receivable
|
8
|
1,732
|
|
1,860
|
|
||
|
Other current assets
|
22
|
452
|
|
372
|
|
||
|
Cash and cash equivalents
|
9
|
360
|
|
386
|
|
||
|
Total current assets
|
3,314
|
|
3,425
|
|
|||
|
Total assets
|
18,194
|
|
18,568
|
|
|||
|
LIABILITIES
|
|||||||
|
Non-current:
|
|||||||
|
Borrowings, less current portion
|
12
|
5,474
|
|
5,562
|
|
||
|
Employee benefit liabilities
|
14
|
162
|
|
278
|
|
||
|
Non-current provisions
|
21
|
48
|
|
89
|
|
||
|
Non-current derivative liabilities
|
11
|
93
|
|
1
|
|
||
|
Deferred tax liabilities
|
19
|
2,237
|
|
2,248
|
|
||
|
Other non-current liabilities
|
208
|
|
177
|
|
|||
|
Total non-current liabilities
|
8,222
|
|
8,355
|
|
|||
|
Current:
|
|||||||
|
Current portion of borrowings
|
12
|
274
|
|
875
|
|
||
|
Current portion of employee benefit liabilities
|
14
|
21
|
|
24
|
|
||
|
Current provisions
|
21
|
194
|
|
221
|
|
||
|
Current derivative liabilities
|
11
|
1
|
|
8
|
|
||
|
Current tax liabilities
|
19
|
86
|
|
44
|
|
||
|
Amounts payable to related parties
|
18
|
178
|
|
162
|
|
||
|
Trade and other payables
|
13
|
2,533
|
|
2,418
|
|
||
|
Total current liabilities
|
3,287
|
|
3,752
|
|
|||
|
Total liabilities
|
11,509
|
|
12,107
|
|
|||
|
EQUITY
|
|||||||
|
Share capital
|
15
|
5
|
|
5
|
|
||
|
Share premium
|
15
|
127
|
|
114
|
|
||
|
Merger reserves
|
15
|
287
|
|
287
|
|
||
|
Other reserves
|
15
|
(503
|
)
|
(419
|
)
|
||
|
Retained earnings
|
6,769
|
|
6,474
|
|
|||
|
Total equity
|
6,685
|
|
6,461
|
|
|||
|
Total equity and liabilities
|
18,194
|
|
18,568
|
|
|||
The accompanying notes are an integral part of these consolidated financial statements.
The financial statements were approved by the Directors and authorised for issue on
15 March 2018
. They were signed on its behalf by:
Damian Gammell
Chief Executive Officer
15 March 2018
|
|
P a g e |
112
|
Coca-Cola European Partners plc
|
Year Ended
|
||||||||||
|
31 December 2017
|
31 December 2016
|
31 December 2015
|
||||||||
|
Note
|
€ million
|
|
€ million
|
|
€ million
|
|
||||
|
Cash flows from operating activities:
|
||||||||||
|
Profit before taxes
|
1,159
|
|
719
|
|
644
|
|
||||
|
Adjustments to reconcile profit before tax to net cash flows from operating activities:
|
||||||||||
|
Depreciation
|
6
|
443
|
|
333
|
|
221
|
|
|||
|
Amortisation of intangible assets
|
5
|
47
|
|
39
|
|
26
|
|
|||
|
Share-based payment expense
|
20
|
14
|
|
42
|
|
39
|
|
|||
|
Finance costs, net
|
17
|
100
|
|
123
|
|
110
|
|
|||
|
Income taxes paid
|
(247
|
)
|
(187
|
)
|
(124
|
)
|
||||
|
Changes in assets and liabilities, net of acquisition amounts:
|
||||||||||
|
Decrease/(increase) in trade and other receivables
|
108
|
|
87
|
|
68
|
|
||||
|
Decrease/(increase) in inventories
|
16
|
|
61
|
|
9
|
|
||||
|
Increase/(decrease) in trade and other payables
|
142
|
|
155
|
|
(91
|
)
|
||||
|
Increase/(decrease) in provisions
|
(67
|
)
|
37
|
|
(5
|
)
|
||||
|
Change in other operating assets and liabilities
|
(92
|
)
|
(165
|
)
|
25
|
|
||||
|
Net cash flows from operating activities
|
1,623
|
|
1,244
|
|
922
|
|
||||
|
Cash flows from investing activities:
|
||||||||||
|
Purchases of property, plant and equipment
|
(484
|
)
|
(459
|
)
|
(292
|
)
|
||||
|
Purchases of capitalised software
|
(36
|
)
|
(38
|
)
|
(21
|
)
|
||||
|
Proceeds from sales of property, plant and equipment
|
32
|
|
12
|
|
12
|
|
||||
|
Settlement of net investment hedges
|
—
|
|
(8
|
)
|
29
|
|
||||
|
Cash from acquisition of bottling operations
|
—
|
|
110
|
|
—
|
|
||||
|
Net cash flows used in investing activities
|
(488
|
)
|
|
(383
|
)
|
(272
|
)
|
|||
|
Cash flows from financing activities:
|
||||||||||
|
Proceeds from borrowings, net of issuance costs
|
12
|
350
|
|
3,174
|
|
495
|
|
|||
|
Repayments on third-party borrowings
|
12
|
(1,180
|
)
|
(241
|
)
|
(431
|
)
|
|||
|
Changes in short-term borrowings
|
12
|
250
|
|
(183
|
)
|
47
|
|
|||
|
Interest paid
|
(94
|
)
|
(110
|
)
|
(91
|
)
|
||||
|
Dividends paid
|
15
|
(489
|
)
|
(204
|
)
|
(232
|
)
|
|||
|
Exercise of employee share options
|
13
|
|
18
|
|
19
|
|
||||
|
Repurchases of share-based payments
|
20
|
—
|
|
(27
|
)
|
—
|
|
|||
|
Settlement of debt-related cross-currency swaps
|
—
|
|
—
|
|
50
|
|
||||
|
Repayment of loan with TCCC assumed in acquisition
|
18
|
—
|
|
(73
|
)
|
—
|
|
|||
|
Return of capital to CCE shareholders
|
15
|
—
|
|
(2,963
|
)
|
—
|
|
|||
|
Share repurchases under share repurchase programmes
|
15
|
—
|
|
—
|
|
(534
|
)
|
|||
|
Other financing activities, net
|
(2
|
)
|
(17
|
)
|
(8
|
)
|
||||
|
Net cash flows used in financing activities
|
(1,152
|
)
|
(626
|
)
|
(685
|
)
|
||||
|
Net change in cash and cash equivalents
|
(17
|
)
|
235
|
|
(35
|
)
|
||||
|
Net effect of currency exchange rate changes on cash and cash equivalents
|
(9
|
)
|
(5
|
)
|
7
|
|
||||
|
Cash and cash equivalents at beginning of period
|
9
|
386
|
|
156
|
|
184
|
|
|||
|
Cash and cash equivalents at end of period
|
9
|
360
|
|
386
|
|
156
|
|
|||
The accompanying notes are an integral part of these consolidated financial statements.
|
|
P a g e |
113
|
Coca-Cola European Partners plc
CONSOLIDATED STATEMENT OF CHANGES IN EQUITY
|
|
|
|
Share Capital
|
|
Share premium
|
|
Merger reserves
|
|
Other reserves
|
|
Treasury shares
|
|
Retained earnings
|
|
Total equity
|
|
||||||
|
|
Note
|
|
€ million
|
|
€ million
|
|
€ million
|
|
€ million
|
|
€ million
|
|
€ million
|
|
€ million
|
|
||||||
|
As at 1 January 2015
|
|
|
3
|
|
|
2,711
|
|
|
—
|
|
|
(94
|
)
|
|
(2,781
|
)
|
|
1,348
|
|
|
1,187
|
|
|
Profit after taxes
|
|
|
—
|
|
—
|
|
—
|
|
—
|
|
—
|
|
513
|
|
513
|
|
||||||
|
Other comprehensive income / (expense)
|
|
|
—
|
|
—
|
|
—
|
|
(86
|
)
|
—
|
|
(50
|
)
|
(136
|
)
|
||||||
|
Total comprehensive income
|
|
|
—
|
|
—
|
|
|
—
|
|
(86
|
)
|
—
|
|
463
|
|
377
|
|
|||||
|
Issuances of shares
|
15
|
|
—
|
|
18
|
|
—
|
|
—
|
|
—
|
|
—
|
|
18
|
|
||||||
|
Equity-settled share-based payment expense
|
20
|
|
—
|
|
—
|
|
—
|
|
—
|
|
—
|
|
25
|
|
25
|
|
||||||
|
Share-based payment tax benefits
|
20
|
|
—
|
|
—
|
|
—
|
|
—
|
|
—
|
|
15
|
|
15
|
|
||||||
|
Dividends
|
15
|
|
—
|
|
—
|
|
—
|
|
—
|
|
—
|
|
(233
|
)
|
(233
|
)
|
||||||
|
Own shares purchased under share repurchase programmes
|
15
|
|
—
|
|
—
|
|
—
|
|
—
|
|
(523
|
)
|
—
|
|
(523
|
)
|
||||||
|
Own shares utilised for share-based payments, net
|
15
|
|
—
|
|
—
|
|
—
|
|
—
|
|
(3
|
)
|
3
|
|
—
|
|
||||||
|
Other activity
|
—
|
|
—
|
|
—
|
|
—
|
|
—
|
|
5
|
|
5
|
|
||||||||
|
As at 31 December 2015
|
|
|
3
|
|
|
2,729
|
|
|
—
|
|
|
(180
|
)
|
|
(3,307
|
)
|
|
1,626
|
|
|
871
|
|
|
Profit after taxes
|
|
|
—
|
|
—
|
|
—
|
|
—
|
|
—
|
|
549
|
|
549
|
|
||||||
|
Other comprehensive income / (expense)
|
|
|
—
|
|
—
|
|
—
|
|
(239
|
)
|
—
|
|
(51
|
)
|
(290
|
)
|
||||||
|
Total comprehensive income
|
|
|
—
|
|
|
—
|
|
|
—
|
|
|
(239
|
)
|
|
—
|
|
|
498
|
|
|
259
|
|
|
Shares utilised for share-based payments prior to Merger
|
15
|
|
—
|
|
9
|
|
—
|
|
—
|
|
(6
|
)
|
6
|
|
9
|
|
||||||
|
Cancellation of CCE shares
|
15
|
|
(3
|
)
|
(2,738
|
)
|
(572
|
)
|
—
|
|
3,313
|
|
—
|
|
—
|
|
||||||
|
Issuance of CCEP shares in consideration for CCIP and CCEG
|
15
|
|
3
|
|
—
|
|
8,466
|
|
—
|
|
—
|
|
—
|
|
8,469
|
|
||||||
|
Group reconstruction transaction
|
15
|
2
|
|
7,605
|
|
(7,607
|
)
|
—
|
|
—
|
|
—
|
|
—
|
|
|||||||
|
Issuances of shares post-Merger
|
15
|
|
—
|
|
9
|
|
—
|
|
—
|
|
—
|
|
—
|
|
9
|
|
||||||
|
Return of capital to CCE shareholders
|
15
|
—
|
|
—
|
|
—
|
|
—
|
|
—
|
|
(2,963
|
)
|
(2,963
|
)
|
|||||||
|
Capital reduction
|
15
|
—
|
|
(7,500
|
)
|
—
|
|
—
|
|
—
|
|
7,500
|
|
—
|
|
|||||||
|
Reclassifications of share-based payments
|
20
|
|
—
|
|
—
|
|
—
|
|
—
|
|
—
|
|
(22
|
)
|
(22
|
)
|
||||||
|
Equity-settled share-based payment expense
|
20
|
|
—
|
|
—
|
|
—
|
|
—
|
|
—
|
|
29
|
|
29
|
|
||||||
|
Share-based payment tax benefits
|
20
|
|
—
|
|
—
|
|
—
|
|
—
|
|
—
|
|
5
|
|
5
|
|
||||||
|
Dividends
|
15
|
|
—
|
|
—
|
|
—
|
|
—
|
|
—
|
|
(205
|
)
|
(205
|
)
|
||||||
|
As at 31 December 2016
|
|
|
5
|
|
114
|
|
287
|
|
(419
|
)
|
—
|
|
6,474
|
|
6,461
|
|
||||||
|
Profit after taxes
|
—
|
|
—
|
|
—
|
|
—
|
|
—
|
|
688
|
|
688
|
|
||||||||
|
Other comprehensive income / (expense)
|
—
|
|
—
|
|
—
|
|
(84
|
)
|
—
|
|
73
|
|
(11
|
)
|
||||||||
|
Total comprehensive income
|
—
|
|
—
|
|
—
|
|
(84
|
)
|
—
|
|
761
|
|
677
|
|
||||||||
|
Issue of shares during the year
|
20
|
—
|
|
13
|
|
—
|
|
—
|
|
—
|
|
—
|
|
13
|
|
|||||||
|
Equity-settled share-based payment expense
|
20
|
—
|
|
—
|
|
—
|
|
—
|
|
—
|
|
11
|
|
11
|
|
|||||||
|
Share-based payment tax benefits
|
20
|
—
|
|
—
|
|
—
|
|
—
|
|
—
|
|
14
|
|
14
|
|
|||||||
|
Dividends
|
15
|
—
|
|
—
|
|
—
|
|
—
|
|
—
|
|
(491
|
)
|
(491
|
)
|
|||||||
|
As at 31 December 2017
|
5
|
|
127
|
|
287
|
|
(503
|
)
|
—
|
|
6,769
|
|
6,685
|
|
||||||||
The accompanying notes are an integral part of these consolidated financial statements.
|
|
P a g e |
114
|
NOTES TO THE CONSOLIDATED FINANCIAL STATEMENTS
Note 1
GENERAL INFORMATION AND BASIS OF PREPARATION
Coca-Cola European Partners plc (the Company or Parent Company) was created through the Merger on 28 May 2016 of the businesses of Coca-Cola Enterprises, Inc., (CCE), Coca-Cola Iberian Partners, S.A. (CCIP) and Coca-Cola Erfrischungsgetränke A.G (CCEG) (the Merger). As part of the Merger, in July 2016, the Company completed the acquisition of Vifilfell hf., the Coca-Cola bottler in Iceland.
The Company and its subsidiaries (together CCEP, or the Group) are a leading consumer goods group in Europe, selling, making and distributing an extensive range of ready-to-drink beverages. The Group is the world’s largest independent Coca-Cola bottler based on revenue, and serves a consumer population of over 300 million across Western Europe, including Andorra, Belgium, continental France, Germany, Great Britain, Iceland, Luxembourg, Monaco, the Netherlands, Norway, Portugal, Spain and Sweden. CCEP is a public limited company by shares, incorporated under the laws of England and Wales with the registered number in England of 09717350. The Group’s shares are listed and traded on Euronext Amsterdam, the New York Stock Exchange, Euronext London and the continuous market of the Spanish Stock Exchanges. The address of the Company’s registered office is Coca-Cola European Partners plc, Pemberton House, Bakers Road, Uxbridge, Middlesex UB8 1EZ, United Kingdom.
CCEP operates in the highly competitive beverage industry and faces strong competition from other general and speciality beverage companies. The Group’s financial results are affected by a number of factors, including, but not limited to, consumer preferences, costs to manufacture and distribute products, foreign currency exchange rates, general economic conditions, local and national laws and regulations, raw material availability and weather patterns.
The consolidated financial statements of the Group for the
year ended 31 December 2017
were approved and signed by Damian Gammell, Chief Executive Officer on
15 March 2018
having been duly authorised to do so by the Board of Directors.
Basis of preparation
Upon the consummation of the Merger, the historical consolidated financial statements of CCE became CCEP’s historical financial statements as CCE was deemed to be the predecessor to CCEP (refer to
Note 2
for further details). Therefore, the financial results presented herein for the years ended 31 December 2015 and for period to date through 27 May 2016 refer to CCE and its consolidated subsidiaries, and the periods subsequent to 28 May 2016 refer to the combined financial results of CCEP. CCE was previously incorporated in the United States of America (US), where it was domiciled. CCE’s main registered office was 2500 Windy Ridge Parkway, Atlanta, Georgia 30339, United States of America.
Additionally, these consolidated financial statements reflect the following:
|
•
|
They have been prepared in accordance with IFRS as issued by the International Accounting Standards Board, IFRS as adopted by the European Union and in accordance with the provisions of the Companies Act 2006. There are no differences between IFRS as adopted by the European Union and IFRS as issued by the International Accounting Standards Board (IASB) that have an impact for the years presented.
|
|
•
|
They have been prepared under the historical cost convention, as modified by the valuation of derivative financial instruments and defined benefit pension plan assets which are measured at fair value.
|
|
•
|
They are presented in euros, which is also the Parent Company’s functional currency.
|
|
•
|
They have been prepared on a going concern basis. The Directors have a reasonable expectation that the Group has adequate resources to continue in operational existence for the foreseeable future. Refer to the “Risk Management, Principal Risks & Viability Statement” section of this Annual Report for further details.
|
Basis of consolidation
The consolidated financial statements comprise the financial statements of the Group and its subsidiaries. All subsidiaries have accounting years ended 31 December and apply consistent accounting policies for the purpose of the consolidated financial statements.
Subsidiary undertakings are consolidated from the date on which effective control is transferred to the Group and cease to be consolidated from the date on which effective control is transferred out of the Group. The Group controls an entity when it is exposed to, or has rights to, variable returns from its involvement with the entity and has the ability to affect those returns through the Group’s power to direct the activities of the entity. All intercompany accounts and transactions are eliminated on consolidation.
|
|
P a g e |
115
|
Foreign currency
The individual financial statements of each subsidiary are presented in the currency of the primary economic environment in which the subsidiary operates (its functional currency). For the purpose of the consolidated financial statements, the results and financial position of each subsidiary are expressed in euros, which is the presentation currency for the Group.
Foreign currency transactions are translated into the functional currency using the exchange rates prevailing at the dates of the transactions. Monetary assets and liabilities denominated in foreign currencies are remeasured to the functional currency of the entity at the rate of exchange in effect at the statement of financial position date with the resulting gain or loss recorded in the
consolidated income statement
. The
consolidated income statement
includes non-operating items which are primarily made up of remeasurement gains and losses related to currency exchange rate fluctuations on financing transactions denominated in a currency other than the subsidiary’s functional currency. Non-operating items are shown on a net basis and reflect the impact of any derivative instruments utilized to hedge the foreign currency movements of the underlying financing transactions.
The assets and liabilities of the Group's foreign operations are translated from local currencies to the euro reporting currency at currency exchange rates in effect at the end of each reporting period. Revenues and expenses are translated at average monthly currency exchange rates, with average rates being a reasonable approximation of the rates prevailing on the transaction dates. Gains and losses from translation are included in other comprehensive income. On disposal of a foreign operation, accumulated exchange differences are recognised as a component of the gain or loss on disposal.
Reporting periods
In these financial statements, the Group, as the successor to CCE, is reporting the financial results of CCE for the period 1 January 2015 to 27 May 2016 and the financial results for CCEP from
28 May 2016
to
31 December 2017
.
Sales of the Group’s products are seasonal, with the second and third quarters accounting for higher unit sales of the Group’s products than the first and fourth quarters. The seasonality of the Group’s sales volume, combined with the accounting for fixed costs such as depreciation, amortisation, rent and interest expense, impacts the Group’s reported results for the first and second halves of the year. Additionally, year-over-year shifts in holidays, selling days and weather patterns can impact the Group’s results on an annual or half-yearly basis.
The following table summarises the number of selling days by quarter for the years ended
31 December 2017
, 31 December
2016
and
31 December 2015
(based on a standard five-day selling week):
|
First Quarter
|
Second Quarter
|
Third Quarter
|
Fourth Quarter
|
Full Year
|
||||||
|
2017
|
65
|
65
|
65
|
65
|
260
|
|||||
|
2016
|
66
|
65
|
65
|
65
|
261
|
|||||
|
2015
|
67
|
65
|
65
|
64
|
261
|
|||||
Accounting policies
The accounting policies applied by the Group are included in the relevant notes herein and have been adopted consistently for the periods presented. Refer to
Note 24
for additional significant accounting policies and recent accounting developments.
Significant judgements and estimates
The preparation of these financial statements requires management to make judgements, estimates and assumptions that affect the application of accounting policies and the reported amounts of assets and liabilities, income and expense. Actual results may differ from these estimates. The significant judgements made in applying the Group’s accounting policies were applied consistently across the annual periods. The significant judgements and key sources of estimation uncertainty that have a significant effect on the amounts recognised in these financial statements are outlined below:
Deductions from revenue and sales incentives
The Group participates in various programmes and arrangements with customers designed to increase the sale of products. The costs of these programmes are recorded as a deduction from revenue. Among the programmes are arrangements under which allowances can be earned by customers for attaining agreed-upon sales levels or for participating in specific marketing programmes.
Under customer programmes and arrangements that require sales incentives to be paid in advance, the Group amortises the amount paid over the period of benefit or contractual sales volume. When incentives are paid in arrears, the Group accrues the estimated amount to be paid based upon historical customer experience, the programme’s contractual terms, expected customer performance and/or estimated sales volume. Due in part to the length of time necessary to obtain relevant data from the Group’s customers, actual amounts paid can differ from these estimates. Refer to
Note 13
for further details about accruals for the Group’s customer marketing programmes.
|
|
P a g e |
116
|
Income tax
The Group is subject to income taxes in numerous jurisdictions and there are many transactions for which the ultimate tax determination cannot be assessed with certainty in the ordinary course of business. The Group recognises a provision for situations that might arise in the foreseeable future based on assessment of the probabilities as to whether additional taxes will be due. In addition, the Group is involved in various legal proceedings and tax matters. Where an outflow of funds is believed to be probable and a reliable estimate of the outcome of the dispute can be made, management provides for its best estimate of the liability. Where the final outcome on these matters is different from the amounts that were initially recorded, such differences will impact the tax provision in the period in which such determination is made. These estimates are inherently judgemental and could change over time as new facts emerge and each circumstance progresses. The evaluation of deferred tax assets recoverability requires judgements to be made regarding the availability of future taxable income in the jurisdiction giving rise to the deferred tax asset. Refer to
Note 19
for further details regarding income taxes.
Intangible assets and goodwill
The Group has assigned indefinite lives to its bottling agreements with The Coca-Cola Company (TCCC). This judgement has been made after evaluating the contractual provisions of the bottling agreements, the Group’s mutually beneficial relationship with TCCC and the history of renewals for bottling agreements.
Determining whether goodwill and intangible assets with indefinite lives are impaired requires an estimation of the value in use or the fair value less costs to sell of the cash-generating units (CGU) to which the goodwill or intangible asset has been allocated. The value in use calculation requires management’s judgement in estimating the future cash flows expected to arise from the CGU and a suitable discount rate in order to calculate present value. Additionally, in connection with the Merger, the CGU goodwill allocation was primarily based upon management’s estimates of the synergy benefits expected to be realised for each CGU.
Refer to
Note 5
for further details about the judgement regarding the lives of bottling agreements, as well as the key sources of estimation uncertainty used in the impairment analysis of goodwill and intangible assets with indefinite lives and the goodwill allocation to each CGU.
Restructuring
The Group holds provisions related to its ongoing restructuring programmes, some of which were in-flight at the time of the Merger and others that have been announced after the Merger. These provisions are predominantly made up of severance costs. While a detailed plan is in place for the respective events, the amount and timing of outflows is subject to estimation uncertainty. Estimates are based on management judgement and information available at the statement of financial position date. Actual outflows may not occur as anticipated, and estimates may prove to be incorrect, leading to further charges or releases of provisions as circumstances dictate. Refer to
Note 16
and
Note 21
for further details regarding restructuring provisions.
Business combinations
The determination of the fair values of the assets acquired and liabilities assumed in the Merger and the useful life of intangible assets and property, plant and equipment acquired was finalised during 2017. This exercise was a substantial undertaking, which required the use of various valuation techniques. Refer to
Note 2
for further details regarding the Merger including the determination of final fair values for the acquired assets and liabilities assumed in the Merger.
Defined benefit plans
The determination of the pension and other post-retirement benefit costs and obligations are estimated based on assumptions determined with the assistance of external actuarial advice. The key assumptions impacting the valuations are the discount rate, salary rate of inflation, mortality rates and retirement patterns. Refer to
Note 14
for further details about the Group’s defined benefit pension plan costs and obligations.
Note 2
BUSINESS COMBINATIONS
Business acquisitions are accounted for using the acquisition method at the acquisition date, which is the date on which control is transferred to the Group.
The cost of an acquisition is measured as the aggregate of the consideration transferred, measured at acquisition date fair value, and the amount of any non-controlling interest in the acquiree. For each business acquisition, the Group measures the non-controlling interest in the acquiree either at fair value or at the proportionate share of the acquiree’s identifiable net assets. Acquisition related costs are expensed as incurred.
Goodwill is initially recorded as the excess of the aggregate consideration transferred over the amount recognised for net identifiable assets acquired and liabilities assumed. If the fair value of the net assets acquired is in excess of the aggregate consideration transferred, the gain is recognised in the
consolidated income statement
. Goodwill is not subject to amortisation and is tested annually for impairment, or more frequently if events or changes in circumstances indicate that it might be impaired.
|
|
P a g e |
117
|
Formation of CCEP
On
28 May 2016
, the Company acquired
100 percent
of the issued and outstanding shares of CCE, a US publicly listed company, CCIP, a private company and the bottling partner for TCCC for Spain, Portugal and Andorra and CCEG, formerly a wholly-owned subsidiary of TCCC, and TCCC’s strategic bottling partner in Germany. The Merger was consummated to enhance the alignment of the Coca-Cola system to compete more effectively across Western Europe with world-class production, sales and distribution platforms and to generate synergies, including supply chain benefits and operating efficiencies. As at
28 May 2016
, each share of CCE common stock issued and outstanding immediately prior to the Merger was cancelled and converted into the right to receive: (1)
US$14.50
in cash, without interest and (2)
one
Company share of common stock. On a fully diluted basis, CCE shareholders received approximately
48 percent
of issued Company shares. CCIP and CCEG shareholders received approximately
34 percent
and
18 percent
, respectively, of the outstanding total Company shares.
The following table outlines the number of shares and total consideration transferred to CCIP and CCEG shareholders in exchange for their businesses, which was calculated based on the closing stock price of CCE common stock immediately prior to the acquisition date, adjusted for the
US$14.50
return of capital to CCE shareholders and converted to euros (consideration calculated prior to rounding):
|
CCIP
(A)
|
|
CCEG
(B)
|
|
Total
|
|
||||
|
Company shares issued (rounded, millions of shares)
|
166
|
|
88
|
|
254
|
|
|||
|
CCE adjusted stock price as at 27 May 2016 (€)
|
33.33
|
|
33.33
|
|
33.33
|
|
|||
|
Total consideration (€ million)
|
5,537
|
|
2,932
|
|
8,469
|
|
|||
|
(A)
|
Olive Partners is the shareholder that received consideration for CCIP.
|
|
(B)
|
European Refreshments, a wholly-owned subsidiary of TCCC, is the shareholder that received consideration for CCEG.
|
The fair values of the assets and liabilities acquired as part of the Merger were provisional as at 31 December 2016 due to the complexity of the acquired businesses. During 2017, the Group finalised the valuation process and adjustments to certain of the provisional amounts were recorded based on new information obtained about facts and circumstances that existed at the date of Merger. This additional information primarily resulted in changes to: (1) the valuation inputs used to determine the fair values of property, plant and equipment and intangible assets and (2) the assessment of recoverability of future taxable profits relating to certain deferred tax assets provisionally recognised.
Management concluded that the changes in the fair values from the provisional amounts disclosed in the 2016
consolidated financial statements
were not material to the Group’s 2016
consolidated financial statements
taken as whole. While certain individual line items on the Statement of Financial Position were impacted by a quantitative amount that is more than inconsequential, the overall impact on the Group’s year ended 31 December 2016 financial position and its reported results for the year ending 31 December 2016 was not significant.
|
|
P a g e |
118
|
As a result, all fair value acquisition accounting adjustments have been recognised in the current period; the
consolidated statement of financial position
as at 31 December 2016 and the
consolidated income statement
for the year ended 31 December 2016 have not been restated. The following table provides the final fair value acquisition accounting adjustments made to the provisional amounts recognised:
|
Provisional fair values at 31 December 2016
|
|
Fair value acquisition accounting adjustments
|
|
Final acquisition date fair value
|
|
||||
|
€ million
|
|
€ million
|
|
€ million
|
|
||||
|
Intangible assets
|
5,429
|
|
129
|
|
5,558
|
|
|||
|
Goodwill
|
2,342
|
|
98
|
|
2,440
|
|
|||
|
Property, plant and equipment
|
2,218
|
|
(149
|
)
|
2,069
|
|
|||
|
Deferred tax assets
|
91
|
|
(48
|
)
|
43
|
|
|||
|
Other non-current assets
|
31
|
|
(3
|
)
|
28
|
|
|||
|
Total non-current assets
|
10,111
|
|
27
|
|
10,138
|
|
|||
|
Current tax assets
|
19
|
|
—
|
|
19
|
|
|||
|
Inventories
|
374
|
|
11
|
|
385
|
|
|||
|
Amounts receivable from related parties
|
47
|
|
—
|
|
47
|
|
|||
|
Trade accounts receivable
|
789
|
|
(39
|
)
|
750
|
|
|||
|
Other current assets
|
249
|
|
3
|
|
252
|
|
|||
|
Cash and cash equivalents
|
149
|
|
—
|
|
149
|
|
|||
|
Total current assets
|
1,627
|
|
(25
|
)
|
1,602
|
|
|||
|
Total assets
|
11,738
|
|
2
|
|
11,740
|
|
|||
|
Borrowings, less current portion
|
(74
|
)
|
—
|
|
(74
|
)
|
|||
|
Employee benefit liabilities
|
(96
|
)
|
—
|
|
(96
|
)
|
|||
|
Non-current provisions
|
(90
|
)
|
—
|
|
(90
|
)
|
|||
|
Deferred tax liabilities
|
(1,580
|
)
|
(7
|
)
|
(1,587
|
)
|
|||
|
Other non-current liabilities
|
(54
|
)
|
(11
|
)
|
(65
|
)
|
|||
|
Total non-current liabilities
|
(1,894
|
)
|
(18
|
)
|
(1,912
|
)
|
|||
|
Current portion of borrowings
|
(21
|
)
|
—
|
|
(21
|
)
|
|||
|
Current portion of employee benefit liabilities
|
(24
|
)
|
—
|
|
(24
|
)
|
|||
|
Current provisions
|
(148
|
)
|
—
|
|
(148
|
)
|
|||
|
Current tax liabilities
|
(18
|
)
|
3
|
|
(15
|
)
|
|||
|
Amounts payable to related parties
|
(214
|
)
|
—
|
|
(214
|
)
|
|||
|
Trade and other payables
|
(950
|
)
|
13
|
|
(937
|
)
|
|||
|
Total current liabilities
|
(1,375
|
)
|
16
|
|
(1,359
|
)
|
|||
|
Total liabilities
|
(3,269
|
)
|
(2
|
)
|
(3,271
|
)
|
|||
Goodwill of
€2.4 billion
was recognised in connection with the Merger representing the excess of consideration transferred over the fair value of the net assets acquired. The goodwill is attributable to the synergies of the combined business operations, new growth opportunities and workforce, and it is not expected to be deductible for tax purposes. The goodwill generated from the Merger has been allocated to each of the Group’s CGUs expected to benefit from the Merger, including CGUs other than Iberia (CCIP) and Germany (CCEG). See
Note 5
for further details about the allocation of goodwill to the Group’s CGUs.
Intangible assets include franchise intangible assets, customer relationships and capitalised software. The franchise intangible assets were valued using an income approach (discounted cash flow analysis). While the agreements related to franchise intangible assets contain no automatic right of renewal, the Group believes that the interdependent relationship with TCCC and the substantial cost and disruption to TCCC that would be caused by non-renewals ensures that these agreements will continue to be renewed and, therefore, are in effect perpetual. After evaluating the contractual provisions of the bottling agreements, the mutually beneficial relationship with TCCC and history of renewals, the Group has assigned indefinite lives to all such franchise intangible assets. Refer to
Note 5
for further details about the Group’s intangible assets and goodwill.
|
|
P a g e |
119
|
Note 3
SEGMENT INFORMATION
Description of segment and principal activities
The Group evaluates its segmental reporting under IFRS 8, “Operating Segments”. The Group derives its revenues through a single business activity, which is selling, making and distributing ready-to-drink beverages. The Group operates solely in developed markets in Western Europe and has a homogenous product portfolio across its geographic territories. Based on the governance structure of the Group, including decision-making authority and oversight, the Group has determined that the Board is its Chief Operating Decision Maker (CODM). The Board, as the CODM, allocates resources and evaluates performance at a consolidated level and therefore, the Group has one operating segment.
No
single customer accounted for more than
10%
of the Group’s revenue during the years ended
31 December 2017
, 31 December
2016
and
31 December 2015
.
Revenue by geography
The following table summarises revenue from external customers by geography, which is based on the origin of the sale:
|
Year Ended
|
||||||||
|
31 December 2017
|
|
31 December 2016
|
|
31 December 2015
|
|
|||
|
Revenue:
|
€ million
|
|
€ million
|
|
€ million
|
|
||
|
Spain/Portugal/Andorra
|
2,706
|
|
1,721
|
|
n/a
|
|
||
|
Germany
|
2,218
|
|
1,335
|
|
n/a
|
|
||
|
Great Britain
|
2,026
|
|
2,076
|
|
2,364
|
|
||
|
France/Monaco
|
1,803
|
|
1,791
|
|
1,817
|
|
||
|
Belgium/Luxembourg/Netherlands
|
1,445
|
|
|
1,414
|
|
1,405
|
|
|
|
Norway
|
416
|
|
408
|
|
405
|
|
||
|
Sweden
|
353
|
|
350
|
|
338
|
|
||
|
Iceland
|
95
|
|
38
|
|
n/a
|
|
||
|
Total
|
11,062
|
|
9,133
|
|
6,329
|
|
||
Assets by geography
Assets are allocated based on operations and physical location. The following table summarises non-current assets, other than financial instruments and deferred tax assets by geography:
|
31 December 2017
|
|
31 December 2016
|
|
||
|
€ million
|
|
€ million
|
|
||
|
Spain/Portugal/Andorra
|
6,561
|
|
6,479
|
|
|
|
Germany
|
3,176
|
|
3,151
|
|
|
|
Great Britain
|
2,395
|
|
2,458
|
|
|
|
Belgium/Luxembourg/Netherlands
|
1,041
|
|
1,029
|
|
|
|
France/Monaco
|
876
|
|
856
|
|
|
|
Sweden
|
421
|
|
431
|
|
|
|
Norway
|
267
|
|
295
|
|
|
|
Iceland
|
41
|
|
45
|
|
|
|
Other unallocated
|
44
|
|
90
|
|
|
|
Total
|
14,822
|
|
|
14,834
|
|
|
|
P a g e |
120
|
Note 4
EARNINGS PER SHARE
Basic earnings per share is calculated by dividing profit after taxes by the weighted average number of shares in issue and outstanding during the period. Diluted earnings per share is calculated in a similar manner, but includes the effect of dilutive securities, principally share options and restricted share units. Share-based payment awards that are contingently issuable upon the achievement of specified market and/or performance conditions are included in the diluted earnings per share calculation based on the number of shares that would be issuable if the end of the period was the end of the contingency period.
The following table summarises basic and diluted earnings per share calculations for the years presented:
|
Year Ended
|
||||||||
|
31 December 2017
|
|
31 December 2016
|
|
31 December 2015
|
|
|||
|
Profit after taxes attributable to equity shareholders (€ million)
|
688
|
|
549
|
|
513
|
|
||
|
Basic weighted average number of shares in issue
(A)
(million)
|
484
|
|
380
|
|
231
|
|
||
|
Effect of dilutive potential shares (million)
(B)
|
5
|
|
5
|
|
4
|
|
||
|
Diluted weighted average number of shares in issue
(A)
(million)
|
489
|
|
385
|
|
235
|
|
||
|
Basic earnings per share (€)
|
1.42
|
|
1.45
|
|
2.23
|
|
||
|
Diluted earnings per share (€)
|
1.41
|
|
1.42
|
|
2.19
|
|
||
|
(A)
|
The increase of the basic and diluted weighted average number of shares in issue is due to the Merger transaction and further described in Note 15. As at
31 December 2017
and at 31 December 2016, the Group had
484,586,428
shares and
483,076,396
shares, respectively in issue and outstanding.
|
|
(B)
|
For the years ended
31 December 2017
,
31 December 2016
and
31 December 2015
, outstanding options to purchase
1.2 million
shares,
1.2 million
shares and
1.6 million
shares, respectively, were excluded from the diluted earnings per share calculation because the effect of including these options in the computation would have been antidilutive. The dilutive impact of the remaining options outstanding and unvested restricted share units was included in the effect of dilutive securities.
|
Note 5
INTANGIBLE ASSETS AND GOODWILL
Intangible assets with indefinite lives
Intangible assets with indefinite lives acquired through business combination transactions are measured at fair value at the date of acquisition. These assets are not subject to amortisation but are tested for impairment at least annually at the CGU level or more frequently if facts and circumstances arise that would indicate an impairment may exist. In addition to the annual impairment test, the assessment of indefinite lives is also reviewed annually.
Franchise intangible assets
The Group’s bottling agreements contain performance requirements and convey the rights to distribute and sell products within specified territories. The Group’s agreements with TCCC for each of its territories have terms of
10
years and expire on
28 May 2026
, with each containing the right for the Group to request a
10
-year renewal. While these agreements contain no automatic right of renewal beyond that date, the Group believes that its interdependent relationship with TCCC and the substantial cost and disruption to TCCC that would be caused by non-renewal ensure that these agreements will continue to be renewed and, therefore, are essentially perpetual. The Group has never had a bottling agreement with TCCC terminated due to non-performance of the terms of the agreement or due to a decision by TCCC to terminate an agreement at the expiration of a term. After evaluating the contractual provisions of bottling agreements, the Group’s mutually beneficial relationship with TCCC and history of renewals, indefinite lives have been assigned to all of the Group’s franchise intangible assets.
Goodwill
Goodwill is initially measured as the excess of the total consideration transferred over the amount recognised for net identifiable assets acquired and liabilities assumed in a business combination. If the fair value of the net assets acquired is in excess of the aggregate consideration transferred, the gain is recognised in the
consolidated income statement
as a bargain purchase. Goodwill is not subject to amortisation. It is tested annually for impairment at the CGU level or more frequently if events or changes in circumstances indicate that it might be impaired. Goodwill acquired in a business combination is, from the acquisition date, allocated to the CGU that is expected to benefit from the synergies of the combination irrespective of whether a CGU is part of the business combination.
|
|
P a g e |
121
|
Intangible assets with finite lives
Intangible assets with finite lives are measured at cost of acquisition or production and are amortised using the straight-line method over their respective estimated useful lives. Finite lived intangible assets are assessed for impairment whenever there is an indication that they may be impaired. The amortisation period and method are reviewed annually.
Internally generated software
The Group capitalises certain development costs associated with internally developed software, including external direct costs of materials and services and payroll costs for employees devoting time to a software project, and any such software acquired as part of a business combination. Development expenditure is recognised as an intangible asset only after its technical feasibility and commercial viability can be demonstrated. When capitalised software is not integral to related hardware it is treated as an intangible asset; otherwise it is included within property, plant and equipment. The estimated useful lives of capitalised software range from
5
to
10
years. Amortisation expense for capitalised software is included within administrative expenses and was
€38 million
,
€33 million
and
€25 million
for the years ended
31 December 2017
, 31 December
2016
and 31 December
2015
, respectively.
Customer relationships
The Group acquired certain customer relationships in connection with the acquisitions of the Norway and Sweden bottling operations from TCCC in 2010 and the Merger with CCIP and CCEG in 2016. These customer relationships were recorded at their fair values on the date of acquisition, and they are amortised over an estimated economic life of
20
years. The fair values were determined using a “with and without” valuation technique, which compares the revenues with all assets of the business in place, to a “without” scenario, which assumes the customer relationship asset and related revenues do not exist and must be rebuilt over time. Amortisation expense for these assets was
€9 million
,
€6 million
and
€1 million
for the years ended
31 December 2017
, 31 December
2016
and 31 December
2015
, respectively.
|
|
P a g e |
122
|
Balances and movements in intangible assets and goodwill
The following table summarises the movements in the carrying amounts of intangible assets and goodwill for the periods presented:
|
Franchise intangible
|
|
Software
|
|
Customer relationships
|
|
Assets under construction
|
|
Total intangibles
|
|
Goodwill
|
|
|||||||
|
Cost:
|
€ million
|
|
€ million
|
|
€ million
|
|
€ million
|
|
€ million
|
|
€ million
|
|
||||||
|
As at 31 December 2015
|
3,114
|
|
152
|
|
17
|
|
16
|
|
3,299
|
|
81
|
|
||||||
|
Additions
|
—
|
|
37
|
|
3
|
|
—
|
|
40
|
|
—
|
|
||||||
|
Acquired - Merger (Note 2)
|
5,170
|
|
83
|
|
173
|
|
3
|
|
5,429
|
|
2,342
|
|
||||||
|
Acquired - Vifilfell, hf. (Note 2)
|
2
|
|
—
|
|
—
|
|
—
|
|
2
|
|
1
|
|
||||||
|
Disposals
|
—
|
|
(4
|
)
|
—
|
|
—
|
|
(4
|
)
|
—
|
|
||||||
|
Transfers and reclassifications
|
—
|
|
16
|
|
—
|
|
(16
|
)
|
—
|
|
—
|
|
||||||
|
Currency translation adjustments
|
(283
|
)
|
(7
|
)
|
—
|
|
—
|
|
(290
|
)
|
3
|
|
||||||
|
As at 31 December 2016
|
8,003
|
|
277
|
|
193
|
|
3
|
|
8,476
|
|
2,427
|
|
||||||
|
Additions
|
—
|
|
26
|
|
—
|
|
10
|
|
36
|
|
—
|
|
||||||
|
Disposals
|
—
|
|
(5
|
)
|
—
|
|
—
|
|
(5
|
)
|
—
|
|
||||||
|
Currency translation adjustments
|
(73
|
)
|
(14
|
)
|
(1
|
)
|
—
|
|
(88
|
)
|
(5
|
)
|
||||||
|
Acquisition accounting adjustments
(A)
|
179
|
|
(17
|
)
|
(30
|
)
|
(3
|
)
|
129
|
|
98
|
|
||||||
|
As at 31 December 2017
|
8,109
|
|
267
|
|
162
|
|
10
|
|
8,548
|
|
2,520
|
|
||||||
|
Accumulated amortisation:
|
||||||||||||||||||
|
As at 31 December 2015
|
—
|
|
(92
|
)
|
(5
|
)
|
—
|
|
(97
|
)
|
—
|
|
||||||
|
Amortisation expense
|
—
|
|
(33
|
)
|
(6
|
)
|
—
|
|
(39
|
)
|
—
|
|
||||||
|
Disposals
|
—
|
|
4
|
|
—
|
|
—
|
|
4
|
|
—
|
|
||||||
|
Transfers and reclassifications
|
—
|
|
1
|
|
—
|
|
—
|
|
1
|
|
—
|
|
||||||
|
Currency translation adjustments
|
—
|
|
(1
|
)
|
—
|
|
—
|
|
(1
|
)
|
—
|
|
||||||
|
As at 31 December 2016
|
—
|
|
(121
|
)
|
(11
|
)
|
—
|
|
(132
|
)
|
—
|
|
||||||
|
Amortisation expense
|
—
|
|
(38
|
)
|
(9
|
)
|
—
|
|
(47
|
)
|
—
|
|
||||||
|
Disposals
|
—
|
|
5
|
|
—
|
|
—
|
|
5
|
|
—
|
|
||||||
|
Currency translation adjustments
|
—
|
|
9
|
|
1
|
|
—
|
|
10
|
|
—
|
|
||||||
|
As at 31 December 2017
|
—
|
|
(145
|
)
|
(19
|
)
|
—
|
|
(164
|
)
|
—
|
|
||||||
|
Net book value:
|
|
|
|
|
|
|||||||||||||
|
As at 31 December 2015
|
3,114
|
|
60
|
|
12
|
|
16
|
|
3,202
|
|
81
|
|
||||||
|
As at 31 December 2016
|
8,003
|
|
156
|
|
182
|
|
3
|
|
8,344
|
|
2,427
|
|
||||||
|
As at 31 December 2017
|
8,109
|
|
122
|
|
143
|
|
10
|
|
8,384
|
|
2,520
|
|
||||||
|
(A)
|
In connection with the finalisation of acquisition accounting and as described in
Note 2
, fair value acquisition accounting adjustments have been recognised in the current period.
|
Impairment testing
Each CGU is tested for impairment at least annually in the fourth quarter or whenever there is an indication of impairment. The recoverable amount of each CGU is determined through a value in use calculation. To determine value in use for a CGU, estimated future cash flows are discounted to their present values using a pre-tax discount rate reflective of the current market conditions and risks specific to each CGU. If the carrying value of a CGU exceeds its recoverable amount, the carrying value of the CGU is reduced to its recoverable amount and impairment charges are recognised immediately within the
consolidated income statement
. Impairment charges other than those related to goodwill may be reversed in future periods if a subsequent test indicates that the recoverable amount has increased. Such recoveries may not exceed a CGU’s original carrying value less any depreciation that would have been recognised if no impairment charges were previously recorded.
|
|
P a g e |
123
|
The Group’s CGUs are based on geography and generally represent the individual territories in which the Group operates. For purposes of allocating intangibles, each franchise intangible is allocated to the geographic region to which the agreement relates, and goodwill is allocated to each of the CGUs expected to benefit from a business combination, irrespective of whether other assets and liabilities of the acquired businesses are assigned to the CGUs. The following table identifies the carrying value of goodwill and indefinite-lived intangible assets attributable to each significant CGU of the Group. In addition to the significant CGUs of the Group, as at
31 December 2017
the Group had other CGUs with total franchise intangible assets of
€663 million
and goodwill of
€206 million
, which includes
€128 million
related to goodwill allocated from the Merger.
|
31 December 2017
|
31 December 2016
|
|||||||||||
|
Franchise intangible
|
|
Goodwill
|
|
Franchise intangible
|
|
Goodwill
|
|
|||||
|
Cash-generating unit
|
€ million
|
|
€ million
|
|
€ million
|
|
€ million
|
|
||||
|
Iberia
|
4,289
|
|
1,275
|
|
4,270
|
|
1,171
|
|
||||
|
Great Britain
|
1,647
|
|
200
|
|
1,705
|
|
200
|
|
||||
|
Germany
|
1,060
|
|
748
|
|
900
|
|
753
|
|
||||
|
Benelux (Belgium, Netherlands and Luxembourg)
|
451
|
|
91
|
|
451
|
|
91
|
|
||||
The recoverable amounts of each CGU were determined through a value in use calculation, which uses cash flow projections for a five-year period. The key assumptions used in projecting these cash flows were as follows:
|
•
|
Discount rate: A weighted-average cost of capital was applied specific to each CGU as a hurdle rate to discount cash flows. The discount rates represent the current market assessment of the risks specific to each CGU, taking into consideration the time value of money and individual risks of the underlying assets that have not been incorporated in the cash flow estimates. The table below identifies the pre-tax discount rate attributable to each significant CGU for the Group’s fiscal year
2017
and
2016
.
|
|
•
|
Growth rate: Cash flows were projected for five years based on the Group’s three-year business plans approved by the Board. Cash flows for the fourth year were projected using compound annual growth rates over the preceding three years, and cash flows for a fifth year and beyond the five-year period were projected using a terminal growth rate of
2%
.
|
|
•
|
Gross and operating margins: Gross and operating margins are based on the business plans approved by the Board. Key assumptions are made within these plans about volume, pricing, discounts and costs based on historical data, current strategy and expected market trends.
|
|
Pre-tax discount rate
|
31 December
|
|||
|
2017
|
2016
|
|||
|
Cash-generating unit
|
%
|
%
|
||
|
Iberia
|
11
|
11
|
||
|
Great Britain
|
10
|
11
|
||
|
Germany
|
10
|
11
|
||
|
Benelux
|
10
|
10
|
||
The Group did not record any impairment charges as a result of the tests conducted in 2017 and 2016. The Group’s Great Britain and Benelux CGU’s have substantial headroom when comparing the estimated value in use calculation of the CGU versus the CGU’s carrying value.
For the Group’s Germany and Iberia CGUs, the headroom in the
2017
impairment analysis was approximately
24%
and
19%
of carrying value, respectively, which is representative of the fact that the net assets of Germany and Iberia were recently subject to acquisition accounting and fair valued based upon operating plans and macroeconomic conditions present at the time of the Merger. As a result, should operating results or macroeconomic conditions deteriorate versus those utilised to fair value the assets, an impairment of the acquired assets could result in the future.
The calculation of value in use is most sensitive to the discount rate and terminal growth rate assumptions. The Group estimates that for the Germany and Iberia CGUs, an approximate
1.25%
increase in the discount rate, or a
1.5%
reduction in terminal growth rates, would eliminate existing headroom.
|
|
P a g e |
124
|
Note 6
PROPERTY, PLANT AND EQUIPMENT
Property, plant and equipment is recorded at cost, net of accumulated depreciation and accumulated impairment losses, where cost is the amount of cash or cash equivalents paid to acquire an asset at the time of its acquisition or construction. Major property additions, replacements and improvements are capitalised, while maintenance and repairs that do not extend the useful life of an asset or add new functionality are expensed as incurred. Land is not depreciated, as it is considered to have an indefinite life. For all property, plant and equipment, other than land, depreciation is recorded using the straight-line method over the respective estimated useful lives as follows:
|
Useful life (years)
|
||
|
Category
|
Low
|
High
|
|
Building and improvements
|
10
|
40
|
|
Machinery, equipment and containers
|
3
|
20
|
|
Cold-drink equipment
|
5
|
12
|
|
Vehicle fleet
|
5
|
12
|
|
Furniture and office equipment
|
4
|
10
|
Gains or losses arising on the disposal or retirement of an asset are determined as the difference between the carrying amount of the asset and any proceeds from its sale. Leasehold improvements are amortised using the straight-line method over the shorter of the remaining lease term or the estimated useful life of the improvement.
The Group assesses, at each reporting date, whether there is an indication that an asset may be impaired. If any indication exists, an impairment test is performed to estimate the potential loss of value that may reduce the recoverable amount of the asset to below its carrying amount. Any impairment loss is recognised within the
consolidated income statement
by the amount which the carrying amount exceeds the recoverable amount. Useful lives and residual amounts are reviewed annually, and adjustments are made prospectively as required.
For property, plant and equipment, the Group assesses annually whether there is an indication that previously recognised impairment losses no longer exist or have decreased. If such indication exists, a previously recognised impairment loss is reversed only if there has been a change in the assumptions used to determine the asset’s recoverable amount since the last impairment loss was recognised and only up to the recoverable amount or the original carrying amount net of depreciation that would have been incurred had no impairment losses been recognised.
|
|
P a g e |
125
|
The following table summarises the movement in net book value for property, plant and equipment for the periods presented:
|
Land
|
|
Building and improvements
|
|
Machinery, equipment and containers
|
|
Cold-drink equipment
|
|
Vehicle fleet
|
|
Furniture and office equipment
|
|
Assets under construction
|
|
Total
|
|
|||||||||
|
€ million
|
|
€ million
|
|
€ million
|
|
€ million
|
|
€ million
|
|
€ million
|
|
€ million
|
|
€ million
|
|
|||||||||
|
Cost:
|
||||||||||||||||||||||||
|
As at 31 December 2015
|
120
|
|
823
|
|
1,269
|
|
978
|
|
61
|
|
112
|
|
111
|
|
3,474
|
|
||||||||
|
Additions
|
6
|
|
72
|
|
134
|
|
123
|
|
10
|
|
19
|
|
104
|
|
468
|
|
||||||||
|
Acquired - Merger (Note 2)
|
207
|
|
607
|
|
943
|
|
272
|
|
59
|
|
42
|
|
88
|
|
2,218
|
|
||||||||
|
Acquired - Vifilfell, hf. (Note 2)
|
—
|
|
22
|
|
10
|
|
3
|
|
—
|
|
1
|
|
—
|
|
36
|
|
||||||||
|
Disposals
|
(2
|
)
|
(11
|
)
|
(91
|
)
|
(137
|
)
|
(6
|
)
|
(7
|
)
|
—
|
|
(254
|
)
|
||||||||
|
Transfers and reclassifications
|
—
|
|
36
|
|
151
|
|
(2
|
)
|
—
|
|
1
|
|
(178
|
)
|
8
|
|
||||||||
|
Currency translation adjustments
|
(7
|
)
|
(37
|
)
|
(66
|
)
|
(51
|
)
|
—
|
|
(3
|
)
|
—
|
|
(164
|
)
|
||||||||
|
As at 31 December 2016
|
324
|
|
1,512
|
|
2,350
|
|
1,186
|
|
124
|
|
165
|
|
125
|
|
5,786
|
|
||||||||
|
Additions
|
1
|
|
38
|
|
155
|
|
168
|
|
8
|
|
18
|
|
129
|
|
517
|
|
||||||||
|
Disposals
|
(3
|
)
|
(8
|
)
|
(116
|
)
|
(82
|
)
|
(2
|
)
|
(13
|
)
|
—
|
|
(224
|
)
|
||||||||
|
Transfers and reclassifications
|
—
|
|
5
|
|
68
|
|
(1
|
)
|
1
|
|
1
|
|
(74
|
)
|
—
|
|
||||||||
|
Currency translation adjustments
|
(5
|
)
|
(16
|
)
|
(24
|
)
|
(20
|
)
|
(1
|
)
|
(6
|
)
|
—
|
|
(72
|
)
|
||||||||
|
Acquisition accounting adjustments and
reclassifications
(A)
|
(5
|
)
|
(78
|
)
|
(5
|
)
|
(48
|
)
|
(12
|
)
|
12
|
|
—
|
|
(136
|
)
|
||||||||
|
As at 31 December 2017
|
312
|
|
1,453
|
|
2,428
|
|
1,203
|
|
118
|
|
177
|
|
180
|
|
5,871
|
|
||||||||
|
Accumulated depreciation:
|
||||||||||||||||||||||||
|
As at 31 December 2015
|
—
|
|
(344
|
)
|
(637
|
)
|
(674
|
)
|
(43
|
)
|
(84
|
)
|
—
|
|
(1,782
|
)
|
||||||||
|
Depreciation expense
|
—
|
|
(47
|
)
|
(157
|
)
|
(101
|
)
|
(11
|
)
|
(17
|
)
|
—
|
|
(333
|
)
|
||||||||
|
Disposals
|
—
|
|
9
|
|
70
|
|
135
|
|
4
|
|
6
|
|
—
|
|
224
|
|
||||||||
|
Transfers and reclassifications
|
—
|
|
—
|
|
—
|
|
—
|
|
—
|
|
—
|
|
—
|
|
—
|
|
||||||||
|
Currency translation adjustments
|
—
|
|
19
|
|
34
|
|
42
|
|
1
|
|
2
|
|
—
|
|
98
|
|
||||||||
|
As at 31 December 2016
|
—
|
|
(363
|
)
|
(690
|
)
|
(598
|
)
|
(49
|
)
|
(93
|
)
|
—
|
|
(1,793
|
)
|
||||||||
|
Depreciation expense
|
—
|
|
(64
|
)
|
(223
|
)
|
(119
|
)
|
(17
|
)
|
(20
|
)
|
—
|
|
(443
|
)
|
||||||||
|
Disposals
|
—
|
|
3
|
|
85
|
|
75
|
|
2
|
|
12
|
|
—
|
|
177
|
|
||||||||
|
Transfers and reclassifications
|
—
|
|
—
|
|
—
|
|
—
|
|
—
|
|
—
|
|
—
|
|
—
|
|
||||||||
|
Currency translation adjustments
|
—
|
|
6
|
|
12
|
|
13
|
|
1
|
|
6
|
|
—
|
|
38
|
|
||||||||
|
Acquisition accounting adjustments and reclassifications
(A)
|
—
|
|
6
|
|
(4
|
)
|
(3
|
)
|
(4
|
)
|
(8
|
)
|
—
|
|
(13
|
)
|
||||||||
|
As at 31 December 2017
|
—
|
|
(412
|
)
|
(820
|
)
|
(632
|
)
|
(67
|
)
|
(103
|
)
|
—
|
|
(2,034
|
)
|
||||||||
|
Net book value:
|
||||||||||||||||||||||||
|
As at 31 December 2015
|
120
|
|
479
|
|
632
|
|
304
|
|
18
|
|
28
|
|
111
|
|
1,692
|
|
||||||||
|
As at 31 December 2016
|
324
|
|
1,149
|
|
1,660
|
|
588
|
|
75
|
|
72
|
|
125
|
|
3,993
|
|
||||||||
|
As at 31 December 2017
|
312
|
|
1,041
|
|
1,608
|
|
571
|
|
51
|
|
74
|
|
180
|
|
3,837
|
|
||||||||
|
(A)
|
In connection with the finalisation of acquisition accounting and as described in
Note 2
, fair value acquisition accounting adjustments have been recognised in the current period. In addition, certain reclassifications between cost and accumulated depreciation were made.
|
Finance leases included in property, plant and equipment primarily relate to buildings, office equipment and vehicle fleet assets. The net book value of buildings held under finance leases was €
20 million
and €
18 million
as at
31 December 2017
and
31 December 2016
. The net book value of vehicle fleet held under finance leases was
€43 million
and
€67 million
as at
31 December 2017
and
31 December 2016
. The net book value of furniture and office equipment held under finance leases was
€7 million
and
€12 million
as at
31 December 2017
and
31 December 2016
. Depreciation expense on assets held under finance leases was
€25 million
,
€13 million
and
€10 million
for the years ended
31 December 2017
,
31 December 2016
and
31 December 2015
. Assets held under finance leases have been pledged as security in relation to the liabilities under the finance leases. Some lease agreements include renewal or purchase options or escalation clauses.
|
|
P a g e |
126
|
Note 7
INVENTORIES
Inventories are valued at the lower of cost or net realisable value and cost is determined using the first-in, first-out (FIFO) method. Inventories consist of raw materials, supplies (primarily including concentrate, other ingredients and packaging) and finished goods, which also include direct labour, indirect production and overhead costs. Cost includes all costs incurred to bring inventories to their present location and condition. Spare parts are recorded as assets at the time of purchase and are expensed as utilised. Net realisable value is the estimated selling price in the ordinary course of business, less the estimated costs necessary to complete and sell the inventory.
The following table summarises the inventory outstanding in the
consolidated statement of financial position
as at the dates presented:
|
|
|
31 December 2017
|
|
|
31 December 2016
|
|
|
|
|
€ million
|
|
€ million
|
|
|
|
Finished goods
|
|
324
|
|
|
354
|
|
|
Raw materials and supplies
|
|
223
|
|
|
222
|
|
|
Spare parts
|
|
103
|
|
|
97
|
|
|
Total inventories
|
|
650
|
|
|
673
|
|
Write-downs of inventories to net realisable value totalled
€25 million
and
€28 million
during the years ended
31 December 2017
and
31 December 2016
, respectively, which were included within cost of sales. None of the write-downs were subsequently reversed.
Note 8
TRADE ACCOUNTS RECEIVABLE
The Group sells its products to retailers, wholesalers and other customers and extends credit, generally without requiring collateral, based on an evaluation of the customer’s financial condition. While the Group has a concentration of credit risk in the retail sector, this risk is mitigated due to the diverse nature of the customers the Group serves, including, but not limited to, their type, geographic location, size and beverage channel. Collections of receivables are dependent on each individual customer’s financial condition and sales adjustments granted after the statement of financial position date.
Trade accounts receivable are initially recognised at fair value and subsequently measured at amortised cost less provision for impairment. Typically, accounts receivable have terms of
30
to
60
days and do not bear interest. Recoverability of trade accounts receivable is reviewed on an ongoing basis. Balances are considered for impairment on an individual basis rather than by reference to the extent that they become overdue. The Group considers factors such as delinquency in payment, financial difficulties and the payment history of the debtor. The carrying amount of trade accounts receivable is reduced through the use of an allowance account and the amount of the loss is recognised in the
consolidated income statement
. Credit insurance on a portion of the accounts receivable balance is also carried. Refer to
Note 23
for further details on credit risk management.
The following table summarises the trade accounts receivable outstanding in the
consolidated statement of financial position
as at the dates presented:
|
31 December 2017
|
|
31 December 2016
|
|
|||
|
€ million
|
|
€ million
|
|
|||
|
Trade accounts receivable, gross
|
1,746
|
|
1,874
|
|
||
|
Allowance for doubtful accounts
|
(14
|
)
|
(14
|
)
|
||
|
Total trade accounts receivable
|
1,732
|
|
1,860
|
|
||
|
|
P a g e |
127
|
The following table summarises the aging of trade accounts receivable, net of allowance for doubtful accounts in the
consolidated statement of financial position
as at the dates presented:
|
31 December 2017
|
|
31 December 2016
|
|
|||
|
€ million
|
|
€ million
|
|
|||
|
Not past due
|
1,561
|
|
1,631
|
|
||
|
Past due 1 - 30 days
|
93
|
|
145
|
|
||
|
Past due 31 - 60 days
|
44
|
|
16
|
|
||
|
Past due 61 - 90 days
|
8
|
|
13
|
|
||
|
Past due 91 - 120 days
|
10
|
|
11
|
|
||
|
Past due 121+ days
|
16
|
|
44
|
|
||
|
Total
|
1,732
|
|
1,860
|
|
||
The following table summarises the change in the allowance for doubtful accounts for the periods presented:
|
Allowance for doubtful accounts
|
|
||
|
€ million
|
|
||
|
As at 31 December 2015
|
(13
|
)
|
|
|
Provision for impairment recognised during the year
|
(3
|
)
|
|
|
Receivables written off during the year as uncollectible
|
2
|
|
|
|
As at 31 December 2016
|
(14
|
)
|
|
|
Provision for impairment recognised during the year
|
(4
|
)
|
|
|
Receivables written off during the year as uncollectible
|
4
|
|
|
|
As at 31 December 2017
|
(14
|
)
|
|
Note 9
CASH AND CASH EQUIVALENTS
Cash and cash equivalents include cash and short-term, highly liquid investments with maturity dates of less than three months when acquired that are readily convertible to cash and which are subject to an insignificant risk of changes in value. Counterparties and instruments used to hold the Group’s cash and cash equivalents are continually assessed, with a focus on preservation of capital and liquidity. Bank overdrafts are classified as current portion of borrowings in the
consolidated statement of financial position
.
The following table summarises the cash and cash equivalents outstanding in the
consolidated statement of financial position
as at the dates presented:
|
31 December 2017
|
|
31 December 2016
|
|
|||
|
€ million
|
|
€ million
|
|
|||
|
Cash at banks and on hand
|
304
|
|
279
|
|
||
|
Short-term deposits and securities
|
56
|
|
107
|
|
||
|
Total cash and cash equivalents
|
360
|
|
386
|
|
||
Cash and cash equivalents are held in the following currencies:
|
31 December 2017
|
|
31 December 2016
|
|
|||
|
€ million
|
|
€ million
|
|
|||
|
Euro
|
248
|
|
272
|
|
||
|
US dollar
|
27
|
|
23
|
|
||
|
British pound
|
30
|
|
25
|
|
||
|
Norwegian krone
|
34
|
|
54
|
|
||
|
Swedish krona
|
8
|
|
2
|
|
||
|
Other
|
13
|
|
10
|
|
||
|
Total cash and cash equivalents
|
360
|
|
386
|
|
||
There are no material restrictions on the Group’s cash and cash equivalents.
|
|
P a g e |
128
|
Note 10
FAIR VALUES
Fair value measurements
All assets and liabilities for which fair value is measured or disclosed in the financial statements are categorised within the fair value hierarchy. This is described, as follows, based on the lowest level input that is significant to the fair value measurement as a whole:
|
•
|
Level 1 - Quoted prices in active markets for identical assets or liabilities;
|
|
•
|
Level 2 - Observable inputs other than quoted prices included in Level 1. The Group values assets and liabilities included in this level using dealer and broker quotations, certain pricing models, bid prices, quoted prices for similar assets and liabilities in active markets or other inputs that are observable or can be corroborated by observable market data; or
|
|
•
|
Level 3 - Unobservable inputs that are supported by little or no market activity and that are significant to the fair value of the assets or liabilities. This includes certain pricing models, discounted cash flow methodologies and similar techniques that use significant unobservable inputs.
|
The fair values of the Group’s cash and cash equivalents, trade accounts receivable, amounts receivable from related parties, trade and other payables and amounts payable to related parties approximate their carrying amounts due to their short-term nature.
The fair values of the Group’s borrowings are estimated based on borrowings with similar maturities and credit quality and current market interest rates. These are categorised within Level 2 of the fair value hierarchy as the Group uses certain pricing models and quoted prices for similar liabilities in active markets in assessing their fair values. Refer to
Note 12
for further details regarding the Group’s borrowings.
The following table summarises the book value and fair value of the Group’s borrowings as at the dates presented:
|
31 December 2017
|
|
31 December 2016
|
|
|||
|
€ million
|
|
€ million
|
|
|||
|
Fair value of borrowings
|
5,953
|
|
6,643
|
|
||
|
Book value of borrowings (Note 12)
|
5,748
|
|
6,437
|
|
||
The Group’s derivative assets and liabilities are carried at fair value, which is determined using a variety of valuation techniques, depending on the specific characteristics of the hedging instrument, taking into account credit risk. The fair value of its derivative contracts (including forwards, options, cross-currency swaps and interest rate swaps) are determined using standard valuation models. The significant inputs used in these models are readily available in public markets or can be derived from observable market transactions and, therefore, the derivative contracts have been classified as Level 2. Inputs used in these standard valuation models include the applicable spot, forward and discount rates. The standard valuation model for the option contracts also includes implied volatility, which is specific to individual options and is based on rates quoted from a widely used third party resource. Refer to
Note 11
for further details about the Group’s derivatives.
The following table summarises the fair value of the assets and liabilities as at the dates presented:
|
31 December 2017
|
|
31 December 2016
|
|
|||
|
€ million
|
|
€ million
|
|
|||
|
Assets at fair value:
|
||||||
|
Derivatives (Note 11)
|
22
|
|
58
|
|
||
|
Liabilities at fair value:
|
||||||
|
Derivatives (Note 11)
|
94
|
|
9
|
|
||
For assets and liabilities that are recognised in the financial statements on a recurring basis, the Group determines whether transfers have occurred between levels in the hierarchy by re-assessing categorisation at the end of each reporting period. There have been no transfers between Level 1 and Level 2 during the periods presented.
|
|
P a g e |
129
|
Note 11
HEDGING ACTIVITIES
Derivative financial instruments
The Group utilises derivative financial instruments to mitigate its exposure to certain market risks associated with its ongoing operations. The primary risks that it seeks to manage through the use of derivative financial instruments include currency exchange risk, commodity price risk and interest rate risk. All derivative financial instrument assets and liabilities are recorded at fair value on the
consolidated statement of financial position
. The Group does not use derivative financial instruments for trading or speculative purposes. At the inception of a hedge transaction the Group documents the relationship between the hedging instrument and the hedged item, as well as its risk management objective and strategy for undertaking the hedge transaction. This process includes linking the derivative financial instrument designated as a hedging instrument to the specific asset, liability, firm commitment or forecasted transaction. Both at the hedge inception and on an ongoing basis, the Group assesses and documents whether the derivative financial instrument used in the hedging transaction is highly effective in offsetting changes in fair value or cash flow of the hedged item. Hedge accounting is discontinued when the hedging instrument expires or is sold, terminated, exercised, or no longer qualifies for hedge accounting. At that time, any cumulative gain or loss on the hedging instrument recognised in equity is retained in equity until the forecasted transaction occurs. If the hedged transaction is no longer expected to occur, the net cumulative gain or loss recognised in equity is transferred to the income statement.
While certain derivative financial instruments are designated as hedging instruments, the Group also enters into derivative financial instruments that are designed to hedge a risk but are not designated as hedging instruments (referred to as an economic hedge or a non-designated hedge). The decision regarding whether or not to designate a hedge for hedge accounting is made by management considering the size, purpose and tenure of the hedge, as well as the anticipated ability to achieve and maintain a highly effective hedging relationship under IAS 39. For the periods presented, the Group has not designated its commodity hedges as they typically contain non-financial risk components that are not always contractually specified, and therefore often would not be eligible for designation under IAS 39. With the adoption of IFRS 9 ‘Financial Instruments’ on 1 January 2018 and the increased flexibility offered with respect to hedge designation, the Group is evaluating its options to designate more commodity hedges in the future, dependent upon management’s assessment and materiality of the arrangements at inception. Refer to Note 24 Other Significant Accounting Policies for further details.
The Group is exposed to counterparty credit risk on all of its derivative financial instruments. It has established and maintained strict counterparty credit guidelines and enters into hedges only with financial institutions that are investment grade or better. It continuously monitors counterparty credit risk and utilises numerous counterparties to minimise its exposure to potential defaults. It does not require collateral under these agreements.
The following table summarises the fair value of the assets and liabilities related to derivative financial instruments and the respective line items in which they were recorded in the
consolidated statement of financial position
as at the dates presented. All derivative instruments are classified as Level 2 within the fair value hierarchy. Discussion of the Group’s other financial assets and liabilities is contained elsewhere in these financial statements. Refer to
Note 8
for trade accounts receivable,
Note 13
for trade and other payables,
Note 12
for borrowings and
Note 18
for amounts receivable and payable with related parties.
|
|
P a g e |
130
|
|
31 December 2017
|
|
31 December 2016
|
|
|||||
|
Hedging Instrument
|
Location – Statement of Financial Position
|
€ million
|
|
€ million
|
|
|||
|
Assets:
|
||||||||
|
Derivatives designated as hedging instruments:
|
||||||||
|
Foreign currency contracts
|
Non-current derivative assets
|
1
|
|
34
|
|
|||
|
Foreign currency contracts
|
Current derivative assets
|
12
|
|
15
|
|
|||
|
Total
|
13
|
|
49
|
|
||||
|
Derivatives not designated as hedging instruments:
|
||||||||
|
Commodity contracts
|
Non-current derivative assets
|
1
|
|
1
|
|
|||
|
Foreign currency contracts
|
Current derivative assets
|
—
|
|
3
|
|
|||
|
Commodity contracts
|
Current derivative assets
|
8
|
|
5
|
|
|||
|
Total
|
9
|
|
9
|
|
||||
|
Total Assets
|
22
|
|
58
|
|
||||
|
Liabilities:
|
||||||||
|
Derivatives designated as hedging instruments:
|
||||||||
|
Foreign currency contracts
|
Non-current derivative liabilities
|
93
|
|
—
|
|
|||
|
Foreign currency contracts
|
Current derivative liabilities
|
—
|
|
3
|
|
|||
|
Total
|
93
|
|
3
|
|
||||
|
Derivatives not designated as hedging instruments:
|
||||||||
|
Commodity contracts
|
Non-current derivative liabilities
|
—
|
|
1
|
|
|||
|
Commodity contracts
|
Current derivative liabilities
|
1
|
|
5
|
|
|||
|
Total
|
1
|
|
6
|
|
||||
|
Total Liabilities
|
94
|
|
9
|
|
||||
Cash flow hedges
The Group uses cash flow hedges to mitigate its exposure to changes in cash flows attributable to currency fluctuations associated with certain forecasted transactions, including purchases of raw materials, finished goods and services denominated in non-functional currencies, the receipt of interest and principal on intercompany loans denominated in non-functional currencies and the payment of interest and principal on debt issuances in non-functional currencies. Effective changes in the fair value of these cash flow hedging instruments are recognised as a component of other reserves on the
consolidated statement of financial position
. The effective changes are then recognised within the line item on the
consolidated income statement
that is consistent with the nature of the underlying hedged item in the period that the forecasted purchases or payments impact earnings. Any changes in the fair value of these cash flow hedges that are the result of ineffectiveness are recognised immediately in the line item on the
consolidated income statement
that is consistent with the nature of the underlying hedged item.
The net notional amount of outstanding cash flow hedges was
€1.2 billion
as at
31 December 2017
and 31 December
2016
. Outstanding cash flow hedges as at
31 December 2017
are expected to settle and affect profit or loss between
2018
and
2021
.
The Group recognised within other comprehensive income
€116 million
net
losses
,
€44 million
net
gains
and
€9 million
net
losses
for the years ended
31 December 2017
,
31 December 2016
and
31 December 2015
, respectively, related to changes in the fair values of outstanding cash flow hedges. The amount of ineffectiveness associated with these cash flow hedges was not material during any year presented within these financial statements.
|
|
P a g e |
131
|
The following table summarises the net of tax effect for cash flow hedges that settled for the periods presented within the
consolidated income statement
:
|
Amount of gain (loss) reclassified from the hedging reserve into profit
|
|||||||||||
|
31 December 2017
|
|
31 December 2016
|
|
31 December 2015
|
|
||||||
|
Cash Flow Hedging Instruments
|
Location – Income Statements
|
€ million
|
|
€ million
|
|
€ million
|
|
||||
|
Foreign currency contracts
|
Cost of sales
|
7
|
|
5
|
|
(13
|
)
|
||||
|
Foreign currency contracts
|
Selling and distribution expenses
|
—
|
|
(1
|
)
|
(1
|
)
|
||||
|
Foreign currency contracts
(A)
|
Non-operating items
|
(123
|
)
|
49
|
|
(6
|
)
|
||||
|
Total
|
(116
|
)
|
|
53
|
|
|
(20
|
)
|
|||
|
(A)
|
The gain (loss) recognised on these currency contracts is offset by the gain (loss) recognised on the remeasurement of the underlying debt instruments; therefore, there is a minimal consolidated net effect in non-operating items on the
consolidated income statement
.
|
Non-designated hedges
The Group periodically enters into derivative instruments that are designed to hedge various risks but are not designated as hedging instruments. These hedged risks include those related to commodity price fluctuations associated with forecasted purchases of aluminium, sugar, components of PET (plastic) and vehicle fuel. At times, it also enters into other short-term non-designated hedges to mitigate its exposure to changes in cash flows attributable to currency fluctuations associated with short-term intercompany loans and certain cash equivalents denominated in non-functional currencies. Changes in the fair value of outstanding non-designated hedges are recognised each reporting period in the line item on the
consolidated income statement
that is consistent with the nature of the hedged risk.
The net notional amount of outstanding non-designated commodity hedges was
€132 million
and
€123 million
as at 31 December
2017
and
31 December 2016
, respectively. Outstanding commodity hedges as at
31 December 2017
are expected to settle and affect profit or loss between
2018
and
2020
.
The net notional amount of outstanding non-designated short-term foreign currency contracts associated with intercompany loans was
€59 million
and
€265 million
as at
31 December 2017
and
31 December 2016
, respectively. Outstanding non-designated foreign currency hedges as at
31 December 2017
are expected to settle and affect profit or loss during
2018
.
The following table summarises the gains (losses) recognised from non-designated derivative financial instruments on the
consolidated income statement
for the years presented:
|
31 December 2017
|
|
31 December 2016
|
|
31 December 2015
|
|
||||||
|
Non-designated Hedging Instruments
|
Location – Income Statements
|
€ million
|
|
€ million
|
|
€ million
|
|
||||
|
Commodity contracts
|
Cost of sales
|
20
|
|
8
|
|
(19
|
)
|
||||
|
Commodity contracts
|
Selling and distribution expenses
|
(2
|
)
|
10
|
|
(15
|
)
|
||||
|
Foreign currency contracts
(A)
|
Non-operating items
|
13
|
|
17
|
|
(4
|
)
|
||||
|
Total
|
31
|
|
35
|
|
(38
|
)
|
|||||
|
(A)
|
The gain (loss) recognised on these currency contracts is offset by the gain (loss) recognised on the remeasurement of the underlying hedged items; therefore, there is a minimal consolidated net effect in non-operating items on the
consolidated income statement
.
|
Net investment hedges
Prior to the Merger, the Group entered into foreign currency forwards, options and foreign currency denominated borrowings designated as net investment hedges of its foreign subsidiaries. Changes in the fair value of these hedges resulting from currency exchange rate changes are recognised as a component of other reserves on the
consolidated statement of financial position
to offset the change in the carrying value of the net investment being hedged. Any changes in the fair value of these hedges that are the result of ineffectiveness are recognised immediately in operating profit on the
consolidated income statement
. All outstanding net investment hedges were settled prior to the Merger. Although the Group had no net investment hedges in place as at
31 December 2017
or 31 December 2016, it continues to monitor its exposure to currency exchange rates and may enter into future net investment hedges as a result of volatility in the functional currencies of certain of its subsidiaries.
|
|
P a g e |
132
|
The Group recognised within other comprehensive income
€44 million
in net
losses
and
€88 million
in net
gains
for the years ended
31 December 2016
and
31 December 2015
, respectively, related to net investment hedges. As a result of US tax law changes in 2017, the Group recognised a deferred tax benefit of
€27 million
in other reserves related to the deferred gain on net investment hedges. Refer to Note 19 for further details. The amount of ineffectiveness associated with these net investment hedging instruments was not material for each year presented within these financial statements.
Note 12
BORROWINGS AND FINANCE LEASES
Borrowings
Borrowings are initially recognised at fair value, net of issuance costs incurred. After initial recognition, borrowings are subsequently measured at amortised cost using the effective interest rate method. Amortisation of transaction costs, premiums and discounts is recognised as part of finance costs within the
consolidated income statement
.
Finance leases
Finance leases are recognised when the Group leases property, plant and equipment and has substantially all the risks and rewards of ownership. Finance leases are capitalised at the inception of the lease at the lower of the fair value of the leased asset or the present value of the minimum lease payments. Lease payments are apportioned between the finance costs and the reduction of the remaining liability. The finance costs are allocated to each period so as to achieve a constant rate of interest on the remaining balance of the liability. Property, plant and equipment acquired in connection with a finance lease is depreciated over the shorter of the useful life of the asset or the lease term. The Group’s interests in assets acquired under finance leases are included in property, plant and equipment and primarily relate to office equipment and vehicle fleet assets. Amortisation of finance lease assets is included in depreciation expense and recorded in the
consolidated income statement
in the line item consistent with the nature of the leased item.
|
|
P a g e |
133
|
Borrowings outstanding
The following table summarises the carrying value of the Group’s borrowings as at the dates presented:
|
|
31 December 2017
|
|
31 December 2016
|
|
||
|
€ million
|
|
€ million
|
|
|||
|
Non-current:
|
||||||
|
€350 million 2.00% Notes 2019
|
348
|
|
347
|
|
||
|
US$525 million 3.50% Notes 2020
|
436
|
|
495
|
|
||
|
US$250 million 3.25% Notes 2021
|
206
|
|
234
|
|
||
|
US$300 million 4.50% Notes 2021
|
249
|
|
283
|
|
||
|
€350 million Floating Rate Note 2021
(A)
|
351
|
|
—
|
|
||
|
€700 million 0.75% Notes 2022
(B)
|
697
|
|
696
|
|
||
|
€350 million 2.63% Notes 2023
|
348
|
|
348
|
|
||
|
€500 million 1.13% Notes 2024
(B)
|
495
|
|
494
|
|
||
|
€350 million 2.38% Notes 2025
|
347
|
|
346
|
|
||
|
€250 million 2.75% Notes 2026
|
248
|
|
248
|
|
||
|
€500 million 1.75% Notes 2028
(B)
|
492
|
|
491
|
|
||
|
€500 million 1.88% Notes 2030
|
496
|
|
496
|
|
||
|
€1 billion term loan 2018-2021
(C)
|
698
|
|
998
|
|
||
|
Finance lease obligations
(D)
|
63
|
|
76
|
|
||
|
Other borrowings
|
—
|
|
10
|
|
||
|
Total non-current borrowings
|
5,474
|
|
5,562
|
|
||
|
Current:
|
||||||
|
€350 million 3.13% Notes 2017
(E)
|
—
|
|
350
|
|
||
|
€500 million Floating Rate Note 2017
(B)(F)
|
—
|
|
499
|
|
||
|
EUR commercial paper
(G)
|
250
|
|
—
|
|
||
|
Finance lease obligations
(D)
|
24
|
|
25
|
|
||
|
Other borrowings
|
—
|
|
1
|
|
||
|
Total current borrowings
|
274
|
|
875
|
|
||
|
(A)
|
In November 2017, the Group issued
€350 million
, floating-rate notes due 2021 at a premium.
|
|
(B)
|
To finance the return of capital to CCE shareholders in connection with the Merger, the Group issued
€2.2 billion
Eurobond notes due between
November 2017 and May 2028
.
|
|
(C)
|
To finance the return of capital to CCE shareholders in connection with the Merger, the Group obtained a
€1.0 billion
,
floating rate
bank term loan with annual payments due each May beginning in
2018
until
2021
. In September 2017,
€200 million
of the term loan due in
2018
and
€100 million
of the term loan due in
2021
were repaid prior to maturity. As at 31 December 2017,
€700 million
of the term loan remains outstanding with annual repayments due between 2019 and 2021.
|
|
(D)
|
These amounts represent the present values of the Group’s minimum finance lease obligations.
|
|
(E)
|
In September 2017,
€350 million
,
3.13%
notes matured and were paid in full.
|
|
(F)
|
In December 2017,
€500 million
, floating-rate notes matured and were paid in full.
|
|
(G)
|
As of 31 December 2017, the Group had
€250 million
of euro denominated commercial paper outstanding, due January 2018.
|
Borrowings are stated net of unamortised financing fees of
€19 million
and
€23 million
, as at
31 December 2017
and 31 December
2016
, respectively.
Credit Facilities
The Group has amounts available for borrowing under a
€1.5 billion
multi-currency credit facility with a syndicate of
ten
banks. This credit facility matures in
2021
and is for general corporate purposes and supporting the Group’s working capital needs. Based on information currently available, there is no indication that the financial institutions participating in this facility would be unable to fulfil their commitments to the Group as at the date of this report. The Group’s current credit facility contains no financial covenants that would impact its liquidity or access to capital. As at
31 December 2017
, the Group had
no
amounts drawn under this credit facility.
|
|
P a g e |
134
|
Finance Lease Maturities
The following table summarises the future maturity of the Group’s finance lease obligations as at the dates presented:
|
31 December 2017
|
|
31 December 2016
|
|
|||
|
Finance lease maturities
|
€ million
|
|
€ million
|
|
||
|
Within one year
|
24
|
|
25
|
|
||
|
After one year but not more than five years
|
46
|
|
56
|
|
||
|
More than five years
|
26
|
|
30
|
|
||
|
Total minimum lease payments
|
96
|
|
|
111
|
|
|
|
Amounts representing interest
(A)
|
(9
|
)
|
(10
|
)
|
||
|
Present value of minimum lease payments
|
87
|
|
|
101
|
|
|
|
(A)
|
Amounts representing interest related to finance lease commitments are not significant for any of the individual time periods presented above.
|
Cash Flows from Financing Activities
The following table provides a reconciliation of movements of liabilities to cash flows arising from financing activities:
|
Current portion of borrowings
|
|
Borrowings, less current portion
|
|
Total
|
|
|||||
|
€ million
|
|
€ million
|
|
€ million
|
|
|||||
|
As at 31 December 2016
|
875
|
|
5,562
|
|
6,437
|
|
||||
|
Changes from financing cash flows
|
|
|
||||||||
|
Proceeds from third party debt, net of issuance costs
|
—
|
|
350
|
|
350
|
|
||||
|
Changes in short-term borrowings
|
250
|
|
250
|
|
||||||
|
Repayments on third party debt
|
(850
|
)
|
—
|
|
(310
|
)
|
(1,160
|
)
|
||
|
Repayments on third party debt; finance leases
|
(1
|
)
|
(19
|
)
|
(20
|
)
|
||||
|
Other non-cash changes
|
|
|
||||||||
|
Discount/premium amortisation
|
—
|
|
6
|
|
6
|
|
||||
|
Capitalised issue costs
|
—
|
|
4
|
|
4
|
|
||||
|
Finance lease additions and other
|
—
|
|
5
|
|
5
|
|
||||
|
Currency translation
|
—
|
|
(124
|
)
|
(124
|
)
|
||||
|
Total changes
|
(601
|
)
|
(88
|
)
|
(689
|
)
|
||||
|
As at 31 December 2017
|
274
|
|
5,474
|
|
5,748
|
|
||||
Note 13
TRADE AND OTHER PAYABLES
These amounts represent liabilities for goods and services provided to the Group prior to the end of the financial year, which are unpaid. Trade and other payables are presented as current liabilities unless payment is not due within
12 months
after the reporting period. Trade and other payables are recognised initially at fair value and subsequently measured at amortised cost using the effective interest method. Trade payables are non-interest bearing and are normally settled between
30
to
60
days.
The Group participates in various programmes and arrangements with customers designed to increase the sale of our products. The costs of these programmes are recorded as deductions from revenue. Among the programmes are arrangements under which allowances can be earned by customers for attaining agreed-upon sales levels or for participating in specific marketing programmes. When these allowances are paid in arrears, the Group accrues the estimated amount to be paid based upon historical customer experience, the programme’s contractual terms, expected customer performance and/or estimated sales volume. The costs of these off-invoice arrangements totalled
€2.9 billion
,
€2.5 billion
and
€1.8 billion
for
2017
,
2016
and
2015
, respectively. The increase in 2017 versus 2016 and 2015 is due to the inclusion of Germany and Iberia.
|
|
P a g e |
135
|
The following table summarises trade and other payables as at the dates presented:
|
31 December 2017
|
|
31 December 2016
|
|
|||
|
€ million
|
|
€ million
|
|
|||
|
Trade accounts payable
|
1,057
|
|
904
|
|
||
|
Accrued customer marketing costs
|
648
|
|
652
|
|
||
|
Accrued deposits
|
266
|
|
271
|
|
||
|
Accrued compensation and benefits
|
249
|
|
260
|
|
||
|
Accrued taxes
|
167
|
|
178
|
|
||
|
Other accrued expenses
|
146
|
|
153
|
|
||
|
Total trade and other payables
|
2,533
|
|
2,418
|
|
||
Note 14
POST-EMPLOYMENT BENEFITS
The cost of providing benefits is determined using the projected unit credit method with actuarial valuations being carried out at the end of each annual reporting period. All remeasurements of the defined benefit obligation, such as actuarial gains and losses and return on plan assets, are recognised directly in other comprehensive income. Remeasurements recognised in other comprehensive income are reflected immediately in retained earnings and are not reclassified to profit or loss. Service costs are presented within cost of sales, selling and distribution expenses and administrative expenses in the
consolidated income statement
. Past service costs are recognised immediately within cost of sales, selling and distribution expenses and administrative expenses in the
consolidated income statement
. The net interest cost is calculated by applying the discount rate to the net balance of the defined benefit obligation and the fair value of plan assets. Net interest cost is presented within finance costs or finance income, as applicable, in the
consolidated income statement
. The defined benefit obligation recognised in the
consolidated statement of financial position
represents the present value of the estimated future cash outflows using interest rates of high quality corporate or government bonds, depending on whether or not there is a deep market for corporate bonds in the relevant country, which have terms to maturity approximating the terms of the related liability.
The following table summarises non-current employee benefit liabilities as at the dates presented:
|
31 December 2017
|
|
31 December 2016
|
|
||
|
€ million
|
|
€ million
|
|
||
|
Retirement benefit obligation of defined benefit plans
|
95
|
|
184
|
|
|
|
Other employee benefit liabilities
|
67
|
|
94
|
|
|
|
Total non-current employee benefit liabilities
|
162
|
|
278
|
|
|
Defined benefit plans
The Group sponsors a number of defined benefit pension plans in Belgium, France, Germany, Great Britain, Luxembourg and Norway of which the Great Britain plan (GB Scheme) and Germany plans (Pension Plan 1 and Pension Plan 2) are the most significant.
The GB Scheme’s defined benefit obligation includes benefits for current employees, former employees and current pensioners. The GB Scheme was closed to new members with effect from 1 October 2005 and is administered by a separate Board of Trustees, which is legally separate from the Group. The Trustees are composed of representatives of both the employer and employees. The Trustees are required by law to act in the interest of all relevant beneficiaries and are responsible for the investment policy with regard to the assets plus the day to day administration of the benefits.
A full actuarial valuation of the GB Scheme occurs on a triennial basis by a qualified external actuary. The latest triennial valuation was carried out as at 5 April 2016 and has been updated to 31 December 2017. The Group’s contributions are determined on the basis of the triennial valuations.
Germany’s defined benefit pension plans are open to existing members but closed to new entrants. The defined benefit obligation includes benefits for current employees, former employees and current pensioners. Pension Plan 1 is funded through a support fund administered by an insurance company. Pension Plan 2 is administered by the Group with the plan being covered by a Contractual Trust Arrangement (CTA) and a single reinsurance contract. The latest annual valuation for these plans was performed as at 31 December 2017.
|
|
P a g e |
136
|
Risks
Our defined benefit pension schemes expose the Group to a number of risks, including:
|
•
|
Asset volatility - The plan liabilities are calculated using a discount rate set with reference to corporate bond yields; if assets underperformed this yield, this will create a deficit. Some of our plans hold a significant proportion of growth assets (equities and property) which, though expected to outperform corporate bonds in the long-term, create volatility and risk in the short-term. The allocation to growth assets is monitored to ensure it remains appropriate given each scheme’s long-term objectives.
|
|
•
|
Changes in bond yields - A decrease in corporate bond yields will increase the defined benefit liability, although this will be partially offset by an increase in the value of the plan’s bond holdings.
|
|
•
|
Inflation risk - A significant proportion of our benefit obligations are linked to inflation, and higher inflation will lead to higher liabilities (although, in most cases, caps on the level of inflationary increases are in place to protect against extreme inflation). The majority of the assets are either unaffected by or only loosely correlated with inflation, meaning that an increase in inflation will also increase the deficit.
|
|
•
|
Life expectancy - The majority of our plans have an obligation to provide benefits for the life of the member, so increases in life expectancy will result in an increase in the defined benefit liabilities.
|
Benefit costs
The following table summarises the expense related to pension plans recognised in the
consolidated income statement
for the years presented:
|
31 December 2017
|
|
31 December 2016
|
|
31 December 2015
|
|
||||
|
€ million
|
|
€ million
|
|
€ million
|
|
||||
|
Service cost
|
53
|
|
49
|
|
51
|
|
|||
|
Past service cost
|
(3
|
)
|
—
|
|
3
|
|
|||
|
Net interest cost (income)
|
3
|
|
2
|
|
—
|
|
|||
|
Administrative expenses
|
2
|
|
2
|
|
3
|
|
|||
|
Total cost
|
55
|
|
53
|
|
57
|
|
|||
Other comprehensive income
The following table summarises the changes in other comprehensive income related to our pension plans for the years presented:
|
31 December 2017
|
|
31 December 2016
|
|
31 December 2015
|
|
||||
|
€ million
|
|
€ million
|
|
€ million
|
|
||||
|
Actuarial (gain) / loss on DBO arising during the period
|
30
|
|
248
|
|
27
|
|
|||
|
Return on plan assets (greater) / less than discount rate
|
(121
|
)
|
(183
|
)
|
23
|
|
|||
|
Net charge to OCI
|
(91
|
)
|
65
|
|
50
|
|
|||
|
|
P a g e |
137
|
Benefit obligation and fair value of plan assets
The following table summarises the changes in the pension plan benefit obligation and the fair value of plan assets for the periods presented:
|
31 December 2017
|
|
31 December 2016
|
|
|||
|
€ million
|
|
€ million
|
|
|||
|
Reconciliation of benefit obligation:
|
||||||
|
Benefit obligation at beginning of plan year
|
1,947
|
|
1,493
|
|
||
|
Service cost
|
53
|
|
49
|
|
||
|
Past service cost
|
(3
|
)
|
—
|
|
||
|
Interest costs on defined benefit obligation
|
43
|
|
50
|
|
||
|
Plan participants contribution
|
45
|
|
63
|
|
||
|
Actuarial loss (gain) - experience
|
5
|
|
(34
|
)
|
||
|
Actuarial loss (gain) - demographic assumptions
|
—
|
|
(10
|
)
|
||
|
Actuarial loss (gain) - financial assumptions
|
25
|
|
292
|
|
||
|
Benefit payments
|
(90
|
)
|
(50
|
)
|
||
|
Administrative expenses
|
2
|
|
—
|
|
||
|
Currency translation adjustments
|
(50
|
)
|
(174
|
)
|
||
|
Additions - Merger (Note 2)
|
—
|
|
268
|
|
||
|
Settlements
|
(8
|
)
|
—
|
|
||
|
Benefit obligation at end of plan year
|
1,969
|
|
1,947
|
|
||
|
Reconciliation of fair value of plan assets:
|
||||||
|
Fair value of plan assets at beginning of plan year
|
1,779
|
|
1,369
|
|
||
|
Interest income on plan assets
|
40
|
|
48
|
|
||
|
Return on plan assets greater than discount rate
|
121
|
|
183
|
|
||
|
Plan participants contributions
|
45
|
|
63
|
|
||
|
Employer contributions
|
58
|
|
78
|
|
||
|
Benefit payments
|
(90
|
)
|
(50
|
)
|
||
|
Administrative expenses
|
—
|
|
(2
|
)
|
||
|
Additions - Merger (Note 2)
|
—
|
|
263
|
|
||
|
Currency translation adjustment
|
(48
|
)
|
(173
|
)
|
||
|
Settlements
|
(7
|
)
|
—
|
|
||
|
Fair value of plan assets at end of plan year
|
1,898
|
|
1,779
|
|
||
Timing of benefit payments
The weighted average duration of the defined benefit plan obligation as at
31 December 2017
is
22
years.
Retirement benefit status
The following table summarises the retirement benefit status of pension plans as at the dates presented:
|
31 December 2017
|
|
31 December 2016
|
|
|||
|
€ million
|
|
€ million
|
|
|||
|
Net benefit status:
|
|
|||||
|
Present value of obligation
|
(1,969
|
)
|
(1,947
|
)
|
||
|
Fair value of assets
|
1,898
|
|
1,779
|
|
||
|
Net benefit status
|
(71
|
)
|
(168
|
)
|
||
|
Retirement benefit surplus
|
24
|
|
16
|
|
||
|
Retirement benefit obligation
|
(95
|
)
|
(184
|
)
|
||
|
|
P a g e |
138
|
Actuarial assumptions
The following tables summarise the weighted average actuarial assumptions used to determine the benefit obligations of pension plans as at the dates presented:
|
31 December 2017
|
31 December 2016
|
|||
|
Financial assumptions
|
%
|
%
|
||
|
Discount rate
|
2.3
|
2.3
|
||
|
Rate of compensation increase
|
3.1
|
3.2
|
||
|
Rate of price inflation
|
2.9
|
2.9
|
||
|
Demographic assumptions (weighted average)
(A)
|
31 December 2017
|
|
31 December 2016
|
|
||
|
Retiring at the end of the reporting period
|
||||||
|
Male
|
21.4
|
|
21.2
|
|
||
|
Female
|
24.3
|
|
24.0
|
|
||
|
Retiring 15 years after the end of the reporting period
|
||||||
|
Male
|
22.7
|
|
22.5
|
|
||
|
Female
|
25.6
|
|
25.4
|
|
||
|
(A)
|
These assumptions translate into an average life expectancy in years for an employee retiring at age
65
.
|
The following table summarises the sensitivity of the defined benefit obligation to changes in the weighted average principal assumptions for the periods presented:
|
Change in assumption %
|
Impact on defined benefit obligation (%)
|
||||||||||||
|
Increase in assumption
|
Decrease in assumption
|
||||||||||||
|
Principal Assumptions
|
2017
|
|
2016
|
|
2017
|
|
2016
|
|
|||||
|
Discount rate
|
0.5
|
(9.1
|
)
|
(9.6
|
)
|
10.6
|
|
10.7
|
|
||||
|
Rate of compensation increase
|
0.5
|
2.6
|
|
2.7
|
|
(2.4
|
)
|
(2.5
|
)
|
||||
|
Rate of price inflation
|
0.5
|
8.9
|
|
9.4
|
|
(7.8
|
)
|
(9.6
|
)
|
||||
|
Mortality rates
|
1 year
|
2.5
|
|
2.5
|
|
(2.4
|
)
|
(2.4
|
)
|
||||
The sensitivity analyses have been determined based on a method that extrapolates the impact on the defined benefit obligation as a result of reasonable changes in key assumptions occurring at the end of the reporting period. The sensitivity analyses are based on a change in a significant assumption, keeping all other assumptions constant. The sensitivity analyses may not be representative of an actual change in the defined benefit obligation as it is unlikely that changes in assumptions would occur in isolation of one another.
Pension plan assets
The Group has established formal investment policies for the assets associated with the pension plans. Policy objectives include (1) maximising long-term return at acceptable risk levels; (2) diversifying among asset classes, if appropriate, and among investment managers; and (3) establishing relevant risk parameters within each asset class. Investment policies reflect the unique circumstances of the respective plans and include requirements designed to mitigate risk, including quality and diversification standards. Asset allocation targets are based on periodic asset liability and/or risk budgeting study results, which help determine the appropriate investment strategies for acceptable risk levels. The investment policies permit variances from the targets within certain parameters.
|
|
P a g e |
139
|
The following tables summarise pension plan assets measured at fair value as at the dates presented:
|
Total
31 December 2017
|
|
Investments quoted in active markets
|
|
Unquoted investments
|
|
||||
|
€ million
|
|
€ million
|
|
€ million
|
|
||||
|
Equity securities:
(A)
|
|||||||||
|
US equities
|
226
|
|
226
|
|
—
|
|
|||
|
Non-US equities
|
749
|
|
693
|
|
56
|
|
|||
|
Fixed-income securities:
(B)
|
|||||||||
|
Corporate bonds and notes
|
60
|
|
34
|
|
26
|
|
|||
|
Government bonds
|
409
|
|
387
|
|
22
|
|
|||
|
Short-term investments
(C)
|
10
|
|
5
|
|
5
|
|
|||
|
Other investments:
|
|||||||||
|
Real estate funds
(D)
|
226
|
|
14
|
|
212
|
|
|||
|
Insurance contracts
(E)
|
218
|
|
—
|
|
218
|
|
|||
|
1,898
|
|
1,359
|
|
539
|
|
||||
|
Total
31 December 2016
|
|
Investments quoted in active markets
|
|
Unquoted investments
|
|
||||
|
€ million
|
|
€ million
|
|
€ million
|
|
||||
|
Equity securities:
(A)
|
|||||||||
|
US equities
|
230
|
|
203
|
|
27
|
|
|||
|
Non-US equities
|
662
|
|
641
|
|
21
|
|
|||
|
Fixed-income securities:
(B)
|
|||||||||
|
Corporate bonds and notes
|
172
|
|
145
|
|
27
|
|
|||
|
Government bonds
|
328
|
|
310
|
|
18
|
|
|||
|
Short-term investments
(C)
|
37
|
|
30
|
|
7
|
|
|||
|
Other investments:
|
|||||||||
|
Real estate funds
(D)
|
149
|
|
14
|
|
135
|
|
|||
|
Insurance contracts
(E)
|
201
|
|
—
|
|
201
|
|
|||
|
1,779
|
|
1,343
|
|
436
|
|
||||
|
(A)
|
Equity securities are comprised of the following investment types: (1) ordinary shares; (2) preference shares; and (3) common trust funds. Investments in ordinary and preference shares are valued using quoted market prices multiplied by the number of shares owned. Investments in common trust funds are valued at the fund unit price multiplied by the number of fund units held.
|
|
(B)
|
Investments other than those held in common trust funds are valued utilising a market approach that includes various valuation techniques and sources such as value generation models, broker quotes in active and non-active markets, benchmark yields and securities, reported trades, issuer spreads and/or other applicable reference data.
|
|
(C)
|
Short-term investments are valued at €
1.00
/unit, which approximates fair value. Amounts are generally invested in actively managed common trust funds or interest-bearing accounts.
|
|
(D)
|
Real estate funds are valued at net asset value, which is calculated using the most recent partnership financial reports, adjusted, as appropriate, for any lag between the date of the financial reports and the measurement date (as of
31 December 2017
, it is not probable that these investments will be sold at an amount other than net asset value).
|
|
(E)
|
Insurance contracts exactly match the amount and timing of certain benefits, therefore the fair value of these insurance policies is deemed to be the present value of the related obligations.
|
Contributions
Contributions to pension plans totalled
€58 million
,
€78 million
and
€47 million
during the years ended 31 December 2017,
31 December 2016
and
31 December 2015
, respectively. During 2016, the Group and the Trustees of the GB Scheme agreed to additional future funding levels to improve the funded status of this plan. Approximately
€29 million
of the
€78 million
contributed by the Group during 2016 related to the additional contributions agreed upon between the Group and the Trustees. The Group expects to make contributions of
€53 million
for the full year ending
31 December 2018
in line with the agreed funding plan.
|
|
P a g e |
140
|
Other employee benefit liabilities
In Germany, the Group also has an early retirement programme designed to create an incentive for employees, within a certain age group, to transition from (full or part-time) employment into retirement before their legal retirement age. Further, the Group also sponsors deferred compensation plans in other territories. The current portion of these liabilities totalled
€21 million
and
€24 million
as at
31 December 2017
and
31 December 2016
, respectively and is included within the current portion of employee benefit liabilities on the
consolidated statement of financial position
. The non-current portion of these liabilities totalled
€67 million
and
€94 million
as at
31 December 2017
and
31 December 2016
and is included within employee benefit liabilities on the
consolidated statement of financial position
.
Defined contribution plans
The Group sponsors qualified defined contribution plans covering substantially all of our employees in Iceland, the Netherlands, Norway, Spain and certain employees in Great Britain. Contributions payable for the period are charged to the
consolidated income statement
as an operating expense for defined contribution plans. Contributions to these plans totalled
€25 million
,
€24 million
and
€22 million
during the
year ended 31 December 2017
,
31 December 2016
and 31 December
2015
, respectively.
Note 15
EQUITY
Share capital
As at 31 December 2017, the Company has issued and fully paid
484,586,428
shares with a nominal value of
€0.01
per share. Shares in issue have one voting right each and no restrictions related to dividends or return of capital.
Immediately prior to the Merger on
28 May 2016
, there were
228,244,244
shares of
US$0.01
par value of CCE shares issued and fully paid, which included net issuances of
908,456
related to share-based payment awards from
1 January 2016
through
27 May 2016
. In connection with the Merger, as described in
Note 2
, all CCE shares were cancelled and replaced with shares of the Company. Additionally, the Company issued
166,128,987
and
87,950,640
shares to Olive Partners and European Refreshments (a wholly owned subsidiary of TCCC), respectively, as consideration to acquire their bottling operations. Subsequent to the Merger, the Group issued an additional
752,525
shares related to share-based payment awards. The number of shares issued and fully paid at 31 December 2016 was
483,076,396
.
The share capital increased in 2017 from the issue of
1,510,032
ordinary shares following the exercise of share-based payment awards.
|
Number of shares
|
|
Share Capital
|
|
|||
|
millions
|
|
€ million
|
|
|||
|
As at 31 December 2015
|
227
|
|
3
|
|
||
|
Shares utilised for share-based payments prior to Merger
|
1
|
|
—
|
|
||
|
Cancellation of CCE shares
|
(228
|
)
|
(3
|
)
|
||
|
Issuance of CCEP shares in consideration for CCIP and CCEG
|
254
|
|
3
|
|
||
|
Group reconstruction transaction
|
228
|
|
2
|
|
||
|
Issuances of shares post-Merger
|
1
|
|
—
|
|
||
|
As at 31 December 2016
|
483
|
|
5
|
|
||
|
Issuance of shares
|
2
|
|
—
|
|
||
|
As at 31 December 2017
|
485
|
|
5
|
|
||
Share premium
Under the Companies Act 2006, the amount reflected in share premium for a group reconstruction is equal to the total consideration transferred in excess of nominal value for the accounting acquirer. As all shares of CCE were cancelled and replaced with shares in the Group,
€7.6 billion
was recorded to the share premium account representing the excess over nominal value of
€0.01
for the
228,244,244
shares issued to CCE shareholders on
28 May 2016
based on the adjusted closing price of CCE shares of
€33.33
at the time of the Merger. As CCE was deemed to be the accounting acquirer, its net assets remain at book value; therefore, the Group recorded a corresponding reduction to merger reserves for this amount. Furthermore, on 22 June 2016, the Group received approval from the UK High Court of Justice to convert
€7.5 billion
of its undistributable profits into distributable profits. This resulted in the reduction to the share premium account of
€7.5 billion
and a corresponding increase to retained earnings. The share premium account increased by cash received for the exercise of options after the Merger by
€13 million
for
31 December 2017
and
€9 million
for
31 December 2016
, respectively.
|
|
P a g e |
141
|
Merger reserves
The consideration transferred to acquire CCIP and CCEG qualified for merger relief under the UK Companies Act of 2006. As such, the excess consideration transferred over nominal value was required to be excluded from the share premium account and recorded to merger reserves. The cumulative balance of
€8.5 billion
includes the consideration transferred in excess of nominal value of
€0.01
for CCIP and CCEG of
€5.5 billion
and
€2.9 billion
, respectively.
Return of capital to CCE shareholders
The return of capital to CCE shareholders in connection with the Merger was in the form of a cash payment of
€3.0 billion
, with a corresponding reduction in retained earnings.
Other reserves
The following table outlines the balances in other reserves (net of tax) as at the dates presented:
|
31 December 2017
|
|
31 December 2016
|
|
|||
|
€ million
|
|
€ million
|
|
|||
|
Cash flow hedge reserve
|
(12
|
)
|
(12
|
)
|
||
|
Net investment hedge reserve
|
197
|
|
170
|
|
||
|
Foreign currency translation adjustment reserve
|
(688
|
)
|
(577
|
)
|
||
|
Total other reserves
|
(503
|
)
|
(419
|
)
|
||
Included within other reserves are derivatives and foreign currency translation reserves. Key movements, including the tax effects, in these accounts through
31 December 2017
are included within the
consolidated statement of comprehensive income
.
Dividends
Dividends are recorded within the Group’s
consolidated financial statements
in the period in which they are paid.
During the
year ended 31 December 2017
, the Company made dividend payments totalling
€489 million
, including
€82 million
in January 2017, based on a dividend rate of
€0.17
per share, and
four
dividends from April 2017 through to December 2017 totalling
€407 million
, each based on an increased dividend rate of
€0.21
per share. During the year ended 31 December 2016,
two
dividend payments were made on previously outstanding CCE shares totalling
US$136 million
, or
€122 million
, based on a dividend rate of
US$0.30
per share. Subsequent to the Merger, in September 2016, the Company’s Board of Directors authorised a dividend of
€0.17
per share, totalling
€82 million
, which was paid in October 2016.
Treasury shares
As part of the Merger agreement, the
128,993,430
shares held in treasury on the acquisition date, with a total cost of
€3.3 billion
, were cancelled. Since the Merger, there have been no share repurchases and, while shareholders have granted authority for the Company to purchase shares in the market, the Board has not yet exercised this authority.
|
|
P a g e |
142
|
Note 16
TOTAL OPERATING COSTS
The following table outlines the significant cost items by nature within operating costs for the years presented:
|
31 December 2017
|
|
31 December 2016
|
|
31 December 2015
|
|
||||
|
€ million
|
|
€ million
|
|
€ million
|
|
||||
|
Cost of inventory recognised as an expense
|
5,021
|
|
4,194
|
|
2,920
|
|
|||
|
Write-down of inventories (Note 7)
|
25
|
|
28
|
|
17
|
|
|||
|
Employee costs
(A)
|
1,719
|
|
1,411
|
|
932
|
|
|||
|
Distribution costs
|
595
|
|
514
|
|
232
|
|
|||
|
Depreciation of property, plant and equipment, excluding restructuring
|
426
|
|
321
|
|
215
|
|
|||
|
Amortisation of intangible assets (Note 5)
|
47
|
|
39
|
|
26
|
|
|||
|
Out of period mark-to-market effects on undesignated derivatives
|
(6
|
)
|
(35
|
)
|
26
|
|
|||
|
Merger related costs
|
4
|
|
126
|
|
40
|
|
|||
|
Restructuring charges, including accelerated depreciation
(B)
|
235
|
|
286
|
|
18
|
|
|||
|
Gain on sale of distribution centre in Great Britain
|
—
|
|
—
|
|
(9
|
)
|
|||
|
(A)
|
Employee Costs
|
|
31 December 2017
|
|
31 December 2016
|
|
31 December 2015
|
|
||||
|
€ million
|
|
€ million
|
|
€ million
|
|
||||
|
Wages and salaries
|
1,317
|
|
1,059
|
|
653
|
|
|||
|
Social security costs
|
290
|
|
234
|
|
152
|
|
|||
|
Pension and other employee benefits
|
112
|
|
118
|
|
127
|
|
|||
|
Total staff costs
|
1,719
|
|
1,411
|
|
932
|
|
|||
Directors’ remuneration information is disclosed in the Directors Remuneration Report.
The average number of persons employed by the Group (including Directors) for the periods presented were as follows:
|
2017
|
|
2016
|
|
2015
|
|
||||
|
No. in thousands
|
|
No. in thousands
|
|
No. in thousands
|
|
||||
|
Commercial
|
7.7
|
|
6.1
|
|
3.5
|
|
|||
|
Supply chain
|
13.5
|
|
10.8
|
|
6.4
|
|
|||
|
Support functions
|
2.3
|
|
2.2
|
|
1.6
|
|
|||
|
Total average staff employed
|
23.5
|
|
19.1
|
|
11.5
|
|
|||
The average number of persons employed by the Group reflects only CCE employees for the full year 2015 and from 1 January to 27 May, 2016. From 28 May through to 31 December 2016, and for the full year 2017, the average number reflects CCEP employees.
|
(B)
|
Restructuring
|
|
31 December 2017
|
|
31 December 2016
|
|
31 December 2015
|
|
||||
|
€ million
|
|
€ million
|
|
€ million
|
|
||||
|
Increase in provision for restructuring programmes (Note 21)
|
186
|
|
260
|
|
17
|
|
|||
|
Amount of provision reversed unused (Note 21)
|
(22
|
)
|
(6
|
)
|
(5
|
)
|
|||
|
Accelerated depreciation and
non-cash costs
|
33
|
|
24
|
|
6
|
|
|||
|
Other cash costs
|
38
|
|
8
|
|
—
|
|
|||
|
Total
|
235
|
|
286
|
|
18
|
|
|||
Restructuring costs charged in arriving at operating profit for the years presented include restructuring costs arising under projects, including the CCE Business Transformation Programme, Belgium Supply Chain Optimisation Programme, Germany Restructuring Programme and the CCEP Integration and Synergy Programme. The CCE Business Transformation Programme was substantially complete by 31 December 2015.
|
|
P a g e |
143
|
CCEP Integration and Synergy Programme
In 2016, the Group announced several restructuring proposals to facilitate and enable the integration of CCE, CCIP and CCEG following the Merger. Restructuring activities include those related to supply chain improvements such as network optimisation, productivity initiatives, continued facility rationalisation in Germany and end to end supply chain organisational design. Restructuring plans also include transferring of Germany transactional related activities to the Company’s shared services centre in Bulgaria and other central function initiatives. The Group also initiated the relocation of Atlanta-based headquarters roles to Europe. In 2017, the Group announced additional restructuring proposals, including the optimisation of manufacturing, warehouse and labour productivity, cold-drink operational practices and facilities, further facility rationalisation in Germany and supply chain organisational design improvements such as route-to-market. These proposals also include the transfer of additional activities to the Group’s shared services centre in Bulgaria and other central function initiatives. During the years ended 31 December 2017 and 31 December 2016, the Group recorded total expenses related to this programme of
€215 million
and
€182 million
, respectively. The total expenditure over the life of the programme is expected to be between €
475 million
and €
500 million
. The programme is expected to be substantially completed by 31 December 2018.
Germany Restructuring Programme and Iberia Inflight Initiatives
At the time of the Merger, the Group assumed ongoing restructuring initiatives in both Germany and Iberia. In Germany, these initiatives principally related to improving the efficiency and effectiveness of the supply chain organisation. On 1 March 2016, CCEG announced its intent to close
two
production sites,
six
distribution sites and to phase out a refillable PET production line. In addition, CCEG announced its intent to restructure parts of its finance, human resources, marketing and sales departments. At the Merger date, there was approximately
€228 million
of restructuring provisions recorded in the opening balance sheet of Germany related to this and other programmes. Subsequent to the Merger, and through the years ended
31 December 2017
and
31 December 2016
, the Group recorded additional expense of €
23 million
and €
76 million
, primarily related to severance costs. This programme was substantially completed by 31 December 2017.
Belgium Supply Chain Optimisation Programme
The project in Belgium commenced in the second half of 2015 and related to the relocation and restructuring of certain production operations designed to optimise the efficiency and effectiveness of the supply chain within Belgium. During the year ended
31 December 2017
, the Group recorded reversals of expense of
€3 million
, and during the year ended
31 December 2016
, the Group recorded expense of
€32 million
related to this programme. This programme was substantially completed by 31 December 2017.
|
|
P a g e |
144
|
Auditor’s remuneration
Audit and other fees charged in the income statement concerning the statutory auditor of the
consolidated financial statements
, Ernst & Young LLP, were as follows:
|
31 December 2017
|
|
31 December 2016
|
|
31 December 2015
|
|
||||
|
€ thousand
|
|
€ thousand
|
|
€ thousand
|
|
||||
|
Audit of parent company and consolidated financial statements
(A)
|
2,383
|
|
4,932
|
|
1,602
|
|
|||
|
Audit of the company’s subsidiaries
|
4,167
|
|
3,800
|
|
1,697
|
|
|||
|
Total audit
|
6,550
|
|
8,732
|
|
3,299
|
|
|||
|
Audit related assurance services
(B)
|
1,187
|
|
1,512
|
|
3,218
|
|
|||
|
Other assurance services
|
115
|
|
138
|
|
3
|
|
|||
|
Total audit and audit-related assurance services
|
7,852
|
|
10,382
|
|
6,520
|
|
|||
|
Taxation advisory services
(C)
|
—
|
|
508
|
|
—
|
|
|||
|
All other services
(D)
|
90
|
|
3
|
|
2
|
|
|||
|
Total non-audit or non-audit-related assurance services
|
90
|
|
511
|
|
2
|
|
|||
|
Total audit and all other fees
|
7,942
|
|
10,893
|
|
6,522
|
|
|||
|
(A)
|
Fees in respect of the audit of the accounts of CCEP plc (and its predecessor CCE, Inc.), including the Group's
consolidated financial statements
.
|
|
(B)
|
Includes professional fees for interim reviews, reporting on internal financial controls, services related to the transaction entered into with CCE, TCCC, CCIP and CCEG, IFRS advisory services, issuance of comfort letters for debt issuances, certain accounting consultations and other attest engagements.
|
|
(C)
|
Includes fees for tax advisory services related to tax advice provided in conjunction with the Merger transaction and its related US tax implications and tax advisory services, including transfer pricing and VAT advisory work, in the Company’s subsidiaries.
|
|
(D)
|
Represents fees for a cultural diagnostic assessment survey, subscription fees to an on-line accounting research tool, IFRS training courses and other services.
|
Note 17
FINANCE COSTS
Finance costs are recognised directly within the income statement in the period in which they are incurred, with the exception of general and specific borrowing costs directly attributable to the acquisition, construction or production of qualifying assets. Qualifying assets are assets that necessarily take a substantial period of time to get ready for their intended use or sale. Borrowing costs are added to the cost of those assets, until such time as the assets are substantially ready for their intended use or sale. All other borrowing costs are recognised within the
consolidated income statement
in the period in which they are incurred based upon the effective interest rate method. Interest income is recognised using the effective interest rate method.
The following table summarises net finance costs for the years presented:
|
31 December 2017
|
|
31 December 2016
|
|
31 December 2015
|
|
||||
|
€ million
|
|
€ million
|
|
€ million
|
|
||||
|
Interest income
(A)
|
48
|
|
31
|
|
24
|
|
|||
|
Interest expense on external debt
(A)
|
(141
|
)
|
(145
|
)
|
(127
|
)
|
|||
|
Other finance costs
(B)
|
(7
|
)
|
(9
|
)
|
(7
|
)
|
|||
|
Total finance costs
|
(148
|
)
|
(154
|
)
|
(134
|
)
|
|||
|
Total finance costs, net
|
(100
|
)
|
(123
|
)
|
(110
|
)
|
|||
|
(A)
|
Includes interest income and expense amounts, as applicable, on cross currency swaps used to hedge USD debt. Refer to Note 11 for further details.
|
|
(B)
|
Other finance costs principally include amortisation of the discount on external debt and interest expense on finance leases.
|
|
|
P a g e |
145
|
Note 18
RELATED PARTY TRANSACTIONS
For the purpose of these consolidated financial statements, transactions with related parties mainly comprise transactions between subsidiaries of the Group and the related parties of the Group.
Transactions with TCCC
TCCC exhibits significant influence over the Group, as defined by IAS 24, “Related Party Disclosures”. As at 31 December
2017
,
18%
of the total outstanding shares in the Group were owned by European Refreshments, a wholly owned subsidiary of TCCC. The Group is a key bottler of TCCC products and has entered into bottling agreements with TCCC to sell, make and distribute products of TCCC within the Group’s territories. The Group purchases concentrate from TCCC and also receives marketing funding to help promote the sale of TCCC products. Bottling agreements with TCCC for each of the Group’s territories extend through
28 May 2026
, with terms of
10
years, with each containing the right for the Group to request a
10
-year renewal. Additionally,
two
of the Group’s
17
Directors are nominated by TCCC.
The following table summarises the transactions with TCCC that directly impacted the
consolidated income statement
for the years presented:
|
31 December 2017
|
|
31 December 2016
|
|
31 December 2015
|
|
||||
|
€ million
|
|
€ million
|
|
€ million
|
|
||||
|
Amounts affecting revenue:
|
|||||||||
|
Fountain syrup and packaged product sales
|
61
|
|
44
|
|
13
|
|
|||
|
Amounts affecting cost of sales:
|
|||||||||
|
Purchases of concentrate, syrup, mineral water and juice
|
(3,112
|
)
|
(2,460
|
)
|
(1,777
|
)
|
|||
|
Purchases of finished products
|
(30
|
)
|
(31
|
)
|
(36
|
)
|
|||
|
Marketing support funding earned
|
313
|
|
264
|
|
181
|
|
|||
|
Total amounts affecting cost of sales
|
(2,829
|
)
|
(2,227
|
)
|
(1,632
|
)
|
|||
|
Amounts affecting operating expenses:
|
|||||||||
|
Other operating credits
|
10
|
|
9
|
|
8
|
|
|||
|
Other operating expenses
|
(11
|
)
|
(8
|
)
|
(4
|
)
|
|||
|
Total amounts affecting operating expenses
|
(1
|
)
|
1
|
|
4
|
|
|||
|
Total net amount affecting the Consolidated Income Statement
|
(2,769
|
)
|
(2,182
|
)
|
(1,615
|
)
|
|||
The following table summarises the transactions with TCCC that impacted the
consolidated statement of financial position
for the periods presented:
|
31 December 2017
|
|
31 December 2016
|
|
|||
|
€ million
|
|
€ million
|
|
|||
|
Amounts due from TCCC
|
71
|
|
91
|
|
||
|
Amounts payable to TCCC
|
162
|
|
154
|
|
||
Marketing support funding earned
The Group and TCCC engage in a variety of marketing programmes to promote the sale of TCCC products in territories in which the Group operates. TCCC makes discretionary marketing contributions under shared marketing agreements to CCEP's operating subsidiaries. Amounts to be paid to the Group by TCCC under the programmes are generally determined annually and are periodically reassessed as the programmes progress. Under the bottling agreements, TCCC is under no obligation to participate in the programmes or continue past levels of funding in the future. The amounts paid and terms of similar programmes with other franchises may differ.
Marketing support funding programmes granted to the Group provide financial support principally based on product sales or upon the completion of stated requirements and are intended to offset a portion of the costs of the programmes.
The Group and TCCC operate under an incidence-based concentrate pricing model and funding program, the terms of which are tied to the term of our bottling agreements.
Payments from TCCC for marketing programmes to promote the sale of products are classified as a reduction in cost of sales, unless the presumption that the payment is a reduction in the price of the franchisors’ products can be overcome. Payments for marketing programmes are recognised as product is sold.
Repayment of acquired loan
At the time of the Merger, the Group assumed a non-interest bearing loan with Atlantic Industries, a subsidiary of TCCC, for the amount of
€73 million
. This loan was fully repaid prior to 31 December 2016.
|
|
P a g e |
146
|
Terms and conditions of transactions with TCCC
Outstanding balances on transactions with TCCC are unsecured, interest-free and generally settled in cash. There have been no guarantees provided or received for any TCCC receivables or payables. Receivables from TCCC are considered to be recoverable and no expense was incurred as a result of outstanding receivables due from TCCC for the
year ended 31 December 2017
,
31 December 2016
and
31 December 2015
.
Transactions with Cobega companies
Cobega exhibits significant influence over the Group, as defined by IAS 24, “Related Party Disclosures”. As a result of the consummation of the Merger, Cobega S.A., who previously owned
56%
of CCIP, indirectly owned
19%
of the total outstanding shares of the Group as at
31 December 2017
through its ownership interest in Olive Partners. Additionally,
five
of the Group’s
17
Directors, including the Chairman, are nominated by Olive Partners,
three
of whom are affiliated with Cobega S.A.
The following table summarises the transactions with Cobega that directly impacted the
consolidated income statement
for the years presented:
|
31 December 2017
|
|
31 December 2016
|
|
|||
|
€ million
|
|
€ million
|
|
|||
|
Amounts affecting revenues:
|
||||||
|
Packaged product sales
|
3
|
|
5
|
|
||
|
Amounts affecting cost of sales:
|
||||||
|
Purchases of juice concentrates and mineral water
|
(68
|
)
|
(37
|
)
|
||
|
Purchases of finished goods and other cost of goods
|
(12
|
)
|
(6
|
)
|
||
|
Total amounts affecting cost of sales
|
(80
|
)
|
(43
|
)
|
||
|
Amounts affecting operating expenses:
|
||||||
|
Maintenance and repair services and plant rental expense
|
(9
|
)
|
(5
|
)
|
||
|
Office rent and other expenses
|
(7
|
)
|
(4
|
)
|
||
|
Total amounts affecting operating expenses
|
(16
|
)
|
(9
|
)
|
||
|
Total net amount affecting the consolidated income statement
|
(93
|
)
|
(47
|
)
|
||
The following table summarises the transactions with Cobega that impacted the
consolidated statement of financial position
for the periods presented:
|
31 December 2017
|
|
31 December 2016
|
|
|||
|
€ million
|
|
€ million
|
|
|||
|
Amounts due from Cobega
|
4
|
|
4
|
|
||
|
Amounts payable to Cobega
|
16
|
|
8
|
|
||
Under the terms of the Merger, Vifilfell hf, a subsidiary of Cobega, was acquired by the Group on 29 July 2016 for cash consideration of
€35 million
. This acquisition was made to expand the Group’s geographical presence by obtaining the rights to sell, make and distribute products within the Icelandic territory. All outstanding consideration was paid prior to 31 December 2016.
There are no significant transactions with other related parties in the periods presented.
Transactions with key management personnel
Key management personnel are the members of the Board of Directors and the members of the senior leadership team.
The following table summarises the amounts recognised as an expense during the reporting period related to key management personnel:
|
|
31 December 2017
|
|
31 December 2016
|
|
31 December 2015
|
|
|||
|
€ million
|
|
€ million
|
|
€ million
|
|
||||
|
Salaries and other short-term employee benefits
|
18
|
|
|
20
|
|
|
17
|
|
|
|
Post-employment benefits
|
1
|
|
|
1
|
|
|
—
|
|
|
|
Share-based payments
|
8
|
|
|
20
|
|
|
25
|
|
|
|
Termination benefits
|
—
|
|
|
10
|
|
|
2
|
|
|
|
Total
|
27
|
|
51
|
|
44
|
|
|||
|
|
P a g e |
147
|
The Group did not have any loans with key management personnel and was not party to any other transactions with the key management personnel during the periods presented.
Note 19
INCOME TAXES
Current income tax
Current income tax for the period includes amounts expected to be payable on taxable income in the period together with any adjustments to taxes payable in respect of previous periods, and is determined based on the tax laws enacted or substantively enacted at the balance sheet date in the countries where the Group operates and generates taxable income. Management periodically evaluates positions taken in tax returns with respect to situations in which applicable tax regulations are subject to interpretation and establishes provisions, where appropriate, on the basis of amounts expected to be paid to the tax authorities.
Deferred tax
Deferred tax is determined by identifying the temporary differences between the tax bases of assets and liabilities and their carrying amounts for financial reporting purposes at the reporting date. Deferred tax for the period includes origination and reversal of temporary differences, remeasurements of deferred tax balances and adjustments in respect of prior periods.
Deferred tax liabilities are recognised for all taxable temporary differences, except:
|
•
|
When the deferred tax liability arises from the initial recognition of goodwill or an asset or liability in a transaction that is not a business combination and, at the time of the transaction, affects neither the accounting profit nor taxable profit or loss; or
|
|
•
|
In respect of taxable temporary differences associated with investments in subsidiaries, branches and associates and interests in joint ventures, when the timing of the reversal of the temporary differences can be controlled by the Group and it is probable that the temporary differences will not reverse in the foreseeable future.
|
Deferred tax assets are recognised for all deductible temporary differences, carry forward of unused tax credits and unused tax losses, to the extent that it is probable that taxable profit will be available against which the deductible temporary differences, and the carry forward of unused tax credits and unused tax losses can be utilised, except:
|
•
|
When the deferred tax asset relating to the deductible temporary difference arises from the initial recognition of an asset or liability in a transaction that is not a business combination and, at the time of the transaction, affects neither the accounting profit nor taxable profit or loss; or
|
|
•
|
In respect of deductible temporary differences associated with investments in subsidiaries, branches and associates and interests in joint ventures, deferred tax assets are recognised only to the extent that it is probable that the temporary differences will reverse in the foreseeable future and taxable profit will be available against which the temporary differences can be utilised.
|
The carrying amount of deferred tax assets is reviewed at each reporting date and reduced to the extent that it is no longer probable that sufficient taxable profit will be available to allow all or part of the deferred tax asset to be utilised. Unrecognised deferred tax assets are reassessed at each reporting date and are recognised to the extent that it has become probable that future taxable profits will allow the deferred tax asset to be recovered.
Deferred tax assets and liabilities are measured at the tax rates that are expected to apply in the year when the asset is realised or the liability is settled, based on tax rates (and tax laws) that have been enacted or substantively enacted at the reporting date.
Deferred tax assets and deferred tax liabilities are offset if a legally enforceable right exists to set off current tax assets against current income tax liabilities and the deferred taxes relate to the same taxation authority on either the same taxable entity or different taxable entities where there is an intention to settle the balances on a net basis.
Income tax is recognised in the
consolidated income statement
. Income tax is recognised in other comprehensive income or directly in equity to the extent that it relates to items recognised in other comprehensive income or in equity.
|
|
P a g e |
148
|
2017
,
2016
and
2015
results
The following table summarises the major components of income tax expense for the periods presented.
|
31 December 2017
|
|
31 December 2016
|
|
31 December 2015
|
|
|||
|
€ million
|
|
€ million
|
|
€ million
|
|
|||
|
Current income tax:
|
||||||||
|
Current income tax charge
|
294
|
|
242
|
|
158
|
|
||
|
Adjustment in respect of current income tax from prior periods
|
—
|
|
24
|
|
(2
|
)
|
||
|
Total current tax
|
294
|
|
266
|
|
156
|
|
||
|
Deferred tax:
|
||||||||
|
Relating to the origination and reversal of temporary differences
|
196
|
|
(56
|
)
|
27
|
|
||
|
Adjustment in respect of deferred income tax from prior periods
|
(3
|
)
|
3
|
|
(1
|
)
|
||
|
Relating to changes in tax rates or the imposition of new taxes
|
(16
|
)
|
(43
|
)
|
(51
|
)
|
||
|
Total deferred tax
|
177
|
|
(96
|
)
|
(25
|
)
|
||
|
Income tax charge per the income statement
|
471
|
|
170
|
|
131
|
|
||
The following table summarises the taxes on items recognised in other comprehensive income and directly within equity for the periods presented.
|
31 December 2017
|
|
31 December 2016
|
|
31 December 2015
|
|
||||
|
€ million
|
|
€ million
|
|
€ million
|
|
||||
|
Taxes charged (credited) to OCI:
|
|||||||||
|
Deferred tax on net gain/loss on revaluation of cash flow hedges
|
—
|
|
(2
|
)
|
5
|
|
|||
|
Deferred tax on net gain/loss on net investment hedges
|
(27
|
)
|
(22
|
)
|
46
|
|
|||
|
Deferred tax on net gain/loss on pension plan remeasurements
|
18
|
|
(14
|
)
|
—
|
|
|||
|
Total taxes charged (credited) to OCI
|
(9
|
)
|
(38
|
)
|
51
|
|
|||
|
Taxes charged (credited) to equity:
|
|||||||||
|
Deferred tax charge (credit): share based compensation
|
(12
|
)
|
(5
|
)
|
(15
|
)
|
|||
|
Current tax charge (credit): share based compensation
|
(2
|
)
|
—
|
|
—
|
|
|||
|
Total taxes charged (credited) to equity
|
(14
|
)
|
(5
|
)
|
(15
|
)
|
|||
The effective tax rate was
40.6%
,
23.6%
and
20.0%
for the years ended
31 December 2017
,
31 December 2016
and 31 December
2015
, respectively. Prior to the Merger the parent company of the Group was a US tax resident; from that date a UK company became the parent. Accordingly, the following tables provide reconciliations of (1) the Group’s income tax expense at the statutory US federal tax rate for year ended 31 December 2015 to the Group’s actual income tax expense for the periods presented and (2) the Group’s income tax expense at the UK statutory tax rate for the years ended
31 December 2017
and
31 December 2016
to the actual income tax expense for the period presented:
|
31 December 2015
|
|
||
|
€ million
|
|
||
|
Accounting profit before tax from continuing operations
|
644
|
|
|
|
Tax expense at the US statutory rate of 35%
|
225
|
|
|
|
Taxation of foreign operations, net
(A)
|
(112
|
)
|
|
|
US taxation of foreign earnings, net of tax credits
|
64
|
|
|
|
Non-deductible expense items for tax purposes
|
3
|
|
|
|
Rate and law change benefit, net
(B)
|
(51
|
)
|
|
|
Other, net
|
2
|
|
|
|
Total provision for income taxes
|
131
|
|
|
|
(A)
|
The Group’s effective tax rate reflects the benefit, net of income tax contingencies, of having all of the operations outside the US, most of which are taxed at statutory rates lower than the statutory US rate of
35%
, with the benefit of some income being fully or partially exempt from income taxes due to various operating and financing activities.
|
|
(B)
|
During the second half of 2015, the UK enacted a corporate income tax rate reduction of
2%
, consisting of a
1%
reduction effective 1 April 2017, and
1%
reduction effective 1 April 2020. As a result, the Group recognised a deferred tax benefit of
€50 million
during the second half of 2015 to reflect the impact of this change.
|
|
|
P a g e |
149
|
|
31 December 2017
|
|
31 December 2016
|
|
|||
|
€ million
|
|
€ million
|
|
|||
|
Accounting profit before tax from continuing operations
|
1,159
|
|
719
|
|
||
|
Tax expense at the UK statutory rate
|
223
|
|
144
|
|
||
|
Taxation of foreign operations, net
(A)
|
86
|
|
(11
|
)
|
||
|
Non-deductible expense items for tax purposes
|
7
|
|
13
|
|
||
|
Non-deductible transaction costs
|
—
|
|
10
|
|
||
|
Rate and law change benefit, net
(B)(C)(D)(E)
|
(16
|
)
|
(43
|
)
|
||
|
Deferred taxes not recognised
(F)
|
174
|
|
30
|
|
||
|
Adjustment in respect of prior periods
|
(3
|
)
|
27
|
|
||
|
Total provision for income taxes
|
471
|
|
170
|
|
||
|
(A)
|
This reflects the impact, net of income tax contingencies, of having operations outside the UK, which are taxed at rates other than the statutory UK rate of
19.25%
for 2017, and
20%
for 2016, with the benefit of some income being fully or partially exempt from income taxes due to various operating and financing activities. In 2017, the amount also includes a net
€125 million
charge related to the deemed repatriation of profits to the US under The Tax Cuts and Jobs Act of 2017 (the “the US Tax Act”).
|
|
(B)
|
In December 2017, the US enacted a corporate income tax rate reduction from
35%
to
21%
, effective 1 January 2018. As a result, the Group recognised a deferred tax expense of
€16 million
to reflect the impact of this change.
|
|
(C)
|
During the second half of 2016, France enacted a corporate income tax rate reduction from
33.33%
to
28%
effective for tax years beginning on or after 1 January 2018. As a result, the Group recognised a deferred tax benefit of
€28 million
during the second half of 2016 to reflect the impact of this change. In December 2017, France enacted a further stepwise corporate income tax rate reduction, ultimately reaching
25%
effective 1 January 2022. The Group recognised in 2017 a deferred tax benefit of
€11 million
to reflect the impact of this change.
|
|
(D)
|
In December 2017, Belgium enacted an incremental corporate income tax rate reduction from
34%
, ultimately reaching
25%
, effective 1 January 2020. As a result the Group recognised a deferred tax benefit of
€20 million
to reflect the impact of this change.
|
|
(E)
|
During the second half of 2016, the UK enacted a corporate income tax rate reduction of
1%
effective 1 April 2020. As a result, the Group recognised a deferred tax benefit of
€14 million
during the second half of 2016 to reflect the impact of this change.
|
|
(F)
|
In 2017, deferred taxes not recognised include a
€178 million
charge related to the reduction of foreign tax credits as a result of the US Tax Act.
|
|
|
P a g e |
150
|
Deferred income taxes
The following table summarises the movements in the carrying amounts of deferred tax liabilities and assets by significant component during the period presented:
|
Franchise and other intangible assets
|
|
Property, plant and equipment
|
|
Financial assets and liabilities
|
|
Net operating loss and other carryforwards
|
|
Employee and retiree benefit accruals
|
|
Tax credit carryforwards, net
|
|
Other, net
|
|
Total, net
|
|
|||||||||
|
€ million
|
|
€ million
|
|
€ million
|
|
€ million
|
|
€ million
|
|
€ million
|
|
€ million
|
|
€ million
|
|
|||||||||
|
As at 31 December 2016
|
1,980
|
|
318
|
|
80
|
|
(72
|
)
|
(124
|
)
|
(258
|
)
|
50
|
|
1,974
|
|
||||||||
|
Amount charged/credited to income statement (excluding effect of tax rate changes)
|
2
|
|
(21
|
)
|
(12
|
)
|
45
|
|
20
|
|
165
|
|
(6
|
)
|
193
|
|
||||||||
|
Effect of tax rate changes on income statement
|
(33
|
)
|
(13
|
)
|
3
|
|
8
|
|
14
|
|
—
|
|
5
|
|
(16
|
)
|
||||||||
|
Amounts charged/credited directly to OCI (excluding effect of tax rate changes)
|
—
|
|
—
|
|
—
|
|
—
|
|
17
|
|
—
|
|
—
|
|
17
|
|
||||||||
|
Effect of tax rate changes on OCI
|
—
|
|
—
|
|
(27
|
)
|
—
|
|
1
|
|
—
|
|
—
|
|
(26
|
)
|
||||||||
|
Amount charged/credited to equity (excluding effect of tax rate changes)
|
—
|
|
—
|
|
—
|
|
—
|
|
(20
|
)
|
—
|
|
—
|
|
(20
|
)
|
||||||||
|
Effect of tax rate changes on equity
|
—
|
|
—
|
|
—
|
|
—
|
|
8
|
|
—
|
|
—
|
|
8
|
|
||||||||
|
Acquired through business combinations
|
63
|
|
(45
|
)
|
—
|
|
—
|
|
(2
|
)
|
46
|
|
(7
|
)
|
55
|
|
||||||||
|
Balance sheet reclassifications
|
(2
|
)
|
2
|
|
—
|
|
—
|
|
—
|
|
—
|
|
—
|
|
—
|
|
||||||||
|
Effect of movements in foreign exchange
|
(13
|
)
|
(4
|
)
|
(13
|
)
|
5
|
|
3
|
|
19
|
|
(1
|
)
|
(4
|
)
|
||||||||
|
As at 31 December 2017
|
1,997
|
|
237
|
|
31
|
|
(14
|
)
|
(83
|
)
|
(28
|
)
|
41
|
|
2,181
|
|
||||||||
Other deferred tax liabilities as at 31 December 2017 and 31 December 2016 include a
€27 million
liability arising on assets capitalised under IFRS but expensed for tax, and a
€22 million
liability related to purchase accounting on earlier transactions in an acquired entity.
Unrecognised tax items
The utilisation of tax loss carryforwards and temporary differences for which currently no deferred tax asset is recognised is subject to the resolution of tax authority enquiries and the achievement of positive income in periods which are beyond the Group’s current business plan and therefore this utilisation is uncertain. In respect of unused tax losses and other carryforwards, deferred tax assets of
€569 million
and
€356 million
have not been recognised, as at
31 December 2017
and
31 December 2016
, respectively.
As at
31 December 2017
, the net recognised tax operating loss carryforwards totalled
€14 million
. Of these,
€11 million
expire in
2036
and €
3 million
expire between
2025
and
2027
. As at
31 December 2017
, the Group’s recognised foreign tax credit carryforwards totalled
€13 million
, which expire between
2021
and
2026
. As at
31 December 2017
, the Group’s other recognised tax credit carryforwards totalled
€15 million
, which expire between
2028
and
2032
.
As at 31 December 2017, there are
no
taxable temporary difference associated with investments in subsidiaries.
Tax provisions
The Group is routinely under audit by taxing authorities in the ordinary course of business. Due to their nature, such proceedings and tax matters involve inherent uncertainties including, but not limited to, court rulings, settlements between affected parties and/or governmental actions. The probability of outcome is assessed and accrued as a liability and/or disclosed, as appropriate. The Group maintains provisions for uncertainty relating to these tax matters that it believes appropriately reflect its risk, the carrying amount of which as at
31 December 2017
is included within other non-current liabilities on the
consolidated statement of financial position
.
The Group reviews the adequacy of these provisions at the end of each reporting period and adjusts them based on changing facts and circumstances. Due to the uncertainty associated with tax matters, it is possible that at some future date, liabilities resulting from audits or litigation could vary significantly from the Group’s provisions.
|
|
P a g e |
151
|
US Tax Cuts and Jobs Act
The US Tax Cuts and Jobs Act (the US Tax Act) was enacted on
22 December 2017
and represents a significant change to the US tax code. Whilst the Group is a UK listed and tax resident entity, it has a number of subsidiaries outside the UK including a US incorporated holding company that is wholly owned by Coca-Cola European Partners plc. Based on the applicable provisions of the US Tax Act, the Group recorded a non-recurring provisional book tax expense totalling
€320 million
during the fourth-quarter of 2017, which included the following items:
|
•
|
An estimated deemed repatriation book tax charge of
€125 million
, net of foreign tax credits. As part of the transition from a worldwide taxation to a territorial taxation system, the US Tax Act imposes a one-off transition tax on un-repatriated earnings of US entities with investments in foreign entities. For the Group, this impact represents a book tax expense and will not result in additional cash taxes.
|
|
•
|
An estimated
€178 million
reduction
in deferred tax assets recognised due to the repeal of the foreign tax credit system. The Group has determined that its foreign tax credits brought forward will not be fully utilised going forward and as such has reduced its deferred tax assets accordingly.
|
|
•
|
An estimated
€3 million
net reduction in deferred tax liabilities as a result of the reduction in the US corporate income tax rate from
35%
to
21%
with effect from 1st January 2018. Based on the backward tracing requirements of IAS 12, the Group recognised a deferred tax benefit of
€27 million
in other comprehensive income (OCI), an
€8 million
unfavourable adjustment to equity, and a deferred tax book expense of
€16 million
.
|
The Group does not currently expect an increase in cash taxes as a result of any provision of the US Tax Act, and while we will continue to evaluate the US Tax Act’s provisions, at this stage, we do not anticipate any impact on the Group’s effective tax rate going forward.
Note 20
SHARE-BASED PAYMENT PLANS
CCEP has established share-based payment plans that provide for the granting of non-qualified share options and restricted share units, some with performance and/or market conditions, to certain executive and management level employees. The Group believes that these awards better align the interests of its employees with the interests of its shareholders. Similar schemes had been maintained by CCE.
The Group recognises compensation expense equal to the grant-date fair value for all share-based payment awards that are expected to vest. Expense is generally recorded on a straight-line basis over the requisite service period for each separately vesting portion of the award. Grant-date fair value of share-based payment awards for each separately vesting tranche is determined using a Black-Scholes model, unless the awards are subject to market conditions, in which case a binomial-lattice model (e.g., Monte Carlo simulation model) is used. The Monte Carlo simulation model utilises multiple input variables to estimate the probability that market conditions will be achieved.
During the years ended
31 December 2017
,
31 December 2016
and
31 December 2015
, compensation expense related to our share-based payment plans totalled
€14 million
,
€42 million
and
€39 million
, respectively.
Share options
Share options (1) are granted with exercise prices equal to or greater than the fair value of the Group’s stock on the date of grant; (2) generally vest in
three
annual tranches over a period of
36 months
and (3) expire
10 years
from the date of grant. Generally, when options are exercised, new shares will be issued rather than issuing treasury shares, if available. At the time of the Merger,
7,462,690
options to purchase CCE shares were converted to
9,900,496
options to purchase Company shares. The number of options, exercise price and grant date fair value were converted to ensure no change in the option holders’ intrinsic values or total cost to exercise. There were no changes made to any option’s vesting schedule and no additional compensation expense was recognised as a result of this conversion. No options were granted during the year ended
31 December 2017
and
31 December 2016
. All options outstanding as at
31 December 2017
, 31 December
2016
and
31 December 2015
were valued and had exercise prices in US dollars.
|
|
P a g e |
152
|
The following table summarises our share option activity for the periods presented:
|
2017
|
2016
|
2015
|
|||||||||||||||
|
Shares
|
|
Average exercise price
|
|
Shares
|
|
Average exercise
price |
|
Shares
|
|
Average exercise
price |
|
||||||
|
thousands
|
|
US$
|
|
thousands
|
|
US$
|
|
thousands
|
|
US$
|
|
||||||
|
Outstanding at beginning of year
|
9,435
|
|
23.03
|
|
8,136
|
|
29.17
|
|
8,548
|
|
24.98
|
|
|||||
|
Granted
|
—
|
|
—
|
|
—
|
|
—
|
|
901
|
|
51.73
|
|
|||||
|
Exercised
|
(842
|
)
|
17.48
|
|
(1,347
|
)
|
14.61
|
|
(1,268
|
)
|
16.84
|
|
|||||
|
Forfeited, expired or cancelled
|
(14
|
)
|
24.61
|
|
(12
|
)
|
32.22
|
|
(45
|
)
|
33.04
|
|
|||||
|
Adjustment for option conversion
|
n/a
|
|
n/a
|
|
2,658
|
|
37.05
|
|
n/a
|
|
n/a
|
|
|||||
|
Outstanding at end of year
|
8,579
|
|
23.58
|
|
9,435
|
|
23.03
|
|
8,136
|
|
29.17
|
|
|||||
|
Options exercisable at end of year
|
8,417
|
|
23.28
|
|
8,701
|
|
21.77
|
|
6,488
|
|
24.45
|
|
|||||
The weighted average share prices during the years-ended
31 December 2017
,
31 December 2016
and
31 December 2015
were
US$39.24
,
US$42.12
and
US$46.93
, respectively.
The following table summarises the weighted average remaining life of options outstanding for the periods presented:
|
2017
|
2016
|
2015
|
||||||||||||
|
Range of exercise prices
|
Options
outstanding
|
|
Weighted
average
remaining
life
|
Options
outstanding |
|
Weighted
average
remaining
life
|
Options
outstanding |
|
Weighted
average remaining life |
|||||
|
US$
|
thousands
|
|
years
|
thousands
|
|
years
|
thousands
|
|
years
|
|||||
|
5.00 to 15.00
|
1,987
|
|
1.37
|
2,532
|
|
2.09
|
2,171
|
|
2.83
|
|||||
|
15.01 to 25.00
|
2,882
|
|
3.98
|
3,060
|
|
5.01
|
1,093
|
|
3.85
|
|||||
|
25.01 to 40.00
|
3,710
|
|
6.85
|
3,843
|
|
7.83
|
4,872
|
|
7.85
|
|||||
|
|
8,579
|
|
4.62
|
9,435
|
|
5.37
|
8,136
|
|
5.90
|
|||||
Key assumptions for grant-date fair value
The following table summarises the weighted average grant-date fair values per unit and assumptions that were used to estimate the grant-date fair values of the share options granted during the period presented:
|
Stock options
(A)
|
2015
|
|
|
|
Grant-date fair value (US$)
|
8.50
|
|
|
|
Assumptions:
|
|||
|
Share price on grant date (US$)
|
51.73
|
|
|
|
Dividend yield (%)
(B)
|
2.30
|
|
|
|
Expected volatility (%)
(C)
|
22.5
|
|
|
|
Risk-free interest rate (%)
(D)
|
1.6
|
|
|
|
Expected life (years)
(E)
|
5
|
|
|
|
(A)
|
There were no option grants during the years ended
31 December 2017
and
31 December 2016
.
|
|
(B)
|
The dividend yield was calculated by dividing the Group’s annual dividend by its average stock price on the date of grant, taking into consideration our future expectations regarding our dividend yield.
|
|
(C)
|
The expected volatility was determined by using a combination of the historical volatility of our stock, the implied volatility of our exchange-traded options and other factors, such as a comparison to our peer group.
|
|
(D)
|
The risk-free interest rate was based on the US Treasury yield with a term equal to the expected life on the date of grant.
|
|
(E)
|
The expected life was used for options valued by the Black-Scholes model. It was determined by using a combination of actual exercise and post-vesting cancellation history for the types of employees included in the grant population.
|
Restricted Share Units
Restricted share units generally vest upon continued employment for a period of at least
36 months
and the attainment of certain market conditions and/or performance targets. Restricted share unit awards entitle the participant to hypothetical dividends, which are paid only if the restricted share units vest, but not voting rights. Unvested restricted share units are restricted as to disposition and subject to forfeiture.
|
|
P a g e |
153
|
There were
0.4 million
,
0.4 million
and
0.5 million
unvested restricted share units outstanding with a weighted average grant-date fair value of
US$44.05
,
US$45.76
and
US$46.58
as at
31 December 2017
,
31 December 2016
and 31 December
2015
, respectively.
Additionally, unvested performance share units (PSUs) of
1.3 million
,
1.4 million
,
1.9 million
and with weighted average grant-date fair values of
US$44.19
,
US$45.81
and
US$43.27
were outstanding as at
31 December 2017
, 31 December
2016
and
31 December 2015
, respectively. The PSUs granted in 2014 also contained a market condition that adjusted the number of PSUs otherwise earned based on the following year's EPS results. Specifically, the percentage of the target PSUs earned based on EPS growth was adjusted (upward or downward) based on Total Shareholder Return (TSR) performance, as compared to the TSR of the companies in the S&P 500 over the performance period. The 2014 performance share units will pay out at
175%
of the target award.
The 2015 PSUs contained only performance and service conditions and will pay out at
100%
of the target award. In 2016, there was no award of PSUs.
The 2017 PSUs vest after three years and are subject to two equally weighted performance conditions; compound annual growth rate of earnings per share,and return on invested capital (ROIC), both measured over a three year period.
Key assumptions for grant-date fair value
The following table summarises the weighted average grant-date fair values per unit:
|
Restricted Share Units
|
2017
|
|
2015
|
|
||
|
Grant-date fair value - service conditions (US$)
|
38.95
|
|
50.30
|
|
||
|
Grant-date fair value - service and performance conditions (US$)
|
37.78
|
|
51.73
|
|
||
|
Grant-date fair value - service, performance and market conditions (US$)
(A)
|
n/a
|
|
49.88
|
|
||
|
(A)
|
The grant-date fair value for these awards was determined using a Monte Carlo simulation model since they are subject to a market condition.
|
Conversions of share-based payments
Upon completion of the Merger, each unvested restricted share unit of CCE shares was converted into a cash payment of
US$14.50
and
one
restricted share unit of Company shares. The cash payment and restricted share unit both vest concurrently and under the same schedule as the original CCE restricted share unit. These awards do not contain a net settlement feature for employee taxes; therefore, the liability of
€21 million
for tax withholdings on unvested restricted share units as at the Merger was reclassified into equity. Further, the Group determined that the total fair value of the cash payment and the new restricted share unit immediately after the Merger equalled the fair value of the original restricted share unit immediately prior to the Merger; thus no incremental expense was recognised. As at 31 December
2016
, the total accrued portion of the cash payment reclassified from equity and included within accrued compensation was
€16 million
. Additionally, CCE had a pre-existing deferred share-based payment plan that was terminated in connection with the Merger. This resulted in the plan being converted and reclassified from an equity-settled plan to a cash-settled plan and shortly after the Merger approximately
€27 million
was distributed to the plan participants.
Note 21
PROVISIONS, CONTINGENCIES AND COMMITMENTS
Provisions are recognised when the Group has a present obligation (legal or constructive) as a result of a past event, it is probable that an outflow of resources embodying economic benefits will be required to settle the obligation and a reliable estimate can be made of the amount of the obligation. When some or all of a provision is expected to be reimbursed, the reimbursement is recognised as a separate asset, but only when the reimbursement is virtually certain. The expense relating to a provision is presented in the
consolidated income statement
, net of any reimbursement.
Asset retirement obligations are estimated at the inception of a lease or contract, for which a liability is recognised. A corresponding asset is also created and depreciated.
If the effect of the time value of money is material, provisions are discounted using a current pre-tax rate that reflects, when appropriate, the risks specific to the liability. When discounting is used, the increase in the provision due to the passage of time is recognised as a finance cost.
The Group is involved in various legal proceedings and tax matters. Due to their nature, such legal proceedings and tax matters involve inherent uncertainties including, but not limited to, court rulings, settlements between affected parties and/or governmental actions. The probability of loss for such contingencies is assessed and accrued as a liability and/or disclosed, as appropriate.
|
|
P a g e |
154
|
Provisions
The following table summarises the movement in each class of provision for the periods presented:
|
|
Restructuring provision
|
|
|
|
Decommissioning provision
|
|
|
Other
provisions
(A)
|
|
|
Total
|
|
|
|
€ million
|
|
€ million
|
|
€ million
|
|
€ million
|
|
||||||
|
As at 31 December 2015
|
19
|
|
17
|
|
1
|
|
37
|
|
|||||
|
Acquired - CCIP from the Merger (Note 2)
|
—
|
|
—
|
|
—
|
|
10
|
|
10
|
|
|||
|
Acquired - CCEG from the Merger (Note 2)
|
228
|
|
—
|
|
—
|
|
—
|
|
228
|
|
|||
|
Charged/(credited) to profit or loss:
|
|||||||||||||
|
Additional provisions recognised
|
260
|
|
2
|
|
1
|
|
263
|
|
|||||
|
Unused amounts reversed
|
(6
|
)
|
—
|
|
(3
|
)
|
(9
|
)
|
|||||
|
Utilised during the period
|
(212
|
)
|
(1
|
)
|
—
|
|
(213
|
)
|
|||||
|
Other miscellaneous adjustments
|
—
|
|
(5
|
)
|
—
|
|
(5
|
)
|
|||||
|
Translation
|
—
|
|
(1
|
)
|
—
|
|
(1
|
)
|
|||||
|
As at 31 December 2016
|
289
|
|
12
|
|
9
|
|
310
|
|
|||||
|
Charged/(credited) to profit or loss:
|
|||||||||||||
|
Additional provisions recognised
|
186
|
|
1
|
|
9
|
|
|
196
|
|
||||
|
Unused amounts reversed
|
(22
|
)
|
—
|
|
(3
|
)
|
|
(25
|
)
|
||||
|
Utilised during the period
|
(238
|
)
|
(1
|
)
|
(2
|
)
|
|
(241
|
)
|
||||
|
Translation
|
1
|
|
1
|
|
—
|
|
|
2
|
|
||||
|
As at 31 December 2017
|
216
|
|
|
13
|
|
|
13
|
|
|
242
|
|
||
|
Non-current
|
31
|
|
|
|
12
|
|
|
5
|
|
|
48
|
|
|
|
Current
|
185
|
|
|
|
1
|
|
|
8
|
|
|
194
|
|
|
|
As at 31 December 2017
|
216
|
|
|
|
13
|
|
|
13
|
|
|
242
|
|
|
|
(A)
|
Other provisions primarily relate to property tax assessment provisions and legal reserves and are not considered material to these financial statements.
|
Restructuring provision
Restructuring provisions are recognised only when the Group has a constructive obligation, which is when a detailed formal plan identifies the business or part of the business concerned, the location and number of employees affected, a detailed estimate of the associated costs and an appropriate timeline and the employees affected have been notified of the plan’s main features. These provisions are expected to be resolved by the time the related program is substantively complete.
Refer to
Note 16
for further details regarding our restructuring programmes, including expected completion date, total costs incurred and expected costs to be incurred.
Decommissioning provisions
Decommissioning liabilities relate to contractual or legal obligations to pay for asset retirement costs. The liabilities represent both the reinstatement obligations when the Group is contractually obligated to pay for the cost of retiring leased buildings and the costs for collection, treatment, reuse, recovery and environmentally sound disposal of cold-drink equipment. Specific to cold-drink equipment obligations, the Group is subject to, and operates in accordance with, the EU Directive on Waste Electrical and Electronic Equipment (WEEE). Under the WEEE Directive, companies that put electrical and electronic equipment (such as cold-drink equipment) on the EU market are responsible for the costs of collection, treatment, recovery and disposal of their own products. The WEEE provision estimate is updated at least bi-annually and utilises assumptions related total cold-drink equipment, disposal cost per unit, average equipment age and inflation rate to determine the appropriate accrual amount.
The period over which the decommissioning liabilities on leased buildings and cold-drink equipment will be settled ranges from
1
to
10
years and
3
to
13
years, respectively.
Contingencies
Legal proceedings and tax matters
The Group is involved in various legal proceedings and tax matters, and is routinely under audit by taxing authorities in the ordinary course of business. Due to their nature, such legal proceedings and tax matters involve inherent uncertainties including, but not limited to, court rulings, settlements between affected parties and/or governmental actions. The probability of loss for such contingencies is assessed and accrued as a liability and/or disclosed, as appropriate.
|
|
P a g e |
155
|
Guarantees
In connection with ongoing litigation in certain territories, guarantees of approximately
€285 million
have been issued to the authorities. The Group was required to issue these guarantees to satisfy potential obligations arising from such litigation. In addition, we have approximately
€50 million
of guarantees issued to third-parties through the normal course of business. These guarantees have various terms, and none of these guarantees are individually significant. The amount represents the maximum potential future payments that we could be required to make under the guarantees. No significant additional liabilities in the accompanying
consolidated financial statements
are expected to arise from guarantees issued.
Commitments
Commitments beyond
31 December 2017
are disclosed herein but not accrued for within the
consolidated statement of financial position
.
Purchase agreements
Total purchase commitments were
€0.8 billion
as at
31 December 2017
. This amount represents non-cancellable purchase agreements with various suppliers that are enforceable and legally binding, and that specify a fixed or minimum quantity that we must purchase. All purchases made under these agreements have standard quality and performance criteria. In addition to these amounts, the Group has outstanding capital expenditure purchase orders of approximately
€81 million
as at
31 December 2017
. The Group also has other purchase orders raised in the ordinary course of business which are settled in a reasonably short period of time.
Operating lease commitments
The Group leases land, office and warehouse space, computer hardware, machinery and equipment and vehicles under non-cancellable operating lease agreements expiring at various dates through
2027
. Some lease agreements contain standard renewal provisions that allow for renewal at rates equivalent to fair market value at the end of the lease term. Under lease agreements that contain escalating rent provisions, lease expense is recorded on a straight-line basis over the lease term. Under lease agreements that contain rent holidays, rent expense is recorded on a straight-line basis over the entire lease term, including the period covered by the rent holiday.
Rent expense under non-cancellable operating lease agreements totalled
€120 million
,
€92 million
and
€62 million
during the years ended
31 December 2017
,
31 December 2016
and
31 December 2015
, respectively.
The following table summarises the future maturity of the Group’s operating lease obligations as at the dates presented:
|
31 December 2017
|
|
31 December 2016
|
|
|||
|
Operating lease maturities
|
€ million
|
|
€ million
|
|
||
|
Within one year
|
90
|
|
89
|
|
||
|
After one year but not more than five years
|
163
|
|
165
|
|
||
|
More than five years
|
37
|
|
51
|
|
||
|
Total minimum lease payments
|
290
|
|
305
|
|
||
Note 22
OTHER CURRENT ASSETS
The following table summarises the Group’s other current assets as at the dates presented:
|
31 December 2017
|
|
31 December 2016
|
|
|||
|
€ million
|
|
€ million
|
|
|||
|
Prepayments
|
45
|
|
63
|
|
||
|
VAT receivables
|
273
|
|
218
|
|
||
|
Miscellaneous receivables
|
124
|
|
81
|
|
||
|
Assets held for sale
|
10
|
|
10
|
|
||
|
Total other current assets
|
452
|
|
372
|
|
||
|
|
P a g e |
156
|
VAT Receivables
As at
31 December 2017
and
31 December 2016
, the Group had a value added tax (VAT) receivable recorded of €
235 million
and €
179 million
respectively, relating to a dispute that began in 2014 between the Spanish Tax Authorities and the Regional Tax Authorities of Bizkaia (Basque Region) as to the responsibility for refunding the VAT to CCEP.
Under relevant tax laws in Spain, conflicts between jurisdictions are ruled by a special Arbitration Board and the refund of the VAT is mandated following the resolution of the issue at the Arbitration Board. However, to date, the Arbitration Board has not ruled on the issue and Spanish legislation offers limited mechanisms for a taxpayer to force the expedition of matters before the Arbitration Board.
Under the laws of the European Union, there must be neutrality of treatment between a supplier and the recipient of a transaction, i.e. provided VAT has been correctly charged and paid, and the recipient is entitled to deduct the input VAT, the excess VAT must be refunded. As such, we believe it is a certainty that the amount due plus interest will be refunded to CCEP once the Arbitration Board rules.
Note 23
FINANCIAL RISK MANAGEMENT
Financial risk factors, objectives and policies
The Group’s activities expose it to several financial risks including market risk, credit risk and liquidity risk. Financial risk activities are governed by appropriate policies and procedures to minimise the uncertainties these risks create on the Group’s future cash flows. Such policies are developed and approved by the Group’s Treasury and Commodities Risk Committee, through the authority provided to it by the Board.
Market risk
Market risk represents the risk that the fair value of future cash flows of a financial instrument will fluctuate due to changes in market prices and includes interest rate risk, currency risk and other price risk such as commodity price risk. Market risk affects outstanding borrowings, as well as derivative financial instruments.
Interest rates
The Group is subject to interest rate risk for its outstanding borrowings. To manage interest rate risk, the Group maintains a significant proportion of its borrowings at fixed rates. Approximately
77%
of the Group’s interest-bearing borrowings was comprised of fixed-rate borrowings at
31 December 2017
and
31 December 2016
. The Group has not entered into any interest rate swap agreements or other such instruments to hedge its interest rate risk during the periods presented.
If interest rates on the Group’s floating-rate debt were adjusted by
1%
for the years ended
31 December 2017
, 31 December
2016
and
31 December 2015
, the Group’s finance costs and pre-tax equity would change on an annual basis by approximately
€12 million
,
€15 million
and
€2 million
, respectively. This amount is determined by calculating the effect of a hypothetical interest rate change on the Group’s floating-rate debt. This estimate does not include the effects of other actions to mitigate this risk or changes in the Group’s financial structure.
Currency exchange rates
The Group’s exposure to the risk of changes in currency exchange rates relates primarily to its operating activities denominated in currencies other than the functional currency, euro. To manage currency exchange risk arising from future commercial transactions and recognised monetary assets and liabilities, foreign currency forward and option contracts with external third parties are utilised. Typically, up to
80%
of anticipated cash flow exposures in each major foreign currency for the next calendar year are hedged using a combination of forward and option contracts with third parties. Prior to the Merger, CCE utilised forward and option contracts to hedge the currency exchange risk related to its net investments in foreign subsidiaries. All net investment hedges were settled prior to the Merger. CCEP continues to monitor its exposure to currency exchange rates and execute cash flow and net investment hedges in line with its hedge strategy, as needed, due to volatilities in anticipated cash flow exposures and the functional currencies of certain of its subsidiaries.
The following table demonstrates the sensitivity of the Group’s profit before income taxes and pre-tax equity as a result of changes in the value of outstanding debt instruments due to reasonable movements in the US dollar against the euro, with all other variables held constant. Movements in foreign currencies related to the Group’s other financial instruments do not have a material impact on profit before income taxes or pre-tax equity.
|
Change in currency rate
|
€ Strengthens Against US$
|
|
€ Weakens Against US$
|
|
||||
|
Effect on profit before tax and pre-tax equity
|
%
|
€ million
|
|
€ million
|
|
|||
|
Year ended 31 December 2017
|
10
|
81
|
|
(89
|
)
|
|||
|
Year ended 31 December 2016
|
10
|
92
|
|
(101
|
)
|
|||
|
Year ended 31 December 2015
|
10
|
127
|
|
(139
|
)
|
|||
|
|
P a g e |
157
|
Commodity price risk
The competitive marketplace in which the Group operates may limit its ability to recover increased costs through higher prices. As such, the Group is subject to market risk with respect to commodity price fluctuations, principally related to its purchases of aluminium, PET (plastic), steel, sugar and vehicle fuel. When possible, exposure to this risk is managed primarily through the use of supplier pricing agreements, which enable the Group to establish the purchase price for certain commodities. Certain suppliers restrict the Group’s ability to hedge prices through supplier agreements. As a result, at times, non-designated commodity hedging programmes are entered into. Typically, up to
80%
of the anticipated commodity transaction exposures for the next calendar year are hedged using a combination of forward and option contracts executed with third parties. The Group estimates that a
10%
change in the market price of these commodities over the current market prices would affect operating profit during the next 12 months by approximately
€37 million
. This does not take into account the effects of derivative instruments used to manage exposure to this risk or pricing agreements in place.
Credit risk
The Group is exposed to counterparty credit risk on all of its derivative financial instruments. Strict counterparty credit guidelines are maintained and only financial institutions that are investment grade or better are acceptable counterparties. Counterparty credit risk is continuously monitored and numerous counterparties are utilised to minimise exposure to potential defaults. Collateral is not required under these agreements. The maximum credit risk exposure for each derivative financial instrument is the carrying amount of the derivative.
Credit is extended in the form of payment terms for trade to customers of the Group, consisting of retailers, wholesalers and other customers, generally without requiring collateral, based on an evaluation of the customer’s financial condition. While the Group has a concentration of credit risk in the retail sector, this risk is mitigated due to the diverse nature of the customers the Group serves, including, but not limited to, their type, geographic location, size and beverage channel. Collections of receivables are dependent on each individual customer’s financial condition and sales adjustments granted. Trade accounts receivable are carried at net realisable value. Typically, accounts receivable have terms of
30
to
60
days and do not bear interest. Exposure to losses on receivables is monitored, and allowances for potential losses or adjustments are maintained. Allowances are determined by: (1) evaluating the aging of receivables; (2) analysing the history of adjustments; and (3) reviewing high-risk customers. Past due receivable balances are written off when the Group’s efforts have been unsuccessful in collecting the amount due. Credit insurance on a portion of the accounts receivable balance is also carried.
Liquidity risk
Liquidity risk is actively managed to ensure that the Group has sufficient funds to satisfy its commitments. The Group’s sources of capital include, but are not limited to, cash flows from operations, public and private issuances of debt and equity securities and bank borrowings. The Group believes its operating cash flow, cash on hand and available short-term and long-term capital resources are sufficient to fund its working capital requirements, scheduled borrowing payments, interest payments, capital expenditures, benefit plan contributions, income tax obligations and dividends to its shareholders. Counterparties and instruments used to hold cash and cash equivalents are continuously assessed, with a focus on preservation of capital and liquidity. Based on information currently available, the Group does not believe it is at significant risk of default by its counterparties.
The Group has amounts available for borrowing under a
€1.5 billion
multi-currency credit facility with a syndicate of
ten
banks. This credit facility matures in
2021
and is for general corporate purposes, including serving as a backstop to its commercial paper programme and supporting the Group’s working capital needs. Based on information currently available, the Group has no indication that the financial institutions participating in this facility would be unable to fulfil their commitments as at the date of the filing of this report. The current credit facility contains no financial covenants that would impact the Group’s liquidity or access to capital. As at
31 December 2017
, the Group had no amounts drawn under this credit facility. CCE previously held a multi-currency credit facility for
US$1.0 billion
with a syndicate of eight banks, which was terminated prior to the Merger. CCE did not have any amounts drawn on this facility for any period presented in the
consolidated statement of financial position
.
|
|
P a g e |
158
|
The table below analyses the Group’s non-derivative financial liabilities and net settled derivative financial liabilities into relevant maturity groupings based on the remaining period at the Statement of Financial Position date to the contractual maturity date. Derivative financial liabilities are included in the analysis if their contractual maturities are essential for an understanding of the timing of the cash flows. The amounts disclosed in the table are the contractual undiscounted cash flows:
|
|
Total
|
|
Less than 1 year
|
|
1 to 3 years
|
|
3 to 5 years
|
|
More than 5 years
|
|
|||||
|
Financial liabilities
|
€ million
|
|
€ million
|
|
€ million
|
|
€ million
|
|
€ million
|
|
|||||
|
31 December 2017
|
|||||||||||||||
|
Trade accounts payable
|
2,282
|
|
2,282
|
|
—
|
|
—
|
|
—
|
|
|||||
|
Amounts payable to related parties
|
178
|
|
178
|
|
—
|
|
—
|
|
—
|
|
|||||
|
Borrowings
|
5,792
|
|
274
|
|
1,320
|
|
1,722
|
|
2,476
|
|
|||||
|
Derivatives
|
94
|
|
1
|
|
93
|
|
—
|
|
—
|
|
|||||
|
Total financial liabilities
|
8,346
|
|
2,735
|
|
1,413
|
|
1,722
|
|
2,476
|
|
|||||
|
|
|||||||||||||||
|
31 December 2016
|
|
|
|||||||||||||
|
Trade accounts payable
|
2,418
|
|
2,418
|
|
—
|
|
—
|
|
—
|
|
|||||
|
Amounts payable to related parties
|
162
|
|
162
|
|
—
|
|
—
|
|
—
|
|
|||||
|
Borrowings
|
6,370
|
|
850
|
|
750
|
|
1,620
|
|
3,150
|
|
|||||
|
Derivatives
|
9
|
|
8
|
|
1
|
|
—
|
|
—
|
|
|||||
|
Total financial liabilities
|
8,959
|
|
|
3,438
|
|
|
751
|
|
|
1,620
|
|
|
3,150
|
|
|
Capital management
The primary objective of the Group’s capital management is to ensure strong credit rating and appropriate capital ratios are maintained in order to support the Group’s business and maximise shareholder value. The Group’s credit ratings are periodically reviewed by rating agencies. Currently, the Group’s long-term ratings from Moody’s and Standard & Poor’s (S&P), are A3 and BBB+, respectively. The ratings outlook from Moody’s and S&P are stable. Changes in the operating results, cash flows or financial position could impact the ratings assigned by the various rating agencies. The credit rating can be materially influenced by a number of factors including, but not limited to, acquisitions, investment decisions, capital management activities of TCCC and/or changes in the credit rating of TCCC. Should the credit ratings be adjusted downward, the Group may incur higher costs to borrow, which could have a material impact on the financial condition and results of operations.
The capital structure is managed and, as appropriate, adjustments are made in light of changes in economic conditions and the Group’s financial policy. The Group monitors its operating performance in the context of targeted financial leverage by comparing the ratio of net debt with Adjusted EBITDA. Net debt is calculated as being the net of cash and cash equivalents and currency adjusted borrowings. Adjusted EBITDA is calculated as EBITDA and adjusting for items impacting comparability.
Refer to
Note 10
for the presentation of fair values for each class of financial assets and financial liabilities, and
Note 11
, for an outline of how the Group utilises derivative financial instruments to mitigate its exposure to certain items impacting comparability.
Refer to the strategic report included within this Annual Report for disclosure of strategic, commercial and operational risk relevant to the Group.
Note 24
OTHER SIGNIFICANT ACCOUNTING POLICIES
Revenue
Revenue is recognised when all of the following conditions are met: (1) the amount of revenue can be reliably measured; (2) it is probable that future economic benefits will flow to the Group; and (3) the significant risks and rewards of ownership of the products have passed to the buyer, usually on delivery of the goods. For product sales, these conditions generally occur when the products are delivered to or picked up by customers and, in the case of full-service vending, when cash is collected from vending machines. Revenue is stated net of sales discounts and marketing and promotional incentives paid to customers.
Value added taxes are recorded on a net basis (i.e. excluded from revenue) and excise taxes and taxes on packaging are recorded on a gross basis (i.e. included in revenue).
|
|
P a g e |
159
|
Deductions from revenue and sales incentives
The Group participates in various programmes and arrangements with customers designed to increase the sale of products. Among the programmes are arrangements under which allowances can be earned by customers for attaining agreed-upon sales levels or for participating in specific marketing programmes.
Under customer programmes and arrangements that require sales incentives to be paid in advance, the Group amortises the amount paid over the period of benefit or contractual sales volume. When incentives are paid in arrears, the Group accrues the estimated amount to be paid based upon historical customer experience, the programme’s contractual terms, expected customer performance and/or estimated sales volume.
Franchisor support arrangements
The Group participates in various funding programmes supported by TCCC or other franchisors whereby it receives funds from the franchisor to support customer marketing programmes or other arrangements that promote the sale of the franchisors’ products. Under these programmes, certain costs incurred by the Group are reimbursed by the franchisor. Payments from TCCC and other franchisors for marketing programmes and other similar arrangements to promote the sale of products are classified as a reduction in cost of sales, unless the presumption that the payment is a reduction in the price of the franchisors’ products can be overcome. Payments for marketing programmes are recognised as product is sold.
Refer to
Note 18
for further details about the Group’s transactions with TCCC.
Shipping and handling costs
Shipping and handling costs related to the movement of finished goods from the Group’s manufacturing locations to the Group’s sales distribution centres are included in cost of sales on the
consolidated income statement
. Shipping and handling costs incurred to move finished goods from sales distribution centres to customer locations are included in selling and distribution expenses on the
consolidated income statement
. Customers do not pay separately for shipping and handling costs.
Standards issued but not yet effective
The standards and interpretations that are issued (although in some cases not yet adopted by the EU), but not yet effective, up to the date of issuance of these financial statements, are disclosed below. These standards will be adopted, if applicable, when they become effective. The impact the standards will have on the Group’s financial statements is being evaluated.
IFRS 9, “Financial Instruments”
IFRS 9 is effective for annual periods beginning on or after 1 January 2018. Based on a detailed review performed and taking into consideration the Group's current hedging activities and risk management strategies, the adoption of IFRS 9 will not have a material impact on the
consolidated financial statements
. The new hedge accounting rules will align the accounting for hedging instruments more closely with the group’s risk management practices. Under the new standard, more hedge relationships may be eligible for hedge accounting, as the standard introduces a more principles-based approach. The Group’s current hedge relationships will qualify as continuing hedges upon the adoption of IFRS 9. In addition, the Group intends to designate more of its commodity exposure in accordance with our risk policy. The decision regarding whether or not to designate a hedge for hedge accounting is made by management considering the size, purpose and tenure of the hedge, as well as the anticipated ability to demonstrate and test the economic relationship per IFRS 9 guidelines. Other changes resulting from the adoption of the new standard include the application of an expected credit loss impairment model for receivables, which is not expected to have a material impact on the Group’s
consolidated financial statements
.
IFRS 15, “Revenue from Contracts with Customers”
In May 2014, the International Accounting Standards Board ("IASB") issued IFRS 15, “Revenue from Contracts with Customers”, that establishes a five-step model to account for revenue arising from contracts with customers. Under IFRS 15, revenue is recognised at an amount that reflects the consideration to which an entity expects to be entitled in exchange for transferring goods or services to a customer. IFRS 15 also requires additional disclosures about the nature, timing and uncertainty of revenue and cash flows arising from customer contracts, including significant judgements and changes in judgements. The new revenue standard will supersede all current revenue recognition requirements under IAS 18. The Group plans to adopt IFRS 15 on a modified retrospective basis.
During the year the Group carried out a detailed review of the current recognition criteria for revenue against the requirements of IFRS 15 and concluded that the overall impact on the Group’s
consolidated financial statements
is not considered material.
|
|
P a g e |
160
|
IFRS 16, “Leases”
In January 2016, the IASB issued IFRS 16, “Leases”. The new standard supersedes IAS 17. The objective of IFRS 16 is to ensure a single lessee accounting model and requires a lessee to recognise assets and liabilities for all leases with a term of more than 12 months, unless the underlying asset is of low value. IFRS 16 substantially carries forward the lessor accounting requirements in IAS 17 and related interpretations. Accordingly, a lessor continues to classify its leases as operating leases or finance leases and to account for those two types of leases differently. IFRS 16 is effective for annual periods beginning on or after 1 January 2019, with early adoption permitted. IFRS 16 allows either a full retrospective application or a modified retrospective application.
The Group is currently evaluating the impact that IFRS 16 will have on its
consolidated financial statements
.
IFRS 2, “Share-based Payments”
In June 2016, the IASB issued the narrow-scope amendments to IFRS 2, “Share-based Payments”. The amendments clarify how to account for certain types of share-based payment transactions including cash-settled share-based payments and share-based payment transactions with a net settlement feature for withholding tax obligations. The amendments also clarify the accounting where a modification to the terms and conditions of a share-based payment transaction changes its classification from cash-settled to equity-settled. Companies are required to apply the amendments for annual periods beginning on or after 1 January 2018.
We do not expect this amendment to have a material impact on the
consolidated financial statements
.
IFRIC Interpretation 23, “Uncertainty over Income Tax Treatment”
The Interpretation addresses the accounting for income taxes when tax treatments involve uncertainty that affects the application of IAS 12 and does not apply to taxes or levies outside the scope of IAS 12, nor does it specifically include interest and penalties associated with uncertain tax treatments. The Interpretation addresses the following: whether an entity considers uncertain tax treatments separately, the assumptions an entity makes about the examination of tax treatments by taxation authorities, determination of taxable profit (tax loss), tax bases, unused tax losses, unused tax credits and tax rates and how changes in facts and circumstances are considered.
An entity must determine whether to consider each uncertain tax treatment separately or together with one or more other uncertain tax treatments. The approach that better predicts the resolution of the uncertainty should be followed. The interpretation is effective for annual reporting periods beginning on or after 1 January 2019.
We do not expect IFRIC 23 to have a material impact on the
consolidated financial statements
.
Note 25
SIGNIFICANT EVENTS AFTER THE REPORTING PERIOD
A dividend of €
0.26
per share for the first quarter 2018 was authorised by the Company’s Board of Directors in February 2018 and will be paid on 15 March 2018.
In January 2018, as part of productivity initiatives in Great Britain, the Group announced proposals to close its manufacturing site in Milton Keynes and distribution centre in Northampton during the course of 2019, subject to full consultation with employees and their representatives. If the proposals are accepted, the impacted production and distribution activities would be transferred within our network of facilities throughout Great Britain. We expect the closures of these facilities will result in restructuring charges comprised primarily of accelerated depreciation and severance payments. However, at this stage, we are unable to provide an estimate of total costs of the closures should the proposals be accepted since we are in consultation with the relevant works councils and labour representatives.
Note 26
GROUP COMPANIES
In accordance with Section 409 of the Companies Act 2006, a full list of subsidiaries, partnerships, associates, joint ventures and joint arrangements, the country of incorporation and the effective percentage of equity owned, as at
31 December 2017
are disclosed below. Unless otherwise stated, they have share capital consisting solely of ordinary shares that are held directly by the Group, and the proportion of ownership interest held equals the voting rights held by the Group.
|
Name
|
Country of Incorporation
|
% Equity interest
|
Registered Address
|
|
Agua De La Vega Del Codorno, S.L.U.
|
Spain
|
100%
|
C/ Ribera Del Loira, 20-22, 2ª Planta - 28042 (Madrid)
|
|
Aguas De Santolin, S.L.U.
|
Spain
|
100%
|
C/ Real, s/n- 09246 Quintanaurria (Burgos)
|
|
Aguas Del Maestrazgo, S.L.U.
|
Spain
|
100%
|
C/ Monasterio de las huelgas, 7 Pol.ind.Alcalde Caballero 50014 (Zaragoza)
|
|
Aguas Del Toscal, S.A.U.
|
Spain
|
100%
|
Ctra. de la Pasadilla, km. 3- 35250 ingenio (Gran Canaria)
|
|
Aguas Vilas Del Turbon, S.L.U.
|
Spain
|
100%
|
C/Monasterio de las Huelgas, 7 Pol.ind.Alcalde Caballero 50014(Zaragoza)
|
|
|
P a g e |
161
|
|
Name
|
Country of Incorporation
|
% Equity interest
|
Registered Address
|
|
Amalgamated Beverages Great Britain Limited
|
United Kingdom
|
100%
|
Pemberton House, Bakers Road, Uxbridge, UB8 1EZ
|
|
BBH Investment Ireland Limited
|
Ireland
|
100%
|
6th Floor 2 Grand Canal Square Dublin 2
|
|
Bebidas Gaseosas Del Noroeste, S.L.U.
|
Spain
|
100%
|
Avda.Alcalde Alfonso Molina, s/n- 15007 (A Coruña)
|
|
Beganet, S.L.U.
|
Spain
|
100%
|
Avda Paisos Catalans, 32 – 08950 (Esplugues de Llobregat)
|
|
BH Holdings Lux Commandite SCS
|
Luxembourg
|
100%
(A)
|
2, rue des Joncs L-1818 Howald
|
|
BH Holdings Luxembourg SARL
|
Luxembourg
|
100%
|
2, rue des Joncs L-1818 Howald
|
|
BH Luxembourg SARL
|
Luxembourg
|
100%
|
2, rue des Joncs L-1818 Howald
|
|
BH SARL
|
Luxembourg
|
100%
|
2, rue des Joncs L-1818 Howald
|
|
Birtingahúsið ehf.
|
Iceland
|
34.5%
|
Laugavegur 174, 105 Reykjavík
|
|
BL Bottling Holdings UK Limited
|
United Kingdom
|
100%
|
Pemberton House, Bakers Road, Uxbridge, UB8 1EZ
|
|
Bottling Great Britain Limited
|
United Kingdom
|
100%
(B)
|
Pemberton House, Bakers Road, Uxbridge, UB8 1EZ
|
|
Bottling Holdings (Luxembourg) SARL
|
Luxembourg
|
100%
|
2, rue des Joncs L-1818 Howald
|
|
Bottling Holdings (Netherlands) B.V.
|
Netherlands
|
100%
|
Watermanweg 30, 3067 GG Rotterdam
|
|
Bottling Holdings Europe Limited
|
United Kingdom
|
100%
(A)
|
Pemberton House, Bakers Road, Uxbridge, UB8 1EZ
|
|
Bottling Holding France SAS
|
France
|
100%
|
9 chemin de Bretagne 92784 Issy-les-Moulineaux
|
|
CC Digital GmbH
|
Germany
|
50%
|
Stralauer Allee 4, 10245 Berlin
|
|
CC Erfrischungsgetränke Oldenburg Verwaltungs GmbH
|
Germany
|
100%
|
Sandkruger Straße 234 26133 Oldenburg
|
|
Cc Iberian Partners Gestion, S.L.
|
Spain
|
100%
|
C/Ribera del Loira, 20-22 - 28042 (Madrid)
|
|
CC Verpackungs GmbH
|
Germany
|
100%
|
Schieferstraße 20 06126 Halle (Saale)
|
|
CCEP Equipment Services Limited
|
United Kingdom
|
100%
|
Pemberton House, Bakers Road, Uxbridge, UB8 1EZ
|
|
CCEP Holdings Norge AS
|
Norway
|
100%
|
Robsrudskogen 5 1470 Lørenskog
|
|
CCEP Holdings Sverige AB
|
Sweden
|
100%
|
Dryckesvägen 2 C 136 87 Haninge
|
|
CCEP Holdings UK Limited
|
United Kingdom
|
100%
|
Pemberton House, Bakers Road, Uxbridge, UB8 1EZ
|
|
CCIP Soporte, S.L.U.
|
Spain
|
100%
|
C/ Ribera Del Loira, 20-22, 2ª Planta – 28042 (Madrid)
|
|
Classic Brand (Europe) Designated Activity Company
|
Ireland
|
100%
|
4th Floor 25-28 Adelaide Road Dublin 2
|
|
Cobega Embotellador, S.L.U.
|
Spain
|
100%
|
Avda Paisos Catalans, 32 – 08950 (Esplugues de Llobregat)
|
|
Coca-Cola European Partners Belgium SPRL
|
Belgium
|
100%
|
Chaussée de Mons 1424,1070 Brussels
|
|
Coca-Cola European Partners Deutschland GmbH
|
Germany
|
100%
|
Stralauer Allee 4, 10245 Berlin
|
|
Coca-Cola European Partners France SAS
|
France
|
100%
(C)
|
9 chemin de Bretagne 92784 Issy-les-Moulineaux
|
|
Coca-Cola European Partners Great Britain Limited
|
United Kingdom
|
100%
|
Pemberton House, Bakers Road, Uxbridge, UB8 1EZ
|
|
Coca-Cola European Partners Holdings Great Britain Limited
|
United Kingdom
|
100%
|
Pemberton House, Bakers Road, Uxbridge, UB8 1EZ
|
|
Coca-Cola European Partners Holdings US, Inc.
|
United States
|
100%
(B)
|
1209 Orange St. Wilmington, 19801 Delaware
|
|
Coca-Cola European Partners Iberia, S.L.U.
|
Spain
|
100%
|
C/ Ribera del Loira, 20-22, 2nd floor, 28042 (Madrid)
|
|
Coca-Cola European Partners Ísland ehf.
|
Iceland
|
100%
|
Studlahals 1, 110 Reykjavik
|
|
Coca-Cola European Partners Luxembourg SARL
|
Luxembourg
|
100%
|
2, rue des Joncs L-1818 Howald
|
|
Coca-Cola European Partners Nederland B.V.
|
Netherlands
|
100%
|
Watermanweg 30, 3067 GG Rotterdam
|
|
Coca-Cola European Partners Norge AS
|
Norway
|
100%
|
Robsrudskogen 5 1470 Lørenskog
|
|
Coca-Cola European Partners Pension Scheme Trustees Limited
|
United Kingdom
|
100%
|
Pemberton House, Bakers Road, Uxbridge, UB8 1EZ
|
|
Coca-Cola European Partners Portugal Unipessoal, LDA
|
Portugal
|
100%
|
Quinta da Salmoura - Cabanas-2929- 509 Azeitão (Setúbal)
|
|
Coca-Cola European Partners Services Bulgaria EOOD
|
Bulgaria
|
100%
|
48 Sitnyakovo Blvd, Serdika Center, Office Building, floor 5, 1505 Sofia
|
|
Coca-Cola European Partners Services Europe Limited
|
United Kingdom
|
100%
|
Pemberton House, Bakers Road, UB8 1EZ
|
|
Coca-Cola European Partners Services SPRL
|
Belgium
|
100%
(D)
|
Chaussée de Mons 1424,1070 Brussels
|
|
|
P a g e |
162
|
|
Name
|
Country of Incorporation
|
% Equity interest
|
Registered Address
|
|
Coca-Cola European Partners Sverige AB
|
Sweden
|
100%
|
136 87 Haninge
|
|
Coca-Cola European Partners US II, LLC
|
United States
|
100%
|
1209 Orange St. Wilmington, 19801 Delaware
|
|
Coca-Cola European Partners US, LLC
|
United States
|
100%
|
1209 Orange St. Wilmington, 19801 Delaware
|
|
Coca-Cola Immobilier SCI
|
France
|
100%
(C)
|
9 chemin de Bretagne 92784 Issy-les-Moulineaux France
|
|
Coca-Cola Production SAS
|
France
|
100%
|
Zone d’entreprises de Bergues – Commune de Socx – 59380 Bergues
|
|
Compañía Asturiana De Bebidas Gasesosas, S.L.U.
|
Spain
|
100%
|
C/ Nava, 18- 3ª (Granada) Siero- 33006 Oviedo Spain
|
|
Compañia Castellana De Bebidas Gaseosas, S.L.
|
Spain
|
100%
|
C/ Ribera Del Loira, 20-22 , 2ª Planta -28042 (MADRID)
|
|
Compañía Levantina De Bebidas Gaseosas, S.L.U.
|
Spain
|
100%
|
Av.Real Monasterio de Sta.María de Poblet,36 – 46930 (Quart de Poblet)
|
|
Compañia Norteña De Bebidas Gaseosas, S.L.U.
|
Spain
|
100%
|
C/ Ibaizábal, 57 – 48960 Galdakao (Bizkaia)
|
|
Compañia Para La Comunicación De Bebidas Sin Alcohol, S.L.U.
|
Spain
|
100%
|
C/ Ribera Del Loira, 20-22 , 2ª Planta -28042 (MADRID)
|
|
Conversia IT, S.L.U.
|
Spain
|
100%
|
C/ Ribera Del Loira, 20-22 , 2ª Planta -28042 (MADRID)
|
|
Developed System Logistics, S.L.U.
|
Spain
|
100%
|
Av.Henry Ford, 25, Manzana 19, Complejo Pq.Ind.Juan Carlos I , 46220 (Picassent) Valencia
|
|
GBH Investment Ireland Limited
|
Ireland
|
100%
|
6th Floor 2 Grand Canal Square Dublin 2
|
|
GBH Luxembourg SARL
|
Luxembourg
|
100%
|
2, rue des Joncs L-1818 Howald
|
|
GH Luxembourg SCS
|
Luxembourg
|
100%
(A)
|
2, rue des Joncs L-1818 Howald
|
|
GR Bottling Holdings UK Limited
|
United Kingdom
|
100%
|
Pemberton House, Bakers Road, Uxbridge, UB8 1EZ
|
|
Herdt Verwaltungs GmbH i.L.
|
Germany
|
100%
|
Karl-Herdt-Weg 100 63075 Offenbach
|
|
Infineo Recyclage SAS
|
France
|
49%
(E)
|
Sainte Marie la Blanche – 21200 Dijon
|
|
Instelling voor Bedrijfspensioenvoorziening
Coca-Cola European Partners
Belgium/Coca-Cola European Partners
Services – Bedienden-Arbeiders OFP
|
Belgium
|
100%
|
Bergensesteenweg 1424 – 1070 Brussel
|
|
Instelling voor Bedrijfspensioenvoorziening
Coca-Cola European Partners
Belgium/Coca-Cola European Partners
Services – Kaderleden OFP
|
Belgium
|
100%
|
Bergensesteenweg 1424 – 1070 Brussel
|
|
Iparbal, 99 S.L.
|
Spain
|
100%
|
C/ Ibaizábal, 57 – 48960 Galdakao (Bizkaia)
|
|
IPARSOFT, 2004 S.L.
|
Spain
|
100%
|
C/ Ibaizábal, 57 – 48960 Galdakao (Bizkaia)
|
|
Lusobega ,S.L.
|
Spain
|
100%
|
C/ Ibaizábal, 57 – 48960 Galdakao (Bizkaia)
|
|
Madrid Ecoplatform, S.L.U.
|
Spain
|
100%
|
C/Pedro Lara, 8 Pq.Tecnológico de Leganes- 28919 (Leganes)
|
|
Peña Umbria, S.L.U
|
Spain
|
100%
|
Av. Real Monasterio de Sta. María de Poblet,36 – 46930 (Quart de Poblet)
|
|
Refecon Águas S.A.
|
Portugal
|
100%
|
Quinta da Salmoura - Cabanas-2929- 509 Azeitão (Setúbal)
|
|
Refrescos Envasados Del Sur, S.L.U.
|
Spain
|
100%
|
Autovía del Sur A-IV, km.528- 41309 La Rinconada (Sevilla)
|
|
Refrige Sgps, S.A
|
Portugal
|
100%
|
Quinta da Salmoura- Cabanas, 2929-509 (Azeitão)
|
|
Roalba, S.L.U.
|
Spain
|
100%
|
C/ Ibaizábal, 57 – 48960 Galdakao (Bizkaia)
|
|
Solares y Edificios Norteños, S.L.U.
|
Spain
|
100%
|
C/ Ibaizábal, 57 – 48960 Galdakao (Bizkaia)
|
|
Svenska Brettbolaget AB
|
Sweden
|
19.6%
|
Greg Turegatan 9 114 46 Stockholm Sweden
|
|
WB Investment Ireland 2 Limited
|
Ireland
|
100%
|
6th Floor 2 Grand Canal Square Dublin 2
|
|
WB Investment Ireland Limited
|
Ireland
|
100%
|
6th Floor 2 Grand Canal Square Dublin 2
|
|
WBH Holdings Luxembourg SCS
|
Luxembourg
|
100%
|
2, rue des Joncs L-1818 Howald
|
|
WBH Luxembourg SARL
|
Luxembourg
|
100%
|
2, rue des Joncs L-1818 Howald
|
|
WIH UK Limited
|
United Kingdom
|
100%
|
Pemberton House, Bakers Road, Uxbridge, UB8 1EZ
|
|
Wir sind Coca-Cola GmbH
|
Germany
|
100%
|
Stralauer Allee 4 10245 Berlin Germany
|
|
(A)
|
Class A and B shares.
|
|
(B)
|
Including preference shares issued to the Group.
|
|
(C)
|
Group shareholding
99.99%
or greater.
|
|
(D)
|
Class A, B and C shares.
|
|
(E)
|
Class A and B shares. The Group holds
49%
of Class B shares.
|
|
|
P a g e |
163
|
COCA-COLA EUROPEAN PARTNERS PLC COMPANY FINANCIAL STATEMENTS
Statement of Financial Position
|
31 December 2017
|
|
31 December 2016
|
|
||||
|
Note
|
€ thousand
|
|
€ thousand
|
|
|||
|
ASSETS
|
|||||||
|
Non-current
|
|||||||
|
Investments
|
3
|
21,834,017
|
|
21,818,126
|
|
||
|
Amounts owed by affiliates
|
6
|
350,000
|
|
—
|
|
||
|
Non-current derivative assets
|
4
|
—
|
|
134,168
|
|
||
|
Deferred tax asset
|
5
|
4,456
|
|
4,175
|
|
||
|
Fixed assets
|
112
|
|
136
|
|
|||
|
Total non-current assets
|
22,188,585
|
|
21,956,605
|
|
|||
|
Current:
|
|||||||
|
Amounts owed by affiliates
|
6
|
561,339
|
|
582,793
|
|
||
|
Current derivative assets
|
4
|
4,995
|
|
6,491
|
|
||
|
Prepayments
|
382
|
|
67
|
|
|||
|
Trade and other receivables
|
123
|
|
100
|
|
|||
|
Cash
|
132
|
|
123
|
|
|||
|
Total current assets
|
566,971
|
|
589,574
|
|
|||
|
Total assets
|
22,755,556
|
|
22,546,179
|
|
|||
|
LIABILITIES
|
|||||||
|
Non-current:
|
|||||||
|
Amounts owed to affiliates
|
7
|
2,850,514
|
|
3,243,177
|
|
||
|
Borrowings, less current portion
|
8
|
2,030,098
|
|
1,676,311
|
|
||
|
Non-current derivative liabilities
|
4
|
214,558
|
|
—
|
|
||
|
Total non-current liabilities
|
5,095,170
|
|
4,919,488
|
|
|||
|
Current:
|
|||||||
|
Amounts owed to affiliates
|
7
|
445,705
|
|
490,909
|
|
||
|
Current portion of borrowings
|
8
|
249,915
|
|
498,866
|
|
||
|
Trade and other payables
|
57,070
|
|
60,247
|
|
|||
|
Provisions
|
2,336
|
|
3,211
|
|
|||
|
Total current liabilities
|
755,026
|
|
1,053,233
|
|
|||
|
Total liabilities
|
5,850,196
|
|
5,972,721
|
|
|||
|
EQUITY
|
|||||||
|
Share capital
|
9
|
4,846
|
|
4,831
|
|
||
|
Share premium
|
9
|
126,742
|
|
113,239
|
|
||
|
Merger reserves
|
9
|
8,465,979
|
|
8,465,979
|
|
||
|
Retained earnings
|
9
|
8,307,793
|
|
7,989,409
|
|
||
|
Total equity
|
16,905,360
|
|
16,573,458
|
|
|||
|
Total equity and liabilities
|
22,755,556
|
|
22,546,179
|
|
|||
The financial statements were approved by the Directors and authorised for issue on
15 March 2018
. They were signed on its behalf by:
Damian Gammell
Chief Executive Officer
15 March 2018
This page does not form part of Coca-Cola European Partners plc Annual Report on Form 20-F for the year ended 31 December 2017 as filed with the SEC
|
|
P a g e |
164
|
Statement of Changes in Equity
|
Share capital
|
|
Share premium
|
|
Merger reserves
|
|
Retained earnings
|
|
Total
|
|
||||||
|
€ thousand
|
|
€ thousand
|
|
€ thousand
|
|
€ thousand
|
|
€ thousand
|
|
||||||
|
Balance as at 4 August 2015
|
63
|
|
—
|
|
—
|
|
—
|
|
—
|
|
63
|
|
|||
|
Issuance of shares at Merger
|
4,760
|
|
7,605,098
|
|
8,465,979
|
|
—
|
|
16,075,837
|
|
|||||
|
Issuance of new shares
|
8
|
|
—
|
|
—
|
|
—
|
|
8
|
|
|||||
|
Share premium reduction
|
—
|
|
(7,500,000
|
)
|
—
|
|
7,500,000
|
|
—
|
|
|||||
|
Share-based payments
|
—
|
|
8,141
|
|
—
|
|
—
|
|
8,141
|
|
|||||
|
Share-based payment reserves
|
—
|
|
—
|
|
—
|
|
188,170
|
|
188,170
|
|
|||||
|
Total comprehensive income for the period
|
—
|
|
—
|
|
—
|
|
383,229
|
|
383,229
|
|
|||||
|
Dividends
|
—
|
|
—
|
|
—
|
|
(81,990
|
)
|
(81,990
|
)
|
|||||
|
Balance as at 31 December 2016
|
4,831
|
|
113,239
|
|
8,465,979
|
|
7,989,409
|
|
16,573,458
|
|
|||||
|
Issuance of new shares
|
15
|
|
13,503
|
|
—
|
|
—
|
|
13,518
|
|
|||||
|
Share-based payment reserves
|
—
|
|
—
|
|
—
|
|
11,781
|
|
11,781
|
|
|||||
|
Total comprehensive income for the period
|
—
|
|
—
|
|
—
|
|
796,227
|
|
796,227
|
|
|||||
|
Dividends
|
—
|
|
—
|
|
—
|
|
(489,624
|
)
|
(489,624
|
)
|
|||||
|
Balance as at 31 December 2017
|
4,846
|
|
126,742
|
|
8,465,979
|
|
8,307,793
|
|
16,905,360
|
|
|||||
This page does not form part of Coca-Cola European Partners plc Annual Report on Form 20-F for the year ended 31 December 2017 as filed with the SEC
|
|
P a g e |
165
|
NOTES TO THE COMPANY FINANCIAL STATEMENTS
Note 1
AUTHORISATION OF FINANCIAL STATEMENTS AND STATEMENT OF COMPLIANCE WITH FRS 101
The financial statements of Coca-Cola European Partners plc (the Company) for the period from
1 January 2017
until 31 December
2017
were authorised for issue by the Board of Directors on
15 March 2018
and the financial statements were signed on the Board’s behalf by Damian Gammell, Chief Executive Officer. Coca-Cola European Partners plc is incorporated and domiciled in England and Wales. The Company was incorporated as a public company limited by shares under the laws of England and Wales with the registered number in England of 09717350. The address of the Company’s registered office is Coca-Cola European Partners plc, Pemberton House, Bakers Road, Uxbridge, Middlesex UB8 1EZ, United Kingdom.
These financial statements were prepared in accordance with Financial Reporting Standard 101 “Reduced Disclosure Framework” (FRS 101) and in accordance with applicable accounting standards. No Income Statement is presented by the Company as permitted by Section 408 of the Companies Act 2006. The profit for the year is
€796,227 thousand
.
The Company’s financial statements are presented in euros and all values are rounded to the nearest thousand (€’000) except where otherwise indicated.
The principal accounting policies adopted by the Company are set out in Note 2.
Note 2
ACCOUNTING POLICIES
Basis of preparation
The accounting policies which follow set out those policies which apply in preparing the financial statements for the period ended 31 December 2017. The Company has taken advantage of the following disclosure exemptions under FRS 101:
|
(a)
|
the requirements of paragraphs 45(b) and 46 to 52 of IFRS 2 "Share-based Payment";
|
|
(b)
|
the requirements of paragraphs 62, B64(d), B64(e), B64(g), B64(h), B64(j) to B64(m), B64(n)(ii), B64 (o)(ii), B64(p), B64(q)(ii), B66 and B67of IFRS 3 “Business Combinations”;
|
|
(c)
|
the requirements of paragraph 33 (c) of IFRS 5 “Non-current Assets Held for Sale and Discontinued Operations”;
|
|
(d)
|
the requirements of IFRS 7 “Financial Instruments: Disclosures”;
|
|
(e)
|
the requirements of paragraphs 91-99 of IFRS 13 “Fair Value Measurement”;
|
|
(f)
|
the requirement in paragraph 38 of IAS 1 “Presentation of Financial Statements” to present comparative information in respect of:
|
|
(i)
|
paragraph 79(a)(iv) of IAS 1;
|
|
(ii)
|
paragraph 73(e) of IAS 16 “Property, Plant and Equipment”;
|
|
(iii)
|
paragraph 118(e) of IAS 38 “Intangible Assets”;
|
|
(iv)
|
paragraphs 76 and 79(d) of IAS 40 “Investment Property”;
|
|
(g)
|
the requirements of paragraphs 10(d), 10(f), 39(c) and 134-136 of IAS 1;
|
|
(h)
|
the requirements of IAS 7 “Statement of Cash Flows”;
|
|
(i)
|
the requirements of paragraphs 30 and 31 of IAS 8 “Accounting Policies, Changes in Accounting Estimates and Errors”;
|
|
(j)
|
the requirements of paragraph 17 of IAS 24 “Related Party Disclosures”;
|
|
(k)
|
the requirements in IAS 24 to disclose related party transactions entered into between two or more members of a group, provided that any subsidiary which is a party to the transaction is wholly owned by such a member; and
|
|
(l)
|
the requirements of paragraphs 134(d)-134(f) and 135(c)-135(e) of IAS 36 “Impairment of Assets”.
|
Significant accounting policies
a) Functional currency
The Company was re-registered as a public limited company on 4 May 2016 and for the purpose of re-registration the Company issued financial statements as of 25 April 2016. The Company also issued its initial accounts at 1 July 2016 before its first dividend distribution. At the time, the appropriate functional currency of the entity was determined to be British pound. Management reassessed the functional currency during 2016, as circumstances had changed, and concluded that the functional currency of the Company should be euros as the most significant cash outflows, such as dividends to shareholders and servicing of third party debt, are expected to be paid in euros. Functional currency of euros remains appropriate for 2017.
This page does not form part of Coca-Cola European Partners plc Annual Report on Form 20-F for the year ended 31 December 2017 as filed with the SEC
|
|
P a g e |
166
|
b) Foreign currency translation
Transactions and balances
Transactions in foreign currencies are initially recorded in the entity’s functional currency by applying the spot exchange rate ruling at the date of the transaction. Monetary assets and liabilities denominated in foreign currencies are retranslated at the functional currency rate of exchange ruling at the period end date. All differences are taken to the Income Statement.
Non-monetary items that are measured in terms of historical cost in a foreign currency are translated using the exchange rates as at the dates of the initial transactions. Non-monetary items measured at fair value in a foreign currency are translated using the exchange rates at the date when the fair value was determined.
c) Investments
The Company assesses at each reporting date whether there is an indication that an asset may be impaired. If any such indication exists the Company makes an estimate of the asset’s recoverable amount in order to determine the extent of the impairment loss. An asset’s recoverable amount is the higher of an asset’s or cash-generating unit’s fair value less costs to sell and its value in use, and is determined for an individual asset, unless the asset does not generate cash inflows that are largely independent of those from other assets or groups of assets. Where the carrying amount of an asset exceeds its recoverable amount, the asset is considered impaired and is written down to its recoverable amount. Impairment losses on continuing operations are recognised in the Income Statement in those expense categories consistent with the function of the impaired asset.
For assets where an impairment loss subsequently reverses, the carrying amount of the asset or cash generating unit is increased to the revised estimate of its recoverable amount, not to exceed the carrying amount that would have been determined, net of depreciation, had no impairment losses been recognised for the asset or cash generating unit in prior years. A reversal of impairment loss is recognised immediately in the Income Statement, unless the asset is carried at a revalued amount when it is treated as a revaluation increase.
d) Share-based payments
The Company has established share-based payments plans that provide for the granting of non-qualified share options and restricted share units to certain executive and management level employees that are employed at its subsidiaries. The Company accounts for its share-based payments by applying IFRS 2 “Share-based Payment” and IFRIC 11 - IFRS 2 “Group and Treasury Share Transactions”. The Company incurs an obligation to settle the transactions with the respective employees where a subsidiary receives the services. The transactions are classified as equity-settled because they are settled in equity instruments of the Company.
The Company recharges subsidiaries for the equity it provides to their respective employees. Therefore, the Company accounts for share-based payments by recording an investment in subsidiary against a corresponding increase to equity.
e) Financial Instruments
i) Financial assets
Initial recognition and measurement
Financial assets within the scope of IAS 39 “Financial Instruments: Recognition and Measurement” are classified as financial assets at fair value through profit or loss, loans and receivables, held-to-maturity investments, available-for-sale financial assets, or as derivatives designated as hedging instruments in an effective hedge, as appropriate. The Company determines the classification of its financial assets at initial recognition.
All financial assets are recognised initially at fair value plus, in the case of investments not at fair value through profit or loss, directly attributable transaction costs.
The Company’s financial assets include cash and short-term deposits, trade and other receivables, loan notes, and derivative financial instruments.
Subsequent measurement
The subsequent measurement of financial assets depends on their classification as follows:
Financial assets at fair value through profit or loss
Financial assets at fair value through profit or loss include financial assets held for trading and financial assets designated upon initial recognition at fair value through profit or loss. Financial assets are classified as held for trading if they are acquired for the purpose of selling in the near term. This category includes derivative financial instruments entered into by the Company that are not designated as hedging instruments in hedge relationships as defined by IAS 39. The Company has not designated any financial assets upon initial recognition as at fair value through profit or loss.
Derivatives, including separated embedded derivatives are also classified as held for trading unless they are designated as effective hedging instruments.
Financial assets at fair value through profit and loss are carried in the Statement of Financial Position at fair value with changes in fair value recognised in finance revenue or finance expense in the Income Statement.
This page does not form part of Coca-Cola European Partners plc Annual Report on Form 20-F for the year ended 31 December 2017 as filed with the SEC
|
|
P a g e |
167
|
Loans and receivables
Loans and receivables are non-derivative financial assets with fixed or determinable payments that are not quoted in an active market. Such assets are initially recognised at fair value and subsequently measured at amortised cost using the effective interest (EIR) method, less impairment. Amortised cost is calculated by taking into account any discount or premium on acquisition and fees or costs that are an integral part of the EIR. The EIR amortisation is included in finance revenue in the Income Statement. Losses arising from impairment are recognised in the Income Statement in other operating expenses.
ii) Financial liabilities
Initial recognition and measurement
Financial liabilities within the scope of IAS 39 are classified as financial liabilities at fair value through profit or loss, loans and borrowings, or as derivatives designated as hedging instruments in an effective hedge, as appropriate. The Company determines the classification of its financial liabilities at initial recognition. All financial liabilities are recognised initially at fair value and in the case of loans and borrowings, plus directly attributable transaction costs.
Subsequent measurement
The measurement of financial liabilities depends on their classification as follows:
Financial liabilities at fair value through profit or loss
Financial liabilities at fair value through profit or loss includes financial liabilities held for trading and financial liabilities designated upon initial recognition as at fair value through profit or loss.
Interest bearing loans and borrowings
Obligations for loans and borrowings are recognised when the Company becomes party to the related contracts and are measured initially at the fair value of consideration received less directly attributable transaction costs.
After initial recognition, interest bearing loans and borrowings are subsequently measured at amortised cost using the effective interest method.
Gains and losses arising on the repurchase, settlement or otherwise cancellation of liabilities are recognised respectively in finance revenue and finance cost.
iii) Derivative financial instruments and hedging
The Company utilises derivative financial instruments to mitigate its exposure to certain market risks associated with its ongoing operations. The primary risks that it seeks to manage through the use of derivative financial instruments include currency exchange risk and interest rate risk. All derivative financial instruments are recorded at fair value on the Statement of Financial Position. The Company does not use derivative financial instruments for trading or speculative purposes.
f) Trade and other payables
These amounts represent liabilities for goods and services provided prior to the end of period which are unpaid. Trade and other payables are presented as current liabilities unless payment is not due within 12 months after the reporting period. Trade and other payables are recognised initially at fair value and subsequently measured at amortised cost using the effective interest method, as needed.
g) Cash at bank and in hand
Cash and cash equivalents in the Statement of Financial Position comprises of cash at banks.
h) Income taxes
Income tax is determined by using the comprehensive balance sheet method of accounting for income taxes which recognises current and future tax consequences of transactions and events, and future tax consequences of future recovery or settlement of the carrying amount of assets and liabilities.
Current Income Tax
Current income tax assets and liabilities for the current period are measured at the amount expected to be paid to or recovered from taxation authorities. The tax rates and tax laws used to compute the amount are those that are enacted or substantively enacted, at the reporting date in the countries where the Company and/or its subsidiaries operate. Current income tax relating to items recognised directly in equity is not recognised in the Income Statement. The Company periodically evaluates positions taken in the tax returns with respect to situations in which applicable tax regulations are subject to interpretation and establish provisions where appropriate.
Deferred Tax
Deferred tax is determined by identifying the temporary differences between the tax bases of assets and liabilities and their carrying amounts for financial reporting purposes at the reporting date. Deferred tax liabilities are recognised for all taxable temporary differences, except:
|
•
|
When the deferred tax liability arises from the initial recognition of goodwill or an asset or liability in a transaction that is not a business combination and, at the time of the transaction, affects neither the accounting profit nor taxable profit or loss; or
|
This page does not form part of Coca-Cola European Partners plc Annual Report on Form 20-F for the year ended 31 December 2017 as filed with the SEC
|
|
P a g e |
168
|
|
•
|
In respect of taxable temporary differences associated with investments in subsidiaries, branches and associates and interests in joint ventures, when the timing of the reversal of the temporary differences can be controlled by the Company and/or its subsidiaries and it is probable that the temporary differences will not reverse in the foreseeable future.
|
Deferred tax assets are recognised for all deductible temporary differences, carry forward of unused tax credits and unused tax losses, to the extent that it is probable that taxable profit will be available against which the deductible temporary differences and the carry forward of unused tax credits and unused tax losses can be utilised, except:
|
•
|
When the deferred tax asset relating to the deductible temporary difference arises from the initial recognition of an asset or liability in a transaction that is not a business combination and, at the time of the transaction, affects neither the accounting profit nor taxable profit or loss; or
|
|
•
|
In respect of deductible temporary differences associated with investments in subsidiaries, branches and associates and interests in joint ventures, deferred tax assets are recognised only to the extent that it is probable that the temporary differences will reverse in the foreseeable future and taxable profit will be available against which the temporary differences can be utilised. The carrying amount of deferred tax assets is reviewed at each reporting date and reduced to the extent that it is no longer probable that sufficient taxable profit will be available to allow all or part of the deferred tax asset to be utilised. Unrecognised deferred tax assets are reassessed at each reporting date and are recognised to the extent that it has become probable that future taxable profits will allow the deferred tax asset to be recovered. Deferred tax assets and liabilities are measured at the tax rates that are expected to apply in the year when the asset is realised or the liability is settled, based on tax rates (and tax laws) that have been enacted or substantively enacted at the reporting date.
|
Note 3
INVESTMENTS
|
2017
|
|
2016
|
|
|||
|
€ thousand
|
|
€ thousand
|
|
|||
|
Balance at 1 January 2017
|
21,818,126
|
|
—
|
|
||
|
Investments acquired at Merger
|
—
|
|
21,737,467
|
|
||
|
Subsequent investment in subsidiaries
|
3,000
|
|
60,000
|
|
||
|
Capitalised share-based payments
|
12,891
|
|
20,659
|
|
||
|
Balance at 31 December 2017
|
21,834,017
|
|
21,818,126
|
|
||
The investments in subsidiaries represent the Company’s investment, mainly created after the Merger in 2016 in the businesses of Coca-Cola Enterprises, Inc. (CCE), Coca-Cola Iberian Partners, S.A. (CCIP) and Coca-Cola Erfrischungsgetränke (CCEG). Investments in subsidiaries are shown at cost less provision for impairment. Management performed an impairment assessment of the investments in subsidiaries balance and concluded that the carrying value of the investments does not exceed the recoverable amount.
During the year ended 31 December 2017, certain group reorganisation activities between wholly owned subsidiaries of the Company resulted in a charge of €1.8 billion in the Company income statement. However, there was an equal and offsetting amount of dividend income received in connection with these transactions, resulting in a zero net impact on the Company’s Statement of Comprehensive Income and Statement of Financial Position.
This page does not form part of Coca-Cola European Partners plc Annual Report on Form 20-F for the year ended 31 December 2017 as filed with the SEC
|
|
P a g e |
169
|
Note 4
DERIVATIVE ASSETS AND LIABILITIES
|
31 December 2017
|
|
31 December 2016
|
|
|||
|
€ thousand
|
|
€ thousand
|
|
|||
|
Non-current derivative assets:
|
||||||
|
Foreign currency contracts
|
—
|
|
134,168
|
|
||
|
Total non-current derivative assets
|
—
|
|
134,168
|
|
||
|
Current derivative assets:
|
||||||
|
Foreign currency contracts
|
4,995
|
|
6,491
|
|
||
|
Total current derivative assets
|
4,995
|
|
6,491
|
|
||
|
Total derivative assets
|
4,995
|
|
140,659
|
|
||
|
31 December 2017
|
|
31 December 2016
|
|
|||
|
€ thousand
|
|
€ thousand
|
|
|||
|
Non-current derivative liabilities:
|
||||||
|
Foreign currency contracts
|
214,558
|
|
—
|
|
||
|
Total non-current derivative liabilities
|
214,558
|
|
—
|
|
||
|
Total derivative liabilities
|
214,558
|
|
—
|
|
||
The Company uses cash flow hedges to mitigate its exposure to changes in cash flows attributable to currency fluctuations associated with certain forecasted transactions including the receipt of interest and principal on intercompany loans denominated in non-functional currencies and the payment of interest and principal on debt issuances in non-functional currencies. The derivative instruments are classified as level 2.
As at 31 December 2017, the Company has entered into an intercompany hedge with Coca-Cola European Partners US LLC with a nominal value of €1.8 billion and a third party hedge with a nominal value of US$1.1 billion.
Note 5
DEFERRED TAXES
|
31 December 2017
|
|
31 December 2016
|
|||
|
€ thousand
|
|
€ thousand
|
|||
|
Deferred tax on foreign currency contracts
|
4.456
|
|
4,175
|
||
|
Total deferred tax
|
4.456
|
|
4,175
|
||
Note 6
AMOUNTS OWED BY AFFILIATES
|
31 December 2017
|
|
31 December 2016
|
|
|||
|
€ thousand
|
|
€ thousand
|
|
|||
|
Non-current amounts owed by affiliates:
|
||||||
|
Loans
|
350,000
|
|
—
|
|
||
|
Total non-current amounts owed by affiliates
|
350,000
|
|
—
|
|
||
|
Current amounts owed by affiliates
|
||||||
|
Loans
|
434,896
|
|
496,164
|
|
||
|
Cash pool receivables
|
123,713
|
|
49,972
|
|
||
|
Trade receivables
|
2,307
|
|
36,385
|
|
||
|
Other
|
423
|
|
272
|
|
||
|
Total current amounts owed by affiliates
|
561,339
|
|
582,793
|
|
||
|
Total amounts owed by affiliates
|
911,339
|
|
582,793
|
|
||
Affiliates represent direct and indirect subsidiaries of the Company.
This page does not form part of Coca-Cola European Partners plc Annual Report on Form 20-F for the year ended 31 December 2017 as filed with the SEC
|
|
P a g e |
170
|
Note 7
AMOUNTS OWED TO AFFILIATES
|
31 December 2017
|
|
31 December 2016
|
|
|||
|
€ thousand
|
|
€ thousand
|
|
|||
|
Non-current amounts owed to affiliates:
|
||||||
|
Borrowings
|
2,850,514
|
|
3,243,177
|
|
||
|
Total non-current amounts owed to affiliates
|
2,850,514
|
|
3,243,177
|
|
||
|
Current amounts owed to affiliates:
|
||||||
|
Borrowings
|
426,332
|
|
476,992
|
|
||
|
Interest payables
|
11,162
|
|
12,512
|
|
||
|
Trade and other payables
|
8,211
|
|
1,405
|
|
||
|
Total current amounts owed to affiliates
|
445,705
|
|
490,909
|
|
||
|
Total amounts owed to affiliates
|
3,296,219
|
|
3,734,086
|
|
||
Affiliates represent direct and indirect subsidiaries of the Company.
Note 8
BORROWINGS
|
31 December 2017
|
|
31 December 2016
|
|
|||
|
€ thousand
|
|
€ thousand
|
|
|||
|
Non-current borrowings:
|
||||||
|
Bank notes
|
2,030,098
|
|
1,676,311
|
|
||
|
Total non-current borrowings
|
2,030,098
|
|
1,676,311
|
|
||
|
Current borrowings:
|
||||||
|
Bank notes
|
—
|
|
498,866
|
|
||
|
Commercial paper
|
249,915
|
|
—
|
|
||
|
Total current borrowings
|
249,915
|
|
498,866
|
|
||
|
Total borrowings
|
2,280,013
|
|
2,175,177
|
|
||
The non-current borrowings as at 31 December 2017 represent Eurobond notes due between November 2021 and May 2028 with rates from
0.75%
to
1.75%
. The principal amounts are €2.1 billion. The notes are stated net of unamortised financing fees of €20 million. There are more details in Note 12 of the
consolidated financial statements
.
The current borrowings represent euro commercial paper with varying interest rates which matured and was repaid in January 2018.
Note 9
EQUITY
Share capital
As at 31 December 2017, the Company has issued and fully paid
484,586,428
shares with a nominal value of
€0.01
per share. Shares in issue have one voting right each and no restrictions related to dividends or return of capital.
Immediately prior to the Merger on 28 May 2016, there were 228,244,244 shares of US$0.01 par value of CCE shares issued and fully paid, which included net issuances of 908,456 related to share-based payment awards from 1 January 2016 through 27 May 2016. In connection with the Merger, as described in Note 2 of the consolidated financial statements, all CCE shares were cancelled and replaced with shares of the Company. Additionally, the Company issued 166,128,987 and 87,950,640 shares to Olive Partners and European Refreshments (a wholly owned subsidiary of TCCC), respectively, as consideration to acquire their bottling operations. Subsequent to the Merger, the Group issued an additional 752,525 shares related to share-based payment awards. The number of shares issued and fully paid at 31 December 2016 was 483,076,396.
The share capital increased in 2017 from the issue of 1,510,032 shares following the exercise of share-based payment awards.
This page does not form part of Coca-Cola European Partners plc Annual Report on Form 20-F for the year ended 31 December 2017 as filed with the SEC
|
|
P a g e |
171
|
Share premium
On 28 May 2016, the excess over nominal value of €0.01 for the 228,244,244 shares issued to CCE shareholders based on the adjusted closing stock price of CCE ordinary shares of €33.33 was included within the share premium account. On 22 June 2016, the Company received approval from the UK High Court of Justice to convert €7.5 billion of its undistributable profits into distributable profits. This resulted in the reduction to the share premium account of €7.5 billion and a corresponding increase to retained earnings.
The share premium account has also increased from cash receipts relating to the exercise of share options subsequent to the Merger.
Merger reserves
The consideration transferred to acquire CCIP and CCEG qualified for merger relief under the UK Companies Act of 2006. As such, the excess consideration transferred over nominal value was required to be excluded from the share premium account and recorded to merger reserves. The cumulative balance of €8.5 billion includes the consideration transferred in excess of nominal value of €0.01 for CCIP and CCEG of €5.5 billion and €2.9 billion, respectively.
Retained earnings
The balance in retained earnings represents opening balance on 1 January 2017, combined with the result for the period and the share-based payment reserve.
Dividends
During the year ended 31 December 2017, the Company made dividend payments totalling €489 million, including €82 million in January 2017, based on a dividend rate of €0.17 per share, and four dividends from April 2017 through to December 2017 totalling €407 million, each based on an increased dividend rate of €0.21 per share. During the year ended 31 December 2016, two dividend payments were made on previously outstanding CCE shares totalling US$136 million, or €122 million, based on a dividend rate of US$0.30 per share. Subsequent to the Merger, in September 2016, the Company’s Board of Directors authorised a dividend of €0.17 per share, totalling €82 million, which was paid in October 2016.
Note 10
CONTINGENT LIABILITIES
As at 31 December 2017 the Company does not have any material contingent liabilities.
Note 11
AUDITORS REMUNERATION
Refer to Note 16 of the consolidated financial statements for details of the remuneration of the Company’s auditor on a group basis.
Note 12
DIRECTORS REMUNERATION
Refer to the Directors Remuneration Report for details of the remuneration of the Company’s Directors on a group basis.
Note 13
EMPLOYEE NUMBERS AND COSTS
Refer to Note 16 of the
consolidated financial statements
for details of employee numbers and costs on a group basis.
Note 14
SIGNIFICANT EVENTS AFTER THE REPORTING PERIOD
A dividend of €
0.26
per share for the first quarter 2018 was authorised by the Company’s Board of Directors in February 2018 and will be paid on 15 March 2018.
In March 2018, the Group initiated a debt and capital structure simplification project. Coca-Cola European Partners US LLC (CCEP US LLC), a wholly owned subsidiary of the Company, requested consent from eligible external noteholders to modify certain non-economic terms of USD and EUR notes currently issued by CCEP US LLC. As at 31 December 2017, CCEP US LLC held notes with principal value of USD 1,075 million and €1,800 million. To the extent the proposals are accepted, the affected notes will be transferred from CCEP US LLC to the Company. In connection with this activity, there will be a corresponding change in the amounts owed to affiliates. As such, the net impact on the Company’s financial position is expected to be immaterial.
This page does not form part of Coca-Cola European Partners plc Annual Report on Form 20-F for the year ended 31 December 2017 as filed with the SEC
|
|
P a g e |
172
|
OTHER GROUP INFORMATION
Shareholder information
The Company was incorporated in England and Wales on 4 August 2015, as a private company under the Companies Act 2006 (the Companies Act). On 4 May 2016, the Company was reregistered as a public company limited by shares and changed its name from Coca-Cola European Partners Limited to Coca-Cola European Partners plc (CCEP). The Company is registered at Companies House, Cardiff, under company number 9717350. The business address for Directors and senior management is Pemberton House, Bakers Road, Uxbridge, UB8 1EZ, England. The main switchboard telephone number is 01895 231313.
The Company was formed through the combination of the businesses of Coca-Cola Enterprises, Inc. (CCE), Coca-Cola Iberian Partners, S.A. (CCIP) and Coca-Cola Erfrischungsgetränke GmbH (CCEG).
The Company is resident in the UK for tax purposes and its primary objective is to sell, make and distribute ready to drink beverages.
Annual General Meeting
The Company’s 2018 Annual General Meeting (AGM) will be held at 11.00am at 22 Duchess Mews, London W1G 9DT on 31 May 2018. Registered shareholders will be sent a Notice of AGM or notice of availability of the Notice of AGM closer to the time of the meeting.
Investor calendar
|
Ex-dividend date for interim Q1 dividend
|
26 February 2018
|
|
Record date for interim Q1 dividend
|
27 February 2018
|
|
Interim Q1 dividend payment date
|
15 March 2018
|
|
Expected ex-dividend date for Q2 interim dividend
|
11 May 2018
|
|
Expected record date for interim Q2 dividend
|
14 May 2018
|
|
Expected interim Q2 dividend payment date
|
29 May 2018
|
|
AGM
|
31 May 2018
|
|
Expected ex-dividend date for interim Q3 dividend
|
21 August 2018
|
|
Expected record date for interim Q3 dividend
|
22 August 2018
|
|
Expected interim Q3 dividend payment date
|
6 September 2018
|
|
Expected ex-dividend date for interim Q4 dividend
|
20 November 2018
|
|
Expected record date for interim Q4 dividend
|
21 November 2018
|
|
Expected interim Q4 dividend payment date
|
3 December 2018
|
Directors and senior management
Biographies of the Board of Directors and senior management are set out on pages 45 to 50. Sol Daurella and Alfonso Líbano Daurella are first cousins.
Service contracts and loss of office arrangements
It is the Remuneration Committee’s policy that there should be no element of reward for failure. When considering payments in the event of a loss of office, it takes account of the individual circumstances, including the reason for the loss of office, Group and individual performance, contractual obligations of both parties as well as share and pension plan rules.
Service contracts for Executive Directors provide for a notice period of not more than 12 months from the Company and not more than 12 months from the individual. The standard Executive Director service contract does not confer any right to additional payments in the event of termination although it does reserve the right for the Group to impose garden leave (i.e. leave with pay) on the Executive Director during any notice period. In the event of redundancy, benefits would be paid according to the Company’s UK redundancy policy prevailing at that time. Executive Directors may be eligible for a pro rata bonus for the period served, subject to performance, but no bonus will be paid in the event of gross misconduct. The treatment of unvested long-term incentive awards is governed by the rules of the relevant plan and depends upon the reasons for leaving. The cost of legal fees spent on reviewing a settlement agreement on departure may be provided where appropriate. The Company also reserves the right to pay for outplacement services as appropriate.
The Non-executive Directors (NEDs), including the Chairman of the Board, do not have service contracts but have letters of appointment. NEDs are not entitled to compensation on leaving the Board.
Directors and senior management interest in Shares
Other than Sol Daurella, Alfonso Líbano Daurella, and José Ignacio Comenge Sánchez-Real, who owned 6.7% (32,312,263 Shares), 1.3% (6,493,803 Shares), and 1.6% (7,728,413 Shares) of the Shares outstanding as of 28 February 2018, respectively, no Director or member of senior management individually owned more than 1% of the Company’s Shares as of 28 February
2018.
Table 1 shows, as at 28 February
2018, the number of share options held by Directors and other members of senior management, including the applicable exercise price and the expiration date of the period when the applicable exercise period ends.
|
|
P a g e |
173
|
Table 1: Share options held by Directors and other members of senior management as at 28 February 2018
|
Name
|
Grant Date
|
Expiry Date
|
Exercise Price
|
|
Total number of shares subject to outstanding options including exercisable and unvested options
|
|
|
|
Damian Gammell
|
5 November 2015
|
5 November 2025
|
$
|
39.00
|
|
324,643
|
|
|
Stephen Moorhouse
|
3 November 2011
|
3 November 2021
|
$
|
19.68
|
|
17,155
|
|
|
Stephen Moorhouse
|
31 October 2013
|
31 October 2023
|
$
|
31.46
|
|
11,446
|
|
|
Stephen Moorhouse
|
30 October 2014
|
30 October 2024
|
$
|
32.51
|
|
1,476
|
|
|
Stephen Moorhouse
|
30 October 2014
|
30 October 2024
|
$
|
32.51
|
|
9,598
|
|
|
Lauren Sayeski
|
31 October 2013
|
31 October 2023
|
$
|
31.46
|
|
1,517
|
|
|
Lauren Sayeski
|
31 October 2013
|
31 October 2023
|
$
|
31.46
|
|
1,661
|
|
|
Ron Lewis
|
5 November 2015
|
5 November 2025
|
$
|
39.00
|
|
81,194
|
|
|
Nik Jhangiani
|
5 November 2012
|
5 November 2022
|
$
|
23.21
|
|
2,064
|
|
|
Nik Jhangiani
|
5 November 2012
|
5 November 2022
|
$
|
23.21
|
|
23,790
|
|
|
Nik Jhangiani
|
31 October 2013
|
31 October 2023
|
$
|
31.46
|
|
84,643
|
|
|
Nik Jhangiani
|
30 October 2014
|
30 October 2024
|
$
|
32.51
|
|
101,757
|
|
|
Nik Jhangiani
|
5 November 2015
|
5 November 2025
|
$
|
39.00
|
|
81,194
|
|
Other employee related matters
Note 16 to the consolidated financial statements provides a breakdown of employees by main category of activity. As at 31 December 2017 we had approximately 23,500 employees, of whom approximately 11 were located in the US. A number of our employees in Europe are covered by collectively bargained labour agreements, most of which do not expire. However, wage rates must be renegotiated at various dates throughout 2018. We believe we will be able to renegotiate these wage rates with satisfactory terms.
Nature of trading market
The Company has one class of ordinary shares. These Shares are traded on the New York Stock Exchange, Euronext London and Amsterdam, and the Spanish Stock Exchanges.
|
Listing Information
|
|
|
Ticker symbol (all exchanges)
|
CCE
|
|
ISIN Code
|
GB00BDCPN049
|
|
Legal Entity Identifier
|
549300LTH67W4GWMRF57
|
|
CUSIP
|
G25839104
|
|
SEDOL Number
|
BDCPN04
|
Share capital
The Articles of Association of the Company (the Articles) contain no upper limit on the authorised share capital of the Company. Subject to certain limitations under the Shareholders’ Agreement, the Board has the authority to offer, allot, grant options over or otherwise deal with or dispose of shares to such persons, at such times, for such consideration and upon such terms as the Board may decide, only if approved by ordinary resolution of our shareholders.
As of 31 December 2017, the Company had 484,586,428 Shares issued and fully paid. As of 28 February 2018, the Company had 484,921,876 Shares issued and fully paid.
Under the Shareholders’ Agreement and the Articles, the Company is permitted to issue, or grant to any person rights to be issued, securities, in one or a series of related transactions, in each case representing 20% or more of our issued share capital, only if approved in advance by special resolution of our shareholders.
Pursuant to this authority, our shareholders have passed resolutions allowing a maximum of a further 337,986,971 Shares (as of 28 February 2018) to be allotted and issued, subject to the restrictions set out below:
|
1.
|
pursuant to a shareholder resolution passed on 26 May 2016, the Board is authorised to grant rights to subscribe for or to convert any security into, and/or allot and issue, Shares up to an aggregate maximum of 18,000,000 Shares in connection with the assumption or replacement by the Company of equity awards granted under certain CCE legacy share plans, of which 2,583,916 have been issued as of 28 February 2018;
|
|
2.
|
pursuant to a shareholder resolution passed on 22 June 2017 regarding the authority to allot new Shares, the Board is authorised to allot Shares and to grant rights to subscribe for or convert any security into Shares:
|
|
a.
|
up to a nominal amount of €1,612,854 (representing 161,285,444 Shares; such amount to be reduced by any allotments or grants made under paragraph 2(b) below in excess of such sum); and
|
|
|
P a g e |
174
|
|
b.
|
comprising equity securities (as defined in the Companies Act) up to a nominal amount of €3,225,709 (representing 322,570,887 Shares; such amount to be reduced by any allotments or grants made under paragraph 2(a) above) in connection with an offer by way of a rights issue:
|
|
i.
|
to ordinary shareholders in proportion (as nearly as may be practicable) to their existing holdings; and
|
|
ii.
|
to holders of other equity securities as required by the rights of those securities or as the Board otherwise considers necessary,
|
and so that the Board may impose any limits or restrictions and make any arrangements which it considers necessary or appropriate to deal with treasury shares, fractional entitlements, record dates, legal, regulatory or practical problems in, or under the laws of, any territory or any other matter; and
|
3.
|
pursuant to a shareholder resolution passed on 22 June 2017 regarding authority to disapply pre-emption rights, the Board is authorised to allot equity securities (as defined in the Companies Act) for cash under the authority given by the shareholder resolution described in paragraph 2 above and/or to sell Shares held by the Company as treasury shares for cash as if section 561 of the Companies Act did not apply to any such allotment or sale, such power to be limited:
|
|
a.
|
to the allotment of equity securities and sale of treasury shares in connection with an offer of, or invitation to apply for, equity securities (but in the case of the authority granted under paragraph 2(b) above, by way of a rights issue only):
|
|
•
|
to ordinary shareholders in proportion (as nearly as may be practicable) to their existing holdings; and
|
|
•
|
to holders of other equity securities, as required by the rights of those securities, or as the Board otherwise considers necessary, and so that the Board may impose any limits or restrictions and make any arrangements which it considers necessary or appropriate to deal with treasury shares, fractional entitlements, record dates, legal, regulatory or practical problems in, or under the laws of, any territory or any other matter; and
|
|
b.
|
in the case of the authority granted under paragraph 2(a) above and/or in the case of any sale of treasury shares, to the allotment of equity securities or sale of treasury shares (otherwise than under paragraph 3(a) above) up to a nominal amount of €241,928 (representing 24,192,817 Shares).
|
Immediately prior to the Merger on 28 May 2016, there were 228,244,244 shares of $0.01 par value of CCE common stock issued and fully paid, which included net issuances of 908,456 related to share-based payment awards from 1 January 2016 through 27 May 2016. In connection with the Merger, all CCE shares were cancelled and replaced with Shares in CCEP. Additionally, CCEP issued 166,128,987 Shares to Olive Partners, S.A. (Olive Partners) and 87,950,640 Shares to European Refreshments (ER), Coca-Cola GmbH and Vivaqa Beteiligungs GmbH & Co. KG as consideration to acquire their bottling operations. Subsequent to the Merger, those of the 87,950,640 Shares held by Coca-Cola GmbH and Vivaqa Beteiligungs GmbH & Co. KG were transferred to ER. Also subsequent to the Merger, up to and including 31 December 2017, CCEP issued 2,262,557 additional Shares related to share-based payment awards. Between 1 January 2018 and 28 February 2018, CCEP issued 335,448 additional Shares related to share-based payment awards.
Shares not representing capital
None.
Shares held by CCEP
We are not permitted under English law to hold our own Shares unless they are repurchased by us and held in treasury. Since the Merger, there have been no Share repurchases; however, at our 2017 AGM, our shareholders passed a special resolution which allows us to buy back our own Shares in the market as permitted by the Companies Act. The Board has no present intention of exercising the authority to make market purchases, other than to offset the dilutive effect of the issue of new Shares under our share plans. However, we consider it to be desirable to have the general authority to do so in order to have maximum flexibility in managing our capital resources. The Board will exercise this authority (other than for the limited anti dilutive purpose described above) only when to do so would be in the best interests of the Company, and our shareholders generally, and could be expected to result in an increase in our earnings per share.
Share-based payment awards
Table 2 on page 175 shows the share-based payment awards outstanding under each of the CCE Legacy Long-Term Incentive Plan (Legacy LTIP), the CCE 2010 Incentive Award Plan (2010 Plan) and the Long-Term Incentive Plan 2016 (CCEP LTIP) as at 31 December 2017 and 28 February 2018.
Further details regarding the share plans and awards granted can be found in Note 20 to the consolidated financial statements on pages 151 to 153.
History of share capital
Table 3 on page 176 sets forth the history of our share capital for the period from the Merger until 28 February 2018.
|
|
P a g e |
175
|
Table 2: Outstanding share-based payment awards
|
Plan
|
Date of award
(dd/mm/yy)
|
Type of award
(A)
|
Total number of Shares awarded to employees outstanding as at 31 December 2017
|
Total number of Shares awarded to employees outstanding as at 28 February 2018
|
Price per Share payable on exercise/
transfer ($)
|
|
Expiration date
(dd/mm/yy)
|
|
Legacy LTIP
|
30/10/08
|
Option
|
918,361
|
675,997
|
5.09
|
|
30/10/18
|
|
10/11/08
|
Option
|
7,982
|
7,982
|
5.24
|
|
10/11/18
|
|
|
04/11/09
|
Option
|
1,048,451
|
1,048,451
|
9.89
|
|
04/11/19
|
|
|
13/11/09
|
Option
|
11,929
|
11,929
|
10.46
|
|
13/11/19
|
|
|
2010 Plan
|
04/11/10
|
Option
|
761,720
|
683,180
|
18.40
|
|
04/11/20
|
|
12/11/10
|
Option
|
1,142
|
1,142
|
18.80
|
|
10/05/18
|
|
|
12/11/10
|
Option
|
1,018
|
1,018
|
18.80
|
|
17/05/18
|
|
|
12/11/10
|
Option
|
12,311
|
12,311
|
18.80
|
|
12/05/20
|
|
|
03/11/11
|
Option
|
910,512
|
910,512
|
19.68
|
|
03/11/21
|
|
|
14/11/11
|
Option
|
1,239
|
1,239
|
19.82
|
|
10/05/18
|
|
|
14/11/11
|
Option
|
1,143
|
1,143
|
19.82
|
|
17/05/18
|
|
|
14/11/11
|
Option
|
18,373
|
18,373
|
19.82
|
|
14/05/21
|
|
|
05/11/12
|
Option
|
1,936
|
1,936
|
23.21
|
|
17/05/18
|
|
|
05/11/12
|
Option
|
1,172,553
|
1,172,553
|
23.21
|
|
05/11/22
|
|
|
31/10/13
|
Option
|
955
|
0
|
31.46
|
|
15/02/18
|
|
|
31/10/13
|
Option
|
1,114
|
1,114
|
31.46
|
|
10/05/18
|
|
|
31/10/13
|
Option
|
1,273
|
1,273
|
31.46
|
|
17/05/18
|
|
|
31/10/13
|
Option
|
2,860
|
2,860
|
31.46
|
|
15/05/20
|
|
|
31/10/13
|
Option
|
827
|
827
|
31.46
|
|
22/11/20
|
|
|
31/10/13
|
Option
|
1,152,546
|
1,152,546
|
31.46
|
|
31/10/23
|
|
|
30/10/14
|
Option
|
1,077
|
1,077
|
32.51
|
|
10/05/18
|
|
|
30/10/14
|
Option
|
1,231
|
1,231
|
32.51
|
|
17/05/18
|
|
|
30/10/14
|
Option
|
143
|
143
|
32.51
|
|
31/05/19
|
|
|
30/10/14
|
Option
|
3,566
|
3,566
|
32.51
|
|
15/05/20
|
|
|
30/10/14
|
Option
|
923
|
923
|
32.51
|
|
22/11/20
|
|
|
30/10/14
|
Option
|
1,348,545
|
1,348,545
|
32.51
|
|
30/10/24
|
|
|
30/10/14
|
PSU
|
315,322
|
311,960
|
Nil
|
|
30/04/18
|
|
|
01/05/15
|
RSU
|
15,200
|
15,200
|
Nil
|
|
01/05/18
|
|
|
03/08/15
|
PSU
|
337
|
337
|
Nil
|
|
30/04/18
|
|
|
03/08/15
|
RSU
|
512
|
512
|
Nil
|
|
03/08/18
|
|
|
02/11/15
|
RSU
|
39,000
|
39,000
|
Nil
|
|
12/10/18
|
|
|
05/11/15
|
Option
|
1,195,618
|
1,195,618
|
39.00
|
|
05/11/25
|
|
|
05/11/15
|
PSU
|
325,632
|
322,732
|
Nil
|
|
30/04/19
|
|
|
05/11/15
|
RSU
|
107,952
|
105,052
|
Nil
|
|
05/11/18
|
|
|
CCEP LTIP
|
03/10/16
|
RSU
|
33,333
|
33,333
|
Nil
|
|
03/10/20
|
|
01/12/16
|
RSU
|
26,328
|
26,328
|
Nil
|
|
01/12/19
|
|
|
27/03/17
|
PSU
|
411,375
|
407,681
|
Nil
|
|
28/03/20
|
|
|
27/03/17
|
RSU
|
104,375
|
100,669
|
Nil
|
|
28/03/20
|
|
|
01/09/17
|
RSU
|
26,620
|
26,620
|
Nil
|
|
28/03/20
|
|
(A)
PSU is Performance Share Unit. RSU is Restricted Share Unit.
|
|
P a g e |
176
|
Table 3: Share capital history
|
Period
|
Nature of Share issuance
|
Number of Shares
|
Consideration
|
Cumulative balance of issued Shares at end of period
|
|
At Merger
|
Opening balance
|
482,323,871
|
N/A
|
482,323,871
|
|
Merger to
31 December 2016
|
Shares issued in connection with the exercise of stock options
|
459,148
|
Exercise price per Share ranging from $11.27 to $32.51
|
482,783,019
|
|
Merger to
31 December 2016
|
Shares issued in connection with the fulfilment of RSU and PSU share-based payment awards
|
293,377
|
Nil
|
483,076,396
|
|
1 January to
31 December 2017
|
Shares issued in connection with the exercise of stock options
|
838,486
|
Exercise price per Share ranging from $5.09 to $32.51
|
483,914,882
|
|
1 January to
31 December 2017
|
Shares issued in connection with the fulfilment of RSU and PSU share-based payment awards
|
671,546
|
Nil
|
484,586,428
|
|
1 January to
28 February 2018
|
Shares issued in connection with the exercise of stock options
|
325,359
|
Exercise price per Share ranging from $5.09 to $32.51
|
484,911,787
|
|
1 January to
28 February 2018
|
Shares issued in connection with the fulfilment of RSU and PSU share-based payment awards
|
10,089
|
Nil
|
484,921,876
|
US shareholders
As at 28 February 2018 to the knowledge of the Company, Shares were held by 203 holders of record with an address in the US who held a total of 484,851,661 Shares or 99.98% of the total number of issued Shares outstanding. However, some Shares are registered in the names of nominees, meaning that the number of shareholders with registered addresses in the US may not be representative of the number of beneficial owners of Shares resident in the US.
High and low Share prices
The table below shows the high and low prices of the Company’s Shares taken directly from Euronext Amsterdam and the NYSE.
|
Euronext Amsterdam
|
NYSE
|
||||
|
Period
|
High (€)
|
Low (€)
|
High ($)
|
Low ($)
|
|
|
Annually
|
|||||
|
2018
(1 Jan to 9 Mar)
|
€33.52
|
€29.86
|
$41.22
|
$36.17
|
|
|
2017
|
€38.94
|
€29.715
|
$44.75
|
$31.09
|
|
|
2016
(28 May to 31 Dec)
|
€36.55
|
€28.75
|
$41.285
|
$30.55
|
|
|
Quarterly
|
|||||
|
Q1 2018
(1 Jan to 9 Mar)
|
€33.52
|
€29.86
|
$41.22
|
$36.17
|
|
|
Q4 2017
|
€35.995
|
€31.985
|
$42.26
|
$37.40
|
|
|
Q3 2017
|
€38.94
|
€33.78
|
$44.75
|
$40.15
|
|
|
Q2 2017
|
€37.60
|
€34.05
|
$41.56
|
$36.93
|
|
|
Q1 2017
|
€35.49
|
€29.715
|
$38.235
|
$31.09
|
|
|
Q4 2016
|
€35.94
|
€28.75
|
$40.01
|
$30.55
|
|
|
Q3 2016
|
€36.48
|
€30.92
|
$41.285
|
$34.22
|
|
|
Q2 2016
(28 May to 30 Jun)
|
€36.55
|
€30.42
|
$40.3455
|
$33.67
|
|
|
Monthly
|
|||||
|
1 to 9 March 2018
|
€33.52
|
€30.54
|
$41.22
|
$37.43
|
|
|
February 2018
|
€33.00
|
€29.86
|
$40.06
|
$36.17
|
|
|
January 2018
|
€33.14
|
€31.26
|
$41.13
|
$38.30
|
|
|
December 2017
|
€33.925
|
€32.42
|
$40.17
|
$38.56
|
|
|
November 2017
|
€35.355
|
€31.985
|
$40.94
|
$37.40
|
|
|
October 2017
|
€35.995
|
€34.405
|
$42.26
|
$39.97
|
|
|
September 2017
|
€37.15
|
€33.78
|
$44.139
|
$40.21
|
|
|
|
P a g e |
177
|
Agent for service of process in the US
The Corporation Trust Company Corporation Trust Center 1209 Orange Street Wilmington, DE 19801
Marketing
The Group relies extensively on advertising and sales promotions in marketing its products. TCCC and other licensors that supply concentrates, syrups and finished products to the Group advertise in all major media to promote sales in the local areas served by the Group. The Group also benefits from regional, local and global advertising programmes conducted by TCCC and other licensors. Certain of the advertising expenditures by TCCC and other licensors are made pursuant to annual arrangements.
The Group and TCCC engage in a variety of marketing programmes to promote the sale of TCCC’s products in territories in which the Group operates. The amounts to be paid to the Group by TCCC under the programmes are determined annually and are periodically reassessed as the programmes progress. Marketing support funding programmes entered into with TCCC provide financial support, principally based on the Group’s product sales or upon the completion of stated requirements, to offset a portion of the Group’s costs of the marketing programmes. Except in certain limited circumstances, TCCC has no specified contractual obligation to participate in expenditures for advertising, marketing and other support in the Group’s territories. The terms of similar programmes TCCC may have with other licensees and the amounts paid by TCCC under them could differ from the Group’s arrangements.
The Group participates in various programmes and arrangements with customers designed to increase the sale of products. Among the programmes are arrangements under which allowances can be earned by customers for attaining agreed-upon sales levels or for participating in specific marketing programmes.
Dependence on franchisors
As a franchise business, CCEP’s business success, including its financial results, depends upon CCEP’s relationships with TCCC and its other franchisors.
Further information is set out in the Risk Factors section earlier in this document.
Competition
The market for non-alcoholic beverages is highly competitive. The Group faces competitors that differ within individual categories in our territories. Moreover, competition exists not only within the non-alcoholic beverage market, but also between the non-alcoholic and alcoholic markets.
The most significant competitive factors impacting the Group’s business include advertising and marketing, brand image, product offerings that meet consumer preferences and trends, new product and package innovations, pricing and cost inputs. Other competitive factors include supply chain (procurement, manufacturing, and distribution) and sales methods, merchandising productivity, customer service, trade and community relationships and the management of sales and promotional activities. Management of cold-drink equipment, including coolers and vending machines, is also a competitive factor. We believe our most favourable competitive factor is the consumer and customer goodwill associated with our brand portfolio.
The Group faces strong competition from companies that produce and sell competing products to a retail sector that is consolidating and in which buyers are able to choose freely between our products and those of our competitors. Our competitors include the local bottlers and distributors of competing products and manufacturers of private-label products. For example, we compete with bottlers and distributors of products of PepsiCo, Inc., Nestlé S.A., Groupe Danone S.A. and other private-label products, including those of certain of our customers. In certain of our territories, we sell products against which we compete in other territories. However, in all of our territories, our primary business is selling, making and distributing products of TCCC.
Impact of governmental regulation
Our business is dependent upon the economic conditions prevailing in our countries of operation. Various governmental economic, fiscal, monetary and political policies, such as those related to inflation or foreign exchange, may affect these economic conditions, and in turn may impact our business.
In addition, many of the Group’s products are subject to various laws and regulations of the countries in which the Group operates that regulate the production, packaging, sale, safety, advertising, labelling and ingredients of our products. There are also specific taxes on certain beverage products in certain territories in which the Group does business.
|
|
P a g e |
178
|
Packaging
The European Commission has a packaging and packing waste directive that has been incorporated into the national legislation of the European Union (EU) member states in which CCEP does business. The weight of packages collected and sent for recycling (inside or outside the EU) in the countries in which CCEP operates must meet certain minimum targets, depending on the type of packaging. The legislation sets targets for the recovery and recycling of household, commercial, and industrial packaging waste and imposes substantial responsibilities on bottlers and retailers for implementation. In the Netherlands, CCEP includes approximately 25% recycled content in its recyclable plastic bottles, in accordance with an agreement it has with the government. In compliance with national regulation within the sparkling beverage industry, CCEP charges its customers in the Netherlands a deposit on all containers greater than a 1⁄2 litre, which is refunded to them if and when the containers are returned. Container deposit schemes also exist in Norway (which is part of the EEA but is not
an EU member state) and Sweden, under which a deposit fee is included in the consumer price, which is refunded to them if and when the container is returned. The Norwegian government further imposes two types of packaging taxes: (1) a base tax and (2) an environmental tax calculated against the amount returned. The Norwegian base tax applies only to one-way packages such as cans and non-returnable PET (plastic) that may not be used again in their original form. In Germany, a container deposit scheme exists for cans, bottles and cases under which a deposit fee is included in the consumer price, which is refunded if and when the containers are returned.
Environmental Regulations
Substantially all of CCEP’s facilities are subject to laws and regulations dealing with above-ground and underground fuel storage tanks and the discharge of materials into the environment. CCEP’s beverage manufacturing operations do not use or generate a significant amount of toxic or hazardous substances. CCEP believes its current practices and procedures for the control and disposition of such wastes comply with applicable laws in each of its territories.
CCEP is subject to, and operates in accordance with, the provisions of the EU Directive on Waste Electrical and Electronic Equipment (WEEE). Under the WEEE Directive, companies that put electrical and electronic equipment (such as its cold-drink equipment) on the EU market are responsible for the costs of collection, treatment, recovery, and disposal of their own products.
Trade regulation
Further, as the exclusive manufacturer and distributor of bottled and canned beverage products of TCCC and other manufacturers within specified geographic territories, the Group is subject to antitrust laws of general applicability. EU rules adopted by the European countries in which the Group does business preclude restriction of the free movement of goods among the member states. As a result, the product licensing and bottling agreements grant the Group exclusive bottling territories, subject to the exception that other EEA bottlers of Coca-Cola trademark beverages and allied beverages can, in response to unsolicited orders, sell such products in the Group’s European territories (as the Group can in their territories).
For further details of the specific taxes on beverage products in certain territories in which the Group does business, and for a discussion of other political factors and governmental, economic, fiscal and monetary policies that could materially affect investments by US shareholders as well as our operations, please refer to Risk Factors, starting on page 29, and Taxation information for shareholders on pages 183 to 185.
Material contracts
There have been no material contracts outside the ordinary course of business to which the Company or any of its subsidiaries is a party in the last two years other than as set out below. The Merger and the related transactions, and the payment of consideration in connection with such transactions, are collectively referred to as the “Combination Transactions”.
The Merger Agreement
The Merger Agreement, dated 6 August 2015, by and among the Company, CCE, Coca-Cola European Partners Holdings US, Inc., formerly known as Orange U.S. HoldCo, LLC (HoldCo), and Coca-Cola European Partners US, LLC, formerly known as Orange MergeCo, LLC (MergeCo) provided that CCE would merge with and into MergeCo, with MergeCo continuing as the surviving company and an indirect wholly owned subsidiary of the Company. The Merger was part of the combination of CCE and the companies that own the Coca-Cola bottling operations in Germany, the Iberian region (i.e. Spain, Portugal and Andorra) and Iceland under the Company.
|
|
P a g e |
179
|
The Transaction Master Agreement
The Transaction Master Agreement, dated 6 August 2015, between the Company, CCE, MergeCo, HoldCo, ER, Coca-Cola GmbH, Vivaqa Beteiligungs GmbH & Co. KG and CCIP, sets out the terms and conditions of the Combination Transactions whereby ER, Coca-Cola GmbH and Vivaqa Beteiligungs GmbH & Co. KG, CCE and Olive Partners combined their NARTD beverage bottling business in Western Europe by combining CCE, CCIP and CCEG through the Merger, a share exchange between the Company and Olive Partners, the terms of which are set forth in the Olive Contribution Agreement incorporated by reference into this Annual Report on Form 20-F, and a share exchange between the Company and European Refreshments, Coca-Cola GmbH and Vivaqa Beteiligungs GmbH & Co. KG, the terms of which are set out in the Black Contribution Agreement incorporated by reference into this Annual Report on Form 20-F.
The Olive Framework Agreement
The Olive Framework Agreement, dated 30 July 2015, by CCIP and certain holders of its outstanding shares, governed the participation of CCIP shareholders in the Combination Transactions, including, among other matters (a) a corporate reorganisation of the CCIP group required prior to the completion of the Merger; (b) the adjustments to be made to the CCIP bottling business to be contributed to the Company; (c) the process by which CCIP shareholders who elected not to participate in the Combination Transactions could sell their CCIP shares to other CCIP shareholders (or to CCIP) at a set price; and (d) the corporate resolutions required for CCIP and Olive Partners to participate in the Combination Transactions and the commitment of the CCIP shareholders who were party to the Olive Framework Agreement to vote in favour of such resolutions. ER, Coca-Cola GmbH and Vivaqa Beteiligungs GmbH & Co. KG, CCE and the Company were third-party beneficiaries of certain obligations of the parties to the Olive Framework Agreement.
The Shareholders’ Agreement
The Shareholders’ Agreement regulates certain aspects of the affairs and governance of the Company as between the Company, Olive Partners and ER. The Shareholders’ Agreement sets out the initial nominees to the Board, including the Independent Non-executive Directors who were appointed to the Company’s Board on completion of the Merger (the Initial INEDs), terms relating to subsequent nominations to the Board and other matters relating to the governance of the Company.
The Registration Rights Agreement
The Registration Rights Agreement governs the respective rights and obligations of the Company, ER, Coca-Cola GmbH and Vivaqa Beteiligungs GmbH & Co. KG and Olive Partners with respect to the registration for resale by ER, Coca-Cola GmbH and Vivaqa Beteiligungs GmbH & Co. KG and Olive Partners and certain of their respective affiliates and transferees of the Company’s Shares following the Combination Transactions.
Copies of material contracts
For further details regarding the Merger Agreement, the Transaction Master Agreement, the Olive Contribution Agreement, the Black Contribution Agreement, the Olive Framework Agreement, the Shareholders’ Agreement and the Registration Rights Agreement, please refer to the Company’s Amendment No. 4 to its Form F-4 Registration Statement filed with the SEC on 11 April 2016. They have all been filed as exhibits to the 2017 Annual Report on Form 20-F filed with the SEC.
Articles of Association
The following is a summary of the principal provisions of the Company’s Articles of Association (the Articles). Shareholders should not rely on this summary but should instead refer to the current Articles, which are filed with the Registrar of Companies in England and Wales and can be viewed on CCEP’s website http://ir.ccep.com/corporate-governance/governance-documents, and to the applicable provisions of English law. The Company has no statement of objects in its Articles and accordingly its objects are unrestricted in accordance with the provisions of the Companies Act.
(a) Voting
Any resolution put to a vote at a general meeting will be decided on a show of hands unless a poll is validly demanded. On a poll, every shareholder who is present in person or by proxy shall have one vote for every share of which he or she is the holder. In the case of joint holders of a share, the vote of the senior holder who tenders a vote, whether in person or by proxy, shall be accepted to the exclusion of the votes of the other joint holders, and seniority shall be determined by the order in which the names stand on the register. Unless the Board otherwise decides, the right to attend a general meeting and voting rights may not be exercised by a shareholder who has not paid to the Company all calls and other sums then payable by him or her in respect of his or her shares.
(b) Transfer of shares
Any shareholder may transfer his or her shares which are in certificated form by an instrument of transfer in any usual form or in any other form which the Board may approve. Such instrument must be properly signed and stamped or certified (or otherwise shown to the satisfaction of the Board as being exempt from stamp duty) and lodged with the Company together with the relevant share certificate(s) and such other evidence as the Board may reasonably require to show the right of the transferor to make the transfer.
|
|
P a g e |
180
|
The Articles contain no other restrictions on the transfer of fully paid certificated shares provided: (i) the transfer, if to joint transferees, is in favour of not more than four transferees; (ii) the instrument of transfer is in respect of only one class of shares; and (iii) the holder of the shares is not subject to an order under Section 794 of the Companies Act.
Any shareholder may transfer title to his or her uncertificated shares by means of a relevant system, such as CREST.
Registration of a transfer of uncertificated shares may be refused in the circumstances set out in the uncertificated securities rules and where, in the case of a transfer to joint holders, the number of joint holders to whom the uncertificated share is to be transferred exceeds four.
Provisions in the Articles will not apply to uncertificated shares to the extent that they are inconsistent with:
|
i.
|
the holding of shares in uncertificated form;
|
|
ii.
|
the transfer of title to shares by means of a system such as CREST; and
|
|
iii.
|
any provisions of relevant regulations.
|
The Board may decline to register a transfer of shares, whether certificated or uncertificated, by a person holding 0.25% or more of the existing shares if such person is subject to an order under section 794 of the Companies Act, after failure to provide the Company with information concerning interests in those shares required to be provided under section 793 of the Companies Act, unless the transfer is carried out pursuant to an arm’s length sale.
Notice of refusal to register a transfer must be sent to the transferee within two months of the instrument of transfer being lodged.
The transferor of a share is deemed to remain the holder until the transferee’s name is entered on the register. The Board may decline to register any transfer of any share which is not fully paid.
(c) Dividends and distribution of assets on liquidation
Under English law, the Company may pay dividends only out of profits available for that purpose, as stated on its accounts that are deemed as relevant accounts pursuant to the Companies Act. A company’s profits available for distribution are its accumulated, realised profits, so far as not previously utilised by distribution or capitalisation, less its accumulated, realised losses, so far as not previously written off in a reduction or reorganisation of capital duly made. In addition, the Company may only make a distribution if the amount of its net assets is not less than the aggregate of its called up share capital and undistributable reserves, and if, and to the extent that, the distribution does not reduce the amount of those assets to less than that aggregate.
The Articles permit the shareholders, by passing an ordinary resolution, to declare dividends. A declaration must not be made unless the Directors have first made a recommendation as to the amount of the dividend. The dividend must not exceed that amount.
In addition, the Board may decide to pay interim dividends. As the Company has only one class of shares, the holders of such shares will be entitled to participate in any surplus assets in a winding-up in proportion to their shareholdings.
(d) Unclaimed dividends
All dividends or other sums payable on or in respect of any shares which remain unclaimed may be invested or otherwise made use of by the Board for the benefit of the Company until claimed. Unless the Board decides otherwise, any dividend or other sums payable on or in respect of any shares unclaimed after a period of 12 years from the date when it was declared or became due for payment will be forfeited and revert to the Company. The Company may stop sending dividend cheques or warrants by post, or employing such other means of payment in respect of any shares, if at least two consecutive dividend payments have remained uncashed or are returned undelivered or if one payment has remained uncashed or is returned undelivered and the Company cannot establish a new address for the holder after making reasonable enquiries. However, in either case, the Company must resume sending cheques or warrants or employ such other means of dividend payment if the holder or any person entitled to the shares by transmission requests the resumption in writing.
(e) Variation of rights and changes in capital
Subject to the provisions of the Companies Act, all or any of the rights attached to any existing class of shares may from time to time (whether or not the Company is being wound up) be varied either with the consent in writing of the holders of not less than three-fourths in nominal value of the issued shares of that class (excluding any shares of that class held as treasury shares) or with the sanction of a special resolution passed at a separate general meeting of the holders of those shares. All the provisions of the Articles as to general meetings of the Company shall, with any necessary modifications, apply to any such separate general meeting, but so that the necessary quorum shall be one person entitled to vote and holding or representing by proxy not less than one-third in nominal value of the issued shares of the class (excluding any shares of that class held as treasury shares), (but so that at any adjourned meeting one holder entitled to vote and present in person or by proxy (whatever the number of shares held by him) shall be a quorum), and that any holder of shares of the class present in person or by proxy and entitled to vote may demand a poll.
|
|
P a g e |
181
|
The rights conferred upon the holders of any shares shall not, unless otherwise expressly provided in the rights attaching to those shares, be deemed to be varied by the creation or issue of further shares ranking pari passu with them or by the purchase or redemption by the Company of any of its own shares.
(f) Limitations on rights of non-resident or foreign shareholders
There are no limitations imposed by the Articles on the rights of non-resident or foreign shareholders or (subject to the effect of any economic sanctions that may be in force from time to time) by current UK laws which relate only to non-residents of the UK or foreign shareholders and which limit the rights of such non-resident or foreign shareholders to hold or (when entitled to do so) vote the shares.
(g) General meetings of shareholders
The Companies Act sets out the provisions applicable to the Company regarding the calling of a general meeting. The Company is required by the Companies Act to hold an AGM each year. General meetings of shareholders may be called as necessary by the Board and must be called promptly upon receipt of a requisition from shareholders representing at least 5% of the paid up, voting capital of the Company. Under the Companies Act, an AGM must be called by notice of at least 21 clear days. A general meeting other than an AGM may be called on not less than 14 clear days’ notice provided a special resolution reducing the notice period to 14 clear days has been passed at the immediately preceding AGM or a general meeting held since that AGM.
(h) Conflicts of interest
The Board may, subject to the provisions of the Articles, authorise any matter which would otherwise involve a Director breaching his or her duty under the Companies Act to avoid conflicts of interest (each a Conflict). A Director seeking authorisation in respect of a Conflict shall declare to the Board the nature and extent of his or her Conflict as soon as is reasonably practicable and shall provide the Board with such details of the matter as are necessary to decide how to address the Conflict. The Board may resolve to authorise the relevant Director in relation to any matter the subject of a Conflict, save that the relevant Director and any other Director with a similar interest shall not count towards the quorum nor vote on any resolution giving such authority, and, if the other Directors so decide, shall be excluded from any Board meeting while the Conflict is under consideration.
(i) Other conflicts of interest
Subject to the provisions of the Companies Act, and provided the nature and extent of a Director’s interest has been declared to the Board, a Director may:
|
i.
|
be party to, or otherwise interested in, any contract with the Company, or in which the Company has a direct or indirect interest;
|
|
ii.
|
hold any other office or place of profit with the Company (except that of auditor) in conjunction with his office of Director for such period and upon such terms, including remuneration, as the Board may decide;
|
|
iii.
|
act by himself or through a firm with which he is associated in a professional capacity for the Company or any other company in which the Company may be interested (otherwise than as auditor);
|
|
iv.
|
be or become a director or other officer of, or employed by or a party to a transaction or arrangement with, or otherwise be interested in any holding company or subsidiary company of the Company or any other company in which the Company may be interested; and
|
|
v.
|
be or become a director of any other company in which the Company does not have an interest and which cannot reasonably be regarded as giving rise to a conflict of interest at the time of his appointment as director of that other company.
|
No contract in which a Director is interested shall be liable to be avoided, and any Director who is so interested is not liable to account to the Company or its shareholders for any benefit realised by the contract by reason of the Director holding that office or of the fiduciary relationship thereby established. However, no Director may vote on, or be counted in the quorum, in relation to any resolution of the Board relating specifically to his or her own appointment (including remuneration) or the terms of his or her termination of appointment or relating to any contract in which he or she has an interest (subject to certain exceptions).
Subject to the Companies Act, the Company may by ordinary resolution suspend or relax to any extent the provisions relating to Directors’ interests or restrictions on voting or ratify any transaction not duly authorised by reason of a contravention of such provisions.
(j) Borrowing powers
Subject to the provisions of the Companies Act, the Board may exercise all the Company’s powers to borrow money; to mortgage or charge all or any of the Company’s undertaking, property (present and future), and uncalled capital; to issue debentures and other securities; and to give security either outright or as collateral security for any debt, liability or obligation of the Company or of any third party.
|
|
P a g e |
182
|
(k) Retirement and removal of Directors
At every AGM all the Directors, other than the Initial INEDs, shall retire from office and may offer themselves for re-appointment by the shareholders. This requirement does not apply to the Chairman during the nine year period after completion of the Merger for as long as she holds office in accordance with the Articles. Three Initial INEDs will stand for election at the AGM in 2019 and each AGM thereafter, an additional three Initial INEDs will stand for election at the Company’s AGM to be held in 2020 and each AGM thereafter, and finally the remaining three Initial INEDs will stand for election at the AGM to be held in 2021 and each AGM thereafter. There is no mandatory retirement age for any Director.
(l) Vacation of office
The office of a Director shall be vacated if:
|
i.
|
he or she resigns or offers to resign and the Board resolves to accept such offer;
|
|
ii.
|
he or she is prohibited by law from being a Director;
|
|
iii.
|
the Board determines that he or she has committed gross misconduct in carrying out his or her duties as a Director or for other similar just cause; or the Board determines that he or she has acted in breach of the Company’s anti corruption or sanctions polices, securities dealing policies or otherwise has acted in a manner which might reasonably be expected to bring the Group into disrepute;
|
|
iv.
|
being a nominated Director he or she is identified in a notice given to the Company by his or her appointer;
|
|
v.
|
being an INED he or she can no longer be considered to meet the criteria required for him or her to be independent, in the reasonable opinion of the Nomination Committee; or
|
|
vi.
|
being an INED the Board determines that he or she holds any operating responsibilities in the NARTD beverage bottling business in any territory in which the Group operates from time to time.
|
(m) Share rights
Subject to any rights attached to existing shares, shares may be issued with such rights and restrictions as the Company may by ordinary resolution decide, or (if there is no such resolution or so far as it does not make specific provision) as the Board may decide. Such rights and restrictions shall apply as if they were set out in the Articles. Redeemable shares may be issued, subject to any rights attached to existing shares. The Board may determine the terms, conditions and manner of redemption of any redeemable share so issued. Such terms and conditions shall apply to the relevant shares as if they were set out in the Articles. Subject to the Articles, any resolution passed by the shareholders and other shareholders’ rights, the Board may decide how to deal with any shares in the Company.
(n) Entrenchment
Certain provisions of the Articles are entrenched and may only be amended or repealed with the prior consent of Olive Partners, ER or a majority of the INEDs (as applicable). In particular, the requirement under the Articles that the Board shall at all times contain a majority of INEDs may only be amended or repealed with the prior consent of a majority of the INEDs .
Documents on display
The Company is subject to the information requirements of the US Securities Exchange Act of 1934, as amended, applicable to foreign private issuers. In accordance with these requirements, the Company files its Annual Report on Form 20-F and other related documents with the US Securities and Exchange Commission (SEC). It is possible to read and copy documents that have been filed by the Company with the SEC at the SEC’s office located at 100 F Street N.E., Washington, DC 20549-2736. Please call the SEC at 1-800-SEC-0330 for further information on the public reference rooms and their copy charges. Filings with the SEC are also available to the public from commercial document retrieval services, and from the website maintained by the SEC at www.sec.gov. The Company’s Annual Report on Form 20-F will also be available on its website (www.ccep.com) and details of how shareholders may order a hard copy, free of charge, are set out in the Useful Addresses section of this document.
Exchange controls
Other than those individuals and entities that are subject to economic sanctions which may be in force from time to time, we are not aware of any other legislative or other legal provision currently in force in the UK, the US, the Netherlands or Spain restricting remittances to non-resident holders of the Company’s shares or affecting the import or export of capital for use by the Company.
|
|
P a g e |
183
|
Taxation information for shareholders
US federal income taxation
US federal income tax consequences to US holders of the ownership and disposition of CCEP Shares
This section summarises the material US federal income tax consequences of owning Shares as capital assets for tax purposes. It is not, however, a comprehensive analysis of all the potential US tax consequences for such holders, and it does not discuss the tax consequences of members of special classes of holders which may be subject to other rules, including: tax exempt entities, life insurance companies, dealers in securities, traders in securities that elect a mark-to-market method of accounting for securities holdings, investors liable for alternative minimum tax, holders that, directly or indirectly, hold 10% or more of the Company’s voting stock, holders that hold Shares as part of a straddle or a hedging or conversion transaction, holders that purchase or sell Shares as part of a wash sale for US federal income tax purposes, or holders whose functional currency is not the US dollar. In addition, if a partnership holds Shares, the US federal income tax treatment of a partner will generally depend on the status of the partner and the tax treatment of the partnership and may not be described fully below. This summary also does not address any aspect of US federal taxation other than US federal income taxation (such as the estate and gift tax or the Medicare tax on net investment income). Investors should consult their tax advisers regarding the US federal, state, local and other tax consequences of owning and disposing of Shares in their particular circumstances.
This section is based on the Internal Revenue Code of 1986, as amended (the IRC), its legislative history, existing and proposed regulations, published rulings and court decisions, and on the United Kingdom-United States Tax Treaty, all of which are subject to change, possibly on a retroactive basis.
A US holder is a beneficial owner of Shares that is, for US federal income tax purposes, (i) a citizen or resident of the US, (ii) a US domestic corporation, (iii) an estate whose income is subject to US federal income taxation regardless of its source, or (iv) a trust if a US court can exercise primary supervision over the trust’s administration and one or more US persons are authorised to control all substantial decisions of the trust. A Non-US holder is a beneficial owner of Shares that is neither a US holder nor a partnership for US federal income tax purposes.
Taxation of dividends
Subject to the passive foreign investment company (PFIC) rules discussed below, a US holder is subject to US federal income taxation on the gross amount of any dividend paid by CCEP out of its current or accumulated earnings and profits (as determined for US federal income tax purposes). Dividends paid to a non-corporate US holder will generally constitute “qualified dividend income” and be taxable to the holder at a preferential rate, provided that the holder has a holding period in the Shares of more than 60 days during the 121 day period beginning 60 days before the ex-dividend date and meets other holding period requirements.
For US federal income tax purposes, a dividend must be included in income when the US holder actually or constructively receives the dividend. Dividends paid by CCEP to corporate US holders will generally not be eligible for the dividends-received deduction allowed to US corporations in respect of dividends received from other US corporations. For foreign tax credit purposes, dividends will generally be income from sources outside the US and will, depending on a US holder’s circumstances, be either “passive” or “general” income for purposes of computing the foreign tax credit allowable to a US holder.
The amount of a dividend distribution on Shares that is paid in a currency other than the US dollar will generally be taxable to a US holder as ordinary income in an amount equal to the US dollar value of the currency received on the date such dividend distribution is includible in income, regardless of whether the payment is, in fact, converted into US dollars on such date. Generally, any gain or loss resulting from currency exchange fluctuations during the period from the date the dividend payment is includible in income to the date the payment is converted into US dollars will be treated as ordinary income or loss and will not be eligible for the preferential tax rate on qualified dividend income. The gain or loss generally will be income or loss from sources within the US for foreign tax credit purposes.
Distributions in excess of CCEP’s earnings and profits, as determined for US federal income tax purposes, will be treated as a return of capital to the extent of the US holder’s basis in its Shares and thereafter as capital gain, subject to taxation as described below.
Taxation of capital gains
Subject to the PFIC rules discussed below, a US holder will generally recognise gain or loss on any sale, exchange, redemption or other taxable disposition of Shares in an amount equal to the difference between the US dollar value of the amount realised on the disposition and the US holder’s tax basis, determined in US dollars, in the Shares. Any such capital gain or loss generally will be long-term gain or loss, subject to tax at a preferential rate for a non-corporate US holder, if the US holder’s holding period for such Shares exceeds one year. Any gain or loss recognised by a US holder on the sale or exchange of Shares will generally be treated as income or loss from sources within the US for foreign tax credit limitation purposes. The deductibility of capital losses is subject to limitations.
|
|
P a g e |
184
|
Passive foreign investment company status
CCEP does not believe that Shares will be treated as stock of a PFIC for US federal income tax purposes, but this conclusion is a factual determination that is made annually and thus is subject to change. If CCEP were to be treated as a PFIC, unless a US holder elects to be taxed annually on a mark-to-market basis with respect to its Shares, any gain realised on the sale or exchange of such Shares would in general not be treated as capital gain. Instead, a US holder would be treated as if he or she had realised such gain ratably over the holding period for Shares and generally would be taxed at the highest tax rate in effect for each such year to which the gain was allocated, and an interest charge in respect of the tax attributable to each such year would apply. Certain distributions would be similarly treated if CCEP were treated as a PFIC. In addition, distributions made by a PFIC generally do not constitute qualified dividend income and are not eligible for the preferential tax rate applicable to such income.
Information reporting and backup withholding
In general, information reporting requirements will apply to dividends received by US holders of Shares, and the proceeds received on the disposition of Shares effected within the US (and, in certain cases, outside the US), in each case, other than US holders that are exempt recipients (such as corporations).
Backup withholding may apply to such amounts if the US holder fails to provide an accurate taxpayer identification number (generally on an IRS Form W-9 provided to the paying agent or the US holder’s broker) or is otherwise subject to backup withholding.
Dividends with respect to Shares and proceeds from the sale or other disposition of Shares received in the US or through certain US related financial intermediaries by a Non-US holder, may be subject to information reporting and backup withholding unless such Non-US holder provides to the applicable withholding agent the required certification as to its non-US status, such as by providing a valid IRS Form W-8BEN, IRS Form W-8BEN-E or IRS Form W-8ECI, or otherwise establishes an exemption, and otherwise complies with the applicable requirements of the backup withholding rules.
Backup withholding is not an additional tax. Any amounts withheld under the backup withholding rules may be allowed as a refund or credit against a holder’s US federal income tax liability, if any, provided the required information is timely furnished to the IRS.
UK taxation consequences for US holders
The following is a general discussion of certain UK tax consequences of the ownership and disposition of Shares for US holders.
This discussion is based on UK tax law and what is understood to be the practice of HMRC, all as in effect on the date hereof, and all of which are subject to differing interpretations and change at any time, possibly with retroactive effect. This discussion does not purport to be a complete analysis of all potential UK tax considerations that may apply to a US holder. In addition, this discussion neither addresses all aspects of UK tax law that may be relevant to particular US holders nor takes into account the individual facts and circumstances of any particular US holder and, accordingly, is not intended to be, and should not be construed as, tax advice.
Distributions on Shares
No UK tax is required to be withheld from cash distributions on Shares paid to US holders. In addition, US holders will not be subject to UK tax in respect of their receipt of cash distributions on their Shares.
Sale, exchange, redemption or other dispositions of Shares
US holders will not be subject to UK tax on capital gains in respect of any gain realised by such US holders on a sale, exchange, redemption or other disposition of their Shares.
While Shares are held within the DTC clearance system, and provided that DTC satisfies various conditions specified in UK legislation, electronic book entry transfers of such Shares should not be subject to UK stamp duty, and agreements to transfer such Shares should not be subject to Stamp Duty Reserve Tax (SDRT). The parties have obtained confirmation of this position by way of formal clearance by HMRC. Likewise, transfers of, or agreements to transfer, such Shares from the DTC clearance system into another clearance system (or into a depositary receipt system) should not, provided that the other clearance system or depositary receipt system satisfies various conditions specified in UK legislation, be subject to UK stamp duty or SDRT.
In the event that Shares have left the DTC clearance system, other than into another clearance system or depositary receipt system, any subsequent transfer of, or agreement to transfer, such Shares may, subject to any available exemption or relief, be subject to UK stamp duty or SDRT at a rate of 0.5% of the consideration for such transfer or agreement. Any such UK stamp duty or SDRT will generally be payable by the transferee and must be paid (and any relevant transfer document stamped by HMRC) before the transfer can be registered in the books of the Company. In the event that Shares that have left the DTC clearance system, other than into another clearance system or depositary receipt system, are subsequently transferred back into a clearance system or depositary receipt system, such transfer or agreement may, subject to any available exemption or relief, be subject to UK stamp duty or SDRT at a rate of 1.5% of the consideration for such transfer (or, where there is no such consideration, 1.5% of the value of such Shares).
|
|
P a g e |
185
|
US federal income tax consequences to Non-US holders of the ownership and disposition of CCEP Shares
In general, a Non-US holder of Shares will not be subject to US federal income tax or, subject to the discussion above under Information reporting and backup withholding, US federal withholding tax on any dividends received on Shares or any gain recognised on a sale or other disposition of Shares including any distribution to the extent it exceeds the adjusted basis in the Non-US holder’s Shares unless:
|
•
|
the dividend or gain is effectively connected with such Non-US holder’s conduct of a trade or business in the US (and, if required by an applicable tax treaty, is attributable to a permanent establishment maintained by the Non-US holder in the US); or
|
|
•
|
in the case of gain only, such Non-US holder is a non-resident alien individual present in the US for 183 days or more during the taxable year of the sale or disposition, and certain other requirements are met.
|
A Non-US holder that is a corporation may also be subject to a branch profits tax at a rate of 30% (or such lower rate specified by an applicable tax treaty) on its effectively connected earnings and profits for the taxable year, as adjusted for certain items.
THIS SUMMARY IS NOT EXHAUSTIVE OF ALL POSSIBLE INCOME TAX CONSEQUENCES. IT IS NOT INTENDED AS LEGAL OR TAX ADVICE TO ANY PARTICULAR HOLDER OF SHARES AND SHOULD NOT BE SO CONSTRUED. HOLDERS OF SHARES SHOULD CONSULT THEIR OWN TAX ADVISOR WITH RESPECT TO THE INCOME TAX CONSEQUENCES APPLICABLE TO THEM IN THEIR OWN PARTICULAR CIRCUMSTANCES.
|
|
P a g e |
186
|
Selected financial data
The following selected financial data should be read in conjunction with the
consolidated financial statements
of the Group and the accompanying notes thereto. The selected financial data of CCEP has been extracted from the
consolidated financial statements
of the Group.
Coca-Cola European Partners plc (the Company) was created through the Merger on 28 May 2016 of the businesses of Coca-Cola Enterprises, Inc., (CCE), Coca-Cola Iberian Partners, S.A. (CCIP) and Coca-Cola Erfrischungsgetränke A.G (CCEG) (the Merger). As part of the Merger, in July 2016, the Company completed the acquisition of Vifilfell hf., the Coca-Cola bottler in Iceland. Upon the consummation of the Merger, the historical
consolidated financial statements
of CCE became CCEP’s historical financial statements as CCE was deemed to be the predecessor to CCEP (refer to
Note 2
of the
consolidated financial statements
for further details). Therefore, the financial results presented herein for the years ended 31 December 2015 and for period to date 1 January 2016 through 27 May 2016 refer to CCE and its consolidated subsidiaries, and the periods subsequent to 28 May 2016 refer to the combined financial results of CCEP.
For all periods up to and including the year ended 31 December 2015, CCE prepared and published its
consolidated financial statements
in accordance with US GAAP. As part of first time adoption of IFRS for CCEP and in order to provide comparative period information, the financial statements of CCE for 2014 and 2015 were prepared in accordance with IFRS. The date of transition to IFRS was 1 January 2014, at which date an opening IFRS Statement of Financial Position has been prepared. As such, no financial information has been provided prior to 1 January 2014 given such financial information has not been prepared under IFRS.
The financial information presented herein has been prepared in accordance with IFRS as issued by the IASB and adopted by the EU. There are no differences between IFRS as issued by the IASB and IFRS as adopted by the EU that have an impact for the years presented.
|
2017
|
|
2016
|
|
2015
|
|
2014
|
|
|||||
|
Income statement
|
€ million
|
|
€ million
|
|
€ million
|
|
€ million
|
|
||||
|
Revenue
|
11,062
|
|
9,133
|
|
6,329
|
|
6,217
|
|
||||
|
Cost of sales
|
(6,772
|
)
|
(5,584
|
)
|
(4,017
|
)
|
(3,987
|
)
|
||||
|
Gross profit
|
4,290
|
|
3,549
|
|
2,312
|
|
2,230
|
|
||||
|
Selling and distribution expenses
|
(2,124
|
)
|
(1,615
|
)
|
(919
|
)
|
(944
|
)
|
||||
|
Administrative expenses
|
(906
|
)
|
(1,083
|
)
|
(634
|
)
|
(539
|
)
|
||||
|
Operating profit
|
1,260
|
|
851
|
|
759
|
|
747
|
|
||||
|
Finance income
|
48
|
|
31
|
|
24
|
|
34
|
|
||||
|
Finance costs
|
(148
|
)
|
(154
|
)
|
(134
|
)
|
(123
|
)
|
||||
|
Total finance costs, net
|
(100
|
)
|
(123
|
)
|
(110
|
)
|
(89
|
)
|
||||
|
Non-operating items
|
(1
|
)
|
(9
|
)
|
(5
|
)
|
—
|
|
||||
|
Profit before taxes
|
1,159
|
|
719
|
|
644
|
|
658
|
|
||||
|
Taxes
|
(471
|
)
|
(170
|
)
|
(131
|
)
|
(174
|
)
|
||||
|
Profit after taxes
|
688
|
|
549
|
|
513
|
|
484
|
|
||||
|
|
P a g e |
187
|
|
2017
|
|
2016
|
|
2015
|
|
2014
|
|
|||||
|
Statement of financial position
|
€ million
|
|
€ million
|
|
€ million
|
|
€ million
|
|
||||
|
Non-current assets
|
14,880
|
|
15,143
|
|
5,113
|
|
5,040
|
|
||||
|
Current assets
|
3,314
|
|
3,425
|
|
1,883
|
|
2,008
|
|
||||
|
Total assets
|
18,194
|
|
18,568
|
|
6,996
|
|
7,048
|
|
||||
|
Non-current liabilities
|
8,222
|
|
8,355
|
|
4,119
|
|
3,706
|
|
||||
|
Current liabilities
|
3,287
|
|
3,752
|
|
2,006
|
|
2,155
|
|
||||
|
Total liabilities
|
11,509
|
|
12,107
|
|
6,125
|
|
5,861
|
|
||||
|
Total equity
|
6,685
|
|
6,461
|
|
871
|
|
1,187
|
|
||||
|
Total equity and liabilities
|
18,194
|
|
18,568
|
|
6,996
|
|
7,048
|
|
||||
|
Capital stock data
|
||||||||||||
|
Number of shares (in millions)
|
485
|
|
483
|
|
227
|
|
239
|
|
||||
|
Share capital (in € million)
|
5
|
|
5
|
|
3
|
|
3
|
|
||||
|
Share premium (in € million)
|
127
|
|
114
|
|
2,729
|
|
2,711
|
|
||||
|
Per share data
|
||||||||||||
|
Basic earnings per share (€)
|
1.42
|
|
1.45
|
|
2.23
|
|
1.96
|
|
||||
|
Diluted earnings per share (€)
|
1.41
|
|
1.42
|
|
2.19
|
|
1.92
|
|
||||
|
Dividends declared per share (€)
(A)
|
0.84
|
|
0.86
|
|
1.01
|
|
0.75
|
|
||||
|
Dividends declared per share ($)
(A)
|
n/a
|
|
0.97
|
|
1.12
|
|
1.00
|
|
||||
|
(A)
|
As a result of the Merger, dividends declared in 2016 may be viewed in two separate categories, dividends declared by CCEP in euros, and dividends declared by CCE in US dollars. Dividends declared by CCE in 2016 in US dollars have been converted to euro from US dollars and to provide an annualised dividend amount for 2016 using the average exchange rate for the respective period. Similarly, dividends declared by CCEP in euros in 2016 have been converted to US dollars to provide an annualised dividend amount for 2016 using the average exchange rate for the respective period. All dividends declared prior to 2016 were declared in USD and have been converted to euro using the average exchange rate for each respective period.
|
Operations review
Revenue
On a reported basis, revenue
increased
by
€1.9 billion
, or
21.0%
, from
€9.1 billion
in
2016
to
€11.1 billion
in
2017
, driven primarily by a full year of operations for Iberia and Germany in 2017, as compared to only seven months in 2016. Iberia and Germany revenues increased €1.0 billion and €0.9 billion, respectively, in 2017. Excluding the impact of Iberia and Germany, revenues were flat year-over-year. On a reported basis, revenue in Great Britain declined by 2.5%, driven by a decline in the British pound versus the euro. Adjusting for a 7.0% unfavourable change due to currency, Great Britain’s revenue was up 4.5% year-on-year. This improvement was driven primarily by volume gains of 2.0% (adjusted for one less selling day in 2017 versus 2016), and favourable price/mix movements. Revenue in France increased by 0.5%, as improvements in price/mix outpaced a slight decline in volume. Revenue in the Northern European territories (Belgium/Luxembourg/Netherlands, Iceland, Norway and Sweden) was up 4.5%, led by Belgium/Luxembourg and the Netherlands, and the inclusion of Iceland.
On a reported basis, revenue increased by 44.5% from €6.3 billion in 2015 to €9.1 billion in 2016 driven by the inclusion of Germany and Iberia in 2016. In 2016, Germany and Iberia contributed revenue of €1.3 billion and €1.7 billion respectively. Excluding both Germany and Iberia, revenue decreased by 4% between 2015 and 2016, or €252 million. On a territory basis, this decline was primarily due to a reduction in Great Britain revenues of 12%, or €288 million, impacted by a decline of 11% in the value of British pound vs. the euro. Operationally, the first half of the year was negatively impacted by a temporary supply chain disruption related to the implementation of new software programmes and processes and an ongoing competitive environment. During the second half of 2016 Great Britain returned to growth with both price/mix and volume growth. Strong execution and the introduction of Coca-Cola Zero Sugar were key drivers of second half performance. Revenue in France declined 1.5% during the year, driven by challenging weather, the economic impact of a decline in tourist travel, and soft category conditions in the first half of 2016, offset partially by improved price/mix and volume growth in the second half of 2016 supported by promotional timing, execution and more favourable weather. Revenue in the Northern European territories grew 3% led by solid growth in Belgium/Luxembourg/Netherlands and Norway and the inclusion of Iceland.
|
|
P a g e |
188
|
The Group participates in various programmes and arrangements with customers designed to increase the sale of our products. The costs of these programmes are recorded as deductions from revenue. Among the programmes are arrangements under which allowances can be earned by customers for attaining agreed-upon sales levels or for participating in specific marketing programmes. When these allowances are paid in arrears, the Group accrues the estimated amount to be paid based upon historical customer experience, the programme’s contractual terms, expected customer performance and/or estimated sales volume. The costs of these arrangements totalled
€2.9 billion
,
€2.5 billion
and
€1.8 billion
for
2017
,
2016
and
2015
, respectively. The increases of €0.4 billion in 2017, and €0.7 billion in 2016, were primarily a result of inclusion of full year operating results of Germany and Iberia in 2017, and seven months in 2016.
Volume
The following table summarises the change in our unit case volume for the periods presented, as adjusted to reflect the impact of one less selling day in 2017 versus 2016 (selling days were the same in 2016 and 2015; (rounded to the nearest 0.5%):
|
2017 Versus 2016
|
|
2016 Versus 2015
|
|
||
|
Change in volume
|
23.0
|
%
|
64.0
|
%
|
|
The following table summarises volume by major brand category for the periods presented, as adjusted to reflect the impact of one less selling day in 2017 versus 2016 (selling days were the same in 2016 and 2015; (rounded to the nearest 0.5%):
|
2017 Versus 2016 Change
|
|
2016 Versus 2015 Change
|
|
2017 % of Total
|
|
2016 % of Total
|
|
2015 % of Total
|
|
|||
|
Sparkling
|
||||||||||||
|
Coca-Cola trademark
|
20.5
|
%
|
54.0
|
%
|
63.5
|
%
|
65.0
|
%
|
68.0
|
%
|
||
|
Sparkling flavours and energy
|
28.5
|
%
|
78.5
|
%
|
21.5
|
%
|
20.5
|
%
|
17.5
|
%
|
||
|
Still
|
||||||||||||
|
Juices, isotonics, and other
|
23.0
|
%
|
57
|
%
|
8.0
|
%
|
8
|
%
|
10.5
|
%
|
||
|
Water
|
33.0
|
%
|
183.5
|
%
|
7.0
|
%
|
6.5
|
%
|
4.0
|
%
|
||
|
Total
|
23.0
|
%
|
64.0
|
%
|
100.0
|
%
|
100.0
|
%
|
100.0
|
%
|
||
The change in volume between 2017 and 2016 was primarily due to the inclusion in 2017 of full year operating results for Germany and Iberia. Excluding the impact of Germany and Iberia, the change in volume between 2017 and 2016 would have been an increase of approximately 1.5% (adjusted for the selling day shift).
The significant increase in volume between 2016 and 2015 was due to the inclusion of Germany and Iberia. Excluding the impact of Germany and Iberia, the change in volume between 2016 and 2015 would have been flat. A challenging consumer environment, improved weather in key selling months and other operating factors highlighted above combined to limit volume improvements.
Cost of sales
On a reported basis, cost of sales
increased
21.5%
, from
€5.6 billion
in 2016 to
€6.8 billion
in 2017, driven primarily by the full year of operations for Iberia and Germany in 2017, as compared to only seven months in 2016. Excluding the Impact of Iberia and Germany, cost of sales increased 2% between 2017 and 2016. This increase was driven by year-over-year cost increases in key inputs, principally concentrate and sweetener, and an increase in restructuring charges recorded in cost of sales as a result of the integration and synergy programme. These increases were partially offset by benefits from our synergy programmes, and currency exchange rate changes, specifically the British pound to euro exchange rate.
Included within cost of sales for 2017 are €66 million of restructuring charges. These charges principally related to restructuring activities under the Integration and Synergy Programme including the optimisation of manufacturing, warehouse and labour productivity, cold-drink operational practices and facilities, further facility rationalisation in Germany and supply chain organisational design improvements such as route-to-market.
On a reported basis, cost of sales increased by 39% from €4.0 billion in 2015 to €5.6 billion in 2016 driven by the inclusion of Germany and Iberia in 2016. Cost of sales attributable to Germany and Iberia in 2016 were €1.8 billion. Excluding the impact of both Germany and Iberia, cost of sales decreased by 6% between 2015 and 2016, or $233 million, primarily due to favourable foreign exchange impacts of €171 million. Increases in commodity costs of sweetener and PET and the impact of mix were further offset by overall net modest decline in all other cost of sales.
In 2015, cost of sales increased by 1% to €4.0 billion. This increase reflects the benefits of favourable cost trends in some of our key commodities including aluminium, sugar and PET (plastic) offset by foreign currency movements.
|
|
P a g e |
189
|
Selling and distribution expenses and administrative expenses
The following table presents Selling and distribution expenses and administrative expenses for the periods presented:
|
2017
|
|
2016
|
|
2015
|
|
||||
|
€ million
|
|
€ million
|
|
€ million
|
|
||||
|
Selling and distribution expenses
|
2,124
|
|
1,615
|
|
919
|
|
|||
|
Administrative expenses
|
906
|
|
1,083
|
|
634
|
|
|||
|
3,030
|
|
2,698
|
|
1,553
|
|
||||
On a reported basis, selling and distribution expenses and administrative expenses (operating expenses) increased by
12.5%
from
€2.7 billion
in
2016
to
€3.0 billion
in
2017
, driven primarily by the full year of operations for Iberia and Germany in 2017, as compared to only seven months in 2016.
Included within operating expenses for 2017 are €169 million of restructuring charges. These charges principally related to restructuring activities under the Integration and Synergy Programme including supply chain improvements, productivity initiatives, streamlining of the HR organisation, the transfer of Germany and Iberia transactional related activities to the shared services centre in Sofia, Bulgaria, and other central function initiatives.
On a reported basis, operating expenses increased by 73.5% from €1.6 billion in 2015 to €2.7 billion in 2016 driven by the inclusion of Germany and Iberia in 2016. Operating expenses attributable to Germany and Iberia in 2016 totalled €1.0 billion.
Included within operating expenses for 2016 are restructuring charges of €286 million related to a number of new programmes to facilitate and enable the integration of CCE, CCIP and CCEG following the Merger, as well as the continuation of existing in-flight initiatives in Belgium, Germany and Iberia prior to the Merger. Merger related costs of €126 million were incurred in 2016. In 2015, restructuring charges included within operating expenses amounted to €18 million, and Merger related costs were €40 million.
Finance cost, net
Finance cost, net totalled
€100 million
,
€123 million
and
€110 million
in
2017
,
2016
and
2015
, respectively. The following tables summarize the primary items impacting our interest expense during the periods presented (in millions):
|
2017
|
|
2016
|
|
2015
|
|
|||
|
Average outstanding debt balance
|
6,263
|
|
5,709
|
|
3,803
|
|
||
|
Weighted average cost of debt
|
1.6
|
%
|
1.8
|
%
|
2.7
|
%
|
||
|
Fixed-rate debt (% of portfolio)
|
77
|
%
|
77
|
%
|
95
|
%
|
||
|
Floating-rate debt (% of portfolio)
|
23
|
%
|
23
|
%
|
5
|
%
|
||
Other non-operating items
Other non-operating expense totalled
€1 million
,
€9 million
and
€5 million
in
2017
,
2016
and
2015
, respectively. Our other non-operating expense is primarily made up of remeasurement gains and losses related to currency exchange rate fluctuations on financing transactions denominated in a currency other than the subsidiary’s functional currency. Non-operating items are shown on a net basis and reflect the impact of any derivative instruments utilized to hedge the foreign currency movements of the underlying financing transactions.
Tax expense
In
2017
our reported effective tax rate was
40.6
%. This includes the impact of a net €
125 million
non-recurring book tax expense related to the deemed repatriation of profits to the US under the US Tax Act and a €195 million reduction in deferred tax assets in the US primarily due to the elimination of foreign tax credits. Our 2017 reported effective tax rate also reflected a deferred tax benefit of €33 million due to the enactment of corporate income tax rate reductions in France, Belgium and Norway.
In
2016
our reported effective tax rate was
23.6%
. Prior to the Merger on
28 May 2016
, the accounting predecessor to the Group was CCE, a US tax resident and from the date of the Merger, a UK company became the parent of the Group. The inclusion of Germany and Iberia during 2016 also impacted the effective tax rate as well as a deferred tax benefit of €42 million due to the enactment of corporate income tax rate reductions in the UK and France and the US tax impact associated with repatriating to the US €195 million of 2016 non-US earnings.
In
2015
our reported effective tax rate was
20.0%
. This rate included a deferred tax benefit of €50 million due to the enactment of corporate income tax rate reductions in the UK. Our 2015 effective tax rate also reflected the US tax impact associated with repatriating to the US $450 million of our 2015 non-US earnings.
|
|
P a g e |
190
|
Cash flow and liquidity review
Liquidity and capital resources
Our sources of capital include, but are not limited to, cash flows from operations, public and private issuances of debt and equity securities, and bank borrowings. We believe our operating cash flow, cash on hand and short-term deposits, and available short-term and long-term capital resources are sufficient to fund our working capital requirements, scheduled debt payments, interest payments, capital expenditures, benefit plan contributions, income tax obligations and dividends to our shareholders for the foreseeable future. We continually assess the counterparties and instruments we use to hold our cash and cash equivalents, with a focus on preservation of capital and liquidity. Based on information currently available, we do not believe we are at significant risk of default by our counterparties.
To finance the return of capital to CCE shareholders as part of the Merger, in 2016 we issued €2.2 billion of Eurobond notes and obtained a €1.0 billion floating rate bank term loan. The Eurobond notes are due between November 2017 and May 2028 (see Note 12 of the
consolidated financial statements
for further details) and the term loan has annual payments between 2018 and 2021.
In the second half of 2017,
€200 million
of the term loan due in
2018
and
€100 million
of the term loan due in
2021
were repaid prior to maturity. As at 31 December 2017,
€700 million
of the term loan remains outstanding with annual repayments due between 2019 and 2021.
The Group has amounts available for borrowing under a
€1.5 billion
multi-currency credit facility with a syndicate of
ten
banks. This credit facility matures in
2021
and is for general corporate purposes and supporting working capital needs. Based on information currently available, there is no indication that the financial institutions participating in this facility would be unable to fulfil their commitments to CCEP as at the date of this report. The credit facility contains no financial covenants that would impact our ability to access the facility. As at
31 December 2017
, the Group did not have amounts drawn on its credit facility.
CCE previously held a multi-currency credit facility for US$1.0 billion with a syndicate of eight banks, which was terminated prior to the Merger. The Group did not have any amounts drawn on this facility for any period presented in the Group’s
consolidated statement of financial position
.
Further details regarding the level of borrowings at the year end are provided within Note 12 of the
consolidated financial statements
.
The Group satisfies seasonal working capital needs and other financing requirements with operating cash flow, cash on hand, short-term borrowings and line of credit. At
31 December 2017
, the Group had
€250 million
in third-party debt maturities in the next 12 months, all of which was in the form of short-term commercial paper. In addition to using operating cash flow and cash on hand, the Group may repay our short-term obligations by issuing more debt which may take the form of commercial paper and/or long-term debt.
In March 2017, the Board increased our quarterly dividend by more than 20% to €0.21 per share. For the full year 2017, our dividend per share represented approximately 40% of our comparable diluted earnings per share. In February 2018, the Board declared a further increase in the quarterly dividend to €0.26 per share, equivalent to an annualised dividend of €1.04 per share. This is in line with our commitment to deliver long-term value to shareholders.
Historically, CCE had authorised and completed a number of share repurchase programmes. Immediately prior to the Merger, CCE had authorisations from the CCE Board of Directors to repurchase shares up to
US$1.0 billion
. CCE completed its planned share repurchases during the second half of 2015. As part of the Merger agreement, the
128,993,430
shares held in treasury on the acquisition date, with a total cost of
€3.3 billion
, were cancelled. Since the Merger there have been no share repurchases made by the Group.
Credit ratings and covenants
The Group’s credit ratings are periodically reviewed by rating agencies. Currently, the Group’s long-term ratings from Moody’s and Standard & Poor’s (S&P), are A3 and BBB+ respectively. The ratings outlook from Moody’s and S&P are stable. Changes in the operating results, cash flows, or financial position could impact the ratings assigned by the various rating agencies. The credit rating can be materially influenced by a number of factors including, but not limited to, acquisitions, investment decisions, and capital management activities of TCCC, and/or changes in the credit rating of TCCC. Should the credit ratings be adjusted downward, the Group may incur higher costs to borrow, which could have a material impact on the financial condition and results of operations.
Summary of cash flow activities
2017
During
2017
, our primary sources of cash included: (1)
€1.6 billion
from operating activities, net of cash payments related to restructuring programs of
€276 million
and contributions to our defined benefit pension plans of
€58 million
; and (2) proceeds of
€600 million
from the issuances of debt.
Our primary uses of cash were: (1) payments on debt of
€1.2 billion
(Refer to Financing Activities section below); (2) dividend payments of
€489 million
; and (3) capital spend on property, plant and equipment of
€484 million
.
|
|
P a g e |
191
|
2016
During 2016, our primary sources of cash included: (1) €1.2 billion from operating activities, net of cash payments related to restructuring programs of €212 million and contributions to our defined benefit pension plans of €78 million; and (2) proceeds of €3.2 billion from the issuances of debt.
Our primary uses of cash were; (1) Return of capital to CCE shareholders of €3.0 billion; (2) debt maturity payments of €424 million, primarily the $250 million 2.00% notes falling due in 2016, and the payment of €73 million of debt obligations to TCCC assumed at the time of the Merger; (3) capital spend on property, plant and equipment of €459 million; and (4) dividend payments of €204 million.
2015
During 2015, our primary sources of cash included; (1) €922 million from operating activities, net of cash payments related to restructuring programs of €25 million and contributions to our defined benefit pension plans of €47 million; (2) proceeds of €495 million from the issuances of debt; (3) the receipt of €50 million upon maturity of certain of our cross-currency swaps related to intercompany loans; and (4) net issuances of commercial paper of €47 million.
Our primary uses of cash were (1) cash payments totalling €534 million for shares repurchased under our share repurchase program; (2) payments on debt of €431 million, primarily from the maturing of $475 million 2.13% notes; (3) capital spend on property, plant and equipment of €292 million; and (4) dividend payments of €232 million.
Operating activities
2017 versus 2016
Our cash derived from operating activities totalled
€1.6 billion
in
2017
versus
€1.2 billion
in
2016
. This
increase
was primarily due to the inclusion of Germany and Iberia operating cashflows for a full year versus seven months in 2016.
2016 versus 2015
Our cash derived from operating activities totalled €1.2 billion in 2016 versus €922 million in 2015. This increase was primarily from the inclusion of Germany and Iberia operating cashflows from 28 May 2016.
Investing activities
Capital asset investments represent a primary use of cash for our investing activities. No significant other investing activities took place during the year ended 31 December 2017. During
2018
, we expect our capital expenditures to be in a range of
€525 million
to
€575 million
and to be invested in similar categories as those listed in the table below. We believe our operating cash flow, cash on hand and available short-term and long-term capital resources are sufficient to fund these plans.
The following table summarises the capital investments for the periods presented:
|
2017
|
|
2016
|
|
2015
|
|
||||
|
€ million
|
|
€ million
|
|
€ million
|
|
||||
|
Supply chain infrastructure
|
322
|
|
309
|
|
175
|
|
|||
|
Cold-drink equipment
|
160
|
|
115
|
|
115
|
|
|||
|
Fleet and other
|
2
|
|
35
|
|
2
|
|
|||
|
Total capital asset investments
|
484
|
|
459
|
|
292
|
|
|||
As part of our investing activities in 2016, cash and cash equivalent balances of €149 million were acquired from Germany and Iberia in connection with the Merger. These cash inflows were partially offset in the year by the €35 million cash payment used as the consideration to acquire Vifilfell hf. and €4 million of other items.
During 2015, investing activities also included the receipt of €29 million from the settlement of net investment hedges as well as €12 million in capital disposals driven primarily by the sale of a distribution facility in Great Britain.
Financing activities
Our net cash used in financing activities totalled
€1,152 million
,
€626 million
and
€685 million
in
2017
,
2016
and
2015
, respectively.
|
|
P a g e |
192
|
The following table summarises our currency adjusted financing activities related to the issuances of and payments on debt for the periods presented (in € millions):
|
Issuances of Debt
|
Maturity Date
|
|
Rate
|
|
2017
|
|
2016
|
|
2015
|
|
|||
|
€350 million notes
|
November 2021
|
|
floating
|
|
350
|
|
—
|
|
—
|
|
|||
|
€500 million notes
|
November 2017
|
|
floating
|
|
—
|
|
499
|
|
—
|
|
|||
|
€700 million notes
|
February 2022
|
|
0.8
|
%
|
—
|
|
695
|
|
—
|
|
|||
|
€500 million notes
|
May 2024
|
|
1.1
|
%
|
—
|
|
493
|
|
—
|
|
|||
|
€500 million notes
|
May 2028
|
|
1.8
|
%
|
—
|
|
491
|
|
—
|
|
|||
|
Term loan
|
May 2018-2021
|
|
floating
|
|
—
|
|
996
|
|
—
|
|
|||
|
€500 million notes
|
March 2030
|
|
1.9
|
%
|
—
|
|
—
|
|
495
|
|
|||
|
Total issuances of debt, less short-term borrowings, net of issuance costs
|
350
|
|
3,174
|
|
495
|
|
|||||||
|
Net issuances of short-term borrowings
|
—
|
|
(A)
|
|
250
|
|
—
|
|
47
|
|
|||
|
Total issuances of debt, net of issuance costs
|
600
|
|
3,174
|
|
542
|
|
|||||||
|
Payments on Debt
|
Maturity Date
|
|
Rate
|
|
2017
|
|
2016
|
|
2015
|
|
|||
|
Term loan
|
May 2018-2021
|
|
floating
|
|
(300
|
)
|
—
|
|
—
|
|
|||
|
€350 million notes
|
September 2017
|
|
3.1
|
%
|
(350
|
)
|
—
|
|
—
|
|
|||
|
€500 million notes
|
November 2017
|
|
floating
|
|
(500
|
)
|
—
|
|
—
|
|
|||
|
US$250 million notes
|
August 2016
|
|
2.0
|
%
|
—
|
|
(223
|
)
|
—
|
|
|||
|
US$475 million notes
|
September 2015
|
|
2.1
|
%
|
—
|
|
—
|
|
(421
|
)
|
|||
|
Payments of other non-current borrowings
|
—
|
|
6.7
|
%
|
(10
|
)
|
—
|
|
—
|
|
|||
|
Net payments of short-term borrowings
|
—
|
|
—
|
|
—
|
|
(183
|
)
|
—
|
|
|||
|
Capital lease & other borrowings
|
—
|
|
—
|
|
(20
|
)
|
(18
|
)
|
(10
|
)
|
|||
|
Total payments on debt
|
(1,180
|
)
|
(424
|
)
|
(431
|
)
|
|||||||
|
(A)
|
These amounts represent represent short term euro commercial paper with varying interest rates.
|
Our financing activities during 2017 included dividend payments totalling
€489 million
. These included
€82 million
paid in January 2017, based on a dividend rate of
€0.17
per share, and
four
dividend payments from April 2017 through to December 2017 totalling
€407 million
, each based on an increased dividend rate of
€0.21
per share.
During 2017 and 2016, short term borrowings of €50 million and €200 million, respectively, were drawn against a credit facility and subsequently repaid prior to 31 December.
Our financing activities during 2016 included cash payments to CCE shareholders in connection with the Merger of €3.0 billion, as well as the repayment of a loan with TCCC of €73 million, assumed at the time of the Merger.
In 2016, prior to the Merger, two dividend payments were made on previously outstanding CCE shares totalling $136 million, or €122 million, based on an approved dividend rate of $0.30 per share. Subsequent to the Merger, the CCEP Board of Directors declared a dividend of €0.17 per share for the third quarter 2016, totalling €82 million, which was paid in October 2016.
In 2015, the CCE Board of Directors approved an increase in quarterly dividend from $0.25 per share to $0.28 per share beginning in the first quarter of 2015. As a result, dividends of $257 million, or €232 million, were paid during 2015. During 2014, dividends of $246 million, or €185 million, were paid.
Our financing activities during 2015 also included euro equivalent cash payments of €534 million for share repurchases. There were no share repurchases during 2016 or 2017.
Additionally, financing activities during 2015 included the receipt of €50 million upon maturity of certain of our cross-currency swaps related to intercompany loans.
|
|
P a g e |
193
|
Financial position
2017
versus
2016
|
31 December 2017
|
|
31 December 2016
|
|
Change
|
|
Change
|
|
||||
|
€ million
|
|
€ million
|
|
€ million
|
|
%
|
|
||||
|
Assets
|
|||||||||||
|
Non-current assets
|
14,880
|
|
15,143
|
|
(263
|
)
|
(1.5
|
)%
|
|||
|
Current assets
|
3,314
|
|
3,425
|
|
(111
|
)
|
(3.0
|
)%
|
|||
|
Total assets
|
18,194
|
|
18,568
|
|
(374
|
)
|
(2.0
|
)%
|
|||
|
Liabilities
|
|||||||||||
|
Non-current liabilities
|
8,222
|
|
8,355
|
|
(133
|
)
|
(1.5
|
)%
|
|||
|
Current liabilities
|
3,287
|
|
3,752
|
|
(465
|
)
|
(12.5
|
)%
|
|||
|
Total liabilities
|
11,509
|
|
12,107
|
|
(598
|
)
|
(5.0
|
)%
|
|||
|
Total equity
|
6,685
|
|
6,461
|
|
224
|
|
3.5
|
%
|
|||
|
Total equity and liabilities
|
18,194
|
|
18,568
|
|
(374
|
)
|
(2.0
|
)%
|
|||
Total non-current assets
decreased
€263 million
, or
1.5%
, from
€15.1 billion
at
31 December 2016
to
€14.9 billion
at 31 December
2017
. This change was partially driven by a decrease in deferred tax assets of €218 million mainly related to US tax law changes enacted prior to year end. Property, plant and equipment reduced by €156 million which was offset by increases in intangible assets and goodwill of €40 million and €93 million, respectively, relating primarily to the finalisation of acquisition accounting for Germany and Iberia and currency effects during the period.
Total current assets
decreased
€111 million
, or
3.0%
, from
€3.4 billion
at
31 December 2016
to
€3.3 billion
at 31 December
2017
. This change was primarily driven by a decrease of €23 million in inventories and €128 million in trade accounts receivable resulting from working capital initiatives.
Total non-current liabilities
decreased
by
€133 million
, or
1.5%
, from
€8.4 billion
at
31 December 2016
to
€8.2 billion
at 31 December
2017
. This change was mainly driven by a reduction of €116 million in our employee benefit liabilities primarily due to the actual return on underlying assets exceeding actuarial estimates, a reduction in non-current borrowings of €88 million reflecting early repayments on a term loan of €300 million, foreign exchange movements on our US denominated debt and issuance of €350 million floating-rate notes, offset by an increase in our derivative liabilities of €92 million relating to our US denominated debt.
Total current liabilities
decreased
€465 million
, or
12.5%
, from
€3.8 billion
at
31 December 2016
to
€3.3 billion
at 31 December
2017
. This change was primarily driven by the repayment of €300 million Eurobond notes in November 2017 and €500 million floating rate notes in December 2017, offset by commercial paper issuances of €250 million. This reduction was offset by an increase in trade and other payables of €115 million, primarily due to working capital initiatives.
2016
versus
2015
|
31 December 2016
|
|
31 December 2015
|
|
Change
|
|
Change
|
|
||||
|
€ million
|
|
€ million
|
|
€ million
|
|
%
|
|
||||
|
Assets
|
|||||||||||
|
Non-current assets
|
15,143
|
|
5,113
|
|
10,030
|
|
196.0
|
%
|
|||
|
Current assets
|
3,425
|
|
1,883
|
|
1,542
|
|
85.0
|
%
|
|||
|
Total assets
|
18,568
|
|
6,996
|
|
11,572
|
|
165.5
|
%
|
|||
|
Liabilities
|
|||||||||||
|
Non-current liabilities
|
8,355
|
|
4,119
|
|
4,236
|
|
103.0
|
%
|
|||
|
Current liabilities
|
3,752
|
|
2,006
|
|
1,746
|
|
87.0
|
%
|
|||
|
Total liabilities
|
12,107
|
|
6,125
|
|
5,982
|
|
98.0
|
%
|
|||
|
Total equity
|
6,461
|
|
871
|
|
5,590
|
|
642.0
|
%
|
|||
|
Total equity and liabilities
|
18,568
|
|
6,996
|
|
11,572
|
|
165.5
|
%
|
|||
Total non-current assets increased €10.0 billion, or 196%, from €5.1 billion at 31 December 2015 to €15.1 billion at 31 December 2016 primarily driven by the assets acquired as a result of the Merger.
Intangible assets increased €5.1 billion, or 161%, from €3.2 billion at 31 December 2015 to €8.3 billion at 31 December 2016 primarily as a result of the acquired distribution agreements with TCCC for Germany and Iberia.
Goodwill increased €2.3 billion, from €81 million at 31 December 2015 to €2.4 billion at 31 December 2016, reflecting the excess of the consideration over the fair value of the net assets of Iberia and Germany acquired as part of the Merger.
|
|
P a g e |
194
|
Property, Plant and Equipment increased €2.3 billion, or 136%, from €1.7 billion at 31 December 2015 to €4.0 billion at 31 December 2016 primarily as a result of the additional capital acquired from Germany and Iberia as part of the Merger.
Total current assets increased €1.5 billion, or 82%, from €1.9 billion at 31 December 2015 to €3.4 billion at 31 December 2016 primarily driven by the assets acquired as a result of the Merger. Inventories increased by €302 million, or 81.%, primarily as a result of the Merger. Trade accounts receivable increased by €650 million, or 54%, mainly as a result of the Merger. Cash and cash equivalents increased by €230 million, or 147%, again primarily as a result of the Merger.
Total non-current liabilities increased by €4.2 billion, or 103%, from €4.1 billion at 31 December 2015 to €8.4 billion at 31 December 2016.
In order to finance the return of capital to CCE shareholders in connection with the Merger, the Group issued €2.2 billion Eurobond notes due between November 2017 and May 2028, and a €1.0 billion floating rate bank term loan in May 2016. These non-current borrowings increases were offset by the reclassification to current liability of €350 million 3.13% Notes due 2017 and €500 million floating rate notes due 2017.
Employee benefit liabilities increased by €136 million in 2016, or 96%, primarily as a result of additional employee obligations in Germany part of the Merger.
Deferred tax liabilities increased by €1.5 billion in 2016, or 192%, primarily as a result of new deferred tax liabilities in Germany and Iberia as part of the Merger.
Total current liabilities increased €1.8 billion in 2016, or 87%, from €2.0 billion from 31 December 2015 to €3.8 billion at 31 December 2016.
Current borrowings increased €457 million in 2016, or 109%, primarily as a result of the reclassification of €350 million 3.13% Notes due 2017 and €500 million floating rate notes due 2017 from Non-current borrowings, offset by the repayment of $250 million 2.0% notes maturing in August 2016 and the repayment of other short term borrowings and capital leases.
Current provisions increased by €201 million in 2016 primarily as a result of an increase in restructuring provisions of €270 million relating to the CCEP integration and synergy programme as inflight restructuring initiatives assumed at the time of the Merger.
Trade and other payables increased by €1.0 billion in 2016, or 75%, primarily of the associated liabilities in Germany and Iberia as part of the Merger.
Raw materials
CCEP purchases concentrates and syrups from TCCC and other licensors to manufacture products. In addition, the Group purchases sweeteners, juices, coffee, mineral waters, finished product, carbon dioxide, fuel, PET (plastic) preforms, glass, aluminium and plastic bottles, aluminium and steel cans, pouches, closures, post-mix, and packaging materials. The Group generally purchases raw materials, other than concentrates, syrups, and mineral waters, from multiple suppliers. The product licensing and bottling agreements with TCCC and agreements with some of our other licensors provide that all authorised containers, closures, cases, cartons and other packages, and labels for their products must be purchased from manufacturers approved by the respective licensor. The principal sweetener we use is sugar derived from sugar beets. Our sugar purchases are made from multiple suppliers. The Group does not separately purchase low-calorie sweeteners because sweeteners for low-calorie beverage products are contained in the concentrates or syrups we purchase.
The Group produces most of the plastic bottle requirements within the production facilities using preforms purchased from multiple suppliers. The Group believes the self-manufacture of certain packages serves to ensure supply and to reduce or manage costs. The Group does not use any materials or supplies that are currently in short supply, although the supply and price of specific materials or supplies are, at times, adversely affected by strikes, weather conditions, speculation, abnormally high demand, governmental controls, new taxes, national emergencies, natural disasters, price or supply fluctuations of their raw material components, and currency fluctuations.
Off-balance sheet arrangements
The Group does not have any off-balance sheet arrangements, as defined by the SEC in Item 5.E of Form 20-F, that have or are reasonably likely to have a current or future effect on the Group's financial condition, changes in financial condition, revenue or expenses, results of operations, liquidity, capital expenditures or capital resources that is material to investors.
|
|
P a g e |
195
|
Contractual obligations
The following table reflects the Group's contractual obligations as at
31 December 2017
:
|
Total
|
|
Less than 1 year
|
|
1 to 3 years
|
|
3 to 5 years
|
|
More than 5 years
|
|
|
|
€ million
|
|
€ million
|
|
€ million
|
|
€ million
|
|
€ million
|
|
|
|
Borrowings
(A)
|
5,661
|
|
250
|
|
1,283
|
|
1,702
|
|
2,426
|
|
|
Finance lease obligations
(B)
|
96
|
|
24
|
|
32
|
|
14
|
|
26
|
|
|
Operating lease obligations
(C)
|
290
|
|
90
|
|
116
|
|
47
|
|
37
|
|
|
Interest obligations
(D)
|
509
|
|
87
|
|
158
|
|
90
|
|
174
|
|
|
Purchase agreements
(E)
|
826
|
|
341
|
|
467
|
|
11
|
|
7
|
|
|
7,382
|
|
792
|
|
2,056
|
|
1,864
|
|
2,670
|
|
|
|
(A)
|
These amounts represent the Group’s scheduled debt maturities, excluding finance lease obligations. Refer to
Note 12
of the
consolidated financial statements
for further details about the borrowings of CCEP.
|
|
(B)
|
These amounts represent the Group’s minimum finance lease payments (including amounts representing interest). Refer to
Note 12
of the
consolidated financial statements
for further details about the finance leases of CCEP.
|
|
(C)
|
These amounts represent the Group’s minimum operating lease payments due under non-cancellable operating leases with initial or remaining lease terms in excess of one year as at
31 December 2017
. Income associated with sublease arrangements is not significant. Refer of
Note 21
of the
consolidated financial statements
for further details about the operating leases of CCEP.
|
|
(D)
|
These amounts represent estimated interest payments related to the Group’s long-term debt obligations, excluding financing leases. Interest on fixed-rate debt has been calculated based on applicable rates and payment dates. Interest on variable-rate debt has been calculated using the forward interest rate curve. Refer to Note 23 of the
consolidated financial statements
for further details about Financial Risk Management with CCEP.
|
|
(E)
|
These amounts represent non-cancellable purchase agreements with various suppliers that are enforceable and legally binding, and that specify a fixed or minimum quantity that we must purchase. All purchases made under these agreements have standard quality and performance criteria. In addition to these amounts, the Group has outstanding capital expenditure purchase orders of approximately
€81 million
as at
31 December 2017
. The Group also has other purchase orders raised in the ordinary course of business which are settled in a reasonably short period of time. These are excluded from the table above.
|
The above table does not reflect the impact of derivatives
and hedging instruments, other than for long-term debt, which are discussed in Note 23 of the
consolidated financial statements
.
The above table also does not reflect employee benefit liabilities of
€436 million
which include current liabilities of
€274 million
and non-current liabilities of
€162 million
as at
31 December 2017
. Refer to Note 14 of the
consolidated financial statements
for further information.
Properties
The Groups principal properties include production facilities, sales and distribution centres, business unit headquarter offices, a shared service centre, and corporate offices.
The table below summarises the main properties which the Group uses as at
31 December 2017
:
|
Great Britain
|
|
France
|
|
Belgium
|
|
The Netherlands
|
|
Norway
|
|
Sweden
|
|
Germany
|
|
Iberia
|
|
Iceland
|
|
Total
|
|
||
|
Production facilities
(A)
|
|||||||||||||||||||||
|
Leased
|
1
|
|
—
|
|
—
|
|
—
|
|
—
|
|
—
|
|
1
|
|
1
|
|
—
|
|
3
|
|
|
|
Owned
|
5
|
|
5
|
|
3
|
|
1
|
|
1
|
|
1
|
|
16
|
|
10
|
|
2
|
|
44
|
|
|
|
Total
|
6
|
|
5
|
|
3
|
|
1
|
|
1
|
|
1
|
|
17
|
|
11
|
|
2
|
|
47
|
|
|
|
Sales and/or distribution facilities
|
|||||||||||||||||||||
|
Leased
|
5
|
|
—
|
|
3
|
|
2
|
|
15
|
|
5
|
|
8
|
|
86
|
|
—
|
|
124
|
|
|
|
Owned
|
5
|
|
—
|
|
—
|
|
—
|
|
—
|
|
1
|
|
8
|
|
10
|
|
—
|
|
24
|
|
|
|
Total
|
10
|
|
—
|
|
3
|
|
2
|
|
15
|
|
6
|
|
16
|
|
96
|
|
—
|
|
148
|
|
|
|
(A)
|
All production facilities are combination production and warehouse facilities.
|
|
|
P a g e |
196
|
The Group’s principal properties cover approximately
47.5 million
square feet in the aggregate of which
7.4 million
square feet is leased and
40.1 million
square feet is owned. The Group believes that its facilities are adequately utilised and sufficient to meet its present operating needs.
At
31 December 2017
, the Group operated approximately 14,000 vehicles of various types, the majority of which are leased. The Group also owned approximately
1.3 million
pieces of cold-drink equipment, principally coolers and vending machines.
Exchange rates
The reporting currency for CCEP is euro. Average and year-end exchange rates between euro and US dollars for the last four years are given below, utilising the ECB published rates; €1 = US$:
|
2017
|
|
2016
|
|
2015
|
|
2014
|
|
|
|
Year end
|
1.1993
|
|
1.0541
|
|
1.0862
|
|
1.2141
|
|
|
Average exchange rates
|
1.1286
|
|
1.1071
|
|
1.1154
|
|
1.3285
|
|
High and low exchange rate values for each of the last six months were as follows:
|
February 2018
|
|
January 2018
|
|
December 2017
|
|
November 2017
|
|
October
2017
|
|
September 2017
|
|
|
|
High
|
1.2493
|
|
1.2457
|
|
1.1993
|
|
1.1952
|
|
1.1856
|
|
1.2060
|
|
|
Low
|
1.2214
|
|
1.1932
|
|
1.1736
|
|
1.1562
|
|
1.1605
|
|
1.1741
|
|
The exchange rate on 9 March 2018 was €1 = $1.2291.
Disclosure controls and procedures
Evaluation of disclosure controls and procedures
The Group maintains “disclosure controls and procedures,” as defined in Rule 13a-15(e) under the US Securities Exchange Act of 1934 (Exchange Act), which are designed to ensure that information required to be disclosed in reports filed or submitted under the Exchange Act is recorded, processed, summarised and reported within the time periods specified in the US Securities and Exchange Commission’s rules and forms, and that such information is accumulated and communicated to the Group’s management, including the Chief Executive Officer and Chief Financial Officer, as appropriate to allow timely decisions regarding required disclosure. The Group’s management, with the participation of the Chief Executive Officer and Chief Financial Officer, has evaluated the effectiveness of the Group’s disclosure controls and procedures pursuant to Exchange Act Rule 13a-15(b) as at 31 December 2017. Based on that evaluation, the Group’s Chief Executive Officer and Chief Financial Officer have concluded that the Group’s disclosure controls and procedures were effective.
Management’s report on internal control over financial reporting
The Group’s management is responsible for establishing and maintaining adequate internal control over financial reporting, as defined in Rule 13a-15(f) under the Exchange Act, for the Group. Internal control over financial reporting is a process designed under the supervision of the principal executive and financial officers to provide reasonable assurance regarding the reliability of financial reporting and the preparation of the Group’s Consolidated Financial Statements for external reporting purposes in accordance with IFRS issued by the IASB. The Group’s internal control over financial reporting includes policies and procedures that (i) pertain to the maintenance of records that, in reasonable detail, accurately and fairly reflect the Group’s transactions and dispositions of assets; (ii) are designed to provide reasonable assurance that transactions are recorded as necessary to permit the preparation of the Group’s Consolidated Financial Statements in accordance with IFRS, and that receipts and expenditures are being made only in accordance with authorisations of management and the Directors of the Group; and (iii) provide reasonable assurance regarding prevention or timely detection of unauthorised acquisition, use or disposition of the Group’s assets that could have a material effect on the Group’s Consolidated Financial Statements. Internal control systems, no matter how well designed, have inherent limitations and may not prevent or detect misstatements. Also, projections of any evaluation of effectiveness to future periods are subject to the risk that internal controls may become inadequate because of changes in conditions, or that the degree of compliance with the policies or procedures may deteriorate.
|
|
P a g e |
197
|
Management, with the participation of the Chief Executive Officer and Chief Financial Officer, assessed the effectiveness of the Group’s internal control over financial reporting as at 31 December 2017, using the criteria set forth in the Internal Control-Integrated Framework issued by The Committee of Sponsoring Organisations of the Treadway Commission (2013 Framework). Based on this assessment, management has determined that the Group’s internal control over financial reporting as at 31 December 2017 was effective. Ernst & Young, LLP, the Group’s independent registered public accounting firm, has issued an attestation report on the Group’s internal control over financial reporting as at 31 December 2017, which is set out on page 106.
Changes in internal control over financial reporting
There has been no change in the Group’s internal control over financial reporting (as defined in Rule 13a-15(f) under the Exchange Act) during 2017 that has materially affected, or is reasonably likely to materially affect, the Group’s internal control over financial reporting.
Principal accountants’ fees and services
The Audit Committee has established policies and procedures for the engagement of the independent registered public accounting firm, Ernst & Young LLP, to render audit and certain assurance and tax services. The policies provide for pre-approval by the Audit Committee of specifically defined audit, audit-related, tax and other services that are not prohibited by regulatory or other professional requirements. Ernst & Young are engaged for these services when its expertise and experience of CCEP are important. Most of this work is of an audit nature. Tax services were awarded either through a full
competitive tender process or following an assessment of the expertise of Ernst & Young relative to that of other potential service providers. These services are for a fixed term.
Under the policy, pre-approval is given for specific services within the following categories: advice on accounting, auditing and financial reporting matters; internal accounting and risk management control reviews (excluding any services relating to information systems design and implementation); non-statutory audit; project assurance and advice on business and accounting process improvement (excluding any services relating to information systems design and implementation relating to CCEP’s financial statements or accounting records); due diligence in connection with acquisitions, disposals and arrangements in which two or more parties have joint control (excluding valuation or involvement in prospective financial information); income tax and indirect tax compliance and advisory services; employee tax services (excluding tax services that could impair independence); provision of, or access to, Ernst & Young publications, workshops, seminars and other training materials; provision of reports from data gathered on non-financial policies and information; and assistance with understanding non-financial regulatory requirements. CCEP operates a two-tier system for audit and non-audit services. For audit related services, the Audit Committee has a pre-approved aggregate level, within which specific work may be approved by management. Non-audit services, including tax services, are pre-approved for management to authorise per individual engagement, but above a defined level must be approved by the chairman of the Audit Committee or the full committee. The Audit Committee has delegated to the chairman of the Audit Committee authority to approve permitted services provided that the chairman reports any decisions to the committee at its next scheduled meeting. Any proposed service not included in the approved service list must be approved in advance by the Audit Committee chairman and reported to the committee, or approved by the full Audit Committee in advance of commencement of the engagement.
The Audit Committee evaluates the performance of the auditors each year. The committee keeps under review the scope and results of audit work and the independence and objectivity of the auditors. The audit fees payable to Ernst & Young are reviewed by the committee for cost effectiveness each year. External regulation and CCEP policy requires the auditors to rotate their lead audit partner every five years. (See Note 16 of the
consolidated financial statements
for details of fees for services provided by auditors.)
|
|
P a g e |
198
|
FORM 20-F TABLE OF CROSS REFERENCES
|
Page
|
||||
|
|
||||
|
Item 1
|
Identity of Directors, Senior Management and Advisors
|
n/a
|
||
|
Item 2
|
Offer Statistics and Expected Timetable
|
n/a
|
||
|
Item 3
|
Key Information
|
|||
|
A - Selected financial data.
|
186 - 187, 196
|
|||
|
B - Capitalization and indebtedness.
|
n/a
|
|||
|
C - Reason for the offer and use of proceeds.
|
n/a
|
|||
|
D - Risk factors.
|
29 - 38
|
|||
|
Item 4
|
Information on the Company
|
|||
|
A - History and development of the company.
|
14, 114, 172
|
|||
|
B - Business overview.
|
14 - 21, 29 - 38, 114 - 115, 119, 177 - 178, 194
|
|||
|
C - Organizational structure.
|
114, 160 - 162
|
|||
|
D - Property, plants and equipment.
|
191, 195-196
|
|||
|
Item 4A
|
Unresolved Staff Comments
|
n/a
|
||
|
Item 5
|
Operating and Financial Review and Prospects
|
|||
|
A - Operating results.
|
14 - 21, 187 - 189, 193 - 194
|
|||
|
B - Liquidity and capital resources.
|
18 - 20, 127, 132 - 134, 140 - 141, 190 - 192, 195
|
|||
|
C - Research and development, patents and licences, etc.
|
n/a
|
|||
|
D - Trend information.
|
14 - 21, 187 - 189
|
|||
|
E - Off-balance sheet arrangements.
|
194
|
|||
|
F - Tabular disclosure of contractual obligations.
|
195
|
|||
|
G - Safe harbor.
|
207
|
|||
|
Item 6
|
Directors, Senior Management and Employees
|
|||
|
A - Directors and senior management.
|
44 - 50, 172
|
|||
|
B - Compensation.
|
74 - 87, 135 - 140
|
|||
|
C - Board practices.
|
44 - 73, 172
|
|||
|
D - Employees.
|
22 - 23, 91, 142, 173
|
|||
|
E - Share ownership.
|
82 - 83, 91, 172 -173
|
|||
|
|
P a g e |
199
|
|
Page
|
||||
|
Item 7
|
Major Shareholders and Related Party Transactions
|
|||
|
A - Major shareholders.
|
90
|
|||
|
B - Related party transactions.
|
145 - 147
|
|||
|
C - Interests of experts and counsel
|
n/a
|
|||
|
Item 8
|
Financial Information
|
|||
|
A - Consolidated Statements and Other Financial Information.
|
14 - 21, 109 - 162
|
|||
|
B - Significant Changes.
|
160
|
|||
|
Item 9
|
The Offer and Listing.
|
|||
|
A - Offer and listing details.
|
176
|
|||
|
B - Plan of distribution.
|
n/a
|
|||
|
C - Markets.
|
173
|
|||
|
D - Selling shareholders.
|
n/a
|
|||
|
E - Dilution.
|
n/a
|
|||
|
F - Expenses of the issue.
|
n/a
|
|||
|
Item 10
|
Additional Information.
|
|||
|
A - Share capital.
|
173 - 176
|
|||
|
B - Memorandum and articles of association.
|
172, 179 - 182
|
|||
|
C - Material contracts.
|
178 - 179
|
|||
|
D - Exchange controls.
|
182
|
|||
|
E - Taxation.
|
183 - 185
|
|||
|
F - Dividends and paying agents.
|
n/a
|
|||
|
G - Statement by experts.
|
n/a
|
|||
|
H - Documents on display.
|
182
|
|||
|
I - Subsidiary Information.
|
160 - 162
|
|||
|
Item 11
|
Quantitative and Qualitative Disclosures about Market Risk.
|
129 - 132, 156 - 158
|
||
|
Item 12
|
Description of Securities Other than Equity Securities.
|
|||
|
A - Debt Securities.
|
n/a
|
|||
|
B - Warrants and Rights.
|
n/a
|
|||
|
C - Other Securities.
|
n/a
|
|||
|
D - American Depository Shares.
|
n/a
|
|||
|
|
P a g e |
200
|
|
Page
|
||||
|
|
||||
|
Item 13
|
Defaults, Dividend Arrearages and Delinquencies.
|
n/a
|
||
|
Item 14
|
Material Modifications to the Rights of Security Holders and Use of Proceeds.
|
n/a
|
||
|
Item 15
|
Controls and Procedures.
|
108, 196 - 197
|
||
|
Item 16A
|
Audit committee financial expert.
|
69
|
||
|
Item 16B
|
Code of Ethics.
|
53
|
||
|
Item 16C
|
Principal Accountant Fees and Services.
|
144, 197
|
||
|
Item 16D
|
Exemptions from the Listing Standards for Audit Committees.
|
n/a
|
||
|
Item 16E
|
Purchases of Equity Securities by the Issuer and Affiliated Purchasers.
|
n/a
|
||
|
Item 16F
|
Change in Registrant’s Certifying Accountant.
|
n/a
|
||
|
Item 16G
|
Corporate Governance.
|
53
|
||
|
Item 16H
|
Mine Safety Disclosure
|
n/a
|
||
|
|
||||
|
Item 17
|
Financial Statements.
|
109 - 162
|
||
|
Item 18
|
Financial Statements.
|
n/a
|
||
|
Item 19
|
Exhibits.
|
201
|
||
|
|
P a g e |
201
|
EXHIBITS
The following documents, which form a part of this Annual Report on Form 20-F, have been filed with the US Securities and Exchange Commission (SEC) via its EDGAR system and can be viewed on the SEC’s website at www.sec.gov.
|
Articles of Association of CCEP (incorporated by reference to Exhibit 3 to CCEP’s Form S-8 registration statement filed with the SEC on June 1, 2016)
.
|
|
|
Shareholders’ Agreement by and among the Company, Olive Partners, S.A., European Refreshments, Coca-Cola GmbH and Vivaqa Beteiligungs GmbH & Co. KG (incorporated by reference to Annex C to the proxy statement/prospectus contained in CCEP’s Form F-4/A registration statement filed with the SEC on April 11, 2016).
|
|
|
Registration Rights Agreement by and among the Company and the shareholder parties thereto (incorporated by reference to Exhibit 2.7 to the Current Report on Form 8-K filed by Coca-Cola Enterprises, Inc. with the SEC on August 12, 2015).
|
|
|
Form of Bottler’s Agreement entered into between The Coca-Cola Company and the bottling subsidiaries of CCEP (incorporated by reference to Exhibit 10.7 to the Company’s Form F-4/A registration statement filed with the SEC on April 7, 2016).
|
|
|
Coca-Cola European Partners plc Long-Term Incentive Plan 2016 (incorporated by reference to Exhibit 4.1 to CCEP’s Form S-8 registration statement filed with the SEC on June 1, 2016).
|
|
|
Rules of the Coca-Cola Enterprises Belgium/Coca-Cola Enterprises Services Belgian and Luxembourg Share Savings Plan (incorporated by reference to Exhibit 4.3 to CCEP’s Form S-8 registration statement filed with the SEC on June 1, 2016).
|
|
|
Trust Deed and Rules of Coca-Cola Enterprises UK Share Plan (incorporated by reference to Exhibit 4.2 to the Company’s Form S-8 registration statement filed with the SEC on June 1, 2016).
|
|
|
The Coca-Cola Enterprises, Inc. 2010 Incentive Award Plan (As Amended Effective February 7, 2012) (incorporated by reference to Exhibit 99.1 to Coca-Cola Enterprises, Inc.’s Current Report on Form 8-K filed on February 9, 2012).
|
|
|
The Coca-Cola Enterprises, Inc. Legacy Long-Term Incentive Plan As Amended and Restated (Effective December 14, 2010) (incorporated by reference to Exhibit 10.9.1 to Coca-Cola Enterprises, Inc.’s Annual Report on Form 10-K filed on February 14, 2011).
|
|
|
Deed of Assumption and Replacement relating to Equity Awards of Coca-Cola Enterprises, Inc. (incorporated by reference to Exhibit 4.3 to the Company’s Post-Effective Amendment No. 1 on Form S-8 to Form F-4 registration statement filed with the SEC on June 1, 2016).
|
|
|
Transaction Master Agreement dated August 6, 2015 (as amended on December 14, 2015 and April 7, 2016 by the Amendment and Restatement Deed) among Coca-Cola Enterprises Inc., Coca-Cola European Partners Limited, Orange MergeCo, LLC, Orange U.S. HoldCo, LLC, European Refreshments, Coca-Cola GmbH, Vivaqa Beteiligungs GmbH & Co. KG and Coca-Cola Iberian Partners, S.A. (incorporated by reference to Annex A to the proxy statement/prospectus contained in CCEP’s Form F-4/A registration statement filed with the SEC on April 11, 2016).
|
|
|
Merger Agreement dated August 6, 2015 among Coca-Cola Enterprises Inc., Coca-Cola European Partners Limited, Orange MergeCo, LLC and Orange U.S. HoldCo, LLC (included as Annex B to the proxy statement/prospectus contained in the Company’s Form F-4/A registration statement filed with the SEC on April 11, 2016).
|
|
|
Olive Contribution Agreement by and between the Company and Olive Partners, S.A. (incorporated by reference to Exhibit 2.5 to the Current Report on Form 8-K filed by Coca-Cola Enterprises, Inc. with the SEC on August 12, 2015).
|
|
|
Black Contribution Agreement by and among the Company, European Refreshments, Coca-Cola GmbH and Vivaqa Beteiligungs Gmbh & Co. KG (incorporated by reference to Exhibit 2.4 to the Current Report on Form 8-K filed by Coca-Cola Enterprises, Inc. with the SEC on December 15, 2015).
|
|
|
Olive Framework Agreement (English translation) (incorporated by reference to Exhibit 10.5 to the proxy statement/prospectus contained in the Company’s Form F-4 registration statement filed with the SEC on December 15, 2015).
|
|
|
List of Subsidiaries of the Company (included in Note 26 of the consolidated financial statements in this Annual Report on Form 20-F).
|
|
|
Rule 13a-14(a) Certification of Damian Gammell
|
|
|
Rule 13a-14(a) Certification of Nik Jhangiani
|
|
|
Rule 13a-14(b) Certifications
|
|
|
Consent of Ernst & Young LLP, UK
|
|
|
Consent of Ernst & Young LLP, US
|
|
|
Exhibit 101.INS
|
XBRL Instance Document
|
|
Exhibit 101.SCH
|
XBRL Taxonomy Extension Schema Document
|
|
Exhibit 101.CAL
|
XBRL Taxonomy Extension Calculation Linkbase Document
|
|
Exhibit 101.DEF
|
XBRL Taxonomy Extension Definition Linkbase Document
|
|
Exhibit 101.LAB
|
XBRL Taxonomy Extension Label Linkbase Document
|
|
Exhibit 101.PRE
|
XBRL Taxonomy Extension Presentation Linkbase Document
|
The total amount of long-term debt securities of the Company and its subsidiaries authorised under any one instrument does not exceed 10% of the total assets of the Company and its subsidiaries on a consolidated basis. The Company agrees to furnish copies of any or all such instruments to the SEC on request.
|
|
P a g e |
202
|
SIGNATURES
The registrant hereby certifies that it meets all of the requirements for filing on Form 20-F and that it has duly caused and authorised the undersigned to sign the Annual Report and Form 20-F on its behalf.
Coca-Cola European Partners plc
_____/s/ Damian Gammell_____
Damian Gammell
Chief Executive Officer
15 March 2018
|
|
P a g e |
203
|
GLOSSARY
Unless the context otherwise requires, the following terms have the meanings shown below.
|
Admission
|
the date of the Company’s admission to the UK market (28 May 2016)
|
|
AGM
|
Annual General Meeting
|
|
Articles
|
Articles of Association of Coca-Cola European Partners plc
|
|
ATC
|
Affiliated Transaction Committee
|
|
Board
|
Board of Directors of Coca-Cola European Partners plc
|
|
Brexit
|
the potential departure of the UK from the EU
|
|
Bribery Act
|
the UK Bribery Act 2010
|
|
Business Unit
|
a business unit of the Group
|
|
CCE or Coca-Cola Enterprises
|
Coca-Cola Enterprises, Inc.
|
|
CCEG or Coca-Cola Erfrischungsgetränke or Germany
|
Coca-Cola Erfrischungsgetränke GmbH
|
|
CCEP or the Group
|
Coca-Cola European Partners plc and its subsidiaries and subsidiary undertakings from time to time
|
|
CCIP or Coca-Cola Iberian Partners
|
Coca-Cola Iberian Partners, S.A.
|
|
CDP
|
formerly known as the Carbon Disclosure Project
|
|
CEO
|
Chief Executive Officer (of Coca-Cola European Partners plc)
|
|
CFO
|
Chief Financial Officer (of Coca-Cola European Partners plc)
|
|
CGU
|
cash generating units
|
|
the Chairman
|
the Chairman of Coca-Cola European Partners plc
|
|
CIO
|
Chief Information Officer (of Coca-Cola European Partners plc)
|
|
Cobega
|
Cobega, S.A.
|
|
the Coca-Cola system
|
comprises The Coca-Cola Company and more than 250 bottling partners worldwide
|
|
the Code
|
the UK Corporate Governance Code (April 2016 edition)
|
|
CODM
|
chief operating decision maker
|
|
the Committee(s)
|
the five committees with delegated authority from the Board: the Audit, Remuneration, Nomination, Corporate Social Responsibility and Affiliated Transaction Committees
|
|
the Committee Chairman/Chairmen
|
the Chairman/Chairmen of the Committee(s)
|
|
Committee member(s)
|
member(s) of the Committees
|
|
the Companies Act
|
the UK Companies Act 2006, as amended
|
|
the Company
|
Coca-Cola European Partners plc
|
|
Company Secretary
|
Company Secretary (of Coca-Cola European Partners plc)
|
|
COO
|
Chief Operating Officer (of Coca-Cola European Partners plc)
|
|
CSR
|
Corporate Social Responsibility
|
|
CTA
|
Contractual Trust Arrangement
|
|
the Director(s)
|
a (the) director(s) of Coca-Cola European Partners plc
|
|
DEFRA
|
UK Department for Environment, Food and Rural Affairs
|
|
DJSI
|
Dow Jones Sustainability Index
|
|
the DTRs
|
the Disclosure Guidance and Transparency Rules of the UK Financial Conduct Authority
|
|
EBITDA
|
earnings before interest, tax, depreciation and amortisation
|
|
EEA
|
European Economic Area
|
|
EPS
|
earnings per share
|
|
EU
|
European Union
|
|
European Refreshments or ER
|
European Refreshments, a wholly-owned subsidiary of TCCC
|
|
the Executive Leadership Team or ELT
|
the CEO and his direct senior leadership reports
|
|
FCPA
|
US Foreign Corrupt Practices Act of 1977
|
|
FIFO
|
first-in, first-out method
|
|
FMCG
|
fast-moving consumer goods
|
|
|
P a g e |
204
|
|
FPI
|
foreign private issuer, a term that applies to a company under the rules of the New York Stock Exchange that is not a domestic US company
|
|
the FRC
|
the Financial Reporting Council
|
|
FRS
|
Financial Reporting Standards
|
|
FTSE4Good
|
a series of ethical investment stock market indices launched in 2001 by the FTSE Group
|
|
GAAP
|
Generally Accepted Accounting Principles
|
|
GDPR
|
General Data Protection Regulation of the EU
|
|
GHG
|
greenhouse gas
|
|
the Group or CCEP
|
Cola-Cola European Partners plc and its subsidiaries and subsidiary undertakings from time to time
|
|
HMRC
|
the UK’s tax authority, Her Majesty’s Revenue and Customs
|
|
IAS
|
International Accounting Standards
|
|
IASB
|
International Accounting Standards Board
|
|
IAS Regulations
|
International Accounting Standards (IAS) Regulations relate to the harmonisation of the financial information presented by issuers of securities in the European Union
|
|
IEA
|
International Energy Agency
|
|
IFRS
|
International Financial Reporting Standards
|
|
INEDs
|
independent non-executive directors of Coca-Cola European Partners plc
|
|
Initial INEDs
|
independent non-executive directors who were appointed to the Company’s Board on completion of the Merger
|
|
the IRC
|
the US Internal Revenue Code of 1986, as amended
|
|
ISAE 3000
|
International Standard on Assurance Engagements 3000
|
|
ISO
|
International Organisation for Standardisation
|
|
the Listing Rules or LRs
|
the Listing Rules of the UK Financial Conduct Authority
|
|
LTIP
|
Long-Term Incentive Plan
|
|
the Merger
|
the formation of Coca-Cola European Partners plc on 28 May 2016 through the combination of the businesses of Coca-Cola Enterprises, Inc., Coca-Cola Iberian Partners, S.A. and Coca-Cola Erfrischungsgetränke GmbH
|
|
NARTD
|
non-alcoholic ready to drink
|
|
NGO
|
non-governmental organisation
|
|
NYSE
|
New York Stock Exchange
|
|
OFAC
|
Office of Foreign Assets Control of the US Department of the Treasury
|
|
the Official List
|
the Official List is the list maintained by the Financial Conduct Authority of securities issued by companies for the purpose of those securities being traded on a UK regulated market such as Euronext London
|
|
Olive Partners
|
Olive Partners, S.A.
|
|
the Paris Climate Agreement
|
the agreement on climate change resulting from UN COP21, the UN Climate Change Conference, also known as the 2015 Paris Climate Conference
|
|
PET
|
polyethylene terephthalate
|
|
the Remuneration Policy
|
the Remuneration Policy as approved by shareholders at the Company’s AGM held on 22 June 2017
|
|
rPET
|
recycled PET
|
|
the Prospectus
|
the prospectus dated 25 May 2016 issued to investors regarding the admission to the standard listing segment of the Official List and to trading on Euronext London and the Barcelona, Bilbao, Madrid and Valencia Stock Exchanges (together the Spanish Stock Exchanges)
|
|
|
P a g e |
205
|
|
PSU
|
performance share units
|
|
ROIC
|
return on invested capital
|
|
RSU
|
restricted share units
|
|
SEC
|
Securities Exchange Commission of the US
|
|
the Shareholders’ Agreement
|
the shareholders’ agreement dated 28 May 2016 between Coca-Cola European Partners plc and Olive Partners, S.A., European Refreshments, Coca-Cola GmbH and Vivaqa Beteiligungs Gmbh & Co. KG
|
|
Shares
|
ordinary shares of €0.01 of Coca-Cola European Partners plc
|
|
SID
|
Senior Independent Director
|
|
SOX or the Sarbanes-Oxley Act
|
the US Sarbanes-Oxley Act of 2002
|
|
the Spanish Stock Exchanges
|
the Barcelona, Bilbao, Madrid and Valencia Stock Exchanges
|
|
TCCC
|
The Coca-Cola Company
|
|
TSR
|
total shareholder return
|
|
UK Accounting Standards
|
Financial Reporting Standards issued by the Accounting Standards Board
|
|
UNESDA
|
Union of European Soft Drinks Associations
|
|
unit case
|
approximately 5.678 litres or 24 servings, a typical volume measurement unit.
|
|
US GAAP
|
the US Generally Accepted Accounting Principles
|
|
WEEE
|
EU Directive on Waste Electrical and Electronic Equipment
|
|
WRI/WBCSD GHG Protocol
|
World Resources Institute/World Business Council for Sustainable Development Greenhouse Gas Protocol
|
|
|
P a g e |
206
|
USEFUL ADDRESSES
Registered office
Coca-Cola European Partners plc
Pemberton House
Bakers Road
Uxbridge
UB8 1EZ
Registered in England and Wales
Company number: 9717350
Share registration
|
US shareholders:
|
Shareholders in Europe and outside the US:
|
|
Computershare
462 South 4th Street
Suite 1600
Louisville
KY, 40202
1-877-373-6374
|
Computershare
The Pavilions
Bridgewater Road
Bristol
BS13 8AE
+44 (0)370 702 0003
|
Report ordering
Shareholders who have not previously requested a paper copy of the Annual Report but would like to receive one, which will be despatched from 20 April 2018, can make their request by sending an email to sendmaterial@proxyvote.com or by making a request via www.proxyvote.com or by phoning (in the US) 1-800-579-1639 or (outside the US) +1-800-579-1639.
|
|
P a g e |
207
|
FORWARD LOOKING STATEMENTS
This document may contain statements, estimates or projections that constitute “forward-looking statements” concerning the financial condition, performance, results, strategy and objectives of Coca-Cola European Partners plc (the Company) and the Group. Generally, the words “believe,” “expect,” “intend,” “estimate,” “anticipate,” “project,” “plan,” “seek,” “may,” “could,” “would,” “should,” “might,” “will,” “forecast,” “outlook,” “guidance,” “possible,” “potential,” “predict” and similar expressions identify forward-looking statements, which generally are not historical in nature.
Forward-looking statements are subject to certain risks that could cause actual results to differ materially from CCEP’s and the Group’s historical experience and present expectations or projections. As a result, undue reliance should not be placed on forward-looking statements, which speak only as of the date on which they are made. These risks and uncertainties include but are not limited to those set forth in the “Risk Factors” section of this Annual Report on Form 20-F, including the statements under the following headings: Risks Relating to Consumer Preferences and the Health Impact of Soft Drinks; Risks Relating to Legal and Regulatory Intervention; Risks Relating to Business Integration and Synergy Savings; Risks Relating to Cyber and Social Engineering Attacks; Risks Relating to the Market; Risks Relating to Economic and Political Conditions; Risks Relating to the Relationship with TCCC and Other Franchisors; Risks Relating to Product Quality; and Other Risks.
Due to these risks and uncertainties, the Company’s or the Group’s actual future results, dividend payments, and capital and leverage ratios may differ materially from the plans, goals, expectations and guidance set out in the Company’s or the Group’s forward-looking statements. Additional risks and uncertainties that may impact the Company’s or the Group’s future financial condition and performance are identified in filings with the SEC which are available on the SEC’s website at www.sec.gov. The Company does not undertake any obligation to publicly update or revise any forward-looking statements, whether as a result of new information, future events, or otherwise, except as required under applicable rules, laws and regulations. The Company assumes no responsibility for the accuracy and completeness of any forward-looking statements. Any or all of the forward-looking statements contained in this filing and in any other of the Company’s respective public statements may prove to be incorrect.
|
|
P a g e |
208
|

TABLE OF CONTENTS
Part 1Item 1 Identity Of Directors, Senior Management and Advisors N/aItem 2 Offer Statistics and Expected Timetable N/aItem 3 Key InformationItem 4 Information on The CompanyItem 4A Unresolved Staff Comments N/aItem 5 Operating and Financial Review and ProspectsItem 6 Directors, Senior Management and EmployeesItem 7 Major Shareholders and Related Party TransactionsItem 8 Financial InformationItem 9 The Offer and ListingItem 10 Additional InformationItem 11 Quantitative and Qualitative Disclosures About Market Risk. 129 - 132, 156 - 158Item 12 Description Of Securities Other Than Equity SecuritiesPart IIItem 13 Defaults, Dividend Arrearages and Delinquencies. N/aItem 14 Material Modifications To The Rights Of Security Holders and Use Of Proceeds. N/aItem 15 Controls and Procedures. 108, 196 - 197Item 16A Audit Committee Financial Expert. 69Item 16B Code Of Ethics. 53Item 16C Principal Accountant Fees and Services. 144, 197Item 16D Exemptions From The Listing Standards For Audit Committees. N/aItem 16E Purchases Of Equity Securities By The Issuer and Affiliated Purchasers. N/aItem 16F Change in Registrant S Certifying Accountant. N/aItem 16G Corporate Governance. 53Item 16H Mine Safety Disclosure N/aPart IIIItem 17 Financial Statements. 109 - 162Item 18 Financial Statements. N/aItem 19 Exhibits. 201