CROSS COUNTRY HEALTHCARE INC
10-Ks and 10-Qs
|
|
|
|
|
|
|
|
|
|
|
|
|
|
|
|
|
|
|
|
|
|
|
|
|
|
|
|
|
|
|
|
|
|
|
|
|
|
|
|
|
|
|
|
|
|
|
|
|
|
|
|
|
UNITED STATES
SECURITIES AND EXCHANGE COMMISSION
Washington, D.C. 20549
__________________
FORM 10-K
|
þ
|
ANNUAL REPORT PURSUANT TO SECTION 13 OR 15(d) OF THE SECURITIES EXCHANGE ACT OF 1934
|
For the Fiscal Year Ended December 31, 2017
or
|
o
|
TRANSITION REPORT PURSUANT TO SECTION 13 OR 15(d) OF THE SECURITIES EXCHANGE ACT OF 1934
|
For the transition period from
__________
to
__________
Commission file number 0-33169

Cross Country Healthcare, Inc.
(Exact name of registrant as specified in its charter)
|
Delaware
|
13-4066229
|
|
(State or other jurisdiction of incorporation or organization)
|
(I.R.S. Employer Identification No.)
|
5201 Congress Avenue, Suite 100B
Boca Raton, Florida 33487
(Address of principal executive offices, zip code)
Registrant’s telephone number, including area code:
(561) 998-2232
Securities registered pursuant to Section 12(b) of the Act:
|
Title of each class
|
Name of each exchange on which registered
|
|
Common Stock, par value $0.0001 per share
|
The NASDAQ Stock Market
|
Securities registered pursuant to Section 12(g) of the act: None
Indicate by check mark if the Registrant is a well-known seasoned issuer, as defined in Rule 405 of the Securities Act. Yes
o
No
þ
Indicate by check mark if the Registrant is not required to file reports pursuant to Section 13 or Section 15(d) of the Act. Yes
o
No
þ
Indicate by check mark whether the Registrant: (1) has filed all reports required to be filed by Section 13 or 15(d) of the Securities Exchange Act of 1934 during the preceding 12 months (or for such shorter period that the Registrant was required to file such reports), and (2) has been subject to such filing requirements for the past 90 days. Yes
þ
No
o
Indicate by check mark whether the registrant has submitted electronically and posted on its corporate web site, if any, every Interactive Data File required to be submitted and posted pursuant to Rule 405 of Regulation S-T during the preceding 12 months (or for such shorter period that the registrant was required to submit and post such files). Yes
þ
No
o
Indicate by check mark if disclosure of delinquent filers pursuant to Item 405 of Regulation S-K (§ 229.405 of this chapter) is not contained herein, and will not be contained, to the best of Registrant’s knowledge, in definitive proxy or information statements incorporated by reference in Part III of this Form 10-K or any amendment to this Form 10-K.
þ
Indicate by check mark whether the Registrant is a large accelerated filer, an accelerated filer, a non-accelerated filer, or a smaller reporting company. See the definitions of “large accelerated filer,” “accelerated filer” and “smaller reporting company” in Rule 12b-2 of the Exchange Act: Large accelerated filer
o
Accelerated filer
þ
Non-accelerated filer
o
Smaller reporting company
o
If an emerging growth company, indicate by check mark if the registrant has elected not to use the extended transition period for complying with any new or revised financial accounting standards provided pursuant to Section 13(a) of the Exchange Act. ☐
Indicate by check mark whether the Registrant is a shell company (as defined by Rule 12b-2 of the Act). Yes
o
No
þ
The aggregate market value of the voting stock held by non-affiliates of the Registrant, based on the closing price of Common Stock on June 30, 2017 of
$12.91
as reported on the NASDAQ National Market, was $454,055,531. This calculation does not reflect a determination that persons are affiliated for any other purpose.
As of February 26, 2018, 36,431,790 shares of Common Stock, $0.0001 par value per share, were outstanding.
DOCUMENTS INCORPORATED BY REFERENCE
Portions of the Registrant’s definitive proxy statement, for the 2018 Annual Meeting of Stockholders, which statement will be filed pursuant to Regulation 14A not later than 120 days after the end of the fiscal year covered by this Report, are incorporated by reference into Part III hereof.
TABLE OF CONTENTS
|
|
|
Page
|
|
|
|
|
|
|
|
|
|
|
|
|
|
|
|
|
|
|
|
|
|
|
|
|
|
|
|
|
|
|
|
|
|
PART I
I
|
||
|
|
|
|
|
|
|
|
|
|
|
|
|
|
|
|
|
|
|
|
|
|
|
|
|
|
|
|
|
|
|
|
|
|
|
|
|
|
|
|
|
|
|
|
|
|
|
|
|
|
|
|
|
|
|
|
|
|
|
|
|
|
|
|
|
|
|
|
|
|
|
|
All references to “we,” “us,” “our,” or “Cross Country” in this Report on Form 10-K means Cross Country Healthcare, Inc., its subsidiaries and affiliates.
Forward-Looking Statements
In addition to historical information, this Form 10-K contains statements relating to our future results (including certain projections and business trends) that are “forward-looking statements” within the meaning of Section 27A of the Securities Act of 1933, as amended, and Section 21E of the Securities Exchange Act of 1934, as amended (the Exchange Act), and are subject to the “safe harbor” created by those sections. Words such as “expects”, “anticipates”, “intends”, “plans”, “believes”, “estimates”, “suggests”, “appears”, “seeks”, “will” and variations of such words and similar expressions are intended to identify forward-looking statements. These statements involve known and unknown risks, uncertainties and other factors that may cause our actual results and performance to be materially different from any future results or performance expressed or implied by these forward-looking statements. Factors that might cause such differences include, but are not limited to, those discussed in the section entitled “Item 1A - Risk Factors.” Readers should also carefully review the “Risk Factors” section contained in other documents we file from time to time with the Securities and Exchange Commission, including the Quarterly Reports on Form 10-Q to be filed by us in fiscal year 2018.
Although we believe that these statements are based upon reasonable assumptions, we cannot guarantee future results and readers are cautioned not to place undue reliance on these forward-looking statements, which reflect management’s opinions only as of the date of this filing. There can be no assurance that (i) we have correctly measured or identified all of the factors affecting our business or the extent of these factors’ likely impact, (ii) the available information with respect to these factors on which such analysis is based is complete or accurate, (iii) such analysis is correct or (iv) our strategy, which is based in part on this analysis, will be successful. The Company undertakes no obligation to update or revise forward-looking statements.
Overview of Our Company
Cross Country Healthcare, Inc. (NASDAQ: CCRN) is a national leader in providing healthcare staffing, recruiting and value-added workforce solutions. Through a full suite of innovative workforce solutions and a national presence including 76 office locations throughout the United States (U.S.), we are able to meet the unique and dynamic needs of our clients. By utilizing our various solutions, clients are able to better plan their personnel needs, outsource recruitment processes, strategically flex their workforce, streamline their purchasing needs, access specialties not available in their local area, access quality healthcare personnel and provide continuity of care for improved patient outcomes.
Our solutions are geared towards assisting our clients in solving their labor issues while maintaining high quality outcomes. We are increasingly being called upon to provide more creative and strategic talent sourcing strategies, particularly to find efficiencies to support cost containment programs and to access hard to find specialties in the current tight labor market. Over the past several years, our Managed Service Programs (MSPs) have shifted to more of a total talent management relationship as our clients continue to focus on improving labor management to address complex financial, compliance, and other challenges in the healthcare industry. In the past 24 months, we have won 23 additional MSP contracts, and for the full year ended December 31, 2017, approximately 30% of our revenue was generated through MSP contracts. During 2017, we had more than 29,000 healthcare professionals on assignment at 6,975 facilities, and our MSPs served approximately 500 facilities.
Our workforce solutions include:
l
Managed Service Programs (MSPs);
l
Optimal Workforce Solutions (OWS);
l
Education Healthcare Services;
l
Electronic Medical Record Transition Staffing (EMR);
l
Recruitment Process Outsourcing (RPO); and
l
Internal Resource Pool Consulting & Development (IRP).
We are able to provide our services on a national level or through any one of our 69 local branches throughout the United States or through a combination of both. We service a variety of clients, including public and private acute care hospitals, public and charter schools, outpatient clinics, ambulatory care facilities, single and multi-specialty physician practices, rehabilitation facilities, urgent care centers, correctional facilities, government facilities, retailers, and many other healthcare providers. Our business consists of three business segments: (i) Nurse and Allied Staffing, (ii) Physician Staffing, and (iii) Other Human Capital Management Services. Fees for our services are paid directly by our clients and in certain instances by vendor managers, and as a result, we have no direct exposure to Medicare or Medicaid reimbursements.
1
Our consolidated 2017 revenue was $865.0 million, reflecting a diversified revenue mix across healthcare customers. Nurse and Allied Staffing was 88% of revenue, comprised of travel nurse, travel allied, and branch-based local nurse and allied staffing (including staffing of public and charter schools). Physician Staffing was 10% of our revenue and consists primarily of physician staffing services with placements across multiple specialties. Other Human Capital Management Services was 2% of our revenue, which consists of our retained and contingent search services primarily for physicians and healthcare executives. On a company-wide basis, we have approximately 6,600 active contracts with healthcare clients, and we provide our staffing services and workforce solutions in all 50 states. In 2017, 2016, and 2015 no client accounted for more than 10% of our revenue. For additional financial information concerning our business segments, see Note 17 - Segment Data to the consolidated financial statements.
Acquisitions
We follow a structured disciplined approach with clearly identified objectives to make strategic acquisitions. Historically, we have acquired companies to improve our position in the four sectors of healthcare where we participate. Accordingly, we acquired traditional healthcare staffing companies such as travel nurse, travel allied, and per diem staffing. The strategic rationale for making acquisitions in Nurse and Allied Staffing has been to: (i) expand our workforce solutions offerings to deepen our relationships with current customers and to attract new customers; (ii) expand our local branch network to grow our local market presence and our MSP business; (iii) further diversify our customer base into the public and charter school market; (iii) diversify our customer base into the local ambulatory care and retail market, which provides more balance between our large volume-based customers and our small local customers; (iv) better position ourselves to take additional market share in our MSP business; (v) access more candidates and candidates in different specialties; and (vi) add new skill sets to our traditional staffing offerings.
In 2015 we expanded our acquisition strategy and acquired Mediscan, an education healthcare staffing company. Staffing of speech language pathologists, physical therapists, and other healthcare workers in schools (public and private) is: (i) mandated by the government; and (ii) not as sensitive to changes in the economy. We believe the higher margin education healthcare staffing market complements our current business and provides an opportunity to add new service lines and further diversify our customer base, as the Mediscan business is divided between acute/ambulatory care and public and charter schools.
In July 2017, we were presented with an opportunity to acquire a quality nurse staffing company, Advantage RN, LLC (Advantage). We acquired the Advantage business to supplement the number of nurses we place at our MSP clients, increase our capture rate, and reduce the number of positions outsourced to subcontractors. In addition, this acquisition provides a vehicle for us to cross-sell our MSP solutions to Advantage's clients, and increase our footprint in the Midwest where Advantage is located. In the fourth quarter of 2017, Advantage had an average of 750 nurses on assignment throughout the United States.
In December 2016, we acquired an RPO business, US Resources Healthcare. The rationale for this acquisition was to increase our workforce solutions capabilities to deliver financial and operating efficiencies to our customers through labor optimization services while enhancing the quality of care. By partnering with our customers to design and execute a tailored solution to meet their talent and business goals, we are able to find the talent our customers need. For additional financial information concerning our acquisitions, see Note 3 - Acquisitions to the consolidated financial statements.
Competition
The principal competitive factors in attracting, retaining, and expanding business with healthcare clients nationally include: (i) understanding the client’s work environment; (ii) offering a comprehensive suite of services to assist the client in assessing its personnel needs and partnering with clients to design various customizable alternative solutions; (iii) the timely filling of clients' needs; (iv) price; (v) customer service; (vi) quality assurance and screening capabilities; (vii) risk management policies; (viii) insurance coverage; and (ix) general industry reputation. The principal competitive factors in attracting qualified healthcare professionals for temporary employment include: (i) a large national pool of desirable assignments; (ii) pay and benefits; (iii) speed of placements; (iv) customer service; (v) quality of accommodations; and (vi) overall industry reputation. We focus on retaining healthcare professionals by providing high-quality customer service, long-term benefits (to employees), and medical malpractice insurance.
We believe we are one of only two large full-service healthcare staffing providers with a national footprint; one of the top five providers of physician staffing services in the United States; and one of the top providers of retained and contingent physician and healthcare executive search services in the healthcare marketplace. Some of our competitors in the healthcare staffing, workforce solutions, and search businesses include: AMN Healthcare Services, Inc., CHG Healthcare Services, Maxim Healthcare, Jackson Healthcare, Team Health, HealthTrust Workforce Solutions, MedAssets, and Witt Kiefer.
We believe we benefit competitively from the following:
2
Breadth and Expertise of Value-Added Workforce Solutions Offered.
As a long-time leader of MSP solutions, our additional services include: OWS, Education Healthcare Staffing Services, EMR staffing, RPO, and IRP. Our holistic approach is to deploy cost effective labor optimization strategies uniquely designed for each customer, all while ensuring quality of care for patients.
|
-
|
MSP Capabilities
.
Rather than an acute care facility’s talent management team working with multiple staffing agencies, our MSP model offers a consultative approach to address total talent management, a single point of contact, access to a nationwide network of subcontractors, uniform rates and terms, and accountability for the quality of healthcare professionals to our clients through the aggregation and standardization of total contract labor spend. This MSP model has become a desired practice of healthcare systems seeking to drive financial and operating efficiencies, while ensuring quality of care.
|
|
-
|
OWS. These services allow our clients to outsource certain non-core department staff that may be particularly challenging to recruit and retain. By outsourcing these departments to our OWS team, our clients can better control their operating costs, gain access to our talent management expertise, free their internal resources for other purposes, streamline or increase efficiency for certain functions, and improve their overall focus.
|
|
-
|
Education Healthcare Staffing Services. By providing consultative and staffing services to traditional public and charter school clients, we help them achieve performance and cost savings goals while experiencing greater flexibility in their operations.
|
|
-
|
EMR. Based on the government mandate for hospitals to convert to Electronic Medical Records to ensure payment for services, we developed a sound transition and implementation process to help our clients backfill staffing needs while they adopt a new or upgraded EMR platform. Staffing plans are created in collaboration with our clients so they have adequate, planned, quality staffing to cover these peak vacancies.
|
|
-
|
RPO. We offer business process outsourcing where a client transfers all or part of its talent management recruitment processes to us and we can assume the design and management of the recruitment process and the responsibility for the results. The structure of this solution differs greatly from client to client as there is a continuum of scope of the services that may be provided (e.g. end to end services or hybrid solutions).
|
|
-
|
IRP. We consult with our clients to structure groups of their staff professionals that can be called upon when shortages exist or are expected. These professionals agree to fill positions when necessary and are available when called upon. They have experience with the facilities where they will work, so they are immediately up to speed with how things are done and what is expected from them the moment they arrive. This type of pool promotes quality of care and is cost-efficient for our clients.
|
Ability to Meet a National Shift Towards a More Integrated Delivery of Healthcare.
With our national resources, as well as local resources at our 69 local branches, we are uniquely positioned to assist hospitals and health systems which continue to turn to
lower-cost, more accessible alternatives, such as outpatient or ambulatory care centers as a result of the Patient Protection and Affordable Care Act (ACA) of 2010 and other market dynamics. By offering travel, per diem, and permanent placement of a variety of healthcare professionals, we are also able to offer many different types of personnel to hospitals and health systems at their main campuses, as well as their ambulatory and outpatient care centers, in order to meet their workforce needs.
Brand Recognition.
We go to market with a variety of brands, which are well-recognized among leading hospitals and healthcare facilities and many healthcare professionals. These businesses have been operating for more than twenty years.
Strong and Diverse Client Relationships.
We provide healthcare staffing and workforce solutions to a diverse client base throughout the United States with approximately 6,600 active contracts with hospitals and healthcare facilities, and other healthcare providers. As a result, we have a diverse choice of assignments for our healthcare professionals to choose from. In addition, our joint venture with a large health system's staffing subsidiary provides us with a unique insight into the challenges facing many of our hospital clients generally and this provides us with the opportunity to better serve all of our clients by designing and implementing workforce solutions to meet their needs. Our relationship with the largest member- owned healthcare services company in the United States should also serve to expand our relationships in the healthcare community.
Recruiting and Placement of Healthcare Professionals.
Healthcare professionals apply with us through our differentiated nursing, locum tenens, and allied healthcare recruitment brands. Our local branch network provides us access to local healthcare professionals who are uniquely qualified to provide care in ambulatory and outpatient settings. We believe our access to such a large and diverse group of healthcare professionals makes us more attractive to healthcare institutions and facilities seeking healthcare staffing and workforce solutions in the current dynamic marketplace.
Certifications.
The staffing businesses of our Cross Country Staffing, Medical Staffing Network (MSN), and Mediscan brands are certified by The Joint Commission under its Health Care Staffing Services Certification Program. In addition,
3
Credent Verification and Licensing Services, a subsidiary of Medical Doctor Associates (MDA), is certified by the National Committee of Quality Assurance (NCQA) -- one of only a handful of companies to achieve such certification.
Experienced Management Team.
On average, our executive management team has more than 20 years of staffing experience. Led by our President and Chief Executive Officer, a 30-year staffing industry veteran who joined the Company in April 2013, the Company has strengthened its leadership team by bringing in experienced executives.
Demand and Supply Drivers
Demand Drivers
Effect of ACA on Healthcare Utilization.
The ACA has increased the number of insured patients over the past few years, especially in states that have expanded Medicaid. It has been reported that the effect of the ACA on healthcare utilization has been that 20 million people have gained health insurance coverage, whether through the federal marketplace, Medicaid expansion, or individuals staying on their parents' health insurance plans (Obamacarefacts.com, January 2018). Despite the shortened enrollment period for 2018, an estimated 8,800,000 individuals have reportedly signed up for 2018 coverage via the federal health insurance exchange and 2017 enrollees were auto renewed in December 2017 for 2018 (Centers for Medicaid & Medicaid Services, Weekly Enrollment Snapshot, December, 2017). In addition, while the Tax Cuts and Jobs Act of 2017 Public Law No. 115-97 (2017 Tax Act) did away with the individual mandate, the elimination of that penalty does not go into effect until the beginning of 2019 and we expect many individuals to maintain insurance under their parents’ policies or otherwise. We believe the demand for healthcare professionals will continue as the number of insured has increased in the past few years under the ACA and with more persons employed who have healthcare insurance.
Creation of Healthcare Jobs Outpacing Other Industries and Occupations.
Healthcare represented 15% of all jobs created in 2017 (HealthleadersMedia.com, January 5, 2018). The Bureau of Labor Statistics recently released its latest 10-year projections of employment growth (from 2016 to 2026), with forecasts by various industries and occupations. Overall, employment is expected to grow 7.4%, far outpaced by employment in the healthcare industry (18%) and among healthcare occupations (18%) (Staffing Industry Analysts, December 14, 2017). This projected 18% growth varies, however, among three categories that make up the healthcare industry: (i) ambulatory healthcare services; (ii) nursing and residential care; and (iii) hospitals. Employment for ambulatory healthcare services is projected to grow 31%; nursing and residential care is projected to grow 13%, and hospital employment is projected to grow 6.8%. The creation of additional jobs in the healthcare market should increase demand for our services as our temporary staff are typically hired to replace healthcare workers taking vacation and leaves of absence.
Use of Temporary Workforce.
The December 2017 penetration rate of temporary workers was 2.1% (U.S. Bureau of Labor Statistics, 2017 Labor Force Statistics Database). We believe contingent labor will continue to be used strategically, as an increase in the use of temporary workers typically allows for cost-effective, time-sensitive solutions to specific business needs and allows organizations to leverage the skills of temporary workers while maintaining a lean staff of traditional permanent employees. Within the healthcare sector, we believe the current dynamic nature of the healthcare industry, among other things, has exacerbated hospitals’ needs for more flexibility to match revenue and payroll.
Hospitals Seeking Efficiencies to Reduce Costs.
Hospitals continue to face pressure to keep costs down to protect their margins from continued Medicare rate reductions and fluctuations in demand for hospital care. This will be further exacerbated if Congress targets entitlement programs to reduce spending on both federal healthcare and anti-poverty programs to reduce the U.S. deficit. In addition, the national shift away from volume-based pricing to value-based pricing continues. The visibility of Hospital Consumer Assessment of Healthcare Providers and Systems survey scores, a national, standardized, publicly reported survey of patients' perspectives of hospital care, has also put pressure on hospitals to maintain a certain level of quality of care so hospitals do not incur financial penalties or risk decreased patient volume due to low scores. We believe these dynamics continue to put pressure on hospitals to find innovative solutions in order to better manage their workforce, which accounts for a large portion of their expenses. Working with an MSP allows healthcare facilities to easily flex their workforce numbers up and down and to streamline their talent acquisition process by having one point-of-contact (Modern Healthcare, March 16, 2017). As a result, we believe hospitals are more willing to engage healthcare staffing companies, such as ours, that provide both staffing and workforce solutions that can help them solve problems, such as assessing their workforce needs or reducing readmission rates without negatively impacting the quality of care. Many hospitals are also making vertical acquisitions by investing in outpatient facilities, ambulatory care centers, and stand-alone emergency departments in order to capture outpatient revenue, which will further drive demand for healthcare personnel.
4
Outpatient/Ambulatory Settings Services Outpace Inpatient Services.
Job growth in ambulatory services such as physician's offices and dental clinics continues to outpace that of the hospital sector as the demand for outpatient services grows (HealthleadersMedia.com, May 8, 2017). The ambulatory sector added 14,800 jobs in December 2017, while hospitals added 12,400 jobs in the same period (Modern Healthcare, January 2018). We believe certain initiatives previously taken under the ACA - such as Medicare reimbursement incentives for reduced readmissions, have had a direct correlation to the shift from inpatient services to outpatient/ambulatory settings. We believe we are poised to take advantage of this trend given our 69 local branches that deliver services in local settings.
Growing and Aging U.S. Population.
Two long-term macro drivers of our business are demographic in nature -- a growing and aging U.S. population. The U.S. Census Bureau projects the U.S. population will increase approximately 31% (from 319 million in 2014 to 417 million in 2060) - crossing the 400 million mark in 2051. In addition, by 2030 one in five Americans is also projected to be 65 years old or more. The number of persons aged 65 and over is expected to increase to 98 million in 2060 (U.S. Census Bureau, 2015). Currently, there are 75 million baby boomers (Modern Healthcare, Nursing Shortage in Perspective, January 1, 2018), which is important because the utilization of healthcare services is generally higher among older people. The American Hospital Association (AHA) has also projected the share of hospital admissions for the over-65 age group to rise from 38% in 2004 to 56% in 2030. Currently, 80% of the baby boomer population has at least one chronic condition (Modern Healthcare, Nursing Shortage in Perspective, January 1, 2018). With the increase in the proportion of the population in older age groups reaching prime retirement age, healthcare occupations and industries are expected to have the fastest employment growth and to add the most jobs, increasing their employment share by four million people to 13.8% in 2026 (Healthcare Financial Management Association, October 30, 2017). Employment in the healthcare and social assistance sector is projected to add nearly 4 million jobs by 2026, about one-third of all new jobs (Modern Healthcare, Nursing Shortage in Perspective, January 1, 2018).
Nursing Shortage.
The Georgetown University Center on Education and the Workforce (CEW) predicts a shortage of 192,620 nurses in 2020, which differs from the surplus of nurses predicted for 2025 by the Health Resources and Services Administration (HRSA) National Center for Health Workforce Analysis (Georgetown University Center on Education and the Workforce (CEW), Forecasts of Nursing Demand 2015). With healthcare now representing almost 20% of the U.S. economy, the aging of the U.S. population, and the expansion of healthcare coverage under the ACA, both the CEW and HRSA agree that demand for healthcare services and healthcare workers will continue to grow. The CEW’s analysis of the nursing shortage differs from that of the HRSA in that the CEW has made assumptions on the “active supply” of nurses - noting there is a stark difference between the number of nursing professionals who are licensed and the number of nursing professionals in the workforce. In 2013, there were 5.2 million licensed nursing professionals, but only 3.6 million were employed in the nursing workforce - so one-third of licensed nurses do not work in nursing (Georgetown University CEW, Forecasts of Nursing Demand 2015). As further noted by CEW, “as the economy improves, many more nurses will have the option to leave the nursing workforce for other types of jobs or to retire.” By 2030, almost a million nurses will retire and leave the workforce taking with them the years of knowledge and experience they have accumulated (Modern Healthcare, Nursing Shortage In Perspective, January 1, 2018). In addition, even HRSA’s analysis notes that its national projection does not take into account an imbalance of RNs at the state level where many states are projected to experience a smaller growth in RN supply relative to their state-specific demand, resulting in a geographical shortage of RNs by 2025. If current trends hold, seven states will have a nursing shortage in 2030: Alaska, California, Georgia, New Jersey, South Carolina, South Dakota, and Texas (Modern Healthcare, Nursing Shortage In Perspective, January 1, 2018). Four of those states will have shortages of 10,000 or more nurses: California, New Jersey, South Carolina, and Texas (Modern Healthcare, Nursing Shortage In Perspective, January 1, 2018). HRSA’s national projection also does not take into account a projected shortfall of registered nurses in particular specialties over the next ten years (Georgetown University CEW, Forecasts of Nursing Demand 2015). We believe the following factors will continue to contribute to new growth in demand for nurses: the continued aging of the baby boomers, the changing landscape of the healthcare industry with emerging care delivery models focused on quality of care, managing health status and preventing acute health issues (e.g., nurses taking on new and/or expanded roles in preventive care and care coordination), an uncertain level of newly insured individuals in the healthcare market, the number of nurses approaching retirement, and the number of registered nurses that re-entered the workforce during the economic downturn that are now likely to leave their jobs during a better economy.
More People Working Who Are Now Insured.
The U.S. economy had a strong year in 2017, and the job market showed continued signs of growth with unemployment at 4.1% through December 2017 (U.S. Bureau of Labor Statistics, 2017 Labor Force Statistics Database). Individuals with employer-sponsored health insurance are more likely to seek medical care than the uninsured, which raises demand for healthcare services and healthcare staff (U.S. Healthcare Staffing Growth Assessment, Staffing Industry Analysts, December 2016). We believe the broader trends that created these labor market changes in 2017 will continue through 2018. Changes to tax rates should also boost the economy making jobs more attractive, thus continuing the consistent low unemployment trends from 2017. Temporary
5
staffing added jobs every month during 2017 and the December 2017 temporary penetration rate for the U.S. continued at a record high 2.10 percent (U.S. Bureau of Labor Statistics, 2017 Labor Force Statistics Database). The acceleration of the U.S. economy in 2017 has led to solid job growth, which we expect will result in more individuals receiving healthcare from their employers - thus supporting the demand for healthcare services.
Increased Need for Healthcare and Special Education Services in Schools.
The Individuals with Disabilities Education Act (IDEA), enacted in 1975, mandates that children and youth ages 3-21 with disabilities be provided a free and appropriate public school education. According to the U.S. Department of Education, National Center for Education Statistic Report titled “The Condition of Education" (May 2017),
the number of children and youth ages 3-21 receiving special education services was 6.7 million, or about 14% of traditional public and charter school enrollment. Of those students in school year 2014-15, 20% had a speech or language impairment, 13% had other health impairments, 9% had autism, 5% had emotional disturbances, 2% had multiple disabilities, and 1% had orthopedic impairments. The IDEA requires that these children and young adults receive care from speech language pathologists, physical therapists, occupational therapists, nurses and other healthcare professionals while at school. Based on the foregoing, we believe the demand for consulting and healthcare staffing services for public schools and charter schools will continue to be strong for agencies that can provide consulting services, healthcare personnel, technical assistance on policies, implementation, and training related to children and youth with special needs in school settings.
Physician Shortage.
The United States is expected to face a shortage of physicians over the next decade, according to a physician workforce report released by the Association of American Medical Colleges on April 5, 2016. The projections show a shortage ranging between 61,700 and 94,700 in 2025 as demand for physicians continues to outpace supply, according to the Association of American Medical Colleges, with a significant shortage showing among many surgical specialties. This demand is largely due to the projected aging of the population and the ACA. Nationally, almost one-third of active physicians are age 60 or older (2017 State Physician Workforce Data Report, Association of American Medical Colleges). In addition, approximately 25% of active physicians in the United States are international medical graduates (2017 State Physician Workforce Data Report, Association of American Medical Colleges). The U.S. is expected to face a shortage of up to 20,500 primary care physicians by 2020 -- a number that is expected to grow to up to 31,100 by 2025, according to analysis by the AAMC (March 2015). The projected shortfall of non-primary care physicians is expected to be up to 63,700 by 2025. The AAMC also expects nearly one-third of all physicians will retire in the next decade. And, while the number of applicants to U.S. medical schools is increasing, it is not expected to keep pace with expected future demand.
Supply Drivers
Networking.
We rely heavily on word-of-mouth referrals for our healthcare professionals. Historically, more than half of our field employees have been referred to us by other healthcare professionals. Our most effective “sales force” is our network of healthcare professionals who have taken temporary or permanent assignments with us or who are currently working for us. We continue to make investments in our online social and professional networks that have also made it easier for us to connect with healthcare professionals and stay connected with them, thus enhancing our recruitment efforts.
Traditional Reasons.
Nurses, allied professionals, and locum tenens physicians work on temporary assignments to experience different geographic regions of the United States without moving permanently, work flexible schedules, gain professional development by working at prestigious healthcare facilities, earn top money and bonuses, travel with friends and family while enjoying quality accommodations, experience various clinical settings, look for a permanent position, and avoid workplace politics often associated with permanent staff positions.
Nurse Retirements.
70,000 nurses are retiring annually and, by 2030, almost a million nurses will retire and leave the workforce taking with them the years of knowledge and experience they have accumulated (Modern Healthcare, Nursing Shortage In Perspective, January 1, 2018). The 2017 Survey of Registered Nurses, Viewpoints on Leadership, Nursing Shortages, and their Profession conducted by AMN Healthcare found that 36% of nurses surveyed said they are planning to retire in one year or less, and 46% of nurses in 2017 who are planning to retire said they will do it in four years or more. 73% of baby boomer nurses who are planning to retire say they will do so in three years or less (2017 Survey of Registered Nurses, AMN Healthcare). These findings support the proposition that significant nurse retirements are already underway (2017 Survey of Registered Nurses, AMN Healthcare).
Higher Quit Rates with an Improved Economy.
The Bureau of Labor Statistics uses the quit rate as a measure of workers’ willingness or ability to leave jobs. According to the February 6, 2018 Job Openings and Labor Turnover Survey Database, quits rose from 1.3% in December 2009 to 2.2% in December 2015 and was 2.2% through December 2017 (Bureau of Labor Statistics, Job Openings and Labor Turnover - December 2017). This increased quit
6
rate from reflected increased confidence among the workforce. The number of job openings reported at the end of December 2017 also remained steady at 5,800,000 (Bureau of Labor Statistics, Job Openings and Labor Turnover Survey, December 2017). With an improved economy and the low national unemployment rate, nurses do not appear as hesitant to quit or voluntarily leave their jobs. We believe with the increased volume of orders for temporary healthcare workers and as wages increase, staff nurses are more confident to change jobs and/or enter the temporary workforce. This is further supported by the 2017 Survey of Registered Nurses conducted by AMN Healthcare that found fewer nurses are planning to remain in their current positions, and some nurses currently working at the bedside plan to work outside of a direct patient care role or will work per diem for more flexibility and/or fewer hours (2017 Survey of Registered Nurses, AMN Healthcare).
National Licensure Compact Promoting Mobility for RNs.
The Enhanced Nurse Licensure Compact (eNLC), overseen by the National Council of State Boards of Nursing, was implemented on January 19, 2018. Under the eNLC, registered nurses and licensed practical/vocational nurses in member states can provide care to patients in other states without having to obtain additional licenses. It takes advantage of new technology and national databases to ensure that compact-licensed nurses meet consistent standards and background check benchmarks. The compact creates an expedited licensing process that gives nurses these privileges as long as they meet eleven uniform licensing as long as they meet eleven uniform licensing requirements. The eNLC will: (i) allow nurses to quickly cross state borders to provide vital services in the event of a disaster; (ii) make practicing across state borders more affordable and convenient by reducing the need for nurses and/or agencies who employ them to obtain additional nursing licenses; and (iii) allow licensed nurses in 25 states to use telehealth to treat patients in other states (National Council of State Boards of Nursing, Fact Sheet).
Temporary Physician Assignments.
Locum tenens assignments offer physicians the ability to focus on practicing medicine while avoiding the stress of running their own practices; the ability to avoid paying the high costs of malpractice insurance; the opportunity to pick up extra shifts and weekends and work during the vacation time of full-time staff jobs in order to earn extra money and repay student loans; to lead a more flexible lifestyle; and to maintain their autonomy while practicing medicine. The supply of physicians available for our Physician Staffing services is variable and is influenced by several factors: the desire of physicians to work temporary assignments, the desire of physicians close to retirement to work fewer hours, work-life balance for all physicians, and the trend toward more female physicians in the workforce who traditionally work fewer hours than their male counterparts.
Physicians Seeking Stability as Full-Time Staff.
Over the past several years, physicians have increasingly become employees of hospitals or health systems due to business pressures and costs of operating private practices. Physician practices faced a combination of factors that include: stagnant or declining reimbursement rates, increased regulatory burden (including the Medicare Access and CHIP Reauthorization Act of 2015), rising costs, greater risk associated with operating a private practice, and an increased desire for a better work-life balance. We believe physicians have sought employment with hospitals at higher rates over the past few years due to: traversing the maze of insurance company requirements, financial strains on private practices from repeated threatened pay cuts based on Medicare’s sustainable growth rate formulas, and the uncertain future of healthcare associated with the ACA. Joining a hospital's staff provides financial certainty and the ability to focus more on practicing medicine. We believe the increase in physicians employed by healthcare facilities will continue to increase supply for our physician and executive search business as physicians look for permanent employment with hospitals or health systems.
Our Business Strategy
Our business strategy is to increase our workforce solutions business and our capture rate at those accounts, grow our supply of healthcare professionals, improve our operating leverage through growth and cost containment, and make strategic disciplined acquisitions to strengthen and broaden our market presence:
Increasing our workforce solutions business by delivering value-added solutions and strengthening and expanding current client relationships and developing new relationships with hospitals and healthcare facilities.
While the shift to value-based payments could slow or reverse, we believe that some iteration of the value-based payment models will remain in effect continuing to put financial pressure on our clients. To assist clients in meeting their financial and healthcare quality goals in a more complex environment, we design and execute workforce solutions customized to meet their unique needs. Our full suite of service offerings includes: MSP, OWS, IRP, Educational Healthcare Services, and RPO. Each of our businesses enjoy strong customer relationships that may serve as a platform to sell new MSP services or expand our workforce solutions at current clients. As a result, we continue to invest in sales and marketing to increase market share through cross-collaboration of our businesses.
7
Improving our capture rate at current MSP accounts and expanding our national and local market presence to support the shift to outpatient and ambulatory care centers.
We believe our large national footprint will allow us to: (i) increase our market share at our current MSPs by improving our capture rate of per diem, local and allied healthcare staffing professionals; (ii) sell our MSP services to clients of our local branch-based network; (iii) support our current hospital and health system clients who are shifting care from inpatient to outpatient where possible and responding to market changes by making vertical acquisitions to control quality across the care continuum; (iv) support smaller, local customers; (v) support retail or commercial providers, such as national drugstore chains; (vi) broaden our customer base; and (vii) gain access to additional healthcare professionals who are uniquely qualified to provide care in outpatient and ambulatory care centers.
Growing our supply of healthcare professionals.
We are investing in technology initiatives to enhance the efficiency and effectiveness of our interactions with our healthcare professionals. We also continue to invest in mobile and online technologies to increase our ability to attract and retain healthcare professionals. We believe providing communication options to our healthcare professionals will strengthen our relationships with them to improve supply and further enhance our delivery of high quality care for patients.
Expanding our gross profit margin and delivering a higher Adjusted EBITDA margin.
We believe this can be accomplished by: (i) continuing to obtain pricing increases from our customers; (ii) managing our mix of business with hospitals and local/retail customers; (iii) expanding our workforce solutions business; and (iv) making further investments in our higher margin businesses: retained, contingent and permanent search, local allied, Healthcare Education Consulting, and RPO businesses.
Making strategic and disciplined acquisitions to strengthen and broaden our market presence.
We believe the best acquisitions follow a structured and disciplined approach with clear strategic objectives, detailed implementation plans, and a focus on creating and capturing value for our shareholders. Our management team has broad and varied experience in multiple types of transactions.
Business Overview
Services Provided
Nurse and Allied Staffing
The Nurse and Allied Staffing segment provides traditional staffing, including temporary and permanent placement of travel nurses and allied professionals, branch-based local nurses, and allied staffing. It markets its service to hospitals and other customers through its Cross Country Staffing®, MSN, Allied Health Group, Advantage, Mediscan, and DirectEd brands. The Nurse and Allied Staffing segment markets its services to healthcare professionals using a multi-brand strategy to segment the market, obtain greater shelf space and maximize its relevance to its healthcare professionals.
We provide flexible workforce solutions to the healthcare and school markets through diversified offerings designed to meet the special needs of each client, including: MSP, OWS, Educational Healthcare Services, IRP and RPO services. Our clients include: public and private acute care hospitals, government-owned facilities, public and charter schools, outpatient clinics, ambulatory care facilities, physician practice groups, retailers, and many other healthcare providers. The Joint Commission has certified our Nurse and Allied Staffing businesses under its Health Care Staffing Services Certification Program. Our Nurse and Allied Staffing revenue and contribution income is set forth in Note 17 - Segment Data to the consolidated financial statements.
A majority of our revenue is generated from staffing registered nurses on long-term contract assignments (typically 13 weeks in length) at hospitals and health systems using various brands. While the typical lead-time to staff a travel healthcare professional is four to five weeks, we also have candidates who are pre-qualified and ready to begin assignments within one to two weeks at hospital clients that have urgent needs. Additionally, we offer a short-term staffing solution of registered nurses, licensed practical nurses, certified nurse assistants, advanced practitioners, pharmacists, and more than 100 specialties of allied professionals on local per diem and short-term assignments in a variety of clinical and non-clinical settings through our national network of local branch offices. We also provide travel allied professionals on long-term contract assignments to hospitals, public and charter schools, and skilled nursing facilities under the Cross Country Staffing®, Mediscan, and DirectEd brands.
Physician Staffing
We provide physicians in many specialties, certified registered nurse anesthetists (CRNAs), nurse practitioners (NPs), and physician assistants (PAs) under our MDA brand as independent contractors on temporary assignments throughout the United States at various healthcare facilities, such as acute and non-acute care facilities, medical group practices,
8
government facilities, and managed care organizations. We recruit these professionals nationally and place them on assignments varying in length from several days up to one year. Our Physician Staffing revenue and contribution income is set forth in Note 17 - Segment Data to the consolidated financial statements.
Other Human Capital Management Services
We provide retained and contingent search services for physicians, healthcare executives, nurses, advanced practice, and allied health professionals. The revenue and contribution income of our Other Human Capital Management Services Segment is set forth in Note 17 - Segment Data to the consolidated financial statements.
Our Cejka Search® (Cejka) subsidiary has been a leading physician, executive, nurses, advanced practice, and allied health retained and contingent search firm for more than twenty years. Cejka recruits top healthcare talent for organizations nationwide through a team of experienced professionals, advanced use of recruitment technology, and commitment to service excellence. Serving clients nationwide, Cejka completes hundreds of search assignments annually for organizations spanning the continuum of healthcare, including physician group practices, hospitals and health systems, academic medical centers, accountable care organizations, managed care, and other healthcare organizations.
Our Business Model
We have developed and will continue to focus our business model on increasing revenue and achieving greater profitability through higher efficiencies, expanding current MSP services and adding new MSP accounts, and further diversifying our customer base - all while continuing to offer the highest possible quality services.
Marketing and Recruiting Healthcare Professionals
We operate differentiated brands to recruit nurses and allied professionals. We believe our multi-brand recruiting model helps us reach a larger volume and a more diverse group of candidates to fill open positions at our clients throughout the United States in various clinical and non-clinical settings and in many different geographic areas. We believe nurses and allied professionals are attracted to us because we offer a wide range of diverse assignments in attractive locations, competitive compensation and benefit packages, scheduling options, as well as a high level of service to them. In addition, we believe nurses and allied professionals are confident we will have new assignments for them as they complete their current assignment. Our benefits generally include professional liability insurance, a 401(k) plan, health insurance, reimbursed travel, per diem allowances, and housing. Each of our nurse and allied healthcare professionals is employed by us is typically paid hourly wages and any other benefits they are entitled to receive during the assignment period.
Recruiters are an essential element of our Nurse and Allied Staffing business, and are responsible for establishing and maintaining key relationships with candidates for the duration of their assignments with us. Recruiters match the supply of qualified candidates in our databases with the demand for open orders posted by our clients. While we rely on word-of-mouth for referrals, we also market our brands on the Internet, including extensive utilization of social media, which has become an increasingly important component of our recruitment efforts. We maintain a number of websites to allow potential applicants to obtain information about our brands and assignment opportunities, as well as to apply online.
MDA recruits and contracts with physicians and advanced practice professionals to provide medical services for MDA’s healthcare customers. Each physician or advanced practice professional is an independent contractor and enters into an agreement with MDA to provide medical services at a particular healthcare facility or physician practice group based on terms and conditions specified by that customer. Physicians and advanced practice professionals are engaged to provide medical services for a healthcare customer ranging from a few days up to a year. We believe physicians are attracted to us because we offer a wide variety of assignments, competitive fees, medical malpractice insurance, and a high level of service to them. MDA relies on word-of-mouth referrals, but also markets it brands on the Internet and through extensive social media campaigns.
Sales and Marketing
We market our Nurse and Allied Staffing services to our hospitals, healthcare facilities, schools, and other clients using our Cross Country Staffing, Medical Staffing Network™, Allied Health Group, Mediscan, and DirectEd brands. Cross Country Staffing typically contracts with our nurse and allied healthcare clients on behalf of itself and our other brands. Mediscan contracts with its hospitals, public schools, and charter schools under the Mediscan and DirectEd brands. Our traditional staffing includes temporary and permanent placement of travel nurses and allied professionals, branch-based local nurses and allied staffing, and physicians. We provide healthcare staffing opportunities to our healthcare professionals, and staffing and workforce solutions to our healthcare clients in all 50 states.
9
We provide flexible workforce solutions to the healthcare and school markets through diversified offerings meeting the special needs of each client. Orders for open positions and other services are entered into our various databases and are available to recruiters. Account managers, who develop relationships with our clients to understand their specific settings and culture, submit candidate profiles to clients, and confirm offers and placements with them.
MDA markets its Physician Staffing operations to hospitals and other healthcare facilities on a national basis. Our recruiters use our extensive database of physicians and their expertise in their given specialties to contact physicians to schedule short and long-term engagements at healthcare customers. MDA successfully operates a multi-site business model with employees at several locations.
Cejka markets its retained and contingent search services to healthcare clients primarily through industry professional organizations, direct marketing, Cejka’s website, and word-of-mouth.
Credentialing and Quality Management
We screen all of our candidates prior to placement through our credentialing departments. While screening requirements are typically negotiated with our clients, each of our businesses has adopted its own minimum standard screening requirements. We continue to monitor our nursing and allied professional employees after placement in an effort to ensure quality performance, to determine eligibility for future placements, and to manage our malpractice risk profile. Our credentialing processes are designed to ensure that our professionals have the requisite skill set required by our customers, as well as the aptitude to meet the day-to-day requirements and challenges they would typically encounter on assignments where they are placed. The credentialing of our nurse and allied healthcare professionals is designed to align with the guidelines of The Joint Commission, a national accrediting body, to ensure quality care. Our Cross Country University division, accredited by the American Nurse Credentialing Center, provides training, assessment, and professional development to further ensure the quality of the personnel we place on assignment.
Our physician credentialing entity, Credent, is also certified by the NCQA. We ask each of our healthcare clients to evaluate our healthcare employees who work at their facility at the end of each assignment in order to continually assess client satisfaction, and so that we may assist our employees with further educational development, if and where necessary.
Payment for Services
We negotiate payment for services with our clients based on market conditions and needs. We generally bill our nurse and allied employees at an hourly rate and assume all employer costs, including payroll, withholding taxes, benefits, professional liability insurance, and other requirements, as well as any travel and housing arrangements, where applicable. Our shared service center processes hours worked by field employees in the time and attendance systems, which in turn generate the billable transactions to our clients.
Hours worked by independent contractor physicians are reported to our MDA office. We bill our clients for hours worked by independent contractor physicians and for our recruitment fee. We negotiate payment for services with our clients based on market conditions and needs, and the amount we earn is not fixed. We keep a recruitment fee and pass on an agreed amount to the independent contractor physician on behalf of our clients.
For our physician and executive search business, Cejka typically bills its clients a candidate acquisition fee and is reimbursed for certain marketing expenses.
Operations
Our Nurse and Allied and Physician Staffing businesses are operated through a relatively centralized business model servicing all assignment needs of our healthcare professional employees, physicians, and client healthcare facilities through operation centers located in Boca Raton, Florida; Newtown Square, Pennsylvania; West Chester, Ohio; Woodland Hills, California; and Berkeley Lake, Georgia. In addition to the key sales and recruitment activities, certain of these centers also perform support activities such as coordinating housing, payroll processing, benefits administration, billing and collections, travel reimbursement processing, customer service, and risk management. On December 31, 2017, we had 76 office locations.
Cejka Search primarily operates its business from its headquarters located in Creve Coeur, Missouri. This business operates relatively independently, other than certain ancillary services that are provided from our Boca Raton, Florida headquarters, such as payroll, legal, and information systems support.
Information Systems
Various information systems are utilized to run our customer relationship management, recruitment, and placement functions based on the different brands that we operate. Some of these sophisticated applications are proprietary and are hosted in Tier 1
10
hosting facilities while other systems are Software as a Service (SaaS) based and hosted by our vendor partners. All of these systems were built/bought to handle considerable growth of all of our businesses. With capability to provide support to all of our facility clients, field employees, and independent contractors, our systems maintain detailed information about our client skill sets and status which assist us in enabling fulfillment and assignment renewal. Our databases are also an extensive pool of existing and potential customers and all related recruitment and sales activity. We constantly evaluate our systems, and the legacy systems for MDA and Cejka Search were recently replaced by an industry leading SaaS product.
Our financial and human resource systems are managed on leading enterprise resource planning software suites that manage certain aspects of accounts payable, accounts receivable, general ledger, billing, and human capital management. These systems have the ability to scale to accommodate revenue growth and/or employee growth. All of our systems are managed by our onshore and offshore Information Technology team.
Risk Management, Insurance, and Benefits
We have developed a risk management program that requires prompt notification of incidents by clients, clinicians, and independent contractors, educational training to our employees, loss analysis, and prompt reporting procedures to reduce our risk exposure. Each of our temporary employees receives instructions regarding the timely reporting of claims and this information is also available on our website. While we cannot predict the future, we continuously review facts and incidents associated with professional liability and workers’ compensation claims in order to identify trends and reduce our risk of loss in the future where possible. In addition, upon notification of an incident that may result in liability to us, we promptly gather all available documentation and review the actions of our employee and independent contractor to determine if he or she should remain on an assignment and whether he or she is eligible for another assignment with us. We consider assessments provided by our clients and we work with clinicians and experts from our insurance carriers to determine employment eligibility and potential exposure. Prior to approving an employee or independent contractor for an assignment, we review records from applicable state professional associations, the national practitioners’ database, and other such databases available to us.
We provide workers’ compensation insurance coverage, professional liability coverage, and healthcare benefits for our eligible temporary professionals. We record our estimate of the ultimate cost of, and reserves for, workers' compensation and professional liability benefits based on actuarial models prepared or reviewed by an independent actuary using our loss history as well as industry statistics. In determining our reserves, we include reserves for estimated claims incurred but not reported. We also estimate on a quarterly basis the healthcare claims that have occurred but have not been reported based on our historical claim submission patterns. The ultimate cost of workers’ compensation, professional liability, and health insurance claims will depend on actual amounts incurred to settle those claims and may differ from the amounts reserved for such claims.
The Company maintains a number of insurance policies including general liability, workers’ compensation, fidelity, fiduciary, directors and officers, cyber, property, and professional liability policies. These policies provide coverage subject to their terms, conditions, limits of liability, and deductibles, for certain liabilities that may arise from our operations. There can be no assurance that any of the above policies will be adequate for our needs, or that we will maintain all such policies in the future.
Regulations
We provide services directly to our clients on a contract basis and receive payment directly from them. However, many of our clients are reimbursed under the federal Medicare program and state Medicaid programs for the services they provide. In recent years, federal and state governments have made significant changes in these programs that have reduced reimbursement rates. In addition, insurance companies and managed care organizations seek to control costs by requiring healthcare providers, such as hospitals, to discount their services in exchange for exclusive or preferred participation in their benefit plans. While not affecting us directly, future federal and state legislation or evolving commercial reimbursement trends may further reduce or change conditions for our clients’ reimbursement. Such limitations on reimbursement could reduce our clients’ cash flows, hampering the pricing we can charge clients and their ability to pay us. We continuously monitor changes in regulations and legislation for potential impacts on our business.
Our business is subject to regulation by numerous governmental authorities in the jurisdictions in which we operate. Complex federal and state laws and regulations govern, among other things, the licensure of professionals, the payment of our employees (e.g., wage and hour laws, employment taxes and income tax withholdings, etc.), and the operations of our business generally. We conduct business primarily in the U.S. and are subject to federal and state laws and regulations applicable to our business, which may be amended from time to time. Future federal and state legislation or interpretations thereof may require us to change our business practices. Compliance with all of these applicable rules and regulations require a significant amount of resources. We endeavor to be in compliance with all such rules and regulations.
Employees
As of December 31, 2017, we had approximately 1,800 corporate employees. During 2017, we employed an average of 7,397 full-time equivalent field employees in Nurse and Allied Staffing which does not include our Physician Staffing independent
11
contractors, all of whom are not employees. Throughout 2017 we were not subject to any collective bargaining agreements. However, in October 2015, the employees we have outsourced to a customer in New York under our OWS model, mainly paraprofessionals, voted to be represented by Local 1199 of the Service Employees International Union. We began negotiating with Local 1199 for an initial collective bargaining agreement in 2016 to cover the terms and conditions of employment for these employees (approximately 450 employees) and expect those negotiations to result in an agreement in 2018. We consider our relationship with employees to be good.
Additional Information
Financial reports and filings with the Securities and Exchange Commission (SEC), including this Annual Report on Form 10-K, are available free of charge as soon as reasonably practicable after filing such material with, or furnishing it to, the SEC, on or through our corporate website at
www.crosscountryhealthcare.com
. The information found on our website is not part of this Annual Report on Form 10-K or any other report we file with or furnish to the SEC.
The following risk factors could materially and adversely affect our future operating results and could cause actual results to differ materially from those predicted in the forward-looking statements we make about our business.
Decreases in demand by our clients may adversely affect the profitability of our business.
Among other things, changes in the economy, a decrease or stagnation in the general level of in-patient admissions or out-patient services at our clients’ facilities, uncertainty regarding or changes to federal healthcare law and the willingness of our hospital, healthcare facilities and physician group clients to develop their own temporary staffing pools and increase the productivity of their permanent staff may, individually or in the aggregate, significantly affect demand for our temporary healthcare staffing services and may hamper our ability to attract, develop and retain clients. When a hospital’s admissions increase, temporary employees or other healthcare professionals are often added before full-time employees are hired. As admissions decrease, clients typically reduce their use of temporary employees or other healthcare professionals before undertaking layoffs of their permanent employees. In addition, if hospitals continue to consolidate in an effort to enhance their market positions, improve operational efficiency, and create organizations capable of managing population health, demand for our services could decrease. Decreases in demand for our services may also affect our ability to provide attractive assignments to our healthcare professionals.
Our clients may terminate or not renew their contracts with us.
Our arrangements with hospitals, healthcare facilities and physician group clients are generally terminable upon 30 to 90 days’ notice. These arrangements may also require us to, among other things, guarantee a percentage of open positions that we will fill. We may have to pay a penalty or a client may terminate our contract if we are unable to meet those obligations, either of which could have a negative impact on our profitability. We may have fixed costs, including housing costs, associated with terminated arrangements that we will be obligated to pay post-termination, thus negatively impacting our profitability. In addition, the loss of one or more of our large clients could materially affect our profitability.
We may be unable to recruit enough quality healthcare professionals to meet our clients’ demands.
We rely significantly on our ability to attract, develop and retain healthcare professionals who possess the skills, experience and, as required, licensure necessary to meet the specified requirements of our healthcare clients. We compete for healthcare staffing personnel with other temporary healthcare staffing companies as well as actual and potential clients such as healthcare facilities and physician groups, some of which seek to fill positions with either permanent or temporary employees. We rely on word-of-mouth referrals, as well as social media to attract qualified healthcare professionals. If our social media strategy is not successful, our ability to attract qualified healthcare professionals could be negatively impacted.
In addition, with a shortage of certain qualified nurses and physicians in many areas of the United States, competition for these professionals remains intense. Our ability to recruit and retain healthcare professionals depends on our ability to, among other things, offer assignments that are attractive to healthcare professionals and offer them competitive wages and benefits or payments, as applicable. Our competitors might increase hourly wages or the value of benefits to induce healthcare professionals to take assignments with them. If we do not raise wages or increase the value of benefits in response to such increases by our competitors, we could face difficulties attracting and retaining qualified healthcare professionals. If we raise wages or increase benefits in response to our competitors’ increases and are unable to pass such cost increases on to our clients, our margins could decline. At this time, we still do not have enough nurses, allied professionals and physicians to meet all of our clients’ demands for these staffing services. This shortage of healthcare professionals generally and the competition for
12
their services may limit our ability to increase the number of healthcare professionals that we successfully recruit, decreasing our ability to grow our business.
If our healthcare facility clients increase the use of intermediaries it could impact our profitability.
We continue to see an increase in the use of intermediaries by our clients. These intermediaries typically enter into contracts with our clients and then subcontract with us and other agencies to provide staffing services, thus interfering to some extent in our relationship with our clients. Each of these intermediaries charges an administrative fee. In instances where we do not win new MSP opportunities or where other vendors win this MSP or VMS business with our current customers, the number of professionals we have on assignment at those clients could decrease. If we are unable to negotiate hourly rates with intermediaries for the services we provide at these clients which are sufficient to cover administrative fees charged by those intermediaries, it could impact our profitability. If those intermediaries become insolvent or fail to pay us for our services, it could impact our bad debt expense and thus our overall profitability. We also provide comprehensive MSP and other workforce solutions directly to certain of our clients. While such contracts typically improve our market share at these facilities, they could result in less diversification of our customer base, increased liability, and reduced margins.
Our costs of providing services may rise faster than we are able to adjust our bill rates and pay rates and, as a result, our margins could decline.
Costs of providing our services could change more quickly than we are able to renegotiate bill rates in our active contracts and pay rates with our thousands of healthcare professionals. For example, we offer housing subsidies to our healthcare professionals or provide actual housing to our healthcare professionals. At any given time, we have over a thousand apartments on lease throughout the U.S. because we provide housing for certain of our healthcare professionals when they are on an assignment with us. The cost of subsidizing housing or renting apartments and furniture for these healthcare professionals may increase faster than we are able to renegotiate our rates with our customers, and this may have a negative impact on our profitability. In addition, an increase in other incremental costs beyond our control, such as insurance and unemployment rates could negatively affect our financial results. The costs related to obtaining and maintaining professional and general liability insurance, health insurance and workers’ compensation insurance for healthcare providers has generally been increasing. This could have an adverse impact on our financial condition unless we are able to pass these costs through to our clients or renegotiate pay rates with our healthcare providers.
Our labor costs could be adversely affected by a shortage of experienced healthcare professionals and labor union activity.
Our operations are dependent on our ability to recruit and staff quality healthcare professionals. We compete with other healthcare staffing companies in recruiting and retaining qualified personnel. We may be required to enhance wages and benefits to our employees, which could negatively impact our profitability. Labor union activity is another factor that could adversely affect our labor costs or otherwise adversely impact us. To the extent a significant portion of our employee base unionizes, our labor costs could increase significantly.
If our labor costs increase, we may not be able to raise rates to offset these increased costs. Because a significant percentage of our revenues consists of fixed, prospective payments, our ability to pass along increased labor costs is constrained. In the event we are not entirely effective at recruiting and retaining qualified management, nurses and other medical support personnel, or in controlling labor costs, this could have an adverse effect on our results of operations.
We may face difficulties integrating our acquisitions into our operations and our acquisitions may be unsuccessful, involve significant cash expenditures or expose us to unforeseen liabilities.
We continually evaluate opportunities to acquire companies that would complement or enhance our business and at times have preliminary acquisition discussions with some of these companies. These acquisitions involve numerous risks, including potential loss of key employees or clients of acquired companies; difficulties integrating acquired personnel and distinct cultures into our business; difficulties integrating acquired companies into our operating, financial planning and financial reporting systems; diversion of management attention from existing operations; and assumptions of liabilities and exposure to unforeseen liabilities of acquired companies, including liabilities for their failure to comply with healthcare and tax regulations. These acquisitions may also involve significant cash expenditures, debt incurrence and integration expenses that could have a material adverse effect on our financial condition and results of operations. Any acquisition may ultimately have a negative impact on our business and financial condition.
If applicable government regulations change, we may face increased costs that reduce our revenue and profitability.
The temporary healthcare staffing industry is regulated in many states. For example, in some states, firms such as our nurse staffing companies must be registered to establish and advertise as a nurse-staffing agency or must qualify for an exemption from registration in those states. If we were to lose any required state licenses, we could be required to cease operating in those
13
states. The introduction of new regulatory provisions could also substantially raise the costs associated with hiring temporary employees. For example, some states could impose sales taxes or increase sales tax rates on temporary healthcare staffing services. These increased costs may not be able to be passed on to clients. In addition, if government regulations were implemented that limited the amount we could charge for our services, our profitability could be adversely affected.
The healthcare industry is highly regulated. Any material changes in the political, economic or regulatory environment that affect the purchasing policies, practices and operations of healthcare organizations, or that lead to consolidation in the healthcare industry, could reduce the funds available to purchase our services or otherwise require us to modify our offerings.
We provide our services to hospitals and health systems who pay us directly. Accordingly, Medicare, Medicaid and insurance reimbursement policy changes generally do not directly impact us. However, indirectly, our business, financial condition and results of operations depend upon conditions affecting the healthcare industry generally and hospitals and health systems particularly. The healthcare industry is highly regulated by federal and state authorities and is subject to changing political, economic and regulatory influences. Factors such as changes in reimbursement policies for healthcare expenses, consolidation in the healthcare industry, regulation, litigation and general economic conditions affect the purchasing practices, operations and the financial health of our customers. Reimbursement changes in government programs, particularly Medicare and Medicaid, can and do indirectly affect the demand and the prices paid for our services.
The ACA was a measure designed to expand access to affordable health insurance, control healthcare spending and improve healthcare quality. Many states have adopted or are considering changes in healthcare laws or policies in part due to state budgetary shortfalls. We believe that we are well-positioned to help our customers in a value-based care environment, which we expect will remain a key feature of government policy under any modified or replacement legislation. Nonetheless, the impact of any other legislation to repeal or amend or replace the ACA is uncertain and could adversely affect our business, cash flow and financial performance.
We operate our business in a regulated industry and modifications, inaccurate interpretations or violations of any applicable statutory or regulatory requirements may result in material costs or penalties as well as litigation and could reduce our revenue and earnings per share.
Our industry is subject to many complex federal, state, local and international laws and regulations related to, among other things, the licensure of professionals, the payment of our field employees (e.g., wage and hour laws, employment taxes and income tax withholdings, etc.) and the operations of our business generally (e.g., federal, state and local tax laws). If we do not comply with the laws and regulations that are applicable to our business, we could incur civil and/or criminal penalties as well as litigation or be subject to equitable remedies.
We are subject to litigation, which could result in substantial judgment or settlement costs; significant legal actions could subject us to substantial uninsured liabilities.
We are party to various litigation claims and legal proceedings. We evaluate these litigation claims and legal proceedings to assess the likelihood of unfavorable outcomes and to estimate, if possible, the amount of potential losses. Based on these assessments and estimates, if any, we establish reserves and/or disclose the relevant litigation claims or legal proceedings, as appropriate. These assessments and estimates are based on the information available to management at the time and involve a significant amount of management judgment. We may not have sufficient insurance to cover these risks. Actual outcomes or losses may differ materially from those estimated by our current assessments which would impact our profitability. Adverse developments in existing litigation claims or legal proceedings involving our Company or new claims could require us to establish or increase litigation reserves or enter into unfavorable settlements or satisfy judgments for monetary damages for amounts in excess of current reserves, which could adversely affect our financial results.
In recent years, healthcare providers have become subject to an increasing number of legal actions alleging malpractice, vicarious liability, violation of certain consumer protection acts, negligent hiring, negligent credentialing, product liability or related legal theories. We may be subject to liability in such cases even if the contribution to the alleged injury was minimal or related to one of our subcontractors or its employees. Many of these actions involve large claims and significant defense costs. In addition, we may be subject to claims related to torts or crimes committed by our corporate employees or healthcare professionals that we place on assignment. In most instances, we are required to indemnify clients against some or all of these risks. A failure of any of our corporate employees or healthcare professional to observe our policies and guidelines, relevant client policies and guidelines or applicable federal, state or local laws, rules and regulations could result in negative publicity, payment of fines or other damages.
To protect ourselves from the cost of these types of claims, we maintain professional malpractice liability insurance and general liability insurance coverage with terms and in amounts with deductibles that we believe are appropriate for our operations. We are partially self-insured for our workers' compensation coverage, health insurance coverage, and professional liability
14
coverage for our locum tenens providers. If we become subject to substantial uninsured workers' compensation, medical coverage or medical malpractice liabilities, whether directly or indirectly, our financial results may be adversely affected. In addition, our insurance coverage may not cover all claims against us or continue to be available to us at a reasonable cost. If we are unable to pay our self-insured retention portion or maintain adequate insurance coverage, we may be exposed to substantial liabilities.
If provisions in our corporate documents and Delaware law delay or prevent a change in control, we may be unable to consummate a transaction that our stockholders consider favorable.
Our certificate of incorporation and by-laws may discourage, delay or prevent a merger or acquisition involving us that our stockholders may consider favorable. For example, our certificate of incorporation authorizes our Board of Directors to issue up to 10,000,000 shares of “blank check” preferred stock. Without stockholder approval, the Board of Directors has the authority to attach special rights, including voting and dividend rights, to this preferred stock. With these rights, preferred stockholders could make it more difficult for a third party to acquire us. Delaware law may also discourage, delay or prevent someone from acquiring or merging with us.
Market disruptions may adversely affect our operating results and financial condition
.
Economic conditions and volatility in the financial markets may have an adverse impact on the availability of credit to us and to our customers and businesses generally. To the extent that disruption in the financial markets occurs, it has the potential to materially affect our and our customers’ ability to tap into debt and/or equity markets to continue ongoing operations, have access to cash and/or pay debts as they come due. These events could negatively impact our results of operations and financial conditions. Although we monitor our credit risks to specific clients that we believe may present credit concerns, default risk or lack of access to liquidity may result from events or circumstances that are difficult to detect or foresee. Conditions in the credit markets and the economy generally could adversely impact our business and limit or prohibit us from refinancing our credit agreements on terms favorable to us when they become due.
Stock issuable under our stock option plans are presently in effect and sales of this stock could cause our stock price to decline.
We registered 4,398,001 shares of common stock for issuance under our 1999 stock option plan, and 3,500,000 shares of common stock for issuance under our 2007 Stock Incentive Plan. In 2014 and 2017, we amended and restated that Plan to issue an additional 600,000 shares and 2,000,000 shares, respectively, all of which have been registered. Fully vested stock appreciation rights of 94,500 were issued and outstanding as of February 26, 2018. Shares of restricted stock outstanding as of February 26, 2018, were 511,599. In addition, a target of 256,371 performance stock awards were issued and outstanding as of February 26, 2018. See Note 14 - Stockholders' Equity to our consolidated financial statements. Common stock issued upon exercise of stock options, stock appreciation rights and restricted stock, under our benefit plans, is eligible for resale in the public market without restriction. We cannot predict what effect, if any, market sales of shares held by any stockholder or the availability of these shares for future sale will have on the market price of our common stock.
We are dependent on the proper functioning of our information systems and applications hosted by our vendors.
We are dependent on the proper functioning of our information systems in operating our business, including those applications hosted by our vendors. Critical information systems used in daily operations identify and match staffing resources and client assignments and perform billing and accounts receivable functions. Additionally, we rely on our information systems in managing our accounting and financial reporting. These systems are subject to certain risks, including technological obsolescence. We are currently evaluating the technology platforms of our businesses. If our proprietary systems of Software as a Service applications fail or are otherwise unable to function in a manner that properly supports our business operations, or if these systems require significant costs to repair, maintain or further develop or update, we could experience business interruptions or delays that could materially and adversely affect our business and financial results.
In addition, our information systems are protected through a secure hosting facility and additional backup remote processing capabilities also exist in the event our primary systems fail or are not accessible. However, the business is still vulnerable to fire, storm, flood, power loss, telecommunications failures, physical or software break-ins and similar events which may prevent personnel from gaining access to systems necessary to perform their tasks in an automated fashion. In the event that critical information systems fail or are otherwise unavailable, these functions would have to be accomplished manually, which could impact our ability to identify business opportunities quickly, to, among other things, maintain billing and clinical records reliably, to bill for services efficiently and to maintain our accounting and financial reporting accurately.
15
We are increasingly dependent on third parties for the execution of certain critical functions.
We have outsourced certain critical applications or business processes to external providers, including but not limited to, cloud-based services. We exercise care in the selection and oversight of these providers. However, the failure or inability to perform on the part of one or more of these critical suppliers could cause significant disruptions and increased costs to our business
Our collection, use, and retention of personal information and personal health information create risks that may harm our business.
As part of our business model, we collect, transmit and retain personal information of our employees and contract professionals and their dependents, including, without limitation, full names, social security numbers, addresses, birth dates, and payroll-related information. We use commercially available information security technologies to protect such information in digital format and have security and business controls to limit access to such information. In addition, we periodically perform penetration tests and respond to those findings. However, employees or third parties may be able to circumvent these measures and acquire or misuse such information, resulting in breaches of privacy, and errors in the storage, use or transmission of such information may result in breaches of privacy. Privacy breaches may require notification and other remedies, which can be costly, and which may have other serious adverse consequences for our business, including regulatory penalties and fines, claims for breach of contract, claims for damages, adverse publicity, reduced demand for our services by clients and/or healthcare professional candidates, harm to our reputation, and regulatory oversight by state or federal agencies. The possession and use of personal information and data in conducting our business subjects us to legislative and regulatory burdens. We may be required to incur significant expenses to comply with mandatory privacy and security standards and protocols imposed by law, regulation, industry standards, or contractual obligations.
Cyber security risks and cyber incidents could adversely affect our business and disrupt operations.
Cyber incidents can result from deliberate attacks or unintentional events. These incidents can include, but are not limited to, gaining unauthorized access to digital systems for purposes of misappropriating assets or sensitive information, corrupting data, or causing operational disruption. The result of these incidents could include, but are not limited to, disrupted operations, misstated financial data, liability for stolen assets or information, increased cyber security protection costs, litigation and reputational damage adversely affecting customer or investor confidence. We have implemented systems and processes to focus on identification, prevention, mitigation and resolution. However, these measures cannot provide absolute security, and our systems may be vulnerable to cyber-security breaches such as viruses, hacking, and similar disruptions from unauthorized intrusions. In addition, we rely on third party service providers to perform certain services, such as payroll and tax services. Any failure of our systems or third party systems may compromise our sensitive information and/or personally identifiable information of our employees. While we have secured cyber insurance to potentially cover certain risks associated with cyber incidents, there can be no assurance the insurance will be sufficient to cover any such liability.
Losses caused by natural disasters, such as hurricanes and fires, could cause us to suffer material financial losses.
Catastrophes can be caused by various events, including, but not limited to, hurricanes, fires, and other severe weather. The incidence and severity of catastrophes are inherently unpredictable. With our headquarters and shared services located in South Florida, we are more vulnerable to possible disruptions from hurricanes and the impacts resulting therefrom, such as tornadoes, flooding, fuel shortages, and disruption of internet services. The extent of losses from a catastrophe is a function of both the total amount of insured exposure and the severity of the event. We do not maintain business interruption insurance for these events. We could suffer material financial losses as a result of disruptions from hurricanes, fires, and other catastrophes.
We have a level of indebtedness which may have an adverse effect on our business or limit our ability to take advantage of business, strategic or financing opportunities.
As indicated below, we have and will continue to have a significant amount of indebtedness relative to our equity. The following table sets forth our total principal amount of debt and stockholders’ equity.
|
|
December 31, 2017
|
||
|
|
(amounts in thousands)
|
||
|
|
|
||
|
Total debt at par
|
$
|
100,000
|
|
|
Total Cross Country Healthcare, Inc. stockholders' equity
|
$
|
237,089
|
|
Our level of indebtedness increases the possibility that we may be unable to generate cash sufficient to pay the principal, interest or other amounts due on our indebtedness. Subject to certain restrictions under our existing indebtedness, we and our
16
subsidiaries may also incur significant additional indebtedness in the future, some of which may be secured debt. This may have the effect of increasing our total leverage. As a consequence of our indebtedness, (1) demands on our cash resources may increase, (2) we are subject to restrictive covenants that limit our financial and operating flexibility, and (3) we may choose to institute self-imposed limits on our indebtedness based on certain considerations including market interest rates, our relative leverage and our strategic plans. For example, as a result of our level of indebtedness and the uncertainties arising in the credit markets and the U.S. economy:
|
-
|
we may be more vulnerable to general adverse economic and industry conditions;
|
|
-
|
we may have to pay higher interest rates upon refinancing or on our variable rate indebtedness if interest rates rise, thereby reducing our cash flows;
|
|
-
|
we may find it more difficult to obtain additional financing to fund future working capital, capital expenditures and other general corporate requirements that would be in our long-term interests;
|
|
-
|
we may be required to dedicate a substantial portion of our cash flow from operations to the payment of principal and interest on our debt, reducing the available cash flow to fund other investments;
|
|
-
|
we may have limited flexibility in planning for, or reacting to, changes in our business or in the industry;
|
|
-
|
we may have a competitive disadvantage relative to other companies in our industry that are less leveraged; and
|
|
-
|
we may be required to sell debt or equity securities or sell some of our core assets, possibly on unfavorable terms, in order to meet payment obligations.
|
These restrictions could have a material adverse effect on our business.
We could fail to generate sufficient cash to fund our liquidity needs and/or fail to satisfy the financial and other restrictive covenants to which we are subject under our existing indebtedness.
We currently have sufficient liquidity to operate our business in the normal course. If, however, we were to make an acquisition or enter into a similar type of transaction, our liquidity needs may exceed our current capacity. In addition, our existing credit facilities currently contain financial covenants that require us to operate above a minimum fixed charge coverage ratio and below a consolidated leverage ratio. Deterioration in our operating results could result in our inability to comply with these covenants and would result in a default under our credit facility. If an event of default exists, our lenders could call the indebtedness and we may be unable to renegotiate or secure other financing.
We are subject to business risks associated with international operations.
We have international operations in India where our Cross Country Infotech, Pvt Ltd. (Infotech) subsidiary is located. Infotech provides in-house information systems development and support services as well as some back-office processing services. We have limited experience in supporting our services outside of North America. Operations in certain markets are subject to risks inherent in international business activities, including: fluctuations in currency exchange rates; changes in regulations; varying economic and political conditions; overlapping or differing tax structures; and regulations (pertaining to, among other things, compensation and benefits, vacation, and the termination of employment). Our inability to effectively manage our international operations or to violate a regulation could result in increased costs and adversely affect our results of operations.
Due to inherent limitations, there can be no assurance that our system of disclosure and internal controls and procedures will be successful in preventing all errors and fraud, or in making all material information known in a timely manner to management.
Our management, including our Chief Executive Officer (CEO) and Chief Financial Officer (CFO), does not expect that our disclosure controls and internal controls will prevent all errors and all fraud. A control system, no matter how well designed and operated, can provide only reasonable, not absolute, assurance that the objectives of the control system are met. Because of the inherent limitations in all control systems, no evaluation of controls can provide absolute assurance that all control issues and instances of fraud, if any, within our company have been detected. These inherent limitations include the realities that judgments in decision-making can be faulty, and that breakdowns can occur because of a simple error or mistake. Additionally, controls can be circumvented by the individual acts of some persons, by collusion of two or more people, or by management override of the control.
The design of any system of controls also is based in part upon certain assumptions about the likelihood of future events, and there can be no assurance that any design will succeed in achieving its stated goals under all potential future conditions; over time, a control may become inadequate because of changes in conditions, or the degree of compliance with the policies or
17
procedures may deteriorate. Because of the inherent limitations, misstatements due to error or fraud may occur and not be detected.
Impairment in the value of our goodwill, trade names, or other intangible assets could negatively impact our net income and earnings per share.
We are required to test goodwill and intangible assets with indefinite lives (such as trade names) annually, to determine if impairment has occurred. Long-lived assets and other identifiable intangible assets are also reviewed for impairment whenever events or changes in circumstances indicate that amounts may not be recoverable. If the testing performed indicates that impairment has occurred, we are required to record a non-cash impairment charge for the difference between the carrying amount of the goodwill or other intangible assets and the implied fair value of the goodwill or the fair value of the indefinite-lived intangible asset in the period the determination is made. The testing of goodwill and other intangible assets for impairment requires us to make significant estimates about our future performance and cash flows, as well as other assumptions. These estimates can be affected by numerous factors, including changes in economic, industry or market conditions, changes in business operations, changes in competition or potential changes in our stock price and market capitalization. Changes in these factors, or changes in actual performance compared with estimates of our future performance, could affect the fair value of goodwill, trade names, or other intangible assets, which may result in an impairment charge. We cannot accurately predict the amount and timing of any impairment of assets. Should the value of goodwill or other intangible assets become impaired, there could be an adverse effect on us. At December 31, 2017, goodwill, trade names not subject to amortization, and other intangible assets represented 44% of our total assets. In 2017 and 2016, we recorded impairment charges of $14.4 million and $24.3 million, respectively.
We could suffer adverse tax and other financial consequences if taxing authorities do not agree with our tax positions, if there are further legislative tax changes, or if we are unable to utilize our net operating losses.
We are periodically subject to a number of tax examinations by taxing authorities in the states and countries where we do business. We also have significant deferred tax assets related to our net operating losses (NOLs) in U.S. federal and state taxing jurisdictions, which, generally, for U.S. federal and state tax purposes, carry forward for up to twenty years. Tax years generally remain subject to examination until three years after NOLs are used or expire. We expect that we will continue to be subject to tax examinations in the future. We recognize tax benefits of uncertain tax positions when we believe the positions are more likely than not of being sustained upon a challenge by the relevant tax authority. We believe our judgments in this area are reasonable and correct, but there is no guarantee that we will be successful if challenged by a taxing authority. If there are tax benefits, including, but not limited to, the use of NOLs, expense reimbursements, or other tax attributes, that are challenged successfully by a taxing authority, we may be required to pay additional taxes or we may seek to enter into settlements with the taxing authorities, which could require significant payments or otherwise have a material adverse effect on our business, results of operations, and financial condition.
In addition, U.S. federal, state and local, as well as international, tax laws and regulations are extremely complex and subject to varying interpretations. Most recently, on December 22, 2017, the President signed the 2017 Tax Act into law. The 2017 Tax Act contains substantial changes to the U.S. federal income tax code effective January 1, 2018, including a reduction in the federal corporate rate from 35% to 21%. In the long-term, we anticipate that we will have an overall benefit from the reduction in the tax rate slightly offset by potential deductions disallowed under the current law. However, we recognized an $8.0 million tax charge in 2017 primarily the result of the lower corporate tax rate, which required us to remeasure our net deferred tax asset to reflect the lower corporate tax rate. Although we are not aware of any provision in the 2017 Tax Act or any other pending tax legislation that would have a material adverse impact on our financial performance, the ultimate impact of the 2017 Tax Act may differ from our current assessment due to changes in interpretations and assumptions made by us as well as the issuance of any further regulations or guidance regarding the U.S. federal income tax code. At this time, it is unclear how many U.S. states will incorporate these federal law changes, or portions thereof, into their tax codes. There can be no assurance that the 2017 Tax Act or any other legislative changes will not negatively impact our operating results, financial condition, and future business operations.
In addition, we may be limited in our ability to utilize our NOLs to offset future taxable income and thereby reduce our otherwise payable income taxes. Our ability to utilize our NOLs is also dependent, in part, upon us having sufficient future earnings to utilize our NOLs before they expire. If market conditions change materially and we determine that we will be unable to generate sufficient taxable income in the future to utilize our NOLs, we could be required to record an additional valuation allowance. We review the valuation allowances for our NOLs periodically and make adjustments from time to time, which can result in an increase or decrease to the net deferred tax asset related to our NOLs. If we are unable to use our NOLs or use of our NOLs is limited, we may have to make significant payments or reduce our deferred tax assets, which could have a material adverse effect on our business, results of operations and financial condition.
18
If certain of our healthcare professionals are reclassified from independent contractors to employees our profitability could be materially adversely impacted.
Federal or state taxing authorities could re-classify our locum tenens physicians, CRNAs and other independent contractors as employees, despite both the general industry standard to treat them as independent contractors and many state laws prohibiting non-physician owned companies from employing physicians (e.g., the “corporate practice of medicine”). If they were re-classified as employees, we would be subject to, among other things, employment and payroll-related tax claims, as well as any applicable penalties and interest. Any such reclassification would have a material adverse impact on our business model for that business segment and would negatively impact our profitability.
If the method for paying locum tenens physicians changes, it could negatively impact our profitability.
The Medicare Access and CHIP Reauthorization Act of 2015 (MACRA) creates a new framework for rewarding physicians for providing higher quality care by establishing two tracks of payment: a merit-based incentive payment system (MIPS), and Advanced Alternative Payment Models (AAPMs). If hospitals change the method for paying locum tenens physicians to meet their performance goals or other criteria for Medicaid or Medicare reimbursements, the profitability of our business could be adversely impacted.
Our financial results could be adversely impacted by the loss of key management.
We believe the successful execution of our business strategy and our ability to build upon significant recent investments and acquisitions depends on the continued employment of key members of our senior management team. If we were to lose any key personnel, we may not be able to find an appropriate replacement on a timely basis and our results of operations could be negatively affected. Further, the loss of a significant number of employees or our inability to hire a sufficient number of qualified employees could have a material adverse effect on our business.
None.
We do not own any real property. Our principal leases as of February 1, 2018 are listed below.
|
Location
|
Function
|
Square
Feet
|
Lease Expiration
|
|||
|
Boca Raton, Florida
|
Nurse and Allied Staffing administration and general office use
|
70,406
|
December 31, 2025
|
|||
|
Boca Raton, Florida
|
Corporate headquarters
|
48,154
|
November 30, 2025
|
|||
|
Berkeley Lake, Georgia
|
Physician Staffing office
|
41,607
|
October 31, 2024
|
|||
|
Creve Coeur, Missouri
|
Physician and Executive search headquarters
|
27,051
|
August 31, 2024
|
|||
We are subject to legal proceedings and claims that arise in the ordinary course of our business. We do not believe the outcome of these matters will have a material adverse effect on our business, financial condition, results of operations, or cash flows.
Not applicable.
Securities.
Our common stock currently trades under the symbol “CCRN” on the NASDAQ Global Select Market (NASDAQ). Our common stock commenced trading on the NASDAQ National Market under the symbol “CCRN” on October 25, 2001. The
19
following table sets forth, for the periods indicated, the high and low sale prices per share of CCRN common stock. Such prices reflect inter-dealer prices, without retail mark-up, mark-down or commission and may not represent actual transactions.
|
|
Sale Prices
|
||||||
|
Calendar Period
|
High
|
Low
|
|||||
|
2017
|
|
|
|||||
|
Quarter Ended March 31, 2017
|
$
|
14.96
|
|
$
|
14.48
|
|
|
|
Quarter Ended June 30, 2017
|
$
|
13.11
|
|
$
|
12.69
|
|
|
|
Quarter Ended September 30, 2017
|
$
|
12.73
|
|
$
|
12.32
|
|
|
|
Quarter Ended December 31, 2017
|
$
|
13.44
|
|
$
|
13.02
|
|
|
|
2016
|
|
|
|||||
|
Quarter Ended March 31, 2016
|
$
|
13.10
|
|
$
|
12.31
|
|
|
|
Quarter Ended June 30, 2016
|
$
|
13.48
|
|
$
|
12.93
|
|
|
|
Quarter Ended September 30, 2016
|
$
|
13.40
|
|
$
|
12.94
|
|
|
|
Quarter Ended December 31, 2016
|
$
|
13.93
|
|
$
|
13.45
|
|
|
The graph below compares the Company to the cumulative 5-year total return of holders of the Company's common stock with the cumulative total returns of the NASDAQ Composite index and the Dow Jones U.S. Business Training & Employment Agencies index. The graph assumes that the value of the investment in the Company's common stock and in each of the indexes (including reinvestment of dividends) was $100 on December 31, 2012 and tracks it through December 31, 2017.
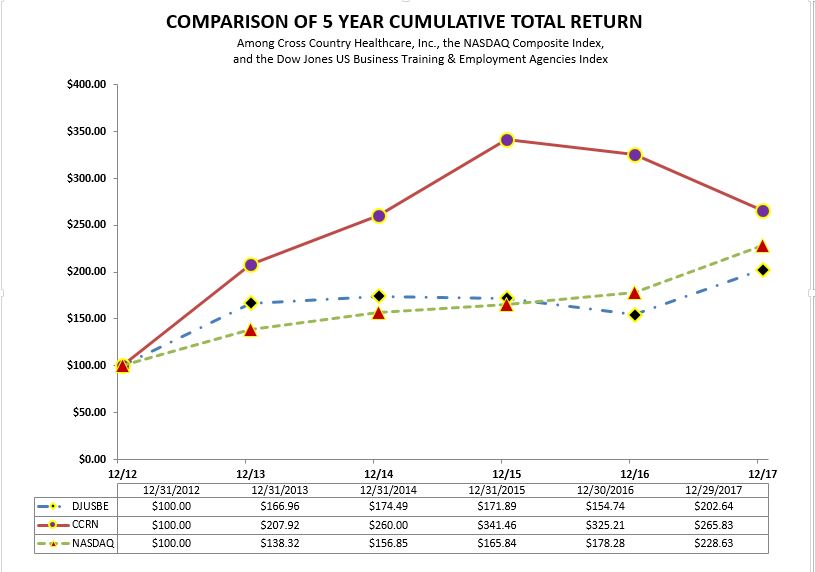
The stock price performance included in this graph is not necessarily indicative of future stock price performance.
20
As of February 21, 2018, there were 135 stockholders of record of our common stock. In addition, there were 4,396 beneficial owners of our common stock held by brokers or other institutions on behalf of stockholders.
We have never paid or declared cash dividends on our common stock. Covenants in our credit agreement limit our ability to repurchase our common stock and declare and pay cash dividends on our common stock. On February 28, 2008, our Board of Directors authorized our most recent stock repurchase program whereby we may purchase up to 1.5 million of our common shares, subject to the terms of our current credit agreement. The shares may be repurchased from time-to-time in the open market and the repurchase program may be discontinued at any time at our discretion. At December 31, 2017, we had 942,443 shares of common stock left remaining to repurchase under this authorization, subject to the limitations of our credit agreement as described in Note 14 - Stockholders' Equity to our consolidated financial statements.
The selected consolidated financial data as of
December 31, 2017
and
2016
and for the years ended
December 31, 2017
,
2016
, and
2015
are derived from the audited consolidated financial statements of Cross Country Healthcare, Inc., included elsewhere in this Report. The selected consolidated financial data as of
December 31, 2015
,
2014
, and
2013
and for the years ended
December 31,
2014
and
2013
are derived from the consolidated financial statements of Cross Country Healthcare, Inc., that have been audited but not included in this Report on Form 10-K.
The following selected financial data should be read in conjunction with the consolidated financial statements and related notes of Cross Country Healthcare, Inc., “Management’s Discussion and Analysis of Financial Condition and Results of Operations” and other financial information included elsewhere in this report.
|
Year Ended December 31,
|
|||||||||||||||||||
|
2017
|
2016
|
2015
|
2014
|
2013
|
|||||||||||||||
|
(Amounts in thousands, except per share data)
|
|||||||||||||||||||
|
Consolidated Statements of Operations Data:
|
|||||||||||||||||||
|
Revenue from services
|
$
|
865,048
|
|
$
|
833,537
|
|
$
|
767,421
|
|
$
|
617,825
|
|
$
|
438,311
|
|
||||
|
Income (loss) from operations
|
11,748
|
|
6,184
|
|
20,565
|
|
(10,468
|
)
|
(8,022
|
)
|
|||||||||
|
Consolidated net income (loss)
|
38,802
|
|
8,731
|
|
4,954
|
|
(31,534
|
)
|
(54,250
|
)
|
|||||||||
|
Net income (loss) attributable to common shareholders
|
37,513
|
|
7,967
|
|
4,418
|
|
(31,783
|
)
|
(51,969
|
)
|
|||||||||
|
Per Share Data:
|
|||||||||||||||||||
|
Net income (loss) per share attributable to common shareholders - Basic
|
$
|
1.07
|
|
$
|
0.25
|
|
$
|
0.14
|
|
$
|
(1.02
|
)
|
$
|
(1.75
|
)
|
||||
|
Net income (loss) per share attributable to common shareholders - Diluted
|
$
|
1.01
|
|
$
|
0.15
|
|
$
|
0.14
|
|
$
|
(1.02
|
)
|
$
|
(1.75
|
)
|
||||
|
Weighted Average Common Shares Outstanding:
|
|||||||||||||||||||
|
Basic
|
35,018
|
|
32,132
|
|
31,514
|
|
31,190
|
|
31,009
|
|
|||||||||
|
Diluted
|
36,166
|
|
36,246
|
|
32,162
|
|
31,190
|
|
31,009
|
|
|||||||||
|
Other Operating Data:
|
|||||||||||||||||||
|
Cash and cash equivalents
|
$
|
25,537
|
|
$
|
20,630
|
|
$
|
2,453
|
|
$
|
4,995
|
|
$
|
8,055
|
|
||||
|
Total assets
|
467,687
|
|
388,378
|
|
365,595
|
|
324,502
|
|
248,245
|
|
|||||||||
|
Total debt at par
|
100,000
|
|
64,523
|
|
63,094
|
|
58,702
|
|
8,576
|
|
|||||||||
|
Total stockholders’ equity
|
237,719
|
|
151,802
|
|
141,344
|
|
130,332
|
|
160,667
|
|
|||||||||
|
Net cash provided by (used in) operating activities
|
45,508
|
|
30,145
|
|
18,235
|
|
(4,072
|
)
|
8,659
|
|
|||||||||
21
_______________
The following items impact the comparability and presentation of our consolidated data:
|
•
|
Consolidated net income (loss) for the years ended December 31, 2017, 2016, 2015, and 2014, respectively, includes amounts attributable to noncontrolling interest of
$1.3 million
,
$0.8 million
,
$0.5 million
, and
$0.2
million. See Note 1 - Organization and Basis of Presentation to our consolidated financial statements.
|
|
•
|
We acquired all of the assets of Advantage effective July 1, 2017, all of the membership interests of Mediscan on October 30, 2015, substantially all of the assets and certain liabilities of MSN on June 30, 2014, and the operating assets of On Assignment, Inc.'s Allied Healthcare Staffing division on December 2, 2013. The results of these acquisition's operations have been included in our consolidated statements of operations since their respective effective dates of acquisition. For the years ended December 31, 2017, 2016, 2015, 2014, and 2013, we recognized
$2.0 million
,
$0.1 million
,
$0.9 million
,
$8.0 million
, and
$0.5 million
of acquisition and integration costs, respectively. See Note 3 - Acquisitions to our consolidated financial statements.
|
|
•
|
The years ended
December 31, 2017
and 2016 include less than
$0.1 million
and
$0.8 million
, respectively, of acquisition-related contingent consideration expense primarily related to the USR and Mediscan acquisitions. See Note 3 - Acquisitions and Note 10 - Fair Value Measurements to our consolidated financial statements.
|
|
•
|
We incurred restructuring costs in the years ended
December 31, 2017
,
2016
,
2015
, 2014, and 2013, for
$1.0 million
,
$0.8 million
,
$1.3 million
,
$0.8 million
, and
$0.5 million
, respectively. Restructuring costs relate to discrete cost savings initiatives in each year.
|
|
•
|
The year ended December 31, 2013 includes a legal settlement charge of
$0.8 million
related to a wage and hour class action lawsuit in California.
|
|
•
|
Non-cash impairment charges of
$14.4 million
,
$24.3 million
,
$2.1 million
,
$10.0 million
, and
$6.4 million
, respectively, were incurred in the years ended December 31, 2017, 2016, 2015, 2014, and 2013. See Note 5 - Goodwill, Trade Names, and Other Intangible Assets to our consolidated financial statements.
|
|
•
|
The years ended December 31, 2017 and 2016 include the impact of a gain on derivative liability of
$1.6
million and
$5.8 million
, while the years ended December 31, 2015 and 2014 include the impact of a loss on derivative liability of
$9.9 million
and
$16.7 million
, respectively. The derivative liability related to the Convertible Notes issued in conjunction with the acquisition of MSN. See Note 9 - Convertible Notes Derivative Liability to our consolidated financial statements.
|
|
•
|
We incurred a loss on sale of business of
$2.2 million
(an after-tax gain of
$1.3 million
), in the year ended December 31, 2015, related to the sale of our education seminars business, Cross Country Education, LLC (CCE) on August 31, 2015. See Note 4 - Disposal to our consolidated financial statements.
|
|
•
|
The years ended December 31, 2017, 2016, and 2013 include a loss on early extinguishment of debt of
$5.0
million,
$1.6 million
, and
$1.4 million
, respectively, related to extinguishment fees and the write-off of unamortized loan fees and net debt discount and issuance costs related to prior credit agreements. See Note 8 - Debt to our consolidated financial statements.
|
|
•
|
The income tax benefit for the year ended December 31, 2017 was primarily the result of reducing federal and certain state valuation allowances on our deferred tax assets totaling
$45.4 million
, offset by an
$8.0
million reduction in our net
deferred tax assets (relating to the impact from the 2017 Tax Act signed into legislation on December 22, 2017). Previously, in the year ended December 31, 2013, we recorded valuation allowances of
$52.0 million
covering all of our net deferred tax assets. The valuation allowance was maintained and reflected in the years ended December 31, 2014 through December 31, 2016.
|
The following discussion and analysis of our financial condition and results of operations should be read in conjunction with Item 1. Business, Item 6. Selected Financial Data, Item 1A. Risk Factors, Forward-Looking Statements and Item 15. Consolidated Financial Statements and the accompanying notes and other data, all of which appear elsewhere in this Annual Report on Form 10-K.
22
Business Overview
We provide healthcare staffing, recruiting and workforce solutions to our customers through a network of 76 office locations throughout the U.S. Our services include placing clinicians on travel and per diem assignments, local short-term contracts, and permanent positions. In addition, we offer flexible workforce management solutions to our customers including: MSP, education healthcare, RPO, and other outsourcing and value-added services as described in Item 1. Business. In addition, we provide both retained and contingent placement services for healthcare executives, physicians, and other healthcare professionals.
We manage and segment our business based on the nature of our services we offer to our customers. As a result, in accordance with the
Segment Reporting
Topic of the FASB ASC, we report three business segments – Nurse and Allied Staffing, Physician Staffing, and Other Human Capital Management Services.
|
●
|
Nurse and Allied Staffing
– For the year ended December 31, 2017, Nurse and Allied Staffing represented approximately
88%
of our total revenue. Nurse and Allied Staffing provides traditional staffing, recruiting, and value-added workforce solutions including: temporary and permanent placement of travel and local branch-based nurse and allied professionals, MSP services, education healthcare services, and outsourcing services. Substantially all of the results of the acquisition of Advantage have been aggregated with our Nurse and Allied Staffing business segment. See Note 3 - Acquisitions to our consolidated financial statements.
|
|
●
|
Physician Staffing
– For the year ended December 31, 2017, Physician Staffing represented approximately 11% of our total revenue. Physician Staffing provides physicians in many specialties, as well as CRNAs, NP, and PAs under our Medical Doctor Associates (MDA) brand as independent contractors on temporary assignments throughout the U.S. Less than 2% of the business related to the Advantage acquisition is managed by, and included in, the Physician Staffing business segment.
|
|
●
|
Other Human Capital Management Services
– For the year ended December 31, 2017, Other Human Capital Management Services (OHCMS) represented approximately 1% of our total revenue. Subsequent to the sale of our education seminars business, CCE, on August 31, 2015, OHCMS is comprised of retained and contingent search services for physicians, healthcare executives, and other healthcare professionals within the U.S.
|
Summary of Operations
For the year ended
December 31, 2017
, revenue from services grew 3.8% to $
865.0 million
, entirely from our Nurse and Allied Staffing business, driven by the acquisition of Advantage effective July 1, 2017, and partly offset by declines in our other segments. Demand in our Nurse and Allied Staffing segment remained relatively stable. However, our fourth quarter revenue was impacted by, in part, what we believe are some short-term pressures on our business including: the impact severe weather had on our operations, particularly due to office closures; lower demand for premium rate specialties; fewer overall placements; and a lower renewal rate. These pressures are expected to continue to impact our first quarter 2018 results, but we expect to recover in the latter part of 2018. The slight decline in our Physician Staffing segment is due to lower volume of days filled and the impact of specialty mix. Our volume of days filled increased for advanced practices compared to a decline for physician specialties. Generally, our pricing remained strong across all segments and we continued to add a growing number of MSPs that should drive continued growth in demand for our services. Excluding the impact of the Advantage acquisition, we continued to manage our selling, general, and administrative expenses as we remain committed to improving operating leverage and overall profitability. Net income attributable to common shareholders was
$37.5 million
, or $1.01 per diluted share and was impacted by noncash items including an income tax benefit resulting from the reversal of substantially all of the our valuation allowances on net deferred tax assets, partly offset by impairment charges related to Physician Staffing, and income tax expense attributable to the remeasurement of deferred tax assets under the 2017 Tax Act. As a result of the valuation allowance release, we expect our ongoing effective tax rate to be more normalized and our remaining net operating losses should offset the majority of cash taxes paid until 2019.
For the year ended December 31, 2017, we generated cash flow from operating activities of $45.5 million. In the third quarter of 2017, we financed the acquisition of Advantage using available cash and an incremental term loan. We renewed and increased the size of our Credit Agreement to a total of $215.0 million, leaving us with extra capacity for further growth. As of December 31, 2017, we had
$25.5 million
of cash and cash equivalents and a $100.0 million term loan outstanding. There were no borrowings drawn on our $115.0 million revolving credit facility, with $21.6 million of letters of credit outstanding, leaving $93.4 million available for borrowings under the revolving credit facility. See Note 8 - Debt to our consolidated financial statements.
23
See Results of Operations, Segment Results, and Liquidity and Capital Resources sections that follow for further information.
Operating Metrics
We evaluate our financial condition by tracking operating metrics and financial results specific to each of our segments. Key operating metrics include hours worked, days filled, number of FTEs, revenue per FTE, and revenue per day filled. Other operating metrics include number of open orders, candidate applications, contract bookings, length of assignment, bill and pay rates, and renewal and fill rates, number of active searches, and number of placements. These operating metrics are representative of trends that assist management in evaluating business performance. Due to the timing of our business process and other factors, certain of these operating metrics may not necessarily correlate to the reported GAAP results for the periods presented. Some of the segment financial results analyzed include revenue, gross profit margins, operating expenses, and contribution income. In addition, we monitor cash flow as well as operating and leverage ratios to help us assess our liquidity needs.
|
Business Segment
|
Business Measurement
|
|
Nurse and Allied Staffing
|
FTEs represent the average number of Nurse and Allied Staffing contract personnel on a full-time equivalent basis.
|
|
Average revenue per FTE per day is calculated by dividing the Nurse and Allied Staffing revenue per FTE by the number of days worked in the respective periods. Nurse and Allied Staffing revenue also includes revenue from the permanent placement of nurses.
|
|
|
Physician Staffing
|
Days filled is calculated by dividing the total hours invoiced during the period by 8 hours. This method does not reflect the impact of
revenue generated from permanent placements, reimbursed
expenses, discounts and allowances, and the impact from accruals
and adjustments recorded for financial statement purposes.
|
|
Revenue per day filled is calculated by dividing revenue invoiced by days filled for the period presented. Invoiced revenue excludes revenue from permanent placement and accrued revenue.
|
|
24
Results of Operations
The following table summarizes, for the periods indicated, selected consolidated statements of operations data expressed as a percentage of revenue. Our historical results of operations are not necessarily indicative of future operating results.
|
|
Year Ended December 31,
|
|||||||
|
|
2017
|
2016
|
2015
|
|||||
|
Revenue from services
|
100.0
|
%
|
100.0
|
%
|
100.0
|
%
|
||
|
Direct operating expenses
|
73.6
|
|
73.4
|
|
74.3
|
|
||
|
Selling, general, and administrative expenses
|
21.7
|
|
21.5
|
|
21.0
|
|
||
|
Bad debt expense
|
0.2
|
|
0.1
|
|
0.1
|
|
||
|
Depreciation and amortization
|
1.2
|
|
1.1
|
|
1.0
|
|
||
|
Loss on sale of business
|
—
|
|
—
|
|
0.3
|
|
||
|
Acquisition and integration costs
|
0.2
|
|
—
|
|
0.1
|
|
||
|
Acquisition-related contingent consideration
|
—
|
|
0.1
|
|
—
|
|
||
|
Restructuring costs
|
0.1
|
|
0.1
|
|
0.2
|
|
||
|
Impairment charges
|
1.6
|
|
2.9
|
|
0.3
|
|
||
|
Income from operations
|
1.4
|
|
0.8
|
|
2.7
|
|
||
|
Interest expense
|
0.5
|
|
0.7
|
|
0.9
|
|
||
|
(Gain) loss on derivative liability
|
(0.2
|
)
|
(0.7
|
)
|
1.3
|
|
||
|
Loss on early extinguishment of debt
|
0.6
|
|
0.2
|
|
—
|
|
||
|
Income before income taxes
|
0.5
|
|
0.6
|
|
0.5
|
|
||
|
Income tax benefit
|
(4.0
|
)
|
(0.5
|
)
|
(0.1
|
)
|
||
|
Consolidated net income
|
4.5
|
|
1.1
|
|
0.6
|
|
||
|
Less: Net income attributable to noncontrolling interest in subsidiary
|
0.2
|
|
0.1
|
|
—
|
|
||
|
Net income attributable to common shareholders
|
4.3
|
%
|
1.0
|
%
|
0.6
|
%
|
||
25
Comparison of Results for the Year Ended December 31, 2017 compared to the Year Ended December 31, 2016
|
Year Ended December 31,
|
||||||||||||||
|
Increase (Decrease)
|
Increase (Decrease)
|
|||||||||||||
|
2017
|
2016
|
$
|
%
|
|||||||||||
|
(Dollars in thousands)
|
||||||||||||||
|
Revenue from services
|
$
|
865,048
|
|
$
|
833,537
|
|
$
|
31,511
|
|
3.8
|
%
|
|||
|
Direct operating expenses
|
636,462
|
|
611,802
|
|
24,660
|
|
4.0
|
%
|
||||||
|
Selling, general, and administrative expenses
|
187,435
|
|
179,820
|
|
7,615
|
|
4.2
|
%
|
||||||
|
Bad debt expense
|
1,828
|
|
593
|
|
1,235
|
|
208.3
|
%
|
||||||
|
Depreciation and amortization
|
10,174
|
|
9,182
|
|
992
|
|
10.8
|
%
|
||||||
|
Acquisition-related contingent consideration
|
44
|
|
814
|
|
(770
|
)
|
(94.6
|
)%
|
||||||
|
Acquisition and integration costs
|
1,975
|
|
78
|
|
1,897
|
|
2,432.1
|
%
|
||||||
|
Restructuring costs
|
1,026
|
|
753
|
|
273
|
|
36.3
|
%
|
||||||
|
Impairment charges
|
14,356
|
|
24,311
|
|
(9,955
|
)
|
(40.9
|
)%
|
||||||
|
Income from operations
|
11,748
|
|
6,184
|
|
5,564
|
|
90.0
|
%
|
||||||
|
Interest expense
|
4,214
|
|
6,106
|
|
(1,892
|
)
|
(31.0
|
)%
|
||||||
|
Gain on derivative liability
|
(1,581
|
)
|
(5,805
|
)
|
4,224
|
|
72.8
|
%
|
||||||
|
Loss on early extinguishment of debt
|
4,969
|
|
1,568
|
|
3,401
|
|
216.9
|
%
|
||||||
|
Other income, net
|
(155
|
)
|
(230
|
)
|
75
|
|
32.6
|
%
|
||||||
|
Income before income taxes
|
4,301
|
|
4,545
|
|
(244
|
)
|
(5.4
|
)%
|
||||||
|
Income tax benefit
|
(34,501
|
)
|
(4,186
|
)
|
(30,315
|
)
|
(724.2
|
)%
|
||||||
|
Consolidated net income
|
38,802
|
|
8,731
|
|
30,071
|
|
344.4
|
%
|
||||||
|
Less: Net income attributable to noncontrolling interest in subsidiary
|
1,289
|
|
764
|
|
525
|
|
68.7
|
%
|
||||||
|
Net income attributable to common shareholders
|
$
|
37,513
|
|
$
|
7,967
|
|
$
|
29,546
|
|
370.9
|
%
|
|||
Revenue from services
Revenue from services
increased
$31.5 million
, or
3.8%
, to
$865.0 million
for the year ended
December 31, 2017
, as compared to
$833.5 million
for the year ended
December 31, 2016
. The
increase
was entirely from Nurse and Allied Staffing primarily due to the Advantage acquisition, and partially offset by lower revenue from Physician Staffing and OHCMS. See further discussion in Segment Results.
Direct operating expenses
Direct operating expenses are comprised primarily of field employee compensation and independent contractor expenses, housing expenses, travel expenses, and field insurance expenses. Direct operating expenses
increased
$24.7 million
, or
4.0%
, to
$636.5 million
for the year ended
December 31, 2017
, as compared to
$611.8 million
for the year ended
December 31, 2016
, entirely due to the Advantage acquisition. As a percentage of total revenue, direct operating expenses increased to 73.6% compared to 73.4% in the prior year period.
Selling, general, and administrative expenses
Selling, general, and administrative expenses
increased
$7.6 million
, or
4.2%
, to
$187.4 million
for the year ended
December 31, 2017
, as compared to
$179.8 million
for the year ended
December 31, 2016
, partly due to the impact of the acquisition of Advantage. Excluding the impact of Advantage, the increase was primarily due to investments in revenue-producing headcount, higher marketing costs for candidate attraction, and higher compensation and benefit costs. As a percentage of total revenue, selling, general, and administrative expenses were 21.7% and 21.5% for the year ended December 31, 2017 and December 31, 2016, respectively.
26
Depreciation and amortization expense
Depreciation and amortization expense
in the year ended
December 31, 2017
increased to
$10.2 million
as compared to
$9.2 million
for the year ended
December 31, 2016
, partly due to the additional amortization of other intangible assets of Advantage. As a percentage of revenue, depreciation and amortization expense was
1.2%
for the year ended
December 31, 2017
and
1.1%
for the year ended
December 31, 2016
.
Acquisition-related contingent consideration
Acquisition-related contingent consideration totaled less than $0.1 million for the year ended December 31, 2017, related to the accretion on earnouts, partly offset by the reversal of an earnout liability related to Mediscan which was determined would not be achieved, as compared to $0.8 million for the year ended December 31, 2016, primarily related to accretion of the Mediscan earnouts. In the fourth quarter of 2017, we also recognized a decrease in the fair value of the USR earnout liability of
$1.3 million
, driven by the decrease in the projected USR 2018 and 2019 revenue and EBITDA amounts, offset by a $1.2 million increase in the projected fair value of Mediscan's DirectEd earnout liability, as a result of an increase in their projected 2018 and 2019 gross profit amounts. See Note 9 - Fair Value Measurements to our consolidated financial statements.
Acquisition and integration costs
During the years ended
December 31, 2017
and 2016, we incurred acquisition and integration costs of
$2.0 million
and
$0.1 million
, respectively. The 2017 costs
consisted primarily of transaction, advisory, and legal fees related to the acquisition of Advantage. See Note 3 - Acquisitions to our consolidated financial statements.
Restructuring costs
Restructuring costs include severance and exit costs incurred as part of separate and discrete cost savings initiatives. We recorded restructuring costs of
$1.0 million
for the year ended
December 31, 2017
and
$0.8 million
for the year ended
December 31, 2016
.
Impairment charges
In the fourth quarter of 2017, we recorded non-cash impairment charges of $14.4 million relating to the Physician Staffing reporting unit. We reduced our long-range forecast for the Physician Staffing business segment in the fourth quarter of 2017. The lower than expected revenue was driven by lower booking volumes, partly due to the loss of customers. In addition, margins of the reporting unit were negatively impacted from continued investments in the business. As a result, we recorded non-cash impairment charges of $8.7 million related to trade names and $5.7 million related to goodwill.
In the second quarter of 2016, we recorded non-cash impairment charges of $24.3 million relating to the Physician Staffing reporting unit. Based on its under-performance to plan through the six months ended June 30, 2016, we revised our growth assumptions for the Physician Staffing reporting unit which triggered our evaluation.
Interest expense
Interest expense
totaled
$4.2 million
for the year ended
December 31, 2017
and
$6.1 million
for the year ended
December 31, 2016
. The decrease was due to a lower effective interest rate partially offset by higher average borrowings. The effective interest rate on our borrowings decreased to 4.6% for the year ended
December 31, 2017
compared to 8.4% for the year ended
December 31, 2016
, primarily due to the payoff of our $25.0 million 8% fixed rate Convertible Notes on March 17, 2017. See Note 7 - Debt to our consolidated financial statements.
Gain on derivative liability
Gain on derivative liability of
$1.6 million
and
$5.8 million
for the years ended
December 31, 2017
and
December 31, 2016
, respectively, related to the change in the fair value of embedded features of our Convertible Notes. The gains in both periods primarily resulted from decreases in our share price from the end of the respective prior years through the 2017 payoff date and through December 31, 2016. The gain in 2016 was partially offset by a reduction in credit risk. See Note 8 - Debt and Note 9 - Convertible Notes Derivative Liability to our consolidated financial statements.
27
Loss on early extinguishment of debt of $5.0 million for the year ended December 31, 2017 relates to the write-off of original issue discount and debt issuance costs of $4.4 million and a pre-payment fee of $0.6 million due to the early settlement of our Convertible Notes. Loss on early extinguishment of debt was $1.6 million for the year ended December 31, 2016 and related to the write-off of unamortized net debt discount and issuance costs, including a redemption premium of $0.6 million, related to our Second Lien Term Loan. See Note 8 - Debt to our consolidated financial statements.
I
ncome tax benefit
Income tax benefit from continuing operations totaled
$34.5 million
for the year ended
December 31, 2017
, compared to
$4.2 million
for the year ended
December 31, 2016
. The effective tax rate was negative 802.2% and negative 92.1%, including the impact of discrete items, for the years ended December 31, 2017 and 2016, respectively. The effective tax rate in 2017 was impacted by the reversal of valuation allowances, partially offset by the changes in estimated deferred tax assets resulting from the 2017 Tax Act. The effective tax rate in 2016 is different than the statutory rates primarily due to the impact from amortization of indefinite-lived intangible assets for tax purposes and the partial non-deductibility of certain per diem expenses and international and state minimum taxes. See Note 13 - Income Taxes to our consolidated financial statements for further information.
Comparison of Results for the Year Ended December 31, 2016 compared to the Year Ended December 31, 2015
|
Year Ended December 31,
|
||||||||||||||
|
Increase (Decrease)
|
Increase (Decrease)
|
|||||||||||||
|
2016
|
2015
|
$
|
%
|
|||||||||||
|
(Dollars in thousands)
|
||||||||||||||
|
Revenue from services
|
$
|
833,537
|
|
$
|
767,421
|
|
$
|
66,116
|
|
8.6
|
%
|
|||
|
Direct operating expenses
|
611,802
|
|
570,056
|
|
41,746
|
|
7.3
|
%
|
||||||
|
Selling, general, and administrative expenses
|
179,820
|
|
161,275
|
|
18,545
|
|
11.5
|
%
|
||||||
|
Bad debt expense
|
593
|
|
999
|
|
(406
|
)
|
(40.6
|
)%
|
||||||
|
Depreciation and amortization
|
9,182
|
|
8,066
|
|
1,116
|
|
13.8
|
%
|
||||||
|
Loss on sale of business
|
—
|
|
2,184
|
|
(2,184
|
)
|
(100.0
|
)%
|
||||||
|
Acquisition-related contingent consideration
|
814
|
|
—
|
|
814
|
|
100.0
|
%
|
||||||
|
Acquisition and integration costs
|
78
|
|
902
|
|
(824
|
)
|
(91.4
|
)%
|
||||||
|
Restructuring costs
|
753
|
|
1,274
|
|
(521
|
)
|
(40.9
|
)%
|
||||||
|
Impairment charges
|
24,311
|
|
2,100
|
|
22,211
|
|
1,057.7
|
%
|
||||||
|
Income from operations
|
6,184
|
|
20,565
|
|
(14,381
|
)
|
(69.9
|
)%
|
||||||
|
Interest expense
|
6,106
|
|
6,810
|
|
(704
|
)
|
(10.3
|
)%
|
||||||
|
(Gain) loss on derivative liability
|
(5,805
|
)
|
9,901
|
|
(15,706
|
)
|
(158.6
|
)%
|
||||||
|
Loss on early extinguishment of debt
|
1,568
|
|
—
|
|
1,568
|
|
100.0
|
%
|
||||||
|
Other income, net
|
(230
|
)
|
(306
|
)
|
76
|
|
24.8
|
%
|
||||||
|
Income before income taxes
|
4,545
|
|
4,160
|
|
385
|
|
9.3
|
%
|
||||||
|
Income tax benefit
|
(4,186
|
)
|
(794
|
)
|
(3,392
|
)
|
(427.2
|
)%
|
||||||
|
Consolidated net income
|
8,731
|
|
4,954
|
|
3,777
|
|
76.2
|
%
|
||||||
|
Less: Net income attributable to noncontrolling interest in subsidiary
|
764
|
|
536
|
|
228
|
|
42.5
|
%
|
||||||
|
Net income attributable to common shareholders
|
$
|
7,967
|
|
$
|
4,418
|
|
$
|
3,549
|
|
80.3
|
%
|
|||
Revenue from services
Revenue from services increased $66.1 million, or 8.6%, to $833.5 million for the year ended December 31, 2016, as compared to $767.4 million for the year ended December 31, 2015. The increase was entirely from Nurse and Allied Staffing,
28
including the impact from the Mediscan acquisition, and partially offset by lower revenue from Physician Staffing and Other Human Capital Management Services, partly due to the divestiture of CCE. See further discussion in Segment Results.
Direct operating expenses
Direct operating expenses are comprised primarily of field employee compensation and independent contractor expenses, housing expenses, travel expenses, and field insurance expenses. Direct operating expenses
increased
$41.7 million, or 7.3%, to $611.8 million for the year ended December 31, 2016, as compared to $570.1 million for year ended December 31, 2015. The increase was due to both higher volume of business driven by organic growth and the result of the Mediscan acquisition, as well as increases in certain costs such as compensation for healthcare professionals and related benefits. These increases were partly offset by the impact of the divestiture of CCE.
As a percentage of total revenue, direct operating expenses represented 73.4% of revenue for the year ended December 31, 2016, and 74.3% for the year ended December 31, 2015 primarily due to improved pricing.
Selling, general, and administrative expenses
Selling, general, and administrative expenses increased $18.5 million, or 11.5%, to $179.8 million for the year ended December 31, 2016, as compared to $161.3 million for the year ended December 31, 2015. The increase was primarily due to investments in our IT infrastructure, growth in revenue producing headcount such as recruiters and workforce solutions specialists, higher marketing costs for candidate attraction, and the impact of the acquisition of Mediscan. These were partially offset by a reduction in expenses related to the CCE divestiture. As a percentage of total revenue, selling, general, and administrative expenses were 21.5% and 21.0% for the year ended December 31, 2016 and December 31, 2015, respectively.
Depreciation and amortization expense
Depreciation and amortization expense
in the year ended
December 31, 2016
increased to $9.2 million as compared to $8.1 million for the year ended December 31, 2015, as a result of the Mediscan acquisition. As a percentage of revenue, depreciation and amortization expense was 1.1% for the year ended
December 31, 2016
and 1.0% for the year ended December 31, 2015.
Loss on sale of business
During the year ended December 31, 2015, we sold our education seminars business and recognized a pre-tax loss of $2.2 million related to the divestiture of the business. There were no such transactions during the year ended December 31, 2016.
Acquisition-related contingent consideration
Acquisition-related contingent consideration totaled $0.8 million for the year ended December 31, 2016, primarily related to the Mediscan acquisition. There were no such costs for the year ended December 31, 2015. See Note 3 - Acquisitions to our consolidated financial statements.
Acquisition and integration costs
During the years ended December 31, 2016 and 2015, we incurred acquisition and integration costs of $0.1 million and $0.9 million, respectively. The 2016 costs related to the acquisition of USR, while the 2015 costs related to the acquisition of Mediscan.
See Note 3 - Acquisitions to our consolidated financial statements.
Restructuring costs
Restructuring costs include severance and lease consolidations as part of our specific cost savings initiatives. We recorded restructuring costs of $0.8 million for the year ended December 31, 2016, related to the centralization of corporate functions and optimizing our branch footprint. We recorded restructuring costs of $1.3 million for the year ended December 31, 2015, related to severance and office consolidations.
Impairment charges
In the second quarter of 2016, we recorded non-cash impairment charges of $24.3 million relating to the Physician Staffing reporting unit. Based on its under-performance to plan through the six months ended June 30, 2016, we revised our growth
29
assumptions for the Physician Staffing reporting unit which triggered our evaluation. In the fourth quarter of 2016, we determined that no additional impairment of goodwill or other intangible assets was warranted. In the fourth quarter of 2015, we conducted an assessment of our indefinite-lived intangible assets and recorded non-cash impairment charges of $2.1 million relating to the Physician Staffing trade names. We determined that based on our projected revenue stream, our estimated fair value was less than the carrying amount of the trade names. See Critical Accounting Principles and Estimates and Note 5 - Goodwill, Trade Names, and Other Intangible Assets to our consolidated financial statements.
Interest expense
Interest expense
totaled $6.1 million for the year ended December 31, 2016 and $6.8 million for the year ended December 31, 2015. We refinanced our debt structure late in the second quarter of 2016, which resulted in lower overall borrowing costs. The effective interest rate on our borrowings was 8.4% for the year ended December 31, 2016 compared to 10.1% in the year ended December 31, 2015. Our $25.0 million in Convertible Notes which bear an interest rate of 8.00% will become callable by us in July 2017.
(Gain) loss on derivative liability
Gain on derivative liability of $5.8 million and loss on derivative liability of $9.9 million for the years ended December 31, 2016 and December 31, 2015, respectively, relate to the change in the fair value of embedded features of our Convertible Notes from the end of the respective prior year. The gain and loss were primarily a result of a corresponding decrease and increase, respectively, in our share price in the respective periods. The Convertible Notes include terms that are considered to be embedded derivatives, including conversion and redemption features that primarily protect the investors' investment with us. Each reporting period we are required to fair value the embedded derivative with the changes being recorded as a component of other expense (income) on our consolidated statements of operations. See Note 9 - Convertible Notes Derivative Liability to our consolidated financial statements.
Loss on early extinguishment of debt
Loss on early extinguishment of debt was $1.6 million for the year ended December 31, 2016 and related to the write-off of unamortized net debt discount and issuance costs, including a redemption premium of $0.6 million, related to our Second Lien Term Loan. See Note 8 - Debt to our consolidated financial statements.
I
ncome tax benefit
Income tax benefit from continuing operations totaled $4.2 million for the year ended December 31, 2016, compared to $0.8 million for the year ended December 31, 2015. The effective tax rate was negative 92.1% and negative 19.1%, including the impact of discrete items, for the years ended December 31, 2016 and 2015, respectively. Excluding discrete items, our effective tax rate for these years was negative 89.8% and 41.1%, respectively. The effective tax rates are different than the statutory rates primarily due to the impact from amortization of indefinite-lived intangible assets for tax purposes, the partial non-deductibility of certain per diem expenses, and international and state minimum taxes.
30
Segment Results
Information on operating segments and a reconciliation to income (loss) from operations for the periods indicated are as follows:
|
|
Year Ended December 31,
|
||||||||||
|
|
2017
|
2016
|
2015
|
||||||||
|
|
(amounts in thousands)
|
||||||||||
|
Revenue from services:
|
|
|
|
||||||||
|
Nurse and Allied Staffing
|
$
|
758,267
|
|
$
|
721,486
|
|
$
|
621,258
|
|
||
|
Physician Staffing
|
93,610
|
|
98,283
|
|
115,336
|
|
|||||
|
Other Human Capital Management Services
|
13,171
|
|
13,768
|
|
30,827
|
|
|||||
|
|
$
|
865,048
|
|
$
|
833,537
|
|
$
|
767,421
|
|
||
|
Contribution income (loss):
|
|
|
|
|
|
|
|||||
|
Nurse and Allied Staffing
|
$
|
73,614
|
|
$
|
71,992
|
|
$
|
55,718
|
|
||
|
Physician Staffing
|
5,256
|
|
8,265
|
|
10,213
|
|
|||||
|
Other Human Capital Management Services
|
(357
|
)
|
(535
|
)
|
1,863
|
|
|||||
|
|
78,513
|
|
79,722
|
|
67,794
|
|
|||||
|
Unallocated corporate overhead
|
39,190
|
|
38,400
|
|
32,703
|
|
|||||
|
Depreciation and amortization
|
10,174
|
|
9,182
|
|
8,066
|
|
|||||
|
Loss on sale of business
|
—
|
|
—
|
|
2,184
|
|
|||||
|
Acquisition and integration costs
|
1,975
|
|
78
|
|
902
|
|
|||||
|
Acquisition-related contingent consideration
|
44
|
|
814
|
|
—
|
|
|||||
|
Restructuring costs
|
1,026
|
|
753
|
|
1,274
|
|
|||||
|
Impairment charges
|
14,356
|
|
24,311
|
|
2,100
|
|
|||||
|
Income from operations
|
$
|
11,748
|
|
$
|
6,184
|
|
$
|
20,565
|
|
||
See Note 17 - Segment Data.
Certain statistical data for our business segments for the periods indicated are as follows:
|
Year Ended December 31,
|
Percent
|
|||||||||||||
|
2017
|
2016
|
Change
|
Change
|
|||||||||||
|
Nurse and Allied Staffing statistical data:
|
||||||||||||||
|
FTEs
|
7,397
|
|
6,953
|
|
444
|
|
6.4
|
%
|
||||||
|
Average Nurse and Allied Staffing revenue per FTE per day
|
$
|
281
|
|
$
|
284
|
|
$
|
(3
|
)
|
(1.1
|
)%
|
|||
|
Physician Staffing statistical data:
|
||||||||||||||
|
Days filled
|
61,148
|
|
62,482
|
|
(1,334
|
)
|
(2.1
|
)%
|
||||||
|
Revenue per day filled
|
$
|
1,549
|
|
$
|
1,549
|
|
$
|
—
|
|
—
|
%
|
|||
31
|
Year Ended December 31,
|
Percent
|
|||||||||||||
|
2016
|
2015
|
Change
|
Change
|
|||||||||||
|
Nurse and Allied Staffing statistical data:
|
||||||||||||||
|
FTEs
|
6,953
|
|
6,624
|
|
329
|
|
5.0
|
%
|
||||||
|
Average Nurse and Allied Staffing revenue per FTE per day
|
$
|
284
|
|
$
|
257
|
|
$
|
27
|
|
10.5
|
%
|
|||
|
Physician Staffing statistical data:
|
||||||||||||||
|
Days filled
|
62,482
|
|
77,601
|
|
(15,119
|
)
|
(19.5
|
)%
|
||||||
|
Revenue per day filled
|
$
|
1,549
|
|
$
|
1,463
|
|
$
|
86
|
|
5.9
|
%
|
|||
See definition of Business Measurements under the Operating Metrics section of our Management's Discussion and Analysis.
Segment Comparison - Year Ended December 31, 2017 compared to the Year Ended December 31, 2016
Nurse and Allied Staffing
Revenue from the Nurse and Allied Staffing business segment
increased
$36.8 million
, or
5.1%
to
$758.3 million
for the year ended
December 31, 2017
, from
$721.5 million
for the year ended
December 31, 2016
. The year-over-year increase was entirely due the impact of the Advantage acquisition. Excluding the impact of the Advantage acquisition, revenue declined 1.3%, primarily due to the impact of higher average bill rates partly related to specific project revenue in the prior year and lower premium rate business in 2017, partially offset by growth in our education healthcare staffing operations.
Contribution income from Nurse and Allied Staffing for the year ended
December 31, 2017
,
increased
$1.6 million
or
2.3%
, to
$73.6 million
from
$72.0 million
in year ended
December 31, 2016
. As a percentage of segment revenue, contribution income margin decreased to
9.7%
for the year ended
December 31, 2017
from
10.0%
for the year ended
December 31, 2016
, primarily due to higher compensation packages for our field staff that were in place in the early part of the year.
Operating Metrics
The average number of Nurse and Allied Staffing FTEs on contract during the year ended
December 31, 2017
increased 6.4% over the year ended
December 31, 2016
, in part due to the impact of the acquisition of Advantage. Average Nurse and Allied Staffing revenue per FTE per day
decreased
approximately
1.1%
in the year ended
December 31, 2017
compared to the year ended
December 31, 2016
, primarily due to less premium rate business in 2017.
Physician Staffing
Revenue from Physician Staffing
decreased
$4.7 million
, or
4.8%
to
$93.6 million
for the year ended
December 31, 2017
, compared to
$98.3 million
for the year ended
December 31, 2016
, primarily due to a decrease in volume of days filled.
Contribution income from Physician Staffing for the year ended
December 31, 2017
,
decreased
$3.0 million
or
36.4%
to
$5.3 million
compared to
$8.3 million
in the year ended
December 31, 2016
. As a percentage of segment revenue, contribution income was
5.6%
for the year ended
December 31, 2017
and
8.4%
for the year ended
December 31, 2016
. The margins were negatively impacted from continued investments in the business.
Operating Metrics
Physician Staffing days filled
decreased
2.1%
to
61,148
in the year ended
December 31, 2017
, compared to
62,482
in the year ended
December 31, 2016
, primarily due to a decline in physician specialties, partly offset by an increase in advanced practices. Part of the volume decline in physician specialties is due to a reduction in orders from government customers. Revenue per day filled was $1,549 for the years ended
December 31, 2017
and 2016.
Other Human Capital Management Services
Revenue from OHCMS for the year ended
December 31, 2017
,
decreased
$0.6 million
, or
4.3%
, to
$13.2 million
from
$13.8 million
in the year ended
December 31, 2016
, primarily due to a decrease in executive searches and placements, partially offset by higher physician searches.
32
Contribution loss from OHCMS for the year ended
December 31, 2017
, decreased by $0.1 million, or
33.3%
, to
$0.4 million
, compared to
$0.5 million
for the year ended
December 31, 2016
.
Unallocated corporate overhead
Included in unallocated corporate overhead is corporate compensation and benefits, and general and administrative expenses including rent and utilities, computer supplies and expenses, insurance, professional expenses, corporate-wide projects (initiatives) and public company expenses. Unallocated corporate overhead was $39.2 million for the year ended December 31, 2017, compared to $38.4 million for the year ended December 31, 2016, primarily due to an increase in compensation and benefits. As a percentage of consolidated revenue, unallocated corporate overhead was
4.5%
for the year ended
December 31, 2017
, and
4.6%
for the year ended
December 31, 2016
.
Segment Comparison - Year Ended December 31, 2016 compared to the Year Ended December 31, 2015
Nurse and Allied Staffing
Revenue from Nurse and Allied Staffing business segment
increased
$100.2 million
, or
16.1%
, to
$721.5 million
for the year ended December 31, 2016, from
$621.3 million
for the year ended December 31, 2015. The year-over-year increase was primarily due to a combination of improved pricing and the impact of the Mediscan acquisition.
Contribution income from Nurse and Allied Staffing for the year ended December 31, 2016, increased $16.3 million or 29.2%, to $72.0 million from $55.7 million in year ended December 31, 2015. As a percentage of segment revenue, contribution income margin increased to 10.0% for the year ended December 31, 2016 from 9.0% for the year ended December 31, 2015, reflecting improvements in bill/pay spread partially offset by an increase in our compensation packages.
Operating Metrics
The average number of Nurse and Allied Staffing FTEs on contract during the year ended December 31, 2016 increased 5.0% over the year ended December 31, 2015, primarily due to increased demand and the impact of the Mediscan acquisition. Average Nurse and Allied Staffing revenue per FTE per day increased approximately 10.5% in the year ended December 31, 2016 compared to the year ended December 31, 2015, primarily due to improved pricing.
Physician Staffing
Revenue from Physician Staffing decreased $17.1 million, or 14.8% to $98.3 million for the year ended December 31, 2016, compared to $115.3 million for the year ended December 31, 2015. The decrease in revenue was due to lower volume of days filled during the period, and was partially offset by favorable pricing.
Contribution income from Physician Staffing for the year ended December 31, 2016, decreased $1.9 million or 19.1% to $8.3 million compared to $10.2 million in the year ended December 31, 2015. As a percentage of segment revenue, contribution income was 8.4% for the year ended December 31, 2016 and 8.9% for the year ended December 31, 2015. The margin decline was primarily due to lower gross profit and reduced operating leverage on the lower revenue.
Operating Metrics
Physician Staffing days filled decreased 19.5% to 62,482 in the year ended December 31, 2016, compared to 77,601 in the year ended December 31, 2015. Revenue per day filled for the year ended December 31, 2016 was $1,549, a 5.9% increase from the year ended December 31, 2015, reflecting higher average prices. The primary decline in days filled was due to lower demand from our customers and partly due to the loss of customers.
Other Human Capital Management Services
Revenue from OHCMS for the year ended December 31, 2016, decreased $17.1 million, or 55.3%, to $13.8 million from $30.8 million in the year ended December 31, 2015, as a result of the divestiture of our education seminars business in the third quarter of 2015. In addition, revenue from our physician and executive search business decreased 15.2% on a lower level of retained and executive searches.
33
Contribution income from OHCMS for the year ended December 31, 2016, decreased by $2.4 million, or 128.7%, to a loss of $0.5 million, compared to income of $1.9 million in the year ended December 31, 2015. The decrease in contribution income was primarily due to the revenue decrease in our physician and executive search business resulting in lower operating leverage for the business. Contribution income as a percentage of segment revenue decreased to a negative 3.9% for the year ended December 31, 2016 from a positive 6.0% for the year ended December 31, 2015.
Unallocated corporate overhead
Included in unallocated corporate overhead is corporate compensation and benefits, and general and administrative expenses including rent and utilities, computer supplies and expenses, insurance, professional expenses, corporate-wide projects (initiatives), and public company expenses. Unallocated corporate overhead was $38.4 million for the year ended December 31, 2016, compared to $32.7 million for the year ended December 31, 2015. The increase is primarily due to higher compensation and benefits and professional expenses as we have been centralizing administrative functions. In addition, we made investments in company-wide projects and IT infrastructure. As a percentage of consolidated revenue, unallocated corporate overhead was 4.6% for the year ended December 31, 2016, and 4.3% for the year ended December 31, 2015.
Transactions with Related Parties
See Note 16 - Related Party Transactions to our consolidated financial statements.
Liquidity and Capital Resources
At
December 31, 2017
, we had
$25.5 million
in cash and cash equivalents, and $100.0 million of Term Loan outstanding. Working capital increased by
$5.8 million
to
$114.3 million
as of
December 31, 2017
, compared to
$108.5 million
as of
December 31, 2016
. Our net days' sales outstanding (DSO), which excludes amounts owed to subcontractors, increased 3 days to 58 days as of December 31, 2017, compared to 55 days as of December 31, 2016.
Our operating cash flow constitutes our primary source of liquidity, and historically, has been sufficient to fund our working capital, capital expenditures, internal business expansion, and debt service, including our commitments as described in the Commitments table which follows. We expect to meet our future needs for working capital, capital expenditures, internal business expansion, and debt service from a combination of cash on hand, operating cash flows, and funds available through the revolving loan portion of our Amended and Restated Credit Agreement. See debt discussion which follows. In 2018, we are planning to launch a new initiative to replace our legacy system which supports the travel nurse staffing operations. The total cost of the initiative is expected to be approximately $10 million to $12 million through 2019, with approximately $5 million to $6 million being incurred in 2018. We expect the majority of the costs for the initiative to be capitalized. Operating cash flows and cash on hand, along with amounts available under our revolving credit facility, should be sufficient to meet these needs during the next twelve months.
Cash Flow Comparisons
Year Ended
December 31, 2017
Compared to Year Ended
December 31, 2016
Net cash provided by operating activities during the year ended
December 31, 2017
was
$45.5 million
compared to
$30.1 million
during the year ended
December 31, 2016
, primarily due to higher collections partly offset by the timing of payments for the year ended December 31, 2017.
Investing activities used a net of
$91.4 million
in the year ended
December 31, 2017
compared to
$9.8 million
in the year ended
December 31, 2016
. Net cash used in the year ended December 31, 2017 was for the Advantage acquisition and for capital expenditures, of which $2.9 million was reimbursed from our landlord for tenant improvements and is reflected in operating activities. Net cash used in investing activities in the year ended December 31, 2016 included $6.5 million for capital expenditures, $1.9 million for the acquisition of USR, and $1.9 million of other acquisition-related settlements, which was partially offset by the receipt of $0.5 million related to proceeds from the sale of CCE. See Note 3 - Acquisitions and Note 4 - Disposal to our consolidated financial statements.
Net cash provided by financing activities during the year ended December 31, 2017 was $50.8 million, compared to $2.2 million net cash used during the year ended December 31, 2016. During the year ended December 31, 2017, in the first quarter, we paid off our Convertible Notes with a partial cash payment of $5.0 million and extinguishment fees of $0.6 million. We also funded the acquisition of Advantage using our Senior Credit Facility and subsequently refinanced, resulting in net borrowings of $68.5 million on the Senior Credit Facility ($62.0 million in Term Loans and $6.5 million on the
34
Revolving Credit Facility which was subsequently repaid) and debt issuance costs of $0.9 million. In addition, we used cash to repay $1.5 million on our Term Loan, pay $1.8 million for shares withheld for taxes, $1.2 million for noncontrolling shareholder payments, and $0.3 million of contingent consideration. During the year ended December 31, 2016, we entered into the 2016 Senior Credit Facility which provided us with $40.0 million of borrowings under the Term Loan Facility. Part of the proceeds from the borrowings were used to prepay our $30.0 million Second Lien Term Loan including a prepayment penalty of $0.6 million and $1.2 million of debt issuance costs. During the year ended December 31, 2016, we also repaid a net of $8.0 million on our senior secured asset-based credit facility and $0.5 million on our term loan facility, and used cash to pay $0.9 million for shares withheld for taxes, $0.7 million for noncontrolling shareholder payments, and $0.2 million of contingent consideration.
Year Ended December 31, 2016 Compared to Year Ended December 31, 2015
Net cash provided by operating activities during the year ended December 31, 2016 was $30.1 million compared to $18.2 million during the year ended December 31, 2015, primarily due to higher revenue from services coupled with a 2 day improvement in net DSO for the year ended December 31, 2016.
Investing activities used a net of $9.8 million in the year ended December 31, 2016 compared to $24.1 million in the year ended December 31, 2015. Net cash used in investing activities in the year ended December 31, 2016 included $6.5 million for capital expenditures in 2016 (of which $1.3 million has been reimbursed from our landlord for tenant improvements and is reflected in operating activities), and $2.4 million for capital expenditures in 2015. During the year ended December 31, 2016, we used $1.9 million for the acquisition of USR, and $1.9 million of acquisition-related settlements, which was partially offset by the receipt of $0.5 million related to proceeds from the sale of CCE. See Note 4 - Disposals to our consolidated financial statements. This compares to a use of $28.7 million for the Mediscan acquisition and $0.1 million of acquisition-related settlements related to MSN, partially offset by proceeds from the sale of our education seminars business of $7.2 million, net of related costs for the year ended December 31, 2015.
Net cash used in financing activities during the year ended December 31, 2016 was $2.2 million, compared to net cash provided by financing activities of $3.4 million during the year ended December 31, 2015. During the year ended December 31, 2016, we used a total of $1.8 million for debt issuance costs and extinguishment fees related to refinancing our debt and we increased the principal amount of our debt by $1.4 million. See Note 8 - Debt to our consolidated financial statements. During 2016, we also paid $0.2 million for contingent consideration related to the Mediscan acquisition. During the year ended December 31, 2015, we increased the principal amount of our debt by $4.5 million primarily to fund the acquisition of Mediscan, including acquisition-related expenses. In addition, we used cash to pay $0.9 million and $0.5 million for shares withheld for taxes, and $0.7 million and $0.5 million for noncontrolling shareholder payments, for the years ended December 31, 2016 and 2015, respectively.
Debt
Credit Facilities
As more fully described in Note 8 - Debt to our consolidated financial statements, on June 22, 2016, we entered into a senior credit agreement (2016 Credit Agreement), which provided a term loan of $40.0 million (Term Loan) and a revolving credit facility of up to $100.0 million (Revolving Credit Facility) (together with the Term Loan, the 2016 Senior Credit Facilities) both of which would have matured in five years.
Effective July 1, 2017, we completed the acquisition of substantially all of the assets of Advantage, for cash consideration of $86.6 million, net of cash acquired, using available cash and $66.9 million in borrowings under the 2016 Credit Facility, including a $40.0 million Incremental Term Loan.
Effective July 1, 2017, we entered into a Second Amendment to our 2016 Credit Agreement to permit the acquisition of Advantage. Also in connection with the acquisition of Advantage, pursuant to the 2016 Credit Agreement, we entered into an Incremental Term Loan Agreement which provided us with an incremental term loan of $40.0 million to pay for part of the consideration of the acquisition.
On August 1, 2017, we entered into an Amendment and Restatement to our Credit Agreement (Amended and Restated Credit Agreement) to refinance and increase the current aggregate committed size of the facility to $215.0 million, including a term loan of $100.0 million (Amended Term Loan) and a $115.0 million revolving credit facility (Amended Revolving Credit Facility) (together with the Amended Term Loan, the Amended Credit Facilities). The proceeds of $106.5 million from this refinancing included $6.5 million under the new revolving credit facility, and were used to repay borrowings under our
35
previously existing credit facilities, as well as to pay related interest, fees and expenses. As of December 31, 2017 the Applicable Margin is 2.25% for Eurodollar Loans and LIBOR Index Rate Loans and 1.25% for Base Rate Loans. As of December 31, 2017, we had a $100.0 million Amended Term Loan and $21.6 million in letters of credit outstanding, leaving $93.4 million available under the Amended Revolving Credit Facility. We believe this provides us with the ability to continue to execute our strategy to grow the business.
Convertible Notes
On March 17, 2017, we paid in full our fixed rate 8% Convertible Notes. The Convertible Notes, had an aggregate principal amount of $25.0 million, and were convertible into shares of our Common Stock, at a conversion price of $7.10 per share. As a result of the early repayment, we recognized $5.0 million as loss on early extinguishment of debt.
At inception of the notes, and at the time of the payoff, the conversion price of $7.10 was below the market price. The initial agreement allowed us to force conversion of the Notes only after three years, beginning July 1, 2017, and if the VWAP exceeded 125% of the Conversion Price for 20 days of a 30 day trading period (the threshold was $8.88, which we were well above). As such, we and the Noteholders agreed to an early settlement at fair value based on the stock price. In connection with the repayment, we issued to the Noteholders an aggregate of 3,175,584 shares of Common Stock and cash in the aggregate amount of $5.6 million.
See Note 8 - Debt to our consolidated financial statements.
Stockholders' Equity
See Note 14 - Stockholders' Equity to our consolidated financial statements.
Commitments and Off-Balance Sheet Arrangements
As of December 31, 2017, we do not have any off-balance sheet arrangements.
The following table reflects our contractual obligations and other commitments as of December 31, 2017:
|
Commitments
|
Total
|
2018
|
2019
|
2020
|
2021
|
2022
|
Thereafter
|
|||||||||||||||||||||
|
|
(Unaudited, amounts in thousands)
|
|||||||||||||||||||||||||||
|
Term Loan (a)
|
$
|
100,000
|
|
$
|
6,875
|
|
$
|
7,500
|
|
$
|
8,125
|
|
$
|
10,000
|
|
$
|
67,500
|
|
$
|
—
|
|
|||||||
|
Interest on debt (b)
|
18,395
|
|
5,371
|
|
4,025
|
|
3,758
|
|
3,418
|
|
1,823
|
|
—
|
|
||||||||||||||
|
Contingent consideration (c)
|
7,391
|
|
280
|
|
399
|
|
6,712
|
|
—
|
|
—
|
|
—
|
|
||||||||||||||
|
Operating lease obligations (d)
|
32,741
|
|
6,700
|
|
5,180
|
|
4,438
|
|
3,993
|
|
3,698
|
|
8,732
|
|
||||||||||||||
|
|
$
|
158,527
|
|
$
|
19,226
|
|
$
|
17,104
|
|
$
|
23,033
|
|
$
|
17,411
|
|
$
|
73,021
|
|
$
|
8,732
|
|
|||||||
_______________
|
(a)
|
Under our Amended Term Loan, we are required to comply with certain financial covenants. Our inability to comply with the required covenants or other provisions could result in default under our amended credit facilities. In the event of any such default and our inability to obtain a waiver of the default, all amounts outstanding under the Amended Credit Facilities could be declared immediately due and payable. As of
December 31, 2017
, we are in compliance with the financial covenants and other covenants contained in the Credit Agreement.
|
|
(b)
|
Interest on debt represents payments due through maturity for our Term Loan, calculated using the December 31, 2017 applicable LIBOR and margin rate totaling 3.6%.
|
|
(c)
|
The contingent consideration represents the estimated payments due to the sellers related to the Mediscan and USR acquisitions, including accretion. In the third quarter of 2017, we determined that one of the contingent consideration earnouts related to the Mediscan acquisition would not be achieved for 2017 and, as a result, the entire earnout liability was reversed. See Note 3 - Acquisitions to our consolidated financial statements. While it is not certain if, or when, the remaining contingent payments will be made, we have included the payments in the table based on our best estimates of the amounts and dates when the contingencies may be resolved.
|
|
(d)
|
Represents future minimum lease payments associated with operating lease agreements with original terms of more than one year.
|
See Note 12 - Commitments and Contingencies to our consolidated financial statements.
36
In addition to the above disclosed contractual obligations, we have accrued uncertain tax positions, pursuant to the
Income Taxes
Topic of the FASB ASC, of
$3.8 million
at December 31, 2017. Based on the uncertainties associated with the settlement of these items, we are unable to make reasonably reliable estimates of the period of potential settlements, if any, with the taxing authorities.
Critical Accounting Policies and Estimates
We have identified the following critical accounting policies that affect the more significant judgments and estimates used in the preparation of our consolidated financial statements. The preparation of our consolidated financial statements in conformity with accounting principles generally accepted in the United States of America requires us to make estimates and judgments that affect our reported amounts of assets and liabilities, revenues and expenses, and related disclosures of contingent assets and liabilities. We evaluate our estimates on an on-going basis, including those related to asset impairment, accruals for self-insurance, allowance for doubtful accounts and sales allowances, taxes and other contingencies, and litigation. We state our accounting policies in the notes to the audited consolidated financial statements for the year ended December 31, 2017, contained herein. These estimates are based on information that is currently available to us and on various assumptions that we believe to be reasonable under the circumstances. Actual results could vary from those estimates under different assumptions or conditions.
We believe that the following critical accounting policies affect the more significant judgments and estimates used in the preparation of our consolidated financial statements:
Goodwill, trade names, and other intangible assets
Our business acquisitions typically result in the recording of goodwill, trade names, and other intangible assets, and the recorded values of those assets may become impaired in the future. The determination of the value of such intangible assets requires management to make estimates and assumptions that affect our consolidated financial statements. For intangible assets purchased in a business combination, the estimated fair values of the assets received are used to establish their recorded values. As more fully described in Note 2 - Summary of Significant Accounting Policies, we assess the impairment of goodwill of our reporting units and indefinite-lived intangible assets annually, or more often if events or changes in circumstances indicate that the carrying value may not be recoverable.
Application of the goodwill impairment test requires judgment, including the identification of reporting units, assignment of assets and liabilities to reporting units, assignment of goodwill to reporting units, and determination of the fair value of each reporting unit. Significant judgments are required to estimate the fair value of reporting units including estimating future cash flows, and determining appropriate discount rates, growth rates, company control premium, and other assumptions. Changes in these estimates and assumptions could materially affect the determination of fair value for each reporting unit.
2017 Impairment Charges
As of October 1, 2017, we performed our annual quantitative impairment test of goodwill, trade names, and other indefinite-lived intangible assets. Upon completion of the impairment testing, we determined that the estimated fair value of the Physician Staffing reporting unit’s trade name was less than its carrying amount resulting in impairment. For our goodwill impairment testing, with the exception of the Physician Staffing reporting unit, the estimated fair value of our Nurse and Allied and OHCMS reporting units exceeded their respective carrying values. The fair value of the Nurse and Allied Staffing reporting unit substantially exceeded its carrying amount. For the OHCMS reporting unit, there was less than 20% of excess fair value over its carrying amount leaving it at risk of impairment in future periods if forecasted results are not achieved.
Projections of revenue, operating costs, and expected cash flows of each reporting unit are inputs into the quantitative testing
for goodwill and intangible assets. We reduced our long-term revenue forecast for the Physician Staffing business
segment in the fourth quarter. The lower than expected revenue was driven by lower booking volumes, partly due to the loss of
customers. In addition, margins of the reporting unit were negatively impacted from continued investments in the business. As
a result, we recorded non-cash impairment charges of $8.7 million related to our trade names and $5.7 million
related to goodwill during the fourth quarter.
2016 Impairment Charges
We performed our annual impairment test as of October 1, 2016. Upon completion of the impairment testing, we determined that no impairment of goodwill, trade names, or other intangible assets was warranted.
37
During an evaluation of goodwill, trade names, and other intangible assets at June 30, 2016, we determined that indicators were present in the Physician Staffing reporting unit which would suggest the fair value of the reporting unit may have declined below its carrying value. As a result, an interim impairment test of goodwill, trade names, and other intangible assets was performed as of June 30, 2016. The evaluation resulted in the carrying value of goodwill, trade names, and other intangible assets for Physician Staffing to exceed the estimated fair value. As a result, we recorded a non-cash impairment charge totaling $24.3 million: $17.7 million related to goodwill, $0.6 million related to trade names, and $6.0 million related to customer relationships.
2015 Impairment Charges
During the fourth quarter of 2015, we determined that no goodwill impairment charges were warranted since the estimated fair value of our reporting units exceeded their respective carrying values. As of December 31, 2015, the fair value of our Physician Staffing reporting unit exceeded its carrying value by less than 20%. The rest of our reporting units had fair values that were substantially in excess of their carrying values.
In the fourth quarter of 2015, in conjunction with our annual testing of indefinite-lived intangible assets not subject to amortization, we recorded a non-cash impairment charge of approximately $2.1 million related to Physician Staffing trade names. We reduced our long-term revenue forecast in the fourth quarter for this business and, as a result, our calculation of estimated fair value was less than the carrying amount of the trade names, resulting in a non-cash impairment charge. See Note 5 - Goodwill, Trade Names, and Other Intangible Assets to our consolidated financial statements.
There can be no assurance that the estimates and assumptions made for purposes of the annual goodwill impairment test will prove to be accurate predictions of the future. Although management believes the assumptions and estimates made are reasonable and appropriate, different assumptions and estimates could materially impact the reported financial results.
In addition, we are required to test the recoverability of long-lived assets, including identifiable intangible assets with definite lives, whenever events or changes in circumstances indicate that the carrying amount may not be recoverable. In testing for potential impairment, if the carrying value of the asset group exceeds the expected undiscounted cash flows, we must then determine the amount by which the fair value of those assets exceeds the carrying value and determine the amount of impairment, if any.
Risk and Uncertainties
The calculation of fair value used in these impairment assessments included a number of estimates and assumptions that required significant judgments, including projections of future income and cash flows, the identification of appropriate market multiples and the choice of an appropriate discount rate. See Note 10 - Fair Value Measurements. Changes in these assumptions could materially affect the determination of fair value for each reporting unit. Specifically, further deterioration of demand for our services, further deterioration of labor market conditions, reduction of our stock price for an extended period, or other factors as described in Item 1.A.
Risk Factors
, may affect our determination of fair value of each reporting unit. This evaluation can also be triggered by various indicators of impairment which could cause the estimated discounted cash flows to be less than the carrying amount of net assets. If we are required to record an impairment charge in the future, it could have an adverse impact on our results of operations. Under the current credit agreement an impairment charge will not have an impact on our liquidity. As of December 31, 2017, we had total goodwill and intangible assets not subject to amortization of $144.3 million or 30.9% of our total assets.
Health, workers' compensation, and professional liability expense
We maintain accruals for our health, workers’ compensation, and professional liability claims that are partially self-insured and are classified as accrued compensation and benefits on our consolidated balance sheets. We determine the adequacy of these accruals by periodically evaluating our historical experience and trends related to health, workers’ compensation, and professional liability claims and payments, based on actuarial models, as well as industry experience and trends. If such models indicate that our accruals are overstated or understated, we will adjust accruals as appropriate. Healthcare insurance accruals have fluctuated with increases or decreases in the average number of temporary healthcare professionals on assignment as well as actual company experience and increases in national healthcare costs. As of December 31, 2017 and 2016, we had
$5.1 million
and $4.1 million accrued, respectively, for incurred but not reported health insurance claims. Corporate and field employees are covered through a partially self-insured health plan. Workers’ compensation insurance accruals can fluctuate over time due to the number of employees and inflation, as well as additional exposures arising from the current policy year. As of December 31, 2017, and 2016, we had $11.4 million and $11.0 million accrued for case reserves and for incurred but not reported workers’ compensation claims, net of insurance receivables, respectively. The accrual for
38
workers’ compensation is based on an actuarial model which is prepared or reviewed by an independent actuary semi-annually. As of December 31, 2017, and 2016, we had $6.4 million and $6.6 million accrued, respectively, for case reserves and for incurred but not reported professional liability claims, net of insurance receivables. The accrual for professional liability is based on actuarial models which are prepared by an independent actuary semi-annually.
Revenue recognition
Revenue from services consists primarily of temporary staffing revenue. Revenue is recognized when services are rendered and all of the following criteria are met: persuasive evidence of the arrangement exists; service has been provided; and we have no remaining obligations; the fee is fixed and determinable; and collectability is reasonably assured. Accounts receivable includes an accrual for employees’ and independent contractors’ estimated time worked but not yet invoiced. We maintain a sales allowance for estimated future billing adjustments resulting from client concessions or resolutions of billing disputes.
We record revenue on a gross basis as a principal or on a net basis as an agent depending on the arrangement, as follows:
|
•
|
We have also entered into certain contracts with acute care facilities to provide comprehensive MSP solutions. Under these contract arrangements, we use our nurses primarily, along with those of third party subcontractors, to fulfill customer orders. If a subcontractor is used, we invoice our customer for these services, but revenue is recorded at the time of billing, net of any related subcontractor liability. The resulting net revenue represents the administrative fee charged by us for our MSP services.
|
|
•
|
Revenue from our Physician Staffing business is recognized on a gross basis as we believe we are the principal in the arrangements.
|
Allowances
We maintain an allowance for doubtful accounts for estimated losses resulting from the inability of our customers to make required payments, which results in a provision for bad debt expense. We determine the adequacy of this allowance by continually evaluating individual customer receivables, considering the customer’s financial condition, credit history and current economic conditions. If the financial condition of our customers were to deteriorate, resulting in an impairment of their ability to make payments, additional allowances may be required. We write-off specific accounts based on an ongoing review of collectability as well as our past experience with the customer. In addition, we maintain a sales allowance for customer disputes which may arise in the ordinary course, which is recorded as contra-revenue. Historically, losses on uncollectible accounts and sales allowances have not exceeded our allowances. As of December 31, 2017, our total allowances were $3.7 million.
Contingent liabilities
We are subject to various claims and legal actions in the ordinary course of our business. Some of these matters include professional liability and employee-related matters. Our healthcare facility clients may also become subject to claims, governmental inquiries and investigations, and legal actions to which we may become a party relating to services provided by our professionals. From time to time, and depending upon the particular facts and circumstances, we may be subject to indemnification obligations under our contracts with our healthcare facility clients relating to these matters.
Income taxes
We account for income taxes in accordance with the
Income Taxes
Topic of the FASB ASC. Deferred tax assets and liabilities are recognized for the future tax consequences attributable to differences between financial statement carrying amounts of existing assets and liabilities and their respective tax bases and operating loss and other loss carryforwards. Deferred tax assets and liabilities are measured using enacted tax rates expected to apply to taxable income in the years in which those temporary differences are expected to be recovered or settled. As of December 31, 2017, we have deferred tax assets related to certain federal, state, and foreign net operating loss carryforwards of $18.2 million. The carryforwards will expire as follows: federal between 2032 and 2037, state between 2018 and 2037, and foreign between 2019 and 2022.
As of December 31, 2017 and 2016, we had valuation allowances on our deferred tax assets of $1.1 million and $46.5 million, respectively. For the year ended December 31, 2017, we reduced the valuation allowance recorded by $45.4 million (comprised of $15.7 million related to U.S. net operating losses, $4.4 million related to state net operating losses, and $25.3 million related to other net deferred tax assets) predominantly on the basis of management’s reassessment of deferred tax assets that are more likely than not to be realized. The valuation allowance on a portion of state net operating losses not more
39
likely than not realizable was not released due to the respective expiration periods and specific state taxable income projections. See Note 13 - Income Taxes to our consolidated financial statements.
As of each reporting date, management considers new evidence, both positive and negative, that could impact its position relative to the future realization of deferred tax assets. As of December 31, 2017, management determined that there was sufficient positive evidence to conclude that it was more likely than not that our net deferred tax assets are realizable. We therefore reduced the valuation allowance accordingly.
In arriving at our conclusion to release the valuation allowance, we considered several positive and negative factors. For the twelve quarters ended December 31, 2017, we had $27.7 million in cumulative pre-tax income adjusted for permanent items. We have a history of utilizing net operating losses prior to expiration. Further, the five-year forecast of pre-tax book income is expected to exceed future tax deductions. Our growth estimates are tied to the growing demand for healthcare solutions for our customers, including a growing aging U.S. population, and our customers’ pressure to keep costs down by using our staffing solutions. With regard to negative evidence, we do not have any material taxable temporary differences to offset deductible temporary differences and do not have any net operating losses available for carryback. Additionally, we are not considering and are not aware of any tax planning strategies that would impact the valuation allowance analysis. As such, the primary focus of our analysis emphasized the positive evidence of our three-year cumulative pre-tax income position adjusted for permanent items and projections of future taxable income that outweighed any negative evidence available.
On December 22, 2017, the 2017 Tax Act was signed into legislation which, among other changes, reduced the Corporate federal income tax rate from 35% to 21%, effective for our year ended December 31, 2018. Because a change in tax law is accounted for in the period of enactment, we have recorded income tax expense of $8.0 million, primarily due to a re-measurement of deferred tax assets and liabilities. The impact of the Global Intangible Low-Taxed Income provision, the transition tax on the deemed repatriation of deferred foreign income, and any future tax impact associated with basis differences on foreign subsidiaries is expected to be immaterial. The 2017 Tax Act is a comprehensive bill containing other provisions, such as limitations on the deductibility of interest expense and certain executive compensation, that are not expected to materially affect us.
The Securities and Exchange Commission (SEC) staff issued Staff Accounting Bulletin No. 118 (SAB 118), which provides guidance on accounting for the tax effects of the 2017 Tax Act. SAB 118 provides a measurement period that should not extend beyond one year from the enactment date for companies to complete the accounting required under the
Income Taxes
Topic of the FASB ASC. In accordance with SAB 118, a company must reflect the income tax effects of those aspects of the 2017 Tax Act for which the accounting under the
Income Taxes
Topic of the FASB ASC is complete. To the extent that a company's accounting for certain income tax effects is incomplete but it is able to determine a reasonable estimate, it must record a provisional estimate in its financial statements. If a company cannot determine a provisional estimate to be included in its financial statements, it should continue to apply the
Income Taxes
Topic of the FASB ASC on the basis of the provisions of the tax laws that were in effect immediately before the enactment. The ultimate impact of the 2017 Tax Act in our financial statements is provisional with regard to certain foreign tax provisions and may differ from our estimates due to changes in the interpretations and assumptions made by us as well as additional regulatory guidance that may be issued. See Note 13 - Income Taxes to our consolidated financial statements.
We are subject to income taxes in the U.S. and certain foreign jurisdictions. Significant judgment is required in determining our consolidated provision for income taxes and recording the related deferred tax assets and liabilities. In the ordinary course of our business there are many transactions and calculations where the ultimate tax determination is uncertain. Accruals for unrecognized tax benefits are provided for in accordance with the
Income Taxes
Topic of the FASB ASC. An unrecognized tax benefit represents the difference between the recognition of benefits related to exposure items for income tax reporting purposes and financial reporting purposes. The current portion of the unrecognized tax benefit is classified as a component of other current liabilities, and the non-current portion is included within other long-term liabilities on the consolidated balance sheets. As of December 31, 2017, total unrecognized tax benefits recorded was $3.8 million. We reserve for interest and penalties on exposure items, if applicable, which is recorded as a component of the overall income tax provision.
We are regularly under audit by tax authorities. Although the outcome of tax audits is always uncertain, we believe that we have appropriate support for the positions taken on our tax returns and that our annual tax provision includes amounts sufficient to pay any assessments. Nonetheless, the amounts ultimately paid, if any, upon resolution of the issues raised by the taxing authorities may differ materially from the amounts accrued for each year.
Embedded derivative
See Note 9 - Convertible Notes Derivative Liability to our consolidated financial statements.
40
Recent Accounting Pronouncements
See Note 2 - Summary of Significant Accounting Policies to our consolidated financial statements.
Seasonality
The number of healthcare professionals on assignment with us is subject to moderate seasonal fluctuations which may impact our quarterly revenue and earnings. Hospital patient census and staffing needs of our hospital and healthcare facilities fluctuate, which impact our number of orders for a particular period. Many of our hospital and healthcare facility clients are located in areas that experience seasonal fluctuations in population during the winter and summer months. These facilities adjust their staffing levels to accommodate the change in this seasonal demand and many of these facilities utilize temporary healthcare professionals to satisfy these seasonal staffing needs. Likewise, the number of nurse and allied professionals on assignment may fluctuate due to the seasonal preferences for destinations of our temporary nurse and allied professionals. In addition, we expect our Physician Staffing business to experience higher demand in the summer months as physicians take vacations. We also expect our education and school business to experience lower demand in the summer months when public and charter schools are closed. This historical seasonality of revenue and earnings may vary due to a variety of factors and the results of any one quarter are not necessarily indicative of the results to be expected for any other quarter or for any year. In addition, typically, our first quarter results are negatively impacted by the reset of payroll taxes.
Inflation
We do not believe that inflation had a significant impact on our results of operations for the periods presented. On an ongoing basis, we seek to ensure that billing rates reflect increases in costs due to inflation. In addition, we attempt to minimize any residual impact on our operating results by controlling operating costs.
Interest Rate Risk
We are exposed to the risk of fluctuation in interest rates relating to our variable rate debt related to our Amended Credit Facilities. During the year ended
December 31, 2017
or 2016, we did not use interest rate swaps or other types of derivative financial instruments to hedge our interest rate risk. Our current credit agreement charges us interest at a rate of LIBOR plus a leverage-based margin. See Note 8 - Debt to our consolidated financial statements for further information.
We have been exposed to interest rate risk associated with our debt instruments which have had interest based on floating rates. A 1% change in interest rates on variable rate debt would have resulted in interest expense fluctuating approximately by $0.7 million and $0.4 million in the years ended December 31, 2017 and 2016. In February 2018, we entered into an International Swap Dealers Association Master Agreement (ISDA) with a potential counterparty in anticipation of entering into a derivative to reduce our exposure to fluctuations in interest rates associated with our debt.
Foreign Currency Risk
We have minor exposure to the impact of foreign currency fluctuations. Approximately 1% of selling, general, and administrative expenses are related to certain software development and information technology support provided by our employees in Pune, India. Changes in foreign currency exchange rates impact translations of foreign denominated assets and liabilities into U.S. dollars and future earnings and cash flows from transactions denominated in different currencies. We have not entered into any foreign currency hedges.
Our international operations transact business in their functional currency. As a result, fluctuations in the value of foreign currencies against the U.S. dollar have an impact on reported results. Expenses denominated in foreign currencies are translated into U.S. dollars at monthly average exchange rates prevailing during the period. Consequently, as the value of the U.S. dollar changes relative to the currencies of our non-U.S. markets, our reported results vary.
Fluctuations in exchange rates also impact the U.S. dollar amount of stockholders’ equity. The assets and liabilities of our non-U.S. subsidiaries are translated into U.S. dollars at the exchange rate in effect at the end of a reporting period. The resulting translation adjustments are recorded in stockholders’ equity, as a component of accumulated other comprehensive loss, included in other stockholders’ equity on our consolidated balance sheets.
41
Item 8.
Financial Statements and Supplementary Data.
See Item 15 – Exhibits, Financial Statement Schedules of Part IV of this Report.
None.
Item 9A.
Controls and Procedures.
Evaluation of Disclosure Controls and Procedures
We carried out an evaluation, under the supervision and with the participation of our Chief Executive Officer and Chief Financial Officer, of the effectiveness of the design and operation of our "disclosure controls and procedures" (as defined in Rules 13a-15(e) and 15d-15(e) of the Securities Exchange Act of 1934, as amended, or the Exchange Act), as of the end of the period covered by this report. Based upon the evaluation, our Chief Executive Officer and Chief Financial Officer concluded that our disclosure controls and procedures are effective. Disclosure controls and procedures are designed to ensure that information required to be disclosed in our reports filed or submitted under the Exchange Act is recorded, processed, summarized, communicated to management, including the Chief Executive Officer and the Chief Financial Officer, and reported within the time periods specified in the Securities and Exchange Commission’s rules and forms. The disclosure controls and procedures are designed to ensure that information required to be disclosed by us in reports required under the Exchange Act of 1934, as amended, is accumulated and communicated to our management, including the Chief Executive Officer and Chief Financial Officer, in order to allow timely decisions regarding any required disclosure.
Changes in Internal Control Over Financial Reporting
We acquired all of the membership interests of Advantage in July 2017. Due to the timing of the acquisition and as allowed
under SEC guidance, management’s assessment of and conclusion regarding the design and effectiveness of internal control
over financial reporting excluded the internal control over financial reporting of the acquired business, which is relevant to our
2017 consolidated financial statements as of and for the year ended December 31, 2017.
Except as disclosed above, there were no other changes in our internal controls over financial reporting during 2017 that have materially affected, or are reasonably likely to materially affect, our internal controls over financial reporting.
Management’s Report on Internal Control Over Financial Reporting
Our management is responsible for establishing and maintaining adequate internal control over financial reporting (as defined in Rule 13a-15(f) under the Exchange Act). Our internal control system is designed to provide reasonable assurance regarding the reliability of financial reporting and the preparation of financial statements for external purposes in accordance with generally accepted accounting principles. Because of its inherent limitations, internal control over financial reporting may not prevent or detect misstatements. Projections of any evaluation of effectiveness to future periods are subject to the risks that controls may become inadequate because of changes in conditions or that the degree of compliance with the policies or procedures may deteriorate.
Management conducted an evaluation of the effectiveness of our internal control over financial reporting as of December 31, 2017. In making this assessment, management used the criteria set forth by the Committee of Sponsoring Organizations of the Treadway Commission, or COSO, in the Internal Control-Integrated Framework (2013 framework). As permitted, our
management’s assessment of and conclusion on the effectiveness of our internal controls did not include the internal controls of
Advantage, because it was acquired by us in July 2017. The total assets of the acquisition constituted $92.9 million as of December 31, 2017, and $47.0 million of revenue from services for the year ended December 31, 2017.
Based on its evaluation, management concluded that, as of December 31, 2017, our internal control over financial reporting is effective based on the specific criteria.
Attestation Report of Independent Registered Public Accounting Firm
Our independent registered public accounting firm has issued an attestation report on our internal control over financial reporting. This report appears on page 43.
42
REPORT OF INDEPENDENT REGISTERED PUBLIC ACCOUNTING FIRM
To the Stockholders and the Board of Directors of
Cross Country Healthcare, Inc.
Boca Raton, Florida
Opinion on Internal Control over Financial Reporting
We have audited the internal control over financial reporting of Cross Country Healthcare, Inc. and subsidiaries (the “Company”) as of December 31, 2017, based on criteria established in
Internal Control - Integrated Framework (2013)
issued by the Committee of Sponsoring Organizations of the Treadway Commission (COSO). In our opinion, the Company maintained, in all material respects, effective internal control over financial reporting as of December 31, 2017, based on criteria established in
Internal Control - Integrated Framework (2013)
issued by COSO.
We have also audited, in accordance with the standards of the Public Company Accounting Oversight Board (United States) (PCAOB), the consolidated financial statements as of and for the year ended December 31, 2017, of the Company and our report dated March 2, 2018, expressed an unqualified opinion on those financial statements.
As described in
Management’s Report on Internal Control Over Financial Reporting
, management excluded from its assessment the internal control over financial reporting at Advantage RN, LLC, which was acquired on July 1, 2017, and whose financial statements constituted $92.9 million of total assets and $47.0 million of revenue from services of the consolidated financial statement amounts as of and for the year ended December 31, 2017. Accordingly, our audit did not include the internal control over financial reporting at Advantage RN, LLC.
Basis for Opinion
The Company’s management is responsible for maintaining effective internal control over financial reporting and for its assessment of the effectiveness of internal control over financial reporting, included in the accompanying
Management's Report on Internal Control over Financial Reporting
. Our responsibility is to express an opinion on the Company’s internal control over financial reporting based on our audit. We are a public accounting firm registered with the PCAOB and are required to be independent with respect to the Company in accordance with the U.S. federal securities laws and the applicable rules and regulations of the Securities and Exchange Commission and the PCAOB.
We conducted our audit in accordance with the standards of the PCAOB. Those standards require that we plan and perform the audit to obtain reasonable assurance about whether effective internal control over financial reporting was maintained in all material respects. Our audit included obtaining an understanding of internal control over financial reporting, assessing the risk that a material weakness exists, testing and evaluating the design and operating effectiveness of internal control based on the assessed risk, and performing such other procedures as we considered necessary in the circumstances. We believe that our audit provides a reasonable basis for our opinion.
Definition and Limitations of Internal Control over Financial Reporting
A company’s internal control over financial reporting is a process designed to provide reasonable assurance regarding the reliability of financial reporting and the preparation of financial statements for external purposes in accordance with generally accepted accounting principles. A company’s internal control over financial reporting includes those policies and procedures that (1) pertain to the maintenance of records that, in reasonable detail, accurately and fairly reflect the transactions and dispositions of the assets of the company; (2) provide reasonable assurance that transactions are recorded as necessary to permit preparation of financial statements in accordance with generally accepted accounting principles, and that receipts and expenditures of the company are being made only in accordance with authorizations of management and directors of the company; and (3) provide reasonable assurance regarding prevention or timely detection of unauthorized acquisition, use, or disposition of the company’s assets that could have a material effect on the financial statements.
43
Because of its inherent limitations, internal control over financial reporting may not prevent or detect misstatements. Also, projections of any evaluation of effectiveness to future periods are subject to the risk that controls may become inadequate because of changes in conditions, or that the degree of compliance with the policies or procedures may deteriorate.
|
/s/ DELOITTE & TOUCHE LLP
|
|
|
Certified Public Accountants
|
|
|
Boca Raton, Florida
|
|
|
March 2, 2018
|
|
44
None.
Information with respect to directors, executive officers and corporate governance is included in our Proxy Statement for the 2018 Annual Meeting of Stockholders (Proxy Statement) to be filed pursuant to Regulation 14A with the SEC and such information is incorporated herein by reference.
Information with respect to executive compensation is included in our Proxy Statement to be filed with the SEC and such information is incorporated herein by reference.
Information with respect to beneficial ownership of our common stock is included in our Proxy Statement to be filed with the SEC and such information is incorporated herein by reference.
With respect to equity compensation plans as of December 31, 2017, see table below:
|
Plan Category
|
Number of securities to
be issued upon exercise
of outstanding options,
warrants and rights (a)
|
Weighted-average
exercise price of
outstanding options,
warrants and
rights (b)
|
Number of securities
remaining available for
future issuance under
equity compensation
plans (excluding
securities reflected in
column (a)) (c)
(1)
|
||||||
|
Equity compensation plans approved by
security holders
|
94,500
|
|
$
|
5.19
|
|
2,338,804
|
|
||
|
Equity compensation plans not approved by
security holders
|
None
|
|
N/A
|
|
N/A
|
|
|||
|
Total
|
94,500
|
|
$
|
5.19
|
|
2,338,804
|
|
||
(1)
For Performance Stock Awards issued under the 2014 Omnibus Incentive Plan, we consider the expected number of shares that may be issued under the award to be outstanding. When the number of Performance Stock Awards have been determined, we true up the actual number of shares that were awarded and return any unawarded shares into shares available for issuance. See Note 14 - Stockholders' Equity to our consolidated financial statements.
Information with respect to certain relationships and related transactions, and director independence is included in our Proxy Statement to be filed with the SEC and such information is incorporated herein by reference.
Information with respect to the fees and services of our principal accountant is included in our Proxy Statement to be filed with the SEC and such information is incorporated herein by reference.
45
|
(a) Documents filed as part of the report.
|
||
|
(1
|
)
|
Consolidated Financial Statements
|
|
|
|
|
|
|
|
Report of Independent Registered Public Accounting Firm
|
|
|
|
|
|
|
|
Consolidated Balance Sheets as of December 31, 2017 and 2016
|
|
|
|
|
|
|
|
Consolidated Statements of Operations for the Years Ended December 31, 2017, 2016, and 2015
|
|
|
|
|
|
|
|
Consolidated Statements of Comprehensive Income for the Years Ended December 31, 2017,
2016, and 2015
|
|
|
|
|
|
|
|
Consolidated Statement of Stockholders’ Equity for the Years Ended December 31, 2017, 2016, and
2015
|
|
|
|
|
|
|
|
Consolidated Statements of Cash Flows for the Years Ended December 31, 2017, 2016, and 2015
|
|
|
|
|
|
|
|
Notes to Consolidated Financial Statements
|
|
|
|
|
|
(2
|
)
|
Financial Statements Schedule
|
|
|
|
|
|
|
|
Schedule II – Valuation and Qualifying Accounts for the Years Ended December 31, 2017, 2016, and
2015
|
|
|
|
|
|
(3
|
)
|
Exhibits
|
|
|
|
|
|
|
|
See Exhibit Index immediately following signatures.
|
46
SIGNATURES
Pursuant to the requirements of Section 13 or 15(d) of the Securities Exchange Act of 1934, the Registrant has duly caused this Report to be signed on its behalf by the undersigned, thereunto duly authorized.
|
|
CROSS COUNTRY HEALTHCARE, INC.
|
|
|
|
|
|
|
|
By:
|
/s/ William J. Grubbs
|
|
|
|
Name: William J. Grubbs
|
|
|
|
Title: President, Chief Executive Officer, Director
|
|
Principal Executive Officer
|
||
|
|
|
Date: March 2, 2018
|
Pursuant to the requirements of the Securities Exchange Act of 1934, this Report has been signed by the following persons in the capacities indicated and on the dates indicated:
|
Signature
|
|
Title
|
|
Date
|
|
|
|
|
|
|
|
/s/ William J. Grubbs
|
|
President, Chief Executive Officer, Director
|
|
March 2, 2018
|
|
William J. Grubbs
|
|
(Principal Executive Officer)
|
|
|
|
|
|
|
|
|
|
/s/ Christopher R. Pizzi
|
|
SVP & Chief Financial Officer
|
|
March 2, 2018
|
|
Christopher R. Pizzi
|
|
(Principal Accounting and Financial Officer)
|
|
|
|
/s/ W. Larry Cash
|
|
Director
|
|
March 2, 2018
|
|
W. Larry Cash
|
|
|
|
|
|
|
|
|
|
|
|
/s/ Thomas C. Dircks
|
|
Director
|
|
March 2, 2018
|
|
Thomas C. Dircks
|
|
|
|
|
|
|
|
|
|
|
|
/s/ Gale Fitzgerald
|
|
Director
|
|
March 2, 2018
|
|
Gale Fitzgerald
|
|
|
|
|
|
|
|
|
|
|
|
/s/ Richard M. Mastaler
|
|
Director
|
|
March 2, 2018
|
|
Richard M. Mastaler
|
|
|
|
|
|
/s/ Mark Perlberg
|
Director
|
March 2, 2018
|
||
|
Mark Perlberg
|
||||
|
|
|
|
|
|
|
/s/ Joseph A. Trunfio
|
|
Director
|
|
March 2, 2018
|
|
Joseph A. Trunfio
|
|
|
|
|
47
EXHIBIT INDEX
|
No.
|
|
Description
|
|
3.1
|
|
|
|
*3.2
|
||
|
3.3
|
|
|
|
4.1
|
|
|
|
4.2 #
|
|
|
|
4.3 #
|
|
|
|
4.4
|
|
|
|
10.1 #
|
|
|
|
10.2 #
|
|
|
|
10.3
|
|
|
|
10.4
|
|
|
|
10.5
|
|
|
|
10.6 #
|
|
|
|
10.7 #
|
|
|
|
10.8
|
|
|
|
10.90
|
|
|
|
10.10 #
|
|
|
|
10.11
|
|
|
|
10.12
|
|
|
|
10.13
|
|
|
48
EXHIBIT INDEX (CONTINUED)
|
No.
|
|
Description
|
|
10.14
|
|
|
|
10.15 #
|
|
|
|
10.16
|
||
|
10.17
|
|
|
|
10.18
|
|
|
|
10.19
|
|
|
|
10.20 #
|
|
|
|
10.21
|
|
|
|
10.22
|
||
|
10.23
|
||
|
10.24
|
||
|
10.25
|
||
|
10.26
|
||
|
10.27
|
||
|
10.28
|
||
|
10.29
|
||
|
10.30
|
||
49
EXHIBIT INDEX (CONTINUED)
|
No.
|
|
Description
|
|
10.31
|
||
|
10.32
|
||
|
10.33
|
||
|
10.34
|
||
|
10.35
|
||
|
10.36
|
||
|
10.37 #
|
||
|
10.38 #
|
||
|
10.39 #
|
||
|
10.40
|
||
|
10.41
|
||
|
10.42
|
||
|
10.43 #
|
|
|
|
10.44
|
||
|
10.45
|
||
|
10.46
|
||
|
10.47
|
||
|
10.48
|
||
50
EXHIBIT INDEX (CONTINUED)
|
No.
|
|
Description
|
|
10.49
|
||
|
10.5
|
||
|
10.51
|
||
|
10.52
|
||
|
10.53
|
||
|
10.54 #
|
||
|
*10.55 #
|
||
|
*10.56
|
||
|
14.1
|
|
|
|
16.1
|
|
|
|
*21.1
|
|
|
|
*23.1
|
||
|
*31.1
|
|
|
|
*31.2
|
|
|
|
*32.1
|
|
|
|
*32.2
|
|
|
|
**101.INS
|
|
XBRL Instance Document
|
|
**101.SCH
|
|
XBRL Taxonomy Extension Schema Document
|
|
**101.DEF
|
|
XBRL Taxonomy Extension Definition Linkbase Document
|
|
**101.LAB
|
|
XBRL Taxonomy Extension Label Linkbase Document
|
|
**101.CAL
|
|
XBRL Taxonomy Extension Calculation Linkbase Document
|
|
**101.PRE
|
|
PRE XBRL Taxonomy Extension Presentation Linkbase Document
|
________________
# Represents a management contract or compensatory plan or arrangement
* Filed herewith
** Furnished herewith
51
INDEX TO CONSOLIDATED FINANCIAL STATEMENTS
|
|
Page
|
|
Cross Country Healthcare, Inc.
|
|
|
Financial Statement Schedule
|
|
Schedules not filed herewith are either not applicable, the information is not material or the information is set forth in the consolidated financial statements or notes thereto.
F- 1
REPORT OF INDEPENDENT REGISTERED PUBLIC ACCOUNTING FIRM
To the Stockholders and the Board of Directors of
Cross Country Healthcare, Inc.
Boca Raton, Florida
Opinion on the Financial Statements
We have audited the accompanying consolidated balance sheets of Cross Country Healthcare, Inc. and subsidiaries (the "Company") as of December 31, 2017 and 2016, and the related consolidated statements of operations, comprehensive income, stockholders' equity, and cash flows for each of the three years in the period ended December 31, 2017, and the related notes and the schedule listed in the Index at Item 15 (collectively referred to as the "financial statements"). In our opinion, the financial statements present fairly, in all material respects, the financial position of the Company as of December 31, 2017 and 2016, and the results of its operations and its cash flows for each of the three years in the period ended December 31, 2017, in conformity with accounting principles generally accepted in the United States of America.
We have also audited, in accordance with the standards of the Public Company Accounting Oversight Board (United States) (PCAOB), the Company's internal control over financial reporting as of December 31, 2017, based on criteria established in
Internal Control - Integrated Framework (2013)
issued by the Committee of Sponsoring Organizations of the Treadway Commission and our report dated March 2, 2018, expressed an unqualified opinion on the Company's internal control over financial reporting.
Basis for Opinion
These financial statements are the responsibility of the Company's management. Our responsibility is to express an opinion on the Company's financial statements based on our audits. We are a public accounting firm registered with the PCAOB and are required to be independent with respect to the Company in accordance with the U.S. federal securities laws and the applicable rules and regulations of the Securities and Exchange Commission and the PCAOB.
We conducted our audits in accordance with the standards of the PCAOB. Those standards require that we plan and perform the audit to obtain reasonable assurance about whether the financial statements are free of material misstatement, whether due to error or fraud. Our audits included performing procedures to assess the risks of material misstatement of the financial statements, whether due to error or fraud, and performing procedures that respond to those risks. Such procedures included examining, on a test basis, evidence regarding the amounts and disclosures in the financial statements. Our audits also included evaluating the accounting principles used and significant estimates made by management, as well as evaluating the overall presentation of the financial statements. We believe that our audits provide a reasonable basis for our opinion.
|
/s/ DELOITTE & TOUCHE LLP
|
|
|
Certified Public Accountants
|
|
|
Boca Raton, Florida
|
|
|
March 2, 2018
|
|
We have served as the Company's auditor since 2015.
F- 2
CROSS COUNTRY HEALTHCARE, INC.
(amounts in thousands, except for share data)
|
|
December 31,
|
||||||
|
|
2017
|
2016
|
|||||
|
Assets
|
|
|
|||||
|
Current assets:
|
|
|
|||||
|
Cash and cash equivalents
|
$
|
25,537
|
|
$
|
20,630
|
|
|
|
Accounts receivable, net of allowances of $3,688 in 2017 and $3,245 in 2016
|
173,603
|
|
173,620
|
|
|||
|
Prepaid expenses
|
5,287
|
|
6,126
|
|
|||
|
Insurance recovery receivable
|
3,497
|
|
3,037
|
|
|||
|
Other current assets
|
963
|
|
2,198
|
|
|||
|
Total current assets
|
208,887
|
|
205,611
|
|
|||
|
Property and equipment, net
|
14,086
|
|
12,818
|
|
|||
|
Goodwill
|
117,589
|
|
79,648
|
|
|||
|
Trade names
|
26,702
|
|
35,402
|
|
|||
|
Other intangible assets, net
|
60,976
|
|
36,835
|
|
|||
|
Non-current deferred tax assets
|
20,219
|
|
—
|
|
|||
|
Other non-current assets
|
19,228
|
|
18,064
|
|
|||
|
Total assets
|
$
|
467,687
|
|
$
|
388,378
|
|
|
|
Liabilities and Stockholders' Equity
|
|
|
|
|
|||
|
Current liabilities:
|
|
|
|
|
|||
|
Accounts payable and accrued expenses
|
$
|
50,597
|
|
$
|
58,850
|
|
|
|
Accrued compensation and benefits
|
34,271
|
|
33,243
|
|
|||
|
Current portion of long-term debt
|
6,875
|
|
2,250
|
|
|||
|
Other current liabilities
|
2,845
|
|
2,749
|
|
|||
|
Total current liabilities
|
94,588
|
|
97,092
|
|
|||
|
Long-term debt, less current portion
|
92,259
|
|
84,750
|
|
|||
|
Non-current deferred tax liabilities
|
105
|
|
13,154
|
|
|||
|
Long-term accrued claims
|
28,757
|
|
28,870
|
|
|||
|
Contingent consideration
|
5,088
|
|
5,301
|
|
|||
|
Other long-term liabilities
|
9,171
|
|
7,409
|
|
|||
|
Total liabilities
|
229,968
|
|
236,576
|
|
|||
|
Commitments and contingencies
|
|
|
|||||
|
Stockholders' equity:
|
|
|
|
|
|||
|
Common stock—$0.0001 par value; 100,000,000 shares authorized; 35,838,108 and 32,339,285 shares issued and outstanding at December 31, 2017 and 2016, respectively
|
4
|
|
3
|
|
|||
|
Additional paid-in capital
|
305,362
|
|
256,570
|
|
|||
|
Accumulated other comprehensive loss
|
(1,166
|
)
|
(1,241
|
)
|
|||
|
Accumulated deficit
|
(67,111
|
)
|
(104,089
|
)
|
|||
|
Total Cross Country Healthcare, Inc. stockholders' equity
|
237,089
|
|
151,243
|
|
|||
|
Noncontrolling interest in subsidiary
|
630
|
|
559
|
|
|||
|
Total stockholders' equity
|
237,719
|
|
151,802
|
|
|||
|
Total liabilities and stockholders' equity
|
$
|
467,687
|
|
$
|
388,378
|
|
|
See accompanying notes
.
F- 3
CROSS COUNTRY HEALTHCARE, INC.
(amounts in thousands, except per share data)
|
|
Year Ended December 31,
|
||||||||||
|
|
2017
|
2016
|
2015
|
||||||||
|
Revenue from services
|
$
|
865,048
|
|
$
|
833,537
|
|
$
|
767,421
|
|
||
|
Operating expenses:
|
|||||||||||
|
Direct operating expenses
|
636,462
|
|
611,802
|
|
570,056
|
|
|||||
|
Selling, general, and administrative expenses
|
187,435
|
|
179,820
|
|
161,275
|
|
|||||
|
Bad debt expense
|
1,828
|
|
593
|
|
999
|
|
|||||
|
Depreciation and amortization
|
10,174
|
|
9,182
|
|
8,066
|
|
|||||
|
Loss on sale of business
|
—
|
|
—
|
|
2,184
|
|
|||||
|
Acquisition-related contingent consideration
|
44
|
|
814
|
|
—
|
|
|||||
|
Acquisition and integration costs
|
1,975
|
|
78
|
|
902
|
|
|||||
|
Restructuring costs
|
1,026
|
|
753
|
|
1,274
|
|
|||||
|
Impairment charges
|
14,356
|
|
24,311
|
|
2,100
|
|
|||||
|
Total operating expenses
|
853,300
|
|
827,353
|
|
746,856
|
|
|||||
|
Income from operations
|
11,748
|
|
6,184
|
|
20,565
|
|
|||||
|
Other expenses (income):
|
|||||||||||
|
Interest expense
|
4,214
|
|
6,106
|
|
6,810
|
|
|||||
|
(Gain) loss on derivative liability
|
(1,581
|
)
|
(5,805
|
)
|
9,901
|
|
|||||
|
Loss on early extinguishment of debt
|
4,969
|
|
1,568
|
|
—
|
|
|||||
|
Other income, net
|
(155
|
)
|
(230
|
)
|
(306
|
)
|
|||||
|
Income before income taxes
|
4,301
|
|
4,545
|
|
4,160
|
|
|||||
|
Income tax benefit
|
(34,501
|
)
|
(4,186
|
)
|
(794
|
)
|
|||||
|
Consolidated net income
|
38,802
|
|
8,731
|
|
4,954
|
|
|||||
|
Less: Net income attributable to noncontrolling interest in subsidiary
|
1,289
|
|
764
|
|
536
|
|
|||||
|
Net income attributable to common shareholders
|
$
|
37,513
|
|
$
|
7,967
|
|
$
|
4,418
|
|
||
|
Net income per share attributable to common shareholders - Basic
|
$
|
1.07
|
|
$
|
0.25
|
|
$
|
0.14
|
|
||
|
Net income per share attributable to common shareholders - Diluted
|
$
|
1.01
|
|
$
|
0.15
|
|
$
|
0.14
|
|
||
|
Weighted average common shares outstanding:
|
|||||||||||
|
Basic
|
35,018
|
|
32,132
|
|
31,514
|
|
|||||
|
Diluted
|
36,166
|
|
36,246
|
|
32,162
|
|
|||||
See accompanying notes.
F- 4
CROSS COUNTRY HEALTHCARE, INC.
CONSOLIDATED STATEMENTS OF COMPREHENSIVE INCOME
(amounts in thousands)
|
|
Year Ended December 31,
|
||||||||||
|
|
2017
|
2016
|
2015
|
||||||||
|
Consolidated net income
|
$
|
38,802
|
|
$
|
8,731
|
|
$
|
4,954
|
|
||
|
Other comprehensive income (loss), before income tax:
|
|
|
|
|
|
|
|||||
|
Unrealized foreign currency translation gain (loss)
|
75
|
|
(34
|
)
|
(89
|
)
|
|||||
|
Other comprehensive income (loss), net of tax
|
75
|
|
(34
|
)
|
(89
|
)
|
|||||
|
Comprehensive income
|
38,877
|
|
8,697
|
|
4,865
|
|
|||||
|
Less: Comprehensive income attributable to noncontrolling interest in subsidiary
|
1,289
|
|
764
|
|
536
|
|
|||||
|
Comprehensive income attributable to common shareholders
|
$
|
37,588
|
|
$
|
7,933
|
|
$
|
4,329
|
|
||
See accompanying notes.
F- 5
CROSS COUNTRY HEALTHCARE, INC.
CONSOLIDATED STATEMENTS OF STOCKHOLDERS’ EQUITY
(amounts in thousands)
|
|
Common Stock
|
Additional
Paid-In Capital |
Accumulated Other Total
Comprehensive Loss, net |
(Accumulated Deficit) Retained Earnings
|
Noncontrolling Interest in Subsidiary
|
Stockholders’ Equity
|
||||||||||||||||||||
|
Shares
|
Dollars
|
|||||||||||||||||||||||||
|
Balances at December 31, 2014
|
31,292
|
|
$
|
3
|
|
$
|
247,467
|
|
$
|
(1,118
|
)
|
$
|
(116,474
|
)
|
$
|
454
|
|
$
|
130,332
|
|
||||||
|
Exercise of share options
|
119
|
|
—
|
|
—
|
|
—
|
|
—
|
|
—
|
|
—
|
|
||||||||||||
|
Vesting of restricted stock
|
191
|
|
—
|
|
(543
|
)
|
—
|
|
—
|
|
—
|
|
(543
|
)
|
||||||||||||
|
Equity compensation
|
—
|
|
—
|
|
2,460
|
|
—
|
|
—
|
|
—
|
|
2,460
|
|
||||||||||||
|
Foreign currency translation adjustment
|
—
|
|
—
|
|
—
|
|
(89
|
)
|
—
|
|
—
|
|
(89
|
)
|
||||||||||||
|
Acquisition of Mediscan
|
350
|
|
—
|
|
4,724
|
|
—
|
|
—
|
|
—
|
|
4,724
|
|
||||||||||||
|
Distribution to noncontrolling shareholder
|
—
|
|
—
|
|
—
|
|
—
|
|
—
|
|
(494
|
)
|
(494
|
)
|
||||||||||||
|
Net income
|
—
|
|
—
|
|
—
|
|
—
|
|
4,418
|
|
536
|
|
4,954
|
|
||||||||||||
|
Balances at December 31, 2015
|
31,952
|
|
3
|
|
254,108
|
|
(1,207
|
)
|
(112,056
|
)
|
496
|
|
141,344
|
|
||||||||||||
|
Exercise of share options
|
103
|
|
—
|
|
—
|
|
—
|
|
—
|
|
—
|
|
—
|
|
||||||||||||
|
Vesting of restricted stock and performance stock awards
|
284
|
|
—
|
|
(917
|
)
|
—
|
|
—
|
|
—
|
|
(917
|
)
|
||||||||||||
|
Equity compensation
|
—
|
|
—
|
|
3,379
|
|
—
|
|
—
|
|
—
|
|
3,379
|
|
||||||||||||
|
Foreign currency translation adjustment
|
—
|
|
—
|
|
—
|
|
(34
|
)
|
—
|
|
—
|
|
(34
|
)
|
||||||||||||
|
Distribution to noncontrolling shareholder
|
—
|
|
—
|
|
—
|
|
—
|
|
—
|
|
(701
|
)
|
(701
|
)
|
||||||||||||
|
Net income
|
—
|
|
—
|
|
—
|
|
—
|
|
7,967
|
|
764
|
|
8,731
|
|
||||||||||||
|
Balances at December 31, 2016
|
32,339
|
|
3
|
|
256,570
|
|
(1,241
|
)
|
(104,089
|
)
|
559
|
|
151,802
|
|
||||||||||||
|
Exercise of share options
|
41
|
|
—
|
|
—
|
|
—
|
|
—
|
|
—
|
|
—
|
|
||||||||||||
|
Vesting of restricted stock and performance stock awards
|
282
|
|
—
|
|
(1,774
|
)
|
—
|
|
—
|
|
—
|
|
(1,774
|
)
|
||||||||||||
|
Shares issued for Convertible Notes
|
3,176
|
|
1
|
|
45,951
|
|
—
|
|
—
|
|
—
|
|
45,952
|
|
||||||||||||
|
Equity compensation
|
—
|
|
—
|
|
4,080
|
|
—
|
|
—
|
|
—
|
|
4,080
|
|
||||||||||||
|
Cumulative-effect adjustment - share-based compensation
|
—
|
|
—
|
|
535
|
|
—
|
|
(535
|
)
|
—
|
|
—
|
|
||||||||||||
|
Foreign currency translation adjustment
|
—
|
|
—
|
|
—
|
|
75
|
|
—
|
|
—
|
|
75
|
|
||||||||||||
|
Distribution to noncontrolling shareholder
|
—
|
|
—
|
|
—
|
|
—
|
|
—
|
|
(1,218
|
)
|
(1,218
|
)
|
||||||||||||
|
Net income
|
—
|
|
—
|
|
—
|
|
—
|
|
37,513
|
|
1,289
|
|
38,802
|
|
||||||||||||
|
Balances at December 31, 2017
|
35,838
|
|
$
|
4
|
|
$
|
305,362
|
|
$
|
(1,166
|
)
|
$
|
(67,111
|
)
|
$
|
630
|
|
$
|
237,719
|
|
||||||
See accompanying notes.
F- 6
CROSS COUNTRY HEALTHCARE, INC.
(amounts in thousands)
|
|
Year Ended December 31,
|
||||||||||
|
|
2017
|
2016
|
2015
|
||||||||
|
Cash flows from operating activities
|
|
|
|
||||||||
|
Consolidated net income
|
$
|
38,802
|
|
$
|
8,731
|
|
$
|
4,954
|
|
||
|
Adjustments to reconcile net income to net cash provided by operating activities:
|
|
|
|
|
|
|
|||||
|
Depreciation and amortization
|
10,174
|
|
9,182
|
|
8,066
|
|
|||||
|
Amortization of debt discount and debt issuance costs
|
651
|
|
1,728
|
|
1,886
|
|
|||||
|
Provision for allowances
|
4,705
|
|
4,034
|
|
1,779
|
|
|||||
|
Deferred income tax benefit
|
(33,812
|
)
|
(5,322
|
)
|
(1,544
|
)
|
|||||
|
(Gain) loss on derivative liability
|
(1,581
|
)
|
(5,805
|
)
|
9,901
|
|
|||||
|
Acquisition-related contingent consideration
|
44
|
|
769
|
|
—
|
|
|||||
|
Impairment charges
|
14,356
|
|
24,311
|
|
2,100
|
|
|||||
|
Loss on early extinguishment of debt
|
4,969
|
|
1,568
|
|
—
|
|
|||||
|
Equity compensation
|
4,080
|
|
3,379
|
|
2,460
|
|
|||||
|
Other noncash costs, including loss on sale of business
|
24
|
|
6
|
|
2,204
|
|
|||||
|
Changes in operating assets and liabilities:
|
|
|
|
|
|||||||
|
Accounts receivable
|
9,708
|
|
(30,781
|
)
|
(28,708
|
)
|
|||||
|
Prepaid expenses and other assets
|
1,816
|
|
(1,882
|
)
|
2,663
|
|
|||||
|
Accounts payable and accrued expenses
|
(9,275
|
)
|
20,370
|
|
11,213
|
|
|||||
|
Other liabilities
|
847
|
|
(143
|
)
|
1,261
|
|
|||||
|
Net cash provided by operating activities
|
45,508
|
|
30,145
|
|
18,235
|
|
|||||
|
Cash flows from investing activities
|
|
|
|
|
|
|
|||||
|
Proceeds from sale of business
|
—
|
|
500
|
|
7,500
|
|
|||||
|
Acquisitions, net of cash acquired
|
(85,977
|
)
|
(1,900
|
)
|
(28,721
|
)
|
|||||
|
Acquisition-related settlements
|
(292
|
)
|
(1,858
|
)
|
(149
|
)
|
|||||
|
Transaction costs related to sale of business
|
—
|
|
—
|
|
(338
|
)
|
|||||
|
Purchases of property and equipment
|
(5,111
|
)
|
(6,522
|
)
|
(2,362
|
)
|
|||||
|
Net cash used in investing activities
|
(91,380
|
)
|
(9,780
|
)
|
(24,070
|
)
|
|||||
|
Cash flows from financing activities
|
|
|
|
|
|
|
|||||
|
Proceeds from Term Loans
|
62,000
|
|
40,000
|
|
—
|
|
|||||
|
Principal payments on Term Loans
|
(1,500
|
)
|
(30,500
|
)
|
—
|
|
|||||
|
Convertible Note cash payment
|
(5,000
|
)
|
—
|
|
—
|
|
|||||
|
Borrowings on revolving credit facility
|
39,000
|
|
59,800
|
|
64,100
|
|
|||||
|
Repayments on revolving credit facility
|
(39,000
|
)
|
(67,800
|
)
|
(59,600
|
)
|
|||||
|
Debt issuance costs
|
(901
|
)
|
(1,182
|
)
|
—
|
|
|||||
|
Extinguishment fees
|
(578
|
)
|
(641
|
)
|
—
|
|
|||||
|
Cash paid for shares withheld for taxes
|
(1,774
|
)
|
(917
|
)
|
(543
|
)
|
|||||
|
Payment of contingent consideration
|
(261
|
)
|
(152
|
)
|
—
|
|
|||||
|
Cash payments to noncontrolling shareholder
|
(1,217
|
)
|
(701
|
)
|
(494
|
)
|
|||||
|
Other
|
(13
|
)
|
(71
|
)
|
(108
|
)
|
|||||
|
Net cash provided by (used in) financing activities
|
50,756
|
|
(2,164
|
)
|
3,355
|
|
|||||
|
Effect of exchange rate changes on cash
|
23
|
|
(24
|
)
|
(62
|
)
|
|||||
|
Change in cash and cash equivalents
|
4,907
|
|
18,177
|
|
(2,542
|
)
|
|||||
|
Cash and cash equivalents at beginning of year
|
20,630
|
|
2,453
|
|
4,995
|
|
|||||
|
Cash and cash equivalents at end of year
|
$
|
25,537
|
|
$
|
20,630
|
|
$
|
2,453
|
|
||
|
Supplemental disclosure of cash flow information:
|
|
|
|
|
|
|
|||||
|
Interest paid
|
$
|
3,408
|
|
$
|
3,893
|
|
$
|
5,052
|
|
||
|
Income taxes paid
|
$
|
697
|
|
$
|
1,773
|
|
$
|
1,035
|
|
||
See accompanying notes.
F- 7
CROSS COUNTRY HEALTHCARE, INC.
NOTES TO CONSOLIDATED FINANCIAL STATEMENTS
DECEMBER 31, 2017
1. Organization and Basis of Presentation
Cross Country Healthcare, Inc. (the Company) was incorporated in Delaware on July 29, 1999 as a business providing travel nurse and allied health staffing services. As of December 31, 2017, the Company is a leading national provider of nurse and allied staffing, recruiting, and value-added workforce solution services, multi-specialty locum tenens (temporary physician staffing) services, as well as a provider of other human capital management services focused on healthcare.
The consolidated financial statements include the accounts of the Company and its direct and indirect wholly-owned subsidiaries. The consolidated financial statements include all assets, liabilities, revenue, and expenses of Cross Country Talent Acquisition Group, LLC (formerly InteliStaf of Oklahoma, LLC), which is controlled by the Company but not wholly owned. The Company records the ownership interest of the noncontrolling shareholder as noncontrolling interest in subsidiary. All intercompany transactions and balances have been eliminated in consolidation.
Certain prior year amounts have been reclassified to conform to the current year presentation. See consolidated balance sheets and consolidated statements of cash flows.
2. Summary of Significant Accounting Policies
Use of Estimates
The preparation of consolidated financial statements in conformity with U.S. generally accepted accounting principles (U.S. GAAP), requires management to make estimates and assumptions that affect the reported amounts in the consolidated financial statements and accompanying notes. Significant estimates and assumptions are used for, but not limited to: (1) the valuation of accounts receivable; (2) goodwill, trade names, and other intangible assets; (3) other long-lived assets; (4) share-based compensation; (5) accruals for health, workers’ compensation, and professional liability claims; (6) valuation of deferred tax assets; (7) purchase price allocation; (8) derivative liability; (9) legal contingencies; (10) contingent considerations; (11) income taxes; and, (12) sales and other non-income tax liabilities. Accrued insurance claims and reserves include estimated settlements from known claims and actuarial estimates for claims incurred but not reported. Actual results could differ from those estimates.
Cash and Cash Equivalents
The Company considers all investments with original maturities of three months or less to be cash and cash equivalents. The Company invests its excess cash in highly rated overnight funds and other highly rated liquid accounts. The Company is exposed to credit risk associated with these investments. The Company minimizes its credit risk relating to these positions by monitoring the financial condition of the financial institutions involved and by primarily conducting business with large, well established financial institutions, and diversifying its counterparties. The Company does not currently anticipate nonperformance by any of its significant counterparties.
Interest income on cash and cash equivalents is included in other income, net, on the Company’s consolidated statements of operations.
Accounts Receivable, Allowance for Doubtful Accounts, and Concentration of Credit Risk
Accounts receivable potentially subject the Company to concentrations of credit risk. The Company’s customers are primarily healthcare providers, and accounts receivable represent amounts due from them. The Company generally does not require collateral and mitigates its credit risk by performing credit evaluations and monitoring at-risk accounts. The allowance for doubtful accounts represents the Company’s estimate of uncollectible receivables based on a review of specific accounts and the Company’s historical collection experience. The Company writes off specific
accounts based on an ongoing review of collectability as well as past experience with the customer.
In addition, the Company maintains a sales allowance for customer disputes which may arise in the ordinary course, which is recorded as contra-revenue.
The Company’s contract terms typically require payment between
15
to
60
days from the date services are provided and are considered past due based on the particular negotiated contract terms. The majority of the Company's business activity is with hospitals located throughout the United States. No single customer accounted for more than 10% of the Company’s accounts receivable balance as of
December 31, 2017
and
2016
, or revenue for the years ended
December 31, 2017
,
2016
, and
2015
.
F- 8
CROSS COUNTRY HEALTHCARE, INC.
NOTES TO CONSOLIDATED FINANCIAL STATEMENTS
DECEMBER 31, 2017
2. Summary of Significant Accounting Policies (continued)
Prepaid Rent and Deposits
The Company leases apartments for eligible field employees under short-term agreements (typically
three
to
six
months), which generally coincide with each employee’s staffing contract. Costs relating to these leases are included in direct operating expenses on the accompanying consolidated statements of operations. As a condition of these agreements, the Company may place security deposits on the leased apartments. Deposits on field employees’ apartments related to these short-term agreements are included in other current assets on the accompanying consolidated balance sheets.
Property and Equipment
Property and equipment are stated at cost, less accumulated depreciation. Depreciation is determined on a straight-line basis over the estimated useful lives of the assets, which generally range from
three
to
seven
years. Leasehold improvements are depreciated over the shorter of their estimated useful life or the term of the individual lease. On an annual basis, the Company reviews its property and equipment listings and disposes of assets that are no longer in use.
Certain software development costs have been capitalized in accordance with the provisions of the
Intangibles-Goodwill and Other/Internal-Use Software
Topic of the Financial Accounting Standards Board (FASB) Accounting Standards Codification (ASC). Such costs include charges for consulting services and costs for Company personnel associated with programming, coding, and testing such software. Amortization of capitalized software costs begins when the software is ready for use and is included in depreciation expense in the accompanying consolidated statements of operations. Software development costs are being amortized using the straight-line method over
three
to
five
years.
Business Combinations
The Company applies accounting in accordance with the
Business Combinations
Topic of the FASB ASC when it acquires control over a business. Business combinations are accounted for at fair value. The associated acquisition costs are expensed as incurred and recorded as acquisition and integration costs; noncontrolling interests, if any, are reflected at fair value at the acquisition date; restructuring costs associated with a business combination are expensed; contingent consideration is measured at fair value at the acquisition date, with changes in the fair value after the acquisition date affecting earnings; and goodwill is determined as the excess of the fair value of the consideration conveyed in the acquisition over the fair value of the net assets acquired. The accounting for business combinations requires estimates and judgments as to expectations for future cash flows of the acquired business, and the allocation of those cash flows to identifiable intangible assets, in determining the estimated fair value for assets and liabilities acquired. The fair values assigned to tangible and intangible assets acquired and liabilities assumed are based on management's estimates and assumptions, including valuations that utilize customary valuation procedures and techniques. If the actual results differ from the estimates and judgments used in these estimates, the amounts recorded in the financial statements could result in a possible impairment of the intangible assets and goodwill, or require acceleration of the amortization expense of finite-lived intangible assets. The results of the acquired businesses' operations are included in the consolidated statements of operations of the combined entity beginning on the date of acquisition. See Note 3 - Acquisitions.
Goodwill, Trade Names, and Other Intangible Assets
Goodwill represents the excess of purchase price and related costs over the fair value assigned to the net tangible and identifiable intangible assets of businesses acquired. Other identifiable intangible assets with definite lives are being amortized using the straight-line method over their estimated useful lives which range from
1
to
16
years. Goodwill and certain intangible assets with indefinite lives are not amortized. Instead, in accordance with the
Intangibles-Goodwill and Other
Topic of the FASB ASC, these assets are reviewed for impairment annually at the beginning of the fourth quarter, and whenever circumstances change that would more likely than not reduce the fair value of a reporting unit below its carrying amount.
When reviewed, the Company has the option to first assess qualitative factors to determine whether it is more likely than not that the fair value of a reporting unit is less than its carrying amount, as a basis for determining whether it is necessary to perform the quantitative testing. If it is determined that a quantitative test is necessary or more efficient than a qualitative approach, the Company generally measures the fair value of its reporting units using a combination of income and market approaches.
For the periods prior to the fourth quarter of 2017, the performance of the quantitative impairment test involved a two-step process. The first step required the Company to determine the fair value of each of its reporting units and compare it to the reporting unit’s carrying amount. If the reporting unit's fair value was less than its carrying amount, the Company was required to perform a second
F- 9
CROSS COUNTRY HEALTHCARE, INC.
NOTES TO CONSOLIDATED FINANCIAL STATEMENTS
DECEMBER 31, 2017
2. Summary of Significant Accounting Policies (continued)
step to calculate the implied value of goodwill. The implied value was then compared to its carrying amount to calculate the impairment charge, if any.
Beginning in the fourth quarter of 2017, for its annual review on October, 1, 2017, the Company early adopted the provisions of Accounting Standards Update (ASU) 2017-04,
Intangibles-Goodwill and Other (Topic 350): Simplifying the Test for Goodwill Impairment.
Under ASU 2017-04, the second step of the quantitative assessment is eliminated, and, if the reporting unit’s carrying value exceeds its fair value, an impairment charge is recognized for the amount by which the carrying amount exceeds the reporting unit’s fair value not to exceed the total amount of goodwill allocated to that reporting unit. Additionally, income tax effects from any tax deductible goodwill on the carrying amount of the reporting unit when measuring the goodwill impairment loss is considered, if applicable. See Recently Adopted Accounting Pronouncements.
The Company determines its reporting units by identifying its operating segments and any component businesses and aggregates the components businesses if they have similar economic characteristics. The Company had the following reporting units that it reviewed for impairment: 1) Nurse and Allied Staffing; 2) Physician Staffing; and 3) Search.
Management considers historical experience and all available information at the time the fair values of its reporting units are estimated. However, fair values that could be realized in an actual transaction may have differed from those used to evaluate the potential impairment of goodwill.
Long-lived assets and identifiable intangible assets with definite lives are evaluated for impairment in accordance with the
Property, Plant, and Equipment
Topic of the FASB ASC. In accordance with this Topic, long-lived assets and definite-lived intangible assets are reviewed for impairment whenever events or changes in circumstances indicate the carrying amount may not be recoverable.
Recoverability of long-lived assets is measured by a comparison of the carrying amount of the asset group to the future undiscounted net cash flow that is expected to be generated by those assets. If such assets are considered to be impaired, the impairment charge recognized is the amount by which the carrying amount of the assets exceeds the fair value of the assets.
Any related impairment losses are recognized in earnings and included in the caption impairment charges on the consolidated statements of operations. See Note 5 - Goodwill, Trade Names, and Other Intangible Assets.
Debt Discount and Debt Issuance Costs
Stated discounts on proceeds, and other fees reimbursed to lender, as well as the initial value of any embedded derivative features of the Convertible Notes and Term Loans, as defined in Note 8 - Debt, are treated as a discount associated with the respective debt instrument and presented in the balance sheet as an offset to the carrying amount of the debt. Discounts are amortized to interest expense using the effective interest rate method, or a method that approximates the effective interest rate method, over the expected life of the debt.
Deferred costs related to the issuance of the Convertible Notes and the Term Loans were capitalized and are presented in the balance sheet as a direct deduction from the carrying amount of the debt liability. Deferred costs are amortized using the effective interest method. Deferred costs related to the Convertible Notes were written off in connection with the repayment of such Convertible Notes. See Note 8 - Debt.
Deferred costs related to the issuance of the Company’s Revolving Credit Facilities and Senior Secured Asset-Based Loan, as defined in Note 8 - Debt, have been capitalized and included in other assets on the consolidated balance sheets, and amortized using the straight line method over the term of the related credit agreement.
Derivative Financial Instruments
The Company evaluates embedded conversion features within its convertible debt in accordance with the
Derivatives and Hedging
Topic of the FASB ASC to determine whether the embedded conversion feature should be bifurcated from the host instrument and accounted for as a derivative at fair value. The Company used a trinomial lattice model to estimate the fair value of embedded conversion and redemption features in its convertible debt at the end of each applicable reporting period. Changes in the fair value of these derivatives during each reporting period were reported in other expenses (income) on the consolidated statements of operations. The fair value at inception had been recorded as debt discount and was being amortized to interest expense over the term of the note using the effective interest method. On March 17, 2017, the Company paid in full its Convertible Notes and, as a result, derecognized the derivative liability. See Note 8 - Debt.
F- 10
CROSS COUNTRY HEALTHCARE, INC.
NOTES TO CONSOLIDATED FINANCIAL STATEMENTS
DECEMBER 31, 2017
2. Summary of Significant Accounting Policies (continued)
Sales and Other State Non-income Tax Liabilities
The Company accrues sales and other state non-income tax liabilities based on the Company’s best estimate of its probable liability utilizing currently available information and interpretation of relevant tax regulations. Given the nature of the Company’s business, significant subjectivity exists as to both whether sales and other state non-income taxes can be assessed on its activity and how the sales tax will ultimately be measured by the relevant jurisdictions. The Company makes a determination for each reporting period whether the estimates for sales and other non-income taxes in certain states should be revised.
Insurance Claims
The Company provides workers’ compensation insurance coverage, professional liability coverage, and healthcare benefits for eligible employees. The Company records its estimate of the ultimate cost of, and reserves for, workers' compensation and professional liability benefits based on actuarial models prepared or reviewed by an independent actuary using the Company’s loss history as well as industry statistics. The healthcare insurance accrual is for estimated claims that have occurred but have not been reported and is based on the Company’s historical claim submission patterns. Furthermore, in determining its reserves, the Company includes reserves for estimated claims incurred but not reported as well as unfavorable claims development.
The
Other Expenses/Insurance Costs
Topic of the FASB ASC previously issued authoritative accounting guidance in the area of insurance contracts and related activity thereto. This topic concluded that, under circumstances such as in the Company’s insured professional liability and workers' compensation policies, since a right of legal offset does not exist due to the fact that there are three parties to an incurred claim, the insured, the insurer, and the claimant, the related liability to the claimant should be classified separately on a gross basis with a separate related receivable from the insurer recognized as being due from insurance carriers. Accordingly, the Company’s consolidated balance sheets as of
December 31, 2017
and
2016
reflect the related short-term liabilities in accrued compensation and benefits and the related
long-term liabilities as long-term accrued claims, and the short-term receivable portion as insurance recovery receivable and the long-term portion as non-current insurance recovery receivable. See Note 7 - Balance Sheet Details. The ultimate cost of workers’ compensation, professional liability, and health insurance claims will depend on actual amounts incurred to settle those claims and may differ from the amounts reserved by the Company for those claims.
Workers’ compensation benefits are provided under a partially self-insured plan. The Company has letters of credit to guarantee payments of claims. At
December 31, 2017
and
2016
, the Company had outstanding approximately
$19.6 million
and
$20.2 million
, respectively, of standby letters of credit as collateral to secure the self-insured portion of this plan.
The Company has occurrence-based primary professional liability policies that provide the Company and each working professional in its nurse and allied healthcare business with coverage. Effective January 1, 2016, the Company has a claims-made professional liability policy for its physicians and advanced practitioners, with a
$0.5 million
self-insured retention per claim. Prior to January 1, 2016, the Company had an occurrence-based professional liability policy for its independent contractor physicians and advanced practitioners which was insured by a wholly-owned subsidiary, Jamestown Indemnity, Ltd., a wholly-owned Cayman Island captive company (the Captive), until its voluntary liquidation in the third quarter of 2015. Beginning in March 2015, the Company's Physician subsidiary self-insured
$0.5 million
for each of its professional liability claims. Under the terms of the Captive’s reinsurance policy there was a requirement to guarantee the payment of claims to its insured party’s primary medical malpractice insurance carrier via a letter of credit. As a result of the Captive's liquidation, the letter of credit was reduced. As of both
December 31, 2017
and
2016
, the value of the letter of credit was
$2.0
million.
Subject to certain limitations, the Company also has umbrella liability coverage for its working nurses and allied healthcare professionals. While this umbrella coverage does not extend to professional liability claims against its independent contractor physicians and advanced practitioners, it does cover claims brought against all of the Company’s subsidiaries for non-patient general liability.
Revenue Recognition
The Company recognizes revenue when it is earned and when all of the following criteria are met: persuasive evidence of the arrangement exists; delivery has occurred or the service has been provided and the Company has no remaining obligations; the fee is fixed or determinable; and, collectability is reasonably assured. The Company includes reimbursable expenses in revenues, and the associated amounts of reimbursable expenses in cost of services.
F- 11
CROSS COUNTRY HEALTHCARE, INC.
NOTES TO CONSOLIDATED FINANCIAL STATEMENTS
DECEMBER 31, 2017
2. Summary of Significant Accounting Policies (continued)
Temporary Staffing Revenue
Revenue from services consists primarily of temporary staffing revenue. Revenues from temporary staffing, net of sales adjustments and discounts, are recognized when earned, based on hours worked by the Company’s healthcare professionals. Billings to customers are based on specific contract provisions which may include approval of submitted time by our customers. Accordingly, accounts receivable includes estimated revenue for employees’ and independent contractors’ time worked but not yet invoiced. At
December 31, 2017
and
2016
, the Company's estimate of amounts that had not been billed totaled
$41.8 million
and
$41.2
million, respectively, and are included in accounts receivable on the consolidated balance sheets.
Permanent Placement
Revenue on permanent placements is recognized when services provided are substantially completed. The Company does not, in the ordinary course of business, provide refunds. If a candidate leaves a permanent placement within a relatively short period of time, it is customary for the Company to provide a replacement at no additional cost.
Gross Versus Net Policies
The Company records revenue on a gross basis as a principal or on a net basis as an agent depending on the arrangement, as follows:
Managed Service Programs Arrangements
The Company has entered into certain contracts with acute care facilities to provide comprehensive managed service programs (MSP). Under these contract arrangements, the Company uses its healthcare professionals along with those of third-party subcontractors to fulfill customer orders. If its healthcare professional is used, revenue is recorded on a gross basis. If a subcontractor is used, the customer is invoiced for their services and a subcontractor liability is recorded in accrued expenses, but only the resulting administrative fee is recognized as revenue. The subcontractor is paid after the Company has received payment from the acute care facility. The Company determined that it acts as an agent in these arrangements.
Physician Staffing
The Physician Staffing business enters into contracts with its healthcare customers to provide temporary staffing services. The Company uses independent contractors for these services. The Company determined that it acts as a principal in this arrangement and, therefore, revenue is reported on a gross basis in the consolidated statements of operations.
Education Seminars
During the third quarter of 2015, the Company completed the sale of its education seminars business, Cross Country Education, LLC (CCE). See Note 4 - Disposal. Prior to the sale of CCE, revenue from the Company’s Education Seminars services was recognized as the independent contractor-led seminars were performed. In the Company’s Education Seminars business, revenue was recorded in the consolidated statements of operations on a gross basis as a principal.
Share-Based Compensation
The Company has, from time to time, granted stock options, stock appreciation rights, performance-based stock awards, and restricted stock for a fixed number of common shares to employees. In accordance with the
Compensation-Stock-Compensation
Topic of the FASB ASC, companies may choose from alternative valuation models. The Company used the Black-Scholes method of valuing its options and stock appreciation rights. The Company has elected to recognize compensation expense on a straight-line basis over the requisite service period of the entire award. The Company values its restricted stock awards and the fair value of its performance-based stock awards by reference to its stock price on the date of grant.
The Company granted performance-based stock awards to certain key personnel pursuant to its 2014 Omnibus Incentive Plan as described in Note 14 - Stockholders' Equity. Pursuant to the plan, the number of target shares that vest are determined based on the level of attainment of the targets. If a minimum level of performance is attained for the awards, restricted stock is issued with a
F- 12
CROSS COUNTRY HEALTHCARE, INC.
NOTES TO CONSOLIDATED FINANCIAL STATEMENTS
DECEMBER 31, 2017
2. Summary of Significant Accounting Policies (continued)
vesting date in the future, subject to the employee's continuing employment. The Company recognizes performance-based restricted stock as compensation expense based on the most likely probability of attaining the prescribed performance and over the requisite service period beginning at its grant date and through the date the restricted stock vests.
The Company used historical data of options with similar characteristics to estimate pre-vesting option forfeitures, as it believed that historical behavior patterns are the best indicators of future behavior patterns. Compensation expense related to share-based payments is included in selling, general, and administrative expenses in the consolidated statements of operations, and totaled
$4.1
million,
$3.4
million, and
$2.5
million, during the years ended
December 31, 2017
,
2016
, and
2015
, respectively. See Note 14
-
Stockholders’ Equity.
Advertising
The Company’s advertising expense consists primarily of online advertising, internet direct marketing, print media, promotional material and, prior to the sale of CCE, direct mail marketing. Advertising costs that were expensed as incurred totaled
$7.6 million
,
$10.2
million, and
$4.9
million, for the years ended
December 31, 2017
,
2016
, and
2015
, respectively. Prior to the sale of CCE, direct mail marketing costs associated with the Company’s education seminars services were capitalized when the Company determined that there was a reasonable expectation that the cost of the incurred advertising would be recovered from the gross profit generated by the advertised event and expensed when the related event took place. There are
no
such costs included in prepaid expenses on the
December 31, 2017
and
2016
consolidated balance sheets.
Restructuring Costs
The Company considers restructuring activities to be programs whereby it fundamentally changes its operations, such as closing and consolidating facilities, reducing headcount and realigning operations in response to changing market conditions. As a result, restructuring costs on the consolidated statements of operations include on-going benefit costs for its employees and exit costs.
Reconciliations of the beginning and ending total restructuring liability balances are presented below:
|
Year Ended December 31,
|
||||||||||||||||||||
|
2017
|
2016
|
2015
|
||||||||||||||||||
|
(amounts in thousands)
|
||||||||||||||||||||
|
On-Going Benefit Costs
|
Exit Costs
|
On-Going Benefit Costs
|
Exit Costs
|
On-Going Benefit Costs
|
Exit Costs
|
|||||||||||||||
|
Balance at beginning of period
|
$
|
325
|
|
$
|
273
|
|
$
|
44
|
|
$
|
338
|
|
$
|
—
|
|
$
|
—
|
|
||
|
Charged to restructuring costs
|
522
|
|
504
|
|
563
|
|
190
|
|
633
|
|
641
|
|
||||||||
|
Payments
|
(760
|
)
|
(336
|
)
|
(282
|
)
|
(255
|
)
|
(589
|
)
|
(303
|
)
|
||||||||
|
Balance at end of period
|
$
|
87
|
|
$
|
441
|
|
$
|
325
|
|
$
|
273
|
|
$
|
44
|
|
$
|
338
|
|
||
Deferred Rent
Deferred rent consists of free rent, rent escalation, tenant improvement allowances, and other incentives received from landlords related to the operating leases for our facilities. Rent escalation represents the difference between actual operating lease payments due and straight-line rent expense, which we record over the term of the lease. The excess is recorded as a deferred credit in the early periods of the lease, when cash payments are generally lower than straight-line rent expense, and is reduced in the later periods of the lease when payments begin to exceed the straight-line expense. Tenant allowances from landlords for tenant improvements are generally comprised of cash received from the landlord or paid on our behalf as part of the negotiated terms of the lease. These tenant improvement allowances and other leasehold incentives are recorded when realizable as deferred rent and are amortized as a reduction of periodic rent expense, over the term of the applicable lease. See Note 12 - Commitments and Contingencies.
F- 13
CROSS COUNTRY HEALTHCARE, INC.
NOTES TO CONSOLIDATED FINANCIAL STATEMENTS
DECEMBER 31, 2017
2. Summary of Significant Accounting Policies (continued)
Income Taxes
The Company accounts for income taxes under the
Income Taxes
Topic of the FASB ASC. Deferred income tax assets and liabilities are determined based upon differences between the financial reporting and tax basis of assets and liabilities, and are measured using the enacted tax rates and laws that will be in effect when the differences are expected to reverse.
The Company recognizes in its financial statements the impact of a tax position if that position is more likely than not of being sustained on audit, based on the technical merits of the position. The Company recognizes interest and penalties related to unrecognized tax benefits in the provision for income taxes.
The Company determines the need for a valuation allowance by assessing the probability of realizing deferred tax assets, taking into consideration all available positive and negative evidence, including historical operating results, expectations of future taxable income, carryforward periods available to the Company for tax reporting purposes, the evaluation of various income tax planning strategies, and other relevant factors. The Company maintains a valuation allowance when it is more likely than not that all or a portion of a deferred tax asset will not be realized based on consideration of all available evidence. Adjustments to the deferred tax valuation allowances are made to earnings in the period when such assessments are made. Significant judgment is required in making this assessment and to the extent future expectations change, the Company would have to assess the recoverability of its deferred tax assets at that time. See Note 13 - Income Taxes.
Comprehensive Income (Loss)
Total comprehensive income (loss) includes net income or loss and foreign currency translation adjustments, net of any related deferred taxes. Certain of the Company’s foreign subsidiaries use their respective local currency as their functional currency. In accordance with the
Foreign Currency Matters
Topic of the FASB ASC,
assets and liabilities of these operations are translated at the exchange rates in effect on the balance sheet date. Income statement items are translated at the average exchange rates for the period. The cumulative impact of currency fluctuations related to the balance sheet translation is included in accumulated other comprehensive loss in the accompanying consolidated balance sheets and was approximately
$1.2
million at both
December 31, 2017
and
2016
.
During the period ended December 31, 2017,
$0.2 million
of income tax expense was included in the consolidated statements of operations due to the impact of a change in federal tax rate on the deferred tax asset related to foreign currency cumulative translation. See Note 13 - Income Taxes. There was
no
income tax impact related to foreign currency translation adjustments for the period ended December 31, 2016. During the period ended
December 31, 2015
,
$0.2 million
of income tax expense related to foreign currency translation adjustments was included on the Company's consolidated statements of comprehensive income (loss).
Fair Value Measurements
The Company complies with the provisions of the
Fair Value Measurements and Disclosures
Topic of the FASB ASC, which defines fair value, establishes a framework for measuring fair value under U.S. GAAP, and expands disclosures about fair value measurements. As of
December 31, 2017
and
2016
, the Company’s financial assets and liabilities required to be measured on a recurring basis were its deferred compensation liability, its Convertible Notes derivative liability, and its contingent consideration liabilities. See Note 10 - Fair Value Measurements.
Earnings Per Share
In accordance with the requirements of the
Earnings Per Share
Topic of the FASB ASC, basic earnings per share is computed by dividing net income available to common shareholders (numerator) by the weighted average number of vested unrestricted common shares outstanding during the period (denominator). Diluted earnings per share gives effect to all dilutive potential common shares outstanding during the period including stock appreciation rights and options and unvested restricted stock, as calculated utilizing the treasury stock method, and Convertible Notes using the if-converted method prior to their payment in full in the first quarter of 2017.
F- 14
CROSS COUNTRY HEALTHCARE, INC.
NOTES TO CONSOLIDATED FINANCIAL STATEMENTS
DECEMBER 31, 2017
2. Summary of Significant Accounting Policies (continued)
Recently Adopted Accounting Pronouncements
In January 2017, the FASB issued ASU No. 2017-04,
Intangibles-Goodwill and Other (Topic 350): Simplifying the Test for Goodwill Impairment,
to simplify how an entity is required to test goodwill for impairment by eliminating Step 2 from the goodwill impairment test. Under this guidance, an entity would perform its annual, or interim goodwill impairment test by comparing the fair value of a reporting unit with its carrying amount. An impairment charge would be recognized for the amount by which the carrying amount exceeds the reporting unit’s fair value; however, the loss recognized should not exceed the total amount of goodwill allocated to that reporting unit. Additionally, an entity would consider income tax effects from any tax deductible goodwill on the carrying amount of the reporting unit when measuring the goodwill impairment loss. An entity still has the option to perform the qualitative assessment for a reporting unit to determine if the quantitative impairment test is necessary. ASU 2017-04 is effective for annual or any interim goodwill impairment tests in fiscal years beginning after December 15, 2019 and is to be applied prospectively. Early adoption was permitted for interim or annual goodwill impairment tests performed on testing dates after January 1, 2017. The Company elected to early adopt this standard in its fourth quarter of 2017, which was the first quarter in which an impairment test was performed. See Note 5 - Goodwill, Trade Names, and Other Intangible Assets.
In August 2016, the Financial Accounting Standards Board (FASB) issued ASU No. 2016-15,
Statement of Cash Flows (Topic 230): Classification of Certain Cash Receipts and Cash Payments
, which amends the guidance in ASC 230 on the classification of certain cash receipts and payments in the statement of cash flows. This update intended to reduce the diversity that has resulted from the lack of consistent principles on this topic by adding or clarifying guidance on eight cash flow issues, including: debt prepayment or debt extinguishment costs, contingent consideration payments made after a business combination, and separately identifiable cash flows and application of the predominance principle. ASU 2016-15 is effective for annual periods beginning after December 15, 2017, and interim periods within those annual periods. Early adoption was permitted. The Company elected to early adopt this standard in its first quarter of 2017, applying the guidance retrospectively with no material impact on its consolidated financial statements.
In March 2016, the FASB issued ASU No. 2016-09,
Compensation-Stock Compensation (Topic 718): Improvements to
Employee Share-Based Payment Accounting.
The Company adopted this guidance in the first quarter of 2017. ASU 2016-09 eliminates the requirement to delay the recognition of excess tax benefits until they reduce current taxes payable. The required method of adoption is modified retrospective transition method. Upon adoption, previously unrecognized excess tax benefits of
$1.3 million
had no impact on the Company's accumulated deficit balance as the related deferred tax assets were fully offset by a valuation allowance. ASU 2016-09 also requires excess tax benefits and deficiencies to be recognized prospectively in the provision for income taxes rather than additional paid-in capital. As a result of the adoption and the reversal of the valuation allowance on deferred tax assets, the Company recognized
$0.6 million
for these excess tax benefits relating to share-based awards vested and exercised for the year ended December 31, 2017. Additionally, as permitted by the ASU, the Company elected to account for forfeitures as they occur rather than estimate expected forfeitures using a modified retrospective transition method. As a result, the Company recorded a cumulative-effect adjustment of
$0.5 million
to accumulated deficit and greater share-based compensation expense of
$0.2 million
compared to the amount of expense that would have been recorded for 2017. Under ASU 2016-09, the threshold for awards to qualify for equity treatment permits withholding up to the maximum statutory tax rates in the applicable jurisdictions. Prior to the adoption of ASU 2016-09, the Company did not allow an award to be partially settled in cash in excess of the minimum statutory withholding requirements. Subsequent to the adoption of the standard, the Company will allow awards to be partially settled at the maximum applicable statutory rates. Finally, ASU 2016-09 requires excess tax benefits to be presented as a component of operating cash flows rather than financing cash flows. The Company elected to adopt this requirement prospectively and accordingly, prior periods have not been adjusted. Excess tax benefits were not material for all periods presented.
In March 2016, the FASB issued ASU No. 2016-06,
Derivatives and Hedging (Topic 815): Contingent Put and Call Options in
Debt Instruments
, to clarify the steps required to assess whether a call or put option meets the criteria for bifurcation as an embedded derivative. ASU 2016-06 is effective for interim and annual periods beginning after December 15, 2016, and requires a modified retrospective approach to adoption. The Company adopted this guidance in the first quarter of 2017. The adoption of this guidance had no impact on the Company's results of operations.
F- 15
CROSS COUNTRY HEALTHCARE, INC.
NOTES TO CONSOLIDATED FINANCIAL STATEMENTS
DECEMBER 31, 2017
2. Summary of Significant Accounting Policies (continued)
Recent Accounting Pronouncements
In February 2018, the FASB issued ASU No. 2018-02,
Income Statement - Reporting Comprehensive Income (Topic 220):
Reclassification of Certain Tax Effects from Accumulated Other Comprehensive Income.
The amendments in this Update allow a reclassification from accumulated other comprehensive income to retained earnings for stranded tax effects resulting from the Tax Cuts and Jobs Act (2017 Tax Act), and require certain disclosures about stranded tax effects. The guidance that requires that the effect of a change in tax laws or rates be included in income from continuing operations is not affected. The amendments in this Update are effective for all entities for fiscal years beginning after December 15, 2018, and interim periods within those fiscal years, and should be applied either in the period of adoption or retrospectively to each period in which the effect of the change in the U.S. federal corporate tax rate in the 2017 Tax Act is recognized. For public business entities, for reporting periods for which financial statements have not yet been issued, early adoption is permitted, including adoption in any interim period. The Company expects to adopt this standard in its first quarter of 2018, and does not expect this guidance to have a material impact on its consolidated financial statements.
In July 2017, the FASB issued ASU No. 2017-11,
Earnings Per Share (Topic 260); Distinguishing Liabilities from Equity (Topic 480); and Derivatives and Hedging (Topic 815): I. Accounting for Certain Financial Instruments with Down Round Features, and II. Replacement of the Indefinite Deferral for Mandatorily Redeemable Financial Instruments of Certain Nonpublic Entities and Certain Mandatorily Redeemable Noncontrolling Interests with a Scope Exception
. The amendments in Part I of this Update change the classification analysis of certain equity-linked financial instruments (or embedded features) with down round features. When determining whether certain financial instruments should be classified as liabilities or equity instruments, a down round feature no longer precludes equity classification when assessing whether the instrument is indexed to an entity’s own stock. The amendments in Part II of this Update recharacterize the indefinite deferral of certain provisions of Topic 480 that now are presented as pending content in the Codification, to a scope exception. Those amendments do not have an accounting effect. For public business entities, the amendments in Part I of this Update are effective for fiscal years, and interim periods within those fiscal years, beginning after December 15, 2018, and should be applied retrospectively to outstanding financial instruments with a down round feature by means of either a cumulative-effect adjustment or for each prior reporting period presented. Early adoption is permitted for all entities, including adoption in an interim period. The Company expects to adopt this standard in its first quarter of 2019, and does not expect this guidance to have a material impact on its consolidated financial statements.
In May 2017, the FASB issued ASU No. 2017-09,
Compensation-Stock Compensation (Topic 718): Scope of Modification Accounting,
to provide guidance about which changes to the terms or conditions of a share-based payment award require an entity to apply modification accounting in Topic 718. Under this guidance, an entity should account for the effects of a modification unless all of the following are met: (1) the fair value of the modified award is the same as the fair value of the original award immediately before the original award is modified, (2) the vesting conditions of the modified award are the same as the vesting conditions of the original award immediately before the original award is modified, and (3) the classification of the modified award as an equity instrument or a liability instrument is the same as the classification of the original award immediately before the original award is modified. ASU 2017-09 is effective for all entities for annual periods, and interim periods within those annual periods, beginning after December 15, 2017 and is to be applied prospectively to an award modified on or after the adoption date. Early adoption is permitted. The Company expects to adopt this standard in its first quarter of 2018, and does not expect this guidance to have a material impact on its consolidated financial statements.
In January 2017, the FASB issued ASU No. 2017-01,
Business Combinations (Topic 805): Clarifying the Definition of a Business
, which clarifies the definition of a business, with the objective of adding guidance to assist entities with evaluating whether transactions should be accounted for as acquisitions (or disposals) of assets or businesses. This update provides a framework to assist entities in evaluating whether both an input and a substantive process are present, and narrows the definition of the term output so that the term is consistent with how outputs are described in the new revenue recognition standard. ASU 2017-01 is effective for annual periods beginning after December 15, 2017, and interim periods within those annual periods. Early adoption is permitted depending upon the date of the transaction. Entities should apply the guidance prospectively on or after the effective date. No disclosures are required at transition. The Company expects to adopt this standard in its first quarter of 2018, and does not expect this guidance to have a material impact on its consolidated financial statements.
In February 2016, the FASB issued ASU No. 2016-02,
Leases (Topic 842)
, which will require, among other items, lessees to recognize most leases as assets and liabilities on the balance sheet. Qualitative and quantitative disclosures will be enhanced to
F- 16
CROSS COUNTRY HEALTHCARE, INC.
NOTES TO CONSOLIDATED FINANCIAL STATEMENTS
DECEMBER 31, 2017
2. Summary of Significant Accounting Policies (continued)
better understand the amount, timing and uncertainty of cash flows arising from leases. ASU 2016-02 is effective for fiscal years beginning after December 15, 2018, and interim periods within those fiscal years, with early adoption permitted. Entities are required to use a modified retrospective approach for leases that exist or are entered into after the beginning of the earliest comparative period in the financial statements. Full retrospective application is prohibited. The Company expects the valuation of right of use assets and lease liabilities, previously described as operating leases, to be the present value of our forecasted future lease commitments. The Company is continuing to assess the overall impacts of the new standard, including the discount rate to be applied in these valuations. See Note 12 - Commitments and Contingencies.
In May 2014, the FASB issued ASU No. 2014-09,
Revenue from Contracts with Customers (Topic 606)
. Topic 606 introduced a new five-step revenue recognition model in which an entity should recognize revenue when its customer obtains control of promised goods or services, in an amount that reflects the consideration to which the entity expects to be entitled in exchange for those goods or services. Topic 606 also requires additional disclosures about the nature, amount, timing and uncertainty of revenue and cash flows arising from customer contracts, including significant judgments and changes in judgments. The FASB has issued several other subsequent updates including the following: 1) further clarification of the guidance on principal versus agent considerations; 2) expanded guidance on identifying performance obligations; and 3) additional guidance and practical expedients in response to identified implementation issues. Collectively, Topic 606, Subtopic 340-40, and all subsequent ASUs that modified Topic 606, are referred to as the “new revenue standard.” The new revenue standard is effective for annual reporting periods beginning after December 15, 2017, including interim periods within such reporting period. The new revenue standard is effective for the Company in the first quarter of 2018 and the Company expects to adopt using a modified retrospective method, which will only impact contracts not completed as of December 31, 2017.
The Company employed a cross-functional implementation team which consisted of representatives from across all of its business segments to analyze and identify material revenue streams and its largest customers within those streams. The implementation team completed a thorough review of its existing contracts and business practices for those customers to assess the impact of the new revenue standard. In the fourth quarter of 2017, the Company finalized its assessment of the new revenue standard and began implementing changes to its accounting policies, processes, and internal controls.
The Company has determined that the adoption of the new revenue standard will not have a material impact on its consolidated financial statements, other than expanded disclosures. The Company has concluded that transfer of control of its staffing services, which represent the majority of its revenues, occurs as the services are provided, which is consistent with recognition under the prior guidance.
3. Acquisitions
Advantage RN
Effective July 1, 2017, the Company acquired all of the assets of Advantage RN, LLC and its subsidiaries (collectively, Advantage) for cash consideration of
$86.6 million
, net of cash acquired. The total purchase price of
$88.0 million
was subject to a net working capital reduction of
$0.6 million
at the closing and an additional
$0.8 million
was received during the third quarter of 2017 as the final adjustment for net working capital. Additionally,
$0.6 million
of the purchase price was deferred as of the closing and is due the seller within
20 months
, less any Cobra and healthcare payments incurred by the Company on behalf of the seller. As of December 31, 2017, approximately
$0.3 million
has been paid for claims and the remaining
$0.3 million
liability is included in other current and long-term liabilities on the Company’s balance sheet.
Included in the amount paid at closing were two escrow accounts, the first was
$14.5 million
which related to tax liabilities and the second was
$7.5 million
which was to cover any post-close liabilities. On July 28, 2017,
$7.3 million
related to the tax liabilities was released from escrow, leaving a balance of
$7.2 million
, with the escrow to cover post-close liabilities remaining unchanged.
The Company financed the purchase using
$19.9 million
in available cash and
$66.9 million
in borrowing under its Credit Facility, including a
$40.0 million
incremental term loan, which was subsequently refinanced on August 1, 2017. See Note 8 - Debt for further information. The transaction was treated as a purchase of assets for income tax purposes.
F- 17
CROSS COUNTRY HEALTHCARE, INC.
NOTES TO CONSOLIDATED FINANCIAL STATEMENTS
DECEMBER 31, 2017
3. Acquisitions (continued)
Advantage is primarily a travel nurse staffing company that deploys many of its nurses through MSPs and Vendor Management Systems, and Advantage maintains direct relationships with many hospitals throughout the United States. This was a strategic acquisition to help the Company fill its recent MSP contract wins and for revenue growth.
The acquisition has been accounted for in accordance with the
Business Combinations
Topic of the FASB ASC, using the acquisition method of accounting. As such, the results of Advantage from July 1, 2017 are included in the Company's consolidated statement of operations and were: revenue of
$47.0 million
and contribution income, as defined in Note 17 - Segment Data, of
$3.8 million
. The acquisition results have been substantially aggregated with the Company's Nurse and Allied Staffing business segment, with less than
2%
of the business included in the Physician Staffing business segment. See Note 17 - Segment Data.
The following is the estimated fair value of the purchase price for Advantage on July 1, 2017:
|
(amounts in thousands)
|
|||
|
Purchase price
|
$
|
88,000
|
|
|
Net working capital adjustments
|
(1,438
|
)
|
|
|
Cash consideration
|
86,562
|
|
|
|
Cash acquired
|
2,833
|
|
|
|
Total consideration
|
$
|
89,395
|
|
The purchase price was allocated to the assets acquired and the liabilities assumed based on the estimated fair value at the date of acquisition. The Company used a third-party appraiser to assist with the determination of the fair value and estimated useful lives of certain acquired assets and liabilities.
The following table is an estimate of the fair value of the assets acquired and liabilities assumed on July 1, 2017.
|
(amounts in thousands)
|
|||
|
Cash and cash equivalents
|
$
|
2,833
|
|
|
Accounts receivable
|
14,396
|
|
|
|
Other current assets
|
392
|
|
|
|
Property and equipment
|
333
|
|
|
|
Goodwill
|
43,596
|
|
|
|
Other intangible assets
|
29,900
|
|
|
|
Total assets acquired
|
91,450
|
|
|
|
Accounts payable and accrued expenses
|
368
|
|
|
|
Accrued employee compensation and benefits
|
1,685
|
|
|
|
Other current liabilities
|
2
|
|
|
|
Total liabilities assumed
|
2,055
|
|
|
|
Net assets acquired
|
$
|
89,395
|
|
The Company assigned the following values to other identifiable intangible assets:
$4.5 million
to trade names with a weighted average estimated useful life of
10
years,
$13.8 million
to customer relationships with a weighted average estimated useful life of
10
years,
$11.3 million
to a database, consisting of healthcare professionals, with a weighted average estimated useful life of
10
years, and
$0.3 million
to non-compete agreements with a weighted average estimated useful life of
5
years, for a total of
$29.9 million
in definite life intangible assets with a weighted average estimated useful life of
10
years.
The remaining excess purchase price over the fair value of net assets acquired of
$43.6 million
was recorded as goodwill, which is expected to be deductible for tax purposes. Associated acquisition-related costs incurred were
$2.0 million
and have been included in acquisition and integration costs on the Company's condensed consolidated statement of operations for the year ended December 31, 2017.
F- 18
CROSS COUNTRY HEALTHCARE, INC.
NOTES TO CONSOLIDATED FINANCIAL STATEMENTS
DECEMBER 31, 2017
3. Acquisitions (continued)
Pro Forma Financial Information
The following unaudited pro forma financial information approximates the consolidated results of operations of the Company as if the Advantage acquisition had occurred as of January 1, 2016, after giving effect to certain adjustments, including additional interest expense on the amount the Company borrowed on the date of the transaction, the amortization of acquired intangible assets, and the elimination of certain expenses that will not be recurring in post-acquisition periods, net of an estimated income tax impact. These adjustments include removing transaction-related expenses of approximately
$2.0 million
for the year ended December 31, 2017. These results are not necessarily indicative of future results as they do not include incremental investments in support functions, elimination of costs for integration or operating synergies, or an estimate of any impact on interest expense resulting from the operating cash flow of the acquired businesses, among other adjustments that could be made in the future but are not factually supportable on the date of the transaction.
|
Year Ended December 31,
|
|||||||
|
2017
|
2016
|
||||||
|
(unaudited, amounts in thousands except per share data)
|
|||||||
|
Revenue from services
|
$
|
916,149
|
|
$
|
934,904
|
|
|
|
Net income attributable to common shareholders
|
$
|
40,255
|
|
$
|
11,391
|
|
|
|
Net income per common share attributable to common shareholders - basic
|
$
|
1.16
|
|
$
|
0.35
|
|
|
|
Net income per common share attributable to common shareholders - diluted
|
$
|
1.09
|
|
$
|
0.25
|
|
|
US Resources Healthcare
On December 1, 2016, the Company completed the acquisition of a recruitment process outsourcing business, US Resources Healthcare, LLC (USR). This acquisition expands the Company's workforce solutions offerings to deliver financial and operating efficiencies through labor optimization services while enhancing the quality of care.
The agreement specified that the sellers were eligible to receive additional purchase price consideration of
$4.5 million
, with a maximum of
$1.0 million
for 2017,
$2.0 million
for 2018, and
$1.5 million
for 2019, based on attainment of specific performance criteria achieved in each of those years. In the fourth quarter of 2017, the Company recognized a decrease in the fair value of the liability of
$1.3 million
included as acquisition-related contingent consideration on its consolidated statements of operations. The adjustment was driven by the decrease in the projected USR 2018 and 2019 revenue and EBITDA amounts. As of December 31, 2017, the fair value of the remaining obligation was estimated at
$0.2 million
and is included in other current liabilities and contingent consideration on the condensed consolidated balance sheets. See Note 10 - Fair Value Measurements.
The acquisition was deemed immaterial and has been accounted for in accordance with the
Business Combinations
Topic of the FASB ASC, using the acquisition method of accounting. USR's results of operations are included in the consolidated statements of operations from December 1, 2016 and have been included in the Company's Nurse and Allied Staffing business segment. See Note 5 - Goodwill, Trade Names, and Other Intangible Assets and Note 10 - Fair Value Measurements.
Mediscan
On October 30, 2015, the Company completed the acquisition of all of the membership interests of New Mediscan II, LLC, Mediscan Diagnostic Services, LLC, and Mediscan Nursing Staffing, LLC (collectively Mediscan) for a purchase price of
$29.9 million
in cash (
$28.0 million
plus working capital estimate) and
$4.7 million
in shares (or
349,871
shares) of the Company's Common Stock, subject to a net working capital adjustment. The shares of Common Stock issued in connection with the acquisition were subject to a lockup period, which ended April 30, 2016. The Company financed the purchase price through a combination of cash-on-hand and borrowings under the Company's senior credit facility. The transaction has been
F- 19
CROSS COUNTRY HEALTHCARE, INC.
NOTES TO CONSOLIDATED FINANCIAL STATEMENTS
DECEMBER 31, 2017
3. Acquisitions (continued)
treated as a purchase of assets for income tax purposes. In the first quarter of 2016, a net working capital adjustment of
$0.3
million was settled. Additionally, an amount of
$5.0 million
of the purchase price that was held in escrow to cover any post-closing liabilities, was released to the sellers on May 3, 2017.
The agreement also specified that the sellers were eligible to receive additional purchase price consideration of
$7.0 million
, with
$3.5 million
per year based on attainment of specific performance criteria in 2016 and 2017. As of December 31, 2016, the Company determined that the first year earnout was not achieved for 2016 and, as of September 30, 2017, the Company
determined that the second year earnout would not be achieved for 2017.
In connection with the Mediscan acquisition, the Company also assumed additional contingent purchase price liabilities for a previously acquired business that are payable annually based on specific performance criteria for the 2016 through 2019 years. Payments related to the 2016 through 2018 years are limited to
$0.3 million
per year and 2019 is uncapped. As of
December 31, 2017
, the fair value of the remaining obligations was estimated at
$5.2 million
and is included in other current liabilities and contingent consideration on the consolidated balance sheets. See Note 10 - Fair Value Measurements.
Mediscan provides temporary healthcare staffing and workforce solutions to both the healthcare and education markets - both public and charter schools. At the time of acquisition, while largely concentrated in California, Mediscan provided services across
11
states to more than
300
clients through more than
70
specialties. The Mediscan acquisition provided the Company a new customer base in the healthcare staffing market for public schools and the workforce solutions arena for charter schools.
The acquisition has been accounted for in accordance with the
Business Combinations
Topic of the FASB ASC
,
using the acquisition method of accounting. Mediscan's results of operations are included in the consolidated statements of operations from October 30, 2015 and have been included in the Company's Nurse and Allied Staffing business segment. As such, the associated goodwill related to the acquisition is fully allocated to Nurse and Allied Staffing.
The amounts of revenue and net income included in the Company's consolidated income statement from the acquisition date to the period ended December 31, 2015 were
$6.7 million
and
$0.3 million
, respectively.
The following is the estimated fair value of the purchase price for Mediscan on October 30, 2015:
|
(amounts in thousands)
|
|||
|
Cash purchase price paid at closing
|
$
|
28,000
|
|
|
Fair value of shares
|
4,723
|
|
|
|
Fair value of contingent consideration
|
3,686
|
|
|
|
Net working capital adjustment, including receivable
|
503
|
|
|
|
Total consideration
|
$
|
36,912
|
|
F- 20
CROSS COUNTRY HEALTHCARE, INC.
NOTES TO CONSOLIDATED FINANCIAL STATEMENTS
DECEMBER 31, 2017
3. Acquisitions (continued)
The purchase price was allocated to the assets acquired and the liabilities assumed based on the estimated fair value at the date of acquisition. The following table summarizes the fair value of the assets acquired and liabilities assumed. The Company used a third-party appraiser to assist with the determination of the fair value and estimated useful lives of acquired assets and liabilities assumed as of October 30, 2015:
|
(amounts in thousands)
|
|||
|
Cash and cash equivalents
|
$
|
79
|
|
|
Accounts receivable
|
6,851
|
|
|
|
Other current assets
|
140
|
|
|
|
Property and equipment
|
20
|
|
|
|
Goodwill
|
14,338
|
|
|
|
Other intangible assets
|
17,200
|
|
|
|
Total assets acquired
|
38,628
|
|
|
|
Accounts payable and accrued expenses
|
306
|
|
|
|
Accrued employee compensation and benefits
|
1,410
|
|
|
|
Total liabilities assumed
|
1,716
|
|
|
|
Net assets acquired
|
$
|
36,912
|
|
The Company assigned the following values to other intangible assets:
$3.2 million
to trade names with a weighted average estimated useful life of
11
years,
$5.2 million
to customer relations with an estimated useful life of
10
years, and
$8.8 million
to a database with an estimated useful life of
10
years, for a total of
$17.2 million
in definite life intangible assets with a weighted average estimated useful life of
10
years.
The remaining excess purchase price over the fair value of net assets acquired of
$14.3 million
was recorded as goodwill, which is expected to be deductible for tax purposes. Associated acquisition costs incurred were
$0.7 million
and have been included in acquisition and integration costs on the Company's consolidated statement of operations for the year ended December 31, 2015.
Medical Staffing Network
On June 30, 2014, the Company acquired substantially all of the assets and certain liabilities of Medical Staffing Network Healthcare, LLC (MSN). Of the purchase price,
$2.5 million
was deferred and due to the seller
21 months
from the acquisition date, less any COBRA expenses incurred by the Company on behalf of former MSN employees over that period. The Company incurred
$0.4 million
in COBRA expenses since the MSN acquisition and, on April 1, 2016, released to the seller the remaining liability of
$2.1 million
.
4. Disposal
On July 21, 2015, the Company's Board of Directors approved an agreement to sell the Company's education seminars business, CCE, which provided in-person seminars to healthcare professionals and was non-core to the Company’s business. The operating results of CCE were included in the Other Human Capital Management Services segment. See Note 17 - Segment Data for further information. The Company used the net proceeds from the transaction to finance, in part, the Mediscan acquisition in the fourth quarter of 2015. See Note 3 - Acquisitions. Since the disposal of the education seminars business did not represent a strategic shift that would have a major effect on the Company’s operations and financial results, it was not reflected as discontinued operations.
On July 27, 2015, the Company entered into an Agreement and Plan of Merger to sell its wholly-owned subsidiary, CCE, to a third party (Buyer) and on August 31, 2015, the sale was completed. The Company received
$8.0 million
in cash, subject to a net working capital adjustment, of which
$0.5 million
was held in escrow for a period of
12 months
following the closing to provide partial security to the Buyer in the event of any breach of the representations, warranties and covenants of the Company. In September 2016, the full amount of escrow, which had been reflected as an escrow receivable, was released to the Company.
F- 21
CROSS COUNTRY HEALTHCARE, INC.
NOTES TO CONSOLIDATED FINANCIAL STATEMENTS
DECEMBER 31, 2016
4. Disposal (continued)
The purchase price also included an earnout of up to
$0.5 million
related to the performance of CCE for the year ended December 31, 2015, which was treated as contingent consideration. The Company assigned no fair value to this earnout as of December 31, 2015 as the performance-based milestones were not met. The original escrow amount was released to the Buyer in the first quarter of 2016.
The Company recognized a pre-tax loss of
$2.2 million
related to the sale of the business, which is included in income (loss) from operations in its consolidated statements of operations for the year ended December 31, 2015. In addition, the Company recorded a tax benefit of
$3.5 million
from the reversal of valuation allowances associated with this business, resulting in an after-tax gain on the sale of CCE of
$1.3 million
.
5. Goodwill, Trade Names, and Other Intangible Assets
The Company had the following acquired intangible assets:
|
|
December 31, 2017
|
December 31, 2016
|
|||||||||||||||||||||
|
|
Gross
Carrying Amount |
Accumulated
Amortization |
Net
Carrying Amount |
Gross
Carrying Amount |
Accumulated
Amortization |
Net
Carrying Amount |
|||||||||||||||||
|
(amounts in thousands)
|
|||||||||||||||||||||||
|
Intangible assets subject to amortization:
|
|
|
|
|
|
|
|||||||||||||||||
|
Databases
|
$
|
42,909
|
|
$
|
18,702
|
|
$
|
24,207
|
|
$
|
31,609
|
|
$
|
16,147
|
|
$
|
15,462
|
|
|||||
|
Customer relationships
|
55,524
|
|
25,912
|
|
29,612
|
|
41,724
|
|
23,316
|
|
18,408
|
|
|||||||||||
|
Non-compete agreements
|
3,919
|
|
3,600
|
|
319
|
|
3,619
|
|
3,527
|
|
92
|
|
|||||||||||
|
Trade names
|
7,716
|
|
878
|
|
6,838
|
|
3,216
|
|
343
|
|
2,873
|
|
|||||||||||
|
Other intangible assets, net
|
$
|
110,068
|
|
$
|
49,092
|
|
$
|
60,976
|
|
$
|
80,168
|
|
$
|
43,333
|
|
$
|
36,835
|
|
|||||
|
Intangible assets not subject to amortization:
|
|
|
|
|
|
|
|
|
|
|
|
|
|||||||||||
|
Trade names
|
|
|
|
|
26,702
|
|
|
|
|
|
35,402
|
|
|||||||||||
|
|
|
|
|
|
$
|
87,678
|
|
|
|
|
|
$
|
72,237
|
|
|||||||||
As of
December 31, 2017
, estimated annual amortization expense is as follows:
|
Years Ending December 31:
|
(amounts in thousands)
|
||
|
2018
|
$
|
7,167
|
|
|
2019
|
7,131
|
|
|
|
2020
|
7,027
|
|
|
|
2021
|
6,819
|
|
|
|
2022
|
6,743
|
|
|
|
Thereafter
|
26,089
|
|
|
|
|
$
|
60,976
|
|
F- 22
CROSS COUNTRY HEALTHCARE, INC.
NOTES TO CONSOLIDATED FINANCIAL STATEMENTS
DECEMBER 31, 2017
5. Goodwill, Trade Names, and Other Intangible Assets (continued)
The changes in the carrying amount of goodwill by segment are as follows:
|
|
Nurse and
Allied Staffing
Segment
|
Physician
Staffing
Segment
|
Other Human
Capital
Management
Services
Segment
|
Total
|
|||||||||||
|
(amounts in thousands)
|
|||||||||||||||
|
Balances as of December 31, 2016
|
|
|
|
|
|||||||||||
|
Aggregate goodwill acquired
|
$
|
304,277
|
|
$
|
43,405
|
|
$
|
19,307
|
|
$
|
366,989
|
|
|||
|
Sale of CCE
|
—
|
|
—
|
|
(9,889
|
)
|
(9,889
|
)
|
|||||||
|
Accumulated impairment loss
|
(259,732
|
)
|
(17,720
|
)
|
—
|
|
(277,452
|
)
|
|||||||
|
Goodwill, net of impairment loss
|
44,545
|
|
25,685
|
|
9,418
|
|
79,648
|
|
|||||||
|
Changes to aggregate goodwill in 2017
|
|||||||||||||||
|
Goodwill acquired (a)
|
43,596
|
|
—
|
|
—
|
|
43,596
|
|
|||||||
|
Impairment charges
|
—
|
|
(5,655
|
)
|
—
|
|
(5,655
|
)
|
|||||||
|
Balances as of December 31, 2017
|
|||||||||||||||
|
Aggregate goodwill acquired
|
347,873
|
|
43,405
|
|
19,307
|
|
410,585
|
|
|||||||
|
Sale of CCE
|
—
|
|
—
|
|
(9,889
|
)
|
(9,889
|
)
|
|||||||
|
Accumulated impairment loss
|
(259,732
|
)
|
(23,375
|
)
|
—
|
|
(283,107
|
)
|
|||||||
|
Goodwill, net of impairment loss
|
$
|
88,141
|
|
$
|
20,030
|
|
$
|
9,418
|
|
$
|
117,589
|
|
|||
_______________
|
(a)
|
Goodwill acquired from the acquisition of Advantage. See Note 3 - Acquisitions.
|
2017 Impairment Charges
The Company performed its annual quantitative impairment test of goodwill and other indefinite-lived intangible assets as of October 1, 2017. Upon completion of the impairment testing, it was determined that the estimated fair value of the Physician Staffing reporting unit’s trade name was less than its carrying amount resulting in impairment. For its goodwill impairment testing, with the exception of its Physician Staffing reporting unit, the estimated fair value of its reporting units exceeded their respective carrying values.
Projections of revenue, operating costs, and expected cash flows of each reporting unit are inputs into the quantitative testing for goodwill and intangible assets. The Company reduced its long-term revenue forecast for the Physician Staffing business segment in the fourth quarter. The lower than expected revenue was driven by lower booking volumes, partly due to the loss of customers. In addition, margins of the reporting unit were negatively impacted from continued investments in the business. As a result, the Company recorded non-cash impairment charges of
$8.7 million
related to its trade names and
$5.7 million
related to goodwill during the fourth quarter.
2016 and 2015 Impairment Charges
The Company performed its annual impairment test as of October 1, 2016. Upon completion of the impairment testing, the Company determined that no impairment of goodwill, trade names, or other intangible assets was warranted.
During an evaluation of goodwill, trade names, and other intangible assets at June 30, 2016, the Company determined that indicators were present in the Physician Staffing reporting unit which would suggest the fair value of the reporting unit may have declined below its carrying value. The Physician Staffing reporting unit was under-performing relative to management’s expectations. The lower than expected revenue was driven by lower booking volumes partly due to the loss of customers, and margins were negatively impacted from continued investments in the business all through the first half of 2016. The Company considered these factors to be impairment indicators that warranted impairment testing of goodwill, trade names, and other
F- 23
CROSS COUNTRY HEALTHCARE, INC.
NOTES TO CONSOLIDATED FINANCIAL STATEMENTS
DECEMBER 31, 2017
5. Goodwill, Trade Names, and Other Intangible Assets (continued)
intangible assets. The interim impairment testing resulted in the carrying values of goodwill, trade names, and other intangible assets for Physician Staffing to exceed their estimated fair values. As a result, the interim impairment testing was performed which resulted in the carrying values of goodwill, trade names, and other intangible assets for Physician Staffing to exceed their estimated fair values. As a result, the Company recorded a non-cash impairment charge totaling
$24.3 million
:
$17.7 million
related to goodwill,
$0.6 million
related to trade names, and
$6.0 million
related to customer relationships.
The Company performed its annual impairment testing as of October 1, 2015. Upon completion of the impairment testing, the Company determined that the estimated fair value of its reporting units exceeded their respective carrying values. Accordingly, no goodwill impairment charges were warranted for these reporting units.
However, in conjunction with the annual impairment testing of trade names in the fourth quarter of 2015, the Company reduced its long-term revenue forecast for the Physician Staffing business segment which caused the calculation of estimated fair value of the trade names to be less than its carrying amount, resulting in a non-cash impairment charge of
$2.1 million
. The reduced long-term revenue forecast for 2015 was impacted by lower projected volume resulting from an under-investment in new revenue producers to keep pace with attrition. No additional impairments of indefinite-lived intangible assets were identified.
Quantitative Methods and Assumptions
Trade Names
The Relief From Royalty methodology was utilized to value the Physician Staffing trade names using projected cash flows of an estimated royalty fee. The royalty rate was determined by a blended rate using the Market Royalty Rate Method and the Apportionment of Profit Method.
Goodwill
The discounted cash flows serve as the primary basis for the income approach and are based on the Company’s discrete financial forecast of revenue, gross profit margins, operating costs and cash flows. The forecast considers historical and estimated future results, general economic and market conditions, as well as the impact of planned business and operational strategies. For its 2017 testing, the assumptions used in the income approach included discount rates of
11.0%
to
15.0%
and a terminal value growth rate of
3.0%
for cash flows beyond the discrete forecast period of
ten
years. Assumptions used in the market approach testing included valuation multiples based on an analysis of multiples for comparable public companies. The Company utilized total enterprise value/Earnings Before Interest, Taxes, Depreciation, and Amortization (EBITDA) multiples ranging from
5.8
to
15.0
. The concluded fair value was based on a weighting of
75%
applied to the income approach and
25%
to the market approach for its Physician Staffing and Search reporting units and a
50%
weighting was applied to the components of each approach to estimate the total fair value of goodwill for its Nurse and Allied Staffing reporting unit. This weighting was an estimate by management and was developed based on the specific characteristics, risks and uncertainties of the reporting units.
Customer Relationships
The Multi-Period Excess Earnings Method (MPEEM) methodology was utilized for valuing the Physician Staffing customer relationships in its interim impairment testing for the second quarter of 2016. The MPEEM estimates the fair value based on the present value of the allocated future economic benefits. The inputs include the projected revenue and associated expenses from the customers, an estimated attrition rate, and a discount rate of
13.5%
.
Although management believes that the Company's current estimates and assumptions are reasonable and supportable, there can be no assurance that the estimates and assumptions made for purposes of the impairment testing will prove to be accurate predictions of future performance.
F- 24
CROSS COUNTRY HEALTHCARE, INC.
NOTES TO CONSOLIDATED FINANCIAL STATEMENTS
DECEMBER 31, 2017
6. Property and Equipment
The Company's property and equipment consists of the following:
|
|
|
December 31,
|
|||||||
|
|
Useful Lives
|
2017
|
2016
|
||||||
|
(amounts in thousands)
|
|||||||||
|
Computer equipment
|
3-5 years
|
$
|
6,432
|
|
$
|
13,584
|
|
||
|
Computer software
|
3-5 years
|
24,933
|
|
28,752
|
|
||||
|
Office equipment
|
5-7 years
|
1,379
|
|
2,397
|
|
||||
|
Furniture and fixtures
|
5-7 years
|
4,680
|
|
3,969
|
|
||||
|
Leasehold improvements
|
(a)
|
7,340
|
|
7,257
|
|
||||
|
|
|
44,764
|
|
55,959
|
|
||||
|
Less accumulated depreciation and amortization
|
|
(30,678
|
)
|
(43,141
|
)
|
||||
|
|
|
$
|
14,086
|
|
$
|
12,818
|
|
||
_______________
|
(a)
|
See Note 2 – Summary of Significant Accounting Policies.
|
F- 25
CROSS COUNTRY HEALTHCARE, INC.
NOTES TO CONSOLIDATED FINANCIAL STATEMENTS
DECEMBER 31, 2017
7. Balance Sheet Details
|
|
December 31,
|
||||||
|
|
2017
|
2016
|
|||||
|
(amounts in thousands)
|
|||||||
|
Insurance recovery receivable:
|
|
|
|||||
|
Insurance recovery for health
|
$
|
—
|
|
$
|
279
|
|
|
|
Insurance recovery for workers’ compensation
|
1,623
|
|
1,271
|
|
|||
|
Insurance recovery for professional liability
|
1,874
|
|
1,487
|
|
|||
|
|
$
|
3,497
|
|
$
|
3,037
|
|
|
|
Other non-current assets:
|
|||||||
|
Insurance recovery for workers’ compensation claims
|
$
|
6,093
|
|
$
|
5,857
|
|
|
|
Insurance recovery for professional liability claims
|
10,011
|
|
10,353
|
|
|||
|
Non-current security deposits
|
1,095
|
|
925
|
|
|||
|
Non-current income tax receivable
|
1,044
|
|
—
|
|
|||
|
Net debt issuance costs
|
985
|
|
929
|
|
|||
|
$
|
19,228
|
|
$
|
18,064
|
|
||
|
Accrued compensation and benefits:
|
|||||||
|
Salaries and payroll taxes
|
$
|
16,342
|
|
$
|
15,480
|
|
|
|
Bonuses
|
2,067
|
|
3,915
|
|
|||
|
Accrual for workers’ compensation claims
|
5,957
|
|
5,266
|
|
|||
|
Accrual for professional liability claims
|
2,683
|
|
2,433
|
|
|||
|
Accrual for healthcare benefits
|
5,105
|
|
4,053
|
|
|||
|
Accrual for vacation
|
2,117
|
|
2,096
|
|
|||
|
|
$
|
34,271
|
|
$
|
33,243
|
|
|
|
Long-term accrued claims:
|
|||||||
|
Accrual for workers’ compensation claims
|
$
|
13,160
|
|
$
|
12,817
|
|
|
|
Accrual for professional liability claims
|
15,597
|
|
16,053
|
|
|||
|
$
|
28,757
|
|
$
|
28,870
|
|
||
|
Other long-term liabilities:
|
|||||||
|
Deferred compensation
|
$
|
1,467
|
|
$
|
1,472
|
|
|
|
Deferred rent
|
6,875
|
|
5,011
|
|
|||
|
Long-term unrecognized tax benefits
|
485
|
|
874
|
|
|||
|
Other
|
344
|
|
52
|
|
|||
|
$
|
9,171
|
|
$
|
7,409
|
|
||
F- 26
CROSS COUNTRY HEALTHCARE, INC.
NOTES TO CONSOLIDATED FINANCIAL STATEMENTS
DECEMBER 31, 2017
8. Debt
The Company's long-term debt consists of the following:
|
|
December 31, 2017
|
December 31, 2016
|
|||||||||||||
|
|
Principal
|
Unamortized Discount and Debt Issuance Costs
|
Principal
|
Unamortized Discount and Debt Issuance Costs
|
|||||||||||
|
(amounts in thousands)
|
|||||||||||||||
|
Term Loan, interest of 3.61% and 2.62% at December 31, 2017 and 2016, respectively
|
$
|
100,000
|
|
$
|
(866
|
)
|
$
|
39,500
|
|
$
|
(363
|
)
|
|||
|
Convertible Notes, fixed rate interest of 8.00%
|
—
|
|
—
|
|
25,000
|
|
(4,669
|
)
|
|||||||
|
Convertible Notes derivative liability
|
—
|
|
—
|
|
27,532
|
|
—
|
|
|||||||
|
Total debt
|
100,000
|
|
(866
|
)
|
92,032
|
|
(5,032
|
)
|
|||||||
|
Less current portion
|
(6,875
|
)
|
—
|
|
(2,250
|
)
|
—
|
|
|||||||
|
Long-term debt
|
$
|
93,125
|
|
$
|
(866
|
)
|
$
|
89,782
|
|
$
|
(5,032
|
)
|
|||
As of
December 31, 2017
, the aggregate scheduled maturities of debt are as follows:
|
|
Term Loan
|
||
|
(amounts in thousands)
|
|||
|
Through Years Ending December 31:
|
|||
|
2018
|
$
|
6,875
|
|
|
2019
|
7,500
|
|
|
|
2020
|
8,125
|
|
|
|
2021
|
10,000
|
|
|
|
2022
|
67,500
|
|
|
|
Total
|
$
|
100,000
|
|
Amendment and Restatement of Senior Credit Facility
On August 1, 2017, the Company entered into an Amendment and Restatement of its Credit Agreement dated June 22, 2016 (Amended and Restated Credit Agreement), to refinance and increase the current aggregate committed size of the facility to
$215.0 million
, including a term loan of
$100.0 million
(Amended Term Loan) and a
$115.0 million
revolving credit facility (Amended Revolving Credit Facility) (together with the Amended Term Loan, the Amended Credit Facilities). The Amended Revolving Credit Facility includes a subfacility for swingline loans up to an amount not to exceed
$15.0 million
, and a
$35.0
million sublimit for the issuance of standby letters of credit. The proceeds of
$106.5 million
from this refinancing included
$6.5
million under the new revolving credit facility and were used to repay borrowings under the Company’s 2016 Senior Credit Facilities (as defined below), as well as to pay related interest, fees, and expenses of the transaction.
In addition to increasing the size of the facilities, the maturity date was extended to August 1, 2022. The Amended and Restated Credit Agreement also includes an accordion feature permitting the Company, subject to certain conditions, to increase the aggregate amount of the commitments under the Amended Revolving Credit Facility or establish one or more additional term loans in an aggregate amount not to exceed
$50.0 million
with optional additional commitments from existing lenders or new commitments from additional lenders. Other terms and pricing are substantially similar to the 2016 Credit Agreement (as defined below).
Borrowings under the Amended Term Loan are payable in quarterly installments, commencing January 2, 2018, in an aggregate per annum amount equal to
5%
for the first four installments,
7.5%
for the next eight installments, and
10%
for the remaining
F- 27
CROSS COUNTRY HEALTHCARE, INC.
NOTES TO CONSOLIDATED FINANCIAL STATEMENTS
DECEMBER 31, 2017
8. Debt (continued)
installments; provided that, to the extent not previously paid, the aggregate unpaid principal balance would be due and payable on the maturity date.
Subject to the Amended and Restated Credit Agreement, the Company pays interest on (i) each Base Rate Loan at the Base Rate (as defined therein) plus the Applicable Margin in effect from time to time, (ii) each LIBOR Index Rate Loan at the One Month LIBOR Index Rate (as defined therein) plus the Applicable Margin in effect from time to time and (iii) each Eurodollar Loan at the Adjusted LIBOR for the applicable Interest Period (as defined therein) in effect for such Loan plus the Applicable Margin in effect from time to time. The Applicable Margin, as of any date, is a percentage per annum determined by reference to the applicable Consolidated Net Leverage Ratio (as defined by the agreement) in effect on such date as set forth in the table below.
|
Level
|
Consolidated Net Leverage Ratio
|
Eurodollar Loans, LIBOR Index Rate Loans and Letter of Credit Fee
|
Base Rate Loans
|
Commitment Fee
|
|
I
|
Less than 1.50:1.00
|
1.75%
|
0.75%
|
0.25%
|
|
II
|
Greater than or equal to 1.50:1.00
but less than 2.00:1.00
|
2.00%
|
1.00%
|
0.30%
|
|
III
|
Greater than or equal to 2.00:1.00
but less than 2.50:1.00
|
2.25%
|
1.25%
|
0.30%
|
|
IV
|
Greater than or equal to 2.50:1.00
but less than 3.00:1.00
|
2.50%
|
1.50%
|
0.35%
|
|
V
|
Greater than or equal to 3.00:1.00
|
2.75%
|
1.75%
|
0.40%
|
As of
December 31, 2017
, the Amended Term Loan and Amended Revolving Credit Facility bore interest at a rate equal to One Month LIBOR plus
2.25%
. The interest rate is subject to an increase of
2.00%
if an event of default exists under the Amended and Restated Credit Agreement. The Company is required to pay a commitment fee on the average daily unused portion of the Amended Revolving Credit Facility, based on the Applicable Margin which was
0.30%
as of
December 31, 2017
.
The Company has the right at any time and from time to time to prepay any borrowing, in whole or in part, without premium or penalty, by giving irrevocable written notice (or telephonic notice promptly confirmed in writing) except that such notice shall be revocable if a prepayment is being made in anticipation of concluding a financing arrangement, and the Company is ultimately unable to secure such financing arrangement. The Company is required to prepay the Amended Credit Facilities under certain circumstances including from net cash proceeds from asset sales or dispositions in excess of certain thresholds, as well as from net cash proceeds from the issuance of certain debt by the Company.
The Amended and Restated Credit Agreement contains customary representations, warranties, and affirmative covenants. The Amended and Restated Credit Agreement also contains customary negative covenants, subject to some exceptions, on: (i) indebtedness and preferred equity; (ii) liens; (iii) fundamental changes; (iv) investments; (v) restricted payments; and, (vi) sale of assets and certain other restrictive agreements. The Amended and Restated Credit Agreement also contains customary events of default, such as payment defaults, cross-defaults to other material indebtedness, bankruptcy and insolvency, the occurrence of a defined change in control and the failure to observe the negative covenants and other covenants related to the operation of the Company’s business.
The Amended and Restated Credit Agreement also includes
two
financial covenants: (i) limiting a maximum Consolidated Total Leverage ratio (as defined therein) to be no greater than
3.50
:1.00 for the fiscal quarters ending September 30, 2017 through June 30, 2018,
3.25
:1.00 for the fiscal quarters ending September 30, 2018 through June 30, 2019, and
3.00
:1.00 for each fiscal quarter ending thereafter and as adjusted pursuant to a Qualified Permitted Acquisition (as defined therein); and (ii) requiring a minimum Consolidated Fixed Charge Coverage ratio (as defined therein) as of the end of each fiscal quarter of
1.50
:1.00. As of
December 31, 2017
, the Company was in compliance with the financial covenants and other covenants contained in the Credit Agreement.
F- 28
CROSS COUNTRY HEALTHCARE, INC.
NOTES TO CONSOLIDATED FINANCIAL STATEMENTS
DECEMBER 31, 2017
8. Debt (continued)
The obligations under the Amended and Restated Credit Agreement are guaranteed by all of the Company’s domestic wholly-owned subsidiaries and are secured by a first-priority security interest in the Collateral (as defined therein).
As of
December 31, 2017
, the Company has
$21.6 million
letters of credit outstanding and
$93.4 million
available under the Amended Revolving Credit Facility. The letters of credit relate to the Company’s workers’ compensation and professional liability insurance policies.
2016 Senior Credit Facilities
On June 22, 2016, the Company entered into a senior credit agreement (2016 Credit Agreement), which provided for an initial term loan of
$40.0 million
(Term Loan) and a revolving credit facility of up to
$100.0 million
(Revolving Credit Facility) (together with the Term Loan, the 2016 Senior Credit Facilities) both of which would have matured on June 22, 2021. The Revolving Credit Facility included a subfacility for swingline loans up to an amount not to exceed
$15.0 million
, and a
$35.0
million sublimit for the issuance of standby letters of credit. Proceeds of the Senior Credit Facilities were used primarily to refinance the Company’s prior senior secured asset-based credit facility and
$30.0 million
Second Lien Term Loan and to pay related transaction fees and expenses, including a redemption premium of
$0.6 million
. The repayment of the Second Lien Term Loan was treated as extinguishment of debt and, as a result, the Company recognized a loss on extinguishment of debt of approximately
$1.6 million
in the second quarter of 2016, related to the write-off of unamortized net debt discount and issuance costs as well as transaction fees and expenses.
On July 5, 2017, the Company entered into a Second Amendment to its 2016 Credit Agreement primarily to allow for the acquisition of Advantage including a reset of the Applicable Margin to Level III, based on the incremental borrowings and consistent with the prior pricing grid (or
2.25%
for Eurodollar Loans and LIBOR Index Rate Loans,
1.25%
for Base Rate Loans and a
0.30%
commitment fee). Also, on July 5, 2017, the Company entered into an Incremental Term Loan Agreement for
$40.0 million
with SunTrust as Lender and Administrative Agent to pay for part of the consideration of the acquisition of Advantage. The Incremental Term Loan maturity date was June 22, 2021 and was prepayable at any time without penalty.
Borrowings under the Incremental Term Loan were payable in quarterly installments, commencing September 30, 2017, with each such installment being in the aggregate principal amount (subject to adjustment as a result of prepayments) for the first eight installments equal to
1.875%
and
2.5%
of the principal amount of the Incremental Term Loan for the remaining installments; provided that, to the extent not previously paid, the aggregate unpaid principal balance would be due and payable on the maturity date. As of July 5, 2017 the Applicable Margin for Eurodollar Loans and LIBOR Index Rate Loans was
2.25%
and the Applicable Margin for Base Rate Loans was
1.25%
.
Convertible Notes
The Company and certain of its domestic subsidiaries entered into a Convertible Note Purchase Agreement (the Note Purchase Agreement), with certain note holders (collectively, the Noteholders) on June 30, 2014. Pursuant to the Note Purchase Agreement, the Company sold to the Noteholders an aggregate of
$25.0 million
of convertible notes (the Convertible Notes). On March 17, 2017, the Company paid in full the Convertible Notes. In connection with the repayment, the Company issued to the Noteholders an aggregate of
3,175,584
shares of Common Stock, par value
$0.0001
, and cash in the aggregate amount of
$5.6 million
(of which
$5.0 million
is included in repayment of debt and
$0.6 million
is presented as extinguishment fees, both within financing activities on the condensed consolidated statements of cash flows). Upon derecognition of the net carrying amounts of the Convertible Notes (the remaining
$20.0 million
after the
$5.0 million
cash payment) and derivative liability (
$26.0 million
), the Company recognized a non-cash charge of
$5.0 million
as loss on early extinguishment and a non-cash addition to additional paid-in capital of
$46.0 million
for the fair value of the shares, which is not presented on the consolidated statements of cash flows. The loss on early extinguishment of debt includes the write-off of unamortized loan fees and remaining interest due through the Forced Conversion date (defined below) of June 30, 2017.
The Convertible Notes were convertible at the option of the holders thereof at any time into shares of the Common Stock at a conversion price of
$7.10
per share, or
3,521,126
shares of Common Stock. After
three
years from the issuance date, the Company had the right to force a conversion of the Convertible Notes if the volume-weighted average price (VWAP) per share of its Common Stock exceeded
125%
of the then conversion price for
20
days of a
30
day trading period (Forced Conversion date).
F- 29
CROSS COUNTRY HEALTHCARE, INC.
NOTES TO CONSOLIDATED FINANCIAL STATEMENTS
DECEMBER 31, 2017
8. Debt (continued)
The Convertible Notes bore interest at a rate of
8.00%
per annum, payable in quarterly cash installments. The Convertible Notes would have matured on June 30, 2020, unless earlier repurchased, redeemed or converted. Subject to certain exceptions, the Company was not permitted to redeem the Convertible Notes until June 30, 2017.
9. Convertible Notes Derivative Liability
On March 17, 2017, the Company paid in full its Convertible Notes and, as a result, derecognized the derivative liability. See Note 8 - Debt. The Company has not used derivative financial instruments to hedge exposures to cash-flow, market or foreign-currency risks. However, the Company issued Convertible Notes with features that were either (i) not afforded equity classification, (ii) embody risks not clearly and closely related to host contracts, or (iii) may be net-cash settled by the counterparty. As required by the
Accounting for Derivative Financial Instruments and Hedging Activities
Topic of the FASB ASC, in certain instances, these instruments were required to be carried as derivative liabilities, at fair value, in the financial statements.
The Convertible Notes were subject to anti-dilution adjustments that allowed for the reduction in the Conversion Price, as defined in the agreement, in the event the Company subsequently issued equity securities including Common Stock or any security convertible or exchangeable for shares of Common Stock for a price less than the then current conversion price. In addition, the Convertible Notes allowed the issuer to exercise optional redemption features and the holder to exercise an offer to purchase feature, under certain conditions. The Company accounted for the conversion option in accordance with the
Accounting for Derivative Financial Instruments and Hedging Activities
Topic of the FASB ASC. Since this conversion feature is not considered to be solely indexed to the Company’s own stock the derivative was recorded as a liability in the line item long-term debt on the Company's consolidated balance sheets.
The Company’s Convertible Notes derivative liability was measured at fair value using a trinomial lattice model. The optional redemption features, along with the offer to purchase features, were incorporated into the valuation model. Inputs into the model required estimates, including such items as estimated volatility of the Company’s stock, estimated credit risk of the Company, estimated probabilities of change of control and issuance of additional financing, risk-free interest rate, and the estimated life of the financial instruments being fair valued. In addition, since the conversion price contained an anti-dilution adjustment, the probability that the Conversion Price of the Notes would decrease as the share price decreased was incorporated into the valuation calculation.
The fair value of the derivative liability was primarily determined by fluctuations in the Company's stock price. In addition, changes in the Company's credit risk profile impacted the fair value determination. These fluctuations resulted in a current period gain or loss that was presented on the consolidated statements of operations as (gain) loss on derivative liability.
10. Fair Value Measurements
The
Fair Value Measurements and Disclosures
Topic of the FASB ASC defines fair value as the exchange price that would be received for an asset or paid to transfer a liability (an exit price) in the principal or most advantageous market for the asset or liability in an orderly transaction between market participants on the measurement date. This topic also establishes a fair value hierarchy which requires an entity to maximize the use of observable inputs and minimize the use of unobservable inputs when measuring fair value. The standard describes three levels of inputs that may be used to measure fair value:
Level 1
—Quoted prices in active markets for identical assets or liabilities.
Level 2
—Observable inputs other than Level 1 prices such as quoted prices for similar assets or liabilities; quoted prices in markets that are not active; or other inputs that are observable or can be corroborated by observable market data for substantially the full term of the assets or liabilities.
Level 3
—Unobservable inputs that are supported by little or no market activity and that are significant to the fair value of the assets or liabilities.
F- 30
CROSS COUNTRY HEALTHCARE, INC.
NOTES TO CONSOLIDATED FINANCIAL STATEMENTS
DECEMBER 31, 2017
10. Fair Value Measurements (continued)
Items Measured at Fair Value on a Recurring Basis
The Company’s financial assets/liabilities required to be measured on a recurring basis were its: deferred compensation liability included in other long-term liabilities, Convertible Notes derivative liability included in long-term debt and capital lease obligations, and contingent consideration liabilities.
Deferred compensation
—The Company utilizes Level 1 inputs to value its deferred compensation liability. The Company’s deferred compensation liability is measured using publicly available indices that define the liability amounts, as per the plan documents.
Convertible notes derivative liability
—The Company utilized Level 3 inputs to value its Convertible Notes derivative liability. See Note 9 - Convertible Notes Derivative Liability.
Contingent purchase price liabilities
—Potential earnout payments related to the acquisition of Mediscan and USR are contingent upon meeting certain performance requirements through 2019. The long-term portion of these liabilities is included in contingent consideration, and the short-term portion is included in other current liabilities on the consolidated balance sheets. The Company utilized Level 3 inputs to value these contingent consideration liabilities as significant unobservable inputs were used in the calculation of their fair value. Both of the Mediscan contingent consideration liabilities have been measured at fair value using a discounted cash flow model in a Monte Carlo simulation setting, utilizing significant unobservable inputs, including the expected volatility of the acquisitions' gross profits and an estimated discount rate commensurate with the risks of the expected gross profit stream. In the third quarter of 2017, the Company determined that one of the contingent consideration earnouts related to the Mediscan acquisition would not be achieved for 2017 and, as a result, the entire earnout was reversed. The USR contingent consideration is recorded as a liability and measured at fair value using a discounted cash flow model utilizing significant unobservable inputs, including the probability of achieving each of the potential milestones and an estimated discount rate commensurate with the risks of the expected cash flows attributable to the milestones. See Note 3 - Acquisitions.
The fair value of contingent consideration and the associated liabilities will be adjusted to fair value at each reporting date until actual settlement occurs, with the changes in fair value and related accretion reflected as acquisition-related contingent consideration on the consolidated statements of operations. Significant increases (decreases) in the volatility or in any of the probabilities of success, or decreases (increases) in the discount rate would result in a significantly higher (lower) fair value, respectively, and commensurate changes to these liabilities.
F- 31
CROSS COUNTRY HEALTHCARE, INC.
NOTES TO CONSOLIDATED FINANCIAL STATEMENTS
DECEMBER 31, 2017
10. Fair Value Measurements (continued)
The table which follows summarizes the estimated fair value of the Company’s financial assets and liabilities measured on a recurring basis:
Fair Value Measurements
|
December 31, 2017
|
December 31, 2016
|
||||||
|
Financial Liabilities:
|
(amounts in thousands)
|
||||||
|
(Level 1)
|
|||||||
|
Deferred compensation
|
$
|
1,467
|
|
$
|
1,472
|
|
|
|
(Level 3)
|
|
|
|
|
|||
|
Convertible Notes derivative liability
|
$
|
—
|
|
$
|
27,532
|
|
|
|
Contingent purchase price liabilities
|
$
|
5,368
|
|
$
|
5,603
|
|
|
The table which follows reconciles the opening balances to the closing balances for fair value measurements categorized within Level 3 of the fair value hierarchy:
|
Contingent Purchase
|
Convertible Notes
|
||||||
|
Price Liabilities (a)
|
Derivative Liability
|
||||||
|
(amounts in thousands)
|
|||||||
|
December 31, 2015
|
$
|
3,686
|
|
$
|
33,337
|
|
|
|
Additions
|
1,300
|
|
—
|
|
|||
|
Payments
|
(152
|
)
|
—
|
|
|||
|
Accretion expense
|
887
|
|
—
|
|
|||
|
Valuation gain for the period
|
(118
|
)
|
(5,805
|
)
|
|||
|
December 31, 2016
|
5,603
|
|
27,532
|
|
|||
|
Payments/Settlements
|
(280
|
)
|
(25,951
|
)
|
|||
|
Accretion expense
|
967
|
|
—
|
|
|||
|
Valuation gain for the period
|
(922
|
)
|
(1,581
|
)
|
|||
|
December 31, 2017
|
$
|
5,368
|
|
$
|
—
|
|
|
_______________
(a) Related to the Mediscan acquisition on October 30, 2015 and the USR acquisition on December 1, 2016. See Note 3 - Acquisitions. Valuation gain and accretion expense is included as acquisition-related contingent consideration on the consolidated statements of operations.
Items Measured at Fair Value on a Non-recurring Basis
The Company's non-financial assets, such as goodwill, trade names, other intangible assets, and property and equipment, are measured at fair value when there is an indicator of impairment and are recorded at fair value only when an impairment charge is recognized. During an evaluation of goodwill, trade names, and other intangible assets during the years ended December 31, 2017, 2016, and 2015, the carrying value of goodwill, trade names, and other intangible assets in the Physician Staffing reporting unit exceeded their fair values. As a result, the Company recorded impairment charges that incorporates fair value measurements based on Level 3 inputs. For further discussion on measuring the Company's non-financial assets, specifically goodwill, trade names, and customer relationships. See Note 5 - Goodwill, Trade Names, and Other Intangible Assets.
F- 32
CROSS COUNTRY HEALTHCARE, INC.
NOTES TO CONSOLIDATED FINANCIAL STATEMENTS
DECEMBER 31, 2017
10. Fair Value Measurements (continued)
Other Fair Value Disclosures
Financial instruments not measured or recorded at fair value in the accompanying consolidated balance sheets consist of cash and cash equivalents, accounts receivable, accounts payable and accrued expenses, and short and long-term debt. The estimated fair value of accounts receivable, accounts payable, and accrued expenses approximate their carrying amount due to the short-term nature of these instruments. The estimated fair value of the Company’s debt was calculated using a discounted cash flow analysis and appropriate valuation methodologies using Level 2 inputs from available market information.
The following table represents the carrying amounts and estimated fair value of the Company’s significant financial instruments that were not measured at fair value:
|
|
December 31, 2017
|
December 31, 2016
|
|||||||||||||
|
Carrying
Amount |
Fair
Value |
Carrying
Amount |
Fair
Value |
||||||||||||
|
(amounts in thousands)
|
|||||||||||||||
|
Financial Liabilities:
|
|||||||||||||||
|
(Level 2)
|
|
|
|
|
|
|
|
|
|||||||
|
Term Loan, net
|
$
|
99,134
|
|
$
|
100,500
|
|
$
|
39,137
|
|
$
|
41,500
|
|
|||
|
Convertible Notes, net
|
$
|
—
|
|
$
|
—
|
|
$
|
20,331
|
|
$
|
27,250
|
|
|||
Concentration of Risk
The Company has invested its excess cash in highly-rated overnight funds and other highly-rated liquid accounts. The Company has been exposed to credit risk associated with these investments. The Company minimizes its credit risk relating to these positions by monitoring the financial condition of the financial institutions involved and by primarily conducting business with large, well established financial institutions and diversifying its counterparties.
The Company generally does not require collateral and mitigates its credit risk by performing credit evaluations and monitoring at-risk accounts. The allowance for doubtful accounts represents the Company’s estimate of uncollectible receivables based on a review of specific accounts and the Company’s historical collection experience. The Company writes off specific accounts based on an ongoing review of collectability as well as past experience with the customer. The Company’s contract terms typically require payment between
15
to
60
days from the date services are provided and are considered past due based on the particular negotiated contract terms. Overall, based on the large number of customers in differing geographic areas, primarily throughout the United States and its territories, the Company believes the concentration of credit risk is limited.
11. Employee Benefit Plans
The Company maintains a voluntary defined contribution 401(k) profit-sharing plan covering all eligible employees as defined in the plan documents. The plan provides for a discretionary matching contribution, which is equal to a percentage of each eligible contributing participant’s elective deferral, which the Company, at its sole discretion, determines from year to year.
Contributions by the Company, net of forfeitures, under this plan amounted to
$0.7 million
,
$0.8 million
, and
$0.7 million
for the years ended
December 31, 2017
,
2016
, and
2015
, respectively. Eligible employees who elect to participate in the plan are generally vested in any existing matching contribution after three years of service with the Company.
The Company offers a non-qualified deferred compensation program to certain key employees whereby they may defer a portion of annual compensation for payment upon retirement. The program is unfunded for tax purposes and for purposes of Title I of the Employee Retirement Income Security Act of 1974. The liability for the deferred compensation is included in other long-term liabilities on the consolidated balance sheets and amounted to
$1.5 million
at
December 31, 2017
and
2016
.
F- 33
CROSS COUNTRY HEALTHCARE, INC.
NOTES TO CONSOLIDATED FINANCIAL STATEMENTS
DECEMBER 31, 2017
12. Commitments and Contingencies
Commitments
Operating Leases
The Company has entered into non-cancelable operating lease agreements for the rental of office space and equipment. Certain of these leases include options to renew as well as rent escalation clauses and in certain cases, incentives from the landlord for rent-free months and premises reductions, and allowances for tenant improvements. The rent escalations and incentives have been reflected in the table below.
Future minimum lease payments, as of
December 31, 2017
, associated with these agreements with terms of one year or more are as follows:
|
Years Ending December 31:
|
(amounts in thousands)
|
||
|
2018
|
$
|
6,700
|
|
|
2019
|
5,180
|
|
|
|
2020
|
4,438
|
|
|
|
2021
|
3,993
|
|
|
|
2022
|
3,698
|
|
|
|
Thereafter
|
8,732
|
|
|
|
|
$
|
32,741
|
|
Total operating lease expense included in selling, general, and administrative expenses was approximately
$9.4 million
,
$8.4
million, and
$8.1
million for the years ending
December 31, 2017
,
2016
, and
2015
, respectively.
Contingencies
Sales and Other State Non-income Tax Liabilities
The Company's sales and other state non-income tax filings are subject to routine audits by authorities in the jurisdictions where it conducts business in the United States which may result in assessments of additional taxes. The Company accrues sales and other non-income tax liabilities based on the Company's best estimate of its probable liability utilizing currently available information and interpretation of relevant tax regulations. Given the nature of the Company's business, significant subjectivity exists as to both whether sales and other state non-income taxes can be assessed on its activity and how the sales tax will ultimately be measured by the relevant jurisdictions. The Company makes a determination for each reporting period whether the estimates for sales and other non-income taxes in certain states should be revised. Non-income tax expense is included in selling, general and administrative expenses on its consolidated statements of operations and the liability is reflected in sales tax payable within other current liabilities as of
December 31, 2017
and
2016
, on its consolidated balance sheets.
Legal Proceedings
The Company is subject to legal proceedings and claims that arise in the ordinary course of its business. The Company does not believe the outcome of these other matters will have a material adverse effect on the Company’s business, financial condition, results of operations or cash flows.
F- 34
CROSS COUNTRY HEALTHCARE, INC.
NOTES TO CONSOLIDATED FINANCIAL STATEMENTS
DECEMBER 31, 2017
13. Income Taxes
The components of the Company's income before income taxes are as follows:
|
|
Year Ended December 31,
|
||||||||||
|
|
2017
|
2016
|
2015
|
||||||||
|
(amounts in thousands)
|
|||||||||||
|
United States
|
$
|
3,826
|
|
$
|
3,309
|
|
$
|
3,565
|
|
||
|
Foreign
|
475
|
|
1,236
|
|
595
|
|
|||||
|
Income before income taxes
|
$
|
4,301
|
|
$
|
4,545
|
|
$
|
4,160
|
|
||
The components of the Company’s income tax benefit are as follows:
|
|
Year Ended December 31,
|
||||||||||
|
|
2017
|
2016
|
2015
|
||||||||
|
(amounts in thousands)
|
|||||||||||
|
Current:
|
|
|
|
||||||||
|
Federal
|
$
|
(555
|
)
|
$
|
227
|
|
$
|
551
|
|
||
|
State
|
(273
|
)
|
587
|
|
(21
|
)
|
|||||
|
Foreign
|
139
|
|
322
|
|
220
|
|
|||||
|
Total
|
(689
|
)
|
1,136
|
|
750
|
|
|||||
|
Deferred:
|
|
|
|
|
|
|
|||||
|
Federal
|
(23,245
|
)
|
(4,114
|
)
|
(1,819
|
)
|
|||||
|
State
|
(10,684
|
)
|
(866
|
)
|
8
|
|
|||||
|
Foreign
|
117
|
|
(342
|
)
|
267
|
|
|||||
|
Total
|
(33,812
|
)
|
(5,322
|
)
|
(1,544
|
)
|
|||||
|
Total income tax benefit
|
$
|
(34,501
|
)
|
$
|
(4,186
|
)
|
$
|
(794
|
)
|
||
Deferred income taxes reflect the net tax effect of temporary differences between the carrying amount of assets and liabilities for financial reporting purposes and the amounts used for income tax purposes.
F- 35
CROSS COUNTRY HEALTHCARE, INC.
NOTES TO CONSOLIDATED FINANCIAL STATEMENTS
DECEMBER 31, 2017
13. Income Taxes (continued)
Significant components of the Company’s deferred tax assets and liabilities are as follows:
|
|
December 31,
|
||||||
|
|
2017
|
2016
|
|||||
|
(amounts in thousands)
|
|||||||
|
Deferred Tax Assets:
|
|||||||
|
Accrued other and prepaid expenses
|
$
|
2,955
|
|
$
|
3,494
|
|
|
|
Allowance for doubtful accounts
|
624
|
|
704
|
|
|||
|
Intangible Assets
|
7,776
|
|
10,725
|
|
|||
|
Net operating loss carryforwards
|
14,718
|
|
17,228
|
|
|||
|
Derivative interest
|
—
|
|
7,940
|
|
|||
|
Accrued professional liability claims
|
1,709
|
|
2,632
|
|
|||
|
Accrued workers’ compensation claims
|
2,512
|
|
3,439
|
|
|||
|
Share-based compensation
|
734
|
|
—
|
|
|||
|
Credit carryforwards
|
189
|
|
1,055
|
|
|||
|
Other
|
444
|
|
584
|
|
|||
|
Gross deferred tax assets
|
31,661
|
|
47,801
|
|
|||
|
Valuation allowance
|
(1,076
|
)
|
(46,454
|
)
|
|||
|
|
30,585
|
|
1,347
|
|
|||
|
Deferred Tax Liabilities:
|
|||||||
|
Depreciation
|
(41
|
)
|
(70
|
)
|
|||
|
Indefinite intangibles
|
(9,964
|
)
|
(13,971
|
)
|
|||
|
Tax on unrepatriated earnings
|
(466
|
)
|
(263
|
)
|
|||
|
Share-based compensation
|
—
|
|
(197
|
)
|
|||
|
|
(10,471
|
)
|
(14,501
|
)
|
|||
|
Net deferred taxes
|
$
|
20,114
|
|
$
|
(13,154
|
)
|
|
As of December 31, 2016 the Company had a valuation allowance on its deferred tax assets, exclusive of indefinite-lived intangible deferred tax liabilities, of
$46.5 million
resulting from a prior history of losses from its operations. As of December 31, 2016, the Company determined that it could not sustain a conclusion that it was more likely than not that it would realize any of its deferred tax assets resulting from recent losses, the difficulty of forecasting future taxable income, and other factors.
For the year ended December 31, 2017, predominantly on the basis of a reassessment of the amount of its deferred tax assets that are more likely than not to be realized, the Company reduced its valuation allowance by
$45.4 million
(comprised of
$15.7 million
related to U.S. net operating losses,
$4.4 million
related to state net operating losses, and
$25.3 million
related to other net deferred tax assets).
In the reassessment, positive and negative factors were considered to arrive at a conclusion to release the valuation allowance. The primary focus of the analysis emphasized the positive evidence of the Company’s three-year cumulative pre-tax income position and projections of future taxable income which outweighed any negative evidence available. For the twelve quarters ended December 31, 2017, the Company had cumulative pre-tax income adjusted for permanent items of
$27.7 million
. It also has a history of utilizing net operating losses prior to expiration. Further, the five-year forecast of pre-tax book income is expected to exceed future tax deductions. Growing demand for healthcare solutions for the Company’s customers, including a growing aging U.S. population, and its customers’ pressure to keep costs down by using temporary staffing solutions were also positive factors in the analysis. With regard to negative evidence, there are no material taxable temporary differences to offset deductible temporary differences and no net operating losses available for carryback. Additionally, no tax planning strategies that would impact the valuation allowance analysis have been considered.
F- 36
CROSS COUNTRY HEALTHCARE, INC.
NOTES TO CONSOLIDATED FINANCIAL STATEMENTS
DECEMBER 31, 2017
13. Income Taxes (continued)
The valuation allowance on a portion of state net operating losses not more likely than not realizable was not released after analysis of respective expiration periods and specific state taxable income projections. As of December 31, 2017, a valuation allowance of
$1.1 million
remained.
On December 22, 2017, the 2017 Tax Act was signed into legislation which, among other changes, reduced the corporate federal income tax rate from
35%
to
21%
effective for the Company's year ended December 31, 2018. Because a change in tax law is accounted for in the period of enactment, the Company recorded income tax expense of
$8.0 million
, primarily due to a re-measurement of deferred tax assets and liabilities. The impact of the Global Intangible Low-Taxed Income provision, the transition tax on the deemed repatriation of deferred foreign income, and any future tax impact associated with basis differences on foreign subsidiaries is expected to be immaterial. The 2017 Tax Act is a comprehensive bill containing other provisions, such as limitations on the deductibility of interest expense and certain executive compensation, that are not expected to materially affect the Company.
The Securities and Exchange Commission (SEC) staff issued Staff Accounting Bulletin No. 118 (SAB 118), which provides guidance on accounting for the tax effects of the 2017 Tax Act. SAB 118 provides a measurement period that should not extend beyond one year from the enactment date for companies to complete the accounting required under the
Income Taxes
Topic of the FASB ASC. In accordance with SAB 118, a company must reflect the income tax effects of those aspects of the 2017 Tax Act for which the accounting under the
Income Taxes
Topic of the FASB ASC is complete. To the extent that a company's accounting for certain income tax effects is incomplete but it is able to determine a reasonable estimate, it must record a provisional estimate in its financial statements. If a company cannot determine a provisional estimate to be included in its financial statements, it should continue to apply the
Income Taxes
Topic of the FASB ASC on the basis of the provisions of the tax laws that were in effect immediately before the enactment. The ultimate impact of the 2017 Tax Act in the Company's financial statements is provisional with regard to certain foreign tax provisions and may differ from its estimates due to changes in the interpretations and assumptions made by the Company as well as additional regulatory guidance that may be issued.
As of
December 31, 2017
and
2016
, respectively, the Company had approximately
$166.1 million
and
$161.1 million
of federal, state, and foreign net operating loss carryforwards. The carryforwards will expire as follows: federal between
2032
and
2037
, state between
2018
and
2037
, and foreign between
2019
and
2022
.
The reconciliation of income tax computed at the U. S. federal statutory rate to income tax benefit is as follows:
|
|
Year Ended December 31,
|
||||||||||
|
|
2017
|
2016
|
2015
|
||||||||
|
(amounts in thousands)
|
|||||||||||
|
Tax at U.S. statutory rate
|
$
|
1,506
|
|
$
|
1,591
|
|
$
|
1,456
|
|
||
|
State taxes, net of federal benefit
|
(1,374
|
)
|
344
|
|
(13
|
)
|
|||||
|
Noncontrolling interest
|
(455
|
)
|
(260
|
)
|
—
|
|
|||||
|
Non-deductible meals and entertainment
|
2,676
|
|
1,546
|
|
1,510
|
|
|||||
|
Foreign tax expense
|
175
|
|
(5
|
)
|
(6
|
)
|
|||||
|
Valuation allowances
|
(45,354
|
)
|
(8,379
|
)
|
(5,078
|
)
|
|||||
|
Uncertain tax positions
|
1,145
|
|
1,090
|
|
917
|
|
|||||
|
Federal rate change
|
8,011
|
|
—
|
|
—
|
|
|||||
|
Other
|
(831
|
)
|
(113
|
)
|
420
|
|
|||||
|
Total income tax benefit
|
$
|
(34,501
|
)
|
$
|
(4,186
|
)
|
$
|
(794
|
)
|
||
The tax years of 2008 and 2010 through 2016 remain open to examination by certain taxing jurisdictions to which the Company is subject to tax. During 2017, the Company accrued
$0.1 million
of India tax on earnings of approximately
$0.5 million
. India withholding taxes on a dividend of India earnings are not affected by the calculation of U.S. taxes due and continue to be accrued.
F- 37
CROSS COUNTRY HEALTHCARE, INC.
NOTES TO CONSOLIDATED FINANCIAL STATEMENTS
DECEMBER 31, 2017
13. Income Taxes (continued)
A reconciliation of the beginning and ending amounts of unrecognized tax benefits is approximately as follows:
|
|
2017
|
2016
|
2015
|
||||||||
|
(amounts in thousands)
|
|||||||||||
|
Balance at January 1
|
$
|
5,180
|
|
$
|
4,071
|
|
$
|
3,777
|
|
||
|
Additions based on tax positions related to the current year
|
1,145
|
|
1,054
|
|
861
|
|
|||||
|
Additions based on tax positions related to prior years
|
—
|
|
55
|
|
62
|
|
|||||
|
Reductions based on settlements of tax positions related to prior years
|
(439
|
)
|
—
|
|
(624
|
)
|
|||||
|
2017 Tax Act federal tax rate change
|
(1,859
|
)
|
—
|
|
—
|
|
|||||
|
Other
|
(220
|
)
|
—
|
|
(5
|
)
|
|||||
|
Balance at December 31
|
$
|
3,807
|
|
$
|
5,180
|
|
$
|
4,071
|
|
||
Short-term unrecognized tax benefits are included in other current liabilities on the consolidated balance sheets and were
$0.1
million as of
December 31, 2017
,
2016
, and 2015. Long-term unrecognized tax benefits are included in other long-term liabilities on the consolidated balance sheets and were
$0.5 million
,
$0.9 million
, and
$0.8 million
as of
December 31, 2017
,
2016
, and 2015, respectively. See Note 7 - Balance Sheet Details. As of
December 31, 2017
,
2016
, and 2015, the Company had unrecognized tax benefits, which would affect the effective tax rate if recognized, of
$4.0 million
,
$4.9
million, and
$3.8 million
, respectively. During
2017
, the Company had gross increases of
$1.1 million
to its current year unrecognized tax benefits, related to federal and state tax positions as well as
$0.2 million
in gross decreases related to statute expirations.
The Company recognizes interest and penalties related to unrecognized tax benefits in the provision for income taxes. During the years ended
December 31, 2017
and 2015, the Company recognized a net decrease in interest and penalties of
$0.2 million
related to statute expirations. During the year ended
December 31, 2016
, the Company recognized an increase in interest and penalties of
$0.1
million. The Company has accrued
$0.2
million,
$0.5
million, and
$0.4 million
for the payment of interest and penalties at
December 31, 2017
,
2016
, and 2015, respectively.
14. Stockholders’ Equity
Stock Repurchase Programs
In February 2008, the Company’s Board of Directors authorized its most recent stock repurchase program whereby the Company may purchase up to
1,500,000
shares of its common stock, subject to terms of the Company’s credit agreement. The shares may be repurchased from time-to-time in the open market and the repurchase program may be discontinued at any time at the Company’s discretion.
During the years ended
December 31, 2017
,
2016
, and
2015
, the Company did not repurchase any shares of its Common Stock under its February 2008 Board authorization.
As of
December 31, 2017
, the Company may purchase up to an additional
942,443
shares of Common Stock under the February 2008 Board authorization, subject to certain conditions in the Company's Amended and Restated Credit Agreement. The Company may repurchase up to an aggregate amount not to exceed
$5.0
million in any fiscal year, or an unlimited amount if the Company meets certain conditions as described in its Amended and Restated Credit Agreement.
Shares Issued
The Company issued
3,175,584
shares to its prior Convertible Notes noteholders. See Note 8 - Debt.
Share-Based Payments
2014 Omnibus Incentive Plan
The Company's 2014 Omnibus Incentive Plan (2014 Plan) provides for the issuance of stock options, stock appreciation rights, restricted stock, performance shares, and performance-based cash awards that may be granted with the intent to comply with
F- 38
CROSS COUNTRY HEALTHCARE, INC.
NOTES TO CONSOLIDATED FINANCIAL STATEMENTS
DECEMBER 31, 2017
14. Stockholders' Equity (continued)
the “performance-based compensation” exception under Section 162(m) of the Internal Revenue Code, and other stock-based awards, all as defined by the 2014 Plan, to eligible employees, consultants and non-employee Directors. On May 23, 2017, the Company's shareholders approved an amendment and restatement of its 2014 Plan which, among others, included the following modifications: (i) a
2,000,000
share increase of the aggregate share reserve to
6,100,000
shares, (2) extension of the 2014 Plan until May 23, 2027, and (3) re-approval of the Section 162(m) performance goals so that certain incentive awards granted to certain executive officers of the Company may qualify as exempt performance-based compensation.
Under the 2014 Plan, the Compensation Committee of the Company’s Board of Directors (the Committee), has the discretion to determine the terms of the awards at the time of the grant provided, however, that in the case of stock options and stock appreciation rights (share options): 1) the exercise price per share of the award is not less than
100%
(or, in the case of
10%
or more stockholders, the exercise price of the incentive stock options (ISOs) granted may not be less than
110%
) of the fair market value of the common stock at the time of the grant; and 2) the term of the award will be no more than
10
years after the date the option is granted (or, shall not exceed
five
years, in the case of a
10%
or more stockholder). In the case of restricted stock, the purchase price may be zero to the extent permitted by applicable law.
Restricted stock awards granted under the Company’s 2014 Plan entitle the holder to receive, at the end of a vesting period, a specified number of shares of the Company’s common stock. Share-based compensation expense is measured by the market value of the Company’s stock on the date of grant. The shares vest ratably over a
three
year period ending on the anniversary date of the grant, and vesting is subject to the employee's continuing employment. There is no partial vesting and any unvested portion is forfeited. Pursuant to the 2014 Plan, the number of target shares that are issued for performance-based stock awards are determined based on the level of attainment of the targets.
The following table summarizes restricted stock awards and performance stock awards activity issued under the 2014 Plan for the year ended
December 31, 2017
:
|
Restricted Stock Awards
|
Performance Stock Awards
|
||||||||||||
|
|
Number of
Shares |
Weighted
Average Grant Date Fair Value |
Number of Target
Shares |
Weighted
Average Grant Date Fair Value |
|||||||||
|
Unvested restricted stock awards, January 1, 2017
|
532,294
|
|
$
|
9.98
|
|
332,092
|
|
$
|
11.73
|
|
|||
|
Granted
|
323,503
|
|
$
|
13.70
|
|
181,067
|
|
$
|
14.36
|
|
|||
|
Vested
|
(292,615
|
)
|
$
|
8.64
|
|
(124,568
|
)
|
$
|
11.86
|
|
|||
|
Forfeited
|
(47,581
|
)
|
$
|
10.41
|
|
(131,016
|
)
|
$
|
11.78
|
|
|||
|
Unvested restricted stock awards, December 31, 2017
|
515,601
|
|
$
|
13.03
|
|
257,575
|
|
$
|
13.49
|
|
|||
If the minimum level of performance is attained for the
2017
awards, restricted stock will be issued with a vesting date of March 31, 2020, subject to the employee’s continuing employment. During the first quarter of
2017
, the Company's Compensation Committee of the Board of Directors approved a
48%
level of attainment for the
2016
performance-based share awards, resulting in the issuance of
86,784
performance shares that will vest on December 31, 2018.
As of
December 31, 2017
, the Company had approximately
$4.6 million
pre-tax of total unrecognized compensation cost related to non-vested restricted stock awards which may be adjusted for future changes in forfeitures. The Company expects to recognize such cost over a weighted average period of
1.97 years
. The fair value of shares vested was approximately
$3.7
million,
$4.3 million
, and
$3.9 million
for the years ended
December 31, 2017
,
2016
, and
2015
, respectively.
As of
December 31, 2017
, the Company had approximately
$2.2
million pre-tax of total unrecognized compensation cost related to performance stock awards which may be adjusted for future changes in forfeitures. The Company expects to recognize such cost over a weighted average period of
2.05 years
, the remaining service period. The fair value of shares vested was approximately
$1.6 million
for the year ended
December 31, 2017
and
$1.2 million
for the year ended
December 31, 2016
, the first year these awards began to vest.
F- 39
CROSS COUNTRY HEALTHCARE, INC.
NOTES TO CONSOLIDATED FINANCIAL STATEMENTS
DECEMBER 31, 2017
14. Stockholders' Equity (continued)
During the years ended
December 31, 2017
,
2016
, and
2015
, the Company did not issue stock options or stock appreciation rights. The following table represents information about stock options and stock appreciation rights exercised in each year.
|
|
Year Ended December 31,
|
||||||||||
|
|
2017
|
2016
|
2015
|
||||||||
|
(amounts in thousands)
|
|||||||||||
|
Total intrinsic value of options exercised
|
$
|
516
|
|
$
|
1,323
|
|
$
|
1,610
|
|
||
The stock appreciation rights can only be settled with stock or cash, at the discretion of the Committee. The stock appreciation rights vest
25%
per year over a
4
year period and expire after
7
years. The Company’s policy is to issue new shares from its authorized but unissued balance of common stock outstanding or shares of common stock reacquired by the Company if stock appreciation rights are settled with stock.
The Company recorded compensation expense for stock options based on the estimated fair value of the options on the date of grant using the Black-Scholes option-pricing model. Due to the adoption of the 2014 Plan (previously titled the 2007 Stock Incentive Plan), no further grants have been issued under the Company’s 1999 Plans referred to below.
1999 Stock Option Plan and Equity Participation Plan
On December 16, 1999, the Company’s Board of Directors approved the 1999 Stock Option Plan and Equity Participation Plan (collectively, the 1999 Plans), which was amended and restated on October 25, 2001 and provided for the issuance of ISOs and non-qualified stock options to eligible employees and non-employee directors for the purchase of up to
4,398,001
shares of common stock.
The following table summarizes the Company’s activities with respect to all of its share option plans (issued under the 2014 Plan and the 1999 Plan) for the year ended
December 31, 2017
:
|
Number of Shares
|
Option Price
|
Weighted
Average Exercise Price |
Weighted-
Average Remaining Contractual Life (in years) |
Aggregate
Intrinsic Value (amounts in thousands) |
||||||||
|
Share options outstanding, January 1, 2017
|
188,213
|
|
$4.16-$22.50
|
$5.72
|
|
|
||||||
|
Granted
|
—
|
|
—
|
—
|
|
|
||||||
|
Exercised
|
(74,625
|
)
|
$4.35-$8.09
|
$5.71
|
|
|
||||||
|
Forfeited/expired
|
(19,088
|
)
|
$5.21-$22.50
|
$8.43
|
|
|
||||||
|
Share options outstanding and exercisable, December 31, 2017
|
94,500
|
|
$4.16-$7.44
|
$5.19
|
1.85
|
$
|
716
|
|
||||
As of
December 31, 2017
, the Company had
94,500
share options outstanding, all of which were vested at a weighted average exercise price of
$5.19
, intrinsic value of
$0.7
million, and a weighted average contractual life of
1.85
years.
F- 40
CROSS COUNTRY HEALTHCARE, INC.
NOTES TO CONSOLIDATED FINANCIAL STATEMENTS
DECEMBER 31, 2017
15. Earnings Per Share
The following table sets forth the components of the numerator and denominator for the computation of the basic and diluted earnings per share:
|
|
Year Ended December 31,
|
||||||||||
|
|
2017
|
2016
|
2015
|
||||||||
|
(amounts in thousands, except per share data)
|
|||||||||||
|
Numerator:
|
|||||||||||
|
Net income attributable to common shareholders - Basic
|
$
|
37,513
|
|
$
|
7,967
|
|
$
|
4,418
|
|
||
|
Interest on Convertible Notes
|
694
|
|
3,383
|
|
*
|
|
|||||
|
Gain on derivative liability
|
(1,581
|
)
|
(5,805
|
)
|
*
|
|
|||||
|
Net income attributable to common shareholders - Diluted
|
$
|
36,626
|
|
$
|
5,545
|
|
$
|
4,418
|
|
||
|
Denominator:
|
|||||||||||
|
Weighted average common shares - Basic
|
35,018
|
|
32,132
|
|
31,514
|
|
|||||
|
Effective of diluted shares:
|
|||||||||||
|
Share-based awards
|
425
|
|
593
|
|
648
|
|
|||||
|
Convertible Notes
|
723
|
|
3,521
|
|
—
|
|
|||||
|
Weighted average common shares - Diluted
|
36,166
|
|
36,246
|
|
32,162
|
|
|||||
|
Net income per share attributable to common shareholders - Basic
|
$
|
1.07
|
|
$
|
0.25
|
|
$
|
0.14
|
|
||
|
Net income per share attributable to common shareholders - Diluted
|
$
|
1.01
|
|
$
|
0.15
|
|
$
|
0.14
|
|
||
* For the year
2015
, the Convertible Notes would have been anti-dilutive if converted at the beginning of the period and therefore, amounts are not applicable.
For the years 2017, 2016, and 2015, no tax benefits were assumed in the weighted average share calculation due to the Company's net operating loss position.
The following table represents the securities that could potentially dilute net income per share attributable to common shareholders in the future that were not included in the computation of diluted net income per share attributable to common shareholders because to do so would have been anti-dilutive for the periods presented.
|
Year Ended December 31,
|
||||||||
|
2017
|
2016
|
2015
|
||||||
|
(amounts in thousands)
|
||||||||
|
Convertible notes and share-based awards
|
118
|
|
—
|
|
3,521
|
|
||
16. Related Party Transactions
The Company provides services to hospitals which are affiliated with certain members of the Company’s Board of Directors. Management believes services with related parties were conducted on terms equivalent to those prevailing in an arm's-length transaction. Revenue related to these transactions was
$4.9 million
,
$5.0 million
, and
$11.8
million in
2017
,
2016
, and
2015
, respectively. Accounts receivable due from these hospitals at
December 31, 2017
and
2016
were approximately
$0.4 million
and
$1.0 million
, respectively.
In connection with the acquisition of MSN, the Company acquired a
68%
ownership interest in Cross Country Talent Acquisition Group, LLC (formerly InteliStaf of Oklahoma, LLC), a joint venture between the Company and a hospital system. The Company generated revenue providing staffing services to the hospital system of
$17.9 million
,
$12.6 million
, and
$10.0
F- 41
CROSS COUNTRY HEALTHCARE, INC.
NOTES TO CONSOLIDATED FINANCIAL STATEMENTS
DECEMBER 31, 2017
16. Related Party Transactions (continued)
million
in 2017, 2016, and 2015, respectively. At
December 31, 2017
and 2016, the Company had a receivable balance of
$0.8 million
and
$1.5 million
, respectively, and a payable balance of
$0.3 million
and
$0.2 million
, respectively.
Subsequent to the Company's acquisition of Mediscan on October 30, 2015, Mediscan continued to operate at premises owned, in part, by the founding members of Mediscan. The Company paid
$0.4 million
for rent for these premises in 2017 and 2016 and
$0.1 million
for the two months ended December 31, 2015.
17. Segment Data
In accordance with the
Segment Reporting
Topic of the FASB ASC, the Company reports
three
business segments – Nurse and Allied Staffing, Physician Staffing, and Other Human Capital Management Services. The Company manages and segments its business based on the services it offers to its customers as described below:
|
•
|
Nurse and Allied Staffing -
Nurse and Allied Staffing provides traditional staffing, recruiting, and value-added workforce solutions including: temporary and permanent placement of travel and local branch-based nurse and allied professionals, MSP services, education healthcare services, and outsourcing services. Its clients include: public and private acute care and non-acute care hospitals, government facilities, public schools and charter schools, outpatient clinics, ambulatory care facilities, physician practice groups, retailers, and many other healthcare providers throughout the U.S. Substantially all of the results of the Advantage acquisition have been aggregated with the Company's Nurse and Allied Staffing business segment. See Note 3 - Acquisitions.
|
|
•
|
Physician Staffing -
Physician Staffing provides physicians in many specialties, certified registered nurse anesthetists (CRNAs), nurse practitioners (NPs), and physician assistants (PAs) as independent contractors on temporary assignments throughout the U.S. at various healthcare facilities, such as acute and non-acute care facilities, medical group practices, government facilities, and managed care organizations. Less than
2%
of the business related to the Advantage acquisition is managed by, and included in, the Physician Staffing business segment.
|
|
•
|
Other Human Capital Management Services -
Other Human Capital Management Services includes retained and contingent search services for physicians, healthcare executives, and other healthcare professionals within the U.S.
|
The Company’s management evaluates performance of each segment primarily based on revenue and contribution income. The Company defines contribution income as income or loss from operations before depreciation and amortization, loss on sale of business, acquisition and integration costs, acquisition-related contingent consideration, restructuring costs, impairment charges, and corporate expenses not specifically identified to a reporting segment. Contribution income is a financial measure used by management when assessing segment performance and is provided in accordance with the
Segment Reporting
Topic of the FASB ASC. The Company’s management does not evaluate, manage, or measure performance of segments using asset information; accordingly, total asset information by segment is not prepared or disclosed. The information in the following table is derived from the segments’ internal financial information as used for corporate management purposes. Certain corporate expenses are not allocated to and/or among the operating segments.
F- 42
CROSS COUNTRY HEALTHCARE, INC.
NOTES TO CONSOLIDATED FINANCIAL STATEMENTS
DECEMBER 31, 2017
17. Segment Data (continued)
Information on operating segments and a reconciliation to income from operations for the periods indicated are as follows:
|
|
Year Ended December 31,
|
||||||||||
|
|
2017
|
2016
|
2015
|
||||||||
|
(amounts in thousands)
|
|||||||||||
|
Revenues:
|
|
|
|
||||||||
|
Nurse and Allied Staffing
|
$
|
758,267
|
|
$
|
721,486
|
|
$
|
621,258
|
|
||
|
Physician Staffing
|
93,610
|
|
98,283
|
|
115,336
|
|
|||||
|
Other Human Capital Management Services
|
13,171
|
|
13,768
|
|
30,827
|
|
|||||
|
|
$
|
865,048
|
|
$
|
833,537
|
|
$
|
767,421
|
|
||
|
Contribution income:
|
|
|
|
|
|
|
|||||
|
Nurse and Allied Staffing
|
$
|
73,614
|
|
$
|
71,992
|
|
$
|
55,718
|
|
||
|
Physician Staffing
|
5,256
|
|
8,265
|
|
10,213
|
|
|||||
|
Other Human Capital Management Services
|
(357
|
)
|
(535
|
)
|
1,863
|
|
|||||
|
|
78,513
|
|
79,722
|
|
67,794
|
|
|||||
|
Unallocated corporate overhead (a)
|
39,190
|
|
38,400
|
|
32,703
|
|
|||||
|
Depreciation and amortization
|
10,174
|
|
9,182
|
|
8,066
|
|
|||||
|
Loss on sale of business (b)
|
—
|
|
—
|
|
2,184
|
|
|||||
|
Acquisition and integration costs
|
1,975
|
|
78
|
|
902
|
|
|||||
|
Acquisition-related contingent consideration
|
44
|
|
814
|
|
—
|
|
|||||
|
Restructuring costs
|
1,026
|
|
753
|
|
1,274
|
|
|||||
|
Impairment charges (c)
|
14,356
|
|
24,311
|
|
2,100
|
|
|||||
|
Income from operations
|
$
|
11,748
|
|
$
|
6,184
|
|
$
|
20,565
|
|
||
_______________
|
(a)
|
The Company has been centralizing administrative functions to gain efficiencies, which have been recorded in unallocated corporate overhead.
|
|
(b)
|
On August 31, 2015, the Company completed the sale of CCE, and recognized a pre-tax loss of
$2.2 million
related to the divestiture of the business. See Note 4 - Disposal.
|
|
(c)
|
During the years ended December 31, 2017, 2016, and 2015, the Company recorded non-cash impairment charges of
$14.4 million
,
$24.3 million
, and
$2.1 million
, respectively. See Note 5 - Goodwill, Trade Names, and Other Intangible Assets.
|
F- 43
CROSS COUNTRY HEALTHCARE, INC.
NOTES TO CONSOLIDATED FINANCIAL STATEMENTS
DECEMBER 31, 2017
18. Quarterly Financial Data (Unaudited)
|
|
First
Quarter |
Second
Quarter |
Third
Quarter |
Fourth
Quarter |
|||||||||||
|
2017
|
(amounts in thousands, except per share data)
|
||||||||||||||
|
Revenue from services
|
$
|
207,573
|
|
$
|
209,313
|
|
$
|
228,488
|
|
$
|
219,674
|
|
|||
|
Gross profit (a)
|
53,275
|
|
56,528
|
|
60,480
|
|
58,303
|
|
|||||||
|
Consolidated net (loss) income
|
(1,718
|
)
|
5,220
|
|
7,044
|
|
28,256
|
|
|||||||
|
Net (loss) income attributable to common shareholders
|
(2,010
|
)
|
4,850
|
|
6,723
|
|
27,950
|
|
|||||||
|
Net (loss) income per share attributable to common shareholders - Basic
|
$
|
(0.06
|
)
|
$
|
0.14
|
|
$
|
0.19
|
|
$
|
0.78
|
|
|||
|
Net (loss) income per share attributable to common shareholders - Diluted
|
$
|
(0.08
|
)
|
$
|
0.13
|
|
$
|
0.19
|
|
$
|
0.77
|
|
|||
|
|
First
Quarter |
Second
Quarter |
Third
Quarter |
Fourth
Quarter |
|||||||||||
|
2016
|
(amounts in thousands, except per share data)
|
||||||||||||||
|
Revenue from services
|
$
|
196,583
|
|
$
|
199,443
|
|
$
|
214,988
|
|
$
|
222,523
|
|
|||
|
Gross profit (a)
|
51,046
|
|
54,846
|
|
58,210
|
|
57,633
|
|
|||||||
|
Consolidated net income (loss)
|
19,186
|
|
(17,095
|
)
|
14,289
|
|
(7,649
|
)
|
|||||||
|
Net income (loss) attributable to common shareholders
|
19,022
|
|
(17,237
|
)
|
14,066
|
|
(7,884
|
)
|
|||||||
|
Net income (loss) per share attributable to common shareholders - Basic
|
$
|
0.60
|
|
$
|
(0.54
|
)
|
$
|
0.44
|
|
$
|
(0.24
|
)
|
|||
|
Net income (loss) per share attributable to common shareholders - Diluted
|
$
|
0.09
|
|
$
|
(0.54
|
)
|
$
|
0.22
|
|
$
|
(0.24
|
)
|
|||
________________
(a) Excludes depreciation and amortization.
The following items impact the comparability and presentation of our consolidated data:
|
•
|
The Company recorded changes in the fair value of Convertible Notes derivative liability, recording a gain in the first quarter of 2017 of
$1.6 million
, a gain in the first and third quarters of 2016 of
$16.4 million
and
$7.1 million
, respectively, and a loss in the second and fourth quarters of 2016 of
$3.6 million
and
$14.2 million
, respectively. See Note 9 - Convertible Notes Derivative Liability.
|
|
•
|
During the fourth quarter of 2017 and the second quarter of 2016, the Company recorded non-cash impairment charges of
$14.4 million
and
$24.3 million
, respectively. See Note 5 - Goodwill, Trade Names, and Other Intangible Assets.
|
|
•
|
During the first quarter of 2017, the Company settled its Convertible Notes and recognized a loss on extinguishment of debt of
$5.0 million
. During the second quarter of 2016, the Company repaid its Second Lien Term Loan and recognized a loss on extinguishment of debt of
$1.6 million
. See Note 8 - Debt.
|
|
•
|
On July 1, 2017, the Company acquired all of the assets of Advantage. The acquisition has been accounted for in accordance with the
Business Combinations
Topic of the FASB ASC
,
using the acquisition method. The results of the acquisition's operations have been included in the consolidated statements of operations from its date of acquisition. See Note 3 - Acquisitions.
|
|
•
|
In 2017 and 2016, the Company recorded acquisition-related contingent consideration expense primarily related to the Mediscan and USR acquisitions, recording expense of
$0.3 million
in the first and second quarters of 2017, a credit of
$0.6 million
in the third quarter of 2017, and expense of
$0.1 million
in the fourth quarter of 2017, and
|
F- 44
CROSS COUNTRY HEALTHCARE, INC.
NOTES TO CONSOLIDATED FINANCIAL STATEMENTS
DECEMBER 31, 2017
18. Quarterly Financial Data (Unaudited) (continued)
expense of
$0.3 million
in the first quarter of 2016,
$0.2 million
in the second and third quarters of 2016, and
$0.1 million
in the fourth quarter of 2016. See Note 3 - Acquisitions and Note 10 - Fair Value Measurements.
|
•
|
In the third and fourth quarters of 2017, the Company recorded restructuring costs of
$0.7 million
and
$0.3 million
, respectively, primarily related to a cost saving initiative, and in the third and fourth quarters of 2016,
$0.6 million
and
$0.2 million
, respectively, primarily related to the centralization of corporate functions. See Note 2 - Summary of Significant Accounting Policies.
|
|
•
|
In the fourth quarter of 2017, the Company benefited from a
$43.3 million
reversal of valuation allowance on its net deferred tax assets, offset by additional income tax expense of
$8.0 million
related to the remeasurement of its deferred tax assets as a result of the 2017 Tax Act. See Note 13 - Income Taxes.
|
F- 45
Schedule II
CROSS COUNTRY HEALTHCARE, INC.
VALUATION AND QUALIFYING ACCOUNTS
FOR THE YEARS ENDED DECEMBER 31, 2017, 2016, AND 2015
|
Balance at
Beginning of Period |
Charged to Operations
|
|
Write-Offs
|
Recoveries
|
Other
Changes |
|
Balance at
End of Period |
||||||||||||||||
|
(amounts in thousands)
|
|||||||||||||||||||||||
|
Allowances for Accounts Receivable
|
|||||||||||||||||||||||
|
Year Ended December 31, 2017
|
$
|
3,245
|
|
$
|
4,705
|
|
|
$
|
(4,804
|
)
|
$
|
542
|
|
$
|
—
|
|
|
$
|
3,688
|
|
|||
|
Year Ended December 31, 2016
|
$
|
4,045
|
|
$
|
4,034
|
|
|
$
|
(5,149
|
)
|
$
|
315
|
|
$
|
—
|
|
$
|
3,245
|
|
||||
|
Year Ended December 31, 2015
|
$
|
1,425
|
|
$
|
2,414
|
|
|
$
|
(923
|
)
|
$
|
1,129
|
|
$
|
—
|
|
$
|
4,045
|
|
||||
|
Valuation Allowance for Deferred Tax Assets
|
|
|
|
|
|
|
|
|
|
|
|
|
|
|
|||||||||
|
Year Ended December 31, 2017
|
$
|
46,454
|
|
$
|
(3,007
|
)
|
|
$
|
(43,333
|
)
|
(a)
|
$
|
—
|
|
$
|
962
|
|
(c)
|
$
|
1,076
|
|
||
|
Year Ended December 31, 2016
|
$
|
55,336
|
|
$
|
(8,894
|
)
|
|
$
|
—
|
|
$
|
—
|
|
$
|
12
|
|
|
$
|
46,454
|
|
|||
|
Year Ended December 31, 2015
|
$
|
63,616
|
|
$
|
(7,518
|
)
|
(b)
|
$
|
—
|
|
$
|
—
|
|
$
|
(762
|
)
|
(c)
|
$
|
55,336
|
|
|||
________________
|
(a)
|
Release of valuation allowances on the Company’s deferred tax assets.
|
|
(b)
|
Includes a reversal of valuation allowance related to CCE.
|
|
(c)
|
Valuation allowance on deferred tax asset related to share-based compensation.
|
II- 1
TABLE OF CONTENTS
Part IItem 1. BusinessItem 1A. Risk FactorsItem 1B. Unresolved Staff CommentsItem 2. PropertiesItem 3. Legal ProceedingsItem 4. Mine Safety DisclosuresPart IIItem 5. Market For Registrant's Common Equity, Related Stockholder Matters and Issuer Purchases Of EquityItem 6. Selected Financial DataItem 7. Management's Discussion and Analysis Of Financial Condition and Results Of OperationsItem 7A. Quantitative and Qualitative Disclosures About Market RiskItem 8. Financial Statements and Supplementary DataItem 9. Changes in and Disagreements with Accountants on Accounting and Financial DisclosureItem 9A. Controls and ProceduresItem 9B. Other InformationPart IIIItem 10. Directors, Executive Officers and Corporate GovernanceItem 11. Executive CompensationItem 12. Security Ownership Of Certain Beneficial Owners and Management and Related Stockholders MattersItem 13. Certain Relationships and Related Transactions, and Director IndependenceItem 14. Principal Accountant Fees and ServicesPart IVItem 15. Exhibits, Financial Statement Schedules