COEUR MINING, INC.
10-Ks and 10-Qs
|
|
|
|
|
|
|
|
|
|
|
|
|
|
|
|
|
|
|
|
|
|
|
|
|
|
|
|
|
|
|
|
|
|
|
|
|
|
|
|
|
|
|
|
|
|
|
|
|
|
|
|
|
|
|
|
|
|
|
UNITED STATES SECURITIES AND EXCHANGE COMMISSION
Washington, D.C. 20549
Form 10-K
|
(Mark One)
|
|
|
x
|
ANNUAL REPORT PURSUANT TO SECTION 13 OR 15(d) OF THE SECURITIES EXCHANGE ACT OF 1934
|
|
|
For the fiscal year ended December 31, 2012
|
|
OR
|
|
|
o
|
TRANSITION REPORT PURSUANT TO SECTION 13 OR 15(d) OF THE SECURITIES EXCHANGE ACT OF 1934
|
|
|
For the transition period from to
|
Commission File Number 1-8641
COEUR D’ALENE MINES CORPORATION
(Exact name of registrant as specified in its charter)
|
Idaho
|
82-0109423
|
|
(State or other jurisdiction of
incorporation or organization)
|
(I.R.S. Employer
Identification No.)
|
|
505 Front Ave., P. O. Box “I”
Coeur d’Alene, Idaho
(Address of principal executive offices)
|
83816
(Zip Code)
|
Registrant’s telephone number, including area code: (208) 667-3511
Securities Registered pursuant to Section 12(b) of the Act:
|
Title of each class
|
|
Name of each exchange on which registered
|
|
Common Stock, par value $0.01 per share
|
|
New York Stock Exchange/Toronto Stock Exchange
|
Securities registered pursuant to Section 12(g) of the Act: None
Indicate by check mark if the registrant is a well-known seasoned issuer as defined in Rule 405 of the Securities Act. Yes
¨
No
x
Indicate by check mark if the registrant is not required to file reports pursuant to Section 13 or Section 15(d) of the Act. Yes
¨
No
x
Indicate by check mark whether the registrant (1) has filed all reports required to be filed by Section 13 or 15(d) of the Securities Exchange Act of 1934 during the preceding 12 months (or for such shorter period that the registrant was required to file such reports), and (2) has been subject to such filing requirements for the past 90 days. Yes
x
No
¨
Indicate by check mark whether the registrant has submitted electronically and posted on its corporate Web site, if any, every Interactive Data File required to be submitted and posted pursuant to Rule 405 of Regulation S-T (§ 232.405 of this chapter) during the preceding 12 months (or for such shorter period that the registrant was required to submit and post such files). Yes
x
No
¨
Indicate by check mark if disclosure of delinquent filers pursuant to Item 405 of Regulation S-K (§ 229.405) is not contained herein, and will not be contained, to the best of registrant’s knowledge, in definitive proxy or information statements incorporated by reference in Part III of this Form 10-K or any amendment to this Form 10-K.
¨
Indicate by check mark whether the registrant is a large accelerated filer, an accelerated filer, a non-accelerated filer, or a smaller reporting company. See the definitions of “large accelerated filer,” “accelerated filer” and “smaller reporting company” in Rule 12b-2 of the Exchange Act. (Check one):
|
Large accelerated filer
x
|
Accelerated filer
o
|
Non-accelerated filer
o
(Do not check if a smaller reporting company)
|
Smaller reporting company
o
|
Indicate by check mark whether the registrant is a shell company (as defined in Rule 12b-2 of the Exchange Act). Yes
¨
No
x
State the aggregate market value of the voting and non-voting common equity held by non-affiliates computed by reference to the price at which the common equity was last sold, or the average bid and asked price of such common equity, as of the last business day of the registrant’s most recently completed second fiscal quarter.
$1,573,890,754
Indicate the number of shares outstanding of each of the registrant’s classes of common stock, as of the latest practicable date.
As of February 20, 2013, 90,434,354 shares of Common Stock, Par Value $0.01
DOCUMENTS INCORPORATED BY REFERENCE
Certain information called for by Part III of the Form 10-K is incorporated by reference from the registrant’s definitive proxy statement for the 2013 Annual Meeting of Shareholders which will be filed pursuant to Regulation 14A not later than 120 days after the end of the fiscal year covered by this report.
COEUR D’ALENE MINES CORPORATION
INDEX
|
PART I
|
||
|
PART II
|
||
|
PART III
|
||
|
PART IV
|
||
2
|
Item 1.
|
Business
|
INTRODUCTION
Coeur d’Alene Mines Corporation (referred to separately as “Coeur” and referred to along with its subsidiaries as “the Company”) is a large primary silver producer with growing gold production and has assets located in the United States, Mexico, Bolivia, Argentina and Australia. The Palmarejo mine, San Bartolomé mine, Kensington mine, and Rochester mine, each of which is operated by the Company, the Martha mine which ceased active mining operations in September 2012, and the Endeavor mine, which is operated by a non-affiliated party, constituted the Company’s principal sources of mining revenues during
2012
.
OVERVIEW OF MINING PROPERTIES AND INTERESTS
The Company’s most significant operating properties and interests are described below:
|
•
|
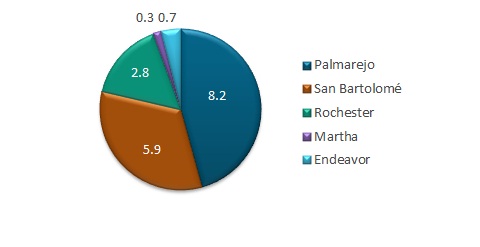
Coeur owns 100% of Coeur Mexicana S.A. de C.V. ("Coeur Mexicana"), which operates the underground and surface Palmarejo silver and gold mine in Mexico. The Palmarejo mine began shipping silver/gold doré in April 2009. Palmarejo produced
8.2
million ounces of silver and
106,038
gold ounces in
2012
. On January 21, 2009, the Company entered into a gold production royalty transaction with Franco-Nevada Corporation under which Franco-Nevada purchased a royalty covering 50% of the life of mine gold to be produced by Coeur from the Palmarejo mine. Royalty payments made beyond the minimum obligation of 400,000 ounces of gold are payable when the market price per ounce of gold is greater than $400.00. The Company controls a large land position around its existing operations.
|
|
•
|
Coeur owns 100% of Empresa Minera Manquiri ("Manquiri") S.A., a Bolivian company that controls the mining rights for the San Bartolomé mine, which is a surface silver mine in Bolivia where Coeur commenced commercial production in June 2008. San Bartolomé produced
5.9
million ounces of silver during
2012
.
|
|
•
|
Coeur owns 100% of Coeur Alaska, Inc., which owns the Kensington mine, an underground gold mine located north of Juneau, Alaska. The Kensington mine began processing ore on June 24, 2010 and began commercial production on July 3, 2010. Kensington produced
82,125
ounces of gold in
2012
.
|
|
•
|
Coeur owns 100% of Coeur Rochester, Inc., which has operated the Rochester mine, a silver and gold surface mining operation located in northwestern Nevada, since 1986. The Company completed construction of a new leach pad and related infrastructure in the fourth quarter of 2011. Rochester produced
2.8
million ounces of silver and
38,066
ounces of gold in
2012
.
|
|
•
|
Coeur owns, directly or indirectly, 100% of Coeur Argentina S.R.L.
,
which owns and operated the underground silver and gold Martha mine located in Santa Cruz, Argentina. Mining operations commenced at the Martha mine in June 2002 and the mine ceased active mining operations in September 2012. The Company recorded an impairment charge of
$5.8
million in the twelve months ended December 31, 2012.
|
|
•
|
In May 2005, the Company acquired, for $44.0 million, all of the silver production and reserves (up to 20.0 million payable ounces) contained at the Endeavor mine in New South Wales, Australia, which is owned and operated by Cobar Operations Pty. Limited, a wholly-owned subsidiary of CBH Resources Ltd. (“CBH”). The Endeavor mine is an underground zinc, lead and silver mine, which has been in production since 1983. Endeavor produced
0.7
million ounces of silver in
2012
.
|
|
•
|
The Joaquin silver and gold development project is located in the Santa Cruz province of southern Argentina. The Company commenced exploration of this large property located north of the Company's Martha silver mine in November 2007. Since that time the Company has defined silver and gold mineralization in two deposits at Joaquin, La Negra and La Morocha, and has recently commenced work on detailed drilling and other technical, economic and environmental programs which it expects will lead to completion of a feasibility study. On December 21, 2012, the Company completed its acquisition of the equity interests of Mirasol Argentina SRL in exchange for a total of approximately
1.3 million
shares of Coeur common stock valued at $30.0 million, a total cash payment of approximately
$30.0 million
and assumption of liabilities of
$0.1 million
. Mirasol Argentina SRL holds the Joaquin silver-gold project in the Santa Cruz province of Argentina. Coeur previously held a
51%
interest in the project. The transaction was accounted for as a purchase of assets and not as a business combination since Joaquin is considered to be in the development stage.
|
|
•
|
In August 2010, the Company sold its subsidiary Compañía Minera Cerro Bayo Ltda. (“Minera Cerro Bayo”), which controlled the Cerro Bayo mine in southern Chile, to Mandalay Resources Corporation (“Mandalay”). Under the terms of the agreement, Coeur received the following from Mandalay in exchange for all of the outstanding shares of Minera Cerro Bayo: (i) $6.0 million in cash; (ii) 17,857,143 common shares of Mandalay; (iii) 125,000 ounces of silver to be
|
3
delivered in six equal quarterly installments commencing in the third quarter of 2011 which had an estimated fair value of $2.3 million; (iv) a 2.0% Net Smelter Royalty (NSR) on production from Minera Cerro Bayo in excess of a cumulative 50,000 ounces of gold and 5,000,000 ounces of silver which had an estimated fair value of $5.4 million; and (v) existing value added taxes of $3.5 million. As part of the transaction, Mandalay also agreed to pay $6 million of reclamation costs associated with Minera Cerro Bayo’s nearby Furioso property. Any reclamation costs above that amount will be shared equally by Mandalay and Coeur. As a result of the sale, the Company realized a loss on the sale of approximately $2.1 million, net of income taxes. Results for the Cerro Bayo mine for the period prior to the sale are reflected in discontinued operations.
Coeur also has interests in other properties that are subject to silver or gold exploration activities upon which no minable ore reserves have yet been delineated.
SILVER AND GOLD PRICES
The Company’s operating results are substantially dependent upon the world market prices of silver and gold. The Company has no control over silver and gold prices, which can fluctuate widely. The volatility of such prices is illustrated by the following table, which sets forth the high and low prices of silver (as reported by Handy and Harman) and gold (PM fixing price as reported by the London Gold Market Fixing Limited) per ounce during the periods indicated:
|
|
Year Ended December 31,
|
||||||||||||||||||||||
|
|
2012
|
2011
|
2010
|
||||||||||||||||||||
|
High
|
|
Low
|
|
High
|
|
Low
|
|
High
|
|
Low
|
|
||||||||||||
|
Silver
|
$
|
36.88
|
|
$
|
26.39
|
|
$
|
48.55
|
|
$
|
26.77
|
|
$
|
30.64
|
|
$
|
14.78
|
|
|||||
|
Gold
|
$
|
1,792
|
|
$
|
1,540
|
|
$
|
1,895
|
|
$
|
1,319
|
|
$
|
1,421
|
|
$
|
1,058
|
|
|||||
MARKETING
All of the Company's mining operations produce silver and gold in doré form except for the Martha mine, which produced a concentrate that contained both silver and gold before mining operations ceased, the Kensington mine, which produces gold concentrate, and the Endeavor mine which produces a concentrate that contains silver.
The Company refines its precious metals doré and concentrates using a geographically diverse group of third party smelters and refiners, including clients located in Switzerland, Australia, Germany, China, and the United States (Valcambi, Nyrstar, Aurubis, China National Gold, Sumitomo, Republic Metals Corporation, and Johnson Matthey).
The Company markets its doré to credit worthy bullion trading houses, market makers and members of the London Bullion Market Association, industrial companies and sound financial institutions. The refined metals are sold to end users for use in electronic circuitry, jewelry, silverware, and the pharmaceutical and technology industries. The Company currently has seven trading counterparties (International Commodities, Mitsui, Mitsubishi, Standard Bank, Valcambi, TD Securities, and Auramet) and the sales of metals to these companies amounted to approximately 91%, 82% and 83% of total metal sales in 2012, 2011 and 2010, respectively. Generally, the loss of a single bullion trading counterparty would not adversely affect the Company due to the liquidity of the markets and the availability of alternative trading counterparties.
Sales of silver and gold concentrates to third party smelters (Nyrstar, Aurubis, Auramet, Sumitomo, and China National Gold) amounted to approximately 9%, 18% and 17% of total metal sales for the years ended December 31, 2012, 2011 and 2010, respectively. The loss of any one smelting and refining client may have a material adverse effect if alternate smelters and refiners are not available. The Company believes there is sufficient global capacity available to address the loss of any one smelter.
HEDGING ACTIVITES
The Company’s strategy is to provide shareholders with leverage to changes in silver and gold prices by selling silver and gold production at market prices. The Company has entered into derivative contracts to protect the selling price for certain anticipated gold production and to manage risks associated with foreign currencies. For additional information see "Item 7A. Quantitative and Qualitative Disclosures About Market Risk" and Note 19 - Derivative Financial Instruments in the notes to the consolidated financial statements.
GOVERNMENT REGULATION
General
The Company’s activities are subject to extensive federal, state and local laws governing the protection of the environment, prospecting, development, production, taxes, labor standards, occupational health, mine safety, toxic substances and other matters. The costs associated with compliance with such regulatory requirements are substantial and possible future legislation and
4
regulations could cause additional expense, capital expenditures, restrictions and delays in the development and continued operation of the Company’s properties, the extent of which cannot be predicted. In the context of environmental permitting, including the approval of reclamation plans, the Company must comply with known standards and regulations which may entail significant costs and delays. Although the Company has been recognized for its commitment to environmental responsibility and believes it is in substantial compliance with applicable laws and regulations, amendments to current laws and regulations, more stringent application or interpretation of these laws and regulations through judicial review or administrative action or the adoption of new laws could have a materially adverse effect upon the Company and its results of operations.
Estimated future reclamation costs are based primarily on legal and regulatory requirements. As of
December 31, 2012
,
$34.5
million was accrued for reclamation costs relating to currently developed and producing properties. The Company is also involved in several matters concerning environmental obligations associated with former mining activities. Based upon the Company’s best estimate of its liabilities for these items,
$0.9 million
was accrued as of
December 31, 2012
. These amounts are included in reclamation and mine closure liabilities on the consolidated balance sheet.
Federal Environmental Laws
Certain mining wastes from extraction and beneficiation of ores are currently exempt from the extensive set of Environmental Protection Agency (“EPA”) regulations governing hazardous waste, although such wastes may be subject to regulation under state law as a solid or hazardous waste. While the EPA has worked on a program to regulate these mining wastes pursuant to its solid waste management authority under the Resource Conservation and Recovery Act (“RCRA”), certain ore processing and other wastes are currently regulated as hazardous wastes by the EPA under RCRA. If the Company’s mine wastes were treated as hazardous waste or such wastes resulted in operations being designated as a “Superfund” site under the Comprehensive Environmental Response, Compensation, and Liability Act (“CERCLA”) for cleanup, material expenditures could be required for the construction of additional waste disposal facilities, for other remediation expenditures, or for natural resource damages. Under CERCLA, any present owner or operator of a Superfund site or an owner or operator at the time of its contamination generally may be held liable and may be forced to undertake remedial cleanup action or to pay for the government’s cleanup efforts. Such owner or operator may also be liable to governmental entities for the cost of damages to natural resources, which may be substantial. Additional regulations or requirements may also be imposed upon the Company’s tailings and waste disposal in Alaska under the Clean Water Act (“CWA”) and state law counterparts, and in Nevada under the Nevada Water Pollution Control Law which implements the CWA. Air emissions are subject to controls under Nevada’s and Alaska’s air pollution statutes implementing the Clean Air Act. The Company has reviewed and considered current federal legislation relating to climate change and does not believe it to have a material effect on its operations. Additional regulation or requirements under any of these laws and regulations could have a materially adverse effect upon the Company and its results of operations.
Proposed Mining Legislation
A portion of the Company’s U.S. mining properties are on unpatented mining claims on federal lands. See "Item 1A. Risk Factors - Third parties may dispute the Company's unpatented mining claims, which could result in the discovery of defective titles and losses affecting its business" and Note 23 - Litigation and Other Events in the notes to the consolidated financial statements. Legislation has been introduced regularly in the U.S. Congress over the last decade to change the Mining Law of 1872 as amended, under which the Company holds these unpatented mining claims. It is possible that the Mining Law may be amended or replaced by less favorable legislation in the future. Previously proposed legislation contained a production royalty obligation, new environmental standards and conditions, additional reclamation requirements and extensive new procedural steps which would likely result in delays in permitting. The ultimate content of future proposed legislation, if enacted, is uncertain. If a royalty on unpatented mining claims were imposed, the Company’s U.S. operations could be adversely affected. In addition, the Forest Service and the Bureau of Land Management have considered revising regulations governing operations under the Mining Law on federal lands they administer, which, if implemented, may result in additional procedures and environmental conditions and standards on those lands. The majority of the Company’s operations are either outside of the United States or on private patented lands and would be unaffected by potential legislation.
Any such reform of the Mining Law or Bureau of Land Management and Forest Service regulations thereunder could increase the costs of mining activities on unpatented mining claims, or could materially impair the ability of the Company to develop or continue operations which derive ore from federal lands, and as a result could have an adverse effect on the Company and its results of operations. Until such time, if any, as new reform legislation or regulations are enacted, the ultimate effects and costs of compliance on the Company cannot be estimated.
Foreign Government Regulations
The mining properties of the Company that are located in Argentina are subject to various government laws and regulations pertaining to the protection of the air, surface water, ground water and the environment in general, as well as the health of the work force, labor standards and the socio-economic impacts of mining facilities upon the communities. The Company believes it is in substantial compliance with all applicable laws and regulations to which it is subject in Argentina.
5
Bolivia, where the San Bartolomé mine is located, and Mexico, where the Palmarejo mine is located, have both adopted laws and guidelines for environmental permitting that are similar to those in effect in the United States and other South American countries. The permitting process requires a thorough study to determine the baseline condition of the mining site and surrounding area, an environmental impact analysis, and proposed mitigation measures to minimize and offset the environmental impact of mining operations. The Company has received all permits required to operate the San Bartolomé and Palmarejo mines.
The Company does not directly hold any interest in mining properties in Australia. However, under the Silver Sale Agreement with CBH Resources Limited (“CBH”), the Company has purchased CBH’s silver reserves and resources in the ground at the Endeavor mine. CBH is responsible for the mining operation and compliance with government regulations and the Company is not responsible for compliance. The Company is however at risk for any production stoppages resulting from non-compliance. CBH’s mining property is subject to a range of state and federal government laws and regulations pertaining to the protection of the air, surface water, ground water, noise, site rehabilitation and the environment in general, as well as the occupational health and safety of the work force, labor standards and the socio-economic impacts of mining facilities among local communities. In addition, the various federal and state native title laws and regulations recognize and protect the rights and interests in Australia of Aboriginal and Torres Strait Islander people in land and waters and may restrict mining and exploration activity and/or result in additional costs. CBH is required to deal with a number of governmental departments in connection with the development and exploitation of its mining property. The Company is not aware of any substantial non-compliance with applicable laws and regulations to which CBH is subject in Australia.
Maintenance of Claims
Bolivia
The Bolivian state-owned mining organization, Corporación Minera de Bolivia (“COMIBOL”), is the underlying owner of all of the mining rights relating to the San Bartolomé mine. COMIBOL’s ownership derives from the Supreme Decree 3196 issued in October 1952, when the government nationalized most of the mines in Potosí. COMIBOL has leased the mining rights for the surface silver and tin bearing sediment ("pallacos", "sucus", and "troceras") to several Potosí cooperatives. The cooperatives in turn have subleased their mining rights to Coeur’s subsidiary, Manquiri, through a series of “joint venture” contracts. In addition to those agreements with the cooperatives Manquiri holds additional mining rights under lease agreements directly with COMIBOL. All of Manquiri’s mining and surface rights collectively constitute the San Bartolomé project. For additional information regarding the maintenance of its claims to the San Bartolomé mine, see "Item 2. Properties — Silver and Gold Mining Properties — Bolivia-San Bartolomé."
Mexico
In order to carry out mining activities in Mexico, the Company is required to obtain a mining concession from the General Bureau of Mining which belongs to the Ministry of Economy (
Secretaría de Economía
) of the Federal Government, or be assigned previously granted concession rights, and both must be recorded with the Public Registry of Mining. In addition, mining works may have to be authorized by other authorities when performed in certain areas, including villages, dams, channels, general communications ways, submarine shelves of islands, islets and reefs, marine beds and subsoil and federal maritime-terrestrial zones. Reports have to be filed with the General Bureau of Mining in May of each year evidencing previous calendar year mining works. Generally nominal biannual mining duties are payable in January and July of each year, and failure to pay these duties could lead to cancellation of the concessions. Upon expiration or cancellation of the concession, certain obligations remain, including obligations to file technical reports and not to withdraw permanent works of fortification.
United States
At mining properties in the United States, including the Rochester and Kensington mines, operations are conducted upon both patented and unpatented mining claims. Pursuant to applicable federal law it is necessary to pay to the Secretary of the Interior, on or before August 31 of each year, a claim maintenance fee of $140 per claim. This claim maintenance fee is in lieu of the assessment work requirement contained in the Mining Law. In addition, in Nevada, holders of unpatented mining claims are required to pay the county recorder of the county in which the claim is situated an annual fee of $8.50 per claim. For unpatented claims in Alaska, the Company is required to pay a variable, annual rental fee based on the age of the claim and must perform annual labor or make an annual payment in lieu of annual labor. No maintenance fees are payable for federal patented claims. Patented claims are similar to land held by an owner who is entitled to the entire interest in the property with unconditional power of disposition and are subject to local property taxes. See "Item 1A. Risk Factors - Third parties may dispute the Company's unpatented mining claims, which could result in the discovery of defective titles and losses affecting its business".
Argentina
Minerals are owned by the provincial governments, which impose a maximum 3% mine-mouth royalty on mineral production. The first step in acquiring mining rights is filing an exploration concession ("Cateo"), which gives exclusive prospecting rights
6
for the requested area for a period of time, generally up to three years. The maximum size of each Cateo is 10,000 hectares; a maximum of 20 Cateos, or 200,000 hectares, can be held by a single entity (individual or company) in any one province.
The holder of a Cateo has exclusive right to establish a discovery concession "(Manifestacion de Descubrimiento" or “MD”) on that Cateo, but MDs can also be set without a Cateo on any land not covered by someone else’s Cateo. MDs are filed as either a vein or disseminated discovery. A square protection zone can be declared around the discovery — up to 840 hectares for a vein MD or up to 7,000 hectares for a disseminated MD. The protection zone grants the discoverer exclusive rights for an indefinite period, during which the discoverer must provide an annual report presenting a program of exploration work and investments related to the protection zone. A MD can later be upgraded to an exploitation concession ("Concesion de Explotacion or "Mina"), which gives the holder the right to begin commercial extraction of minerals.
Australia
At the Endeavor mining property in Australia operated by CBH, operations are conducted on designated mining leases issued by the relevant state government mining department. Mining leases are issued for a specific term and include a range of environmental and other conditions including the payment of production royalties, annual lease fees and the use of cash or a bank guarantee as security for reclamation liabilities. The amounts required to be paid to secure reclamation liabilities are determined on a case by case basis. In addition, CBH holds a range of exploration titles and permits, which are also issued by the respective state government mining departments for specified terms and require payment of annual fees and completion of designated expenditure programs on the leases to maintain title. In Australia, minerals in the ground are owned by the state until severed from the ground through mining operations.
Chile
The State of the Republic of Chile recognizes the free availability for concession purposes of all mineral substances, both metal and non-metal, with the exception of liquid or gaseous hydrocarbons. Mining concessions are always established by the court with no decision-making action by any other authority, avoiding in this way the discretionary interference of administrative authorities. Preference for establishing a concession is given to the first person to submit the necessary application to the court. Any Chilean or foreign person may establish and acquire mining concessions. The holder's title to the mining concession is protected by the constitutional (warrant) guarantee of proprietary rights. Chilean legislation provides for two kinds of concessions: (i) the exploration concession, which remains in effect for 2 years and may be extended for another 2 year period, provided at least half the area thereof is surrendered; and (ii) the exploitation concession which is perpetual. In order to maintain the exploration and exploitation concession, an annual tax is payable to the government before March 31 of each year in the approximate amount of $1.60 and $8.00 per hectare, respectively. As of December 31, 2012, the Company held exploration concessions on two properties in Chile, totaling 8,918 square miles (4,664 hectares).
EMPLOYEES
The number of full-time employees at the Company as of
December 31, 2012
was:
|
U.S. Corporate Staff and Office
|
68
|
|
|
Rochester Mine
|
250
|
|
|
Kensington Mine
|
306
|
|
|
South American Administrative Offices
|
16
|
|
|
South American Exploration
|
12
|
|
|
Martha Mine/Argentina
|
17
|
|
|
San Bartolomé Mine/Bolivia
(1)
|
341
|
|
|
Palmarejo Mine/Mexico
|
888
|
|
|
Total
|
1,898
|
|
|
(1)
|
The Company maintains a labor agreement in South America with Sindicato de Trabajadorés Mineras de la Empresa Manquiri S.A. at the San Bartolomé mine in Bolivia. The San Bartolomé mine labor agreement, which became effective January 28, 2010, does not have a fixed term. As of December 31, 2012, approximately 10.0% of the Company’s worldwide labor force was covered by collective bargaining agreements.
|
EXPLORATION STAGE MINING PROPERTIES
The Company, either directly or through wholly-owned subsidiaries, has interests in properties located in the United States, Chile, Argentina, Bolivia, and Mexico but upon which no minable ore reserves have yet been delineated. Exploration conducted on these properties is included in the Company's total annual exploration programs.
7
BUSINESS STRATEGY AND COMPETITIVE STRENGTHS
The Company believes the following strengths provide it with significant competitive advantages as mangement executes its business strategy:
Strong track record of developing and operating mines:
The Company has successfully acquired, developed and operated a strong portfolio of operating mines since its founding in 1928. The Company is a large primary silver producer with growing gold production. For the twelve months ended December 31, 2012, it produced
18.0
million ounces of silver and
226,486
ounces of gold with a cash cost of
$7.57
per ounce of silver and
$1,358
per ounce of gold. Production has grown substantially over the last four years as the Company has built and begun production at three wholly-owned, long lived mines: the San Bartolomé mine, the Palmarejo mine and the Kensington mine. In addition, production commenced late in 2011 from a new leach pad at its Rochester mine.
Silver Production Gold Production


Operating and commodity diversity:
The Company produces silver and gold from five operating mines located in four countries. The Company's operating assets consist of the Palmarejo silver and gold mine in Mexico, the San Bartolomé silver mine in Bolivia, the Kensington gold mine in Alaska, the Rochester silver and gold mine in Nevada and the Endeavor silver and base metal mine in Australia. The Company also owns the Joaquin silver and gold development project in Argentina. The Company expects to increase its operating and commodity diversity as the Kensington mine and the Rochester mine ramp up to their design capacity. The Company's metal sales breakdown by operating mine and metal is set out below:
2012 Gold Sales by Mine 2012 Silver Sales by Mine

Experienced management team
: The Company has built a high caliber management team of devoted professionals with extensive mining industry expertise. President and Chief Executive Officer, Mitchell Krebs, and Senior Vice President, Chief Operating Officer and Chief Financial Officer, Frank Hanagarne, have significant experience in the mining industry. The board of directors also brings diverse industry backgrounds and considerable professional experience to the Company.
Capitalizing on Prior Development Program
: Over the past four years the Company has invested significant capital in commissioning three large mines at the San Bartolomé, Palmarejo and Kensington properties, realizing the first full year of production in 2011 from these mines. With the large majority of the development capital spending complete at these mines, capital expenditures declined materially in 2012 to
$115.6
million, from an average of $164.7 million per annum over the prior three years. The growth generated by these mines is resulting in significantly higher production, metal sales and free cash flow in continued strong metals markets.
The Palmarejo mine, San Bartolomé mine, Kensington mine, and Rochester mine, each operated by the Company, the Martha mine, which ceased active mining operations in September 2012, and the Endeavor mine, operated by a non-affiliated party,
8
constituted the Company’s principal sources of mining revenues in 2012. See Note 22- Segment Reporting in the notes to the Consolidated Financial Statements, under the heading “Geographical Information”, for revenues attributed to all foreign countries. The following table sets forth information regarding the percentage contribution to the Company’s total revenues (i.e., revenues from the sale of concentrates and doré) by the sources of those revenues during the past five years, excluding discontinued operations:
|
Coeur Percentage
Ownership at
December 31,
|
Percentage of Total Revenues(2)
For The Years Ended December 31,
|
|||||||||||||||||
|
Mine/Company
|
2012
|
2012
|
2011
|
2010
|
2009
|
2008
|
||||||||||||
|
Palmarejo Mine
|
100
|
%
|
49
|
%
|
50
|
%
|
45
|
%
|
30
|
%
|
—
|
%
|
||||||
|
San Bartolomé Mine
|
100
|
%
|
20
|
|
26
|
|
28
|
|
38
|
|
14
|
|
||||||
|
Kensington Mine
|
100
|
%
|
12
|
|
15
|
|
4
|
|
—
|
|
—
|
|
||||||
|
Rochester Mine
|
100
|
%
|
15
|
|
6
|
|
11
|
|
15
|
|
52
|
|
||||||
|
Martha Mine
|
100
|
%
|
2
|
|
1
|
|
10
|
|
15
|
|
24
|
|
||||||
|
Endeavor Mine
(1)
|
100
|
%
|
2
|
|
2
|
|
2
|
|
2
|
|
10
|
|
||||||
|
|
|
|
100
|
%
|
100
|
%
|
100
|
%
|
100
|
%
|
100
|
%
|
||||||
|
(1)
|
Ownership interest reflects the Company’s ownership interest in the property’s silver production. Other constituent metals are owned by a non-affiliated entity.
|
|
(2)
|
Effective August 9, 2010, the Company sold its interest in the Cerro Bayo mine to Mandalay Resources Corporation.
|
DEFINITIONS
The following sets forth definitions of certain important mining terms used in this report.
“Ag”
is the abbreviation for silver.
“Au”
is the abbreviation for gold.
“Backfill”
is primarily waste sand or rock used to support the roof or walls after removal of ore from a stope.
“By-Product”
is a secondary metal or mineral product recovered in the milling process, such as gold.
“Cash Costs”
are costs directly related to the physical activities of producing silver and gold, and include mining, processing, transportation and other plant costs, third-party refining and smelting costs, marketing expense, on-site general and administrative costs, royalties and in-mine drilling expenditures that are related to production and other direct costs. Sales of by-product metals, including gold, are deducted from the above in computing cash costs per ounce. Cash costs exclude depreciation, depletion and amortization, corporate general and administrative expense, exploration, interest, and pre-feasibility costs and accruals for mine reclamation. Cash costs are calculated and presented using the “Gold Institute Production Cost Standard” applied consistently for all periods presented. See "Item 7. Management's Discussion and Analysis of Financial Condition and Results of Operations - Reconciliation of Non-GAAP Cash Costs to GAAP Production Costs."
“Cash Costs per Ounce”
are calculated by dividing the cash costs computed for each of the Company’s mining properties for a specific period by the amount of gold ounces or silver ounces produced by that property during that same period. Management uses cash costs per ounce produced as a key indicator of the profitability of each of its mining properties. Gold and silver are sold and priced in the world financial markets on a U.S. dollar per ounce basis. By calculating the cash costs from each of the Company’s mines on the same unit basis, management can determine the gross margin that each ounce of gold and silver produced is generating. While this represents a key indicator of the performance of the Company’s mining properties you are cautioned not to place undue reliance on this single measurement. To fully evaluate a mine’s performance, management also monitors U.S. Generally Accepted Accounting Principles (“U.S. GAAP”) based profit/(loss), depreciation and amortization expenses and capital expenditures for each mine as presented in Note 22 — Segment Reporting in the notes to the Consolidated Financial Statements. Total cash costs per ounce is a non-GAAP measurement and investors are cautioned not to place undue reliance on it and are urged to read all GAAP accounting disclosures presented in the consolidated financial statements and accompanying footnotes. See "Item 7. Management's Discussion and Analysis of Financial Condition and Results of Operations - Reconciliation of Non-GAAP Cash Costs to GAAP Production Costs."
“Concentrate”
is a very fine powder-like product containing the valuable metal from which most of the waste material in the ore has been eliminated.
“Contained Ounces”
represents ounces in the ground before reduction of ounces not able to be recovered by applicable metallurgical process.
9
“Cutoff Grade”
is the minimum metal at which an ore body can be economically mined; used in the calculation of reserves in a given deposit.
“Cyanidation”
is a method of extracting gold or silver by dissolving it in a weak solution of sodium or potassium cyanide.
“Development”
is work carried out for the purpose of accessing a mineral deposit. In an underground mine that includes shaft sinking, crosscutting, drifting and raising. In an open pit mine, development includes the removal of over burden.
“Dilution”
is an estimate of the amount of waste or low-grade mineralized rock which will be mined with the ore as part of normal mining practices in extracting an ore body.
“Doré”
is unrefined gold and silver bullion bars which contain gold, silver and minor amounts of impurities which will be further refined to almost pure metal.
“Drilling”
Core drilling:
process of obtaining cylindrical rock samples by means of an annular-shaped rock-cutting bits (diamond impregnated) rotated by a bore-hole drilling machine. The core samples are used for geological study and chemical analysis used in mineral exploration.
In-fill:
is any method of drilling intervals between existing holes, used to provide greater geological detail and to help establish reserve estimates.
Reverse circulation:
a method of drilling, often used in mineral exploration, that produces fragmented samples of rock collected by a rotary, percussion drilling machine.
“Exploration”
is prospecting, sampling, mapping, drilling and other work involved in searching for ore.
“Gold”
is a metallic element with minimum fineness of 999 parts per 1000 parts pure gold.
“Grade”
is the amount of metal in each ton of ore, expressed as troy ounces per ton or grams per tonne for precious metals.
"g/t Ag"
are grams of gold per metric ton (tonne) of rock. A tonne is equal to 1.1023 short tons, or 2,205 pounds.
"g/t Au"
are grams of silver per metric ton (tonne) of rock. A tonne is equal to 1.1023 short tons, or 2,205 pounds.
“Heap Leach Pad”
is a large impermeable foundation or pad used as a base for ore during heap leaching.
“Heap Leaching Process”
is a process of extracting gold and silver by placing broken ore on an impermeable pad and applying a diluted cyanide solution that dissolves a portion of the contained gold and silver, which are then recovered in metallurgical processes.
“Hectare”
is a metric unit of area equal to 10,000 square meters (2.471 acres).
“Mill”
is a processing facility where ore is finely ground and thereafter undergoes physical or chemical treatments to extract the valuable metals.
“Mill-Lead Grades”
are metal content of mined ore going into a mill for processing.
“Mineralized Material”
is gold and silver bearing material that has been physically delineated by one or more of a number of methods, including drilling, underground work, surface trenching and other types of sampling. This material has been found to contain a sufficient amount of mineralization of an average grade of metal or metals to have economic potential that warrants further exploration evaluation. While this material is not currently or may never be classified as ore reserves, it is reported as mineralized material only if the potential exists for reclassification into the reserves category. This material cannot be classified in the reserves category until final technical, economic and legal factors have been determined. Under the United States Securities and Exchange Commission’s standards, a mineral deposit does not qualify as a reserve unless it can be economically and legally extracted at the time of reserve determination and it constitutes a proven or probable reserve (as defined below). In accordance with Securities and Exchange Commission guidelines, mineralized material reported in the Company’s Form 10-K does not include material that would be classified as inferred.
“Mining Rate”
tons of ore mined per day or even specified time period.
“Non-cash Costs”
are costs that are typically accounted for ratably over the life of an operation and include depreciation, depletion and amortization of capital assets, accruals for the costs of final reclamation and long-term monitoring and care that are usually incurred at the end of mine life, and the amortization of the cost of property acquisitions.
“Open Pit”
is a mine where the minerals are mined entirely from the surface.
10
“Operating Cash Costs Per Ounce”
are cash costs per ounce minus production taxes and royalties.
“Ore”
is rock, generally containing metallic or non-metallic minerals, which can be mined and processed at a profit.
“Ore Body”
is a sufficiently large amount of ore that can be mined economically.
“Ore Reserve” or "Reserve"
is that part of a mineral deposit that could be economically and legally extracted or produced at the time of the reserve determination. Mining dilution and recovery, where appropriate, has been factored into the estimation of ore reserves.
“Probable (Indicated) Reserves”
are reserves for which quantity and grade and/or quality are computed from information similar to that used for proven (measured) reserves, but the sites for inspection, sampling, and measurement are farther apart or are otherwise less adequately spaced. The degree of assurance, although lower than that for proven (measured) reserves, is high enough to assume continuity between points of observation.
“Proven (Measured) Reserves”
are reserves for which (a) quantity is computed from dimensions revealed in outcrops, trenches, workings, or drill holes; grade and/or quality are computed from the results of detailed sampling and (b) the sites for inspection, sampling, and measurement are spaced so closely and the geologic character is so well defined that size, shape, depth , and mineral content of reserves are well-established.
“Reclamation”
is the process by which lands disturbed as a result of mining activity are modified to support beneficial land use. Reclamation activity may include the removal of buildings, equipment, machinery and other physical remnants of mining, closure of tailings, leach pads and other features, and contouring, covering and re-vegetation of waste rock and other disturbed areas.
“Recovery Rate”
is a term used in process metallurgy to indicate the proportion of valuable material physically recovered in the processing of ore. It is generally stated as a percentage of material recovered compared to the material originally present.
“Refining”
is the final stage of metal production in which impurities are removed from the molten metal.
“Run-of-mine Ore”
is mined ore which has not been subjected to any pretreatment, such as washing, sorting or crushing prior to processing.
“Silver”
is a metallic element with minimum fineness of 995 parts per 1000 parts pure silver.
“Stripping Ratio”
is the ratio of the number of tons of waste material to the number of tons of ore extracted at an open-pit mine.
“Tailings”
is the material that remains after all economically and technically recovered precious metals have been removed from the ore during processing.
“Ton”
means a short ton which is equivalent to 2,000 pounds, unless otherwise specified.
“Total costs”
are the sum of cash costs and non-cash costs.
IMPORTANT FACTORS RELATING TO FORWARD-LOOKING STATEMENTS
This report contains numerous forward-looking statements relating to the Company’s gold and silver mining business, including estimated production data, expected operating schedules, expected capital costs and other operating data, the expected impact of pending litigation and permit and other regulatory approvals. Such forward-looking statements are identified by the use of words such as “believes,” “intends,” “expects,” “hopes,” “may,” “should,” “plan,” “projected,” “contemplates,” “anticipates” or similar words. Actual production, operating schedules, results of operations, ore reserve and resources could differ materially from those projected in the forward-looking statements. The factors that could cause actual results to differ materially from those projected in the forward-looking statements include (i) the risk factors set forth below under Item 1A, (ii) the risks and hazards inherent in the mining business (including environmental hazards, industrial accidents, weather or geologically related conditions), (iii) changes in the market prices of gold and silver, (iv) the uncertainties inherent in the Company’s production, exploratory and developmental activities, including risks relating to permitting and regulatory delays and disputed mining claims, (v) any future labor disputes or work stoppages, (vi) the uncertainties inherent in the estimation of gold and silver ore reserves, (vii) changes that could result from the Company’s future acquisition of new mining properties or businesses, (viii) reliance on third parties to operate certain mines where the Company owns silver production and reserves, (ix) the loss of any third-party smelter to which the Company markets silver and gold, (x) the effects of environmental and other governmental regulations, (xi) the risks inherent in the ownership or operation of or investment in mining properties or businesses in foreign countries, (xii) the worldwide economic downturn and difficult conditions in the global capital and credit markets, and (xiii) the Company’s ability to raise additional financing necessary to conduct its business, make payments or refinance its debt. Readers are cautioned not to put undue reliance
11
on forward-looking statements. The Company disclaims any intent or obligation to update publicly these forward-looking statements, whether as a result of new information, future events or otherwise.
AVAILABLE INFORMATION
The Company maintains an internet website at
http://www.coeur.com
. Coeur makes available, free of charge, on or through its website, its Annual Reports on Form 10-K, Quarterly Reports on Form 10-Q, Current Reports on Form 8-K and Proxy Statements, as well as Forms 3, 4 and 5 with respect to its common stock, as soon as reasonably practicable after such reports are electronically filed with the Securities and Exchange Commission (the "SEC"). Copies of Coeur’s Corporate Governance Guidelines, charters of the key committees of the Board of Directors (Audit, Compensation, Nominating and Corporate Governance, and Environmental, Health, Safety, and Social Responsibility Committees) and its Code of Business Conduct and Ethics for Directors, Officers and Employees, applicable to the Chief Executive Officer, Chief Financial Officer and Chief Accounting Officer, are available at the Company’s website
http://www.coeur.com
. Information contained on the Company’s website is not a part of this report.
|
Item 1A.
|
Risk Factors
|
The Company's results of operations, cash flows and operating costs are highly dependent upon the market prices of silver and gold and other commodities, which are volatile and beyond the Company's control. The Company's use of derivative contracts to protect against such volatility exposes us to risk of opportunity loss, mark-to-market accounting adjustments and exposure to counterparty credit risk.
Silver and gold are commodities, and their prices are volatile. During the last twelve months ended
December 31, 2012
, the price of silver ranged from a low of
$26.39
per ounce to a high of
$36.88
per ounce, and the price of gold ranged from a low of
$1,540
per ounce to a high of
$1,792
per ounce. During the fourth quarter of 2012, the price of silver ranged from a low of $29.73 per ounce to a high of $34.89 per ounce, and the price of gold ranged from a low of $1,651 per ounce to a high of $1,792 per ounce. The closing market prices of silver and gold on February 20, 2013 were $28.57 per ounce and $1,565 per ounce, respectively.
Silver and gold prices are affected by many factors beyond the Company's control, including prevailing interest rates and returns on other asset classes, expectations regarding inflation, speculation, currency values, governmental decisions regarding the disposal of precious metals stockpiles, global and regional demand and production, political and economic conditions and other factors. In addition, Exchange Traded Funds (“ETFs”), which have substantially facilitated the ability of large and small investors to buy and sell precious metals, have become significant holders of gold and silver.
Because the Company derives all of its revenues from sales of silver and gold, its results of operations and cash flows will fluctuate as the prices of these metals increase or decrease. A sustained period of declining gold and silver prices would materially and adversely affect the results of operations and cash flows. Factors that are generally understood to contribute to a decline in the prices of silver and gold include a strengthening of the U.S. dollar, net outflows from gold and silver ETFs, bullion sales by private and government holders and a general global economic slowdown.
In addition, operating costs at the Company's mines are affected by the price of input commodities, such as fuel, electricity, labor, chemical reagents, explosives, steel and concrete. Prices for these input commodities are volatile and can fluctuate due to conditions that are difficult to predict, including global competition for resources, currency fluctuations, consumer or industrial demand and other factors. Continued volatility in the prices of commodities and other supplies the Company purchases could lead to higher costs, which would adversely affect results of operations and cash flows.
From time to time, the Company may enter into price risk management contracts to protect against fluctuations in the price of its products and changes in the price of fuel and other input costs. These contracts could include forward sales or purchase contracts, futures contracts, purchased or sold put and call options and other contracts. Any such use of forward or futures contracts can expose us to risk of an opportunity loss. The use of derivative contracts may also result in significant mark-to-market accounting adjustments, which may have a material adverse impact on reported financial results. The Company is exposed to credit risk with contract counter-parties, including, but not limited to, sales contracts and derivative contracts. In the event of non-performance in connection with a contract, the Company could be exposed to a loss of value for that contract.
Since the beginning of 2011, the Company has made strategic minority investments in eight silver and gold development companies in North and South America. The value of these investments depends significantly on the market prices of silver and gold. The Company cannot assure that the value of these investments, or the value of future investments it may make in other development companies, will not decline. Declines in the value of these investments could adversely affect the Company's financial condition.
12
A substantial decline in gold and silver prices could cause one or more of the Company's mining properties to become unprofitable, which could require it to record write-downs of long-lived assets that would adversely affect results of operations and financial condition.
Established accounting standards for impairment of the value of long-lived assets such as mining properties requires the Company to review the recoverability of the cost of its assets upon a triggering event by estimating the future undiscounted cash flows expected to result from the use and eventual disposition of the asset. Impairment, measured by comparing an asset's carrying value to its fair value, must be recognized when the carrying value of the asset exceeds these cash flows. A significant and sustained decline in silver or gold prices, or our failure to control production costs or realize the minable ore reserves at the Company's mining properties, could lead it to terminate or suspend mining operations at one or more of its properties and require a write down of the carrying value of the assets. Any such actions would negatively affect results of operations and financial condition.
The Company may record other types of additional mining property charges in the future if it sells a property for a price less than its carrying value or has to increase reclamation liabilities in connection with the closure and reclamation of a property. Any such additional write-downs of mining properties could adversely affect results of operations and financial condition.
The Company is an international company and is exposed to political and social risks in the countries in which it has significant operations or interests.
A majority of the Company's revenues are generated by operations outside the United States, and it is subject to significant risks inherent in resource extraction by foreign companies and contracts with government owned entities. Exploration, development, production and closure activities in many countries are potentially subject to heightened political and social risks that are beyond the Company's control. These risks include the possible unilateral cancellation or forced re-negotiation of contracts, unfavorable changes in foreign laws and regulations, royalty and tax increases, claims by governmental entities or indigenous communities, expropriation or nationalization of property and other risks arising out of foreign sovereignty over areas in which operations are conducted. The right to export silver and gold may depend on obtaining certain licenses and quotas, which could be delayed or denied at the discretion of the relevant regulatory authorities. In addition, the Company's rights under local law may be less secure in countries where judicial systems are susceptible to manipulation and intimidation by government agencies, non-governmental organizations or civic groups.
Any of these developments could require the Company to curtail or terminate operations at its mines, incur significant costs to meet newly-imposed environmental or other standards, pay greater royalties or higher prices for labor or services and recognize higher taxes, which could materially and adversely affect financial condition, results of operations and cash flows.
These risks may be higher in developing countries in which the Company may expand its exploration for and development of mineral deposits. Potential operations in these areas increase the Company's exposure to risks of war, local economic conditions, political disruption, civil disturbance and governmental policies that may disrupt its operations.
The Company's operations outside the United States also expose it to economic and operational risks.
The Company's operations outside the United States also expose it to economic and operational risks. Local economic conditions can cause shortages of skilled workers and supplies, increase costs and adversely affect the security of operations. In addition, higher incidences of criminal activity and violence in the area of some of the Company's foreign operations, including drug-cartel related violence in Mexico, could adversely affect the Company's ability to operate in an optimal fashion and may impose greater risks of theft and greater risks as to property security. These conditions could lead to lower productivity and higher costs, which would adversely affect results of operations and cash flows. The Company sells gold and silver doré in U.S. dollars, but it conducts operations outside the United States in local currency. Currency exchange movements could adversely affect results of operations.
Silver and gold mining involves significant production and operational risks.
Silver and gold mining involves significant production and operational risks, including those related to uncertain mineral exploration success, unexpected geological or mining conditions, the difficulty of development of new deposits, unfavorable climate conditions, equipment or service failures, current unavailability of or delays in installing and commissioning plants and equipment, import or customs delays and other general operating risks. Commencement of mining can reveal mineralization or geologic formations, including higher than expected content of other minerals that can be difficult to separate from silver, which can result in unexpectedly low recovery rates.
Problems also may arise due to the quality or failure of locally obtained equipment or interruptions to services (such as power, water, fuel or transport or processing capacity) or technical support, which could result in the failure to achieve expected target dates for exploration, or could cause production activities to require greater capital expenditure to achieve expected recoveries.
13
Many of these production and operational risks are beyond the Company's control. Delays in commencing successful mining activities at new or expanded mines, disruptions in production and low recovery rates could have adverse effects on the Company's financial condition, results of operations and cash flows.
The estimation of ore reserves is imprecise and depends upon subjective factors. Estimated ore reserves may not be realized in actual production. The Company's results of operations and financial position may be negatively affected by inaccurate estimates.
The ore reserve figures presented in the Company's public filings are estimates made by the Company's technical personnel and by independent mining consultants contracted by it. Reserve estimates are a function of geological and engineering analyses that require the Company to make assumptions about production costs, recoveries and silver and gold market prices. Reserve estimation is an imprecise and subjective process. The accuracy of such estimates is a function of the quality of available data and of engineering and geological interpretation, judgment and experience. Assumptions about silver and gold market prices are subject to great uncertainty as those prices have fluctuated widely in the past. Declines in the market prices of silver or gold may render reserves containing relatively lower grades of ore uneconomic to exploit, and the Company may be required to reduce reserve estimates, discontinue development or mining at one or more of its properties or write down assets as impaired. Should the Company encounter mineralization or geologic formations at any of its mines or projects different from those predicted, it may adjust its reserve estimates and alter its mining plans. Either of these alternatives may adversely affect actual production and financial condition, results of operations and cash flows.
Forward sales and royalty arrangements can result in limiting the Company's ability to take advantage of increased metal prices while increasing its exposure to lower metal prices.
The Company has in the past entered into, and may in the future enter into, arrangements under which it has agreed to make royalty or similar payments to lenders in amounts that are based on expected production and price levels for gold or silver. The Company enters into such arrangements when it concludes that they provide it with necessary capital to develop a specific mining property on favorable terms. Royalty or similar payment obligations, however, can limit the Company's ability to realize the full effects of rising gold or silver prices and require the Company to make potentially significant cash payments if the mine fails to achieve specified minimum production levels.
The Company's future operating performance may not generate cash flows sufficient to meet debt payment obligations.
As of
December 31, 2012
, the Company had a total of approximately $121.4 million of outstanding indebtedness, which includes
$61.9
million for future estimated gold production royalty payments due to Franco-Nevada Corporation,
$48.1 million
of 3.25% Convertible Senior Notes due 2028 (the “3.25% Convertible Senior Notes”) and capital lease obligations of
$11.4
million. The liabilities associated with such royalty payments increase as the price of gold increases. The Company's ability to make scheduled debt payments on outstanding indebtedness will depend on future results of operations and cash flows. The Company's results of operations and cash flows, in part, are subject to economic factors beyond its control, including the market prices of silver and gold. The Company may not be able to generate enough cash flow to meet obligations and commitments. If the Company cannot generate sufficient cash flow from operations to service debt, it may need to further refinance debt, dispose of assets or issue equity to obtain the necessary funds. The Company cannot predict whether it would be able to refinance debt, issue equity or dispose of assets to raise funds on a timely basis or on satisfactory terms.
The Company's future growth will depend upon its ability to develop new mines, either through exploration at existing properties or by acquisition from other mining companies.
Because mines have limited lives based on proven and probable ore reserves, an important element of the Company's business strategy is the opportunistic acquisition of silver and gold mines, properties and businesses or interests therein. During 2011, the Company successfully constructed a new leach pad at the Company's Rochester mine and substantially completed development of other major mining properties at Palmarejo, San Bartolomé and Kensington. The Company's ability to achieve significant additional growth in revenues and cash flows will depend upon success in further developing existing properties and developing or acquiring new mining properties. Both strategies are inherently risky, and the Company cannot assure that it will be able to successfully compete in either the development of existing or new mining properties or acquisitions of additional mining properties.
While it is the Company's practice to engage independent mining consultants to assist in evaluating and making acquisitions, any mining properties or interests that it may acquire may not be developed profitably. If profitable when acquired, that profitability might not be sustained. In connection with any future acquisitions, the Company may incur indebtedness or issue equity securities, resulting in increased interest expense, or dilution of the percentage ownership of existing shareholders. The Company cannot predict the impact of future acquisitions on the price of its business or common stock or that it would be able to obtain any necessary financing on acceptable terms. Unprofitable acquisitions, or additional indebtedness or issuances of securities in connection with such acquisitions, may negatively affect results of operations.
14
In addition, since the beginning of 2011, the Company has also made strategic minority investments in eight silver and gold development companies in North and South America. As of
December 31, 2012
, the Company's investments in these companies had an estimated fair value of
$27.1
million. The Company cannot assure that the value of these investments, or the value of future investments it may make in other development companies, will not decline. Declines in the value of these investments could adversely affect the Company's financial condition and results of operations.
Mineral exploration and development inherently involves significant and irreducible financial risks. The Company may suffer from the failure to find and develop profitable mines.
The exploration for and development of mineral deposits involves significant financial risks that even a combination of careful evaluation, experience and knowledge cannot eliminate. Unprofitable efforts may result from the failure to discover mineral deposits. Even if mineral deposits are found, those deposits may be insufficient in quantity and quality to return a profit from production, or it may take a number of years until production is possible, during which time the economic viability of the project may change. Few properties which are explored are ultimately developed into producing mines.
Substantial expenditures are required to establish ore reserves, to extract metals from ores and, in the case of new properties, to construct mining and processing facilities. The economic feasibility of any development project is based upon, among other things, volatile metals prices, estimates of the size and grade of ore reserves, proximity to infrastructures and other resources such as water and power, metallurgical recoveries, production rates and capital and operating costs. Development projects also are subject to the completion of favorable feasibility studies, issuance and maintenance of necessary permits and receipt of adequate financing.
The commercial viability of a mineral deposit, once developed, depends on a number of factors, including: the particular attributes of the deposit, such as size, grade and proximity to infrastructure; government regulations including taxes, royalties and land tenure; land use; importing and exporting of minerals; environmental protection; and mineral prices. Factors that affect adequacy of infrastructure include: reliability of roads, bridges, power sources and water supply; unusual or infrequent weather phenomena; sabotage; and government or other interference in the maintenance or provision of such infrastructure. All of these factors are highly cyclical. The exact effect of these factors cannot be accurately predicted, but the combination may result in not receiving an adequate return on invested capital.
Significant investment risks and operational costs are associated with exploration, development and mining activities. These risks and costs may result in lower economic returns and may adversely affect the Company's business.
The Company's ability to sustain or increase its present production levels depends in part on successful exploration and development of new ore bodies and expansion of existing mining operations. Mineral exploration, particularly for silver and gold, involves many risks and is frequently unproductive. The economic feasibility of any development project is based upon, among other things, estimates of the size and grade of ore reserves, proximity to infrastructures and other resources (such as water and power), metallurgical recoveries, production rates and capital and operating costs of such development projects, and metals prices. Development projects are also subject to the completion of favorable feasibility studies, issuance and maintenance of necessary permits and receipt of adequate financing.
Development projects may have no operating history upon which to base estimates of future operating costs and capital requirements. Development project items such as estimates of reserves, metal recoveries and cash operating costs are to a large extent based upon the interpretation of geologic data, obtained from a limited number of drill holes and other sampling techniques, and feasibility studies. Estimates of cash operating costs are then derived based upon anticipated tonnage and grades of ore to be mined and processed, the configuration of the ore body, expected recovery rates of metals from the ore, comparable facility and equipment costs, anticipated climate conditions and other factors.
As a result, actual cash operating costs and economic returns of any and all development projects may materially differ from the costs and returns estimated, and accordingly, the Company's financial condition, results of operations and cash flows may be negatively affected.
The Company might be unable to raise additional financing necessary to meet capital needs, conduct business, make payments when due or refinance debt.
The Company might need to raise additional funds in order to meet capital needs, implement its business plan, refinance debt or acquire complementary businesses or products. Any required additional financing might not be available on commercially reasonable terms, or at all. If the Company raises additional funds by issuing equity securities, holders of its common stock could experience significant dilution of their ownership interest, and these securities could have rights senior to those of the holders of common stock.
15
A significant delay or disruption in sales of concentrates as a result of the unexpected discontinuation of purchases by smelter customers could have a material adverse effect on operations.
The Company currently markets silver and gold concentrates to third-party smelters and refineries in Mexico, Germany, China, Australia, and the United States. The loss of any one smelter could have a material adverse effect on the Company if alternative smelters and refineries were unavailable. The Company cannot assure you that alternative smelters or refineries would be available if the need for them were to arise or that it would not experience delays or disruptions in sales that would materially and adversely affect results of operations.
The Company's silver and gold production may decline in the future, reducing its results of operations and cash flows.
The Company's silver and gold production, unless it is able to develop or acquire new properties, will decline over time due to the exhaustion of reserves and the possible closure of mines in response to declining metals prices or other factors. Identifying promising mining properties is difficult and speculative. The Company encounters strong competition from other mining companies in connection with the acquisition of properties producing or capable of producing silver and gold. Many of these companies have greater financial resources than the Company does. Consequently, the Company may be unable to replace and expand current ore reserves through the acquisition of new mining properties or interests therein on terms that are considered acceptable. As a result, revenues from the sale of silver and gold may decline, resulting in lower income and reduced growth. The Company cannot assure that it would be able to replace the production that would be lost due to the exhaustion of reserves and the possible closure of mines.
There are significant hazards associated with mining activities, some of which may not be fully covered by insurance.
The mining business is subject to risks and hazards, including environmental hazards, industrial accidents, the encountering of unusual or unexpected geological formations, cave-ins, flooding, earthquakes and periodic interruptions due to inclement or hazardous weather conditions. These occurrences could result in damage to, or destruction of, mineral properties or production facilities, personal injury or death, environmental damage, reduced production and delays in mining, asset write-downs, monetary losses and possible legal liability. Insurance fully covering many environmental risks, including potential liability for pollution or other hazards as a result of disposal of waste products occurring from exploration and production, is not generally available to us or to other companies in the industry. Any liabilities that the Company incurs for these risks and hazards could be significant and could adversely affect results of operation, cash flows and financial condition.
The Company is subject to significant governmental regulations, including under the Federal Mine Safety and Health Act, and related costs and delays may negatively affect its business.
Mining activities are subject to extensive federal, state, local and foreign laws and regulations governing environmental protection, natural resources, prospecting, development, production, post-closure reclamation, taxes, labor standards and occupational health and safety laws and regulations, including mine safety, toxic substances and other matters. The costs associated with compliance with such laws and regulations are substantial. Possible future laws and regulations, or more restrictive interpretations of current laws and regulations by governmental authorities, could cause additional expense, capital expenditures, restrictions on or suspensions of operations and delays in the development of new properties.
U.S. surface and underground mines like the Kensington and Rochester mines are continuously inspected by the U.S. Mine Safety and Health Administration (“MSHA”), which inspections often lead to notices of violation. Recently, the MSHA has been conducting more frequent and more comprehensive inspections of mining operations in general.
Failure to comply with applicable laws, regulations and permitting requirements may result in enforcement actions, including orders issued by regulatory or judicial authorities causing operations to cease or be curtailed, which may require corrective measures including capital expenditures, installation of additional equipment or remedial actions. In addition, any of the Company's U.S. mines could be subject to a temporary or extended shut down as a result of a violation alleged by the MSHA. Parties engaged in mining operations or in the exploration or development of mineral properties may be required to compensate those suffering loss or damage by reason of the mining activities and may be subject to civil or criminal fines or penalties imposed for violations of applicable laws or regulations. Any such penalties, fines, sanctions or shutdowns could have a material adverse effect on the Company's business and results of operations.
Compliance with environmental regulations and litigation based on environmental regulations could require significant expenditures.
Environmental regulations mandate, among other things, the maintenance of air and water quality standards and land reclamation, and set forth limitations on the generation, transportation, storage and disposal of solid and hazardous waste. Environmental legislation is evolving in a manner that will require stricter standards and enforcement, increased fines and penalties for non-compliance, more stringent environmental assessments of proposed projects, and a heightened degree of responsibility
16
for mining companies and their officers, directors and employees. The Company may incur environmental costs that could have a material adverse effect on financial condition and results of operations. Any failure to remedy an environmental problem could require it to suspend operations or enter into interim compliance measures pending completion of the required remedy. The environmental standards that ultimately may be imposed at a mine site affect the cost of remediation and could exceed the financial accruals that the Company has made for such remediation. The potential exposure may be significant and could have a material adverse effect on the Company's financial condition and results of operations.
Moreover, governmental authorities and private parties may bring lawsuits based upon damage to property and injury to persons resulting from the environmental, health and safety impacts of prior and current operations, including operations conducted by other mining companies many years ago at sites located on properties that the Company currently or formerly owned. These lawsuits could lead to the imposition of substantial fines, remediation costs, penalties and other civil and criminal sanctions. Substantial costs and liabilities, including for restoring the environment after the closure of mines, are inherent in the Company's operations. The Company cannot assure that any such law, regulation, enforcement or private claim would not have a negative effect on its financial condition, results of operations or cash flows.
Some of the Company's mining wastes currently are exempt to a limited extent from the extensive set of federal Environmental Protection Agency (the “EPA”) regulations governing hazardous waste under the Resource Conservation and Recovery Act (“RCRA”). If the EPA designates these wastes as hazardous under RCRA, the Company would be required to expend additional amounts on the handling of such wastes and to make significant expenditures to construct hazardous waste disposal facilities. In addition, if any of these wastes causes contamination in or damage to the environment at a mining facility, that facility could be designated as a “Superfund” site under the Comprehensive Environmental Response, Compensation and Liability Act (“CERCLA”). Under CERCLA, any present owner or operator of a Superfund site or the owner or operator at the time of contamination may be held liable and may be forced to undertake extensive remedial cleanup action or to pay for the government's cleanup efforts. The owner or operator also may be liable to governmental entities for the cost of damages to natural resources, which could be substantial. Additional regulations or requirements also are imposed on the Company's tailings and waste disposal areas in Alaska under the federal Clean Water Act (“CWA”) and in Nevada under the Nevada Water Pollution Control Law which implements the CWA.
Airborne emissions are subject to controls under air pollution statutes implementing the Clean Air Act in Nevada and Alaska. In addition, there are numerous legislative and regulatory proposals related to climate change, including legislation pending in the U.S. Congress to require reductions in greenhouse gas emissions. Adoption of these proposals could have a materially adverse effect on results of operations and cash flows.
The Company relies on third parties to operate, maintain and produce silver for it at the Endeavor mine.
The Endeavor mine is owned, maintained and operated by Cobar Operations Pty. Limited (“Cobar”), a wholly-owned subsidiary of CBH Resources Ltd. (“CBH”). However, pursuant to a silver sale and purchase agreement, the Company's wholly-owned subsidiary, CDE Australia Pty. Ltd. (“CDE Australia”), has acquired all silver production and reserves at the Endeavor mine, up to a total of 20.0 million payable ounces. CDE Australia has agreed to pay Cobar an operating cost contribution of $1.00 for each ounce of payable silver plus 50% of the amount by which the silver price exceeds $7.00 per ounce, subject to annual adjustments for inflation.
Under this arrangement, the Company relies on Cobar to own, maintain and operate the Endeavor mine, which exposes it to substantial counterparty risk. Cobar may fail to adequately or appropriately operate or maintain the project or may fail to fulfill its other obligations under the silver purchase agreement. The Company cannot assure that Cobar will not suffer financial hardship, that it will continue as a going concern or that it will not enter bankruptcy or otherwise liquidate. Any such event could expose the Company to significant costs and could limit the amounts, if any, it could recover in any proceeding against CBH or Cobar for breach of the silver purchase agreement. Any failure, inability or refusal of Cobar to meet its obligations to the Company could have a material and adverse effect on its business, results of operations or financial condition.
The Company's ability to obtain necessary government permits to expand operations or begin new operations can be materially affected by third party activists.
Private parties such as environmental activists frequently attempt to intervene in the permitting process and to persuade regulators to deny necessary permits or seek to overturn permits that have been issued. Obtaining the necessary governmental permits is a complex and time-consuming process involving numerous jurisdictions and often involving public hearings and costly undertakings. These third party actions can materially increase the costs and cause delays in the permitting process and could cause the Company to not proceed with the development or expansion of a mine.
An environmental organization, Great Basin Resource Watch (“GBRW”) has brought an administrative appeal challenging the Bureau of Land Management's approval of a plan of amendment which allows active mining to be resumed and a new heap leach pad to be constructed at the Rochester property. The Interior Board of Land Appeals (“IBLA”) is expected to rule on the
17
appeal in the first half of 2013. However, because GBRW did not seek a stay of the BLM's decision, operations have been proceeding as approved during the IBLA proceeding. The Company cannot predict the outcome of the appeal or what effect, if any, an adverse ruling may have on current operations. If an adverse ruling is issued, the Company may be required to update the permitting for the current operations at Rochester.
The Company's operations in Bolivia are subject to political risks.
The Bolivian government adopted a new constitution in early 2009 that strengthened state control over key economic sectors such as mining. In connection with the 2009 constitution, the government of Bolivia announced a restructuring of the mining law. A commission was established in March 2011 to finalize the mining law updates and the commission's evaluation remains ongoing. The Company has been assessing the potential effects of the proposed legislation on its Bolivian operations but any effects remain uncertain until the law is enacted. The law is expected to regulate taxation and royalties and to provide for contracting with the government rather than concession holding. The revised mining law is expected to be enacted in the first half of 2013. The Company cannot assure that its operations at the San Bartolomé mine will not be affected by the current political environment in Bolivia.
On October 14, 2009, the Bolivian state-owned mining company, Corporación Minera de Bolivia (“COMIBOL”), announced by resolution that it was temporarily suspending mining activities above the elevation of 4,400 meters above sea level while stability studies of the Cerro Rico mountain are undertaken. The Company holds rights to mine above this elevation under valid contracts with COMIBOL as well as under authorized contracts with local mining cooperatives that hold their rights under contract themselves with COMIBOL. The Company temporarily adjusted its mine plan to confine mining activities to the ore deposits below 4,400 meters above sea level and timely notified COMIBOL of the need to lift the restriction. The Cooperative Reserva Fiscal, with which the Company has one of those contracts, subsequently interpreted the COMIBOL resolution and determined that the Huacajchi deposit was not covered by such resolution. In March 2010, the Cooperative Reserva Fiscal notified COMIBOL that, based on its interpretation, it was resuming mining of high grade material above the 4,400 meter level in the Huacajchi deposit. In December 2011, the Cooperative Reserva Fiscal sent a similar notification to COMIBOL with respect to a further area above the 4,400 meter level known as Huacajchi Sur. Based on these notifications and on the absence of any objection from COMIBOL, the Company resumed mining operations at the San Bartolomé mine on the Huacajchi deposit and Huacajchi Sur. Mining in other areas above the 4,400 meter level continue to be suspended. The partial suspension may reduce production until the Company is able to resume mining above 4,400 meters generally. It is uncertain at this time how long the suspension will remain in place. In addition, it is possible that COMIBOL may decide that the Company's operations at the Huacajchi deposit or Huacajchi Sur are subject to the COMIBOL resolution, which may force the Company to cease mining at such deposits. If COMIBOL objects to the Company mining at the Huacajchi deposit or Huacajchi Sur or if the other restrictions are not lifted, it may need to write down the carrying value of the asset. It is also uncertain if any new mining or investment policies or shifts in political attitude may affect mining in Bolivia.
The Company's business depends on good relations with its employees.
The Company could experience labor disputes, work stoppages or other disruptions in production that could adversely affect its business and results of operations. Labor disruptions may be used to advocate labor, political or social goals, particularly at non-U.S. mines. For example, labor disruptions may occur in sympathy with strikes or labor unrest in other sectors of local economies. During the past three years, two of the Company's mines have experienced work stoppages, each of which was resolved within a short period of time and had no material effect on operations. Most recently, in May 2012, a small, unorganized group of employees at the Palmarejo mine blocked access to the mine. Palmarejo management supervised an orderly, temporary shut-down of the mine and mill in order to allow for dialogue with employees while ensuring the safety of workers at the mine site. Management considered the actions taken by the group to be illegal. Within approximately five days, the group agreed to return to work and full production resumed at the mine. The Company cannot assure that work stoppages or other disruptions will not occur in the future. Any such work stoppage or disruption could expose the Company to significant costs and have a material and adverse effect on its business, results of operations or financial condition.
As of
December 31, 2012
, unions represented approximately 10.0% of the Company's worldwide workforce. The Company currently has a labor agreement at its San Bartolomé mine, which became effective January 28, 2010 and does not have a fixed term. The Company cannot predict whether this agreement will be renewed, whether future labor disruptions will occur or, if disruptions do occur, how long they will last.
Third parties may dispute the Company's unpatented mining claims, which could result in the discovery of defective titles and losses affecting its business.
The validity of unpatented mining claims, which constitute a significant portion of the Company's property holdings in the United States, is often uncertain and may be contested. Although the Company has attempted to acquire satisfactory title to undeveloped properties, in accordance with mining industry practice it does not generally obtain title opinions until a decision is
18
made to develop a property. As a result, some titles, particularly titles to undeveloped properties may be defective. Defective title to any of the Company's mining claims could result in litigation, insurance claims and potential losses affecting its business as a whole.
Coeur Rochester, Inc. (“Coeur Rochester”), the Company's wholly-owned subsidiary, is party to a legal action relating to a third party's assertion of rights to unpatented mining claims at and near the Rochester property in Nevada. Coeur Rochester held 541 U.S. Federal unpatented claims through August 2011. On September 1, 2011, the Company inadvertently missed a claims fee payment to the U.S. Bureau of Land Management (“BLM”) and as a result the prior unpatented mining claims were forfeited. The Company re-staked 516 claims in early December 2011 and August 2012 and filed notices with Pershing County, Nevada and the BLM. The new claims cover the majority of the prior unpatented claim area. A third party asserts that it also staked and filed notices on the Company's original unpatented mining claims and over subsequent new claims that had been previously staked by the Company. The Company believes it holds a superior property interest to the adverse staking party and filed a lawsuit to quiet title in the claims. The mine operates under an approved BLM plan of operations and has continued normal operations while the legal action is pending. The Company believes there will be no effect on the current silver and gold reserves at Coeur Rochester as a result of the claims dispute. However, the Company does believe an adverse outcome would require it to modify existing plans to further expand future mining operations and would require permits to be updated to reflect changes in claim ownership.
There may be challenges to the title of any of the claims comprising the Company's mines that, if successful, could impair development and operations. A defect could result in the Company losing all or a portion of its right, title, estate and interest in and to the properties to which the title defect relates.
The Company has the ability to issue additional equity securities, which would lead to dilution of its issued and outstanding common stock and may materially and adversely affect the price of its common stock.
The issuance of additional equity securities or securities convertible into equity securities would result in dilution of the Company's existing shareholders' equity ownership. The Company is authorized to issue, without shareholder approval, 10,000,000 shares of preferred stock in one or more series, to establish the number of shares to be included in each series and to fix the designation, powers, preferences and relative participating, optional, conversion and other special rights of the shares of each series as well as the qualification, limitations or restrictions on each series. Any series of preferred stock could contain dividend rights, conversion rights, voting rights, terms of redemption, redemption prices, liquidation preferences or other rights superior to the rights of holders of its common stock. If the Company issues additional equity securities, the price of its common stock may be materially and adversely affected.
|
Item 1B.
|
Unresolved Staff Comments
|
None
|
Item 2.
|
Properties
|
SILVER AND GOLD MINING PROPERTIES
The Company’s operating segments include Palmarejo (Mexico), San Bartolomé (Bolivia), Kensington (Alaska, USA), Rochester (Nevada, USA), Martha (Argentina), and Endeavor (New South Wales, Australia). See Note 22— Segment Reporting in the notes to the Consolidated Financial Statements, for information relating to its business segments and its domestic and export sales.
Mexico — Palmarejo
The Palmarejo surface and underground silver and gold mine, and associated milling operation, owned and operated by Coeur Mexicana, is located in the state of Chihuahua, Mexico. Access to the property is provided by air, rail, and all-weather paved and gravel roads from the state capitol of Chihuahua.
For the full year ended
2012
, Palmarejo produced
8.2
million ounces of silver and
106,038
ounces of gold, compared to
9.0
million ounces of silver and
125,071
ounces of gold in
2011
. Cash operating costs per ounce and total cash costs per ounce of silver for
2012
were both
$1.33
. See "Item 7. Management's Discussion and Analysis of Financial Condition and Results of Operations - Reconciliation of Non-GAAP Cash Costs to GAAP Production Costs." Metal sales in
2012
from Palmarejo totaled
$442.1
million, or
49%
of the Company's total metal sales, compared with $513.1 million, or 50% of the Company's total metal sales in 2011. Sales of silver totaled $261.5 million and sales from gold were $180.6 million. Production costs in 2012 totaled
$197.5
million while depreciation and depletion expense was
$146.6
million. Total capital expenditures in 2012 were
$38.5
million.
The low costs per silver ounce are due in part to significant by-product credits from gold production and an increase in price over the last three years. For the years ended December 31, 2012, 2011 and 2010, gold by-product credits were approximately, $21.40, $21.83 and $21.50 per silver ounce, respectively, and were deducted from operating costs in the calculation of cash costs
19
per ounce. If the Company's accounting policy had been changed to treat gold production as a co-product, the following total cash costs per ounce would have been reported:
|
2012
|
2011
|
2010
|
||||||||
|
Cash operating cost per ounce:
|
||||||||||
|
Silver
|
$
|
13.45
|
|
$
|
12.82
|
|
$
|
19.90
|
|
|
|
Gold
|
$
|
742
|
|
$
|
581
|
|
$
|
328
|
|
|
|
Total cash cost per ounce:
|
||||||||||
|
Silver
|
$
|
13.45
|
|
$
|
12.82
|
|
$
|
19.90
|
|
|
|
Gold
|
$
|
742
|
|
$
|
581
|
|
$
|
328
|
|
|
The Company’s property position at Palmarejo is large, consisting of contiguous mining concessions totaling 30,278 acres (12,253 hectares or 47 square miles) in size located in the south east part of the state of Chihuahua. Of the total concessions, 32 concessions consisting of 47 square miles (12,204 hectares) are owned 100% by Coeur Mexicana, formerly Planet Gold S.A. de C.V. (a wholly-owned subsidiary of the Company), and the remaining three concessions, representing 0.19 square miles (48.77 hectares) are partially owned (50 to 60%) by Coeur Mexicana. All of the Company’s ore reserves are located on concessions owned 100% by Coeur Mexicana. All concessions owned by Coeur Mexicana are valid until at least 2029. In addition to Palmarejo, the Company also controls 21,016 acres (8,505 hectares) of concessions at the Yécora exploration-stage property located in the state of Sonora, near the border with Chihuahua, and 17,717 acres (7,170 hectares) of concessions at the La Guitarra exploration-stage property in Chihuahua, south-east of Palmarejo.
All property and equipment are in good operating condition with no major maintenance expected. Power is supplied to the property by the local power utility as well as by generators. Water is supplied to the property by pipeline from the Chinipas River and also from recycled process water collected at the site.
Commercial production commenced in April 2009. Recovery of gold has been consistent with the initial metallurgical test work and feasibility study estimates and averaged
94.4
% during 2012, up from 92.2% in 2011. The recovery of silver averaged
83
% during 2012, which was below feasibility study estimates, but up from 76.4% in 2011. Although the Company will continue pursuing adjustments to the plant to increase silver recovery rates, as of
December 31, 2012
, it expects silver recoveries to average 84% for 2013. The Company is researching opportunities to achieve further improvements going forward.
The Palmarejo mine is located on the western flank of the Sierra Madre Occidental, a mountain range that comprises the central spine of northern Mexico. The north-northwest-trending Sierra Madre Occidental is composed of a relatively flat-lying sequence of Tertiary volcanic rocks that forms a volcanic plateau, cut by numerous igneous intrusive rocks. This volcanic plateau is deeply incised in the Palmarejo mine area, locally forming steep-walled canyons. The Sierra Madre Occidental gives way to the west to an extensional terrain that represents the southward continuation of the Basin and Range Province of the western United States, and then to the coastal plain of western Mexico.
The gold and silver deposits at the Palmarejo mine, typical of many of the other silver and gold deposits in the Sierra Madre, are classified as epithermal deposits and are hosted in multiple veins, breccias and fractures. These geologic structures trend generally northwest to southeast and dip either southwest or northeast. The dip on the structures ranges from about 45 degrees to 70 degrees. In the mineralized portions of the structures gold and silver are zoned from top to bottom with higher silver values occurring in the upper parts of the deposit and higher gold values in the lower parts, sometimes accompanied by base metal mineralization, though local variations are common. The Palmarejo property contains a number of mineralized zones or areas of interest. The most important of these to date is the Palmarejo zone in the north of the concessions which covers the old Palmarejo gold-silver mine formed at the intersection of the northwest-southeast trending La Prieta and La Blanca gold-and-silver bearing structures. In addition to Palmarejo, other mineralized vein and alteration systems in the district area have been identified all roughly sub-parallel to the Palmarejo zone. The most significant of these additional targets are the Guadalupe (including Animas) and La Patria vein systems in the southern part of the property which are currently under development and exploration by the Company.
The Company spent $19.9 million in the Palmarejo district in
2012
to discover new silver and gold mineralization and define new ore reserves. This program consisted of drilling 341,975 feet (104,234 meters) of core. The exploration budget for Palmarejo for 2013 is $15.8 million.
20
Year-end Proven and Probable Ore Reserves — Palmarejo Mine
|
2012
|
2011
|
2010
|
||||||
|
|
(1, 2, 3, 4, 5)
|
|
|
|||||
|
Proven
|
|
|
|
|
|
|
||
|
Short tons (000’s)
|
5,747
|
|
4,916
|
|
4,649
|
|
||
|
Ounces of silver per ton
|
4.67
|
|
5.31
|
|
7.12
|
|
||
|
Contained ounces of silver (000’s)
|
26,858
|
|
26,091
|
|
33,096
|
|
||
|
Ounces of gold per ton
|
0.06
|
|
0.07
|
|
0.09
|
|
||
|
Contained ounces of gold
|
348,000
|
|
329,950
|
|
436,600
|
|
||
|
Probable
|
|
|
|
|
|
|
||
|
Short tons (000’s)
|
7,105
|
|
7,581
|
|
9,019
|
|
||
|
Ounces of silver per ton
|
3.69
|
|
4.05
|
|
4.29
|
|
||
|
Contained ounces of silver (000’s)
|
26,251
|
|
30,727
|
|
38,662
|
|
||
|
Ounces of gold per ton
|
0.05
|
|
0.05
|
|
0.05
|
|
||
|
Contained ounces of gold
|
317,000
|
|
358,170
|
|
433,600
|
|
||
|
Proven and Probable
|
|
|
|
|
|
|
||
|
Short tons (000’s)
|
12,852
|
|
12,497
|
|
13,668
|
|
||
|
Ounces of silver per ton
|
4.13
|
|
4.55
|
|
5.25
|
|
||
|
Contained ounces of silver (000’s)
|
53,110
|
|
56,818
|
|
71,758
|
|
||
|
Ounces of gold per ton
|
0.05
|
|
0.06
|
|
0.06
|
|
||
|
Contained ounces of gold
|
665,000
|
|
688,120
|
|
870,200
|
|
||
Year-end Mineralized Material — Palmarejo Mine
|
2012
|
2011
|
2010
|
||||||
|
Short tons (000’s)
|
23,712
|
|
5,062
|
|
4,503
|
|
||
|
Ounces of silver per ton
|
1.93
|
|
3.36
|
|
3.7
|
|
||
|
Ounces of gold per ton
|
0.04
|
|
0.04
|
|
0.04
|
|
||
Operating Data
|
2012
|
2011
|
2010
|
|||||||||
|
Production
|
|
|
|
|
|
|
|||||
|
Ore tons milled
|
2,114,366
|
|
1,723,056
|
|
1,835,408
|
|
|||||
|
Ore grade silver (oz./ton)
|
4.70
|
|
6.87
|
|
4.6
|
|
|||||
|
Ore grade gold (oz./ton)
|
0.05
|
|
0.08
|
|
0.06
|
|
|||||
|
Recovery silver(%)
|
83.0
|
|
76.4
|
|
69.8
|
|
|||||
|
Recovery gold(%)
|
94.4
|
|
92.2
|
|
91.1
|
|
|||||
|
Silver produced (oz.)
|
8,236,013
|
|
9,041,488
|
|
5,887,576
|
|
|||||
|
Gold produced (oz.)
|
106,038
|
|
125,071
|
|
102,440
|
|
|||||
|
Cost per Ounce
|
|
|
|
|
|
|
|||||
|
Cash operating costs
|
$
|
1.33
|
|
$
|
(0.97
|
)
|
$
|
4.10
|
|
||
|
Other cash costs
(6)
|
—
|
|
—
|
|
—
|
|
|||||
|
Cash costs
(7)
|
1.33
|
|
(0.97
|
)
|
4.10
|
|
|||||
|
Non-cash costs
|
17.93
|
|
17.77
|
|
15.56
|
|
|||||
|
Total production costs
|
$
|
19.26
|
|
$
|
16.80
|
|
$
|
19.66
|
|
||
21
|
(1)
|
Current ore reserves are effective as of
December 31, 2012
. Metal prices used in calculating proven and probable reserves were $27.50 per ounce of silver and $1,450 per ounce of gold.
|
|
(2)
|
The ore reserves are underground and open pit mineable and include an allowance for mining dilution and recovery. For the underground-mineable reserves, the dilution and mining recovery is incorporated into the detailed design of each stope for the Palmarejo mine; a 10% dilution at a grade of 0.62 g/t Au and 54 g/t Ag and 100% mining recovery was used for the Guadalupe deposit. For the open pit-minable reserves, the mining dilution and mining recovery was incorporated into a block diluted model for the Palmarejo mine. No open pit reserves are included for the Guadalupe deposit at this time.
|
|
(3)
|
Metallurgical recovery factors of 93% for gold and 63% to 80% for silver were used in estimations for ore reserves for Palmarejo and should be applied to the contained reserve ounces.
|
|
(4)
|
The ore reserves and mineralized material estimates were prepared by W. Orr (Manager of Corporate Technical Services) and the Company’s technical staff with the assistance of an independent consulting firm.
|
|
(5)
|
For the part of the Palmarejo Mine currently in production in surface and underground mining, the proven and probable reserves are defined above an economic cut-off grade demonstrating grade continuity delineated by exploration and definition drill holes with a nominal grid spacing of 15 meters to 45 meters, depending on resource area. Proven reserves is material at a distance of less than or equal to 15 meters from the nearest composite sample with a minimum of two drill holes used in the grade estimate. Probable reserves are defined by distance to the nearest composite sample of between 15 meters and 45 meters and a minimum of two drill holes used in the grade estimate. For the Guadalupe deposit, being developed for underground mining, the proven and probable reserves are defined as mineralized material above an economic cut-off grade demonstrating grade continuity delineated by at least two exploration drill holes within less than 65 meters of each other. Proven reserves were selected from resource areas with average drill hole spacing of 20 meters to less than 35 meters and a minimum of two drill holes used in the grade estimate. The current proven reserve blocks are at an average distance of 12 meters from the nearest composite sample (45 meters maximum), have an average of 4 octants informed for the estimates and were informed by an average of 8 drill holes. Probable reserves were selected from resource areas with average drill hole spacing of 35 meters to less than 80 meters. Probable reserves were further defined by distance to the nearest composite sample of less than approximately 65 meters and a minimum of two drill holes used in the grade estimate. The current probable reserve blocks are at an average of 18 meters from the nearest drill hole (102 meters maximum), have an average of 4 octants informed for the estimates and were informed by an average of 8 drill holes. Mineralized material is similarly classified.
|
|
(6)
|
Includes production taxes and royalties, if applicable.
|
|
(7)
|
Cash costs per ounce of silver or gold represent a non-U.S. GAAP measurement that management uses to monitor and evaluate the performance of its mining operations. See “Item 7. Management’s Discussion and Analysis of Financial Condition and Results of Operations — Reconciliation of Non-GAAP Cash Costs to GAAP Production Costs.”
|
Bolivia — San Bartolomé
The San Bartolomé open pit silver mine, and associated milling operation, operated by Empresa Minera Manquiri SA (“Manquiri”), a wholly-owned subsidiary of the Company, is located on the flanks of the Cerro Rico Mountain bordering the town of Potosí, in the department of Potosí, Bolivia. Access to the property and the Company’s processing facilities is by paved and all-weather gravel roads leading south-southwest from Potosí.
Silver production for
2012
was
5.9
million ounces compared to
7.5
million ounces in 2011. Cash operating costs per ounce for
2012
were
$11.76
per ounce compared to
$9.10
per ounce in
2011
. Total cash costs per ounce (which includes production taxes and royalties) for
2012
were
$12.95
per ounce compared to
$10.64
per ounce in
2011
. See "Item 7. Management's Discussion and Analysis of Financial Condition and Results of Operations - Reconciliation of Non-GAAP Cash Costs to GAAP Production Costs." Metal sales in
2012
were
$178.0
million, representing
20%
of the Company’s total metal sales. One hundred percent of these sales were derived from silver. Production costs in
2012
totaled
$71.4
million and depreciation and depletion expense was
$16.7
million. Total capital expenditures in
2012
were
$25.7
million.
Coeur acquired 100% of the equity in Manquiri from Asarco Incorporated (“ASARCO”) on September 9, 1999. Construction activities commenced in 2004. Manquiri’s principal asset is the mining rights to the San Bartolomé mine. Silver was first discovered in the area around 1545. Mining of silver and lesser amounts of tin and base metals has been conducted nearly continuously since that time from multiple underground mines driven into Cerro Rico. The prior owner did not conduct any mining or processing of the surface ores at San Bartolomé.
The Company completed feasibility studies in 2000 and 2004, which concluded that an open pit mine was potentially capable of producing approximately six million ounces of silver annually.
The property, plant and equipment are maintained in good working condition through a regular preventative maintenance program with periodic improvements as required. Power is supplied to the property by the local power utility. Water is supplied to the property by a public water source.
22
The Bolivian tax rate on most mining companies is 37.5%. However, mining companies that produce a doré product, as the San Bartolomé mine does, will receive a 5% credit based upon their specific operation. Thus, the tax rate for San Bartolomé is 32.5%.
The Company obtained political risk insurance policies from the Overseas Private Insurance Corporation (“OPIC”) and another private insurer and is self-insured for $23.3 million. The combined policies are in the amount of $155.0 million and cover Coeur up to the lesser of $131.8 million or 85.0% of any loss arising from expropriation, political violence or currency inconvertibility. The policy costs were capitalized during the development and construction phases and are now included as a cost of inventory produced over the term of the policies which expire in 2019 and 2024.
The silver mineralization at San Bartolomé is hosted in unconsolidated sediments (pallacos) and reworked sediments (sucus and troceras) and oxide stockpiles and dumps (desmontes) from past mining that occurred on the flanks of Cerro Rico. Cerro Rico is a prominent mountain in the region that reaches an elevation of over 15,400 feet (over 4,700 meters). It is composed of Tertiary-aged volcanic and intrusive rocks that were emplaced into and over older sedimentary, and volcanic, basement rocks. Silver, along with tin and base metals, is located in multiple veins and vein swarms and stockworks that occur in a northeast trending belt which transects Cerro Rico. The upper parts of the Cerro Rico mineralized system were subsequently eroded and re-deposited into the flanking gravel deposits. Silver is hosted in all portions of the pallacos, sucus, and troceras with the best grades segregated to the coarser-grained silicified fragments. These deposits lend themselves to simple, free digging surface mining techniques and can be extracted without drilling and blasting. Of the several pallaco deposits which are controlled by Coeur and surround Cerro Rico, three are of primary importance and are known as Huacajchi, Diablo and Santa Rita.
The mineral rights for the San Bartolomé mine are held through joint venture and long-term lease agreements with several independent mining cooperatives and the Bolivian state-owned mining organization COMIBOL. Manquiri controls 47.93 square kilometers (11,578 acres) of land at San Bartolomé around Cerro Rico under contracts and concessions and approximately 37.45 square kilometers (8.95 acres) of concessions at the Rio Blanco property, a gold exploration target south of Potosí. The San Bartolomé lease agreements expire between 2021 and 2028 and are generally subject to a production royalty payable partially to the cooperatives and partially to COMIBOL. The royalty rate is 3% at silver prices below $4 per ounce and 6% at prices above $8 per ounce. The rate is a factor of 75% of the silver price between $4 and $8. The Company has additional mining rights known as the Plahipo project which include the mining rights to oxide dumps adjacent to the original property package. The oxide dumps included in the Plahipo project are subject to a sliding scale royalty payable to COMIBOL that is a function of silver price. The Company incurred royalty payment obligations to COMIBOL and the Cooperatives for these mining rights totaling $7.1 million and $11.6 million for the years ended
2012
and
2011
, respectively.
On October 14, 2009, the Bolivian state-owned mining company, Corporación Minera de Bolivia (“COMIBOL”), announced by resolution that it was temporarily suspending mining activities above the elevation of 4,400 meters above sea level while stability studies of the Cerro Rico mountain are undertaken. The Company holds rights to mine above this elevation under valid contracts with COMIBOL as well as under authorized contracts with local mining cooperatives that hold their rights under contract themselves with COMIBOL. The Company temporarily adjusted its mine plan to confine mining activities to the ore deposits below 4,400 meters above sea level and timely notified COMIBOL of the need to lift the restriction. The Cooperative Reserva Fiscal, with which the Company has one of those contracts, subsequently interpreted the COMIBOL resolution and determined that the Huacajchi deposit was not covered by such resolution. In March 2010, the Cooperative Reserva Fiscal notified COMIBOL that, based on its interpretation, it was resuming mining of high grade material above the 4,400 meter level in the Huacajchi deposit. In December 2011, the Cooperative Reserva Fiscal sent a similar notification to COMIBOL with respect to a further area above the 4,400 meter level known as Huacajchi Sur. Based on these notifications and on the absence of any objection from COMIBOL, the Company resumed mining operations at the San Bartolomé mine on the Huacajchi deposit and Huacajchi Sur. Mining in other areas above the 4,400 meter level continue to be suspended. The partial suspension may reduce production until the Company is able to resume mining above 4,400 meters generally. It is uncertain at this time how long the suspension will remain in place. In addition, it is possible that COMIBOL may decide that the Company's operations at the Huacajchi deposit or Huacajchi Sur are subject to the COMIBOL resolution, which may force the Company to cease mining at such deposits. If COMIBOL objects to the Company mining at the Huacajchi deposit or Huacajchi Sur or if the other restrictions are not lifted, it may need to write down the carrying value of the asset. It is also uncertain if any new mining or investment policies or shifts in political attitude may affect mining in Bolivia. Access to the Huacajchi deposit and its higher grade material is having beneficial effect on production and cost at the mine. The Company does not use explosives in its surface-only mining activities and is sensitive to the preservation of the mountain under its contracts with the state-owned mining entity and the local cooperatives.
In 2012, exploration trenching and sampling was performed at San Bartolomé to expand the ore reserves. This program cost $0.4 million and 4,288 feet (1,307 meters) of trenching was accomplished and sampled in 2012. A similar program is planned for 2013 at an estimated cost of $0.6 million.
23
Year-end Proven and Probable Ore Reserves — San Bartolomé Mine
|
2012
|
2011
|
2010
|
||||||
|
|
(1, 2, 3, 4)
|
|
|
|||||
|
Proven
|
|
|
|
|
|
|
||
|
Short tons (000’s)
|
1,187
|
|
959
|
|
476
|
|
||
|
Ounces of silver per ton
|
2.92
|
|
3.01
|
|
3.62
|
|
||
|
Contained ounces of silver (000’s)
|
3,460
|
|
2,888
|
|
1,723
|
|
||
|
Probable
|
|
|
|
|
|
|
||
|
Short tons (000’s)
|
41,699
|
|
43,556
|
|
27,602
|
|
||
|
Ounces of silver per ton
|
2.53
|
|
2.64
|
|
3.81
|
|
||
|
Contained ounces of silver (000’s)
|
105,628
|
|
115,192
|
|
105,295
|
|
||
|
Proven and Probable
|
|
|
|
|
|
|
||
|
Short tons (000’s)
|
42,886
|
|
44,515
|
|
28,078
|
|
||
|
Ounces of silver per ton
|
2.54
|
|
2.65
|
|
3.81
|
|
||
|
Contained ounces of silver (000’s)
|
109,088
|
|
118,080
|
|
107,018
|
|
||
Year-end Mineralized Material — San Bartolomé Mine
|
2012
|
2011
|
2010
|
||||||
|
Short tons (000’s)
|
20,040
|
|
21,264
|
|
36,953
|
|
||
|
Ounces of silver per ton
|
2.27
|
|
2.59
|
|
1.75
|
|
||
Operating Data
|
2012
|
2011
|
2010
|
|||||||||
|
Production
|
|
|
|
|
|
|
|||||
|
Tons ore milled
|
1,477,271
|
|
1,567,269
|
|
1,504,779
|
|
|||||
|
Ore grade silver (oz./ton)
|
4.49
|
|
5.38
|
|
5.03
|
|
|||||
|
Recovery silver(%)
|
89.5
|
|
88.9
|
|
88.6
|
|
|||||
|
Silver produced (oz.)
|
5,930,394
|
|
7,501,367
|
|
6,708,775
|
|
|||||
|
Cost per Ounce of Silver
|
|
|
|
|
|
|
|||||
|
Cash operating costs
|
$
|
11.76
|
|
$
|
9.10
|
|
$
|
7.87
|
|
||
|
Other cash costs(5)
|
1.19
|
|
1.54
|
|
0.80
|
|
|||||
|
Cash costs(6)
|
12.95
|
|
10.64
|
|
8.67
|
|
|||||
|
Non-cash costs
|
2.86
|
|
3.11
|
|
3.05
|
|
|||||
|
Total production costs
|
$
|
15.81
|
|
$
|
13.75
|
|
$
|
11.72
|
|
||
|
(1)
|
Current ore reserves are effective as of December 31, 2012. The metal price used for current ore reserves was $27.50 per ounce of silver.
|
|
(2)
|
Ore reserves are open pit-minable and include a mining recovery such that 15 cm buffer of ore material above the bedrock was excluded from the reserve; this equates to a mining recovery of 99.0%. Metallurgical recovery factors of 77% to 86% were used in estimations for ore reserves for San Bartolomé and should be applied to the contained reserve ounces.
|
|
(3)
|
Ore reserves and mineralized material estimates were prepared by W. Orr (Manager of Corporate Technical Services) and the Company’s technical staff with the assistance of an independent consulting firm.
|
|
(4)
|
Proven and probable ore reserves are defined by surface drill holes, trenches, and pits (pozos) with an average spacing of no more than 230 feet (70 meters). Proven reserves are those reserves in stockpile as of December 31, 2012. The grade of ore reserve block is determined by the grade of proximal drill hole and/or pit composites and three-dimensional models of geologic controls. A minimum of 8 and maximum of 20 composite were used to classify proven and probable ore reserves and variable geostatistical estimation variances. Mineralized Material is similarly classified.
|
|
(5)
|
Includes production taxes and royalties, if applicable.
|
24
|
(6)
|
Costs per ounce of silver represent a non-U.S. GAAP measurement that management uses to monitor and evaluate the performance of its mining operations. See “Item 7. Management’s Discussion and Analysis of Financial Condition and Results of Operations Reconciliation of Non-GAAP Cash Costs to GAAP Production Costs.”
|
USA — Alaska-Kensington Mine
The Kensington underground gold mine and associated milling facilities are located on the east side of the Lynn Canal about 45 miles north-northwest of Juneau, Alaska. The Kensington mine commenced commercial production on July 3, 2010. The mine is accessed by a horizontal tunnel and utilizes conventional and mechanized underground mining methods. Ore is processed in a flotation mill that produces a concentrate which is sold to third party smelters. Waste material is deposited in an impoundment facility on the property. Power is supplied to the site by on-site diesel generators. Access to the project is by either a combination of road vehicles, boat, helicopter, float plane, or by boat direct from Juneau.
Production at Kensington was
82,125
ounces of gold in
2012
. Metal sales in
2012
at Kensington were
$111.0
million, or
12%
of total sales. Production costs were
$87.1
million and depreciation and depletion expense was
$41.6
million. The Company's capital expenditures at the Kensington mine totaled approximately
$37.0
million in
2012
.
In December of 2011, Kensington entered a six month period where processing levels were reduced by 50% to approximately 700 tons per day. The reduction in ore processing was required to allow work to be completed on several infrastructure projects. This allowed the mine to implement and complete several key initiatives, including:
|
•
|
accelerated underground development, resulting in more working faces and greater operational flexibility;
|
|
•
|
large in-fill drilling program to better define the high-grade ore zones and improve the mine plan;
|
|
•
|
completion and commissioning of the underground paste backfill plant and related distribution system, providing access to stopes located in previously mined areas;
|
|
•
|
upgrading and completing construction of several underground and surface facilities; and
|
|
•
|
improving overall safety of the operation.
|
All initiatives have been completed and the Kensington mine has resumed full production.
Coeur Alaska, Inc., (“Coeur Alaska”), a wholly-owned subsidiary of the Company, controls two contiguous land groups: the Kensington and Jualin properties. The Kensington property consists of 51 private patented lode and mill-site claims covering approximately 768 acres, 294 federal unpatented lode claims covering approximately 3,894 acres, and eight State of Alaska mining claims covering approximately 96 acres. The Company controls the Jualin Property, under a lease agreement with Hyak Mining Company, through the cessation of mining, so long as the Company makes timely payments pursuant to the lease agreement. The Jualin Property consists of 23 patented lode and mill-site claims covering approximately 381 acres, 438 federal unpatented lode claims and one unpatented mill-site claim covering approximately 8,617 acres, and 17 State of Alaska mining claims covering approximately 341 acres. The federal and state claims, as well as the private patented lode and mill-site claims, provide Coeur with the necessary rights to mine and process ore from Kensington. All of the Company’s Alaska ore reserves are located within the patented claims. The unpatented claims and mill site are maintained via annual filings and fees to the U.S. Bureau of Land Management (BLM), which acts as administrator of the claims. State claims are maintained via filings and fees to Alaska Department of Natural Resources — Juneau Recorder’s Office. Real property taxes are paid yearly to the City and Borough of Juneau for the patented claims. Lease payments are paid annually and all leases are in good standing.
Coeur Alaska is obligated to pay a scaled net smelter return royalty on 1.0 million ounces of future gold production after Coeur Alaska recoups the $32.5 million purchase price and its construction and development expenditures incurred after July 7, 1995 in connection with placing the property into commercial production. The royalty ranges from 1% at $400 per ounce gold prices to a maximum of 2.5% at gold prices above $475 per ounce, with the royalty to be capped at 1.0 million ounces of production.
The Kensington ore deposit consists of multiple gold bearing mesothermal, quartz, carbonate and pyrite vein swarms and discrete quartz-pyrite veins hosted in Cretaceous-aged Jualin diorite. Most of the gold is contained in calaverite (AuTe
2
) which occurs in association with native gold as inclusions in and interstitial to pyrite grains and in microfractures in pyrite.
The Company spent $4.1 million on exploration at Kensington in
2012
, completing 60,666 feet (20,137 meters) of core drilling during the year and plans to spend $9.4 million on exploration in 2013.
25
Year-end Proven and Probable Ore Reserves — Kensington Mine
|
2012
|
2011
|
2010
|
||||||
|
|
(1, 2, 3, 4, 5)
|
|
|
|||||
|
Proven
|
|
|
|
|
|
|
||
|
Short tons (000’s)
|
647
|
|
1,164
|
|
319
|
|
||
|
Ounces of gold per ton
|
0.28
|
|
0.28
|
|
0.45
|
|
||
|
Contained ounces of gold (000’s)
|
179
|
|
326
|
|
145
|
|
||
|
Probable
|
|
|
||||||
|
Short tons (000’s)
|
4,020
|
|
4,842
|
|
5,618
|
|
||
|
Ounces of gold per ton
|
0.21
|
|
0.21
|
|
0.23
|
|
||
|
Contained ounces of gold (000’s)
|
837
|
|
1,014
|
|
1,265
|
|
||
|
Proven and Probable
|
|
|
|
|
|
|
||
|
Short tons (000’s)
|
4,667
|
|
6,006
|
|
5,937
|
|
||
|
Ounces of gold per ton
|
0.22
|
|
0.22
|
|
0.24
|
|
||
|
Contained ounces of gold (000’s)
|
1,016
|
|
1,340
|
|
1,410
|
|
||
Year-end Mineralized Material — Kensington Mine
|
2012
|
2011
|
2010
|
||||||
|
Short tons (000’s)
|
2,606
|
|
3,039
|
|
2,504
|
|
||
|
Ounces of gold per ton
|
0.20
|
|
0.19
|
|
0.19
|
|
||
Operating Data
|
2012
|
2011
|
2010
|
|||||||||
|
Production
|
|
|
|
|
|
|
|||||
|
Ore tons milled
|
394,780
|
|
415,340
|
|
174,028
|
|
|||||
|
Ore grade gold (oz./ton)
|
0.22
|
|
0.23
|
|
0.28
|
|
|||||
|
Recovery gold(%)
|
95.6
|
|
92.7
|
|
89.9
|
|
|||||
|
Gold produced (oz.)
|
82,125
|
|
88,420
|
|
43,143
|
|
|||||
|
Cost per Ounce
|
|
|
|
|
|
|
|||||
|
Cash operating costs
|
$
|
1,358
|
|
$
|
1,088
|
|
$
|
989
|
|
||
|
Other cash costs(6)
|
—
|
|
—
|
|
—
|
|
|||||
|
Cash costs(7)
|
1,358
|
|
1,088
|
|
989
|
|
|||||
|
Non-cash costs
|
507
|
|
406
|
|
405
|
|
|||||
|
Total production costs
|
$
|
1,865
|
|
$
|
1,494
|
|
$
|
1,394
|
|
||
|
(1)
|
Current ore reserves are effective as of December 31, 2012. Metal price used in calculating proven and probable reserves was $1,450 per ounce of gold.
|
|
(2)
|
The ore reserves are underground minable and include factors for mining dilution and recovery. A factor of approximately 10% additional tonnage at a grade of 0.063 ounces of gold per ton of dilution was included. An average 91% mining recovery was included.
|
|
(3)
|
Metallurgical recovery factor of 94.5% should be applied to the contained gold reserve ounces.
|
|
(4)
|
The ore reserves and mineralized material estimates were estimated by J. Barry (Mine Engineer) of the Company’s technical staff with the assistance of an independent consultant. Independent consultant groups have performed independent reviews of the Company’s resource estimate model used to prepare the ore reserve estimates.
|
|
(5)
|
Proven and probable reserves are defined underground drilling and underground workings. In practice, reserve blocks are defined by the number of proximal composites and three-dimensional geologic controls. Proven ore reserves include stockpiled ore. Ore reserve must be defined by at least 10 drill samples from at least 2 drill holes spaced not more than 60 feet from the block center. Mineralized material is similarly classified.
|
|
(6)
|
Includes production taxes and royalties, if applicable.
|
26
|
(7)
|
Cash costs per ounce of silver or gold represent a non-U.S. GAAP measurement that management uses to monitor and evaluate the performance of its mining operations. See “Item 7. Management’s Discussion and Analysis of Financial Condition and Results of Operations — Reconciliation of Non-GAAP Cash Costs to GAAP Production Costs.”
|
USA — Nevada-Rochester Mine
The Rochester mine and associated heap leach facilities is an open pit silver and gold mine located in Pershing County, Nevada, which is located approximately 25 miles of paved and all-weather gravel road northeast of the town of Lovelock. The Company owns 100% of the Rochester Mine through the Company’s wholly-owned subsidiary, Coeur Rochester, Inc. (“Coeur Rochester”). The mine consists of the main Rochester deposit and the adjacent Nevada Packard deposit, due south of Rochester.
Production at the Rochester mine in
2012
was approximately
2.8
million ounces of silver and
38,066
ounces of gold, compared to approximately
1.4
million ounces of silver and
6,276
ounces of gold in
2011
. Production was higher due to increased ounces recovered from the ore on the new leach pad that was constructed in 2011. Cash operating costs per ounce of silver decreased to
$9.62
per ounce in
2012
, compared to $22.97 per ounce in
2011
. Total cash costs per ounce of silver (which includes production taxes and royalties) were
$11.65
per ounce in
2012
compared to $24.82 per ounce in
2011
. This decrease was primarily due to the increase in ore produced from the new leach pad. Rochester’s total metal sales in
2012
totaled
$132.4
million, or approximately
15%
of the Company’s total metal sales. Approximately 59% of Rochester’s metal sales were derived from silver, while 41% were derived from gold. Production costs totaled
$74.3
million in
2012
and depreciation and depletion expenses were
$8.1
million, compared to $28.3 million and $2.8 million in
2011
. The Company’s capital expenditures at the Rochester mine totaled approximately
$11.8
million in
2012
. The Company plans capital expenditures at the Rochester mine of $32.5 million in 2013, primarily for infrastructure to support further expansion.
The low costs per silver ounce are due in part to significant by-product credits from gold production and an increase in price over the last three years. For the years ended December 31, 2012, 2011 and 2010, gold by-product credits were approximately, $22.65, $7.11 and $5.81 per silver ounce, respectively, and were deducted from operating costs in the calculation of cash costs per ounce. If the Company's accounting policy had been changed to treat gold production as a co-product, the following total cash costs per ounce would have been reported:
|
2012
|
2011
|
2010
|
||||||||
|
Cash operating cost per ounce:
|
||||||||||
|
Silver
|
$
|
19.20
|
|
$
|
25.34
|
|
$
|
4.20
|
|
|
|
Gold
|
$
|
962
|
|
$
|
1,050
|
|
$
|
952
|
|
|
|
Total cash cost per ounce:
|
||||||||||
|
Silver
|
$
|
20.40
|
|
$
|
26.91
|
|
$
|
4.61
|
|
|
|
Gold
|
$
|
1,023
|
|
$
|
1,115
|
|
$
|
1,045
|
|
|
Coeur Rochester held 541 U.S. Federal unpatented claims, of which 66 were under lease agreements, and 22 patented claims, totaling approximately 8,600 acres through August 2011. On September 1, 2011, the Company inadvertently missed paying the 2012 assessment year claim maintenance fees to the U.S. Bureau of Land Management (BLM) and as a result the prior unpatented mining claims were forfeited. In December 2011 and August 2012, the Company located new claims on ground covered by the previous unpatented mining claims, including those subject to lease agreements. The new claims total 516 covering approximately 9,282 acres, and cover the majority of the prior unpatented claim area.
With respect to the claims that were held under lease agreements, the Company has continued to pay lease fees to the lessors according to the rates set forth in the lease agreements. The Company is not currently mining on any of the leased claims, and the Company does not believe these claims to be individually or collectively material to the Company's cash flows or the Rochester property's current plan of operations approved by the BLM. The Company uses the property on which the leased claims are located principally to facilitate access to other portions of the Rochester property and to provide space for infrastructure. None of the lessors has initiated or threatened any litigation against the Company with respect to the leases or the Company's continued use of the lessors' property.
A substantial portion of the new claims is the subject of a legal dispute stemming from competing asserted interests in the claims. A third party asserts that it also staked and filed notices on the Company's original unpatented mining claims and over subsequent new claims that had been previously staked by the Company. The Company believes it holds a superior property interest to the adverse staking party and filed a lawsuit to quiet title in the claims. The mine operates under an approved BLM plan of operations and has continued normal operations while the legal action is pending. The Company believes there will be no impact to the current silver and gold reserves at Coeur Rochester as a result of the claims dispute.
Furthermore, the Company believes that it would retain access to all active mining areas of the Rochester property
27
notwithstanding an adverse outcome. Because surface access is governed by the approved BLM plan of operations and not by claim ownership, the Company believes that it would retain surface access to all areas of property within the approved BLM plan of operations. However, the Company does believe an adverse outcome would cause it to modify existing plans to further expand future mining operations and would require permits to be updated to reflect changes in claim ownership arising from an adverse outcome. See Note 23 - Litigation and Other Events for information relating to the unpatented mining claims dispute at Rochester.
The claims dispute has not resulted in any changes to the Company's BLM-approved plan of operations for the Rochester property, or any effect on the Company's leaching activities or stockpiles. The Company does not expect any such changes or effects unless the claims dispute is finally resolved against the Company. In the event all claims in dispute were resolved in favor of the adverse party, the Company cannot determine whether any fees or amounts would be awarded to the adverse party for adverse land use, or what the amount or range of such fees or amounts might be. However, the Company would not be subject to BLM fees for any such adverse land use within the BLM-approved plan of operations. The effect on the Company's leaching operations or stockpiles could depend on further BLM proceedings or private negotiations with respect to surface uses of the claims in dispute. The Company estimates that approximately 53,261,000 short tons of mineralized material, averaging 0.46 and 0.003 silver and gold ounces per ton, respectively, is affected by the claim dispute.
On December 20, 2011, the Sixth Judicial District Court of Nevada issued a preliminary injunction, enjoining Rye Patch from entering certain active mine areas at the Coeur Rochester mine operation. A map showing the boundary established by the preliminary injunction is filed as Exhibit 99.1 attached to this Form 10-K and available online at http://www.coeur.com/operations/rochester-nevada/rochester-claims-dispute.
The Company acquired the Rochester property from ASARCO in 1983 and commenced mining in 1986. No mining or processing was conducted at Rochester by the prior owner. The Company acquired its initial interest in the adjacent Nevada Packard property in 1996, completed the full purchase in 1999 and commenced mining in 2003. Very limited mining and processing was conducted at Nevada Packard by the prior owner. Collectively, the Rochester and Nevada Packard properties comprise the Company’s Rochester silver and gold mining and processing operation.
The Rochester mine is fully supported with electricity, supplied by a local power company on their public grid, telephone and radio communications, production water wells, and processing, maintenance, warehouse, and office facilities. All of these facilities are in good operating condition with no major maintenance expected. The mine utilizes the heap leaching process to extract both silver and gold from ore mined using conventional open pit methods.
Gold and silver are recovered by heap leaching of crushed open-pit ore placed on pads located east of the Rochester mining area. Based upon actual operating experience and metallurgical testing, the Company estimates ultimate recovery rates from the crushed ore of 61.0% for silver, depending on the ore being leached, and 92.0% for gold. See Note 3 — Summary of Significant Accounting Policies to the Consolidated Financial Statements included herein, for further discussion.
The Company commenced studies to investigate the potential to recommence mining and leaching of new material in 2008 and completed feasibility studies in 2009 and 2010 demonstrating the viability of an expansion of mining and leaching operations at its Rochester mine through 2017. The Company prepared an Amended Plan of Operations for resumption of mining within the existing and permitted Rochester pit and construction of an additional heap leach pad, all within the currently permitted mine boundary. The Bureau of Land Management (BLM) deemed this plan complete in August 2009 under federal regulations and initiated the National Environmental Policy Act process. The BLM issued a positive Decision Record (DR) for the mine to extend silver and gold mining operations by several years with new production ounces being recovered in the fourth quarter of 2011.
At Rochester, silver and gold mineralization is hosted in folded and faulted volcanic rocks of the Rochester Formation and overlying Weaver Formation. Silver and gold, consisting of silver sulfosalt minerals, argentite, silver-bearing tetrahedrite and minor native gold, are contained in zones of multiple quartz veins and veinlets (vein and vein swarms and stockworks) with variable amounts of pyrite.
The Company is obligated to pay a net smelter royalty interest to ASARCO, the prior owner, when the average quarterly market price of silver equals or exceeds $23.60 per ounce indexed for inflation up to a maximum rate of 5%. Royalty expense was $3.5 million, $2.2 million and $0.2 million for the years ended December 31, 2012, 2011 and 2010, respectively.
In 2012, exploration expenditures of $3.9 million funded 138,121 feet (42,099 meters) of reverse circulation, vibratory rotary (Sonic) and core drilling. The 2013 budget for exploration is $3.5 million.
28
Year-end Proven and Probable Ore Reserves — Rochester Mine
|
2012
|
2011
|
2010
|
||||||
|
|
(1, 2, 3, 4, 5, 8, 9)
|
|
|
|||||
|
Proven
|
|
|
|
|
|
|
||
|
Short tons (000’s)
|
56,304
|
|
31,532
|
|
35,959
|
|
||
|
Ounces of silver per ton
|
0.54
|
|
0.59
|
|
0.54
|
|
||
|
Contained ounces of silver (000’s)
|
30,501
|
|
18,681
|
|
19,499
|
|
||
|
Ounces of gold per ton
|
0.004
|
|
0.006
|
|
0.005
|
|
||
|
Contained ounces of gold
|
230,000
|
|
178,800
|
|
196,100
|
|
||
|
Probable
|
|
|
|
|
|
|
||
|
Short tons (000’s)
|
23,619
|
|
15,747
|
|
12,312
|
|
||
|
Ounces of silver per ton
|
0.61
|
|
0.69
|
|
0.65
|
|
||
|
Contained ounces of silver (000’s)
|
14,396
|
|
10,892
|
|
8,057
|
|
||
|
Ounces of gold per ton
|
0.003
|
|
0.004
|
|
0.004
|
|
||
|
Contained ounces of gold
|
78,000
|
|
68,200
|
|
51,300
|
|
||
|
Proven and Probable
|
|
|
|
|
|
|
||
|
Short tons (000’s)
|
79,923
|
|
47,279
|
|
48,271
|
|
||
|
Ounces of silver per ton
|
0.56
|
|
0.63
|
|
0.57
|
|
||
|
Contained ounces of silver (000’s)
|
44,897
|
|
29,573
|
|
27,556
|
|
||
|
Ounces of gold per ton
|
0.004
|
|
0.005
|
|
0.005
|
|
||
|
Contained ounces of gold
|
308,000
|
|
247,000
|
|
247,400
|
|
||
Year-end Mineralized Material — Rochester Mine
|
2012
|
2011
|
2010
|
||||||
|
Short tons (000’s)
|
264,283
|
|
251,472
|
|
215,603
|
|
||
|
Ounces of silver per ton
|
0.46
|
|
0.45
|
|
0.44
|
|
||
|
Ounces of gold per ton
|
0.003
|
|
0.003
|
|
0.003
|
|
||
Operating Data
|
2012
|
2011
|
2010
|
|||||||||
|
Production
|
|
|
|
|
|
|
|||||
|
Tons ore mined
|
11,710,795
|
|
2,028,889
|
|
—
|
|
|||||
|
Tons ore crushed
|
8,926,598
|
|
1,782,971
|
|
—
|
|
|||||
|
Ore grade silver (oz./ton)
|
0.55
|
|
0.47
|
|
—
|
|
|||||
|
Ore grade gold (oz./ton)
|
0.0047
|
|
0.0047
|
|
—
|
|
|||||
|
Recovery/Ag oz(%)
|
57.0
|
|
165.1
|
|
—
|
|
|||||
|
Recovery/Au oz(%)
|
89.9
|
|
75.6
|
|
—
|
|
|||||
|
Silver produced (oz.)
|
2,801,405
|
|
1,392,433
|
|
2,023,423
|
|
|||||
|
Gold produced (oz.)
|
38,066
|
|
6,276
|
|
9,641
|
|
|||||
|
Cost per Ounce
|
|
|
|
|
|
|
|||||
|
Operating cash costs
|
$
|
9.62
|
|
$
|
22.97
|
|
$
|
2.93
|
|
||
|
Other cash costs
(6)
|
2.03
|
|
1.85
|
|
0.85
|
|
|||||
|
Cash costs
(7)
|
11.65
|
|
24.82
|
|
3.78
|
|
|||||
|
Non-cash costs
|
2.40
|
|
2.39
|
|
1.04
|
|
|||||
|
Total production costs
|
$
|
14.05
|
|
$
|
27.21
|
|
$
|
4.82
|
|
||
29
|
(1)
|
Current ore reserves are open-pit minable, and in surface stockpiles, effective as of December 31, 2012. Metal prices used in calculating proven and probable reserves were $27.50 per ounce of silver and $1,450 per ounce of gold.
|
|
(2)
|
No factors for mining dilution or recovery are applied to open-pit ore reserves.
|
|
(3)
|
Metallurgical recovery for oxide ore were 61% for silver and 92% for gold. Approximately .08 million tons (3.8%) of sulfide bearing ore is included in the total ore reserves at lower metallurgical recovery rates. However, ultimate recoveries will not be known until leaching operations cease. Current recovery may vary significantly from ultimate recovery, calculated based on the ounces recovered as a percent of the ounces placed on the pad. The ore reserves and mineralized material estimates were estimated by C. Kiel (Superintendent of Rochester Technical Services) and the Company’s technical staff. An independent consulting group reviewed engineering studies and a consulting firm modeled drilling results and updated the estimates of mineralized material.
|
|
(4)
|
Ore reserves are defined by drilling on a grid of 100 feet by 200 feet, or closer, and include open pit mine production sampling to assist with determination of gold and silver grades. The grade is defined by the number of proximal drill-hole composited assay values and three-dimensional geologic controls. The number of drill samples used in estimation of grades must be at least 4 with a maximum search distance of 150 feet at Rochester and 120 feet at Nevada Packard. Mineralized material is similarly classified.
|
|
(5)
|
Mining and crushing operations temporarily terminated in August 2007 and resumed in 2011.
|
|
(6)
|
Includes production taxes and royalties, if applicable.
|
|
(7)
|
Cash costs per ounce of silver or gold represent a non-U.S. GAAP measurement that management uses to monitor and evaluate the performance of its mining operations. See "Item 7, Management’s Discussion and Analysis of Financial Condition and Results of Operations Reconciliation of Non-GAAP Cash Costs to GAAP Production Costs.”
|
|
(8)
|
The Company believes there will be no impact to current silver and gold reserves at Coeur Rochester as a result of the ongoing claims dispute.
|
|
(9)
|
Current mineralized material estimates were determined from within both disputed and undisputed claims and from historic surface stockpiles. While the Company believes it holds a superior position in the ongoing claim dispute, the Company believes an adverse legal outcome would cause it to modify mineralized material estimates.
|
Argentina — Martha Mine
The Martha underground silver and gold mine, and associated milling operation, owned and operated by Coeur Argentina S.R.L., a wholly-owned subsidiary of the Company, is located in the Santa Cruz Province of southern Argentina. Access to the property is provided by all-weather gravel roads leading 30 miles northeast of the town of Gobernador Gregores. The Martha mine ceased active mining operations in September 2012. The Company recorded an impairment charge of
$5.8
million in the twelve months ended December 31, 2012.
Production at the Martha mine in
2012
was approximately
0.3
million ounces of silver and
257
ounces of gold compared to
0.5
million ounces of silver and
615
ounces of gold in
2011
. The
38.9%
decrease in silver production was primarily due to a decrease in ore grade in 2012. Cash operating costs per ounce for
2012
were
$49.77
per ounce compared to
$32.79
per ounce in
2011
. Total cash costs per ounce of silver (which includes production taxes and royalties) were
$50.71
in
2012
compared to
$34.08
in
2011
. The increase in total cash costs per ounce was attributed to the decrease in silver production as compared to
2011
. Metal sales in
2012
totaled
$13.2
million at Martha. Production costs totaled
$17.7
million and depreciation and depletion expenses were
$0.7
million, compared with
$15.5
million and
$0.6
million in
2011
. Total capital expenditures at the Martha mine in
2012
were
$1.2
million.
The mineral rights for the Martha property are fully-owned by Coeur Argentina S.R.L. Mineral rights owned by Coeur Argentina S.R.L. in the Santa Cruz Province (excluding Joaquin) total 166 square miles (43,214 hectares) of exploration concessions ("Cateos"), 275 square miles (71,281 hectares) of discovery concessions ("Manifestaciones de Descubrimiento" or "MDs"), and 3.0 square miles (774 hectares) of exploitation concessions ("concesiones de exploitacion"). Martha is centered on the exploitation concessions, which fully cover the area of the mine infrastructure and the ore reserves reported herein. Concessions do not have an expiration date, subject only to required annual fees. Surface rights covering the Martha deposit are controlled by the 137.8 square mile (35,705-hectare) Cerro Primero de Abril Estancia which is owned by Coeur Argentina S.R.L. Included on the estancia is a 60-person camp, mine and exploration offices, and assay laboratory.
The Company acquired the property in 2002 and is obligated to pay a 2.0% net smelter royalty on silver and gold production to Royal Gold Corporation. In addition, the Company is subject to a 3.0% net proceeds royalty payable to the Province of Santa Cruz. The Company incurred royalty expense totaling $0.3 million, $0.7 million and $1.5 million for the years ended
2012
,
2011
, and
2010
, respectively.
The Company operated a 240 tonne per day flotation mill at the site, which produced a flotation concentrate that was shipped to a third-party smelter located in Mexico. The property and equipment are maintained in good working condition through a regular preventive maintenance program with periodic improvements as required. Power is provided by Company-owned diesel generators.
At Martha, silver and gold mineralization is hosted in epithermal quartz veins and veinlets within generally sub-horizontal
30
volcanic rocks of the Jurassic-aged Chon Aike Formation. The veins and veinlets occur as sub-parallel clusters largely trending west-northwest and dipping steeply to the southwest. The main ore minerals of silver and gold are silver sulfosalt minerals, argentite, electrum (a naturally-occurring gold and silver alloy) and native silver.
Exploration at the Martha mine consisted of 10,646 feet (3,245 meters) of core drilling for a total cost of $1.1 million in 2012.
Year-end Proven and Probable Ore Reserves — Martha Mine
|
2012
|
2011
|
2010
|
||||||
|
|
(1, 2, 3, 4, 5)
|
|
|
|||||
|
Proven
|
|
|
|
|
|
|
||
|
Short tons (000’s)
|
—
|
|
—
|
|
—
|
|
||
|
Ounces of silver per ton
|
—
|
|
—
|
|
—
|
|
||
|
Contained ounces of silver (000’s)
|
—
|
|
—
|
|
—
|
|
||
|
Ounces of gold per ton
|
—
|
|
—
|
|
—
|
|
||
|
Contained ounces of gold
|
—
|
|
—
|
|
—
|
|
||
|
Probable
|
|
|
|
|
|
|
||
|
Short tons (000’s)
|
—
|
|
53
|
|
45
|
|
||
|
Ounces of silver per ton
|
—
|
|
12.79
|
|
18.61
|
|
||
|
Contained ounces of silver (000’s)
|
—
|
|
671
|
|
828
|
|
||
|
Ounces of gold per ton
|
—
|
|
0.01
|
|
0.02
|
|
||
|
Contained ounces of gold
|
—
|
|
580
|
|
1,089
|
|
||
|
Proven and Probable
|
|
|
|
|
|
|
||
|
Short tons (000’s)
|
—
|
|
53
|
|
45
|
|
||
|
Ounces of silver per ton
|
—
|
|
12.79
|
|
18.61
|
|
||
|
Contained ounces of silver (000’s)
|
—
|
|
671
|
|
828
|
|
||
|
Ounces of gold per ton
|
—
|
|
0.01
|
|
0.02
|
|
||
|
Contained ounces of gold
|
—
|
|
580
|
|
1,089
|
|
||
Year-end Mineralized Material — Martha Mine
|
2012
|
2011
|
2010
|
||||||
|
Short tons (000’s)
|
57
|
|
35
|
|
39
|
|
||
|
Ounces of silver per ton
|
13.57
|
|
12.15
|
|
14.02
|
|
||
|
Ounces of gold per ton
|
0.02
|
|
0.01
|
|
0.01
|
|
||
31
Operating Data
|
2012
|
2011
|
2010
|
|||||||||
|
Production
|
|
|
|
|
|
|
|||||
|
Tons ore milled
|
100,548
|
|
101,167
|
|
56,401
|
|
|||||
|
Ore grade silver (oz./ton)
|
4.01
|
|
6.29
|
|
31.63
|
|
|||||
|
Ore grade gold (oz./ton)
|
0.0035
|
|
0.0082
|
|
0.04
|
|
|||||
|
Recovery silver (%)
|
80.3
|
|
83.2
|
|
88.3
|
|
|||||
|
Recovery gold (%)
|
72.2
|
|
74
|
|
84.1
|
|
|||||
|
Silver produced (oz.)
|
323,386
|
|
529,602
|
|
1,575,827
|
|
|||||
|
Gold produced (oz.)
|
257
|
|
615
|
|
1,838
|
|
|||||
|
Cost per Ounce
|
|
|
|
|
|
|
|||||
|
Cash operating costs
|
$
|
49.77
|
|
$
|
32.79
|
|
$
|
13.16
|
|
||
|
Other cash costs
(4)
|
0.94
|
|
1.29
|
|
0.98
|
|
|||||
|
Cash costs
(5)
|
50.71
|
|
34.08
|
|
14.14
|
|
|||||
|
Non-cash costs
|
4.32
|
|
2.11
|
|
5.88
|
|
|||||
|
Total production costs
|
$
|
55.03
|
|
$
|
36.19
|
|
$
|
20.02
|
|
||
|
(1)
|
Current ore reserves and mineralized material are effective as of December 31, 2012.
|
|
(2)
|
Ore reserves and mineralized material estimates were prepared by O. Orosco (Mine Manager for the Martha mine) and the Company’s technical staff.
|
|
(3)
|
Ore reserves were defined with polygonal estimation using underground channels and drill hole samples. For probable reserves: An area demonstrating grade continuity with channel sample or drill hole spacing less than 25 meters. Mineralized material was similarly classified.
|
|
(4)
|
Includes production taxes and royalties, if applicable.
|
|
(5)
|
Cash costs per ounce of silver or gold represent a non-U.S. GAAP measurement that management uses to monitor and evaluate the performance of its mining operations. See “Item 7. Management’s Discussion and Analysis of Financial Condition and Results of Operations — Reconciliation of Non-GAAP Cash Costs to GAAP Production Costs.”
|
Australia — New South Wales — Endeavor Mine
The Endeavor mine and associated mill facility is an underground silver and base metal operation located in north-central New South Wales, Australia, about 447 miles (720 kilometers) from Sydney. Access to the mine is by paved roads 30 miles (18 kilometers) to the northwest from the community of Cobar.
Production at the Endeavor mine in
2012
was
0.7
million ounces of silver compared to
0.6
million ounces of silver in
2011
. The increase in silver production was due to a 6.4% increase in tons milled and a 23.5% increase in ore grades as compared to
2011
. Cash operating costs and total cash costs per ounce of silver produced were
$17.27
in
2012
compared to
$18.87
in
2011
. This decrease was due primarily to the increased production.
Metal sales at the Endeavor mine in
2012
were
$18.8
million, all of which was derived from silver. Production costs totaled
$8.8
million and depreciation and depletion costs were
$4.6
million. The Company incurred no capital expenditures at the Endeavor mine in 2012.
The ore reserves at Endeavor are covered by five consolidated mining leases issued by the state of New South Wales to Cobar Operations Pty. Limited (“Cobar”), a wholly-owned subsidiary of CBH Resources Ltd. (“CBH”), which in turn is a wholly owned subsidiary of Toho Zinc Co. Ltd., a company listed on the Tokyo Stock Exchange. The leases form a contiguous block of 10,121 acres in size and expire between 2019 and 2027.
The Endeavor mine has been in production since 1983 and is owned and operated by CBH. On May 23, 2005, CDE Australia Pty. Ltd., a wholly-owned subsidiary of Coeur (“CDE Australia”), acquired all of the silver production and reserves, up to a maximum 17.7 million payable ounces, contained at the Endeavor Mine, which is owned and operated by CBH, for $44.0 million including transaction fees. Under the terms of the original agreement, CDE Australia paid Cobar $15.4 million of cash at the closing. In addition, CDE Australia agreed to pay Cobar approximately $26.5 million upon the receipt of a report confirming that the reserves at the Endeavor mine are equal to or greater than the reported ore reserves for 2004. In addition, CDE Australia originally committed to pay Cobar an operating cost contribution of $1.00 for each ounce of payable silver plus a further increment when the silver price exceeds $5.23 per ounce. This further increment was to have begun on the second anniversary of this agreement and is 50% of the amount by which the silver price exceeds $5.23 per ounce. A cost contribution of $0.25 per ounce is also payable
32
by CDE Australia in respect of new ounces of proven and probable silver reserves as they are discovered. During the first quarter of 2007, $2.1 million was paid for additional ounces of proven and probable silver reserves under the terms of the contract. This amount was capitalized as a cost of the mineral interests acquired and is being amortized using the units of production method. The Company is not required to contribute to ongoing capital costs at the mine.
On March 28, 2006, CDE Australia reached an agreement with CBH to modify the terms of the original silver purchase agreement. Under the modified terms, CDE Australia owns all silver production and reserves up to a total of 20.0 million payable ounces, up from 17.7 million payable ounces in the original agreement. The silver price-sharing provision was deferred until such time as CDE Australia had received approximately two million cumulative ounces of silver from the mine or June 2007, whichever was later. In addition, the silver price-sharing threshold increased to $7.00 per ounce, from the previous level of $5.23 per ounce. The conditions relating to the second payment were also modified and tied to certain paste fill plant performance criteria and mill throughput tests. In January 2008, the mine met the criteria for payment of the additional $26.2 million. This amount was paid on April 1, 2008, plus accrued interest at the rate of 7.5% per annum from January 24, 2008. Expansion of the ore reserve will be required to achieve the maximum payable ounces of silver production as set forth in the modified contract. It is expected that future expansion to the ore reserve will occur as a result of the conversion of portions of the property’s existing inventory of mineralized material and future exploration discoveries near the mine.
The mine employs bulk mining methods and utilizes a conventional flotation mill to produce a concentrate that is sold to a third-party smelter. Silver recovery averaged approximately 41.0% in 2012 and
45.0
% in 2011. Power to the mine and processing facilities is provided by the grid servicing the local communities. The property and equipment are maintained in good working condition by CBH through a regular preventive maintenance program with periodic improvements as required.
At Endeavor, silver, lead, zinc and lesser amounts of copper mineralization are contained within sulfide lenses hosted in fine-grained sedimentary rocks of the Paleozoic-aged Amphitheatre Group. Sulfide lenses are elliptically-shaped, steeply-dipping to the southwest and strike to the northwest. Principal ore minerals are galena, sphalerite and chalcopyrite. Silver occurs with both lead- and zinc-rich sulfide zones.
CBH conducts exploration to define new reserves at the mine from both underground and surface core drilling platforms. For fiscal year ended June 30, 2012, which is the fiscal year used by the operator (CBH), the exploration expenditure at the mine was $0.7 million ($0.7 million AUD). Budgeted exploration for 2013 is approximately $0.4 million ($0.4 million AUD).
Year-end Proven and Probable Ore Reserves — Endeavor Mine
|
2012
|
2011
|
2010
|
||||||
|
|
(1, 2, 3, 4)
|
|
|
|||||
|
Proven
|
|
|
|
|
|
|
||
|
Short tons (000’s)
|
2,258
|
|
2,635
|
|
3,472
|
|
||
|
Ounces of silver per ton
|
4.32
|
|
1.39
|
|
1.87
|
|
||
|
Contained ounces of silver (000’s)
|
9,757
|
|
3,674
|
|
6,482
|
|
||
|
Probable
|
|
|
||||||
|
Short tons (000’s)
|
2,508
|
|
2,998
|
|
3,605
|
|
||
|
Ounces of silver per ton
|
1.43
|
|
2.5
|
|
3.73
|
|
||
|
Contained ounces of silver (000’s)
|
3,588
|
|
7,501
|
|
13,457
|
|
||
|
Proven and Probable
|
|
|
|
|
||||
|
Short tons (000’s)
|
4,766
|
|
5,633
|
|
7,077
|
|
||
|
Ounces of silver per ton
|
2.8
|
|
1.98
|
|
2.82
|
|
||
|
Contained ounces of silver (000’s)
|
13,345
|
|
11,175
|
|
19,939
|
|
||
Year-end Mineralized Material — Endeavor Mine
|
2012
|
2011
|
2010
|
||||||
|
Short tons (000’s)
|
10,941
|
|
11,047
|
|
16,535
|
|
||
|
Ounces of silver per ton
|
2.21
|
|
2.64
|
|
1.82
|
|
||
33
Operating Data (Coeur’s Share)
|
2012
|
2011
|
2010
|
|||||||||
|
Production
|
|
|
|
|
|
|
|||||
|
Tons ore milled
|
791,209
|
|
743,936
|
|
653,550
|
|
|||||
|
Ore grade silver (oz./ton)
|
2.26
|
|
1.83
|
|
1.96
|
|
|||||
|
Recovery silver(%)
|
41.0
|
|
45.0
|
|
44.3
|
|
|||||
|
Silver produced (oz.)
|
734,008
|
|
613,361
|
|
566,134
|
|
|||||
|
Cost per Ounce of Silver
|
|
|
|
|
|
|
|||||
|
Operating cash costs
|
$
|
17.27
|
|
$
|
18.87
|
|
$
|
10.15
|
|
||
|
Other cash costs
|
—
|
|
—
|
|
—
|
|
|||||
|
Cash costs
(5)
|
17.27
|
|
18.87
|
|
10.15
|
|
|||||
|
Non-cash costs
|
6.25
|
|
5.13
|
|
3.51
|
|
|||||
|
Total production costs
|
$
|
23.52
|
|
$
|
24.00
|
|
$
|
13.66
|
|
||
|
(1)
|
Ore reserves are effective as of June 30, 2012, which is the end of the most recent fiscal year of the operator, CBH Resources Ltd. These totals do not include additions or depletions through December 31, 2012. Ore reserves were estimated with a cutoff grade of 7.0% combined lead and zinc. Metal prices used were $2,200 per metric ton of zinc, $2,200 per metric ton of lead, and $34.00 per ounce of silver.
|
|
(2)
|
The ore reserves are underground and open pit minable. Dilution factors, ranging from 5% to 25%, and mining recovery factors, ranging from 40% to 95%, were applied to in-situ reserves depending on the type of planned mining extraction.
|
|
(3)
|
Metallurgical recovery factor of 45% should be applied to the silver reserve ounces.
|
|
(4)
|
The ore reserves and mineralized material estimates were prepared by the staff of the mine operator and reviewed by the staff of the Company's Technical Services Department. Classification of reserves is based on spacing from drill hole composites to reserve block centers. For proven reserves the maximum distance is 25 meters and for probable reserves it is 40 meters. A minimum of 5 drill hole samples from at least 2 drill holes are used in estimation of ore reserve grades. Mineralized material is similarly classified.
|
|
(5)
|
Cash costs per ounce of silver represent a non U.S. GAAP measurement that management uses to monitor and evaluate the performance of its mining operations. See "Item 7. Management’s Discussion and Analysis of Financial Condition and Results of Operations; Reconciliation of Non-GAAP Cash Costs to GAAP Production Costs."
|
NON PRODUCING AND DEVELOPMENT PROPERTIES
Joaquin Project — Argentina
The Joaquin silver and gold development project (the "Joaquin Project") is located in the Santa Cruz province of southern Argentina approximately 43 miles (70kms) north of the Company's Martha mine. The property is accessed by all weather dirt roads, leading north-northeast from the town of Gobernador Gregores.
The Joaquin property encompasses over 70,819 acres (28,459 hectares) of exploration concessions ("Cateos") and discover concessions ("MDs").
In November 2006, the Company entered into an exploration and joint venture agreement with Mirasol Resources Ltd., for two properties termed Joaquin and Sascha (under terms of the agreement, the Company terminated its option interest in Sascha). In November 2007, the Company commenced exploration on the Joaquin property. Since that time the Company has defined silver and gold mineralization in two deposits at Joaquin - La Negra and La Morocha - and has recently commenced work on detailed drilling and other technical, economic and environmental programs which it expects will lead to completion of a feasibility study. On December 21, 2012, the Company completed its acquisition of the equity interests of Mirasol Argentina SRL in exchange for a total of approximately
1.3 million
shares of Coeur common stock valued at $30.0 million, a total cash payment of approximately
$30.0 million
and assumption of liabilities of
$0.1 million
. Mirasol Argentina SRL holds the Joaquin silver-gold project in the Santa Cruz province of Argentina. Coeur previously held a
51%
interest in the project. The transaction was accounted for as a purchase of assets and not as a business combination since Joaquin is considered to be in the exploration and development stage.
The geology of the Joaquin property consists dominantly of various volcanic rocks of the Jurassic-aged Chon Aike Formation, the host to most of the precious metal deposits discovered to-date in the Santa Cruz province, with lesser amounts of intrusive rocks associated with the Chon Aike Formation. Collectively, the volcanic and intrusive rock units form a prominent geologic domain in the province termed the Deseado Massif. Silver and Gold mineralization at Joaquin occurs in epithermal veins, breccia, stockwork veinlets and mantos within the favorable units of the Chon Aike Formation. Occurrences of lead and
34
zinc mineralization have also been discovered. Locally, the rocks of the Deseado Massif are covered by Tertiary-aged basalt and younger unconsolidated sediments, that post-date silver and gold mineralization.
Exploration in 2012 consisted of geologic mapping, sampling, geophysical and geochemical surveys amounting to $5.8 million and the completion of 54,809 feet (16,706 meters) of core drilling. The 2013 exploration budget for Joaquin is $3.3 million.
Year-end Mineralized Material — Joaquin Development Property
|
2012
|
2011
|
2010
|
||||||
|
(1,2,3,4)
|
||||||||
|
Short tons (000’s)
|
17,340
|
|
4,050
|
|
—
|
|
||
|
Ounces of silver per ton
|
3.76
|
|
2.48
|
|
—
|
|
||
|
Ounces of gold per ton
|
0.004
|
|
0.005
|
|
||||
|
(1)
|
Mineralized material is effective as of December 31, 2012. Metal prices used to calculate mineralized material were $1,700 per ounce of gold and $33.00 per ounce of silver. Tons are shown, in 2012, reflecting the Company's current 100% interest in the Joaquin property.
|
|
(2)
|
Mineralized material was estimated with surface mine parameters and initial metallurgical test results.
|
|
(3)
|
Mineralized material estimates were prepared by a consulting engineering group from Santiago, Chile and supervised by A. Cruzat and C. Romo of the Company's exploration staff.
|
|
(4)
|
Mineralized material was estimated using 3-dimensional geologic modeling and geostatistical evaluation of the exploration drill data. Blocks must be influenced by at least two different drill holes within a distance corresponding to 100% of the variogram range of each deposit.
|
EXPLORATION AND DEVELOPMENT ACTIVITY
Exploration and reserve development expenditures of $40.2 million, $26.3 million and $18.0 million were incurred by the Company in
2012
,
2011
and
2010
, respectively.
During 2012, the company drilled a total of 625,152 feet (190,546 meters) in its global exploration program. A total of 620,795 feet (189,218 meters) were drilled to explore for and define new silver and gold mineralization in existing operating areas and development properties. The remainder was drilled on the company's early stage properties in Chile. In addition, at the Kensington Mine in Alaska, 77,730 feet (23,692 meters) of tightly-spaced definition drilling was completed at Block K.
The main components of the
2012
program included:
|
•
|
Drilling to expand known mineralized zones in and around the current Palmarejo surface and underground mine. The program was focused on the Tucson-Chapotillo zones with surface drilling and on the Rosario, 76 and 108 zones with underground drilling.
|
|
•
|
Surface drilling to extend and define the Guadalupe and La Patria deposits in the Palmarejo district and initial testing of several new targets in the district.
|
|
•
|
Surface drilling to expand the La Negra and La Morocha deposits within the Joaquin property located in the Santa Cruz province of southern Argentina. Exploration drilling at the Martha mine and the Lejano project area in Argentina was also conducted this year.
|
|
•
|
Underground drilling to expand and define gold mineralization in the Raven vein at Kensington and test new targets peripheral to Kensington.
|
|
•
|
Surface drilling to test extensions of the main north-northeast mineralized trends within the greater Rochester property and a large drilling program to evaluate the tons and grade of historic surface dumps and leach pads.
|
|
•
|
New surface trenching and sampling at San Bartolomé in Bolivia.
|
Mexico
Exploration in Mexico was focused primarily in the Palmarejo district in the state of Chihuahua. A total of $19.9 million was spent in 2012 on mapping, sampling, drill target generation and drilling to identify and define new silver and gold mineralization. A total of 341,975 feet (104,234 meters) was completed, including 149,635 feet (45,609 meters) of surface and underground drilling completed around the current Palmarejo mine. The remainder was devoted to the Guadalupe and La Patria deposit areas and other new targets in the district. The budget for 2013 for exploration in Mexico is $15.8 million of which over 95% is to be allocated to the Palmarejo district.
USA — Kensington
Exploration in 2012 consisted of drilling 143,796 feet (43,829 meters) of core at Kensington. The majority of this work was devoted to in-fill drilling of Block K and the Raven vein. New drilling focused on Kensington South, the Ann Trend, Elmira
35
vein and on surface drilling of the Jualin Mine. The Company plans for an additional underground drilling program in 2013 on Zone 10, Zone 50, Zone 30, Kensington South, Elmira vein, and Ann. Continued surface drilling is planned at the Jualin Mine and several other targets on the property. The total 2013 Kensington exploration budget is $8.6 million.
USA — Rochester
The Company conducted drilling programs on the Rochester North and West historic stockpiles and Northwest Rochester, Nevada Packard and South Mystic areas in 2012. These programs amounted to 138,121 feet (42,099 meters) of vertical and angled reverse circulation, Sonic® (rotary vibratory drilling) and core holes. The Company has allocated $3.5 million for exploration in 2013 at the greater Rochester property.
Argentina — Martha Mine
In 2012, the Company's exploration efforts at the Martha Mine consisted of 10,646 feet (3,245 meters) of core drilling in several locations around the mine and at the Company's Malbec target north of the mine. In September of 2012, the Company ceased active mining operations at Martha.
Argentina — Other Properties
Activities focused on the Joaquin property where a total of 54,809 feet of drilling (16,706 meters) was completed. Drilling at Joaquin during 2012 continued to return encouraging results on two targets: La Negra and La Morocha. Additional exploratory and definition drilling will continue in 2013 on this property. In 2010, the Company met its obligations, under its agreement with Mirasol Resources Ltd., to earn an initial 51% participating and managing equity interest in the Joaquin property. In 2012, the Company acquired Mirasol's 49% interest in Joaquin to establish 100% ownership. The purchase has been treated as an acquisition of mineral rights.
Lejano Project — Argentina
The Lejano silver and gold exploration-stage project is located in the Santa Cruz province of southern Argentina approximately 110 miles (180 kilometers) northwest of the Company's Martha mine and approximately 80 miles (130 kilometers) southeast of the town of Perito Moreno. The property is accessed by paved and all weather gravel roads, leading from the towns of Gobernador Gregores or from Perito Moreno.
The Lejano property encompasses over 82,000 acres (33,282 hectares) of exploration concessions within three groups of concessions and several exploration targets, including Cisne, Cerro Armando and Ciclon. In 2002 the Company acquired its initial interest in the Lejano area from Yamana S.R.L. as part of its purchase of the Martha mine and other properties in the province. The Company also controls other concessions in the Lejano area that are not subject to a royalty.
Lejano is located in the northwestern portion of the Deseado Massif in southern Argentina. Host rocks to mineralization at Lejano are a sequence of Jurassic-aged volcanic rocks, predominantly tuffs and flows, assigned to the Chon Aike Formation. The Chon Aike is major host to precious metal mineralization in the Deseado Massif. Silver and lesser gold and base metal mineralization at Lejano are hosted in three, known west-northwest oriented, moderately- to steeply-dipping structural zones. The mineralized material reported herein was estimate from drilling in the South Ridge structural zone. Mineralization at Lejano occurs in silicified fractures, veins and fault zones. In general, the known mineralization at Lejano is well-oxidized to approximately 330 feet (100 meters) depth grading locally into sulfide.
Exploration in 2012 consisted of geologic mapping, sampling, geophysical and geochemical surveys, and drilling amounting to $1.4 million and the completion of 4,888 feet (1,490 meters) of core drilling. Favorable results from this program allowed for the estimation of the first mineralized material tons and average grades for South Ridge zone, one of three known mineralized zones on the Lejano project. The 2013 exploration budget for the Lejano area is $1.8 million.
Year-end Mineralized Material - Lejano Exploration-Stage Property
|
2012
|
2011
|
2010
|
||||||
|
(1,2,3,4)
|
||||||||
|
Short tons (000’s)
|
1,233
|
|
—
|
|
—
|
|
||
|
Ounces of silver per ton
|
2.42
|
|
—
|
|
—
|
|
||
|
Ounces of gold per ton
|
0.008
|
|
||||||
|
(1)
|
Mineralized material is effective as of December 31, 2012. Metal prices used to calculate mineralized material were $1,700 per ounce of gold and $33.00 per ounce of silver.
|
|
(2)
|
Mineralized material was estimated with surface mine parameters and initial metallurgical test results.
|
36
|
(3)
|
Mineralized material estimates were prepared by a consulting engineering group from Santiago, Chile and supervised by A. Cruzat and C. Romo of the Company's exploration staff.
|
|
(4)
|
Mineralized material was estimated using 3-dimensional geologic modeling and geostatistical evaluation of the exploration drill data. Blocks must be influenced by at least two different drill holes within a distance corresponding to 100% of the variogram range of each deposit.
|
Bolivia - San Bartolomé
In 2012, the Company completed trenching and sampling at several silver-bearing gravel deposits, called pallacos, to expand and define the known silver mineralization. A new target, called Pucka Loma, was sampled late in 2012. The Company has budgeted $0.7 million in 2013 for follow-up trenching and sampling around San Bartolomé and for land holding costs.
Chile - Other properties
In 2012, the Company tested its Carrizalillo gold and silver property, near Copiapo, Chile with 1,328 meters (4,357 feet) of core drilling. The 2013 exploration budget for Chile is $0.6 million, consisting of identification and evaluation of potential new mining properties and supervision of exploration within Argentina and Chile.
The Company plans to spend $40.1 million in exploration during 2013 with approximately 81% of the budget earmarked for expansion of ore reserves and mineralized material at or near its existing operations at San Bartolomé (Bolivia), Joaquin (Argentina), Palmarejo (Mexico), Kensington (Alaska), Rochester (Nevada), and on its large exploration land holdings in Santa Cruz, Argentina, which include the Lejano project.
|
Item 3.
|
Legal Proceedings
.
|
For a discussion of legal proceedings, see Note 23 — Litigation and Other Events to the consolidated financial statements included herein.
Item 4.
Mine Safety Disclosure
Information pertaining to mine safety matters is reported in accordance with Section 1503(a) of the Dodd-Frank Wall Street Reform and Consumer Protection Act in Exhibit 95.1 attached to this Form 10-K.
|
Item 5.
|
Market for Registrant’s Common Equity, Related Stockholder Matters and Issuer Purchases of Equity Securities
|
The Company’s common stock is listed on the New York Stock Exchange (the “NYSE”) and the Toronto Stock Exchange (“TSX”). The following table sets forth, for the periods indicated, the high and low closing sales prices of the common stock as reported by the NYSE:
|
|
2012
|
2011
|
|||||||||||||
|
|
High
|
Low
|
High
|
Low
|
|||||||||||
|
First Quarter
|
$
|
30.22
|
|
$
|
23.39
|
|
$
|
36.07
|
|
$
|
22.10
|
|
|||
|
Second Quarter
|
$
|
24.32
|
|
$
|
16.35
|
|
$
|
37.59
|
|
$
|
22.41
|
|
|||
|
Third Quarter
|
$
|
29.17
|
|
$
|
15.36
|
|
$
|
30.99
|
|
$
|
21.35
|
|
|||
|
Fourth Quarter
|
$
|
31.86
|
|
$
|
22.06
|
|
$
|
29.85
|
|
$
|
19.30
|
|
|||
|
2013
|
|
|
|
|
|
|
|
|
|||||||
|
First Quarter through February 20, 2013
|
$
|
25.20
|
|
$
|
18.81
|
|
|
|
|||||||
The Company has not paid per share cash distributions or dividends on its common stock since 1996. Future distributions or dividends on the common stock, if any, will be determined by the Company’s Board of Directors and will depend upon the Company’s results of operations, financial condition, capital requirements and other factors.
On June 7, 2012, the Company announced that its Board of Directors has authorized a share repurchase program of up to $100 million of the Company's common equity. Common stock repurchase activity during the fourth quarter of 2012, all of which was under the repurchase program, was as follows (in thousands except for per share amounts):
37
|
Period
|
Total Number of
Shares Purchased |
Average Price
Paid per Share |
Dollar Value of Shares that May Yet Be Purchased Under the Plans
|
|
10/1/2012 - 10/31/12
|
$90,041
|
||
|
11/1/2012 - 11/30/12
|
417.2
|
$23.94
|
$80,052
|
|
12/1/2012 - 12/31/12
|
—
|
—
|
$80,052
|
|
Total
|
417.2
|
$23.94
|
$80,052
|
On February 20, 2013, there were outstanding 90,434,354
shares of the Company’s common stock which were held by approximately 1,567 stockholders of record.
STOCK PERFORMANCE CHART
COMPARISON OF 5 YEAR CUMULATIVE TOTAL RETURN*
AMONG COEUR D’ALENE MINES CORPORATION,
S&P 500 INDEX AND PEER GROUP INDEX
The following performance graph compares the performance of the Company's common stock during the period beginning December 31, 2007 and ending December 31, 2012 to the S&P 500 and a Peer Group Index consisting of the following companies: Agnico-Eagle Mines Limited, Goldcorp, Hecla Mining Company, IAMGold Corporation, Kinross Gold Corporation, Northgate Minerals Corporation, Pan American Silver Corporation, Centerra Gold Inc., and Stillwater Mining Company for the same period. The graph assumes a $100 investment in the Company's common stock and in each of the indexes at the beginning of the period, and a reinvestment of dividends paid on such investments throughout the period.

|
Dec.
2007
|
Dec.
2008
|
Dec.
2009
|
Dec.
2010
|
Dec.
2011
|
Dec.
2012
|
|||||||
|
Coeur d’Alene Mines Corporation
|
100
|
|
17.82
|
|
36.56
|
|
55.3
|
|
48.86
|
|
49.78
|
|
|
S&P 500 Index
|
100
|
|
62.99
|
|
79.65
|
|
91.64
|
|
93.57
|
|
108.53
|
|
|
Peer Group Only
|
100
|
|
85.39
|
|
107.06
|
|
130.37
|
|
102.61
|
|
97.51
|
|
This stock performance information is “furnished” and shall not be deemed to be “soliciting material” or subject to Rule 14A, shall not be deemed “filed” for purposes of Section 18 of the Exchange Act or otherwise subject to the liabilities of that section,
38
and shall not be deemed incorporated by reference in any filing under the Securities Act of 1933, as amended, or the Exchange Act, whether made before or after the date of this report and irrespective of any general incorporation by reference language in any such filing, except to the extent that it specifically incorporates the information by reference.
|
Item 6.
|
Selected Financial Data
|
The following table summarizes certain selected consolidated financial data with respect to the Company and should be read in conjunction with the Consolidated Financial Statements and Notes thereto appearing elsewhere in this report.
|
Income Statement Data:
|
2012
|
2011
|
2010
|
2009
|
2008
|
|||||||||||||||
|
Sales of metal
|
$
|
895,492
|
|
$
|
1,021,200
|
|
$
|
515,457
|
|
$
|
300,361
|
|
$
|
129,285
|
|
|||||
|
Production costs applicable to sales
|
(456,757
|
)
|
(419,956
|
)
|
(257,636
|
)
|
(191,311
|
)
|
(78,652
|
)
|
||||||||||
|
Depreciation and depletion
|
(218,857
|
)
|
(224,500
|
)
|
(141,619
|
)
|
(81,376
|
)
|
(16,499
|
)
|
||||||||||
|
Gross profit
|
219,878
|
|
376,744
|
|
116,202
|
|
27,674
|
|
34,134
|
|
||||||||||
|
Costs and expenses
|
|
|
|
|
|
|
|
|
|
|
||||||||||
|
Administrative and general
|
32,977
|
|
31,379
|
|
24,176
|
|
22,070
|
|
25,825
|
|
||||||||||
|
Exploration
|
26,270
|
|
19,128
|
|
14,249
|
|
13,056
|
|
17,838
|
|
||||||||||
|
Loss on impairment and other
|
5,825
|
|
—
|
|
—
|
|
—
|
|
—
|
|
||||||||||
|
Pre-development, care, maintenance and other
|
1,261
|
|
19,441
|
|
2,877
|
|
1,468
|
|
17,074
|
|
||||||||||
|
Total costs and expenses
|
66,333
|
|
69,948
|
|
41,302
|
|
36,594
|
|
60,737
|
|
||||||||||
|
Operating income (loss)
|
153,545
|
|
306,796
|
|
74,900
|
|
(8,920
|
)
|
(26,603
|
)
|
||||||||||
|
Other income (expense)
|
|
|
|
|
|
|
|
|
|
|
||||||||||
|
Gains (loss) on debt extinguishments
|
(1,036
|
)
|
(5,526
|
)
|
(20,300
|
)
|
31,528
|
|
—
|
|
||||||||||
|
Fair value adjustments, net
|
(23,487
|
)
|
(52,050
|
)
|
(117,094
|
)
|
(82,227
|
)
|
1,756
|
|
||||||||||
|
Interest income and other, net
|
14,436
|
|
(6,610
|
)
|
771
|
|
1,648
|
|
4,023
|
|
||||||||||
|
Interest expense, net of capitalized interest
|
(26,169
|
)
|
(34,774
|
)
|
(30,942
|
)
|
(18,102
|
)
|
(4,726
|
)
|
||||||||||
|
Total other income (expense)
|
(36,256
|
)
|
(98,960
|
)
|
(167,565
|
)
|
(67,153
|
)
|
1,053
|
|
||||||||||
|
Income (loss) from continuing operations before income taxes
|
117,289
|
|
207,836
|
|
(92,665
|
)
|
(76,073
|
)
|
(25,550
|
)
|
||||||||||
|
Income tax benefit (provision)
|
(68,612
|
)
|
(114,337
|
)
|
9,481
|
|
33,071
|
|
17,387
|
|
||||||||||
|
Income (loss) from continuing operations
|
48,677
|
|
93,499
|
|
(83,184
|
)
|
(43,002
|
)
|
(8,163
|
)
|
||||||||||
|
Income (loss) from discontinued operations
|
—
|
|
—
|
|
(6,029
|
)
|
(9,601
|
)
|
7,536
|
|
||||||||||
|
Gain (loss) on sale of net assets of discontinued operation
|
—
|
|
—
|
|
(2,095
|
)
|
25,537
|
|
—
|
|
||||||||||
|
Net income (loss)
|
$
|
48,677
|
|
$
|
93,499
|
|
$
|
(91,308
|
)
|
$
|
(27,066
|
)
|
$
|
(627
|
)
|
|||||
|
Other comprehensive income (loss)
|
(2,746
|
)
|
(4,975
|
)
|
(5
|
)
|
—
|
|
(634
|
)
|
||||||||||
|
COMPREHENSIVE INCOME (LOSS)
|
$
|
45,931
|
|
$
|
88,524
|
|
$
|
(91,313
|
)
|
$
|
(27,066
|
)
|
$
|
(1,261
|
)
|
|||||
|
Basic and Diluted Income (Loss) Per Share
|
|
|
|
|
|
|
|
|
|
|
||||||||||
|
Basic income (loss) per share:
|
|
|
|
|
|
|
|
|
|
|
||||||||||
|
Income (loss) from continuing operations
|
$
|
0.54
|
|
$
|
1.05
|
|
$
|
(0.95
|
)
|
$
|
(0.6
|
)
|
$
|
(0.15
|
)
|
|||||
|
Income (loss) from discontinued operations
|
—
|
|
—
|
|
(0.10
|
)
|
0.22
|
|
0.14
|
|
||||||||||
|
Net income (loss)
|
$
|
0.54
|
|
$
|
1.05
|
|
$
|
(1.05
|
)
|
$
|
(0.38
|
)
|
$
|
(0.01
|
)
|
|||||
|
Diluted income (loss) per share:
|
|
|
|
|
|
|
|
|
|
|
||||||||||
|
Income (loss) from continuing operations
(2),(3)
|
$
|
0.54
|
|
$
|
1.04
|
|
$
|
(0.95
|
)
|
$
|
(0.6
|
)
|
$
|
(0.15
|
)
|
|||||
|
Income (loss) from discontinued operations
(2),(3)
|
—
|
|
—
|
|
(0.1
|
)
|
0.22
|
|
0.14
|
|
||||||||||
|
Net income (loss)
|
$
|
0.54
|
|
$
|
1.04
|
|
$
|
(1.05
|
)
|
$
|
(0.38
|
)
|
$
|
(0.01
|
)
|
|||||
|
Weighted average number of shares of common stock
(1)
|
|
|
|
|
|
|
|
|
|
|
||||||||||
|
Basic
|
89,437
|
|
89,383
|
|
87,185
|
|
71,565
|
|
55,073
|
|
||||||||||
|
Diluted
|
89,603
|
|
89,725
|
|
87,185
|
|
71,565
|
|
55,073
|
|
||||||||||
39
|
Balance Sheet Data:
|
2012
|
2011
|
2010
|
2009
|
2008
|
|||||||||||||||
|
Total assets
|
$
|
3,221,401
|
|
$
|
3,264,441
|
|
$
|
3,157,527
|
|
$
|
3,054,035
|
|
$
|
2,928,121
|
|
|||||
|
Working capital
|
$
|
167,930
|
|
$
|
212,862
|
|
$
|
(4,506
|
)
|
$
|
(2,572
|
)
|
$
|
(8,533
|
)
|
|||||
|
Long-term liabilities
|
$
|
784,869
|
|
$
|
875,639
|
|
$
|
846,043
|
|
$
|
867,381
|
|
$
|
981,225
|
|
|||||
|
Shareholders’ equity
|
$
|
2,198,280
|
|
$
|
2,136,721
|
|
$
|
2,040,767
|
|
$
|
1,998,046
|
|
$
|
1,785,912
|
|
|||||
|
(1)
|
In May 2009, Coeur's Board of Directors authorized a 1-for-10 reverse stock split which became effective on May 26, 2009. Consequently, previously reported amounts for weighted average number of shares of common stock have been adjusted to reflect the 1-for-10 reverse stock split.
|
|
(2)
|
Effective July 1, 2009, the Company sold to Perilya Broken Hill Ltd. its 100% interest in the silver contained at the Broken Hill mine for $55.0 million in cash. Coeur originally purchased this interest from Perilya Broken Hill, Ltd. in September 2005 for $36.9 million. As a result of this transaction, the Company realized a gain on the sale of approximately $25.5 million, net of income taxes, in 2009.
|
|
(3)
|
In August 2010, the Company sold its 100% interest in subsidiary Compañía Minera Cerro Bayo (“Minera Cerro Bayo”) to Mandalay Resources Corporation (“Mandalay”). The Company realized a loss on the sale of approximately $2.1 million, net of income taxes.
|
|
Item 7.
|
Management’s Discussion and Analysis of Financial Condition and Results of Operations
|
The following discussion provides information that management believes is relevant to an assessment and understanding of the consolidated financial condition and results of operations of Coeur and its subsidiaries for the three years ended
December 31, 2012
. It consists of the following subsections:
|
•
|
“Overview” which provides a brief summary of the Company’s financial position and the primary factors affecting those results.
|
|
•
|
“Critical Accounting Policies” which provides a discussion of the accounting policies Coeur considers critical because of their effect on the reported amounts of assets, liabilities, income and/or expenses in the Company’s consolidated financial statements and/or because they require different objectives or complex judgments by management.
|
|
•
|
“Operating statistics and ore reserve estimates” which provides a summary of the consolidated production results for the three years ended
December 31, 2012
and discussion of Coeur’s reported ore reserves.
|
|
•
|
“Results of operations” which sets forth an analysis of the operating results for the last three years.
|
|
•
|
“Liquidity and capital resources” which contains a discussion of the Company’s cash flows and liquidity, investing activities and financing activities, contractual obligations and environmental compliance expenditures.
|
|
•
|
“Recently issued accounting pronouncements,” which summarizes recently published authoritative accounting guidance, how it might apply to Coeur, and how it might affect the Company’s future results.
|
Overview
The Company is a large primary silver producer with growing gold production and has assets located in the United States, Mexico, Bolivia, Argentina and Australia. The Palmarejo mine, San Bartolomé mine, Kensington mine and Rochester mine, each of which is operated by the Company, the Martha mine, which ceased active mining operations in September 2012, and the Endeavor mine, which is operated by a non-affiliated party, constituted the Company’s principal sources of mining revenues during
2012
. Coeur is an Idaho corporation incorporated in 1928.
The Company’s business strategy is to discover, acquire, develop and operate low-cost silver and gold operations that will produce long-term cash flow, provide opportunities for growth through continued exploration, and generate superior and sustainable returns for shareholders. The Company’s management focuses on maximizing cash flow from its existing operations, the main elements of which are silver and gold prices, cash costs of production and capital expenditures. The Company also focuses on reducing its non-operating costs in order to maximize cashflow.
The results of the Company’s operations are significantly affected by fluctuation in prices of silver and gold, which may fluctuate widely and are affected by numerous factors beyond its control, including interest rates, expectations regarding inflation, currency values, governmental decisions regarding the disposal of precious metals stockpiles, global and regional political and economic conditions and other factors. In addition, The Company faces challenges including raising capital, increasing production and managing social, political and environmental issues. Operating costs at the Company’s mines are subject to variation due to a number of factors such as changing commodity prices, ore grades, metallurgy, revisions to mine plans and changes in accounting principles. At foreign locations, operating costs are also influenced by currency fluctuations that may affect its U.S. dollar costs.
40
Highlights during
2012
:
|
•
|
Silver and gold prices averaged $31.16 per ounce and $1,669 per ounce in
2012
, respectively. Silver reached a high of
$36.88
per ounce on February 28, 2012 and a low of
$26.39
per ounce on June 28, 2012. Gold reached a high of
$1,792
per ounce on October 4, 2012 and a low of
$1,540
per ounce on May 30, 2012.
|
|
•
|
The Company produced a total of
18.0
million ounces of silver during
2012
, which was a
5.5%
decrease from
2011
. The Company produced
226,486
ounces of gold during
2012
, which was a
2.8%
increase over
2011
.
|
|
•
|
Cash operating costs were
$7.57
per silver ounce in 2012 compared with
$6.31
per silver ounce in 2011.
|
|
•
|
The Company experienced a
12.3%
decrease in metal sales to
$895.5
million compared to
$1,021.2
million in 2011.
|
|
•
|
Net cash provided by operating activities in
2012
was
$271.6
million, compared to
$416.2
million in
2011
.
|
|
•
|
The Company spent
$115.6
million in capital expenditures, which represents a
3.6%
decrease from
2011
.
|
Critical Accounting Policies and Estimates
The information provided in this Form 10-K is based on the Company’s consolidated financial statements, which have been prepared in accordance with U.S. GAAP. The preparation of these statements requires that the Company make estimates and assumptions that affect the reported amounts of assets and liabilities, disclosure of contingent assets and liabilities at the date of its financial statements, and the reported amounts of revenue and expenses during the reporting period. The Company bases these estimates on historical experience and on assumptions that it considers reasonable under the circumstances; however, reported results could differ from those based on the current estimates under different assumptions or conditions.
Management considers the policies discussed below to be most critical in understanding the judgments that are involved in preparing the Company's consolidated financial statements and the uncertainties that could affect its results of operations, financial condition, and cash flows. The effects and associated risks of these policies on its business operations are discussed throughout this discussion and analysis. The areas requiring the use of management’s estimates and assumptions relate to recoverable ounces from proven and probable reserves that are the basis of future cash flow estimates and units-of-production depreciation and amortization calculations; useful lives utilized for depreciation, depletion, and long lived assets; estimates of recoverable gold and silver ounces in ore on leach pad; reclamation and remediation costs; valuation allowance for deferred tax assets; and post-employment and other employee benefit liabilities. For a detailed discussion on the application of these and other accounting policies, see Note 3 — Summary of Significant Accounting Policies to the financial statements included herein.
Revenue Recognition.
Revenue includes sales value received for the Company’s principal product, silver, and associated by-product revenues from the sale of by-product metals by its silver producing properties, consisting primarily of gold. Revenue is recognized when title to silver and gold passes to the buyer and when collectability is reasonably assured. Title passes to the buyer based on terms of the sales contract. Product pricing is determined at the point revenue is recognized by reference to active and freely traded commodity markets, for example, the London Bullion Market for both gold and silver, in an identical form to the product sold.
Under the Company’s concentrate sales contracts with third-party smelters, final gold and silver prices are set on a specified future quotational period, typically one to three months, after the shipment date based on market metal prices. Revenues are recorded under these contracts at the time title passes to the buyer based on the forward price for the expected settlement period. The contracts, in general, provide for provisional payment based upon provisional assays and quoted metal prices. Final settlement is based on the average applicable price for the specified future quotational period and generally occurs from three to six months after shipment. Final sales are settled using smelter weights and settlement assays (average of assays exchanged and/or umpire assay results) and are priced as specified in the smelter contract. The Company’s provisionally priced sales contain an embedded derivative that is required to be separated from the host contract for accounting purposes. The host contract is the receivable from the sale of concentrates at the forward price at the time of sale. The embedded derivative does not qualify for hedge accounting. The embedded derivative is recorded as a derivative asset in prepaid expenses and other assets or as a derivative liability in accrued liabilities and other on the balance sheet and is adjusted to fair value through revenue each period until the date of final gold and silver settlement. The form of the material being sold, after deduction for smelting and refining, is in an identical form to that sold on the London Bullion Market. The form of the product is metal in flotation concentrate, which is the final process for which the Company is responsible.
The effects of forward sales contracts are reflected in revenue at the date the related precious metals are delivered. Third-party smelting and refining costs are recorded as a reduction of revenue.
At
December 31, 2012
, the Company had outstanding provisionally priced sales of
$33.2
million consisting of
0.4
million ounces of silver and
11,957
ounces of gold, which had a fair value of approximately
$34.1
million including the embedded derivative. For each one cent per ounce change in realized silver price, revenue would vary (plus or minus) approximately
$4
and
41
for each one dollar per ounce change in realized gold price, revenue would vary (plus or minus) approximately
$12
. At
December 31, 2011
, the Company had outstanding provisionally priced sales of $22.5 million consisting of 0.2 million ounces of silver and 9,701 ounces of gold, which had a fair value of approximately $21.7 million including the embedded derivative. For each one cent per ounce change in realized silver price, revenue would vary (plus or minus) approximately $2,000 and for each one dollar per ounce change in realized gold price, revenue would vary (plus or minus) approximately $9,700.
Reserve Estimates.
The preparation of the Company’s consolidated financial statements in conformity with U.S. GAAP requires management to make estimates and assumptions that affect the reported amount of assets and liabilities, disclosure of contingent assets and liabilities at the date of its financial statements, and the reported amounts of revenue and expenses during the reporting period. There can be no assurance that actual results will not differ from those estimates. The most critical accounting principles upon which the Company’s financial status depends are those requiring estimates of recoverable ounces from proven and probable reserves and/or assumptions of future commodity prices. There are a number of uncertainties inherent in estimating quantities of reserves, including many factors beyond the Company’s control. Ore reserve estimates are based upon engineering evaluations of samplings of drill holes and other openings. These estimates involve assumptions regarding future silver and gold prices, the geology of its mines, the mining methods it uses and the related costs it incurs to develop and mine its reserves. Changes in these assumptions could result in material adjustments to the Company’s reserve estimates. The Company uses reserve estimates in determining the units-of-production depreciation and amortization expense, as well as in evaluating mine asset impairments.
Impairments.
The Company reviews and evaluates its long-lived assets for impairment when events or changes in circumstances indicate that the related carrying amounts may not be recoverable. An impairment is considered to exist if total estimated future cash flows or probability-weighted cash flows on an undiscounted basis are less than the carrying amount of the assets, including property, plant and equipment, mineral property, development property, and any deferred costs. The accounting estimates related to impairment are critical accounting estimates because the future cash flows used to determine whether an impairment exists is dependent on reserve estimates and other assumptions, including silver and gold prices, production levels, and capital and reclamation costs, all of which are based on detailed engineering life-of-mine plans.
Depreciation and Amortization.
The Company depreciates its property, plant and equipment, mining properties and mine development using the units-of-production method over the estimated life of the ore body based on its proven and probable recoverable reserves or on a straight-line basis over the useful life, whichever is shorter. The accounting estimates related to depreciation and amortization are critical accounting estimates because 1) the determination of reserves involves uncertainties with respect to the ultimate geology of its reserves and the assumptions used in determining the economic feasibility of mining those reserves and 2) changes in estimated proven and probable reserves and useful asset lives can have a material impact on net income.
Ore on leach pad.
The heap leach process is a process of extracting silver and gold by placing ore on an impermeable pad and applying a diluted cyanide solution that dissolves a portion of the contained silver and gold, which are then recovered in metallurgical processes.
The Company uses several integrated steps to scientifically measure the metal content of ore placed on the leach pads. As the ore body is drilled in preparation for the blasting process, samples are taken of the drill residue which were assayed to determine estimated quantities of contained metal. The Company estimates the quantity of ore by utilizing global positioning satellite survey techniques. The Company then processes the ore through crushing facilities where the output is again weighed and sampled for assaying. A metallurgical reconciliation with the data collected from the mining operation is completed with appropriate adjustments made to previous estimates. The crushed ore is then transported to the leach pad for application of the leaching solution. As the leach solution is collected from the leach pads, it is continuously sampled for assaying. The quantity of leach solution is measured by flow meters throughout the leaching and precipitation process. After precipitation, the product is converted to doré, which is the final product produced by the mine. The inventory is stated at lower of cost or market, with cost being determined using a weighted average cost method.
The Company reported ore on leach pad of
$44.3
million as of
December 31, 2012
. Of this amount,
$23.0
million is reported as a current asset and
$21.3
million is reported as a non-current asset. The distinction between current and non-current is based upon the expected length of time necessary for the leaching process to remove the metals from the broken ore. The historical cost of the metal that is expected to be extracted within twelve months is classified as current and the historical cost of metals contained within the broken ore that will be extracted beyond twelve months is classified as non-current. Inventories of ore on leach pad are valued based on actual production costs incurred to produce and place ore on the leach pad, adjusted for effects on monthly production of costs of abnormal production levels, less costs allocated to minerals recovered through the leach process. The costs consist of those production activities occurring at the mine site and include the costs, including depreciation, associated with mining, crushing and precipitation circuits. In addition, refining is provided by a third-party refiner to place the metal extracted from the leach pad in a saleable form. These additional costs are considered in the valuation of inventory.
The estimate of both the ultimate recovery expected over time and the quantity of metal that may be extracted relative to the time the leach process occurs requires the use of estimates which are inherently inaccurate since they rely upon laboratory
42
testwork. Testwork consists of 60 day leach columns from which the Company projects metal recoveries up to five years in the future. The quantities of metal contained in the ore are estimated based upon actual weights and assay analysis. The rate at which the leach process extracts gold and silver from the crushed ore is based upon laboratory column tests and actual experience occurring over more than twenty years of leach pad operations at the Rochester mine. The assumptions used by the Company to measure metal content during each stage of the inventory conversion process includes estimated recovery rates based on laboratory testing and assaying. The Company periodically reviews its estimates compared to actual experience and revises its estimates when appropriate. The Company believes its current residual heap leach activities are expected to continue through 2015. The ultimate recovery will not be known until leaching operations cease. The Company estimated the number of ounces that are recoverable from the stage IV leach pad at
December 31, 2012
. If its estimate of ultimate recovery requires adjustment, the impact upon its valuation and upon its income statement would be as follows:
|
Positive/Negative
Change in Recoverable Silver Ounces
|
Positive/Negative
Change in Rcoverable Gold Ounces
|
||||||||||||||||||||||
|
|
5%
|
10%
|
15%
|
5%
|
10%
|
15%
|
|||||||||||||||||
|
Quantity of recoverable ounces
|
65,026
|
|
130,052
|
|
195,079
|
|
578
|
|
1,157
|
|
1,735
|
|
|||||||||||
|
Positive impact on future cost of production per silver equivalent ounce for increases in recoverable metal
|
$
|
0.23
|
|
$
|
0.45
|
|
$
|
0.66
|
|
$
|
0.13
|
|
$
|
0.25
|
|
$
|
0.37
|
|
|||||
|
Negative impact on future cost of production per silver equivalent ounce for decreases in recoverable metal
|
$
|
(0.25
|
)
|
$
|
(0.51
|
)
|
$
|
(0.80
|
)
|
$
|
(0.13
|
)
|
$
|
(0.27
|
)
|
$
|
(0.41
|
)
|
|||||
Inventories of ore on leach pads are valued based upon actual production costs incurred to produce and place such ore on the leach pad during the current period, adjusted for the effects on monthly production of costs of abnormal production levels, less costs allocated to minerals recovered through the leach process.
Reclamation and remediation costs.
The Company recognizes obligations associated with the retirement of tangible long-lived assets and the associated asset retirement costs. These legal obligations are associated with the retirement of long-lived assets that result from the acquisition, construction, development and normal use of the asset. The fair value of a liability for an asset retirement obligation will be recognized in the period in which it is incurred if a reasonable estimate of fair value can be made. The fair value of the liability is added to the carrying amount of the associated asset and this additional carrying amount is depreciated over the life of the asset. An accretion cost, representing the increase over time in the present value of the liability, is recorded each period in depreciation, depletion and amortization expense. As reclamation work is performed or liabilities are otherwise settled, the recorded amount of the liability is reduced.
Future remediation costs for inactive mines are accrued based on management’s best estimate at the end of each period of the undiscounted costs expected to be incurred at the site. Such cost estimates include, where applicable, ongoing care and maintenance and monitoring costs. Changes in estimates are reflected in earnings in the period an estimate is revised.
Derivatives accounting.
The Company recognizes all derivatives as either assets or liabilities on the balance sheet and measures those instruments at fair value. Changes in the value of derivative instruments are recorded each period in fair value adjustments, net.
Income taxes.
The Company computes income taxes using an asset and liability approach which results in the recognition of deferred tax liabilities and assets for the expected future tax consequences or benefits of temporary differences between the financial reporting bases and the tax bases of assets and liabilities, as well as operating loss and tax credit carryforwards, using enacted tax rates in effect in the years in which the differences are expected to reverse.
In assessing the realizability of deferred tax assets, management considers whether it is more likely than not that some portion or all of its deferred tax assets will not be realized. Management considers the scheduled reversal of deferred tax liabilities, projected future taxable income and tax planning strategies in making this assessment. A valuation allowance has been provided for the portion of the Company’s net deferred tax assets for which it is more likely than not that they will not be realized.
The Company and its subsidiaries are subject to U.S. federal income tax as well as income tax of multiple state and foreign jurisdictions. The Company has substantially concluded all U.S. federal income tax matters for years through 1999. Federal income tax returns for 2000 through 2011 are subject to examination. The Company’s practice is to recognize interest and/or penalties related to income tax matters in income tax expense.
The Company had accrued $2.5 million in interest and penalties at
December 31, 2012
, related to an item under audit review in Bolivia.
Operating Statistics and Ore Reserve Estimates
The Company's total production in
2012
was
18.0
million ounces of silver and
226,486
ounces of gold, compared to 19.1 million ounces of silver and 220,382 ounces of gold in
2011
. Total estimated proven and probable reserves at
December 31, 2012
were approximately
220.4
million ounces of silver and
2.0
million ounces of gold, compared to silver and gold ore reserves at
December 31, 2011
of approximately 216.3 million ounces and 2.3 million ounces, respectively.
43
The following table shows the estimated amounts of proven and probable ore reserves and mineralized material at the following Company locations at year-end
2012
:
|
|
Proven and Probable Ore Reserves
|
Mineralized Material
|
|||||||||||||||||||||
|
(000’s)
Tons
|
Grade
Ag oz/t
|
Grade
Au oz/t
|
(000’s)
Ounces Ag
|
(000’s)
Ounces Au
|
(000’s)
Tons
|
Grade
Ag oz/t
|
Grade
Au oz/t
|
||||||||||||||||
|
Palmarejo
|
12,852
|
|
4.13
|
|
0.05
|
|
53,110
|
|
665
|
|
23,712
|
|
1.93
|
|
0.041
|
|
|||||||
|
San Bartolomé
|
42,886
|
|
2.54
|
|
—
|
|
109,088
|
|
—
|
|
20,040
|
|
2.27
|
|
—
|
|
|||||||
|
Kensington
|
4,667
|
|
—
|
|
0.22
|
|
—
|
|
1,016
|
|
2,606
|
|
—
|
|
0.202
|
|
|||||||
|
Rochester
|
79,923
|
|
0.56
|
|
0.004
|
|
44,897
|
|
308
|
|
264,283
|
|
0.46
|
|
0.003
|
|
|||||||
|
Martha
(1)
|
—
|
|
—
|
|
—
|
|
—
|
|
—
|
|
57
|
|
13.57
|
|
0.02
|
|
|||||||
|
Endeavor
|
4,766
|
|
2.8
|
|
—
|
|
13,345
|
|
—
|
|
10,941
|
|
2.21
|
|
—
|
|
|||||||
|
Joaquin Development Property
(2)
|
—
|
|
—
|
|
—
|
|
—
|
|
—
|
|
17,340
|
|
3.76
|
|
0.004
|
|
|||||||
|
Lejano Development Property
|
—
|
|
—
|
|
—
|
|
—
|
|
—
|
|
1,233
|
|
2.42
|
|
0.008
|
|
|||||||
|
Total
|
145,094
|
|
|
|
|
|
220,440
|
|
1,989
|
|
340,212
|
|
|
|
|
|
|||||||
|
|
Total tons
|
Ag oz/t
|
Au oz/t
|
|
|
Total tons
|
Ag oz/t
|
Au oz/t
|
|||||||||||||||
|
|
(000’s)
|
(Wt. Avg.)
|
(Wt. Avg.)
|
|
|
(000’s)
|
(Wt. Avg.)
|
(Wt. Avg.)
|
|||||||||||||||
|
Summary by metal:
|
|
|
|
|
|
|
|
|
|
|
|
|
|
|
|
|
|||||||
|
Silver
|
140,427
|
|
1.57
|
|
|
|
|
|
337,606
|
|
0.90
|
|
|||||||||||
|
Gold
|
97,442
|
|
0.02
|
|
|
|
|
|
309,231
|
|
0.008
|
|
|||||||||||
|
(1)
|
The Martha mine ceased active mining operations in September 2012.
|
|
(2)
|
Tons are shown reflecting the Company's current 100% ownership in the Joaquin property.
|
44
The following table presents production information by mine and consolidated sales information for the years ended December 31:
|
2012
|
2011
|
2010
|
|||||||||
|
PRIMARY SILVER OPERATIONS:
|
|
|
|
|
|
|
|||||
|
Palmarejo
(1)
|
|
|
|
|
|
|
|||||
|
Tons milled
|
2,114,366
|
|
1,723,056
|
|
1,835,408
|
|
|||||
|
Ore grade/Ag oz
|
4.70
|
|
6.87
|
|
4.60
|
|
|||||
|
Ore grade/Au oz
|
0.05
|
|
0.08
|
|
0.06
|
|
|||||
|
Recovery/Ag oz (%)
(1)
|
83.0
|
|
76.4
|
|
69.8
|
|
|||||
|
Recovery/Au oz (%)
(1)
|
94.4
|
|
92.2
|
|
91.1
|
|
|||||
|
Silver production ounces
(3)
|
8,236,013
|
|
9,041,488
|
|
5,887,576
|
|
|||||
|
Gold production ounces
(3)
|
106,038
|
|
125,071
|
|
102,440
|
|
|||||
|
Cash operating costs/oz
(4)
|
$
|
1.33
|
|
$
|
(0.97
|
)
|
$
|
4.10
|
|
||
|
Cash cost/oz
(4)
|
$
|
1.33
|
|
$
|
(0.97
|
)
|
$
|
4.10
|
|
||
|
Total production cost/oz
|
$
|
19.26
|
|
$
|
16.80
|
|
$
|
19.66
|
|
||
|
San Bartolomé
|
|
|
|
|
|
|
|||||
|
Tons milled
|
1,477,271
|
|
1,567,269
|
|
1,504,779
|
|
|||||
|
Ore grade/Ag oz
|
4.49
|
|
5.38
|
|
5.03
|
|
|||||
|
Recovery/Ag oz (%)
|
89.5
|
|
88.9
|
|
88.6
|
|
|||||
|
Silver production ounces
(3)
|
5,930,394
|
|
7,501,367
|
|
6,708,775
|
|
|||||
|
Cash operating costs/oz
(4)
|
$
|
11.76
|
|
$
|
9.10
|
|
$
|
7.87
|
|
||
|
Cash cost/oz
(4)
|
$
|
12.95
|
|
$
|
10.64
|
|
$
|
8.67
|
|
||
|
Total production cost/oz
|
$
|
15.81
|
|
$
|
13.75
|
|
$
|
11.72
|
|
||
|
Rochester
2
|
|
|
|
|
|
|
|||||
|
Tons Mined
|
11,710,795
|
|
2,028,889
|
|
—
|
|
|||||
|
Ore grade/Ag oz
|
0.55
|
|
0.47
|
|
—
|
|
|||||
|
Ore grade/Au oz
|
0.0047
|
|
0.0047
|
|
—
|
|
|||||
|
Recovery/Ag oz (%)
(2)
|
57.0
|
|
165.1
|
|
—
|
|
|||||
|
Recovery/Au oz (%)
(2)
|
89.9
|
|
75.6
|
|
—
|
|
|||||
|
Silver production ounces
(3)
|
2,801,405
|
|
1,392,433
|
|
2,023,423
|
|
|||||
|
Gold production ounces
(3)
|
38,066
|
|
6,276
|
|
9,641
|
|
|||||
|
Cash operating costs/oz
(4)
|
9.62
|
|
22.97
|
|
2.93
|
|
|||||
|
Cash cost/oz
(4)
|
11.65
|
|
24.82
|
|
3.78
|
|
|||||
|
Total production cost/oz
|
14.05
|
|
27.21
|
|
4.82
|
|
|||||
45
|
2012
|
2011
|
2010
|
|||||||||
|
Martha
|
|
|
|
|
|
|
|||||
|
Tons milled
|
100,548
|
|
101,167
|
|
56,401
|
|
|||||
|
Ore grade/Ag oz
|
4.01
|
|
6.29
|
|
31.63
|
|
|||||
|
Ore grade/Au oz
|
0.0035
|
|
0.0082
|
|
0.04
|
|
|||||
|
Recovery/Ag oz (%)
|
80.3
|
|
83.2
|
|
88.3
|
|
|||||
|
Recovery/Au oz (%)
|
72.2
|
|
74.0
|
|
84.1
|
|
|||||
|
Silver production ounces
|
323,386
|
|
529,602
|
|
1,575,827
|
|
|||||
|
Gold production ounces
|
257
|
|
615
|
|
1,838
|
|
|||||
|
Cash operating costs/oz
(4)
|
$
|
49.77
|
|
$
|
32.79
|
|
$
|
13.16
|
|
||
|
Cash cost/oz
(4)
|
$
|
50.71
|
|
$
|
34.08
|
|
$
|
14.14
|
|
||
|
Total production cost/oz
|
$
|
55.03
|
|
$
|
36.19
|
|
$
|
20.02
|
|
||
|
Endeavor
|
|
|
|
|
|
|
|||||
|
Tons milled
|
791,209
|
|
743,936
|
|
653,550
|
|
|||||
|
Ore grade/Ag oz
|
2.26
|
|
1.83
|
|
1.96
|
|
|||||
|
Recovery/Ag oz (%)
|
41.0
|
|
45.0
|
|
44.3
|
|
|||||
|
Silver production ounces
|
734,008
|
|
613,361
|
|
566,134
|
|
|||||
|
Cash operating costs/oz
(4)
|
$
|
17.27
|
|
$
|
18.87
|
|
$
|
10.15
|
|
||
|
Cash cost/oz
(4)
|
$
|
17.27
|
|
$
|
18.87
|
|
$
|
10.15
|
|
||
|
Total production cost/oz
|
$
|
23.52
|
|
$
|
24.00
|
|
$
|
13.66
|
|
||
|
GOLD OPERATIONS:
|
|
|
|
|
|
|
|||||
|
Kensington
|
|
|
|
|
|
|
|||||
|
Tons milled
|
394,780
|
|
415,340
|
|
174,028
|
|
|||||
|
Ore grade/Au oz
|
0.22
|
|
0.23
|
|
0.28
|
|
|||||
|
Recovery/Au oz (%)
|
95.6
|
|
92.7
|
|
89.9
|
|
|||||
|
Gold production ounces
(3)
|
82,125
|
|
88,420
|
|
43,143
|
|
|||||
|
Cash operating costs/oz
(4)
|
$
|
1,358
|
|
$
|
1,088
|
|
$
|
989
|
|
||
|
Cash cost/oz
(4)
|
$
|
1,358
|
|
$
|
1,088
|
|
$
|
989
|
|
||
|
Total production cost/oz
|
$
|
1,865
|
|
$
|
1,494
|
|
$
|
1,394
|
|
||
|
CONSOLIDATED PRODUCTION TOTALS
|
|
|
|
|
|
|
|||||
|
Silver ounces
(3)
|
18,025,206
|
|
19,078,251
|
|
16,761,735
|
|
|||||
|
Gold ounces
(3)
|
226,486
|
|
220,382
|
|
157,062
|
|
|||||
|
Cash operating costs/oz
(4)
|
$
|
7.57
|
|
$
|
6.31
|
|
$
|
6.53
|
|
||
|
Cash cost per oz/silver
(4)
|
$
|
8.30
|
|
$
|
7.09
|
|
$
|
7.05
|
|
||
|
Total production cost/oz
|
$
|
18.14
|
|
$
|
17.14
|
|
$
|
14.52
|
|
||
|
CONSOLIDATED SALES TOTALS
|
|
|
|
|
|
|
|||||
|
Silver ounces sold
(3)
|
17,965,383
|
|
19,057,503
|
|
17,221,335
|
|
|||||
|
Gold ounces sold
(3)
|
213,185
|
|
238,551
|
|
130,142
|
|
|||||
|
Realized price per silver ounce
|
$
|
30.92
|
|
$
|
35.15
|
|
$
|
20.99
|
|
||
|
Realized price per gold ounce
|
$
|
1,665
|
|
$
|
1,558
|
|
$
|
1,237
|
|
||
|
(1)
|
Palmarejo commenced commercial production on April 20, 2009. Mine statistics do not represent normal operating results
|
|
(2)
|
The leach cycle at Rochester requires 5 to 10 years to recover gold and silver contained in the ore. The Company estimates the metallurgical recovery to be approximately 61% for silver and 92% for gold. Current recovery may vary significantly from ultimate recovery. See Critical Accounting Policies and Estimates — Ore on Leach Pad.
|
|
(3)
|
Current production ounces and recoveries reflect final metal settlements of previously reported production ounces.
|
|
(4)
|
See "Reconciliation of Non-GAAP Cash Costs to GAAP Production Costs."
|
46
Reconciliation of Non-GAAP Cash Costs to GAAP Production Costs
In this Form 10-K, the Company has disclosed certain non-U.S. GAAP measures, such as “cash costs”, “cash operating costs” and related per ounce measures. These measures are used in the mining industry and by the Company's management to measure, across periods, the net cash flow generated by mining operations. The Company cannot assure investors that other mining companies will calculate these measures in the same manner that the Company does.
Production costs is the closest comparable U.S. GAAP measure for these measures. Accordingly, we have provided in the tables below a reconciliation of cash costs and cash operating costs to production costs. The corresponding per ounce measures can be calculated by dividing cash costs or cash operating costs, as applicable, by the number of ounces of silver or gold produced at the business unit.
Cash costs reflect the direct and overhead cash costs arising from the physical activities involved in producing metal. These costs include the cost of mining, processing and other plant costs, third-party refining and smelting costs, marketing expenses, on-site general and administrative expenses, royalties and mining production taxes, but net of by-product revenues earned from selling metals other than the primary metal produced by the business unit. Cash costs exclude certain amounts required to be included in production costs (which amounts can be substantial), including third-party smelting costs, by-product credits, inventory adjustments and other non-cash charges.
Cash operating costs are calculated as cash costs less royalties and production taxes.
Reconciliation of Non-U.S. GAAP Cash Costs to U.S. GAAP Production Costs
Year Ended
December 31, 2012
|
(In thousands except ounces and per ounce costs)
|
Palmarejo
|
San Bartolomé
|
Kensington
|
Rochester
|
Martha
(1)
|
Endeavor
|
Total
|
|||||||||||||||||||||
|
Total Cash Operating Cost (Non-U.S. GAAP)
|
$
|
10,958
|
|
$
|
69,771
|
|
$
|
111,499
|
|
$
|
26,959
|
|
$
|
16,094
|
|
$
|
12,675
|
|
$
|
247,956
|
|
|||||||
|
Royalties
|
—
|
|
7,084
|
|
—
|
|
3,487
|
|
306
|
|
—
|
|
10,877
|
|
||||||||||||||
|
Production taxes
|
—
|
|
—
|
|
—
|
|
2,195
|
|
—
|
|
—
|
|
2,195
|
|
||||||||||||||
|
Total Cash Costs (Non-U.S. GAAP)
|
$
|
10,958
|
|
$
|
76,855
|
|
$
|
111,499
|
|
$
|
32,641
|
|
$
|
16,400
|
|
|
$
|
12,675
|
|
$
|
261,028
|
|
||||||
|
Add/Subtract:
|
||||||||||||||||||||||||||||
|
Third party smelting costs
|
—
|
|
—
|
|
(10,910
|
)
|
—
|
|
(3,943
|
)
|
(3,648
|
)
|
(18,501
|
)
|
||||||||||||||
|
By-product credit
|
176,237
|
|
—
|
|
—
|
|
63,440
|
|
422
|
|
—
|
|
240,099
|
|
||||||||||||||
|
Other adjustments
|
1,108
|
|
256
|
|
17
|
|
(1,355
|
)
|
882
|
|
—
|
|
908
|
|
||||||||||||||
|
Change in inventory
|
9,175
|
|
(5,683
|
)
|
(13,517
|
)
|
(20,470
|
)
|
3,922
|
|
(204
|
)
|
(26,777
|
)
|
||||||||||||||
|
Depreciation, depletion and amortization
|
146,557
|
|
16,707
|
|
41,645
|
|
8,065
|
|
515
|
|
4,591
|
|
218,080
|
|
||||||||||||||
|
Production costs applicable to sales, including depreciation, depletion and amortization (U.S. GAAP)
|
$
|
344,035
|
|
$
|
88,135
|
|
$
|
128,734
|
|
$
|
82,321
|
|
$
|
18,198
|
|
$
|
13,414
|
|
$
|
674,837
|
|
|||||||
|
Production of silver (ounces)
|
8,236,013
|
|
5,930,394
|
|
—
|
|
2,801,405
|
|
323,386
|
|
734,008
|
|
18,025,206
|
|
||||||||||||||
|
Cash operating cost per silver ounce
|
$
|
1.33
|
|
$
|
11.76
|
|
$
|
—
|
|
$
|
9.62
|
|
$
|
49.77
|
|
$
|
17.27
|
|
$
|
7.57
|
|
|||||||
|
Cash costs per silver ounce
|
$
|
1.33
|
|
$
|
12.95
|
|
$
|
—
|
|
$
|
11.65
|
|
$
|
50.71
|
|
$
|
17.27
|
|
$
|
8.30
|
|
|||||||
|
Production of gold (ounces)
|
—
|
|
—
|
|
82,125
|
|
—
|
|
—
|
|
—
|
|
82,125
|
|
||||||||||||||
|
Cash operating cost per gold ounce
|
$
|
—
|
|
$
|
—
|
|
$
|
1,358
|
|
$
|
—
|
|
$
|
—
|
|
$
|
—
|
|
$
|
1,358
|
|
|||||||
|
Cash cost per gold ounce
|
$
|
—
|
|
$
|
—
|
|
$
|
1,358
|
|
$
|
—
|
|
$
|
—
|
|
$
|
—
|
|
$
|
1,358
|
|
|||||||
47
Year Ended
December 31, 2011
|
(In thousands except ounces and per ounce costs)
|
Palmarejo
|
San Bartolomé
|
Kensington
|
Rochester
|
Martha
(1)
|
Endeavor
|
Total
|
|||||||||||||||||||||
|
Total Cash Operating Cost (Non-U.S. GAAP)
|
$
|
(8,743
|
)
|
$
|
68,277
|
|
$
|
96,234
|
|
$
|
31,978
|
|
$
|
17,367
|
|
$
|
11,573
|
|
$
|
216,686
|
|
|||||||
|
Royalties
|
—
|
|
11,561
|
|
—
|
|
2,177
|
|
685
|
|
—
|
|
14,423
|
|
||||||||||||||
|
Production taxes
|
—
|
|
—
|
|
—
|
|
409
|
|
—
|
|
—
|
|
409
|
|
||||||||||||||
|
Total Cash Costs (Non-U.S. GAAP)
|
$
|
(8,743
|
)
|
$
|
79,838
|
|
$
|
96,234
|
|
$
|
34,564
|
|
$
|
18,052
|
|
$
|
11,573
|
|
$
|
231,518
|
|
|||||||
|
Add/Subtract:
|
||||||||||||||||||||||||||||
|
Third party smelting costs
|
—
|
|
—
|
|
(11,003
|
)
|
—
|
|
(2,882
|
)
|
(2,872
|
)
|
(16,757
|
)
|
||||||||||||||
|
By-product credit
|
197,342
|
|
—
|
|
—
|
|
9,898
|
|
949
|
|
—
|
|
208,189
|
|
||||||||||||||
|
Other adjustments
|
1,441
|
|
906
|
|
19
|
|
522
|
|
559
|
|
—
|
|
3,447
|
|
||||||||||||||
|
Change in inventory
|
(3,839
|
)
|
(1,065
|
)
|
16,422
|
|
(16,727
|
)
|
(1,165
|
)
|
(67
|
)
|
(6,441
|
)
|
||||||||||||||
|
Depreciation, depletion and amortization
|
159,231
|
|
22,408
|
|
35,839
|
|
2,807
|
|
554
|
|
3,148
|
|
223,987
|
|
||||||||||||||
|
Production costs applicable to sales, including depreciation, depletion and amortization (U.S. GAAP)
|
$
|
345,432
|
|
$
|
102,087
|
|
$
|
137,511
|
|
$
|
31,064
|
|
$
|
16,067
|
|
$
|
11,782
|
|
$
|
643,943
|
|
|||||||
|
Production of silver (ounces)
|
9,041,488
|
|
7,501,367
|
|
—
|
|
1,392,433
|
|
529,602
|
|
613,361
|
|
19,078,251
|
|
||||||||||||||
|
Cash operating cost per silver ounce
|
$
|
(0.97
|
)
|
$
|
9.10
|
|
$
|
—
|
|
$
|
22.97
|
|
$
|
32.79
|
|
$
|
18.87
|
|
$
|
6.31
|
|
|||||||
|
Cash costs per silver ounce
|
$
|
(0.97
|
)
|
$
|
10.64
|
|
$
|
—
|
|
$
|
24.82
|
|
$
|
34.08
|
|
$
|
18.87
|
|
$
|
7.09
|
|
|||||||
|
Production of gold (ounces)
|
—
|
|
—
|
|
88,420
|
|
—
|
|
—
|
|
—
|
|
88,420
|
|
||||||||||||||
|
Cash operating cost per gold ounce
|
$
|
—
|
|
$
|
—
|
|
$
|
1,088.37
|
|
$
|
—
|
|
$
|
—
|
|
$
|
—
|
|
$
|
1,088.37
|
|
|||||||
|
Cash cost per gold ounce
|
$
|
—
|
|
$
|
—
|
|
$
|
1,088.37
|
|
$
|
—
|
|
$
|
—
|
|
$
|
—
|
|
$
|
1,088.37
|
|
|||||||
Year Ended
December 31, 2010
|
(In thousands except ounces and per ounce costs)
|
Palmarejo
(2)
|
San Bartolomé
|
Kensington
|
Rochester
|
Martha
(1)
|
Endeavor
|
Total
|
|||||||||||||||||||||
|
Total Cash Operating Cost (Non-U.S. GAAP)
|
$
|
24,164
|
|
$
|
52,810
|
|
$
|
42,652
|
|
$
|
5,932
|
|
$
|
20,730
|
|
$
|
5,747
|
|
$
|
152,035
|
|
|||||||
|
Royalties
|
—
|
|
5,384
|
|
—
|
|
174
|
|
1,548
|
|
—
|
|
7,106
|
|
||||||||||||||
|
Production taxes
|
—
|
|
—
|
|
—
|
|
1,540
|
|
—
|
|
—
|
|
1,540
|
|
||||||||||||||
|
Total Cash Costs (Non-U.S. GAAP)
|
$
|
24,164
|
|
$
|
58,194
|
|
$
|
42,652
|
|
$
|
7,646
|
|
$
|
22,278
|
|
$
|
5,747
|
|
$
|
160,681
|
|
|||||||
|
Add/Subtract:
|
|
|
|
|
|
|
|
|
|
|
|
|
|
|
||||||||||||||
|
Third party smelting costs
|
—
|
|
—
|
|
(4,599
|
)
|
—
|
|
(3,299
|
)
|
(1,544
|
)
|
(9,442
|
)
|
||||||||||||||
|
By-product credit
(3)
|
126,588
|
|
—
|
|
—
|
|
11,756
|
|
2,192
|
|
—
|
|
140,536
|
|
||||||||||||||
|
Other adjustments
|
131
|
|
806
|
|
—
|
|
211
|
|
1,422
|
|
—
|
|
2,570
|
|
||||||||||||||
|
Change in inventory
|
(23,224
|
)
|
1,022
|
|
(24,011
|
)
|
5,148
|
|
4,446
|
|
(90
|
)
|
(36,709
|
)
|
||||||||||||||
|
Depreciation, depletion and amortization
|
91,457
|
|
19,650
|
|
17,487
|
|
1,890
|
|
7,848
|
|
1,989
|
|
140,321
|
|
||||||||||||||
|
Production costs applicable to sales, including depreciation, depletion and amortization (U.S. GAAP)
|
$
|
219,116
|
|
$
|
79,672
|
|
$
|
31,529
|
|
$
|
26,651
|
|
$
|
34,887
|
|
$
|
6,102
|
|
$
|
397,957
|
|
|||||||
|
Production of silver (ounces)
|
5,887,576
|
|
6,708,775
|
|
—
|
|
2,023,423
|
|
1,575,827
|
|
566,134
|
|
16,761,735
|
|
||||||||||||||
|
Cash operating cost per silver ounce
|
$
|
4.10
|
|
$
|
7.87
|
|
$
|
—
|
|
$
|
2.93
|
|
$
|
13.16
|
|
$
|
10.15
|
|
$
|
6.53
|
|
|||||||
|
Cash costs per silver ounce
|
$
|
4.10
|
|
$
|
8.67
|
|
$
|
—
|
|
$
|
3.78
|
|
$
|
14.14
|
|
$
|
10.15
|
|
$
|
7.05
|
|
|||||||
|
Production of gold (ounces)
|
$
|
—
|
|
$
|
—
|
|
$
|
43,143
|
|
$
|
—
|
|
—
|
|
$
|
—
|
|
$
|
43,143
|
|
||||||||
|
Cash operating cost per gold ounce
|
$
|
—
|
|
$
|
—
|
|
$
|
988.63
|
|
$
|
—
|
|
$
|
—
|
|
$
|
—
|
|
$
|
988.63
|
|
|||||||
|
Cash cost per gold ounce
|
$
|
—
|
|
$
|
—
|
|
$
|
988.63
|
|
$
|
—
|
|
$
|
—
|
|
$
|
—
|
|
$
|
988.63
|
|
|||||||
|
(1)
|
The Martha mine ceased active mining operations in September 2012.
|
|
(2)
|
The Palmarejo gold production royalty is currently reflected as a minimum royalty obligation which commenced on July 1, 2009 and ends when payments have been made on a total of 400,000 ounces of gold, at which time a royalty expense will be recorded.
|
|
(3)
|
Amounts reflect final metal settlement adjustments.
|
48
Gold is accounted for as a by-product credit at the Palmarejo and Rochester mines whereby revenues from gold are deducted from operating costs in the calculation of cash costs per ounce. If the Company's accounting policy was changed to treat gold as a co-product, the following costs per ounce would be reported:
|
2012
|
||||||||
|
Palmarejo
|
Rochester
|
|||||||
|
Total cash operating costs
|
$
|
187,195
|
|
$
|
90,400
|
|
||
|
Total cash costs
|
$
|
187,195
|
|
$
|
96,081
|
|
||
|
Revenue
|
||||||||
|
Silver
|
59%
|
59%
|
||||||
|
Gold
|
41%
|
41%
|
||||||
|
Ounces produced
|
||||||||
|
Silver
|
8,236,013
|
|
2,801,405
|
|
||||
|
Gold
|
103,068
|
|
38,066
|
|
||||
|
Total cash operating costs per ounce
|
||||||||
|
Silver
|
$
|
13.45
|
|
$
|
19.20
|
|
||
|
Gold
|
$
|
742
|
|
$
|
962
|
|
||
|
Total cash costs per ounce
|
||||||||
|
Silver
|
$
|
13.45
|
|
$
|
20.40
|
|
||
|
Gold
|
$
|
742
|
|
$
|
1,023
|
|
||
|
2011
|
||||||||
|
Palmarejo
|
Rochester
|
|||||||
|
Total cash operating costs
|
$
|
188,599
|
|
$
|
41,876
|
|
||
|
Total cash costs
|
$
|
188,599
|
|
$
|
44,463
|
|
||
|
Revenue
|
||||||||
|
Silver
|
61%
|
84%
|
||||||
|
Gold
|
39%
|
16%
|
||||||
|
Ounces produced
|
||||||||
|
Silver
|
9,041,488
|
|
1,392,433
|
|
||||
|
Gold
|
125,071
|
|
6,276
|
|
||||
|
Total cash operating costs per ounce
|
||||||||
|
Silver
|
$
|
12.82
|
|
$
|
25.34
|
|
||
|
Gold
|
$
|
581
|
|
$
|
1,050
|
|
||
|
Total cash costs per ounce
|
||||||||
|
Silver
|
$
|
12.82
|
|
$
|
26.91
|
|
||
|
Gold
|
$
|
581
|
|
$
|
1,115
|
|
||
49
|
2010
|
||||||||
|
Palmarejo
|
Rochester
|
|||||||
|
Total cash operating costs
|
$
|
150,752
|
|
$
|
17,688
|
|
||
|
Total cash costs
|
$
|
150,752
|
|
$
|
19,401
|
|
||
|
Revenue
|
||||||||
|
Silver
|
78%
|
48%
|
||||||
|
Gold
|
22%
|
52%
|
||||||
|
Ounces produced
|
||||||||
|
Silver
|
5,887,576
|
|
2,023,423
|
|
||||
|
Gold
|
102,440
|
|
9,641
|
|
||||
|
Total cash operating costs per ounce
|
||||||||
|
Silver
|
$
|
19.90
|
|
$
|
4.20
|
|
||
|
Gold
|
$
|
328
|
|
$
|
952
|
|
||
|
Total cash costs per ounce
|
||||||||
|
Silver
|
$
|
19.90
|
|
$
|
4.61
|
|
||
|
Gold
|
$
|
328
|
|
$
|
1,045
|
|
||
Results of Operations
Year Ended
December 31, 2012
Compared to Year Ended
December 31, 2011
Revenues
Sales of metal from continuing operations in the year ended
December 31, 2012
decreased by
$125.7
million, or
12.3%
, from the year ended
December 31, 2011
to
$895.5
million. The decrease was primarily due to a decrease in the quantity of silver and gold ounces sold and a lower realized price per ounce for silver in
2012
. The decreased sale of silver ounces was primarily due to decreases in silver production at the Palmarejo and San Bartolomé mines. In
2012
, the Company sold
18.0
million ounces of silver and
213,185
ounces of gold, compared to sales of
19.1
million ounces of silver and
238,551
ounces of gold in
2011
from continuing operations. In the year ended
December 31, 2012
, the Company realized average silver and gold prices of
$30.92
per ounce and
$1,665
per ounce, respectively, compared with realized average prices of $35.15 per ounce and $1,558 per ounce, respectively, in the prior year. Silver contributed
61.4%
of sales as compared to
38.6%
from gold.
Included in revenues is by-product metal sales derived from the sale of gold by the Company's silver producing properties. In 2012, by-product revenues totaled
$234.8
million compared to $207.4 million in 2011. The Company believes that presentation of these revenue streams as by-products from its current operations will continue to be appropriate in the future.
In the year ended December 31, 2012, the Company’s continuing operations produced a total of
18.0
million ounces of silver and
226,486
ounces of gold compared to 19.1 million ounces of silver and 220,382 ounces of gold in 2011. The decrease in silver production is primarily due to lower production levels at Palmarejo and San Bartolomé, partially off-set by higher production at Rochester in 2012 compared to 2011. The increase in gold production is primarily due to an increase in production at the Rochester mine due to a new leach pad having been in operation for a full year.
Production costs applicable to sales from continuing operations for the year ended December 31, 2012 increased by
$36.8
million, or
8.8%
, from the year ended December 31, 2011 to
$456.8
million. The increase in production costs applicable to sales for the year is primarily due to increases at Palmarejo, San Bartolomé, and Rochester. Equipment maintenance costs were up due to major component rebuilds and spare parts for the mining fleet. Rehabilitation work and on-going ground control expenses at Palmarejo also contributed to the increase.
Depreciation and depletion decreased in the year ended December 31, 2012 by
$5.6
million, or
2.5%
, over the prior year, The decrease was primarily the result of a decrease in depletion of $13.1 million due to production decreases offset by an increase in depreciation of $6.1 million. The majority of depletion decrease is attributed to Palmarejo of $17.5 million, with smaller
50
decreases at San Bartolomé and Martha of $2.0 million and $0.2 million, respectively. These decreases were offset by increases at Kensington, Endeavor, and Rochester of $1.5 million, $1.4 million, and $2.3 million respectively. The depreciation increase is attributed to increases at Kensington, Palmarejo, and Rochester of $4.3 million, $2.1 million, and $3.0 million respectively, as more capital projects have been placed in service at these sites. These increases were offset by a decrease at San Bartolomé.
Costs and Expenses
Administrative and general expenses increased
$1.6
million or
5.1%
in 2012 compared to 2011. The increase was primarily due to increased legal and finance related expenses and salaries and relocation costs for new employees.
Exploration expenses increased by
$7.1
million or
37.3%
in 2012 compared to 2011 primarily as a result of increased exploration activity at and around the Company’s existing properties. This exploration is described in more detail under "Item 2. Properties."
Pre-development, care and maintenance and other expenses were
$1.3
million, a decrease of
$18.2
million from 2011, primarily related to non-recurring charges for the expansion of mining at the Rochester mine in 2011.
Other Income and Expenses
Non-cash fair value adjustments, net in the
twelve months ended
December 31, 2012
were a loss of
$23.5
million compared to a loss of
$52.1
million in the year ended
December 31, 2011
. The majority of the decrease in the fair value adjustment, net was due to the impact of changing gold prices on the Palmarejo gold production royalty obligation.
Interest income and other increased by
$21.0
million to
$14.4
million in the year ended
December 31, 2012
, compared with net expense of
$6.6
million in the year ended December 31, 2011. The majority of the increase is the result of foreign currency gains and a $2.5 million business interruption insurance settlement at San Bartolomé.
Interest expense, net of capitalized interest, decreased to
$26.2
million in the year ended
December 31, 2012
from
$34.8
million in the the year ended December 31, 2011. The decrease in interest expense was primarily due to a decrease in total outstanding debt and capital lease obligations.
Income Taxes
For the year ended
December 31, 2012
, the Company reported an income tax provision of approximately
$68.6
million compared to an income tax provision of
$114.3
million in
2011
. The following table summarizes the components of the Company’s income tax provision for the years ended
2012
and
2011
.
|
Years Ended
December
|
|||||||
|
|
2012
|
2011
|
|||||
|
Current:
|
|
|
|
|
|||
|
United States — Alternative minimum tax
|
$
|
(257
|
)
|
$
|
2,015
|
|
|
|
United States — Foreign withholding tax
|
(736
|
)
|
(842
|
)
|
|||
|
Argentina
|
976
|
|
(1,219
|
)
|
|||
|
Australia
|
(1,760
|
)
|
(1,755
|
)
|
|||
|
Mexico
|
(7,814
|
)
|
(1,084
|
)
|
|||
|
Bolivia
|
(43,546
|
)
|
(59,660
|
)
|
|||
|
Deferred:
|
|
|
|
|
|||
|
Australia
|
(223
|
)
|
(661
|
)
|
|||
|
Bolivia
|
(1,086
|
)
|
(207
|
)
|
|||
|
Mexico
|
(10,579
|
)
|
(28,022
|
)
|
|||
|
United States
|
(3,587
|
)
|
(22,902
|
)
|
|||
|
Income tax benefit (provision)
|
$
|
(68,612
|
)
|
$
|
(114,337
|
)
|
|
In
2012
, the Company recognized a current provision in the U.S. and certain foreign jurisdictions primarily related to inflationary adjustments on non-monetary assets and the Company being subject to the Mexico IETU tax, which is a form of alternative minimum tax. Further, the Company accrued foreign withholding taxes of approximately $0.7 million on inter-company transactions between the U.S. parent and the Argentina, Mexico and Australia subsidiaries. Also, as a result of an audit of the 2009 Bolivian tax return, the Company has recognized an additional $7.8 million of expenses, including interest and penalties for uncertain tax positions for the years ending 2008, 2009, 2010, and 2011 and an additional $3.9 million of expense for the year
51
ended 2012. Finally, the Company recognized a $15.5 million deferred tax provision for the recognition of deferred taxes on deductible temporary differences, utilization of net operating loss carryforwards and deferred withholding taxes in various jurisdictions (principally U.S. and Mexico).
In 2011, the Company recognized a current provision in the U.S. and certain foreign jurisdictions primarily related to higher metals prices, inflationary adjustments on non-monetary assets and unrealized foreign exchange gains on U.S. dollar denominated liabilities in Bolivia. The Company intends to carry back a portion of its 2011 U.S. taxable loss and has recognized a benefit of $2.0 million. Further, the Company accrued foreign withholding taxes of approximately $0.8 million on inter-company transactions between the U.S. parent and the Argentina, Mexico and Australia subsidiaries. Finally, the Company recognized a $51.8 million deferred tax provision for the recognition of deferred taxes on deductible temporary differences, utilization of net operating loss carryforwards and deferred withholding taxes in various jurisdictions (principally Mexico and Bolivia).
Year Ended
December 31, 2011
Compared to Year Ended
December 31, 2010
Revenues
Sales of metal from continuing operations in the year ended December 31, 2011 increased by $
505.7
million, or
98.1%
, from the year ended December 31, 2010 to $
1,021.2
million. The increase was primarily due to an increase in the quantity of silver and gold ounces sold and a higher realized price per ounce for both metals in 2011. The increased sale of gold ounces was primarily due to increased gold production at the Palmarejo mine and a full year of gold production at the Kensington mine. In 2011, the Company sold
19.1
million ounces of silver and
238,551
ounces of gold, compared to sales of 17.2 million ounces of silver and 130,142 ounces of gold in 2010 from continuing operations. In the year ended December 31, 2011, the Company realized average silver and gold prices of $
35.15
per ounce and $
1,558
per ounce, respectively, compared with realized average prices of $20.99 per ounce and $1,237 per ounce, respectively, in the prior year. Silver contributed
64.9%
of sales as compared to
35.1%
from gold.
Included in revenues is by-product metal sales derived from the sale of gold by the Company's silver producing properties. In 2011, by-product revenues totaled $207.4 million compared to $134.9 million in 2010. The Company believes that presentation of these revenue streams as by-products from its current operations will continue to be appropriate in the future.
In the year ended December 31, 2011, the Company’s continuing operations produced a total of
19.1
million ounces of silver and
220,382
ounces of gold compared to 16.8 million ounces of silver and 157,062 ounces of gold in 2010. The increase in silver production is primarily due to higher production levels at Palmarejo and San Bartolomé in 2011 compared to 2010. The increase in gold production is primarily due to an increase in production at the Kensington mine with its first full year production of 88,420 ounces.
Production costs applicable to sales from continuing operations for the year ended December 31, 2011 increased by $
162.3
million, or
63.0%
, from the year ended December 31, 2010 to $
420.0
million. The increase in production costs applicable to sales for the year is primarily due to the inclusion of a full year of operating costs for the Kensington mine and higher production levels at Palmarejo and San Bartolomé.
Depreciation and depletion increased in the year ended December 31, 2011 by $
82.9
million, or
58.5%
, over the prior year, primarily due to an increase in production at the Palmarejo mine and a full year of depreciation and depletion expense from the Kensington mine.
Costs and Expenses
Administrative and general expenses increased $
7.2
million or
29.8%
in 2011 compared to 2010 due primarily to severance related expenses connected to the departure of the Company's former President and Chief Executive Officer and share-based compensation expense from cash settled awards.
Exploration expenses increased by $
4.9
million or
34.2%
in 2011 compared to 2010 primarily as a result of increased exploration activity at and around the Company’s existing properties. This exploration is described in more detail under "Item 2,. Properties."
Pre-development, care and maintenance and other expenses were $
19.4
million, an increase of $
16.6
million from 2010, primarily related to costs incurred to re-permit and prepare for the expansion of mining at Rochester.
Other Income and Expenses
The Company recognized $
5.5
million of loss from debt extinguishments during 2011 due to the pre-payment premium for the early paydown of the Senior Term Notes. During 2010, the Company recognized $20.3 million of loss from debt extinguishments due to the exchange of a portion of the 3.25% convertible senior notes and the 1.25% convertible senior notes for shares of common stock, and the early paydown of the Senior Term Notes.
52
Fair value adjustments during 2011 totaled a loss of $
52.1
million, which was $
65.0
million less than in 2010. The reduction in fair value adjustments was primarily due to a smaller increase in the gold price during 2011 compared to 2010, which resulted in reduced fair value adjustments related to the future estimated royalty payments to Franco Nevada.
Interest expense, net of capitalized interest was $
34.8
million in 2011 compared to $30.9 million in 2010. The increase in interest expense is primarily the result of increased interest expense for the Kensington Term Facility. See Note 14 — Debt and Royalty Obligation to the financial statements included herein, for further discussion. In addition, the Kensington project was placed into service on July 3, 2010, decreasing capitalized interest in 2011 as compared to 2010. Capitalized interest was $2.2 million in 2011 compared to $9.9 million in 2010.
Income Taxes
For the year ended December 31, 2011, the Company reported an income tax provision of approximately $
114.3
million compared to an income tax benefit of $9.5 million in 2010. The following table summarizes the components of the Company’s income tax provision/benefit for the years ended 2011 and 2010.
|
Years Ended
December
|
|||||||
|
|
2011
|
2010
|
|||||
|
Current:
|
|
|
|
|
|||
|
United States — Alternative minimum tax
|
$
|
2,015
|
|
$
|
(482
|
)
|
|
|
United States — Foreign withholding tax
|
(842
|
)
|
(1,009
|
)
|
|||
|
Argentina
|
(1,219
|
)
|
(7,094
|
)
|
|||
|
Australia
|
(1,755
|
)
|
(251
|
)
|
|||
|
Mexico
|
(1,084
|
)
|
(316
|
)
|
|||
|
Bolivia
|
(59,660
|
)
|
(20,268
|
)
|
|||
|
Deferred:
|
|
|
|
|
|||
|
Australia
|
(661
|
)
|
(541
|
)
|
|||
|
Bolivia
|
(207
|
)
|
(1,388
|
)
|
|||
|
Mexico
|
(28,022
|
)
|
24,371
|
|
|||
|
United States
|
(22,902
|
)
|
16,459
|
|
|||
|
Income tax benefit (provision)
|
$
|
(114,337
|
)
|
$
|
9,481
|
|
|
In 2011, the Company recognized a current provision in the U.S. and certain foreign jurisdictions primarily related to higher metals prices, inflationary adjustments on non-monetary assets and unrealized foreign exchange gains on U.S. dollar denominated liabilities in Bolivia. The Company intends to carry back a portion of its 2011 U.S. taxable loss and has recognized a benefit of $2.0 million. Further, the Company accrued foreign withholding taxes of approximately $0.8 million on inter-company transactions between the U.S. parent and the Argentina, Mexico and Australia subsidiaries. Finally, the Company recognized a $51.8 million deferred tax provision for the recognition of deferred taxes on deductible temporary differences, utilization of net operating loss carryforwards and deferred withholding taxes in various jurisdictions (principally Mexico and Bolivia).
In 2010, the Company recognized a current provision in the U.S. and certain foreign jurisdictions primarily related to higher metals prices, inflationary adjustments on non-monetary assets and unrealized foreign exchange gains on U.S. dollar denominated liabilities in Bolivia. Further, the Company accrued foreign withholding taxes of approximately $1.0 million on inter-company transactions between the U.S. parent and the Argentina, Mexico and Australia subsidiaries. Finally, the Company recognized a $40.8 million deferred tax benefit for the recognition of deferred taxes on deductible temporary differences and net operating loss carryforwards in various jurisdictions (principally Mexico). The Company recognized a deferred tax provision of $1.9 million for inflation adjustments on non-monetary assets in Bolivia.
Results of Discontinued Operations
Effective August 9, 2010, Coeur sold its subsidiary, Compañía Minera Cerro Bayo Ltd. (“Minera Cerro Bayo”), which controlled the Cerro Bayo mine in southern Chile, to Mandalay Resources Corporation (“Mandalay”). Under the terms of the agreement, Coeur received the following from Mandalay in exchange for all of the outstanding shares of Minera Cerro Bayo; (i) $6.0 million in cash; (ii) 17,857,143 common shares of Mandalay; (iii) 125,000 ounces of silver to be delivered in six equal quarterly installments commencing in the third quarter of 2011, which had an estimated fair value of $2.3 million; (iv) a 2.0% Net
53
Smelter Royalty (NSR) on production from Minera Cerro Bayo in excess of a cumulative 50,000 ounces of gold and 5,000,000 ounces of silver, which had an estimated fair value of $5.4 million; and (v) existing value-added taxes collected from the Chilean government in excess of $3.5 million. As part of the transaction, Mandalay agreed to pay the next $6.0 million of reclamation costs associated with Minera Cerro Bayo’s nearby Furioso property. Any reclamation costs above that amount will be shared equally by Mandalay and the Company. As a result of the sale, the Company realized a loss on the sale of approximately $2.1 million, net of income taxes.
Loss from discontinued operations, net of taxes, was nil during 2011 compared to $6.0 million during 2010. In addition, the Company recognized a loss of $2.1 million, net of taxes, on the sale of Minera Cerro Bayo in 2010.
The following is a summary of the Company’s discontinued operations included in the consolidated statements of operations for the years ended December 31, 2011 and 2010:
|
2011
|
2010
|
||||||
|
Sales of metal
|
$
|
—
|
|
$
|
—
|
|
|
|
Production costs applicable to sales
|
—
|
|
—
|
|
|||
|
Depreciation and depletion
|
—
|
|
(2,194
|
)
|
|||
|
Administrative and general
|
—
|
|
(18
|
)
|
|||
|
Mining exploration
|
—
|
|
—
|
|
|||
|
Other
|
—
|
|
(2,351
|
)
|
|||
|
Other income and expense
|
—
|
|
(145
|
)
|
|||
|
Income tax expense
|
—
|
|
(1,321
|
)
|
|||
|
Loss from discontinued operations
|
—
|
|
(6,029
|
)
|
|||
|
Loss on sale of net assets of discontinued operations, net of taxes
|
—
|
|
(2,095
|
)
|
|||
|
Loss from discontinued operations
|
$
|
—
|
|
$
|
(8,124
|
)
|
|
Liquidity and Capital Resources
Working Capital; Cash and Cash Equivalents
The Company’s working capital at
December 31, 2012
decreased by
$44.9
million to
$167.9
million compared to
$212.9
million at
December 31, 2011
. The ratio of current assets to current liabilities was
1.70
to 1 at
December 31, 2012
compared to
1.84
to 1 at
December 31, 2011
.
The Company’s financing activities used
$188.1
million of cash during
2012
compared to net cash used for financing activities of
$146.3
million in
2011
. The increase in net cash used in financing activities was primarily due to payments on long term debt, the gold production royalty and the share repurchase program.
As of
December 31, 2012
, the Company’s cash, equivalents and short-term investments totaled
$126.4
million.
Liquidity
The Company intends to indefinitely reinvest a portion of its earnings from its Palmarejo operations in Mexico. Accordingly, U.S. and non-U.S. income and withholding taxes for which deferred taxes might otherwise be required, have not been provided on a cumulative amount of temporary differences (including, for this purpose, any difference between the tax basis in the stock of a consolidated subsidiary and the amount of the subsidiary’s net equity determined for financial reporting purposes) related to investments in foreign subsidiaries of approximately $170.0 million for the year ended
December 31, 2012
and the year ended
December 31, 2011
. The additional U.S. and non-U.S. income and withholding tax that would arise on the reversal of the temporary differences could be offset in part, by tax credits. Because the determination of the amount of available tax credits and the limitations imposed on the annual utilization of such credits are subject to a highly complex series of calculations and expense allocations, it is impractical to estimate the amount of net income and withholding tax that might be payable if a reversal of temporary differences occurred. The Company does not believe that the amounts permanently reinvested will have a material impact on liquidity.
The Company may elect to defer some capital investment activities or to secure additional capital to ensure it maintains sufficient liquidity. In addition, if the Company decides to pursue the acquisition of additional mineral interests, new capital projects, or acquisitions of new properties, mines or companies, additional financing activities may be necessary. There can be no assurances that such financing will be available when or if needed upon acceptable terms, or at all.
54
Cash Provided by Operating Activities
Net cash provided by operating activities in the year ended December 31, 2012 was
$271.6
million, compared with
$416.2
million for the year ended December 31, 2011.
Excluding changes in operating assets and liabilities, the Company’s operating cash flow consisted of the following:
|
|
Year Ended December 31,
|
||||||||||
|
|
2012
|
2011
|
2010
|
||||||||
|
|
(In thousands)
|
||||||||||
|
CASH PROVIDED BY OPERATING ACTIVITIES
|
$
|
271,634
|
|
$
|
416,173
|
|
$
|
165,563
|
|
||
|
Changes in operating assets and liabilities:
|
|||||||||||
|
Receivables and other current assets
|
(9,756
|
)
|
21,950
|
|
6,228
|
|
|||||
|
Prepaid expenses and other
|
(2,489
|
)
|
8,839
|
|
(5,871
|
)
|
|||||
|
Inventories
|
48,305
|
|
30,408
|
|
47,887
|
|
|||||
|
Accounts payable and accrued liabilities
|
31,019
|
|
(22,990
|
)
|
(29,888
|
)
|
|||||
|
Operating cash flow (Non GAAP)
|
$
|
338,713
|
|
$
|
454,380
|
|
$
|
183,919
|
|
||
Cash Used in Investing Activities
Net cash used in investing activities in the year ended
December 31, 2012
was
$133.1
million, compared to
$161.0
million in the year ended
December 31, 2011
. The decrease was primarily the result of a decrease in purchases of investments and an increase in the proceeds from sale of investments. The Company spent
$13.0
million to purchase investments in
2012
, compared with
$49.5
million in 2011. The Company had proceeds from sales of investments of
$21.7
million in
2012
, compared with
$6.2
million in
2011
.
The Company spent
$115.6
million on capital expenditures in
2012
, compared with
$120.0
million during
2011
. Capital expenditures in
2012
were primarily related to capitalized exploration drilling and development of the Guadalupe satellite underground mine; underground development at Palmarejo; and tailings expansion, paste plant construction, underground development and upgraded surface facilities at Kensington.
On December 21, 2012, the Company completed its acquisition of the equity interests of Mirasol Argentina SRL in exchange for a total of approximately
1.3 million
shares of Coeur common stock valued at $30 million, a total cash payment of approximately
$30.0 million
and assumption of liabilities of
$0.1 million
. Mirasol Argentina SRL holds the Joaquin silver-gold project in the Santa Cruz province of Argentina.
Cash Used in Financing Activities
Net cash used in financing activities during the year ended
December 31, 2012
was
$188.1
million compared to
$146.3
million for the same time period last year. The increase in cash used in financing activities is primarily the result of repaying off the Kensington Term Facility (as defined below). During the year ended
December 31, 2012
, the Company paid
$171.9
million to settle existing debt and royalty obligations, primarily the repayment of the Kensington Term Facility and payment of the Palmarejo gold production royalty. During the year ended December 31, 2011, the Company paid
$172.5
million to settle existing debt.
Revolving Credit Facility
On August 1, 2012, Coeur Alaska, Inc. and Coeur Rochester, Inc. (the “Borrowers”), each a wholly-owned subsidiary of the Company, entered into a Credit Agreement (the “Credit Agreement”) by and among the Company, the Borrowers, the lenders party thereto and Wells Fargo Bank, N.A., as administrative agent. The Credit Agreement provides for a senior secured revolving credit facility (the “Revolving Credit Facility”) in an aggregate principal amount of up to $100.0 million, which principal amount may be increased, subject to receiving additional commitments therefor, by up to $50.0 million. The unused line fee for the twelve months ended
December 31, 2012
was $
0.2
million and was charged to interest expense.
The term of the Revolving Credit Facility is four years. Amounts may be borrowed under the Revolving Credit Facility to finance working capital and general corporate purposes of the Company and its subsidiaries, including the payment of fees and expenses incurred in connection with the Revolving Credit Facility. The obligations under the Revolving Credit Facility will be secured by substantially all of the assets of the Company and its domestic subsidiaries, including the land, mineral rights and
55
infrastructure at the Kensington and Rochester mines, as well as a pledge of the shares of certain of the Company's subsidiaries. In addition, in connection with the Revolving Credit Facility, Coeur Alaska, Inc. transferred its existing hedge positions established under the Kensington Term Facility, to Wells Fargo Bank, N.A. as hedge provider.
Borrowings under the Revolving Credit Facility will bear interest at a rate selected by the Borrowers equal to either LIBOR plus a margin of 2.25%-3.25% or an alternate base rate plus a margin of 1.25%-2.25%, with the margin determined by reference to the Company's ratio of consolidated debt to adjusted EBITDA.
Voluntary prepayments of the loans and voluntary reductions of the unutilized portion of the commitments under the Revolving Credit Facility are permitted without prepayment premium or penalty, subject to payment of customary LIBOR breakage costs. Amounts so repaid may be re-borrowed subject to customary requirements.
The Revolving Credit Facility contains representations and warranties, events of default and affirmative and negative covenants that are usual and customary, including covenants that, among other things, restrict the ability of the Company and its subsidiaries to incur additional debt, incur or permit liens on assets, make investments and acquisitions, consolidate or merge with any other company, engage in asset sales and make dividends and distributions. The Revolving Credit Facility also contains financial covenants that require (i) the ratio of consolidated debt to adjusted EBITDA to be not greater than 3.25 to 1.00 (subject to a step-down to 3.00 to 1.00 after two years), (ii) the ratio of adjusted EBITDA to interest expense to be not less than 3.00 to 1.00 and (iii) the tangible net worth to be not less than 90% of the tangible net worth as of March 31, 2012 plus 25% of the net income for each fiscal quarter ending after March 31, 2012 to the date of measurement. The Company was in compliance with all covenants during the year ended 2012.
3.25% Convertible Senior Notes due 2028
As of
December 31, 2012
, the outstanding balance of the 3.25% Convertible Senior Notes was
$48.7
million, or
$48.1
million net of debt discount.
The carrying value of the equity component representing the embedded conversion option at
December 31, 2012
and December 31, 2011 was
$10.9
million.
Each holder of the notes may require that the Company repurchase some or all of the holder’s notes on March 15, 2013, March 15, 2015, March 15, 2018 and March 15, 2023 at a repurchase price equal to 100% of the principal amount of the notes to be repurchased, plus accrued and unpaid interest, in cash, shares of common stock or a combination of cash and shares of common stock, at the Company’s election. Holders will also have the right, following certain fundamental change transactions, to require the Company to repurchase all or any part of their notes for cash at a repurchase price equal to 100% of the principal amount of the notes to be repurchased plus accrued and unpaid interest. The Company may redeem the notes for cash in whole or in part at any time on or after March 22, 2015 at 100% of the principal amount of the notes to be redeemed plus accrued and unpaid interest.
The notes provide for “net share settlement” of any conversions. Pursuant to this feature, upon conversion of the notes, the Company (1) will pay the note holder an amount in cash equal to the lesser of the conversion obligation or the principal amount of the notes and (2) will settle any excess of the conversion obligation above the notes’ principal amount in the Company’s common stock, cash or a combination thereof, at the Company’s election.
The notes are convertible under certain circumstances, as defined in the indenture agreement, at the holder’s option, at an initial conversion rate of 17.60254 shares of the Company’s common stock per $1,000 principal amount of notes, which is equivalent to an initial conversion price of approximately $56.81 per share, subject to adjustment in certain circumstances.
The Company announced on February 13, 2013 that it is offering to repurchase all of its outstanding 3.25% Convertible Senior Notes due 2028.
7.785% Convertible Senior Notes due 2021
On January 29, 2013, the Company completed an offering of
$300 million
in aggregate principal amount of
7.875%
Senior Notes due 2021 (the “Notes”) in a private placement conducted pursuant to Rule 144A and Regulation S under the Securities Act of 1933, as amended (the “Securities Act”).
The Notes are governed by an Indenture, dated as of January 29, 2013 (the “Indenture”), among the Company, as issuer, certain of the Company's subsidiaries named therein, as guarantors thereto (the “Guarantors”), and The Bank of New York Mellon, as trustee (the “Trustee”).
The Notes are the Company's unsecured senior obligations and rank equally in right of payment with all of its existing and future unsecured senior debt and rank senior in right of payment to all of its existing and future subordinated debt. The Notes are effectively subordinated to any of the Company's existing and future secured debt, including indebtedness under the Company's senior credit facility (the “Senior Credit Facility”), to the extent of the value of the assets securing such debt. Initially, the Company's
56
obligations under the Notes are jointly and severally guaranteed by the all of the Company's domestic subsidiaries that guarantee the borrowings under the Senior Credit Facility. In addition, each of the Company's restricted subsidiaries that becomes a borrower under or that guarantees the Senior Credit Facility, or that guarantees other indebtedness that exceeds $20.0 million aggregate principal amount, will be required to guarantee the Notes in the future. The guarantees rank equally in right of payment to all of the Guarantors' existing and future unsecured senior debt and senior in right of payment to all of the Guarantors' existing and future subordinated debt. The guarantees are effectively subordinated to any of the Guarantors' existing and future secured debt to the extent of the value of the assets securing such debt. The Notes are also structurally subordinated to the liabilities of subsidiaries of the Company that have not guaranteed the Notes.
The Notes bear interest at a rate of
7.875%
per year from the date of original issuance or from the most recent payment date to which interest has been paid or provided for. Interest on the Notes is payable semi-annually in arrears on February 1 and August 1 of each year, commencing on August 1, 2013. The Company will make each interest payment to the holders of record of the Notes on the immediately preceding January 15 and July 15. In certain circumstances the Company may be required to pay additional interest.
At any time prior to February 1, 2017, the Company may redeem all or part of the Notes upon not less than 30 nor more than 60 days prior notice at a redemption price equal to the sum of (i)
100%
of the principal amount thereof, plus (ii) a make-whole premium as of the date of redemption, plus (iii) accrued and unpaid interest and additional interest, if any, thereon, to the date of redemption. In addition, the Company may redeem some or all of the Notes on or after February 1, 2017, at redemption prices set forth in the Indenture, together with accrued and unpaid interest. At any time prior to February 1, 2016, the Company may use the proceeds of certain equity offerings to redeem up to
35%
of the aggregate principal amount of the Notes, including any permitted additional Notes, at a redemption price equal to
107.875%
of the principal amount.
Upon the occurrence of a change of control triggering event (as defined in the Indenture), unless the Company has exercised its right to redeem the Notes, each holder of Notes will have the right to require the Company to repurchase all or a portion of such holder's Notes at a price equal to
101%
of the principal amount thereof, plus accrued and unpaid interest, if any, to the date of repurchase.
If the Company or its restricted subsidiaries sell assets under certain circumstances specified in the Indenture and do not use the proceeds for certain specified purposes, the Company must offer to use certain net proceeds therefrom to repurchase the Notes and other debt that ranks equal in right of payment to the Notes on a pro rata basis. The purchase price of the Notes will be equal to
100%
of the principal amount of the Notes repurchased, plus accrued and unpaid interest, if any, to the applicable date of repurchase.
If the Company receives excess political risk insurance proceeds (as defined in the Indenture) related to its San Bartolomé mine and does not use the proceeds for certain specified purposes, the Company must offer to use certain net proceeds therefrom to repurchase the Notes and other debt that ranks equal in right of payment to the Notes and contains similar political risk insurance offer provisions on a pro rata basis. The purchase price of the Notes will be equal to 100% of the principal amount of the Notes repurchased, plus accrued and unpaid interest, if any, to the applicable date of repurchase.
The Indenture contains covenants that, among other things, limit the Company's ability under certain circumstances to create liens or enter into sale-leaseback transactions and impose conditions on the Company's ability to engage in mergers, consolidations and sales of all or substantially all of its assets.
The Indenture also contains certain “Events of Default” (as defined in the Indenture) customary for indentures of this type. If an Event of Default has occurred and is continuing, the Trustee or the holders of not less than 25% in aggregate principal amount of the Notes then outstanding may, and the Trustee at the request of the holders of not less than 25% in aggregate principal amount of the Notes then outstanding shall, declare all unpaid principal of, premium, if any, and accrued interest on all the Notes to be due and payable.
Kensington Term Facility
On August 16, 2012, Coeur Alaska prepaid all obligations and indebtedness outstanding under the Kensington Term Facility, which totaled approximately $68.6 million and resulted in a $1.0 million loss in 2012. Upon payment in full, the Kensington Term Facility was terminated and all of the liens granted under the Kensington Term Facility were released.
As a condition to the Kensington Term Facility, the Company agreed to enter into a gold hedging program which protects a minimum of 243,750 ounces of gold production over the life of the facility against the risk associated with fluctuations in the market price of gold. This program consists of a series of zero cost collars which consist of a floor price and a ceiling price of gold. Coeur Alaska has transferred these hedge positions to Wells Fargo Bank, N.A., as hedge provider. Call options protecting
97,000
ounces of gold were outstanding at December 31, 2012. The weighted average strike price of the call options was
$1,967.89
. Put options protecting
122,000
ounces of gold were outstanding at December 31, 2012. The weighted average strike price of the put options was
$967.86
.
57
Capital Lease Obligations
As of
December 31, 2012
and
December 31, 2011
, the Company had outstanding balances on capital leases of
$11.4
million and
$27.0
million, respectively.
Palmarejo Gold Production Royalty Obligation
On January 21, 2009, Coeur Mexicana entered into a gold production royalty transaction with Franco-Nevada Corporation under which Franco-Nevada purchased a royalty covering 50% of the life of mine gold to be produced from its Palmarejo silver and gold mine in Mexico. Coeur Mexicana received $75.0 million in cash plus a warrant to acquire Franco-Nevada Common Shares (the “Franco-Nevada warrant”), which was valued at $3.0 million at closing of the Franco-Nevada transaction. In September 2010, the warrant was exercised and the related shares were sold for $10.0 million.
The royalty agreement provides for a minimum obligation to be paid monthly on a total of 400,000 ounces of gold, or 4,167 ounces per month over an initial eight year period. Each monthly payment is an amount equal to the greater of 4,167 ounces of gold or 50% of actual gold production multiplied by the excess of the monthly average market price of gold above $400 per ounce (which $400 floor is subject to a 1% annual inflation compounding adjustment beginning on January 21, 2013). As of December 31, 2012, payments had been made on a total of
202,648
ounces of gold with further payments to be made on an additional
197,352
ounces of gold. After payments have been made on a total of 400,000 ounces of gold, the royalty obligation is payable in the amount of 50% of actual gold production per month multiplied by the excess of the monthly average market price of gold above $400 per ounce, adjusted as described above. Payments under the royalty agreement are to be made in cash or gold bullion. During the years ended
December 31, 2012
and
2011
, the Company paid
$74.7
million and
$73.2
million, respectively, in royalty payments to Franco-Nevada Corporation. Payments made during the minimum obligation period will result in a reduction to the remaining minimum obligation. Payments made beyond the minimum obligation period will be recognized as other cash operating expenses and result in an increase to Coeur Mexicana’s reported cash cost per ounce of silver.
The Company used an implicit interest rate of
30.0%
to discount the original obligation, based on the fair value of the consideration received projected over the expected future cash flows at inception of the obligation. The discounted obligation is accreted to its expected future value over the expected minimum payment period based on the implicit interest rate. The Company recognized accretion expense for the years ended
December 31, 2012
,
2011
, and
2010
of
$19.1
million and $22.2 million, and $20.5 million respectively. As of
December 31, 2012
and
2011
, the remaining minimum obligation under the royalty agreement was
$61.9
million and $72.1 million, respectively.
The price volatility associated with the minimum royalty obligation is considered an embedded derivative under U.S. GAAP. Fluctuations in the market price of gold since inception of the agreement have resulted in the recognition of additional fair value adjustments and resulted in higher payments to date. Please see Note 19 — Derivative Financial Instruments in the notes to the consolidated financial statements, Palmarejo Gold Production Royalty, for further discussion of the embedded derivative feature of the royalty agreement.
Capitalized Interest
The Company capitalizes interest incurred on its various debt instruments as a cost of properties under development. For the years ended
December 31, 2012
,
2011
and
2010
, the Company capitalized interest of
$2.7
million, $2.2 million and $9.9 million, respectively.
58
Contractual Obligations
The following table summarizes the Company’s contractual obligations at
December 31, 2012
and the effect such obligations are expected to have on its liquidity and cash flow in future periods.
|
|
Payments Due by Period
|
|||||||||||||||||||
|
Contractual Obligations
|
Total
|
Less Than
1 Year
|
1- 3 Years
|
3-5 Years
|
More Than
5 Years
|
|||||||||||||||
|
Long-term debt obligation:
|
|
|
|
|
|
|
|
|
|
|
||||||||||
|
Convertible debt
(1)
|
$
|
48,658
|
|
$
|
48,658
|
|
$
|
—
|
|
$
|
—
|
|
$
|
—
|
|
|||||
|
Interest on debt
|
25,302
|
|
1,581
|
|
3,163
|
|
3,163
|
|
17,395
|
|
||||||||||
|
|
73,960
|
|
50,239
|
|
3,163
|
|
3,163
|
|
17,395
|
|
||||||||||
|
Capital lease obligations
(2)
|
12,038
|
|
8,323
|
|
3,155
|
|
330
|
|
230
|
|
||||||||||
|
Operating lease obligations:
|
|
|
|
|
|
|
|
|
|
|
||||||||||
|
Hyak Mining Lease
|
6,172
|
|
268
|
|
537
|
|
537
|
|
4,830
|
|
||||||||||
|
Operating leases
|
13,980
|
|
5,065
|
|
8,093
|
|
555
|
|
267
|
|
||||||||||
|
|
20,152
|
|
5,333
|
|
8,630
|
|
1,092
|
|
5,097
|
|
||||||||||
|
Other long-term obligations:
|
|
|
|
|
|
|
|
|
|
|
||||||||||
|
Reclamation and mine closure
(3)
|
93,123
|
|
668
|
|
2,042
|
|
3,903
|
|
86,510
|
|
||||||||||
|
Lines of credit and other financing
(4)
|
—
|
|
—
|
|
—
|
|
—
|
|
—
|
|
||||||||||
|
Severance payments
(5)
|
7,557
|
|
1,437
|
|
—
|
|
—
|
|
6,120
|
|
||||||||||
|
Palmarejo Royalty Obligation
(6)
|
254,966
|
|
69,198
|
|
129,166
|
|
56,602
|
|
—
|
|
||||||||||
|
|
355,646
|
|
71,303
|
|
131,208
|
|
60,505
|
|
92,630
|
|
||||||||||
|
Total
|
$
|
461,796
|
|
$
|
135,198
|
|
$
|
146,156
|
|
$
|
65,090
|
|
$
|
115,352
|
|
|||||
|
(1)
|
See "Item 7. Management's Discussion and Analysis of Financial Condition and Results of Operations - Debt and Capital Resources - 3.25% Convertible Senior Notes due 2028". The Company announced its offer to repurchase the 3.25% Convertible Senior Notes due 2028 on February 12, 2013.
|
|
(2)
|
The Company has entered into various capital lease agreements for commitments principally over the next three years.
|
|
(3)
|
Reclamation and mine closure amounts represent the Company’s estimate of the cash flows associated with its legal obligation to reclaim and remediate mining properties. This amount will decrease as reclamation and remediation work is completed. Amounts shown on the table are undiscounted.
|
|
(4)
|
See "Item 7. Management's Discussion and Analysis of Financial Condition and Results of Operations - Debt and Capital Resources - Revolving Credit Facility."
|
|
(5)
|
Severance amounts represent accrued benefits for government mandated severance at the Palmarejo mine, Martha mine, San Bartolomé mine, and Coeur South America.
|
|
(6)
|
See "Item 7. Management's Discussion and Analysis of Financial Condition and Results of Operations - Debt and Capital Resources - Palmarejo Gold Production Royalty Obligation."
|
Environmental Compliance Expenditures
For the years ended
December 31, 2012
,
2011
, and
2010
, the Company expended $9.6 million, $10.4 million and $7.7 million, respectively, in connection with routine environmental compliance activities at its operating properties. Such activities include monitoring, earth moving, water treatment and re-vegetation activities. In addition, the Company has incurred reclamation costs of $0.5 million, $0.4 million and $0.8 million for the years ended December 31, 2012, 2011 and 2010. Such costs stem from activities including monitoring, earth moving water treatment and re-vegetation activities.
The Company estimates that environmental compliance expenditures during 2013 will be approximately $5.9 million to obtain permit modifications and other regulatory authorizations. Future environmental expenditures will be determined by governmental regulations and the overall scope of the Company’s operating and development activities. The Company places a very high priority on its compliance with environmental regulations.
59
Off-Balance Sheet Arrangements
The Company has no off-balance sheet arrangements.
Recently Adopted Accounting Standards
The Accounting Standard Codification
Effective January 1, 2012, the Company adopted ASU 2011-04 which included new guidance on fair value measurement and disclosure requirements. This standard provides guidance on the application of fair value accounting where it is already required or permitted by other standards. This standard also requires additional disclosures related to transfers of financial instruments within the fair value hierarchy and quantitative and qualitative disclosures related to significant unobservable inputs. In addition, the standard includes specifications for the categorization by level of the fair value hierarchy for items that are not measured at fair value in the statement of financial position, but for which the fair value of such items is required to be disclosed. The adoption of this standard has no material effect on the Company's financial position, results of operations or cash flows. Refer to Note 6 — Fair Value Measurements, for further details regarding the Company’s assets and liabilities measured at fair value.
Effective January 1, 2012, the Company adopted ASU 2011-05 which includes guidance for presentation of comprehensive income and requires that all nonowner changes in stockholders' equity be presented either in a single continuous statement of comprehensive income or in two separate but consecutive statements. The updated guidance was effective for the Company's fiscal year beginning January 1, 2012. The Company chose to use the two-statement approach and the update had no effect on the Company's financial position, results of operations or cash flows.
In December, 2011, the FASB issued ASU 2011-11,
"Balance Sheet (Topic 201): Disclosures about Offsetting Assets and Liabilities."
This ASU adds certain additional disclosure requirements about financial instruments and derivative instruments that are subject to netting arrangements. ASU 2011-11 is effective for fiscal years, and interim periods within those years, beginning after January 1, 2013, with retrospective application required. The Company does not believe the adoption of this update will have a material impact on the disclosure requirements for its consolidated financial statements.
Risk Factors; Forward-Looking Statements
For information relating to important risks and uncertainties that could materially adversely affect the Company’s business, securities, financial condition or operating results, reference is made to the disclosure set forth above in "Item 1A. Risk Factors." In addition, because the preceding discussion includes numerous forward-looking statements relating to the Company, its results of operations and financial condition and business, reference is made to the information set forth above in “Item 1. Business” under the caption “Important Factors Relating to Forward-Looking Statements.”
Item 7A.
Quantitative and Qualitative Disclosure about Market Risk
The Company is exposed to various market risks as a part of its operations. In an effort to mitigate losses associated with these risks, the Company may, at times, enter into derivative financial instruments. These may take the form of forward sales contracts, foreign currency exchange contracts and interest rate swaps. The Company does not actively engage in the practice of trading derivative instruments for profit. This discussion of the Company’s market risk assessments contains “forward looking statements” that contain risks and uncertainties. Actual results and actions could differ materially from those discussed below.
The Company’s operating results are substantially dependent upon the world market prices of silver and gold. The Company has no control over silver and gold prices, which can fluctuate widely and are affected by numerous factors, such as supply and demand and investor sentiment. In order to mitigate some of the risk associated with these fluctuations, the Company will at times enter into forward sale contracts. The Company continually evaluates the potential benefits of engaging in these strategies based on current market conditions. The Company may be exposed to nonperformance risk by counterparties as a result of its hedging activities. This exposure would be limited to the amount that the spot price of the metal falls short of the contract price. The Company enters into contracts and other arrangements from time to time in an effort to reduce the negative effect of price changes on its cashflows. These arrangements typically consist of managing its exposure to foreign currency exchange rates and market prices associated with changes in gold and silver commodity prices. The Company may also manage price risk through the purchase of put options.
Third Party Contracts
The Company enters into concentrate sales contracts with third-party smelters. The contracts, in general, provide for a provisional payment based upon provisional assays and quoted metal prices. The provisionally priced sales contracts contain an embedded derivative that is required to be separated from the host contract for accounting purposes. The host contract is the
60
receivable from the sale of concentrates at the forward price at the time of sale. The embedded derivative, which is the final settlement based on a future price, does not qualify for hedge accounting. These embedded derivatives are recorded as derivative assets in prepaid expenses and other or as derivative liabilities in accrued liabilities and other on the balance sheet and are adjusted to fair value through earnings each period until the date of final settlement.
Concentrate Sales Contracts
At
December 31, 2012
, the Company had outstanding provisionally priced sales of
$33.2
million consisting of
0.4
million ounces of silver and
11,957
ounces of gold, which had a fair value of approximately
$34.1
million including the embedded derivative. For each one cent per ounce change in realized silver price, revenue would vary (plus or minus) approximately
$4,000
and for each one dollar per ounce change in realized gold price, revenue would vary (plus or minus) approximately
$12,000
. At
December 31, 2011
, the Company had outstanding provisionally priced sales of $22.5 million consisting of 0.2 million ounces of silver and 9,701 ounces of gold, which had a fair value of approximately $21.7 million including the embedded derivative. For each one cent per ounce change in realized silver price, revenue would vary (plus or minus) approximately $2,000 and for each one dollar per ounce change in realized gold price, revenue would vary (plus or minus) approximately $9,700.
Foreign Currency Contracts
The Company operates, or has mining interests, in several foreign countries, specifically Australia, Bolivia, Chile, Mexico and Argentina, which exposes it to risks associated with fluctuations in the exchange rates of the currencies involved. As part of its program to manage foreign currency risk, the Company from time to time enters into foreign currency forward exchange contracts. These contracts enable the Company to purchase a fixed amount of foreign currencies. Gains and losses on foreign exchange contracts that are related to firm commitments are designated and effective as hedges and are deferred and recognized in the same period as the related transaction. All other contracts that do not qualify as hedges are marked to market and the resulting gains or losses are recorded in income. The Company continually evaluates the potential benefits of entering into these contracts to mitigate foreign currency risk and proceeds when it believes that the exchange rates are most beneficial.
During
2012
and
2011
, the Company entered into forward foreign currency exchange contracts to reduce the foreign exchange risk associated with forecasted Mexican peso (“MXP”) operating costs at its Palmarejo mine.
At
December 31, 2012
, the Company had MXP foreign exchange contracts of
$26.1
million in U.S. dollars. These contracts require the Company to exchange U.S. dollars for MXP at a weighted average exchange rate of
13.11
MXP to each U.S. dollar and had a fair value of
$0.1
million at
December 31, 2012
. The Company recorded mark-to-market gains (losses) of
$3.3
million, $(3.2) million and $(1.3) million for the years ended
December 31, 2012
,
2011
and
2010
, respectively, which is reflected in the gain (loss) on derivatives. A 10% weakening of the MXP would result in a reduction in fair value of
$2.9
million. The Company recorded realized gains (losses) of
$(1.6)
million, $0.4 million and $1.6 million in production costs applicable to sales during the years ended
December 31, 2012
,
2011
and
2010
, respectively.
Palmarejo Gold Production Royalty
On January 21, 2009, the Company entered into the gold production royalty transaction with Franco-Nevada Corporation. The minimum royalty obligation ends when payments have been made on a total of 400,000 ounces of gold. As of
December 31, 2012
, a total of
197,352
ounces of gold remain outstanding under the minimum royalty obligation. The price volatility associated with the minimum royalty obligation is considered an embedded derivative financial instrument under U.S. GAAP. The fair value of the embedded derivative at
December 31, 2012
and
December 31, 2011
was a liability of
$145.1
million and
$159.4
million, respectively. During the years ended
December 31, 2012
and 2011, the mark-to-market adjustments for this embedded derivative amounted to a gain of
$14.3
million and a gain of $2.6 million, respectively. For the years ended
December 31, 2012
and 2011, realized losses on settlement of the liabilities were
$45.4
million and $42.8 million, respectively. The mark-to-market adjustments and realized losses are included in fair value adjustments, net in the consolidated statement of operations.
The Company used an implicit interest rate of
30.0%
to discount the original obligation, based on the fair value of the consideration received projected over the expected future cash flows at inception of the obligation. The discounted obligation is accreted to its expected future value over the expected minimum payment period based on the implicit interest rate. The Company recognized accretion expense for the years ended
December 31, 2012
, and
2011
of
$19.1
million and $22.2 million, respectively. As of December 31, 2012, and 2011, the remaining minimum obligation under the royalty agreement was
$61.9
million and $72.1 million, respectively.
For each $1.00 increase in the price of gold, the fair value of the net derivative liability at
December 31, 2012
would have increased by approximately $0.2 million. For each $1.00 decrease in the price of gold, the fair value of the net derivative liability at
December 31, 2012
would have decreased by approximately $0.2 million.
61
Gold Hedges
At
December 31, 2012
the Company had outstanding call options requiring it to deliver
97,000
ounces of gold at a weighted average strike price of
$1,968
per ounce if the market price of gold exceeds the strike price. At
December 31, 2012
, the Company had outstanding put options allowing it to sell
122,000
ounces of gold at a weighted average strike price of
$968
per ounce if the market price of gold were to fall below the strike price. The contracts will expire over the next four years. As of December 31, 2011 the fair market value of these contracts was a net liability of
$9.3
million.
Additional information about the Company’s derivative financial instruments may be found in Note 19 - Derivative Financial Instruments in the notes to the consolidated financial statements.
|
Item 8.
|
Financial Statements and Supplementary Data
|
The financial statements required hereunder and contained herein are listed under Item 15, Exhibits, Financial Statement Schedules, below.
|
Item 9.
|
Changes in and Disagreements with Accountants on Accounting and Financial Disclosure
|
Not applicable.
|
Item 9A.
|
Controls and Procedures
|
|
(a)
|
Disclosure Controls and Procedures
|
The Company’s disclosure controls and procedures are designed to provide reasonable assurance that information required to be disclosed by it in its periodic reports filed with the SEC is recorded, processed, summarized and reported, within the time periods specified in the SEC’s rules and forms, and to ensure that such information is accumulated and communicated to the Company’s management, including its Chief Executive Officer, and Chief Financial Officer, as appropriate to allow timely decisions regarding required disclosure. Based on an evaluation of the Company’s disclosure controls and procedures conducted by the Company’s Chief Executive Officer and Chief Financial Officer, such officers concluded that the Company’s disclosure controls and procedures were effective and operating at a reasonable assurance level as of
December 31, 2012
.
|
(b)
|
Management’s Report on Internal Control Over Financial Reporting
|
The management of the Company is responsible for establishing and maintaining adequate internal control over financial reporting. The Securities Exchange Act of 1934 defines internal control over financial reporting in Rule 13a-15(f) and 15d-15(f) as a process designed by, or under the supervision of, the Company’s principal executive and principal financial officers and effected by the Company’s board of directors, management and other personnel, to provide reasonable assurance regarding the reliability of financial reporting and the preparation of financial statements for external purposes in accordance with generally accepted accounting principles and includes those policies and procedures that:
|
•
|
Pertain to the maintenance of records that in reasonable detail accurately and fairly reflect the transactions and dispositions of the assets of the Company;
|
|
•
|
Provide reasonable assurance that transactions are recorded as necessary to permit preparation of financial statements in accordance with generally accepted accounting principles, and that receipts and expenditures of the Company are being made only in accordance with authorizations of management and directors of the Company; and
|
|
•
|
Provide reasonable assurance regarding prevention or timely detection of unauthorized acquisition, use or disposition of the Company’s assets that could have a material effect on the consolidated financial statements.
|
Because of its inherent limitations, internal control over financial reporting may not prevent or detect misstatements. Also, projections of any evaluation of effectiveness to future periods are subject to risk that controls may become inadequate because of changes in conditions, or that the degree of compliance with the policies or procedures may deteriorate.
The Company’s management assessed the effectiveness of the Company’s internal control over financial reporting as of
December 31, 2012
. In making this assessment, the Company’s management used the criteria set forth by the Committee of Sponsoring Organizations of the Treadway Commission (COSO) in
Internal Control-Integrated Framework
. Based upon its assessment, management concluded that, as of
December 31, 2012
, the Company’s internal control over financial reporting is effective based upon those criteria.
The effectiveness of internal control over financial reporting as of December 31, 2012 has been audited by KPMG LLP, as independent registered public accounting firm, as stated in their report which is included herein.
|
(c)
|
Changes in Internal Control Over Financial Reporting
|
62
There have been no changes in the Company’s internal control over financial reporting during the most recently completed fiscal quarter that have materially affected, or are reasonably likely to materially affect, its internal control over financial reporting.
|
Item 9B.
|
Other Information
|
None
|
Item 10.
|
Directors, Executive Officers and Corporate Governance
|
Pursuant to General Instruction G(3) of Form 10-K, the information called for by this item regarding directors is hereby incorporated by reference from the Company’s definitive proxy statement for the 2013 Annual Meeting of Shareholders filed pursuant to Regulation 14A, or an amendment hereto, to be filed not later than 120 days after the end of the fiscal year covered by this report under the captions “Proposal No. 1 Election of Directors”, “Executive Officers”, “Section 16(a) Beneficial Ownership Reporting Compliance,” and “Audit Committee Report”.
|
Item 11.
|
Executive Compensation
|
Pursuant to General Instruction G(3) of Form 10-K, the information called for by this item is hereby incorporated by reference from the Company’s definitive proxy statement for the 2013 Annual Meeting of Shareholders filed pursuant to Regulation 14A, or an amendment hereto, to be filed not later than 120 days after the end of the fiscal year covered by this report under the captions “Compensation Discussion and Analysis,” “2012 Summary Compensation Table,” “2012 Grants of Plan-Based Awards,” “Outstanding Equity Awards at 2012 Fiscal Year End,” “2012 Option Exercises and Stock Vested,” “Pension Benefits and Non-Qualified Deferred Compensation,” “Director Compensation” and “Compensation Committee Report.”
|
Item 12.
|
Security Ownership of Certain Beneficial Owners and Management and Related Stockholder Matters
|
Pursuant to General Instruction G(3) of Form 10-K, certain information called for by this item is hereby incorporated by reference from the Company’s definitive proxy statement for the 2013 Annual Meeting of Shareholders filed pursuant to Regulation 14A, or an amendment hereto, to be not later than 120 days after the end of the fiscal year covered by this report under the caption “Share Ownership.”
Equity Compensation Plan Information
The following table sets forth information as of
December 31, 2012
regarding the Company’s equity compensation plans.
|
Plan category
|
Number of shares to be
issued upon exercise of outstanding options, warrants and rights |
Weighted-average exercise
price of outstanding options,
warrants and rights
|
Number of shares remaining
available for future issuance under equity compensation plans (excluding securities reflected in column (a) (1) |
|||||||
|
|
(a)
|
(b)
|
(c)
|
|||||||
|
Equity compensation plans approved by security holders
|
370,000
|
|
$31.04
|
2,925,857
|
|
|||||
|
Equity compensation plans not approved by security holders
|
—
|
|
—
|
|
—
|
|
||||
|
Total
|
370,000
|
|
$
|
31.04
|
|
2,925,857
|
|
|||
_______________________________________
|
(1)
|
Amounts include 109,159 performance shares which are issued at the end of the three year service period if certain market conditions are met and the recipient remains an employee of the Company.
|
|
Item 13.
|
Certain Relationships and Related Transactions, and Director Independence
|
Pursuant to General Instruction G(3) of Form 10-K, the information called for by this item is hereby incorporated by reference from the Company’s definitive proxy statement for the 2013 Annual Meeting of Shareholders filed pursuant to Regulation 14A, or an amendment hereto, to be filed not later than 120 days after the end of the fiscal year covered by this report under the captions “Certain Related Person Transactions” and “Committees of the Board of Directors.”
|
Item 14
.
|
Principal Accountant Fees and Services
|
Pursuant to General Instruction G(3) of Form 10-K, the information called for by this item is hereby incorporated by reference from the Company’s definitive proxy statement for the 2013 Annual Meeting of Shareholders filed pursuant to Regulation 14A,
63
or an amendment hereto, to be filed not later than 120 days after the end of the fiscal year covered by this report under the captions “Audit and Non-Audit Fees” and “Audit Committee Policies and Procedures for Pre-Approval of Independent Auditor Services.”
|
Item 15.
|
Exhibits, Financial Statement Schedules
|
(a) The following financial statements are filed herewith:
|
(1)
|
The following consolidated financial statements of Coeur d’Alene Mines Corporation and subsidiaries are included in Item 8, Financial Statements and Supplementary Data.
|
Consolidated Balance Sheets — December 31, 2012 and 2011.
Consolidated Statements of Operations for the Years Ended December 31, 2012, 2011, and 2010.
Consolidated Statements of Comprehensive Income (loss) for the Years Ended December 31, 2012, 2011, and 2010.
Consolidated Statements of Changes in Shareholders’ Equity for the Years Ended December 31, 2012, 2011 and 2010.
Consolidated Statements of Cash Flows for the Years Ended December 31, 2012, 2011 and 2010.
Notes to Consolidated Financial Statements.
(b)
Exhibits:
The following listed documents are filed as Exhibits to this report:
|
3.1
|
Restated and Amended Articles of Incorporation of the Registrant, as amended effective May 26, 2009. (Incorporated herein by reference to Exhibit 3.1 to the Registrant’s Quarterly Report on Form 10-Q filed on May 10, 2010).
|
|
3.2
|
Certificate of Designation, Preferences and Rights of the Series B Junior Preferred Stock of the Registrant, as filed with Idaho Secretary of State on May 13, 1999 (Incorporated herein by reference to Exhibit 3.C to the Registrant’s Annual Report on Form 10-K filed on March 21, 2003).
|
|
3.3
|
Certificate of Amendment to the Certificate of Designation, Preferences and Rights of Series B Junior Preferred Stock of the Registrant, dated December 7, 2007 (Incorporated herein by reference to Exhibit 3(G) to the Registrant’s Annual Report on Form 10-K filed on February 29, 2008).
|
|
3.4
|
Amended and restated Bylaws of the Registrant, effective July 17, 2012 (Incorporated herein by reference to Exhibit 3.1 to the Registrant’s Current Report on Form 8-K filed on July 23, 2012).
|
|
4.1
|
Specimen certificate of the Registrant’s stock. (Incorporated herein by reference to Exhibit 4.1 to the Registrant’s Current Report on Form 8-K filed on May 27, 2009).
|
|
4.2
|
Indenture dated as of March 18, 2008, by and between the Registrant and the Bank of New York relating to the Registrant’s 3.25% Convertible Senior Notes due 2028 (Incorporated herein by reference to Exhibit 4.1 to the Registrant’s Current Report on Form 8-K filed on March 20, 2008).
|
|
4.3
|
First Supplemental Indenture dated as of March 18, 2008 to Indenture dated as of March 18, 2008, by and between the Registrant and the Bank of New York relating to the Registrant’s 3.25% Convertible Senior Notes due 2028 (Incorporated herein by reference to Exhibit 4.2 to the Registrant’s Current Report on Form 8-K filed on March 20, 2008).
|
|
4.4
|
Indenture, dated January 29, 2013, among the Registrant, as issuer, certain subsidiaries of the Registrant, as guarantors thereto, and The Bank of New York Mellon, as trustee (Filed herewith).
|
|
4.5
|
Registration Rights Agreement, dated January 29, 2013, among the Registrant, certain subsidiaries of the Registrant, and Barclays Capital Inc. (Incorporated herein by reference to Exhibit 4.2 to the Registrant's Current Report on Form 8-K filed on January 29, 2013).
|
|
10.1
|
401k Plan of the Registrant. (Incorporated by reference to Exhibit 10(pp) to the Registrant’s Annual Report on Form 10-K filed on March 29, 1995).*
|
|
10.2
|
Amended and Restated 2005 Non-Employee Directors’ Equity Incentive Plan, as amended for the Registrant’s reverse stock split. (Incorporated herein by reference to Exhibit 10(b) to the Registrant’s Annual Report on Form 10-K filed on February 26, 2010).*
|
|
10.3
|
Amended Mining Lease, effective as of August 5, 2005, between Hyak Mining Company, Inc. and Coeur Alaska, Inc. (Incorporated herein by reference to Exhibit 10.5 to the Registrant’s Quarterly Report on Form 10-Q filed on August 12, 2005).
|
|
10.4
|
Silver Sale Agreement, dated September 8, 2005, between the Registrant, Perilya Broken Hill Ltd. and CDE Australia Pty. Ltd. (Portions of this exhibit have been omitted pursuant to a request for confidential treatment.) (Incorporated herein by reference to Exhibit 10.1 to the Registrant’s Quarterly Report on Form 10-Q filed on November 9, 2005).
|
64
|
10.5
|
Form of Restricted Stock Award Agreement (Filed herewith).*
|
|
10.6
|
Form of Incentive Stock Option Award Agreement (Filed herewith).*
|
|
10.7
|
Form of Non-Qualified Stock Option Award Agreement (Filed herewith).*
|
|
10.8
|
Form of Performance Share Award Agreement (Filed herewith).*
|
|
10.9
|
Form of Performance Unit Award Agreement (Filed herewith).*
|
|
10.10
|
Form of Cash Settled Restricted Stock Unit Award Agreement (Incorporated by reference to exhibit 10 (k) to the Registrant's Annual Report on Form 10-K filed on February 26, 2010.)*
|
|
10.11
|
Form of Cash-Settled Stock Appreciation Rights Award Agreement (Filed herewith).*
|
|
10.12
|
Amended and Restated Silver Sale and Purchase Agreement, dated March 28, 2006, between CDE Australia Pty Limited and Cobar Operations Pty Limited (Portions of this exhibit have been omitted pursuant to a request for confidential treatment.) (Incorporated herein by reference to Exhibit 10(b) to the Registrant’s Quarterly Report on Form 10-Q filed on May 9, 2006).
|
|
10.13
|
Supplemental Agreement in respect of the Amended and Restated Silver Sale and Purchase Agreement, dated January 29, 2008, between CDE Australia Pty Limited and Cobar Operations Pty Limited (Incorporated herein by reference to Exhibit 10(cc) to the Registrant’s Annual Report on Form 10-K filed on February 29, 2008).
|
|
10.14
|
Gold royalty stream agreement, dated as of January 21, 2009, by and between the Registrant and Franco-Nevada (Incorporated herein by reference to Exhibit 10.5 to the Registrant’s Quarterly Report on Form 10-Q filed on May 11, 2009).*
|
|
10.15
|
Deed of Termination, dated July 15, 2009, of the Silver Sale Agreement, dated September 8, 2005, between the Registrant, Perilya Broken Hill Ltd. and CDE Australia Pty. Ltd. (Incorporated herein by reference to Exhibit 10.1 to the Registrant’s Quarterly Report on Form 10-Q filed on August 6, 2009.)
|
|
10.16
|
Employment Agreement, dated September 12, 2011, between the Company and Mitchell J. Krebs. (Incorporated by reference to Exhibit 10.1 to the Registrant's Current Report on Form 8-K filed on September 16, 2011.)*
|
|
10.17
|
Side letter, dated September 12, 2011, between the Company and Mitchell J. Krebs. (Incorporated by reference to Exhibit 10.2 to the Registrant's Current Report on Form 8-K filed on September 16, 2011.)*
|
|
10.18
|
Employment Agreement, dated September 16, 2011, between the Company and Frank L. Hanagarne Jr. (Incorporated by reference to Exhibit 10.1 to the Registrant's Current Report on Form 8-K filed on September 19, 2011.)*
|
|
10.19
|
Employment Agreement, dated December 31, 2011, between the Company and Luke Russell. (Filed herewith.)*
|
|
10.20
|
Amended and Restated 2003 Long-Term Incentive Plan of Coeur d'Alene Mines Corporation, dated December 17, 2012 (Filed herewith).*
|
|
10.21
|
Amended and Restated Coeur d'Alene Mines Corporation Executive Severance Policy (Filed herewith).*
|
|
10.22
|
Form of Director Indemnification Agreement (Incorporated herein by reference to Exhibit 10.1 to the Registrant's Current Report on Form 8-K filed on July 23, 2012).
|
|
10.23
|
Form of Officer Indemnification Agreement (Incorporated herein by reference to Exhibit 10.2 to the Registrant's Current Report on Form 8-K filed on July 23, 2012).
|
|
10.24
|
Credit Agreement, dated August 1, 2012, by and among the Registrant, Coeur Alaska, Inc. and Coeur Rochester, Inc., as the borrowers, the lenders party thereto and Wells Fargo Bank, N.A., as administrative agent (Incorporated herein by reference to Exhibit 10.1 to the Registrant's Current Report on Form 8-K filed on August 7, 2012).
|
|
12
|
Computation of Ratio of Earnings to Fixed Charges. (Filed herewith).
|
|
21
|
List of subsidiaries of the Registrant. (Filed herewith).
|
|
23
|
Consent of KPMG LLP, Independent Registered Public Accounting Firm (Filed herewith).
|
|
31.1
|
Certification of the CEO (Filed herewith).
|
|
31.2
|
Certification of the CFO (Filed herewith).
|
|
32.1
|
CEO Section 1350 Certification (Filed herewith).
|
|
32.2
|
CFO Section 1350 Certification (Filed herewith).
|
|
95.1
|
Mine Safety Disclosure (Filed herewith)
|
|
99.1
|
Claims Dispute Map (Filed herewith)
|
|
*
|
Management contract or compensatory plan.
|
65
SIGNATURES
Pursuant to the requirements of Section 13 or 15(d) of the Securities Exchange Act of 1934, the registrant has duly caused this report to be signed on its behalf by the undersigned, thereunto duly authorized.
Coeur d’Alene Mines Corporation
(Registrant)
|
Date:
|
February 21, 2013
|
By:
|
/s/ Mitchell J. Krebs
|
|
|
Mitchell J. Krebs
(Director, President and
Chief Executive Officer)
|
||
Pursuant to the requirements of the Securities Exchange Act of 1934, this report has been signed below by the following persons on behalf of the registrant and in the capacities and on the dates indicated.
|
/s/ Mitchell J. Krebs__________________________
Mitchell J. Krebs
|
Director, President, Chief Executive
Officer
(Principal Executive Officer)
|
February 21, 2013
|
||
|
|
|
|
||
|
/s/ Frank L. Hanagarne Jr.______________________
Frank L. Hanagarne Jr.
|
Senior Vice President, Chief Operating Officer and Chief Financial Officer (Principal Financial Officer )
|
February 21, 2013
|
||
|
|
|
|
||
|
/s/ Elizabeth M. Druffel________________________
Elizabeth M. Druffel
|
Treasurer and Chief Accountant (Principal Accounting Officer )
|
February 21, 2013
|
||
|
/s/ James J.Curran____________________________
James J. Curran
|
Director
|
February 21, 2013
|
||
|
|
|
|
||
|
/s/ Sebastian Edwards_________________________
Sebastian Edwards
|
Director
|
February 21, 2013
|
||
|
|
|
|
||
|
/s/ Robert E. Mellor___________________________
Robert E. Mellor
|
Director
|
February 21, 2013
|
||
|
|
|
|
||
|
/s/ John H. Robinson__________________________
John H. Robinson
|
Director
|
February 21, 2013
|
||
|
|
|
|
||
|
/s/ J. Kenneth Thompson_______________________
J. Kenneth Thompson
|
Director
|
February 21, 2013
|
||
|
|
|
|
||
|
/s/ Michael Bogert____________________________
Michael Bogert
|
Director
|
February 21, 2013
|
||
ANNUAL REPORT ON FORM 10-K
CONSOLIDATED FINANCIAL STATEMENTS
YEAR ENDED DECEMBER 31, 2010
COEUR D’ALENE MINES CORPORATION
COEUR D’ALENE, IDAHO
66
F-1
Report of Independent Registered Public Accounting Firm
The Board of Directors and Shareholders
Coeur d'Alene Mines Corporation:
We have audited the accompanying consolidated balance sheets of Coeur d'Alene Mines Corporation and subsidiaries as of December 31, 2012 and 2011, and the related consolidated statements of operations, comprehensive income (loss), changes in shareholders' equity, and cash flows for each of the years in the three-year period ended December 31, 2012. These consolidated financial statements are the responsibility of the Company's management. Our responsibility is to express an opinion on these consolidated financial statements based on our audits.
We conducted our audits in accordance with the standards of the Public Company Accounting Oversight Board (United States). Those standards require that we plan and perform the audit to obtain reasonable assurance about whether the financial statements are free of material misstatement. An audit includes examining, on a test basis, evidence supporting the amounts and disclosures in the financial statements. An audit also includes assessing the accounting principles used and significant estimates made by management, as well as evaluating the overall financial statement presentation. We believe that our audits provide a reasonable basis for our opinion.
In our opinion, the consolidated financial statements referred to above present fairly, in all material respects, the financial position of Coeur d'Alene Mines Corporation and subsidiaries as of December 31, 2012 and 2011, and the results of their operations and their cash flows for each of the years in the three-year period ended December 31, 2012, in conformity with U.S. generally accepted accounting principles.
We also have audited, in accordance with the standards of the Public Company Accounting Oversight Board (United States), Coeur d'Alene Mines Corporation's internal control over financial reporting as of December 31, 2012, based on criteria established in
Internal Control - Integrated Framework
issued by the Committee of Sponsoring Organizations of the Treadway Commission (COSO), and our report dated February 21, 2013 expressed an unqualified opinion on the effectiveness of the Company's internal control over financial reporting.
/s/ KPMG LLP
Seattle, Washington
February 21, 2013
F-2
Report of Independent Registered Public Accounting Firm
The Board of Directors and Shareholders
Coeur d'Alene Mines Corporation:
We have audited Coeur d'Alene Mines Corporation's internal control over financial reporting as of December 31, 2012, based on criteria established in
Internal Control - Integrated Framework
issued by the Committee of Sponsoring Organizations of the Treadway Commission (COSO). Coeur d'Alene Mines Corporation's management is responsible for maintaining effective internal control over financial reporting and for its assessment of the effectiveness of internal control over financial reporting, included in the accompanying Management's Report on Internal Control over Financial Reporting. Our responsibility is to express an opinion on the Company's internal control over financial reporting based on our audit.
We conducted our audit in accordance with the standards of the Public Company Accounting Oversight Board (United States). Those standards require that we plan and perform the audit to obtain reasonable assurance about whether effective internal control over financial reporting was maintained in all material respects. Our audit included obtaining an understanding of internal control over financial reporting, assessing the risk that a material weakness exists, and testing and evaluating the design and operating effectiveness of internal control based on the assessed risk. Our audit also included performing such other procedures as we considered necessary in the circumstances. We believe that our audit provides a reasonable basis for our opinion.
A company's internal control over financial reporting is a process designed to provide reasonable assurance regarding the reliability of financial reporting and the preparation of financial statements for external purposes in accordance with generally accepted accounting principles. A company's internal control over financial reporting includes those policies and procedures that (1) pertain to the maintenance of records that, in reasonable detail, accurately and fairly reflect the transactions and dispositions of the assets of the company; (2) provide reasonable assurance that transactions are recorded as necessary to permit preparation of financial statements in accordance with generally accepted accounting principles, and that receipts and expenditures of the company are being made only in accordance with authorizations of management and directors of the company; and (3) provide reasonable assurance regarding prevention or timely detection of unauthorized acquisition, use, or disposition of the company's assets that could have a material effect on the financial statements.
Because of its inherent limitations, internal control over financial reporting may not prevent or detect misstatements. Also, projections of any evaluation of effectiveness to future periods are subject to the risk that controls may become inadequate because of changes in conditions, or that the degree of compliance with the policies or procedures may deteriorate.
In our opinion, Coeur d'Alene Mines Corporation maintained, in all material respects, effective internal control over financial reporting as of December 31, 2012, based on criteria established in
Internal Control - Integrated Framework
issued by the Committee of Sponsoring Organizations of the Treadway Commission.
We also have audited, in accordance with the standards of the Public Company Accounting Oversight Board (United States), the consolidated balance sheets of Coeur d'Alene Mines Corporation and subsidiaries as of December 31, 2012 and 2011, and the related consolidated statements of operations, comprehensive income (loss), changes in shareholders' equity, and cash flows for each of the years in the three-year period ended December 31, 2012, and our report dated February 21, 2013 expressed an unqualified opinion on those consolidated financial statements.
/s/ KPMG LLP
Seattle, Washington
February 21, 2013
F-3
COEUR D’ALENE MINES CORPORATION AND SUBSIDIARIES
|
December 31,
2012 |
December 31,
2011 |
|||||||||
|
ASSETS
|
Notes
|
|
(In thousands, except share data)
|
|||||||
|
CURRENT ASSETS
|
||||||||||
|
Cash and cash equivalents
|
$
|
125,440
|
|
$
|
175,012
|
|
||||
|
Short term investments
|
9
|
|
999
|
|
20,254
|
|
||||
|
Receivables
|
10
|
|
62,438
|
|
83,497
|
|
||||
|
Ore on leach pad
|
22,991
|
|
27,252
|
|
||||||
|
Metal and other inventory
|
11
|
|
170,670
|
|
132,781
|
|
||||
|
Deferred tax assets
|
16
|
|
2,458
|
|
1,869
|
|
||||
|
Restricted assets
|
396
|
|
60
|
|
||||||
|
Prepaid expenses and other
|
20,790
|
|
24,218
|
|
||||||
|
406,182
|
|
464,943
|
|
|||||||
|
NON-CURRENT ASSETS
|
||||||||||
|
Property, plant and equipment, net
|
12
|
|
683,860
|
|
687,676
|
|
||||
|
Mining properties, net
|
13
|
|
1,991,951
|
|
2,001,027
|
|
||||
|
Ore on leach pad, non-current portion
|
21,356
|
|
6,679
|
|
||||||
|
Restricted assets
|
24,970
|
|
28,911
|
|
||||||
|
Marketable securities
|
9
|
|
27,065
|
|
19,844
|
|
||||
|
Receivables, non-current portion
|
10
|
|
48,767
|
|
40,314
|
|
||||
|
Debt issuance costs, net
|
3,713
|
|
1,889
|
|
||||||
|
Deferred tax assets
|
16
|
|
955
|
|
263
|
|
||||
|
Other
|
12,582
|
|
12,895
|
|
||||||
|
TOTAL ASSETS
|
$
|
3,221,401
|
|
$
|
3,264,441
|
|
||||
|
LIABILITIES AND SHAREHOLDERS’ EQUITY
|
||||||||||
|
CURRENT LIABILITIES
|
||||||||||
|
Accounts payable
|
$
|
57,482
|
|
$
|
78,590
|
|
||||
|
Accrued liabilities and other
|
10,002
|
|
13,126
|
|
||||||
|
Accrued income taxes
|
27,108
|
|
47,803
|
|
||||||
|
Accrued payroll and related benefits
|
21,306
|
|
16,240
|
|
||||||
|
Accrued interest payable
|
478
|
|
559
|
|
||||||
|
Current portion of debt and capital leases
|
12,14
|
|
55,983
|
|
32,602
|
|
||||
|
Current portion of royalty obligation
|
14
|
|
65,104
|
|
61,721
|
|
||||
|
Current portion of reclamation and mine closure
|
15
|
|
668
|
|
1,387
|
|
||||
|
Deferred tax liabilities
|
16
|
|
121
|
|
53
|
|
||||
|
238,252
|
|
252,081
|
|
|||||||
|
NON-CURRENT LIABILITIES
|
||||||||||
|
Long-term debt and capital leases
|
14
|
|
3,460
|
|
115,861
|
|
||||
|
Non-current portion of royalty obligation
|
14,19
|
141,879
|
|
169,788
|
|
|||||
|
Reclamation and mine closure
|
15
|
|
34,670
|
|
32,371
|
|
||||
|
Deferred tax liabilities
|
16
|
|
577,488
|
|
527,573
|
|
||||
|
Other long-term liabilities
|
27,372
|
|
30,046
|
|
||||||
|
784,869
|
|
875,639
|
|
|||||||
|
COMMITMENTS AND CONTINGENCIES (Notes 12, 14, 15, 16, 19, 20 and 23)
|
|
|
||||||||
|
SHAREHOLDERS’ EQUITY
|
||||||||||
|
Common stock, par value $0.01 per share; authorized 150,000,000 shares, issued and outstanding 90,342,338 at December 31, 2012 and 89,655,124 at December 31, 2011
|
903
|
|
897
|
|
||||||
|
Additional paid-in capital
|
2,601,254
|
|
2,585,632
|
|
||||||
|
Accumulated deficit
|
(396,156
|
)
|
(444,833
|
)
|
||||||
|
Accumulated other comprehensive loss
|
(7,721
|
)
|
(4,975
|
)
|
||||||
|
2,198,280
|
|
2,136,721
|
|
|||||||
|
TOTAL LIABILITIES AND SHAREHOLDERS’ EQUITY
|
$
|
3,221,401
|
|
$
|
3,264,441
|
|
||||
The accompanying notes are an integral part of these consolidated financial statements.
F-4
COEUR D’ALENE MINES CORPORATION AND SUBSIDIARIES
|
|
Years Ended December 31,
|
||||||||||
|
|
2012
|
2011
|
2010
|
||||||||
|
|
(In thousands, except share data)
|
||||||||||
|
Sales of metal
|
$
|
895,492
|
|
$
|
1,021,200
|
|
$
|
515,457
|
|
||
|
Production costs applicable to sales
|
(456,757
|
)
|
(419,956
|
)
|
(257,636
|
)
|
|||||
|
Depreciation, depletion and amortization
|
(218,857
|
)
|
(224,500
|
)
|
(141,619
|
)
|
|||||
|
Gross profit
|
219,878
|
|
376,744
|
|
116,202
|
|
|||||
|
COSTS AND EXPENSES
|
|||||||||||
|
Administrative and general
|
32,977
|
|
31,379
|
|
24,176
|
|
|||||
|
Exploration
|
26,270
|
|
19,128
|
|
14,249
|
|
|||||
|
Loss on impairment
|
5,825
|
|
—
|
|
—
|
|
|||||
|
Pre-development, care, maintenance and other
|
1,261
|
|
19,441
|
|
2,877
|
|
|||||
|
Total cost and expenses
|
66,333
|
|
69,948
|
|
41,302
|
|
|||||
|
OPERATING INCOME
|
153,545
|
|
306,796
|
|
74,900
|
|
|||||
|
OTHER INCOME AND EXPENSE, NET
|
|||||||||||
|
Loss on debt extinguishments
|
(1,036
|
)
|
(5,526
|
)
|
(20,300
|
)
|
|||||
|
Fair value adjustments, net
|
(23,487
|
)
|
(52,050
|
)
|
(117,094
|
)
|
|||||
|
Interest income and other, net
|
14,436
|
|
(6,610
|
)
|
771
|
|
|||||
|
Interest expense, net of capitalized interest
|
(26,169
|
)
|
(34,774
|
)
|
(30,942
|
)
|
|||||
|
Total other income and expense, net
|
(36,256
|
)
|
(98,960
|
)
|
(167,565
|
)
|
|||||
|
Income (loss) from continuing operations before income taxes
|
117,289
|
|
207,836
|
|
(92,665
|
)
|
|||||
|
Income tax (provision) benefit
|
(68,612
|
)
|
(114,337
|
)
|
9,481
|
|
|||||
|
Income (loss) from continuing operations
|
$
|
48,677
|
|
$
|
93,499
|
|
$
|
(83,184
|
)
|
||
|
Loss from discontinued operations
|
—
|
|
—
|
|
(6,029
|
)
|
|||||
|
Loss on sale of net assets of discontinued operations
|
—
|
|
—
|
|
(2,095
|
)
|
|||||
|
NET INCOME (LOSS)
|
$
|
48,677
|
|
$
|
93,499
|
|
$
|
(91,308
|
)
|
||
|
BASIC AND DILUTED INCOME (LOSS) PER SHARE
|
|||||||||||
|
Basic income (loss) per share:
|
|||||||||||
|
Net income (loss) from continuing operations
|
$
|
0.54
|
|
$
|
1.05
|
|
$
|
(0.95
|
)
|
||
|
Net income (loss) from discontinued operations
|
—
|
|
—
|
|
(0.10
|
)
|
|||||
|
Net income (loss)
|
0.54
|
|
1.05
|
|
(1.05
|
)
|
|||||
|
Diluted income (loss) per share:
|
|||||||||||
|
Net income (loss) from continuing operations
|
$
|
0.54
|
|
$
|
1.04
|
|
$
|
(0.95
|
)
|
||
|
Net income (loss) from discontinued operations
|
—
|
|
—
|
|
(0.10
|
)
|
|||||
|
Net income (loss)
|
$
|
0.54
|
|
$
|
1.04
|
|
$
|
(1.05
|
)
|
||
|
Weighted average number of shares of common stock
|
|||||||||||
|
Basic
|
89,437
|
|
89,383
|
|
87,185
|
|
|||||
|
Diluted
|
89,603
|
|
89,725
|
|
87,185
|
|
|||||
The accompanying notes are an integral part of these consolidated financial statements.
F-5
COEUR D’ALENE MINES CORPORATION AND SUBSIDIARIES
CONSOLIDATED STATEMENTS OF COMPREHENSIVE INCOME (LOSS)
|
|
Years ended
December 31, |
|||||||
|
2012
|
2011
|
2010
|
||||||
|
(In thousands)
|
||||||||
|
Net income (loss)
|
$
|
48,677
|
|
93,499
|
|
$
|
(91,308
|
)
|
|
OTHER COMPREHENSIVE LOSS:
|
||||||||
|
Unrealized loss on available for sale securities, net
|
(2,746
|
)
|
(4,975
|
)
|
(5
|
)
|
||
|
Other comprehensive loss
|
(2,746
|
)
|
(4,975
|
)
|
(5
|
)
|
||
|
COMPREHENSIVE INCOME (LOSS)
|
$
|
45,931
|
|
88,524
|
|
$
|
(91,313
|
)
|
The accompanying notes are an integral part of these consolidated financial statements.
F-6
COEUR D’ALENE MINES CORPORATION AND SUBSIDIARIES
CONSOLIDATED STATEMENT OF CHANGES IN SHAREHOLDERS’ EQUITY
Years ended December 31, 2012, 2011, and 2010
|
(In thousands)
|
Common
Stock
Shares
|
Common
Stock Par
Value
|
Additional Paid-
In Capital
|
Accumulated
Deficit
|
Accumulated
Other
Comprehensive
Loss
|
Total
|
||||||||||||||||
|
Balances at December 31, 2009
|
80,310
|
|
$
|
803
|
|
$
|
2,444,262
|
|
$
|
(447,024
|
)
|
$
|
5
|
|
$
|
1,998,046
|
|
|||||
|
Net loss
|
—
|
|
—
|
|
—
|
|
(91,308
|
)
|
—
|
|
(91,308
|
)
|
||||||||||
|
Common stock issued for payment of principal, interest and financing fees on 6.5% Senior Secured Notes
|
1,357
|
|
13
|
|
19,993
|
|
—
|
|
—
|
|
20,006
|
|
||||||||||
|
Common stock issued to extinguish 3.25% and 1.25% debt
|
7,639
|
|
77
|
|
113,357
|
|
—
|
|
—
|
|
113,434
|
|
||||||||||
|
Common stock issued/cancelled under long-term incentive plans and director fees and options, net
|
10
|
|
—
|
|
594
|
|
—
|
|
—
|
|
594
|
|
||||||||||
|
Other
|
—
|
|
—
|
|
—
|
|
—
|
|
(5
|
)
|
(5
|
)
|
||||||||||
|
Balances at December 31, 2010
|
89,316
|
|
$
|
893
|
|
$
|
2,578,206
|
|
$
|
(538,332
|
)
|
$
|
—
|
|
$
|
2,040,767
|
|
|||||
|
Net income
|
—
|
|
—
|
|
—
|
|
93,499
|
|
—
|
|
93,499
|
|
||||||||||
|
Common stock issued/cancelled under long-term incentive plans, net
|
339
|
|
4
|
|
7,426
|
|
—
|
|
—
|
|
7,430
|
|
||||||||||
|
Other comprehensive loss
|
—
|
|
—
|
|
—
|
|
—
|
|
(4,975
|
)
|
(4,975
|
)
|
||||||||||
|
Balances at December 31, 2011
|
89,655
|
|
$
|
897
|
|
$
|
2,585,632
|
|
$
|
(444,833
|
)
|
$
|
(4,975
|
)
|
$
|
2,136,721
|
|
|||||
|
Net income
|
—
|
|
—
|
|
—
|
|
48,677
|
|
—
|
|
48,677
|
|
||||||||||
|
Other comprehensive loss
|
—
|
|
—
|
|
—
|
|
—
|
|
(2,746
|
)
|
(2,746
|
)
|
||||||||||
|
Common stock share buy back
|
(893
|
)
|
(9
|
)
|
(19,962
|
)
|
—
|
|
—
|
|
(19,971
|
)
|
||||||||||
|
Common stock issued for the acquisition of Joaquin property
|
1,310
|
|
13
|
|
29,987
|
|
—
|
|
—
|
|
30,000
|
|
||||||||||
|
Common stock issued/cancelled under long-term incentive plans and director fees and options, net
|
270
|
|
2
|
|
5,597
|
|
—
|
|
|
|
5,599
|
|
||||||||||
|
Balances at December 31, 2012
|
90,342
|
|
$
|
903
|
|
$
|
2,601,254
|
|
$
|
(396,156
|
)
|
$
|
(7,721
|
)
|
$
|
2,198,280
|
|
|||||
The accompanying notes are an integral part of these consolidated financial statements.
F-7
COEUR D’ALENE MINES CORPORATION AND SUBSIDIARIES
|
|
Years ended December 31,
|
||||||||||
|
|
2012
|
2011
|
2010
|
||||||||
|
|
(In thousands)
|
||||||||||
|
CASH FLOWS FROM OPERATING ACTIVITIES:
|
|||||||||||
|
Net income (loss)
|
$
|
48,677
|
|
$
|
93,499
|
|
$
|
(91,308
|
)
|
||
|
Add (deduct) non-cash items
|
|||||||||||
|
Depreciation, depletion and amortization
|
218,857
|
|
224,500
|
|
143,813
|
|
|||||
|
Accretion of discount on debt and other assets, net
|
3,431
|
|
4,041
|
|
3,374
|
|
|||||
|
Accretion of royalty obligation
|
18,294
|
|
21,550
|
|
19,018
|
|
|||||
|
Deferred income taxes
|
16,163
|
|
51,792
|
|
(37,628
|
)
|
|||||
|
Loss on debt extinguishment
|
1,036
|
|
5,526
|
|
20,300
|
|
|||||
|
Fair value adjustments, net
|
18,421
|
|
46,450
|
|
115,458
|
|
|||||
|
Loss (gain) on foreign currency transactions
|
(1,381
|
)
|
380
|
|
3,867
|
|
|||||
|
Share-based compensation
|
8,010
|
|
8,122
|
|
7,217
|
|
|||||
|
Loss (gain) on sale of assets
|
1,101
|
|
(1,145
|
)
|
(25
|
)
|
|||||
|
Loss on impairment
|
5,825
|
|
—
|
|
—
|
|
|||||
|
Loss (gain) on asset retirement
|
279
|
|
(335
|
)
|
(167
|
)
|
|||||
|
Changes in operating assets and liabilities:
|
|||||||||||
|
Receivables and other current assets
|
9,756
|
|
(21,950
|
)
|
(6,228
|
)
|
|||||
|
Prepaid expenses and other
|
2,489
|
|
(8,839
|
)
|
5,871
|
|
|||||
|
Inventories
|
(48,305
|
)
|
(30,408
|
)
|
(47,887
|
)
|
|||||
|
Accounts payable and accrued liabilities
|
(31,019
|
)
|
22,990
|
|
29,888
|
|
|||||
|
CASH PROVIDED BY OPERATING ACTIVITIES
|
271,634
|
|
416,173
|
|
165,563
|
|
|||||
|
CASH FLOWS FROM INVESTING ACTIVITIES
|
|||||||||||
|
Capital expenditures
|
(115,641
|
)
|
(119,988
|
)
|
(155,994
|
)
|
|||||
|
Acquisition of Joaquin mineral interests
|
(29,297
|
)
|
—
|
|
—
|
|
|||||
|
Purchase of short term investments and marketable securities
|
(12,959
|
)
|
(49,501
|
)
|
(5,872
|
)
|
|||||
|
Proceeds from sales and maturities of short term investments, marketable securities
|
21,695
|
|
6,246
|
|
24,244
|
|
|||||
|
Other
|
3,087
|
|
2,282
|
|
5,927
|
|
|||||
|
CASH USED IN INVESTING ACTIVITIES
|
(133,115
|
)
|
(160,961
|
)
|
(131,695
|
)
|
|||||
|
CASH FLOWS FROM FINANCING ACTIVITIES:
|
|||||||||||
|
Proceeds from issuance of notes and bank borrowings
|
—
|
|
27,500
|
|
176,166
|
|
|||||
|
Payments on long-term debt, capital leases, and associated costs
|
(97,170
|
)
|
(85,519
|
)
|
(106,827
|
)
|
|||||
|
Payments on gold production royalty
|
(74,734
|
)
|
(73,191
|
)
|
(43,125
|
)
|
|||||
|
Proceeds from gold lease facility
|
—
|
|
—
|
|
18,445
|
|
|||||
|
Payments on gold lease facility
|
—
|
|
(13,800
|
)
|
(37,977
|
)
|
|||||
|
Proceeds from sale-leaseback transactions
|
—
|
|
—
|
|
4,853
|
|
|||||
|
Reductions of (additions to) restricted assets associated with the Kensington Term Facility
|
4,645
|
|
(1,326
|
)
|
(2,353
|
)
|
|||||
|
Share repurchases
|
(19,971
|
)
|
—
|
|
—
|
|
|||||
|
Other
|
(861
|
)
|
18
|
|
286
|
|
|||||
|
CASH (USED IN) PROVIDED BY FINANCING ACTIVITIES
|
(188,091
|
)
|
(146,318
|
)
|
9,468
|
|
|||||
|
(DECREASE) INCREASE IN CASH AND CASH EQUIVALENTS
|
(49,572
|
)
|
108,894
|
|
43,336
|
|
|||||
|
Cash and cash equivalents at beginning of period
|
175,012
|
|
66,118
|
|
22,782
|
|
|||||
|
Cash and cash equivalents at end of period
|
$
|
125,440
|
|
$
|
175,012
|
|
$
|
66,118
|
|
||
The accompanying notes are an integral part of these consolidated financial statements.
F-8
Coeur d'Alene Mines Corporation and Subsidiaries
Notes to Consolidated Financial Statements
|
NOTE 1 -
|
NATURE OF OPERATIONS
|
The Company is a large primary silver producer with significant gold assets located in North America and is engaged, through its subsidiaries, in the operation and ownership, development and exploration of silver and gold mining properties and companies located primarily within South America (Argentina and Bolivia), Mexico (Chihuahua), the United States (Nevada and Alaska) and Australia (New South Wales). Coeur is an Idaho corporation incorporated in 1928.
Basis of Presentation:
These consolidated financial statements have been prepared under United States Generally Accepted Accounting Principles (“U.S. GAAP”). All significant intercompany transactions and balances have been eliminated during consolidation.
Principles of Consolidation:
The consolidated financial statements include the wholly-owned subsidiaries of the Company, the most significant of which are Empresa Minera Manquiri S.A., Coeur Mexicana S.A. de C.V., Coeur Rochester, Inc., Coeur Alaska, Inc., Coeur Argentina S.R.L. and CDE Australia Pty. Ltd. The consolidated financial statements also include all entities in which voting control of more than
50%
is held by the Company. The Company has
no
investments in entities in which it has greater than
50%
ownership interest accounted for using the equity method. Intercompany balances and transactions have been eliminated in consolidation. Investments in corporate joint ventures where the Company has ownership of
50%
or less and funds its proportionate share of expenses are accounted for under the equity method. The Company has
no
investments in entities in which it has a greater than
20%
ownership interest accounted for using the cost method.
Revenue Recognition:
Revenue is recognized when persuasive evidence of an arrangement exists, delivery has occurred, the price is fixed or determinable, no obligations remain and collection is probable. The passing of title to the customer is based on the terms of the sales contract. Product pricing is determined at the point revenue is recognized by reference to active and freely traded commodity markets, for example the London Bullion Market for both gold and silver, in an identical form to the product sold.
Under the Company’s concentrate sales contracts with third-party smelters, final gold and silver prices are set on a specified future quotational period, typically one to three months, after the shipment date based on market metal prices. Revenues and production costs applicable to sales are recorded on a gross basis under these contracts at the time title passes to the buyer based on the forward price for the expected settlement period. The contracts, in general, provide for provisional payment based upon provisional assays and quoted metal prices. Final settlement is based on the average applicable price for the specified future quotational period and generally occurs from three to six months after shipment. Final sales are settled using smelter weights and settlement assays (average of assays exchanged and/or umpire assay results) and are priced as specified in the smelter contract. The Company’s provisionally priced sales contain an embedded derivative that is required to be separated from the host contract for accounting purposes. The host contract is the receivable from the sale of concentrates measured at the forward price at the time of sale. The embedded derivative does not qualify for hedge accounting. The embedded derivative is recorded as a derivative asset in prepaid expenses and other assets or as a derivative liability in accrued liabilities and other on the consolidated balance sheet and is adjusted to fair value through revenue each period until the date of final gold and silver settlement. The form of the material being sold, after deduction for smelting and refining, is in an identical form to that sold on the London Bullion Market. The form of the product is metal in flotation concentrate, which is the final process for which the Company is responsible. Revenue includes the sales of by-product gold from the Company’s silver mining operations.
The effects of forward sales contracts are reflected in revenue at the date the related precious metals are delivered or the contracts expire. Third-party smelting and refining costs of
$16.6 million
,
$17.7 million
and
$8.6 million
in 2012, 2011 and 2010, respectively, are recorded as a reduction of revenue.
At
December 31, 2012
, the Company had outstanding provisionally priced sales of $
33.2
million consisting of
0.4
million ounces of silver and
11,957
ounces of gold, which had a fair value of approximately $
34.1
million including the embedded derivative. For each one cent per ounce change in realized silver price, revenue would vary (plus or minus) approximately $
4,000
and for each one dollar per ounce change in realized gold price, revenue would vary (plus or minus) approximately $
12,000
. At December 31, 2011, the Company had outstanding provisionally priced sales of
$22.5
million consisting of
0.2
million ounces of silver and
9,701
ounces of gold, which had a fair value of approximately
$21.7
million including the embedded derivative. For each one cent per ounce change in realized silver price, revenue would vary (plus or minus) approximately
$2,000
and for each one dollar per ounce change in realized gold price, revenue would vary (plus or minus) approximately
$9,700
.
F-9
Coeur d'Alene Mines Corporation and Subsidiaries
Notes to Consolidated Financial Statements (Unaudited) - (Continued)
Cash and Cash Equivalents:
Cash and cash equivalents include all highly-liquid investments with a maturity of
three months
or less at the date of purchase. The Company minimizes its credit risk by investing its cash and cash equivalents with major U.S. and international banks and financial institutions located principally in the United States with a minimum credit rating of A1 as defined by Standard & Poor’s. The Company’s management believes that no concentration of credit risk exists with respect to the investment of its cash and cash equivalents.
Receivables:
Trade receivables and other receivable balances recorded in other current assets are reported at outstanding principal amounts, net of an allowance for doubtful accounts, if deemed necessary. Management evaluates the collectability of receivable account balances to determine the allowance, if any. Management considers the other party's credit risk and financial condition, as well as current and projected economic and market conditions, in determining the amount of the allowance. Receivable balances are written off when management determines that the balance is uncollectable.
Ore on Leach Pad:
The heap leach process is a process of extracting silver and gold by placing ore on an impermeable pad and applying a diluted cyanide solution that dissolves a portion of the contained silver and gold, which are then recovered in metallurgical processes.
The Company uses several integrated steps to scientifically measure the metal content of ore placed on the leach pads. As the ore body is drilled in preparation for the blasting process, samples are taken of the drill residue which are assayed to determine estimated quantities of contained metal. The Company estimates the quantity of ore by utilizing global positioning satellite survey techniques. The Company then processes the ore through crushing facilities where the output is again weighed and sampled for assaying. A metallurgical reconciliation with the data collected from the mining operation is completed with appropriate adjustments made to previous estimates. The crushed ore is then transported to the leach pad for application of the leaching solution. As the leach solution is collected from the leach pads, it is continuously sampled for assaying. The quantity of leach solution is measured by flow meters throughout the leaching and precipitation process. After precipitation, the product is converted to doré, which is the final product produced by the mine. The inventory is stated at lower of cost or market, with cost being determined using a weighted average cost method.
The Company reported ore on the leach pads of
$44.3
million as of
December 31, 2012
, and
$33.9
million as of
December 31, 2011
. As of
December 31, 2012
,
$23.0
million is reported as a current asset and
$21.3
million is reported as a non-current asset. As of
December 31, 2011
,
$27.3
million is reported as a current asset and
$6.7
million is reported as a non-current asset. The distinction between current and non-current is based upon the expected length of time necessary for the leaching process to remove the metals from the broken ore. The historical cost of the metal that is expected to be extracted within twelve months is classified as current and the historical cost of metals contained within the broken ore that is expected to be extracted beyond twelve months is classified as non-current. Inventories of ore on leach pad are valued based on actual production costs incurred to produce and place ore on the leach pad, adjusted for effects on monthly production costs of abnormal production levels, less costs allocated to minerals recovered through the leach process.
The estimate of both the ultimate recovery expected over time and the quantity of metal that may be extracted relative to the time the leach process occurs requires the use of estimates which are inherently inaccurate since they rely upon laboratory testwork. Testwork consists of 60 day leach columns from which the Company projects metal recoveries up to five years in the future. The quantities of metal contained in the ore are based upon actual weights and assay analysis. The rate at which the leach process extracts gold and silver from the crushed ore is based upon laboratory column tests and actual experience occurring over more than twenty years of leach pad operations at the Rochester mine. The assumptions used by the Company to measure metal content during each stage of the inventory conversion process includes estimated recovery rates based on laboratory testing and assaying. The Company periodically reviews its estimates compared to actual experience and revises its estimates when appropriate.
During the first quarter of 2011, the Company increased its estimated silver ounces contained in the Stage IV heap inventory by
0.7
million and decreased its estimated gold ounces contained in the heap inventory by
298
ounces. During the fourth quarter of 2011, the Company decreased its estimated silver ounces contained in the Stage IV heap inventory by
0.2
million ounces and decreased its estimated gold ounces contained in the Stage IV heap inventory by
10,828
ounces.
During the fourth quarter of 2012, the Company increased its estimated silver ounces contained in the Stage IV heap inventory by
0.5 million
ounces and increased its estimated gold ounces contained in the Stage IV heap inventory by
8,879
ounces.
The increase in estimated silver and gold ounces contained in the stage IV heap inventory is due to a change in the amount of time the Company expects to continue leaching. The ultimate recovery will not be known until leaching operations cease.
Metal and Other Inventory:
Inventories include concentrate ore, doré, ore in stockpiles and operating materials and supplies. The classification of inventory is determined by the stage at which the ore is in the production process. To the extent there is work in process inventories at the Endeavor mine, such amounts are carried as inventories. Inventories of ore in stock piles are sampled for gold and silver content and are valued based on the lower of costs incurred or estimated net realizable value based upon the period ending prices of gold and silver. Material that does not contain a minimum quantity of gold and silver to cover estimated processing expense to recover the contained gold and silver is not classified as inventory and is assigned no value. All inventories are stated at the lower of cost or market, with cost being determined using a weighted average cost method. Concentrate and doré
F-10
Coeur d'Alene Mines Corporation and Subsidiaries
Notes to Consolidated Financial Statements (Unaudited) - (Continued)
inventory includes product at the mine site and product held by refineries and are also valued at lower of cost or market value. Concentrate inventories associated with the Endeavor mine are held by third parties. Metal inventory costs include direct labor, materials, depreciation, depletion and amortization as well as administrative overhead costs relating to mining activities.
Property, Plant, and Equipment:
Expenditures for new facilities, assets acquired pursuant to capital leases, new assets or expenditures that extend the useful lives of existing facilities are capitalized and depreciated using the straight-line method at rates sufficient to depreciate such costs over the shorter of estimated productive lives of such facilities or the useful life of the individual assets. Productive lives range from
7
to
31
years for buildings and improvements and
3
to
13
years for machinery and equipment. Certain mining equipment is depreciated using the units-of-production method based upon estimated total proven and probable reserves. Maintenance and repairs are expensed as incurred. Gains or losses from sales or retirements of assets are included in other income or expense.
Operational Mining Properties and Mine Development:
Capitalization of mine development costs that meet the definition of an asset begins once all operating permits have been secured, mineralization is classified as proven and probable reserves and a final feasibility study has been completed. Mine development costs include engineering and metallurgical studies, drilling and other related costs to delineate an ore body, the removal of overburden to initially expose an ore body at open pit surface mines and the building of access ways, shafts, lateral access, drifts, ramps and other infrastructure at underground mines. Costs incurred during the start-up phase of a mine are expensed as incurred. Costs incurred before mineralization is classified as proven and probable reserves are expensed and classified as Exploration or Pre-development expense. All capitalized costs are amortized using the units of production method over the estimated life of the ore body based on recoverable ounces to be mined from proven and probable reserves. Interest expense allocable to the cost of developing mining properties and to construct new facilities is capitalized until assets are ready for their intended use.
Drilling and related costs incurred at the Company’s operating mines are expensed as incurred as exploration expense, unless the Company can conclude with a high degree of confidence, prior to the commencement of a drilling program, that the drilling costs will result in the conversion of a mineral resource into proven and probable reserves. The Company’s assessment is based on the following factors: results from previous drill programs; results from geological models; results from a mine scoping study confirming economic viability of the resource; and preliminary estimates of mine inventory, ore grade, cash flow and mine life. In addition, the Company must have all permitting and/or contractual requirements necessary to have the right to and/or control of the future benefit from the targeted ore body. The costs of a drilling program that meet these criteria are capitalized as mine development costs. All other drilling and related costs, including those beyond the boundaries of the development and production stage properties, are expensed as incurred.
Drilling and related costs of approximately
$13.9
million and
$7.2
million at
December 31, 2012
and 2011, respectively, met the criteria for capitalization listed above at the Company’s properties that are in the development and production stages.
The cost of removing overburden and waste materials to access the ore body at an open pit mine prior to the production phase are referred to as “pre-stripping costs.” Pre-stripping costs are capitalized during the development of an open pit mine. Stripping costs incurred during the production phase of a mine are variable production costs that are included as a component of inventory to be recognized in production costs applicable to sales in the same period as the revenue from the sale of inventory.
Mineral Interests:
Significant payments related to the acquisition of land and mineral rights are capitalized as incurred. Prior to acquiring such land or mineral rights, the Company generally makes a preliminary evaluation to determine that the property has significant potential to develop an economic ore body. The time between initial acquisition and full evaluation of a property’s potential is variable and is determined by many factors including: location relative to existing infrastructure, the property’s stage of development, geological controls and metal prices. If a mineable ore body is discovered, such costs are amortized when production begins using the units-of-production method based on recoverable ounces to be mined from proven and probable reserves. If no mineable ore body is discovered, such costs are expensed in the period in which it is determined the property has no future economic value. The Company amortizes its mineral interests in the Endeavor mine using the units of production method.
Asset Impairment:
Management reviews and evaluates its long-lived assets for impairment when events and changes in circumstances indicate that the related carrying amounts of its assets may not be recoverable. Impairment is considered to exist if the total probability-weighted estimate or other appropriate estimate of future cash flows on an undiscounted basis are less than the carrying amount of the asset group, including property plant and equipment, mineral property, development property, and any deferred costs. An impairment loss is measured and recorded based on the difference between book value and estimated fair value of the asset group, as determined through the application of present value technique to estimate fair value in the absence of a market price. Future cash flows include estimates of recoverable ounces, gold and silver prices (considering current and historical prices, price trends and related factors), production levels and required capital investment, all based on life-of-mine plans and projections. Assumptions underlying future cash flow estimates are subject to risks and uncertainties. Any differences between these assumptions and actual market conditions or the Company’s actual operating performance could have a material effect on the Company’s determination of its ability to recover the carrying amounts of its long-lived assets resulting in impairment charges. In estimating future cash flows, assets are grouped at the lowest level for which there are identifiable cash flows that are largely
F-11
Coeur d'Alene Mines Corporation and Subsidiaries
Notes to Consolidated Financial Statements (Unaudited) - (Continued)
independent of cash flows from other asset groups. Generally, in estimating future cash flows, all assets are grouped at a particular mine for which there is identifiable cash flow.
Coeur owns, directly or indirectly, 100% of Coeur Argentina S.R.L.
,
which owns and operated the underground silver and gold Martha mine located in Santa Cruz, Argentina. Mining operations commenced at the Martha mine in June 2002 and the mine ceased active mining operation in September 2012. The Company recorded an impairment charge of
$5.8
million in the year ended December 31, 2012.
As of December 31, 2012, the decrease in proven and probable resources at the Kensington mine prompted an impairment review of the carrying value of the mine. The review determined there were no impairments for the Kensington mine. The impairment assessment compared the cumulative undiscounted prospective cash flows of the mine over the expected mine life to the sum of the carrying value of the long-lived assets at Kensington as of December 31, 2012.
Restricted Assets:
The Company, under the terms of its self-insurance and bonding agreements with certain banks, lending institutions and regulatory agencies, is required to collateralize certain portions of its obligations. The Company has collateralized these obligations by assigning certificates of deposit that have maturity dates ranging from
three months to a year
, to the respective institutions or agencies. At
December 31, 2012
and 2011, the Company held certificates of deposit and cash under these agreements of
$25.0
million and
$28.9
million, respectively, restricted for these purposes. The ultimate timing of the release of the collateralized amounts is dependent on the timing and closure of each mine and repayment of the facility. In order to release the collateral, the Company must seek approval from certain government agencies responsible for monitoring the mine closure status. Collateral could also be released to the extent the Company is able to secure alternative financial assurance satisfactory to the regulatory agencies. The Company believes there is a reasonable probability that the collateral will remain in place beyond a twelve-month period and has therefore classified these investments as long-term.
Reclamation and Remediation Costs:
The Company recognizes obligations for the retirement of tangible long-lived assets and other associated asset retirement costs. These legal obligations are associated with the retirement of long-lived assets that result from the acquisition, construction, development and normal use of the asset. The fair value of a liability for an asset retirement obligation will be recognized in the period in which it is incurred if a reasonable estimate of fair value can be made. The fair value of the liability is added to the carrying amount of the associated asset and this additional carrying amount is depreciated over the life of the asset. An accretion cost, representing the increase over time in the present value of the liability, is recorded each period in depreciation, depletion and amortization expense. As reclamation work is performed or liabilities are otherwise settled, the recorded amount of the liability is reduced.
Future remediation costs for inactive mines are accrued based on management’s best estimate at the end of each period of the undiscounted costs expected to be incurred at the site. Such cost estimates include, where applicable, ongoing care and maintenance and monitoring costs. Changes in estimates are reflected in earnings in the period an estimate is revised.
Foreign Currency:
The assets and liabilities of the Company’s foreign subsidiaries are measured using U.S. dollars as their functional currency. Revenues and expenses are translated at the average exchange rate for the period. Foreign currency transaction gains and losses are included in the determination of net income or loss.
Derivative Financial Instruments:
The Company recognizes all derivatives as either assets or liabilities on the balance sheet and measures those instruments at fair value. Changes in the value of derivative instruments are recorded each period in the consolidated statement of operations under the caption "fair value adjustments, net."
Stock-based Compensation Plans:
The Company estimates the fair value of stock options and stock appreciation rights (“SARs”) awards using the Black-Scholes option pricing model. Stock options granted are accounted for as equity-based awards and SARs are accounted for as liability-based awards. The value of the SARs is remeasured at each reporting date. The Company estimates the fair value of performance share and performance unit grants using a Monte Carlo simulation valuation model. Performance shares granted are accounted for as equity based awards and performance shares units are accounted for as liability-based awards. The Company estimates forfeitures of stock-based awards based on historical data and periodically adjusts the forfeiture rate. The adjustment of the forfeiture rate is recorded as a cumulative adjustment in the period the forfeiture estimate is changed. Compensation costs related to stock based compensation are included in administrative and general expenses, production costs applicable to sales and the cost of self-constructed property, plant and equipment as deemed appropriate.
Restricted stock and restricted stock units granted under the Company’s incentive plans are accounted for based on the market value of the underlying shares on the date of grant and vest in equal installments annually over three years. Restricted stock awards are accounted for as equity-based awards and restricted stock unit awards are accounted for as liability-based awards. Restricted stock units are remeasured at each reporting date. Restricted stock units are settled in cash based on the number of vested restricted stock units multiplied by the current market price of the common shares when vested. Holders of the restricted stock are entitled to vote the shares and to receive any dividends declared on the shares.
F-12
Coeur d'Alene Mines Corporation and Subsidiaries
Notes to Consolidated Financial Statements (Unaudited) - (Continued)
Income Taxes:
The Company uses an asset and liability approach which results in the recognition of deferred tax liabilities and assets for the expected future tax consequences or benefits of temporary differences between the financial reporting basis and the tax basis of assets and liabilities, as well as operating loss and tax credit carryforwards, using enacted tax rates in effect in the years in which the differences are expected to reverse.
In assessing the realizability of deferred tax assets, management considers whether it is more likely than not that some portion or all of its deferred tax assets will not be realized. Management considers the scheduled reversal of deferred tax liabilities, projected future taxable income and tax planning strategies in making this assessment. A valuation allowance has been provided for the portion of the Company’s net deferred tax assets for which it is more likely than not that they will not be realized.
The Company and its subsidiaries are subject to U.S. federal income tax as well as income tax of multiple state and foreign jurisdictions. The Company has substantially concluded all U.S. federal income tax matters for years through 1999. Federal income tax returns for 2000 through 2011 are subject to examination. The Company’s practice is to recognize interest and/or penalties related to income tax matters in income tax expense. The Company has accrued additional expense due to an audit of San Bartolomé's 2009 Bolivian tax return, whereby San Bartolomé incurred an additional
$1.4
million of tax expense, including interest and penalties, related to the 2009 tax year and recognized a further
$15.5
million of tax expense, including interest and penalties, related to uncertainty in similar tax positions for the years 2010, 2011 and 2012.
Supplemental Cash Flow Information:
The following table sets forth non-cash financing and investing activities and other cash flow information for the years ended:
|
Non-cash financing and investing activities:
|
2012
|
2011
|
2010
|
||||||||
|
Capital expenditures
(1)
|
$
|
3,402
|
|
$
|
2,936
|
|
$
|
(2,589
|
)
|
||
|
Capital lease obligations
|
1,857
|
|
4,510
|
|
23,437
|
|
|||||
|
Non-cash capitalized interest
|
845
|
|
681
|
|
3,778
|
|
|||||
|
Non-cash interest paid with stock
|
—
|
|
—
|
|
1,756
|
|
|||||
|
Non-cash Joaquin acquisition and related deferred taxes
|
64,133
|
|
—
|
|
—
|
|
|||||
|
Other cash flow information:
|
|
|
|
|
|
|
|||||
|
Interest paid
|
6,092
|
|
11,033
|
|
12,676
|
|
|||||
|
Capitalized interest
|
2,663
|
|
2,175
|
|
9,885
|
|
|||||
|
Income taxes paid
|
54,680
|
|
44,396
|
|
9,998
|
|
|||||
|
(1)
|
Accrued capital expenditures are recognized in the consolidated statements of cash flows in the period in which they are paid.
|
Debt Issuance Costs:
Costs associated with the issuance of debt are included in other noncurrent assets and are amortized over the term of the related debt using the effective interest method. Upon early retirement of all or a portion of a debt issue, a pro-rata fraction of the related debt issuance costs is written off and recognized as loss on debt extinguishment.
Use of Estimates:
The preparation of the Company’s consolidated financial statements in conformity with U.S. GAAP requires management to make estimates and assumptions that affect the amounts reported in their consolidated financial statements and accompanying notes. The areas requiring the use of management’s estimates and assumptions relate to recoverable ounces from proven and probable reserves that are the basis of future cash flow estimates and units-of-production depreciation and amortization calculations; useful lives utilized for depreciation, depletion and amortization; estimates of future cash flows for long lived assets; estimates of recoverable gold and silver ounces in ore on leach pads; the amount and timing of reclamation and remediation costs; valuation allowance for deferred tax assets; and other employee benefit liabilities.
F-13
Coeur d'Alene Mines Corporation and Subsidiaries
Notes to Consolidated Financial Statements (Unaudited) - (Continued)
Basic earnings per share is computed by dividing net income (loss) available to common shareholders by the weighted average number of common shares outstanding during each period. Diluted earnings per share reflect the potential dilution that could occur if securities or other contracts to issue common stock were exercised or converted into common stock. For the year ended
December 31, 2012
,
479,767
shares of common stock equivalents related to equity-based awards have not been included in the diluted per share calculation as the shares would be antidilutive. The
3.25%
Convertible Senior Notes were not included in the computation of diluted earning per share for the years ended
December 31, 2012
, 2011, and 2010 because there is no excess value upon conversion over the principal amount of the Notes. For the year ended
December 31, 2011
,
1,059,228
shares of common stock equivalents related to convertible debt and
4,258
equity based awards have not been included in the diluted per share calculation as the shares would be antidilutive. For the year ended
December 31, 2010
,
1,296,231
common stock equivalents related to convertible debt and
496,291
options were not included in the computation of diluted per share calculations as the Company had recorded a net loss from continuing operations for the period.
The effect of potentially dilutive stock outstanding for the years ended
December 31, 2012
, and 2011 are as follows (in thousands, except per share data):
|
|
Year ended December 31, 2012
|
|||||||||
|
(In thousands except for EPS)
|
||||||||||
|
|
Income
(Numerator)
|
Shares
(Denominator)
|
Per-Share
Amount
|
|||||||
|
Basic EPS
|
||||||||||
|
Net income available to common shareholders
|
$
|
48,677
|
|
89,437
|
|
$
|
0.54
|
|
||
|
Effect of Dilutive Securities
|
||||||||||
|
Equity awards
|
—
|
|
166
|
|
||||||
|
Diluted EPS
|
||||||||||
|
Net income available to common shareholders
|
$
|
48,677
|
|
89,603
|
|
$
|
0.54
|
|
||
|
|
Year ended December 31, 2011
|
|||||||||
|
(In thousands except for EPS)
|
||||||||||
|
|
Income
(Numerator)
|
Shares
(Denominator)
|
Per-Share
Amount
|
|||||||
|
Basic EPS
|
||||||||||
|
Net income available to common shareholders
|
$
|
93,499
|
|
89,383
|
|
$
|
1.05
|
|
||
|
Effect of Dilutive Securities
|
||||||||||
|
Equity awards
|
—
|
|
342
|
|
||||||
|
Diluted EPS
|
||||||||||
|
Net income available to common shareholders
|
$
|
93,499
|
|
89,725
|
|
$
|
1.04
|
|
||
|
NOTE 5 -
|
RECENTLY ADOPTED ACCOUNTING STANDARDS
|
Effective January 1, 2012, the Company adopted ASU 2011-04 which included new guidance on fair value measurement and disclosure requirements. This standard provides guidance on the application of fair value accounting where it is already required or permitted by other standards. This standard also requires additional disclosures related to transfers of financial instruments within the fair value hierarchy and quantitative and qualitative disclosures related to significant unobservable inputs. In addition, the standard includes specifications for the categorization by level of the fair value hierarchy for items that are not measured at fair value in the statement of financial position, but for which the fair value of such items is required to be disclosed. The adoption of this standard has no material effect on the Company's financial position, results of operations or cash flows. Refer to Note 6 — Fair Value Measurements in the notes to the consolidated financial statements, for further details regarding the Company’s assets and liabilities measured at fair value.
Effective January 1, 2012, the Company adopted ASU 2011-05 which includes guidance for presentation of comprehensive income and requires that all nonowner changes in stockholders' equity be presented either in a single continuous statement of comprehensive income or in two separate but consecutive statements. The updated guidance was effective for the Company's fiscal year beginning January 1, 2012. The Company chose to use the two-statement approach and the retrospective update had no effect on the Company's financial position, results of operations or cash flows for any period presented.
F-14
Coeur d'Alene Mines Corporation and Subsidiaries
Notes to Consolidated Financial Statements (Unaudited) - (Continued)
In December, 2011, the FASB issued ASU 2011-11,
"Balance Sheet (Topic 201): Disclosures about Offsetting Assets and Liabilities."
This ASU adds certain additional disclosure requirements about financial instruments and derivative instruments that are subject to netting arrangements. ASU 2011-11 is effective for fiscal years, and interim periods within those years, beginning after January 1, 2013, with retrospective application required. The Company does not believe the adoption of this update will have a material impact on the disclosure requirements for its consolidated financial statements.
Accounting standards establish a fair value hierarchy that prioritizes the inputs to valuation techniques used to measure fair value. The hierarchy gives the highest priority to unadjusted quoted prices in active markets for identical assets or liabilities (Level 1 measurements) and the lowest priority to unobservable inputs (Level 3 measurements). The three levels of the fair value hierarchy are described below:
|
Level 1
|
Unadjusted quoted prices in active markets that are accessible at the measurement date for identical, unrestricted assets or liabilities;
|
|
Level 2
|
Quoted market prices in markets that are not active, or inputs that are observable, either directly or indirectly, for substantially the full term of the asset or liability; and
|
|
Level 3
|
Prices or valuation techniques that require inputs that are both significant to the fair value measurement and unobservable (supported by little or no market activity).
|
The following table sets forth the Company’s financial assets and liabilities measured at fair value on a recurring basis (at least annually) by level within the fair value hierarchy. As required by accounting guidance, assets and liabilities are classified in their entirety based on the lowest level of input that is significant to the fair value measurement (in thousands):
|
|
Fair Value at December 31, 2012
|
||||||||||||||
|
|
Total
|
Level 1
|
Level 2
|
Level 3
|
|||||||||||
|
Assets:
|
|||||||||||||||
|
Short-term investments
|
$
|
999
|
|
$
|
999
|
|
$
|
—
|
|
$
|
—
|
|
|||
|
Marketable equity securities
|
27,065
|
|
27,065
|
|
—
|
|
—
|
|
|||||||
|
Other derivative instruments, net
|
943
|
|
—
|
|
943
|
|
—
|
|
|||||||
|
$
|
29,007
|
|
$
|
28,064
|
|
$
|
943
|
|
$
|
—
|
|
||||
|
Liabilities:
|
|||||||||||||||
|
Royalty obligation embedded derivative
|
$
|
145,098
|
|
$
|
—
|
|
$
|
145,098
|
|
$
|
—
|
|
|||
|
Put and call options
|
9,299
|
|
—
|
|
9,299
|
|
—
|
|
|||||||
|
$
|
154,397
|
|
$
|
—
|
|
$
|
154,397
|
|
$
|
—
|
|
||||
|
|
Fair Value at December 31, 2011
|
||||||||||||||
|
|
Total
|
Level 1
|
Level 2
|
Level 3
|
|||||||||||
|
Assets:
|
|||||||||||||||
|
Short-term investments
|
$
|
20,254
|
|
$
|
20,254
|
|
$
|
—
|
|
$
|
—
|
|
|||
|
Marketable equity securities
|
19,844
|
|
19,844
|
|
—
|
|
—
|
|
|||||||
|
Put and call options
|
3,040
|
|
—
|
|
3,040
|
|
—
|
|
|||||||
|
Silver ounces receivable from Mandalay
|
814
|
|
—
|
|
814
|
|
—
|
|
|||||||
|
$
|
43,952
|
|
$
|
40,098
|
|
$
|
3,854
|
|
$
|
—
|
|
||||
|
Liabilities:
|
|||||||||||||||
|
Royalty obligation embedded derivative
|
$
|
159,400
|
|
$
|
—
|
|
$
|
159,400
|
|
$
|
—
|
|
|||
|
Put and call options
|
20,892
|
|
—
|
|
20,892
|
|
—
|
|
|||||||
|
Other derivative instruments, net
|
4,012
|
|
—
|
|
4,012
|
|
—
|
|
|||||||
|
$
|
184,304
|
|
$
|
—
|
|
$
|
184,304
|
|
$
|
—
|
|
||||
The Company’s short-term investments are readily convertible to cash and, therefore, these investments are classified within Level 1 of the fair value hierarchy.
F-15
Coeur d'Alene Mines Corporation and Subsidiaries
Notes to Consolidated Financial Statements (Unaudited) - (Continued)
The Company’s marketable equity securities are recorded at fair market value in the financial statements based on quoted market prices, which are accessible at the measurement date for identical assets. Such instruments are classified within Level 1 of the fair value hierarchy. Please see Note 9 - Investments for additional details on marketable equity securities.
The Company’s derivative instruments related to the gold put and call options, silver ounces receivable from Mandalay, royalty obligation embedded derivative, and other derivative instruments, net, which relate to the concentrate sales contracts and foreign exchange contracts, are valued using pricing models which require inputs that are derived from observable market data, including contractual terms, forward market prices, yield curves and credit spreads. The model inputs can generally be verified and do not involve significant management judgment. Such instruments are classified within Level 2 of the fair value hierarchy.
The Company had no Level 3 financial assets and liabilities as of
December 31, 2012
or
December 31, 2011
.
Financial assets and liabilities that are not measured at fair value at
December 31, 2012
and December 31, 2011 are set forth in the following table (in thousands):
|
|
Fair Value at December 31, 2012
|
||||||||||||||
|
|
Total
|
Level 1
|
Level 2
|
Level 3
|
|||||||||||
|
Liabilities:
|
|
||||||||||||||
|
3.25% Convertible Senior Notes
|
$
|
48,220
|
|
$
|
48,220
|
|
$
|
—
|
|
$
|
—
|
|
|||
|
Palmarejo Gold Production Royalty Obligation
|
$
|
90,617
|
|
$
|
—
|
|
$
|
90,617
|
|
$
|
—
|
|
|||
|
|
Fair Value at December 31, 2011
|
||||||||||||||
|
|
Total
|
Level 1
|
Level 2
|
Level 3
|
|||||||||||
|
Liabilities:
|
|||||||||||||||
|
3.25% Convertible Senior Notes
|
$
|
49,205
|
|
$
|
49,205
|
|
$
|
—
|
|
$
|
—
|
|
|||
|
Palmarejo Gold Production Royalty Obligation
|
$
|
111,257
|
|
$
|
—
|
|
$
|
111,257
|
|
$
|
—
|
|
|||
The fair value at
December 31, 2012
and December 31, 2011 of the
3.25
% Convertible Senior Notes outstanding were determined by active market transactions. As such, the notes are classified as Level 1 in the fair value hierarchy.
The fair value of the Palmarejo Gold Production Royalty Obligation is valued using a pricing model which requires inputs that are derived from observable market data, including contractual terms, yield curves, and credit spreads. The model inputs can generally be verified and do not involve significant management judgment. As such, the obligation is classified within Level 2 of the fair value hierarchy.
The fair value of the Company's cash equivalents, receivables, restricted assets, accounts payable, accrued liabilities, and capital leases approximate book value due to the nature of these assets and liabilities and are classified as Level 1 in the fair value hierarchy, except for capital leases which are classified as Level 2.
The fair value of the Company's non-current portion of the refundable value added tax is not practicable to estimate due to the uncertainty of the timing of the expected future cash flows to be received see note 10 - Receivables in the notes to the consolidated financial statements.
|
NOTE 7 -
|
DISCONTINUED OPERATIONS
|
In August 2010, the Company sold its
100%
interest in its subsidiary Compañía Minera Cerro Bayo Ltd. (“Minera Cerro Bayo”), which controlled the Cerro Bayo mine in southern Chile, to Mandalay Resources Corporation (“Mandalay”). Under the terms of the agreement, the Company received the following from Mandalay in exchange for all of the outstanding shares of Minera Cerro Bayo: (i)
$6.0
million in cash; (ii)
17,857,143
common shares of Mandalay; (iii)
125,000
ounces of silver to be delivered in six equal quarterly installments commencing in the third quarter of 2011, which had an estimated fair value of
$2.3
million; (iv) a
2.0%
Net Smelter Royalty (NSR) on production from Minera Cerro Bayo in excess of a cumulative
50,000
ounces of gold and
5,000,000
ounces of silver, which had an estimated fair value of
$5.4
million; and (v) existing value-added taxes collected from the Chilean government in excess of
$3.5
million, which were valued at
$3.5
million. As part of the transaction, Mandalay agreed to pay the next
$6.0
million of reclamation costs associated with Minera Cerro Bayo’s nearby Furioso property. Any reclamation costs above that amount will be shared equally by Mandalay and the Company. As a result of the sale, the Company realized a loss in 2010 on the sale of approximately
$2.1
million, net of income taxes.
F-16
Coeur d'Alene Mines Corporation and Subsidiaries
Notes to Consolidated Financial Statements (Unaudited) - (Continued)
The following table details selected financial information included in income (loss) from discontinued operations for the year ended December 31, 2010:
|
|
Year Ended
December 31, 2010
|
||
|
|
Cerro Bayo Mine
|
||
|
Depreciation and depletion
|
(2,194
|
)
|
|
|
Administrative and general
|
(18
|
)
|
|
|
Care and maintenance and other
|
(2,351
|
)
|
|
|
Other income and expense
|
(145
|
)
|
|
|
Income tax expense
|
(1,321
|
)
|
|
|
Income from discontinued operations, net of tax
|
(6,029
|
)
|
|
|
Loss on sale of net assets of discontinued operations
|
(2,095
|
)
|
|
|
|
$
|
(8,124
|
)
|
On December 21, 2012, the Company completed its acquisition of the equity interests of Mirasol Argentina SRL in exchange for a total of approximately
1.3 million
shares of Coeur common stock, a total cash payment of approximately
$30.0 million
and assumption of liabilities of
$0.1 million
. Mirasol Argentina SRL holds the Joaquin silver-gold project in the Santa Cruz province of Argentina. Coeur previously held a
51%
interest in the project. The transaction was accounted for as a purchase of mineral interests since Joaquin is considered to be in the development stage.
The total consideration paid for the asset acquisition was as follows (in thousands):
|
Consideration:
|
||||
|
Common shares issued (1,310,043 at $22.90)
|
$
|
30,000
|
|
|
|
Cash
|
30,000
|
|
||
|
Transaction advisory fees and other acquisition costs
|
1,224
|
|
||
|
Total purchase price
|
61,224
|
|
||
|
Current liabilities
|
80
|
|
||
|
Deferred income taxes
|
32,540
|
|
||
|
Total liabilities assumed
|
32,620
|
|
||
|
Total consideration
|
$
|
93,844
|
|
|
The following summarizes the estimated fair value of the assets acquired on December 21, 2012 (in thousands):
|
Fair value of assets acquired:
|
||||
|
Cash
|
$
|
42
|
|
|
|
Other current assets
|
353
|
|
||
|
Mineral interests (Note 13)
|
93,429
|
|
||
|
Other assets
|
20
|
|
||
|
Total assets acquired
|
$
|
93,844
|
|
|
The Company classifies the marketable securities in which it invests as available-for-sale securities. Such securities are measured at fair market value in the financial statements with unrealized gains or losses recorded in other comprehensive income (loss).
At the time securities are sold or otherwise disposed of, gains or losses are included in net income. The equity securities reflected in the table below consist of equity securities of silver and gold exploration and development companies that the Company purchased. The following table summarizes the Company’s available-for-sale securities on hand as of
December 31, 2012
and
December 31, 2011
(in thousands):
F-17
Coeur d'Alene Mines Corporation and Subsidiaries
Notes to Consolidated Financial Statements (Unaudited) - (Continued)
|
|
Investments in marketable securities
|
||||||||||||||
|
|
Cost
|
Gross
Unrealized
Losses
|
Gross
Unrealized
Gains
|
Estimated
Fair Value
|
|||||||||||
|
Marketable securities at December 31, 2012
|
$
|
34,786
|
|
$
|
(10,443
|
)
|
$
|
2,722
|
|
$
|
27,065
|
|
|||
|
Marketable securities at December 31, 2011
|
$
|
24,819
|
|
$
|
(4,975
|
)
|
$
|
—
|
|
$
|
19,844
|
|
|||
The following table summarizes the gross unrealized losses on investment securities for which other-than-temporary impairments have not been recognized and the fair values of those securities, aggregated by the length of time the individual securities have been in a continuous unrealized loss position, at December 31, 2012 (in thousands):
|
Less than twelve months
|
Twelve months or more
|
Total
|
||||||||||||||||||
|
Unrealized Losses
|
Fair Value
|
Unrealized Losses
|
Fair Value
|
Unrealized Losses
|
Fair Value
|
|||||||||||||||
|
Marketable equity securities
|
$
|
(2,716
|
)
|
$
|
7,728
|
|
$
|
(7,727
|
)
|
$
|
4,948
|
|
$
|
(10,443
|
)
|
$
|
12,676
|
|
||
In the years
December 31, 2012
, and 2011, the Company recognized a net unrealized loss of
$2.7
million and an unrealized loss of
$5.0
million, respectively, in other comprehensive loss. The Company performs a quarterly assessment on each of its marketable securities with unrealized losses to determine if the security is other than temporarily impaired. The Company has the intent and ability to hold these investments to allow sufficient time for a recovery in fair value. The Company's management team uses industry knowledge and expertise to evaluate each investment and has determined that unrealized losses on three investments it currently holds and has concluded that they are not other than temporary based on a review of the potential for each company. The Company determined that one of its available-for-sale investments was other than temporarily impaired at September 30, 2012 and recorded an impairment loss of
$0.6 million
during the third quarter of 2012. There were no impairment losses recorded during 2011. Gross realized gains and losses are based on cost, net of discount or premium of investments sold.
The Company's impairment review includes the following factors:
|
•
|
evaluation of each investment to determine possible indications of impairment
|
|
•
|
analysis of each investment that is in an unrealized loss position, which includes the length of time that the investment has been in an unrealized loss position and the expected period of recovery
|
|
•
|
discussion of evidence of factors that would and would not support the classification of the unrealized loss as other-than-temporary
|
|
•
|
documentation of the analysis and results that support the treatment of the losses on the investments
|
The Company used the following criteria to determine whether a loss is temporary:
|
•
|
the length of time and the extent to which the fair value has been below cost
|
|
•
|
the severity of the impairment
|
|
•
|
the cause of the impairment and the financial condition of the issuer
|
|
•
|
market activity that may indicate adverse credit condition of the issuer
|
|
•
|
the Company's intent and ability to hold the investment for a sufficient period of time to allow for the anticipated recovery in value
|
In addition, the Company had
$1.0
million and
$20.3
million of short-term investments at
December 31, 2012
and
December 31, 2011
, respectively. These investments are primarily in certificates of deposit with various banks and all have maturity dates of less than one year.
F-18
Coeur d'Alene Mines Corporation and Subsidiaries
Notes to Consolidated Financial Statements (Unaudited) - (Continued)
Receivables consist of the following (in thousands):
|
December 31, 2012
|
December 31,
2011
|
||||||
|
Receivables - current portion
|
|||||||
|
Accounts receivable - trade
|
$
|
8,701
|
|
$
|
14,366
|
|
|
|
Refundable income tax
|
9,331
|
|
11,480
|
|
|||
|
Refundable value added tax
|
40,020
|
|
52,968
|
|
|||
|
Accounts receivable - other
|
4,386
|
|
4,683
|
|
|||
|
$
|
62,438
|
|
$
|
83,497
|
|
||
|
Receivables - non-current portion
|
|||||||
|
Refundable value added tax
|
$
|
48,767
|
|
$
|
40,314
|
|
|
Trade receivables and other receivable balances are reported at outstanding principal amounts, net of an allowance for doubtful accounts. Management evaluates the collectability of receivable account balances to determine the allowance, if any. There were no allowances against receivable balances at
December 31, 2012
or
December 31, 2011
.
Taxes paid to foreign governments that are refundable to the Company are classified as “Refundable value added tax” at the face value of the amount of the tax refund due. Refunds expected to be received in the next twelve months are classified as “current” and amounts that are expected to be received after twelve months are classified as “non-current”.
Metal and other inventory consist of the following (in thousands):
|
December 31, 2012
|
December 31,
2011
|
||||||
|
Concentrate and doré inventory
|
$
|
91,130
|
|
$
|
73,590
|
|
|
|
Supplies
|
79,540
|
|
59,191
|
|
|||
|
Metal and other inventory
|
$
|
170,670
|
|
$
|
132,781
|
|
|
Property, plant and equipment consist of the following (in thousands):
|
December 31, 2012
|
December 31,
2011
|
||||||
|
Land
|
$
|
2,010
|
|
$
|
1,432
|
|
|
|
Buildings and improvements
|
581,286
|
|
520,137
|
|
|||
|
Machinery and equipment
|
360,199
|
|
246,584
|
|
|||
|
Capitalized leases for machinery, equipment, buildings, and land
|
35,129
|
|
76,244
|
|
|||
|
978,624
|
|
844,397
|
|
||||
|
Accumulated depreciation and amortization
|
(313,067
|
)
|
(235,528
|
)
|
|||
|
665,557
|
|
608,869
|
|
||||
|
Construction in progress
|
18,303
|
|
78,807
|
|
|||
|
$
|
683,860
|
|
$
|
687,676
|
|
||
F-19
Coeur d'Alene Mines Corporation and Subsidiaries
Notes to Consolidated Financial Statements (Unaudited) - (Continued)
The Company’s capital expenditures by segment were as follows:
|
|
Years Ended December 31,
|
||||||||||
|
|
2012
|
2011
|
2010
|
||||||||
|
Palmarejo
|
$
|
38,456
|
|
$
|
36,976
|
|
$
|
54,226
|
|
||
|
San Bartolomé
|
25,672
|
|
17,731
|
|
6,159
|
|
|||||
|
Kensington
|
36,994
|
|
34,013
|
|
92,730
|
|
|||||
|
Rochester
|
11,794
|
|
27,217
|
|
2,349
|
|
|||||
|
Martha
|
1,193
|
|
3,426
|
|
100
|
|
|||||
|
Other
|
1,532
|
|
625
|
|
430
|
|
|||||
|
Net asset additions
|
$
|
115,641
|
|
$
|
119,988
|
|
$
|
155,994
|
|
||
Minimum future lease payments under capital and operating leases with terms longer than one year at December 31, 2012 are as follows:
|
Year Ending December 31,
|
Capital
Leases
|
Operating
Leases
|
||||||
|
2013
|
$
|
8,323
|
|
$
|
5,065
|
|
||
|
2014
|
2,779
|
|
4,245
|
|
||||
|
2015
|
376
|
|
3,848
|
|
||||
|
2016
|
223
|
|
546
|
|
||||
|
2017
|
107
|
|
9
|
|
||||
|
2018 and thereafter
|
230
|
|
267
|
|
||||
|
Total minimum payments due
|
12,038
|
|
$
|
13,980
|
|
|||
|
Less: Amount representing interest
|
(676
|
)
|
|
|||||
|
Present value of net minimum lease payments (See Note 14)
|
11,362
|
|
|
|
||||
|
Less: Current maturities
|
(7,902
|
)
|
|
|
||||
|
Non-current portion
|
$
|
3,460
|
|
|
|
|||
The Company has also entered into various operating lease agreements which expire over the next year. Total rent expense charged to net income for all operating lease agreements was
$14.1
million,
$14.2
million and
$10.5
million for the years ended
December 31, 2012
,
2011
and
2010
, respectively.
F-20
Coeur d'Alene Mines Corporation and Subsidiaries
Notes to Consolidated Financial Statements (Unaudited) - (Continued)
Mining properties consist of the following (in thousands):
|
December 31, 2012
|
Palmarejo
|
San
Bartolomé
|
Kensington
|
Rochester
|
Martha
|
Endeavor
|
Joaquin
|
Other
|
Total
|
||||||||||||||||||||||||||
|
Mining properties
|
$
|
155,722
|
|
$
|
70,322
|
|
$
|
333,619
|
|
$
|
114,973
|
|
$
|
11,416
|
|
$
|
—
|
|
$
|
—
|
|
$
|
—
|
|
$
|
686,052
|
|
||||||||
|
Accumulated depletion
|
(82,037
|
)
|
(18,439
|
)
|
(46,649
|
)
|
(100,437
|
)
|
(11,416
|
)
|
—
|
|
—
|
|
—
|
|
(258,978
|
)
|
|||||||||||||||||
|
73,685
|
|
51,883
|
|
286,970
|
|
14,536
|
|
—
|
|
—
|
|
—
|
|
—
|
|
427,074
|
|
||||||||||||||||||
|
Mineral interests
|
1,658,389
|
|
26,642
|
|
—
|
|
—
|
|
—
|
|
44,033
|
|
93,429
|
|
—
|
|
1,822,493
|
|
|||||||||||||||||
|
Accumulated depletion
|
(235,795
|
)
|
(7,338
|
)
|
—
|
|
—
|
|
—
|
|
(14,625
|
)
|
—
|
|
—
|
|
(257,758
|
)
|
|||||||||||||||||
|
1,422,594
|
|
19,304
|
|
—
|
|
—
|
|
—
|
|
29,408
|
|
93,429
|
|
—
|
|
1,564,735
|
|
||||||||||||||||||
|
Non-producing and development properties
|
—
|
|
—
|
|
—
|
|
—
|
|
—
|
|
—
|
|
—
|
|
142
|
|
142
|
|
|||||||||||||||||
|
Total mining properties
|
$
|
1,496,279
|
|
$
|
71,187
|
|
$
|
286,970
|
|
$
|
14,536
|
|
$
|
—
|
|
$
|
29,408
|
|
$
|
93,429
|
|
$
|
142
|
|
$
|
1,991,951
|
|
||||||||
|
December 31, 2011
|
Palmarejo
|
San
Bartolomé
|
Kensington
|
Rochester
|
Martha
|
Endeavor
|
Joaquin
|
Other
|
Total
|
||||||||||||||||||||||||||
|
Mining properties
|
$
|
134,296
|
|
$
|
68,684
|
|
$
|
321,456
|
|
$
|
112,826
|
|
$
|
12,643
|
|
$
|
—
|
|
$
|
—
|
|
$
|
—
|
|
$
|
649,905
|
|
||||||||
|
Accumulated depletion
|
(53,060
|
)
|
(14,989
|
)
|
(27,160
|
)
|
(97,834
|
)
|
(10,373
|
)
|
—
|
|
—
|
|
—
|
|
(203,416
|
)
|
|||||||||||||||||
|
81,236
|
|
53,695
|
|
294,296
|
|
14,992
|
|
2,270
|
|
—
|
|
—
|
|
—
|
|
446,489
|
|
||||||||||||||||||
|
Mineral interests
|
1,658,389
|
|
26,642
|
|
—
|
|
—
|
|
—
|
|
44,033
|
|
—
|
|
—
|
|
1,729,064
|
|
|||||||||||||||||
|
Accumulated depletion
|
(158,627
|
)
|
(6,007
|
)
|
—
|
|
—
|
|
—
|
|
(10,034
|
)
|
—
|
|
—
|
|
(174,668
|
)
|
|||||||||||||||||
|
1,499,762
|
|
20,635
|
|
—
|
|
—
|
|
—
|
|
33,999
|
|
—
|
|
—
|
|
1,554,396
|
|
||||||||||||||||||
|
Non-producing and development properties
|
—
|
|
—
|
|
—
|
|
—
|
|
—
|
|
—
|
|
—
|
|
142
|
|
142
|
|
|||||||||||||||||
|
Total mining properties
|
$
|
1,580,998
|
|
$
|
74,330
|
|
$
|
294,296
|
|
$
|
14,992
|
|
$
|
2,270
|
|
$
|
33,999
|
|
$
|
—
|
|
$
|
142
|
|
$
|
2,001,027
|
|
||||||||
Operational Mining Properties
Palmarejo Mine:
Palmarejo is located in the State of Chihuahua in northern Mexico, and its principal silver and gold properties are collectively referred to as the “Palmarejo mine.” The Palmarejo mine commenced production in April 2009.
San Bartolomé Mine:
The San Bartolomé mine is a silver mine located near the city of Potosi, Bolivia. The mineral rights for the San Bartolomé project are held through long-term joint venture/lease agreements with several local independent mining co-operatives and the Bolivian state owned mining organization, (“COMIBOL”). The Company commenced commercial production at San Bartolomé in June 2008.
Kensington Mine:
The Kensington mine is an underground gold mine and consists of the Kensington and adjacent Jualin properties located on the east side of the Lynn Canal about
45
miles north-northwest of Juneau, Alaska. The Company commenced commercial production in July of 2010.
Rochester Mine:
The Company has conducted operations at the Rochester mine, located in Western Nevada, since September 1986. The mine utilizes the heap-leaching process to extract both silver and gold from ore mined using open pit methods. Rochester’s primary product is silver with gold produced as a by-product.
Martha Mine:
The Martha mine is an underground silver mine located in Argentina. Coeur acquired a
100%
interest in the Martha mine in April 2002. Due to high operating costs and a short remaining expected mine life, the Company evaluated strategic and operational alternatives for the Martha mine and recorded an impairment charge of
$5.8
million in the year ended December 31, 2012. The Martha mine ceased active mining operations in September 2012.
Mineral Interests
Endeavor Mine:
In May 2005, CDE Australia Pty Ltd, (“CDE Australia”), a wholly-owned subsidiary of Coeur acquired the silver production and reserves, up to a maximum
17.7 million
payable ounces, contained at the Endeavor mine in Australia, which is owned and operated by Cobar Operations Pty. Limited (“Cobar”), a wholly-owned subsidiary of CBH Resources Ltd.
F-21
Coeur d'Alene Mines Corporation and Subsidiaries
Notes to Consolidated Financial Statements (Unaudited) - (Continued)
(“CBH”). In March 2006, CDE Australia entered into an amended agreement under which it owns all silver production and reserves up to a total of
20.0 million
payable ounces.
CDE Australia began realizing reductions in revenues in the fourth quarter of 2008 as a result of a silver price sharing provision that was part of the purchase agreement. CDE Australia has received approximately
4.2
million payable ounces to-date and the current ore reserve contains approximately
4.5 million
payable ounces based on current metallurgical recovery and current smelter contract terms.
Non-Producing and Development Properties
Joaquin Project – Argentina:
The Joaquin project is located in the Santa Cruz province of southern Argentina. The Company commenced exploration of this large property located north of the Company's Martha silver mine in November 2007. Since that time, the Company has defined silver and gold mineralization in two deposits at Joaquin, La Negra and La Morocha, collectively referred to as the "Joaquin Project," and has recently commenced work on detailed drilling and other technical, economic and environmental programs. Please see Note 8 - Acquisition of Joaquin Mineral Interests in the notes to the consolidated financial statements for more information.
The current and non-current portions of long-term debt and capital lease obligations as of
December 31, 2012
and
December 31, 2011
are as follows (in thousands):
|
|
December 31,
2012 |
December 31,
2011 |
|||||||||||||
|
|
Current
|
Non-Current
|
Current
|
Non-Current
|
|||||||||||
|
3.25% Convertible Senior Notes due March 2028
|
$
|
48,081
|
|
$
|
—
|
|
$
|
—
|
|
$
|
45,545
|
|
|||
|
Kensington Term Facility
|
—
|
|
—
|
|
15,398
|
|
60,425
|
|
|||||||
|
Capital lease obligations
|
7,902
|
|
3,460
|
|
17,119
|
|
9,891
|
|
|||||||
|
Other
|
—
|
|
—
|
|
85
|
|
—
|
|
|||||||
|
$
|
55,983
|
|
$
|
3,460
|
|
$
|
32,602
|
|
$
|
115,861
|
|
||||
3.25% Convertible Senior Notes
As of
December 31, 2012
, the outstanding balance of the
3.25%
Convertible Senior Notes due 2028 was
$48.7
million, or
$48.1
million net of debt discount. The notes are classified as current liabilities as of
December 31, 2012
as a result of the holders' option to require the Company to repurchase the notes on March 15, 2013.
The fair value of the notes outstanding, as determined by market transactions at
December 31, 2012
and
December 31, 2011
was
$48.2
million and
$49.2 million
, respectively. The carrying value of the equity component at
December 31, 2012
and
December 31, 2011
was
$10.9 million
.
For the years ended
December 31, 2012
and 2011, interest expense recognized was
$1.6 million
and
$1.6
million, respectively. For the years ended
December 31, 2012
and 2011 accretion of the debt discount was
$2.5
million and
$2.3 million
, respectively. The debt discount remaining at
December 31, 2012
was
$0.6
million, which will be amortized through March 15, 2013. The effective interest rate on the notes was
8.9%
.
Revolving Credit Facility
On August 1, 2012, Coeur Alaska, Inc. and Coeur Rochester, Inc. (the “Borrowers”), each a wholly-owned subsidiary of the Company, entered into a new Credit Agreement (the “Credit Agreement”) by and among the Company, the Borrowers, the lenders party thereto and Wells Fargo Bank, N.A., as administrative agent. The Credit Agreement provides for a senior secured revolving credit facility (the “Revolving Credit Facility”) in an aggregate principal amount of up to
$100.0
million, which principal amount may be increased, subject to receiving additional commitments therefor, by up to
$50.0
million. The unused line fee for the year ended
December 31, 2012
was $
0.2
million and was charged to interest expense.
The term of the Revolving Credit Facility is four years. Amounts may be borrowed under the Revolving Credit Facility to finance working capital and general corporate purposes of the Company and its subsidiaries, including the payment of fees and expenses incurred in connection with the Revolving Credit Facility. The obligations under the Revolving Credit Facility are secured by substantially all of the assets of the Company and its domestic subsidiaries, including the land, mineral rights and infrastructure at the Kensington and Rochester mines, as well as a pledge of the shares of certain of the Company's subsidiaries. In addition, in connection with the Revolving Credit Facility, Coeur Alaska, Inc. retained its existing hedge positions established under the Kensington Term Facility described below, with Wells Fargo Bank, N.A. as hedge provider.
F-22
Coeur d'Alene Mines Corporation and Subsidiaries
Notes to Consolidated Financial Statements (Unaudited) - (Continued)
Borrowings under the Revolving Credit Facility bear interest at a rate selected by the Borrowers equal to either
LIBOR
plus a margin of
2.25%
-
3.25%
or an
alternate base rate
plus a margin of
1.25%
-
2.25%
, with the margin determined by reference to the Company's ratio of consolidated debt to adjusted EBITDA.
Voluntary prepayments of the loans and voluntary reductions of the unutilized portion of the commitments under the Revolving Credit Facility are permitted without prepayment premium or penalty, subject to payment of customary LIBOR breakage costs. Amounts so repaid may be re-borrowed subject to customary requirements.
The Revolving Credit Facility contains representations and warranties, events of default and affirmative and negative covenants that are usual and customary, including covenants that, among other things, restrict the ability of the Company and its subsidiaries to incur additional debt, incur or permit liens on assets, make investments and acquisitions, consolidate or merge with any other company, engage in asset sales and make dividends and distributions. The Revolving Credit Facility also contains financial covenants that require (i) the ratio of consolidated debt to adjusted EBITDA to be not greater than
3.25
to 1.00 (subject to a step-down to
3.00
to 1.00 after two years), (ii) the ratio of adjusted EBITDA to interest expense to be not less than
3.00
to 1.00 and (iii) the tangible net worth to be not less than
90%
of the tangible net worth as of March 31, 2012 plus
25%
of the net income for each fiscal quarter ending after March 31, 2012 to the date of measurement.
As of
December 31, 2012
, no amounts were outstanding under the Revolving Credit Facility.
Lines of Credit
At December 31, 2012, Empresa Minera Manquiri had two outstanding lines of credit supporting value added tax recoveries in Bolivia. The lines are held with Banco Bisa,
$5.0
million bearing interest at
2.75%
per annum, and Banco de Credito,
$2.5
million bearing interest at
2.5%
per annum. There were no balances outstanding on either line at December 31, 2012.
Kensington Term Facility
On August 16, 2012, Coeur Alaska prepaid all obligations and indebtedness outstanding under the Coeur Alaska, Inc. Term Facility Agreement, as amended and restated on December 20, 2010, with Credit Suisse AG (the "Kensington Term Facility"), which totaled approximately
$68.6 million
and resulted in a
$1.0 million
loss on the debt extinguishment in 2012. Upon payment in full, the Kensington Term Facility was terminated and all of the liens granted under the Kensington Term Facility were released.
As a condition to the Kensington Term Facility with Credit Suisse, the Company agreed to enter into a gold hedging program which protects a minimum of
243,750
ounces of gold production over the life of the term facility against the risk associated with fluctuations in the market price of gold. This program consists of a series of zero cost collars which consist of a floor price and a ceiling price of gold. Coeur Alaska has transferred these hedge positions to Wells Fargo Bank, N.A., as hedge provider. Call options protecting
97,000
ounces of gold were outstanding at
December 31, 2012
. The weighted average strike price of the call options was
$1,967.89
. Put options protecting
122,000
ounces of gold were outstanding at
December 31, 2012
. The weighted average strike price of the put options was
$967.86
. Call options protecting
136,000
ounces of gold were outstanding at
December 31, 2011
. The weighted average strike price of the call options was
$1,919.83
. Put options protecting
190,000
ounces of gold were outstanding at
December 31, 2011
. The weighted average strike price of the put options was
$951.93
.
Capital Lease Obligations
As of
December 31, 2012
and
December 31, 2011
, the Company had outstanding balances on capital leases of
$11.4
million and
$27.0
million, respectively.
Palmarejo Gold Production Royalty Obligation
On January 21, 2009, Coeur Mexicana entered into a gold production royalty transaction with Franco-Nevada Corporation under which Franco-Nevada purchased a royalty covering
50%
of the life of mine gold to be produced from its Palmarejo silver and gold mine in Mexico. Coeur Mexicana received
$75.0 million
in cash plus a warrant to acquire Franco-Nevada Common Shares (the “Franco-Nevada warrant”), which was valued at
$3.0 million
at closing of the Franco-Nevada transaction. In September, 2010, the warrant was exercised and the related shares were sold for
$10.0 million
.
The royalty agreement provides for a minimum obligation to be paid monthly on a total of
400,000
ounces of gold, or
4,167
ounces per month over an initial
eight
year period. Each monthly payment is an amount equal to the greater of
4,167
ounces of gold or
50%
of actual gold production multiplied by the excess of the monthly average market price of gold above
$400
per ounce (which
$400
floor is subject to a
1%
annual inflation compounding adjustment beginning on January 21, 2013). As of
December 31, 2012
, payments had been made on a total of
202,648
ounces of gold with further payments to be made on an additional
197,352
ounces of gold. After payments have been made on a total of
400,000
ounces of gold, the royalty obligation is payable in the amount of
50%
of actual gold production per month multiplied by the excess of the monthly average market price of gold above
$400
per ounce, adjusted as described above. Payments under the royalty agreement are to be made in cash or gold bullion. During the years ended
December 31, 2012
and
2011
, the Company paid
$74.7
million and
73.2
million, respectively, in royalty payments
F-23
Coeur d'Alene Mines Corporation and Subsidiaries
Notes to Consolidated Financial Statements (Unaudited) - (Continued)
to Franco-Nevada Corporation. Payments made during the minimum obligation period will result in a reduction to the remaining minimum obligation. Payments made beyond the minimum obligation period will be recognized as other cash operating expenses and result in an increase to Coeur Mexicana’s reported cash cost per ounce.
The Company used an implicit interest rate of
30.0%
to discount the original obligation, based on the fair value of the consideration received projected over the expected future cash flows at inception of the obligation. The discounted obligation is accreted to its expected future value over the expected minimum payment period based on the implicit interest rate. The Company recognized accretion expense on the Palmarejo gold production royalty obligation for the years ended
December 31, 2012
, 2011, and 2010 of
$19.1 million
,
$22.2 million
, and
$20.5
million, respectively. As of
December 31, 2012
and
December 31, 2011
, the remaining minimum obligation under the royalty agreement was
$61.9
million and
$72.1 million
, respectively.
The price volatility associated with the minimum royalty obligation is considered an embedded derivative under U.S. GAAP. Fluctuations in the market price of gold since inception of the agreement have resulted in the recognition of additional fair value adjustments and resulted in higher payments to date. Please see Note 19 — Derivative Financial Instruments, Palmarejo Gold Production Royalty, for further discussion of the embedded derivative feature of the royalty agreement.
Interest Expense
The Company expenses interest incurred on its various debt instruments as a cost of operating its properties. For the years ended
December 31, 2012
, 2011, and 2010 the Company expensed interest of
$26.2
million,
$34.8 million
, and
$30.9 million
, respectively.
|
|
Years Ended December 31,
|
||||||||||
|
|
2012
|
2011
|
2010
|
||||||||
|
(in thousands)
|
|||||||||||
|
3.25% Convertible Senior Notes due March 2028
|
$
|
1,581
|
|
$
|
1,581
|
|
$
|
2,394
|
|
||
|
1.25% Convertible Senior Notes due January 2024 (terminated in 2011)
|
—
|
|
1
|
|
28
|
|
|||||
|
Senior Term Notes (terminated in 2011)
|
—
|
|
1,381
|
|
5,074
|
|
|||||
|
Kensington Term Facility (terminated in 2012)
|
2,339
|
|
4,383
|
|
2,017
|
|
|||||
|
Gold Lease Facility (terminated in 2011)
|
—
|
|
—
|
|
677
|
|
|||||
|
Capital lease obligations
|
997
|
|
1,620
|
|
2,122
|
|
|||||
|
Other debt obligations
|
1,094
|
|
1,379
|
|
1,423
|
|
|||||
|
Accretion of Franco Nevada royalty obligation
|
19,139
|
|
22,230
|
|
20,502
|
|
|||||
|
Amortization of debt issuance costs
|
1,146
|
|
2,050
|
|
4,047
|
|
|||||
|
Accretion of debt discount
|
2,536
|
|
2,324
|
|
2,543
|
|
|||||
|
Capitalized interest
|
(2,663
|
)
|
(2,175
|
)
|
(9,885
|
)
|
|||||
|
Total interest expense, net of capitalized interest
|
$
|
26,169
|
|
$
|
34,774
|
|
$
|
30,942
|
|
||
Capitalized Interest
The Company capitalizes interest incurred on its various debt instruments as a cost of properties under development. For the years ended
December 31, 2012
, 2011, and 2010 the Company capitalized interest of
$2.7
million,
$2.2
million, and
$9.9 million
, respectively.
F-24
Coeur d'Alene Mines Corporation and Subsidiaries
Notes to Consolidated Financial Statements (Unaudited) - (Continued)
Minimum Debt Repayments
The following is the Company’s scheduled minimum debt repayments at
December 31, 2012
:
|
December 31,
|
Minimum
Debt Repayments(1)
|
|||
|
2013
|
$
|
117,856
|
|
|
|
2014
|
64,278
|
|
||
|
2015
|
64,888
|
|
||
|
2016
|
56,602
|
|
||
|
2017
|
—
|
|
||
|
Thereafter
|
—
|
|
||
|
Minimum Debt Repayments
|
303,624
|
|
||
|
Debt discount
|
(48,560
|
)
|
||
|
Present value of net scheduled capital lease payments (See Note 14)
|
11,362
|
|
||
|
|
$
|
266,426
|
|
|
|
(1)
|
Includes minimum gold production royalty obligation payments due to Franco-Nevada Corporation for royalty covering
50%
of the life of mine gold to be produced from the Palmarejo silver and gold mine in Mexico.
|
Reclamation and mine closure costs are based principally on legal and regulatory requirements. Management estimates costs associated with reclamation of mining properties as well as remediation costs for inactive properties. The Company uses assumptions about future costs, mineral prices, mineral processing recovery rates, production levels, capital costs and reclamation costs. Such assumptions are based on the Company’s current mining plan and the best available information for making such estimates. The sum of the expected costs by year is discounted, using the Company's credit adjusted risk free interest rate. On an ongoing basis, management evaluates its estimates and assumptions; however, actual amounts could differ from those based on such estimates and assumptions.
The asset retirement obligation is measured using the following factors: 1) Expected labor costs, 2) Allocated overhead and equipment charges, 3) Contractor markup, 4) Inflation adjustment, and 5) Market risk premium. The sum of the expected costs by year is discounted, using the Company’s credit adjusted risk-free interest rate from the time it expects to pay the retirement obligation to the time it incurs the obligation.
Upon initial recognition of a liability for an asset retirement obligation, the Company capitalizes the asset retirement cost as an increase in the carrying amount of the related long-lived asset. The Company depletes this amount using the units-of-production method. The Company is not required to re-measure the obligation at fair value each period, but the Company is required to evaluate the cash flow estimates at the end of each reporting period to determine whether the estimates continue to be appropriate. Upward revisions in the amount of undiscounted cash flows are discounted using a current credit-adjusted risk-free rate. Downward revisions are discounted using the credit-adjusted risk-free rate that existed when the original liability was recorded, or, if not readily determinable, at the weighted average discount rate used to record the liability.
Changes to the Company’s asset retirement obligations are as follows (in thousands):
|
|
Years ended December 31,
|
||||||
|
|
2012
|
2011
|
|||||
|
Asset retirement obligation - Beginning
|
$
|
32,714
|
|
$
|
27,302
|
|
|
|
Accretion
|
2,911
|
|
2,648
|
|
|||
|
Addition and changes in estimates
|
(1,073
|
)
|
2,822
|
|
|||
|
Settlements
|
(95
|
)
|
(58
|
)
|
|||
|
Asset retirement obligation - December 31
|
$
|
34,457
|
|
$
|
32,714
|
|
|
In addition, the Company has accrued
$0.9 million
and
$1.8 million
as of
December 31, 2012
and
December 31, 2011
, respectively, for reclamation liabilities related to former mining activities. These amounts are also included in reclamation and mine closure liabilities.
The components of income (loss) from continuing operations before income taxes were as follows:
F-25
Coeur d'Alene Mines Corporation and Subsidiaries
Notes to Consolidated Financial Statements (Unaudited) - (Continued)
|
|
Years Ended December 31,
|
||||||||||
|
|
2012
|
2011
|
2010
|
||||||||
|
United States
|
$
|
(5,638
|
)
|
$
|
(38,781
|
)
|
$
|
(37,710
|
)
|
||
|
Foreign
|
122,927
|
|
246,617
|
|
(54,955
|
)
|
|||||
|
Total
|
$
|
117,289
|
|
$
|
207,836
|
|
$
|
(92,665
|
)
|
||
For the years ended
December 31, 2012
, 2011, and 2010 the Company reported an income tax (provision) benefit of
$(68.6)
million,
$(114.3)
million, and an income tax benefit of
$9.5
million, respectively.
The following table summarizes the components of the Company’s income tax provision from continuing operations for the three years ended December 31, 2012, 2011, and 2010 (in thousands):
F-26
Coeur d'Alene Mines Corporation and Subsidiaries
Notes to Consolidated Financial Statements (Unaudited) - (Continued)
The components of the consolidated income tax benefit (expense) from continuing operations were as follows:
|
|
Years Ended December 31,
|
||||||||||
|
|
2012
|
2011
|
2010
|
||||||||
|
Current:
|
|
|
|
|
|
|
|||||
|
United States — Alternative minimum tax
|
$
|
(257
|
)
|
$
|
2,015
|
|
$
|
(482
|
)
|
||
|
United States — Foreign withholding tax
|
(736
|
)
|
(842
|
)
|
(1,009
|
)
|
|||||
|
Argentina
|
976
|
|
(1,219
|
)
|
(7,094
|
)
|
|||||
|
Australia
|
(1,760
|
)
|
(1,755
|
)
|
(251
|
)
|
|||||
|
Mexico
|
(7,814
|
)
|
(1,084
|
)
|
(316
|
)
|
|||||
|
Bolivia
|
(43,546
|
)
|
(59,660
|
)
|
(20,268
|
)
|
|||||
|
Deferred:
|
|
|
|
|
|
|
|||||
|
Australia
|
(223
|
)
|
(661
|
)
|
(541
|
)
|
|||||
|
Bolivia
|
(1,087
|
)
|
(207
|
)
|
(1,388
|
)
|
|||||
|
Mexico
|
(10,579
|
)
|
(28,022
|
)
|
24,371
|
|
|||||
|
United States
|
(3,586
|
)
|
(22,902
|
)
|
16,459
|
|
|||||
|
Income tax benefit (expense)
|
$
|
(68,612
|
)
|
$
|
(114,337
|
)
|
$
|
9,481
|
|
||
A reconciliation of the Company’s effective tax rate with the federal statutory tax rate for the periods indicated is as follows:
|
|
Years Ended December 31
|
||||||||||
|
|
2012
|
2011
|
2010
|
||||||||
|
Tax benefit (expense) from continuing operations
|
$
|
(41,051
|
)
|
$
|
(72,743
|
)
|
$
|
32,433
|
|
||
|
State tax provision from continuing operations
|
(956
|
)
|
(10,600
|
)
|
4,726
|
|
|||||
|
Percentage depletion and related deductions
|
7,461
|
|
—
|
|
3,093
|
|
|||||
|
Change in valuation allowance
|
(12,651
|
)
|
(6,032
|
)
|
2,734
|
|
|||||
|
Non-deductible imputed interest
|
(525
|
)
|
(808
|
)
|
(1,718
|
)
|
|||||
|
Uncertain tax positions
|
(9,849
|
)
|
(1,279
|
)
|
(299
|
)
|
|||||
|
U.S. and foreign non-deductible expenses
|
(4,206
|
)
|
(10,648
|
)
|
(9,052
|
)
|
|||||
|
Foreign exchange rates
|
(10,416
|
)
|
(4,440
|
)
|
(7,066
|
)
|
|||||
|
Foreign inflation and indexing
|
712
|
|
(3,829
|
)
|
(3,352
|
)
|
|||||
|
Foreign tax rate differences
|
3,967
|
|
22,795
|
|
(9,861
|
)
|
|||||
|
Foreign withholding and other foreign taxes
|
(5,861
|
)
|
(23,246
|
)
|
(2,986
|
)
|
|||||
|
Foreign tax credits and other, net
|
4,763
|
|
(3,507
|
)
|
829
|
|
|||||
|
|
$
|
(68,612
|
)
|
$
|
(114,337
|
)
|
$
|
9,481
|
|
||
F-27
Coeur d'Alene Mines Corporation and Subsidiaries
Notes to Consolidated Financial Statements (Unaudited) - (Continued)
As of
December 31, 2012
and
2011
, the significant components of the Company’s deferred tax assets and liabilities were as follows:
|
|
Years Ended December 31
|
||||||
|
|
2012
|
2011
|
|||||
|
Deferred tax liabilities:
|
|
|
|
|
|||
|
Mineral properties
|
$
|
461,742
|
|
$
|
453,818
|
|
|
|
Foreign subsidiaries — unremitted earnings
|
247,000
|
|
235,116
|
|
|||
|
Property, plant and equipment, net
|
60,266
|
|
68,013
|
|
|||
|
|
$
|
769,008
|
|
$
|
756,947
|
|
|
|
Deferred tax assets:
|
|
|
|
|
|||
|
Net operating loss carryforwards
|
99,323
|
|
128,073
|
|
|||
|
Foreign subsidiaries — future tax credits
|
145,395
|
|
133,160
|
|
|||
|
Royalty and other long-term debt
|
42,221
|
|
48,254
|
|
|||
|
Capital loss carryforwards
|
35,315
|
|
35,562
|
|
|||
|
Asset retirement obligation
|
8,623
|
|
9,638
|
|
|||
|
Unrealized foreign currency loss and other
|
1,590
|
|
3,974
|
|
|||
|
Accrued expenses
|
20,692
|
|
23,247
|
|
|||
|
Tax credit carryforwards
|
22,811
|
|
11,987
|
|
|||
|
Inventory
|
1,418
|
|
6,069
|
|
|||
|
|
377,388
|
|
399,964
|
|
|||
|
Valuation allowance
|
(182,576
|
)
|
(168,511
|
)
|
|||
|
|
194,812
|
|
231,453
|
|
|||
|
Net deferred tax liabilities
|
$
|
(574,196
|
)
|
$
|
(525,494
|
)
|
|
The Company has evaluated the amount of taxable income and periods over which it must be earned to allow for realization of the deferred tax assets. Management considers the scheduled reversal of deferred tax liabilities, projected future taxable income, and tax planning strategies in making this decision. Based upon this analysis, the Company has recorded valuation allowances as follows:
|
|
Years Ended December 31
|
||||||
|
|
2012
|
2011
|
|||||
|
U.S.
|
$
|
132,790
|
|
$
|
123,539
|
|
|
|
Argentina
|
18,442
|
|
10,739
|
|
|||
|
Canada
|
2,227
|
|
5,390
|
|
|||
|
New Zealand
|
27,125
|
|
27,026
|
|
|||
|
Other
|
1,992
|
|
1,817
|
|
|||
|
|
$
|
182,576
|
|
$
|
168,511
|
|
|
The Company continues to monitor the valuation allowance quarterly, and will make the appropriate adjustments as necessary should circumstances change.
U.S. GAAP provides the criteria that an individual tax position must satisfy for some or all of the benefits of that position to be recognized in a Company’s financial statements. U.S. GAAP prescribes a recognition threshold of more likely than not for all tax positions taken or expected to be taken on a return.
F-28
Coeur d'Alene Mines Corporation and Subsidiaries
Notes to Consolidated Financial Statements (Unaudited) - (Continued)
A reconciliation of the beginning and ending amount related to unrecognized tax benefits is as follows (in thousands):
|
Unrecognized tax benefits at January 1, 2011
|
$
|
1,076
|
|
|
Gross increase to current period tax positions
|
904
|
|
|
|
Gross decrease to prior period tax positions
|
—
|
|
|
|
Unrecognized tax benefits at December 31, 2011
|
$
|
1,980
|
|
|
Gross increase to current period tax positions
|
9,227
|
|
|
|
Gross decrease to prior period tax positions
|
(696
|
)
|
|
|
Unrecognized tax benefits at December 31, 2012
|
$
|
10,511
|
|
During 2012, an audit of San Bartolome's 2009 Bolivian income tax return resulted in the recognition of an additional
$1.4
million of income tax expense, including interest and penalties. Multiple tax positions were challenged during the audit and the Company has assessed these positions as they relate to the remaining open tax periods of Bolivia. As such, the Company has recognized an additional
$11.8
million of tax expense, including interest and penalties, related to these unrecognized tax benefits.
The Company has decided to classify interest and penalties associated with these uncertain tax positions as a component of income tax expense and has recognized additional interest and penalties of
$2.5
million,
$0.4
million, and
$0.04
million during
2012
,
2011
, and
2010
, respectively.
The Company files income tax returns in various U.S. federal and state jurisdictions, in all identified foreign jurisdictions and various others. To the extent there are loss carryovers in any such jurisdictions, the statute of limitations generally remains open.
The Company has previously determined the earnings from certain foreign subsidiaries were not indefinitely reinvested. Accordingly, the Company has recognized deferred taxes and withholding taxes related to those jurisdictions. In
2012
, the Company retained its position established in 2008 when it was determined that it was reasonable, appropriate and prudent that a portion of the anticipated future cash flows from Mexico would be indefinitely reinvested to fund ongoing capital improvements and additional exploration activities within and around the Palmarejo operating site. Accordingly, U.S. and non-U.S. income and withholding taxes for which deferred taxes might otherwise be required, have not been provided on a cumulative amount of temporary differences (including, for this purpose, any difference between the tax basis in the stock of a consolidated subsidiary and the amount of the subsidiary’s net equity determined for financial reporting purposes) related to investments in foreign subsidiaries of approximately
$170.0
million for the years ended
December 31, 2012
and
2011
. The additional U.S. and non-U.S. income and withholding tax that would arise on the reversal of the temporary differences could be offset in part by tax credits. Because the determination of the amount of available tax credits and the limitations imposed on the annual utilization of such credits are subject to a highly complex series of calculations and expense allocations, it is impractical to estimate the amount of net income and withholding tax that might be payable if a reversal of temporary differences occurred.
During 2007, the Company incurred an ownership change which generally limits the availability of existing tax attributes, including net operating loss carryforwards to reduce future taxable income. The Company has the following tax attribute carryforwards as of
December 31, 2012
, by jurisdiction:
|
U.S.
|
Argentina
|
Canada
|
Mexico
|
New Zealand
|
Other
|
Total
|
|||||||||||||||
|
Regular net operating losses
|
133,640
|
|
18,598
|
|
4,243
|
|
31,305
|
|
96,875
|
|
—
|
|
6,640
|
|
291,301
|
|
|||||
|
Alternative minimum tax net operating losses
|
7,409
|
|
—
|
|
—
|
|
—
|
|
—
|
|
—
|
|
7,409
|
|
|||||||
|
Capital losses
|
89,632
|
|
—
|
|
3,755
|
|
—
|
|
—
|
|
—
|
|
93,387
|
|
|||||||
|
Alternative minimum tax credits
|
3,131
|
|
—
|
|
—
|
|
—
|
|
—
|
|
—
|
|
3,131
|
|
|||||||
|
Foreign tax credits
|
19,680
|
|
—
|
|
—
|
|
—
|
|
—
|
|
—
|
|
19,680
|
|
|||||||
The U.S. net operating losses expire from 2017 through 2031 and the Canada net operating losses expire from 2028 through 2030. The Mexico net operating losses expire from 2018 to 2019, while the remaining net operating losses from the foreign jurisdictions have an indefinite carryforward period. The U.S. capital losses expire in 2015 while the Canada capital losses generally have an indefinite carryforward period. Alternative minimum tax credits do not expire and foreign tax credits expire if unused by 2019.
The Company has an annual incentive plan and a long-term incentive plan. The Company’s shareholders approved the Amended and Restated 2003 Long-Term Incentive Plan of Coeur d’Alene Mines Corporation at the 2010 annual shareholders
F-29
Coeur d'Alene Mines Corporation and Subsidiaries
Notes to Consolidated Financial Statements (Unaudited) - (Continued)
meeting.The compensation expense recognized in the Company’s consolidated financial statements for the years ended
December 31, 2012
,
2011
, and
2010
under these plans was
$12.1 million
,
$11.9 million
, and
$10.6 million
, respectively.
Stock options and Stock Appreciation Rights (SARs) granted under the Company’s incentive plans vest over three years and are exercisable over a period not to exceed ten years from the grant date. The exercise price of the stock options and SARs is equal to the greater of the par value of the shares or the fair market value of the shares on the date of the grant. The value of each stock option award and SAR is estimated on the date of grant using the Black-Scholes option pricing model. Stock options are accounted for as equity-based awards and SARs are accounted for as liability-based awards. The value of the SARs is remeasured at each reporting date. SARs, when vested, provide the participant the right to receive cash equal to the excess of the market price of the shares over the exercise price when exercised. Cash used to settle stock options and SARs for the years ended
December 31, 2012
,
2011
and 2010 was
$0.4
million,
$1.9
million and
$0.1
million, respectively.
Restricted stock and restricted stock units granted under the Company’s incentive plans are accounted for based on the market value of the underlying shares on the date of grant and vest in equal installments annually over three years. Restricted stock awards are accounted for as equity-based awards and restricted stock unit awards are accounted for as liability-based awards. Restricted stock units are remeasured at each reporting date. Restricted stock units are settled in cash based on the number of vested restricted stock units multiplied by the current market price of the common shares when vested. Holders of the restricted stock are entitled to vote the shares and to receive any dividends declared on the shares. Cash used to settle restricted stock units for the years ended
December 31, 2012
,
2011
, and 2010 was
$0.9
million,
$2.2
million, and
$0.3
million, respectively.
Performance shares and performance units granted under the Company’s incentive plans are accounted for at fair value. Performance share awards are accounted for as equity-based awards and performance units are accounted for as liability-based awards. Performance shares and performance units are valued using a Monte Carlo simulation valuation model on the date of grant. The value of the performance units is remeasured each reporting date. Vesting is contingent on meeting certain market conditions based on relative total shareholder return. The performance shares and units vest at the end of the three-year service period if the market conditions are met and the employee remains an employee of the Company. The existence of a market condition requires recognition of compensation cost for the performance share awards over the requisite period regardless of whether the market condition is ever satisfied. Performance units are cash-based awards and are settled in cash based on the current market price of the common shares when vested. Cash used to settle performance units for the years ended
December 31, 2012
,
2011
, and 2010 was
$2.1
million,
$1.4
million, and
nil
respectively.
The compensation expense recognized in the Company’s consolidated financial statements for the year ended
December 31, 2012
,
2011
and
2010
for stock based compensation awards was
$7.5
million,
$8.1
million and
$7.2
million, respectively. The SAR’s, restricted stock units and performance units are liability-based awards and are required to be remeasured at the end of each reporting period with corresponding adjustments to previously recognized and future stock-based compensation expense. As of
December 31, 2012
, there was
$4.9 million
of total unrecognized compensation cost (net of estimated forfeitures) related to unvested stock options, SARs, restricted stock, restricted stock units, performance shares and performance units which is expected to be recognized over a weighted-average remaining vesting period of
1.6 years
.
The following table sets forth the weighted average fair value of stock options on the date of grant and the weighted average fair value of the SARs at
December 31, 2012
. The assumptions used to estimate the fair value of the stock options and SARs using the Black-Scholes option valuation model are as follows:
|
|
Date of Grant
|
As of December 31, 2012
|
||||||||
|
Stock
Options
2012
|
Stock Options
2011
|
SARs
2010
|
||||||||
|
Weighted average fair value of stock options granted and SARs outstanding
|
$
|
15.77
|
|
$
|
17.85
|
|
$
|
13.73
|
|
|
|
Expected volatility
|
70.56
|
%
|
72.56
|
%
|
51.57
|
%
|
||||
|
Expected life
|
5.5 years
|
|
6 years
|
|
2.7 years
|
|
||||
|
Risk-free interest rate
|
0.89
|
%
|
2.30
|
%
|
0.34
|
%
|
||||
|
Expected dividend yield
|
—
|
|
—
|
|
—
|
|
||||
The expected volatility is determined using historical volatilities based on historical stock prices. The Company estimated the expected life of the options and SARs granted using the midpoint between the vesting date and the original contractual term. The risk free rate was determined using the yield available on U.S. Treasury zero-coupon issues with a remaining term equal to the expected life of the option or SAR. The Company has not paid dividends on its common stock since 1996.
F-30
Coeur d'Alene Mines Corporation and Subsidiaries
Notes to Consolidated Financial Statements (Unaudited) - (Continued)
The following table summarizes stock option and SARs activity for the years ended
December 31, 2012
,
2011
and
2010
:
|
|
Stock Options
|
SARs
|
|||||||||||
|
Shares
|
Weighted
Average
Exercise
|
Shares
|
Weighted
Average
Exercise
|
||||||||||
|
Stock options outstanding at December 31, 2009
|
392,678
|
|
$
|
23.48
|
|
112,471
|
|
$
|
10.00
|
|
|||
|
Granted
|
4,089
|
|
15.30
|
|
151,287
|
|
15.40
|
|
|||||
|
Exercised
|
(29,104
|
)
|
9.81
|
|
(16,639
|
)
|
10.00
|
|
|||||
|
Canceled/Forfeited
|
(36,823
|
)
|
23.31
|
|
(16,556
|
)
|
11.17
|
|
|||||
|
Stock options outstanding at December 31, 2010
|
330,840
|
|
24.60
|
|
230,563
|
|
13.46
|
|
|||||
|
Granted
|
139,916
|
|
27.39
|
|
—
|
|
—
|
|
|||||
|
Exercised
|
(129,785
|
)
|
11.41
|
|
(119,801
|
)
|
13.10
|
|
|||||
|
Canceled/forfeited
|
(19,364
|
)
|
40.16
|
|
(3,123
|
)
|
14.46
|
|
|||||
|
Stock options outstanding at December 31, 2011
|
321,607
|
|
30.20
|
|
107,639
|
|
13.83
|
|
|||||
|
Granted
|
151,102
|
|
26.97
|
|
—
|
|
—
|
|
|||||
|
Exercised
|
(40,173
|
)
|
11.84
|
|
(34,385
|
)
|
12.73
|
|
|||||
|
Canceled/forfeited/expired
|
(62,536
|
)
|
29.22
|
|
(4,389
|
)
|
15.40
|
|
|||||
|
Stock options outstanding at December 31, 2012
|
370,000
|
|
$
|
31.04
|
|
68,865
|
|
$
|
14.27
|
|
|||
Options to purchase
218,369
shares were exercisable at
December 31, 2012
at a weighted average exercise price of
$34.00
.
|
|
Options Outstanding
|
Options Exercisable
|
||||||||||||||||
|
Range of
Exercise Price
|
Number
Outstanding
|
Weighted Average
Exercise
Price
|
Weighted
Average
Remaining
Contractual
Life (Years)
|
Number
Exercisable
|
Weighted
Average
Exercise
Price
|
Weighted
Average
Remaining
Contractual Life
(Years)
|
||||||||||||
|
$ 0.00-$10.00
|
27,853
|
|
$
|
10.00
|
|
6.09
|
27,853
|
|
$
|
10.00
|
|
6.09
|
||||||
|
$10.00-$20.00
|
15,892
|
|
$
|
18.06
|
|
8.89
|
2,726
|
|
$
|
15.30
|
|
7.59
|
||||||
|
$20.00-$30.00
|
227,154
|
|
$
|
27.28
|
|
6.60
|
90,397
|
|
$
|
27.00
|
|
3.31
|
||||||
|
$30.00-$40.00
|
49,673
|
|
$
|
39.12
|
|
2.39
|
47,965
|
|
$
|
39.28
|
|
2.18
|
||||||
|
$40.00-$50.00
|
20,464
|
|
$
|
48.50
|
|
2.91
|
20,464
|
|
$
|
48.50
|
|
2.91
|
||||||
|
$50.00-$60.00
|
12,937
|
|
$
|
51.40
|
|
2.23
|
12,937
|
|
$
|
51.40
|
|
2.23
|
||||||
|
$60.00-$70.00
|
3,219
|
|
$
|
66.60
|
|
1.02
|
3,219
|
|
$
|
66.60
|
|
1.02
|
||||||
|
$70.00-$80.00
|
12,808
|
|
$
|
70.90
|
|
1.14
|
12,808
|
|
$
|
70.90
|
|
1.14
|
||||||
As of
December 31, 2012
, there was
$0.8
million of unrecognized compensation cost related to non-vested stock options and SARs to be recognized over a weighted average period of
1.4
years.
F-31
Coeur d'Alene Mines Corporation and Subsidiaries
Notes to Consolidated Financial Statements (Unaudited) - (Continued)
The following table summarizes restricted stock and restricted stock units activity for the years ended
December 31, 2012
,
2011
and
2010
:
|
|
Restricted Stock
|
Restricted Stock Units
|
|||||||||||
|
Number of
Shares
|
Weighted
Average
Grant Date
Fair Value
|
Number of
Units
|
Weighted Average
Fair Value
|
||||||||||
|
Outstanding at December 31, 2009
|
134,389
|
|
$
|
15.95
|
|
67,485
|
|
$
|
18.06
|
|
|||
|
Granted
|
2,363
|
|
15.30
|
|
91,378
|
|
15.40
|
|
|||||
|
Vested
|
(57,926
|
)
|
21.90
|
|
(22,500
|
)
|
15.24
|
|
|||||
|
Cancelled/Forfeited
|
(14,203
|
)
|
12.43
|
|
(9,947
|
)
|
15.76
|
|
|||||
|
Outstanding at December 31, 2010
|
64,623
|
|
11.37
|
|
126,416
|
|
27.32
|
|
|||||
|
Granted
|
205,463
|
|
27.37
|
|
—
|
|
—
|
|
|||||
|
Vested
|
(85,323
|
)
|
19.36
|
|
(79,014
|
)
|
27.87
|
|
|||||
|
Cancelled/Forfeited
|
(11,254
|
)
|
26.89
|
|
(1,884
|
)
|
25.03
|
|
|||||
|
Outstanding at December 31, 2011
|
173,509
|
|
25.38
|
|
45,518
|
|
24.14
|
|
|||||
|
Granted
|
230,096
|
|
26.40
|
|
—
|
|
—
|
|
|||||
|
Vested
|
(95,336
|
)
|
23.15
|
|
(31,456
|
)
|
25.92
|
|
|||||
|
Cancelled/Forfeited
|
(68,571
|
)
|
27.43
|
|
(2,651
|
)
|
24.60
|
|
|||||
|
Outstanding at December 31, 2012
|
239,698
|
|
$
|
26.65
|
|
11,411
|
|
$
|
24.60
|
|
|||
As of
December 31, 2012
, there was
$2.1
million of total unrecognized compensation cost related to restricted stock and restricted stock unit awards to be recognized over a weighted-average period of
1.4
years.
The following table summarizes performance shares and performance units’ activity for the years-ended
December 31, 2012
,
2011
, and
2010
:
|
|
Performance Shares
|
Performance Units
|
|||||||||||
|
Number of
Shares
|
Weighted
Average
Grant Date
Fair Value
|
Number of
Units
|
Weighted Average
Fair Value
|
||||||||||
|
Outstanding at December 31, 2009
|
136,298
|
|
$
|
16.59
|
|
67,485
|
|
$
|
27.53
|
|
|||
|
Granted
|
2,363
|
|
18.65
|
|
91,378
|
|
19.94
|
|
|||||
|
Vested
|
—
|
|
—
|
|
—
|
|
—
|
|
|||||
|
Cancelled/Forfeited
|
(37,833
|
)
|
17.53
|
|
(13,840
|
)
|
20.12
|
|
|||||
|
Outstanding at December 31, 2010
|
100,828
|
|
16.29
|
|
145,023
|
|
35.41
|
|
|||||
|
Granted
|
81,489
|
|
42.72
|
|
—
|
|
—
|
|
|||||
|
Vested
|
(56,830
|
)
|
23.24
|
|
(57,948
|
)
|
24.68
|
|
|||||
|
Cancelled/Forfeited
|
(19,558
|
)
|
48.62
|
|
(2,536
|
)
|
25.03
|
|
|||||
|
Outstanding at December 31, 2011
|
105,929
|
|
26.92
|
|
84,539
|
|
39.78
|
|
|||||
|
Granted
|
145,508
|
|
25.78
|
|
32,498
|
|
—
|
|
|||||
|
Vested
|
(111,703
|
)
|
7.96
|
|
(74,845
|
)
|
31.17
|
|
|||||
|
Cancelled/Forfeited
|
(30,575
|
)
|
42.11
|
|
(7,953
|
)
|
49.20
|
|
|||||
|
Outstanding at December 31, 2012
|
109,159
|
|
$
|
40.55
|
|
34,239
|
|
$
|
49.20
|
|
|||
As of
December 31, 2012
, there was
$2.0
million of total unrecognized compensation cost related to performance shares and performance units to be recognized over a weighted average period of
1.8
years.
Defined Contribution Plan
The Company provides a noncontributory defined contribution retirement plan for all eligible U.S. employees. Total contributions were
$2.1 million
,
$1.5 million
and
$1.0 million
for the years ended
December 31, 2012
,
2011
, and
2010
respectively.
F-32
Coeur d'Alene Mines Corporation and Subsidiaries
Notes to Consolidated Financial Statements (Unaudited) - (Continued)
401(k) Plan
The Company maintains a retirement savings plan (which qualifies under Section 401(k) of the U.S. Internal Revenue Code) covering all eligible U.S. employees. Under the plan, employees may elect to contribute up to
100%
of their cash compensation, subject to ERISA limitations. The Company adopted a Safe Harbor Tiered Match and is required to make matching contributions equal to
100%
of the employee’s contribution up to
3%
of the employee’s compensation plus matching contributions equal to
50%
of the employee’s contribution up to an additional
2%
of the employee’s compensation. Total plan expenses recognized for the years ended
December 31, 2012
,
2011
, and
2010
were
$2.0 million
,
$1.4 million
, and
$0.9 million
, respectively.
Palmarejo Gold Production Royalty
On January 21, 2009, the Company entered into a gold production royalty transaction with Franco-Nevada Corporation. The royalty covers
50%
of the life of mine production from the Palmarejo mine and adjacent properties. The royalty transaction included a minimum obligation of
4,167
ounces per month that ends when payments have been made on a total of
400,000
ounces of gold. As of
December 31, 2012
, a total of
197,352
ounces of gold remain outstanding under the minimum royalty obligation.
The price volatility associated with the minimum royalty obligation is considered an embedded derivative financial instrument under U.S. GAAP. As such, the Company is required to recognize the change in fair value of the remaining minimum obligation due to the changing gold prices. Unrealized gains are recognized in periods when the gold price has decreased from the previous period and unrealized losses are recognized in periods when the gold price increases. The fair value of the embedded derivative is reflected net of the Company's current credit adjusted risk free rate, which was
4.2%
and
5.7%
at
December 31, 2012
and
December 31, 2011
, respectively. The fair value of the embedded derivative at
December 31, 2012
and
December 31, 2011
, based on forward gold prices averaging approximately
$1,694
and
$1,599
per ounce, respectively, was a liability of
$145.1
million and
$159.4 million
, respectively. During the years ended
December 31, 2012
, 2011, and 2010 the mark-to-market adjustments for this embedded derivative amounted to a gain of
$14.3
million, a gain of
$2.6 million
, and a loss of
$84.0
million, respectively.
Payments on the royalty obligation occur monthly resulting in a decrease to the carrying amount of the minimum obligation and the derivative liability and the recognition of realized gains or losses as a result of changing prices for gold. Each monthly payment is an amount equal to the greater of the minimum of
4,167
ounces of gold or
50%
of the actual gold production per month multiplied by the excess of the monthly average market price of gold above
$400
per ounce (which
$400
floor is subject to a
1%
annual inflation compounding adjustment beginning on January 21, 2013). For the years ended
December 31, 2012
, 2011, and 2010 realized losses on settlement of the liabilities were
$45.4
million,
$42.8
million, and
$18.2
million, respectively. The mark-to-market adjustments and realized losses are included in fair value adjustments, net in the consolidated statement of operations.
Forward Foreign Exchange Contracts
The Company periodically enters into forward foreign currency contracts to reduce the foreign exchange risk associated with forecasted Mexican peso (“MXN”) operating costs at its Palmarejo mine. At
December 31, 2012
, the Company had MXN foreign exchange contracts of
$26.1
million in U.S. dollars. These contracts require the Company to exchange U.S. dollars for MXN at a weighted average exchange rate of
13.11
MXN to each U.S. dollar and the Company had an asset with a fair value of
$0.1
million at
December 31, 2012
. At
December 31, 2011
, the Company had MXP foreign exchange contracts of $
25.5
million in U.S. dollars. These contracts required the Company to exchange U.S. dollars for MXN at a weighted average exchange rate of
12.40
MXN to each U.S. dollar and the Company had a liability with a fair value of
$3.2
million at December 31, 2011. The Company recorded mark-to-market gains on these contracts of
$3.3
million for the years ended
December 31, 2012
. The Company recorded mark-to-market losses of
$3.2 million
and
$1.3 million
for the years ended
December 31, 2011
and 2010, respectively. These mark-to-market adjustments are reflected in fair value adjustments, net. The Company recorded a realized loss of
$1.6
million, and realized gains of
$0.4
million and
$1.6
million in production costs applicable to sales during the years ended
December 31, 2012
, 2011, and 2010, respectively.
Gold Lease Facility
On December 12, 2008, the Company entered into a gold lease facility with Mitsubishi International Corporation (“MIC”). This facility permitted the Company to lease amounts of gold from MIC and obligated the Company to deliver the same amounts back to MIC and to pay specified lease fees to MIC equivalent to interest at market rates on the value of the gold leased. Pursuant to a Second Amended and Restated Collateral Agreement, the Company’s obligations under the facility were secured by certain collateral. The collateral agreement specified the maximum amount of gold the Company was permitted to lease from MIC, as well as the amount and type of collateral. This gold lease facility was terminated in 2011.
The Company recorded realized losses of
$2.3 million
and
$10.1 million
for the years ended December 31, 2011, and 2010, respectively. The mark-to-market adjustments and realized losses are included in fair value adjustments, net.
F-33
Coeur d'Alene Mines Corporation and Subsidiaries
Notes to Consolidated Financial Statements (Unaudited) - (Continued)
Concentrate Sales Contracts
The Company enters into concentrate sales contracts with third-party smelters. The contracts, in general, provide for a provisional payment based upon provisional assays and quoted metal prices. The provisionally priced sales contain an embedded derivative that is required to be separated from the host contract for accounting purposes. The host contract is the receivable from the sale of concentrates at the forward price at the time of sale. The embedded derivative, which is the final settlement price based on a future price, does not qualify for hedge accounting. These embedded derivatives are recorded as derivative assets (in Prepaid expenses and other) or derivative liabilities (in Accrued liabilities and other) on the balance sheet and are adjusted to fair value through earnings each period until the date of final settlement. At
December 31, 2012
, the Company had outstanding provisionally priced sales of
$33.2
million, consisting of
0.4
million ounces of silver and
11,957
ounces of gold, which had a fair value of
$34.1
million including the embedded derivative. At
December 31, 2011
, the Company had outstanding provisionally priced sales of
$22.5 million
consisting of
0.2
million ounces of silver and
9,701
ounces of gold, which had a fair value of approximately
$21.7 million
including the embedded derivative.
Commodity Derivatives
As of
December 31, 2012
, the Company had outstanding call options requiring it to deliver
97,000
ounces of gold at a weighted average strike price of
$1,967.89
per ounce if the market price of gold exceeds the strike price. At
December 31, 2012
, the Company had outstanding put options allowing it to sell
122,000
ounces of gold at a weighted average strike price of
$967.86
per ounce if the market price of gold were to fall below the strike price. The contracts will expire over the next
three
years. At December 31, 2011, the Company had written outstanding call options requiring it to deliver
136,000
ounces of gold at a weighted average strike price of
$1,919.83
per ounce if the market price of gold exceeds the strike price. At December 31, 2011, the Company had outstanding put options allowing it to sell
190,000
ounces of gold at a weighted average strike price of
$951.93
per ounce if the market price of gold were to fall below the strike price. As of
December 31, 2012
and December 31, 2011, the fair market value of these contracts was a net liability of
$9.3
million and $
17.9
million, respectively. During the year ended
December 31, 2012
,
68,000
ounces of gold put options expired at a weighted average strike price of
$923.34
per ounce, resulting in a realized loss of
$2.9
million. During the year ended
December 31, 2012
,
14,000
ounces of gold call options at a weighted average strike price of $
2,000.00
expired. During the year ended December 31, 2012, the Company settled
25,000
ounces of gold call options resulting in a realized loss of
$1.6 million
.
During the year ended
December 31, 2012
, 2011, and 2010, the Company recorded unrealized gains of
$8.6
million, unrealized losses of
$3.1
million, and unrealized losses of
$13.8
million, respectively, related to the outstanding options which was included in fair value adjustments, net.
During the year ended December 31, 2011, the Company settled an outstanding forward gold contract of
10,000
ounces at a fixed price of
$1,380
per ounce, which resulted in a realized gain of
$0.5
million.
During the year ended December 31, 2010, outstanding put options allowing the Company to deliver
5.4
million ounces of silver at an average strike price of
$9.21
per ounce expired. The Company recorded realized losses of
$2.1
million for the year ended December 31, 2010, which are included in Fair value adjustments, net.
In connection with the sale of the Cerro Bayo mine to Mandalay Resources Corporation, the Company received the right to
125,000
ounces of silver to be delivered in
six
equal quarterly installments commencing in the third quarter of 2011. The Company recognized mark-to-market losses of
$0.6 million
for the year ended
December 31, 2012
. The Company recognized mark-to-market gains of
$0.8
million associated with this silver in the year ended
December 31, 2011
. The silver ounces receivable from Mandalay Resources Corporation had a fair value of
$2.3 million
at
December 31, 2011
. This obligation was fully settled at December 31, 2012.
F-34
Coeur d'Alene Mines Corporation and Subsidiaries
Notes to Consolidated Financial Statements (Unaudited) - (Continued)
As of
December 31, 2012
, the Company had the following derivative instruments that settle in each of the years indicated in the table (in thousands except average prices, ounces and notional data):
|
2013
|
2014
|
2015
|
Thereafter
|
||||||||||||
|
Palmarejo gold production royalty
|
$
|
27,205
|
|
$
|
24,895
|
|
$
|
24,691
|
|
$
|
21,140
|
|
|||
|
Average gold price in excess of minimum contractual deduction
|
502
|
|
498
|
|
494
|
|
490
|
|
|||||||
|
Notional ounces
|
54,171
|
|
50,004
|
|
50,004
|
|
43,173
|
|
|||||||
|
Mexican peso forward purchase contracts
|
$
|
26,100
|
|
$
|
—
|
|
$
|
—
|
|
$
|
—
|
|
|||
|
Average rate (MXP/$)
|
$
|
13.11
|
|
$
|
—
|
|
$
|
—
|
|
$
|
—
|
|
|||
|
Mexican peso notional amount
|
342,235
|
|
—
|
|
—
|
|
—
|
|
|||||||
|
Silver concentrate sales agreements
|
$
|
12,736
|
|
$
|
—
|
|
$
|
—
|
|
$
|
—
|
|
|||
|
Average silver price
|
$
|
31.04
|
|
$
|
—
|
|
$
|
—
|
|
$
|
—
|
|
|||
|
Notional ounces
|
410,298
|
|
—
|
|
—
|
|
—
|
|
|||||||
|
Gold concentrates sales agreements
|
$
|
20,498
|
|
$
|
—
|
|
$
|
—
|
|
$
|
—
|
|
|||
|
Average gold price
|
$
|
1,714
|
|
$
|
—
|
|
$
|
—
|
|
$
|
—
|
|
|||
|
Notional ounces
|
11,957
|
|
—
|
|
—
|
|
—
|
|
|||||||
|
Gold put options purchased
|
$
|
1,800
|
|
$
|
720
|
|
$
|
—
|
|
$
|
—
|
|
|||
|
Average gold strike price
|
$
|
928
|
|
$
|
979
|
|
$
|
1,010
|
|
$
|
—
|
|
|||
|
Notional ounces
|
45,000
|
|
47,000
|
|
30,000
|
|
—
|
|
|||||||
|
Gold call options sold
|
$
|
1,800
|
|
$
|
720
|
|
$
|
—
|
|
$
|
—
|
|
|||
|
Average gold strike price
|
$
|
2,000
|
|
$
|
1,933
|
|
$
|
2,000
|
|
$
|
—
|
|
|||
|
Notional ounces
|
20,000
|
|
47,000
|
|
30,000
|
|
—
|
|
|||||||
The following summarizes the classification of the fair value of the derivative instruments as of
December 31, 2012
and
December 31, 2011
(in thousands):
|
|
December 31, 2012
|
||||||||||||||||||
|
|
Prepaid
expenses and
other
|
Accrued
liabilities and
other
|
Other long-
term
liabilities
|
Current
portion of
royalty
obligation
|
Non-current
portion of
royalty
obligation
|
||||||||||||||
|
Forward foreign exchange contracts
|
$
|
376
|
|
$
|
300
|
|
$
|
—
|
|
$
|
—
|
|
$
|
—
|
|
||||
|
Palmarejo gold production royalty
|
—
|
|
—
|
|
—
|
|
41,146
|
|
103,952
|
|
|||||||||
|
Put and call options, net
|
—
|
|
2,025
|
|
7,274
|
|
—
|
|
—
|
|
|||||||||
|
Concentrate sales contracts
|
1,030
|
|
163
|
|
—
|
|
—
|
|
—
|
|
|||||||||
|
$
|
1,406
|
|
$
|
2,488
|
|
$
|
7,274
|
|
$
|
41,146
|
|
$
|
103,952
|
|
|||||
|
|
December 31, 2011
|
||||||||||||||||||
|
|
Prepaid
expenses and
other
|
Accrued
liabilities and
other
|
Other long-
term
Liabilities
|
Current
portion of
royalty
obligation
|
Non-current
portion of
royalty
obligation
|
||||||||||||||
|
Silver ounces receivable from Mandalay
|
$
|
814
|
|
$
|
—
|
|
$
|
—
|
|
$
|
—
|
|
$
|
—
|
|
||||
|
Forward foreign exchange contracts
|
—
|
|
3,188
|
|
—
|
|
—
|
|
—
|
|
|||||||||
|
Palmarejo gold production royalty
|
—
|
|
—
|
|
—
|
|
37,206
|
|
122,194
|
|
|||||||||
|
Put and call options, net
|
—
|
|
3,183
|
|
14,669
|
|
—
|
|
—
|
|
|||||||||
|
Concentrate sales contracts
|
—
|
|
825
|
|
—
|
|
—
|
|
—
|
|
|||||||||
|
$
|
814
|
|
$
|
7,196
|
|
$
|
14,669
|
|
$
|
37,206
|
|
$
|
122,194
|
|
|||||
The following represent mark-to-market gains (losses) on derivative instruments for the years ended
December 31, 2012
and 2011 (in thousands):
F-35
Coeur d'Alene Mines Corporation and Subsidiaries
Notes to Consolidated Financial Statements (Unaudited) - (Continued)
|
|
|
Years ended December 31,
|
|||||||||||
|
Financial statement line
|
Derivative
|
2012
|
2011
|
2010
|
|||||||||
|
Sales of metal
|
Concentrate sales contracts
|
$
|
1,682
|
|
$
|
2,505
|
|
$
|
1,636
|
|
|||
|
Production costs applicable to sales
|
Forward foreign exchange contracts
|
(1,621
|
)
|
383
|
|
1,638
|
|
||||||
|
Fair value adjustments, net
|
Gold lease facility
|
—
|
|
(132
|
)
|
2,885
|
|
||||||
|
Fair value adjustments, net
|
Forward foreign exchange contracts
|
3,264
|
|
(3,192
|
)
|
(1,330
|
)
|
||||||
|
Fair value adjustments, net
|
Forward gold contract
|
—
|
|
34
|
|
425
|
|
||||||
|
Fair value adjustments, net
|
Silver ounces receivable
|
213
|
|
(276
|
)
|
1,594
|
|
||||||
|
Fair value adjustments, net
|
Palmarejo gold royalty
|
(31,053
|
)
|
(40,046
|
)
|
(83,989
|
)
|
||||||
|
Fair value adjustments, net
|
Franco-Nevada warrant
|
—
|
|
—
|
|
3,451
|
|
||||||
|
Fair value adjustments, net
|
Put and call options
|
4,089
|
|
(8,438
|
)
|
(11,795
|
)
|
||||||
|
$
|
(23,426
|
)
|
$
|
(49,162
|
)
|
$
|
(85,485
|
)
|
|||||
Please see Note 6 - Fair Value Measurements for additional detail on the fair value amounts for derivatives.
Credit Risk
The credit risk exposure related to any potential derivative instruments is limited to the unrealized gains, if any, on outstanding contracts based on current market prices. To reduce counter-party credit exposure, the Company deals with financial institutions management deems credit worthy and limits credit exposure to each. The Company does not anticipate non-performance by any of its counterparties. In addition, to allow for situations where positions may need to be revised, the Company deals only in markets that management considers highly liquid.
Labor Union Contracts
The Company maintains
one
labor agreement in South America, consisting of a labor agreement with Sindicato de la Empresa Minera Manquiri at the San Bartolomé mine in Bolivia. The labor agreement at the San Bartolomé mine, which became effective October 11, 2007, does not have a fixed term. As of
December 31, 2012
, approximately
10.0%
of the Company’s worldwide labor force was covered by collective bargaining agreements.
Termination Benefits
The Company established a termination benefit program for its employees at the Rochester mine in 2005. The program provides a financial benefit in the form of severance pay to terminated employees if their employment is terminated due to curtailment of operations. The individual benefit is based on the employee’s service time and rate of pay at the time of termination. The Rochester mine resumed mining and crushing operations in late 2011, and currently employs more than
200
employees. This termination benefit program was extended to include newly hired employees. As of November 2012, the plan was terminated. At the time of termination, the Company recognized a
$1.8
million credit to operations and a
$2.0
million credit to care and maintenance in the Consolidated Statement of Operations.
Changes to the Company's termination benefits are as follows (in thousands):
|
Years ended December 31,
|
|||||||
|
|
2012
|
2011
|
|||||
|
Beginning balance
|
$
|
3,335
|
|
$
|
1,105
|
|
|
|
Accruals
|
473
|
|
2,230
|
|
|||
|
Plan termination
|
(3,808
|
)
|
—
|
|
|||
|
Ending balance
|
$
|
—
|
|
$
|
3,335
|
|
|
The Company does not have a written severance plan for any of its foreign operations including those operations located in Chile, Argentina, Bolivia and Mexico. However, laws in these foreign jurisdictions require payment of certain minimum statutory termination benefits. Accordingly, in situations where minimum statutory termination benefits must be paid to the affected employees, the Company records employee severance costs in accordance with U.S. GAAP. The Company has accrued obligations
F-36
Coeur d'Alene Mines Corporation and Subsidiaries
Notes to Consolidated Financial Statements (Unaudited) - (Continued)
for post-employment benefits in these locations of approximately
$7.6 million
and
$7.4 million
as of
December 31, 2012
and
December 31, 2011
, respectively.
Kensington Production Royalty
On July 7, 1995, Coeur, through its wholly-owned subsidiary, Coeur Alaska, Inc., acquired the
50%
ownership interest of Echo Bay Exploration Inc., or Echo Bay, giving Coeur
100%
ownership of the Kensington property. Coeur Alaska is obligated to pay Echo Bay, a subsidiary of Kinross Gold Corporation, a scaled net smelter return royalty on
1.0 million
ounces of future gold production after Coeur Alaska recoups the
$32.5 million
purchase price and its construction and development expenditures incurred after July 7, 1995 in connection with placing the property into commercial production. The royalty ranges from
1%
at gold prices of
$400
per ounce to a maximum of
2.5%
at gold prices above
$475
per ounce, with the royalty to be capped at
1.0 million
ounces of production. No royalty has been paid to date.
Rochester Production Royalty
The Company acquired the Rochester property from ASARCO, a subsidiary of Grupo Mexico SA de CV, in 1983. The Company is obligated to pay a net smelter royalty interest to ASARCO when the market price of silver equals or exceeds
$23.60
per ounce up to a maximum rate of
5%
. Royalty expense was
$3.5 million
,
$2.2 million
, $
0.2
million for the years ended
December 31, 2012
, 2011, and 2010, respectively.
Palmarejo Gold Production Royalty
On January 21, 2009, Coeur Mexicana entered into a gold production royalty transaction with Franco-Nevada Corporation under which Franco-Nevada purchased a royalty covering
50%
of the life of mine gold to be produced from its Palmarejo silver and gold mine in Mexico. The royalty agreement provides for a minimum obligation to be paid monthly on a total of
400,000
ounces of gold, or
4,167
ounces per month over an initial
eight
year period. Please see Note 14 - Debt, Capital Leases and Royalty Obligation, Palmarejo Gold Production Royalty, for further discussion on the royalty obligation.
The Company markets its doré to credit worthy bullion trading houses, market makers and members of the London Bullion Market Association, industrial companies and sound financial institutions. The refined metals are sold to end users for use in electronic circuitry, jewelry, silverware, pharmaceutical products, and the technology industry. The Company currently has seven trading counterparties (International Commodities, Mitsui, Mitsubishi, Standard Bank, TD Securities, Valcambi, and Auramet) and the sales of metals to these companies amounted to approximately
91%
,
82%
, and
83%
of total metal sales for the years ended
December 31, 2012
, 2011, and 2010, respectively. Generally, the loss of a single bullion trading counterparty would not adversely affect the Company due to the liquidity of the markets and the availability of alternative trading counterparties.
Sales of silver and gold concentrates to third parties (Nyrstar, Aurubis, Sumitomo, Trafigura, Auramet, Sumitomo, and China National Gold) amounted to approximately
9%
,
18%
, and
17%
of total metal sales for the years ended
December 31, 2012
, 2011, and 2010, respectively. The loss of any one smelting and refining client may have a material adverse effect if alternate smelters and refiners are not available. The Company believes there is sufficient global capacity available to address the loss of any one smelter.
The following table indicates customers that represent
10%
or more of total sales of metal for the years
December 31, 2012
, 2011, and 2010 (in millions):
|
Customer
|
Year ended December 31, 2012
|
Year ended December 31, 2011
|
Year ended December 31, 2010
|
Segments reporting revenue
|
||||
|
Valcambi
|
$414.4
|
$385.5
|
$174.1
|
Palmarejo, San Bartolomé
|
||||
|
Auramet
|
94.6
|
50.8
|
79.0
|
Palmarejo
|
||||
|
Penoles
|
0.3
|
13.3
|
53.9
|
Martha
|
||||
|
China Gold
|
43.8
|
108.9
|
23.6
|
Kensington
|
||||
|
International Commodities
|
58.0
|
112.6
|
36.7
|
Palmarejo, San Bartolomé, Rochester
|
||||
|
Mitsui
|
65.6
|
105.1
|
45.9
|
Palmarejo, San Bartolomé, Rochester
|
||||
F-37
Coeur d'Alene Mines Corporation and Subsidiaries
Notes to Consolidated Financial Statements (Unaudited) - (Continued)
Operating segments are defined as components of an enterprise about which separate financial information is available that is evaluated regularly by the chief operating decision maker, or decision-making group, in deciding how to allocate resources and in assessing performance. The Company’s chief operating decision-making group is comprised of the Chief Executive Officer, Chief Financial Officer, and the Chief Operating Officer.
The operating segments are managed separately because each segment represents a distinct use of company resources and a separate contribution to the Company’s cash flows. The Company’s reportable operating segments include the Palmarejo, San Bartolomé, Martha, Rochester, Kensington and Endeavor mining properties. All operating segments are engaged in the discovery and/or mining of gold and silver and generate the majority of their revenues from the sale of these precious metal concentrates and/or refined precious metals. Through September 2012, the Martha mine sold precious metal concentrates, typically under long-term contracts, to trading partners located in the United States and Switzerland. The Company ceased active mining in September of 2012. The Kensington mine sells precious metals and concentrates, typically under long-term contracts to smelters in China and Germany. Refined gold and silver produced by the Rochester, Palmarejo, and San Bartolomé mines are principally sold on a spot basis to precious metals trading banks such as International Commodities, Mitsui, Mitsubishi, Standard Bank, TD Securities, Valcambi and Auramet. Concentrates produced at the Endeavor mine are sold to Nyrstar (formerly Zinifex), an Australian smelter. The Other segment includes the Joaquin project, corporate headquarters, elimination of intersegment transactions and other items necessary to reconcile to consolidated amounts. The accounting policies of the operating segments are the same as those described in the summary of significant accounting policies above. The Company evaluates performance and allocates resources based on profit or loss before interest, income taxes, depreciation and amortization, unusual and infrequent items and extraordinary items.
Revenues from silver sales were
$549.7
million,
$662.6
million and
$356.9
million in 2012, 2011, and 2010, respectively. Revenues from gold sales were
$345.8
million,
$358.6
million and
$158.5
million in 2012, 2011, and 2010, respectively.
Financial information relating to the Company’s segments is as follows (in thousands):
|
Year ended December 31, 2012
|
Palmarejo
Mine
|
San Bartolomé
Mine
|
Kensington
Mine
|
Rochester
Mine
|
Martha
Mine
|
Endeavor
Mine
|
Other
|
Total
|
|||||||||||||||||||||||
|
Sales of metals
|
$
|
442,098
|
|
$
|
178,005
|
|
$
|
110,987
|
|
$
|
132,392
|
|
$
|
13,162
|
|
$
|
18,848
|
|
$
|
—
|
|
$
|
895,492
|
|
|||||||
|
Productions costs applicable to sales
|
(197,478
|
)
|
(71,428
|
)
|
(87,089
|
)
|
(74,256
|
)
|
(17,682
|
)
|
(8,824
|
)
|
—
|
|
(456,757
|
)
|
|||||||||||||||
|
Depreciation and depletion
|
(146,595
|
)
|
(16,709
|
)
|
(41,645
|
)
|
(8,065
|
)
|
(692
|
)
|
(4,591
|
)
|
(560
|
)
|
(218,857
|
)
|
|||||||||||||||
|
Gross profit (loss)
|
98,025
|
|
89,868
|
|
(17,747
|
)
|
50,071
|
|
(5,212
|
)
|
5,433
|
|
(560
|
)
|
219,878
|
|
|||||||||||||||
|
Exploration expense
|
7,575
|
|
159
|
|
3,283
|
|
3,591
|
|
8,648
|
|
—
|
|
3,014
|
|
26,270
|
|
|||||||||||||||
|
Loss on impairment
|
—
|
|
—
|
|
—
|
|
—
|
|
5,825
|
|
—
|
|
—
|
|
5,825
|
|
|||||||||||||||
|
Other operating expenses
|
11
|
|
80
|
|
74
|
|
1,401
|
|
2,108
|
|
—
|
|
30,564
|
|
34,238
|
|
|||||||||||||||
|
OPERATING INCOME (LOSS)
|
90,439
|
|
89,629
|
|
(21,104
|
)
|
45,079
|
|
(21,793
|
)
|
5,433
|
|
(34,138
|
)
|
153,545
|
|
|||||||||||||||
|
Interest and other income, net
|
4,017
|
|
9,719
|
|
(77
|
)
|
358
|
|
(1,153
|
)
|
—
|
|
1,572
|
|
14,436
|
|
|||||||||||||||
|
Interest expense, net
|
(18,938
|
)
|
(72
|
)
|
(2,972
|
)
|
(26
|
)
|
(3
|
)
|
—
|
|
(4,158
|
)
|
(26,169
|
)
|
|||||||||||||||
|
Loss on debt extinguishment
|
—
|
|
—
|
|
(1,036
|
)
|
—
|
|
—
|
|
—
|
|
—
|
|
(1,036
|
)
|
|||||||||||||||
|
Fair value adjustments, net
|
(31,054
|
)
|
—
|
|
4,089
|
|
—
|
|
—
|
|
—
|
|
3,478
|
|
(23,487
|
)
|
|||||||||||||||
|
Income tax expense
|
(18,066
|
)
|
(44,632
|
)
|
—
|
|
—
|
|
976
|
|
409
|
|
(7,299
|
)
|
(68,612
|
)
|
|||||||||||||||
|
Net income (loss)
|
$
|
26,398
|
|
$
|
54,644
|
|
$
|
(21,100
|
)
|
$
|
45,411
|
|
$
|
(21,973
|
)
|
$
|
5,842
|
|
$
|
(40,545
|
)
|
$
|
48,677
|
|
|||||||
|
Segment assets
(A)
|
$
|
1,905,269
|
|
$
|
302,922
|
|
$
|
508,658
|
|
$
|
104,373
|
|
$
|
9,813
|
|
$
|
31,479
|
|
$
|
111,542
|
|
$
|
2,974,056
|
|
|||||||
|
Capital expenditures
(B)
|
$
|
38,456
|
|
$
|
25,672
|
|
$
|
36,994
|
|
$
|
11,794
|
|
$
|
1,193
|
|
$
|
—
|
|
$
|
1,532
|
|
$
|
115,641
|
|
|||||||
F-38
Coeur d'Alene Mines Corporation and Subsidiaries
Notes to Consolidated Financial Statements (Unaudited) - (Continued)
|
Year ended December 31, 2011
|
Palmarejo
Mine
|
San Bartolomé
Mine
|
Kensington
Mine
|
Rochester
Mine
|
Martha
Mine
|
Endeavor
Mine
|
Other
|
Total
|
|||||||||||||||||||||||
|
Sales of metals
|
$
|
513,097
|
|
$
|
267,502
|
|
$
|
151,186
|
|
$
|
57,331
|
|
$
|
13,347
|
|
$
|
18,737
|
|
$
|
—
|
|
$
|
1,021,200
|
|
|||||||
|
Productions costs applicable to sales
|
(186,201
|
)
|
(79,679
|
)
|
(101,672
|
)
|
(28,257
|
)
|
(15,513
|
)
|
(8,634
|
)
|
—
|
|
(419,956
|
)
|
|||||||||||||||
|
Depreciation and depletion
|
(159,264
|
)
|
(22,410
|
)
|
(35,839
|
)
|
(2,824
|
)
|
(556
|
)
|
(3,148
|
)
|
(459
|
)
|
(224,500
|
)
|
|||||||||||||||
|
Gross profit (loss)
|
167,632
|
|
165,413
|
|
13,675
|
|
26,250
|
|
(2,722
|
)
|
6,955
|
|
(459
|
)
|
376,744
|
|
|||||||||||||||
|
Exploration expense
|
6,863
|
|
248
|
|
1,102
|
|
1,989
|
|
6,367
|
|
—
|
|
2,559
|
|
19,128
|
|
|||||||||||||||
|
Other operating expenses
|
949
|
|
342
|
|
317
|
|
19,931
|
|
156
|
|
(1
|
)
|
29,126
|
|
50,820
|
|
|||||||||||||||
|
OPERATING INCOME (LOSS)
|
159,820
|
|
164,823
|
|
12,256
|
|
4,330
|
|
(9,245
|
)
|
6,956
|
|
(32,144
|
)
|
306,796
|
|
|||||||||||||||
|
Interest and other income, net
|
(9,099
|
)
|
156
|
|
4
|
|
57
|
|
(544
|
)
|
—
|
|
2,816
|
|
(6,610
|
)
|
|||||||||||||||
|
Interest expense, net
|
(23,453
|
)
|
(45
|
)
|
(4,889
|
)
|
(21
|
)
|
(458
|
)
|
—
|
|
(5,908
|
)
|
(34,774
|
)
|
|||||||||||||||
|
Loss on debt extinguishment
|
—
|
|
—
|
|
—
|
|
—
|
|
—
|
|
—
|
|
(5,526
|
)
|
(5,526
|
)
|
|||||||||||||||
|
Fair value adjustments, net
|
(40,046
|
)
|
—
|
|
(8,438
|
)
|
—
|
|
—
|
|
—
|
|
(3,566
|
)
|
(52,050
|
)
|
|||||||||||||||
|
Income tax expense
|
(28,023
|
)
|
(59,867
|
)
|
(31
|
)
|
—
|
|
(1,219
|
)
|
—
|
|
(25,197
|
)
|
(114,337
|
)
|
|||||||||||||||
|
Net income (loss)
|
$
|
59,199
|
|
$
|
105,067
|
|
$
|
(1,098
|
)
|
$
|
4,366
|
|
$
|
(11,466
|
)
|
$
|
6,956
|
|
$
|
(69,525
|
)
|
$
|
93,499
|
|
|||||||
|
Segment assets
(A)
|
$
|
2,029,769
|
|
$
|
276,423
|
|
$
|
507,891
|
|
$
|
76,852
|
|
$
|
19,717
|
|
$
|
35,686
|
|
$
|
16,792
|
|
$
|
2,963,130
|
|
|||||||
|
Capital expenditures
(B)
|
$
|
36,976
|
|
$
|
17,731
|
|
$
|
34,013
|
|
$
|
27,217
|
|
$
|
3,426
|
|
$
|
—
|
|
$
|
625
|
|
$
|
119,988
|
|
|||||||
|
(A)
|
Segment assets consist of receivables, prepaids, inventories, property, plant and equipment, and mining properties
|
|
(B)
|
Balance represents cash flow amounts
|
F-39
Coeur d'Alene Mines Corporation and Subsidiaries
Notes to Consolidated Financial Statements (Unaudited) - (Continued)
|
Year ended December 31, 2010
|
Palmarejo
Mine
|
San Bartolomé
Mine
|
Kensington
Mine
|
Rochester
Mine
|
Martha
Mine
|
Endeavor
Mine
|
Other
|
Total
|
|||||||||||||||||||||||
|
Sales of metals
|
$
|
230,024
|
|
$
|
142,989
|
|
$
|
23,628
|
|
$
|
54,323
|
|
$
|
53,875
|
|
$
|
10,618
|
|
$
|
—
|
|
$
|
515,457
|
|
|||||||
|
Productions costs applicable to sales
|
(127,658
|
)
|
(60,023
|
)
|
(14,043
|
)
|
(24,760
|
)
|
(27,040
|
)
|
(4,112
|
)
|
—
|
|
(257,636
|
)
|
|||||||||||||||
|
Depreciation and depletion
|
(91,505
|
)
|
(19,650
|
)
|
(17,487
|
)
|
(1,890
|
)
|
(8,525
|
)
|
(1,989
|
)
|
(573
|
)
|
(141,619
|
)
|
|||||||||||||||
|
Gross profit (loss)
|
10,861
|
|
63,316
|
|
(7,902
|
)
|
27,673
|
|
18,310
|
|
4,517
|
|
(573
|
)
|
116,202
|
|
|||||||||||||||
|
Exploration expense
|
4,658
|
|
9
|
|
659
|
|
190
|
|
5,791
|
|
—
|
|
2,942
|
|
14,249
|
|
|||||||||||||||
|
Other operating expenses
|
352
|
|
—
|
|
170
|
|
1,544
|
|
—
|
|
—
|
|
24,987
|
|
27,053
|
|
|||||||||||||||
|
OPERATING INCOME (LOSS)
|
5,851
|
|
63,307
|
|
(8,731
|
)
|
25,939
|
|
12,519
|
|
4,517
|
|
(28,502
|
)
|
74,900
|
|
|||||||||||||||
|
Interest and other income, net
|
914
|
|
(373
|
)
|
(26
|
)
|
681
|
|
(3,974
|
)
|
—
|
|
3,549
|
|
771
|
|
|||||||||||||||
|
Interest expense, net
|
(21,567
|
)
|
(325
|
)
|
(1,591
|
)
|
—
|
|
(90
|
)
|
—
|
|
(7,369
|
)
|
(30,942
|
)
|
|||||||||||||||
|
Loss on debt extinguishment
|
—
|
|
—
|
|
—
|
|
—
|
|
—
|
|
—
|
|
(20,300
|
)
|
(20,300
|
)
|
|||||||||||||||
|
Fair value adjustments, net
|
(98,707
|
)
|
—
|
|
(13,783
|
)
|
—
|
|
—
|
|
—
|
|
(4,604
|
)
|
(117,094
|
)
|
|||||||||||||||
|
Income tax expense
|
16,901
|
|
(21,655
|
)
|
(8
|
)
|
—
|
|
(8,523
|
)
|
—
|
|
22,766
|
|
9,481
|
|
|||||||||||||||
|
Income (loss) from continuting operations
|
(96,608
|
)
|
40,954
|
|
(24,139
|
)
|
26,620
|
|
(68
|
)
|
4,517
|
|
(34,460
|
)
|
$
|
(83,184
|
)
|
||||||||||||||
|
Loss from discontinued operations
|
—
|
|
—
|
|
—
|
|
—
|
|
—
|
|
—
|
|
(6,029
|
)
|
$
|
(6,029
|
)
|
||||||||||||||
|
Loss on sale of net assets of discontinued operations
|
—
|
|
—
|
|
—
|
|
—
|
|
—
|
|
—
|
|
(2,095
|
)
|
$
|
(2,095
|
)
|
||||||||||||||
|
Net income (loss)
|
$
|
(96,608
|
)
|
$
|
40,954
|
|
$
|
(24,139
|
)
|
$
|
26,620
|
|
$
|
(68
|
)
|
$
|
4,517
|
|
$
|
(42,584
|
)
|
$
|
(91,308
|
)
|
|||||||
|
Segment assets
(A)
|
$
|
2,119,367
|
|
$
|
260,653
|
|
$
|
512,401
|
|
$
|
29,734
|
|
$
|
21,290
|
|
$
|
39,530
|
|
$
|
17,414
|
|
$
|
3,000,389
|
|
|||||||
|
Capital expenditures
(B)
|
$
|
54,226
|
|
$
|
6,159
|
|
$
|
92,730
|
|
$
|
2,349
|
|
$
|
100
|
|
$
|
—
|
|
$
|
430
|
|
$
|
155,994
|
|
|||||||
|
(A)
|
Segment assets consist of receivables, prepaids, inventories, property, plant and equipment, and mining properties
|
|
(B)
|
Balance represents cash flow amounts
|
|
2012
|
2011
|
2010
|
|||||||||
|
Assets
|
|||||||||||
|
Total assets for reportable segments
|
$
|
2,974,056
|
|
$
|
2,963,130
|
|
$
|
3,000,389
|
|
||
|
Cash and cash equivalents
|
125,440
|
|
175,012
|
|
66,118
|
|
|||||
|
Short term investments
|
999
|
|
20,254
|
|
—
|
|
|||||
|
Other assets
|
120,906
|
|
106,045
|
|
91,020
|
|
|||||
|
Total consolidated assets
|
$
|
3,221,401
|
|
$
|
3,264,441
|
|
$
|
3,157,527
|
|
||
F-40
Coeur d'Alene Mines Corporation and Subsidiaries
Notes to Consolidated Financial Statements (Unaudited) - (Continued)
Geographic Information
|
As of December 31,
|
|||||||||||
|
2012
|
2011
|
2010
|
|||||||||
|
Long Lived Assets:
|
|||||||||||
|
United States
|
$
|
608,051
|
|
$
|
515,096
|
|
$
|
488,104
|
|
||
|
Australia
|
29,408
|
|
33,999
|
|
37,147
|
|
|||||
|
Chile
|
65
|
|
65
|
|
14
|
|
|||||
|
Argentina
|
1,705
|
|
5,213
|
|
1,882
|
|
|||||
|
Bolivia
|
240,905
|
|
230,956
|
|
234,306
|
|
|||||
|
Mexico
|
1,795,677
|
|
1,903,374
|
|
2,028,864
|
|
|||||
|
Total
|
$
|
2,675,811
|
|
$
|
2,688,703
|
|
$
|
2,790,317
|
|
||
|
|
Twelve months ended December 31,
|
||||||||||
|
|
2012
|
2011
|
2010
|
||||||||
|
Revenues:
|
|||||||||||
|
United States
|
$
|
243,379
|
|
$
|
208,517
|
|
$
|
77,951
|
|
||
|
Mexico
|
442,098
|
|
513,097
|
|
230,025
|
|
|||||
|
Bolivia
|
178,005
|
|
267,502
|
|
142,988
|
|
|||||
|
Australia
|
18,848
|
|
18,737
|
|
10,618
|
|
|||||
|
Argentina
|
13,162
|
|
13,347
|
|
53,875
|
|
|||||
|
Total
|
$
|
895,492
|
|
$
|
1,021,200
|
|
$
|
515,457
|
|
||
Sites Related to Callahan Mining Corporation
In 1991, the Company acquired all of the outstanding common stock of Callahan Mining Corporation. Since then, the Company has received requests for information or notices of potential liability from state or federal agencies with regard to Callahan's operations at sites in Idaho, Maine, Colorado and Washington. The Company did not make any decisions with respect to generation, transport or disposal of hazardous waste at these sites. Therefore, the Company believes that it is not liable for any potential cleanup costs either directly as an operator or indirectly as a parent. To date, none of these agencies have made any claims against the Company or Callahan for cleanup costs. The Company anticipates that further agency interaction may be possible with respect to two of these sites.
Callahan operated a mine and mill in Brooksville, Maine from 1968 until 1972 and subsequently disposed of the property. In 2000, the U.S. Environmental Protection Agency, or EPA, made a formal request to the Company for information regarding the site. The site was placed on the National Priorities List on September 5, 2002, and the Maine Department of Transportation, a partial owner of the property, signed a consent order in 2005. In January 2009, the EPA and the State of Maine made additional formal requests to the Company for information relating to the site, to which the Company responded. The first phase of cleanup at the site began in April 2011.
The Van Stone Mine in Stevens County, Washington consists of several parcels and was mined by several owners from 1926 until 1993. Callahan held an ownership interest in the Van Stone Mine from 1971 to 1990. In February 2010, the State of Washington Department of Ecology notified Callahan Mining Corporation that it, among others, is a potentially liable person (PLP) under Washington law. Asarco LLC ("Asarco"), an affiliate of American Smelting and Refining Company, which developed the mill on the site in 1951, settled for
$3.5
million. Another potentially liable person, Vaagen Brothers, signed a consent order which allows access to the site for a Remedial Investigation and Feasibility Study. Neither the Company nor Callahan Mining Corporation has received any further notices from the Washington Department of Ecology. On June 5, 2012, Asarco filed a lawsuit in the U.S. District Court for the Eastern District of Washington against five named defendants, including Callahan Mining Corporation, seeking contribution for the
$3.5
million settlement. Callahan Mining Corporation filed a response and defense to the lawsuit on December 11, 2012 and does not believe it has any liability to Asarco. The Court has set a trial date for April 28, 2014.
F-41
Coeur d'Alene Mines Corporation and Subsidiaries
Notes to Consolidated Financial Statements (Unaudited) - (Continued)
Bolivian Temporary Restriction on Mining above 4,400 Meters
On October 14, 2009, the Bolivian state-owned mining organization, COMIBOL, announced by resolution that it was temporarily suspending mining activities above the elevation of
4,400
meters above sea level while stability studies of Cerro Rico mountain are undertaken. The Company holds rights to mine above this elevation under valid contracts with COMIBOL as well as under authorized contracts with local mining cooperatives that hold their rights under contract themselves with COMIBOL. The Company temporarily adjusted its mine plan to confine mining activities to the ore deposits below 4,400 meters above sea level and timely notified COMIBOL of the need to lift the restriction.
The Cooperative Reserva Fiscal, with which the Company has one of those contracts, subsequently interpreted the COMIBOL resolution and determined that the Huacajchi deposit was not covered by such resolution. In March 2010, the Cooperative Reserva Fiscal notified COMIBOL that, based on its interpretation, it was resuming mining of high grade material above the 4,400 meter level in the Huacajchi deposit. In December 2011, the Cooperative Reserva Fiscal sent a similar notification to COMIBOL with respect to a further area above the 4,400 meter level known as Huacajchi Sur. Based on these notifications and on the absence of any objection from COMIBOL, the Company resumed mining operations at the San Bartolomé mine on the Huacajchi deposit and Huacajchi Sur. Mining in other areas above the
4,400
meter level continues to be suspended.
The partial suspension may reduce production until the Company is able to resume mining above 4,400 meters generally. It is uncertain at this time how long the suspension will remain in place. In addition, it is possible that COMIBOL may decide that the Company's operations at the Huacajchi deposit or Huacajchi Sur are subject to the COMIBOL resolution, which may force the Company to cease mining at such deposits. If COMIBOL objects to the Company mining at the Huacajchi deposit or Huacajchi Sur or if the other restrictions are not lifted, the Company may need to write down the carrying value of the asset. It is also uncertain if any new mining or investment policies or shifts in political attitude may affect mining in Bolivia.
Unpatented Mining Claims Dispute at Rochester in Nevada
On December 5, 2011, Coeur Rochester filed a lawsuit in the Sixth Judicial District Court of Nevada against Rye Patch Gold Corp and Rye Patch Gold US, Inc. seeking a declaratory judgment as to Coeur Rochester's ownership of
447
unpatented mining claims covering approximately
8,600
acres of federal lands in and surrounding the Coeur Rochester mine operation. On December 5, 2011, Rye Patch Gold US, Inc. filed a similar action asserting its interest in the claims in the Second Judicial District Court of Nevada. The Rye Patch action was subsequently moved to the Sixth Judicial Court and consolidated with Coeur Rochester's pending action. The dispute stems from competing asserted interests in the mining claims between Coeur Rochester and Rye Patch following Coeur Rochester's inadvertent failure to pay annual mining claim maintenance fees. On December 5, 2011, the court issued a temporary restraining order prohibiting Rye Patch from entering the property. On December 20, 2011, following a hearing, the District Court judge issued a preliminary injunction, enjoining Rye Patch from entering certain active mine areas at the Coeur Rochester mine operation. On March 6, 2012 Rye Patch filed a Motion for Preliminary Injunction to which Coeur Rochester responded in opposition on March 21, 2012. It is Coeur Rochester's position that there is no new material for review by the Court since the original preliminary injunction was granted in favor of Coeur Rochester. However, if granted in favor of Rye Patch, a preliminary injunction could halt Coeur Rochester's mining operations on the disputed claims. On May 7, 2012, the Court appointed a Special Master to address certain pre-trial matters. A hearing on the Motion was held before the Special Master appointed by the Court on June 27-28, 2012. On August 6, 2012, the Special Master issued a recommendation that the Court deny Rye Patch's motion on the grounds that Rye Patch did not demonstrate a likelihood of success on the merits of the case and did not show that it would suffer irreparable harm if a preliminary injunction were not granted. On August 9-10, 2012, the Court entered orders adopting a number of recommendations made by the Special Master regarding several pending motions, including an order denying Rye Patch's motion to revoke the appointment of the Special Master. On October 12, 2012, the Court continued the original November 2012 trial date, which has since been re-scheduled for September 2013.
On August 27, 2012, Coeur Rochester filed a Motion for Partial Summary Judgment with the Court, requesting the Court enter an Order declaring that Rye Patch's LH Claims located within Coeur Rochester's current Bureau of Land Management (BLM) approved plan of operations boundary are invalid because claims located by trespass cannot be valid. On August 29, 2012, Rye Patch filed a competing Motion for Partial Summary Judgment requesting the Court enter an Order declaring Coeur Rochester's old unpatented mining claims as forfeited for failure to pay the annual maintenance fees to the BLM and that Rye Patch had a federal statutory right to locate the LH claims. Coeur Rochester and Rye Patch each has responded in opposition to the other party's motions and filed subsequent replies to the opposition.
On September 7, 2012, Rye Patch filed a petition with the Nevada Supreme Court requesting a special writ be issued to the District Court to prevent its enforcement of its appointment of the Special Master. On October 5, 2012, the Supreme Court entered an order granting Rye Patch's request for a temporary stay of the appointment of the Special Master. Coeur Rochester filed an answer to Rye Patch's appeal with respect to the appointment of the Special Master on November 5, 2012. The Supreme Court will determine whether to hold a hearing or decide the appeal based only on the written filings.
F-42
Coeur d'Alene Mines Corporation and Subsidiaries
Notes to Consolidated Financial Statements (Unaudited) - (Continued)
The Company believes it holds a superior property interest to Rye Patch based on flaws in the Rye Patch claims, and the Company's valid possessory rights in the claims. The mine operates under an approved BLM plan of operations and has continued normal operations while the legal action is pending. The Company cannot predict how the court will rule on the ownership interest in the claims and if all or some of the claims at issue will be retained by the Company. The Company believes there will be no impact to the current silver and gold reserves at Coeur Rochester as a result of the claims dispute. Furthermore, the Company believes the likelihood of a loss or impairment of assets is remote. The Company believes an adverse outcome would cause it to modify existing plans to further expand future mining operations, would require permits to be updated to reflect changes in claim ownership arising from an adverse outcome and would prevent the Company from future exploration in areas that are subject to any claims ultimately determined to be held by third parties.
Appeal of Plan of Operations Amendment at Rochester in Nevada
The Rochester property is also the subject of an administrative appeal filed by Great Basin Resource Watch (“GBRW”) with the Interior Board of Land Appeals (“IBLA”). This appeal challenges the decision of the U.S. Bureau of Land Management (“BLM”) to approve a plan of operations amendment permitting resumed mining in the existing mine pit and construction of a new heap leach pad. GBRW asserts that the National Environmental Policy Act (“NEPA”) required an Environmental Impact Statement for the plan of operations amendment, as opposed to the Environmental Assessment (“EA”) that was prepared. GBRW further alleges that BLM violated the Federal Land Policy & Management Act (“FLPMA”) by failing to avoid unnecessary and undue degradation of public lands. Because GBRW did not seek a stay of BLM's decision, operations are proceeding as approved. Coeur was granted intervenor status in the appeal and is actively participating in its resolution. The BLM and Coeur assert that the EA complies with NEPA and that BLM complied with FLPMA by, among other things, requiring mitigation of any possible future effects on water quality. BLM filed a Supplemental Briefing on March 1, 2012 regarding additional analysis conducted by the BLM further supporting and strengthening BLM and Coeur's positions that the EA complies with NEPA. The Company cannot predict whether this will result in further briefing with the IBLA, when the IBLA will rule on the appeal or what impact, if any, an adverse ruling may have on Rochester's operations.
|
NOTE 24 -
|
SUMMARY OF QUARTERLY FINANCIAL DATA (UNAUDITED)
|
The following table sets forth a summary of the unaudited quarterly results of operations for the years ended December 31, 2012 and 2011 (In thousands, except per share data):
|
Q1
|
Q2
|
Q3
|
Q4
|
||||||||||||
|
2012
|
|
|
|
|
|
|
|
|
|||||||
|
Sales of metals
|
$
|
204,564
|
|
$
|
254,406
|
|
$
|
230,593
|
|
$
|
205,929
|
|
|||
|
Income (loss) from continuing operations
|
3,975
|
|
22,973
|
|
(15,821
|
)
|
37,550
|
|
|||||||
|
Net income (loss)
|
3,975
|
|
22,973
|
|
(15,821
|
)
|
37,550
|
|
|||||||
|
Depreciation, depletion, and amortization
|
52,592
|
|
61,024
|
|
52,844
|
|
52,397
|
|
|||||||
|
Production costs
|
92,554
|
|
131,823
|
|
124,967
|
|
107,413
|
|
|||||||
|
Exploration expenses
|
6,567
|
|
6,305
|
|
6,957
|
|
6,441
|
|
|||||||
|
Other operating expenses (general and administrative, pre-development, and loss on impairment)
|
8,664
|
|
13,680
|
|
11,836
|
|
5,883
|
|
|||||||
|
Cash provided by operating activities
|
17,002
|
|
113,203
|
|
79,735
|
|
61,694
|
|
|||||||
|
Capital expenditures
|
31,647
|
|
32,238
|
|
29,972
|
|
21,784
|
|
|||||||
|
Basic net income (loss) per share:
|
|
|
|
|
|||||||||||
|
Income (loss) from continuing operations
|
0.04
|
|
0.26
|
|
(0.18
|
)
|
0.42
|
|
|||||||
|
Net income (loss)
|
$
|
0.04
|
|
$
|
0.26
|
|
$
|
(0.18
|
)
|
$
|
0.42
|
|
|||
|
Diluted net income (loss) per share:
|
|
|
|
|
|
|
|
|
|||||||
|
Income (loss) from continuing operations
|
0.04
|
|
0.26
|
|
(0.18
|
)
|
0.42
|
|
|||||||
|
Net income (loss)
|
$
|
0.04
|
|
$
|
0.26
|
|
$
|
(0.18
|
)
|
$
|
0.42
|
|
|||
F-43
Coeur d'Alene Mines Corporation and Subsidiaries
Notes to Consolidated Financial Statements (Unaudited) - (Continued)
|
Q1
|
Q2
|
Q3
|
Q4
|
||||||||||||
|
2011
|
|
|
|
|
|
|
|
|
|||||||
|
Sales of metals
|
$
|
199,624
|
|
$
|
231,090
|
|
$
|
343,575
|
|
$
|
246,911
|
|
|||
|
Income from continuing operations
|
12,464
|
|
38,611
|
|
31,060
|
|
11,364
|
|
|||||||
|
Net income
|
12,464
|
|
38,611
|
|
31,060
|
|
11,364
|
|
|||||||
|
Depreciation, depletion, and amortization
|
50,041
|
|
57,641
|
|
58,652
|
|
58,166
|
|
|||||||
|
Production costs
|
92,474
|
|
77,102
|
|
141,253
|
|
109,127
|
|
|||||||
|
Exploration expenses
|
2,762
|
|
4,077
|
|
4,772
|
|
7,517
|
|
|||||||
|
Other operating expenses
|
15,805
|
|
12,931
|
|
11,507
|
|
10,577
|
|
|||||||
|
Cash provided by operating activities
|
35,786
|
|
111,065
|
|
181,911
|
|
87,411
|
|
|||||||
|
Capital expenditures
|
15,918
|
|
25,764
|
|
38,099
|
|
40,207
|
|
|||||||
|
Basic net income per share:
|
|
|
|
|
|
|
|
|
|||||||
|
Income from continuing operations
|
0.14
|
|
0.43
|
|
0.35
|
|
0.13
|
|
|||||||
|
Net income
|
$
|
0.14
|
|
$
|
0.43
|
|
$
|
0.35
|
|
$
|
0.13
|
|
|||
|
Diluted net income per share:
|
|
|
|
|
|
|
|
|
|||||||
|
Income from continuing operations
|
0.14
|
|
0.43
|
|
0.35
|
|
0.13
|
|
|||||||
|
Net Income
|
$
|
0.14
|
|
$
|
0.43
|
|
$
|
0.35
|
|
$
|
0.13
|
|
|||
Indenture
On January 29, 2013, Coeur d'Alene Mines Corporation (the “Company”) completed an offering of
$300 million
in aggregate principal amount of
7.875%
Senior Notes due 2021 (the “Notes”) in a private placement conducted pursuant to Rule 144A and Regulation S under the Securities Act of 1933, as amended (the “Securities Act”).
The Notes are governed by an Indenture, dated as of January 29, 2013 (the “Indenture”), among the Company, as issuer, certain of the Company's subsidiaries named therein, as guarantors thereto (the “Guarantors”), and The Bank of New York Mellon, as trustee (the “Trustee”).
The Notes are the Company's unsecured senior obligations and rank equally in right of payment with all of its existing and future unsecured senior debt and rank senior in right of payment to all of its existing and future subordinated debt. The Notes are effectively subordinated to any of the Company's existing and future secured debt, including indebtedness under the Company's senior credit facility (the “Senior Credit Facility”), to the extent of the value of the assets securing such debt. Initially, the Company's obligations under the Notes are jointly and severally guaranteed by the all of the Company's domestic subsidiaries that guarantee the borrowings under the Senior Credit Facility. In addition, each of the Company's restricted subsidiaries that becomes a borrower under or that guarantees the Senior Credit Facility, or that guarantees other indebtedness that exceeds
$20.0 million
aggregate principal amount, will be required to guarantee the Notes in the future. The guarantees rank equally in right of payment to all of the Guarantors' existing and future unsecured senior debt and senior in right of payment to all of the Guarantors' existing and future subordinated debt. The guarantees are effectively subordinated to any of the Guarantors' existing and future secured debt to the extent of the value of the assets securing such debt. The Notes are also structurally subordinated to the liabilities of subsidiaries of the Company that have not guaranteed the Notes.
The Notes bear interest at a rate of
7.875%
per year from the date of original issuance or from the most recent payment date to which interest has been paid or provided for. Interest on the Notes is payable semi-annually in arrears on February 1 and August 1 of each year, commencing on August 1, 2013. The Company will make each interest payment to the holders of record of the Notes on the immediately preceding January 15 and July 15. In certain circumstances the Company may be required to pay additional interest.
At any time prior to February 1, 2017, the Company may redeem all or part of the Notes upon not less than
30
nor more than
60
days' prior notice at a redemption price equal to the sum of (i)
100%
of the principal amount thereof, plus (ii) a make-whole premium as of the date of redemption, plus (iii) accrued and unpaid interest and additional interest, if any, thereon, to the date of redemption. In addition, the Company may redeem some or all of the Notes on or after February 1, 2017, at redemption prices set forth in the Indenture, together with accrued and unpaid interest. At any time prior to February 1, 2016, the Company may use the proceeds of certain equity offerings to redeem up to
35%
of the aggregate principal amount of the Notes, including any permitted additional Notes, at a redemption price equal to
107.875%
of the principal amount.
F-44
Coeur d'Alene Mines Corporation and Subsidiaries
Notes to Consolidated Financial Statements (Unaudited) - (Continued)
Upon the occurrence of a change of control triggering event (as defined in the Indenture), unless the Company has exercised its right to redeem the Notes, each holder of Notes will have the right to require the Company to repurchase all or a portion of such holder's Notes at a price equal to
101%
of the principal amount thereof, plus accrued and unpaid interest, if any, to the date of repurchase.
If the Company or its restricted subsidiaries sell assets under certain circumstances specified in the Indenture and do not use the proceeds for certain specified purposes, the Company must offer to use certain net proceeds therefrom to repurchase the Notes and other debt that ranks equal in right of payment to the Notes on a pro rata basis. The purchase price of the Notes will be equal to
100%
of the principal amount of the Notes repurchased, plus accrued and unpaid interest, if any, to the applicable date of repurchase.
If the Company receives excess political risk insurance proceeds (as defined in the Indenture) related to its San Bartolomé mine and does not use the proceeds for certain specified purposes, the Company must offer to use certain net proceeds therefrom to repurchase the Notes and other debt that ranks equal in right of payment to the Notes and contains similar political risk insurance offer provisions on a pro rata basis. The purchase price of the Notes will be equal to
100%
of the principal amount of the Notes repurchased, plus accrued and unpaid interest, if any, to the applicable date of repurchase.
The Indenture contains covenants that, among other things, limit the Company's ability under certain circumstances to create liens or enter into sale-leaseback transactions and impose conditions on the Company's ability to engage in mergers, consolidations and sales of all or substantially all of its assets.
The Indenture also contains certain “Events of Default” (as defined in the Indenture) customary for indentures of this type. If an Event of Default has occurred and is continuing, the Trustee or the holders of not less than
25%
in aggregate principal amount of the Notes then outstanding may, and the Trustee at the request of the holders of not less than 25% in aggregate principal amount of the Notes then outstanding shall, declare all unpaid principal of, premium, if any, and accrued interest on all the Notes to be due and payable.
Registration Rights Agreement
In connection with the sale of the Notes, the Company entered into a Registration Rights Agreement, dated as of January 29, 2013 (the “Registration Rights Agreement”), with the Guarantors and Barclays Capital Inc., as initial purchaser of the Notes. Under the Registration Rights Agreement, the Company and the Guarantors have agreed, to (i) file a registration statement (the “Exchange Offer Registration Statement”) with the United States Securities and Exchange Commission (the “SEC”) with respect to a registered offer (the “Exchange Offer”) to exchange the Notes for new notes of the Company having terms substantially identical in all material respects to the Notes (the “Exchange Notes”), (ii) to use their commercially reasonable efforts to cause the Exchange Offer to be completed on or prior to
365
days after January 29, 2013 and (iii) to commence the Exchange Offer and use their commercially reasonable efforts to issue on or prior to
35
business days, or longer, if required by applicable securities laws, after the date on which the Exchange Offer Registration Statement was declared effective by the SEC, the Exchange Notes in exchange for all Notes tendered prior thereto in the Exchange Offer.
If the Exchange Offer is not consummated, under certain circumstances and within specified time periods, the Company and the Guarantors are required to file a shelf registration statement (the “Shelf Registration Statement”) covering resales of the Notes, use their commercially reasonable efforts to cause the Shelf Registration Statement to be declared effective and to keep the Shelf Registration Statement effective until such time as the Notes cease to be registrable securities.
Subject to certain limitations, the Company and the Guarantors will be required to pay the holders of the Notes special interest on the Notes if (i) the Exchange Offer is not completed on or prior to 365 days after January 29, 2013, (ii) the Company and the Guarantors fail to file any Shelf Registration Statement required by the Registration Rights Agreement on or before the date specified for such filing, (iii) any such Shelf Registration Statement is not declared effective by the SEC prior to the date specified for such effectiveness, (iv) the Company and the Guarantors fail to consummate the Exchange Offer within 35 business days after the date on which the Exchange Offer Registration Statement was declared effective by the SEC, or (v) the Shelf Registration Statement or the Exchange Offer Registration Statement is declared effective but thereafter ceases to be effective or usable in connection with resales of registrable securities during specified time periods.
Offer to repurchase
The Company announced on February 13, 2013 that it is offering to repurchase all of its outstanding
3.25%
Convertible Senior Notes due 2028 (the “Notes”). As of February 12, 2013, there was
$48,658,000
aggregate principal amount of Notes outstanding.
The Indenture governing the Notes provides the holders of the Notes with a right to require the Company to purchase their Notes on March 15, 2013. To the extent that holders exercise this put right, the Company will pay a repurchase price in cash, consisting of
100%
of the principal amount of the Notes repurchased, plus accrued but unpaid interest, up to, but not including,
F-45
Coeur d'Alene Mines Corporation and Subsidiaries
Notes to Consolidated Financial Statements (Unaudited) - (Continued)
March 15, 2013.
Holders may exercise their put right by delivery to the Company and the Paying Agent of a written notice of purchase at any time from the opening of business on February 13, 2013 until 5:00 p.m. New York City time on March 14, 2013, stating (i) the certificate number of the Note which the Holder will deliver to be repurchased, (ii) the portion of the principal amount of the Note which the Holder will deliver to be repurchased, which portion must be in a principal amount of
$1,000
or an integral multiple thereof and (iii) that such Note shall be repurchased as of the Repurchase Date pursuant to the terms and conditions specified in paragraph 6 of the Notes and in the Indenture, or by delivery or book-entry transfer of such Notes to the Paying Agent prior to, on or after the Repurchase Date at the offices of the Paying Agent. Unless the Company defaults in making payment of the Repurchase Price, interest on Notes covered by any Repurchase Notice will cease to accrue on and after the Repurchase Date.
The Notes may be converted during the periods or upon the events described in the Indenture. Upon a conversion of the Notes, a Holder would be entitled to receive a cash payment equal to the “Principal Portion” (as defined in the Indenture) plus, in certain circumstances, an amount in excess thereof paid in cash, shares of the Company's common stock or a combination thereof, at the Company's election. The type and amount of consideration a Holder would receive upon conversion of its Notes would depend on, among other things, the conversion rate applicable at the time of conversion, the trading prices of the Company's common stock during a
20
-day trading period beginning on the second business day following the Holder's conversion election and whether the Company elects to settle any excess amount in cash, common stock or a combination thereof. The conversion rate in effect on February 13, 2013 was
17.6025
shares of common stock per
$1,000
principal amount of the Notes and the conversion price in effect at that time was
$56.81
per share of common stock.
A Repurchase Notice may be withdrawn by means of a written notice of withdrawal delivered to the office of the Paying Agent in accordance with the Repurchase Notice at any time prior to 5:00 p.m. on March 14, 2013, specifying (i) the certificate and principal amount of the Note in respect of which such notice of withdrawal is being submitted and (ii) the principal amount, if any, of such Note which remains subject to the original Repurchase Notice and which has been or will be delivered for purchase by the Company.
The Repurchase Price for any Notes as to which a Repurchase Notice has been given and not withdrawn shall be paid promptly following the later of the Repurchase Date and the time of surrender of such Notes.
Acquisition of Orko Silver Corp.
On February 20, 2013, the Company entered into a definitive agreement to acquire all of the issued and outstanding common shares of Orko Silver Corp. ("Orko") (TSX VENTURE: OK). Under the terms of the agreement, Orko shareholders may elect to receive in exchange for each Orko share:
|
▪
|
0.0815
common shares of Coeur ("Coeur Shares") and CAD
$0.70
cash and
0.01118
warrants to purchase Coeur shares ("Coeur Warrants");
|
|
▪
|
0.1118
Coeur Shares and
0.01118
Coeur Warrants, subject to pro-ration as to the number of Coeur Shares if the total number of Coeur Shares elected by Orko shareholders exceeds approximately
11.6 million
; or
|
|
▪
|
CAD
$2.60
in cash and
0.01118
Coeur Warrants, subject to pro-ration as to the amount of cash if the total cash elected by Orko shareholders exceeds CAD
$100 million
.
|
Each whole Coeur Warrant will be exercisable for one Coeur Share for a period of
four
years at an exercise price of US
$30.00
, all subject to adjustment in accordance with the terms of the warrant.
In connection with the agreement, Orko executed and delivered a promissory note (the “Note”) in the principal amount of CAD$11,600,000 in favor of the Company in connection with the Company's payment, on behalf of Orko, of the termination fee due to First Majestic Silver Corp. (“First Majestic”) pursuant to Orko's and First Majestic's arrangement agreement, dated as of December 16, 2012 (the “First Majestic Arrangement Agreement”). Orko and First Majestic terminated the First Majestic Arrangement Agreement in accordance with its terms on February 20, 2013. The indebtedness due under the Note will not accrue interest. The Note has a maturity date of August 20, 2014; provided, however, that earlier repayment may be required upon the occurrence of certain events of default or upon a Termination Payment becoming payable pursuant to the Arrangement Agreement. The Note includes customary representations, warranties and covenants by the parties thereto.
F-46
TABLE OF CONTENTS
Part IItem 1. BusinessItem 1A. Risk FactorsItem 1B. Unresolved Staff CommentsItem 2. PropertiesItem 3. Legal ProceedingsPart IIItem 4. Mine Safety DisclosureItem 5. Market For Registrant S Common Equity, Related Stockholder Matters and Issuer Purchases Of Equity SecuritiesItem 6. Selected Financial DataItem 7. Management S Discussion and Analysis Of Financial Condition and Results Of OperationsItem 7A. Quantitative and Qualitative Disclosure About Market RiskItem 8. Financial Statements and Supplementary DataItem 9. Changes in and Disagreements with Accountants on Accounting and Financial DisclosureItem 9A. Controls and ProceduresItem 9B. Other InformationPart IIIItem 10. Directors, Executive Officers and Corporate GovernanceItem 11. Executive CompensationItem 12. Security Ownership Of Certain Beneficial Owners and Management and Related Stockholder MattersItem 13. Certain Relationships and Related Transactions, and Director IndependenceItem 14 . Principal Accountant Fees and ServicesPart IVItem 15. Exhibits, Financial Statement SchedulesNote 1 - Nature Of OperationsNote 2 Basis Of PresentationNote 3 Summary Of Significant Accounting PoliciesNote 4 Earnings Per ShareNote 5 - Recently Adopted Accounting StandardsNote 6 Fair Value MeasurementsNote 7 - Discontinued OperationsNote 8 Aquisition Of Joaquin Mineral InterestsNote 9 InvestmentsNote 10 ReceivablesNote 11 Metal and Other InventoryNote 12 Property, Plant and EquipmentNote 13 Mining PropertiesNote 14 Debt, Capital Leases and Royalty ObligationNote 15 Reclamation and Mine ClosureNote 16 Income TaxesNote 17 Share-based Compensation PlansNote 18 Defined Contribution and 401(k) PlansNote 19 Derivative Financial InstrumentsNote 20 Commitments and ContingenciesNote 21 Significant CustomersNote 22 Segment ReportingNote 23 Litigation and Other EventsNote 24 - Summary Of Quarterly Financial Data (unaudited)Note 25 Subsequent Events