COEUR MINING, INC.
10-Ks and 10-Qs
|
|
|
|
|
|
|
|
|
|
|
|
|
|
|
|
|
|
|
|
|
|
|
|
|
|
|
|
|
|
|
|
|
|
|
|
|
|
|
|
|
|
|
|
|
|
|
|
|
|
|
|
|
|
|
|
|
|
|
UNITED STATES SECURITIES AND EXCHANGE COMMISSION
Washington, D.C. 20549
Form 10-K
|
(Mark One)
|
|
|
x
|
ANNUAL REPORT PURSUANT TO SECTION 13 OR 15(d) OF THE SECURITIES EXCHANGE ACT OF 1934
|
|
|
For the fiscal year ended December 31, 2015
|
|
OR
|
|
|
o
|
TRANSITION REPORT PURSUANT TO SECTION 13 OR 15(d) OF THE SECURITIES EXCHANGE ACT OF 1934
|
|
|
For the transition period from to
|
Commission File Number 1-8641

COEUR MINING, INC.
(Exact name of registrant as specified in its charter)
|
Delaware
|
82-0109423
|
|
(State or other jurisdiction of
incorporation or organization)
|
(I.R.S. Employer
Identification No.)
|
|
104 S. Michigan Ave. Suite 900
Chicago, IL
(Address of principal executive offices)
|
60603
(Zip Code)
|
Registrant’s telephone number, including area code: (312) 489-5800
Securities Registered pursuant to Section 12(b) of the Act:
|
Title of each class
|
|
Name of each exchange on which registered
|
|
Common Stock, par value $0.01 per share
|
|
New York Stock Exchange
|
Securities registered pursuant to Section 12(g) of the Act: None
Indicate by check mark if the registrant is a well-known seasoned issuer as defined in Rule 405 of the Securities Act. Yes
¨
No
x
Indicate by check mark if the registrant is not required to file reports pursuant to Section 13 or Section 15(d) of the Act. Yes
¨
No
x
Indicate by check mark whether the registrant (1) has filed all reports required to be filed by Section 13 or 15(d) of the Securities Exchange Act of 1934 during the preceding 12 months (or for such shorter period that the registrant was required to file such reports), and (2) has been subject to such filing requirements for the past 90 days. Yes
x
No
¨
Indicate by check mark whether the registrant has submitted electronically and posted on its corporate Web site, if any, every Interactive Data File required to be submitted and posted pursuant to Rule 405 of Regulation S-T (§ 232.405 of this chapter) during the preceding 12 months (or for such shorter period that the registrant was required to submit and post such files). Yes
x
No
¨
Indicate by check mark if disclosure of delinquent filers pursuant to Item 405 of Regulation S-K (§ 229.405) is not contained herein, and will not be contained, to the best of registrant’s knowledge, in definitive proxy or information statements incorporated by reference in Part III of this Form 10-K or any amendment to this Form 10-K.
x
Indicate by check mark whether the registrant is a large accelerated filer, an accelerated filer, a non-accelerated filer, or a smaller reporting company. See the definitions of “large accelerated filer,” “accelerated filer” and “smaller reporting company” in Rule 12b-2 of the Exchange Act. (Check one):
|
Large accelerated filer
x
|
Accelerated filer
o
|
Non-accelerated filer
o
(Do not check if a smaller reporting company)
|
Smaller reporting company
o
|
Indicate by check mark whether the registrant is a shell company (as defined in Rule 12b-2 of the Exchange Act). Yes
¨
No
x
State the aggregate market value of the voting and non-voting common equity held by non-affiliates computed by reference to the price at which the common equity was last sold, or the average bid and asked price of such common equity, as of the last business day of the registrant’s most recently completed second fiscal quarter.
$777,662,184
Indicate the number of shares outstanding of each of the registrant’s classes of common stock, as of the latest practicable date.
As of February 9, 2016, 152,597,110 shares of Common Stock, par value $0.01 per share
DOCUMENTS INCORPORATED BY REFERENCE
Certain information called for by Part III of the Form 10-K is incorporated by reference from the registrant’s definitive proxy statement for the 2016 Annual Meeting of Stockholders which will be filed pursuant to Regulation 14A not later than 120 days after the end of the fiscal year covered by this report.
COEUR MINING, INC.
FORM 10-K
INDEX
|
PART I
|
||
|
PART II
|
||
|
PART III
|
||
|
Directors, Executive Office
rs and Corporate Governance
|
||
|
Certain Relationships and Related Transactions
, and Director Independence
|
||
|
PART IV
|
||
2
|
Item 1.
|
Business
|
INTRODUCTION
Coeur Mining, Inc. (“Coeur”,“the Company”, or "we") is a gold and silver producer with mines located in the United States, Mexico, and Bolivia and exploration projects in Mexico and Argentina. The Company operates the Palmarejo complex, the Rochester, Kensington, Wharf, and San Bartolomé mines, and also owns Coeur Capital, which is primarily comprised of the Endeavor silver stream, other precious metal royalties, and strategic investments. The Company’s principal sources of revenue are its operating mines and the Endeavor silver stream.
Coeur was incorporated as an Idaho corporation in 1928 under the name Coeur d'Alene Mines Corporation. On May 16, 2013, Coeur changed its state of incorporation from the State of Idaho to the State of Delaware and changed its name to Coeur Mining, Inc.
OVERVIEW OF MINING PROPERTIES AND INTERESTS
The Company’s operating properties and interests are described below:
|
•
|
Coeur owns 100% of Coeur Mexicana S.A. de C.V. ("Coeur Mexicana"), which has operated the underground and surface Palmarejo silver and gold mine (the “Palmarejo mine”) in Mexico since 2009. Palmarejo produced
5.1 million
ounces of silver and
70,922
ounces of gold in 2015. The Company controls a large land position around its existing operations. In April 2015, the Company completed the acquisition of Paramount Gold and Silver Corp. ("Paramount"), and now owns 100% of Coeur San Miguel Corp., which owns the San Miguel project that is adjacent to Coeur's Palmarejo property. The combined property now consists of (1) the Palmarejo mine and mill; (2) the Guadalupe underground mine, located about 8 kilometers southeast of the Palmarejo mine; (3) the Independencia deposit, located approximately 800 meters northeast of the Guadalupe underground mine, and (4) other nearby deposits and exploration targets (together, the “Palmarejo complex”).
|
In 2009, Coeur Mexicana entered into a gold production royalty with a subsidiary of Franco-Nevada Corporation covering 50% of life of mine gold production for the portion of the Palmarejo complex owned by Coeur Mexicana prior to completion of the Paramount acquisition (the “Coeur Mexicana Property”). In 2014, Coeur Mexicana terminated the gold production royalty effective upon completion of the minimum ounce delivery requirement and subsequently entered into a gold stream agreement with a subsidiary of Franco-Nevada Corporation.
|
•
|
Coeur owns 100% of Coeur Rochester, Inc. ("Coeur Rochester"), which has operated the Rochester mine, a silver and gold surface mining operation located in northwestern Nevada, since 1986. Rochester produced
4.6 million
ounces of silver and
52,588
ounces of gold in 2015. Coeur Rochester is obligated to pay a 3.4% net smelter returns ("NSR") royalty on up to 39.4 million silver equivalent ounces produced and sold from a portion of the Rochester mine.
|
|
•
|
Coeur owns 100% of Coeur Alaska, Inc. ("Coeur Alaska"), which operates the Kensington mine, an underground gold mine located north of Juneau, Alaska. The Kensington mine began commercial production in 2010. Kensington produced
126,266
ounces of gold in 2015.
|
|
•
|
Coeur owns 100% of Wharf Resources (U.S.A.) Inc. ("Wharf"), which operates the Wharf mine, an open-pit gold mine located near Lead, South Dakota. Wharf is located in the Black Hills mining district of South Dakota and has been in production for over 30 years, during which it has produced over 2.0 million ounces of gold. Coeur acquired Wharf in February 2015 from Goldcorp Inc. for cash consideration of $99.4 million. Wharf produced
78,132
ounces of gold post-acquisition in 2015.
|
|
•
|
Coeur owns 100% of Empresa Minera Manquiri S.A. ("Manquiri"), a Bolivian company that controls the mining rights for the San Bartolomé mine, which is a surface silver mine in Bolivia where Coeur commenced commercial production in 2008. San Bartolomé produced
5.4 million
ounces of silver in 2015.
|
|
•
|
Coeur owns 100% of Coeur Capital, Inc. (“Coeur Capital”), which holds the Company's streaming and royalty interests, along with a portfolio of strategic equity investments. The Endeavor silver stream, pursuant to a 2005 purchase agreement, allows Coeur to buy 100% of silver production up to 20.0 million ounces from the Endeavor mine for an operating cost contribution of $1.00 for each ounce of payable silver, indexed annually for inflation, plus a further increment when the silver price exceeds $7.00 per ounce. The Endeavor mine, operated by Cobar Operations Pty. Limited, is an underground zinc, lead, and silver mine which has been in operation since 1983. Endeavor produced
0.6 million
ounces of silver in 2015. At December 31, 2015, the Company has received a total of 6.0 million ounces under the streaming agreement.
|
3
Coeur Capital also holds a tiered royalty on McEwen Mining Inc.’s El Gallo complex in Mexico, currently paying a 3.5% NSR royalty, a 1.5% NSR royalty on Dynasty Metals & Mining, Inc.’s Zaruma mine in Ecuador, a 2.0% NSR royalty on Mandalay Resources Corp.’s Cerro Bayo mine in Chile, and other non-producing royalties.
|
•
|
Coeur owns an 80% interest in a 2.5% royalty on OceanaGold Corporation's Correnso mine in New Zealand. Coeur has entered into an agreement to acquire the remaining 20% interest, which is expected to be completed in 2016.
|
|
•
|
Coeur owns 100% of the La Preciosa silver-gold exploration project in the State of Durango, Mexico.
|
|
•
|
Coeur owns 100% of the Joaquin silver-gold exploration project located in the Santa Cruz province of southern Argentina.
|
|
•
|
Coeur owns 100% of Coeur Argentina S.R.L., which operated the Martha mine located in Argentina through 2012. In February 2016, the Company entered into an agreement to sell the Martha mine assets and properties for total consideration of $3.0 million. The transaction is subject to customary closing conditions and is expected to close in the first quarter of 2016.
|
The Company also has interests in exploration stage properties located in the United States, Chile, Argentina, Bolivia, and Mexico with no mineable ore reserves. For financial and geographic information regarding our operating segments, see Note 3 to the consolidated financial statements.
SILVER AND GOLD PRICES
The Company’s operating results are substantially dependent upon the market prices of silver and gold, which fluctuate widely. The volatility of such prices is illustrated in the following table, which sets forth the high and low prices of silver based on the London Bullion Market Association ("LBMA") Silver Price, formerly known as the silver fix, and gold based on the PM LBMA Gold Price, formerly known as the PM gold fix:
|
|
Year Ended December 31,
|
||||||||||
|
|
2015
|
2014
|
2013
|
||||||||
|
High
|
Low
|
High
|
Low
|
High
|
Low
|
||||||
|
Silver
|
$18.23
|
$13.71
|
$22.05
|
$15.28
|
$32.23
|
$18.61
|
|||||
|
Gold
|
$1,296
|
$1,049
|
$1,385
|
$1,142
|
$1,694
|
$1,192
|
|||||
MARKETING
All of the Company's mining operations produce silver and gold in doré form except the Kensington and Wharf mines, which produce gold in various concentrate forms. The Endeavor mine, in which Coeur Capital holds a silver stream, produces lead and zinc concentrates with a high silver content, from which the Company recovers its payable silver ounces. The Company uses a geographically diverse group of third-party refiners and smelters in the United States, China, and Japan.
The Company's doré, as well as the concentrate product produced by the Wharf mine, is refined into gold and silver bullion according to benchmark standards set by the LBMA, which regulates the acceptable requirements for bullion traded in the London precious metals markets. The Company then sells its silver and gold bullion to multi-national banks, bullion trading houses, and refiners across the globe. The Company has
eleven
trading counterparties and the sales of metals to these companies amounted to approximately
74%
, 63%, and 72% of total metal sales for the years ended December 31, 2015, 2014, and 2013, respectively. Generally, the loss of a single bullion trading counterparty would not adversely affect the Company due to the liquidity of the markets and availability of alternative trading counterparties.
The Company's concentrate produced by the Kensington mine is sold to smelters under purchase and sale agreements, and the smelters pay the Company for the gold and silver recovered from the concentrates. The Company currently sells concentrate to
three
smelters, and sales to these companies amounted to approximately
26%
, 37%, and 28% of total metal sales for the years ended December 31, 2015, 2014, and 2013, respectively. While the loss of any one smelter may have a material adverse effect if alternate smelters are not available, the Company believes that there is sufficient global capacity available to address the loss of a smelter.
HEDGING ACTIVITIES
The Company’s strategy is to provide stockholders with exposure to silver and gold prices by selling silver and gold production at market prices. The Company may enter into derivative contracts to protect the selling price for certain anticipated silver and gold production and to manage risks associated with foreign currencies. For additional information see "Item 7A. Quantitative and Qualitative Disclosures About Market Risk" and Note 12 -- Derivative Financial Instruments in the notes to the consolidated financial statements.
4
GOVERNMENT REGULATION
General
The Company’s activities are subject to extensive federal, state and local laws governing the protection of the environment, prospecting, development, production, taxes, labor standards, occupational health, mine safety, toxic substances and other matters. The costs to comply with such regulatory requirements are substantial and possible future legislation and regulations could cause additional expense, capital expenditures, restrictions and delays in the development and continued operation of the Company’s properties, the extent of which cannot be predicted. In the context of environmental permitting, including the approval of reclamation plans, the Company must comply with known standards and regulations which may entail significant costs and delays. Although the Company has been recognized for its commitment to environmental responsibility and believes it is in substantial compliance with applicable laws and regulations, amendments to current laws and regulations, more stringent application or interpretation of these laws and regulations through judicial review, or administrative action or the adoption of new laws could have a material adverse effect upon the Company and its results of operations.
Estimated future reclamation costs are based primarily on legal and regulatory requirements. At December 31, 2015,
$82.1 million
was accrued for reclamation costs relating to currently developed and producing properties. The Company is also involved in several matters concerning environmental obligations associated with former mining activities. Based upon the Company’s best estimate of its liabilities for these items,
$3.2 million
was accrued at December 31, 2015. These amounts are included in Reclamation on the Consolidated Balance Sheet.
Federal Environmental Laws
Certain mining wastes from extraction and beneficiation of ores would be considered hazardous waste under the Resource Conservation and Recovery Act (“RCRA”) and state law equivalents, but are currently exempt from the extensive set of Environmental Protection Agency (“EPA”) regulations governing hazardous waste. If the Company’s mine wastes were treated as hazardous waste under RCRA or such wastes resulted in operations being designated as “Superfund” sites under the Comprehensive Environmental Response, Compensation, and Liability Act (“CERCLA”) or state law equivalents for cleanup, material expenditures could be required for the construction of additional waste disposal facilities, for other remediation expenditures, or for natural resource damages. Under CERCLA, any present or past owners or operators of a Superfund site generally may be held liable and may be forced to undertake remedial cleanup action or to pay for the government’s cleanup efforts. Such owners or operators may also be liable to governmental entities for the cost of damages to natural resources, which may be substantial. Additional regulations or requirements may also be imposed upon the Company’s operations, tailings, and waste disposal areas as well as upon mine closure in Alaska, Nevada, and South Dakota under federal and state environmental laws and regulations, including, without limitation, the Clean Water Act (“CWA”) and state law equivalents. Air emissions are subject to the Clean Air Act and its state equivalents as well. Additionally, the Company is subject to other federal and state environmental laws relating to the operation and closure of the Company’s mine sites. The Company has reviewed and considered current federal legislation relating to climate change and does not believe it to have a material effect on its operations. Future changes in federal or state laws or regulations could have a material adverse effect upon the Company and its results of operations.
Proposed U.S. Mining Legislation
A portion of the Company’s U.S. mining properties are on unpatented mining claims on federal lands. Legislation has been introduced regularly in the U.S. Congress over the last decade to change the Mining Law of 1872 as amended (the "Mining Law"), under which the Company holds these unpatented mining claims. It is possible that the Mining Law may be amended or replaced by less favorable legislation in the future. Previously proposed legislation contained a production royalty obligation, new environmental standards and conditions, additional reclamation requirements and extensive new procedural steps which would likely result in delays in permitting. The ultimate content of future proposed legislation, if enacted, is uncertain. If a royalty on unpatented mining claims were imposed, the profitability of the Company’s U.S. operations could be materially adversely affected. In addition, the U.S. Forest Service and the U.S. Bureau of Land Management ("BLM") have considered revising regulations governing operations under the Mining Law on federal lands they administer, which, if implemented, may result in additional procedures and environmental conditions and standards on those lands. The majority of the Company’s operations are either outside of the United States or on private patented lands and would be unaffected by potential legislation.
Any such reform of the Mining Law or BLM and U.S. Forest Service regulations thereunder could increase the costs of mining activities on unpatented mining claims, or could materially impair the ability of the Company to develop or continue operations which derive ore from federal lands, and as a result, could have an adverse effect on the Company and its results of operations. Until such time, if any, as new reform legislation or regulations are enacted, the ultimate effects and costs of compliance on the Company cannot be estimated.
5
Foreign Government Regulations
Bolivia, where the San Bartolomé mine is located, and Mexico, where the Palmarejo complex and the La Preciosa exploration project are located, have both adopted laws and guidelines for environmental permitting that are similar to those in effect in the United States. The permitting process requires a thorough study to determine the baseline condition of the mining site and surrounding area, an environmental impact analysis, and proposed mitigation measures to minimize and offset the environmental impact of mining operations. The Company has received all permits required to operate the San Bartolomé mine and Palmarejo complex as currently conducted, and has received all permits necessary for its exploration activities at the La Preciosa exploration project.
The mining properties of the Company that are located in Argentina are subject to various government laws and regulations pertaining to the protection of the air, surface and ground water, and the environment in general, as well as the health of the work force, labor standards and the socio-economic impacts of mining facilities upon the communities. The Company believes it is in substantial compliance with all applicable laws and regulations to which it is subject in Argentina.
The Company does not directly hold any interest in mining properties in Australia. However, the Company owns a silver stream on CBH Resources Ltd.'s ("CBH") Endeavor mine. CBH is responsible for the mining operation and compliance with laws and regulations, and the Company is not responsible for compliance. The Company is, however, at risk for any production stoppages resulting from non-compliance. CBH’s mining property is subject to a range of laws and regulations pertaining to the protection of the air, surface water, ground water, noise, site rehabilitation and the environment in general, as well as the occupational health and safety of the work force, labor standards and the socio-economic impacts of mining facilities among local communities. In addition, the various federal and state native title laws and regulations recognize and protect the rights and interests in Australia of Aboriginal and Torres Strait Islander people in land and waters and may restrict mining and exploration activity and/or result in additional costs. CBH is required to deal with a number of governmental departments in connection with the development and exploitation of its mining property. The Company is not aware of any substantial non-compliance with applicable laws and regulations to which CBH is subject in Australia.
Maintenance of Claims
United States
At mining properties in the United States, including the Rochester, Kensington, and Wharf mines, operations are conducted upon both patented and unpatented mining claims. Pursuant to applicable federal law, it is necessary to pay to the Secretary of the Interior, on or before September 1st of each year, a claim maintenance fee of $155 per unpatented claim. This claim maintenance fee is in lieu of the assessment work requirement contained in applicable mining laws. In addition, Nevada holders of unpatented mining claims are required to pay the county recorder of the county in which the claim is situated an annual fee of $8.50 per claim. In South Dakota, holders of unpatented mining claims are required to pay the county recorder of the county in which the claim is situated an annual fee of $0.25 per claim. For unpatented claims in Alaska, the Company is required to pay a variable, annual rental fee based on the age of the claim and must perform annual labor or make an annual payment in lieu of annual labor. No maintenance fees are payable for federal patented claims. Patented claims are similar to land held by an owner who is entitled to the entire interest in the property with unconditional power of disposition and are subject to local ad valorem property taxes.
Mexico
In order to carry out mining activities in Mexico, the Company is required to obtain a mining concession from the General Bureau of Mining, which belongs to the Ministry of Economy of the Federal Government, or be assigned previously granted concession rights, and both must be recorded with the Public Registry of Mining. In addition, mining works may have to be authorized by other authorities when performed in certain areas, including
ejidos
(communal owners of land recognized by the federal laws in Mexico), villages, dams, channels, general communications ways, submarine shelves of islands, islets and reefs, marine beds and subsoil and federal maritime-terrestrial zones. Reports have to be filed with the General Bureau of Mining in May of each year, evidencing previous calendar year mining investment and works. Annual reports, detailing production results, must be submitted by January 30 for each concession bearing production and all concessions over six years of age. Bi-annual mining duties are payable in January and July of each year and, based on amount of surface of each mining concession, holders of mining concessions must also pay annually and no later than the last business day of March a special mining fee based on 7.5% of the income before interest and certain other permitted deductions derived from the transfer or sale of minerals, plus 0.5% of gross revenues from sales of gold, silver and platinum. Failure to pay any of these duties and submit the required reports could lead to cancellation of the concessions. Upon expiration or cancellation of the concession, certain obligations remain, such as filing technical reports and ground support.
6
Bolivia
The Bolivian state owns the mining rights at San Bartolomé. The Bolivian state-owned mining organization, Corporación Minera de Bolivia (“COMIBOL”), is the underlying manager of all of the mining rights relating to the San Bartolomé mine. Bolivia’s ownership derives from the Supreme Decree 3196 issued in October 1952, when the government nationalized most of the mines in Potosí. COMIBOL has leased the mining rights for the surface silver and tin bearing sediment to several Potosí cooperatives. The cooperatives have subleased their mining rights to Coeur’s subsidiary, Manquiri, through a series of “joint venture” contracts. In addition to those agreements with the cooperatives, Manquiri holds additional mining rights under lease agreements directly with COMIBOL. All of Manquiri’s mining and surface rights collectively constitute the San Bartolomé mine. For additional information regarding the maintenance of its claims to the San Bartolomé mine, see "Item 2. Properties - Silver and Gold Mining Properties, Bolivia-San Bartolomé."
Argentina
In Argentina, minerals are owned by the provincial governments, which impose a maximum 3% mine-mouth royalty on mineral production. The first step in acquiring mining rights is filing an exploration permit, or
cateo
, which gives exclusive prospecting rights for the requested area for a period of time, generally up to three years. The maximum size of each
cateo
is 10,000 hectares; a maximum of 20
cateos
, or 200,000 hectares, can be held by a single entity in any one province.
The holder of a
cateo
has exclusive right to establish a discovery concession ("
Manifestacion de Descubrimiento
" or “MD”) on that
cateo
, but MDs can also be set without a
cateo
on any land not covered by another party's
cateo
. MDs are filed as either a vein or disseminated discovery. A square protection zone can be declared around the discovery of up to 840 hectares for a vein MD, or up to 7,000 hectares for a disseminated MD. The protection zone grants the discoverer exclusive rights for an indefinite period, during which the discoverer must provide an annual report presenting a program of exploration work and investments related to the protection zone. An MD can be upgraded to an exploitation concession ("
Concesion de Explotacion
" or "Mina"), which gives the holder the right to begin commercial extraction of minerals.
Australia
In Australia, minerals in the ground are owned by the state until severed from the ground through mining operations. At the Endeavor mining property operated by CBH, operations are conducted on designated mining leases issued by the relevant state government mining department. Mining leases are issued for a specific term and include a range of environmental and other conditions including the payment of production royalties, annual lease fees and the use of cash or a bank guarantee as security for reclamation liabilities. The amounts required to be paid to secure reclamation liabilities are determined on a case by case basis. In addition, according to public sources, CBH holds a range of exploration titles and permits, which are also issued by the respective state government mining departments for specified terms and require payment of annual fees and completion of designated expenditure programs to maintain title.
EMPLOYEES
The number of full-time employees of the Company at December 31, 2015 was:
|
U.S. Corporate and Other
|
69
|
|
|
Wharf Mine
|
197
|
|
|
Rochester Mine
|
301
|
|
|
Kensington Mine
|
321
|
|
|
San Bartolomé Mine
(1)
|
352
|
|
|
Palmarejo Complex
|
765
|
|
|
Total
|
2,005
|
|
|
(1)
|
The Company maintains a labor agreement in South America with Sindicato de Trabajadorés Mineras de la Empresa Manquiri S.A. at the San Bartolomé mine in Bolivia. The San Bartolomé mine labor agreement is in effect for 2016. At December 31, 2015, approximately
11%
of the Company’s global labor force was covered by collective bargaining agreements.
|
7
BUSINESS STRATEGY AND COMPETITIVE STRENGTHS
Management believes the following strengths provide the Company with significant competitive advantages:
Strong track record of developing and operating mines
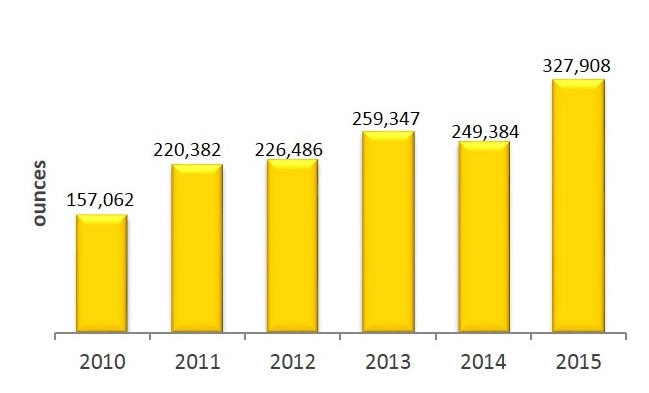
The Company has successfully acquired, developed, and operated a portfolio of operating mines since its founding in 1928. In 2015, it produced
15.9 million
ounces of silver and
327,908
ounces of gold at costs applicable to sales of
$13.23
per silver equivalent ounce at its primary silver mines and
$770
per gold equivalent ounce at its primary gold mines.
Silver Production Gold Production

Operating and commodity diversity
The Company's silver and gold production comes from six operating mines located in four countries. The Company operates the Palmarejo silver and gold complex in Mexico, the San Bartolomé silver mine in Bolivia, the Kensington gold mine in Alaska, the Wharf gold mine in South Dakota, and the Rochester silver and gold mine in Nevada. In addition, the Company owns a silver stream on the Endeavor mine in Australia. The Company also owns the La Preciosa and Joaquin silver-gold exploration projects in Mexico and Argentina, respectively.
The Company's metal sales breakdown by operating mine and metal is set out below:
2015 Silver Sales by Mine (millions of ounces) 2015 Gold Sales by Mine (ounces)


Experienced management team
The Company has built a high-caliber management team of devoted professionals with extensive mining industry expertise. President and Chief Executive Officer, Mitchell Krebs, Senior Vice President and Chief Financial Officer, Peter Mitchell, and Senior Vice President and Chief Operating Officer, Frank Hanagarne, each has significant experience in the mining industry. The board of directors also brings diverse industry backgrounds and a depth of professional experience to the Company.
8
Capitalizing on prior development program
The Company has spent significant capital in commissioning or expanding its five operating mines. The following table provides the percentage contribution to the Company’s total revenues by mine:
|
Coeur Percentage Ownership at December 31,
|
Percentage of Total Revenues
For The Year Ended December 31,
|
||||||||||||||||
|
Mine/Location
|
2015
|
2015
|
2014
|
2013
|
2012
|
2011
|
|||||||||||
|
Palmarejo Complex, Mexico
|
100%
|
27
|
%
|
38
|
%
|
43
|
%
|
49
|
%
|
50
|
%
|
||||||
|
Kensington Mine, United States
|
100%
|
23
|
|
22
|
|
20
|
|
12
|
|
15
|
|
||||||
|
Rochester Mine, United States
|
100%
|
22
|
|
20
|
|
16
|
|
15
|
|
6
|
|
||||||
|
Wharf Mine, United States
(1)
|
100%
|
13
|
|
—
|
|
—
|
|
—
|
|
—
|
|
||||||
|
San Bartolomé Mine, Bolivia
|
100%
|
13
|
|
19
|
|
19
|
|
20
|
|
26
|
|
||||||
|
Coeur Capital
(2)
|
100%
|
2
|
|
1
|
|
2
|
|
2
|
|
2
|
|
||||||
|
Martha Mine, Argentina
|
100%
|
—
|
|
—
|
|
—
|
|
2
|
|
1
|
|
||||||
|
|
|
100
|
%
|
100
|
%
|
100
|
%
|
100
|
%
|
100
|
%
|
||||||
|
(1)
|
Acquired February 20, 2015.
|
|
(2)
|
Primarily revenue from the Endeavor silver stream (Australia).
|
CAUTIONARY STATEMENT CONCERNING FORWARD-LOOKING STATEMENTS
This report contains numerous forward-looking statements within the meaning of Section 21E of the Securities Exchange Act of 1934, as amended (the “Exchange Act”) relating to the Company’s gold and silver mining business, including statements regarding potential acquisitions and dispositions, mineral reserve and mineralized material estimates, exploration and development efforts, estimated production, costs, capital expenditures, expenses, metals prices, sufficiency of assets, ability to discharge liabilities, liquidity management, financing needs, environmental compliance expenditures, risk management strategies, and initiatives to maximize net cash flow, enhance revenues, reduce operating and non-operating costs, and manage working capital efficiently. Such forward-looking statements are identified by the use of words such as “believes,” “intends,” “expects,” “hopes,” “may,” “should,” “plan,” “projected,” “contemplates,” “anticipates” or similar words. Actual results could differ materially from those projected in the forward-looking statements. The factors that could cause actual results to differ materially from those projected in the forward-looking statements include (i) the risk factors set forth below under Item 1A and in Management’s Discussion and Analysis of Financial Condition and Results of Operations under Item 7, (ii) the risks and hazards inherent in the mining business (including risks inherent in developing large-scale mining projects, environmental hazards, industrial accidents, weather or geologically related conditions), (iii) changes in the market prices of gold and silver and a sustained lower price environment, (iv) the uncertainties inherent in the Company’s production, exploratory and developmental activities, including risks relating to permitting and regulatory delays, ground conditions and grade variability, (v) any future labor disputes or work stoppages (involving the Company and its subsidiaries or third parties), (vi) the uncertainties inherent in the estimation of gold and silver reserves and mineralized material, (vii) changes that could result from the Company’s future acquisition of new mining properties or businesses, (viii) reliance on third parties to operate certain mines where the Company owns silver production and reserves, (ix) the absence of control over mining operations in which the Company or any of its subsidiaries holds royalty or streaming interests and risks related to these mining operations (including results of mining and exploration activities, environmental, economic and political risks, and changes in mine plans and project parameters); (x) the loss of access to any third-party smelter to which the Company markets silver and gold, (xi) the effects of environmental and other governmental regulations, (xii) the risks inherent in the ownership or operation of or investment in mining properties or businesses in foreign countries, and (xiii) the Company’s ability to raise additional financing necessary to conduct its business, make payments or refinance its debt. Readers are cautioned not to put undue reliance on forward-looking statements. The Company disclaims any intent or obligation to update publicly these forward-looking statements, whether as a result of new information, future events or otherwise.
CAUTIONARY NOTE REGARDING DISCLOSURE OF MINERAL PROPERTIES
Reserves, Resources and Mineralized Material
Coeur Mining, Inc. is subject to the reporting requirements of the Exchange Act and applicable Canadian securities laws, and as a result we report our mineral reserves according to two different standards. Canadian reporting requirements for disclosure of mineral properties are governed by National Instrument 43-101 Standards of Disclosure for Mineral Projects (“NI 43-101”). The definitions of NI 43-101 are adopted from those given by the Canadian Institute of Mining, Metallurgy and Petroleum. U.S. reporting requirements, however, are governed by Securities and Exchange Commission ("SEC") Industry Guide 7 (“Guide 7”). Both sets of reporting standards have similar goals in terms of conveying an appropriate level of confidence in the disclosures
9
being reported, but embody different approaches and definitions. Under Guide 7, mineralization may not be classified as a “reserve” unless the determination has been made that the mineralization could be economically and legally produced or extracted at the time the reserve determination is made.
In our public filings in Canada and in certain other announcements not filed with the SEC, we disclose measured, indicated and inferred resources, each as defined in NI 43-101, in addition to our mineral reserves. U.S. investors are cautioned that, while the terms “measured mineral resources,” “indicated mineral resources” and “inferred mineral resources” are recognized and required by Canadian securities laws, Guide 7 does not recognize them. The estimation of measured resources and indicated resources involve greater uncertainty as to their existence and economic feasibility than the estimation of proven and probable reserves, and therefore U.S. investors are cautioned not to assume that all or any part of measured or indicated resources will ever be converted into Guide 7 compliant reserves. The estimation of inferred resources involves far greater uncertainty as to their existence and economic viability than the estimation of other categories of resources, and therefore it cannot be assumed that all or any part of inferred resources will ever be upgraded to a higher category. Therefore, investors are cautioned not to assume that all or any part of inferred resources exist, or that they can be mined legally or economically.
In this Annual Report on Form 10-K ("Form 10-K") and in our other filings with the SEC, we modify our estimates made in compliance with NI 43-101 to conform to Guide 7 for reporting in the United States. In this Form 10-K, we use the term “mineralized material” to describe mineralization in mineral deposits that do not constitute “reserves” under U.S. standards. “Mineralized material” is substantially equivalent to measured and indicated mineral resources (exclusive of reserves) as disclosed for reporting purposes in Canada, except that the SEC only permits issuers to report "mineralized material" in tonnage and average grade without reference to contained ounces. We provide disclosure of mineralized material to allow a means of comparing our projects to those of other companies in the mining industry, many of which are Canadian and report pursuant to NI 43-101, and to comply with applicable disclosure requirements. We caution you not to assume that all or any part of mineralized material will ever be converted into Guide 7 compliant reserves.
Technical Reports and Qualified Persons
As required by Canadian securities laws, we hereby notify Canadian investors that the scientific and technical information concerning our mineral projects in this Form 10-K have been reviewed and approved by a “qualified person” under NI 43-101, namely our Director, Resource Geology, Dana Willis. For a description of the key assumptions, parameters and methods used to estimate mineral reserves included in this Form 10-K, as well as data verification procedures and a general discussion of the extent to which the estimates may be affected by any known environmental, permitting, legal, title, taxation, socio-political, marketing or other relevant factors, Canadian investors may view technical reports prepared for each of our properties as filed on SEDAR at
http://www.sedar.com
.
Neither the technical reports nor the statements of any qualified person filed with the Canadian securities regulatory authorities are included in, or incorporated by reference in, this Form 10-K.
Because the definitions and standards of NI 43-101 differ from those of Guide 7, investors are cautioned that information contained in reports prepared pursuant to NI 43-101, like the technical reports, may not be comparable to similar information that we can disclose in this Form 10-K or the other reports we file with the SEC.
AVAILABLE INFORMATION
Coeur makes available, on its website (
http://www.coeur.com)
, its Annual Reports on Form 10-K, Quarterly Reports on Form 10-Q, Current Reports on Form 8-K and Proxy Statements, as well as Forms 3, 4 and 5 with respect to its common stock, including any amendments to any of the foregoing, as soon as reasonably practicable after such reports are electronically filed with the SEC. Copies of Coeur’s Corporate Governance Guidelines, charters of the key committees of the Board of Directors (Audit, Compensation, Nominating and Corporate Governance, and Environmental, Health, Safety, and Social Responsibility Committees) and its Code of Business Conduct and Ethics, applicable to the Chief Executive Officer, Chief Financial Officer and Chief Accounting Officer, among others, are also available on the Company’s website. Information contained on the Company’s website is not a part of this report.
10
|
Item 1A.
|
Risk Factors
|
The Company's results of operations, cash flows and operating costs are highly dependent upon the market prices of silver and gold and other commodities, which are volatile and beyond the Company's control.
Silver and gold are actively traded commodities, and their prices are volatile. During the twelve months ended December 31, 2015, the price of silver ranged from a low of
$13.71
per ounce to a high of
$18.23
per ounce, and the price of gold ranged from a low of
$1,049
per ounce to a high of
$1,296
per ounce. The closing market prices of silver and gold on February 9, 2016 were $15.34 per ounce and $1,191 per ounce, respectively.
Silver and gold prices are affected by many factors beyond the Company’s control, including U.S. dollar strength or weakness, prevailing interest rates and returns on other asset classes, expectations regarding inflation, speculation, global currency values, governmental decisions regarding precious metals stockpiles, global and regional demand and production, political and economic conditions and other factors. In addition, Exchange Traded Funds (“ETFs”), which have substantially facilitated the ability of large and small investors to buy and sell precious metals, have become significant holders of gold and silver. Factors that are generally understood to contribute to a decline in the prices of silver and gold include a strengthening of the U.S. dollar, net outflows from gold and silver ETFs, bullion sales by private and government holders and global economic conditions and/or fiscal policies that negatively impact large consumer markets.
Because the Company derives all of its revenues from sales of silver and gold, its results of operations and cash flows will fluctuate as the prices of these metals change. A period of significant and sustained lower gold and silver prices would materially and adversely affect the Company’s results of operations and cash flows. Additionally, if market prices for silver and gold decline further or remain at current or lower levels for a sustained period of time, the Company may have to revise its operating plans, including reducing operating costs and capital expenditures, terminating or suspending mining operations at one or more of its properties and discontinuing certain exploration and development plans. The Company may be unable to decrease its costs in an amount sufficient to offset reductions in revenues, and may continue to incur losses.
Operating costs at the Company’s mines are also affected by the price of input commodities, such as fuel, electricity, labor, chemical reagents, explosives, steel and concrete. Prices for these input commodities are volatile and can fluctuate due to conditions that are difficult to predict, including global competition for resources, currency fluctuations, consumer or industrial demand and other factors. Continued volatility in the prices of commodities and other supplies the Company purchases could lead to higher costs, which would adversely affect results of operations and cash flows.
The significant and sustained decline in gold and silver prices since 2013 caused the Company to write down certain of its long-lived assets and, in the future, such declines could cause one or more of the Company’s mining properties to become less profitable, which could require the Company to record additional write-downs of long-lived assets. Such write-downs may adversely affect the Company’s results of operations and financial condition.
The Company reviews its long-lived assets for recoverability pursuant to the Financial Accounting Standard Board’s Accounting Standards Codification Section 360 (“ASC 360”). Under that standard, the Company reviews the recoverability of its long-lived assets, such as its mining properties, upon a triggering event. Such review involves the Company estimating the future undiscounted cash flows expected to result from the use and eventual disposition of the asset. Impairment, measured by comparing an asset’s carrying value to its fair value, must be recognized when the carrying value of the asset exceeds these cash flows. The Company conducts a review of the financial performance of its mines in connection with the preparation of its financial statements for each reported period and determines whether any triggering events are indicated.
The Company’s assessment of the recoverability of its long-lived assets at December 31, 2015 and 2014 under ASC 360 indicated that write-downs of its long-lived assets of
$313.3 million
and $1,472.7 million, respectively, were required. These non-cash impairment charges resulted in write-downs in the Company's Statement of Comprehensive Income (Loss) and reduced the carrying value of
Mining properties
and
Property, plant, and equipment
on the Company’s balance sheet at December 31, 2015 and 2014. See Note 4 -- Write-Downs in the notes to the Consolidated Financial Statements for further detail.
If there are further significant and sustained declines in silver and gold prices or if the currently low silver or gold prices remain at such prices, or if the Company fails to control production and operating costs or realize the mineable ore reserves at its mining properties, the Company may terminate or suspend mining operations at one or more of its properties. These events could require a further write-down of the carrying value of the Company’s assets. Any such actions would adversely affect the Company’s results of operations and financial condition.
11
The Company may record other types of charges in the future if it sells a property for a price less than its carrying value or has to increase reclamation liabilities in connection with the closure and reclamation of a property. Any additional write-downs of mining properties could adversely affect the Company’s results of operations and financial condition.
The Company’s future growth will depend upon its ability to develop new mines, either through exploration at existing properties or by acquisition from other mining companies.
Because mines have limited lives based on proven and probable ore reserves, an important element of the Company’s business strategy is the opportunistic acquisition of silver and gold mines, properties and businesses or interests therein. The Company’s ability to achieve significant additional growth in revenues and cash flows will depend upon success in further developing existing properties and developing or acquiring new mining properties. While initial development of major mining properties at Palmarejo, San Bartolomé, Rochester, and Kensington has been substantially completed, development work continues at Palmarejo, Rochester, and Kensington to expand these mines while using existing infrastructure. Since December 2012, the Company has owned 100% of the Joaquin silver-gold exploration project located in the Santa Cruz province of southern Argentina. As a result of its acquisition of Orko (now Coeur La Preciosa Silver Corp.) in April 2013, the Company also holds the La Preciosa silver-gold exploration project in the state of Durango, Mexico. The Company acquired the Wharf gold mine in February 2015 and Paramount in April 2015. The Company is also currently in the process of developing the Guadalupe and Independencia deposits at the Palmarejo complex and the Jualin deposit at Kensington. These strategies are inherently risky, and the Company cannot assure that it will be able to successfully develop existing or new mining properties or acquire additional mining properties on favorable economic terms or at all.
The Company expects to continue to evaluate acquisition opportunities and pursue those opportunities it believes are in the Company’s long-term best interests. There can be no assurance that the anticipated benefits of any such acquisition will be realized. The success of any acquisition will depend upon the Company’s ability to effectively manage the integration and operations of entities or properties it acquires and to realize other anticipated benefits. The process of managing acquired businesses may involve unforeseen difficulties and may require a disproportionate amount of management resources, which may divert management’s focus and resources from other strategic opportunities and from operational matters during this process.
Any acquisition would be accompanied by risks, including:
|
•
|
a significant change in commodity or stock prices after the Company has committed to complete the transaction and established the purchase price or exchange ratio;
|
|
•
|
a material ore body may prove to be below expectations;
|
|
•
|
difficulties integrating and assimilating the operations and personnel of any acquired companies, realizing anticipated synergies and maximizing the financial and strategic position of the combined enterprise, and maintaining uniform standards, policies and controls across the organization; and
|
|
•
|
the acquired business or assets may have unknown liabilities which may be significant.
|
In connection with an acquisition, the Company may incur indebtedness or issue equity securities or securities convertible into equity securities, resulting in increased interest expense, or dilution of the percentage ownership of existing stockholders. The Company cannot predict the impact of future acquisitions on the price of its common stock, or assure that it would be able to obtain any necessary financing on acceptable terms. Unprofitable acquisitions, or additional indebtedness or issuances of securities in connection with such acquisitions, may negatively affect results of operations.
In addition, the Company’s systems, procedures and controls may be inadequate to support the expansion of our operations resulting from an acquisition. The Company’s future operating results could be affected by the ability of its officers and key employees to manage the changing business conditions and to integrate the acquired business into Coeur. There may also be liabilities, such as environmental liabilities, or significant capital expenditures that the Company failed to discover or have underestimated in connection with an acquisition. Any such liabilities or capital expenditure requirements could have a material adverse effect on the Company’s business, financial condition or future prospects.
The Company’s use of derivative contracts to protect against market price volatility exposes it to risk of opportunity loss, mark-to-market fair value adjustments and exposure to counterparty credit risk.
From time to time, the Company may enter into price risk management contracts to protect against fluctuations in the price of silver and gold, foreign currency rates and changes in the prices of fuel and other input costs. These contracts could include forward sales or purchase contracts, futures contracts, purchased or sold put and call options and other derivative instruments.
12
The use of derivative instruments can expose the Company to risk of an opportunity loss and may also result in significant mark-to-market fair value adjustments, which may have a material adverse impact on reported financial results. The Company is exposed to credit risk with contract counterparties, including, but not limited to, sales contracts and derivative contracts. In the event of nonperformance in connection with a contract, the Company could be exposed to a loss of value for that contract.
The Company is an international company and is exposed to political and social risks in the countries in which it has significant operations or interests.
A significant portion of the Company’s revenues are generated by operations outside the United States, and it is subject to significant risks inherent in mineral extraction by foreign companies and contracts with government owned entities. Exploration, development, production and closure activities in many countries are potentially subject to heightened political and social risks that are beyond the Company’s control. These risks include the possible unilateral cancellation or forced renegotiation of contracts, unfavorable changes in foreign laws and regulations, royalty and tax increases, risks associated with the value-added tax (“VAT”) recovery and collection process, claims by governmental entities or indigenous communities, expropriation or nationalization of property and other risks arising out of foreign sovereignty over areas in which operations are conducted. The right to export silver and gold may depend on obtaining certain licenses and quotas, which could be delayed or denied at the discretion of the relevant regulatory authorities. In addition, the Company’s rights under local law may be less secure in countries where judicial systems are susceptible to manipulation and intimidation by government agencies, non-governmental organizations or civic groups.
Any of these developments could require the Company to curtail or terminate operations at its mines, incur significant costs to meet newly-imposed environmental or other standards, pay greater royalties or higher prices for labor or services and recognize higher taxes, or experience significant delays or obstacles in the recovery of VAT refunds owed, which could materially and adversely affect financial condition, results of operations and cash flows.
These risks may be higher in developing countries in which the Company may expand its exploration for and development of mineral deposits. Potential operations in these areas increase the Company’s exposure to risks of war, local economic conditions, political disruption, civil disturbance and governmental policies that may disrupt its operations.
The Company’s ongoing and future success depends on developing and maintaining productive relationships with the communities, including indigenous peoples, and other stakeholders in its operating locations. The Company believes its operations can provide valuable benefits to surrounding communities, in terms of direct employment, training and skills development and other benefits associated with ongoing payment of taxes. In addition, the Company seeks to maintain its partnerships and relationships with local communities and stakeholders in a variety of ways, including in-kind contributions, volunteer time, sponsorships and donations. Notwithstanding the Company’s ongoing efforts, local communities and stakeholders can become dissatisfied with its activities or the level of benefits provided, which may result in civil unrest, protests, direct action or campaigns against it. Any such occurrences could materially and adversely affect the Company’s financial condition, results of operations and cash flows.
The Company’s operations outside the United States also expose it to economic and operational risks.
The Company’s operations outside the United States also expose it to economic and operational risks. Local economic conditions can cause shortages of skilled workers and supplies, increase costs and adversely affect the security of operations. In addition, higher incidences of criminal activity and violence in the area of some of the Company’s foreign operations, including drug-cartel related violence in Mexico, could adversely affect the Company’s ability to operate in an optimal fashion and may impose greater risks of theft and greater risks as to personnel and property security. These conditions could lead to lower productivity and higher costs, which would adversely affect results of operations and cash flows.
In addition, acts of civil disobedience are common in certain of the countries where the Company’s operations are located. In recent years, many mining companies have been the targets of actions to restrict their legally-entitled access to mining concessions or property. Such acts of civil disobedience often occur with no warning and can result in significant direct and indirect costs. The Company cannot provide assurance that there will be no disruptions to site access in the future, which could adversely affect the Company’s business.
The Company sells silver and gold doré and concentrates in U.S. dollars, but it conducts operations outside the United States in local currency. Currency exchange movements could also adversely affect the Company’s results of operations.
13
The estimation of ore reserves is imprecise and depends upon subjective factors. Estimated ore reserves may not be realized in actual production. The Company’s results of operations and financial position may be adversely affected by inaccurate estimates.
The ore reserve figures presented in the Company’s public filings are estimates made by the Company’s technical personnel and independent mining consultants with whom the Company contracts. Reserve estimates are a function of geological and engineering analyses that require the Company to make assumptions about production costs, recoveries and silver and gold market prices. Reserve estimation is an imprecise and subjective process. The accuracy of such estimates is a function of the quality of available data and of engineering and geological interpretation, judgment and experience. Assumptions about silver and gold market prices are subject to great uncertainty as those prices fluctuate widely and have continued to fall over the past several years. Declines in the market prices of silver or gold may render reserves containing relatively lower grades of ore uneconomic to exploit, and the Company may be required to reduce reserve estimates, discontinue development or mining at one or more of its properties or write down assets as impaired. Should the Company encounter mineralization or geologic formations at any of its mines or projects different from those predicted, it may adjust its reserve estimates and alter its mining plans. Either of these alternatives may adversely affect actual production and financial condition, results of operations and cash flows.
The Company’s estimates of future production, costs, and financial results are imprecise, depend upon subjective factors and may not be realized in actual production and such estimates speak only as of their respective dates.
The Company has in the past, and may in the future, provide estimates and projections of its future production, costs and financial results. Any such information is forward-looking. Such estimates are made by the Company’s management and technical personnel and depend on numerous assumptions, including assumptions about the availability, accessibility, sufficiency and quality of ore, the Company’s costs of production, the market prices of silver and gold, the Company’s ability to sustain and increase production levels, the sufficiency of its infrastructure, the performance of its personnel and equipment, its ability to maintain and obtain mining interests and permits and its compliance with existing and future laws and regulations. Actual results and experience may differ materially from these assumptions. Any such production, cost, or financial results estimates speak only as of the date on which they are made, and the Company disclaims any intent or obligation to update such estimates, whether as a result of new information, future events or otherwise.
Forward sales, royalty arrangements, and certain derivative instruments can result in limiting the Company’s ability to take advantage of increased metal prices while increasing its exposure to lower metal prices.
The Company has in the past entered into, and may in the future enter into, arrangements under which it has agreed to make royalty or similar payments to lenders or other third parties in amounts that are based on expected production and price levels for silver or gold. The Company enters into such arrangements when it concludes that they provide it with necessary capital to develop a specific mining property or to achieve other business objectives. Royalty or similar payment obligations, however, can limit the Company’s ability to realize the full effects of rising gold or silver prices and may require the Company to make potentially significant cash payments if the mine fails to achieve specified minimum production levels.
The Company’s future operating performance may not generate cash flows sufficient to meet debt payment obligations.
As of December 31, 2015, the Company had approximately
$490.4 million
of outstanding indebtedness. In addition, the Company's total debt excludes
$15.2 million
for future minimum estimated gold production royalty payments due from Coeur Mexicana to Franco-Nevada. The liabilities associated with these gold production royalty payments increase as the price of gold increases. The Company’s ability to make scheduled debt payments on outstanding indebtedness will depend on future results of operations and cash flows. The Company’s results of operations and cash flows, in part, are subject to economic factors beyond its control, including the market prices of silver and gold. The Company may not be able to generate enough cash flow to meet obligations and commitments. If the Company cannot generate sufficient cash flow from operations to service debt, it may need to further refinance debt, dispose of assets or issue equity to obtain the necessary funds.
The Company cannot predict whether it would be able to refinance debt, issue equity or dispose of assets to raise funds on a timely basis or on satisfactory terms. In a rising interest rate environment, the costs of borrowing additional funds or refinancing outstanding indebtedness would also be expected to increase.
14
The terms of the Company’s debt impose restrictions on its operations.
The agreements governing the Company’s outstanding indebtedness include a number of significant negative covenants. These covenants, among other things:
|
•
|
limit the Company’s ability to obtain additional financing, repurchase outstanding debt or equity or issue debt or equity securities;
|
|
•
|
require a substantial portion of the Company’s cash flows to be dedicated to debt service payments instead of other purposes, thereby reducing the amount of cash flows available for working capital, capital expenditures, acquisitions and other general corporate purposes;
|
|
•
|
limit our flexibility in planning for and reacting to changes in the industry in which we compete; and
|
|
•
|
place us at a disadvantage compared to other, less leveraged competitors.
|
A breach of any of these covenants could result in an event of default under the applicable agreement governing the Company’s outstanding indebtedness that, if not cured or waived, could give the holders of the defaulted debt the right to terminate commitments to lend and cause all amounts outstanding with respect to the debt to be due and payable immediately. Acceleration of any debt could result in cross-defaults under the Company’s other debt instruments. The Company’s assets and cash flow may be insufficient to repay borrowings fully under all of its outstanding debt instruments if any of its debt instruments are accelerated upon an event of default, which could force the Company into bankruptcy or liquidation.
The Company might be unable to raise additional financing necessary to meet capital needs, conduct business, make payments when due or refinance debt.
The Company might need to raise additional funds in order to meet capital needs, implement its business plan, refinance debt or acquire complementary assets. Any required additional financing might not be available on commercially reasonable terms, or at all. In a rising interest rate environment, the costs of borrowing additional funds or refinancing outstanding indebtedness would also be expected to increase. If the Company raises additional funds by issuing equity securities or securities convertible into equity securities, holders of its common stock could experience significant dilution of their ownership interest, and these securities could have rights senior to those of the holders of common stock.
Any downgrade in the credit ratings assigned to the Company’s debt securities could increase future borrowing costs, adversely affect the availability of new financing and may result in increased collateral requirements under the Company’s existing surety bond portfolio.
There can be no assurance that any rating currently assigned by Standard & Poor’s Rating Services or Moody’s Investors Service to the Company will remain unchanged for any given period of time or that a rating will not be lowered if, in that rating agency’s judgment, future circumstances relating to the basis of the rating so warrant. If the Company is unable to maintain its outstanding debt and financial ratios at levels acceptable to the credit rating agencies, or should the Company’s business prospects or financial results deteriorate, including as a result of declines in silver and gold prices or other factors beyond our control, our ratings could be downgraded by the rating agencies. A downgrade by the rating agencies could adversely affect the value of the Company’s outstanding debt securities, its existing debt, and its ability to obtain new financing on favorable terms, if at all, increase borrowing costs, and may result in increased collateral requirements under the Company’s existing surety bond portfolio, which in turn may adversely affect the Company’s results of operations and financial position.
The Company’s business is subject to U.S. Foreign Corrupt Practices Act and similar worldwide anti-bribery laws, a breach or violation of which could lead to civil and criminal fines and penalties, loss of licenses or permits and reputational harm.
The Company operates in certain jurisdictions that have experienced governmental and private sector corruption to some degree. For example, the U.S. Foreign Corrupt Practices Act and anti-bribery laws in other jurisdictions generally prohibit companies and their intermediaries from making improper payments for the purpose of obtaining or retaining business or other commercial advantage. The Company’s Code of Business Conduct and Ethics and other corporate policies mandate compliance with these anti-bribery laws, which often carry substantial penalties. There can be no assurance that the Company’s internal control policies and procedures always will protect it from recklessness, fraudulent behavior, dishonesty or other inappropriate acts committed by the Company’s affiliates, employees or agents. As such, the Company’s corporate policies and processes may not prevent all potential breaches of law or other governance practices. Violations of these laws, or allegations of such violations, could lead to civil and criminal fines and penalties, litigation, and loss of operating licenses or permits, and may damage the Company’s reputation, which could have a material adverse effect on the Company’s business, financial position and results of operations.
15
Significant investment risks and operational costs are associated with exploration, development and mining activities. These risks and costs may result in lower economic returns and may adversely affect the Company’s business.
The Company’s ability to sustain or increase its present production levels depends in part on successful exploration and development of new ore bodies and expansion of existing mining operations. Substantial expenditures are required to establish ore reserves, to extract metals from ores and, in the case of new properties, to construct mining and processing facilities.
Mineral exploration, particularly for silver and gold, involves many risks and is frequently unproductive. Even if mineral deposits are found, those deposits may be insufficient in quantity and quality to return a profit from production, or it may take a number of years until production is possible, during which time the economic viability of the project may change. Few properties that are explored are ultimately developed into producing mines. The commercial viability of a mineral deposit, once developed, depends on a number of factors, including: the particular attributes of the deposit, such as size, grade and proximity to infrastructure; government regulations including taxes, royalties and land tenure; land use; importing and exporting of minerals; environmental protection; mineral prices; and issuance and maintenance of necessary permits. Factors that affect adequacy of infrastructure include: reliability of roads, bridges, power sources and water supply; unusual or infrequent weather phenomena; sabotage; and government or other interference in the maintenance or provision of such infrastructure. All of these factors are highly cyclical. The exact effect of these factors cannot be accurately predicted, but the combination may result in not receiving an adequate return on invested capital.
In addition, exploration projects may have no operating history upon which to base estimates of future operating costs and capital requirements. Exploration project items such as estimates of reserves, metal recoveries and cash operating costs are to a large extent based upon the interpretation of geologic data, obtained from a limited number of drill holes and other sampling techniques, and feasibility studies. Estimates of cash operating costs are then derived based upon anticipated tonnage and grades of ore to be mined and processed, the configuration of the ore body, expected recovery rates of metals from the ore, comparable facility and equipment costs, anticipated climate conditions and other factors. As a result, actual operating costs and economic returns of any and all exploration projects may materially differ from the costs and returns estimated, and accordingly, the Company’s financial condition, results of operations and cash flows may be negatively affected.
A significant delay or disruption in sales of concentrates as a result of the unexpected discontinuation of purchases by smelter customers could have a material adverse effect on results of operations.
The Company currently sells gold concentrates to third-party smelters in China, Japan, and Australia. The loss of any one smelter could have a material adverse effect on the Company if alternative smelters were unavailable. The Company cannot ensure that alternative smelters would be available or offer comparable terms if the need for them were to arise or that it would not experience delays or disruptions in sales that would materially and adversely affect results of operations.
There are significant hazards associated with mining activities, some of which may not be fully covered by insurance.
The mining business is subject to risks and hazards, including environmental hazards, industrial accidents, the encountering of unusual or unexpected geological formations, cave-ins, flooding, earthquakes and periodic interruptions due to inclement or hazardous weather conditions. These occurrences could result in damage to, or destruction of, mineral properties or production facilities, personal injury or death, environmental damage, reduced production and delays in mining, asset write-downs, monetary losses and possible legal liability.
Insurance fully covering many environmental risks, including potential liability for pollution or other hazards as a result of disposal of waste products occurring from exploration and production, is not generally available. Any liabilities that the Company incurs for these risks and hazards could be significant and could adversely affect results of operations, cash flows and financial condition.
The Company is subject to significant governmental regulations, including the Federal Mine Safety and Health Act, and related costs and delays may negatively affect its business.
Mining activities are subject to extensive federal, state, local and foreign laws and regulations governing environmental protection, natural resources, prospecting, development, production, post-closure reclamation, taxes, labor standards and occupational health and safety laws and regulations, including mine safety, toxic substances and other matters. The costs associated with compliance with such laws and regulations are substantial. Possible future laws and regulations, or more restrictive interpretations of current laws and regulations by governmental authorities, could cause additional expense, capital expenditures, restrictions on or suspensions of operations and delays in the development of new properties.
16
U.S. surface and underground mines like the Kensington, Rochester and Wharf mines are continuously inspected by the U.S. Mine Safety and Health Administration (“MSHA”), which inspections often lead to notices of violation. Recently, MSHA has been conducting more frequent and more comprehensive inspections of mining operations in general.
Failure to comply with applicable laws, regulations and permitting requirements may result in enforcement actions, including orders issued by regulatory or judicial authorities causing operations to cease or be curtailed, which may require corrective measures including capital expenditures, installation of additional equipment or remedial actions. In addition, any of the Company’s U.S. mines could be subject to a temporary or extended shutdown as a result of a violation alleged by MSHA. Parties engaged in mining operations or in the exploration or development of mineral properties may be required to compensate those suffering loss or damage by reason of the mining activities and may be subject to civil or criminal fines or penalties imposed for violations of applicable laws or regulations. Any such penalties, fines, sanctions or shutdowns could have a material adverse effect on the Company’s business and results of operations.
Compliance with environmental regulations and litigation based on environmental regulations could require significant expenditures.
Environmental regulations mandate, among other things, the maintenance of air and water quality standards, land development and land reclamation, and set forth limitations on the generation, transportation, storage and disposal of solid and hazardous waste. Environmental legislation is evolving in a manner that may require stricter standards and enforcement, increased fines and penalties for non-compliance, more stringent environmental assessments of proposed projects, and a heightened degree of responsibility for mining companies and their officers, directors and employees. The Company may incur environmental costs that could have a material adverse effect on financial condition and results of operations. Any failure to remedy an environmental problem could require it to suspend operations or enter into interim compliance measures pending completion of the required remedy. The environmental standards that ultimately may be imposed at a mine site affect the cost of remediation and could exceed the financial accruals that the Company has made for such remediation. The potential exposure may be significant and could have a material adverse effect on the Company’s financial condition and results of operations.
Moreover, governmental authorities and private parties may bring lawsuits based upon damage to property and injury to persons resulting from the environmental, health and safety impacts of prior and current operations, including operations conducted by other mining companies many years ago at sites located on properties that the Company currently or formerly owned. These lawsuits could lead to the imposition of substantial fines, remediation costs, penalties and other civil and criminal sanctions. Substantial costs and liabilities, including for restoring the environment after the closure of mines, are inherent in the Company’s operations. The Company cannot assure that any such law, regulation, enforcement or private claim would not have a material adverse effect on its financial condition, results of operations or cash flows.
Some of the mining wastes from the Company’s U.S. mines currently are exempt to a limited extent from the extensive set of EPA regulations governing hazardous waste under the RCRA. If the EPA were to repeal this exemption, and designate these mining wastes as hazardous under RCRA, the Company would be required to expend additional amounts on the handling of such wastes and to make significant expenditures to construct hazardous waste storage or disposal facilities. In addition, if any of these wastes causes contamination in or damage to the environment at a U.S. mining facility, that facility could be designated as a “Superfund” site under CERCLA. Under CERCLA, any present owner or operator of a Superfund site or the owner or operator at the time of contamination may be held jointly and severally liable regardless of fault, and may be forced to undertake extensive remedial cleanup action or to pay for the cleanup efforts. The owner or operator also may be liable to federal, state and tribal governmental entities for the cost of damages to natural resources, which could be substantial. Additional regulations or requirements also are imposed on the Company’s tailings and waste disposal areas in Alaska under the federal Clean Water Act (“CWA”), in Nevada under the Nevada Water Pollution Control Law which implements the CWA, and in South Dakota under the South Dakota Water Pollution Control Act and the Administrative Rules of the State of South Dakota.
Airborne emissions are subject to controls under air pollution statutes implementing the Clean Air Act in Nevada, Alaska and South Dakota. In addition, there are numerous legislative and regulatory proposals related to climate change, including legislation pending in the U.S. Congress to require reductions in greenhouse gas emissions. Adoption of these proposals could have a material adverse effect on results of operations and cash flows.
17
Continuation of the Company’s mining operations is dependent on the availability of sufficient and affordable water supplies.
The Company’s mining operations require significant quantities of water for mining, ore processing and related support facilities. In particular, the Company’s properties in Mexico are in areas where water is scarce and competition among users for continuing access to water is significant. Continuous production and mine development is dependent on the Company’s ability to acquire and maintain water rights and claims and to defeat claims adverse to current water uses in legal proceedings. Although each of the Company’s operating mines currently has sufficient water rights and claims to cover its operational demands, the Company cannot predict the potential outcome of pending or future legal proceedings relating to water rights, claims and uses. Water shortages may also result from weather or environmental and climate impacts out of the Company’s control. Shortages in water supply could result in production and processing interruptions. In addition, the scarcity of water in certain regions could result in increased costs to obtain sufficient quantities of water to conduct the Company's operations. The loss of some or all water rights, in whole or in part, or shortages of water to which we have rights or significantly higher costs to obtain sufficient quantities of water could require the Company to curtail or shut down mining production and could prevent the Company from pursuing expansion or development opportunities, which could adversely affect the Company's results of operations and financial condition. Laws and regulations may be introduced in some jurisdictions in which the Company operates which could also limit access to sufficient water resources, thus adversely affecting the Company’s operations.
The Company relies on third parties who own, maintain and operate the mines underlying its streaming and royalty assets.
The Endeavor mine is owned, maintained and operated by Cobar, a wholly-owned subsidiary of CBH. However, pursuant to a silver sale and purchase agreement, the Company’s wholly-owned subsidiary, CDE Australia Pty. Ltd. (“CDE Australia”), has acquired all silver production and reserves at the Endeavor mine, up to a total of 20.0 million payable ounces. CDE Australia has agreed to pay Cobar an operating cost contribution of $1.00 for each ounce of payable silver, indexed annually for inflation, plus a further increment when the silver price exceeds $7.00 per ounce. In addition, the Company currently holds a tiered royalty on McEwen Mining Inc.’s El Gallo complex in Mexico, currently paying a 3.5% NSR, a 1.5% NSR on Dynasty Metals & Mining, Inc.’s Zaruma mine in Ecuador, a 2.0% NSR on Mandalay Resources Corp.’s Cerro Bayo mine in Chile, and an 80% interest in a 2.5% royalty on OceanaGold Corporation's Correnso mine in New Zealand, as well as several royalties on mining assets that are not yet developed. The Company may acquire additional streaming and royalty interests in the future.
The Company relies on third parties to own, maintain and operate the mining projects underlying its royalty and streaming interests, which exposes it to substantial counterparty risk. These third parties may fail to adequately or appropriately operate or maintain their respective projects or may be unable or unwilling to fulfill their obligations under their agreements with the Company.
The Company cannot ensure that each of these third parties will not suffer financial hardship, will continue as a going concern or will not enter bankruptcy or otherwise liquidate. Any such event could expose the Company to significant costs and could limit the amounts, if any, the Company could recover in any proceeding against any such third party for breach of their agreement with the Company. There can be no assurance that the production from any of these mining operations will meet forecasted production targets. At any time, any of the owners or operators of these mining operations may decide to suspend or discontinue operations. In addition, the owners or operators of projects that are not yet operational in which the Company may hold royalty or streaming interests may decide to delay or not to proceed with commencing commercial production. Any failure, inability or refusal of a counterparty to meet its obligations to the Company under these royalty or streaming arrangements could have a material adverse effect on the Company’s business, results of operations or financial condition.
The Company is required to obtain and renew governmental permits in order to conduct operations, a process which is often costly and time-consuming. The Company’s ability to obtain necessary government permits to expand operations or begin new operations can be materially affected by third party activists.
In the normal course of its business, the Company is required to obtain and renew governmental permits for exploration, operations and expansion of existing operations and for the development of new projects. Obtaining and renewing governmental permits is a complex and time-consuming process. The timeliness and success of permitting efforts are contingent upon many variables not within the Company's control, including the interpretation of permit approval requirements administered by the applicable permitting authority. The Company may not be able to obtain or renew permits that are necessary to its operations or the cost and time required to obtain or renew permits may exceed the Company's expectations. Any unexpected delays or costs associated with the permitting process could delay the development or impede the operation of a mine, which in turn could materially adversely affect the Company's revenues and future growth. In addition, key permits and approvals may be revoked or suspended or may be changed in a manner that adversely affects the Company’s operations.
Private parties such as environmental activists frequently attempt to intervene in the permitting process and to persuade regulators to deny necessary permits or seek to overturn permits that have been issued. Obtaining the necessary governmental
18
permits is a complex and time-consuming process involving numerous jurisdictions and often involving public hearings and costly undertakings. These third party actions can materially increase the costs and cause delays in the permitting process and could cause the Company to not proceed with the development or expansion of a mine. In addition, the Company’s ability to successfully obtain key permits and approvals to explore for, develop, operate and expand mines and to conduct its operations will likely depend on the Company’s ability to develop, operate, expand and close mines in a manner that is consistent with the creation of social and economic benefits in the surrounding communities, which may or may not be required by law. The Company’s ability to obtain permits and approvals and to successfully operate in particular communities may be adversely impacted by real or perceived detrimental events associated with its activities or those of other mining companies affecting the environment, human health and safety of communities in which it operates.
In June 2013, Coeur submitted a proposed amendment to the plan of operations for the Rochester mine (“POA 10”) to the BLM to expand leach pad capacity. Absent POA 10 approval, Coeur anticipates that the capacity under the existing leach pad will be insufficient after mid to late 2017. If POA 10 is not approved on a timely basis or at all, or if the permitting process is delayed for any reason, including to address public comments, the Company’s plans for continued operations and future growth at Rochester could be materially adversely affected which could have a material adverse effect on the Company’s financial condition and results of operations.
The Company is dependent upon information technology systems, which are subject to disruption, damage, failure and risks associated with implementation and integration.
The Company’s information technology systems used in its operations are subject to disruption, damage or failure from a variety of sources, including, without limitation, computer viruses, security breaches, cyber-attacks, natural disasters and defects in design. Cybersecurity incidents, in particular, are evolving and include, but are not limited to, malicious software, attempts to gain unauthorized access to data and other electronic security breaches that could lead to disruptions in systems, unauthorized release of confidential or otherwise protected information and the corruption of data. Various measures have been implemented to manage the Company’s risks related to information technology systems and network disruptions. However, given the unpredictability of the timing, nature and scope of information technology disruptions, the Company could potentially be subject to production downtimes, operational delays, the compromising of confidential or otherwise protected information, destruction or corruption of data, security breaches, other manipulation or improper use of our systems and networks or financial losses from remedial actions, any of which could have a material adverse effect on cash flows, financial condition or results of operations.
The Company could also be adversely affected by system or network disruptions if new or upgraded information technology systems are defective, not installed properly or not properly integrated into operations. Various measures have been implemented to manage the risks related to the system implementation and modification, but system modification failures could have a material adverse effect on the Company’s business, financial position and results of operations.
The Company’s exploration projects, La Preciosa and Joaquin, are subject to significant development, operational and regulatory risks.
As exploration projects, La Preciosa and Joaquin are subject to numerous risks. The economic feasibility of an exploration project is based on many factors such as: estimation of mineral reserves and mineralized material, anticipated metallurgical recoveries, environmental considerations and permitting, future metals prices, and anticipated capital and operating costs of these projects. For the La Preciosa project, the Company’s 2014 feasibility study derived estimates of costs and economic returns based upon anticipated tonnage and grades of reserves to be mined and processed, the configuration of the mineral body, expected recovery rates, estimated expenditures, anticipated climatic conditions and other factors. As a result, it is possible that actual costs and economic returns will differ significantly from those estimated for the project in the feasibility study. For example, the significant decline in metals prices since the feasibility study, among other factors, has resulted in the reclassification of the mineral reserves previously declared at La Preciosa. When the Company ultimately determines to proceed with project construction, the Company may be unable to complete project and environmental permitting within an economically acceptable time frame.
As a result of these and related risks, future estimates of or actual costs and economic returns of the La Preciosa and Joaquin projects may materially differ from the estimated costs and returns for these projects.
The Company’s operations in Bolivia are subject to political risks.
In May 2014, the new Bolivian mining law was enacted. The Company has been assessing the potential effects of the legislation on its Bolivian operations but any effects remain uncertain until the regulations implementing the law are enacted. The law regulates royalties and provides for mining contracts with the government rather than concession holding. If the regulations promulgated under the new mining law mandate a renegotiation of the terms of our existing contracts with the Bolivian state-
19
owned mining company, Corporacion Minera de Bolivia (“COMIBOL”) and the mining cooperatives, this could materially adversely affect the profitability and cash flow of our operations in Bolivia. It is also uncertain if any new mining or investment policies or shifts in political attitude may further affect mining in Bolivia.
In addition, companies are also operating under Law No. 403 of September 18, 2013, and its regulatory Supreme Decree, which provides for the reversion of mining rights if the Ministry of Mines verifies that a person with mining rights has not initiated mining activities or developed the mining rights. The contracts with COMIBOL and the cooperatives are excluded from the application of Law No. 403. In April 2014, our subsidiary in Bolivia was served by the Bolivian government with a reversion decision affecting nine mining rights wholly-owned by our subsidiary. The affected area is not in an area of active mining by the Company and the Company’s San Bartolomé operations were not targeted as an area of interest in the decision since all of our past and current mining activity is performed through our contracts with COMIBOL and the mining cooperatives.
On October 14, 2009, the Bolivian state-owned mining organization, COMIBOL, announced by resolution that it was temporarily suspending mining activities above the elevation of 4,400 meters above sea level while stability studies of Cerro Rico mountain are undertaken. The Company holds rights to mine above this elevation under valid contracts with COMIBOL as well as under authorized contracts with local mining cooperatives that hold their rights under contract themselves with COMIBOL. The stability studies have been completed and officially submitted to the Bolivian mining technical authorities. Accordingly, the COMIBOL suspension has expired in accordance with the terms of the resolution. As a result of the resolution, the Company temporarily adjusted its mine plan to confine mining activities to the ore deposits below 4,400 meters above sea level and timely notified COMIBOL of the need to lift the restriction. The Cooperative Reserva Fiscal, with whom the Company has one of those contracts, subsequently interpreted the COMIBOL resolution and determined that the Huacajchi deposit was not covered by such resolution. In March 2010, the Cooperative Reserva Fiscal notified COMIBOL that, based on its interpretation, it was resuming mining of high grade material above the 4,400 meter level in the Huacajchi deposit. In December 2011, the Cooperative Reserva Fiscal sent a similar notification to COMIBOL with respect to a further area above the 4,400 meter level known as Huacajchi Sur. Based on these notifications and on the absence of any objection from COMIBOL, the Company resumed limited mining operations at the San Bartolomé mine on the Huacajchi deposit and Huacajchi Sur. Despite the fact that the COMIBOL suspension has expired, the Company has not resumed mining in other areas above the 4,400 meter level due to community relations concerns and the current political climate in Bolivia.
While the COMIBOL suspension has expired, it is uncertain at this time how long the Company will continue to suspend its mining operations in areas above the 4,400 meter level other than at Huacajchi and Huacajchi Sur. If COMIBOL decides to affirmatively adopt a new resolution to restrict access above the 4,400 meter level on a permanent basis, the Company may need to further write down the carrying value of the asset. While a portion of the Company's proven and probable reserves relate to material above the 4,400 meter level at San Bartolomé, so long as operations remain suspended, there is a risk that silver may not be produced from this material at expected levels or at all, particularly given the remaining anticipated mine life of this asset. It is also uncertain if any new mining or investment policies or shifts in political attitude may affect mining in Bolivia.
The Company’s business depends on good relations with its employees.
The Company may experience labor disputes, work stoppages or other disruptions in production that could adversely affect its business and results of operations. Labor disruptions may be used to advocate labor, political or social goals, particularly at non-U.S. mines. For example, labor disruptions may occur in sympathy with strikes or labor unrest in other sectors of local economies. During the past three years, two of the Company’s mines have experienced work stoppages, each of which was resolved within a short period of time and had no material effect on results of operations or financial condition. The Company cannot assure that work stoppages or other disruptions will not occur in the future. Any such work stoppage or disruption could expose the Company to significant costs and have a material adverse effect on its business, results of operations or financial condition.
At December 31, 2015, unions represented approximately
11%
of the Company’s global workforce, all of which were comprised of workers at the San Bartolomé mine in Bolivia. The Company has a labor agreement at the San Bartolomé mine which is in effect for 2016. The Company cannot predict whether this agreement will be renewed on similar terms or at all, whether future labor disruptions will occur or, if disruptions do occur, how long they will last.
Disputes regarding the Company’s mining claims, concessions or surface rights to land in the vicinity of the Company’s mining projects or conservation efforts involving U.S. federal lands could adversely impact operations.
The validity of mining or exploration claims, concessions or rights, which constitute most of the Company’s property holdings, is often uncertain and may be contested. The Company has used commercially reasonable efforts, in accordance with industry standard, to investigate its title or claims to its various properties, however, no assurance can be given that applicable governments will not revoke or significantly alter the conditions of the applicable exploration and mining claims, concessions or
20
rights or that such exploration and mining claims, concessions or rights will not be challenged by third parties. Although the Company has attempted to acquire satisfactory title to undeveloped properties, in accordance with mining industry practice it does not generally obtain title opinions until a decision is made to develop a property. As a result, some titles, particularly titles to undeveloped properties may be defective. Defective title to any of the Company’s exploration and mining claims, concessions or rights could result in litigation, insurance claims and potential losses affecting its business as a whole. There may be challenges to the title of any of the claims comprising the Company’s projects that, if successful, could impair development and operations. A defect could result in the Company losing all or a portion of its right, title, estate and interest in and to the properties to which the title defect relates.
In Mexico, while mineral rights are administered by the federal government through federally issued mining concessions,
ejidos
control surface or surface access rights to the land. An
ejido
may sell or lease lands directly to a private entity. While the Company has agreements or is in the process of negotiating agreements with the
ejidos
that impact all of its projects in Mexico, some of these agreements may be subject to renegotiation. In Bolivia, we obtain surface rights from cooperatives, through a series of “joint venture” contracts. Changes to the existing agreements or leases or failure to reach agreement in any negotiations may have a significant impact on operations at the Company’s projects and may, on occasion, lead to litigation. Further, the Bolivian government under Law No. 403 may have the ability to reverse our wholly-owned mining rights. Any such reversion decision could adversely impact our future mining plans.
In addition, U.S. environmental conservation efforts could result in the withdrawal of certain federal lands from mineral entry under the Mining Law, which could have the effect of restricting the Company’s current or future planned activities involving its unpatented mining claims on the affected public lands.
The Company is subject to litigation and may be subject to additional litigation in the future.
The Company is currently, and may in the future become, subject to other litigation, arbitration or proceedings with other parties. If decided adversely to the Company, these legal proceedings, or others that could be brought against the Company in the future, could have a material adverse effect on our financial position or prospects. For a more detailed discussion of pending litigation, see Note 21 to the Consolidated Financial Statements. In the event of a dispute arising at the Company’s foreign operations, the Company may be subject to the exclusive jurisdiction of foreign courts or arbitral panels, or may not be successful in subjecting foreign persons to the jurisdiction of courts or arbitral panels in the United States. The Company’s inability to enforce its rights and the enforcement of rights on a prejudicial basis by foreign courts or arbitral panels could have an adverse effect on the Company’s results of operations and financial position.
The Company has the ability to issue additional equity securities, which would lead to dilution of its issued and outstanding common stock and may materially and adversely affect the price of its common stock.
The issuance of additional equity securities or securities convertible into equity securities would result in dilution of the Company's existing stockholders' equity ownership. The Company is authorized to issue, without stockholder approval, 10.0 million shares of preferred stock in one or more series, to establish the number of shares to be included in each series and to fix the designation, powers, preferences and relative participating, optional, conversion and other special rights of the shares of each series as well as the qualification, limitations or restrictions on each series. Any series of preferred stock could contain dividend rights, conversion rights, voting rights, terms of redemption, redemption prices, liquidation preferences or other rights superior to the rights of holders of its common stock. If the Company issues additional equity securities, the price of its common stock may be materially and adversely affected.
Item 1B.
Unresolved Staff Comments
None.
21
Item 2.
Properties
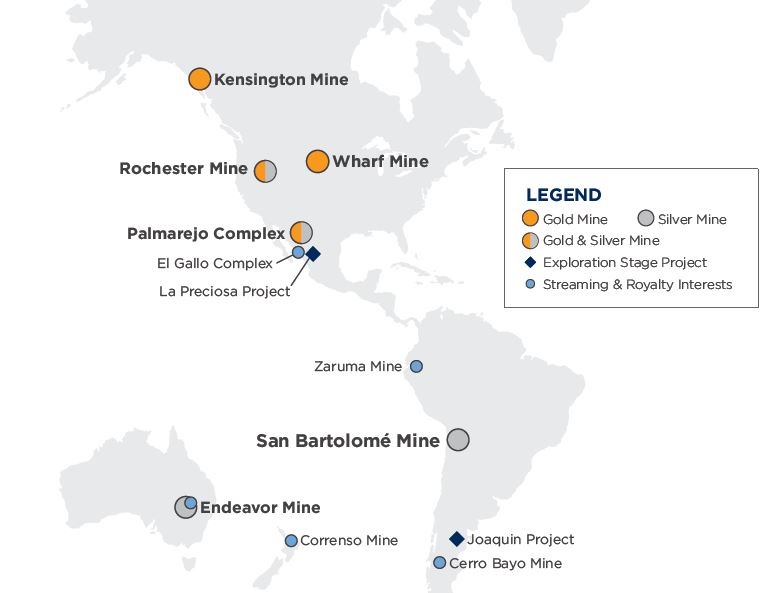
SILVER AND GOLD MINING PROPERTIES
Coeur Mining's significant production and development properties are described below. Operating statistics are presented in the section entitled "Operating Statistics" below.
Mexico — Palmarejo
The Palmarejo complex consists of (1) the Palmarejo mine and mill; (2) the Guadalupe underground mine, located about 8 kilometers southeast of the Palmarejo mine; (3) the Independencia deposit, located approximately 800 meters northeast of the Guadalupe underground mine; and (4) other nearby deposits and exploration targets. The Palmarejo complex is located in the state of Chihuahua, Mexico. Access to the property is provided by air, rail, and all-weather paved and gravel roads from the state capitol of Chihuahua. Silver and gold production from the Palmarejo complex (consisting of the Palmarejo and Guadalupe mines) was approximately
5.1 million
ounces and
70,922
ounces in 2015, respectively. At December 31, 2015, we reported
44.9 million
ounces of silver reserves and
690,100
ounces of gold reserves at the Palmarejo complex.
On April 17, 2015, Coeur completed its acquisition of Paramount Gold and Silver Corp. (“Paramount”) in an all-stock transaction valued at approximately $146.0 million. Following completion of the transaction, Paramount, together with its wholly-owned subsidiary, Paramount Gold de Mexico ("Paramount Mexico"), is now wholly-owned by Coeur.
The Palmarejo complex is made up of 81 wholly-owned mining concessions, covering approximately 135,131 acres (54,685 hectares) of land, held as follows: Coeur Mexicana - 36 mining concessions, approximately 30,351 acres (12,282 hectares); and Paramount Gold de Mexico - 45 mining concessions, approximately 104,780 acres (42,403 hectares). In total, the Palmarejo complex covers over 211 square miles. All mining concessions owned by Coeur and its wholly-owned subsidiaries are valid until at least 2029.
22
The Palmarejo complex is located on the western flank of the Sierra Madre Occidental, a mountain range that comprises the central spine of northern Mexico. The north-northwest trending Sierra Madre Occidental is composed of a relatively flat-lying sequence of Tertiary volcanic rocks that forms a volcanic plateau, cut by numerous igneous intrusive rocks. This volcanic plateau is deeply incised in the Palmarejo mine area, forming steep-walled canyons. The Sierra Madre Occidental gives way to the west to an extensional terrain that represents the southward continuation of the Basin and Range Province of the western United States, and then to the coastal plain of western Mexico.
The gold and silver deposits at the Palmarejo complex, typical of many of the other silver and gold deposits in the Sierra Madre, are classified as epithermal deposits and are hosted in multiple veins, breccias, and fractures. These geologic structures trend generally northwest to southeast and dip either southwest or northeast. The dip on the structures ranges from about 45 degrees to 70 degrees. In the mineralized portions of the structures, gold and silver are zoned from top to bottom with higher silver values occurring in the upper parts of the deposit and higher gold values in the lower parts, sometimes accompanied by base metal mineralization, though local variations are common. The Palmarejo complex contains a number of mineralized zones or areas of interest. The most important of these to date is the Palmarejo zone in the north of the mining concessions, which covers the old Palmarejo gold-silver mine formed at the intersection of the northwest-southeast trending La Prieta and La Blanca gold-and-silver bearing structures. In addition to Palmarejo, other mineralized vein and alteration systems in the district area have been identified all roughly sub-parallel to the Palmarejo zone. The most significant of these additional targets are the Guadalupe (including Animas), Independencia, and La Patria vein systems in the southern part of the property, which are currently under development and exploration by the Company.
In 2009, Coeur Mexicana entered into a gold production royalty transaction with a subsidiary of Franco-Nevada Corporation under which Franco-Nevada purchased a royalty covering 50% of the life of mine gold to be produced by Coeur from the Coeur Mexicana Property. A total of
33,495
ounces of gold remain outstanding at December 31, 2015 under the minimum royalty obligation. On October 2, 2014, Coeur Mexicana terminated the Palmarejo gold production royalty effective upon completion of the minimum ounce delivery requirement. Subsequently, Coeur Mexicana entered into a gold stream agreement with a subsidiary of Franco-Nevada Corporation whereby Coeur Mexicana will sell 50% of Coeur Mexicana Property gold production upon completion of the gold production royalty minimum ounce delivery requirement for the lesser of $800 or spot price per ounce. The properties acquired by Coeur in the Paramount acquisition are not subject to the Franco-Nevada gold production royalty or the gold stream agreement.
USA — Rochester
The Rochester mine, and associated heap leach facilities, is an open pit silver and gold mine located in Pershing County, Nevada, approximately 12 miles north of the city of Lovelock. The Company owns 100% of the Rochester Mine through Coeur Rochester. The mine consists of the main Rochester deposit and the adjacent Nevada Packard deposit, southwest of Rochester. The Rochester mine is fully supported with electricity, supplied by a local power company on their public grid, telephone and radio communications, production water wells, and processing, maintenance, warehouse, and office facilities. All of these facilities are in good operating condition with no major maintenance expected. Ore is mined using conventional open pit methods, with gold and silver recovered by heap leaching of crushed open-pit ore placed on pads located within the Rochester mining area. Based upon actual operating experience and metallurgical testing, the Company estimates ultimate recovery rates from the crushed ore of 61.0% for silver, depending on the ore being leached, and 92.0% for gold. Silver and gold production from Rochester was approximately
4.6 million
ounces and
52,588
ounces in 2015, respectively. At December 31, 2015, we reported
79.3 million
ounces of silver reserves and
477,000
ounces of gold reserves at Rochester.
Coeur Rochester lands consist of approximately 15,682 net acres, which encompasses 733 Federal unpatented lode claims, appropriating approximately 11,063 net acres of Public Land, 21 patented lode claims, consisting of approximately 357 acres, interests owned in approximately 3,993 gross acres of additional real property and certain rights in and to approximately 269 acres, held either through lease, letter agreement or license.
The Company acquired the Rochester property from ASARCO in 1983 and commenced mining in 1986. No mining or processing was conducted at Rochester by the prior owner. The Company acquired its initial interest in the adjacent Nevada Packard property in 1996, completed the full purchase in 1999 and commenced mining in 2003. However, mining of the Nevada Packard property has since ceased. The prior owner conducted very limited mining and processing at Nevada Packard. Collectively, the Rochester and Nevada Packard properties, together with other adjacent and contiguous lands subsequently acquired, comprise the Rochester silver and gold processing operation. The Federal unpatented lode claims are maintained via annual filings and timely payment of claim maintenance fees to the BLM, which acts as administrator of the claims.
23
At Rochester, silver and gold mineralization is hosted in folded and faulted volcanic rocks of the Rochester Formation and overlying Weaver Formation. Silver and gold, consisting of silver sulfosalt minerals, argentite, silver-bearing tetrahedrite and minor native gold, are contained in zones of multiple quartz veins and veinlets (vein, vein swarms and stockworks) with variable amounts of pyrite.
The Company is obligated to pay a NSR royalty to ASARCO, the prior owner, when the average quarterly market price of silver equals or exceeds $23.60 per ounce indexed for inflation up to a maximum rate of 5% with the condition that Rochester achieves positive cash flow for the applicable year. If cash flow at Rochester is negative in any calendar year, the maximum royalty payable is $250,000.
Coeur Rochester is obligated to pay a 3.4% NSR royalty on up to 39.4 million silver equivalent ounces produced and sold from a portion of the Rochester mine (including stockpile ore, mineral processing facilities and mining claims located in the Sections set forth in the NSR royalty agreement) commencing January 1, 2014. For each calendar quarter, the royalty is payable on the actual sales prices received at the time of sale (exclusive of gains or losses associated with trading activities), less refining costs, of gold and silver produced and sold from the Rochester mine. At December 31, 2015, 24.2 million silver equivalent ounces remain subject to the 3.4% NSR royalty.
USA — Kensington
The Kensington underground gold mine and associated milling facilities are located on the east side of the Lynn Canal about 45 miles north-northwest of Juneau, Alaska. The Company controls 100% of the mine through Coeur Alaska. The mine is accessed by a horizontal tunnel and utilizes conventional and mechanized underground mining methods. Ore is processed in a flotation mill that produces a concentrate that is sold to third party smelters. Waste material is deposited in an impoundment facility on the property. Power is supplied to the site by on-site diesel generators. Access to the mine is by either a combination of road vehicles, boat, helicopter, floatplane, or by boat direct from Juneau. Gold production from Kensington was
126,266
ounces in 2015. At December 31, 2015, we reported
560,301
ounces of gold reserves at Kensington.
Coeur Alaska controls two contiguous property groups: the Kensington Group and Jualin Group. The Kensington Group, totaling approximately 3,969 net acres, consists of 51 patented lode and patented mill site claims comprising approximately 766 net acres, 284 Federal unpatented lode claims covering approximately 3,108 net acres, and 13 State of Alaska mining claims covering approximately 95 net acres. The Jualin Group, totaling approximately 8,366 net acres, is composed of 23 patented lode and patented mill site claims covering approximately 388 net acres, 471 Federal unpatented lode claims and 1 Federal unpatented mill site claim appropriating approximately 7,916 net acres, and 29 State of Alaska mining claims comprising approximately 306 net acres. 14 of the 23 patented lode claims cover private surface estate only. The mineral estate to these 14 patented lode claims is owned by the State of Alaska, the mineral rights to which are secured by State of Alaska mining claims. The Company controls properties comprising the Jualin Group, under a lease agreement with Hyak Mining Company, which is valid until August 5, 2035 and thereafter, provided mining and production are actively occurring within and from the leased premises.
The Federal unpatented lode and Federal unpatented mill site claims are maintained via annual filings and timely payment of claim maintenance fees to the BLM, which acts as administrator of the claims. State of Alaska mining claims are maintained via fees and filings to the Alaska Department of Natural Resources, Division of Mining, Land and Water and the Juneau Recorder’s Office. Real property taxes are paid annually to the City and Borough of Juneau for the patented lode claims. Lease payments are paid annually and all leases are in good standing.
The Kensington ore deposit consists of multiple gold bearing mesothermal, quartz, carbonate and pyrite vein swarms and discrete quartz-pyrite veins hosted in Cretaceous-aged Jualin diorite. Most of the gold is contained in calaverite (AuTe
2
) that occurs in association with native gold as inclusions in and interstitial to pyrite grains and in microfractures in pyrite.
USA — Wharf
The Wharf mine is located in the northern Black Hills of western South Dakota, approximately 4 miles southwest of the city of Lead, South Dakota. Access is established by paved road with power supplied by a local power company.
On February 20, 2015, Coeur completed its acquisition of Wharf. As a result of the acquisition, Coeur owns all of the issued and outstanding equity interests in Wharf and its wholly-owned subsidiary, Golden Reward Mining Limited Partnership (“Golden Reward”). Post-acquisition gold production from Wharf was
78,132
ounces in 2015. At December 31, 2015, we reported
712,090
ounces of gold reserves at Wharf.
There are two contiguous property groups located at the Wharf mine; the Wharf Group and the Golden Reward Group, owned or controlled by Wharf or Golden Reward, respectively. The Wharf Group is generally described as the northern and
24
western portions of the project, while the Golden Reward Group is generally described as the southern and eastern portion of the project.
The Wharf Group comprises 362 patented lode claims, 35 government lots, 133 subdivided lots, and 59 federal unpatented lode claims. The Wharf Group is comprised of approximately 3,638 net acres of surface, 652 net mineral acres where both the Precambrian and younger formations are owned or controlled, 3,243 net mineral acres of non-Precambrian mineral estate, and 1,603 net mineral acres of Precambrian mineral estate and 287 net acres of federal unpatented lode claims. The Golden Reward Group encompasses 218 patented lode claims, 14 government lots, 19 subdivided lots and 33 federal unpatented lode claims. The Golden Reward Group is comprised of approximately 1,563 net acres of surface estate, 2,987 net mineral acres of mineral estate where both the Precambrian and younger formations are owned or controlled, 357 net mineral acres of Non-Precambrian mineral estate, 153 net mineral acres of Precambrian mineral estate and 25 net acres of federal unpatented lode claims.
The federal unpatented lode claims are maintained by the timely annual payment of claim maintenance fees, payable to the BLM. The patented lands are private land and therefore not subject to federal claim maintenance requirements. However, as private land, they are subject to ad valorem property taxes assessed by Lawrence County, South Dakota, which may be paid semi-annually.
Wharf and Golden Reward are obligated to pay a sliding scale production royalty to Royal Gold, Inc. The royalty encumbers the majority of the land comprising the Wharf Group, together with a small portion of the lands encompassing the Golden Reward Group, and wholly excludes the Precambrian Mineral Estate. The sliding scale provides for a 2.0% royalty on the gross value less state severance taxes with a monthly average PM LBMA Gold Price of $500 or more per ounce.
Wharf and Golden Reward are also obligated to pay a 3.0% non-participating royalty to Donald D. Valentine, et al, on gold that is produced from ores mined and delivered to heap leach pads or recovered from tailings. This royalty encumbers the mineral estate, including the Precambrian Mineral Estate, of much of the lands comprising the Wharf Group, together with a small portion of the lands encompassing the Golden Reward Group. Wharf Resources holds a right of first refusal to purchase this royalty upon any proposed transfer by the royalty holder.
Bolivia — San Bartolomé
The San Bartolomé silver mine, and associated milling operation, operated by Manquiri, is located on the flanks of the Cerro Rico Mountain bordering the town of Potosí, in the department of Potosí, Bolivia. Access to the property and Manquiri’s processing facilities is by paved and all-weather gravel roads leading south-southwest from Potosí. Silver was first discovered in the area around 1545. Mining of silver and lesser amounts of tin and base metals has been conducted nearly continuously since that time from multiple underground mines driven into Cerro Rico. Silver production from San Bartolomé was approximately
5.4 million
ounces in 2015. At December 31, 2015, we reported
27.9 million
ounces of silver reserves at San Bartolomé.
The silver mineralization at San Bartolomé is hosted in unconsolidated sediments (pallacos), reworked sediments (sucus and troceras), and oxide stockpiles and dumps (desmontes) from past mining that occurred on Cerro Rico. Cerro Rico is a prominent mountain in the region that reaches an elevation of over 15,400 feet (over 4,700 meters). It is composed of Tertiary-aged volcanic and intrusive rocks that were emplaced into and over older sedimentary, and volcanic, basement rocks. Silver, along with tin and base metals, is located in multiple veins and vein swarms and stockworks that occur in a northeast trending belt, which transects Cerro Rico. The upper parts of the Cerro Rico mineralized system were subsequently eroded and re-deposited into the flanking gravel deposits. Silver is hosted in all portions of the pallacos, sucus, and troceras with the best grades segregated to the coarser-grained silicified fragments. These deposits lend themselves to simple, free digging surface mining techniques and can be extracted without drilling and blasting. Of the several pallaco deposits that are controlled by Manquiri and surround Cerro Rico, three are of primary importance and are known as Huacajchi, Diablo, and Santa Rita.
The mineral and mining rights for the San Bartolomé mine are held through a mixture of joint venture agreements, long-term lease agreements, and Autorizaciones Transitorias Especiales (similar to mining concessions) with seven independent mining cooperatives and the Bolivian state-owned mining organization COMIBOL. Manquiri controls 3 acres (1 hectare) of land at San Bartolomé, around Cerro Rico, through these agreements and Autorizaciones Transitorias Especiales and approximately 8,587 acres (3,475 hectares) of Autorizaciones Transitorias Especiales at the Rio Blanco property, a gold exploration target south of Potosí. The San Bartolomé agreements expire between 2021 and 2028 and are generally subject to a production royalty payable partially to the cooperatives and partially to COMIBOL. The royalty rate is 3% at silver prices below $4 per ounce and 6% at prices above $8 per ounce. The rate is a factor of 75% of the silver price between $4 and $8. The Company has additional mining rights, known as the Plahipo project, which include the mining rights to oxide dumps adjacent to the original property package. The oxide dumps included in the Plahipo project are subject to a sliding scale royalty payable to COMIBOL that is a function of silver price. Manquiri incurred royalty payment obligations to COMIBOL and the Cooperatives for these mining rights totaling $2.6 million and $4.2 million for the years ended 2015 and 2014, respectively.
25
STREAMING AND ROYALTY INTERESTS
Australia — Endeavor
The Endeavor mine and associated mill facility is an underground silver and base metal operation in production since 1983 located in north-central New South Wales, Australia, about 30 miles (18 kilometers) northwest of the community of Cobar, accessible by paved road. The ore reserves at Endeavor are covered by five consolidated mining leases issued by the state of New South Wales to Cobar Operations Pty. Limited (“Cobar”), a wholly-owned subsidiary of CBH Resources Ltd. (“CBH”), which in turn is a wholly-owned subsidiary of Toho Zinc Co. Ltd. The leases form a contiguous block of 10,121 acres in size and expire between 2019 and 2027. The mine employs bulk mining methods and utilizes a conventional flotation mill to produce a concentrate that is sold to a third-party smelter. Power to the mine and processing facilities is provided by the grid servicing the local communities. Silver production from Endeavor was approximately
0.6 million
ounces in 2015. At July 1, 2015, we reported
3.8 million
ounces of silver reserves at Endeavor.
On May 23, 2005, CDE Australia Pty. Ltd. (“CDE Australia”), a wholly-owned subsidiary of Coeur Capital, acquired silver production and reserves contained at the Endeavor Mine, for $44.0 million. Under the terms of the agreement, as modified in 2006, CDE Australia owns all silver production and reserves up to a total of 20.0 million payable ounces. CDE Australia has committed to pay Cobar an operating cost contribution of $1.00 for each ounce of payable silver (indexed annually and currently $1.31 an ounce) plus a further increment when the silver price exceeds $7.00 per ounce.
At Endeavor, silver, lead, zinc and lesser amounts of copper mineralization are contained within sulfide lenses hosted in fine-grained sedimentary rocks of the Paleozoic-aged Amphitheatre Group. Sulfide lenses are elliptically-shaped, steeply-dipping to the southwest and strike to the northwest. Principal ore minerals are galena, sphalerite and chalcopyrite. Silver occurs with both lead- and zinc-rich sulfide zones.
Mexico — El Gallo
The El Gallo complex is operated by McEwen Mining and is located in Mexico’s State of Sinaloa, along the foothills of the Sierra Madre Mountains. The complex includes the El Gallo and Palmarito silver deposits and the Magistral gold deposit, located within an eight mile (13 kilometer) radius. The Company, through its wholly-owned subsidiary Coeur Capital, owns a tiered royalty on the mine's production for the life of mine, currently paying a 3.5% NSR royalty.
Ecuador — Zaruma
The Zaruma gold mine is operated and developed by Dynasty Metals & Mining and is located in the cantons of Zaruma and Portovelo, Province of El Oro, Ecuador. The mine is in pre-commercial production, with processing of ore to doré occurring at a processing plant located in Zaruma, Ecuador. The Company, through its wholly-owned subsidiary Coeur Capital, owns a 1.5% NSR royalty on the mine's production for the life of mine.
Chile — Cerro Bayo
The Cerro Bayo underground silver-gold mine is operated by Mandalay Resources and is located in southern Chile, approximately 81 miles (130 kilometers) south of Coyhaique. The Company, through its wholly-owned subsidiary Coeur Capital, owns a 2.0% NSR royalty on the mine's production for the life of mine.
New Zealand — Correnso
The Correnso underground gold mine is operated by OceanaGold Corporation and is located near the town of Waihi, New Zealand. The Company owns an 80% interest in a 2.5% royalty on the mine's production for the life of the mine. Coeur has entered into an agreement to acquire the remaining 20% interest, which is expected to be completed in 2016.
Other Royalties
The Company also owns several royalties on non-producing properties.
26
EXPLORATION STAGE PROPERTIES
Mexico — La Preciosa Project
On April 16, 2013, the Company completed its acquisition of Orko Silver Corporation (since renamed Coeur La Preciosa Silver Corp.), which owns the mining concessions of the La Preciosa project. La Preciosa is an advanced-stage silver-gold exploration project located approximately 52 miles (84 kilometers) northeast of the city of Durango in Durango State, Mexico. The La Preciosa property comprises 14 mining concessions, covering an area of approximately 95,340 acres (approximately 38,583 hectares), located along the eastern flank of the Sierra Madre Occidental Mountain range. The Company completed a feasibility study in 2014, and has deferred construction activities until expected returns improve.
The Tertiary age epithermal quartz veins containing economic levels of silver and gold mineralization are hosted in Cretaceous age conglomerate and Tertiary age andesitic volcanic rocks. The veins at the La Preciosa project have been classified as low- to intermediate-sulfidation type. Two major vein and vein breccia systems are exposed on hills and ridges on either side of an approximately 800 meter wide valley. The dominant geological feature on the Property is the northwest-trending La Preciosa Ridge which hosts the north-striking and westward-dipping main vein system, which includes the Martha, Abundancia, Gloria, Pica, Luz Elena, Sur, and Nueva veins. These veins are crosscut by east-striking, south-dipping transversal veins. The major vein breccia system to the east of La Preciosa Ridge on the eastern side of the valley floor includes the northwest striking Zona Oriente and Zona Oriente Extension, which is believed to be the surface expression of the Martha vein.
Argentina — Joaquin Project
The Joaquin silver-gold exploration project is located in the Santa Cruz province of southern Argentina, approximately 43 miles (70 kilometers) north of the Company's now dormant Martha mine. The property is accessed by all-weather dirt roads, leading north-northeast from the town of Gobernador Gregores. The Joaquin property encompasses over 55,502 acres (22,461 hectares) of
cateos
and MDs. On December 21, 2012, the Company completed its acquisition of the 49% minority interest from its joint venture partner. Coeur previously held a 51% interest in the project.
The geology of the Joaquin property consists dominantly of various volcanic rocks of the Jurassic-aged Chon Aike Formation, the host to most of the precious metal deposits discovered to date in the Santa Cruz province, with lesser amounts of intrusive rocks associated with the Chon Aike Formation. Collectively, the volcanic and intrusive rock units form a prominent geologic domain in the province termed the Deseado Massif. Silver and gold mineralization at Joaquin occurs in epithermal veins, breccia, stockwork veinlets and mantos within the favorable units of the Chon Aike Formation. Occurrences of lead and zinc mineralization have also been discovered. Locally, the rocks of the Deseado Massif are covered by Tertiary-aged basalt and younger unconsolidated sediments, that post-date silver and gold mineralization.
Argentina — Martha Mine
The Martha underground silver and gold mine is located in the Santa Cruz province of southern Argentina, owned by Coeur Argentina S.R.L., a wholly-owned subsidiary of the Company. The Martha mine ceased active mining operations in September 2012. The mineral rights for the Martha property are fully owned by Coeur Argentina S.R.L. Surface rights covering the Martha deposit are controlled by the 138 square mile (35,705 hectare) Cerro Primero de Abril Estancia, which is owned by Coeur Argentina S.R.L. In February 2016, the Company entered into an agreement to sell the Martha mine for total consideration of $3.0 million. The transaction is subject to customary closing conditions and is expected to close in the first quarter of 2016.
EXPLORATION
Exploration expense was
$11.6 million
, $21.7 million, and $22.4 million in 2015, 2014 and 2013, respectively. Capitalized exploration was $6.0 million in 2015 and $8.9 million in 2014. Coeur's exploration program completed over 273,824 feet (83,483 meters) of combined core and reverse circulation drilling in 2015.
Mexico — Palmarejo
Exploration focused primarily on the expansion of the Guadalupe underground mine and Independencia deposit, and discovery of the Los Bancos and Nación deposits. $4.7 million of expensed exploration funds were spent on mapping, sampling, drill target generation, and drilling to identify and define new silver and gold mineralization, for a total of 65,501 feet (19,965 meters). $2.1 million was spent on capitalized drilling within the Guadalupe and Independencia ore bodies for a total of 49,448 feet (15,072 meters) of drilling.
The Company expects to spend $5.0 million in 2016 to discover and expand silver and gold mineralization in the Guadalupe-Independencia corridor, and for new project reviews in Mexico. Additionally, the Company is planning to spend $5.0 million on capitalized drilling on further infilling of the Guadalupe and Independencia resources.
27
USA — Kensington
At Kensington, expensed exploration consisted of drilling 9,743 feet (2,970 meters) while capitalized exploration completed 28,849 feet (8,793 meters) of drilling. A total of $2.6 million was spent on expensed exploration and $1.4 million on capitalized exploration, primarily to expand and define mineralization in the main Kensington deposit. Expensed exploration completed the discovery of the high-grade Jualin resource, which became the focus of a revised preliminary economic assessment for the mine in April 2015. Capitalized drilling was focused in the southern and deeper portions of the main Kensington resource as well as in the Raven vein. In 2016, the Company expects to spend $2.5 million in expensed exploration and $3.5 in capitalized exploration for additional expansion at Jualin and South Kensington.
USA — Wharf
Expensed exploration at Wharf consisted of drilling 7,250 feet (2,210 meters) and capitalized drilling consisted of 28,560 feet (8,705 meters). A total of $0.1 million was spent on expensed exploration, primarily at the Two Johns target area while $0.9 million was spent on capitalized exploration, focused on the main resource model expansion. The Company expects to spend $1.0 million in 2016 for additional capitalized drilling, focused in the Portland Ridge area.
USA — Rochester
In 2015, the Company spent $1.3 million on expensed exploration and $1.6 million in capitalized exploration at Rochester. Expensed exploration consisted of 42,000 feet (12,802 meters) testing areas east of the Packard Pit and East Rochester Pit while capitalized exploration consisted of 36,410 feet (11,098 meters) mainly within the main Rochester Pit resource. In 2016, the Company expects to spend $1.3 million in expensed exploration drill testing several targets around Rochester, and $2.5 million in capitalized exploration to continue to infill and grow the East Rochester target.
Bolivia — San Bartolomé
In 2015, the Company spent $0.1 million to complete trenching and sampling at several silver-bearing gravel deposits to expand and define known silver mineralization. The Company expects to spend $0.2 million in 2016 for trenching and sampling.
Project Evaluation
The Company spent $1.2 million completing target analysis and regional exploration, mainly focused in the Great Basin of Nevada-Utah, and the Black Hills, South Dakota. The Company completed two new earn-in/option agreements for the Arabia and Quito projects in Nevada. Geologic work and reclamation of 2014 drill sites was completed at the Wonder project in Nevada. Surface sampling and mapping were completed at the Klondyke silver-gold project in Nevada. The Company expects to spend $1.0 million in 2016 focused on surface sampling and mapping of all the projects in preparation for an expanded drilling program in 2017.
OPERATING STATISTICS
|
Palmarejo
|
Rochester
|
||||||||||||||||||||||
|
2015
|
2014
|
2013
|
2015
|
2014
|
2013
|
||||||||||||||||||
|
Ore tons milled
|
1,616,668
|
|
2,135,088
|
|
2,322,660
|
|
16,414,302
|
|
13,154,429
|
|
10,693,654
|
|
|||||||||||
|
Ore grade silver (oz./ton)
|
3.78
|
|
3.97
|
|
4.21
|
|
0.63
|
|
0.57
|
|
0.55
|
|
|||||||||||
|
Ore grade gold (oz./ton)
|
0.05
|
|
0.05
|
|
0.06
|
|
0.003
|
|
0.004
|
|
0.003
|
|
|||||||||||
|
Recovery/Ag oz. (%)
|
84.3
|
|
77.5
|
|
77.7
|
|
44.7
|
|
50.0
|
|
41.1
|
|
|||||||||||
|
Recovery/Au oz. (%)
|
80.6
|
|
80.5
|
|
84.2
|
|
100.2
|
|
85.7
|
|
89.4
|
|
|||||||||||
|
Silver produced (oz.)
|
5,148,612
|
|
6,558,091
|
|
7,603,144
|
|
4,630,738
|
|
4,189,071
|
|
2,798,937
|
|
|||||||||||
|
Gold produced (oz.)
|
70,922
|
|
86,673
|
|
116,536
|
|
52,588
|
|
44,888
|
|
30,860
|
|
|||||||||||
|
Costs applicable to sales/oz.
(1)
|
$
|
14.07
|
|
$
|
15.40
|
|
$
|
13.25
|
|
$
|
12.41
|
|
$
|
14.49
|
|
$
|
15.54
|
|
|||||
|
Kensington
|
Wharf
|
||||||||||||||||||||||
|
2015
|
2014
|
2013
|
2015
|
2014
|
2013
|
||||||||||||||||||
|
Ore tons milled
|
660,464
|
|
635,960
|
|
553,717
|
|
3,600,279
|
|
—
|
|
—
|
|
|||||||||||
|
Ore grade gold (oz./ton)
|
0.20
|
|
0.20
|
|
0.22
|
|
0.03
|
|
—
|
|
—
|
|
|||||||||||
|
Recovery/Au oz. (%)
|
94.9
|
|
94.0
|
|
94.2
|
|
72.3
|
|
—
|
|
—
|
|
|||||||||||
|
Gold produced (oz.)
|
126,266
|
|
117,823
|
|
111,951
|
|
78,132
|
|
—
|
|
—
|
|
|||||||||||
|
Costs applicable to sales/oz.
(1)
|
$
|
803
|
|
$
|
951
|
|
$
|
901
|
|
$
|
712
|
|
$
|
—
|
|
$
|
—
|
|
|||||
28
|
San Bartolomé
|
Endeavor
|
||||||||||||||||||||||
|
2015
|
2014
|
2013
|
2015
|
2014
|
2013
|
||||||||||||||||||
|
Ore tons milled
|
1,713,079
|
|
1,749,423
|
|
1,679,839
|
|
767,314
|
|
792,694
|
|
791,116
|
|
|||||||||||
|
Ore grade silver (oz./ton)
|
3.75
|
|
3.80
|
|
3.93
|
|
1.87
|
|
1.63
|
|
1.85
|
|
|||||||||||
|
Recovery/Ag oz. (%)
|
84.6
|
|
88.1
|
|
90
|
|
43.8
|
|
45.6
|
|
41.3
|
|
|||||||||||
|
Silver produced (oz.)
|
5,436,353
|
|
5,851,678
|
|
5,940,538
|
|
629,167
|
|
589,585
|
|
605,832
|
|
|||||||||||
|
Costs applicable to sales/oz.
(1)
|
$
|
13.80
|
|
$
|
14.29
|
|
$
|
14.28
|
|
$
|
5.72
|
|
$
|
7.17
|
|
$
|
9.61
|
|
|||||
(1)
See Non-GAAP Financial Performance Measures
PROVEN AND PROBABLE RESERVES
|
Silver Reserves at December 31, 2015
(1)(2)(3)
|
||||||||||||||||||||||||||||
|
Proven Reserves
|
Probable Reserves
|
Proven and Probable Reserves
|
||||||||||||||||||||||||||
|
Tons (000s)
|
Grade (oz./ton)
|
Ounces (000s)
|
Tons (000s)
|
Grade (oz./ton)
|
Ounces (000s)
|
Tons (000s)
|
Grade (oz./ton)
|
Ounces (000s)
|
Metallurgical Recovery
|
|||||||||||||||||||
|
Palmarejo
(4)
|
802
|
|
6.29
|
|
5,048
|
|
8,297
|
|
4.81
|
|
39,871
|
|
9,099
|
|
4.94
|
|
44,919
|
|
85-87%
|
|||||||||
|
Rochester
(5)
|
96,520
|
|
0.53
|
|
51,007
|
|
54,171
|
|
0.52
|
|
28,336
|
|
150,691
|
|
0.53
|
|
79,343
|
|
61%
|
|||||||||
|
San Bartolomé
(6)
|
6,850
|
|
3.32
|
|
22,742
|
|
1,388
|
|
3.69
|
|
5,122
|
|
8,238
|
|
3.38
|
|
27,864
|
|
74-84%
|
|||||||||
|
Endeavor
(7)
|
904
|
|
2.18
|
|
1,969
|
|
849
|
|
2.12
|
|
1,800
|
|
1,753
|
|
2.15
|
|
3,769
|
|
50%
|
|||||||||
|
Total Silver
|
105,076
|
|
80,766
|
|
64,705
|
|
75,129
|
|
169,781
|
|
155,895
|
|
||||||||||||||||
|
Gold Reserves at December 31, 2015
(1)(2)(3)
|
||||||||||||||||||||||||||||
|
Proven Reserves
|
Probable Reserves
|
Proven and Probable Reserves
|
||||||||||||||||||||||||||
|
Tons (000s)
|
Grade (oz./ton)
|
Ounces
|
Tons (000s)
|
Grade (oz./ton)
|
Ounces
|
Tons (000s)
|
Grade (oz./ton)
|
Ounces
|
Metallurgical Recovery
|
|||||||||||||||||||
|
Kensington
(8)
|
338
|
|
0.198
|
|
67,008
|
|
2,487
|
|
0.198
|
|
493,293
|
|
2,825
|
|
0.198
|
|
560,301
|
|
95%
|
|||||||||
|
Palmarejo
(4)
|
802
|
|
0.077
|
|
62,100
|
|
8,297
|
|
0.076
|
|
628,000
|
|
9,099
|
|
0.076
|
|
690,100
|
|
87-90%
|
|||||||||
|
Rochester
(5)
|
96,520
|
|
0.003
|
|
316,000
|
|
54,171
|
|
0.003
|
|
161,000
|
|
150,691
|
|
0.003
|
|
477,000
|
|
92%
|
|||||||||
|
Wharf
(9)
|
11,791
|
|
0.032
|
|
374,135
|
|
14,984
|
|
0.023
|
|
337,955
|
|
26,775
|
|
0.027
|
|
712,090
|
|
80%
|
|||||||||
|
Total Gold
|
109,451
|
|
819,243
|
|
79,939
|
|
1,620,248
|
|
189,390
|
|
2,439,491
|
|
||||||||||||||||
|
Silver Reserves at December 31, 2014
(1)(2)(3)
|
||||||||||||||||||||||||||||
|
Proven Reserves
|
Probable Reserves
|
Proven and Probable Reserves
|
||||||||||||||||||||||||||
|
Tons (000s)
|
Grade (oz./ton)
|
Ounces (000s)
|
Tons (000s)
|
Grade (oz./ton)
|
Ounces (000s)
|
Tons (000s)
|
Grade (oz./ton)
|
Ounces (000s)
|
Metallurgical Recovery
|
|||||||||||||||||||
|
Palmarejo
(4)
|
1,089
|
|
3.37
|
|
3,670
|
|
5,627
|
|
4.80
|
|
27,007
|
|
6,716
|
|
4.57
|
|
30,677
|
|
81-83%
|
|||||||||
|
San Bartolomé
(6)
|
1,206
|
|
2.73
|
|
3,287
|
|
13,337
|
|
3.20
|
|
42,724
|
|
14,543
|
|
3.16
|
|
46,011
|
|
74-83%
|
|||||||||
|
Rochester
(5)
|
89,077
|
|
0.56
|
|
49,786
|
|
56,158
|
|
0.54
|
|
30,418
|
|
145,235
|
|
0.55
|
|
80,204
|
|
61%
|
|||||||||
|
Endeavor
(7)
|
1,323
|
|
1.82
|
|
2,411
|
|
1,102
|
|
2.24
|
|
2,469
|
|
2,425
|
|
2.01
|
|
4,880
|
|
50%
|
|||||||||
|
La Preciosa
(10)
|
18,830
|
|
3.16
|
|
59,534
|
|
21,851
|
|
2.71
|
|
59,196
|
|
40,681
|
|
2.92
|
|
118,730
|
|
84%
|
|||||||||
|
Total Silver
|
111,525
|
|
118,688
|
|
98,075
|
|
161,814
|
|
209,600
|
|
280,502
|
|
||||||||||||||||
|
Gold Reserves at December 31, 2014
(1)(2)(3)
|
||||||||||||||||||||||||||||
|
Proven Reserves
|
Probable Reserves
|
Proven and Probable Reserves
|
||||||||||||||||||||||||||
|
Tons (000s)
|
Grade (oz./ton)
|
Ounces
|
Tons (000s)
|
Grade (oz./ton)
|
Ounces
|
Tons (000s)
|
Grade (oz./ton)
|
Ounces
|
Metallurgical Recovery
|
|||||||||||||||||||
|
Kensington
(8)
|
417
|
|
0.188
|
|
78,281
|
|
2,986
|
|
0.185
|
|
551,081
|
|
3,403
|
|
0.185
|
|
629,362
|
|
95%
|
|||||||||
|
Palmarejo
(4)
|
1,089
|
|
0.043
|
|
46,423
|
|
5,627
|
|
0.078
|
|
441,287
|
|
6,716
|
|
0.073
|
|
487,710
|
|
85-87%
|
|||||||||
|
Rochester
(5)
|
89,077
|
|
0.004
|
|
346,000
|
|
56,158
|
|
0.003
|
|
172,000
|
|
145,235
|
|
0.004
|
|
518,000
|
|
92%
|
|||||||||
|
La Preciosa
(10)
|
18,830
|
|
0.006
|
|
110,940
|
|
21,851
|
|
0.004
|
|
91,139
|
|
40,681
|
|
0.005
|
|
202,079
|
|
61%
|
|||||||||
|
Total Gold
|
109,413
|
|
581,644
|
|
86,622
|
|
1,255,507
|
|
196,035
|
|
1,837,151
|
|
||||||||||||||||
|
(1)
|
Certain definitions:
|
The term “reserve” means that part of a mineral deposit that can be economically and legally extracted or produced at the time of the reserve determination.
29
The term “proven (measured) reserves” means reserves for which (a) quantity is computed from dimensions revealed in outcrops, trenches, workings or drill holes, grade and/or quality are computed from the results of detailed sampling; and (b) the sites for inspection, sampling and measurements are spaced so closely and the geologic character is sufficiently defined that size, shape, depth and mineral content of reserves are well established.
The term “probable (indicated) reserves” means reserves for which quantity and grade and/or quality are computed from information similar to that used for proven (measured) reserves, but the sites for inspection, sampling and measurement are farther apart or are otherwise less adequately spaced. The degree of assurance, although lower than that for proven (measured) reserves, is high enough to assume continuity between points of observation. Proven and probable reserves include silver attributable to Coeur’s ownership or economic interest in the Endeavor project.
The term “cutoff grade” means the lowest grade of mineralized material considered economic to process. Cutoff grades vary between deposits depending upon prevailing economic conditions, mineability of the deposit, by-products, amenability of the mineralized material to silver or gold extraction and type of milling or leaching facilities available.
|
(2)
|
Effective at December 31, 2015, except where otherwise noted. Assumed metal prices for estimated 2015 proven and probable reserves were $17.50/oz. silver and $1,250/oz. gold, except (a) the open pit, Rosario and lower 76 underground deposits at Palmarejo at $15.50 per ounce of silver and $1,150 per ounce of gold, (b) Endeavor at $2,400 per tonne zinc, $2,200 per tonne lead and $17.00 per ounce of silver. and (c) Wharf at $1,275 per ounce of gold. Proven and probable reserves (other than Endeavor) were also evaluated using $15.50 per ounce of silver and $1,150 per ounce of gold. It was determined that substantially all proven and probable reserves could be economically and legally extracted or produced at these lower price assumptions. Assumed metal prices for estimated 2014 proven and probable reserves were $19.00/oz. silver and $1,275/oz. gold except where otherwise noted.
|
|
(3)
|
Mineral reserve estimates, with the exception of Endeavor, were prepared by the Company's technical staff with the assistance of independent consulting firms. Endeavor mineral reserve estimates were prepared by the CBH Resources Ltd. staff and reviewed by the Company’s technical staff.
|
|
(4)
|
Calculated based on cutoff assuming the metal prices noted above except the open pit, Rosario, and lower 76 underground deposits at Palmarejo, the Guadalupe deposit, and the Independencia deposit, which assumed metal prices of $15.50/oz. silver and $1,150/oz. gold. The cutoff grades for mineral reserves range from 0.52 to 0.58 g/tonne AuEq. AuEq factor based on [($Price Au) / ($Price Ag)] x [(%Recovery Au)/(%Recovery Ag)] x [(%Payable Au)/(%Payable Ag)]
|
|
(5)
|
Calculated based on cutoff assuming the metal prices noted above. The cutoff grade for mineral reserves is 2.64 to 3.22 oz/ton AgEq.
|
|
(6)
|
Calculated based on cutoff assuming the metal prices noted above. The cutoff grades for mineral reserves range from 81 to 107 g/tonne Ag based on material.
|
|
(7)
|
Effective at July 1, 2015, thus excluding additions or depletions through December 31, 2015. Mineral reserves were estimated with a cutoff grade of 7.0% combined lead and zinc.
|
|
(8)
|
Calculated based on cutoff assuming the metal prices noted above. The cutoff grade for mineral reserves is 0.13 oz/ton Au.
|
|
(9)
|
Calculated based on cutoff assuming metal price of $1,275/oz. gold. The cutoff grade for mineral reserves is 0.012 oz/ton Au.
|
|
(10)
|
Calculated based on cutoff assuming the metal prices noted above. A Net Smelter Return ("NSR") cutoff of $16.88/tonne was used.
|
MINERALIZED MATERIAL
|
Mineralized Material at December 31, 2015
(1)(2)(3)(4)
|
||||||||
|
Tons (000s)
|
Silver Grade (oz./ton)
|
Gold Grade (oz./ton)
|
||||||
|
Palmarejo Mine, Mexico
(5)
|
5,922
|
|
4.27
|
|
0.056
|
|
||
|
San Bartolomé Mine, Bolivia
(6)
|
8,060
|
|
2.10
|
|
—
|
|
||
|
Kensington Mine, USA
(7)
|
1,832
|
|
—
|
|
0.283
|
|
||
|
Wharf Mine, USA
(8)
|
6,564
|
|
—
|
|
0.025
|
|
||
|
Rochester Mine, USA
(9)
|
140,951
|
|
0.48
|
|
0.003
|
|
||
|
Endeavor Mine, Australia
(10)
|
13,569
|
|
2.29
|
|
—
|
|
||
|
La Preciosa Project, Mexico
(11)
|
38,974
|
|
2.96
|
|
0.005
|
|
||
|
Joaquin Project, Argentina
(12)
|
10,252
|
|
5.02
|
|
0.004
|
|
||
|
Lejano Project, Argentina
(13)
|
631
|
|
3.09
|
|
0.011
|
|
||
|
Martha Property, Argentina
(14)
|
57
|
|
13.57
|
|
0.017
|
|
||
|
Total Mineralized Material
|
226,812
|
|
||||||
|
Mineralized Material at December 31, 2014
(1)(2)(3)(4)
|
||||||||
|
Tons (000s)
|
Silver Grade (oz./ton)
|
Gold Grade (oz./ton)
|
||||||
|
Palmarejo Mine, Mexico
(5)
|
4,971
|
|
4.78
|
|
0.084
|
|
||
|
San Bartolomé Mine, Bolivia
(6)
|
7,033
|
|
1.91
|
|
—
|
|
||
|
Kensington Mine, USA
(7)
|
1,566
|
|
—
|
|
0.244
|
|
||
|
Rochester Mine, USA
(9)
|
173,201
|
|
0.43
|
|
0.003
|
|
||
|
Endeavor Mine, Australia
(10)
|
12,897
|
|
2.33
|
|
—
|
|
||
|
La Preciosa Project, Mexico
(11)
|
7,114
|
|
1.63
|
|
0.003
|
|
||
|
Joaquin Project, Argentina
(12)
|
11,551
|
|
4.68
|
|
0.003
|
|
||
|
Lejano Project, Argentina
(13)
|
631
|
|
3.09
|
|
0.011
|
|
||
|
Martha Property, Argentina
(14)
|
57
|
|
13.57
|
|
0.017
|
|
||
|
Total Mineralized Material
|
219,021
|
|
||||||
|
(1)
|
Assumed metal prices for estimated 2015 mineralized material were $19.00/oz. silver and $1,275/oz. gold, except (a) Endeavor at $2,400 per tonne zinc, $2,200 per tonne lead and $17.00 per ounce of silver. and (b) Wharf at $1,350 per ounce of gold. 2015 mineralized material effective December 31, 2015, except where otherwise noted. Assumed metal prices for estimated 2014 mineralized material were $22.00/oz. silver and $1,300/oz. gold.
|
30
|
(2)
|
Estimated with mining cost parameters and initial metallurgical test results.
|
|
(3)
|
Estimates were prepared by a number of different consulting groups and supervised by the Company's personnel.
|
|
(4)
|
Estimated using 3-dimensional geologic modeling and geostatistical evaluation of the exploration drill data. Mineralized material is reported exclusive of reserves. “Mineralized material” as used in this Annual Report on Form 10-K, although permissible under Guide 7, does not indicate “reserves” by SEC standards. There is no certainty that any part of the reported mineralized material will ever be confirmed or converted into Guide 7 compliant “reserves”.
|
|
(5)
|
Calculated based on cutoff assuming the metal prices noted above. The cutoff grades for mineralized material range from 2.6 to 3.2 g/tonne AuEq. AuEq factor based on [($Price Au) / ($Price Ag)] x [(%Recovery Au)/(%Recovery Ag)] x [(%Payable Au)/(%Payable Ag)]
|
|
(6)
|
Calculated based on cutoff assuming the metal prices noted above. Cutoff grades for mineralized material range from 66 to 87 g/tonne Ag based on material.
|
|
(7)
|
Calculated based on cutoff assuming the metal prices noted above. The cutoff grade for mineralized material is 0.12 oz/ton Au.
|
|
(8)
|
Calculated based on cutoff assuming metal price of $1,350/oz. gold.
|
|
(9)
|
Calculated based on cutoff assuming the metal prices noted above. The cutoff grade for mineralized material is 0.48 to 0.52 oz/ton AgEq.
|
|
(10)
|
Effective July 1, 2015. Prepared by CBH Resources Ltd. staff and reviewed by the Company’s technical staff.
|
|
(11)
|
Calculated based on cutoff assuming the metal prices noted above. Cutoff grades for mineralized material range from 39 to 43 g/tonne Ag based on material.
|
|
(12)
|
No changes were made to cutoff grades in 2015 for the Joaquin project.
|
|
(13)
|
No changes were made to cutoff grades in 2015 for the Lejano project.
|
|
(14)
|
No changes were made to cutoff grades in 2015 for the Martha project.
|
|
Item 3.
|
Legal Proceedings
|
For a discussion of legal proceedings, see Note 21 -- Commitments and Contingencies in the notes to the consolidated financial statements included herein.
Item 4.
Mine Safety Disclosures
Information pertaining to mine safety matters is reported in accordance with Section 1503(a) of the Dodd-Frank Wall Street Reform and Consumer Protection Act in Exhibit 95.1 attached to this Form 10-K.
31
|
Item 5.
|
Market for Registrant’s Common Equity, Related Stockholder Matters and Issuer Purchases of Equity Securities
|
The following table sets forth, for the periods indicated, the high and low closing sales prices of the common stock as reported by the New York Stock Exchange:
|
|
2015
|
2014
|
|||||||||||||
|
|
High
|
Low
|
High
|
Low
|
|||||||||||
|
First Quarter
|
$
|
7.27
|
|
$
|
4.44
|
|
$
|
11.92
|
|
$
|
9.29
|
|
|||
|
Second Quarter
|
$
|
6.33
|
|
$
|
4.71
|
|
$
|
9.63
|
|
$
|
6.69
|
|
|||
|
Third Quarter
|
$
|
5.81
|
|
$
|
2.70
|
|
$
|
9.28
|
|
$
|
4.96
|
|
|||
|
Fourth Quarter
|
$
|
3.34
|
|
$
|
2.41
|
|
$
|
5.28
|
|
$
|
3.40
|
|
|||
|
2016
|
|
|
|
|
|||||||||||
|
First Quarter through February 9, 2016
|
$
|
2.61
|
|
$
|
1.73
|
|
|||||||||
The Company has not paid cash dividends on its common stock since 1996. Future dividends, if any, will be determined by the Company’s Board of Directors and will depend upon the Company’s results of operations, financial condition, capital requirements and other factors.
On February 9, 2016, there were outstanding 152,597,110 shares of the Company’s common stock which were held by approximately 1,564 stockholders of record.
32
STOCK PERFORMANCE CHART
COMPARISON OF 5 YEAR CUMULATIVE TOTAL RETURN
AMONG COEUR MINING, S&P 500 INDEX AND PEER GROUP INDEX
The following performance graph compares the performance of the Company's common stock during the period beginning December 31, 2010 and ending December 31, 2015 to the S&P 500 and a Peer Group Index consisting of the following companies: Agnico-Eagle Mines Limited, Alamos Gold Inc., Allied Nevada Gold Corporation, Centerra Gold Inc., First Majestic Silver, Hecla Mining Company, Hochschild Mining, New Gold, Pan American Silver Corporation, Silver Standard Resources, Inc., and Stillwater Mining Company. AuRico Gold, Inc. merged with Alamos Gold Inc. in 2015 and is included separately in prior year periods.
The graph assumes a $100 investment in the Company's common stock and in each of the indexes at the beginning of the period, and a reinvestment of dividends paid on such investments throughout the five-year period.
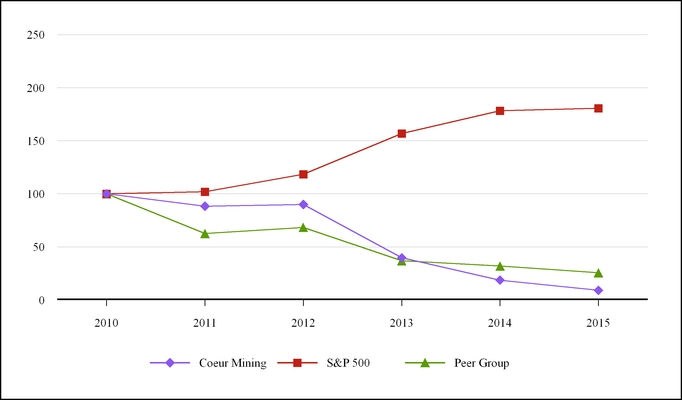
|
Dec.
2011
|
Dec.
2012
|
Dec.
2013
|
Dec.
2014
|
Dec.
2015
|
||||||
|
Coeur Mining
|
88.36
|
|
90.04
|
|
39.71
|
|
18.70
|
|
9.08
|
|
|
S&P 500 Index
|
102.11
|
|
118.45
|
|
156.82
|
|
178.28
|
|
180.75
|
|
|
Peer Group
|
62.56
|
|
68.35
|
|
36.88
|
|
31.94
|
|
25.56
|
|
This stock performance information is “furnished” and shall not be deemed to be “soliciting material” or subject to Rule 14A, shall not be deemed “filed” for purposes of Section 18 of the Exchange Act or otherwise subject to the liabilities of that section, and shall not be deemed incorporated by reference in any filing under the Securities Act of 1933, as amended, or the Exchange Act, whether made before or after the date of this report and irrespective of any general incorporation by reference language in any such filing, except to the extent that it specifically incorporates the information by reference.
33
|
Item 6.
|
Selected Financial Data
|
The following table summarizes certain selected consolidated financial data with respect to the Company and should be read in conjunction with the Consolidated Financial Statements and Notes thereto appearing elsewhere in this report.
|
Year ended December 31,
|
||||||||||||||||||||
|
2015
|
2014
|
2013
|
2012
|
2011
|
||||||||||||||||
|
Revenue
|
$
|
646,086
|
|
$
|
635,742
|
|
$
|
745,994
|
|
$
|
895,492
|
|
$
|
1,021,200
|
|
|||||
|
Costs applicable to sales
|
479,654
|
|
477,945
|
|
463,663
|
|
454,562
|
|
419,547
|
|
||||||||||
|
Net income (loss)
|
$
|
(367,183
|
)
|
$
|
(1,186,874
|
)
|
$
|
(650,563
|
)
|
$
|
48,677
|
|
$
|
93,499
|
|
|||||
|
Basic net income (loss) per share
|
$
|
(2.83
|
)
|
$
|
(11.59
|
)
|
$
|
(6.65
|
)
|
$
|
0.54
|
|
$
|
1.05
|
|
|||||
|
Diluted net income (loss) per share
|
$
|
(2.83
|
)
|
$
|
(11.59
|
)
|
$
|
(6.65
|
)
|
$
|
0.54
|
|
$
|
1.04
|
|
|||||
|
At December 31,
|
||||||||||||||||||||
|
2015
|
2014
|
2013
|
2012
|
2011
|
||||||||||||||||
|
Total assets
|
$
|
1,332,489
|
|
$
|
1,436,569
|
|
$
|
2,885,978
|
|
$
|
3,221,401
|
|
$
|
3,264,441
|
|
|||||
|
Reclamation and mine closure liabilities
|
$
|
85,268
|
|
$
|
70,814
|
|
$
|
58,428
|
|
$
|
35,338
|
|
$
|
33,758
|
|
|||||
|
Debt, including current portion
|
$
|
490,410
|
|
$
|
468,546
|
|
$
|
297,823
|
|
$
|
55,730
|
|
$
|
146,574
|
|
|||||
|
Stockholders’ equity
|
$
|
421,476
|
|
$
|
554,328
|
|
$
|
1,730,567
|
|
$
|
2,198,280
|
|
$
|
2,136,721
|
|
|||||
34
Item 7.
Management's Discussion and Analysis of Financial Condition and Results of Operations
The following discussion provides information that management believes is relevant to an assessment and understanding of the consolidated financial condition and results of operations of Coeur Mining, Inc. and its subsidiaries (collectively "the Company", "our", or "we"). We use certain non-GAAP financial performance measures in Management's Discussion and Analysis ("MD&A") such as costs applicable to sales, all-in sustaining costs, and adjusted net income (loss). For a detailed description of each of these non-GAAP measures, please see "Non-GAAP Financial Performance Measures" at the end of this item.
We provide some operational and financial data on a silver equivalent basis, converting gold to silver at a 60:1 ratio of silver ounces to gold ounces. We also provide some silver equivalent data using a ratio determined by the actual ratio of average realized silver and gold prices during the relevant period. Silver and gold equivalence are stated using the 60:1 ratio unless otherwise noted.
Overview
We are a gold and silver producer with mines located in the United States, Mexico, and Bolivia and exploration projects in Mexico and Argentina. The Palmarejo complex, the Rochester, Kensington, Wharf, and San Bartolomé mines constitute our principal sources of revenue. The Company also owns Coeur Capital, which is primarily comprised of the Endeavor silver stream as well as other precious metal royalties and strategic investments.
The Company's strategy is to discover, acquire, develop and operate low-cost silver and gold mines that produce long-term cash flow, provide opportunities for growth through continued exploration, and generate superior and sustainable returns for stockholders. Management focuses on maximizing net cash flow through identifying and implementing revenue enhancement opportunities, reducing operating and non-operating costs, consistent capital discipline, and efficient working capital management.
2015 Highlights
|
•
|
Metal sales of
$639.2 million
and royalty revenue of
$6.9 million
|
|
•
|
Production of
35.6 million
silver equivalent ounces, consisting of
15.9 million
silver ounces and
327,908
gold ounces
|
|
•
|
Costs applicable to sales were
$13.23
per silver equivalent ounce (
$12.31
per silver equivalent ounce using average realized price equivalency) and
$768
per gold equivalent ounce (see "Non-GAAP Financial Performance Measures")
|
|
•
|
All-in sustaining costs were
$16.50
per silver equivalent ounce (
$14.62
per silver equivalent ounce using average realized price equivalency) (see "Non-GAAP Financial Performance Measures")
|
|
•
|
General and administrative expenses reduced
20%
from 2014 to
$32.8 million
|
|
•
|
Adjusted net loss of
$96.6 million
or
$0.75
per share (see "Non-GAAP Financial Performance Measures")
|
|
•
|
Capital expenditures of
$95.2 million
, including $16.6 million of development capital at Guadalupe, $11.8 million for tunnel development to the high-grade Independencia deposit at Palmarejo, $11.3 million for crusher expansion at Rochester, and $8.0 million for tunnel development to the high-grade Jualin deposit at Kensington
|
|
•
|
Cash and cash equivalents of
$200.7 million
at December 31, 2015
|
|
•
|
Completed the cash acquisition of Wharf for
$99.4 million
and the Paramount acquisition for
$201.4 million
in common stock and cash
|
Consolidated Performance
Net
loss
was
$367.2 million
for 2015 compared to
Net
loss
of
$1,186.9 million
in 2014. The
lower
Net loss
in 2015 is primarily due to lower write-downs, higher gold ounces sold, lower costs applicable to sales per silver and gold ounce, and lower general and administrative expenses, partially offset by lower average realized silver and gold prices and lower silver ounces sold.
The Company produced
15.9 million
ounces of silver and
327,908
ounces of gold in 2015, compared to
17.2 million
ounces of silver and
249,384
ounces of gold in 2014. Silver production
decreased
due to lower throughput at Palmarejo and San Bartolomé, partially offset by higher grade and tons placed at Rochester. Gold production
increased
in 2015 due to the acquisition of Wharf and higher throughput at Kensington.
Costs applicable to sales were
$13.23
per silver equivalent ounce and
$768
per gold equivalent ounce in 2015 compared to
$14.71
per silver equivalent ounce and
$951
per gold ounce in 2014. Costs applicable to sales per silver equivalent ounce
decreased
in 2015 due to lower unit costs at Rochester and Palmarejo. Costs applicable to sales per gold equivalent ounce
decreased
in 2015 due to lower unit costs at Kensington and the addition of Wharf.
35
|
Year ended December 31,
|
|||||||||||
|
2015
|
2014
|
2013
|
|||||||||
|
Silver ounces produced
|
15,900,614
|
|
17,188,425
|
|
16,948,451
|
|
|||||
|
Gold ounces produced
|
327,908
|
|
249,384
|
|
259,347
|
|
|||||
|
Silver equivalent ounces produced
|
35,575,094
|
|
32,151,465
|
|
32,509,271
|
|
|||||
|
Silver ounces sold
|
16,506,819
|
|
17,423,662
|
|
17,105,259
|
|
|||||
|
Gold ounces sold
|
335,882
|
|
242,655
|
|
263,048
|
|
|||||
|
Silver equivalent ounces sold
|
36,659,759
|
|
31,982,962
|
|
32,888,139
|
|
|||||
|
Average realized price per silver ounce
|
$
|
15.46
|
|
$
|
18.87
|
|
$
|
23.94
|
|
||
|
Average realized price per gold ounce
|
$
|
1,143
|
|
$
|
1,252
|
|
$
|
1,327
|
|
||
|
Costs applicable to sales per silver equivalent ounce
(1)
|
$
|
13.23
|
|
$
|
14.71
|
|
$
|
13.85
|
|
||
|
Costs applicable to sales per realized silver equivalent ounce
(1)(2)
|
$
|
12.31
|
|
$
|
14.24
|
|
$
|
14.22
|
|
||
|
Costs applicable to sales per gold equivalent ounce
(1)
|
$
|
768
|
|
$
|
951
|
|
$
|
901
|
|
||
|
All-in sustaining costs per silver equivalent ounce
(1)
|
$
|
16.50
|
|
$
|
19.72
|
|
$
|
19.83
|
|
||
|
All-in sustaining costs per realized silver equivalent ounce
(1)(2)
|
$
|
14.62
|
|
$
|
18.81
|
|
$
|
20.34
|
|
||
|
(1)
|
See "Non-GAAP Financial Performance Measures."
|
|
(2)
|
Equivalent ounces calculated using average realized prices.
|
2016 Guidance
Through our focus on operational excellence, cost reduction initiatives, and capital discipline, we expect to achieve the following in 2016:
|
•
|
Silver equivalent production of 33.8 - 36.8 million ounces, consisting of 14.6 - 16.0 million ounces of silver and 320,000 - 347,000 ounces of gold
|
|
•
|
Costs applicable to sales per silver equivalent ounce of $12.50 - $13.50 at Palmarejo, $11.25 - $12.25 at Rochester, and $13.50 - $14.25 at San Bartolomé
|
|
•
|
Costs applicable to sales of $825 - $875 per gold ounce at Kensington and $650 - $750 per gold equivalent ounce at Wharf
|
|
•
|
All-in sustaining costs per silver equivalent ounce of $16.00 - $17.25
|
|
•
|
Capital expenditures of $90 - $100 million, including $22.5 million of development capital for the Palmarejo complex and Kensington underground development
|
|
•
|
General and administrative expense of $28 - $32 million
|
|
•
|
Exploration expense of $11 - $13 million
|
36
Consolidated Financial Results
2015 compared to 2014
Revenue
Metal sales increased
2%
due to higher gold ounces sold, partially offset by lower average realized silver and gold prices and lower silver ounces sold. The Company realized average silver and gold prices of
$15.46
per ounce and
$1,143
per ounce, respectively, compared with average realized prices of
$18.87
per ounce and
$1,252
per ounce, respectively. The Company sold
16.5 million
silver ounces and
335,882
gold ounces, compared to sales of
17.4 million
silver ounces and
242,655
gold ounces. Gold contributed 60% of sales and silver contributed 40%, compared to 48% of sales from gold and 52% from silver. Royalty revenue
increased
$3.6 million
due to commencement of production at the Correnso mine, as well as higher production from Cerro Bayo and El Gallo.
Costs Applicable to Sales
Costs applicable to sales were consistent due to lower unit costs at all sites and lower silver ounces sold offset by higher gold ounces sold. For a complete discussion of costs applicable to sales, see
Results of Operations
below.
Amortization
Amortization
decreased
by
$18.7 million
, or
12%
, primarily due to lower amortizable mineral interests and mining equipment, partially offset by higher silver equivalent production.
Expenses
General and administrative expenses
decreased
$8.0 million
, or
20%
, primarily due to lower compensation and professional services costs.
Exploration expense
decreased
$10.1 million
, or
46%
, due to decreased drilling activity at Palmarejo, Kensington, and Rochester.
Pre-development, reclamation, and other expenses
decreased
32%
to
$17.8 million
, primarily due to the completion of the La Preciosa feasibility study in 2014.
Write-downs were
$313.3 million
(
$276.5 million
after tax) compared to
$1,472.7 million
($1,021.8 million net of tax). The non-cash impairment charges were largely driven by decreases in long-term metal price assumptions and revised mine plans in the fourth quarter. The 2015 write-down was primarily related to the Palmarejo complex, San Bartolomé, and Coeur Capital.
Other Income and Expenses
Non-cash fair value adjustments, net, were a
gain
of
$5.2 million
compared to a
gain
of
$3.6 million
, primarily due to the impact of changes in future metal prices on the Palmarejo gold production royalty and the Rochester 3.4% NSR royalty obligation.
Interest expense (net of capitalized interest of
$3.1 million
)
decreased
to
$45.7 million
from
$47.5 million
primarily due to the write-off of costs associated with the termination of a former revolving credit facility in 2014, lower accretion of the Palmarejo gold production royalty obligation, and higher capitalized interest, partially offset by interest expense associated with additional borrowings.
Other, net
decreased
by
$5.2 million
, primarily due to changes in foreign currency exchange rates mostly offset by a gain on the exchange of 7.875% Senior Notes due 2021 (the "Senior Notes") for common stock.
37
Income and Mining Taxes
In 2015, the Company reported estimated income and mining tax
benefit
of approximately
$26.3 million
, for an effective tax rate of 6.7%. Estimated income and mining tax
benefit
in 2014 was
$428.3 million
, for an effective tax rate of 26.5%. The following table summarizes the components of the Company’s income (loss) before tax and income and mining tax (expense) benefit:
|
|
Year ended December 31, 2015
|
Year ended December 31, 2014
|
|||||||||||
|
In thousands
|
Income (loss) before tax
|
Tax (expense) benefit
|
Income (loss) before tax
|
Tax (expense) benefit
|
|||||||||
|
United States
|
$
|
(43,924
|
)
|
$
|
(527
|
)
|
$
|
(213,883
|
)
|
$
|
(482
|
)
|
|
|
Argentina
|
(3,869
|
)
|
(482
|
)
|
(82,093
|
)
|
24,408
|
|
|||||
|
Mexico
|
(250,054
|
)
|
26,713
|
|
(1,204,983
|
)
|
384,099
|
|
|||||
|
Bolivia
|
(76,739
|
)
|
(5,154
|
)
|
(107,547
|
)
|
18,114
|
|
|||||
|
Other jurisdictions
|
(18,860
|
)
|
5,713
|
|
(6,622
|
)
|
2,115
|
|
|||||
|
$
|
(393,446
|
)
|
$
|
26,263
|
|
$
|
(1,615,128
|
)
|
$
|
428,254
|
|
||
The Company’s effective tax rate is impacted by recurring items, such as foreign exchange rates on deferred tax balances, the impacts of mineral interest impairments, the full valuation allowance on the deferred tax assets relating to losses in the United States and certain foreign jurisdictions, mining tax expense and uncertain tax position accruals. In addition, the Company's consolidated effective income tax rate is a function of the combined effective tax rates and foreign exchange rates in the jurisdictions in which it operates. Variations in the jurisdictional mix of income and loss and foreign exchange rates result in significant fluctuations in its consolidated effective tax rate.
A valuation allowance is provided for deferred tax assets for which it is more likely than not that the related benefits will not be realized. Each quarter, the Company analyzes its deferred tax assets and if it is determined that the Company will not realize all or a portion of its deferred tax assets, it will record or increase a valuation allowance. Conversely, if it is determined that the Company will ultimately be able to realize all or a portion of the related benefits for which a valuation allowance has been provided, all or a portion of the related valuation allowance will be reduced. There are a number of risk factors that could impact the Company’s ability to realize its deferred tax assets.
Likewise, there are a number of factors that can potentially impact the Company’s effective tax, including the geographic distribution of income, the non-recognition of tax assets, changes in tax laws, and the impact of specific transactions.
2014 compared to 2013
Revenue
Metal sales decreased by $113.5 million, or 15%, to $632.5 million due to lower average realized silver and gold prices and lower gold ounces sold as a result of shipping delays from the Kensington mine due to a labor dispute affecting ports on the west coast of the U.S. The Company sold 17.4 million silver ounces and 242,655 gold ounces, compared to sales of 17.1 million silver ounces and 263,048 gold ounces. The Company realized average silver and gold prices of $18.87 per ounce and $1,252 per ounce, respectively, compared to average realized prices of $23.94 per ounce and $1,327 per ounce, respectively. Silver contributed 52% of sales and gold contributed 48%, compared to 53% of sales from silver and 47% from gold. Royalty revenue increased $3.2 million, primarily due to the acquisition of royalty assets by Coeur Capital in the fourth quarter of 2013.
Costs Applicable to Sales
Costs applicable to sales increased by $14.3 million, or 3%, to $477.9 million. The increase in costs applicable to sales is primarily due to higher production at Rochester. For a complete discussion of costs applicable to sales, see "Results of Operations" below.
Amortization
Amortization decreased by $67.1 million, or 29%, primarily due to lower amortizable mineral interests and mining equipment as a result of the 2013 write-downs at the Palmarejo and Kensington mines.
Expenses
General and administrative expenses decreased $14.5 million, or 26%, primarily due to lower relocation costs compared to 2013.
38
Exploration expense decreased 3% to $21.7 million, primarily as a result of reduced exploration activity near the Company’s Joaquin project in Argentina, mostly offset by higher exploration at Kensington.
The $32.0 million
Litigation settlement
in 2013 relates to the settlement of a mining claims dispute at Rochester. In connection with the settlement, Coeur Rochester acquired all mining claims in dispute in exchange for a one-time $10.0 million cash payment and granting a 3.4% NSR royalty on up to 39.4 million silver equivalent ounces from the Rochester mine beginning January 1, 2014.
Pre-development, reclamation, and other expenses increased 72% to $26.0 million, primarily due to La Preciosa feasibility study costs, which was completed in July 2014.
Write-downs were $1,472.7 million ($1,021.8 million after tax) compared to $773.0 million ($504.5 million after tax). The non-cash impairment charges were largely driven by significant decreases in long-term metal price assumptions and revised mine plans in the fourth quarter. The 2014 write-down was primarily related to the Palmarejo, Kensington, and San Bartolomé mines and the La Preciosa and Joaquin exploration projects.
Other Income and Expenses
Non-cash fair value adjustments, net, reflected a gain of
$3.6 million
compared to a gain of $82.8 million, primarily due to changes in future metal prices on the Palmarejo gold production royalty and the Rochester 3.4% NSR royalty obligation.
Other, net was consistent as a higher other-than-temporary impairment of strategic investments in 2013 was partially offset by a gain on the substitution of certain reclamation bonds for restricted cash in 2013.
Interest expense (net of capitalized interest) increased to $47.5 million from $41.3 million primarily due to the March 2014 issuance of an additional $150 million of the Senior Notes and the write-off of costs associated with a credit agreement terminated in 2014.
Income and Mining Taxes
The Company reported an income and mining tax benefit of approximately $428.3 million compared to income and mining tax benefit of $158.1 million. The following table summarizes the components of the Company’s income (loss) before tax and income and mining tax (expense) benefit:
|
|
Year ended December 31, 2014
|
Year ended December 31, 2013
|
|||||||||||
|
In thousands
|
Income (loss) before tax
|
Tax (expense) benefit
|
Income (loss) before tax
|
Tax (expense) benefit
|
|||||||||
|
United States
|
$
|
(213,883
|
)
|
$
|
(482
|
)
|
$
|
(242,562
|
)
|
$
|
78,176
|
|
|
|
Argentina
|
(82,093
|
)
|
24,408
|
|
(8,814
|
)
|
7,925
|
|
|||||
|
Mexico
|
(1,204,983
|
)
|
384,099
|
|
(592,111
|
)
|
85,805
|
|
|||||
|
Bolivia
|
(107,547
|
)
|
18,114
|
|
36,280
|
|
(10,938
|
)
|
|||||
|
Other jurisdictions
|
(6,622
|
)
|
2,115
|
|
(1,472
|
)
|
(2,852
|
)
|
|||||
|
$
|
(1,615,128
|
)
|
$
|
428,254
|
|
$
|
(808,679
|
)
|
$
|
158,116
|
|
||
The Company’s effective tax rate is impacted by recurring items, such as foreign exchange rates on deferred tax balances, the impacts of mineral interest impairments, mining tax expense and uncertain tax position accruals. In 2013, the Company asserted its intention to permanently reinvest earnings from Mexico, recording an income tax benefit of $81.0 million. In addition, the Company's consolidated effective income tax rate is a function of the combined effective tax rates and foreign exchange rates in the jurisdictions in which it operates. Variations in the jurisdictional mix of income and loss and foreign exchange rates result in significant fluctuations in its consolidated effective tax rate.
39
Results of Operations
Palmarejo
|
Year ended December 31,
|
|||||||||||
|
2015
|
2014
|
2013
|
|||||||||
|
Tons milled
|
1,616,668
|
|
2,135,088
|
|
2,322,660
|
|
|||||
|
Silver ounces produced
|
5,148,612
|
|
6,558,091
|
|
7,603,144
|
|
|||||
|
Gold ounces produced
|
70,922
|
|
86,673
|
|
116,536
|
|
|||||
|
Silver equivalent ounces produced
|
9,403,932
|
|
11,758,471
|
|
14,595,304
|
|
|||||
|
Costs applicable to sales/oz
(1)
|
$
|
14.07
|
|
$
|
15.40
|
|
$
|
13.25
|
|
||
|
Costs applicable to sales/oz
(2)
|
$
|
12.75
|
|
$
|
14.69
|
|
$
|
13.75
|
|
||
|
(1)
|
See Non-GAAP Financial Performance Measures.
|
|
(2)
|
Equivalent ounces calculated using average realized prices. See Non-GAAP Financial Performance Measures.
|
2015 compared to 2014
Silver equivalent production
decreased
20%
due to planned lower mill throughput as the mine continues its transition to a lower tonnage, higher grade underground operation from a predominantly open pit operation. Metal sales were
$169.1 million
, or
27%
of Coeur's metal sales, compared with
$244.0 million
, or
39%
of Coeur's metal sales due to lower production and the addition of Wharf. Costs applicable to sales per ounce
decreased
as a result of lower waste tons mined, lower milling, diesel, and consumables costs, favorable currency exchange rates, and lower maintenance costs due to the wind-down of open pit mining. Amortization decreased to
$32.4 million
compared to
$69.4 million
due to lower production and amortizable mineral interests and mining equipment. Capital expenditures increased to
$36.0 million
compared to
$26.1 million
due to underground development of the Guadalupe and Independencia deposits.
2014 compared to 2013
Silver equivalent production decreased due primarily to lower ore grades and mill throughput. Metal sales were $244.0 million, or 39% of metal sales, compared with $324.0 million, or 43% of metal sales. Costs applicable to sales per ounce increased due to lower production, higher underground mining and maintenance costs, an $11.3 million inventory adjustment, and the new 0.5% revenue mining duty. Amortization decreased to $69.4 million compared to $133.5 million due to lower amortizable mineral interests and mining equipment, and lower production. Capital expenditures decreased to $26.1 million compared to $33.7 million.
Rochester
|
Year ended December 31,
|
|||||||||||
|
2015
|
2014
|
2013
|
|||||||||
|
Tons placed
|
16,414,302
|
|
14,739,808
|
|
12,311,918
|
|
|||||
|
Silver ounces produced
|
4,630,738
|
|
4,189,071
|
|
2,798,937
|
|
|||||
|
Gold ounces produced
|
52,588
|
|
44,888
|
|
30,860
|
|
|||||
|
Silver equivalent ounces produced
|
7,786,018
|
|
6,882,351
|
|
4,650,537
|
|
|||||
|
Costs applicable to sales/oz
(1)
|
$
|
12.41
|
|
$
|
14.49
|
|
$
|
15.54
|
|
||
|
Costs applicable to sales/oz
(2)
|
$
|
11.32
|
|
$
|
13.94
|
|
$
|
16.04
|
|
||
|
(1)
|
See Non-GAAP Financial Performance Measures.
|
|
(2)
|
Equivalent ounces calculated using average realized prices. See Non-GAAP Financial Performance Measures.
|
2015 compared to 2014
Silver equivalent production
increased
13%
as a result of higher tons placed, higher silver grades, and timing of recoveries. Metal sales were
$143.9 million
, or
23%
of Coeur’s metal sales, compared with
$123.8 million
, or
20%
of Coeur's metal sales. Costs applicable to sales per ounce
decreased
due to higher production, lower diesel costs, and lower equipment rentals. Amortization was
$23.9 million
compared to
$20.8 million
due to higher production. Capital expenditures were
$25.3 million
compared to
$11.9 million
due to in-pit crusher expansion and Stage III buttress construction.
40
2014 compared to 2013
Silver equivalent production increased substantially as a result of higher tons placed and higher gold grade. Metal sales were $123.8 million, or 20% of Coeur’s metal sales, compared with $119.3 million, or 16% of metal sales. Costs applicable to sales per ounce decreased 7% due to higher production and lower mining costs, partially offset by higher leaching and maintenance costs. Amortization was $20.8 million compared to $8.9 million due to higher production. Capital expenditures decreased to $11.9 million compared to $29.4 million as the Stage III leach pad expansion was completed in 2013.
Kensington
|
Year ended December 31,
|
|||||||||||
|
2015
|
2014
|
2013
|
|||||||||
|
Tons milled
|
660,464
|
|
635,960
|
|
553,717
|
|
|||||
|
Gold ounces produced
|
126,266
|
|
117,823
|
|
111,951
|
|
|||||
|
Costs applicable to sales/oz
(1)
|
$
|
803
|
|
$
|
951
|
|
$
|
901
|
|
||
|
(1)
|
See Non-GAAP Financial Performance Measures.
|
2015 compared to 2014
Gold production
increased
7%
due to higher grade and mill throughput. Metal sales were
$148.7 million
, or
23%
of Coeur's metal sales, compared to
$137.0 million
, which represented
22%
of Coeur’s metal sales. Costs applicable to sales per ounce
decreased
due to higher production, lower diesel costs, and lower contract mining services. Amortization was
$42.2 million
compared to
$43.6 million
due to lower amortizable mineral interests and mining equipment, partially offset by higher production. Capital expenditures were
$23.8 million
compared to
$16.2 million
due to underground development of the high grade Jualin deposit.
2014 compared to 2013
Gold production increased due to higher mill throughput, partially offset by lower grade. Metal sales were $137.0 million, or 22% of metal sales, compared to $148.8 million, which represented 20% of Coeur’s metal sales. Metal sales were negatively impacted by delayed gold shipments from the mine due to a labor dispute affecting ports on the west coast of the U.S. Costs applicable to sales per ounce increased due to higher mining and water treatment costs. Amortization was $43.6 million compared to $62.8 million due to lower amortizable mineral interests and mining equipment. Capital expenditures were $16.2 million compared to $21.4 million.
Wharf
|
Year ended December 31,
|
|||||||||||
|
2015
(1)
|
2014
|
2013
|
|||||||||
|
Tons placed
|
3,600,279
|
|
—
|
|
—
|
|
|||||
|
Silver ounces produced
|
55,744
|
|
—
|
|
—
|
|
|||||
|
Gold ounces produced
|
78,132
|
|
—
|
|
—
|
|
|||||
|
Gold equivalent ounces produced
(2)
|
79,061
|
|
—
|
|
$
|
—
|
|
||||
|
Costs applicable to sales/oz
(2)
|
$
|
706
|
|
$
|
—
|
|
$
|
—
|
|
||
|
(1)
|
Amounts are post-acquisition (February 20, 2015).
|
|
(2)
|
See Non-GAAP Financial Performance Measures.
|
Gold production was
78,132
ounces in the post-acquisition period after February 20, 2015. Metal sales were
$84.1 million
, or
13%
of Coeur's metal sales. Costs applicable to sales were
$706
per ounce, and amortization was
$16.4 million
. Capital expenditures were
$3.2 million
and primarily consisted of pad re-lining and capitalized drilling.
41
San Bartolomé
|
Year ended December 31,
|
|||||||||||
|
2015
|
2014
|
2013
|
|||||||||
|
Tons milled
|
1,713,079
|
|
1,749,423
|
|
1,679,839
|
|
|||||
|
Silver ounces produced
|
5,436,353
|
|
5,851,678
|
|
5,940,538
|
|
|||||
|
Costs applicable to sales/oz
(1)
|
$
|
13.80
|
|
$
|
14.29
|
|
$
|
14.28
|
|
||
|
(1)
|
See Non-GAAP Financial Performance Measures.
|
2015 compared to 2014
Silver production
decreased
7%
due to a three-week shutdown in July as a result of political protests and lower recoveries, partially offset by higher grade supplemental ore purchases. Silver sales were
$84.7 million
, or
13%
of Coeur's metal sales, compared with
$117.7 million
, or
19%
of Coeur's metal sales. Costs applicable to sales per ounce was lower due to lower revenue-based royalty payments. Amortization was
$17.8 million
compared to
$19.4 million
due to lower production. Capital expenditures were
$6.2 million
compared to
$7.9 million
.
2014 compared to 2013
Silver production decreased slightly due to lower grade, partly offset by higher mill throughput. Silver sales were $117.7 million, or 19%
of metal sales, compared with $141.7 million, or 19% of metal sales. Costs applicable to sales per ounce were mostly unchanged. Amortization was $19.4 million compared to $19.1 million. Capital expenditures were $7.9 million compared to $11.6 million.
Coeur Capital
|
Year ended December 31,
|
|||||||||||
|
Endeavor Silver Stream
|
2015
|
2014
|
2013
|
||||||||
|
Tons milled
|
767,314
|
|
792,694
|
|
791,116
|
|
|||||
|
Silver ounces produced
|
629,167
|
|
589,585
|
|
605,832
|
|
|||||
|
Costs applicable to sales/oz
(1)
|
$
|
5.72
|
|
$
|
7.17
|
|
$
|
9.61
|
|
||
|
(1)
|
See Non-GAAP Financial Performance Measures.
|
2015 compared to 2014
Silver production
increased
due to higher grade, partially offset by lower throughput. Costs applicable to sales per ounce
decreased
due to the impact of lower silver prices on the Company's silver price sharing agreement with the Endeavor mine operator. Royalty revenue was
$6.9 million
compared to
$3.2 million
primarily due to commencement of production from Correnso, as well as higher production from Cerro Bayo and El Gallo. Amortization was
$9.0 million
compared to
$7.0 million
due to higher production.
2014 compared to 2013
Silver production decreased due to lower grade. Royalty revenue was $3.2 million compared to nil, primarily due to the acquisition of Global Royalty Corp. in December 2013. Costs applicable to sales per ounce decreased due to the impact of lower silver prices on the Endeavor silver stream's price sharing agreement. Amortization increased to $7.0 million compared to $3.8 million due to depletion of royalty interests in 2014.
42
Liquidity and Capital Resources
Cash Provided by Operating Activities
Net cash provided by operating activities was
$113.5 million
,
$53.5 million
, and
$114.0 million
in 2015, 2014, and 2013, respectively, and was impacted by the following key factors:
|
Year ended December 31,
|
|||||||||||
|
2015
|
2014
|
2013
|
|||||||||
|
Consolidated silver equivalent ounces sold
|
36,659,759
|
|
31,982,962
|
|
32,888,139
|
|
|||||
|
Average realized price per silver equivalent ounce
|
$
|
17.62
|
|
$
|
19.88
|
|
$
|
22.68
|
|
||
|
Costs applicable to sales per consolidated silver equivalent ounce
|
(13.08
|
)
|
(14.94
|
)
|
(14.10
|
)
|
|||||
|
Operating margin per consolidated silver equivalent ounce
|
$
|
4.54
|
|
$
|
4.94
|
|
$
|
8.58
|
|
||
|
(1)
|
See Non-GAAP Financial Performance Measures.
|
|
|
Year ended December 31,
|
||||||||||
|
In thousands
|
2015
|
2014
|
2013
|
||||||||
|
Cash flow before changes in operating assets and liabilities
|
$
|
70,019
|
|
$
|
31,046
|
|
$
|
150,348
|
|
||
|
Changes in operating assets and liabilities:
|
|||||||||||
|
Receivables
|
17,560
|
|
(11,611
|
)
|
663
|
|
|||||
|
Prepaid expenses and other
|
(3,063
|
)
|
5,635
|
|
(15,165
|
)
|
|||||
|
Inventories
|
19,573
|
|
12,971
|
|
4,031
|
|
|||||
|
Accounts payable and accrued liabilities
|
9,453
|
|
15,507
|
|
(25,910
|
)
|
|||||
|
CASH PROVIDED BY OPERATING ACTIVITIES
|
$
|
113,542
|
|
$
|
53,548
|
|
$
|
113,967
|
|
||
Cash provided by operating activities increased
$60.0 million
in 2015 compared to 2014 due to higher silver equivalent ounces sold and lower costs applicable to sales per silver equivalent ounce, partially offset by lower average realized prices. Metal sales for 2015 increased $92.4 million due to higher silver equivalent ounces sold, mostly offset by a $85.9 million reduction due to lower average realized prices. The
$43.5 million
working capital decrease for 2015 was primarily due to a reduction of metal inventory and collection of accounts receivable, compared to the $22.5 million working capital decrease for 2014, which was primarily due to a reduction of inventory.
Cash provided by operating activities decreased $60.4 million in 2014 compared to 2013 primarily due to lower average realized silver and gold prices and lower gold ounces sold, partially offset by higher silver ounces sold, lower costs applicable to sales per gold ounce and a decrease in working capital. 2014 metal sales were $92.1 million lower due to lower average realized prices and $18.2 million lower due to lower silver equivalent ounces sold. The decrease in silver equivalent ounces sold was primarily due to delayed gold shipments from the Kensington mine as a result of a labor dispute affecting ports on the west coast of the U.S. The $22.5 million working capital decrease for 2014 was primarily due to a reduction of inventory, compared to the $36.4 million working capital increase for 2013, which was due to higher accruals.
The Company’s financial position at
December 31, 2015
, and the expected operating cash flows over the next twelve months, lead management to believe that the Company’s liquid assets are sufficient to fund currently planned capital expenditures for existing operations and to discharge liabilities as they come due. Please refer to the “2016 Outlook” section of this MD&A for a more detailed description of capital expenditures planned for 2016.
Cash Used in Investing Activities
Net cash
used in
investing activities in 2015 was
$211.3 million
compared to
$81.7 million
in 2014, primarily due to the acquisition of the Wharf gold mine for
$99.4 million
and higher development capital expenditures in 2015, partially offset by purchases of short-term investments in 2014. The Company spent
$95.2 million
on capital expenditures in 2015 compared with
$64.2 million
in 2014. Capital expenditures in 2015 were primarily related to underground development of the Guadalupe and Independencia deposits at Palmarejo, crusher expansion and Stage III buttress construction at Rochester, and underground development of the Jualin deposit at Kensington, compared to underground development at Palmarejo and Kensington in 2014.
Net cash used in investing activities in 2014 was $81.7 million compared to $186.5 million in 2013, primarily due to lower capital expenditures and the acquisition of Orko Silver Corporation in 2013, partly offset by the purchases of NSR royalties on non-producing exploration properties in 2014. The Company spent $64.2 million on capital expenditures in 2014, compared with $100.8 million in 2013. Capital expenditures in 2014 were primarily related to underground development at Palmarejo and
43
Kensington, underground development of the Guadalupe deposit at Palmarejo, and San Bartolomé tailings expansion, compared to the Stage III Rochester expansion and underground development at Palmarejo and Kensington in 2013.
Cash Provided by Financing Activities
Net cash
provided by
financing activities in 2015 was
$29.0 million
compared to
$93.0 million
in 2014. During 2015, the Company entered into a $50 million short-term loan which was subsequently repaid upon entering into the $100 million Term Loan (as defined below). In 2014, the Company completed a follow-on offering of $150 million of its 7.875% Senior Notes due 2021 ("the Senior Notes").
Net cash provided by financing activities in 2014 was $93.0 million compared to $154.3 million in 2013. The decrease in cash provided by financing activities is primarily the result of the follow-on offering of $150 million of Senior Notes in 2014, partly offset by the repurchase of $15.1 million of Senior Notes and lower gold prices driving lower Palmarejo gold production royalty payments. In contrast, 2013 included the original offering of $300 million of Senior Notes partly offset by the repurchase of $43.3 million of Convertible Notes, $27.6 million of common stock repurchases, and higher gold prices driving higher Palmarejo gold production royalty payments.
On June 23, 2015, the Company and certain of its subsidiaries entered into a credit agreement for a senior secured term loan (the "Term Loan") with Barclays Bank PLC as administrative agent (the "Term Loan Credit Agreement"). The Term Loan Credit Agreement provides for a five year, $100 million term loan to the Company, of which a portion of the proceeds were used to repay the Short-term Loan, and the remaining proceeds are expected to be used for general corporate purposes. The Term Loan contains no financial maintenance covenants and currently bears interest at a rate equal to an adjusted Eurodollar rate plus a margin of 8.00% (at no time will the adjusted Eurodollar rate be deemed to be less than 1.00% per annum). Voluntary prepayments of the Term Loan under the Term Loan Credit Agreement are permitted, subject to the payment of a make-whole premium if such prepayment occurs prior to the first anniversary of the closing date, a premium of 105.0% of the principal amount between the first anniversary and the second anniversary of the closing date and a premium of 103.0% if such prepayment occurs on or after the second anniversary but prior to the third anniversary of the closing date. The Term Loan Credit Agreement requires amortization payments equal to 1.0% of the principal amount of the Term Loan per annum and also requires net cash proceeds of debt issuances, excess cash flow, asset sales and casualty insurance recoveries (in each case, subject to certain exceptions) to either be reinvested in long-term assets used in the Company’s business or be applied as a mandatory prepayment of the Term Loan. Amounts repaid on the Term Loan may not be re-borrowed. The obligations under the Term Loan are secured by substantially all of the assets of the Company and its domestic subsidiaries, including the land, mineral rights and infrastructure at the Kensington, Rochester and Wharf mines, as well as a pledge of the shares of certain of the Company's subsidiaries. The Term Loan Credit Agreement contains customary representations and warranties, events of default, and affirmative and negative covenants.
On November 2, 2015, the Company and the Term Loan lenders entered into a Consent under Credit Agreement, and the Company entered into a privately-negotiated agreement to exchange
$54.2 million
in aggregate principal amount of its Senior Notes for
14.4 million
shares of common stock. Based on the closing price of the Company's common stock on the date of the exchange, the exchange resulted in a gain of
$15.9 million
which is recorded in
Other, net
in the Company's Consolidated Statement of Comprehensive Income (Loss).
44
Contractual Obligations
The following table summarizes the Company’s contractual obligations at December 31, 2015 and the effect such obligations are expected to have on its liquidity and cash flow in future periods.
|
|
Payments Due by Period
|
|||||||||||||||||||
|
Contractual Obligations
|
Total
|
Less Than
1 Year
|
1-3 Years
|
4-5 Years
|
More Than
5 Years
|
|||||||||||||||
|
Long-term debt obligations:
|
||||||||||||||||||||
|
3.25% Convertible Senior Notes due 2028
|
$
|
712
|
|
$
|
—
|
|
$
|
—
|
|
$
|
—
|
|
$
|
712
|
|
|||||
|
7.875% Senior Notes due 2021, net
|
378,747
|
|
—
|
|
—
|
|
—
|
|
378,747
|
|
||||||||||
|
Term Loan due 2020, net
|
99,500
|
|
1,000
|
|
2,000
|
|
96,500
|
|
—
|
|
||||||||||
|
Interest on debt
|
201,932
|
|
41,099
|
|
82,058
|
|
76,035
|
|
2,740
|
|
||||||||||
|
|
680,891
|
|
42,099
|
|
84,058
|
|
172,535
|
|
382,199
|
|
||||||||||
|
Capital lease obligations
(1)
|
18,566
|
|
10,120
|
|
6,558
|
|
1,844
|
|
44
|
|
||||||||||
|
Operating lease obligations:
|
||||||||||||||||||||
|
Hyak mining lease
|
7,688
|
|
287
|
|
574
|
|
2,524
|
|
4,303
|
|
||||||||||
|
Operating leases
|
42,990
|
|
13,348
|
|
17,542
|
|
7,452
|
|
4,648
|
|
||||||||||
|
|
50,678
|
|
13,635
|
|
18,116
|
|
9,976
|
|
8,951
|
|
||||||||||
|
Other long-term obligations:
|
||||||||||||||||||||
|
Reclamation and mine closure
(2)
|
218,970
|
|
3,339
|
|
11,123
|
|
11,414
|
|
193,094
|
|
||||||||||
|
Lines of credit and other financing
|
4,571
|
|
4,571
|
|
—
|
|
—
|
|
—
|
|
||||||||||
|
Severance payments
(3)
|
8,456
|
|
2,854
|
|
—
|
|
—
|
|
5,602
|
|
||||||||||
|
Unrecognized tax benefits
(4)
|
23,850
|
|
—
|
|
—
|
|
—
|
|
—
|
|
||||||||||
|
Palmarejo royalty obligation
|
21,641
|
|
21,641
|
|
—
|
|
—
|
|
—
|
|
||||||||||
|
|
277,488
|
|
32,405
|
|
11,123
|
|
11,414
|
|
198,696
|
|
||||||||||
|
Total
|
$
|
1,027,623
|
|
$
|
98,259
|
|
$
|
119,855
|
|
$
|
195,769
|
|
$
|
589,890
|
|
|||||
|
(1)
|
The Company has entered into various capital lease agreements for commitments primarily over the next two years.
|
|
(2)
|
Reclamation and mine closure amounts represent the Company’s estimate of the cash flows associated with its legal obligation to reclaim and remediate mining properties. This amount will decrease as reclamation and remediation work is completed. Amounts shown on the table are undiscounted.
|
|
(3)
|
Accrued government-mandated severance at the Palmarejo complex and San Bartolomé mine.
|
|
(4)
|
The Company is unable to reasonably estimate the timing of recognition of unrecognized tax benefits beyond 2015 due to uncertainties in the timing of the effective settlement of tax positions.
|
Environmental Compliance Expenditures
For the years ended December 31, 2015, 2014, and 2013, the Company spent $6.8 million, $5.6 million, and $5.9 million, respectively, in connection with routine environmental compliance activities at its operating properties. The Company estimates that environmental compliance expenditures during 2016 will be approximately $7.6 million. Future environmental compliance expenditures will be determined by governmental regulations and the overall scope of the Company’s operating and development activities.
Other Liquidity Matters
The Company has asserted indefinite reinvestment of certain foreign subsidiary earnings as determined by management’s judgment about and intentions concerning the future operations of the Company. For the years 2015 and 2014, the Company had no unremitted earnings from these specific foreign operations. As a result, the Company does not record a U.S. deferred tax liability for the foreign earnings that meet the indefinite reversal criteria. The Company does not believe that the amounts reinvested will have a material impact on liquidity.
The Company may elect to defer some capital investment activities or to secure additional capital to ensure it maintains sufficient liquidity. In addition, if the Company decides to pursue the acquisition of additional mineral interests, new capital projects, or acquisitions of new properties, mines or companies, additional financing activities may be necessary. There can be no assurances that such financing will be available when or if needed upon acceptable terms, or at all.
45
Certain of our debt securities currently trade at substantial discounts to their face amounts. In order to reduce future cash interest payments, and/or amounts due at maturity or upon redemption, from time to time we may repurchase such debt for cash or in exchange for other securities, which may include secured or unsecured notes or equity, in each case in open market or privately negotiated transactions. We regularly engage in conversations with our bondholders and evaluate any such transactions in light of prevailing market conditions, liquidity requirements, contractual restrictions, and other factors. The amounts involved may be significant and any such transactions may occur at a substantial discount to the debt securities' face amount.
Critical Accounting Policies and Accounting Developments
Listed below are the accounting policies that we believe are critical to our financial statements due to the degree of uncertainty regarding the estimates and assumptions involved and the magnitude of the asset, liability, revenue, and expense being reported. For a discussion of recent accounting pronouncements, see Note 2 -- Summary of Significant Accounting Policies in the notes to the consolidated financial statements.
Revenue Recognition
Revenue includes sales value received for the Company’s principal products, silver and gold, and royalty revenues received. Revenue is recognized when title to silver and gold passes to the buyer and when collectability is reasonably assured. Title passes to the buyer based on terms of the sales contract. Product pricing is determined at the point revenue is recognized by reference to active and freely traded commodity markets; for example, the London Bullion Market for both gold and silver.
Under the Company’s concentrate sales contracts with third-party smelters, final gold and silver prices are set on a specified future quotational period, typically one to three months, after the shipment date based on market prices. Revenues are recorded under these contracts at the time title passes to the buyer based on the forward price for the expected settlement period. The contracts, in general, provide for provisional payment based upon provisional assays and quoted metal prices. Final settlement is based on the average applicable price for the specified future quotational period and generally occurs from three to six months after shipment. Final sales are settled using smelter weights and settlement assays (average of assays exchanged and/or umpire assay results) and are priced as specified in the smelter contract. The Company’s provisionally priced sales contracts contain an embedded derivative that is required to be separated from the host contract for accounting purposes. The host contract is the receivable from the sale of concentrates at the forward price at the time of sale. The embedded derivative does not qualify for hedge accounting and is adjusted to fair value through revenue each period until the date of final gold and silver settlement.
Estimates
The preparation of the Company’s consolidated financial statements in conformity with U.S. GAAP requires management to make estimates and assumptions that affect the reported amount of assets and liabilities, disclosure of contingent assets and liabilities at the date of its financial statements, the reported amounts of revenue and expenses during the reporting period, and mined reserves. There can be no assurance that actual results will not differ from those estimates. There are a number of uncertainties inherent in estimating quantities of reserves, including many factors beyond the Company’s control. Ore reserve estimates are based upon engineering evaluations of samplings of drill holes and other openings. These estimates involve assumptions regarding future silver and gold prices, the geology of its mines, the mining methods it uses and the related costs it incurs to develop and mine its reserves. Changes in these assumptions could result in material adjustments to the Company’s reserve estimates. The Company uses reserve estimates in determining the units-of-production amortization and evaluating mine assets for potential impairment.
Amortization
The Company amortizes its property, plant, and equipment, mining properties, and mine development using the units-of-production method over the estimated life of the ore body based on its proven and probable reserves or the straight-line method over the useful life, whichever is shorter. The accounting estimates related to amortization are critical accounting estimates because (1) the determination of reserves involves uncertainties with respect to the ultimate geology of its reserves and the assumptions used in determining the economic feasibility of mining those reserves and (2) changes in estimated proven and probable reserves and asset useful lives can have a material impact on net income.
Write-downs
We review and evaluate our long-lived assets for impairment when events or changes in circumstances indicate that the related carrying amounts may not be recoverable. Asset impairment is considered to exist if the total estimated undiscounted pre-tax future cash flows are less than the carrying amount of the asset. In estimating future cash flows, assets are grouped at the lowest level for which there is identifiable cash flows that are largely independent of future cash flows from other asset groups. An impairment loss is measured and recorded based on discounted estimated future cash flows. Future cash flows are estimated based on estimated quantities of recoverable minerals, expected silver and gold prices (considering current and historical prices, trends and related factors), production levels, operating costs, capital requirements and reclamation costs, all based on life-of-
46
mine plans. The significant assumptions used in determining future cash flows for each mine site asset group at December 31, 2015, apart from production cost and capitalized expenditure assumptions unique to each operation, included long-term silver and gold prices of
$17.50
and
$1,200
per ounce (consistent with the Company’s long-term reserve prices), respectively, and discount rates ranging from
7.50%
-
11.00%
(to reflect project and country-specific risks). During 2015, 2014, and 2013, we recorded impairments of
$313.3 million
, $1,472.7 million, and $773.0 million, respectively, to reduce the carrying value of mining properties and property, plant and equipment as part of
Write-downs.
See Note 4 -- Write-Downs for additional detail.
Existing proven and probable reserves and value beyond proven and probable reserves, including mineralization other than proven and probable reserves, are included when determining the fair value of mine site asset groups at acquisition and, subsequently, in determining whether the assets are impaired. The term “recoverable minerals” refers to the estimated amount of silver and gold that will be obtained after taking into account losses during ore processing and treatment. Estimates of recoverable minerals from exploration stage mineral interests are risk adjusted based on management’s relative confidence in such materials. The ability to achieve the estimated quantities of recoverable minerals from exploration stage mineral interests involves further risks in addition to those risk factors applicable to mineral interests where proven and probable reserves have been identified, due to the lower level of confidence that the identified mineralized material could ultimately be mined economically. Assets classified as exploration potential have the highest level of risk that the carrying value of the asset can be ultimately realized, due to the still lower level of geological confidence and economic modeling.
Silver and gold prices are volatile and affected by many factors beyond the Company’s control, including prevailing interest rates and returns on other asset classes, expectations regarding inflation, speculation, currency values, governmental decisions regarding precious metals stockpiles, global and regional demand and production, political and economic conditions and other factors may affect the key assumptions used in the Company’s impairment testing. Various factors could impact our ability to achieve forecasted production levels from proven and probable reserves. Additionally, production, capital and reclamation costs could differ from the assumptions used in the cash flow models used to assess impairment. Actual results may vary from the Company’s estimates and result in additional
Write-downs
.
Ore on Leach Pads
The heap leach process is a process of extracting silver and gold by placing ore on an impermeable pad and applying a diluted cyanide solution that dissolves a portion of the contained silver and gold, which are then recovered in metallurgical processes.
The Company uses several integrated steps to scientifically measure the metal content of ore placed on the leach pads. As the ore body is drilled in preparation for the blasting process, samples are taken of the drill residue which are assayed to determine estimated quantities of contained metal. The Company estimates the quantity of ore by utilizing global positioning satellite survey techniques. The Company then processes the ore through crushing facilities where the output is again weighed and sampled for assaying. A metallurgical reconciliation with the data collected from the mining operation is completed with appropriate adjustments made to previous estimates. The crushed ore is then transported to the leach pad for application of the leaching solution. As the leach solution is collected from the leach pads, it is continuously sampled for assaying. The quantity of leach solution is measured by flow meters throughout the leaching and precipitation process. After precipitation, the product is converted to doré, which is the final product produced by the mine. The inventory is stated at lower of cost or market, with cost being determined using a weighted average cost method.
The historical cost of the metal that is expected to be extracted within twelve months is classified as current. Ore on leach pad is valued based on actual production costs incurred to produce and place ore on the leach pads, less costs allocated to minerals recovered through the leach process.
The estimate of both the ultimate recovery expected over time and the quantity of metal that may be extracted relative to the time the leach process occurs requires the use of estimates and relies upon laboratory testwork. Testwork consists of 60 day leach columns from which the Company projects metal recoveries up to five years in the future. The quantities of metal contained in the ore are estimated based upon actual weights and assay analysis. The rate at which the leach process extracts gold and silver from the crushed ore is based upon laboratory column tests and actual experience occurring over more than twenty years of leach pad operations at the Rochester mine. The assumptions used by the Company to measure metal content during each stage of the inventory conversion process includes estimated recovery rates based on laboratory testing and assaying. The Company periodically reviews its estimates compared to actual experience and revises its estimates when appropriate. The ultimate recovery will not be known until leaching operations cease. Historically, our operating results have not been materially impacted by variations between the estimated and actual recoverable quantities of silver and gold on our leach pads.
Reclamation
The Company recognizes obligations associated with the retirement of tangible long-lived assets and the associated asset retirement costs. The fair value of a liability for an asset retirement obligation will be recognized in the period in which it is incurred
47
if a reasonable estimate of fair value can be made. The fair value of the liability is added to the carrying amount of the associated asset and this additional carrying amount is depreciated over the life of the asset. An accretion cost, representing the increase over time in the present value of the liability, is recorded each period in
Pre-development, Reclamation, and Other
. As reclamation work is performed or liabilities are otherwise settled, the recorded amount of the liability is reduced. Future remediation costs for inactive mines are accrued based on management’s best estimate at the end of each period of the discounted costs expected to be incurred at the site. Such cost estimates include, where applicable, ongoing care and maintenance and monitoring costs. Changes in estimates are reflected in earnings in the period an estimate is revised.
Derivatives
The Company recognizes all derivatives as either assets or liabilities on the balance sheet and measures those instruments at fair value. Changes in the value of derivative instruments are recorded each period in
Fair value adjustments, net
. Management applies judgment in estimating the fair value of instruments that are highly sensitive to assumptions regarding commodity prices, market volatilities, and foreign currency exchange rates.
Income and Mining Taxes
The Company accounts for income taxes in accordance with the guidance of ASC 740. The Company’s annual tax rate is based on income, statutory tax rates in effect and tax planning opportunities available to us in the various jurisdictions in which the Company operates. Significant judgment is required in determining the annual tax expense, current tax assets and liabilities, deferred tax assets and liabilities, and our future taxable income, both as a whole and in various tax jurisdictions, for purposes of assessing our ability to realize future benefit from our deferred tax assets. Actual income taxes could vary from these estimates due to future changes in income tax law, significant changes in the jurisdictions in which we operate or unpredicted results from the final determination of each year’s liability by taxing authorities.
The Company’s deferred income taxes reflect the impact of temporary differences between the reported amounts of assets and liabilities for financial reporting purposes and such amounts measured by tax laws and regulations. In evaluating the realizability of the deferred tax assets, management considers both positive and negative evidence that may exist, such as earnings history, reversal of taxable temporary differences, forecasted operating earnings and available tax planning strategies in each tax jurisdiction. A valuation allowance may be established to reduce our deferred tax assets to the amount that is considered more likely than not to be realized through the generation of future taxable income and other tax planning strategies.
The Company has asserted indefinite reinvestment of certain foreign subsidiary earnings as determined by management’s judgment about and intentions concerning the future operations of the Company. For the years 2015 and 2014, the Company had no unremitted earnings from these specific foreign operations. As a result, the Company does not record a U.S. deferred tax liability for the foreign earnings that meet the indefinite reversal criteria. Refer to Note 8 -- Income and Mining Taxes for further discussion on our assertion.
The Company’s operations may involve dealing with uncertainties and judgments in the application of complex tax regulations in multiple jurisdictions. The final taxes paid are dependent upon many factors, including negotiations with taxing authorities in various jurisdictions and resolution of disputes arising from federal, state, and international tax audits. The Company recognizes potential liabilities and records tax liabilities for anticipated tax audit issues in the United States and other tax jurisdictions based on its estimate of whether, and the extent to which, additional taxes will be due. The Company adjusts these reserves in light of changing facts and circumstances, such as the progress of a tax audit; however, due to the complexity of some of these uncertainties, the ultimate resolution could result in a payment that is materially different from our current estimate of the tax liabilities. These differences will be reflected as increases or decreases to income tax expense in the period which they are determined. The Company recognizes interest and penalties, if any, related to unrecognized tax benefits in income tax expense.
During 2015, the Company completed a reconciliation of its tax basis assets and liabilities, as well as a comprehensive analysis of its income and mining taxes receivable and payable, which identified prior year immaterial errors of
$31.0 million
. The Company's results have been revised to reflect the adjustment for the year ended December 31, 2014.
Non-GAAP Financial Performance Measures
Non-GAAP financial measures are intended to provide additional information only and do not have any standard meaning prescribed by generally accepted accounting principles ("GAAP"). These measures should not be considered in isolation or as a substitute for performance measures prepared in accordance with GAAP.
48
Adjusted Net Income (Loss)
Management uses
Adjusted net income (loss)
to evaluate the Company's operating performance, and to plan and forecast its operations. The Company believes the use of
Adjusted net income (loss)
reflects the underlying operating performance of our core mining business and allows investors and analysts to compare results of the Company to similar results of other mining companies. Management's determination of the components of
Adjusted net income (loss)
are evaluated periodically and are based, in part, on a review of non-GAAP financial measures used by mining industry analysts.
Net income (loss)
is reconciled to
Adjusted net income (loss)
in the table below, with amounts presented after-tax:
|
Year ended December 31,
|
|||||||||||
|
In thousands except per share amounts
|
2015
|
2014
|
2013
|
||||||||
|
Net income (loss)
|
$
|
(367,183
|
)
|
$
|
(1,186,874
|
)
|
$
|
(650,563
|
)
|
||
|
Fair value adjustments, net
|
(4,109
|
)
|
(4,323
|
)
|
(59,908
|
)
|
|||||
|
Stock-based compensation
|
8,701
|
|
8,976
|
|
4,611
|
|
|||||
|
Impairment of marketable securities
|
2,346
|
|
6,593
|
|
18,308
|
|
|||||
|
Accretion of royalty obligation
|
4,252
|
|
6,976
|
|
12,349
|
|
|||||
|
Write-downs
|
276,510
|
|
1,021,756
|
|
593,214
|
|
|||||
|
Litigation settlement
|
—
|
|
—
|
|
32,046
|
|
|||||
|
Gain on sale of building
|
—
|
|
—
|
|
(1,200
|
)
|
|||||
|
Gain on commutation of reclamation bonding arrangements
|
—
|
|
—
|
|
(7,609
|
)
|
|||||
|
(Gain) loss on debt extinguishments
|
(15,916
|
)
|
(426
|
)
|
—
|
|
|||||
|
Revolving Credit Facility termination
|
—
|
|
3,035
|
|
—
|
|
|||||
|
Inventory adjustments
|
10,207
|
|
14,482
|
|
5,691
|
|
|||||
|
Corporate reorganization costs
|
647
|
|
—
|
|
—
|
|
|||||
|
Transaction-related costs
|
2,112
|
|
—
|
|
300
|
|
|||||
|
Foreign exchange impact on deferred taxes
|
(14,170
|
)
|
(15,689
|
)
|
11,760
|
|
|||||
|
Adjusted net income (loss)
|
$
|
(96,603
|
)
|
$
|
(145,494
|
)
|
$
|
(41,001
|
)
|
||
|
Adjusted net income (loss) per share
|
$
|
(0.75
|
)
|
$
|
(1.42
|
)
|
$
|
(0.42
|
)
|
||
Costs Applicable to Sales and All-in Sustaining Costs
Management uses
Costs applicable to sales
("CAS") and
All-in sustaining costs
("AISC") (as defined by the World Gold Council) to evaluate the Company’s current operating performance and life of mine performance from discovery through reclamation. We believe these measures assist analysts, investors and other stakeholders in understanding the costs associated with producing silver and gold and assessing our operating performance and ability to generate free cash flow from operations. These measures may not be indicative of operating profit or cash flow from operations as determined under GAAP. Management believes converting the benefit from selling gold into silver equivalent ounces best allows management, analysts, investors and other stakeholders to evaluate the operating performance of the Company. Other companies may calculate CAS and AISC differently as a result of reflecting the benefit from selling non-silver metals as a by-product credit rather than converting to silver equivalent ounces, differences in the determination of sustaining capital expenditures, and differences in underlying accounting principles and accounting frameworks such as in International Financial Reporting Standards.
49
Year Ended
December 31, 2015
|
Silver
|
Gold
|
Total
|
||||||||||||||||||||||||||||||||||
|
In thousands except per ounce amounts
|
Palmarejo
|
Rochester
|
San Bartolomé
|
Endeavor
|
Total
|
Kensington
|
Wharf
|
Total
|
||||||||||||||||||||||||||||
|
Costs applicable to sales, including amortization (U.S. GAAP)
|
$
|
170,899
|
|
$
|
127,900
|
|
$
|
93,625
|
|
$
|
9,059
|
|
$
|
401,483
|
|
$
|
147,880
|
|
$
|
68,575
|
|
$
|
216,455
|
|
$
|
617,938
|
|
|||||||||
|
Amortization
|
32,423
|
|
23,906
|
|
17,798
|
|
5,539
|
|
79,666
|
|
42,240
|
|
16,378
|
|
58,618
|
|
138,284
|
|
||||||||||||||||||
|
Costs applicable to sales
|
$
|
138,476
|
|
$
|
103,994
|
|
$
|
75,827
|
|
$
|
3,520
|
|
$
|
321,817
|
|
$
|
105,640
|
|
$
|
52,197
|
|
$
|
157,837
|
|
$
|
479,654
|
|
|||||||||
|
Silver equivalent ounces sold
(1)
|
9,840,705
|
|
8,377,823
|
|
5,495,369
|
|
615,022
|
|
24,328,919
|
|
36,659,759
|
|
||||||||||||||||||||||||
|
Gold equivalent ounces sold
(1)
|
131,553
|
|
73,961
|
|
205,514
|
|
||||||||||||||||||||||||||||||
|
Costs applicable to sales per ounce
(1)
|
$
|
14.07
|
|
$
|
12.41
|
|
$
|
13.80
|
|
$
|
5.72
|
|
$
|
13.23
|
|
$
|
803
|
|
$
|
706
|
|
$
|
768
|
|
$
|
13.08
|
|
|||||||||
|
Costs applicable to sales per realized ounce
(2)
|
$
|
12.75
|
|
$
|
11.32
|
|
|
|
$
|
12.31
|
|
|
|
|
$
|
11.60
|
|
|||||||||||||||||||
|
Costs applicable to sales
|
$
|
479,654
|
|
|||||||||||||||||||||||||||||||||
|
Treatment and refining costs
|
4,801
|
|
||||||||||||||||||||||||||||||||||
|
Sustaining capital
|
53,362
|
|
||||||||||||||||||||||||||||||||||
|
General and administrative
|
32,834
|
|
||||||||||||||||||||||||||||||||||
|
Exploration
|
11,647
|
|
||||||||||||||||||||||||||||||||||
|
Reclamation
|
16,769
|
|
||||||||||||||||||||||||||||||||||
|
Project/pre-development costs
|
5,674
|
|
||||||||||||||||||||||||||||||||||
|
All-in sustaining costs
|
$
|
604,741
|
|
|||||||||||||||||||||||||||||||||
|
Silver equivalent ounces sold
(1)
|
24,328,919
|
|
||||||||||||||||||||||||||||||||||
|
Kensington and Wharf silver equivalent ounces sold
(1)
|
12,330,840
|
|
||||||||||||||||||||||||||||||||||
|
Consolidated silver equivalent ounces sold
(1)
|
36,659,759
|
|
||||||||||||||||||||||||||||||||||
|
All-in sustaining costs per silver equivalent ounce
(1)
|
$
|
16.50
|
|
|||||||||||||||||||||||||||||||||
|
All-in sustaining costs per realized silver equivalent ounce
(2)
|
$
|
14.62
|
|
|||||||||||||||||||||||||||||||||
|
(1)
|
Equivalent ounces calculated using a 60:1 silver to gold ratio.
|
|
(2)
|
Equivalent ounces calculated using average realized prices.
|
Year Ended
December 31, 2014
|
Silver
|
Gold
|
|||||||||||||||||||||||||||
|
In thousands except per ounce amounts
|
Palmarejo
|
Rochester
|
San Bartolomé
|
Endeavor
|
Total
|
Kensington
|
Total
|
|||||||||||||||||||||
|
Costs applicable to sales, including amortization (U.S. GAAP)
|
$
|
256,707
|
|
$
|
112,252
|
|
$
|
109,082
|
|
$
|
8,514
|
|
$
|
486,555
|
|
$
|
148,961
|
|
$
|
635,516
|
|
|||||||
|
Amortization
|
69,431
|
|
20,790
|
|
19,423
|
|
4,308
|
|
113,952
|
|
43,619
|
|
157,571
|
|
||||||||||||||
|
Costs applicable to sales
|
$
|
187,276
|
|
$
|
91,462
|
|
$
|
89,659
|
|
$
|
4,206
|
|
$
|
372,603
|
|
$
|
105,342
|
|
$
|
477,945
|
|
|||||||
|
Silver equivalent ounces sold
(1)
|
12,161,719
|
|
6,309,912
|
|
6,275,769
|
|
586,242
|
|
25,333,642
|
|
31,982,962
|
|
||||||||||||||||
|
Gold equivalent ounces sold
(1)
|
110,822
|
|
||||||||||||||||||||||||||
|
Costs applicable to sales per ounce
(1)
|
$
|
15.40
|
|
$
|
14.49
|
|
$
|
14.29
|
|
$
|
7.17
|
|
$
|
14.71
|
|
$
|
951
|
|
$
|
14.94
|
|
|||||||
|
Costs applicable to sales per realized ounce
(2)
|
$
|
14.69
|
|
$
|
13.94
|
|
|
|
$
|
14.24
|
|
$
|
14.26
|
|
||||||||||||||
|
Costs applicable to sales
|
$
|
477,945
|
|
|||||||||||||||||||||||||
|
Treatment and refining costs
|
4,943
|
|
||||||||||||||||||||||||||
|
Sustaining capital
|
61,199
|
|
||||||||||||||||||||||||||
|
General and administrative
|
40,845
|
|
||||||||||||||||||||||||||
|
Exploration
|
21,740
|
|
||||||||||||||||||||||||||
|
Reclamation
|
7,468
|
|
||||||||||||||||||||||||||
|
Project/pre-development costs
|
16,588
|
|
||||||||||||||||||||||||||
|
All-in sustaining costs
|
$
|
630,728
|
|
|||||||||||||||||||||||||
|
Silver equivalent ounces sold
(1)
|
25,333,642
|
|
||||||||||||||||||||||||||
|
Kensington and Wharf silver equivalent ounces sold
(1)
|
6,649,320
|
|
||||||||||||||||||||||||||
|
Consolidated silver equivalent ounces sold
(1)
|
31,982,962
|
|
||||||||||||||||||||||||||
|
All-in sustaining costs per silver equivalent ounce
(1)
|
$
|
19.72
|
|
|||||||||||||||||||||||||
|
All-in sustaining costs per realized silver equivalent ounce
(2)
|
$
|
18.81
|
|
|||||||||||||||||||||||||
|
(1)
|
Equivalent ounces calculated using a 60:1 silver to gold ratio.
|
|
(2)
|
Equivalent ounces calculated using average realized prices.
|
50
Year Ended December 31, 2013
|
Silver
|
Gold
|
|||||||||||||||||||||||||||
|
In thousands except per ounce amounts
|
Palmarejo
|
Rochester
|
San Bartolomé
|
Endeavor
|
Total
|
Kensington
|
Total
|
|||||||||||||||||||||
|
Costs applicable to sales, including amortization (U.S. GAAP)
|
$
|
322,107
|
|
$
|
86,759
|
|
$
|
105,930
|
|
$
|
9,575
|
|
$
|
524,371
|
|
$
|
167,325
|
|
$
|
691,696
|
|
|||||||
|
Amortization
|
133,535
|
|
8,890
|
|
19,103
|
|
3,755
|
|
165,283
|
|
62,750
|
|
228,033
|
|
||||||||||||||
|
Costs applicable to sales
|
$
|
188,572
|
|
$
|
77,869
|
|
$
|
86,827
|
|
$
|
5,820
|
|
$
|
359,088
|
|
$
|
104,575
|
|
$
|
463,663
|
|
|||||||
|
Silver equivalent ounces sold
(1)
|
14,227,657
|
|
5,012,194
|
|
6,079,156
|
|
605,832
|
|
25,924,839
|
|
||||||||||||||||||
|
Gold equivalent ounces sold
(1)
|
116,055
|
|
||||||||||||||||||||||||||
|
Costs applicable to sales per ounce
(1)
|
$
|
13.25
|
|
$
|
15.54
|
|
$
|
14.28
|
|
$
|
9.61
|
|
$
|
13.85
|
|
$
|
901
|
|
$
|
14.10
|
|
|||||||
|
Costs applicable to sales per realized ounce
(2)
|
$
|
13.75
|
|
$
|
16.04
|
|
$
|
14.22
|
|
$
|
14.63
|
|
||||||||||||||||
|
Costs applicable to sales
|
$
|
463,663
|
|
|||||||||||||||||||||||||
|
Treatment and refining costs
|
6,964
|
|
||||||||||||||||||||||||||
|
Sustaining capital
|
88,305
|
|
||||||||||||||||||||||||||
|
General and administrative
|
55,343
|
|
||||||||||||||||||||||||||
|
Exploration
|
22,360
|
|
||||||||||||||||||||||||||
|
Reclamation
|
3,746
|
|
||||||||||||||||||||||||||
|
Project/pre-development costs
|
11,869
|
|
||||||||||||||||||||||||||
|
All-in sustaining costs
|
$
|
652,250
|
|
|||||||||||||||||||||||||
|
Silver equivalent ounces sold
(1)
|
25,924,839
|
|
||||||||||||||||||||||||||
|
Kensington and Wharf silver equivalent ounces sold
(1)
|
6,963,300
|
|
||||||||||||||||||||||||||
|
Consolidated silver equivalent ounces sold
(1)
|
32,888,139
|
|
||||||||||||||||||||||||||
|
All-in sustaining costs per silver equivalent ounce
(1)
|
$
|
19.83
|
|
|||||||||||||||||||||||||
|
All-in sustaining costs per realized silver equivalent ounce
(2)
|
$
|
20.34
|
|
|||||||||||||||||||||||||
|
(1)
|
Equivalent ounces calculated using a 60:1 silver to gold ratio.
|
|
(2)
|
Equivalent ounces calculated using average realized prices.
|
51
Item 7A.
Quantitative and Qualitative Disclosures About Market Risk
The Company is exposed to various market risks as a part of its operations and engages in risk management strategies to mitigate these risks. The Company continually evaluates the potential benefits of engaging in these strategies based on current market conditions. The Company does not actively engage in the practice of trading derivative instruments for profit. Additional information about the Company’s derivative financial instruments may be found in Note 12 -- Derivative Financial Instruments in the notes to the consolidated financial statements. This discussion of the Company's market risk assessments contains "forward looking statements" that contain risks and uncertainties. For additional information regarding forward-looking statements and risks and uncertainties that could impact the Company, please refer to Part I, Item 1 of this Report - Cautionary Statement Concerning Forward-Looking Statements. Actual results and actions could differ materially from those discussed below.
Gold and Silver Price
Gold and silver prices may fluctuate widely due to numerous factors such as U.S. dollar strength or weakness, demand, investor sentiment, inflation or deflation, and global mine production. The Company's profitability and cash flow may be significantly impacted by changes in the market price of gold and silver.
Gold and Silver Hedging
To mitigate the risks associated with gold and silver price fluctuations, the Company may enter into option contracts to hedge future production. At
December 31, 2015
, the Company had no outstanding option contracts.
Provisional Silver and Gold Sales
The Company enters into sales contracts with third-party smelters which, in some cases, provide for a provisional payment based upon preliminary assays and quoted metal prices. The provisionally priced sales contracts contain an embedded derivative that is required to be separated from the host contract. Depending on the difference between the price at the time of sale and the final settlement price, embedded derivatives are recorded as either a derivative asset or liability. The embedded derivatives do not qualify for hedge accounting and, as a result, are marked to the market gold and silver price at the end of each period from the provisional sale date to the date of final settlement. The mark-to-market gains and losses are recorded in earnings. Changes in silver and gold pricing resulted in provisional pricing mark-to-market gains of
$0.3 million
in the year ended
December 31, 2015
.
At
December 31, 2015
, the Company had outstanding provisionally priced sales of
0.6 million
ounces of silver and
30,627
ounces of gold at prices of
$14.98
and
$1,110
, respectively. A 10% change in realized silver price would cause revenue to vary
$0.9 million
and a 10% change in realized gold price would cause revenue to vary
$3.7 million
.
Palmarejo Gold Production Royalty
On January 21, 2009, Coeur Mexicana entered into a gold production royalty transaction with a subsidiary of Franco-Nevada Corporation. The royalty covers 50% of the life of mine production from the Palmarejo mine and adjacent properties and includes a minimum obligation of 4,167 gold ounces per month which terminates when payments in respect of 400,000 gold ounces have been made. The minimum royalty obligation is considered an embedded derivative financial instrument due to the impact of fluctuating gold prices on the underlying gold ounces.
At
December 31, 2015
, a total of
33,495
ounces of gold remain outstanding under the minimum royalty obligation. The fair value of the embedded derivative is reflected net of the Company's current credit adjusted risk free rate, which was
19.9%
at
December 31, 2015
. The fair value of the embedded derivative at
December 31, 2015
was a liability of
$5.0 million
. A 10% change in the price of gold would result in a change in the fair value of the net derivative liability at
December 31, 2015
to vary by
$2.9 million
.
Foreign Currency
The Company operates, or has mineral interests, in several foreign countries including Australia, Bolivia, Chile, Mexico, Argentina, Ecuador, and New Zealand, which exposes it to foreign currency exchange rate risks. Foreign currency exchange rates are influenced by world market factors beyond the Company's control such as supply and demand for U.S. and foreign currencies and related monetary and fiscal policies. Fluctuations in local currency exchange rates in relation to the U.S. dollar may significantly impact profitability and cash flow.
Foreign Currency Hedging
To manage foreign currency risk, the Company may enter into forward foreign currency contracts and option contracts when the Company believes such contracts would be beneficial. The Company had no outstanding foreign exchange contracts at
December 31, 2015
.
52
Item 8.
Financial Statements and Supplementary Data
Report of Independent Registered Public Accounting Firm
The Board of Directors and Stockholders
Coeur Mining, Inc.:
We have audited the accompanying consolidated balance sheets of Coeur Mining, Inc. and subsidiaries (the Company) as of December 31, 2015 and 2014, and the related consolidated statements of comprehensive income (loss), changes in stockholders' equity, and cash flows for each of the years in the three-year period ended December 31, 2015. These consolidated financial statements are the responsibility of the Company's management. Our responsibility is to express an opinion on these consolidated financial statements based on our audits.
We conducted our audits in accordance with the standards of the Public Company Accounting Oversight Board (United States). Those standards require that we plan and perform the audit to obtain reasonable assurance about whether the financial statements are free of material misstatement. An audit includes examining, on a test basis, evidence supporting the amounts and disclosures in the financial statements. An audit also includes assessing the accounting principles used and significant estimates made by management, as well as evaluating the overall financial statement presentation. We believe that our audits provide a reasonable basis for our opinion.
In our opinion, the consolidated financial statements referred to above present fairly, in all material respects, the financial position of Coeur Mining, Inc. and subsidiaries as of December 31, 2015 and 2014, and the results of their operations and their cash flows for each of the years in the three-year period ended December 31, 2015, in conformity with U.S. generally accepted accounting principles.
We also have audited, in accordance with the standards of the Public Company Accounting Oversight Board (United States), Coeur Mining, Inc.'s internal control over financial reporting as of December 31, 2015, based on criteria established in
Internal Control - Integrated Framework (2013)
issued by the Committee of Sponsoring Organizations of the Treadway Commission (COSO), and our report dated February 10, 2016 expressed an unqualified opinion on the effectiveness of the Company's internal control over financial reporting.
/s/ KPMG LLP
Chicago, Illinois
February 10, 2016
53
Report of Independent Registered Public Accounting Firm
The Board of Directors and Stockholders
Coeur Mining, Inc.:
We have audited Coeur Mining, Inc.'s internal control over financial reporting as of December 31, 2015, based on criteria established in
Internal Control - Integrated Framework (2013)
issued by the Committee of Sponsoring Organizations of the Treadway Commission (COSO). Coeur Mining, Inc.'s management is responsible for maintaining effective internal control over financial reporting and for its assessment of the effectiveness of internal control over financial reporting, included in the accompanying Management's Report on Internal Control over Financial Reporting. Our responsibility is to express an opinion on the Company's internal control over financial reporting based on our audit.
We conducted our audit in accordance with the standards of the Public Company Accounting Oversight Board (United States). Those standards require that we plan and perform the audit to obtain reasonable assurance about whether effective internal control over financial reporting was maintained in all material respects. Our audit included obtaining an understanding of internal control over financial reporting, assessing the risk that a material weakness exists, and testing and evaluating the design and operating effectiveness of internal control based on the assessed risk. Our audit also included performing such other procedures as we considered necessary in the circumstances. We believe that our audit provides a reasonable basis for our opinion.
A company's internal control over financial reporting is a process designed to provide reasonable assurance regarding the reliability of financial reporting and the preparation of financial statements for external purposes in accordance with generally accepted accounting principles. A company's internal control over financial reporting includes those policies and procedures that (1) pertain to the maintenance of records that, in reasonable detail, accurately and fairly reflect the transactions and dispositions of the assets of the company; (2) provide reasonable assurance that transactions are recorded as necessary to permit preparation of financial statements in accordance with generally accepted accounting principles, and that receipts and expenditures of the company are being made only in accordance with authorizations of management and directors of the company; and (3) provide reasonable assurance regarding prevention or timely detection of unauthorized acquisition, use, or disposition of the company's assets that could have a material effect on the financial statements.
Because of its inherent limitations, internal control over financial reporting may not prevent or detect misstatements. Also, projections of any evaluation of effectiveness to future periods are subject to the risk that controls may become inadequate because of changes in conditions, or that the degree of compliance with the policies or procedures may deteriorate.
In our opinion, Coeur Mining, Inc. maintained, in all material respects, effective internal control over financial reporting as of December 31, 2015, based on criteria established in
Internal Control - Integrated Framework (2013)
issued by the Committee of Sponsoring Organizations of the Treadway Commission (COSO).
Coeur Mining, Inc. acquired Wharf during 2015, and management excluded the internal control over financial reporting of Wharf from its assessment of the effectiveness of Coeur Mining, Inc.’s internal control over financial reporting as of December 31, 2015. Coeur Mining, Inc.’s consolidated financial statements related to Wharf reflect total assets of
$136.0 million
and total revenues of
$84.1 million
. Our audit of internal control over financial reporting of Coeur Mining, Inc. also excluded an evaluation of the internal control over financial reporting of Wharf.
We also have audited, in accordance with the standards of the Public Company Accounting Oversight Board (United States), the consolidated balance sheets of Coeur Mining, Inc. and subsidiaries as of December 31, 2015 and 2014, and the related consolidated statements of comprehensive income (loss), changes in stockholders' equity and cash flows for each of the years in the three-year period ended December 31, 2015, and our report dated February 10, 2016 expressed an unqualified opinion on those consolidated financial statements.
/s/ KPMG LLP
Chicago, Illinois
February 10, 2016
54
COEUR MINING, INC. AND SUBSIDIARIES
|
|
Year ended December 31,
|
|||||||||||
|
|
2015
|
2014
|
2013
|
|||||||||
|
|
Notes
|
In thousands, except share data
|
||||||||||
|
Revenue
|
3
|
$
|
646,086
|
|
$
|
635,742
|
|
$
|
745,994
|
|
||
|
COSTS AND EXPENSES
|
||||||||||||
|
Costs applicable to sales
(1)
|
3
|
479,654
|
|
477,945
|
|
463,663
|
|
|||||
|
Amortization
|
143,751
|
|
162,436
|
|
229,564
|
|
||||||
|
General and administrative
|
32,834
|
|
40,845
|
|
55,343
|
|
||||||
|
Exploration
|
11,647
|
|
21,740
|
|
22,360
|
|
||||||
|
Litigation settlement
|
—
|
|
—
|
|
32,046
|
|
||||||
|
Write-downs
|
313,337
|
|
1,472,721
|
|
772,993
|
|
||||||
|
Pre-development, reclamation, and other
|
17,793
|
|
26,037
|
|
15,184
|
|
||||||
|
Total costs and expenses
|
999,016
|
|
2,201,724
|
|
1,591,153
|
|
||||||
|
OTHER INCOME (EXPENSE), NET
|
||||||||||||
|
Fair value adjustments, net
|
10
|
5,202
|
|
3,618
|
|
82,768
|
|
|||||
|
Interest expense, net of capitalized interest
|
19
|
(45,703
|
)
|
(47,546
|
)
|
(41,303
|
)
|
|||||
|
Other, net
|
11
|
(15
|
)
|
(5,218
|
)
|
(4,985
|
)
|
|||||
|
Total other income (expense), net
|
(40,516
|
)
|
(49,146
|
)
|
36,480
|
|
||||||
|
Income (loss) before income and mining taxes
|
(393,446
|
)
|
(1,615,128
|
)
|
(808,679
|
)
|
||||||
|
Income and mining tax (expense) benefit
|
8
|
26,263
|
|
428,254
|
|
158,116
|
|
|||||
|
NET INCOME (LOSS)
|
$
|
(367,183
|
)
|
$
|
(1,186,874
|
)
|
$
|
(650,563
|
)
|
|||
|
OTHER COMPREHENSIVE INCOME (LOSS), net of tax:
|
||||||||||||
|
Unrealized gain (loss) on equity securities, net of tax of $1,446 and $5,362 for the years ended December 31, 2014 and 2013, respectively
|
(4,154
|
)
|
(2,290
|
)
|
(8,489
|
)
|
||||||
|
Reclassification adjustments for impairment of equity securities, net of tax of $(2,552) and $(7,087) for the years ended December 31, 2014 and 2013, respectively
|
2,346
|
|
4,042
|
|
11,221
|
|
||||||
|
Reclassification adjustments for realized loss on sale of equity securities, net of tax of $(219) and $(53) for the years ended December 31, 2014 and 2013 respectively
|
894
|
|
346
|
|
83
|
|
||||||
|
Other comprehensive income (loss)
|
(914
|
)
|
2,098
|
|
2,815
|
|
||||||
|
COMPREHENSIVE INCOME (LOSS)
|
$
|
(368,097
|
)
|
$
|
(1,184,776
|
)
|
$
|
(647,748
|
)
|
|||
|
NET INCOME (LOSS) PER SHARE
|
9
|
|||||||||||
|
Basic
|
$
|
(2.83
|
)
|
$
|
(11.59
|
)
|
$
|
(6.65
|
)
|
|||
|
Diluted
|
$
|
(2.83
|
)
|
$
|
(11.59
|
)
|
$
|
(6.65
|
)
|
|||
(1) Excludes amortization.
The accompanying notes are an integral part of these consolidated financial statements.
55
COEUR MINING, INC. AND SUBSIDIARIES
|
|
Year ended December 31,
|
||||||||||||
|
|
2015
|
2014
|
2013
|
||||||||||
|
|
Notes
|
In thousands
|
|||||||||||
|
CASH FLOWS FROM OPERATING ACTIVITIES:
|
|||||||||||||
|
Net income (loss)
|
$
|
(367,183
|
)
|
(1,186,874
|
)
|
(650,563
|
)
|
||||||
|
Adjustments:
|
|||||||||||||
|
Amortization
|
143,751
|
|
162,436
|
|
229,564
|
|
|||||||
|
Accretion
|
14,149
|
|
16,246
|
|
20,810
|
|
|||||||
|
Deferred income taxes
|
(40,838
|
)
|
(448,905
|
)
|
(177,178
|
)
|
|||||||
|
Loss on termination of revolving credit facility
|
—
|
|
3,035
|
|
—
|
|
|||||||
|
Gain on extinguishment of senior notes
|
(16,187
|
)
|
—
|
|
—
|
|
|||||||
|
Fair value adjustments, net
|
10
|
(5,202
|
)
|
(3,618
|
)
|
(80,399
|
)
|
||||||
|
Litigation settlement
|
21
|
—
|
|
—
|
|
22,046
|
|
||||||
|
Stock-based compensation
|
6
|
9,272
|
|
9,288
|
|
4,812
|
|
||||||
|
(Gain) loss on sale of assets
|
—
|
|
—
|
|
(9,801
|
)
|
|||||||
|
Impairment of equity securities
|
14
|
2,346
|
|
6,593
|
|
18,308
|
|
||||||
|
Write-downs
|
313,337
|
|
1,472,721
|
|
772,993
|
|
|||||||
|
Foreign exchange and other
|
16,574
|
|
124
|
|
(244
|
)
|
|||||||
|
Changes in operating assets and liabilities:
|
|||||||||||||
|
Receivables
|
17,560
|
|
(11,611
|
)
|
663
|
|
|||||||
|
Prepaid expenses and other current assets
|
(3,063
|
)
|
5,635
|
|
(15,165
|
)
|
|||||||
|
Inventory and ore on leach pads
|
19,573
|
|
12,971
|
|
4,031
|
|
|||||||
|
Accounts payable and accrued liabilities
|
9,453
|
|
15,507
|
|
(25,910
|
)
|
|||||||
|
CASH PROVIDED BY OPERATING ACTIVITIES
|
113,542
|
|
53,548
|
|
113,967
|
|
|||||||
|
CASH FLOWS FROM INVESTING ACTIVITIES:
|
|||||||||||||
|
Capital expenditures
|
(95,193
|
)
|
(64,244
|
)
|
(100,813
|
)
|
|||||||
|
Acquisitions, net
|
13
|
(110,846
|
)
|
(21,329
|
)
|
(116,898
|
)
|
||||||
|
Other
|
(3,979
|
)
|
8
|
|
4,478
|
|
|||||||
|
Purchase of short-term investments and equity securities
|
(1,880
|
)
|
(50,513
|
)
|
(8,052
|
)
|
|||||||
|
Sales and maturities of short-term investments
|
605
|
|
54,344
|
|
34,796
|
|
|||||||
|
CASH USED IN INVESTING ACTIVITIES
|
(211,293
|
)
|
(81,734
|
)
|
(186,489
|
)
|
|||||||
|
CASH FLOWS FROM FINANCING ACTIVITIES:
|
|||||||||||||
|
Issuance of notes and bank borrowings
|
19
|
153,500
|
|
167,784
|
|
300,000
|
|
||||||
|
Payments on debt, capital leases, and associated costs
|
(84,715
|
)
|
(25,902
|
)
|
(60,628
|
)
|
|||||||
|
Gold production royalty payments
|
(39,235
|
)
|
(48,395
|
)
|
(57,034
|
)
|
|||||||
|
Share repurchases
|
—
|
|
—
|
|
(27,552
|
)
|
|||||||
|
Other
|
(542
|
)
|
(509
|
)
|
(514
|
)
|
|||||||
|
CASH PROVIDED BY FINANCING ACTIVITIES
|
29,008
|
|
92,978
|
|
154,272
|
|
|||||||
|
Effect of exchange rate changes on cash and cash equivalents
|
(1,404
|
)
|
(621
|
)
|
(500
|
)
|
|||||||
|
INCREASE (DECREASE) IN CASH AND CASH EQUIVALENTS
|
(70,147
|
)
|
64,171
|
|
81,250
|
|
|||||||
|
Cash and cash equivalents at beginning of period
|
270,861
|
|
206,690
|
|
125,440
|
|
|||||||
|
Cash and cash equivalents at end of period
|
$
|
200,714
|
|
$
|
270,861
|
|
$
|
206,690
|
|
||||
The accompanying notes are an integral part of these consolidated financial statements.
56
COEUR MINING, INC. AND SUBSIDIARIES
|
December 31,
2015 |
December 31,
2014 |
||||||||
|
ASSETS
|
Notes
|
In thousands, except share data
|
|||||||
|
CURRENT ASSETS
|
|||||||||
|
Cash and cash equivalents
|
$
|
200,714
|
|
$
|
270,861
|
|
|||
|
Receivables
|
15
|
85,992
|
|
107,923
|
|
||||
|
Inventory
|
16
|
81,711
|
|
114,931
|
|
||||
|
Ore on leach pads
|
16
|
67,329
|
|
48,204
|
|
||||
|
Prepaid expenses and other
|
10,942
|
|
15,523
|
|
|||||
|
446,688
|
|
557,442
|
|
||||||
|
NON-CURRENT ASSETS
|
|||||||||
|
Property, plant and equipment, net
|
17
|
195,999
|
|
227,911
|
|
||||
|
Mining properties, net
|
18
|
589,219
|
|
501,192
|
|
||||
|
Ore on leach pads
|
16
|
44,582
|
|
37,889
|
|
||||
|
Restricted assets
|
11,633
|
|
7,037
|
|
|||||
|
Equity securities
|
14
|
2,766
|
|
5,982
|
|
||||
|
Receivables
|
15
|
24,768
|
|
21,686
|
|
||||
|
Deferred tax assets
|
|
1,942
|
|
67,515
|
|
||||
|
Other
|
14,892
|
|
9,915
|
|
|||||
|
TOTAL ASSETS
|
$
|
1,332,489
|
|
$
|
1,436,569
|
|
|||
|
LIABILITIES AND STOCKHOLDERS’ EQUITY
|
|||||||||
|
CURRENT LIABILITIES
|
|||||||||
|
Accounts payable
|
$
|
48,732
|
|
$
|
49,052
|
|
|||
|
Accrued liabilities and other
|
53,953
|
|
51,513
|
|
|||||
|
Debt
|
19
|
10,431
|
|
17,498
|
|
||||
|
Royalty obligations
|
10
|
24,893
|
|
43,678
|
|
||||
|
Reclamation
|
5
|
2,071
|
|
3,871
|
|
||||
|
140,080
|
|
165,612
|
|
||||||
|
NON-CURRENT LIABILITIES
|
|||||||||
|
Debt
|
19
|
479,979
|
|
451,048
|
|
||||
|
Royalty obligations
|
10
|
4,864
|
|
27,651
|
|
||||
|
Reclamation
|
5
|
83,197
|
|
66,943
|
|
||||
|
Deferred tax liabilities
|
|
147,132
|
|
141,076
|
|
||||
|
Other long-term liabilities
|
55,761
|
|
29,911
|
|
|||||
|
770,933
|
|
716,629
|
|
||||||
|
STOCKHOLDERS’ EQUITY
|
|||||||||
|
Common stock, par value $0.01 per share; authorized 300,000,000 shares, issued and outstanding 151,339,136 at December 31, 2015 and authorized 150,000,000 shares, issued and outstanding 103,384,408 at December 31, 2014
|
1,513
|
|
1,034
|
|
|||||
|
Additional paid-in capital
|
3,024,461
|
|
2,789,695
|
|
|||||
|
Accumulated other comprehensive income (loss)
|
(3,722
|
)
|
(2,808
|
)
|
|||||
|
Accumulated deficit
|
(2,600,776
|
)
|
(2,233,593
|
)
|
|||||
|
421,476
|
|
554,328
|
|
||||||
|
TOTAL LIABILITIES AND STOCKHOLDERS’ EQUITY
|
$
|
1,332,489
|
|
$
|
1,436,569
|
|
|||
The accompanying notes are an integral part of these consolidated financial statements.
57
COEUR MINING, INC. AND SUBSIDIARIES
CONSOLIDATED STATEMENT OF CHANGES IN STOCKHOLDERS’ EQUITY
|
In thousands
|
Common
Stock
Shares
|
Common
Stock Par
Value
|
Additional
Paid-In Capital
|
Accumulated
Deficit
|
Accumulated
Other
Comprehensive
Income (Loss)
|
Total
|
||||||||||||||||
|
Balances at December 31, 2012
|
90,342
|
|
$
|
903
|
|
$
|
2,601,254
|
|
$
|
(396,156
|
)
|
$
|
(7,721
|
)
|
$
|
2,198,280
|
|
|||||
|
Net income (loss)
|
—
|
|
—
|
|
—
|
|
(650,563
|
)
|
—
|
|
(650,563
|
)
|
||||||||||
|
Other comprehensive income
|
—
|
|
—
|
|
—
|
|
—
|
|
2,815
|
|
2,815
|
|
||||||||||
|
Common stock share buyback
|
(1,691
|
)
|
(17
|
)
|
(27,535
|
)
|
—
|
|
—
|
|
(27,552
|
)
|
||||||||||
|
Common stock issued for the acquisition of Orko Silver Corporation
|
11,573
|
|
116
|
|
179,024
|
|
—
|
|
—
|
|
179,140
|
|
||||||||||
|
Common stock issued for the acquisition of Global Royalty Corporation
|
2,130
|
|
21
|
|
22,177
|
|
—
|
|
—
|
|
22,198
|
|
||||||||||
|
Common stock issued under long-term incentive plans, net
|
489
|
|
5
|
|
6,244
|
|
—
|
|
—
|
|
6,249
|
|
||||||||||
|
Balances at December 31, 2013
|
102,843
|
|
$
|
1,028
|
|
$
|
2,781,164
|
|
$
|
(1,046,719
|
)
|
$
|
(4,906
|
)
|
$
|
1,730,567
|
|
|||||
|
Net income (loss)
|
—
|
|
—
|
|
—
|
|
(1,186,874
|
)
|
—
|
|
(1,186,874
|
)
|
||||||||||
|
Other comprehensive income (loss)
|
—
|
|
—
|
|
—
|
|
—
|
|
2,098
|
|
2,098
|
|
||||||||||
|
Common stock issued under long-term incentive plans, net
|
541
|
|
6
|
|
8,531
|
|
—
|
|
—
|
|
8,537
|
|
||||||||||
|
Balances at December 31, 2014
|
103,384
|
|
$
|
1,034
|
|
$
|
2,789,695
|
|
$
|
(2,233,593
|
)
|
$
|
(2,808
|
)
|
$
|
554,328
|
|
|||||
|
Net income (loss)
|
—
|
|
—
|
|
—
|
|
(367,183
|
)
|
—
|
|
(367,183
|
)
|
||||||||||
|
Other comprehensive income (loss)
|
—
|
|
—
|
|
—
|
|
—
|
|
(914
|
)
|
(914
|
)
|
||||||||||
|
Common stock issued for the acquisition of Paramount Gold and Silver Corp.
|
32,667
|
|
327
|
|
188,490
|
|
—
|
|
—
|
|
188,817
|
|
||||||||||
|
Common stock issued for the extinguishment of Senior Notes
|
14,365
|
|
144
|
|
38,379
|
|
—
|
|
—
|
|
38,523
|
|
||||||||||
|
Common stock issued under stock-based compensation plans, net
|
923
|
|
8
|
|
7,897
|
|
—
|
|
—
|
|
7,905
|
|
||||||||||
|
Balances at December 31, 2015
|
151,339
|
|
$
|
1,513
|
|
$
|
3,024,461
|
|
$
|
(2,600,776
|
)
|
$
|
(3,722
|
)
|
$
|
421,476
|
|
|||||
The accompanying notes are an integral part of these consolidated financial statements.
58
Coeur Mining, Inc. and Subsidiaries
Notes to Consolidated Financial Statements
Coeur Mining, Inc. (“Coeur” or “the Company”) is a gold and silver producer with mines located in the United States, Mexico, and Bolivia and exploration projects in Mexico and Argentina. The Company operates the Palmarejo complex, Kensington, Rochester, Wharf, and San Bartolomé mines, and owns Coeur Capital, which is primarily comprised of the Endeavor silver stream, other precious metal royalties, and strategic investments. The cash flow and profitability of the Company's operations are significantly impacted by the market price of gold and silver.
Use of Estimates
The Company's Consolidated Financial Statements have been prepared in accordance with United States Generally Accepted Accounting Principles. The preparation of the Company's Consolidated Financial Statements requires the Company to make estimates and assumptions that affect the reported amounts of assets and liabilities and the related disclosure of contingent assets and liabilities at the date of the Consolidated Financial Statements and reported amounts of revenues and expenses during the reporting period. The more significant areas requiring the use of management estimates and assumptions relate to metal prices and mineral reserves that are the basis for future cash flow estimates utilized in impairment calculations and units-of-production amortization calculations, environmental, reclamation and closure obligations, estimates of recoverable silver and gold in leach pad inventories, estimates of fair value for certain reporting units and asset impairments, valuation allowances for deferred tax assets, and the fair value and accounting treatment of financial instruments, equity securities, and derivative instruments. The Company bases its estimates on historical experience and on various other assumptions that are believed to be reasonable under the circumstances. Accordingly, actual results will differ from the amounts estimated in these financial statements.
Principles of Consolidation
The Consolidated Financial Statements include the wholly-owned subsidiaries of the Company, the most significant of which are Coeur Mexicana S.A. de C.V., Coeur Rochester, Inc., Coeur Alaska, Inc., Wharf Resources (U.S.A.), Empresa Minera Manquiri S.A., and Coeur Capital, Inc. All intercompany balances and transactions have been eliminated. The Company's investments in entities in which it has less than 20% ownership interest are accounted for using the cost method.
Revenue Recognition
Revenue is recognized, net of treatment and refining charges, when persuasive evidence of an arrangement exists, delivery has occurred, the price is fixed or determinable, no obligations remain, and collection is probable.
Under the Company’s concentrate sales contracts with third-party smelters, gold and silver prices are set on a specified future quotational period, typically one to three months, after the shipment date based on market prices.
Revenue
and
Costs Applicable to Sales
are recorded on a gross basis under these contracts at the time title passes to the buyer based on the forward price for the expected settlement period. The contracts, in general, provide for provisional payment based upon provisional assays and forward metal prices. Final settlement is based on the average applicable price for the specified future quotational period and generally occurs from three to six months after shipment. The Company’s provisionally priced sales contain an embedded derivative that is required to be separated from the host contract for accounting purposes. The host contract is the receivable from the sale of concentrates measured at the forward price at the time of sale. The embedded derivative does not qualify for hedge accounting and is adjusted to fair value through revenue each period until the date of final gold and silver settlement.
Cash and Cash Equivalents
Cash and cash equivalents include all highly-liquid investments with an original maturity of three months or less. The Company minimizes its credit risk by investing its cash and cash equivalents with major U.S. and international banks and financial institutions located principally in the United States with a minimum credit rating of A1, as defined by Standard & Poor’s. The Company’s management believes that no concentration of credit risk exists with respect to the investment of its cash and cash equivalents.
Receivables
Trade receivables and other receivable balances are reported at outstanding principal amounts, net of an allowance for doubtful accounts, if deemed necessary. Management evaluates the collectability of receivable account balances to determine the allowance, if any. Management considers the other party's credit risk and financial condition, as well as current and projected economic and market conditions, in determining the amount of the allowance. Receivable balances are written off when management determines that the balance is uncollectible.
59
Coeur Mining, Inc. and Subsidiaries
Notes to Consolidated Financial Statements
Ore on Leach Pads
The heap leach process extracts silver and gold by placing ore on an impermeable pad and applying a diluted cyanide solution that dissolves a portion of the contained silver and gold, which are then recovered in metallurgical processes.
The Company uses several integrated steps to scientifically measure the metal content of ore placed on the leach pads. As the ore body is drilled in preparation for the blasting process, samples are taken of the drill residue which are assayed to determine estimated quantities of contained metal. The Company estimates the quantity of ore by utilizing global positioning satellite survey techniques. The Company then processes the ore through crushing facilities where the output is again weighed and sampled for assaying. A metallurgical reconciliation with the data collected from the mining operation is completed with appropriate adjustments made to previous estimates. The crushed ore is then transported to the leach pad for application of the leaching solution. As the leach solution is collected from the leach pads, it is continuously sampled for assaying. The quantity of leach solution is measured by flow meters throughout the leaching and precipitation process. After precipitation, the product is converted to doré at the Rochester mine and a form of gold concentrate at the Wharf mine, representing the final product produced by each mine. The inventory is stated at lower of cost or market, with cost being determined using a weighted average cost method.
The historical cost of metal expected to be extracted within twelve months is classified as current and the historical cost of metals contained within the broken ore expected to be extracted beyond twelve months is classified as non-current. Ore on leach pads is valued based on actual production costs incurred to produce and place ore on the leach pad, less costs allocated to minerals recovered through the leach process.
The estimate of both the ultimate recovery expected over time and the quantity of metal that may be extracted relative to the time the leach process occurs requires the use of estimates, which are inherently inaccurate due to the nature of the leaching process. The quantities of metal contained in the ore are based upon actual weights and assay analysis. The rate at which the leach process extracts gold and silver from the crushed ore is based upon laboratory testing and actual experience of more than twenty years of leach pad operations at the Rochester mine and thirty years of leach pad operations at the Wharf mine. The assumptions used by the Company to measure metal content during each stage of the inventory conversion process includes estimated recovery rates based on laboratory testing and assaying. The Company periodically reviews its estimates compared to actual experience and revises its estimates when appropriate. Variations between actual and estimated quantities resulting from changes in assumptions and estimates that do not result in write-downs to net realizable value are accounted for on a prospective basis.
Metal and Other Inventory
Inventories include concentrate, doré, and operating materials and supplies. The classification of inventory is determined by the stage at which the ore is in the production process. All inventories are stated at the lower of cost or market, with cost being determined using a weighted average cost method. Concentrate and doré inventory includes product at the mine site and product held by refineries. Metal inventory costs include direct labor, materials, depreciation, depletion and amortization as well as overhead costs relating to mining activities.
Property, Plant, and Equipment
Expenditures for new facilities, assets acquired pursuant to capital leases, new assets or expenditures that extend the useful lives of existing facilities are capitalized and depreciated using the straight-line method at rates sufficient to depreciate such costs over the shorter of estimated productive lives of such facilities, lease term, or the useful life of the individual assets. Productive lives range from
7
to
30
years for buildings and improvements and
3
to
10
years for machinery and equipment. Certain mining equipment is depreciated using the units-of-production method based upon estimated total proven and probable reserves.
Mining Properties and Mine Development
Capitalization of mine development costs begins once all operating permits have been secured, mineralization is classified as proven and probable reserves and a final feasibility study has been completed. Mine development costs include engineering and metallurgical studies, drilling and other related costs to delineate an ore body, the removal of overburden to initially expose an ore body at open pit surface mines and the building of access ways, shafts, lateral access, drifts, ramps and other infrastructure at underground mines. Costs incurred before mineralization are classified as proven and probable reserves are expensed and classified as exploration or pre-development expense. Mine development costs are amortized using the units of production method over the estimated life of the ore body based on recoverable ounces to be mined from proven and probable reserves. Interest expense allocable to the cost of developing mining properties and to construct new facilities is capitalized until assets are ready for their intended use.
Drilling and related costs incurred at the Company’s operating mines are expensed as incurred in
Exploration,
unless the Company can conclude with a high degree of confidence, prior to the commencement of a drilling program, that the drilling costs will result in the conversion of a mineral resource into proven and probable reserves. The Company’s assessment is based on the following factors: results from previous drill programs; results from geological models; results from a mine scoping study
60
Coeur Mining, Inc. and Subsidiaries
Notes to Consolidated Financial Statements
confirming economic viability of the resource; and preliminary estimates of mine inventory, ore grade, cash flow and mine life. In addition, the Company must have all permitting and/or contractual requirements necessary to have the right to and/or control of the future benefit from the targeted ore body. The costs of a drilling program that meet these criteria are capitalized as mine development costs. Drilling and related costs of approximately
$6.0 million
and
$8.9 million
at December 31, 2015 and 2014, respectively, were capitalized.
The cost of removing overburden and waste materials to access the ore body at an open pit mine prior to the production phase are referred to as “pre-stripping costs.” Pre-stripping costs are capitalized during the development of an open pit mine. Stripping costs incurred during the production phase of a mine are variable production costs that are included as a component of inventory to be recognized in
Costs applicable to sales
in the same period as the revenue from the sale of inventory.
Mineral Interests
Significant payments related to the acquisition of land and mineral rights are capitalized. Prior to acquiring such land or mineral rights, the Company generally makes a preliminary evaluation to determine that the property has significant potential to develop an economic ore body. The time between initial acquisition and full evaluation of a property’s potential is variable and is determined by many factors including: location relative to existing infrastructure, the property’s stage of development, geological controls and metal prices. If a mineable ore body is discovered, such costs are amortized when production begins using the units-of-production method based on recoverable ounces to be mined from proven and probable reserves. If no mineable ore body is discovered, such costs are expensed in the period in which it is determined the property has no future economic value.
Write-downs
We review and evaluate our long-lived assets for impairment when events or changes in circumstances indicate that the related carrying amounts may not be recoverable. Asset impairment is considered to exist if the total estimated undiscounted pre-tax future cash flows are less than the carrying amount of the asset. In estimating future cash flows, assets are grouped at the lowest level for which there is identifiable cash flows that are largely independent of future cash flows from other asset groups. An impairment loss is measured by discounted estimated future cash flows, and recorded by reducing the asset's carrying amount to fair value. Future cash flows are estimated based on estimated quantities of recoverable minerals, expected silver and gold prices (considering current and historical prices, trends and related factors), production levels, operating costs, capital requirements and reclamation costs, all based on life-of-mine plans. The significant assumptions used in determining future cash flows for each mine site asset group at December 31, 2015, apart from production cost and capitalized expenditure assumptions unique to each operation, included long-term silver and gold prices of
$17.50
and
$1,200
per ounce (consistent with the Company’s long-term reserve prices), respectively, and discount rates ranging from
7.50%
-
11.00%
(to reflect project and country-specific risks). During 2015, 2014, and 2013, we recorded impairments of
$313.3 million
,
$1,472.7 million
, and
$773.0 million
, respectively, to reduce the carrying value of mining properties and property, plant and equipment as part of
Write-downs.
Existing proven and probable reserves and value beyond proven and probable reserves, including mineralization other than proven and probable reserves are included when determining the fair value of mine site asset groups at acquisition and, subsequently, in determining whether the assets are impaired. The term “recoverable minerals” refers to the estimated amount of silver and gold that will be obtained after taking into account losses during ore processing and treatment. Estimates of recoverable minerals from exploration stage mineral interests are risk adjusted based on management’s relative confidence in such materials. The ability to achieve the estimated quantities of recoverable minerals from exploration stage mineral interests involves further risks in addition to those risk factors applicable to mineral interests where proven and probable reserves have been identified, due to the lower level of confidence that the identified mineralized material could ultimately be mined economically. Assets classified as exploration potential have the highest level of risk that the carrying value of the asset can be ultimately realized, due to the still lower level of geological confidence and economic modeling.
Silver and gold prices are volatile and affected by many factors beyond the Company’s control, including prevailing interest rates and returns on other asset classes, expectations regarding inflation, speculation, currency values, governmental decisions regarding precious metals stockpiles, global and regional demand and production, political and economic conditions and other factors may affect the key assumptions used in the Company’s impairment testing. Various factors could impact our ability to achieve forecasted production levels from proven and probable reserves. Additionally, production, capital and reclamation costs could differ from the assumptions used in the cash flow models used to assess impairment. Actual results may vary from the Company’s estimates and result in additional
Write-downs
.
61
Coeur Mining, Inc. and Subsidiaries
Notes to Consolidated Financial Statements
Restricted Assets
The Company, under the terms of its self-insurance and bonding agreements with certain banks, lending institutions and regulatory agencies, is required to collateralize certain portions of its obligations. The Company has collateralized these obligations by assigning certificates of deposit that have maturity dates ranging from three months to a year, to the respective institutions or agencies. At December 31, 2015 and 2014, the Company held certificates of deposit and cash under these agreements of
$6.3 million
and
$7.0 million
, respectively. The ultimate timing of the release of the collateralized amounts is dependent on the timing and closure of each mine and repayment of the facility. In order to release the collateral, the Company must seek approval from certain government agencies responsible for monitoring the mine closure status. Collateral could also be released to the extent the Company is able to secure alternative financial assurance satisfactory to the regulatory agencies. The Company believes there is a reasonable probability that the collateral will remain in place beyond a twelve-month period and has therefore classified these investments as long-term.
Reclamation
The Company recognizes obligations for the expected future retirement of tangible long-lived assets and other associated asset retirement costs. The fair value of a liability for an asset retirement obligation will be recognized in the period in which it is incurred if a reasonable estimate of fair value can be made. The fair value of the liability is added to the carrying amount of the associated asset and this additional carrying amount is depreciated over the life of the asset. An accretion cost, representing the increase over time in the present value of the liability, is recorded each period in
Pre-development, reclamation, and other
. As reclamation work is performed or liabilities are otherwise settled, the recorded amount of the liability is reduced. Future remediation costs for inactive mines are accrued based on management’s best estimate at the end of each period of the discounted costs expected to be incurred at the site. Such cost estimates include, where applicable, ongoing care and maintenance and monitoring costs. Changes in estimates are reflected prospectively in the period an estimate is revised.
Foreign Currency
The assets and liabilities of the Company’s foreign subsidiaries are measured using U.S. dollars as their functional currency. Revenues and expenses are translated at the average exchange rate for the period. Foreign currency gains and losses are included in the determination of net income or loss.
Derivative Financial Instruments
The Company recognizes all derivatives as either assets or liabilities on the balance sheet and measures those instruments at fair value. Changes in the value of derivative instruments are recorded each period in the Consolidated Statement of Comprehensive Income (Loss) in
Fair value adjustments, net
. Management applies judgment in estimating the fair value of instruments that are highly sensitive to assumptions regarding commodity prices, market volatilities, and foreign currency exchange rates.
Stock-based Compensation Plans
The Company estimates the fair value of stock options using the Black-Scholes option pricing model and stock appreciation rights (“SARs”) awards using market comparison. Stock options granted are accounted for as equity-based awards and SARs are accounted for as liability-based awards. The value of the SARs is remeasured at each reporting date. The Company estimates the fair value of performance share and performance unit grants using a Monte Carlo simulation valuation model. Performance shares granted are accounted for as equity based awards and performance shares units are accounted for as liability-based awards. The Company estimates forfeitures of stock-based awards based on historical data and periodically adjusts the forfeiture rate. The adjustment of the forfeiture rate is recorded as a cumulative adjustment in the period the forfeiture estimate is changed. Compensation costs related to stock based compensation are included in
General and administrative expenses
,
Costs applicable to sales
, and
Property, plant, and equipment, net
as deemed appropriate.
Restricted stock and restricted stock units granted under the Company’s incentive plans are accounted for based on the market value of the underlying shares on the date of grant. Restricted stock awards are accounted for as equity-based awards and restricted stock unit awards are accounted for as liability-based awards. Restricted stock units are remeasured at each reporting date. Restricted stock units are settled in cash based on the number of vested restricted stock units multiplied by the current market price of the common shares when vested. Holders of the restricted stock are entitled to vote the shares and to receive any dividends declared on the shares.
Income and Mining Taxes
The Company uses an asset and liability approach which results in the recognition of deferred tax liabilities and assets for the expected future tax consequences or benefits of temporary differences between the financial reporting basis and the tax basis of assets and liabilities, as well as operating loss and tax credit carryforwards, using enacted tax rates in effect in the years in which the differences are expected to reverse.
62
Coeur Mining, Inc. and Subsidiaries
Notes to Consolidated Financial Statements
In assessing the realizability of deferred tax assets, management considers whether it is more likely than not that some portion or all of its deferred tax assets will not be realized. Management considers the scheduled reversal of deferred tax liabilities, projected future taxable income and tax planning strategies in making this assessment. A valuation allowance has been provided for the portion of the Company’s net deferred tax assets for which it is more likely than not that they will not be realized.
Revisions
During 2015, the Company completed a reconciliation of its tax basis assets and liabilities, as well as a comprehensive analysis of its income and mining taxes receivable and payable, which identified prior year immaterial errors of
$31.0 million
. The Company's results have been revised to reflect the adjustment in
Income and mining tax (expense) benefit, Deferred tax liabilities,
and
Receivables
for the year ended December 31, 2014. Certain immaterial amounts in prior years relating to foreign exchange impacts on cash have been reclassified to conform to the current presentation of the Consolidated Statement of Cash Flows.
Recent Accounting Standards
In November 2015, the FASB issued ASU 2015-17,
"Balance Sheet Classification of Deferred Taxes,"
which requires entities with a classified balance sheet to present all deferred tax assets and liabilities as non-current. The updated guidance became effective under early adoption for the Company's fiscal year beginning January 1, 2015, and resulted in a reclassification of amounts from
Current deferred tax assets
to
Non-current deferred tax assets
and
Current deferred tax liabilities
to
Non-current deferred tax liabilities
in the current and prior periods.
In September 2015, the FASB issued ASU 2015-16,
"Simplifying the Accounting for Measurement-Period Adjustments,"
which eliminates the requirement for an acquirer to retrospectively adjust the financial statements for measurement-period adjustments that occur in periods after a business combination is consummated. These changes become effective for the Company's fiscal year beginning January 1, 2016. The Company is currently evaluating the potential impact of implementing these changes on the Company's consolidated financial position, results of operations, and cash flows.
In August 2015, the FASB issued ASU 2015-14,
"Deferral of the Effective Date"
, which defers the effective date of ASU 2014-09,
"Revenue from Contracts with Customers"
to January 1, 2018. The Company is currently evaluating the potential impact of adopting the prescribed changes on the Company's consolidated financial position, results of operations, and cash flows.
In July 2015, the FASB issued ASU 2015-11, "
Simplifying the Measurement of Inventory,"
which provides a revised, simpler measurement for inventory to be measured at the lower of cost and net realizable value. These changes become effective for the Company's fiscal year beginning January 1, 2018. The Company is currently evaluating the potential impact of implementing these changes on the Company's consolidated financial position, results of operations, and cash flows.
In April 2015, the FASB issued ASU 2015-03,
"Simplifying the Presentation of Debt Issuance Costs,"
which requires that debt issuance costs related to a recognized debt liability be presented as a reduction to the carrying amount of that debt liability, not as an asset. The updated guidance became effective under early adoption for the Company's fiscal year beginning January 1, 2015, and resulted in a reclassification of amounts from
Other Non-current Assets
to
Debt
in the current and prior periods.
In February 2015, the FASB issued ASU 2015-02,
"Amendments to the Consolidation Analysis,"
which amends the consolidation requirements in ASC 810. These changes become effective for the Company's fiscal year beginning January 1, 2016. The Company is currently evaluating the potential impact of implementing these changes on the Company's consolidated financial position, results of operations, and cash flows.
The Company’s operating segments include the Palmarejo complex, Rochester, Kensington, Wharf, and San Bartolomé mines, and Coeur Capital. All operating segments are engaged in the discovery and mining of gold and silver and generate the majority of their revenues from the sale of these precious metals with the exception of Coeur Capital, which holds the Endeavor silver stream and other precious metals royalties. Other includes the La Preciosa project, Joaquin project, Martha mine, corporate office, elimination of intersegment transactions, and other items necessary to reconcile to consolidated amounts.
63
Coeur Mining, Inc. and Subsidiaries
Notes to Consolidated Financial Statements
Financial information relating to the Company’s segments is as follows (in thousands):
|
Year ended December 31, 2015
|
Palmarejo
|
Rochester
|
Kensington
|
Wharf
|
San Bartolomé
|
Coeur Capital
|
Other
|
Total
|
|||||||||||||||||||||||
|
Revenue
|
|||||||||||||||||||||||||||||||
|
Metal sales
|
$
|
169,133
|
|
$
|
143,930
|
|
$
|
148,710
|
|
$
|
84,052
|
|
$
|
84,679
|
|
$
|
8,732
|
|
$
|
—
|
|
$
|
639,236
|
|
|||||||
|
Royalties
|
—
|
|
—
|
|
—
|
|
—
|
|
—
|
|
6,850
|
|
—
|
|
6,850
|
|
|||||||||||||||
|
169,133
|
|
143,930
|
|
148,710
|
|
84,052
|
|
84,679
|
|
15,582
|
|
—
|
|
646,086
|
|
||||||||||||||||
|
Costs and Expenses
|
|||||||||||||||||||||||||||||||
|
Costs applicable to sales
(1)
|
138,476
|
|
103,994
|
|
105,640
|
|
52,197
|
|
75,827
|
|
3,520
|
|
—
|
|
479,654
|
|
|||||||||||||||
|
Amortization
|
32,423
|
|
23,906
|
|
42,240
|
|
16,378
|
|
17,798
|
|
9,010
|
|
1,996
|
|
143,751
|
|
|||||||||||||||
|
Exploration
|
4,533
|
|
1,324
|
|
2,596
|
|
134
|
|
126
|
|
(124
|
)
|
3,058
|
|
11,647
|
|
|||||||||||||||
|
Write-downs
|
224,507
|
|
—
|
|
—
|
|
—
|
|
66,712
|
|
22,118
|
|
—
|
|
313,337
|
|
|||||||||||||||
|
Other operating expenses
|
1,293
|
|
2,948
|
|
1,301
|
|
1,717
|
|
1,787
|
|
33
|
|
41,548
|
|
50,627
|
|
|||||||||||||||
|
Other income (expense)
|
|||||||||||||||||||||||||||||||
|
Fair value adjustments, net
|
3,160
|
|
818
|
|
—
|
|
—
|
|
—
|
|
—
|
|
1,224
|
|
5,202
|
|
|||||||||||||||
|
Interest expense, net
|
(4,269
|
)
|
(748
|
)
|
(218
|
)
|
—
|
|
(725
|
)
|
—
|
|
(39,743
|
)
|
(45,703
|
)
|
|||||||||||||||
|
Other, net
|
(10,968
|
)
|
(14
|
)
|
7
|
|
143
|
|
1,558
|
|
(3,182
|
)
|
12,441
|
|
(15
|
)
|
|||||||||||||||
|
Income and mining tax (expense) benefit
|
37,597
|
|
(1,497
|
)
|
—
|
|
(857
|
)
|
(5,154
|
)
|
5,542
|
|
(9,368
|
)
|
26,263
|
|
|||||||||||||||
|
Net income (loss)
|
$
|
(206,579
|
)
|
$
|
10,318
|
|
$
|
(3,278
|
)
|
$
|
12,912
|
|
$
|
(81,893
|
)
|
$
|
(16,615
|
)
|
$
|
(82,048
|
)
|
$
|
(367,183
|
)
|
|||||||
|
Segment assets
(2)
|
$
|
406,648
|
|
$
|
190,714
|
|
$
|
197,873
|
|
$
|
113,305
|
|
$
|
91,141
|
|
$
|
27,892
|
|
$
|
75,737
|
|
$
|
1,103,310
|
|
|||||||
|
Capital expenditures
|
$
|
35,991
|
|
$
|
25,330
|
|
$
|
23,834
|
|
$
|
3,211
|
|
$
|
6,220
|
|
$
|
—
|
|
$
|
607
|
|
$
|
95,193
|
|
|||||||
(1) Excludes amortization
(2) Segment assets include receivables, prepaids, inventories, property, plant and equipment, and mineral interests
|
Year ended December 31, 2014
|
Palmarejo
|
Rochester
|
Kensington
|
San Bartolomé
|
Coeur Capital
|
Other
|
Total
|
||||||||||||||||||||
|
Revenue
|
|||||||||||||||||||||||||||
|
Metal sales
|
$
|
244,003
|
|
$
|
123,768
|
|
$
|
136,960
|
|
$
|
117,749
|
|
$
|
10,046
|
|
$
|
—
|
|
$
|
632,526
|
|
||||||
|
Royalties
|
—
|
|
—
|
|
—
|
|
—
|
|
3,216
|
|
—
|
|
3,216
|
|
|||||||||||||
|
244,003
|
|
123,768
|
|
136,960
|
|
117,749
|
|
13,262
|
|
—
|
|
635,742
|
|
||||||||||||||
|
Costs and Expenses
|
|||||||||||||||||||||||||||
|
Costs applicable to sales
(1)
|
187,276
|
|
91,462
|
|
105,342
|
|
89,659
|
|
4,206
|
|
—
|
|
477,945
|
|
|||||||||||||
|
Amortization
|
69,431
|
|
20,790
|
|
43,619
|
|
19,423
|
|
7,015
|
|
2,158
|
|
162,436
|
|
|||||||||||||
|
Exploration
|
6,671
|
|
2,636
|
|
8,005
|
|
120
|
|
515
|
|
3,793
|
|
21,740
|
|
|||||||||||||
|
Write-downs
|
784,038
|
|
—
|
|
107,832
|
|
118,754
|
|
6,202
|
|
455,895
|
|
1,472,721
|
|
|||||||||||||
|
Other operating expenses
|
620
|
|
2,813
|
|
796
|
|
(251
|
)
|
938
|
|
61,966
|
|
66,882
|
|
|||||||||||||
|
Other income (expense)
|
|||||||||||||||||||||||||||
|
Fair value adjustments, net
|
(1,847
|
)
|
3,653
|
|
—
|
|
—
|
|
—
|
|
1,812
|
|
3,618
|
|
|||||||||||||
|
Interest expense, net
|
(9,320
|
)
|
(679
|
)
|
(214
|
)
|
(52
|
)
|
(1
|
)
|
(37,280
|
)
|
(47,546
|
)
|
|||||||||||||
|
Other, net
|
131
|
|
105
|
|
(22
|
)
|
2,461
|
|
(7,141
|
)
|
(752
|
)
|
(5,218
|
)
|
|||||||||||||
|
Income and mining tax (expense) benefit
|
251,840
|
|
(2,224
|
)
|
—
|
|
18,114
|
|
2,067
|
|
158,457
|
|
428,254
|
|
|||||||||||||
|
Net income (loss)
|
$
|
(563,229
|
)
|
$
|
6,922
|
|
$
|
(128,870
|
)
|
$
|
(89,433
|
)
|
$
|
(10,689
|
)
|
$
|
(401,575
|
)
|
$
|
(1,186,874
|
)
|
||||||
|
Segment assets
(2)
|
$
|
332,369
|
|
$
|
196,765
|
|
$
|
215,973
|
|
$
|
188,616
|
|
$
|
59,848
|
|
$
|
81,688
|
|
$
|
1,075,259
|
|
||||||
|
Capital expenditures
|
$
|
26,084
|
|
$
|
11,898
|
|
$
|
16,220
|
|
$
|
7,937
|
|
$
|
—
|
|
$
|
2,105
|
|
$
|
64,244
|
|
||||||
(1) Excludes amortization
(2) Segment assets include receivables, prepaids, inventories, property, plant and equipment, and mineral interests
64
Coeur Mining, Inc. and Subsidiaries
Notes to Consolidated Financial Statements
|
Year ended December 31, 2013
|
Palmarejo
|
Rochester
|
Kensington
|
San Bartolomé
|
Coeur Capital
|
Other
|
Total
|
||||||||||||||||||||
|
Revenue
|
|||||||||||||||||||||||||||
|
Metal sales
|
$
|
324,040
|
|
$
|
119,254
|
|
$
|
148,769
|
|
$
|
141,721
|
|
$
|
12,871
|
|
$
|
(661
|
)
|
$
|
745,994
|
|
||||||
|
Royalties
|
—
|
|
—
|
|
—
|
|
—
|
|
—
|
|
—
|
|
—
|
|
|||||||||||||
|
324,040
|
|
119,254
|
|
148,769
|
|
141,721
|
|
12,871
|
|
(661
|
)
|
745,994
|
|
||||||||||||||
|
Costs and Expenses
|
|||||||||||||||||||||||||||
|
Costs applicable to sales
(1)
|
188,572
|
|
77,869
|
|
104,575
|
|
86,827
|
|
5,820
|
|
—
|
|
463,663
|
|
|||||||||||||
|
Amortization
|
133,535
|
|
8,890
|
|
62,750
|
|
19,103
|
|
3,755
|
|
1,531
|
|
229,564
|
|
|||||||||||||
|
Exploration
|
7,161
|
|
2,653
|
|
4,199
|
|
111
|
|
2,069
|
|
6,167
|
|
22,360
|
|
|||||||||||||
|
Write-downs
|
642,094
|
|
—
|
|
130,694
|
|
—
|
|
—
|
|
205
|
|
772,993
|
|
|||||||||||||
|
Other operating expenses
|
705
|
|
36,265
|
|
735
|
|
6,205
|
|
1,397
|
|
57,266
|
|
102,573
|
|
|||||||||||||
|
Other income (expense)
|
|||||||||||||||||||||||||||
|
Fair value adjustments, net
|
76,218
|
|
416
|
|
7,480
|
|
—
|
|
—
|
|
(1,346
|
)
|
82,768
|
|
|||||||||||||
|
Interest expense, net
|
(15,123
|
)
|
(20
|
)
|
(424
|
)
|
(74
|
)
|
—
|
|
(25,662
|
)
|
(41,303
|
)
|
|||||||||||||
|
Other, net
|
906
|
|
(318
|
)
|
(187
|
)
|
2,582
|
|
(19,474
|
)
|
11,506
|
|
(4,985
|
)
|
|||||||||||||
|
Income and mining tax (expense) benefit
|
107,748
|
|
(2,332
|
)
|
(1
|
)
|
(10,938
|
)
|
2,179
|
|
61,460
|
|
158,116
|
|
|||||||||||||
|
Net income (loss)
|
$
|
(478,278
|
)
|
$
|
(8,677
|
)
|
$
|
(147,316
|
)
|
$
|
21,045
|
|
$
|
(17,465
|
)
|
$
|
(19,872
|
)
|
$
|
(650,563
|
)
|
||||||
|
Segment assets
(2)
|
$
|
1,164,852
|
|
$
|
176,789
|
|
$
|
343,144
|
|
$
|
289,272
|
|
$
|
62,678
|
|
$
|
522,084
|
|
$
|
2,558,819
|
|
||||||
|
Capital expenditures
|
$
|
33,730
|
|
$
|
29,406
|
|
$
|
21,404
|
|
$
|
11,568
|
|
$
|
—
|
|
$
|
4,705
|
|
$
|
100,813
|
|
||||||
(1) Excludes amortization
(2) Segment assets include receivables, prepaids, inventories, property, plant and equipment, and mineral interests
|
Assets
|
December 31, 2015
|
|
December 31, 2014
|
||||
|
Total assets for reportable segments
|
$
|
1,103,310
|
|
$
|
1,075,259
|
|
|
|
Cash and cash equivalents
|
200,714
|
|
270,861
|
|
|||
|
Other assets
|
28,465
|
|
90,449
|
|
|||
|
Total consolidated assets
|
$
|
1,332,489
|
|
$
|
1,436,569
|
|
|
Geographic Information
|
Long-Lived Assets
|
December 31, 2015
|
|
December 31, 2014
|
||||
|
Mexico
|
$
|
390,694
|
|
$
|
298,101
|
|
|
|
United States
|
336,210
|
|
275,594
|
|
|||
|
Bolivia
|
35,201
|
|
107,960
|
|
|||
|
Australia
|
5,952
|
|
21,362
|
|
|||
|
Argentina
|
10,871
|
|
10,970
|
|
|||
|
Other
|
9,058
|
|
15,116
|
|
|||
|
Total
|
$
|
787,986
|
|
$
|
729,103
|
|
|
|
Revenue
|
Year ended December 31,
|
|||||||||||
|
2015
|
2014
|
2013
|
||||||||||
|
United States
|
$
|
376,692
|
|
$
|
260,728
|
|
$
|
268,023
|
|
|||
|
Mexico
|
171,911
|
|
245,493
|
|
324,040
|
|
||||||
|
Bolivia
|
84,679
|
|
117,749
|
|
141,721
|
|
||||||
|
Australia
|
8,732
|
|
10,046
|
|
12,871
|
|
||||||
|
Other
|
4,072
|
|
1,726
|
|
(661
|
)
|
||||||
|
Total
|
$
|
646,086
|
|
$
|
635,742
|
|
$
|
745,994
|
|
|||
The Company's doré, as well as the concentrate product produced by the Wharf mine, is refined into gold and silver bullion according to benchmark standards set by the London Bullion Market Association, which regulates the acceptable requirements for bullion traded in the London precious metals markets. The Company then sells its silver and gold bullion to
65
Coeur Mining, Inc. and Subsidiaries
Notes to Consolidated Financial Statements
multi-national banks, bullion trading houses, and refiners across the globe. The Company has
eleven
trading counterparties and the sales of metals to these companies amounted to approximately
74%
,
63%
, and
72%
of total metal sales for the years ended December 31, 2015, 2014, and 2013, respectively. Generally, the loss of a single bullion trading counterparty would not adversely affect the Company due to the liquidity of the markets and the availability of alternative trading counterparties.
The Company's concentrate produced by the Kensington mine is sold to smelters under purchase and sale agreements, and the smelters pay the Company for the gold or silver recovered from the concentrates. The Company currently sells concentrate to
three
smelters, and sales to these companies amounted to approximately
26%
,
37%
, and
28%
of total metal sales for the years ended December 31, 2015, 2014, and 2013, respectively. While the loss of any one smelter may have a material adverse effect if alternate smelters are not available, the Company believes that there is sufficient global capacity available to address the loss of a smelter.
The following table indicates customers that represent 10% or more of total sales of metal for at least one of the years December 31, 2015, 2014, and 2013 (in millions):
|
Years Ended December 31,
|
||||||||||||||
|
Customer
|
2015
|
2014
|
2013
|
Segments reporting revenue
|
||||||||||
|
Mitsui & Co.
|
$
|
137.7
|
|
$
|
133.8
|
|
$
|
70.3
|
|
Palmarejo, Rochester
|
||||
|
China National Gold
|
126.2
|
|
86.8
|
|
81.5
|
|
Kensington
|
|||||||
|
Asahi (formerly Johnson Matthey)
|
84.2
|
|
71.8
|
|
66.4
|
|
Wharf, Rochester, San Bartolomé
|
|||||||
|
TD Securities
|
81.3
|
|
106.7
|
|
106.7
|
|
Palmarejo, Rochester
|
|||||||
|
Standard Bank
|
34.7
|
|
87.5
|
|
69.0
|
|
Palmarejo, Rochester
|
|||||||
|
INTL Commodities
|
33.1
|
|
22.4
|
|
84.6
|
|
Palmarejo, San Bartolomé, Rochester
|
|||||||
|
Valcambi
|
—
|
|
33.9
|
|
77.2
|
|
Palmarejo, San Bartolomé
|
|||||||
|
Auramet
|
—
|
|
10.8
|
|
111.7
|
|
Palmarejo, San Bartolomé, Kensington, Rochester
|
|||||||
|
Year ended December 31,
|
||||||||||||
|
2015
|
2014
|
2013
|
||||||||||
|
Mining properties
|
||||||||||||
|
Palmarejo
|
$
|
205,803
|
|
$
|
668,803
|
|
$
|
539,359
|
|
|||
|
San Bartolomé
|
16,690
|
|
32,328
|
|
—
|
|
||||||
|
Kensington
|
—
|
|
67,671
|
|
82,337
|
|
||||||
|
La Preciosa
|
—
|
|
371,411
|
|
—
|
|
||||||
|
Joaquin
|
—
|
|
83,429
|
|
—
|
|
||||||
|
Coeur Capital
|
22,118
|
|
6,202
|
|
—
|
|
||||||
|
Martha
|
—
|
|
—
|
|
205
|
|
||||||
|
244,611
|
|
1,229,844
|
|
621,901
|
|
|||||||
|
Property, plant, and equipment
|
||||||||||||
|
Palmarejo
|
$
|
18,704
|
|
$
|
115,235
|
|
$
|
102,735
|
|
|||
|
San Bartolomé
|
50,022
|
|
86,426
|
|
—
|
|
||||||
|
Kensington
|
—
|
|
40,161
|
|
48,357
|
|
||||||
|
La Preciosa
|
—
|
|
1,055
|
|
—
|
|
||||||
|
68,726
|
|
242,877
|
|
151,092
|
|
|||||||
|
Total
|
$
|
313,337
|
|
$
|
1,472,721
|
|
$
|
772,993
|
|
|||
The 2015 write-down of
$313.3 million
(
$276.5 million
net of tax) was due to a
$224.5 million
impairment of the Palmarejo complex (
$193.5 million
net of tax) and a
$66.7 million
impairment of the San Bartolomé mine, and a
$22.1 million
impairment (
$16.3 million
net of tax) of certain Coeur Capital assets, including the Endeavor silver stream and other royalties. The non-cash
66
Coeur Mining, Inc. and Subsidiaries
Notes to Consolidated Financial Statements
impairment charges were largely driven by significant decreases in long-term metal price assumptions and revised mine plans in the fourth quarter. For purposes of this evaluation, estimates of future cash flows of the individual reporting units were used to determine fair value. The estimated cash flows were derived from life-of-mine plans, developed using long-term pricing reflective of the current price environment and management’s projections for operating costs.
The 2014 write-down of
$1,472.7 million
(
$1,021.8 million
net of tax) was primarily due to a
$784.0 million
impairment of the Palmarejo complex (
$504.5 million
net of tax) and a
$372.5 million
impairment of the La Preciosa project (
$244.9 million
net of tax) due to a decrease in the Company's long-term silver and gold price assumptions reflective of the current silver and gold price environment and revised mine plans.
The 2013 write-down of
$773.0 million
was primarily due to a
$642.1 million
impairment of the Palmarejo complex (
$462.3 million
net of tax) and a
$130.7 million
impairment of the Kensington mine due to a decrease in the Company's long-term silver and gold price assumptions reflective of the current silver and gold price environment.
Reclamation and mine closure costs are based principally on legal and regulatory requirements. Management estimates costs associated with reclamation of mining properties. The Company uses assumptions about future costs, mineral prices, mineral processing recovery rates, production levels, capital costs, and reclamation costs. On an ongoing basis, management evaluates its estimates and assumptions, and future expenditures could differ from current estimates.
Changes to the Company’s asset retirement obligations for operating sites are as follows:
|
Year ended December 31,
|
|||||||
|
In thousands
|
2015
|
2014
|
|||||
|
Asset retirement obligation - Beginning
|
$
|
67,214
|
|
$
|
55,966
|
|
|
|
Accretion
|
7,738
|
|
4,826
|
|
|||
|
Additions and changes in estimates
|
11,939
|
|
6,748
|
|
|||
|
Settlements
|
(4,819
|
)
|
(326
|
)
|
|||
|
Asset retirement obligation - Ending
|
$
|
82,072
|
|
$
|
67,214
|
|
|
The increase in asset retirement obligations in the year ended
December 31, 2015
is primarily due to the acquisition of the Wharf gold mine. The Company has accrued
$3.2 million
and
$3.6 million
at
December 31, 2015
and
December 31, 2014
, respectively, for reclamation liabilities related to former mining activities, which are included in
Reclamation.
The Company has stock incentive plans for executives and eligible employees. Stock awards include stock options, restricted stock, and performance shares. The Company previously awarded stock appreciation rights, restricted stock units, and performance share units. Stock-based compensation expense for the years ended December 31, 2015, 2014, and 2013 was
$9.3 million
,
$9.3 million
, and
$4.8 million
, respectively. At December 31, 2015, there was
$8.0 million
of unrecognized stock-based compensation cost which is expected to be recognized over a weighted-average remaining vesting period of
1.4
years.
Stock Options and Stock Appreciation Rights
Stock options and stock appreciation rights (SARs) granted under the Company’s incentive plans vest over three years and are exercisable over a period not to exceed ten years from the grant date. The exercise price of stock options is equal to the fair market value of the shares on the date of the grant. The value of each stock option award is estimated using the Black-Scholes option pricing model. Stock options are accounted for as equity awards and SARs are accounted for as liability awards and remeasured at each reporting date. SARs, when vested, provide the participant the right to receive cash equal to the excess of the market price of the shares over the exercise price when exercised.
67
Coeur Mining, Inc. and Subsidiaries
Notes to Consolidated Financial Statements
The following table sets forth the weighted average fair value of stock options and the assumptions used to estimate the fair value of the stock options using the Black-Scholes option valuation model:
|
2015
|
2014
|
2013
|
|||||||||
|
Weighted average fair value of stock options granted
|
$
|
2.65
|
|
$
|
3.79
|
|
$
|
12.60
|
|
||
|
Volatility
|
55.71
|
%
|
50.93
|
%
|
76.74
|
%
|
|||||
|
Expected life in years
|
4.75
|
|
3.9
|
|
5.0
|
|
|||||
|
Risk-free interest rate
|
1.51
|
%
|
1.25
|
%
|
0.84
|
%
|
|||||
|
Dividend yield
|
—
|
|
—
|
|
—
|
|
|||||
The following table summarizes stock option and SAR activity for the years ended December 31, 2015, 2014, and 2013:
|
|
Stock Options
|
SARs
|
|||||||||||
|
Shares
|
Weighted
Average
Exercise
Price
|
Shares
|
Weighted
Average Exercise Price |
||||||||||
|
Outstanding at December 31, 2012
|
370,000
|
|
$
|
30.20
|
|
68,865
|
|
$
|
13.83
|
|
|||
|
Granted
|
190,452
|
|
20.41
|
|
—
|
|
—
|
|
|||||
|
Exercised
|
(13,027
|
)
|
10.77
|
|
(6,617
|
)
|
13.14
|
|
|||||
|
Canceled/forfeited
|
(131,855
|
)
|
29.30
|
|
(12,039
|
)
|
15.40
|
|
|||||
|
Outstanding at December 31, 2013
|
415,570
|
|
27.36
|
|
50,209
|
|
14.15
|
|
|||||
|
Granted
|
415,172
|
|
9.45
|
|
—
|
|
—
|
|
|||||
|
Exercised
|
—
|
|
—
|
|
—
|
|
—
|
|
|||||
|
Canceled/forfeited
|
(232,396
|
)
|
23.94
|
|
(3,637
|
)
|
15.40
|
|
|||||
|
Outstanding at December 31, 2014
|
598,346
|
|
16.26
|
|
46,572
|
|
14.06
|
|
|||||
|
Granted
|
310,028
|
|
5.57
|
|
—
|
|
—
|
|
|||||
|
Exercised
|
—
|
|
—
|
|
—
|
|
—
|
|
|||||
|
Canceled/forfeited
|
(238,365
|
)
|
12.69
|
|
—
|
|
—
|
|
|||||
|
Outstanding at December 31, 2015
|
670,009
|
|
$
|
12.58
|
|
46,572
|
|
$
|
14.06
|
|
|||
|
|
Options Outstanding
|
Options Exercisable
|
||||||||||||||||
|
Range of
Exercise Price
|
Number
Outstanding
|
Weighted Average
Exercise
Price
|
Weighted
Average
Remaining
Contractual
Life (Years)
|
Number
Exercisable
|
Weighted
Average
Exercise
Price
|
Weighted
Average
Remaining
Contractual Life (Years)
|
||||||||||||
|
$ 0.00-$10.00
|
439,746
|
|
$
|
7.33
|
|
8.71
|
75,613
|
|
$
|
9.41
|
|
7.49
|
||||||
|
$10.00-$20.00
|
71,540
|
|
13.42
|
|
7.56
|
40,823
|
|
14.56
|
|
7.31
|
||||||||
|
$20.00-$30.00
|
149,992
|
|
25.63
|
|
6.31
|
126,828
|
|
25.98
|
|
6.17
|
||||||||
|
$30.00-$40.00
|
3,134
|
|
39.90
|
|
1.22
|
3,134
|
|
39.90
|
|
1.22
|
||||||||
|
$40.00-$50.00
|
3,336
|
|
48.50
|
|
2.03
|
3,336
|
|
48.50
|
|
2.03
|
||||||||
|
$50.00-$60.00
|
2,261
|
|
51.40
|
|
0.14
|
2,261
|
|
51.40
|
|
0.14
|
||||||||
|
670,009
|
|
$
|
12.58
|
|
251,995
|
|
$
|
19.86
|
|
|||||||||
At December 31, 2015, there was
$0.4 million
of unrecognized compensation cost related to non-vested stock options to be recognized over a weighted average period of
1.1
years.
Restricted Stock and Restricted Stock Units
Restricted stock granted under the Company’s incentive plans are accounted for based on the market value of the underlying shares on the date of grant and vest in equal installments annually over three years. Restricted stock awards are accounted for as equity awards and restricted stock unit awards were accounted for as liability awards. Restricted stock units were remeasured at each reporting date and settled in cash based on the number of vested restricted stock units multiplied by the current market price
68
Coeur Mining, Inc. and Subsidiaries
Notes to Consolidated Financial Statements
of the common shares when vested. Holders of restricted stock are entitled to vote the shares and to receive any dividends declared on the shares.
The following table summarizes restricted stock and restricted stock units activity for the years ended December 31, 2015, 2014, and 2013:
|
|
Restricted Stock
|
Restricted Stock Units
|
|||||||||||
|
Number of
Shares
|
Weighted
Average
Grant Date
Fair Value
|
Number of
Units
|
Weighted Average
Fair Value
|
||||||||||
|
Outstanding at December 31, 2012
|
239,698
|
|
$
|
25.38
|
|
11,411
|
|
$
|
24.14
|
|
|||
|
Granted
|
573,467
|
|
15.38
|
|
—
|
|
—
|
|
|||||
|
Vested
|
(90,963
|
)
|
26.83
|
|
(11,411
|
)
|
22.74
|
|
|||||
|
Cancelled/Forfeited
|
(109,116
|
)
|
23.30
|
|
—
|
|
—
|
|
|||||
|
Outstanding at December 31, 2013
|
613,086
|
|
16.68
|
|
—
|
|
—
|
|
|||||
|
Granted
|
695,897
|
|
9.83
|
|
—
|
|
—
|
|
|||||
|
Vested
|
(234,103
|
)
|
17.16
|
|
—
|
|
—
|
|
|||||
|
Cancelled/Forfeited
|
(172,881
|
)
|
11.87
|
|
—
|
|
—
|
|
|||||
|
Outstanding at December 31, 2014
|
901,999
|
|
12.19
|
|
—
|
|
—
|
|
|||||
|
Granted
|
1,180,384
|
|
5.49
|
|
—
|
|
—
|
|
|||||
|
Vested
|
(317,122
|
)
|
13.38
|
|
—
|
|
—
|
|
|||||
|
Cancelled/Forfeited
|
(257,849
|
)
|
7.59
|
|
—
|
|
—
|
|
|||||
|
Outstanding at December 31, 2015
|
1,507,412
|
|
$
|
7.49
|
|
—
|
|
$
|
—
|
|
|||
At December 31, 2015, there was
$3.2 million
of unrecognized compensation cost related to restricted stock awards to be recognized over a weighted-average period of
1.2
years.
Performance Shares and Performance Share Units
Performance shares granted under the Company’s incentive plans are accounted for at fair value using a Monte Carlo simulation valuation model on the date of grant. Performance share awards are accounted for as equity awards and performance units are accounted for as liability-based awards and remeasured each reporting date. The performance shares vest at the end of a three-year service period if relative stockholder return and internal performance metrics are met. The existence of a market condition requires recognition of compensation cost for the performance share awards over the requisite period regardless of whether the relative stockholder return metric is met. Performance share units were settled in cash based on the current market price of the common shares when vested.
69
Coeur Mining, Inc. and Subsidiaries
Notes to Consolidated Financial Statements
The following table summarizes performance shares and performance units’ activity for the years ended December 31, 2015, 2014, and 2013:
|
|
Performance Shares
|
Performance Units
|
|||||||||||
|
Number of
Shares
|
Weighted
Average
Grant Date
Fair Value
|
Number of
Units
|
Weighted Average
Fair Value
|
||||||||||
|
Outstanding at December 31, 2012
|
109,159
|
|
$
|
26.92
|
|
34,239
|
|
$
|
39.78
|
|
|||
|
Granted
|
173,773
|
|
23.35
|
|
34,239
|
|
38.02
|
|
|||||
|
Vested
|
(4,160
|
)
|
30.97
|
|
(68,478
|
)
|
38.02
|
|
|||||
|
Cancelled/Forfeited
|
(68,377
|
)
|
34.49
|
|
—
|
|
—
|
|
|||||
|
Outstanding at December 31, 2013
|
210,395
|
|
28.04
|
|
—
|
|
—
|
|
|||||
|
Granted
|
358,398
|
|
12.21
|
|
—
|
|
—
|
|
|||||
|
Vested
|
(34,611
|
)
|
27.18
|
|
—
|
|
—
|
|
|||||
|
Cancelled/Forfeited
|
(17,352
|
)
|
27.15
|
|
—
|
|
—
|
|
|||||
|
Outstanding at December 31, 2014
|
516,830
|
|
17.61
|
|
—
|
|
—
|
|
|||||
|
Granted
|
809,293
|
|
6.97
|
|
—
|
|
—
|
|
|||||
|
Vested
|
—
|
|
—
|
|
—
|
|
—
|
|
|||||
|
Cancelled/Forfeited
|
(190,988
|
)
|
15.62
|
|
—
|
|
—
|
|
|||||
|
Outstanding at December 31, 2015
|
1,135,135
|
|
$
|
10.35
|
|
—
|
|
$
|
—
|
|
|||
At December 31, 2015, there was
$3.7 million
of unrecognized compensation cost related to performance shares to be recognized over a weighted average period of
1.7
years.
Supplemental Incentive Plan
In 2014, the Company adopted a supplemental incentive plan under which benefits are payable upon achievement of certain performance and market conditions. The maximum potential incentive payout under the plan is
$3.8 million
, of which
$2.8 million
may be settled in cash or stock at the Company’s discretion. At December 31, 2015,
$2.2 million
has been accrued for this plan.
The Company has a 401(k) retirement savings plan that covers all eligible U.S. employees. Eligible employees may elect to contribute up to
75%
of base salary, subject to ERISA limitations. In addition, the Company has a deferred compensation plan for employees whose benefits under the 401(k) plan are limited by federal regulations. The Company generally makes matching contributions equal to
100%
of the employee’s contribution up to
4%
of the employee's salary. The Company may also provide a voluntary, noncontributory defined contribution based on an eligible employee's salary. Total plan expenses recognized for the years ended
December 31, 2015
, 2014, and 2013 were
$2.9 million
,
$2.6 million
, and
$4.1 million
, respectively.
The components of
Income (loss) before income taxes
are below:
|
|
Year ended December 31,
|
||||||||||
|
In thousands
|
2015
|
2014
|
2013
|
||||||||
|
United States
|
$
|
(43,924
|
)
|
$
|
(213,883
|
)
|
$
|
(242,562
|
)
|
||
|
Foreign
|
(349,522
|
)
|
(1,401,245
|
)
|
(566,117
|
)
|
|||||
|
Total
|
$
|
(393,446
|
)
|
$
|
(1,615,128
|
)
|
$
|
(808,679
|
)
|
||
70
Coeur Mining, Inc. and Subsidiaries
Notes to Consolidated Financial Statements
The components of the consolidated
Income and mining tax (expense) benefit
from continuing operations are below:
|
Year ended December 31,
|
|||||||||||
|
In thousands
|
2015
|
2014
|
2013
|
||||||||
|
Current:
|
|
|
|
|
|
|
|||||
|
United States
|
$
|
49
|
|
$
|
904
|
|
$
|
4
|
|
||
|
United States — State mining taxes
|
(4,305
|
)
|
(879
|
)
|
(714
|
)
|
|||||
|
United States — Foreign withholding tax
|
—
|
|
(6,250
|
)
|
397
|
|
|||||
|
Argentina
|
715
|
|
(71
|
)
|
(137
|
)
|
|||||
|
Australia
|
130
|
|
—
|
|
(914
|
)
|
|||||
|
Mexico
|
(476
|
)
|
(10,122
|
)
|
(9,046
|
)
|
|||||
|
Bolivia
|
(5,154
|
)
|
(4,008
|
)
|
(6,716
|
)
|
|||||
|
Canada
|
(516
|
)
|
(145
|
)
|
(1,936
|
)
|
|||||
|
Deferred:
|
|||||||||||
|
Argentina
|
(1,197
|
)
|
24,478
|
|
8,062
|
|
|||||
|
Australia
|
3,223
|
|
(401
|
)
|
(2
|
)
|
|||||
|
Bolivia
|
—
|
|
22,122
|
|
(4,222
|
)
|
|||||
|
Canada
|
2,875
|
|
2,662
|
|
—
|
|
|||||
|
Mexico
|
27,189
|
|
394,221
|
|
94,851
|
|
|||||
|
United States
|
1,778
|
|
5,743
|
|
78,489
|
|
|||||
|
United States — State mining taxes
|
1,952
|
|
—
|
|
—
|
|
|||||
|
Income tax (expense) benefit
|
$
|
26,263
|
|
$
|
428,254
|
|
$
|
158,116
|
|
||
A reconciliation of the Company’s effective tax rate with the federal statutory tax rate for the periods indicated is below:
|
|
Year ended December 31,
|
||||||||||
|
In thousands
|
2015
|
2014
|
2013
|
||||||||
|
Income and mining tax benefit (expense) at statutory rate
|
$
|
137,706
|
|
$
|
565,295
|
|
$
|
283,038
|
|
||
|
State tax provision from continuing operations
|
(2,075
|
)
|
20,253
|
|
2,245
|
|
|||||
|
Change in valuation allowance
|
(101,027
|
)
|
(151,191
|
)
|
(106,802
|
)
|
|||||
|
Non-deductible imputed interest
|
—
|
|
—
|
|
(214
|
)
|
|||||
|
Uncertain tax positions
|
(1,947
|
)
|
(4,425
|
)
|
(5,209
|
)
|
|||||
|
U.S. and foreign non-deductible expenses
|
1,365
|
|
(4,892
|
)
|
(2,383
|
)
|
|||||
|
Mineral interest related
|
(19,310
|
)
|
—
|
|
—
|
|
|||||
|
Foreign exchange rates
|
22,350
|
|
23,672
|
|
13,937
|
|
|||||
|
Foreign inflation and indexing
|
1,117
|
|
3,765
|
|
2,937
|
|
|||||
|
Foreign tax rate differences
|
(15,980
|
)
|
(63,930
|
)
|
(24,108
|
)
|
|||||
|
Foreign withholding and other taxes
|
8,140
|
|
82,884
|
|
(100,331
|
)
|
|||||
|
Foreign tax credits and other, net
|
(4,076
|
)
|
(43,177
|
)
|
13,153
|
|
|||||
|
Mexico permanent reinvestment assertion
|
—
|
|
—
|
|
81,853
|
|
|||||
|
Income and mining tax benefit (expense)
|
$
|
26,263
|
|
$
|
428,254
|
|
$
|
158,116
|
|
||
71
Coeur Mining, Inc. and Subsidiaries
Notes to Consolidated Financial Statements
At December 31, 2015 and 2014, the significant components of the Company’s deferred tax assets and liabilities are below:
|
|
Year ended December 31,
|
||||||
|
In thousands
|
2015
|
2014
|
|||||
|
Deferred tax liabilities:
|
|
|
|
|
|||
|
Mexican mining tax
|
$
|
15,451
|
|
$
|
8,065
|
|
|
|
Foreign subsidiaries — unremitted earnings
|
12,999
|
|
45,249
|
|
|||
|
Inventory
|
2,353
|
|
3,135
|
|
|||
|
Royalty and other long-term debt
|
1,648
|
|
—
|
|
|||
|
|
$
|
32,451
|
|
$
|
56,449
|
|
|
|
Deferred tax assets:
|
|
|
|
|
|||
|
Net operating loss carryforwards
|
203,958
|
|
153,701
|
|
|||
|
Mineral properties
|
34,966
|
|
46,006
|
|
|||
|
Property, plant, and equipment
|
6,980
|
|
38,091
|
|
|||
|
Royalty and other long-term debt
|
—
|
|
5,863
|
|
|||
|
Capital loss carryforwards
|
3,938
|
|
35,251
|
|
|||
|
Asset retirement obligation
|
21,480
|
|
21,586
|
|
|||
|
Unrealized foreign currency loss and other
|
8,424
|
|
8,213
|
|
|||
|
Accrued expenses
|
17,905
|
|
9,365
|
|
|||
|
Tax credit carryforwards
|
26,439
|
|
56,322
|
|
|||
|
|
324,090
|
|
374,398
|
|
|||
|
Valuation allowance
|
(436,829
|
)
|
(391,510
|
)
|
|||
|
|
(112,739
|
)
|
(17,112
|
)
|
|||
|
Net deferred tax liabilities
|
$
|
145,190
|
|
$
|
73,561
|
|
|
The Company reviews the measurement of its deferred tax assets at each balance sheet date. All available evidence, both positive and negative, is considered in determining whether, based upon the weight of the evidence, it is more likely than not that some portion or all of the deferred tax asset will not be realized. Based upon this analysis, the Company has recorded valuation allowances as follows:
|
|
Year ended December 31,
|
||||||
|
In thousands
|
2015
|
2014
|
|||||
|
U.S.
|
$
|
292,677
|
|
$
|
305,534
|
|
|
|
Argentina
|
8,376
|
|
21,520
|
|
|||
|
Canada
|
1,718
|
|
2,009
|
|
|||
|
Bolivia
|
45,177
|
|
15,948
|
|
|||
|
Mexico
|
63,373
|
|
14,816
|
|
|||
|
New Zealand
|
25,508
|
|
28,710
|
|
|||
|
Other
|
—
|
|
2,973
|
|
|||
|
|
$
|
436,829
|
|
$
|
391,510
|
|
|
72
Coeur Mining, Inc. and Subsidiaries
Notes to Consolidated Financial Statements
The Company has the following tax attribute carryforwards at December 31, 2015, by jurisdiction:
|
In thousands
|
U.S.
|
Argentina
|
Bolivia
|
Canada
|
Mexico
|
New Zealand
|
Other
|
Total
|
|||||||||||||||
|
Regular net operating losses
|
320,511
|
|
12,210
|
|
55,019
|
|
2,182
|
|
108,191
|
|
91,096
|
|
68
|
|
589,277
|
|
|||||||
|
Alternative minimum tax net operating losses
|
187,376
|
|
—
|
|
—
|
|
—
|
|
—
|
|
—
|
|
—
|
|
187,376
|
|
|||||||
|
Capital losses
|
11,195
|
|
—
|
|
—
|
|
—
|
|
—
|
|
—
|
|
—
|
|
11,195
|
|
|||||||
|
Alternative minimum tax credits
|
3,173
|
|
—
|
|
—
|
|
—
|
|
—
|
|
—
|
|
—
|
|
3,173
|
|
|||||||
|
Foreign tax credits
|
19,898
|
|
—
|
|
—
|
|
—
|
|
—
|
|
—
|
|
—
|
|
19,898
|
|
|||||||
The U.S. net operating losses expire from 2019 through 2035 and the Canada net operating losses will expire from 2029 through 2035. The Mexico net operating losses expire from 2017 to 2035, while the remaining net operating losses from the foreign jurisdictions have an indefinite carryforward period. The majority of the U.S. capital losses expired in 2015. Alternative minimum tax credits do not expire and foreign tax credits expire if unused beginning in 2019.
The Company intends to indefinitely reinvest earnings from certain foreign operations. For the years 2015 and 2014, the Company had no unremitted earnings from these specific foreign operations.
A reconciliation of the beginning and ending amount related to unrecognized tax benefits is below (in thousands):
|
Unrecognized tax benefits at January 1, 2014
|
$
|
15,471
|
|
|
Gross increase to current period tax positions
|
1,856
|
|
|
|
Gross increase to prior period tax positions
|
524
|
|
|
|
Reductions in unrecognized tax benefits resulting from a lapse of the applicable statute of limitations
|
(1,767
|
)
|
|
|
Unrecognized tax benefits at December 31, 2014
|
$
|
16,084
|
|
|
Gross increase to current period tax positions
|
1,030
|
|
|
|
Gross increase to prior period tax positions
|
810
|
|
|
|
Reductions in unrecognized tax benefits resulting from a lapse of the applicable statute of limitations
|
—
|
|
|
|
Unrecognized tax benefits at December 31, 2015
|
$
|
17,924
|
|
At December 31, 2015, 2014, and 2013,
$17.9 million
,
$16.1 million
, and
$14.3 million
, respectively, of these gross unrecognized benefits would, if recognized, decrease the Company's effective tax rate.
The Company operates in numerous countries around the world and is subject to, and pays annual income taxes under, the various income tax regimes in the countries in which it operates. The Company has historically filed, and continues to file, all required income tax returns and paid the taxes reasonably determined to be due. The tax rules and regulations in many countries are highly complex and subject to interpretation. From time to time, the Company is subject to a review of its historic income tax filings and, in connection with such reviews, disputes can arise with the taxing authorities over the interpretation or application of certain rules to the Company’s business conducted within the country involved.
The Company files income tax returns in various U.S. federal and state jurisdictions, in all identified foreign jurisdictions, and various others. The statute of limitations remains open from 2012 for the US federal jurisdiction and from 2008 for certain other foreign jurisdictions. During 2014, the U.S. Internal Revenue Service concluded its examination of the Company's 2009, 2010, and 2011 tax years. As a result of statutes of limitations that will begin to expire within the next 12 months in various jurisdictions and possible settlement of audit-related issues with taxing authorities in various jurisdictions with respect to which none of these issues are individually significant, the Company believes that it is reasonably possible that the total amount of its unrecognized income tax liability will decrease between
$0.5 million
and
$1.0 million
in the next 12 months.
The Company classifies interest and penalties associated with uncertain tax positions as a component of income tax expense and recognized interest and penalties of
$9.2 million
,
$6.9 million
, and
$4.1 million
at December 31, 2015, 2014, and 2013, respectively.
73
Coeur Mining, Inc. and Subsidiaries
Notes to Consolidated Financial Statements
Basic net income (loss) per share is computed by dividing net income (loss) available to common stockholders by the weighted average number of common shares outstanding during the period. Diluted net income (loss) per share reflects the potential dilution that would occur if securities or other contracts to issue common stock were exercised or converted into common stock.
For the years ended
December 31, 2015
,
2014
, and 2013,
3,239,425
,
1,871,681
, and
1,111,021
, respectively, of common stock equivalents related to equity-based awards were not included in the diluted per share calculation as the shares would be antidilutive.
The
3.25%
Convertible Senior Notes were not included in the computation of diluted net income (loss) per share for the years ended
December 31, 2015
,
2014
, and 2013 because there is no excess value upon conversion over the principal amount of the Notes.
|
Year ended December 31,
|
|||||||||||
|
In thousands except per share amounts
|
2015
|
2014
|
2013
|
||||||||
|
Net income (loss) available to common stockholders
|
$
|
(367,183
|
)
|
$
|
(1,186,874
|
)
|
$
|
(650,563
|
)
|
||
|
Weighted average shares:
|
|||||||||||
|
Basic
|
129,639
|
|
102,441
|
|
97,864
|
|
|||||
|
Effect of stock-based compensation plans
|
—
|
|
—
|
|
—
|
|
|||||
|
Diluted
|
129,639
|
|
102,441
|
|
97,864
|
|
|||||
|
Income (loss) per share:
|
|||||||||||
|
Basic
|
$
|
(2.83
|
)
|
$
|
(11.59
|
)
|
$
|
(6.65
|
)
|
||
|
Diluted
|
$
|
(2.83
|
)
|
$
|
(11.59
|
)
|
$
|
(6.65
|
)
|
||
The following table presents the components of
Fair value adjustments, net
:
|
|
Year ended December 31,
|
|||||||||||
|
In thousands
|
2015
|
2014
|
2013
|
|||||||||
|
Palmarejo royalty obligation embedded derivative
|
$
|
3,101
|
|
$
|
(2,001
|
)
|
$
|
76,200
|
|
|||
|
Rochester net smelter royalty (NSR) royalty obligation
|
818
|
|
3,653
|
|
416
|
|
||||||
|
Silver and gold options
|
1,283
|
|
1,058
|
|
7,119
|
|
||||||
|
Foreign exchange contracts
|
—
|
|
908
|
|
(967
|
)
|
||||||
|
Fair value adjustments, net
|
$
|
5,202
|
|
$
|
3,618
|
|
$
|
82,768
|
|
|||
Accounting standards establish a fair value hierarchy that prioritizes the inputs to valuation techniques used to measure fair value. The hierarchy gives the highest priority to unadjusted quoted prices in active markets for identical assets or liabilities (Level 1), secondary priority to quoted prices in inactive markets or observable inputs (Level 2), and the lowest priority to unobservable inputs (Level 3).
The following table presents the Company’s financial assets and liabilities measured at fair value on a recurring basis (at least annually) by level within the fair value hierarchy. Assets and liabilities are classified in their entirety based on the lowest level of input that is significant to the fair value measurement:
|
|
Fair Value at December 31, 2015
|
||||||||||||||
|
In thousands
|
Total
|
Level 1
|
Level 2
|
Level 3
|
|||||||||||
|
Assets:
|
|||||||||||||||
|
Equity securities
|
$
|
2,766
|
|
$
|
2,756
|
|
$
|
—
|
|
$
|
10
|
|
|||
|
Liabilities:
|
|||||||||||||||
|
Palmarejo royalty obligation embedded derivative
|
$
|
4,957
|
|
$
|
—
|
|
$
|
—
|
|
$
|
4,957
|
|
|||
|
Rochester NSR royalty obligation
|
9,593
|
|
—
|
|
—
|
|
9,593
|
|
|||||||
|
Other derivative instruments, net
|
508
|
|
—
|
|
508
|
|
—
|
|
|||||||
|
$
|
15,058
|
|
$
|
—
|
|
$
|
508
|
|
$
|
14,550
|
|
||||
74
Coeur Mining, Inc. and Subsidiaries
Notes to Consolidated Financial Statements
|
|
Fair Value at December 31, 2014
|
||||||||||||||
|
In thousands
|
Total
|
Level 1
|
Level 2
|
Level 3
|
|||||||||||
|
Assets:
|
|||||||||||||||
|
Equity securities
|
$
|
5,982
|
|
$
|
4,603
|
|
$
|
—
|
|
$
|
1,379
|
|
|||
|
Silver and gold options
|
3,882
|
|
—
|
|
3,882
|
|
—
|
|
|||||||
|
$
|
9,864
|
|
$
|
4,603
|
|
$
|
3,882
|
|
$
|
1,379
|
|
||||
|
Liabilities:
|
|||||||||||||||
|
Palmarejo royalty obligation embedded derivative
|
$
|
21,912
|
|
$
|
—
|
|
$
|
—
|
|
$
|
21,912
|
|
|||
|
Rochester NSR royalty obligation
|
15,370
|
|
—
|
|
—
|
|
15,370
|
|
|||||||
|
Silver and gold options
|
1,039
|
|
—
|
|
1,039
|
|
—
|
|
|||||||
|
Other derivative instruments, net
|
805
|
|
—
|
|
805
|
|
—
|
|
|||||||
|
$
|
39,126
|
|
$
|
—
|
|
$
|
1,844
|
|
$
|
37,282
|
|
||||
The Company’s investments in equity securities are recorded at fair market value in the financial statements based primarily on quoted market prices. Such instruments are classified within Level 1 of the fair value hierarchy. Quoted market prices are not available for certain equity securities; these securities are valued using pricing models, which require the use of observable and unobservable inputs, and are classified within Level 3 of the fair value hierarchy.
The Company’s silver and gold options and other derivative instruments, net, which relate to concentrate and certain doré sales contracts and foreign exchange contracts, are valued using pricing models, which require inputs that are derived from observable market data, including contractual terms, forward market prices, yield curves, credit spreads, and other unobservable inputs. The model inputs can generally be verified and do not involve significant management judgment. Such instruments are classified within Level 2 of the fair value hierarchy.
The fair values of the Palmarejo royalty obligation embedded derivative and Rochester NSR royalty obligation were estimated based on observable market data including contractual terms, forward silver and gold prices, yield curves, and credit spreads, as well as the Company’s current mine plan which is considered a significant unobservable input. Therefore, the Company has classified these obligations as Level 3 financial liabilities. Based on current mine plans, expected royalty durations of
0.7
years and
2.5
years were used to estimate the fair value of the Palmarejo royalty obligation embedded derivative and Rochester NSR royalty obligation, respectively, at
December 31, 2015
.
No assets or liabilities were transferred between fair value levels in the year ended
December 31, 2015
.
The following tables present the changes in the fair value of the Company's Level 3 financial assets and liabilities for the years ended
December 31, 2015
and 2014:
|
Year ended December 31, 2015
|
|||||||||||||||
|
In thousands
|
Balance at the beginning of the period
|
Revaluation
|
Settlements
|
Balance at the
end of the
period
|
|||||||||||
|
Assets:
|
|||||||||||||||
|
Equity securities
|
$
|
1,379
|
|
$
|
(983
|
)
|
$
|
(386
|
)
|
$
|
10
|
|
|||
|
Liabilities:
|
|||||||||||||||
|
Palmarejo royalty obligation embedded derivative
|
$
|
21,912
|
|
$
|
(3,101
|
)
|
$
|
(13,854
|
)
|
$
|
4,957
|
|
|||
|
Rochester NSR royalty obligation
|
$
|
15,370
|
|
(818
|
)
|
(4,959
|
)
|
$
|
9,593
|
|
|||||
|
Year ended December 31, 2014
|
|||||||||||||||||||||||
|
In thousands
|
Balance at the beginning of the period
|
Additions
|
Revaluation
|
Settlements
|
Transfers from Level 1
|
Balance at the
end of the
period
|
|||||||||||||||||
|
Palmarejo royalty obligation embedded derivative
|
$
|
40,338
|
|
$
|
—
|
|
$
|
2,001
|
|
$
|
(20,427
|
)
|
$
|
—
|
|
$
|
21,912
|
|
|||||
|
Rochester NSR royalty obligation
|
21,630
|
|
—
|
|
(3,653
|
)
|
(2,607
|
)
|
—
|
|
15,370
|
|
|||||||||||
|
Equity securities
|
—
|
|
69
|
|
(55
|
)
|
—
|
|
1,365
|
|
1,379
|
|
|||||||||||
75
Coeur Mining, Inc. and Subsidiaries
Notes to Consolidated Financial Statements
During 2015, Coeur recorded write-downs related to
Property, plant, and equipment
and
Mining properties
totaling
$313.3 million
(
$276.5 million
net of tax). The fair values of
Property, plant, and equipment
and
Mining properties
were estimated using a discounted cash flow approach. The discounted cash flow model used significant unobservable inputs and is therefore classified within Level 3 for the fair value hierarchy. The following table sets forth the quantitative and qualitative information related to the unobservable inputs used in the calculation of the Company's non-recurring Level 3 fair value measurements:
|
Description
|
Valuation technique
|
Unobservable input
|
Range / Weighted Average
|
|
Property, plant, and equipment
and
Mining properties
|
Discounted cash flow
|
Discount rate
|
7.50% - 11.00%
|
|
Long-term silver price
|
$17.50
|
||
|
Long-term gold price
|
$1,200
|
||
During 2014, Coeur recorded write-downs related to
Property, plant, and equipment
and
Mining properties
totaling
$1,472.7 million
(
$1,021.8 million
net of tax). The fair values of
Property, plant, and equipment
and
Mining properties
were estimated using a discounted cash flow approach. The discounted cash flow model used significant unobservable inputs and is therefore classified within Level 3 for the fair value hierarchy. The following table sets forth the quantitative and qualitative information related to the unobservable inputs used in the calculation of the Company's non-recurring Level 3 fair value measurements:
|
Description
|
Valuation technique
|
Unobservable input
|
Range / Weighted Average
|
|
Property, plant, and equipment
and
Mining properties
|
Discounted cash flow
|
Discount rate
|
8.00% - 10.75%
|
|
Long-term silver price
|
$19.00
|
||
|
Long-term gold price
|
$1,275
|
||
During 2013, Coeur recorded write-downs related to
Property, plant, and equipment
and
Mining properties
totaling
$773.0 million
(
$593.2 million
net of tax). The fair values of
Property, plant, and equipment
and
Mining properties
were estimated using a discounted cash flow approach. The discounted cash flow model used significant unobservable inputs and is therefore classified within Level 3 for the fair value hierarchy. The following table sets forth the quantitative and qualitative information related to the unobservable inputs used in the calculation of the Company's non-recurring Level 3 fair value measurements:
|
Description
|
Valuation technique
|
Unobservable input
|
Range / Weighted Average
|
|
Property, plant, and equipment
and
Mining properties
|
Discounted cash flow
|
Discount rate
|
8.50% - 10.50%
|
|
Long-term silver price
|
$25.00
|
||
|
Long-term gold price
|
$1,450
|
||
The fair value of financial assets and liabilities carried at book value in the financial statements at
December 31, 2015
and
December 31, 2014
is presented in the following table:
|
|
December 31, 2015
|
||||||||||||||||||
|
In thousands
|
Book Value
|
Fair Value
|
Level 1
|
Level 2
|
Level 3
|
||||||||||||||
|
Liabilities:
|
|
||||||||||||||||||
|
3.25% Convertible Senior Notes due 2028
|
$
|
712
|
|
$
|
693
|
|
$
|
—
|
|
$
|
693
|
|
$
|
—
|
|
||||
|
7.875% Senior Notes due 2021
(1)
|
373,433
|
|
227,487
|
|
—
|
|
227,487
|
|
—
|
|
|||||||||
|
Term Loan due 2020
(2)
|
94,489
|
|
99,500
|
|
—
|
|
99,500
|
|
—
|
|
|||||||||
|
San Bartolomé Lines of Credit
|
4,571
|
|
4,571
|
|
—
|
|
4,571
|
|
—
|
|
|||||||||
|
Palmarejo gold production royalty obligation
|
15,207
|
|
15,580
|
|
—
|
|
—
|
|
15,580
|
|
|||||||||
|
(1)
|
Net of unamortized debt issuance costs and premium received of
$5.3 million
.
|
|
(2)
|
Net of unamortized debt issuance costs of
$5.0 million
.
|
76
Coeur Mining, Inc. and Subsidiaries
Notes to Consolidated Financial Statements
|
|
December 31, 2014
|
||||||||||||||||||
|
In thousands
|
Book Value
|
Fair Value
|
Level 1
|
Level 2
|
Level 3
|
||||||||||||||
|
Liabilities:
|
|||||||||||||||||||
|
3.25% Convertible Senior Notes due 2028
|
$
|
5,334
|
|
$
|
4,979
|
|
$
|
—
|
|
$
|
4,979
|
|
$
|
—
|
|
||||
|
7.875% Senior Notes due 2021
(1)
|
427,603
|
|
343,305
|
|
—
|
|
343,305
|
|
—
|
|
|||||||||
|
San Bartolomé Lines of Credit
|
14,785
|
|
14,785
|
|
—
|
|
14,785
|
|
—
|
|
|||||||||
|
Palmarejo gold production royalty obligation
|
34,047
|
|
38,290
|
|
—
|
|
—
|
|
38,290
|
|
|||||||||
|
(1)
|
Net of unamortized debt issuance costs and premium received of
$7.3 million
.
|
The fair values of the
3.25%
Convertible Senior Notes due 2028 (the "Convertible Notes") and
7.875%
Senior Notes due 2021 (the "Senior Notes") outstanding were estimated using quoted market prices. The fair value of the Term Loan due 2020 (the "Term Loan") approximates book value (excluding unamortized debt issuance costs) as the liability is secured, has a variable interest rate, and lacks significant credit concerns. The fair value of the San Bartolomé line of credit approximates book value due to the short-term nature of the liability and absence of significant interest rate or credit concerns. The fair value of the Palmarejo gold production royalty obligation is estimated based on observable market data including contractual terms, forward silver and gold prices, yield curves, and credit spreads, as well as the Company’s current mine plan which is considered a significant unobservable input.
Other, net
consists of the following:
|
|
Year ended December 31,
|
|||||||||||
|
In thousands
|
2015
|
2014
|
2013
|
|||||||||
|
Impairment of equity securities
|
$
|
(2,346
|
)
|
$
|
(6,593
|
)
|
$
|
(18,308
|
)
|
|||
|
Gain on extinguishment of Senior Notes
|
16,187
|
|
—
|
|
—
|
|
||||||
|
Foreign exchange gain (loss)
|
(15,769
|
)
|
470
|
|
(189
|
)
|
||||||
|
Gain on termination of reclamation bonds
|
—
|
|
—
|
|
8,519
|
|
||||||
|
Other
|
1,913
|
|
905
|
|
4,993
|
|
||||||
|
Other, net
|
$
|
(15
|
)
|
$
|
(5,218
|
)
|
$
|
(4,985
|
)
|
|||
Palmarejo Gold Production Royalty
On January 21, 2009, the Company's subsidiary, Coeur Mexicana S.A. de C.V. ("Coeur Mexicana"), entered into a gold production royalty agreement with a subsidiary of Franco-Nevada Corporation. The royalty covers
50%
of the life of mine production from the Palmarejo mine and legacy adjacent properties, excluding production from the recently acquired Paramount Gold and Silver Corp. ("Paramount") properties. The royalty transaction includes a minimum obligation of
4,167
gold ounces per month and terminates when payments on
400,000
gold ounces have been made. At
December 31, 2015
, a total of
33,495
gold ounces remain outstanding under the obligation.
The price volatility associated with the minimum royalty obligation is considered an embedded derivative. The Company is required to recognize the change in fair value of the remaining minimum obligation due to changing gold prices. Unrealized gains are recognized in periods when the gold price has decreased from the previous period and unrealized losses are recognized in periods when the gold price increases. The fair value of the embedded derivative is reflected net of the Company's current credit adjusted risk free rate, which was
19.9%
and
11.8%
at
December 31, 2015
and
December 31, 2014
, respectively. The fair value of the embedded derivative at
December 31, 2015
and
December 31, 2014
was a liability of
$5.0 million
and
$21.9 million
, respectively. The mark-to-market adjustments were gains of
$17.0 million
,
$18.4 million
, and
$104.8 million
for the years ended
December 31, 2015
,
2014
, and 2013, respectively.
Payments on the royalty obligation decrease the carrying amount of the minimum obligation and the derivative liability. Each monthly payment is an amount equal to the greater of the minimum of
4,167
ounces of gold or
50%
of actual gold production multiplied by the excess of the monthly average market price of gold above
$412
per ounce, subject to a
1%
annual inflation adjustment. Realized losses on settlement of the liabilities were
$13.9 million
,
$20.4 million
, and
$28.6 million
for the years ended
December 31, 2015
,
2014
, and 2013, respectively. The mark-to-market adjustments and realized losses are included in
Fair value adjustments, net
.
77
Coeur Mining, Inc. and Subsidiaries
Notes to Consolidated Financial Statements
Provisional Silver and Gold Sales
The Company enters into sales contracts with third-party smelters and refiners which, in most cases, provide for a provisional payment based upon preliminary assays and quoted metal prices. The provisionally priced sales contracts contain an embedded derivative that is required to be separated from the host contract for accounting purposes. The host contract is the receivable recorded at the forward price at the time of sale. The embedded derivatives do not qualify for hedge accounting and are marked to market through earnings each period until final settlement. Changes in silver and gold prices resulted in provisional pricing mark-to-market gains of
$0.3 million
, losses of
$0.1 million
, and losses of
$2.0 million
in the years ended
December 31, 2015
,
2014
, and 2013, respectively. At
December 31, 2015
, the Company had outstanding provisionally priced sales of
0.6 million
ounces of silver and
30,627
ounces of gold at prices of
$14.98
and
$1,110
, respectively.
Silver and Gold Options
During the years ended
December 31, 2014
and 2013, the Company recorded unrealized gains of
$1.5 million
and
$8.9 million
, respectively, related to outstanding options which were included in
Fair value adjustments, net.
The Company recognized realized gains of
$1.3 million
, realized losses of
$0.6 million
, and
no
realized gain or loss during the years ended
December 31, 2015
,
2014
, and 2013, respectively, from settled contracts.
At
December 31, 2015
, the Company had the following derivative instruments that settle as follows:
|
In thousands except average prices and notional ounces
|
2016
|
Thereafter
|
|||||
|
Palmarejo gold production royalty
|
$
|
21,641
|
|
$
|
—
|
|
|
|
Average gold price in excess of minimum contractual deduction
|
$
|
646
|
|
$
|
—
|
|
|
|
Notional ounces
|
33,495
|
|
—
|
|
|||
|
Provisional silver sales
|
$
|
8,849
|
|
$
|
—
|
|
|
|
Average silver price
|
$
|
14.98
|
|
$
|
—
|
|
|
|
Notional ounces
|
590,750
|
|
—
|
|
|||
|
Provisional gold sales
|
$
|
33,996
|
|
$
|
—
|
|
|
|
Average gold price
|
$
|
1,110
|
|
$
|
—
|
|
|
|
Notional ounces
|
30,627
|
|
—
|
|
|||
The following summarizes the classification of the fair value of the derivative instruments:
|
|
December 31, 2015
|
||||||||||||||
|
In thousands
|
Prepaid expenses and other
|
Accrued liabilities and other
|
Current portion of royalty obligation
|
Non-current portion of royalty obligation
|
|||||||||||
|
Palmarejo gold production royalty
|
—
|
|
—
|
|
4,957
|
|
—
|
|
|||||||
|
Concentrate sales contracts
|
28
|
|
536
|
|
—
|
|
—
|
|
|||||||
|
$
|
28
|
|
$
|
536
|
|
$
|
4,957
|
|
$
|
—
|
|
||||
|
|
December 31, 2014
|
||||||||||||||
|
|
Prepaid expenses and other
|
Accrued liabilities and other
|
Current portion of royalty obligation
|
Non-current portion of royalty obligation
|
|||||||||||
|
Palmarejo gold production royalty
|
—
|
|
—
|
|
14,405
|
|
7,507
|
|
|||||||
|
Silver and gold options
|
3,882
|
|
1,039
|
|
—
|
|
—
|
|
|||||||
|
Concentrate sales contracts
|
43
|
|
848
|
|
—
|
|
—
|
|
|||||||
|
$
|
3,925
|
|
$
|
1,887
|
|
$
|
14,405
|
|
$
|
7,507
|
|
||||
78
Coeur Mining, Inc. and Subsidiaries
Notes to Consolidated Financial Statements
The following represent mark-to-market gains (losses) on derivative instruments for the years ended
December 31, 2015
,
2014
, and 2013 (in thousands):
|
|
|
Year ended December 31,
|
|||||||||||
|
Financial statement line
|
Derivative
|
2015
|
2014
|
2013
|
|||||||||
|
Revenue
|
Concentrate sales contracts
|
$
|
296
|
|
$
|
(123
|
)
|
(1,995
|
)
|
||||
|
Costs applicable to sales
|
Foreign exchange contracts
|
—
|
|
924
|
|
589
|
|
||||||
|
Fair value adjustments, net
|
Foreign exchange contracts
|
—
|
|
(16
|
)
|
(985
|
)
|
||||||
|
Fair value adjustments, net
|
Palmarejo gold royalty
|
3,101
|
|
(2,001
|
)
|
76,200
|
|
||||||
|
Fair value adjustments, net
|
Silver and gold options
|
1,283
|
|
1,058
|
|
7,119
|
|
||||||
|
$
|
4,680
|
|
$
|
(158
|
)
|
$
|
80,928
|
|
|||||
Credit Risk
The credit risk exposure related to any derivative instrument is limited to the unrealized gains, if any, on outstanding contracts based on current market prices. To reduce counter-party credit exposure, the Company enters into contracts with financial institutions management deems credit worthy and limits credit exposure to each institution. The Company does not anticipate non-performance by any of its counterparties. In addition, to allow for situations where derivative positions may need to be revised, the Company transacts only in markets that management considers highly liquid.
On
April 17, 2015
, the Company completed the acquisition of Paramount, which held mineral claims adjacent to the Company's Palmarejo mine, including a continuation of the Independencia deposit. Upon closing, Paramount became a wholly-owned subsidiary of the Company, and each issued and outstanding share of Paramount common stock was converted into
0.2016
shares of Coeur common stock, with cash paid in lieu of fractional shares. Immediately prior to completion of the acquisition, Paramount spun off to its existing stockholders a separate, publicly-traded company, Paramount Gold Nevada Corp. ("SpinCo"), which owns the Sleeper Gold Project and other assets in Nevada. SpinCo was capitalized with
$8.5 million
in cash contributed by Coeur, which amount has been included in the total consideration paid for the acquisition of Paramount. The Company also paid
$1.5 million
to acquire
4.9%
of the newly issued and outstanding shares of SpinCo.
The transaction was accounted for as an asset acquisition, as Paramount is an exploration stage project, which requires that the total purchase price be allocated to the assets acquired and liabilities assumed based on their relative fair values. The purchase price and acquired assets and liabilities were as follows (in thousands except share data):
|
Common shares issued (32,667,327 at $5.78)
|
$
|
188,817
|
|
|
Cash
|
8,530
|
|
|
|
Transaction advisory fees and other acquisition costs
|
4,020
|
|
|
|
Total purchase price
|
201,367
|
|
|
|
Assets:
|
|||
|
Cash
|
118
|
|
|
|
Receivables and other current assets
|
1,685
|
|
|
|
Property, plant, and equipment
|
215
|
|
|
|
Mining properties, net
|
305,175
|
|
|
|
307,193
|
|
||
|
Liabilities:
|
|||
|
Accounts payable and accrued liabilities
|
2,737
|
|
|
|
Deferred income taxes
|
103,089
|
|
|
|
105,826
|
|
||
|
Net assets acquired
|
$
|
201,367
|
|
The assets acquired and liabilities assumed have been assigned to the Palmarejo reportable operating segment.
79
Coeur Mining, Inc. and Subsidiaries
Notes to Consolidated Financial Statements
On February 20, 2015, the Company completed its acquisition of the Wharf gold mine located near Lead, South Dakota, from a subsidiary of Goldcorp in exchange for
$99.4 million
in cash. The transaction was accounted for as a business combination which requires that assets acquired and liabilities assumed be recognized at their respective fair values at the acquisition date. The Company incurred
$2.1 million
of acquisition costs, which are included in
Pre-development, reclamation, and other
on the Condensed Consolidated Statements of Comprehensive Income (Loss).
The purchase price allocation was based on the fair value of acquired assets and liabilities as follows (in thousands):
|
Assets:
|
|||
|
Cash
|
$
|
982
|
|
|
Receivables
|
3,061
|
|
|
|
Inventory
|
2,147
|
|
|
|
Ore on leach pads
|
12,710
|
|
|
|
Other current assets
|
2,924
|
|
|
|
Property, plant, and equipment
|
30,055
|
|
|
|
Mining properties, net
|
77,424
|
|
|
|
Other non-current assets
|
3,966
|
|
|
|
133,269
|
|
||
|
Liabilities:
|
|||
|
Accounts payable and accrued liabilities
|
5,938
|
|
|
|
Reclamation
|
18,270
|
|
|
|
Deferred income taxes
|
5,915
|
|
|
|
Other non-current liabilities
|
3,750
|
|
|
|
33,873
|
|
||
|
Net assets acquired
|
$
|
99,396
|
|
The following table presents the unaudited pro forma summary of the Company’s Condensed Consolidated Statements of Comprehensive Income (Loss) for the years ended
December 31, 2015
,
2014
, and 2013 as if the acquisition had occurred on January 1, 2013. The following unaudited pro forma financial information is presented for informational purposes only and is not necessarily indicative of the results of operations as they would have been had the transaction occurred on the assumed date, nor is it necessarily an indication of trends in future results for a number of reasons, including, but not limited to, differences between the assumptions used to prepare the pro forma information, potential synergies, and cost savings from operating efficiencies.
|
|
Year ended December 31,
|
|||||||||||
|
In thousands
|
2015
|
2014
|
2013
|
|||||||||
|
Revenue
|
$
|
664,086
|
|
$
|
729,742
|
|
$
|
823,994
|
|
|||
|
Income (loss) before income and mining taxes
|
(393,498
|
)
|
(1,587,128
|
)
|
(786,679
|
)
|
||||||
|
Net income (loss)
|
(367,235
|
)
|
(1,158,874
|
)
|
(628,563
|
)
|
||||||
On May 27, 2014, the Company's subsidiary, Coeur Capital, Inc., entered into an NSR royalty agreement with Northair Silver Corp. (formerly, International Northair Mines, Ltd., "Northair"). Pursuant to the agreement, the Company paid
$2.2 million
cash on May 27, 2014 for a
1.25%
NSR and
$1.8 million
on September 2, 2014 for an additional
1.25%
NSR royalty payable on future production from Northair's La Cigarra silver project located in north central Mexico.
80
Coeur Mining, Inc. and Subsidiaries
Notes to Consolidated Financial Statements
The Company invests in equity securities of silver and gold exploration and development companies. These investments are classified as available-for-sale and are measured at fair value in the financial statements with unrealized gains and losses recorded in
Other comprehensive income (loss)
.
|
At December 31, 2015
|
|||||||||||
|
In thousands
|
Cost
|
Gross
Unrealized
Losses
|
Gross
Unrealized
Gains
|
Estimated
Fair Value
|
|||||||
|
Equity securities
|
3,386
|
|
(1,179
|
)
|
559
|
|
2,766
|
|
|||
|
At December 31, 2014
|
|||||||||||||||
|
In thousands
|
Cost
|
Gross
Unrealized
Losses
|
Gross
Unrealized
Gains
|
Estimated
Fair Value
|
|||||||||||
|
Equity securities
|
$
|
5,687
|
|
$
|
(8
|
)
|
$
|
303
|
|
$
|
5,982
|
|
|||
The Company performs a quarterly assessment on each of its equity securities with unrealized losses to determine if the security is other than temporarily impaired. The Company recorded pre-tax other-than-temporary impairment losses of
$2.3 million
,
$6.6 million
, and
$18.3 million
in the years ended
December 31, 2015
,
2014
, and 2013, respectively, in
Other, net
. The following table summarizes the gross unrealized losses on equity securities for which other-than-temporary impairments have not been recognized and the fair values of those securities, aggregated by the length of time the individual securities have been in a continuous unrealized loss position, at
December 31, 2015
:
|
Less than twelve months
|
Twelve months or more
|
Total
|
||||||||||||||||||
|
In thousands
|
Unrealized Losses
|
Fair Value
|
Unrealized Losses
|
Fair Value
|
Unrealized Losses
|
Fair Value
|
||||||||||||||
|
Equity securities
|
$
|
(1,179
|
)
|
$
|
614
|
|
$
|
—
|
|
$
|
—
|
|
$
|
(1,179
|
)
|
$
|
614
|
|
||
Receivables consist of the following:
|
In thousands
|
December 31, 2015
|
December 31, 2014
|
|||||
|
Current receivables:
|
|||||||
|
Trade receivables
|
$
|
17,878
|
|
$
|
20,448
|
|
|
|
Income tax receivable
|
13,678
|
|
21,047
|
|
|||
|
Value added tax receivable
|
50,669
|
|
63,805
|
|
|||
|
Other
|
3,767
|
|
2,623
|
|
|||
|
$
|
85,992
|
|
$
|
107,923
|
|
||
|
Non-current receivables:
|
|||||||
|
Value added tax receivable
|
$
|
24,768
|
|
$
|
21,686
|
|
|
|
Total receivables
|
$
|
110,760
|
|
$
|
129,609
|
|
|
81
Coeur Mining, Inc. and Subsidiaries
Notes to Consolidated Financial Statements
Inventory consists of the following:
|
In thousands
|
December 31, 2015
|
December 31, 2014
|
|||||
|
Inventory:
|
|||||||
|
Concentrate
|
$
|
16,165
|
|
$
|
23,563
|
|
|
|
Precious metals
|
21,908
|
|
40,870
|
|
|||
|
Supplies
|
43,638
|
|
50,498
|
|
|||
|
$
|
81,711
|
|
$
|
114,931
|
|
||
|
Ore on leach pads:
|
|||||||
|
Current
|
$
|
67,329
|
|
$
|
48,204
|
|
|
|
Non-current
|
44,582
|
|
37,889
|
|
|||
|
$
|
111,911
|
|
$
|
86,093
|
|
||
|
Total inventory and ore on leach pads
|
$
|
193,622
|
|
$
|
201,024
|
|
|
Property, plant and equipment consist of the following:
|
In thousands
|
December 31, 2015
|
December 31, 2014
|
|||||
|
Land
|
$
|
8,287
|
|
$
|
1,752
|
|
|
|
Facilities and equipment
|
654,585
|
|
647,181
|
|
|||
|
Capital leases
|
30,648
|
|
28,680
|
|
|||
|
693,520
|
|
677,613
|
|
||||
|
Accumulated amortization
|
(514,509
|
)
|
(464,852
|
)
|
|||
|
179,011
|
|
212,761
|
|
||||
|
Construction in progress
|
16,988
|
|
15,150
|
|
|||
|
Property, plant and equipment, net
|
$
|
195,999
|
|
$
|
227,911
|
|
|
Rent expense for operating lease agreements was
$14.3 million
,
$11.2 million
, and
$16.7 million
for the years ended December 31, 2015, 2014, and 2013, respectively.
82
Coeur Mining, Inc. and Subsidiaries
Notes to Consolidated Financial Statements
Mining properties consist of the following (in thousands):
|
December 31, 2015
|
Palmarejo
|
Rochester
|
Kensington
|
Wharf
|
San
Bartolomé
|
La Preciosa
|
Joaquin
|
Coeur Capital
|
Total
|
||||||||||||||||||||||||||
|
Mine development
|
$
|
151,828
|
|
$
|
149,756
|
|
$
|
238,786
|
|
$
|
32,318
|
|
$
|
39,474
|
|
$
|
—
|
|
$
|
—
|
|
$
|
—
|
|
$
|
612,162
|
|
||||||||
|
Accumulated amortization
|
(131,055
|
)
|
(126,242
|
)
|
(131,236
|
)
|
(5,784
|
)
|
(30,325
|
)
|
—
|
|
—
|
|
|
|
(424,642
|
)
|
|||||||||||||||||
|
20,773
|
|
23,514
|
|
107,550
|
|
26,534
|
|
9,149
|
|
—
|
|
—
|
|
—
|
|
187,520
|
|
||||||||||||||||||
|
Mineral interests
|
629,303
|
|
—
|
|
—
|
|
45,837
|
|
12,868
|
|
49,085
|
|
10,000
|
|
59,343
|
|
806,436
|
|
|||||||||||||||||
|
Accumulated amortization
|
(348,268
|
)
|
—
|
|
—
|
|
(10,551
|
)
|
(11,400
|
)
|
—
|
|
—
|
|
(34,518
|
)
|
(404,737
|
)
|
|||||||||||||||||
|
281,035
|
|
—
|
|
—
|
|
35,286
|
|
1,468
|
|
49,085
|
|
10,000
|
|
24,825
|
|
401,699
|
|
||||||||||||||||||
|
Mining properties, net
|
$
|
301,808
|
|
$
|
23,514
|
|
$
|
107,550
|
|
$
|
61,820
|
|
$
|
10,617
|
|
$
|
49,085
|
|
$
|
10,000
|
|
$
|
24,825
|
|
$
|
589,219
|
|
||||||||
|
December 31, 2014
|
Palmarejo
|
Rochester
|
Kensington
|
San
Bartolomé
|
La Preciosa
|
Joaquin
|
Coeur Capital
|
Total
|
|||||||||||||||||||||||
|
Mine development
|
$
|
137,821
|
|
$
|
153,535
|
|
$
|
217,138
|
|
$
|
49,305
|
|
$
|
—
|
|
$
|
—
|
|
$
|
—
|
|
$
|
557,799
|
|
|||||||
|
Accumulated amortization
|
(121,906
|
)
|
(113,533
|
)
|
(106,865
|
)
|
(26,106
|
)
|
—
|
|
—
|
|
—
|
|
(368,410
|
)
|
|||||||||||||||
|
15,915
|
|
40,002
|
|
110,273
|
|
23,199
|
|
—
|
|
—
|
|
—
|
|
189,389
|
|
||||||||||||||||
|
Mineral interests
|
521,349
|
|
—
|
|
—
|
|
17,560
|
|
49,059
|
|
10,000
|
|
81,461
|
|
679,429
|
|
|||||||||||||||
|
Accumulated amortization
|
(332,032
|
)
|
—
|
|
—
|
|
(10,143
|
)
|
—
|
|
—
|
|
(25,451
|
)
|
(367,626
|
)
|
|||||||||||||||
|
189,317
|
|
—
|
|
—
|
|
7,417
|
|
49,059
|
|
10,000
|
|
56,010
|
|
311,803
|
|
||||||||||||||||
|
Mining properties, net
|
$
|
205,232
|
|
$
|
40,002
|
|
$
|
110,273
|
|
$
|
30,616
|
|
$
|
49,059
|
|
$
|
10,000
|
|
$
|
56,010
|
|
$
|
501,192
|
|
|||||||
The Palmarejo complex is located in the State of Chihuahua in northern Mexico and consists of the Palmarejo mine and mill, the Guadalupe underground mine, the Independencia deposit, and other deposits and exploration targets. The Palmarejo mine commenced production in April 2009 and the Guadalupe mine commenced production in 2015.
The Company has conducted operations at the Rochester silver and gold mine, located in northwestern Nevada, since September 1986. The mine utilizes the heap-leaching process to extract both silver and gold from ore mined using open pit methods.
The Kensington mine is an underground gold mine and consists of the Kensington and adjacent Jualin properties located north-northwest of Juneau, Alaska. The Company commenced commercial production in July 2010.
The Wharf gold mine is an open pit gold mine located near the city of Lead, South Dakota. The Company acquired Wharf in February 2015.
The San Bartolomé mine is a silver mine located near the city of Potosi, Bolivia. The Company commenced commercial production at San Bartolomé in June 2008.
The La Preciosa silver-gold project is located in the State of Durango in northern Mexico. The Company completed a feasibility study in 2014 and has deferred construction activities until expected returns improve.
The Joaquin silver-gold project is located in the Santa Cruz province of southern Argentina. The Company commenced exploration of the property located north of the Company's Martha silver mine in November 2007.
The Company's mineral interests held by Coeur Capital primarily consist of the Endeavor silver stream, acquired by the Company in May 2005, under which the Company owns all silver production and reserves up to
20.0 million
payable ounces at the Endeavor mine in Australia, owned and operated by Cobar Operations Pty. Limited. The Company has received
6.0 million
payable ounces to-date and the current ore reserve contains
1.4 million
payable ounces.
Coeur Capital also holds royalties on McEwen Mining Inc.’s El Gallo complex in Mexico, currently paying a
3.5%
NSR royalty, a
1.5%
NSR royalty on Dynasty Metals & Mining, Inc.’s Zaruma mine in Ecuador, a
2.0%
NSR royalty on Mandalay Resources Corp.’s Cerro Bayo mine in Chile, and royalties on other non-producing properties. Coeur also owns an
80%
interest in a
2.5%
royalty on OceanaGold Corporation's Correnso mine in New Zealand and has entered into an agreement to acquire the remaining
20%
interest in 2016. Royalty revenue is immaterial to the Company.
83
Coeur Mining, Inc. and Subsidiaries
Notes to Consolidated Financial Statements
Long-term debt and capital lease obligations at
December 31, 2015
and
December 31, 2014
are as follows:
|
|
December 31, 2015
|
December 31, 2014
|
|||||||||||||
|
In thousands
|
Current
|
Non-Current
|
Current
|
Non-Current
|
|||||||||||
|
3.25% Convertible Senior Notes due 2028
|
$
|
—
|
|
$
|
712
|
|
$
|
5,334
|
|
$
|
—
|
|
|||
|
7.875% Senior Notes due 2021, net
(1)
|
—
|
|
373,433
|
|
—
|
|
427,603
|
|
|||||||
|
Term Loan due 2020, net
(2)
|
1,000
|
|
93,489
|
|
—
|
|
—
|
|
|||||||
|
San Bartolomé Lines of Credit
|
—
|
|
4,571
|
|
4,481
|
|
10,304
|
|
|||||||
|
Capital lease obligations
|
9,431
|
|
7,774
|
|
7,683
|
|
13,141
|
|
|||||||
|
$
|
10,431
|
|
$
|
479,979
|
|
$
|
17,498
|
|
$
|
451,048
|
|
||||
(1)
Net of unamortized debt issuance costs and premium received of
$5.3 million
and
$7.3 million
at December 31, 2015 and December 31, 2014, respectively.
(2)
Net of unamortized debt issuance costs of
$5.0 million
at December 31, 2015.
7.875% Senior Notes due 2021
During the fourth quarter of 2015, the Company entered into a privately-negotiated agreement to exchange
$54.2 million
in aggregate principal amount of its Senior Notes for
14.4 million
shares of common stock. Based on the closing price of the Company's common stock on the date of the exchange, the exchange resulted in a gain of
$15.9 million
which is recognized in
Other, net
in the Company's Consolidated Statement of Comprehensive Income (Loss). During 2015 and 2014, the Company repurchased
$71.3 million
in aggregate principal amount of the Senior Notes. The impact of the exchange and repurchases result in an aggregate principal balance outstanding of
$378.7 million
at
December 31, 2015
.
At any time prior to February 1, 2017, the Company may redeem all or part of the Senior Notes upon not less than
30
nor more than
60
days’ prior notice at a redemption price equal to the sum of
100%
of the principal amount thereof, a make-whole premium as of the date of redemption, and accrued and unpaid interest and additional interest, if any, thereon, to the date of redemption. In addition, the Company may redeem some or all of the Senior Notes on or after February 1, 2017, at redemption prices set forth in the Indenture for the Senior Notes, together with accrued and unpaid interest.
On March 12, 2014, the Company completed a follow-on offering of
$150 million
in aggregate principal amount of its Senior Notes (the “Additional Notes”) in a private placement conducted pursuant to Rule 144A and Regulation S under the Securities Act of 1933, as amended (the “Securities Act”). The Additional Notes constitute a further issuance of the Original Notes (as defined below) and form a single series of debt securities with the Original Notes. Upon completion of Coeur’s offering of the Additional Notes, the aggregate principal amount of the outstanding Senior Notes was
$450.0 million
. The Company commenced an exchange offer for the Additional Notes on April 10, 2014 to exchange the Additional Notes for freely transferable notes containing substantially similar terms, in accordance with the registration rights granted to the holders of the Additional Notes when they were issued. The exchange offer was consummated on May 9, 2014.
On January 29, 2013, the Company completed an offering of
$300.0 million
in aggregate principal amount of
7.875%
Senior Notes due 2021 (the “Original Notes”) in a private placement conducted pursuant to the Securities Act. The Company commenced an exchange offer for the Original Notes on September 30, 2013 to exchange the Original Notes for freely transferable notes containing substantially similar terms, in accordance with the registration rights granted to the holders of the Original Notes when they were issued. The exchange offer was consummated on November 5, 2013.
3.25% Convertible Senior Notes due 2028
Per the indenture governing the Convertible Notes, the Company announced on February 12, 2015 that it was offering to repurchase all of the Convertible Notes. During the first quarter of 2015, the Company repurchased
$4.6 million
in aggregate principal amount, leaving a balance of
$0.7 million
at
December 31, 2015
. The Convertible Notes are classified as non-current liabilities at
December 31, 2015
as a result of the expiration of the holders' option to require the Company to repurchase the notes on March 15, 2015.
Term Loan due 2020
On June 23, 2015, the Company and certain of its subsidiaries entered into a credit agreement for a senior secured term loan (the "Term Loan") with Barclays Bank PLC, as administrative agent (the “Term Loan Credit Agreement”). The Term Loan Credit Agreement provides for a five year
$100.0 million
term loan to the Company, of which a portion of the proceeds were used to repay the Short-term Loan, and the remaining proceeds are expected to be used for general corporate purposes. The Term Loan contains no financial maintenance covenants and currently bears interest at a rate equal to an adjusted Eurodollar rate plus a margin of
8.00%
(at no time will the adjusted Eurodollar rate be deemed to be less than
1.00%
per annum). Voluntary prepayments of
84
Coeur Mining, Inc. and Subsidiaries
Notes to Consolidated Financial Statements
the Term Loan under the Term Loan Credit Agreement are permitted, subject to the payment of a make-whole premium if such prepayment occurs prior to the first anniversary of the closing date, a premium of
105.0%
of the principal amount between the first anniversary and the second anniversary of the closing date and a premium of
103.0%
if such prepayment occurs on or after the second anniversary but prior to the third anniversary of the closing date. The Term Loan Credit Agreement requires amortization payments equal to
1.0%
of the principal amount of the Term Loan per annum and also requires net cash proceeds of debt issuances, excess cash flow, asset sales and casualty insurance recoveries (in each case, subject to certain exceptions) to either be reinvested in long-term assets used in the Company’s business or be applied as a mandatory prepayment of the Term Loan. Amounts repaid on the Term Loan may not be re-borrowed. As of December 31, 2015, the Company has made amortization payments totaling
$0.5 million
. The obligations under the Term Loan are secured by substantially all of the assets of the Company and its domestic subsidiaries, including the land, mineral rights and infrastructure at the Kensington, Rochester and Wharf mines, as well as a pledge of the shares of certain of the Company's subsidiaries. The Term Loan Credit Agreement contains customary representations and warranties, events of default, and affirmative and negative covenants.
Lines of Credit
At
December 31, 2015
, San Bartolomé had
two
outstanding lines of credit. The first line of credit is for
$12.0
million bearing interest at
6.0%
per annum, maturing June 30, 2018. The second line of credit is for
$15.0 million
bearing interest at
6.0%
per annum, maturing December 29, 2016. Both lines of credit are secured with machinery and equipment. There was an outstanding balance of
$4.6 million
on the first line of credit at
December 31, 2015
.
Short-term Loan
On March 31, 2015, the Company entered into a credit agreement (the "Short-term Credit Agreement") with The Bank of Nova Scotia. The Short-term Credit Agreement provided for a
$50.0 million
loan (the "Short-term Loan") to the Company. The Short-term Loan generally bore interest at a rate equal to an adjusted Eurocurrency rate plus a margin of
2.50%
. On June 25, 2015, the Short-term Loan was repaid in full, the security for the Short-term Loan was released, and the Short-term Credit Agreement was terminated.
Palmarejo Gold Production Royalty Obligation
On January 21, 2009, Coeur Mexicana entered into a gold production royalty transaction with a subsidiary of Franco-Nevada Corporation under which the subsidiary of Franco-Nevada Corporation purchased a royalty covering
50%
of the life of mine gold to be produced from the Palmarejo silver and gold mine in Mexico. This royalty excludes production from the recently acquired Paramount properties.
The royalty agreement provides for a minimum obligation to be paid monthly on a total of
400,000
ounces of gold, or
4,167
ounces per month over an initial eight year period. Each monthly payment is an amount equal to the greater of
4,167
ounces of gold or
50%
of actual gold production multiplied by the excess of the monthly average market price of gold above
$412
per ounce, subject to a
1%
annual inflation compounding adjustment. Payments under the royalty agreement are made in cash or gold bullion. The Company paid
$39.2 million
,
$48.4 million
, and
$57.0 million
during the years ended
December 31, 2015
,
2014
, and 2013, respectively. At
December 31, 2015
, payments had been made on a total of
366,505
ounces of gold with further payments to be made on an additional
33,495
ounces of gold.
The Company used an implicit interest rate of
30.5%
to discount the original royalty obligation, based on the fair value of the consideration received projected over the expected future cash flows at inception of the obligation. The discounted obligation is accreted to its expected future value over the expected minimum payment period based on the implicit interest rate. The Company recognized accretion expense of
$6.6 million
,
$10.8 million
, and
$17.6 million
for the years ended
December 31, 2015
,
2014
, and 2013, respectively. At
December 31, 2015
and
December 31, 2014
, the remaining minimum obligation under the royalty agreement was
$15.2 million
and
$34.0 million
, respectively.
85
Coeur Mining, Inc. and Subsidiaries
Notes to Consolidated Financial Statements
Interest Expense
Interest expense, net of capitalized interest
consists of the following:
|
|
Year ended December 31,
|
||||||||||
|
In thousands
|
2015
|
2014
|
2013
|
||||||||
|
3.25% Convertible Senior Notes due 2028
|
$
|
54
|
|
$
|
173
|
|
$
|
466
|
|
||
|
7.875% Senior Notes due 2021
|
33,437
|
|
32,741
|
|
21,853
|
|
|||||
|
Short-term Loan
|
326
|
|
—
|
|
—
|
|
|||||
|
Term Loan due 2020
|
4,719
|
|
—
|
|
—
|
|
|||||
|
San Bartolomé Lines of Credit
|
795
|
|
—
|
|
—
|
|
|||||
|
Revolving Credit Facility
|
—
|
|
179
|
|
612
|
|
|||||
|
Loss on Revolving Credit Facility
|
—
|
|
3,035
|
|
—
|
|
|||||
|
Capital lease obligations
|
1,035
|
|
972
|
|
415
|
|
|||||
|
Other debt obligations
|
20
|
|
—
|
|
291
|
|
|||||
|
Accretion of Palmarejo gold production royalty obligation
|
6,567
|
|
10,773
|
|
17,641
|
|
|||||
|
Amortization of debt issuance costs
|
2,257
|
|
1,740
|
|
2,143
|
|
|||||
|
Accretion of debt premium
|
(409
|
)
|
(357
|
)
|
576
|
|
|||||
|
Capitalized interest
|
(3,098
|
)
|
(1,710
|
)
|
(2,694
|
)
|
|||||
|
Total interest expense, net of capitalized interest
|
$
|
45,703
|
|
$
|
47,546
|
|
$
|
41,303
|
|
||
The following Condensed Consolidating Financial Statements are presented to satisfy disclosure requirements of Rule 3-10 of Regulation S-X resulting from the guarantees by Coeur Alaska, Inc., Coeur Explorations, Inc., Coeur Rochester, Inc., Coeur South America Corp., Wharf Resources (U.S.A.) Inc. and subsidiaries, and Coeur Capital, Inc. (collectively, the “Subsidiary Guarantors”) of the Senior Notes. The following schedules present Condensed Consolidating Financial Statements of (a) Coeur, the parent company; (b) the Subsidiary Guarantors; and (c) certain wholly-owned domestic and foreign subsidiaries of the Company (collectively, the “Non-Guarantor Subsidiaries”). Each of the Subsidiary Guarantors is 100% owned by Coeur and the guarantees are full and unconditional. There are no restrictions on the ability of Coeur to obtain funds from its subsidiaries by dividend or loan.
86
Coeur Mining, Inc. and Subsidiaries
Notes to Consolidated Financial Statements
CONDENSED CONSOLIDATING STATEMENT OF COMPREHENSIVE INCOME (LOSS)
YEAR ENDED
DECEMBER 31, 2015
|
In thousands
|
Coeur Mining, Inc.
|
Guarantor Subsidiaries
|
Non-Guarantor Subsidiaries
|
Eliminations
|
Consolidated
|
|||||||||||||||
|
Revenue
|
$
|
—
|
|
$
|
378,278
|
|
$
|
267,808
|
|
$
|
—
|
|
$
|
646,086
|
|
|||||
|
COSTS AND EXPENSES
|
||||||||||||||||||||
|
Costs applicable to sales
(1)
|
—
|
|
261,830
|
|
217,824
|
|
—
|
|
479,654
|
|
||||||||||
|
Amortization
|
1,991
|
|
83,325
|
|
58,435
|
|
—
|
|
143,751
|
|
||||||||||
|
COSTS AND EXPENSES
|
||||||||||||||||||||
|
General and administrative
|
32,405
|
|
35
|
|
394
|
|
—
|
|
32,834
|
|
||||||||||
|
Exploration
|
2,265
|
|
3,931
|
|
5,451
|
|
—
|
|
11,647
|
|
||||||||||
|
Write-downs
|
—
|
|
1,630
|
|
311,707
|
|
—
|
|
313,337
|
|
||||||||||
|
Pre-development, reclamation, and other
|
4,083
|
|
5,920
|
|
7,790
|
|
—
|
|
17,793
|
|
||||||||||
|
Total costs and expenses
|
40,744
|
|
356,671
|
|
601,601
|
|
—
|
|
999,016
|
|
||||||||||
|
OTHER INCOME (EXPENSE), NET
|
||||||||||||||||||||
|
Fair value adjustments, net
|
1,224
|
|
818
|
|
3,160
|
|
—
|
|
5,202
|
|
||||||||||
|
Other, net
|
20,252
|
|
(3,106
|
)
|
(13,385
|
)
|
(3,776
|
)
|
(15
|
)
|
||||||||||
|
Interest expense, net of capitalized interest
|
(39,867
|
)
|
(966
|
)
|
(8,646
|
)
|
3,776
|
|
(45,703
|
)
|
||||||||||
|
Total other income (expense), net
|
(18,391
|
)
|
(3,254
|
)
|
(18,871
|
)
|
—
|
|
(40,516
|
)
|
||||||||||
|
Loss before income and mining taxes
|
(59,135
|
)
|
18,353
|
|
(352,664
|
)
|
—
|
|
(393,446
|
)
|
||||||||||
|
Income and mining tax (expense) benefit
|
1,827
|
|
(2,354
|
)
|
26,790
|
|
—
|
|
26,263
|
|
||||||||||
|
Total loss after income and mining taxes
|
(57,308
|
)
|
15,999
|
|
(325,874
|
)
|
—
|
|
(367,183
|
)
|
||||||||||
|
Equity income (loss) in consolidated subsidiaries
|
(309,875
|
)
|
(14,814
|
)
|
—
|
|
324,689
|
|
—
|
|
||||||||||
|
NET INCOME (LOSS)
|
$
|
(367,183
|
)
|
$
|
1,185
|
|
$
|
(325,874
|
)
|
$
|
324,689
|
|
$
|
(367,183
|
)
|
|||||
|
OTHER COMPREHENSIVE INCOME (LOSS), net of tax:
|
||||||||||||||||||||
|
Unrealized gain (loss) on marketable securities, net of tax
|
(4,154
|
)
|
(3,118
|
)
|
—
|
|
3,118
|
|
(4,154
|
)
|
||||||||||
|
Reclassification adjustments for impairment of marketable securities
|
2,346
|
|
2,346
|
|
—
|
|
(2,346
|
)
|
2,346
|
|
||||||||||
|
Reclassification adjustments for realized loss on sale of marketable securities
|
894
|
|
894
|
|
—
|
|
(894
|
)
|
894
|
|
||||||||||
|
Other comprehensive income (loss)
|
(914
|
)
|
122
|
|
—
|
|
(122
|
)
|
(914
|
)
|
||||||||||
|
COMPREHENSIVE INCOME (LOSS)
|
$
|
(368,097
|
)
|
$
|
1,307
|
|
$
|
(325,874
|
)
|
$
|
324,567
|
|
$
|
(368,097
|
)
|
|||||
(1) Excludes amortization.
CONDENSED CONSOLIDATING STATEMENT OF COMPREHENSIVE INCOME (LOSS)
YEAR ENDED DECEMBER 31, 2014
|
In thousands
|
Coeur Mining, Inc.
|
Guarantor Subsidiaries
|
Non-Guarantor Subsidiaries
|
Eliminations
|
Consolidated
|
|||||||||||||||
|
Revenue
|
$
|
—
|
|
$
|
261,963
|
|
$
|
373,779
|
|
$
|
—
|
|
$
|
635,742
|
|
|||||
|
COSTS AND EXPENSES
|
||||||||||||||||||||
|
Costs applicable to sales
(1)
|
—
|
|
196,805
|
|
281,140
|
|
—
|
|
477,945
|
|
||||||||||
|
Amortization
|
1,805
|
|
65,100
|
|
95,531
|
|
—
|
|
162,436
|
|
||||||||||
|
General and administrative
|
39,976
|
|
6
|
|
863
|
|
—
|
|
40,845
|
|
||||||||||
|
Exploration
|
3,560
|
|
11,157
|
|
7,023
|
|
—
|
|
21,740
|
|
||||||||||
|
Write-downs
|
—
|
|
107,832
|
|
1,364,889
|
|
—
|
|
1,472,721
|
|
||||||||||
|
Pre-development, reclamation, and other
|
8,813
|
|
3,889
|
|
13,335
|
|
—
|
|
26,037
|
|
||||||||||
|
Total costs and expenses
|
54,154
|
|
384,789
|
|
1,762,781
|
|
—
|
|
2,201,724
|
|
||||||||||
|
OTHER INCOME (EXPENSE), NET
|
||||||||||||||||||||
|
Fair value adjustments, net
|
1,812
|
|
3,653
|
|
(1,847
|
)
|
—
|
|
3,618
|
|
||||||||||
|
Other, net
|
4,406
|
|
(7,023
|
)
|
227
|
|
(2,828
|
)
|
(5,218
|
)
|
||||||||||
|
Interest expense, net of capitalized interest
|
(38,389
|
)
|
(891
|
)
|
(11,094
|
)
|
2,828
|
|
(47,546
|
)
|
||||||||||
|
Total other income (expense), net
|
(32,171
|
)
|
(4,261
|
)
|
(12,714
|
)
|
—
|
|
(49,146
|
)
|
||||||||||
|
Income (Loss) before income and mining taxes
|
(86,325
|
)
|
(127,087
|
)
|
(1,401,716
|
)
|
—
|
|
(1,615,128
|
)
|
||||||||||
|
Income and mining tax (expense) benefit
|
1,742
|
|
(2,224
|
)
|
428,736
|
|
—
|
|
428,254
|
|
||||||||||
|
Income (Loss) after income and mining taxes
|
(84,583
|
)
|
(129,311
|
)
|
(972,980
|
)
|
—
|
|
(1,186,874
|
)
|
||||||||||
|
Equity income (loss) in consolidated subsidiaries
|
(1,102,291
|
)
|
(4,181
|
)
|
—
|
|
1,106,472
|
|
—
|
|
||||||||||
|
NET INCOME (LOSS)
|
$
|
(1,186,874
|
)
|
$
|
(133,492
|
)
|
$
|
(972,980
|
)
|
$
|
1,106,472
|
|
$
|
(1,186,874
|
)
|
|||||
|
OTHER COMPREHENSIVE INCOME (LOSS), net of tax:
|
||||||||||||||||||||
|
Unrealized gain (loss) on equity securities, net of tax
|
(2,290
|
)
|
(2,272
|
)
|
—
|
|
2,272
|
|
(2,290
|
)
|
||||||||||
|
Reclassification adjustments for impairment of equity securities, net of tax
|
4,042
|
|
4,042
|
|
—
|
|
(4,042
|
)
|
4,042
|
|
||||||||||
|
Reclassification adjustments for realized loss on sale of equity securities, net of tax
|
346
|
|
328
|
|
—
|
|
(328
|
)
|
346
|
|
||||||||||
|
Other comprehensive income (loss)
|
2,098
|
|
2,098
|
|
—
|
|
(2,098
|
)
|
2,098
|
|
||||||||||
|
COMPREHENSIVE INCOME (LOSS)
|
$
|
(1,184,776
|
)
|
$
|
(131,394
|
)
|
$
|
(972,980
|
)
|
$
|
1,104,374
|
|
$
|
(1,184,776
|
)
|
|||||
(1) Excludes amortization.
87
Coeur Mining, Inc. and Subsidiaries
Notes to Consolidated Financial Statements
CONDENSED CONSOLIDATING STATEMENT OF COMPREHENSIVE INCOME (LOSS)
YEAR ENDED DECEMBER 31, 2013
|
In thousands
|
Coeur Mining, Inc.
|
Guarantor Subsidiaries
|
Non-Guarantor Subsidiaries
|
Eliminations
|
Consolidated
|
|||||||||||||||
|
Revenue
|
$
|
—
|
|
$
|
268,023
|
|
$
|
477,971
|
|
$
|
—
|
|
$
|
745,994
|
|
|||||
|
COSTS AND EXPENSES
|
||||||||||||||||||||
|
Costs applicable to sales
(1)
|
—
|
|
182,444
|
|
281,219
|
|
—
|
|
463,663
|
|
||||||||||
|
Amortization
|
1,066
|
|
71,655
|
|
156,843
|
|
—
|
|
229,564
|
|
||||||||||
|
General and administrative
|
50,213
|
|
3,245
|
|
1,885
|
|
—
|
|
55,343
|
|
||||||||||
|
Exploration
|
1,602
|
|
8,920
|
|
11,838
|
|
—
|
|
22,360
|
|
||||||||||
|
Litigation settlement
|
—
|
|
32,046
|
|
—
|
|
—
|
|
32,046
|
|
||||||||||
|
Write-downs
|
—
|
|
130,694
|
|
642,299
|
|
—
|
|
772,993
|
|
||||||||||
|
Pre-development, reclamation, and other
|
—
|
|
3,093
|
|
12,091
|
|
—
|
|
15,184
|
|
||||||||||
|
Total costs and expenses
|
52,881
|
|
432,097
|
|
1,106,175
|
|
—
|
|
1,591,153
|
|
||||||||||
|
OTHER INCOME (EXPENSE), NET
|
||||||||||||||||||||
|
Fair value adjustments, net
|
(1,346
|
)
|
7,896
|
|
76,218
|
|
—
|
|
82,768
|
|
||||||||||
|
Other, net
|
(4,689
|
)
|
(1,750
|
)
|
4,602
|
|
(3,148
|
)
|
(4,985
|
)
|
||||||||||
|
Interest expense, net of capitalized interest
|
(25,652
|
)
|
(445
|
)
|
(18,354
|
)
|
3,148
|
|
(41,303
|
)
|
||||||||||
|
Total other income (expense), net
|
(31,687
|
)
|
5,701
|
|
62,466
|
|
—
|
|
36,480
|
|
||||||||||
|
Income (Loss) before income and mining taxes
|
(84,568
|
)
|
(158,373
|
)
|
(565,738
|
)
|
—
|
|
(808,679
|
)
|
||||||||||
|
Income and mining tax (expense) benefit
|
78,332
|
|
(155
|
)
|
79,939
|
|
—
|
|
158,116
|
|
||||||||||
|
Income (Loss) after income and mining taxes
|
(6,236
|
)
|
(158,528
|
)
|
(485,799
|
)
|
—
|
|
(650,563
|
)
|
||||||||||
|
Equity income (loss) in consolidated subsidiaries
|
(644,327
|
)
|
(68
|
)
|
—
|
|
644,395
|
|
—
|
|
||||||||||
|
NET INCOME (LOSS)
|
$
|
(650,563
|
)
|
$
|
(158,596
|
)
|
$
|
(485,799
|
)
|
$
|
644,395
|
|
$
|
(650,563
|
)
|
|||||
|
OTHER COMPREHENSIVE INCOME (LOSS), net of tax:
|
||||||||||||||||||||
|
Unrealized gain (loss) on equity securities, net of tax
|
(8,489
|
)
|
(552
|
)
|
—
|
|
552
|
|
(8,489
|
)
|
||||||||||
|
Reclassification adjustments for impairment of equity securities, net of tax
|
11,221
|
|
211
|
|
—
|
|
(211
|
)
|
11,221
|
|
||||||||||
|
Reclassification adjustments for realized loss on sale of equity securities, net of tax
|
83
|
|
—
|
|
—
|
|
—
|
|
83
|
|
||||||||||
|
Other comprehensive income (loss)
|
2,815
|
|
(341
|
)
|
—
|
|
341
|
|
2,815
|
|
||||||||||
|
COMPREHENSIVE INCOME (LOSS)
|
$
|
(647,748
|
)
|
$
|
(158,937
|
)
|
$
|
(485,799
|
)
|
$
|
644,736
|
|
$
|
(647,748
|
)
|
|||||
(1) Excludes amortization.
CONDENSED CONSOLIDATING STATEMENT OF CASH FLOWS
YEAR ENDED
DECEMBER 31, 2015
|
In thousands
|
Coeur Mining, Inc.
|
Guarantor Subsidiaries
|
Non-Guarantor Subsidiaries
|
Eliminations
|
Consolidated
|
|||||||||||||||
|
CASH FLOWS FROM OPERATING ACTIVITIES:
|
||||||||||||||||||||
|
Cash provided by (used in) operating activities
|
$
|
(377,091
|
)
|
$
|
86,486
|
|
$
|
79,458
|
|
$
|
324,689
|
|
113,542
|
|
||||||
|
CASH FLOWS FROM INVESTING ACTIVITIES
|
||||||||||||||||||||
|
Capital expenditures
|
(514
|
)
|
(52,376
|
)
|
(42,303
|
)
|
—
|
|
(95,193
|
)
|
||||||||||
|
Purchase of short-term investments and equity securities
|
(1,880
|
)
|
—
|
|
—
|
|
—
|
|
(1,880
|
)
|
||||||||||
|
Sales and maturities of short-term investments
|
2
|
|
532
|
|
71
|
|
—
|
|
605
|
|
||||||||||
|
Acquisitions, net of cash acquired
|
(110,846
|
)
|
—
|
|
—
|
|
—
|
|
(110,846
|
)
|
||||||||||
|
Other
|
(4,710
|
)
|
523
|
|
208
|
|
—
|
|
(3,979
|
)
|
||||||||||
|
Investments in consolidated subsidiaries
|
282,041
|
|
20,239
|
|
120
|
|
(302,400
|
)
|
—
|
|
||||||||||
|
CASH PROVIDED BY (USED IN) INVESTING ACTIVITIES
|
164,093
|
|
(31,082
|
)
|
(41,904
|
)
|
(302,400
|
)
|
(211,293
|
)
|
||||||||||
|
CASH FLOWS FROM FINANCING ACTIVITIES:
|
||||||||||||||||||||
|
Issuance of notes and bank borrowings
|
150,000
|
|
—
|
|
3,500
|
|
—
|
|
153,500
|
|
||||||||||
|
Payments on debt, capital leases, and associated costs
|
(62,930
|
)
|
(7,428
|
)
|
(14,357
|
)
|
—
|
|
(84,715
|
)
|
||||||||||
|
Gold production royalty payments
|
—
|
|
—
|
|
(39,235
|
)
|
—
|
|
(39,235
|
)
|
||||||||||
|
Net intercompany financing activity
|
12,232
|
|
(19,518
|
)
|
29,575
|
|
(22,289
|
)
|
—
|
|
||||||||||
|
Other
|
(542
|
)
|
—
|
|
—
|
|
—
|
|
(542
|
)
|
||||||||||
|
CASH PROVIDED BY (USED IN) FINANCING ACTIVITIES
|
98,760
|
|
(26,946
|
)
|
(20,517
|
)
|
(22,289
|
)
|
29,008
|
|
||||||||||
|
Effect of exchange rate changes on cash and cash equivalents
|
—
|
|
(11
|
)
|
(1,393
|
)
|
—
|
|
(1,404
|
)
|
||||||||||
|
NET CHANGE IN CASH AND CASH EQUIVALENTS
|
(114,238
|
)
|
28,447
|
|
15,644
|
|
—
|
|
(70,147
|
)
|
||||||||||
|
Cash and cash equivalents at beginning of period
|
210,361
|
|
5,781
|
|
54,719
|
|
—
|
|
270,861
|
|
||||||||||
|
Cash and cash equivalents at end of period
|
$
|
96,123
|
|
$
|
34,228
|
|
$
|
70,363
|
|
$
|
—
|
|
$
|
200,714
|
|
|||||
88
Coeur Mining, Inc. and Subsidiaries
Notes to Consolidated Financial Statements
CONDENSED CONSOLIDATING STATEMENT OF CASH FLOWS
YEAR ENDED DECEMBER 31, 2014
|
In thousands
|
Coeur Mining, Inc.
|
Guarantor Subsidiaries
|
Non-Guarantor Subsidiaries
|
Eliminations
|
Consolidated
|
|||||||||||||||
|
CASH FLOWS FROM OPERATING ACTIVITIES:
|
||||||||||||||||||||
|
Cash provided by (used in) operating activities
|
$
|
(1,175,464
|
)
|
$
|
41,292
|
|
$
|
81,248
|
|
$
|
1,106,472
|
|
53,548
|
|
||||||
|
CASH FLOWS FROM INVESTING ACTIVITIES
|
—
|
|
—
|
|
—
|
|
||||||||||||||
|
Capital expenditures
|
(1,849
|
)
|
(28,118
|
)
|
(34,277
|
)
|
—
|
|
(64,244
|
)
|
||||||||||
|
Purchase of short term investments and equity securities
|
(50,013
|
)
|
(429
|
)
|
(71
|
)
|
—
|
|
(50,513
|
)
|
||||||||||
|
Sales and maturities of short term investments and equity securities
|
49,069
|
|
5,261
|
|
14
|
|
—
|
|
54,344
|
|
||||||||||
|
Acquisitions
|
(12,079
|
)
|
(4,000
|
)
|
(5,250
|
)
|
—
|
|
(21,329
|
)
|
||||||||||
|
Other
|
—
|
|
48
|
|
(40
|
)
|
—
|
|
8
|
|
||||||||||
|
Investments in consolidated subsidiaries
|
1,151,372
|
|
4,106
|
|
—
|
|
(1,155,478
|
)
|
—
|
|
||||||||||
|
CASH PROVIDED BY (USED IN) INVESTING ACTIVITIES
|
1,136,500
|
|
(23,132
|
)
|
(39,624
|
)
|
(1,155,478
|
)
|
(81,734
|
)
|
||||||||||
|
CASH FLOWS FROM FINANCING ACTIVITIES:
|
||||||||||||||||||||
|
Issuance of notes and bank borrowings
|
153,000
|
|
—
|
|
14,784
|
|
—
|
|
167,784
|
|
||||||||||
|
Payments on long-term debt, capital leases, and associated costs
|
(18,545
|
)
|
(6,114
|
)
|
(1,243
|
)
|
—
|
|
(25,902
|
)
|
||||||||||
|
Gold production royalty payments
|
—
|
|
—
|
|
(48,395
|
)
|
—
|
|
(48,395
|
)
|
||||||||||
|
Net intercompany financing activity
|
(21,697
|
)
|
(7,256
|
)
|
(20,053
|
)
|
49,006
|
|
—
|
|
||||||||||
|
Other
|
(509
|
)
|
—
|
|
—
|
|
—
|
|
(509
|
)
|
||||||||||
|
CASH PROVIDED BY (USED IN) FINANCING ACTIVITIES
|
112,249
|
|
(13,370
|
)
|
(54,907
|
)
|
49,006
|
|
92,978
|
|
||||||||||
|
Effect of exchange rate changes on cash and cash equivalents
|
—
|
|
—
|
|
(621
|
)
|
—
|
|
(621
|
)
|
||||||||||
|
NET CHANGE IN CASH AND CASH EQUIVALENTS
|
73,285
|
|
4,790
|
|
(13,904
|
)
|
—
|
|
64,171
|
|
||||||||||
|
Cash and cash equivalents at beginning of period
|
137,076
|
|
991
|
|
68,623
|
|
—
|
|
206,690
|
|
||||||||||
|
Cash and cash equivalents at end of period
|
$
|
210,361
|
|
$
|
5,781
|
|
$
|
54,719
|
|
$
|
—
|
|
$
|
270,861
|
|
|||||
CONDENSED CONSOLIDATING STATEMENT OF CASH FLOWS
YEAR ENDED DECEMBER 31, 2013
|
In thousands
|
Coeur Mining, Inc.
|
Guarantor Subsidiaries
|
Non-Guarantor Subsidiaries
|
Eliminations
|
Consolidated
|
|||||||||||||||
|
CASH FLOWS FROM OPERATING ACTIVITIES:
|
||||||||||||||||||||
|
Cash provided by (used in) operating activities
|
$
|
(701,653
|
)
|
$
|
17,456
|
|
$
|
151,991
|
|
$
|
646,173
|
|
$
|
113,967
|
|
|||||
|
CASH FLOWS FROM INVESTING ACTIVITIES
|
||||||||||||||||||||
|
Capital expenditures
|
(3,573
|
)
|
(50,810
|
)
|
(46,430
|
)
|
—
|
|
(100,813
|
)
|
||||||||||
|
Purchase of short term investments and equity securities
|
(2,921
|
)
|
(66
|
)
|
(5,065
|
)
|
—
|
|
(8,052
|
)
|
||||||||||
|
Sales and maturities of short term investments and equity securities
|
29,274
|
|
75
|
|
5,447
|
|
—
|
|
34,796
|
|
||||||||||
|
Acquisitions
|
(113,214
|
)
|
(3,684
|
)
|
—
|
|
—
|
|
(116,898
|
)
|
||||||||||
|
Other
|
3,266
|
|
444
|
|
768
|
|
—
|
|
4,478
|
|
||||||||||
|
Investments in consolidated subsidiaries
|
642,617
|
|
68
|
|
3,488
|
|
(646,173
|
)
|
—
|
|
||||||||||
|
CASH PROVIDED BY (USED IN) INVESTING ACTIVITIES
|
555,449
|
|
(53,973
|
)
|
(41,792
|
)
|
(646,173
|
)
|
(186,489
|
)
|
||||||||||
|
CASH FLOWS FROM FINANCING ACTIVITIES:
|
||||||||||||||||||||
|
Issuance of notes and bank borrowings
|
300,000
|
|
—
|
|
—
|
|
—
|
|
300,000
|
|
||||||||||
|
Payments on long-term debt, capital leases, and associated costs
|
(52,568
|
)
|
(3,171
|
)
|
(4,889
|
)
|
—
|
|
(60,628
|
)
|
||||||||||
|
Gold production royalty payments
|
—
|
|
—
|
|
(57,034
|
)
|
—
|
|
(57,034
|
)
|
||||||||||
|
Share repurchases
|
(27,552
|
)
|
—
|
|
—
|
|
—
|
|
(27,552
|
)
|
||||||||||
|
Net intercompany financing activity
|
(22,874
|
)
|
40,279
|
|
(17,405
|
)
|
—
|
|
—
|
|
||||||||||
|
Other
|
(514
|
)
|
—
|
|
—
|
|
—
|
|
(514
|
)
|
||||||||||
|
CASH PROVIDED BY (USED IN) FINANCING ACTIVITIES
|
196,492
|
|
37,108
|
|
(79,328
|
)
|
—
|
|
154,272
|
|
||||||||||
|
Effect of exchange rate changes on cash and cash equivalents
|
—
|
|
—
|
|
(500
|
)
|
—
|
|
(500
|
)
|
||||||||||
|
NET CHANGE IN CASH AND CASH EQUIVALENTS
|
50,288
|
|
591
|
|
30,371
|
|
—
|
|
81,250
|
|
||||||||||
|
Cash and cash equivalents at beginning of period
|
86,788
|
|
400
|
|
38,252
|
|
—
|
|
125,440
|
|
||||||||||
|
Cash and cash equivalents at end of period
|
$
|
137,076
|
|
$
|
991
|
|
$
|
68,623
|
|
$
|
—
|
|
$
|
206,690
|
|
|||||
89
Coeur Mining, Inc. and Subsidiaries
Notes to Consolidated Financial Statements
CONDENSED CONSOLIDATING BALANCE SHEET
DECEMBER 31, 2015
|
In thousands
|
Coeur Mining, Inc.
|
Guarantor Subsidiaries
|
Non-Guarantor Subsidiaries
|
Eliminations
|
Consolidated
|
|||||||||||||||
|
ASSETS
|
||||||||||||||||||||
|
CURRENT ASSETS
|
||||||||||||||||||||
|
Cash and cash equivalents
|
$
|
96,123
|
|
$
|
34,228
|
|
$
|
70,363
|
|
$
|
—
|
|
$
|
200,714
|
|
|||||
|
Receivables
|
11
|
|
12,773
|
|
73,208
|
|
—
|
|
85,992
|
|
||||||||||
|
Ore on leach pads
|
—
|
|
67,329
|
|
—
|
|
—
|
|
67,329
|
|
||||||||||
|
Inventory
|
—
|
|
45,491
|
|
36,220
|
|
—
|
|
81,711
|
|
||||||||||
|
Prepaid expenses and other
|
3,496
|
|
1,075
|
|
6,371
|
|
—
|
|
10,942
|
|
||||||||||
|
99,630
|
|
160,896
|
|
186,162
|
|
—
|
|
446,688
|
|
|||||||||||
|
NON-CURRENT ASSETS
|
||||||||||||||||||||
|
Property, plant and equipment, net
|
4,546
|
|
138,706
|
|
52,747
|
|
—
|
|
195,999
|
|
||||||||||
|
Mining properties, net
|
—
|
|
199,303
|
|
389,916
|
|
—
|
|
589,219
|
|
||||||||||
|
Ore on leach pads
|
—
|
|
44,582
|
|
—
|
|
—
|
|
44,582
|
|
||||||||||
|
Restricted assets
|
5,755
|
|
381
|
|
5,497
|
|
—
|
|
11,633
|
|
||||||||||
|
Equity securities
|
434
|
|
2,332
|
|
—
|
|
—
|
|
2,766
|
|
||||||||||
|
Receivables
|
—
|
|
—
|
|
24,768
|
|
—
|
|
24,768
|
|
||||||||||
|
Deferred tax assets
|
—
|
|
—
|
|
1,942
|
|
—
|
|
1,942
|
|
||||||||||
|
Net investment in subsidiaries
|
127,671
|
|
27,657
|
|
—
|
|
(155,328
|
)
|
—
|
|
||||||||||
|
Other
|
54,578
|
|
9,197
|
|
5,695
|
|
(54,578
|
)
|
14,892
|
|
||||||||||
|
TOTAL ASSETS
|
$
|
292,614
|
|
$
|
583,054
|
|
$
|
666,727
|
|
$
|
(209,906
|
)
|
$
|
1,332,489
|
|
|||||
|
LIABILITIES AND STOCKHOLDERS’ EQUITY
|
||||||||||||||||||||
|
CURRENT LIABILITIES
|
||||||||||||||||||||
|
Accounts payable
|
$
|
1,743
|
|
$
|
18,535
|
|
$
|
28,454
|
|
$
|
—
|
|
$
|
48,732
|
|
|||||
|
Accrued liabilities and other
|
20,555
|
|
14,598
|
|
18,800
|
|
—
|
|
53,953
|
|
||||||||||
|
Debt
|
1,000
|
|
8,120
|
|
1,311
|
|
—
|
|
10,431
|
|
||||||||||
|
Royalty obligations
|
—
|
|
4,729
|
|
20,164
|
|
—
|
|
24,893
|
|
||||||||||
|
Reclamation
|
—
|
|
1,401
|
|
1,821
|
|
(1,151
|
)
|
2,071
|
|
||||||||||
|
23,298
|
|
47,383
|
|
70,550
|
|
(1,151
|
)
|
140,080
|
|
|||||||||||
|
NON-CURRENT LIABILITIES
|
||||||||||||||||||||
|
Debt
|
467,634
|
|
4,947
|
|
61,976
|
|
(54,578
|
)
|
479,979
|
|
||||||||||
|
Royalty obligations
|
—
|
|
4,864
|
|
—
|
|
—
|
|
4,864
|
|
||||||||||
|
Reclamation
|
—
|
|
61,924
|
|
20,122
|
|
1,151
|
|
83,197
|
|
||||||||||
|
Deferred tax liabilities
|
28,600
|
|
6,927
|
|
111,605
|
|
—
|
|
147,132
|
|
||||||||||
|
Other long-term liabilities
|
2,171
|
|
3,838
|
|
49,752
|
|
—
|
|
55,761
|
|
||||||||||
|
Intercompany payable (receivable)
|
(650,565
|
)
|
411,103
|
|
239,462
|
|
—
|
|
—
|
|
||||||||||
|
(152,160
|
)
|
493,603
|
|
482,917
|
|
(53,427
|
)
|
770,933
|
|
|||||||||||
|
STOCKHOLDERS’ EQUITY
|
||||||||||||||||||||
|
Common stock
|
1,513
|
|
250
|
|
130,885
|
|
(131,135
|
)
|
1,513
|
|
||||||||||
|
Additional paid-in capital
|
3,024,461
|
|
179,553
|
|
1,896,047
|
|
(2,075,600
|
)
|
3,024,461
|
|
||||||||||
|
Accumulated deficit
|
(2,600,776
|
)
|
(135,049
|
)
|
(1,913,672
|
)
|
2,048,721
|
|
(2,600,776
|
)
|
||||||||||
|
Accumulated other comprehensive income (loss)
|
(3,722
|
)
|
(2,686
|
)
|
—
|
|
2,686
|
|
(3,722
|
)
|
||||||||||
|
421,476
|
|
42,068
|
|
113,260
|
|
(155,328
|
)
|
421,476
|
|
|||||||||||
|
TOTAL LIABILITIES AND STOCKHOLDERS’ EQUITY
|
$
|
292,614
|
|
$
|
583,054
|
|
$
|
666,727
|
|
$
|
(209,906
|
)
|
$
|
1,332,489
|
|
|||||
90
Coeur Mining, Inc. and Subsidiaries
Notes to Consolidated Financial Statements
CONDENSED CONSOLIDATING BALANCE SHEET
DECEMBER 31, 2014
|
In thousands
|
Coeur Mining, Inc.
|
Guarantor Subsidiaries
|
Non-Guarantor Subsidiaries
|
Eliminations
|
Consolidated
|
|||||||||||||||
|
ASSETS
|
||||||||||||||||||||
|
CURRENT ASSETS
|
||||||||||||||||||||
|
Cash and cash equivalents
|
$
|
210,361
|
|
$
|
5,781
|
|
$
|
54,719
|
|
$
|
—
|
|
$
|
270,861
|
|
|||||
|
Receivables
|
87
|
|
11,151
|
|
96,685
|
|
—
|
|
107,923
|
|
||||||||||
|
Ore on leach pads
|
—
|
|
48,204
|
|
—
|
|
—
|
|
48,204
|
|
||||||||||
|
Inventory
|
—
|
|
54,983
|
|
59,948
|
|
—
|
|
114,931
|
|
||||||||||
|
Prepaid expenses and other
|
6,349
|
|
4,557
|
|
4,617
|
|
—
|
|
15,523
|
|
||||||||||
|
216,797
|
|
124,676
|
|
215,969
|
|
—
|
|
557,442
|
|
|||||||||||
|
NON-CURRENT ASSETS
|
||||||||||||||||||||
|
Property, plant and equipment, net
|
6,155
|
|
107,084
|
|
114,672
|
|
—
|
|
227,911
|
|
||||||||||
|
Mining properties, net
|
12,004
|
|
159,124
|
|
330,064
|
|
—
|
|
501,192
|
|
||||||||||
|
Ore on leach pads
|
—
|
|
37,889
|
|
—
|
|
—
|
|
37,889
|
|
||||||||||
|
Restricted assets
|
897
|
|
50
|
|
6,090
|
|
—
|
|
7,037
|
|
||||||||||
|
Equity securities
|
—
|
|
5,982
|
|
—
|
|
—
|
|
5,982
|
|
||||||||||
|
Receivables
|
—
|
|
—
|
|
21,686
|
|
—
|
|
21,686
|
|
||||||||||
|
Deferred tax assets
|
30,812
|
|
—
|
|
36,703
|
|
—
|
|
67,515
|
|
||||||||||
|
Net investment in subsidiaries
|
97,923
|
|
45,615
|
|
—
|
|
(143,538
|
)
|
—
|
|
||||||||||
|
Other
|
50,813
|
|
5,522
|
|
4,394
|
|
(50,814
|
)
|
9,915
|
|
||||||||||
|
TOTAL ASSETS
|
$
|
415,401
|
|
$
|
485,942
|
|
$
|
729,578
|
|
$
|
(194,352
|
)
|
$
|
1,436,569
|
|
|||||
|
LIABILITIES AND STOCKHOLDERS’ EQUITY
|
||||||||||||||||||||
|
CURRENT LIABILITIES
|
||||||||||||||||||||
|
Accounts payable
|
$
|
3,414
|
|
$
|
13,391
|
|
$
|
32,247
|
|
$
|
—
|
|
$
|
49,052
|
|
|||||
|
Accrued liabilities and other
|
22,588
|
|
11,207
|
|
17,718
|
|
—
|
|
51,513
|
|
||||||||||
|
Debt
|
5,334
|
|
7,476
|
|
4,688
|
|
—
|
|
17,498
|
|
||||||||||
|
Royalty obligations
|
—
|
|
5,747
|
|
37,931
|
|
—
|
|
43,678
|
|
||||||||||
|
Reclamation
|
—
|
|
3,401
|
|
1,621
|
|
(1,151
|
)
|
3,871
|
|
||||||||||
|
31,336
|
|
41,222
|
|
94,205
|
|
(1,151
|
)
|
165,612
|
|
|||||||||||
|
NON-CURRENT LIABILITIES
|
||||||||||||||||||||
|
Debt
|
427,604
|
|
12,806
|
|
61,452
|
|
(50,814
|
)
|
451,048
|
|
||||||||||
|
Royalty obligations
|
—
|
|
9,623
|
|
18,028
|
|
—
|
|
27,651
|
|
||||||||||
|
Reclamation
|
—
|
|
46,792
|
|
19,000
|
|
1,151
|
|
66,943
|
|
||||||||||
|
Deferred tax liabilities
|
60,343
|
|
3,811
|
|
76,922
|
|
—
|
|
141,076
|
|
||||||||||
|
Other long-term liabilities
|
2,582
|
|
469
|
|
26,860
|
|
—
|
|
29,911
|
|
||||||||||
|
Intercompany payable (receivable)
|
(660,792
|
)
|
427,156
|
|
233,636
|
|
—
|
|
—
|
|
||||||||||
|
(170,263
|
)
|
500,657
|
|
435,898
|
|
(49,663
|
)
|
716,629
|
|
|||||||||||
|
STOCKHOLDERS’ EQUITY
|
||||||||||||||||||||
|
Common stock
|
1,034
|
|
250
|
|
128,299
|
|
(128,549
|
)
|
1,034
|
|
||||||||||
|
Additional paid-in capital
|
2,789,695
|
|
79,712
|
|
1,682,830
|
|
(1,762,542
|
)
|
2,789,695
|
|
||||||||||
|
Accumulated deficit
|
(2,233,593
|
)
|
(133,091
|
)
|
(1,611,654
|
)
|
1,744,745
|
|
(2,233,593
|
)
|
||||||||||
|
Accumulated other comprehensive income (loss)
|
(2,808
|
)
|
(2,808
|
)
|
—
|
|
2,808
|
|
(2,808
|
)
|
||||||||||
|
554,328
|
|
(55,937
|
)
|
199,475
|
|
(143,538
|
)
|
554,328
|
|
|||||||||||
|
TOTAL LIABILITIES AND STOCKHOLDERS’ EQUITY
|
$
|
415,401
|
|
$
|
485,942
|
|
$
|
729,578
|
|
$
|
(194,352
|
)
|
$
|
1,436,569
|
|
|||||
91
Coeur Mining, Inc. and Subsidiaries
Notes to Consolidated Financial Statements
Labor Union Contract
The Company maintains a labor agreement with Sindicato de Trabajadores Mineros de la Empresa Manquiri S.A. at the San Bartolomé mine in Bolivia. The San Bartolomé mine labor agreement, which became effective January 28, 2010, is currently active and does not have a fixed term. At
December 31, 2015
, approximately
11%
of the Company’s global labor force was covered by this collective bargaining agreement. The Company cannot predict whether this agreement will be renewed on similar terms or at all, whether future labor disruptions will occur or, if disruptions do occur, how long they will last.
Rochester Production Royalty
Commencing January 1, 2014, Coeur Rochester is obligated to pay a
3.4%
net smelter returns royalty on up to
39.4 million
silver equivalent ounces produced and sold from a portion of the Rochester mine, payable on a quarterly basis. For each calendar quarter, the royalty will be payable on the actual sales prices received (exclusive of gains or losses associated with trading activities), less refining costs, of gold and silver produced and sold from the applicable portions of the Rochester mine. Changes in the Company's mine plan and silver and gold prices result in the recognition of mark-to-market gains or losses in
Fair value adjustments, net
. At
December 31, 2015
, a total of
26.1 million
silver equivalent ounces remain outstanding under the obligation.
Palmarejo Gold Production Royalty and Gold Stream
On January 21, 2009, Coeur Mexicana entered into a gold production royalty agreement with a subsidiary of Franco-Nevada Corporation under which the subsidiary of Franco-Nevada Corporation purchased a royalty covering
50%
of the life of mine gold to be produced from its Palmarejo silver and gold mine in Mexico (excluding production from the recently acquired Paramount properties). The royalty agreement provides for a minimum obligation of
4,167
ounces per month over an initial eight-year period for a total of
400,000
ounces of gold.
On
October 2, 2014
, Coeur Mexicana terminated the Palmarejo gold production royalty in exchange for a termination payment of
$2.0 million
, effective upon completion of the minimum ounce delivery requirement. Subsequently, Coeur Mexicana entered into a gold stream agreement with a subsidiary of Franco-Nevada Corporation whereby Coeur Mexicana will sell
50%
of Palmarejo gold production (excluding production from the recently acquired Paramount properties) upon completion of the gold production royalty minimum ounce delivery requirement for the lesser of
$800
or spot price per ounce. Under the gold stream agreement, Coeur Mexicana received a
$22.0 million
deposit toward future deliveries under the gold stream agreement.
Sites Related to Callahan Mining Corporation
In 1991, the Company acquired all of the outstanding common stock of Callahan Mining Corporation. The Company has received requests for information or notices of potential liability from state or federal agencies with regard to Callahan's operations at sites in Maine, Colorado and Washington. The Company did not make any decisions with respect to generation, transport or disposal of hazardous waste at these sites. Therefore, the Company believes that it is not liable for any potential cleanup costs either directly as an operator or indirectly as a parent. The Company anticipates that further agency interaction may occur with respect to these sites.
Callahan operated a mine and mill in Brooksville, Maine from 1968 until 1972 and subsequently disposed of the property. In 2000, the U.S. Environmental Protection Agency, or EPA, made a formal request to the Company for information regarding the site. The site was placed on the National Priorities List on September 5, 2002, and the Maine Department of Transportation, a partial owner of the property, signed a consent order in 2005. In January 2009, the EPA and the State of Maine made additional formal requests to the Company for information relating to the site, to which the Company responded. The first phase of cleanup at the site began in April 2011.
The Van Stone Mine in Stevens County, Washington consists of several parcels of land and was mined from 1926 until 1993 by multiple owners. Callahan sold its parcel in 1990. In February 2010, the State of Washington Department of Ecology notified Callahan that it, among others, is a potentially liable person (PLP) under Washington law.
Under lease and option agreements with several owners, Callahan was involved with the Akron Mine located in Gunnison County, Colorado from 1937-1960. The United States Forest Service (“USFS”) made formal requests for information to Callahan regarding the site in December 2003, February 2007, March 2013, and November 2013. Callahan timely responded to each request. In August 2014, Callahan received a notice of potential CERCLA liability from the USFS regarding environmental contamination at the Akron Mine. Callahan and the USFS are currently in discussions regarding this matter.
92
Coeur Mining, Inc. and Subsidiaries
Notes to Consolidated Financial Statements
Bolivian Temporary Restriction on Mining above
4,400
Meters
On October 14, 2009, the Bolivian state-owned mining organization, COMIBOL, announced by resolution that it was temporarily suspending mining activities above the elevation of
4,400
meters above sea level while stability studies of Cerro Rico mountain are undertaken. The Company holds rights to mine above this elevation under valid contracts with COMIBOL as well as under authorized contracts with local mining cooperatives that hold their rights under contract themselves with COMIBOL. The stability studies have been completed and officially submitted to the Bolivian mining technical authorities. Accordingly, the COMIBOL suspension has expired in accordance with the terms of the resolution. As a result of the resolution, the Company temporarily adjusted its mine plan to confine mining activities to the ore deposits below
4,400
meters above sea level and timely notified COMIBOL of the need to lift the restriction. The Cooperative Reserva Fiscal, with whom the Company has one of those contracts, subsequently interpreted the COMIBOL resolution and determined that the Huacajchi deposit was not covered by such resolution. In March 2010, the Cooperative Reserva Fiscal notified COMIBOL that, based on its interpretation, it was resuming mining of high grade material above the
4,400
meter level in the Huacajchi deposit. In December 2011, the Cooperative Reserva Fiscal sent a similar notification to COMIBOL with respect to a further area above the
4,400
meter level known as Huacajchi Sur. Based on these notifications and on the absence of any objection from COMIBOL, the Company resumed limited mining operations at the San Bartolomé mine on the Huacajchi deposit and Huacajchi Sur. Despite the fact that the COMIBOL suspension has expired, the Company has not resumed mining in other areas above the
4,400
meter level due to community relations concerns and the current political climate in Bolivia.
While the COMIBOL suspension has expired, it is uncertain at this time how long the Company will continue to suspend its mining operations in areas above the
4,400
meter level other than at Huacajchi and Huacajchi Sur. If COMIBOL decides to affirmatively adopt a new resolution to restrict access above the
4,400
meter level on a permanent basis, the Company may need to further write down the carrying value of the asset. While a portion of the Company's proven and probable reserves relate to material above the
4,400
meter level at San Bartolomé, so long as operations remain suspended, there is a risk that silver may not be produced from this material at expected levels or at all, particularly given the remaining anticipated mine life of this asset. It is also uncertain if any new mining or investment policies or shifts in political attitude may affect mining in Bolivia.
The following table presents non-cash financing and investing activities and other cash flow information:
|
Year ended December 31,
|
|||||||||||
|
Non-cash financing and investing activities:
|
2015
|
2014
|
2013
|
||||||||
|
Capital lease obligations
|
$
|
4,123
|
|
$
|
24,879
|
|
$
|
—
|
|
||
|
Non-cash extinguishment of senior notes
|
53,373
|
|
—
|
|
—
|
|
|||||
|
Non-cash acquisitions and related deferred taxes
|
297,821
|
|
—
|
|
317,826
|
|
|||||
|
Other cash flow information:
|
|||||||||||
|
Interest paid
|
$
|
42,264
|
|
$
|
30,691
|
|
$
|
14,139
|
|
||
|
Income taxes paid
|
1,937
|
|
20,198
|
|
26,585
|
|
|||||
93
Coeur Mining, Inc. and Subsidiaries
Notes to Consolidated Financial Statements
SUMMARY OF QUARTERLY FINANCIAL DATA (UNAUDITED)
The following table sets forth a summary of the unaudited quarterly results of operations for the years ended December 31, 2015 and 2014 (in thousands, except per share data):
|
Q1
|
Q2
|
Q3
|
Q4
|
||||||||||||
|
2015
|
|
|
|
|
|
|
|
|
|||||||
|
Revenues
|
$
|
152,956
|
|
|
$
|
166,263
|
|
|
$
|
162,552
|
|
|
$
|
164,315
|
|
|
Costs applicable to sales
|
115,062
|
|
|
119,097
|
|
|
120,237
|
|
|
125,258
|
|
||||
|
Amortization
|
33,090
|
|
|
38,974
|
|
|
35,497
|
|
|
36,190
|
|
||||
|
Exploration
|
4,266
|
|
|
3,579
|
|
|
2,112
|
|
|
1,690
|
|
||||
|
Other operating expenses (General and administrative, Pre-development, reclamation, and other, and Write-downs)
(1)
|
15,597
|
|
|
10,718
|
|
|
11,632
|
|
|
326,017
|
|
||||
|
Net income (loss)
|
(33,287
|
)
|
|
(16,677
|
)
|
|
(14,219
|
)
|
|
(303,000
|
)
|
||||
|
Cash provided by (used in) operating activities
|
(3,449
|
)
|
|
37,004
|
|
|
36,770
|
|
|
43,217
|
|
||||
|
Capital expenditures
|
17,620
|
|
|
23,677
|
|
|
23,861
|
|
|
30,035
|
|
||||
|
|
|||||||||||||||
|
Basic net income (loss) per share
|
$
|
(0.32
|
)
|
|
$
|
(0.12
|
)
|
|
$
|
(0.11
|
)
|
|
$
|
(2.28
|
)
|
|
|
|||||||||||||||
|
Diluted net income (loss) per share
|
$
|
(0.32
|
)
|
|
$
|
(0.12
|
)
|
|
$
|
(0.11
|
)
|
|
$
|
(2.28
|
)
|
(1) The Company performed impairment testing of long-lived assets in the fourth quarter of 2015 and, based on the results of the impairment testing, recorded a write-down of
$313.3 million
to long-lived assets.
|
Q1
|
Q2
|
Q3
|
Q4
|
||||||||||||
|
2014
|
|
|
|
|
|
|
|
|
|||||||
|
Revenues
|
$
|
159,633
|
|
$
|
164,562
|
|
$
|
170,938
|
|
$
|
140,609
|
|
|||
|
Costs applicable to sales
|
106,896
|
|
118,687
|
|
125,910
|
|
126,452
|
|
|||||||
|
Amortization
|
40,459
|
|
41,422
|
|
41,985
|
|
38,570
|
|
|||||||
|
Exploration
|
4,217
|
|
5,153
|
|
6,587
|
|
5,783
|
|
|||||||
|
Other operating expenses (General and administrative, Pre-development, reclamation, and other, and Write-downs)
(1)
|
20,880
|
|
18,158
|
|
12,759
|
|
1,446,961
|
|
|||||||
|
Net income (loss)
|
(37,191
|
)
|
(43,121
|
)
|
3,466
|
|
(1,110,028
|
)
|
|||||||
|
Cash provided by (used in) operating activities
|
(9,602
|
)
|
30,381
|
|
31,565
|
|
1,204
|
|
|||||||
|
Capital expenditures
|
11,936
|
|
15,356
|
|
16,784
|
|
20,168
|
|
|||||||
|
Basic net income (loss) per share
|
$
|
(0.36
|
)
|
$
|
(0.42
|
)
|
$
|
0.03
|
|
$
|
(10.84
|
)
|
|||
|
Diluted net income (loss) per share
|
$
|
(0.36
|
)
|
$
|
(0.42
|
)
|
$
|
0.03
|
|
$
|
(10.84
|
)
|
|||
(1) The Company performed impairment testing of long-lived assets in the fourth quarter of 2014 and, based on the results of the impairment testing, recorded a write-down of $1,472.7 million to long-lived assets.
|
Item 9.
|
Changes in and Disagreements with Accountants on Accounting and Financial Disclosure
|
Not applicable.
|
Item 9A.
|
Controls and Procedures
|
|
(a)
|
Disclosure Controls and Procedures
|
The Company’s disclosure controls and procedures are designed to provide reasonable assurance that information required to be disclosed by it in its periodic reports filed with the SEC is recorded, processed, summarized and reported, within the time periods specified in the SEC’s rules and forms, and to ensure that such information is accumulated and communicated to the Company’s management, including its Chief Executive Officer, and Chief Financial Officer, as appropriate to allow timely decisions regarding required disclosure. Based on an evaluation of the Company’s disclosure controls and procedures conducted by the Company’s Chief Executive Officer and Chief Financial Officer, such officers concluded that the Company’s disclosure controls and procedures were effective and operating at a reasonable assurance level as of December 31, 2015.
94
|
(b)
|
Management’s Report on Internal Control Over Financial Reporting
|
The management of the Company is responsible for establishing and maintaining adequate internal control over financial reporting. The Securities Exchange Act of 1934 defines internal control over financial reporting in Rule 13a-15(f) and 15d-15(f) as a process designed by, or under the supervision of, the Company’s principal executive and principal financial officers and effected by the Company’s board of directors, management and other personnel, to provide reasonable assurance regarding the reliability of financial reporting and the preparation of financial statements for external purposes in accordance with generally accepted accounting principles and includes those policies and procedures that:
|
•
|
Pertain to the maintenance of records that in reasonable detail accurately and fairly reflect the transactions and dispositions of the assets of the Company;
|
|
•
|
Provide reasonable assurance that transactions are recorded as necessary to permit preparation of financial statements in accordance with generally accepted accounting principles, and that receipts and expenditures of the Company are being made only in accordance with authorizations of management and directors of the Company; and
|
|
•
|
Provide reasonable assurance regarding prevention or timely detection of unauthorized acquisition, use or disposition of the Company’s assets that could have a material effect on the consolidated financial statements.
|
Because of its inherent limitations, internal control over financial reporting may not prevent or detect misstatements. Also, projections of any evaluation of effectiveness to future periods are subject to risk that controls may become inadequate because of changes in conditions, or that the degree of compliance with the policies or procedures may deteriorate.
The Company’s management assessed the effectiveness of the Company’s internal control over financial reporting as of December 31, 2015. In making this assessment, the Company’s management used the criteria set forth by the Committee of Sponsoring Organizations of the Treadway Commission (COSO) in
Internal Control - Integrated Framework (2013)
. Based upon its assessment, management concluded that, as of December 31, 2015, the Company’s internal control over financial reporting was effective.
The Company completed the acquisition of Wharf during 2015, and management excluded the internal control over financial reporting of this entity from its assessment of the Company's internal control over financial reporting at December 31, 2015. The consolidated financial statements of the Company for the year ended December 31, 2015, reflect total assets of approximately
$136.0 million
and revenues of
$84.1 million
associated with the acquired businesses.
The effectiveness of internal control over financial reporting as of December 31, 2015 has been audited by KPMG LLP, an independent registered public accounting firm, as stated in their report which is included herein.
|
(c)
|
Changes in Internal Control Over Financial Reporting
|
There have been no changes in the Company’s internal control over financial reporting during the most recently completed fiscal quarter that have materially affected, or are reasonably likely to materially affect, its internal control over financial reporting.
|
Item 9B.
|
Other Information
|
None.
95
|
Item 10.
|
Directors, Executive Officers and Corporate Governance
|
Pursuant to General Instruction G(3) of Form 10-K, the information called for by this item regarding directors is hereby incorporated by reference from the Company’s definitive proxy statement for the 2016 Annual Meeting of Stockholders filed pursuant to Regulation 14A, or an amendment hereto, to be filed not later than 120 days after the end of the fiscal year covered by this report under the captions “Proposal No. 1 Election of Directors”, “Executive Officers”, “Section 16(a) Beneficial Ownership Reporting Compliance,” “Corporate Governance Guidelines and Code of Business Conduct and Ethics” and “Audit Committee Report”.
|
Item 11.
|
Executive Compensation
|
Pursuant to General Instruction G(3) of Form 10-K, the information called for by this item is hereby incorporated by reference from the Company’s definitive proxy statement for the 2016 Annual Meeting of Stockholders filed pursuant to Regulation 14A, or an amendment hereto, to be filed not later than 120 days after the end of the fiscal year covered by this report under the captions “Compensation Discussion and Analysis,” “2015 Summary Compensation Table,” “2015 Grants of Plan-Based Awards,” “Outstanding Equity Awards at 2015 Year End,” “2015 Option Exercises and Stock Vested,” “Pension Benefits and Nonqualified Deferred Compensation,” “Director Compensation” and “Compensation Committee Report.”
|
Item 12.
|
Security Ownership of Certain Beneficial Owners and Management and Related Stockholder Matters
|
Pursuant to General Instruction G(3) of Form 10-K, certain information called for by this item is hereby incorporated by reference from the Company’s definitive proxy statement for the 2016 Annual Meeting of Stockholders filed pursuant to Regulation 14A, or an amendment hereto, to be not later than 120 days after the end of the fiscal year covered by this report under the caption “Share Ownership.”
Equity Compensation Plan Information
The following table sets forth information as of December 31, 2015 regarding the Company’s equity compensation plans.
|
Plan category
|
Number of shares to be
issued upon exercise of outstanding options, warrants and rights |
Weighted-average exercise
price of outstanding options,
warrants and rights
|
Number of shares remaining
available for future issuance under equity compensation plans (excluding securities reflected in column (a) (1) |
|||||||
|
|
(a)
|
(b)
|
(c)
|
|||||||
|
Equity compensation plans approved by security holders
|
670,009
|
|
$
|
12.58
|
|
6,395,476
|
|
|||
|
Equity compensation plans not approved by security holders
|
—
|
|
—
|
|
—
|
|
||||
|
Total
|
670,009
|
|
$
|
12.58
|
|
6,395,476
|
|
|||
|
(1)
|
Amounts include 1,135,135 performance shares that cliff vest three years after the date of grant if certain market and performance criteria are met, if the recipient remains an employee of the Company and subject to approval of the Compensation Committee of the Board of Directors.
|
|
Item 13.
|
Certain Relationships and Related Transactions, and Director Independence
|
Pursuant to General Instruction G(3) of Form 10-K, the information called for by this item is hereby incorporated by reference from the Company’s definitive proxy statement for the 2016 Annual Meeting of Stockholders filed pursuant to Regulation 14A, or an amendment hereto, to be filed not later than 120 days after the end of the fiscal year covered by this report under the captions “Related Person Transactions”, “Committees of the Board of Directors and Attendance”, and “Director Independence”.
|
Item 14
.
|
Principal Accountant Fees and Services
|
Pursuant to General Instruction G(3) of Form 10-K, the information called for by this item is hereby incorporated by reference from the Company’s definitive proxy statement for the 2016 Annual Meeting of Stockholders filed pursuant to Regulation 14A, or an amendment hereto, to be filed not later than 120 days after the end of the fiscal year covered by this report under the captions “Audit and Non-Audit Fees” and “Audit Committee Policies and Procedures for Pre-Approval of Independent Auditor Services.”
96
|
Item 15.
|
Exhibits, Financial Statement Schedules
|
(a) The Company's consolidated financial statements and notes, together with the report thereon of KPMG LLP dated February 10, 2016, are included herein as part of Item 8. Financial Statements and Supplementary Data above.
(b) The following listed documents are filed as Exhibits to this report:
|
2.1
|
Arrangement Agreement, dated February 20, 2013, among the Registrant, 0961994 B.C. Ltd. and Orko Silver Corp. (Incorporated herein by reference to Exhibit 2.1 to the Registrant’s Current Report on Form 8-K filed on February 20, 2013 (File No. 001-08641)).
|
|
2.2
|
Memorandum of Agreement, dated March 12, 2013, among the Registrant, 0961994 B.C. Ltd. and Orko Silver Corp. (Incorporated herein by reference to Exhibit 2.1 to the Registrant’s Current Report on Form 8-K filed on March 13, 2013 (File No. 001-08641)).
|
|
2.3
|
Agreement and Plan of Merger, dated as of December 16, 2014, among the Registration, Hollywood Merger Sub, Inc., Paramount Gold and Silver Corp. and Paramount Nevada Gold Corp. (Incorporated herein by reference to Exhibit 2.1 to the Registrant’s Current Report on Form 8-K filed on December 18, 2014 (File No. 001-08641)).
|
|
2.4
|
Amendment to Agreement and Plan of Merger, dated as of March 3, 2015, among Coeur Mining, Inc., Hollywood Merger Sub, Inc., Paramount Gold and Silver Corp. and Paramount Nevada Gold Corp. (Incorporated herein by reference to Exhibit 2.1 to the Registrant’s Current Report on Form 8-K filed on March 6, 2015 (File No. 001-08641)).
|
|
2.5
|
Stock Purchase Agreement, dated as of January 12, 2015, among Coeur Mining, Inc. and Goldcorp America Holdings Inc. (Incorporated herein by reference to Exhibit 2.1 to the Registrant’s Current Report on Form 8-K filed on January 13, 2015 (File No. 001-08641)).
|
|
3.1
|
Delaware Certificate of Conversion of the Registrant, effective as of May 16, 2013 (Incorporated herein by reference to Exhibit 3.1 to the Registrant’s Current Report on Form 8-K12B filed on May 16, 2013 (File No. 001-08641)).
|
|
3.2
|
Delaware Certificate of Incorporation of the Registrant, effective as of May 16, 2013 (Incorporated herein by reference to Exhibit 3.2 to the Registrant’s Current Report on Form 8-K12B filed on May 16, 2013 (File No. 001-08641)).
|
|
3.3
|
Certificate of Amendment to Certificate of Incorporation, effective as of May 12, 2015 (Incorporated herein by reference to Exhibit 4.3 to the Registrant's Registration Statement on Form S-8 filed on May 13, 2015 (File No. 333-204142)).
|
|
3.4
|
Amended and Restated Bylaws of the Registrant, effective September 16, 2013 (Incorporated herein by reference to Exhibit 3.1 to the Registrant’s Current Report on Form 8-K filed on September 20, 2013 (File No. 001-08641)).
|
|
4.1
|
Warrant Agreement dated as of April 16, 2013, by and among the Registrant, Computershare Trust Company, N.A. and Computershare, Inc., as Warrant Agent (Incorporated herein by reference to Exhibit 10.1 to the Registrant’s Current Report on Form 8-K filed on April 16, 2013 (File No. 001-08641)).
|
|
4.2
|
Form of Common Stock Share Certificate of the Registrant. (Incorporated herein by reference to Exhibit 4.1 to the Registrant’s Current Report on Form 8-K12B filed on May 16, 2013 (File No. 001-08641)).
|
|
4.3
|
Form of Warrant Certificate of the Registrant (Incorporated herein by reference to Exhibit 4.2 to the Registrant’s Current Report on Form 8-K12B filed on May 16, 2013 (File No. 001-08641)).
|
|
4.4
|
Indenture dated as of March 18, 2008, by and between the Registrant and the Bank of New York relating to the Registrant’s 3.25% Convertible Senior Notes due 2028 (Incorporated herein by reference to Exhibit 4.1 to the Registrant’s Current Report on Form 8-K filed on March 20, 2008 (File No.: 001-08641)).
|
|
4.5
|
First Supplemental Indenture dated as of March 18, 2008 to Indenture dated as of March 18, 2008, by and between the Registrant and the Bank of New York relating to the Registrant’s 3.25% Convertible Senior Notes due 2028 (Incorporated herein by reference to Exhibit 4.2 to the Registrant’s Current Report on Form 8-K filed on March 20, 2008 (File No. 001-08641)).
|
|
4.6
|
Indenture, dated January 29, 2013, among the Registrant, as issuer, certain subsidiaries of the Registrant, as guarantors thereto, and The Bank of New York Mellon, as trustee (Incorporated herein by reference to Exhibit 4.4 to the Registrant’s Annual Report on Form 10-K for the fiscal year ended December 31, 2012 (File No. 001-08641)).
|
|
4.7
|
First Supplemental Indenture, dated December 16, 2013, among the Registrant, as issuer, certain subsidiaries of the Registrant, as guarantors thereto, and The Bank of New York Mellon, as trustee (Filed herewith).
|
|
4.8
|
Second Supplemental Indenture, dated as of March 12, 2014, among Coeur Mining, Inc., as issuer, certain subsidiaries of Coeur Mining, Inc., as guarantors thereto, and The Bank of New York Mellon, as trustee (Incorporated herein by reference to Exhibit 4.3 to the Registrant’s Current Report on Form 8-K filed on March 12, 2014 (File No. 001-08641))
|
|
4.9
|
Third Supplemental Indenture, dated April 14, 2015, among Coeur Mining, Inc., as issuer, certain subsidiaries of Coeur Mining, Inc., as guarantors thereto, and The Bank of New York Mellon, as trustee (Incorporated herein by reference to Exhibit 4.1 to the Registrant’s Quarterly Report on Form 10-Q filed on May 4, 2015 (File No. 001-08641)).
|
97
|
4.10
|
Registration Rights Agreement, dated as of March 12, 2014, among Coeur Mining, Inc., certain subsidiaries of Coeur Mining Inc., as guarantors thereto, and Barclays Capital Inc., as initial purchaser (Incorporated herein by reference to Exhibit 4.4 to the Registrant’s Current Report on Form 8-K filed on March 12, 2014 (File No. 001-08641))
|
|
10.1
|
401k Plan of the Registrant. (Incorporated by reference to Exhibit 10(pp) to the Registrant’s Annual Report on Form 10-K filed on March 29, 1995 (File No. 001-08641)).*
|
|
10.2
|
Amended and Restated 2005 Non-Employee Directors’ Equity Incentive Plan, as amended for the Registrant’s reverse stock split. (Incorporated herein by reference to Exhibit 10(b) to the Registrant’s Annual Report on Form 10-K filed on February 26, 2010 (File No. 001-08641)).*
|
|
10.3
|
Amended Mining Lease, effective as of August 5, 2005, between Hyak Mining Company, Inc. and Coeur Alaska, Inc. (Incorporated herein by reference to Exhibit 10.5 to the Registrant’s Quarterly Report on Form 10-Q filed on August 12, 2005 (File No. 001-08641)).
|
|
10.4
|
Amended and Restated Silver Sale and Purchase Agreement, dated March 28, 2006, between CDE Australia Pty Limited and Cobar Operations Pty Limited (Portions of this exhibit have been omitted pursuant to a request for confidential treatment.) (Incorporated herein by reference to Exhibit 10(b) to the Registrant’s Quarterly Report on Form 10-Q filed on May 9, 2006 (File No. 001-08641)).
|
|
10.5
|
Supplemental Agreement in respect of the Amended and Restated Silver Sale and Purchase Agreement, dated January 29, 2008, between CDE Australia Pty Limited and Cobar Operations Pty Limited (Incorporated herein by reference to Exhibit 10(cc) to the Registrant’s Annual Report on Form 10-K filed on February 29, 2008 (File No. 001-08641)).
|
|
10.6
|
Gold royalty stream agreement, dated as of January 21, 2009, by and between the Registrant and Franco-Nevada (Incorporated herein by reference to Exhibit 10.5 to the Registrant’s Quarterly Report on Form 10-Q filed on May 11, 2009 (File No. 001-08641)).
|
|
10.7
|
Credit Agreement, dated August 1, 2012, by and among the Registrant, Coeur Alaska, Inc. and Coeur Rochester, Inc., as the borrowers, the lenders party thereto and Wells Fargo Bank, N.A., as administrative agent (Incorporated herein by reference to Exhibit 10.1 to the Registrant's Current Report on Form 8-K filed on August 7, 2012 (File No. 001-08641)).
|
|
10.8
|
Amendment No. 1 to Credit Agreement, dated January 16, 2014, by and among the Registrant, as the parent, Coeur Alaska, Inc. and Coeur Rochester, Inc., as the borrowers, the lenders party thereto and Wells Fargo Bank, N.A., as administrative agent (Incorporated herein by reference to Exhibit 10.1 to the Registrant’s Form S-3 filed on January 30, 2014 (Reg. No. 333-193652)).
|
|
10.9
|
Offer letter dated February 4, 2013 from the Registrant to Frank L. Hanagarne, Jr. (Incorporated herein by reference to Exhibit 10.1 to the Registrant's Current Report on Form 8-K filed on February 7, 2013 (File No. 001-08641)).*
|
|
10.10
|
Offer letter dated February 4, 2013 from the Registrant to Peter Mitchell (Incorporated herein by reference to Exhibit 10.1 to the Registrant's Current Report on Form 8-K filed on May 8, 2013 (File No. 001-08641)).*
|
|
10.11
|
Form of Indemnification Agreement (Incorporated herein by reference to Exhibit 10.1 to the Registrant’s Current Report on Form 8-K filed on May 16, 2013 (File No. 001-08641)).
|
|
10.12
|
Amended and Restated Executive Severance Policy of the Registrant (Incorporated herein by reference to Exhibit 10.21 to the Registrant’s Amendment No. 1 to Form S-4 filed on September 23, 2013 (Reg. No. 333-191133)).*
|
|
10.13
|
Offer letter dated February 15, 2013 from the Registrant to Casey M. Nault. (Incorporated herein by reference to Exhibit 10.1 to the Registrant’s Quarterly Report on Form 10-Q filed on May 7, 2014 (File No. 001-08641)).*
|
|
10.14
|
Offer letter dated February 15, 2013 from the Registrant to Keagan J. Kerr. (Incorporated herein by reference to Exhibit 10.1 to the Registrant’s Quarterly Report on Form 10-Q filed on May 7, 2014 (File No. 001-08641)).*
|
|
10.15
|
Supplemental Incentive Agreement dated July 30, 2014 between the Registrant and Mitchell J. Krebs. (Incorporated herein by reference to Exhibit 10.1 to the Registrant’s Current Report on Form 8-K filed on August 1, 2014 (File No. 001-08641)).*
|
|
10.16
|
Amended and Restated Employment Agreement dated July 30, 2014 between the Registration and Mitchell J. Krebs. (Incorporated herein by reference to Exhibit 10.2 to the Registrant’s Current Report on Form 8-K filed on August 1, 2014 (File No. 001-08641)).*
|
|
10.17
|
Voting and Support Agreement, dated as of December 16, 2014, among Coeur Mining, Inc. and various stockholders of Paramount. (Incorporated herein by reference to Exhibit 2.2 to the Registrant’s Current Report on Form 8-K filed on December 18, 2014 (File No. 001-08641)).
|
|
10.18
|
Credit Agreement, dated March 31, 2015, by and between Coeur Mining, Inc. and The Bank of Nova Scotia (Incorporated herein by reference to Exhibit 10.1 to the Registrant's Current Report on Form 8-K filed on April 2, 2015 (File No. 001-08641)).
|
|
10.19
|
Credit Agreement, dated June 23, 2015, by and between Coeur Mining, Inc., certain subsidiaries of Coeur Mining, Inc., as guarantors, the lenders party thereto and Barclays Bank plc, as administrative agent. (Incorporated herein by reference to Exhibit 10.1 to the Registrant's Current Report on Form 8-K filed on June 25, 2015 (File No. 001-08641)).
|
|
10.20
|
Consent under Credit Agreement dated November 2, 2015 (Incorporated herein by reference to Exhibit 10.1 to the Registrant’s Quarterly Report on Form 10-Q filed on November 2, 2015 (File No. 001-08641)).
|
98
|
10.21
|
Coeur Mining, Inc. 2015 Long-Term Incentive Plan (Incorporated herein by reference to Exhibit 10.1 to the Registrant's Current Report on Form 8-K filed on May 13, 2015 (File No. 001-08641)).*
|
|
10.22
|
Form of Restricted Stock Award Agreement (Incorporated herein by reference to Exhibit 10.2 to the Registrant’s Quarterly Report on Form 10-Q filed on August 4, 2015 (File No. 001-08641)).*
|
|
10.23
|
Form of Incentive Stock Option Award Agreement (Incorporated herein by reference to Exhibit 10.3 to the Registrant’s Quarterly Report on Form 10-Q filed on August 4, 2015 (File No. 001-08641)).*
|
|
10.24
|
Form of Nonqualified Stock Option Award Agreement (Incorporated herein by reference to Exhibit 10.4 to the Registrant’s Quarterly Report on Form 10-Q filed on August 4, 2015 (File No. 001-08641)).*
|
|
10.25
|
Form of Performance Share Agreement (Incorporated herein by reference to Exhibit 10.5 to the Registrant’s Quarterly Report on Form 10-Q filed on August 4, 2015 (File No. 001-08641)).*
|
|
10.26
|
Form of Cash-Settled Stock Appreciation Rights Award Agreement (Incorporated herein by reference to Exhibit 10.6 to the Registrant’s Quarterly Report on Form 10-Q filed on August 4, 2015 (File No. 001-08641)).*
|
|
10.27
|
Form of Performance Unit Agreement (Incorporated herein by reference to Exhibit 10.7 to the Registrant’s Quarterly Report on Form 10-Q filed on August 4, 2015 (File No. 001-08641)).*
|
|
10.28
|
Separation and Release of Claims Agreement dated January 21, 2016, between Coeur Mining, Inc. and Keagan J. Kerr (Incorporated herein by reference to Exhibit 10.1 to the Registrant’s Current Report on Form 8-K filed on January 22, 2016 (File. No. 001-08641)).*
|
|
10.29
|
Professional Services Agreement effective February 1, 2016, between Coeur Mining, Inc. and Keagan J. Kerr (Incorporated herein by reference to Exhibit 10.2 to the Registrant’s Current Report on Form 8-K filed on January 22, 2016 (File. No. 001-08641)).*
|
|
12
|
Computation of Ratio of Earnings to Fixed Charges. (Filed herewith).
|
|
21
|
List of subsidiaries of the Registrant. (Filed herewith).
|
|
23
|
Consent of KPMG LLP, Independent Registered Public Accounting Firm (Filed herewith).
|
|
31.1
|
Certification of the CEO (Filed herewith).
|
|
31.2
|
Certification of the CFO (Filed herewith).
|
|
32.1
|
CEO Section 1350 Certification (Filed herewith).
|
|
32.2
|
CFO Section 1350 Certification (Filed herewith).
|
|
95.1
|
Mine Safety Disclosure (Filed herewith).
|
|
101.INS
|
XBRL Instance Document**
|
|
101.SCH
|
XBRL Taxonomy Extension Schema**
|
|
101.CAL
|
XBRL Taxonomy Extension Calculation Linkbase**
|
|
101.DEF
|
XBRL Taxonomy Extension Definition Linkbase**
|
|
101.LAB
|
XBRL Taxonomy Extension Label Linkbase**
|
|
101.PRE
|
XBRL Taxonomy Extension Presentation Linkbase**
|
* Management contract or compensatory plan or arrangement.
** The following financial information from Coeur Mining, Inc.'s Annual Report on Form 10-K for the year ended December 31, 2015, formatted in XBRL (Extensible Business Reporting Language): Consolidated Statements of Comprehensive Income (Loss), Consolidated Statements of Cash Flows, Consolidated Balance Sheets, and Consolidated Statement of Changes in Stockholders' Equity
99
SIGNATURES
Pursuant to the requirements of Section 13 or 15(d) of the Securities Exchange Act of 1934, the registrant has duly caused this report to be signed on its behalf by the undersigned, thereunto duly authorized.
COEUR MINING, INC.
(Registrant)
|
Date:
|
February 10, 2016
|
By:
|
/s/ Mitchell J. Krebs
|
|
|
Mitchell J. Krebs
(Director, President, and Chief Executive Officer)
|
||
Pursuant to the requirements of the Securities Exchange Act of 1934, this report has been signed below by the following persons on behalf of the registrant and in the capacities and on the dates indicated.
|
/s/ Mitchell J. Krebs
______________________
Mitchell J. Krebs
|
Director, President, and Chief Executive Officer
(Principal Executive Officer)
|
February 10, 2016
|
||
|
|
|
|
||
|
/s/ Peter C. Mitchell
______________________
Peter C. Mitchell
|
Senior Vice President and Chief Financial Officer (Principal Financial Officer)
|
February 10, 2016
|
||
|
|
|
|
||
|
/s/ Mark Spurbeck
_______________________
Mark Spurbeck
|
Vice President, Finance
(Principal Accounting Officer)
|
February 10, 2016
|
||
|
/s/ Linda L. Adamany
_____________________
Linda L. Adamany
|
Director
|
February 10, 2016
|
||
|
|
|
|
||
|
/s/ Kevin S. Crutchfield
___________________
Kevin S. Crutchfield |
Director
|
February 10, 2016
|
||
|
|
|
|
||
|
/s/ Sebastian Edwards
_____________________
Sebastian Edwards
|
Director
|
February 10, 2016
|
||
|
/s/ Randolph E. Gress
_____________________
Randolph E. Gress |
Director
|
February 10, 2016
|
||
|
/s/ Robert E. Mellor
______________________
Robert E. Mellor
|
Director
|
February 10, 2016
|
||
|
|
|
|
||
|
/s/ John H. Robinson
______________________
John H. Robinson
|
Director
|
February 10, 2016
|
||
|
|
|
|
||
|
/s/ J. Kenneth Thompson
___________________
J. Kenneth Thompson
|
Director
|
February 10, 2016
|
||
100
TABLE OF CONTENTS
Part IItem 1. BusinessItem 1A. Risk FactorsItem 1B. Unresolved Staff CommentsItem 2. PropertiesItem 3. Legal ProceedingsItem 4. Mine Safety DisclosuresPart IIItem 5. Market For Registrant S Common Equity, Related Stockholder Matters and Issuer Purchases Of Equity SecuritiesItem 6. Selected Financial DataItem 7. Management's Discussion and Analysis Of Financial Condition and Results Of OperationsItem 7A. Quantitative and Qualitative Disclosures About Market RiskItem 8. Financial Statements and Supplementary DataNote 1 - The CompanyNote 2 - Summary Of Significant Accounting PoliciesNote 3 Segment ReportingNote 4 Write-downsNote 5 ReclamationNote 6 Stock-based CompensationNote 7 Retirement Savings PlanNote 8 Income and Mining TaxesNote 9 Net Income (loss) Per ShareNote 10 Fair Value MeasurementsNote 11 - Other, NetNote 12 Derivative Financial InstrumentsNote 13 AcquisitionsNote 14 InvestmentsNote 15 ReceivablesNote 16 Inventory and Ore on Leach PadsNote 17 Property, Plant and EquipmentNote 18 Mining PropertiesNote 19 DebtNote 20 - Supplemental Guarantor InformationNote 21 Commitments and ContingenciesNote 22 - Supplemental Cash Flow InformationItem 9. Changes in and Disagreements with Accountants on Accounting and Financial DisclosureItem 9A. Controls and ProceduresItem 9B. Other InformationPart IIIItem 10. Directors, Executive Officers and Corporate GovernanceItem 11. Executive CompensationItem 12. Security Ownership Of Certain Beneficial Owners and Management and Related Stockholder MattersItem 13. Certain Relationships and Related Transactions, and Director IndependenceItem 14 . Principal Accountant Fees and ServicesPart IVItem 15. Exhibits, Financial Statement Schedules