CDW CORP
10-Ks and 10-Qs
|
|
|
|
|
|
|
|
|
|
|
|
|
|
|
|
|
|
|
|
|
|
|
|
|
|
|
|
|
|
|
|
|
|
|
|
|
|
|
|
|
|
|
|
UNITED STATES
SECURITIES AND EXCHANGE COMMISSION
Washington, D.C. 20549
|
FORM 10-K
|
(Mark One)
|
ý
|
ANNUAL REPORT PURSUANT TO SECTION 13 OR 15(d) OF THE SECURITIES EXCHANGE ACT OF 1934
|
For the fiscal year ended December 31, 2014
or
|
¨
|
TRANSITION REPORT PURSUANT TO SECTION 13 OR 15(d) OF THE SECURITIES EXCHANGE ACT OF 1934
|
For the transition period from
to
Commission File Number 001-35985
|
CDW CORPORATION
|
|
(Exact name of registrant as specified in its charter)
|
|
Delaware
|
26-0273989
|
|
|
(State or other jurisdiction of
incorporation or organization)
|
(I.R.S. Employer
Identification No.)
|
|
|
200 N. Milwaukee Avenue
Vernon Hills, Illinois
|
60061
|
|
|
(Address of principal executive offices)
|
(Zip Code)
|
|
(847) 465-6000
(Registrant’s telephone number, including area code)
None
(Former name, former address and former fiscal year, if changed since last report)
____________________________________________
Securities registered pursuant to Section 12(b) of the Act:
|
Title of each class:
|
Name of each exchange on which registered
|
|
|
Common stock, par value $0.01 per share
|
NASDAQ Global Select Market
|
|
Securities registered pursuant to Section 12(g) of the Act: None
____________________________________________
Indicate by check mark if the registrant is a well-known seasoned issuer, as defined in Rule 405 of the Securities Act.
ý
Yes
¨
No
Indicate by check mark if the registrant is not required to file reports pursuant to Section 13 or Section 15(d) of the Act.
¨
Yes
ý
No
Indicate by check mark whether the registrant (1) has filed all reports required to be filed by Section 13 or 15(d) of the Securities Exchange Act of 1934 during the preceding 12 months (or for shorter period that the registrant was required to file such reports), and (2) has been subject to such filing requirements for the past 90 days.
ý
Yes
¨
No
Indicate by check mark whether the registrant has submitted electronically and posted on its corporate Web site, if any, every Interactive Data File required to be submitted and posted pursuant to Rule 405 of Regulation S-T (§232.405 of this chapter) during the preceding 12 months (or for such shorter period that the registrant was required to submit and post such files).
ý
Yes
¨
No
Indicate by check mark if disclosure of delinquent filers pursuant to Item 405 of Regulation S-K (§ 229.405) is not contained herein, and will not be contained, to the best of registrant’s knowledge, in definitive proxy or information statements incorporated by reference in Part III of this Form 10-K or any amendment to this Form 10-K.
ý
Indicate by check mark whether the registrant is a large accelerated filer, an accelerated filer, a non-accelerated filer, or a smaller reporting company. See the definitions of “large accelerated filer,” “accelerated filer,” and “smaller reporting company” in Rule 12b-2 of the Exchange Act (Check one):
|
Large accelerated filer
|
x
|
Accelerated filer
|
¨
|
|
Non-accelerated filer
|
¨
(Do not check if a smaller reporting company)
|
Smaller reporting company
|
¨
|
Indicate by check mark whether the registrant is a shell company (as defined in Rule 12b-2 of the Exchange Act).
¨
Yes
ý
No
The aggregate market value of the voting and non-voting common equity held by non-affiliates of the registrant as of
June 30, 2014
, the last business day of the registrant’s most recently completed second fiscal quarter, was
$2,762.3 million
, based on the per share closing sale price of
$31.88
on that date.
As of
February 20, 2015
, there were
172,275,656
shares of common stock, $0.01 par value, outstanding.
DOCUMENTS INCORPORATED BY REFERENCE
Portions of the registrant’s definitive proxy statement for use in connection with its
2015
Annual Meeting of Shareholders, to be filed not later than 120 days after
December 31, 2014
, are incorporated by reference into Part III of this report.
CDW CORPORATION AND SUBSIDIARIES
ANNUAL REPORT ON FORM 10-K
Year Ended December 31, 2014
TABLE OF CONTENTS
|
Item
|
|
Page
|
|
PART I
|
||
|
Item 1.
|
||
|
Item 1A.
|
||
|
Item 1B.
|
||
|
Item 2.
|
||
|
Item 3.
|
||
|
Item 4.
|
||
|
PART II
|
||
|
Item 5.
|
||
|
Item 6.
|
||
|
Item 7.
|
||
|
Item 7A.
|
||
|
Item 8.
|
||
|
Item 9.
|
||
|
Item 9A.
|
||
|
Item 9B.
|
||
|
PART III
|
||
|
Item 10.
|
||
|
Item 11.
|
||
|
Item 12.
|
||
|
Item 13.
|
||
|
Item 14.
|
||
|
PART IV
|
||
|
Item 15.
|
||
|
SIGNATURES
|
||
2
FORWARD-LOOKING STATEMENTS
This report contains forward-looking statements within the meaning of the federal securities laws. All statements other than statements of historical fact included in this report are forward-looking statements. These statements relate to analyses and other information, which are based on forecasts of future results and estimates of amounts not yet determinable. These statements also relate to our future prospects, developments and business strategies. We claim the protection of The Private Securities Litigation Reform Act of 1995 for all forward-looking statements in this report.
These forward-looking statements are identified by the use of terms and phrases such as “anticipate,” “believe,” “could,” “estimate,” “expect,” “intend,” “may,” “plan,” “predict,” “project,” “should,” “will” and similar terms and phrases, including references to assumptions. However, these words are not the exclusive means of identifying such statements. Although we believe that our plans, intentions and expectations reflected in or suggested by such forward-looking statements are reasonable, we cannot assure you that we will achieve those plans, intentions or expectations. All forward-looking statements are subject to risks and uncertainties that may cause actual results to differ materially from those that we expected.
Important factors that could cause actual results to differ materially from our expectations, or cautionary statements, are disclosed under the section entitled “Risk Factors” included elsewhere in this report. All written and oral forward-looking statements attributable to us, or persons acting on our behalf, are expressly qualified in their entirety by the cautionary statements contained in the section entitled “Risk Factors” included elsewhere in this report as well as other cautionary statements that are made from time to time in our other Securities and Exchange Commission ("SEC") filings and public communications. You should evaluate all forward-looking statements made in this report in the context of these risks and uncertainties.
We caution you that the important factors referenced above may not contain all of the factors that are important to you. In addition, we cannot assure you that we will realize the results or developments we expect or anticipate or, even if substantially realized, that they will result in the consequences or affect us or our operations in the way we expect. The forward-looking statements included in this report are made only as of the date hereof. We undertake no obligation to publicly update or revise any forward-looking statement as a result of new information, future events or otherwise, except as otherwise required by law.
3
Our Company
CDW is a Fortune 500 company and a leading provider of integrated information technology (“IT”) solutions in the U.S. and Canada. We help our customer base of approximately
250,000
small, medium and large business, government, education and healthcare customers by delivering critical solutions to their increasingly complex IT needs. Our broad array of offerings ranges from discrete hardware and software products to integrated IT solutions such as mobility, security, data center optimization, cloud computing, virtualization and collaboration. We are technology "agnostic," with a product portfolio that includes over
100,000
products from more than
1,000
brands. We provide our products and solutions through sales force and service delivery teams consisting of nearly
4,600
coworkers, including more than
1,800
field sellers, highly-skilled technology specialists and advanced service delivery engineers.
We are a leading U.S. sales channel partner for many original equipment manufacturers (“OEMs”) and software publishers (collectively, our “vendor partners”), whose products we sell or include in the solutions we offer. We believe we are an important extension of our vendor partners' sales and marketing capabilities, providing them with a cost-effective way to reach customers and deliver a consistent brand experience through our established end-market coverage and extensive customer access.
We provide value to our customers by simplifying the complexities of technology across design, selection, procurement, integration and management. Our goal is to have our customers, regardless of their size, view us as an indispensable extension of their IT staffs. We seek to achieve this goal by providing our customers with superior service through our large and experienced sales force and service delivery teams. Our multi-brand offering approach enables us to identify the products or combination of products that best address each customer's specific organizational IT requirements and to evolve our offerings as new technologies develop.
We believe we offer the following value proposition to our customers and our vendor partners:
|
Our value proposition to our customers
|
Our value proposition to our vendor partners
|
|
Ÿ
Broad selection of products and multi-branded IT solutions
Ÿ
Value-added services with integration capabilities
Ÿ
Highly-skilled specialists and engineers
Ÿ
Solutions across a very broad IT landscape
|
Ÿ
Access to approximately 250,000 customers throughout the U.S. and Canada
Ÿ
Large and established customer channels
Ÿ
Strong distribution and implementation capabilities
Ÿ
Value-added solutions and marketing programs that generate end-user demand
|
Our customers include private sector businesses many of which employ fewer than 5,000 employees, government agencies and educational and healthcare institutions. We serve our customers through channel-specific sales teams and service delivery teams with extensive technical skills and knowledge of the specific markets they serve. This market segmentation allows us to customize our offerings and to provide enhanced expertise in designing and implementing IT solutions for our customers. We currently have five dedicated customer channels: medium/large business, small business, government, education and healthcare, each of which generated nearly
$1 billion
or more in net sales in
2014
. The scale and diversity of our customer channels provide us with multiple avenues for growth and a balanced customer base to weather economic and technology cycles.
4
The following table provides information regarding our reportable segments and our customer channels:
|
Corporate Segment
|
Public Segment
|
||||||||||
|
Customer Channels
|
Medium/Large Business
|
Small Business
|
Government
|
Education
|
Healthcare
|
Other
|
|||||
|
Target Customers
|
100 - 5,000 employees
|
10 - 100 employees
|
Various federal, state and local agencies
|
Higher education and K-12
|
Hospitals, ambulatory service providers and long-term care facilities
|
Advanced services customers
plus Canada
|
|||||
|
2014 Net Sales
(in billions)
|
$5.5
|
$1.0
|
$1.5
|
$1.8
|
$1.6
|
$0.7
|
|||||
For further information on our segments, including financial results, see Note 17 to the accompanying audited consolidated financial statements included elsewhere in this report.
We offer more than
1,000
brands, from well-established companies such as APC, Apple, Cisco, EMC, Google, Hewlett-Packard, IBM, Lenovo, Microsoft, NetApp, Samsung, Symantec and VMware to emerging vendor partners such as Aerohive Networks, Box, Inc., Drobo, Jive, Nimble Storage, Nutanix, and Ruckus. In
2014
, we generated over $1 billion of revenue for each of four of our vendor partners and over $100 million of revenue for each of 12 other vendor partners. We have received the highest level of certification from major vendor partners such as Cisco, EMC and Microsoft, which reflects the extensive product and solution knowledge and capabilities that we bring to our customers' IT challenges. These certifications also provide us with access to favorable pricing, tools and resources, including vendor incentive programs, which we use to provide additional value to our customers. Our vendor partners also regularly recognize us with top awards and select us to develop and grow new customer solutions.
History
CDW was founded in 1984. In 2003, we purchased selected U.S. assets and the Canadian operations of Micro Warehouse, which extended our growth platform into Canada. In 2006, we acquired Berbee Information Networks Corporation, a regional provider of technology products, solutions and customized engineering services in advanced technologies primarily across Cisco, IBM and Microsoft portfolios. This acquisition increased our capabilities in customized engineering services and managed services.
On October 12, 2007, CDW Corporation, an Illinois corporation, was acquired through a merger transaction by an entity controlled by investment funds affiliated with Madison Dearborn Partners, LLC and Providence Equity Partners L.L.C. (the “Acquisition”). CDW Corporation continued as the surviving corporation and same legal entity after the Acquisition, but became a wholly owned subsidiary of VH Holdings, Inc., a Delaware corporation.
On December 31, 2009, CDW Corporation merged into CDWC LLC, an Illinois limited liability company owned by VH Holdings, Inc., with CDWC LLC as the surviving entity. This change had no impact on our operations or management. On December 31, 2009, CDWC LLC was renamed CDW LLC (“CDW LLC”). On August 17, 2010, VH Holdings, Inc. was renamed CDW Corporation (“Parent”), a Delaware corporation.
Throughout this report, the terms “the Company” and “CDW” refer to Parent and its 100% owned subsidiaries.
Prior to July 2, 2013, the date of our initial public offering (“IPO”), Parent was owned directly by CDW Holdings LLC ("CDW Holdings"), a company controlled by investment funds affiliated with Madison Dearborn Partners, LLC and Providence Equity Partners L.L.C. (the "Sponsors"), certain other co-investors and certain members of CDW management. Before the IPO, Madison Dearborn Partners, LLC and Providence Equity Partners L.L.C. owned 46.0% and 40.6% of our common stock, respectively. After the IPO and through subsequent secondary offerings in fourth quarter of 2013 and during 2014, the Sponsors' ownership has significantly decreased. As of December 31, 2014, the Sponsors own
15.5%
and
13.7%
of our common stock, respectively.
5
On July 2, 2013, Parent completed the IPO of its common stock. In connection with the IPO, CDW Holdings distributed all of its shares of Parent's common stock to its members in June 2013 in accordance with the members' respective membership interests and was subsequently dissolved in August 2013. See Note 9 to the accompanying audited consolidated financial statements included elsewhere in this report for additional discussion of the IPO.
On November 10, 2014, we completed the acquisition of a 35% non-controlling equity interest in Kelway TopCo Limited ("Kelway"), a UK-based IT solutions provider, which has global supply chain relationships that enable it to conduct business in more than 100 countries. This investment strengthens our ability to provide a more comprehensive solution to our customers and enhances our ability to serve our existing multi-national customers.
Our Market
We operate in the U.S. and Canadian IT markets, which are large and growing markets. According to IDC, the overall U.S. IT market generated approximately
$675 billion
in sales in
2014
. We believe our addressable market in the U.S. in the indirect sales channel represents more than
$215 billion
in annual sales and for the year ended
December 31, 2014
, our U.S. net sales of $11.5 billion represented approximately 5% of that highly diverse and fragmented market. According to IDC, the overall Canadian IT market generated more than
$50 billion
in sales in
2014
. We believe our addressable market in Canada in the indirect sales channel represents more than
$11 billion
in annual sales and for the year ended December 31, 2014, our net sales of
$532 million
in Canada represented approximately 5% of that market. We believe we have the largest market share in our addressable market, with our
2014
net sales exceeding the cumulative North American net sales of our four largest publicly traded sales channel competitors, based upon publicly available information for those companies. New technologies, including cloud, virtualization and mobility, coupled with the resulting increase in demand for data as well as aging infrastructure, are increasingly requiring businesses and institutions to seek integrated solutions to their IT needs. We expect this trend to continue for the foreseeable future, with end-user demand for business efficiency and productivity driving future IT spending growth.
Our Offerings
Our offerings range from discrete hardware and software products and services to complex integrated solutions that include one or more of these elements. We believe our customers increasingly view technology purchases as integrated solutions rather than discrete product and service categories and we estimate t
hat approximately 47% of
our net sales in
2014
came from sales of product categories and services typically associated with solutions. Our hardware products include notebooks/mobile devices (including tablets), network communications, enterprise and data storage, video monitors, printers, desktop computers and servers. Our software products include application suites, security, virtualization, operating systems, network management and Software as a Service (“SaaS”) offerings. We also provide a full suite of value-added-services, which range from basic installation, warranty and repair services to custom configuration, data center and network implementation services, as well as managed services that include Infrastructure as a Service (“IaaS”) offerings.
We also offer a variety of integrated solutions, such as:
•
Mobility
: We assist our customers with the selection, procurement and integration of mobile security software, hardware devices such as smartphones, tablets and notebooks, and cellular wireless activation systems. We also provide mobile device management applications with policy and security management capabilities across a variety of mobile operating systems and platforms.
•
Security
: We assess our customers' security needs and provide them with threat prevention tools in order to protect their networks, servers and applications, such as anti-virus, anti-spam, content filtering, intrusion prevention, firewall and virtual private network services, and network access control. We also design and implement data loss prevention solutions, using data monitoring and encryption across a wide array of devices to ensure the security of customer information, personal employee information and research and development data.
•
Data Center Optimization
: We help our customers evaluate their data centers for convergence and optimization opportunities. Our data center optimization solutions consist of server virtualization, physical server consolidation, data storage management and energy-efficient power and cooling systems.
•
Cloud Computing
: We provide our customers with a broad portfolio of cloud-based solutions, which are technology delivered as a service. Our cloud offerings include: Infrastructure as a Service (IaaS), which delivers compute, networking, storage, and data center capabilities via the cloud; Software as a Service (SaaS), which connects users to cloud-based software applications; and Platform as a Service (PaaS), which enables development and ongoing maintenance of cloud-based solutions. We provide public cloud solutions which reside off customer premises on a public (shared) infrastructure, and private cloud solutions, which reside on customer premises. We also offer hybrid cloud solutions that deliver the benefits of both public and private solutions. Our migration, integration and managed
6
services offerings help our customers simplify cloud adoption, as well as the ongoing management of cloud solutions across the entire IT lifecycle. Dedicated Cloud Client Executives work with our customers to architect cloud solutions that meet their organizational, technology and financial objectives.
•
Virtualization
: We design and implement server, storage and desktop virtualization solutions. Virtualization enables our customers to efficiently utilize hardware resources by running multiple, independent, virtual operating systems on a single computer and multiple virtual servers simultaneously on a single server. Virtualization also can separate a desktop environment and associated application software from the hardware device that is used to access it, and provides employees with remote desktop access. Our specialists assist customers with the steps of implementing virtualization solutions, including evaluating network environments, deploying shared storage options and licensing platform software.
•
Collaboration
: We provide our customers with communication tools that allow employees to share knowledge, ideas and information among each other and with clients and partners effectively and quickly. Our collaboration solutions unite communications and applications via the integration of products that facilitate the use of multiple enterprise communication methods including email, instant messaging, presence, social media, voice, video, hardware, software and services. We also host cloud-based collaboration solutions.
While we believe customers increasingly view technology purchases as solutions rather than discrete product and service categories, the following table shows our net sales by major category, based upon our internal category classifications.
|
|
Year Ended December 31, 2014
|
Year Ended December 31, 2013
(1)
|
Year Ended December 31, 2012
(1)
|
||||||||||||||||||
|
Dollars in
Millions
|
Percentage
of Total Net Sales
|
Dollars in
Millions
|
Percentage
of Total Net Sales
|
Dollars in
Millions
|
Percentage
of Total Net Sales
|
||||||||||||||||
|
Notebooks/Mobile Devices
|
$
|
2,352.3
|
|
19.5
|
%
|
$
|
1,698.4
|
|
15.8
|
%
|
$
|
1,462.8
|
|
14.4
|
%
|
||||||
|
NetComm Products
|
1,615.9
|
|
13.4
|
|
1,486.3
|
|
13.8
|
|
1,351.5
|
|
13.3
|
|
|||||||||
|
Enterprise and Data Storage (Including Drives)
|
1,024.3
|
|
8.5
|
|
999.2
|
|
9.3
|
|
981.5
|
|
9.7
|
|
|||||||||
|
Other Hardware
|
4,549.2
|
|
37.6
|
|
4,178.5
|
|
38.8
|
|
4,075.7
|
|
40.3
|
|
|||||||||
|
Software
(2)
|
2,076.7
|
|
17.2
|
|
1,993.1
|
|
18.5
|
|
1,877.7
|
|
18.5
|
|
|||||||||
|
Services
|
371.4
|
|
3.1
|
|
332.7
|
|
3.1
|
|
285.0
|
|
2.8
|
|
|||||||||
|
Other
(3)
|
84.7
|
|
0.7
|
|
80.4
|
|
0.7
|
|
94.0
|
|
1.0
|
|
|||||||||
|
Total net sales
|
$
|
12,074.5
|
|
100.0
|
%
|
$
|
10,768.6
|
|
100.0
|
%
|
$
|
10,128.2
|
|
100.0
|
%
|
||||||
|
(1)
|
Amounts have been reclassified for changes in individual product classifications to conform to the presentation for the year ended December 31, 2014.
|
|
(2)
|
The decline in software as a percentage of total net sales is primarily driven by a higher proportion of revenue recorded on a net basis, including SaaS.
|
|
(3)
|
Includes items such as delivery charges to customers and certain commission revenue.
|
Our Customers
We provide integrated IT solutions to approximately
250,000
small, medium and large business, government, education and healthcare customers throughout the U.S. and Canada. Sales to the U.S. federal government, which are diversified across multiple agencies and departments, collectively accounted for approximately
7%
,
7%
and
10%
of total net sales in 2014, 2013 and 2012, respectively. However, there are several independent purchasing decision-makers across these agencies and departments. Excluding these sales to the federal government, we are not reliant on any one customer, as our next five largest customers cumulatively comprised approximately
3%
of our net sales in
2014
.
Inventory Management
We utilize our IT systems to manage our inventory in a cost-efficient manner, resulting in a rapid-turn inventory model. We generally only stock items that have attained a minimum sales volume.
7
Our distribution process is highly automated. Once a customer order is received and credit approved, orders are automatically routed to one of our distribution centers for picking and shipping as well as configuration and imaging services. We operate two distribution centers: a 450,000 square foot facility in Vernon Hills, Illinois, and a 513,000 square foot facility in North Las Vegas, Nevada. We ship almost
37 million
units annually on an aggregate basis from our two distribution centers. We believe that the location of our distribution centers allows us to efficiently ship products throughout the U.S. and provide timely access to our principal distributors. In addition, in the event of weather-related or other disruptions at one of our distribution centers, we are able to shift order processing and fulfillment from one center to the other quickly and efficiently, enabling us to continue to ship products in a timely manner. We believe that competitive sources of supply are available in substantially all of the product categories we offer. We continue to improve the productivity of our distribution centers as measured by key performance indicators such as units shipped per hour worked and bin accuracy.
We also have drop-shipment arrangements with many of our OEMs and wholesale distributors, which permit us to offer products to our customers without having to take physical delivery at either of our distribution centers. These arrangements generally represent approximately
40% to 50%
of total net sales, including approximately
15% to 20%
related to electronic delivery for software licenses.
Information Technology Systems
We maintain customized IT and unified communication systems that enhance our ability to provide prompt, efficient and expert service to our customers. In addition, these systems enable centralized management of key functions, including purchasing, inventory management, billing and collection of accounts receivable, sales and distribution. Our systems provide us with thorough, detailed and real-time information regarding key aspects of our business. This capability helps us to continuously enhance productivity, ship customer orders quickly and efficiently, respond appropriately to industry changes and provide high levels of customer service. We believe that our websites, which provide electronic order processing and advanced tools, such as order tracking, reporting and asset management, make it easy for customers to transact business with us and ultimately strengthen our customer relationships.
Product Procurement
We may purchase all or only some of the products that our vendor partners offer for resale to our customers or for inclusion in the solutions we offer. Each vendor partner agreement provides for specific terms and conditions, which may include one or more of the following: product return privileges, price protection policies, purchase discounts and vendor incentive programs, such as purchase or sales rebates and cooperative advertising reimbursements. We also purchase software from major software publishers for resale to our customers or for inclusion in the solutions we offer. Our agreements with software publishers allow the end-user customer to acquire software or licensed products and services.
In addition to purchasing products directly from our vendor partners, we purchase products from wholesale distributors for resale to our customers or for inclusion in the solutions we offer. These wholesale distributors provide logistics management and supply-chain services for us, as well as for our vendor partners. For the year ended
December 31, 2014
, we purchased
54%
of the products we sold as discrete products or as components of a solution directly from our vendor partners and the remaining 46% from wholesale distributors. Purchases from our three largest wholesale distributors, Tech Data, SYNNEX and Ingram Micro each represented
9%
of our total purchases. Sales of products manufactured by Apple, Cisco, EMC, Hewlett-Packard, Lenovo and Microsoft, whether purchased directly from these vendor partners or from a wholesale distributor, represented in the aggregate
54%
of our net sales in
2014
. Sales of products manufactured by Hewlett-Packard and Cisco represented
18%
and
14%
, of our
2014
net sales, respectively.
Competition
The market for technology products and services is highly competitive. Competition is based on the ability to tailor specific solutions to customer needs, quality and breadth of product and service offerings, knowledge and expertise of sales force, customer service, price, product availability, speed of delivery and credit availability. Our competition includes:
|
•
|
resellers such as Dimension Data, ePlus, Insight Enterprises, PC Connection, PCM, Presidio, Softchoice, World Wide Technology and many smaller resellers;
|
|
•
|
manufacturers who sell directly to customers, such as Dell, Hewlett-Packard and Apple;
|
|
•
|
large service providers and system integrators, such as IBM, Accenture, Hewlett-Packard and Dell;
|
|
•
|
e-tailers such as Amazon, Newegg, and TigerDirect.com;
|
|
•
|
cloud providers such as AT&T, Amazon Web Services and Box; and
|
8
|
•
|
retailers (including their e-commerce activities) such as Staples and Office Depot.
|
We expect the competitive landscape in which we compete to continue to change as new technologies are developed. While innovation can help our business as it creates new offerings for us to sell, it can also disrupt our business model and create new and stronger competitors. For a discussion of the risks associated with competition, see “Risk Factors” included elsewhere in this report.
Marketing
We market the CDW brand to both national and local audiences using a variety of channels that include online, broadcast, print, social and other media. This promotion is supported by integrated communication efforts that target decision-makers, influencers and the general public using a combination of news releases, case studies, media interviews and speaking opportunities. We also market to current and prospective customers through integrated marketing programs that include behaviorally targeted email, print, online media, events and sponsorships, as well as broadcast media.
As a result of our relationships with our vendor partners, a significant portion of our advertising and marketing expenses are reimbursed through cooperative advertising reimbursement programs. These programs are at the discretion of our vendor partners and are typically tied to sales or purchasing volumes or other commitments to be met by us within a specified period of time. We believe that our national scale and analytical techniques that measure the efficacy of our marketing programs differentiate us from our competitors.
Coworkers
As of
December 31, 2014
, we employed
7,211
coworkers, none of whom is covered by collective bargaining agreements. We consider our coworker relations to be good.
Intellectual Property
The CDW trademark and certain variations thereon are registered or subject to pending trademark applications in the U.S., Canada and certain other jurisdictions. We believe our trademarks have significant value and are important factors in our marketing programs. In addition, we own registrations for domain names, including cdw.com and cdwg.com, for certain of our primary trademarks. We also have unregistered copyrights in our website content.
There are many factors that affect our business, results of operations and cash flows, some of which are beyond our control. The following is a description of some important factors that may cause our actual results of operations and cash flows in future periods to differ materially from those currently expected or desired.
Risks Related to Our Business
General economic conditions could negatively affect technology spending by our customers and put downward pressure on prices, which may have an adverse impact on our business, results of operations or cash flows.
Weak economic conditions generally, sustained uncertainty about global economic conditions, U.S. federal government spending cuts and the impact of new government programs, or a tightening of credit markets could cause our customers and potential customers to postpone or reduce spending on technology products or services or put downward pressure on prices, which could have an adverse effect on our business, results of operations or cash flows.
Our financial performance could be adversely affected by decreases in spending on technology products and services by our Public segment customers.
Our sales to our Public segment customers are impacted by government spending policies, budget priorities and revenue levels. Although our sales to the federal government are diversified across multiple agencies and departments, they collectively accounted for approximately
7%
of 2014 net sales. An adverse change in government spending policies (including ongoing budget cuts at the federal level), budget priorities or revenue levels could cause our Public segment customers to reduce their purchases or to terminate or not renew their contracts with us, which could adversely affect our business, results of operations or cash flows. For example, in 2013, as a result of sequestration and related budget uncertainty and the partial shutdown of the federal government for 16 days, we experienced significantly reduced Federal sales in our Public segment.
Our business depends on our vendor partner relationships and the availability of their products.
9
We purchase products for resale from vendor partners, which include OEMs and software publishers, and wholesale distributors. For the year ended December 31,
2014
, we purchased approximately
54%
of the products we sold directly from vendor partners and the remaining amount from wholesale distributors. We are authorized by vendor partners to sell all or some of their products via direct marketing activities. Our authorization with each vendor partner is subject to specific terms and conditions regarding such things as sales channel restrictions, product return privileges, price protection policies, purchase discounts and vendor partner programs and funding, including purchase rebates, sales volume rebates, purchasing incentives and cooperative advertising reimbursements. However, we do not have any long-term contracts with our vendor partners and many of these arrangements are terminable upon notice by either party. A reduction in vendor partner programs or funding or our failure to timely react to changes in vendor partner programs or funding could have an adverse effect on our business, results of operations or cash flows. In addition, a reduction in the amount of credit granted to us by our vendor partners could increase our need for, and the cost of, working capital and could have an adverse effect on our business, results of operations or cash flows, particularly given our substantial indebtedness.
From time to time, vendor partners may terminate or limit our right to sell some or all of their products or change the terms and conditions or reduce or discontinue the incentives that they offer us. For example, there is no assurance that, as our vendor partners continue to sell directly to end users and through resellers, they will not limit or curtail the availability of their products to solutions providers like us. Any such termination or limitation or the implementation of such changes could have a negative impact on our business, results of operations or cash flows.
Although we purchase from a diverse vendor base, in
2014
, products we purchased from distributors Tech Data, SYNNEX and Ingram Micro each represented
9%
of our total purchases. In addition, sales of Apple, Cisco, EMC, Hewlett-Packard, Lenovo and Microsoft products comprise a substantial portion of our sales, representing approximately
54%
of net sales in
2014
. Sales of products manufactured by Hewlett-Packard and Cisco represented approximately
18%
and
14%
, respectively, of our 2014 net sales. The loss of, or change in business relationship with, any of these or any other key vendor partners, the diminished availability of their products, or backlogs for their products leading to manufacturer allocation, could reduce the supply and increase the cost of products we sell and negatively impact our competitive position.
Additionally, the relocation of key distributors utilized in our purchasing model could increase our need for, and the cost of, working capital and have an adverse effect on our business, results of operations or cash flows. Further, the sale, spin-off or combination of any of our vendor partners and/or certain of their business units, including any such sale to or combination with a vendor with whom we do not currently have a commercial relationship or whose products we do not sell, could have an adverse impact on our business, results of operations or cash flows.
Our sales are dependent on continued innovations in hardware, software and services offerings by our vendor partners and the competitiveness of their offerings, and our ability to partner with new and emerging technology providers.
The technology industry is characterized by rapid innovation and the frequent introduction of new and enhanced hardware, software and services offerings, such as cloud-based solutions, including SaaS, IaaS and PaaS. We have been and will continue to be dependent on innovations in hardware, software and services offerings, as well as the acceptance of those innovations by customers. A decrease in the rate of innovation, or the lack of acceptance of innovations by customers, could have an adverse effect on our business, results of operations or cash flows.
In addition, if we are unable to keep up with changes in technology and new hardware, software and services offerings, for example by providing the appropriate training to our account managers, sales technology specialists and engineers to enable them to effectively sell and deliver such new offerings to customers, our business, results of operations or cash flows could be adversely affected.
We also are dependent upon our vendor partners for the development and marketing of hardware, software and services to compete effectively with hardware, software and services of vendors whose products and services we do not currently offer or that we are not authorized to offer in one or more customer channels. In addition, our success is dependent on our ability to develop relationships with and sell hardware, software and services from new emerging vendors and vendors that we have not historically represented in the marketplace. To the extent that a vendor's offering that is highly in demand is not available to us for resale in one or more customer channels, and there is not a competitive offering from another vendor that we are authorized to sell in such customer channels, or we are unable to develop relationships with new technology providers or companies that we have not historically represented, our business, results of operations or cash flows could be adversely impacted.
Substantial competition could reduce our market share and significantly harm our financial performance.
Our current competition includes:
10
|
•
|
resellers, such as Dimension Data, ePlus, Insight Enterprises, PC Connection, PCM, Presidio, Softchoice, World Wide Technology and many smaller resellers;
|
|
•
|
manufacturers who sell directly to customers, such as Dell, Hewlett-Packard and Apple;
|
|
•
|
large service providers and system integrators, such as IBM, Accenture, Hewlett-Packard and Dell;
|
|
•
|
e-tailers, such as Amazon, Newegg and TigerDirect.com;
|
|
•
|
cloud providers, such as AT&T, Amazon Web Services and Box; and
|
|
•
|
retailers (including their e-commerce activities), such as Staples and Office Depot.
|
We expect the competitive landscape in which we compete to continue to change as new technologies are developed. While innovation can help our business as it creates new offerings for us to sell, it can also disrupt our business model and create new and stronger competitors. For instance, while cloud-based solutions present an opportunity for us, cloud-based solutions and technologies that deliver technology solutions as a service could increase the amount of sales directly to customers rather than through solutions providers like us, or could reduce the amount of hardware we sell, leading to a reduction in our sales and/or profitability. In addition, some of our hardware and software vendor partners sell, and could intensify their efforts to sell, their products directly to our customers. Moreover, traditional OEMs have increased their services capabilities through mergers and acquisitions with service providers, which could potentially increase competition in the market to provide comprehensive technology solutions to customers. If any of these trends becomes more prevalent, it could adversely affect our business, results of operations or cash flows.
We focus on offering a high level of service to gain new customers and retain existing customers. To the extent we face increased competition to gain and retain customers, we may be required to reduce prices, increase advertising expenditures or take other actions which could adversely affect our business, results of operations or cash flows. Additionally, some of our competitors may reduce their prices in an attempt to stimulate sales, which may require us to reduce prices. This would require us to sell a greater number of products to achieve the same level of net sales and gross profit. If such a reduction in prices occurs and we are unable to attract new customers and sell increased quantities of products, our sales growth and profitability could be adversely affected.
The success of our business depends on the continuing development, maintenance and operation of our information technology systems.
Our success is dependent on the accuracy, proper utilization and continuing development of our information technology systems, including our business systems, such as our sales, customer management, financial and accounting, marketing, purchasing, warehouse management, e-commerce and mobile systems, as well as our operational platforms, including voice and data networks and power systems. The quality and our utilization of the information generated by our information technology systems, and our success in implementing new systems and upgrades, affects, among other things, our ability to:
|
•
|
conduct business with our customers, including delivering services and solutions to them;
|
|
•
|
manage our inventory and accounts receivable;
|
|
•
|
purchase, sell, ship and invoice our hardware and software products and provide and invoice our services efficiently and on a timely basis; and
|
|
•
|
maintain our cost-efficient operating model while scaling our business.
|
The integrity of our information technology systems is vulnerable to disruption due to forces beyond our control. While we have taken steps to protect our information technology systems from a variety of threats, including computer viruses, malware, phishing, social engineering, unauthorized access and other malicious attacks, both internal and external, and human error, there can be no guarantee that those steps will be effective. Furthermore, although we have redundant systems at a separate location to back up our primary systems, there can be no assurance that these redundant systems will operate properly if and when required. Any disruption to or infiltration of our information technology systems could significantly harm our business and results of operations.
Breaches of data security could adversely impact our business.
11
Our business involves the storage and transmission of proprietary information and sensitive or confidential data, including personal information of coworkers, customers and others. In addition, we operate data centers for our customers which host their technology infrastructure and may store and transmit both business-critical data and confidential information. In connection with our services business, our coworkers also have access to our customers' confidential data and other information. We have privacy and data security policies in place that are designed to prevent security breaches; however, as newer technologies evolve, we could be exposed to increased risk of breaches in security. Breaches in security could expose us, our customers or other individuals to a risk of public disclosure, loss or misuse of this information, resulting in legal claims or proceedings, liability or regulatory penalties under laws protecting the privacy of personal information, as well as the loss of existing or potential customers and damage to our brand and reputation. In addition, the cost and operational consequences of implementing further data protection measures could be significant. Such breaches, costs and consequences could adversely affect our business, results of operations or cash flows.
The failure to comply with our Public segment contracts or applicable laws and regulations could result in, among other things, termination, fines or other liabilities, and changes in procurement regulations could adversely impact our business, results of operations or cash flows.
Revenues in our Public segment are derived from sales to governmental entities, educational institutions and healthcare customers, through various contracts and open market sales of products and services. Sales to Public segment customers are highly regulated. Noncompliance with contract provisions, government procurement regulations or other applicable laws or regulations (including but not limited to the False Claims Act and the Medicare and Medicaid Anti-Kickback Statute) could result in civil, criminal and administrative liability, including substantial monetary fines or damages, termination of government contracts or other Public segment customer contracts, and suspension, debarment or ineligibility from doing business with the government and other customers in the Public segment. In addition, contracts in the Public segment are generally terminable at any time for convenience of the contracting agency or group purchasing organization (“GPO”) or upon default. Furthermore, our inability to enter into or retain contracts with GPOs may threaten our ability to sell to customers in those GPOs and compete. The effect of any of these possible actions could adversely affect our business, results of operations or cash flows. In addition, the adoption of new or modified procurement regulations and other requirements may increase our compliance costs and reduce our gross margins, which could have a negative effect on our business, results of operations or cash flows.
If we fail to provide high-quality services to our customers, or if our third-party service providers fail to provide high-quality services to our customers, our reputation, business, results of operations or cash flows could be adversely affected.
Our service offerings include field services, managed services, warranties, configuration services, partner services and telecom services. Additionally, we deliver and manage mission critical software, systems and network solutions for our customers. We also offer certain services, such as implementation and installation services and repair services, to our customers through various third-party service providers engaged to perform these services on our behalf. If we or our third-party service providers fail to provide high quality services to our customers or such services result in a disruption of our customers' businesses, this could, among other things, result in legal claims and proceedings and liability. Moreover, as we expand our services and solutions business, we may be exposed to additional operational, regulatory and other risks. We also could incur liability for failure to comply with the rules and regulations applicable to the new services and solutions we provide to our customers. If any of the foregoing were to occur, our reputation with our customers, our brand and our business, results of operations or cash flows could be adversely affected.
If we lose any of our key personnel, or are unable to attract and retain the talent required for our business, our business could be disrupted and our financial performance could suffer.
Our success is heavily dependent upon our ability to attract, develop, engage and retain key personnel to manage and grow our business, including our key executive, management, sales, services and technical coworkers.
Our future success will depend to a significant extent on the efforts of Thomas E. Richards, our Chairman and Chief Executive Officer, as well as the continued service and support of our other executive officers. Our future success also will depend on our ability to retain our customer-facing coworkers, who have been given critical CDW knowledge regarding, and the opportunity to develop strong relationships with, many of our customers. In addition, as we seek to expand our offerings of value-added services and solutions, our success will even more heavily depend on attracting and retaining highly skilled technology specialists and engineers, for whom the market is extremely competitive.
Our inability to attract, develop and retain key personnel could have an adverse effect on our relationships with our vendor partners and customers and adversely affect our ability to expand our offerings of value-added services and solutions. Moreover, our inability to train our sales, services and technical personnel effectively to meet the rapidly changing technology
12
needs of our customers could cause a decrease in the overall quality and efficiency of such personnel. Such consequences could adversely affect our business, results of operations or cash flows.
The interruption of the flow of products from suppliers could disrupt our supply chain.
A significant portion of the products we sell are manufactured or purchased by our vendor partners outside of the U.S., primarily in Asia. Political, social or economic instability in Asia, or in other regions in which our vendor partners purchase or manufacture the products we sell, could cause disruptions in trade, including exports to the U.S. Other events that could also cause disruptions to our supply chain include:
|
•
|
the imposition of additional trade law provisions or regulations;
|
|
•
|
the imposition of additional duties, tariffs and other charges on imports and exports;
|
|
•
|
foreign currency fluctuations;
|
|
•
|
natural disasters or other adverse occurrences at, or affecting, any of our suppliers' facilities;
|
|
•
|
restrictions on the transfer of funds;
|
|
•
|
the financial instability or bankruptcy of manufacturers; and
|
|
•
|
significant labor disputes, such as strikes.
|
We cannot predict whether the countries in which the products we sell are purchased or manufactured, or may be purchased or manufactured in the future, will be subject to new or additional trade restrictions or sanctions imposed by the U.S. or foreign governments, including the likelihood, type or effect of any such restrictions. Trade restrictions, including new or increased tariffs or quotas, embargoes, sanctions, safeguards and customs restrictions against the products we sell, as well as foreign labor strikes and work stoppages or boycotts, could increase the cost or reduce the supply of product available to us and adversely affect our business, results of operations or cash flows. In addition, our exports are subject to regulations and noncompliance with these requirements could have a negative effect on our business, results of operations or cash flows.
A natural disaster or other adverse occurrence at one of our primary facilities or customer data centers could damage our business.
Substantially all of our corporate, warehouse and distribution functions are located at our Vernon Hills, Illinois facilities and our second distribution center in North Las Vegas, Nevada. If the warehouse and distribution equipment at one of our distribution centers were to be seriously damaged by a natural disaster or other adverse occurrence, we could utilize the other distribution center or third-party distributors to ship products to our customers. However, this may not be sufficient to avoid interruptions in our service and may not enable us to meet all of the needs of our customers and would cause us to incur incremental operating costs. In addition, we operate three customer data centers and numerous sales offices which may contain both business-critical data and confidential information of our customers. A natural disaster or other adverse occurrence at any of the customer data centers or at any of our major sales offices could negatively impact our business, results of operations or cash flows.
We are heavily dependent on commercial delivery services.
We generally ship hardware products to our customers by FedEx, United Parcel Service and other commercial delivery services and invoice customers for delivery charges. If we are unable to pass on to our customers future increases in the cost of commercial delivery services, our profitability could be adversely affected. Additionally, strikes, inclement weather, natural disasters or other service interruptions by such shippers could adversely affect our ability to deliver products on a timely basis.
We are exposed to accounts receivable and inventory risks.
We extend credit to our customers for a significant portion of our net sales, typically on 30-day payment terms. We are subject to the risk that our customers may not pay for the products they have purchased, or may pay at a slower rate than we have historically experienced, the risk of which is heightened during periods of economic downturn or uncertainty or, in the case of Public segment customers, during periods of budget constraints.
We are also exposed to inventory risks as a result of the rapid technological changes that affect the market and pricing for the products we sell. We seek to minimize our inventory exposure through a variety of inventory management procedures and policies, including our rapid-turn inventory model, as well as vendor price protection and product return programs. However, if we were unable to maintain our rapid-turn inventory model, if there were unforeseen product developments that
13
created more rapid obsolescence or if our vendor partners were to change their terms and conditions, our inventory risks could increase. We also from time to time take advantage of cost savings associated with certain opportunistic bulk inventory purchases offered by our vendor partners or we may decide to carry high inventory levels of certain products that have limited or no return privileges due to customer demand or request. These bulk purchases could increase our exposure to inventory obsolescence.
We could be exposed to additional risks if we continue to make strategic investments or acquisitions or enter into alliances.
We may continue to pursue transactions, including strategic investments, acquisitions or alliances, in an effort to extend or complement our existing business. These types of transactions involve numerous business risks, including finding suitable transaction partners and negotiating terms that are acceptable to us, the diversion of management's attention from other business concerns, extending our product or service offerings into areas in which we have limited experience, entering into new geographic markets, the potential loss of key coworkers or business relationships and successfully integrating acquired businesses, any of which could adversely affect our operations.
In addition, our financial results could be adversely affected by financial adjustments required by accounting principles generally accepted in the United States of America (“GAAP”) in connection with these types of transactions where significant goodwill or intangible assets are recorded. To the extent the value of goodwill or identifiable intangible assets with indefinite lives becomes impaired, we may be required to incur material charges relating to the impairment of those assets.
Our future operating results may fluctuate significantly.
We may experience significant variations in our future quarterly results of operations. These fluctuations may cause the market price of our common stock to be volatile and may result from many factors, including the condition of the technology industry in general, shifts in demand and pricing for hardware, software and services and the introduction of new products or upgrades.
Our operating results are also highly dependent on our level of gross profit as a percentage of net sales. Our gross profit percentage fluctuates due to numerous factors, some of which may be outside of our control, including general macroeconomic conditions; pricing pressures; changes in product costs from our vendor partners; the availability of price protection, purchase discounts and incentive programs from our vendor partners; changes in product, order size and customer mix; the risk of some items in our inventory becoming obsolete; increases in delivery costs that we cannot pass on to customers; and general market and competitive conditions.
In addition, our cost structure is based, in part, on anticipated sales and gross margins. Therefore, we may not be able to adjust our cost structure quickly enough to compensate for any unexpected sales or gross margin shortfall, and any such inability could have an adverse effect on our business, results of operations or cash flows.
We are exposed to risks from legal proceedings and audits.
We are party to various legal proceedings that arise in the ordinary course of our business, which include commercial, employment, tort and other litigation.
We are subject to intellectual property infringement claims against us in the ordinary course of our business, either because of the products and services we sell or the business systems and processes we use to sell such products and services, in the form of cease-and-desist letters, licensing inquiries, lawsuits and other communications and demands. In our industry, such intellectual property claims have become more frequent as the complexity of technological products and the intensity of competition in our industry have increased. Increasingly, many of these assertions are brought by non-practicing entities whose principal business model is to secure patent licensing revenue, but we may also be subject to suits from inventors, competitors or other patent holders who may seek licensing revenue, lost profits and/or an injunction preventing us from engaging in certain activities, including selling certain products and services.
Because of our significant sales to governmental entities, we also are subject to audits by federal, state and local authorities. We also are subject to audits by various vendor partners and large customers, including government agencies, relating to purchases and sales under various contracts. In addition, we are subject to indemnification claims under various contracts.
Current and future litigation, infringement claims, governmental proceedings, audits or indemnification claims that we face may result in substantial costs and expenses and significantly divert the attention of our management regardless of the outcome. In addition, current and future litigation, infringement claims, governmental proceedings, audits or indemnification claims could lead to increased costs or interruptions of our normal business operations. Litigation, infringement claims, governmental proceedings, audits or indemnification claims involve uncertainties and the eventual outcome of any litigation,
14
infringement claim, governmental proceeding, audit or indemnification claim could adversely affect our business, results of operations or cash flows.
Failure to comply with the laws and regulations applicable to our operations could adversely impact our business, results of operations or cash flows.
Our operations are subject to numerous U.S. and foreign laws and regulations in a number of areas including, but not limited to, areas of labor and employment, advertising, e-commerce, tax, import and export requirements, anti-corruption, data privacy requirements, anti-competition, and environmental, health, and safety. Compliance with these laws, regulations and similar requirements may be onerous and expensive, and they may be inconsistent from jurisdiction to jurisdiction, further increasing the cost of compliance and doing business, and the risk of noncompliance. We have implemented policies and procedures designed to help ensure compliance with applicable laws and regulations, but there can be no guarantee against coworkers, contractors, or agents violating such laws and regulations or our policies and procedures.
We have significant deferred cancellation of debt income.
As a result of a 2009 debt modification, we realized $395.5 million of cancellation of debt income (“CODI”). We made an election under Code Section 108(i) to defer this CODI from taxable income, pursuant to which we are also required to defer certain original issue discount (“OID”) deductions as they accrue. As of December 31, 2013, we had deferred approximately $114.5 million of OID deductions. Starting in 2014, we were required to include the deferred CODI and the deferred OID into taxable income ratably over a five-year period ending in 2018. Because we have more CODI than the aggregate of our deferred OID on the relevant remaining debt instruments, we will have a future cash tax liability associated with our significant deferred CODI. We have reflected the associated cash tax liability in our deferred taxes for financial accounting purposes.
All of our deferred CODI will be accelerated into current taxable income if, prior to 2018, we engage in a so-called “impairment transaction” and the gross value of our assets immediately afterward is less than 110% of the sum of our total liabilities and the tax on the net amount of our deferred CODI and OID (the “110% test”) as determined under the applicable Treasury Regulations. An “impairment transaction” is any transaction that impairs our ability to pay the tax on our deferred CODI, and includes dividends or distributions with respect to our equity and charitable contributions, in each case in a manner that is not consistent with our historical practice within the meaning of the applicable Treasury Regulations.
Prior to 2018, our willingness to pay dividends or make distributions with respect to our equity could be adversely affected if, at the time, we do not meet the 110% test and, as a result, the payment of a dividend or the making of a distribution would accelerate the tax payable with respect to our deferred CODI. We believe that, based on our interpretation of applicable Treasury Regulations, the gross value of our assets exceeds 110% of the sum of our total liabilities and the tax on the net amount of our deferred CODI and OID as of the filing date of this Annual Report on Form 10-K. However, we cannot assure you that this will continue to be true in the future.
Risks Related to Our Indebtedness
We have a substantial amount of indebtedness, which could have important consequences to our business.
We have a substantial amount of indebtedness. As of December 31,
2014
, we had
$3.2 billion
of total long-term debt outstanding, as defined by GAAP, and
$332.1 million
of obligations outstanding under our inventory financing agreements, and the ability to borrow an additional
$935.6 million
under our senior secured asset-based revolving credit facility (the “Revolving Loan”). Our substantial indebtedness could have important consequences, including the following:
|
•
|
making it more difficult for us to satisfy our obligations with respect to our indebtedness;
|
|
•
|
requiring us to dedicate a substantial portion of our cash flow from operations to debt service payments on our and our subsidiaries' debt, which reduces the funds available for working capital, capital expenditures, acquisitions and other general corporate purposes;
|
|
•
|
requiring us to comply with restrictive covenants in our senior credit facilities and indentures, which limit the manner in which we conduct our business;
|
|
•
|
making it more difficult for us to obtain vendor financing from our vendor partners, including original equipment manufacturers and software publishers;
|
|
•
|
limiting our flexibility in planning for, or reacting to, changes in the industry in which we operate;
|
15
|
•
|
placing us at a competitive disadvantage compared to any of our less-leveraged competitors;
|
|
•
|
increasing our vulnerability to both general and industry-specific adverse economic conditions; and
|
|
•
|
limiting our ability to obtain additional debt or equity financing to fund future working capital, capital expenditures, acquisitions or other general corporate requirements and increasing our cost of borrowing.
|
Restrictive covenants under our senior credit facilities and, to varying degrees, our indentures may adversely affect our operations and liquidity.
Our senior credit facilities and, to varying degrees, our indentures contain, and any future indebtedness of ours may contain, various covenants that limit our ability to, among other things:
|
•
|
incur or guarantee additional debt;
|
|
•
|
pay dividends or make distributions to holders of our capital stock or to make certain other restricted payments or investments;
|
|
•
|
repurchase or redeem capital stock;
|
|
•
|
make loans, capital expenditures or investments or acquisitions;
|
|
•
|
receive dividends or other payments from our subsidiaries;
|
|
•
|
enter into transactions with affiliates;
|
|
•
|
create liens;
|
|
•
|
merge or consolidate with other companies or transfer all or substantially all of our assets;
|
|
•
|
transfer or sell assets, including capital stock of subsidiaries; and
|
|
•
|
prepay, repurchase or redeem debt.
|
As a result of these covenants, we are limited in the manner in which we conduct our business and we may be unable to engage in favorable business activities or finance future operations or capital needs. A breach of any of these covenants or any of the other restrictive covenants would result in a default under our senior credit facilities. Upon the occurrence of an event of default under our senior credit facilities, the lenders:
|
•
|
will not be required to lend any additional amounts to us;
|
|
•
|
could elect to declare all borrowings outstanding thereunder, together with accrued and unpaid interest and fees, to be due and payable; or
|
|
•
|
could require us to apply all of our available cash to repay these borrowings.
|
The acceleration of amounts outstanding under our senior credit facilities would likely trigger an event of default under our existing indentures.
If we were unable to repay those amounts, the lenders under our senior credit facilities could proceed against the collateral granted to them to secure our borrowings thereunder. We have pledged a significant portion of our assets as collateral under our senior credit facilities. If the lenders under our senior credit facilities accelerate the repayment of borrowings, we cannot assure you that we will have sufficient assets to repay our senior credit facilities and our other indebtedness or the ability to borrow sufficient funds to refinance such indebtedness. Even if we were able to obtain new financing, it may not be on commercially reasonable terms, or terms that are acceptable to us.
In addition, under our Revolving Loan, we are permitted to borrow an aggregate amount of up to $1,250.0 million. However, our ability to borrow under our Revolving Loan is limited by a borrowing base and a liquidity condition. The borrowing base at any time equals the sum of up to 85% of CDW LLC and its subsidiary guarantors’ eligible accounts receivable (net of accounts reserves) (up to 30% of such eligible accounts receivable which can consist of federal government accounts receivable) plus the lesser of (i) 75% of CDW LLC and its subsidiary guarantors’ eligible inventory (valued at cost and net of inventory reserves) and (ii) the product of 85% multiplied by the net orderly liquidation value percentage multiplied by eligible inventory (valued at cost and net of inventory reserves), less reserves (other than accounts reserves and inventory
16
reserves). The borrowing base in effect as of December 31,
2014
was
$1,253.4 million
, and therefore, did not restrict our ability to borrow under our Revolving Loan as of that date.
Our ability to borrow under our Revolving Loan is also limited by a minimum liquidity condition, which provides that, if excess cash availability is less than the lesser of (i) $125.0 million and (ii) the greater of (A) 10% of the borrowing base and (B) $100.0 million, the lenders are not required to lend any additional amounts under our Revolving Loan unless the consolidated fixed charge coverage ratio (as defined in the credit agreement for our Revolving Loan) is at least 1.0 to 1.0. Moreover, our Revolving Loan provides discretion to the agent bank acting on behalf of the lenders to impose additional availability reserves, which could materially impair the amount of borrowings that would otherwise be available to us. We cannot assure you that the agent bank will not impose such reserves or, were it to do so, that the resulting impact of this action would not materially and adversely impair our liquidity.
We will be required to generate sufficient cash to service our indebtedness and, if not successful, we may be forced to take other actions to satisfy our obligations under our indebtedness.
Our ability to make scheduled payments on or to refinance our debt obligations depends on our financial and operating performance, which is subject to prevailing economic and competitive conditions and to certain financial, business and other factors beyond our control. Our outstanding long-term debt will impose significant cash interest payment obligations on us and, accordingly, we will have to generate significant cash flow from operating activities to fund our debt service obligations. We cannot assure you that we will maintain a level of cash flows from operating activities sufficient to permit us to pay the principal, premium, if any, and interest on our indebtedness. See “Management’s Discussion and Analysis of Financial Condition and Results of Operations-Liquidity and Capital Resources” included elsewhere in this report.
If our cash flows and capital resources are insufficient to fund our debt service obligations, we may be forced to reduce or delay capital expenditures, sell assets or operations, seek additional debt or equity capital, restructure or refinance our indebtedness, or revise or delay our strategic plan. We cannot assure you that we would be able to take any of these actions, that these actions would be successful and permit us to meet our scheduled debt service obligations or satisfy our capital requirements, or that these actions would be permitted under the terms of our existing or future debt agreements, including our senior credit facilities and indentures. In the absence of such operating results and resources, we could face substantial liquidity problems and might be required to dispose of material assets or operations to meet our debt service and other obligations. Our senior credit facilities and the indenture governing our 8.5% Senior Notes due 2019 ("2019 Senior Notes") restrict our ability to dispose of assets and use the proceeds from the disposition. We may not be able to consummate those dispositions or to obtain the proceeds which we could realize from them and these proceeds may not be adequate to meet any debt service obligations then due. Furthermore, the Sponsors have no obligation to provide us with debt or equity financing.
If we cannot make scheduled payments on our debt, we will be in default and, as a result:
|
•
|
our debt holders could declare all outstanding principal and interest to be due and payable;
|
|
•
|
the lenders under our senior credit facilities could foreclose against the assets securing the borrowings from them and the lenders under our term loan facility could terminate their commitments to lend us money; and
|
|
•
|
we could be forced into bankruptcy or liquidation.
|
Despite our indebtedness levels, we and our subsidiaries may be able to incur substantially more debt, including secured debt. This could further increase the risks associated with our leverage.
We and our subsidiaries may be able to incur substantial additional indebtedness in the future. The terms of our senior credit facilities and indentures do not fully prohibit us or our subsidiaries from doing so. To the extent that we incur additional indebtedness or such other obligations, the risks associated with our substantial indebtedness described above, including our possible inability to service our debt, will increase. As of December 31,
2014
, we had approximately
$935.6 million
available for additional borrowing under our Revolving Loan after taking into account borrowing base limitations (net of
$2.1 million
of issued and undrawn letters of credit and
$332.1 million
of reserves related to our floorplan sub-facility).
Variable rate indebtedness subjects us to interest rate risk, which could cause our debt service obligations to increase significantly.
Certain of our borrowings, primarily borrowings under our senior credit facilities, are at variable rates of interest and expose us to interest rate risk. As of December 31,
2014
, we had
$1,513.5 million
of variable rate debt outstanding. If interest rates increase above 1% per annum, our debt service obligations on the variable rate indebtedness would increase even though the amount borrowed remained the same, and our net income would decrease. Although we have entered into interest rate cap
17
agreements on our term loan facility to reduce interest rate volatility, we cannot assure you we will be able to enter into interest rate cap agreements in the future on acceptable terms or that such caps or the caps we have in place now will be effective.
Risks Related to Ownership of Our Common Stock
Our common stock price may be volatile and may decline regardless of our operating performance, and holders of our common stock could lose a significant portion of their investment.
The market price for our common stock may be volatile. Our stockholders may not be able to resell their shares of common stock at or above the price at which they purchased such shares, due to fluctuations in the market price of our common stock, which may be caused by a number of factors, many of which we cannot control, including the risk factors described in this Annual Report on Form 10-K and the following:
|
•
|
changes in financial estimates by any securities analysts who follow our common stock, our failure to meet these estimates or failure of securities analysts to initiate or maintain coverage of our common stock;
|
|
•
|
downgrades by any securities analysts who follow our common stock;
|
|
•
|
future sales of our common stock by our officers, directors and significant stockholders, including the Sponsors;
|
|
•
|
market conditions or trends in our industry or the economy as a whole;
|
|
•
|
investors’ perceptions of our prospects;
|
|
•
|
announcements by us or our competitors of significant contracts, acquisitions, joint ventures or capital commitments;
|
|
•
|
changes in key personnel; and
|
|
•
|
our limited public float in light of the Sponsors’ beneficial ownership of a majority of our common stock, which may result in the trading of relatively small quantities of shares by our stockholders having a disproportionate positive or negative influence on the market price of our common stock.
|
In addition, the stock markets have experienced extreme price and volume fluctuations that have affected and continue to affect the market prices of equity securities of many companies, including companies in our industry. In the past, securities class action litigation has followed periods of market volatility. If we were involved in securities litigation, we could incur substantial costs, and our resources and the attention of management could be diverted from our business.
The Sponsors have influence over significant corporate activities and their interests may not align with yours.
Madison Dearborn beneficially owns approximately
15.5%
of our common stock and Providence Equity beneficially owns approximately
13.7%
of our common stock as of February 20, 2015. As a result of their ownership, each Sponsor, so long as it holds a sizable portion of our outstanding common stock, will have substantial voting power with respect to matters submitted to a vote of stockholders. In addition, so long as each Sponsor has representation on our board of directors, it will have the ability to exercise influence over decision-making with respect to our business direction and policies. Matters over which each of the Sponsors may, directly or indirectly, exercise influence include:
|
•
|
the election of our board of directors and the appointment and removal of our officers;
|
|
•
|
mergers and other business combination transactions, including proposed transactions that would result in our stockholders receiving a premium price for their shares;
|
|
•
|
other acquisitions or dispositions of businesses or assets;
|
|
•
|
incurrence of indebtedness and the issuance of equity securities;
|
|
•
|
repurchase of stock and payment of dividends; and
|
|
•
|
the issuance of shares to management under our equity incentive plans.
|
Under our amended and restated certificate of incorporation, each Sponsor and its affiliates do not have any obligation to present to us, and each Sponsor may separately pursue, corporate opportunities of which it becomes aware, even if those opportunities are ones that we would have pursued if granted the opportunity.
18
Future sales of our common stock, or the perception in the public markets that these sales may occur, may depress our stock price.
Sales of substantial amounts of our common stock in the public market, or the perception that these sales could occur, could adversely affect the price of our common stock and could impair our ability to raise capital through the sale of additional shares. As of February 20, 2015, there were
172,275,656
shares of our common stock outstanding. The shares of our common stock sold in our initial public offering and in registered secondary offerings are freely tradable without restriction under the Securities Act of 1933, as amended (the “Securities Act”), except that any shares of our common stock that may be acquired by our directors, executive officers and other affiliates, as that term is defined in the Securities Act, may be sold only in compliance with certain volume limitations and other restrictions of Rule 144 under the Securities Act.
The remaining shares of our common stock, to the extent not previously sold pursuant to an exemption from registration, will continue to be “restricted securities” within the meaning of Rule 144 under the Securities Act and subject to certain restrictions on resale. Restricted securities may be sold in the public market only if they are registered under the Securities Act or are sold pursuant to an exemption from registration such as Rule 144 under the Securities Act.
As of February 20, 2015, the holders of approximately 53,000,000 shares of our common stock will continue to have the right to require us to register the sales of such shares under the Securities Act, under the terms of an agreement between us and the holders.
In the future, we may also issue our securities in connection with investments or acquisitions. The number of shares of our common stock issued in connection with an investment or acquisition could constitute a material portion of our then-outstanding shares of our common stock.
Anti-takeover provisions in our charter documents and Delaware law might discourage or delay acquisition attempts for us that you might consider favorable.
Our amended and restated certificate of incorporation and amended and restated bylaws contain provisions that may make the acquisition of the Company more difficult without the approval of our board of directors. These provisions:
|
•
|
authorize the issuance of undesignated preferred stock, the terms of which may be established and the shares of which may be issued without stockholder approval, and which may include super voting, special approval, dividend, or other rights or preferences superior to the rights of the holders of common stock;
|
|
•
|
establish a classified board of directors so that not all members of our board of directors are elected at one time;
|
|
•
|
generally prohibit stockholder action by written consent, requiring all stockholder actions be taken at a meeting of our stockholders;
|
|
•
|
provide that special meetings of the stockholders can only be called by or at the direction of (i) our board of directors pursuant to a written resolution adopted by the affirmative vote of the majority of the total number of directors that the Company would have if there were no vacancies;
|
|
•
|
establish advance notice requirements for nominations for elections to our board of directors or for proposing matters that can be acted upon by stockholders at stockholder meetings; and
|
|
•
|
provide that our board of directors is expressly authorized to make, alter or repeal our amended and restated bylaws.
|
Our amended and restated certificate of incorporation also contains a provision that provides us with protections similar to Section 203 of the Delaware General Corporation Law, and will prevent us from engaging in a business combination with a person who acquires at least 15% of our common stock for a period of three years from the date such person acquired such common stock, unless board or stockholder approval is obtained prior to the acquisition. These anti-takeover provisions and other provisions under Delaware law could discourage, delay or prevent a transaction involving a change in control of the Company, even if doing so would benefit our stockholders. These provisions could also discourage proxy contests and make it more difficult for our stockholders to elect directors of their choosing and to cause us to take other corporate actions our stockholders desire.
19
Conflicts of interest may arise because some of our directors are principals of our largest stockholders.
Paul Finnegan and Robin Selati, who are principals of Madison Dearborn, and Glenn Creamer and Michael Dominguez, who are managing directors of Providence Equity, serve on our board of directors. As of February 20, 2015, Madison Dearborn and Providence Equity each continue to hold a sizable portion of our outstanding common stock. The Sponsors and the entities respectively controlled by them may hold equity interests in entities that directly or indirectly compete with us, and companies in which they currently invest may begin competing with us. As a result of these relationships, when conflicts arise between the interests of Madison Dearborn or Providence Equity, on the one hand, and of other stockholders, on the other hand, these directors may not be disinterested. Although our directors and officers have a duty of loyalty to us under Delaware law and our amended and restated certificate of incorporation, transactions that we enter into in which a director or officer has a conflict of interest are generally permissible so long as (1) the material facts relating to the director’s or officer’s relationship or interest as to the transaction are disclosed to our board of directors and a majority of our disinterested directors approves the transaction, (2) the material facts relating to the director’s or officer’s relationship or interest as to the transaction are disclosed to our stockholders and a majority of our disinterested stockholders approve the transaction or (3) the transaction is otherwise fair to us. Our amended and restated certificate of incorporation also provides that any principal, officer, member, manager and/or employee of a Sponsor or any entity that controls, is controlled by or under common control with a Sponsor (other than us or any company that is controlled by us) or a Sponsor-managed investment fund will not be required to offer any transaction opportunity of which they become aware to us and could take any such opportunity for themselves or offer it to other companies in which they have an investment, unless such opportunity is offered to them solely in their capacities as our directors.
We cannot assure you that we will continue to pay dividends on our common stock or repurchase any of our common stock under our share repurchase program, and our indebtedness and certain tax considerations could limit our ability to continue to pay dividends on, or make share repurchases of, our common stock. If we do not continue to pay dividends, you may not receive any return on investment unless you are able to sell your common stock for a price greater than your purchase price.
We expect to continue to pay a cash dividend on our common stock of $0.0675 per share per quarter, or $0.27 per share per annum. Any determination to pay dividends in the future will be at the discretion of our board of directors. Any determination to pay dividends on, or repurchase, shares of our common stock in the future will depend upon our results of operations, financial condition, business prospects, capital requirements, contractual restrictions, including those under our senior credit facilities and indentures, any potential indebtedness we may incur, restrictions imposed by applicable law, tax considerations and other factors our board of directors deems relevant. In addition, our ability to pay dividends on, or repurchase, shares of our common stock will be limited by restrictions on our ability to pay dividends or make distributions to our stockholders and on the ability of our subsidiaries to pay dividends or make distributions to us, in each case, under the terms of our current and any future agreements governing our indebtedness. There can be no assurance that we will continue to pay a dividend at the current rate or at all or that we will repurchase shares of our common stock. If we do not pay dividends in the future, realization of a gain on your investment will depend entirely on the appreciation of the price of our common stock, which may never occur. See “--Risks Related to Our Business--We have significant deferred cancellation of debt income” for a discussion of certain tax considerations that could affect our willingness to pay dividends in the future
.
We are a holding company and rely on dividends, distributions and other payments, advances and transfers of funds from our subsidiaries to meet our obligations.
We are a holding company that does not conduct any business operations of our own. As a result, we are largely dependent upon cash dividends and distributions and other transfers from our subsidiaries to meet our obligations. The agreements governing the indebtedness of our subsidiaries impose restrictions on our subsidiaries’ ability to pay dividends or other distributions to us. The deterioration of the earnings from, or other available assets of, our subsidiaries for any reason could also limit or impair their ability to pay dividends or other distributions to us.
None.
As of
December 31, 2014
, we owned or leased a total of
2.3 million
square feet of space throughout the U.S. and Canada. We own two properties: a combined office and a 450,000 square foot distribution center in Vernon Hills, Illinois, and a 513,000 square foot distribution center in North Las Vegas, Nevada. In addition, we conduct sales, services and administrative activities in various leased locations throughout the U.S. and Canada, including data centers in Madison, Wisconsin and Minneapolis, Minnesota.
20
We believe that our facilities are well maintained, suitable for our business and occupy sufficient space to meet our operating needs. As part of our normal business, we regularly evaluate sales center performance and site suitability. Leases covering our currently occupied leased properties expire at varying dates, generally within the next ten years. We anticipate no difficulty in retaining occupancy through lease renewals, month-to-month occupancy or replacing the leased properties with equivalent properties. We believe that suitable additional or substitute leased properties will be available as required.
We are party to various legal proceedings that arise in the ordinary course of our business, which include commercial, intellectual property, employment, tort and other litigation matters. We are also subject to audit by federal, state and local authorities, and by various partners, group purchasing organizations and customers, including government agencies, relating to purchases and sales under various contracts. In addition, we are subject to indemnification claims under various contracts. From time to time, certain of our customers file voluntary petitions for reorganization or liquidation under the U.S. bankruptcy laws. In such cases, certain pre-petition payments received by us could be considered preference items and subject to return to the bankruptcy administrator.
As of December 31, 2014
, we do not believe that there is a reasonable possibility that any material loss exceeding the amounts already recognized for these proceedings and matters, if any, has been incurred. However, the ultimate resolutions of these proceedings and matters are inherently unpredictable. As such, our financial condition and results of operations could be adversely affected in any particular period by the unfavorable resolution of one or more of these proceedings or matters.
Not applicable.
21
Executive Officers
|
Name
|
Age
|
Position
|
|
|
Thomas E. Richards
|
60
|
|
Chairman, President and Chief Executive Officer, and Director
|
|
Dennis G. Berger
|
50
|
|
Senior Vice President and Chief Coworker Services Officer
|
|
Neal J. Campbell
|
53
|
|
Senior Vice President and Chief Marketing Officer
|
|
Christina M. Corley
|
47
|
|
Senior Vice President - Corporate Sales
|
|
Douglas E. Eckrote
|
50
|
|
Senior Vice President - Strategic Solutions and Services
|
|
Christine A. Leahy
|
50
|
|
Senior Vice President, General Counsel and Corporate Secretary
|
|
Christina V. Rother
|
51
|
|
Senior Vice President - Public and Advanced Technology Sales
|
|
Jonathan J. Stevens
|
45
|
|
Senior Vice President - Operations and Chief Information Officer
|
|
Matthew A. Troka
|
44
|
|
Senior Vice President - Product and Partner Management
|
|
Ann E. Ziegler
|
56
|
|
Senior Vice President and Chief Financial Officer
|
Thomas E. Richards
serves as our Chairman, President and Chief Executive Officer, as a member of our board of directors and as a manager of CDW LLC. Mr. Richards has served as our President and Chief Executive Officer since October 2011 and was named Chairman on January 1, 2013. From September 2009 to October 2011, Mr. Richards served as our President and Chief Operating Officer. Prior to joining CDW, Mr. Richards held leadership positions with Qwest Communications International Inc. ("Qwest"), a broadband Internet-based communications company. From 2008 to 2009, he served as Executive Vice President and Chief Operating Officer, where he was responsible for the day-to-day operation and performance of Qwest, and before assuming that role, was the Executive Vice President of the Business Markets Group from 2005 to 2008. Mr. Richards also has served as Chairman and Chief Executive Officer of Clear Communications Corporation and as Executive Vice President of Ameritech Corporation. Mr. Richards serves as a board member of Junior Achievement of Chicago, Rush University Medical Center and the University of Pittsburgh. Mr. Richards also is a member of the Economic Club of Chicago and the Executives’ Club of Chicago. Mr. Richards is a graduate of the University of Pittsburgh where he earned a bachelor’s degree and a graduate of Massachusetts Institute of Technology where he earned a Master of Science in Management as a Sloan Fellow.
Dennis G. Berger
serves as our Senior Vice President and Chief Coworker Services Officer. Mr. Berger joined CDW in September 2005 as Vice President-Coworker Services. In January 2007, he was named Senior Vice President and Chief Coworker Services Officer. Mr. Berger is responsible for leading CDW’s programs in coworker learning and development, benefits, compensation, performance management, coworker relations and talent acquisition. Prior to joining CDW, he served as Vice President of Human Resources at PepsiAmericas, a beverage company, from 2002 to 2005. Mr. Berger has also held human resources positions of increasing responsibility at Pepsi Bottling Group, Inc., Pepsico, Inc. and GTE Corporation. Mr. Berger serves on the board of directors of Glenwood Academy, Anti-Defamation League of Chicago and Skills for Chicagoland’s Future. Mr. Berger is a graduate of Northeastern University where he earned a bachelor’s degree and a graduate of John M. Olin School of Business at Washington University in St. Louis where he earned a Master of Business Administration.
Neal J. Campbell
serves as our Senior Vice President and Chief Marketing Officer. Mr. Campbell joined CDW in January 2011, and is responsible for the strategy and development of CDW’s advertising, public relations, channel marketing, marketing intelligence and research, merchandising, microsites, creative services and direct marketing content, along with relationship marketing, corporate communications and e-commerce initiatives including content development, online marketing and e-procurement. Prior to joining CDW, Mr. Campbell served as Chief Executive Officer of TrafficCast, a provider of real-time and predictive traffic information to Google, Yahoo and others from 2008 to 2011. From 2006 to 2008, he served as Executive Vice President and General Manager-Strategic Marketing and Next Generation Products for ISCO International, a manufacturer of wireless telecommunications components. Mr. Campbell also spent 17 years with Motorola, most recently as Vice President and General Manager, GSM Portfolio Marketing and Planning for the company’s mobile device business. He currently serves as a board member of TrafficCast and Junior Achievement of Chicago, and is on the Executive Advisory Council of Bradley University. Mr. Campbell is a graduate of Bradley University where he earned a bachelor’s degree and a graduate of Northwestern University’s Kellogg School of Management where he earned a Master of Business Administration.
Christina M. Corley
serves as our Senior Vice President of Corporate Sales and is responsible for managing all aspects of our corporate sales force, including sales force strategy, structure, goals, operations, revenue generation and training and development. Prior to joining CDW in September 2011, Ms. Corley served as President and Chief Operating Officer of Zones, Inc., a provider of IT products and solutions, from 2006 to 2011. She served as Executive Vice President of Purchasing and Operations for Zones, Inc. from April 2005 to October 2006. She served as President of Corporate PC Source (“CPCS”), a
22
wholly owned subsidiary of Zones, Inc., from March 2003 to April 2005. Prior to its acquisition by Zones, Inc., Ms. Corley served as Chief Executive Officer of CPCS from 1999 to 2003. Ms. Corley began her career in sales and marketing, holding various positions at IBM, Dataflex and VisionTek. She currently serves as a board member of the Boys and Girls Club of Chicago. Ms. Corley is a graduate of the University of Illinois at Urbana-Champaign where she earned a bachelor’s degree and a graduate of Northwestern University’s Kellogg School of Management where she earned a Master of Business Administration in management and strategy.
Douglas E. Eckrote
serves as our Senior Vice President of Strategic Solutions and Services and is responsible for our technology specialist teams focusing on servers and storage, unified communications, security, wireless, power and cooling, networking, software licensing and mobility solutions. He also holds responsibility for CDW Canada, Inc. Mr. Eckrote joined CDW in 1989 as an account manager. Mr. Eckrote was appointed Director of Operations in 1996, Vice President of Operations in 1999 and Senior Vice President of Purchasing in April 2001. In October 2001, he was named Senior Vice President of Purchasing and Operations. He was named Senior Vice President of Operations, Services and Canada in 2006 and assumed his current role in 2009. Prior to joining CDW, Eckrote worked in outside sales for Arrow Electronics and Cintas Uniform Company. From 2003 to 2009, Mr. Eckrote served on the board of directors of the Make-A-Wish Foundation of Illinois, completing the last two years as board chair, and served on the Make-A-Wish Foundation of America National Chapter Performance Committee from 2009-2014. Mr. Eckrote also served on the board of directors of the Center for Enriched Living from 2002-2011, serving as Vice President from 2004-2005, President from 2006-2008, board emeritus from 2009-2011 and currently serves as a trustee. Mr. Eckrote is a graduate of Purdue University where he earned a bachelor’s degree and a graduate of Northwestern University’s Kellogg School of Management where he earned an Executive Master of Business Administration.
Christine A. Leahy
serves as our Senior Vice President, General Counsel and Corporate Secretary and is responsible for our legal, corporate governance, enterprise risk management and ethics and compliance functions. She also is responsible for our international strategy and serves on the board of directors of Kelway, a UK-based technology solutions provider in which CDW has a minority investment. Ms. Leahy joined CDW in January 2002. Prior to that, Ms. Leahy served as a corporate partner in the Chicago office of Sidley Austin LLP where she specialized in mergers and acquisitions, strategic counseling, corporate governance and securities law. Ms. Leahy serves on the board of trustees of Children’s Home and Aid. Ms. Leahy is a graduate of Brown University where she earned a bachelor’s degree and a graduate of Boston College Law School where she earned her Juris Doctor. She also completed the CEO Perspective and Women’s Director Development Programs at Northwestern University’s Kellogg School of Management.
Christina V. Rother
serves as our Senior Vice President of Public and Advanced Technology Sales and is responsible for managing all aspects of our public sector and advanced technology sales forces, including sales force strategy, structure, goals, operations, revenue generation and training and development. Ms. Rother joined CDW in 1991 as an account manager. In 2002, she was appointed Vice President for Education and State and Local Sales. In 2005, she was chosen to lead our newly formed healthcare sales team. Beginning in 2006, Ms. Rother has held various positions ranging from Group Vice President of CDW Government LLC, President of CDW Government LLC and Senior Vice President of Sales. In September 2011, Ms. Rother assumed her current role as Senior Vice President of Public and Advanced Technology Sales. Prior to joining CDW, Ms. Rother held a number of sales positions with technology companies including Laser Computers and Price Electronics. Ms. Rother currently serves as chair of the board of directors of the Make-A-Wish Foundation of Illinois. Ms. Rother is a graduate of the University of Illinois at Chicago where she earned a bachelor’s degree.
Jonathan J. Stevens
serves as our Senior Vice President of Operations and Chief Information Officer. Mr. Stevens joined CDW in June 2001 as Vice President-Information Technology, was named Chief Information Officer in January 2002 and Vice President-International and Chief Information Officer from 2005 until December 2006. In January 2007, he was named Senior Vice President and Chief Information Officer and assumed his current role in November 2009. Mr. Stevens is responsible for the strategic direction of our information technology. Additionally, he holds responsibility for our distribution centers, transportation, facilities, customer relations and operational excellence practices. Prior to joining CDW, Mr. Stevens served as regional technology director for Avanade, an international technology integration company formed through a joint venture between Microsoft and Accenture from 2000 to 2001. Prior to that, Mr. Stevens was a principal with Microsoft Consulting Services and led an information technology group for a corporate division of AT&T/NCR. He currently serves on the board of directors of SingleWire Software, LLC and Northeast Illinois Council: Boy Scouts of America. Mr. Stevens is a graduate of the University of Dayton where he earned a bachelor’s degree.
Matthew A. Troka
serves as our Senior Vice President of Product and Partner Management. Mr. Troka is responsible for managing our relationships with all of our vendor partners. In addition, he directs the day-to-day operations of our purchasing department. Mr. Troka joined CDW in 1992 as an account manager and became a sales manager in 1995. From 1998 to 2001, he served as Corporate Sales Director. From 2001 to 2004, Mr. Troka was Senior Director of Purchasing. From 2004 to 2006, Mr. Troka served as Vice President of Purchasing. From 2006 to 2011, Mr. Troka was Vice President of Product and Partner Management. On March 3, 2011, Mr. Troka was elected Senior Vice President of Product and Partner Management.
23
Mr. Troka serves as a member of the board of directors of Encompass Championship Charities. Mr. Troka is a graduate of the University of Illinois where he earned a bachelor’s degree.
Ann E. Ziegler
joined CDW in April 2008 as Senior Vice President and Chief Financial Officer. Prior to joining CDW, Ms. Ziegler spent 15 years at Sara Lee Corporation (“Sara Lee”), a global consumer goods company, in a number of executive roles including finance, mergers and acquisitions, strategy and general management positions in both U.S. and international businesses. Most recently, from 2005 until April 2008, Ms. Ziegler served as Chief Financial Officer and Senior Vice President of Administration for Sara Lee Food and Beverage. Prior to joining Sara Lee, Ms. Ziegler was a corporate attorney at Skadden, Arps, Slate, Meagher & Flom. Ms. Ziegler serves on the board of directors of Hanesbrands, Inc, Groupon, Inc., and the board of governors of the Smart Museum of Art at the University of Chicago. During the previous five years, Ms. Ziegler also served on the board of directors of Unitrin, Inc. Ms. Ziegler is a graduate of The College of William and Mary where she earned a bachelor’s degree and a graduate of the University of Chicago Law School where she earned her Juris Doctor.
24
Market Information
Our common stock has been listed on the NASDAQ Global Select Market since
June 27, 2013
under the symbol “CDW.” Prior to that date, there was no public market for our common stock. Shares sold in our initial public offering ("IPO") were priced at
$17.00
per share on June 26, 2013. The following table sets forth the ranges of high and low sales prices per share of our common stock as reported on the NASDAQ Global Select Market and the cash dividends per share of common stock declared for the periods indicated.
|
Year ended December 31, 2014
|
High
|
Low
|
Dividends declared per share
|
||||||
|
Fourth quarter
|
$
|
36.08
|
|
$
|
27.59
|
|
$
|
0.0675
|
|
|
Third quarter
|
$
|
33.80
|
|
$
|
30.07
|
|
$
|
0.0425
|
|
|
Second quarter
|
$
|
32.41
|
|
$
|
26.70
|
|
$
|
0.0425
|
|
|
First quarter
|
$
|
27.53
|
|
$
|
22.72
|
|
$
|
0.0425
|
|
|
Year ended December 31, 2013
|
High
|
Low
|
Dividends declared per share
|
||||||
|
Fourth quarter
|
$
|
23.56
|
|
$
|
20.50
|
|
$
|
0.0425
|
|
|
Third quarter
|
$
|
24.51
|
|
$
|
18.26
|
|
$
|
—
|
|
|
Second quarter (beginning June 27, 2013)
|
$
|
19.17
|
|
$
|
17.38
|
|
$
|
—
|
|
Holders
As of
February 20, 2015
, there were
71
holders of record of our common stock. The number of beneficial stockholders is substantially greater than the number of holders of record because a portion of our common stock is held through brokerage firms.
Dividends
On
February 10, 2015
, we announced that our board of directors declared a quarterly cash dividend on our common stock of
$0.0675
per share. The dividend will be paid on
March 10, 2015
to all stockholders of record as of the close of business on
February 25, 2015
.
We expect to continue to pay quarterly cash dividends on our common stock in the future, but such payments remain at the discretion of our board of directors and will depend upon our results of operations, financial condition, business prospects, capital requirements, contractual restrictions, any potential indebtedness we may incur, restrictions imposed by applicable law, tax considerations and other factors that our board of directors deems relevant. In addition, our ability to pay dividends on our common stock will be limited by restrictions on our ability to pay dividends or make distributions to our stockholders and on the ability of our subsidiaries to pay dividends or make distributions to us, in each case, under the terms of our current and any future agreements governing our indebtedness. For a discussion of our cash resources and needs and restrictions on our ability to pay dividends, see “Management’s Discussion and Analysis of Financial Condition and Results of Operations—Liquidity and Capital Resources” included elsewhere in this report. For additional discussion of restrictions on our ability to pay dividends, see Note 7 to the accompanying audited consolidated financial statements included elsewhere in this report.
Issuer Purchases of Equity Securities
On November 6, 2014, we announced that the board of directors approved a $500 million share repurchase program, which became effective immediately, under which we may repurchase shares of our common stock in the open market or through privately negotiated transactions, depending on share price, market conditions and other factors. The share repurchase program does not obligate us to repurchase any dollar amount or number of shares, and repurchases may be commenced or
25
suspended from time to time without prior notice. As of the date of this filing, no shares have been repurchased under the share repurchase program.
Stock Performance Graph
The information contained in this Stock Performance Graph section shall not be deemed to be "soliciting material" or "filed" or incorporated by reference in future filings with the SEC, or subject to the liabilities of Section 18 of the Securities Exchange Act of 1934, except to the extent that we specifically incorporate it by reference into a document filed under the Securities Act of 1933 or the Securities Exchange Act of 1934.
The following graph compares the cumulative total shareholder return, calculated on a dividend reinvested basis, on $100.00 invested at the opening of the market on June 27, 2013, the date our common stock first traded on the NASDAQ Global Select Market, through and including the market close on December 31, 2014, with the cumulative total return for the same time period of the same amount invested in the S&P MidCap 400 index and a peer group index. Our peer group index for 2014 consists of the following companies: Accenture plc, Anixter International, Inc., Arrow Electronics, Inc., Avnet, Inc., CGI Group Inc., Genuine Parts Company, Henry Schein, Inc., Insight Enterprises, Inc., Owens & Minor, Inc., Patterson Companies, Inc., SYNNEX Corporation, United Stationers Inc., W.W. Grainger, Inc. and Wesco International, Inc. This peer group was selected based on a review of publicly available information about these companies and our determination that they met one or more of the following criteria: (i) similar size in terms of revenue and/or enterprise value (one-third to three times our revenue or enterprise value); (ii) operates in a business-to-business distribution environment; (iii) members of the technology industry; (iv) similar customers (
i.e.
, business, government, healthcare, and education); (v) companies that provide services and/or solutions; and (vi) similar EBITDA and gross margins.
Shareholder returns over the indicated period are based on historical data and should not be considered indicative of future shareholder returns.
26
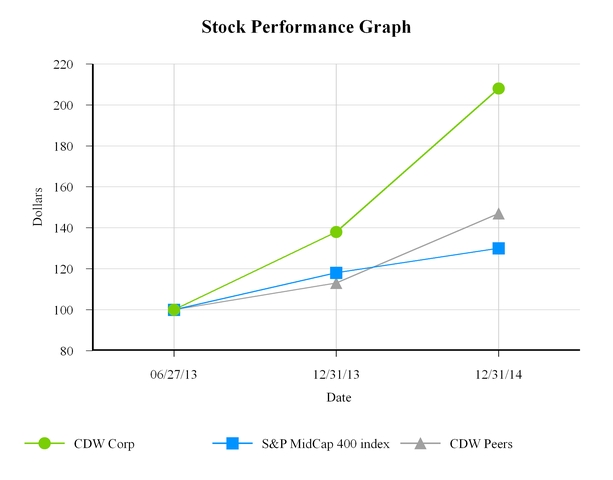
|
June 27, 2013
|
December 31, 2013
|
December 31, 2014
|
||||||||||
|
CDW Corp
|
$
|
100
|
|
$
|
138
|
|
$
|
208
|
|
|||
|
S&P MidCap 400 index
|
100
|
|
118
|
|
130
|
|
||||||
|
CDW Peers
|
100
|
|
113
|
|
147
|
|
||||||
Recent Sales of Unregistered Securities
None.
Use of Proceeds from Registered Securities
None.
The selected financial data set forth below are not necessarily indicative of the results of future operations and should be read in conjunction with “Management’s Discussion and Analysis of Financial Condition and Results of Operations” and our audited consolidated financial statements and the related notes included elsewhere in this report.
We have derived the selected financial data presented below as of December 31, 2014 and December 31, 2013 and for the years ended December 31, 2014, 2013, and 2012 from our audited consolidated financial statements and related notes, which are included elsewhere in this report. The selected financial data as of December 31, 2011 and December 31, 2010 have been derived from our audited consolidated financial statements as of and for those periods, which are not included in this report.
The following are some of the items affecting comparability of the selected financial data for the periods presented:
27
|
•
|
During the years ended December 31, 2014, 2013, 2012, and 2011, we recorded net losses on extinguishments of long-term debt of
$90.7 million
,
$64.0 million
,
$17.2 million
, and
$118.9 million
, respectively. The losses represented the difference between the amount paid upon extinguishment, including call premiums and expenses paid to the debt holders and agents, and the net carrying amount of the extinguished debt, adjusted for a portion of the unamortized deferred financing costs. Refer to Note 7 to the accompanying audited consolidated financial statements included elsewhere in this report for additional information on long-term debt.
|
|
•
|
During the year ended December 31, 2013, we recorded IPO- and secondary-offering related expenses of $75.0 million. Refer to Note 9 to the accompanying audited consolidated financial statements included elsewhere in this report for additional information on the IPO- and secondary-offering related expenses.
|
28
|
|
||||||||||||||||||||
|
|
Years Ended December 31,
|
|||||||||||||||||||
|
(dollars and shares in millions, except per share amounts)
|
2014
|
2013
|
2012
|
2011
|
2010
|
|||||||||||||||
|
Statement of Operations Data:
|
||||||||||||||||||||
|
Net sales
|
$
|
12,074.5
|
|
$
|
10,768.6
|
|
$
|
10,128.2
|
|
$
|
9,602.4
|
|
$
|
8,801.2
|
|
|||||
|
Cost of sales
|
10,153.2
|
|
9,008.3
|
|
8,458.6
|
|
8,018.9
|
|
7,410.4
|
|
||||||||||
|
Gross profit
|
1,921.3
|
|
1,760.3
|
|
1,669.6
|
|
1,583.5
|
|
1,390.8
|
|
||||||||||
|
Selling and administrative expenses
|
1,110.3
|
|
1,120.9
|
|
1,029.5
|
|
990.1
|
|
932.1
|
|
||||||||||
|
Advertising expense
|
138.0
|
|
130.8
|
|
129.5
|
|
122.7
|
|
106.0
|
|
||||||||||
|
Income from operations
|
673.0
|
|
508.6
|
|
510.6
|
|
470.7
|
|
352.7
|
|
||||||||||
|
Interest expense, net
|
(197.3
|
)
|
(250.1
|
)
|
(307.4
|
)
|
(324.2
|
)
|
(391.9
|
)
|
||||||||||
|
Net (loss) gain on extinguishments of long-term debt
|
(90.7
|
)
|
(64.0
|
)
|
(17.2
|
)
|
(118.9
|
)
|
2.0
|
|
||||||||||
|
Other income, net
|
2.7
|
|
1.0
|
|
0.1
|
|
0.7
|
|
0.2
|
|
||||||||||
|
Income (loss) before income taxes
|
387.7
|
|
195.5
|
|
186.1
|
|
28.3
|
|
(37.0
|
)
|
||||||||||
|
Income tax (expense) benefit
|
(142.8
|
)
|
(62.7
|
)
|
(67.1
|
)
|
(11.2
|
)
|
7.8
|
|
||||||||||
|
Net income (loss)
|
$
|
244.9
|
|
$
|
132.8
|
|
$
|
119.0
|
|
$
|
17.1
|
|
$
|
(29.2
|
)
|
|||||
|
Net income (loss) per common share:
|
||||||||||||||||||||
|
Basic
|
$1.44
|
$0.85
|
$0.82
|
$0.12
|
$(0.20)
|
|||||||||||||||
|
Diluted
|
$1.42
|
$0.84
|
$0.82
|
$0.12
|
$(0.20)
|
|||||||||||||||
|
Weighted-average common shares outstanding:
|
||||||||||||||||||||
|
Basic
|
170.6
|
|
156.6
|
|
145.1
|
|
144.8
|
|
144.4
|
|
||||||||||
|
Diluted
|
172.8
|
|
158.7
|
|
145.8
|
|
144.9
|
|
144.4
|
|
||||||||||
|
Balance Sheet Data (at period end):
|
||||||||||||||||||||
|
Cash and cash equivalents
|
$
|
344.5
|
|
$
|
188.1
|
|
$
|
37.9
|
|
99.9
|
|
$
|
36.6
|
|
||||||
|
Working capital
|
985.4
|
|
810.9
|
|
666.5
|
|
538.1
|
|
675.4
|
|
||||||||||
|
Total assets
|
6,099.9
|
|
5,924.6
|
|
5,720.0
|
|
5,967.7
|
|
5,943.8
|
|
||||||||||
|
Total debt and capitalized lease obligations
(1)
|
3,190.0
|
|
3,251.2
|
|
3,771.0
|
|
4,066.0
|
|
4,290.0
|
|
||||||||||
|
Total shareholders’ equity (deficit)
|
936.5
|
|
711.7
|
|
136.5
|
|
(7.3
|
)
|
(43.5
|
)
|
||||||||||
|
Other Financial Data:
|
||||||||||||||||||||
|
Capital expenditures
|
$
|
55.0
|
|
$
|
47.1
|
|
$
|
41.4
|
|
45.7
|
|
$
|
41.5
|
|
||||||
|
Depreciation and amortization
|
207.9
|
|
208.2
|
|
210.2
|
|
204.9
|
|
209.4
|
|
||||||||||
|
Gross profit as a percentage of net sales
|
15.9
|
%
|
16.3
|
%
|
16.5
|
%
|
16.5
|
%
|
15.8
|
%
|
||||||||||
|
Ratio of earnings to fixed charges
(2)
|
2.9
|
|
1.8
|
|
1.6
|
|
1.1
|
|
(a)
|
|
||||||||||
|
EBITDA
(3)
|
$
|
792.9
|
|
$
|
653.8
|
|
$
|
703.7
|
|
557.4
|
|
$
|
564.3
|
|
||||||
|
Adjusted EBITDA
(3)
|
907.0
|
|
808.5
|
|
766.6
|
|
717.3
|
|
601.8
|
|
||||||||||
|
Non-GAAP net income
(4)
|
409.9
|
|
314.3
|
|
247.1
|
|
198.8
|
|
85.7
|
|
||||||||||
|
Statement of Cash Flows Data:
|
||||||||||||||||||||
|
Net cash provided by (used in):
|
||||||||||||||||||||
|
Operating activities
|
$
|
435.0
|
|
$
|
366.3
|
|
$
|
317.4
|
|
$
|
214.7
|
|
$
|
423.7
|
|
|||||
|
Investing activities
|
(164.8
|
)
|
(47.1
|
)
|
(41.7
|
)
|
(56.0
|
)
|
(125.4
|
)
|
||||||||||
|
Financing activities
|
(112.0
|
)
|
(168.3
|
)
|
(338.0
|
)
|
(95.4
|
)
|
(350.1
|
)
|
||||||||||
|
(1)
|
Excludes borrowings of
$332.1 million
,
$256.6 million
,
$249.2 million
,
$278.7 million
and
$28.2 million
, as of December 31, 2014, 2013, 2012, 2011, and 2010, respectively, under our inventory financing agreements. We do not include these borrowings in total debt because we have not in the past incurred, and in the future do not expect to incur, any interest expense or late fees under these agreements.
|
29
|
(2)
|
For purposes of calculating the ratio of earnings to fixed charges, earnings consist of earnings before income taxes minus income from equity investments plus distributed income from equity investments and fixed charges. Fixed charges consist of interest expense and the portion of rental expense we believe is representative of the interest component of rental expense.
|
|
(a)
|
For the year ended December 31, 2010, earnings available for fixed charges were inadequate to cover fixed charges by $37.0 million.
|
|
(3)
|
EBITDA is defined as consolidated net income (loss) before interest expense, income tax expense (benefit), depreciation, and amortization. Adjusted EBITDA, which is a measure defined in our credit agreements, is calculated by adjusting EBITDA for certain items of income and expense including (but not limited to) the following: (a) non-cash equity-based compensation; (b) goodwill impairment charges; (c) sponsor fees; (d) certain consulting fees; (e) debt-related legal and accounting costs; (f) equity investment income and losses; (g) certain severance and retention costs; (h) gains and losses from the early extinguishment of debt; (i) gains and losses from asset dispositions outside the ordinary course of business; and (j) non-recurring, extraordinary or unusual gains or losses or expenses.
|
We have included a reconciliation of EBITDA and Adjusted EBITDA in the table below. Both EBITDA and Adjusted EBITDA are considered non-GAAP financial measures. Generally, a non-GAAP financial measure is a numerical measure of a company’s performance, financial position or cash flows that either excludes or includes amounts that are not normally included or excluded in the most directly comparable measure calculated and presented in accordance with GAAP. Non-GAAP measures used by the Company may differ from similar measures used by other companies, even when similar terms are used to identify such measures. We believe that EBITDA and Adjusted EBITDA provide helpful information with respect to our operating performance and cash flows including our ability to meet our future debt service, capital expenditures and working capital requirements. Adjusted EBITDA also provides helpful information as it is the primary measure used in certain financial covenants contained in our credit agreements.
The following unaudited table sets forth reconciliations of net income (loss) to EBITDA and EBITDA to Adjusted EBITDA for the periods presented:
|
|
Years Ended December 31,
|
|||||||||||||||||||
|
(in millions)
|
2014
|
2013
|
2012
|
2011
|
2010
|
|||||||||||||||
|
Net income (loss)
|
$
|
244.9
|
|
$
|
132.8
|
|
$
|
119.0
|
|
$
|
17.1
|
|
$
|
(29.2
|
)
|
|||||
|
Depreciation and amortization
|
207.9
|
|
208.2
|
|
210.2
|
|
204.9
|
|
209.4
|
|
||||||||||
|
Income tax expense (benefit)
|
142.8
|
|
62.7
|
|
67.1
|
|
11.2
|
|
(7.8
|
)
|
||||||||||
|
Interest expense, net
|
197.3
|
|
250.1
|
|
307.4
|
|
324.2
|
|
391.9
|
|
||||||||||
|
EBITDA
|
792.9
|
|
653.8
|
|
703.7
|
|
557.4
|
|
564.3
|
|
||||||||||
|
Non-cash equity-based compensation
|
16.4
|
|
8.6
|
|
22.1
|
|
19.5
|
|
11.5
|
|
||||||||||
|
Sponsor fees
|
—
|
|
2.5
|
|
5.0
|
|
5.0
|
|
5.0
|
|
||||||||||
|
Consulting and debt-related professional fees
|
—
|
|
0.1
|
|
0.6
|
|
5.1
|
|
15.1
|
|
||||||||||
|
Net loss (gain) on extinguishments of long-term debt
|
90.7
|
|
64.0
|
|
17.2
|
|
118.9
|
|
(2.0
|
)
|
||||||||||
|
Litigation, net
(i)
|
(0.9
|
)
|
(4.1
|
)
|
4.3
|
|
—
|
|
—
|
|
||||||||||
|
IPO- and secondary-offering related expenses
|
1.4
|
|
75.0
|
|
—
|
|
—
|
|
—
|
|
||||||||||
|
Other adjustments
(ii)
|
6.5
|
|
8.6
|
|
13.7
|
|
11.4
|
|
7.9
|
|
||||||||||
|
Adjusted EBITDA
|
$
|
907.0
|
|
$
|
808.5
|
|
$
|
766.6
|
|
$
|
717.3
|
|
$
|
601.8
|
|
|||||
|
(i)
|
Relates to unusual, non-recurring litigation matters.
|
|
(ii)
|
Other adjustments primarily include certain retention costs and equity investment income.
|
30
The following unaudited table sets forth a reconciliation of EBITDA to net cash provided by operating activities for the periods presented:
|
|
Years Ended December 31,
|
|||||||||||||||||||
|
(in millions)
|
2014
|
2013
|
2012
|
2011
|
2010
|
|||||||||||||||
|
EBITDA
|
$
|
792.9
|
|
$
|
653.8
|
|
$
|
703.7
|
|
$
|
557.4
|
|
$
|
564.3
|
|
|||||
|
Depreciation and amortization
|
(207.9
|
)
|
(208.2
|
)
|
(210.2
|
)
|
(204.9
|
)
|
(209.4
|
)
|
||||||||||
|
Income tax (expense) benefit
|
(142.8
|
)
|
(62.7
|
)
|
(67.1
|
)
|
(11.2
|
)
|
7.8
|
|
||||||||||
|
Interest expense, net
|
(197.3
|
)
|
(250.1
|
)
|
(307.4
|
)
|
(324.2
|
)
|
(391.9
|
)
|
||||||||||
|
Net income (loss)
|
244.9
|
|
132.8
|
|
119.0
|
|
17.1
|
|
(29.2
|
)
|
||||||||||
|
Depreciation and amortization
|
207.9
|
|
208.2
|
|
210.2
|
|
204.9
|
|
209.4
|
|
||||||||||
|
Equity-based compensation expense
|
16.4
|
|
46.6
|
|
22.1
|
|
19.5
|
|
11.5
|
|
||||||||||
|
Amortization of deferred financing costs, debt premium, and debt discount, net
|
6.4
|
|
8.8
|
|
13.6
|
|
15.7
|
|
18.0
|
|
||||||||||
|
Deferred income taxes
|
(89.1
|
)
|
(48.7
|
)
|
(56.3
|
)
|
(10.2
|
)
|
(4.3
|
)
|
||||||||||
|
Allowance for doubtful accounts
|
0.3
|
|
—
|
|
—
|
|
0.4
|
|
(1.3
|
)
|
||||||||||
|
Realized loss on interest rate swap agreements
|
—
|
|
—
|
|
—
|
|
2.8
|
|
51.5
|
|
||||||||||
|
Net loss (gain) on extinguishments of long-term debt
|
90.7
|
|
64.0
|
|
17.2
|
|
118.9
|
|
(2.0
|
)
|
||||||||||
|
Income from equity investments
|
(1.2
|
)
|
—
|
|
—
|
|
—
|
|
—
|
|
||||||||||
|
Changes in assets and liabilities
|
(41.8
|
)
|
(47.1
|
)
|
(9.4
|
)
|
(158.3
|
)
|
165.3
|
|
||||||||||
|
Other non-cash items
|
0.5
|
|
1.7
|
|
1.0
|
|
3.9
|
|
4.8
|
|
||||||||||
|
Net cash provided by operating activities
|
$
|
435.0
|
|
$
|
366.3
|
|
$
|
317.4
|
|
$
|
214.7
|
|
$
|
423.7
|
|
|||||
31
|
(4)
|
Non-GAAP net income is considered a non-GAAP financial measure. Generally, a non-GAAP financial measure is a numerical measure of a company’s performance, financial position or cash flows that either excludes or includes amounts that are not normally included or excluded in the most directly comparable measure calculated and presented in accordance with GAAP. Non-GAAP measures used by the Company may differ from similar measures used by other companies, even when similar terms are used to identify such measures. We believe that non-GAAP net income provides meaningful information regarding our operating performance and our prospects for the future. This supplemental measure excludes, among other things, charges related to the amortization of acquisition-related intangibles, non-cash equity-based compensation and gains and losses from the early extinguishment of debt. The following unaudited table sets forth a reconciliation of net income (loss) to non-GAAP net income for the periods presented:
|
|
Years Ended December 31,
|
||||||||||||||||||||
|
(in millions)
|
2014
|
2013
|
2012
|
2011
|
2010
|
|||||||||||||||
|
Net income (loss)
|
$
|
244.9
|
|
$
|
132.8
|
|
$
|
119.0
|
|
$
|
17.1
|
|
$
|
(29.2
|
)
|
|||||
|
Amortization of intangibles
(i)
|
161.2
|
|
161.2
|
|
163.7
|
|
165.7
|
|
166.8
|
|
||||||||||
|
Non-cash equity-based compensation
|
16.4
|
|
8.6
|
|
22.1
|
|
19.5
|
|
11.5
|
|
||||||||||
|
Litigation, net
(ii)
|
(0.6
|
)
|
(6.3
|
)
|
—
|
|
—
|
|
—
|
|
||||||||||
|
Net loss on extinguishments of long-term debt
|
90.7
|
|
64.0
|
|
17.2
|
|
118.9
|
|
(2.0
|
)
|
||||||||||
|
Interest expense adjustment related to extinguishments of long-term debt
(iii)
|
(1.1
|
)
|
(7.5
|
)
|
(3.3
|
)
|
(19.4
|
)
|
(0.7
|
)
|
||||||||||
|
IPO- and secondary-offering related expenses
(iv)
|
1.4
|
|
75.0
|
|
—
|
|
—
|
|
—
|
|
||||||||||
|
Debt-related refinancing costs
(v)
|
—
|
|
—
|
|
—
|
|
3.8
|
|
5.6
|
|
||||||||||
|
Aggregate adjustment for income taxes
(vi)
|
(103.0
|
)
|
(113.5
|
)
|
(71.6
|
)
|
(106.8
|
)
|
(66.3
|
)
|
||||||||||
|
Non-GAAP net income
|
$
|
409.9
|
|
$
|
314.3
|
|
$
|
247.1
|
|
$
|
198.8
|
|
$
|
85.7
|
|
|||||
|
(i)
|
Includes amortization expense for acquisition-related intangible assets, primarily customer relationships and trade names.
|
|
(ii)
|
Relates to unusual, non-recurring litigation matters.
|
|
(iii)
|
Reflects adjustments to interest expense resulting from debt extinguishments. Represents the difference between interest expense previously recognized under the effective interest method and actual interest paid.
|
|
(iv)
|
IPO- and secondary-offering related expenses consist of the following:
|
|
(in millions)
|
Years Ended December 31,
|
|||||||
|
2014
|
2013
|
|||||||
|
Acceleration charge for certain equity awards and related employer payroll taxes
|
$
|
—
|
|
$
|
40.7
|
|
||
|
RDU Plan cash retention pool accrual
|
—
|
|
7.5
|
|
||||
|
Management services agreement termination fee
|
—
|
|
24.4
|
|
||||
|
Other expenses
|
1.4
|
|
2.4
|
|
||||
|
IPO- and secondary-offering related expenses
|
$
|
1.4
|
|
$
|
75.0
|
|
||
|
(v)
|
Represents fees and costs expensed related to the December 2010 and March 2011 amendments to our prior senior secured term loan facility.
|
|
(vi)
|
Based on a normalized effective tax rate of 39.0%.
|
32
Unless otherwise indicated or the context otherwise requires, as used in this “Management’s Discussion and Analysis of Financial Condition and Results of Operations,” the terms “we,” “us,” “the Company,” “our,” “CDW” and similar terms refer to CDW Corporation and its subsidiaries. “Management’s Discussion and Analysis of Financial Condition and Results of Operations” should be read in conjunction with the audited consolidated financial statements and the related notes included elsewhere in this report. This discussion contains forward-looking statements that are subject to numerous risks and uncertainties. Actual results may differ materially from those contained in any forward-looking statements. See “Forward-Looking Statements” above.
Overview
CDW is a Fortune 500 company and a leading provider of integrated information technology (“IT”) solutions in the U.S. and Canada. We help our customer base of approximately
250,000
small, medium and large business, government, education and healthcare customers by delivering critical solutions to their increasingly complex IT needs. Our broad array of offerings ranges from discrete hardware and software products to integrated IT solutions such as mobility, security, data center optimization, cloud computing, virtualization and collaboration. We are technology "agnostic," with a product portfolio that includes more than
100,000
products from more than
1,000
brands. We provide our products and solutions through sales force and service delivery teams consisting of nearly
4,600
coworkers, including more than
1,800
field sellers, highly-skilled technology specialists and advanced service delivery engineers.
We are a leading U.S. sales channel partner for many original equipment manufacturers (“OEMs”) and software publishers (collectively, our “vendor partners”), whose products we sell or include in the solutions we offer. We believe we are an important extension of our vendor partners' sales and marketing capabilities, providing them with a cost-effective way to reach customers and deliver a consistent brand experience through our established end-market coverage and extensive customer access.
We have two reportable segments: Corporate, which is comprised primarily of private sector business customers, and Public, which is comprised of government agencies and education and healthcare institutions. Our Corporate segment is divided into a medium/large business customer channel, primarily serving customers with more than 100 employees, and a small business customer channel, primarily serving customers with up to 100 employees. We also have three other operating segments, CDW Advanced Services, Canada and Kelway TopCo Limited ("Kelway"), which do not meet the reportable segment quantitative thresholds and, accordingly, are combined together as “Other.” In November 2014, we acquired a 35% non-controlling equity interest in Kelway. See Note 15 to the accompanying audited consolidated financial statements included elsewhere in this report for additional details.
The CDW Advanced Services business consists primarily of customized engineering services delivered by technology specialists and engineers, and managed services that include Infrastructure as a Service (“IaaS”) offerings. Revenues from the sale of hardware, software, custom configuration and third-party provided services are recorded within our Corporate and Public segments.
We may sell all or only select products that our vendor partners offer. Each vendor partner agreement provides for specific terms and conditions, which may include one or more of the following: product return privileges, price protection policies, purchase discounts and vendor incentive programs, such as purchase or sales rebates and cooperative advertising reimbursements. We also resell software for major software publishers. Our agreements with software publishers allow the end-user customer to acquire software or licensed products and services. In addition to helping our customers determine the best software solutions for their needs, we help them manage their software agreements, including warranties and renewals. A significant portion of our advertising and marketing expenses is reimbursed through cooperative advertising reimbursement programs with our vendor partners. These programs are at the discretion of our vendor partners and are typically tied to sales or purchasing volumes or other commitments to be met by us within a specified period of time.
Trends and Key Factors Affecting our Financial Performance
We believe the following trends may have an important impact on our financial performance:
|
•
|
Our Public segment sales are impacted by government spending policies, budget priorities and revenue levels. An adverse change in any of these factors could cause our Public segment customers to reduce their purchases or to terminate or not renew contracts with us, which could adversely affect our business, results of operations or cash flows. Although our sales to the federal government are diversified across multiple
|
33
agencies and departments, they collectively accounted for approximately
7%
,
7%
and
10%
of our net sales for the years ended December 31, 2014, 2013 and 2012, respectively. In 2013, and through the second quarter of 2014, Public segment results were impacted by the combined and residual negative effects of sequestration, the partial shutdown of the federal government in 2013 and federal government budget uncertainty. However, with the finalization of federal budget allocations in early 2014, we began to see improvement in federal sales in the second quarter of 2014. The momentum continued through the third quarter of 2014 in conjunction with the federal fiscal year-end. This recovery continued into the fourth quarter of 2014 in connection with increased customer confidence that a federal budget for 2015 would be in place.
|
•
|
An important factor affecting our ability to generate sales and achieve our targeted operating results is the impact of general economic conditions on our customers’ willingness to spend on information technology. While macroeconomic uncertainty drove a cautious approach to customer spending in the early part of 2013, uncertainty began to dissipate in the back half of 2013 and continued to dissipate throughout 2014. Our sales to small business customers increased in 2014 as a result of the improvement in the macroeconomic environment. We will continue to closely monitor macroeconomic conditions during 2015. Uncertainties related to potential reductions in government spending, requirements associated with implementation of the Affordable Care Act, potential changes in tax and regulatory policy, weakening consumer and business confidence or increased unemployment could result in reduced or deferred spending on information technology products and services by our customers and result in increased competitive pricing pressures.
|
|
•
|
We believe that our customers’ transition to more complex technology solutions will continue to be an important growth area for us in the future. However, because the market for technology products and services is highly competitive, our success at capitalizing on this transition will be based on our ability to tailor specific solutions to customer needs, the quality and breadth of our product and service offerings, the knowledge and expertise of our sales force, price, product availability and speed of delivery. In 2014, market dynamics, including client device refresh and digital testing needs for K-12 students, drove customer demand for transactional products, primarily client devices, which include notebooks/mobile devices and desktops. Our diverse product suite of more than 100,000 products from over 1,000 leading and emerging brands and efficient, distribution capabilities enabled us to capitalize on this demand. While sales growth for transactional products was strong during the year, growth in solutions-focused products, including netcomm and software, also contributed to the increase in net sales during 2014. We expect the demand for client devices to moderate in 2015, both from the client device refresh slowing and a wind-down in preparation for digital testing requirements.
|
Key Business Metrics
Our management monitors a number of financial and non-financial measures and ratios on a regular basis in order to track the progress of our business and make adjustments as necessary. We believe that the most important of these measures and ratios include average daily sales, gross margin, operating margin, net income, Non-GAAP net income, net income per diluted share, Non-GAAP net income per diluted share, EBITDA and Adjusted EBITDA, return on invested capital, cash and cash equivalents, cash flow, net working capital, cash conversion cycle (defined to be days of sales outstanding in accounts receivable plus days of supply in inventory minus days of purchases outstanding in accounts payable, based on a rolling three-month average), debt levels including available credit and leverage ratios, sales per coworker and coworker turnover. These measures and ratios are compared to standards or objectives set by management, so that actions can be taken, as necessary, in order to achieve the standards and objectives. Non-GAAP net income, Non-GAAP net income per diluted share and Adjusted EBITDA are non-GAAP financial measures. We believe these measures provide helpful information with respect to the company’s operating performance and cash flows including our ability to meet our future debt service, capital expenditures, dividend payments, and working capital requirements. Adjusted EBITDA also provides helpful information as it is the primary measure used in certain financial covenants contained in our senior credit facilities. See "Selected Financial Data" included elsewhere in this report for the definitions of Non-GAAP net income and Adjusted EBITDA and reconciliations to net income.
34
The results of certain key business metrics are as follows:
|
(dollars in millions)
|
Years Ended December 31,
|
||||||||||
|
2014
|
2013
|
2012
|
|||||||||
|
Net sales
|
$
|
12,074.5
|
|
$
|
10,768.6
|
|
$
|
10,128.2
|
|
||
|
Gross profit
|
1,921.3
|
|
1,760.3
|
|
1,669.6
|
|
|||||
|
Income from operations
|
673.0
|
|
508.6
|
|
510.6
|
|
|||||
|
Net income
|
244.9
|
|
132.8
|
|
119.0
|
|
|||||
|
Non-GAAP net income
|
409.9
|
|
314.3
|
|
247.1
|
|
|||||
|
Adjusted EBITDA
|
907.0
|
|
808.5
|
|
766.6
|
|
|||||
|
Average daily sales
|
47.5
|
|
42.4
|
|
39.9
|
|
|||||
|
Net debt (defined as total debt minus cash and cash equivalents)
|
2,845.5
|
|
3,063.1
|
|
3,733.1
|
|
|||||
|
Cash conversion cycle (in days)
(1)
|
21
|
|
23
|
|
24
|
|
|||||
|
(1)
|
Cash conversion cycle is defined as days of sales outstanding in accounts receivable plus days of supply in inventory minus days of purchases outstanding in accounts payable, based on a rolling three-month average. The prior periods have been revised to conform to the current definition.
|
Results of Operations
Year Ended December 31, 2014 Compared to Year Ended December 31, 2013
The following table presents our results of operations, in dollars and as a percentage of net sales, for the years ended
December 31, 2014 and 2013
:
|
|
Year Ended December 31, 2014
|
Year Ended December 31, 2013
|
||||||||||||
|
|
Dollars in
Millions
|
Percentage of
Net Sales
|
Dollars in
Millions
|
Percentage of
Net Sales
|
||||||||||
|
Net sales
|
$
|
12,074.5
|
|
100.0
|
%
|
$
|
10,768.6
|
|
100.0
|
%
|
||||
|
Cost of sales
|
10,153.2
|
|
84.1
|
|
9,008.3
|
|
83.7
|
|
||||||
|
Gross profit
|
1,921.3
|
|
15.9
|
|
1,760.3
|
|
16.3
|
|
||||||
|
Selling and administrative expenses
|
1,110.3
|
|
9.2
|
|
1,120.9
|
|
10.4
|
|
||||||
|
Advertising expense
|
138.0
|
|
1.1
|
|
130.8
|
|
1.2
|
|
||||||
|
Income from operations
|
673.0
|
|
5.6
|
|
508.6
|
|
4.7
|
|
||||||
|
Interest expense, net
|
(197.3
|
)
|
(1.6
|
)
|
(250.1
|
)
|
(2.3
|
)
|
||||||
|
Net loss on extinguishments of long-term debt
|
(90.7
|
)
|
(0.8
|
)
|
(64.0
|
)
|
(0.6
|
)
|
||||||
|
Other income, net
|
2.7
|
|
—
|
|
1.0
|
|
—
|
|
||||||
|
Income before income taxes
|
387.7
|
|
3.2
|
|
195.5
|
|
1.8
|
|
||||||
|
Income tax expense
|
(142.8
|
)
|
(1.2
|
)
|
(62.7
|
)
|
(0.6
|
)
|
||||||
|
Net income
|
$
|
244.9
|
|
2.0
|
%
|
$
|
132.8
|
|
1.2
|
%
|
||||
35
Net sales
The following table presents our net sales by segment, in dollars and as a percentage of total net sales, and the year-over-year dollar and percentage change in net sales for the years ended
December 31, 2014 and 2013
:
|
Years Ended December 31,
|
||||||||||||||||||||
|
|
2014
|
2013
|
|
|||||||||||||||||
|
|
Dollars in
Millions
|
Percentage of
Total Net Sales
|
Dollars in
Millions
|
Percentage of
Total Net Sales
|
Dollar Change
|
Percent
Change (1) |
||||||||||||||
|
Corporate
|
$
|
6,475.5
|
|
53.6
|
%
|
$
|
5,960.1
|
|
55.3
|
%
|
$
|
515.4
|
|
8.6
|
%
|
|||||
|
Public
|
4,879.4
|
|
40.4
|
|
4,164.5
|
|
38.7
|
|
714.9
|
|
17.2
|
|
||||||||
|
Other
|
719.6
|
|
6.0
|
|
644.0
|
|
6.0
|
|
75.6
|
|
11.7
|
|
||||||||
|
Total net sales
|
$
|
12,074.5
|
|
100.0
|
%
|
$
|
10,768.6
|
|
100.0
|
%
|
$
|
1,305.9
|
|
12.1
|
%
|
|||||
|
(1)
|
There were
254
selling days in both the years ended
December 31, 2014 and 2013
.
|
The following table presents our net sales by customer channel for our Corporate and Public segments and the year-over-year dollar and percentage change in net sales for the years ended
December 31, 2014 and 2013
. Net sales of
$150.1 million
for the year ended
December 31, 2013
have been reclassified from the small business customer channel to the medium/large customer channel to conform to the current period presentation.
|
(dollars in millions)
|
Years Ended December 31,
|
|
|
||||||||||||
|
|
2014
|
2013
|
Dollar Change
|
Percent Change
|
|||||||||||
|
Corporate:
|
|||||||||||||||
|
Medium / Large
|
$
|
5,485.4
|
|
$
|
5,052.7
|
|
$
|
432.7
|
|
8.6
|
%
|
||||
|
Small Business
|
990.1
|
|
907.4
|
|
82.7
|
|
9.1
|
|
|||||||
|
Total Corporate
|
$
|
6,475.5
|
|
$
|
5,960.1
|
|
$
|
515.4
|
|
8.6
|
%
|
||||
|
Public:
|
|||||||||||||||
|
Government
|
$
|
1,449.4
|
|
$
|
1,250.6
|
|
$
|
198.8
|
|
15.9
|
%
|
||||
|
Education
|
1,824.0
|
|
1,449.0
|
|
375.0
|
|
25.9
|
|
|||||||
|
Healthcare
|
1,606.0
|
|
1,464.9
|
|
141.1
|
|
9.6
|
|
|||||||
|
Total Public
|
$
|
4,879.4
|
|
$
|
4,164.5
|
|
$
|
714.9
|
|
17.2
|
%
|
||||
Total net sales in
2014
increased
$1,305.9 million
, or
12.1%
, to
$12,074.5 million
, compared to
$10,768.6 million
in
2013
. There were
254
selling days for both the years ended
December 31, 2014 and 2013
. The increase in total net sales was primarily the result of continued growth in transactional products driven by notebooks/mobile devices and desktop computers as customers across all channels refreshed their client devices and K-12 customers continued to prepare for digital testing requirements, and the addition of more than 140 customer-facing coworkers, the majority in pre- and post-sale technical positions such as technical specialists and service delivery roles. Growth in solutions-focused products, including netcomm and software, also contributed to the increase in net sales during
2014
.
Corporate segment net sales in
2014
increased
$515.4 million
, or
8.6%
, compared to
2013
, driven by sales growth in the medium/large customer channel. Within our Corporate segment, net sales to medium/large customers increased
$432.7 million
, or
8.6%
, between years primarily due to customers refreshing their client devices and making continued investments in technology infrastructure and a continued focus on seller productivity. This increase was led by growth in notebooks/mobile devices, netcomm products, software, and desktop computers. Net sales to small business customers increased
$82.7 million
, or
9.1%
, between years, driven by growth in notebooks/mobile devices and desktop computers due to customers refreshing their client devices.
Public segment net sales in
2014
increased
$714.9 million
, or
17.2%
, between years, driven by strong performance across all channels. In 2013, and through the second quarter of 2014, Public segment results were impacted by the combined and residual negative effects of sequestration, the partial shutdown of the federal government in 2013 and federal government budget uncertainty. However, with the finalization of federal budget allocations in early 2014, we began to see improvement in federal sales in the second quarter of 2014 and saw continued momentum through the third quarter of 2014 in conjunction with
36
the federal fiscal year-end. This recovery continued into the fourth quarter of 2014 in connection with increased customer confidence that a federal budget for 2015 would be in place. Net sales to government customers increased
$198.8 million
, or
15.9%
. The increase in net sales to the federal government was led by increases in sales of notebooks/mobile devices and desktop computers. The increase in net sales to state/local government customers was led by growth in sales of notebooks/mobile devices, netcomm products, enterprise storage, and software due to a continued focus on public safety solutions. Net sales to education customers increased
$375.0 million
, or
25.9%
, between years, led by growth in net sales to K-12 customers, reflecting increased sales of notebooks/mobile devices to support digital testing requirements. Net sales to healthcare customers increased
$141.1 million
, or
9.6%
, between periods, driven by growth in netcomm products, notebook/mobile devices, and desktop computers.
Gross profit
Gross profit increased
$161.0 million
, or
9.1%
, to
$1,921.3 million
in
2014
, compared to
$1,760.3 million
in
2013
. As a percentage of total net sales, gross profit
decreased
40
basis points to
15.9%
during
2014
, down from
16.3%
in
2013
. Gross profit margin was negatively impacted 30 basis points by unfavorable price/mix changes within product margin, as transactional product categories such as notebooks/mobile devices and desktops experienced a higher rate of net sales growth than our overall net sales growth, accompanied by continuing product margin compression in these product categories. Additionally, we experienced an unfavorable impact of 10 basis points from vendor funding in 2014. Although vendor funding dollars increased, it represented a lower percentage of net sales in
2014
compared to
2013
. Vendor funding includes purchase discounts, volume rebates and cooperative advertising.
The gross profit margin may fluctuate based on various factors, including vendor incentive and inventory price protection programs, cooperative advertising funds classified as a reduction of cost of sales, product mix, net service contract revenue, commission revenue, pricing strategies, market conditions and other factors, any of which could result in changes in gross profit margins.
Selling and administrative expenses
Selling and administrative expenses
decreased
$10.6 million
, or
0.9%
, to
$1,110.3 million
in
2014
, compared to
$1,120.9 million
in
2013
. The overall decrease was largely driven by the absence of $74.3 million in costs incurred during 2013 related to the completion of our IPO. This decrease was partially offset by an increase of $31.4 million, or 14.3%, of certain coworker costs between years which was primarily due to higher compensation consistent with increased coworker count and attainment-based compensation accruals tied to annual performance. Total coworker count was 7,211, up 244 from 6,967 at
December 31, 2013
. In addition, sales payroll, including sales commissions and other variable compensation costs, increased $18.6 million, or 3.9% between years, consistent with higher sales and gross profit. Further offsetting the decrease in selling and administrative expenses was an increase in long-term compensation expense and equity compensation expense of $7.2 million during 2014.
As a percentage of total net sales, selling and administrative expenses
decreased
120
basis points to
9.2%
in
2014
,
down
from
10.4%
in
2013
. The decrease in selling and administrative expenses as a percentage of net sales was largely driven by a decline of 70 basis points in costs related to the IPO in
2013
. Sales payroll as a percentage of net sales also decreased 30 basis points during 2014 reflecting the lower cost to serve transactional sales compared to solutions-focused sales, consistent with our variable compensation cost structure.
Advertising expense
Advertising expense
increase
d
$7.2 million
, or
5.5%
, to
$138.0 million
in
2014
, compared to
$130.8 million
in
2013
. As a percentage of net sales, advertising expense remained relatively consistent at
1.1%
in
2014
, compared to
1.2%
in
2013
. The dollar
increase
in advertising expense was due to a continued focus on advertising our solutions and products, which reinforces our reputation as a leading IT solutions provider.
37
Income from operations
The following table presents income from operations by segment, in dollars and as a percentage of net sales, and the year-over-year percentage change in income from operations for the years ended
December 31, 2014 and 2013
:
|
|
Year Ended December 31, 2014
|
Year Ended December 31, 2013
|
|
||||||||||||||
|
|
Dollars in
Millions
|
Operating
Margin
Percentage
|
Dollars in
Millions
|
Operating
Margin
Percentage
|
Percent Change
in Income
from Operations
|
||||||||||||
|
Segments:
(1)
|
|||||||||||||||||
|
Corporate
|
$
|
439.8
|
|
6.8
|
%
|
$
|
363.3
|
|
6.1
|
%
|
21.1
|
%
|
|||||
|
Public
|
313.2
|
|
6.4
|
|
246.5
|
|
5.9
|
|
27.1
|
|
|||||||
|
Other
|
32.9
|
|
4.6
|
|
27.2
|
|
4.2
|
|
20.9
|
|
|||||||
|
Headquarters
(2)
|
(112.9
|
)
|
nm*
|
|
(128.4
|
)
|
nm*
|
|
12.0
|
|
|||||||
|
Total income from operations
|
$
|
673.0
|
|
5.6
|
%
|
$
|
508.6
|
|
4.7
|
%
|
32.3
|
%
|
|||||
* Not meaningful
|
(1)
|
Segment income (loss) from operations includes the segment’s direct operating income (loss) and allocations for Headquarters’ costs, allocations for income and expenses from logistics services, certain inventory adjustments and volume rebates and cooperative advertising from vendors.
|
|
(2)
|
Includes certain Headquarters’ function costs that are not allocated to the segments.
|
Income from operations was
$673.0 million
in
2014
, an increase of
$164.4 million
, or
32.3%
, compared to
$508.6 million
in
2013
. The increase in income from operations was driven by higher net sales and gross profit and the absence of IPO-related costs. Total operating margin percentage increased 90 basis points to
5.6%
in
2014
, from
4.7%
in
2013
. Operating margin percentage benefited from the decrease in selling and administrative expenses as a percentage of net sales, which was driven by the absence of $74.3 million in costs related to our IPO in 2013, and was partially offset by a decrease in gross profit margin.
Corporate segment income from operations was
$439.8 million
in
2014
, an increase of
$76.5 million
, or
21.1%
, compared to
$363.3 million
in
2013
. This increase was primarily driven by higher net sales and gross profit. Corporate segment operating margin percentage increased 70 basis points to
6.8%
in
2014
, from
6.1%
in
2013
. Operating margin percentage benefited from the decrease in selling and administrative expenses as a percentage of net sales, which was driven by the absence of costs related to our IPO in 2013, and was partially offset by a decrease in gross profit margin.
Public segment income from operations was
$313.2 million
in
2014
, an increase of
$66.7 million
, or
27.1%
, compared to
$246.5 million
in
2013
. This increase was primarily driven by higher net sales and gross profit. Public segment operating margin percentage increased 50 basis points to
6.4%
in
2014
, from
5.9%
in
2013
. Operating margin percentage benefited from the decrease in selling and administrative expenses as a percentage of net sales, which was driven by the absence of costs related to our IPO in 2013, and was partially offset by a decrease in gross profit margin.
Interest expense, net
At
December 31, 2014
, our outstanding long-term debt totaled
$3,190.0 million
, compared to
$3,251.2 million
at
December 31, 2013
. We reduced our long-term debt during 2014 through refinancing activities to redeem our higher interest debt. Net interest expense in
2014
was
$197.3 million
, a decrease of
$52.8 million
compared to
$250.1 million
in
2013
. This decrease was primarily due to lower debt balances and effective interest rates for
2014
compared to
2013
as a result of debt repayments and refinancing activities completed during
2014
and
2013
. See "Liquidity and Capital Resources" below for a description of the significant debt refinancings in 2014.
Net loss on extinguishments of long-term debt
During 2014, we recorded a net loss on extinguishments of long-term debt of
$90.7 million
compared to
$64.0 million
in 2013.
In December 2014, we redeemed
$541.4 million
aggregate principal amount of the 2019 Senior Notes. We recorded a
loss on extinguishment of debt of
$36.9 million
, representing the difference between the redemption price and the net carrying
amount of the purchased debt, adjusted for a portion of the unamortized deferred financing costs and unamortized premium.
38
In September 2014, we redeemed
$234.7 million
aggregate principal amount of the 2019 Senior Notes. We recorded a
loss on extinguishment of debt of
$22.1 million
, representing the difference between the redemption price and the net carrying
amount of the purchased debt, adjusted for a portion of the unamortized deferred financing costs and unamortized premium.
In August 2014, we redeemed all of the remaining
$325.0 million
aggregate principal amount of the 8.0% Senior Secured Notes due 2018 ("Senior Secured Notes"). We recorded a loss on extinguishment of debt of
$23.7 million
, representing the difference between the redemption price and the net carrying amount of the purchased debt, adjusted for the remaining unamortized deferred financing costs.
In June 2014, we entered into the Senior Secured Asset-Based Revolving Credit Facility ("Revolving Loan"), a new five-year
$1,250.0 million
senior secured asset-based revolving credit facility. The Revolving Loan replaces our previous revolving loan credit facility that was to mature on June 24, 2016. In connection with the termination of the previous facility, we recorded a loss on extinguishment of long-term debt of
$0.4 million
, representing a write-off of a portion of unamortized deferred financing costs.
In May 2014, we redeemed all of the remaining
$42.5 million
aggregate principal amount of the 12.535% Senior Subordinated Exchange Notes due 2017 ("Senior Subordinated Notes"). We recorded a loss on extinguishment of long-term debt of
$2.2 million
, representing the difference between the redemption price and the net carrying amount of the purchased debt, adjusted for the remaining unamortized deferred financing costs.
In March 2014, we repurchased
$25.0 million
aggregate principal amount of the 2019 Senior Notes. We recorded a
loss on extinguishment of long-term debt of
$2.7 million
, representing the difference between the repurchase price and the net
carrying amount of the purchased debt, adjusted for a portion of the unamortized deferred financing costs.
In January and February 2014, we redeemed
$50.0 million
aggregate principal amounts of the Senior Subordinated Notes. We recorded a loss on extinguishment of long-term debt of
$2.7 million
, representing the difference between the redemption price and the net carrying amount of the purchased debt, adjusted for a portion of the unamortized deferred financing costs.
In October 2013, we redeemed
$155.0 million
aggregate principal amount of the Senior Subordinated Notes. In connection with this redemption, we recorded a loss on extinguishment of long-term debt of
$8.5 million
, representing the difference between the redemption price and the net carrying amount of the purchased debt, adjusted for a portion of the unamortized deferred financing costs.
In August 2013, we redeemed
$324.0 million
aggregate principal amount of the Senior Subordinated Notes. In connection with this redemption, we recorded a loss on extinguishment of long-term debt of
$24.6 million
, representing the difference between the redemption price and the net carrying amount of the purchased debt, adjusted for a portion of the unamortized deferred financing costs.
In July 2013, we redeemed
$175.0 million
aggregate principal amount of the Senior Secured Notes. In connection with this redemption, we recorded a loss on extinguishment of long-term debt of
$16.7 million
, representing the difference between the redemption price and the net carrying amount of the purchased debt, adjusted for a portion of the unamortized deferred financing costs.
In April 2013, we entered into a new seven-year,
$1,350.0 million
aggregate principal amount Senior Secured Term Loan Facility ("Term Loan"). Substantially all of the proceeds were used to repay the
$1,299.5 million
outstanding aggregate principal amount of the prior senior secured term loan facility. In connection with this refinancing, we recorded a loss on extinguishment of long-term debt of
$10.3 million
, representing a write-off of the remaining unamortized deferred financing costs related to the prior senior secured term loan facility.
In March 2013, we redeemed
$50.0 million
aggregate principal amount of the Senior Subordinated Notes. We recorded a loss on extinguishment of long-term debt of
$3.9 million
, representing the difference between the redemption price and the net carrying amount of the purchased debt, adjusted for a portion of the unamortized deferred financing costs.
39
Income tax expense
Income tax expense was
$142.8 million
in
2014
, compared to
$62.7 million
in
2013
. The effective income tax rate, expressed by calculating income tax expense or benefit as a percentage of income before income taxes, was
36.8%
and
32.1%
for
2014
and
2013
, respectively.
For
2014
, the effective tax rate differed from the U.S. federal statutory rate primarily due to state income taxes, including current year state income tax credits. For
2013
, the effective tax rate differed from the U.S. federal statutory rate primarily due to state income taxes, including current year state income tax credits and an adjustment to deferred state income taxes due to changes in apportionment factors. The higher effective tax rate for
2014
as compared to
2013
was primarily attributable to the favorable impact of changes in state tax apportionment factors had on deferred state income taxes in 2013 and a lower rate impact of state income tax credits due to the increase in income before income taxes in 2014.
Net income
Net income was
$244.9 million
in
2014
, compared to
$132.8 million
in
2013
. Significant factors and events causing the net changes between the periods are discussed above.
Non-GAAP net income
Non-GAAP net income was
$409.9 million
for the year ended December 31,
2014
, an increase of
$95.6 million
, or
30.4%
, compared to
$314.3 million
for the year ended December 31,
2013
.
We have included a reconciliation of Non-GAAP net income for the years ended
December 31, 2014 and 2013
below. Non-GAAP net income excludes, among other things, charges related to the amortization of acquisition-related intangible assets, non-cash equity-based compensation, and gains and losses from the early extinguishment of debt. Non-GAAP net income is considered a non-GAAP financial measure. Generally, a non-GAAP financial measure is a numerical measure of a company's performance, financial position, or cash flows that either excludes or includes amounts that are not normally included or excluded in the most directly comparable measure calculated and presented in accordance with GAAP. Non-GAAP measures used by the Company may differ from similar measures used by other companies, even when similar terms are used to identify such measures. We believe that Non-GAAP net income provides helpful information with respect to our operating performance and cash flows including our ability to meet our future debt service, capital expenditures and working capital requirements.
40
|
(in millions)
|
Years Ended December 31,
|
|||||||
|
2014
|
2013
|
|||||||
|
Net income
|
$
|
244.9
|
|
$
|
132.8
|
|
||
|
Amortization of intangibles
(1)
|
161.2
|
|
161.2
|
|
||||
|
Non-cash equity-based compensation
|
16.4
|
|
8.6
|
|
||||
|
Litigation, net
(2)
|
(0.6
|
)
|
(6.3
|
)
|
||||
|
Net loss on extinguishments of long-term debt
|
90.7
|
|
64.0
|
|
||||
|
Interest expense adjustment related to extinguishments of long-term debt
(3)
|
(1.1
|
)
|
(7.5
|
)
|
||||
|
IPO- and secondary-offering related expenses
(4)
|
1.4
|
|
75.0
|
|
||||
|
Aggregate adjustment for income taxes
(5)
|
(103.0
|
)
|
(113.5
|
)
|
||||
|
Non-GAAP net income
|
$
|
409.9
|
|
$
|
314.3
|
|
||
|
(1)
|
Includes amortization expense for acquisition-related intangible assets, primarily customer relationships and trade names.
|
|
(2)
|
Relates to unusual, non-recurring litigation matters.
|
|
(3)
|
Reflects adjustments to interest expense resulting from debt extinguishments. Represents the difference between interest expense previously recognized under the effective interest method and actual interest paid.
|
|
(4)
|
IPO- and secondary-offering related expenses consist of the following:
|
|
(in millions)
|
Years Ended December 31,
|
|||||||
|
2014
|
2013
|
|||||||
|
Acceleration charge for certain equity awards and related employer payroll taxes
|
$
|
—
|
|
$
|
40.7
|
|
||
|
RDU Plan cash retention pool accrual
|
—
|
|
7.5
|
|
||||
|
Management services agreement termination fee
|
—
|
|
24.4
|
|
||||
|
Other expenses
|
1.4
|
|
2.4
|
|
||||
|
IPO- and secondary-offering related expenses
|
$
|
1.4
|
|
$
|
75.0
|
|
||
|
(5)
|
Based on a normalized effective tax rate of 39.0%.
|
Adjusted EBITDA
Adjusted EBITDA was
$907.0 million
for the year ended
December 31, 2014
, an increase of
$98.5 million
, or
12.2%
, compared to
$808.5 million
for the year ended
December 31, 2013
. As a percentage of net sales, Adjusted EBITDA was
7.5%
for both the years ended
December 31, 2014 and 2013
.
We have included a reconciliation of EBITDA and Adjusted EBITDA for the years ended
December 31, 2014 and 2013
in the tables below. EBITDA is defined as consolidated net income before interest expense, income tax expense, depreciation and amortization. Adjusted EBITDA, which is a measure defined in our credit agreements, means EBITDA adjusted for certain items which are described in the table below. Both EBITDA and Adjusted EBITDA are considered non-GAAP financial measures. Generally, a non-GAAP financial measure is a numerical measure of a company's performance, financial position or cash flows that either excludes or includes amounts that are not normally included or excluded in the most directly comparable measure calculated and presented in accordance with GAAP. Non-GAAP measures used by the Company may differ from similar measures used by other companies, even when similar terms are used to identify such measures. We believe that EBITDA and Adjusted EBITDA provide helpful information with respect to our operating performance and cash flows including our ability to meet our future debt service, capital expenditures and working capital requirements. Adjusted EBITDA also provides helpful information as it is the primary measure used in certain financial covenants contained in our credit agreements.
41
|
(in millions)
|
Years Ended December 31,
|
||||||
|
|
2014
|
2013
|
|||||
|
Net income
|
$
|
244.9
|
|
$
|
132.8
|
|
|
|
Depreciation and amortization
|
207.9
|
|
208.2
|
|
|||
|
Income tax expense
|
142.8
|
|
62.7
|
|
|||
|
Interest expense, net
|
197.3
|
|
250.1
|
|
|||
|
EBITDA
|
792.9
|
|
653.8
|
|
|||
|
Adjustments:
|
|||||||
|
Non-cash equity-based compensation
|
16.4
|
|
8.6
|
|
|||
|
Sponsor fee
|
—
|
|
2.5
|
|
|||
|
Net loss on extinguishments of long-term debt
|
90.7
|
|
64.0
|
|
|||
|
Litigation, net
(1)
|
(0.9
|
)
|
(4.1
|
)
|
|||
|
IPO- and secondary-offering related expenses
(2)
|
1.4
|
|
75.0
|
|
|||
|
Other adjustments
(3)
|
6.5
|
|
8.7
|
|
|||
|
Total adjustments
|
114.1
|
|
154.7
|
|
|||
|
Adjusted EBITDA
|
$
|
907.0
|
|
$
|
808.5
|
|
|
|
(1)
|
Relates to unusual, non-recurring litigation matters.
|
|
(2)
|
As defined under
Non-GAAP net income
above.
|
|
(3)
|
Other adjustments primarily include certain retention costs and equity investment income.
|
The following table sets forth a reconciliation of EBITDA to net cash provided by operating activities for the years ended December 31,
2014
and
2013
.
|
|
Years Ended December 31,
|
|||||||
|
(in millions)
|
2014
|
2013
|
||||||
|
EBITDA
|
$
|
792.9
|
|
$
|
653.8
|
|
||
|
Depreciation and amortization
|
(207.9
|
)
|
(208.2
|
)
|
||||
|
Income tax expense
|
(142.8
|
)
|
(62.7
|
)
|
||||
|
Interest expense, net
|
(197.3
|
)
|
(250.1
|
)
|
||||
|
Net income
|
244.9
|
|
132.8
|
|
||||
|
Depreciation and amortization
|
207.9
|
|
208.2
|
|
||||
|
Equity-based compensation expense
|
16.4
|
|
46.6
|
|
||||
|
Deferred income taxes
|
(89.1
|
)
|
(48.7
|
)
|
||||
|
Amortization of deferred financing costs, debt premium, and debt discount, net
|
6.4
|
|
8.8
|
|
||||
|
Net loss on extinguishments of long-term debt
|
90.7
|
|
64.0
|
|
||||
|
Other
|
(0.4
|
)
|
1.7
|
|
||||
|
Changes in assets and liabilities
|
(41.8
|
)
|
(47.1
|
)
|
||||
|
Net cash provided by operating activities
|
$
|
435.0
|
|
$
|
366.3
|
|
||
42
Year Ended December 31, 2013 Compared to Year Ended December 31, 2012
The following table presents our results of operations, in dollars and as a percentage of net sales, for the years ended December 31, 2013 and 2012:
|
|
Year Ended December 31, 2013
|
Year Ended December 31, 2012
|
||||||||||||
|
|
Dollars in
Millions
|
Percentage of
Net Sales
|
Dollars in
Millions
|
Percentage of
Net Sales
|
||||||||||
|
Net sales
|
$
|
10,768.6
|
|
100.0
|
%
|
$
|
10,128.2
|
|
100.0
|
%
|
||||
|
Cost of sales
|
9,008.3
|
|
83.7
|
|
8,458.6
|
|
83.5
|
|
||||||
|
Gross profit
|
1,760.3
|
|
16.3
|
|
1,669.6
|
|
16.5
|
|
||||||
|
Selling and administrative expenses
|
1,120.9
|
|
10.4
|
|
1,029.5
|
|
10.2
|
|
||||||
|
Advertising expense
|
130.8
|
|
1.2
|
|
129.5
|
|
1.3
|
|
||||||
|
Income from operations
|
508.6
|
|
4.7
|
|
510.6
|
|
5.0
|
|
||||||
|
Interest expense, net
|
(250.1
|
)
|
(2.3
|
)
|
(307.4
|
)
|
(3.0
|
)
|
||||||
|
Net loss on extinguishments of long-term debt
|
(64.0
|
)
|
(0.6
|
)
|
(17.2
|
)
|
(0.2
|
)
|
||||||
|
Other income, net
|
1.0
|
|
—
|
|
0.1
|
|
—
|
|
||||||
|
Income before income taxes
|
195.5
|
|
1.8
|
|
186.1
|
|
1.8
|
|
||||||
|
Income tax expense
|
(62.7
|
)
|
(0.6
|
)
|
(67.1
|
)
|
(0.7
|
)
|
||||||
|
Net income
|
$
|
132.8
|
|
1.2
|
%
|
$
|
119.0
|
|
1.1
|
%
|
||||
Net sales
The following table presents our net sales by segment, in dollars and as a percentage of total net sales, and the year-over-year dollar and percentage change in net sales for the years ended December 31, 2013 and 2012:
|
Years Ended December 31,
|
||||||||||||||||||||
|
|
2013
|
2012
|
|
|||||||||||||||||
|
|
Dollars in
Millions
|
Percentage of
Total Net Sales
|
Dollars in
Millions
|
Percentage of
Total Net Sales
|
Dollar Change
|
Percent
Change (1) |
||||||||||||||
|
Corporate
|
$
|
5,960.1
|
|
55.3
|
%
|
$
|
5,512.8
|
|
54.4
|
%
|
$
|
447.3
|
|
8.1
|
%
|
|||||
|
Public
|
4,164.5
|
|
38.7
|
|
4,023.0
|
|
39.7
|
|
141.5
|
|
3.5
|
|
||||||||
|
Other
|
644.0
|
|
6.0
|
|
592.4
|
|
5.9
|
|
51.6
|
|
8.7
|
|
||||||||
|
Total net sales
|
$
|
10,768.6
|
|
100.0
|
%
|
$
|
10,128.2
|
|
100.0
|
%
|
$
|
640.4
|
|
6.3
|
%
|
|||||
|
(1)
|
There were 254 selling days in both the years ended December 31, 2013 and 2012.
|
43
The following table presents our net sales by customer channel for our Corporate and Public segments and the year-over-year dollar and percentage change in net sales for the years ended December 31, 2013 and 2012. Net sales of
$150.1 million
and $124.2 million for the years ended
December 31, 2013
and 2012 have been reclassified from the small business customer channel to the medium/large customer channel to conform to the 2014 presentation.
|
(in millions)
|
Years Ended December 31,
|
|
|
||||||||||||
|
|
2013
|
2012
|
Dollar Change
|
Percent Change
|
|||||||||||
|
Corporate:
|
|||||||||||||||
|
Medium / Large
|
$
|
5,052.7
|
|
$
|
4,572.7
|
|
$
|
480.0
|
|
10.5
|
%
|
||||
|
Small Business
|
907.4
|
|
940.1
|
|
(32.7
|
)
|
(3.5
|
)
|
|||||||
|
Total Corporate
|
$
|
5,960.1
|
|
$
|
5,512.8
|
|
$
|
447.3
|
|
8.1
|
%
|
||||
|
Public:
|
|||||||||||||||
|
Government
|
$
|
1,250.6
|
|
$
|
1,394.1
|
|
$
|
(143.5
|
)
|
(10.3
|
)%
|
||||
|
Education
|
1,449.0
|
|
1,192.3
|
|
256.7
|
|
21.5
|
|
|||||||
|
Healthcare
|
1,464.9
|
|
1,436.6
|
|
28.3
|
|
2.0
|
|
|||||||
|
Total Public
|
$
|
4,164.5
|
|
$
|
4,023.0
|
|
$
|
141.5
|
|
3.5
|
%
|
||||
Total net sales in 2013 increased
$640.4 million
, or
6.3%
, to
$10,768.6 million
, compared to
$10,128.2 million
in 2012. There were 254 selling days for both the years ended December 31, 2013 and 2012. The increase in total net sales was primarily the result of growth in hardware and software, a more tenured sales force, a continued focus on seller productivity across all areas of the organization and the addition of nearly 120 customer-facing coworkers, the majority in pre- and post-sale technical positions such as technical specialists and service delivery roles. Our total net sales growth for the year ended December 31, 2013 reflected growth in notebooks/mobile devices, netcomm products and software. Software gains were driven by growth in security, document management software and network management software, partially offset by a decline in application suites.
Corporate segment net sales in 2013 increased
$447.3 million
, or
8.1%
, compared to 2012, driven by sales growth in the medium/large customer channel. Within our Corporate segment, net sales to medium/large customers increased
10.5%
between years primarily due to certain of these customers increasing their IT spending, a more tenured sales force, a continued focus on seller productivity and additional customer-facing coworkers, the majority in pre- and post-sale technical positions such as technical specialists and service delivery roles. This increase was led by unit volume growth in netcomm products and growth in notebooks/mobile devices and software. Partially offsetting the growth in the medium/large customer channel was a
3.5%
decline in net sales to small business customers, due to certain of these customers taking a more cautious approach to spending as macroeconomic and regulatory uncertainty impacted decision-making. This decrease was led by unit volume declines in notebooks/mobile devices, partially offset by growth in netcomm products.
Public segment net sales in 2013 increased
$141.5 million
, or
3.5%
, between years, driven by strong performance in the education customer channel. Net sales to education customers increased
$256.7 million
, or
21.5%
, between years, led by growth in net sales to K-12 customers, reflecting increased sales of notebooks/mobile devices to support new standardized digital testing requirements that will take effect in 2014. Net sales to government customers decreased
$143.5 million
, or
10.3%
, in 2013 compared to 2012 due to reductions and delays in federal government spending following sequestration, uncertainty over future budget negotiations and the partial shutdown of the federal government. The government customer channel net sales decline was led by decreases in sales of enterprise storage and notebooks/mobile devices, partially offset by growth in software. Net sales to healthcare customers increased
$28.3 million
, or
2.0%
, between years, driven by growth in notebooks/mobile devices and desktop computers.
Gross profit
Gross profit increased
$90.7 million
, or
5.4%
, to
$1,760.3 million
in 2013, compared to
$1,669.6 million
in 2012. As a percentage of total net sales, gross profit decreased 20 basis points to
16.3%
in 2013, down from
16.5%
in 2012. Gross profit margin was negatively impacted 30 basis points by unfavorable price/mix changes within product margin, as we experienced product margin compression in transactional product categories such as desktops and notebooks. Partially offsetting this decrease was an increase of 10 basis points due to a higher mix of net service contract revenue. Net service contract revenue, including items such as third-party services and warranties, has a positive impact on gross profit margin as our cost paid to the vendor or third-party service provider is recorded as a reduction to net sales, resulting in net sales being equal to the gross profit on the transaction.
44
The gross profit margin may fluctuate based on various factors, including vendor incentive and inventory price protection programs, cooperative advertising funds classified as a reduction of cost of sales, product mix, net service contract revenue, commission revenue, pricing strategies, market conditions and other factors, any of which could result in changes in gross profit margins.
Selling and administrative expenses
Selling and administrative expenses increased
$91.3 million
, or
8.9%
, to
$1,120.9 million
in 2013, compared to
$1,029.5 million
in 2012. As a percentage of total net sales, selling and administrative expenses increased 20 basis points to
10.4%
in 2013, up from
10.2%
in 2012. Sales payroll, including sales commissions and other variable compensation costs, increased $28.9 million, or 6.4%, between years, consistent with higher sales and gross profit. Additionally, selling and administrative expenses for 2013 included IPO- and secondary-offering related expenses of $75.0 million, as follows:
|
•
|
Pre-tax charges of $36.7 million related to the acceleration of the expense recognition for certain equity awards and $4.0 million for the related employer payroll taxes. See Note 10 of the accompanying audited consolidated financial statements for additional discussion of the impact of the IPO on our equity awards.
|
|
•
|
A pre-tax charge of $24.4 million related to the payment of a termination fee to affiliates of the Sponsors in connection with the termination of the management services agreement with such entities.
|
|
•
|
A pre-tax charge of $7.5 million related to compensation expense in connection with the Restricted Debt Unit Plan. See Note 12 of the accompanying audited consolidated financial statements for additional discussion of this charge.
|
|
•
|
Other IPO- and secondary-offering related expenses of $2.4 million.
|
We did not record any IPO- or secondary-offering related expenses during 2012. Partially offsetting these increases in 2013 was the favorable resolution of a class action legal proceeding in which we were a claimant, which reduced selling and administrative expenses by $10.4 million in 2013 compared to 2012. Total coworker count increased by 163 coworkers, from 6,804 at December 31, 2012, to 6,967 at December 31, 2013.
Advertising expense
Advertising expense increased
$1.3 million
, or
0.9%
, to
$130.8 million
in 2013, compared to
$129.5 million
in 2012. As a percentage of net sales, advertising expense was
1.2%
in 2013, compared to
1.3%
in 2012. The dollar increase in advertising expense was due to a continued focus on advertising our solutions and products, which reinforces our reputation as a leading IT solutions provider.
Income from operations
The following table presents income from operations by segment, in dollars and as a percentage of net sales, and the year-over-year percentage change in income from operations for the years ended December 31, 2013 and 2012:
|
|
Year Ended December 31, 2013
|
Year Ended December 31, 2012
|
|
||||||||||||||
|
|
Dollars in
Millions
|
Operating
Margin
Percentage
|
Dollars in
Millions
|
Operating
Margin
Percentage
|
Percent Change
in Income
from Operations
|
||||||||||||
|
Segments:
(1)
|
|||||||||||||||||
|
Corporate
|
$
|
363.3
|
|
6.1
|
%
|
$
|
349.0
|
|
6.3
|
%
|
4.1
|
%
|
|||||
|
Public
|
246.5
|
|
5.9
|
|
246.7
|
|
6.1
|
|
(0.1
|
)
|
|||||||
|
Other
|
27.2
|
|
4.2
|
|
18.6
|
|
3.1
|
|
46.3
|
|
|||||||
|
Headquarters
(2)
|
(128.4
|
)
|
nm*
|
|
(103.7
|
)
|
nm*
|
|
(23.8
|
)
|
|||||||
|
Total income from operations
|
$
|
508.6
|
|
4.7
|
%
|
$
|
510.6
|
|
5.0
|
%
|
(0.4
|
)%
|
|||||
* Not meaningful
|
(1)
|
Segment income (loss) from operations includes the segment’s direct operating income (loss) and allocations for Headquarters’ costs, allocations for logistics services, certain inventory adjustments, and volume rebates and cooperative advertising from vendors.
|
|
(2)
|
Includes Headquarters’ function costs that are not allocated to the segments.
|
45
Income from operations was
$508.6 million
in 2013, a decrease of $2.0 million, or
0.4%
, compared to
$510.6 million
in 2012. The decrease in income from operations was driven by higher selling and administrative expenses primarily resulting from $75.0 million of IPO- and secondary-offering related expenses recorded during 2013, mostly offset by higher net sales and gross profit. Total operating margin percentage decreased 30 basis points to
4.7%
in 2013, from
5.0%
in 2012. Operating margin percentage was negatively impacted by the increase in selling and administrative expenses as a percentage of net sales and gross profit margin compression, partially offset by a decrease in advertising expense as a percentage of net sales.
Corporate segment income from operations was
$363.3 million
in 2013, an increase of $14.3 million, or
4.1%
, compared to
$349.0 million
in 2012. Corporate segment operating margin percentage decreased 20 basis points to
6.1%
in
2013, from
6.3%
in 2012. Results for 2013 included $26.4 million of IPO- and secondary-offering related expenses, which reduced Corporate segment operating margin by 40 basis points. Higher sales and gross profit dollars offset the effect of IPO- and secondary-offering related expenses on income from operations for 2013.
Public segment income from operations was
$246.5 million
in 2013, a decrease of $0.2 million, or 0.1%, compared to
$246.7 million
in 2012. Public segment operating margin percentage decreased 20 basis points to
5.9%
in
2013, from
6.1%
in 2012. Results for 2013 included $14.4 million of IPO- and secondary-offering related expenses, which reduced Public segment operating margin by 30 basis points. Higher sales and gross profit dollars nearly offset the effect of IPO- and secondary-offering related expenses on income from operations for 2013.
Interest expense, net
At
December 31, 2013
, our outstanding long-term debt totaled $3,251.2 million, compared to $3,771.0 million at December 31, 2012. We reduced long-term debt throughout the year primarily through the use of a portion of the net proceeds from the IPO and cash flows provided by operating activities. Net interest expense in 2013 was
$250.1 million
, a decrease of
$57.3 million
compared to
$307.4 million
in 2012. This decrease was primarily due to lower debt balances and effective interest rates for 2013 compared to 2012 as a result of debt repayments and refinancing activities completed during 2012 and 2013.
Net loss on extinguishments of long-term debt
During
2013
, we recorded a net loss on extinguishments of long-term debt of
$64.0 million
compared to
$17.2 million
in
2012
.
In October 2013, we redeemed $155.0 million aggregate principal amount of the Senior Subordinated Notes. In connection with this redemption, we recorded a loss on extinguishment of long-term debt of $8.5 million, representing the difference between the redemption price and the net carrying amount of the purchased debt, adjusted for a portion of the unamortized deferred financing costs.
In August 2013, we redeemed $324.0 million aggregate principal amount of the Senior Subordinated Notes. In connection with this redemption, we recorded a loss on extinguishment of long-term debt of $24.6 million, representing the difference between the redemption price and the net carrying amount of the purchased debt, adjusted for a portion of the unamortized deferred financing costs.
In July 2013, we redeemed $175.0 million aggregate principal amount of the Senior Secured Notes. In connection with this redemption, we recorded a loss on extinguishment of long-term debt of $16.7 million, representing the difference between the redemption price and the net carrying amount of the purchased debt, adjusted for a portion of the unamortized deferred financing costs.
In April 2013, we entered into a new seven-year, $1,350.0 million aggregate principal amount Term Loan. Substantially all of the proceeds were used to repay the $1,299.5 million outstanding aggregate principal amount of the prior senior secured term loan facility. In connection with this refinancing, we recorded a loss on extinguishment of long-term debt of $10.3 million, representing a write-off of the remaining unamortized deferred financing costs related to the prior senior secured term loan facility.
In March 2013, we redeemed $50.0 million aggregate principal amount of the Senior Subordinated Notes. We recorded a loss on extinguishment of long-term debt of $3.9 million, representing the difference between the redemption price and the net carrying amount of the purchased debt, adjusted for a portion of the unamortized deferred financing costs.
In December 2012, we redeemed $100.0 million aggregate principal amount of the Senior Subordinated Notes. We recorded a loss on extinguishment of long-term debt of $7.8 million representing the difference between the redemption price and the net carrying amount of the purchased debt, adjusted for a portion of the unamortized deferred financing costs.
46
In February and March 2012, we purchased or redeemed the remaining $129.0 million of 11.0% Senior Exchange Notes due 2015 and 11.5%/12.25% Senior PIK Election Exchange Notes due 2015 (together, the "Senior Notes due 2015"), funded with the issuance of an additional $130.0 million of Senior Notes due 2019. As a result, we recorded a loss on extinguishment of long-term debt of $9.4 million, representing the difference between the purchase or redemption price of the Senior Notes due 2015 and the net carrying amount of the purchased debt, adjusted for the remaining unamortized deferred financing costs.
Income tax expense
Income tax expense was
$62.7 million
in
2013
, compared to
$67.1 million
in
2012
. The effective income tax rate was
32.1%
and
36.0%
for
2013
and
2012
, respectively.
For
2013
, the effective tax rate differed from the U.S. federal statutory rate primarily due to state income taxes, including current year state income tax credits and an adjustment to deferred state income taxes due to changes in apportionment factors. For
2012
, the effective tax rate differed from the U.S. federal statutory rate primarily due to favorable adjustments to state tax credits which were partially offset by the unfavorable impact of adjustments to deferred state income taxes due to changes in state tax laws and non-deductible expenses, primarily equity-based compensation and meals and entertainment. The lower effective tax rate for
2013
as compared to
2012
was primarily driven by the favorable impact of adjustments to deferred state income taxes due to changes in state tax apportionment factors and lower non-deductible expenses.
Net income
Net income was
$132.8 million
in 2013, compared to
$119.0 million
in 2012. Significant factors and events causing the net changes between the periods are discussed above.
Non-GAAP net income
Non-GAAP net income was
$314.3 million
for the year ended December 31, 2013, an increase of
$67.2 million
, or
27.2%
, compared to
$247.1 million
for the year ended December 31, 2012.
We have included a reconciliation of Non-GAAP net income for the years ended December 31, 2013 and 2012 below. Non-GAAP net income excludes, among other things, charges related to the amortization of acquisition-related intangibles, non-cash equity-based compensation, IPO- and secondary-offering related expenses and gains and losses from the early extinguishment of debt. Non-GAAP net income is considered a non-GAAP financial measure. Generally, a non-GAAP financial measure is a numerical measure of a company's performance, financial position, or cash flows that either excludes or includes amounts that are not normally included or excluded in the most directly comparable measure calculated and presented in accordance with GAAP. Non-GAAP measures used by the Company may differ from similar measures used by other companies, even when similar terms are used to identify such measures. We believe that Non-GAAP net income provides helpful information with respect to our operating performance and cash flows including our ability to meet our future debt service, capital expenditures and working capital requirements.
47
|
(in millions)
|
Years Ended December 31,
|
|||||||
|
2013
|
2012
|
|||||||
|
Net income
|
$
|
132.8
|
|
$
|
119.0
|
|
||
|
Amortization of intangibles
(1)
|
161.2
|
|
163.7
|
|
||||
|
Non-cash equity-based compensation
|
8.6
|
|
22.1
|
|
||||
|
Litigation, net
(2)
|
(6.3
|
)
|
—
|
|
||||
|
Net loss on extinguishments of long-term debt
|
64.0
|
|
17.2
|
|
||||
|
Interest expense adjustment related to extinguishments of long-term debt
(3)
|
(7.5
|
)
|
(3.3
|
)
|
||||
|
IPO- and secondary-offering related expenses
(4)
|
75.0
|
|
—
|
|
||||
|
Aggregate adjustment for income taxes
(5)
|
(113.5
|
)
|
(71.6
|
)
|
||||
|
Non-GAAP net income
|
$
|
314.3
|
|
$
|
247.1
|
|
||
|
(1)
|
Includes amortization expense for acquisition-related intangible assets, primarily customer relationships and trade names.
|
|
(2)
|
Relates to unusual, non-recurring litigation matters.
|
|
(3)
|
Reflects adjustments to interest expense resulting from debt extinguishments. Represents the difference between interest expense previously recognized under the effective interest method and actual interest paid.
|
|
(4)
|
IPO- and secondary-offering related expenses consist of the following:
|
|
(in millions)
|
Years Ended December 31,
|
|||||||
|
2013
|
2012
|
|||||||
|
Acceleration charge for certain equity awards and related employer payroll taxes
|
$
|
40.7
|
|
$
|
—
|
|
||
|
RDU Plan cash retention pool accrual
|
7.5
|
|
—
|
|
||||
|
Management services agreement termination fee
|
24.4
|
|
—
|
|
||||
|
Other expenses
|
2.4
|
|
—
|
|
||||
|
IPO- and secondary-offering related expenses
|
$
|
75.0
|
|
$
|
—
|
|
||
|
(5)
|
Based on a normalized effective tax rate of 39.0%.
|
Adjusted EBITDA
Adjusted EBITDA was
$808.5 million
in 2013, an increase of $41.9 million, or 5.5%, compared to
$766.6 million
in 2012. As a percentage of net sales, Adjusted EBITDA was 7.5% and 7.6% in 2013 and 2012, respectively.
We have included a reconciliation of EBITDA and Adjusted EBITDA for 2013 and 2012 in the table below. EBITDA is defined as consolidated net income before interest expense, income tax expense, depreciation and amortization. Adjusted EBITDA, which is a measure defined in our credit agreements, means EBITDA adjusted for certain items which are described in the table below. Both EBITDA and Adjusted EBITDA are considered non-GAAP financial measures. Generally, a non-GAAP financial measure is a numerical measure of a company's performance, financial position or cash flows that either excludes or includes amounts that are not normally included or excluded in the most directly comparable measure calculated and presented in accordance with GAAP. Non-GAAP measures used by the Company may differ from similar measures used by other companies, even when similar terms are used to identify such measures. We believe that EBITDA and Adjusted EBITDA provide helpful information with respect to our operating performance and cash flows including our ability to meet our future debt service, capital expenditures and working capital requirements. Adjusted EBITDA also provides helpful information as it is the primary measure used in certain financial covenants contained in our credit agreements.
48
|
(in millions)
|
Years Ended December 31,
|
||||||
|
|
2013
|
2012
|
|||||
|
Net income
|
$
|
132.8
|
|
$
|
119.0
|
|
|
|
Depreciation and amortization
|
208.2
|
|
210.2
|
|
|||
|
Income tax expense
|
62.7
|
|
67.1
|
|
|||
|
Interest expense, net
|
250.1
|
|
307.4
|
|
|||
|
EBITDA
|
653.8
|
|
703.7
|
|
|||
|
Adjustments:
|
|||||||
|
Non-cash equity-based compensation
|
8.6
|
|
22.1
|
|
|||
|
Sponsor fee
|
2.5
|
|
5.0
|
|
|||
|
Consulting and debt-related professional fees
|
0.1
|
|
0.6
|
|
|||
|
Net loss on extinguishments of long-term debt
|
64.0
|
|
17.2
|
|
|||
|
Litigation, net
(1)
|
(4.1
|
)
|
4.3
|
|
|||
|
IPO- and secondary-offering related expenses
(2)
|
75.0
|
|
—
|
|
|||
|
Other adjustments
(3)
|
8.6
|
|
13.7
|
|
|||
|
Total adjustments
|
154.7
|
|
62.9
|
|
|||
|
Adjusted EBITDA
|
$
|
808.5
|
|
$
|
766.6
|
|
|
|
(1)
|
Relates to unusual, non-recurring litigation matters.
|
|
(2)
|
As defined under
Non-GAAP net income
above.
|
|
(3)
|
Other adjustments primarily include certain retention costs and equity investment income.
|
The following table sets forth a reconciliation of EBITDA to net cash provided by operating activities for the years ended December 31, 2013 and 2012.
|
|
Years Ended December 31,
|
|||||||
|
(in millions)
|
2013
|
2012
|
||||||
|
EBITDA
|
$
|
653.8
|
|
$
|
703.7
|
|
||
|
Depreciation and amortization
|
(208.2
|
)
|
(210.2
|
)
|
||||
|
Income tax expense
|
(62.7
|
)
|
(67.1
|
)
|
||||
|
Interest expense, net
|
(250.1
|
)
|
(307.4
|
)
|
||||
|
Net income
|
132.8
|
|
119.0
|
|
||||
|
Depreciation and amortization
|
208.2
|
|
210.2
|
|
||||
|
Equity-based compensation expense
|
46.6
|
|
22.1
|
|
||||
|
Deferred income taxes
|
(48.7
|
)
|
(56.3
|
)
|
||||
|
Amortization of deferred financing costs, debt premium, and debt discount, net
|
8.8
|
|
13.6
|
|
||||
|
Net loss on extinguishments of long-term debt
|
64.0
|
|
17.2
|
|
||||
|
Other
|
1.7
|
|
1.0
|
|
||||
|
Changes in assets and liabilities
|
(47.1
|
)
|
(9.4
|
)
|
||||
|
Net cash provided by operating activities
|
$
|
366.3
|
|
$
|
317.4
|
|
||
Seasonality
While we have not historically experienced significant seasonality throughout the year, sales in our Corporate segment, which primarily serves private sector business customers, are typically higher in the fourth quarter than in other quarters due to customers spending their remaining technology budget dollars at the end of the year. Additionally, sales in our Public segment have historically been higher in the third quarter than in other quarters primarily due to the buying patterns of the federal government and education customers.
Liquidity and Capital Resources
49
Overview
We finance our operations and capital expenditures through a combination of internally generated cash from operations and from borrowings under our senior secured asset-based revolving credit facility. We believe that our current sources of funds will be sufficient to fund our cash operating requirements for the next year. In addition, we believe that, in spite of the uncertainty of future macroeconomic conditions, we have adequate sources of liquidity and funding available to meet our longer-term needs. However, there are a number of factors that may negatively impact our available sources of funds. The amount of cash generated from operations will be dependent upon factors such as the successful execution of our business plan and general economic conditions.
Long-Term Debt Activities
During the year ended December 31, 2014, we had significant debt refinancings. In connection with these refinancings, we recorded a loss on extinguishment of long-term debt of
$90.7 million
in our consolidated statement of operations for the year ended December 31, 2014. See Note 7 to the accompanying audited consolidated financial statements included elsewhere in this report for additional details.
Share Repurchase Program
On November 6, 2014, we announced that our Board of Directors approved a $500 million share repurchase program effective immediately under which we may repurchase shares of our common stock in the open market or through privately negotiated transactions, depending on share price, market conditions and other factors. The share repurchase program does not obligate us to repurchase any dollar amount or number of shares, and repurchases may be commenced or suspended from time to time without prior notice. As of the date of this filing, no shares have been repurchased under the share repurchase program.
Dividends
A summary of 2014 dividend activity for our common stock is shown below:
|
Dividend Amount
|
Declaration Date
|
Record Date
|
Payment Date
|
|||
|
$0.0425
|
February 12, 2014
|
February 25, 2014
|
March 10, 2014
|
|||
|
$0.0425
|
May 8, 2014
|
May 27, 2014
|
June 10, 2014
|
|||
|
$0.0425
|
July 31, 2014
|
August 25, 2014
|
September 10, 2014
|
|||
|
$0.0675
|
November 6, 2014
|
November 25, 2014
|
December 10, 2014
|
|||
On February 10, 2015, we announced that our board of directors declared a quarterly cash dividend on our common stock of $0.0675 per share. The dividend will be paid on March 10, 2015 to all stockholders of record as of the close of business on February 25, 2015.
The payment of any future dividends will be at the discretion of our board of directors and will depend upon our results of operations, financial condition, business prospects, capital requirements, contractual restrictions, any potential indebtedness we may incur, restrictions imposed by applicable law, tax considerations and other factors that our board of directors deems relevant. In addition, our ability to pay dividends on our common stock will be limited by restrictions on our ability to pay dividends or make distributions to our stockholders and on the ability of our subsidiaries to pay dividends or make distributions to us, in each case, under the terms of our current and any future agreements governing our indebtedness.
Cash Flows
50
Cash flows from operating, investing and financing activities were as follows:
|
(in millions)
|
Years Ended December 31,
|
||||||||||
|
|
2014
|
2013
|
2012
|
||||||||
|
Net cash provided by (used in):
|
|||||||||||
|
Operating activities
|
$
|
435.0
|
|
$
|
366.3
|
|
$
|
317.4
|
|
||
|
Investing activities
|
(164.8
|
)
|
(47.1
|
)
|
(41.7
|
)
|
|||||
|
Net change in accounts payable - inventory financing
|
75.5
|
|
7.4
|
|
(29.5
|
)
|
|||||
|
Other financing activities
|
(187.5
|
)
|
(175.7
|
)
|
(308.5
|
)
|
|||||
|
Financing activities
|
(112.0
|
)
|
(168.3
|
)
|
(338.0
|
)
|
|||||
|
Effect of exchange rate changes on cash and cash equivalents
|
(1.8
|
)
|
(0.7
|
)
|
0.3
|
|
|||||
|
Net increase (decrease) in cash and cash equivalents
|
$
|
156.4
|
|
$
|
150.2
|
|
$
|
(62.0
|
)
|
||
Operating Activities
Net cash provided by operating activities for
2014
increased
$68.7 million
compared to
2013
. Net income adjusted for the impact of non-cash items such as depreciation and amortization, equity-based compensation expense and net loss on extinguishments of long-term debt was
$476.8 million
during
2014
, compared to
$413.4 million
during
2013
. The increase in cash of
$63.4 million
reflected stronger operating results in
2014
compared to
2013
. Net changes in assets and liabilities reduced cash by
$41.8 million
in
2014
compared to a reduction of
$47.1 million
in
2013
, resulting in a change of
$5.3 million
between periods. The decrease in inventory balances year over year contributed to a $111.7 million increase in cash flows which was primarily due to the timing of inventory receipts and earlier than expected inventory shipments at the end of 2014 due to accelerated customer roll-outs. Partially offsetting the increase in cash flows from inventory was a decline in cash inflows from accounts payable of $102.4 million driven by the timing of inventory receipts at the end of 2014 versus 2013.
Net cash provided by operating activities for 2013 increased $48.9 million compared to 2012. Net income adjusted for the impact of non-cash items such as depreciation and amortization, equity-based compensation expense and net loss on extinguishments of long-term debt was $413.4 million during 2013, compared to $326.8 million during 2012, an increase of $86.6 million. The increase in cash of $86.6 million reflected stronger operating results in 2013 compared to 2012. Net changes in assets and liabilities reduced cash by $47.1 million in 2013 compared to a reduction of $9.4 million in 2012, resulting in a change of $37.7 million between periods. While changes in assets and liabilities were relatively flat during 2012, during 2013, accounts receivable and accounts payable balances decreased and increased cash by $170.8 million and $146.1 million, respectively, primarily as a result of accelerated sales growth during the final month of 2013. Merchandise inventory also increased during 2013 to support strong sales order volume near the end of 2013.
51
In order to manage our working capital and operating cash needs, we monitor our cash conversion cycle, defined as days of sales outstanding in accounts receivable plus days of supply in inventory minus days of purchases outstanding in accounts payable, based on a rolling three-month average. The following table presents the components of our cash conversion cycle:
|
(in days)
|
December 31,
|
|||||||
|
|
2014
|
2013
|
2012
|
|||||
|
Days of sales outstanding (DSO)
(1)
|
42
|
|
44
|
|
42
|
|
||
|
Days of supply in inventory (DIO)
(2)
|
13
|
|
14
|
|
14
|
|
||
|
Days of purchases outstanding (DPO)
(3)
|
(34
|
)
|
(35
|
)
|
(32
|
)
|
||
|
Cash conversion cycle
|
21
|
|
23
|
|
24
|
|
||
|
(1)
|
Represents the rolling three-month average of the balance of trade accounts receivable, net at the end of the period divided by average daily net sales for the same three-month period. Also incorporates components of other miscellaneous receivables.
|
|
(2)
|
Represents the rolling three-month average of the balance of inventory at the end of the period divided by average daily cost of goods sold for the same three-month period. The prior period has been revised to conform to the current definition.
|
|
(3)
|
Represents the rolling three-month average of the combined balance of accounts payable-trade, excluding cash overdrafts, and accounts payable-inventory financing at the end of the period divided by average daily cost of goods sold for the same three-month period.
|
The cash conversion cycle decreased to
21
days at December 31, 2014 compared to
23
days at December 31, 2013, primarily driven by improvement in DSO. The decline in DSO was primarily driven by improved collections and early payments from certain customers. Additionally, the timing of inventory receipts at the end of 2014 had a favorable impact on DIO and an unfavorable impact on DPO.
The cash conversion cycle decreased to 23 days at December 31, 2013 compared to 24 days at December 31, 2012. The increase in DSO was primarily driven by an increase in receivables for third-party services such as software assurance and warranties. These services have an unfavorable impact on DSO as the receivable is recognized on the balance sheet on a gross basis while the corresponding sales amount in the statement of operations is recorded on a net basis. The DPO increase was primarily due to an increase in payables for third-party services, which offsets the related increase in DSO discussed above. These services have a favorable impact on DPO as the payable is recognized on the balance sheet without a corresponding cost of sales in the statement of operations because the cost paid to the vendor or third-party service provider is recorded as a reduction to net sales. The timing of quarter-end payments also had a favorable impact on DPO at December 31, 2013.
Investing Activities
Net cash used in investing activities increased
$117.7 million
in
2014
compared to
2013
. We paid
$86.8 million
in the fourth quarter of
2014
to acquire a 35% non-controlling interest in Kelway. Additionally, capital expenditures increased
$7.9 million
to
$55.0 million
from
$47.1 million
for
2014
and
2013
, respectively, primarily for improvements to our information technology systems during both years.
Net cash used in investing activities increased $5.4 million in 2013 compared to 2012. Capital expenditures were $47.1 million and $41.4 million for 2013 and 2012, respectively, primarily for improvements to our information technology systems during both years.
Financing Activities
Net cash used in financing activities decreased
$56.3 million
in
2014
compared to
2013
. The decrease was primarily driven by several debt refinancing transactions during each period and our July 2013 IPO, which generated net proceeds of
$424.7 million
after deducting underwriting discounts, expenses and transaction costs. The net impact of our debt transactions resulted in cash outflows of
$161.3 million
and
$569.4 million
during
2014
and
2013
, respectively, as cash was used in each period to reduce our total long-term debt. See Note 7 to the accompanying audited consolidated financial statements included elsewhere in this report for a description of the debt transactions impacting each period.
Net cash used in financing activities decreased $169.7 million in 2013 compared to 2012. The decrease was primarily driven by various debt transactions during each period and our July 2013 IPO, which generated net proceeds of $424.7 million after deducting underwriting discounts, expenses and transaction costs. The net impact of our debt transactions resulted
52
in cash outflows of $569.4 million and $310.6 million during 2013 and 2012, respectively, as cash was used in each period to reduce our total long-term debt.
As of December 31, 2014, we had total indebtedness of $
3.2 billion
, of which
$1.5 billion
was secured indebtedness.
At December 31, 2014, we were in compliance with the covenants under our various credit agreements and indentures. Under the indenture governing the 8.5% Senior Notes due 2019, which contains the most restrictive restricted payment provisions in our various credit agreements and indentures, we are generally restricted from paying dividends and making other restricted payments. For the purpose of determining restricted payment capacity, consolidated net income or loss includes certain adjustments that are defined in the applicable indenture. At December 31, 2014, the amount of cumulative consolidated net income free of restrictions under our credit agreements and indentures was
$230.3 million
.
See Note 7 to the accompanying audited consolidated financial statements included elsewhere in this report for further details regarding our debt and each of the transactions described below.
During the year ended December 31, 2014, the following events occurred with respect to our debt structure:
|
•
|
On January 22, 2014 and February 21, 2014, we redeemed
$30.0 million
and
$20.0 million
aggregate principal amounts of the 12.535% Senior Subordinated Exchange Notes due 2017, respectively.
|
|
•
|
On March 20, 2014, we repurchased and subsequently canceled
$25.0 million
aggregate principal amount of the 8.5% Senior Notes due 2019 from an affiliate of Providence Equity in a privately-negotiated transaction on an arms’ length basis.
|
|
•
|
On May 9, 2014, we redeemed all of the remaining
$42.5 million
aggregate principal amount of the 12.535% Senior Subordinated Exchange Notes due 2017.
|
|
•
|
On June 6, 2014, we entered into a new five-year
$1,250.0 million
senior secured asset-based revolving credit facility which will mature on June 6, 2019.
|
|
•
|
On August 5, 2014, we completed the issuance of $600.0 million aggregate principal amount of 6.0% Senior Notes due 2022 which will mature on August 15, 2022.
|
|
•
|
On September 5, 2014, we redeemed all of the remaining
$325.0 million
aggregate principal amount of the 12.535% Senior Subordinated Exchange Notes due 2017, plus accrued and unpaid interest through the date of redemption.
|
|
•
|
On September 5, 2014, we redeemed
$234.7 million
aggregate principal amount of the 8.5% Senior Notes due 2019, plus accrued and unpaid interest through the date of redemption.
|
|
•
|
On December 1, 2014, we completed the issuance of $575.0 million principal amount of 5.5% Senior Notes due 2024 which will mature on December 1, 2024.
|
|
•
|
On December 31, 2014, we redeemed
$541.4 million
aggregate principal amount of the 8.5% Senior Notes due 2019, plus accrued and unpaid interest through the date of redemption.
|
Inventory Financing Agreements
We have entered into agreements with certain financial intermediaries to facilitate the purchase of inventory from various suppliers under certain terms and conditions. These amounts are classified separately as accounts payable-inventory financing on the consolidated balance sheets. We do not incur any interest expense associated with these agreements as balances are paid when they are due. See Note 5 to the accompanying audited consolidated financial statements included elsewhere in this report for further details.
Contractual Obligations
We have future obligations under various contracts relating to debt and interest payments, operating leases and asset retirement obligations. The following table presents our estimated future payments under contractual obligations that existed as of December 31, 2014, based on undiscounted amounts.
53
|
(in millions)
|
Payments Due by Period
|
||||||||||||||||||
|
|
Total
|
< 1 year
|
1-3 years
|
4-5 years
|
> 5 years
|
||||||||||||||
|
Term Loan
(1)
|
$
|
1,767.8
|
|
$
|
64.4
|
|
$
|
127.3
|
|
$
|
125.3
|
|
$
|
1,450.8
|
|
||||
|
Senior Notes due 2019
(2)
|
696.6
|
|
42.8
|
|
85.7
|
|
568.1
|
|
—
|
|
|||||||||
|
Senior Notes due 2022
(2)
|
889.0
|
|
37.0
|
|
72.0
|
|
72.0
|
|
708.0
|
|
|||||||||
|
Senior Notes due 2024
(2)
|
891.3
|
|
31.6
|
|
63.3
|
|
63.3
|
|
733.1
|
|
|||||||||
|
Operating leases
(3)
|
127.5
|
|
19.1
|
|
31.4
|
|
26.4
|
|
50.6
|
|
|||||||||
|
Asset retirement obligations
(4)
|
0.5
|
|
—
|
|
0.5
|
|
—
|
|
—
|
|
|||||||||
|
Total
|
$
|
4,372.7
|
|
$
|
194.9
|
|
$
|
380.2
|
|
$
|
855.1
|
|
$
|
2,942.5
|
|
||||
|
(1)
|
Includes future principal and cash interest payments on long-term borrowings through scheduled maturity dates. Interest payments for variable rate debt were calculated using interest rates as of December 31, 2014. Excluded from these amounts are the amortization of debt issuance and other costs related to indebtedness.
|
|
(2)
|
Includes future principal and cash interest payments on long-term borrowings through scheduled maturity dates. Interest on the Senior Notes is calculated using the stated interest rates. Excluded from these amounts are the amortization of debt issuance and other costs related to indebtedness.
|
|
(3)
|
Includes the minimum lease payments for non-cancelable leases of properties and equipment used in our operations. Additionally, included in these amounts are future minimum lease payments commencing in the fourth quarter of 2016 that relate to a new lease entered into in December 2014 for our future headquarters in Lincolnshire, Illinois. Also reflected in these amounts is the future expiration of two leases in the first quarter of 2016 for facilities currently in use by us which we plan to consolidate into the new headquarters location and accordingly, these leases will not be renewed.
|
|
(4)
|
Represent commitments to return property subject to operating leases to original condition upon lease termination.
|
Off-Balance Sheet Arrangements
We have no off-balance sheet arrangements that have or are reasonably likely to have a material current or future effect on our financial condition, changes in financial condition, revenues or expenses, results of operations, liquidity, capital expenditures or capital resources.
Inflation
Inflation has not had a material impact on our operating results. We generally have been able to pass along price increases to our customers, though certain economic factors and technological advances in recent years have tended to place downward pressure on pricing. We also have been able to generally offset the effects of inflation on operating costs by continuing to emphasize productivity improvements and by accelerating our overall cash conversion cycle. There can be no assurances, however, that inflation would not have a material impact on our sales or operating costs in the future.
Commitments and Contingencies
The information set forth in Note 14 to the accompanying audited consolidated financial statements included in Part II, Item 8 of this Form 10-K is incorporated herein by reference.
Critical Accounting Policies and Estimates
The preparation of financial statements in accordance with GAAP requires management to make use of certain estimates and assumptions that affect the reported amounts of assets and liabilities and disclosure of contingent assets and liabilities at the date of the financial statements and the reported amounts of revenue and expenses during the reported periods. We base our estimates on historical experience and on various other assumptions that we believe are reasonable under the circumstances, the results of which form the basis for making judgments about carrying values of assets and liabilities that are not readily apparent from other sources. Actual results could differ from those estimates.
In Note 1 to the accompanying audited consolidated financial statements, we include a discussion of the significant accounting policies used in the preparation of our consolidated financial statements. We believe the following are the most critical accounting policies and estimates that include significant judgments used in the preparation of our financial statements. We consider an accounting policy or estimate to be critical if it requires assumptions to be made that were uncertain at the time they were made, and if changes in these assumptions could have a material impact on our financial condition or results of operations.
54
Revenue Recognition
We are a primary distribution channel for a large group of vendors and suppliers, including OEMs, software publishers and wholesale distributors. We record revenue from sales transactions when title and risk of loss are passed to our customer, there is persuasive evidence of an arrangement for sale, delivery has occurred and/or services have been rendered, the sales price is fixed or determinable, and collectability is reasonably assured. Our shipping terms typically specify F.O.B. destination, at which time title and risk of loss have passed to the customer.
Revenues from the sales of hardware products and software products and licenses are generally recognized on a gross basis with the selling price to the customer recorded as sales and the acquisition cost of the product recorded as cost of sales. These items can be delivered to customers in a variety of ways, including (i) as physical product shipped from our warehouse, (ii) via drop-shipment by the vendor or supplier, or (iii) via electronic delivery for software licenses. At the time of sale, we record an estimate for sales returns and allowances based on historical experience. Our vendor partners warrant most of the products we sell.
We leverage drop-shipment arrangements with many of our vendors and suppliers to deliver products to our customers without having to physically hold the inventory at our warehouses, thereby increasing efficiency and reducing costs. We recognize revenue for drop-shipment arrangements on a gross basis upon delivery to the customer with contract terms that typically specify F.O.B. destination. We recognize revenue on a gross basis as the principal in the transaction because we are the primary obligor in the arrangement, we assume inventory risk if the product is returned by the customer, we set the price of the product charged to the customer, we assume credit risk for the amounts invoiced, and we work closely with our customers to determine their hardware and software specifications. These arrangements generally represent approximately
40% to 50%
of total net sales, including approximately
15% to 20%
related to electronic delivery for software licenses.
Revenue from professional services is either recognized as provided for services billed at an hourly rate or recognized using a proportional performance model for services provided at a fixed fee. Revenue from cloud computing solutions including Software as a Service ("SaaS") and Infrastructure as a Service ("IaaS") arrangements, as well as data center services such as managed and remote managed services, server co-location, internet connectivity and data backup and storage, is recognized over the period service is provided.
We also sell certain products for which we act as an agent. Products in this category include the sale of third-party services, warranties, software assurance (“SA”) and third-party hosted SaaS and IaaS arrangements. SA is a product that allows customers to upgrade, at no additional cost, to the latest technology if new applications are introduced during the period that the SA is in effect. These sales do not meet the criteria for gross sales recognition, and thus are recognized on a net basis at the time of sale. Under net sales recognition, the cost paid to the vendor or third-party service provider is recorded as a reduction to sales, resulting in net sales being equal to the gross profit on the transaction.
Our larger customers are offered the opportunity by certain of our vendors to purchase software licenses and SA under enterprise agreements (“EAs”). Under EAs, customers are considered to be compliant with applicable license requirements for the ensuing year, regardless of changes to their employee base. Customers are charged an annual true-up fee for changes in the number of users over the year. With most EAs, our vendors will transfer the license and bill the customer directly, paying resellers such as us an agency fee or commission on these sales. We record these fees as a component of net sales as earned and there is no corresponding cost of sales amount. In certain instances, we bill the customer directly under an EA and account for the individual items sold based on the nature of the item. Our vendors typically dictate how the EA will be sold to the customer.
From time to time, we sell some of our products and services as part of bundled contract arrangements containing multiple deliverables, which may include a combination of the products and services. For each deliverable that represents a separate unit of accounting, total arrangement consideration is allocated based upon the relative selling prices of each element. The allocated arrangement consideration is recognized as revenue in accordance with the principles described above. Selling prices are determined by using vendor specific objective evidence (“VSOE”) if it exists. Otherwise, selling prices are determined using third party evidence (“TPE”). If neither VSOE or TPE is available, we use our best estimate of selling prices.
We record freight billed to our customers as net sales and the related freight costs as a cost of sales.
Deferred revenue includes (1) payments received from customers in advance of providing the product or performing services, and (2) amounts deferred if other conditions of revenue recognition have not been met.
We perform an analysis of the estimated number of days of sales in-transit to customers at the end of each period based on a weighted-average analysis of commercial delivery terms that includes drop-shipment arrangements. This analysis is the basis upon which we estimate the amount of sales in-transit at the end of the period and adjust revenue and the related costs
55
to reflect only what has been received by the customer. Changes in delivery patterns may result in a different number of business days used in making this adjustment and could have a material impact on our revenue recognition for the period.
Inventory Valuation
Inventory is valued at the lower of cost or market value. Cost is determined using a weighted-average cost method. Price protection is recorded when earned as a reduction to the cost of inventory. We decrease the value of inventory for estimated obsolescence equal to the difference between the cost of inventory and the estimated market value, based upon an aging analysis of the inventory on hand, specifically known inventory-related risks, and assumptions about future demand and market conditions. If future demand or actual market conditions are less favorable than those projected by management, additional inventory write-downs may be required.
Vendor Programs
We receive incentives from certain of our vendors related to cooperative advertising allowances, volume rebates, bid programs, price protection and other programs. These incentives generally relate to written agreements with specified performance requirements with the vendors and are recorded as adjustments to cost of sales or inventory, depending on the nature of the incentive. Vendors may change the terms of some or all of these programs, which could have an impact on our results of operations.
We record receivables from vendors related to these programs when the amounts are probable and reasonably estimable. Some programs are based on the achievement of specific targets, and we base our estimates on information provided by our vendors and internal information to assess our progress toward achieving those targets. If actual performance does not match our estimates, we may be required to adjust our receivables. We record reserves for vendor receivables for estimated losses due to vendors’ inability to pay or rejections by vendors of claims; however, if actual collections differ from our estimates, we may incur additional losses that could have a material impact on gross margin and operating income.
Goodwill and Other Intangible Assets
Goodwill is not amortized but is subject to periodic testing for impairment at the reporting unit level. Our reporting units used to assess potential goodwill impairment are the same as our operating segments. We are required to perform an evaluation of goodwill on an annual basis or more frequently if circumstances indicate a potential impairment. The annual test for impairment is conducted as of December 1. We have the option of performing a qualitative assessment of a reporting unit's fair value from the last quantitative assessment to determine if it is more likely than not that the reporting unit's goodwill is impaired or performing a quantitative assessment by comparing a reporting unit's estimated fair value to its carrying amount. Under the quantitative assessment, testing for impairment of goodwill is a two-step process. The first step compares the fair value of a reporting unit with its carrying amount, including goodwill. If the carrying amount of a reporting unit exceeds its fair value, the second step compares the implied fair value of reporting unit goodwill with the carrying amount of that goodwill to determine the amount of impairment loss. Fair value of a reporting unit is determined by using a weighted combination of an income approach and a market approach, as this combination is considered the most indicative of the reporting units’ fair value in an orderly transaction between market participants. Under the income approach, we determine fair value based on estimated future cash flows of a reporting unit, discounted by an estimated weighted-average cost of capital, which reflects the overall level of inherent risk of a reporting unit and the rate of return an outside investor would expect to earn. Under the market approach, we utilize valuation multiples derived from publicly available information for peer group companies to provide an indication of how much a knowledgeable investor in the marketplace would be willing to pay for a company. We have weighted the income approach and the market approach at 75% and 25%, respectively.
Determining the fair value of a reporting unit (and the allocation of that fair value to individual assets and liabilities within the reporting unit to determine the implied fair value of goodwill in the event a step two analysis is required) is judgmental in nature and requires the use of significant estimates and assumptions. These estimates and assumptions include primarily, but are not limited to, discount rate, terminal growth rate, selection of appropriate peer group companies and control premium applied, and forecasts of revenue growth rates, gross margins, operating margins, and working capital requirements. The allocation requires analysis to determine the fair value of assets and liabilities including, among others, customer relationships, trade names, and property and equipment. Any changes in the judgments, estimates, or assumptions used could produce significantly different results. Although we believe our assumptions are reasonable, actual results may vary significantly and may expose us to material impairment charges in the future.
Intangible assets include customer relationships, trade names, internally developed software and other intangibles. Intangible assets with determinable lives are amortized on a straight-line basis over the estimated useful lives of the assets. The cost of software developed or obtained for internal use is capitalized and amortized on a straight-line basis over the estimated useful life of the software. These intangible assets are reviewed for impairment whenever events or changes in circumstances
56
indicate that the carrying amount of such assets may not be recoverable. Determination of recoverability is based on an estimate of undiscounted future cash flows resulting from the use of the asset and its eventual disposition. If the carrying amount of an asset exceeds its estimated future undiscounted cash flows, an impairment loss is recorded for the excess of the asset’s carrying amount over its fair value.
Allowance for Doubtful Accounts
We record an allowance for doubtful accounts related to trade accounts receivable for estimated losses resulting from the inability of our customers to make required payments. We take into consideration historical loss experience, the overall quality of the receivable portfolio and specifically identified customer risks. If actual collections of customer receivables differ from our estimates, additional allowances may be required which could have an impact on our results of operations.
Income Taxes
Deferred income taxes are provided to reflect the differences between the tax bases of assets and liabilities and their reported amounts in the consolidated financial statements using enacted tax rates in effect for the year in which the differences are expected to reverse. We perform an evaluation of the realizability of our deferred tax assets on a quarterly basis. This evaluation requires us to use estimates and make assumptions and considers all positive and negative evidence and factors, such as the scheduled reversal of temporary differences, the mix of earnings in the jurisdictions in which we operate, and prudent and feasible tax planning strategies.
We account for unrecognized tax benefits based upon our assessment of whether a tax benefit is more likely than not to be sustained upon examination by tax authorities. We report a liability for unrecognized tax benefits resulting from unrecognized tax benefits taken or expected to be taken in a tax return and recognize interest and penalties, if any, related to unrecognized tax benefits in income tax expense.
Recent Accounting Pronouncements
The information set forth in Note 2 to the accompanying audited consolidated financial statements included in Part II, Item 8 of this Form 10-K is incorporated herein by reference.
Subsequent Events
The information set forth in Note 20 to the accompanying audited consolidated financial statements included in Part II, Item 8 of this Form 10-K is incorporated herein by reference.
Our market risks relate primarily to changes in interest rates. The interest rates on borrowings under our senior secured asset-based revolving credit facility and our senior secured term loan facility are floating and, therefore, are subject to fluctuations. In order to manage the risk associated with changes in interest rates on borrowings under our senior secured term loan facility, we have entered into interest rate derivative agreements to economically hedge a portion of the cash flows associated with the facility. Our objectives in using interest rate derivatives are to add stability to interest expense and to manage our exposure to interest rate fluctuations.
W
e utilize interest rate caps for the purpose of limiting current and future exposure to interest rate risk on our floating-rate debt under the senior secured term loan facility.
As of
December 31, 2014
we have ten interest rate cap agreements in effect through January 14, 2015 with a combined notional amount of $1,150.0 million which entitled the Company to payments from the counterparty of the amount, if any, by which three-month LIBOR exceeds a weighted average rate of 2.4% during the agreement period.
During the year ended
December 31, 2014
, we entered into 14 additional interest rate cap agreements with a combined notional amount of
$1,000.0 million
. These interest rate cap agreements have not been designated as cash flow hedges of interest rate risk for GAAP accounting purposes. The entire
$1,000.0 million
notional amount entitles us to payments from the counterparty of the amount, if any, by which three-month LIBOR exceeds
2.0%
during the agreement period. The interest rate cap agreements are effective from January 14, 2015 through January 14, 2017. See Note 7 to the accompanying audited consolidated financial statements included elsewhere in this report for additional details.
See “Management's Discussion and Analysis of Financial Condition and Results of Operations - Liquidity and Capital Resources - Contractual Obligations” for information on cash flows, interest rates and maturity dates of our debt obligations.
57
Index to Consolidated Financial Statements
|
|
Page
|
58
Report of Independent Registered Public Accounting Firm
To the Board of Directors and Shareholders of
CDW Corporation
We have audited the accompanying consolidated balance sheets of CDW Corporation and subsidiaries as of December 31, 2014 and 2013, and the related consolidated statements of operations, comprehensive income, shareholders' equity (deficit) and cash flows for each of the three years in the period ended December 31, 2014. Our audits also included the financial statement schedule listed in the Index at Item 15(a)(2). These financial statements and schedule are the responsibility of the Company's management. Our responsibility is to express an opinion on these financial statements and schedule based on our audits.
We conducted our audits in accordance with the standards of the Public Company Accounting Oversight Board (United States). Those standards require that we plan and perform the audit to obtain reasonable assurance about whether the financial statements are free of material misstatement. An audit includes examining, on a test basis, evidence supporting the amounts and disclosures in the financial statements. An audit also includes assessing the accounting principles used and significant estimates made by management, as well as evaluating the overall financial statement presentation. We believe that our audits provide a reasonable basis for our opinion.
In our opinion, the financial statements referred to above present fairly, in all material respects, the consolidated financial position of CDW Corporation and subsidiaries at December 31, 2014 and 2013, and the consolidated results of their operations and their cash flows for each of the three years in the period ended December 31, 2014, in conformity with U.S. generally accepted accounting principles. Also, in our opinion, the related financial statement schedule, when considered in relation to the basic financial statements taken as a whole, presents fairly in all material respects the information set forth therein.
We also have audited, in accordance with the standards of the Public Company Accounting Oversight Board (United States), CDW Corporation and subsidiaries’ internal control over financial reporting as of December 31, 2014, based on criteria established in Internal Control-Integrated Framework issued by the Committee of Sponsoring Organizations of the Treadway Commission (2013 framework) and our report dated February 26, 2015 expressed an unqualified opinion thereon.
|
/s/ Ernst & Young LLP
|
|
Chicago, Illinois
|
|
February 26, 2015
|
59
|
CDW CORPORATION AND SUBSIDIARIES
(in millions, except per-share amounts)
|
|||||||
|
|
December 31,
|
||||||
|
|
2014
|
2013
|
|||||
|
Assets
|
|||||||
|
Current assets:
|
|||||||
|
Cash and cash equivalents
|
$
|
344.5
|
|
$
|
188.1
|
|
|
|
Accounts receivable, net of allowance for doubtful accounts of $5.7 and $5.4, respectively
|
1,561.1
|
|
1,451.0
|
|
|||
|
Merchandise inventory
|
337.5
|
|
382.0
|
|
|||
|
Miscellaneous receivables
|
155.6
|
|
146.3
|
|
|||
|
Prepaid expenses and other
|
54.7
|
|
46.1
|
|
|||
|
Total current assets
|
2,453.4
|
|
2,213.5
|
|
|||
|
Property and equipment, net
|
137.2
|
|
131.1
|
|
|||
|
Equity investments
|
86.7
|
|
—
|
|
|||
|
Goodwill
|
2,217.6
|
|
2,220.3
|
|
|||
|
Other intangible assets, net
|
1,168.8
|
|
1,328.0
|
|
|||
|
Deferred financing costs, net
|
33.0
|
|
30.1
|
|
|||
|
Other assets
|
3.2
|
|
1.6
|
|
|||
|
Total assets
|
$
|
6,099.9
|
|
$
|
5,924.6
|
|
|
|
Liabilities and Shareholders’ Equity
|
|||||||
|
Current liabilities:
|
|||||||
|
Accounts payable-trade
|
$
|
704.0
|
|
$
|
662.8
|
|
|
|
Accounts payable-inventory financing
|
332.1
|
|
256.6
|
|
|||
|
Current maturities of long-term debt
|
15.4
|
|
45.4
|
|
|||
|
Deferred revenue
|
81.3
|
|
94.8
|
|
|||
|
Accrued expenses:
|
|
|
|||||
|
Compensation
|
130.1
|
|
112.2
|
|
|||
|
Interest
|
28.1
|
|
31.8
|
|
|||
|
Sales taxes
|
29.1
|
|
29.2
|
|
|||
|
Advertising
|
34.0
|
|
33.2
|
|
|||
|
Income taxes
|
0.2
|
|
6.3
|
|
|||
|
Other
|
113.7
|
|
130.3
|
|
|||
|
Total current liabilities
|
1,468.0
|
|
1,402.6
|
|
|||
|
Long-term liabilities:
|
|||||||
|
Debt
|
3,174.6
|
|
3,205.8
|
|
|||
|
Deferred income taxes
|
475.0
|
|
563.5
|
|
|||
|
Other liabilities
|
45.8
|
|
41.0
|
|
|||
|
Total long-term liabilities
|
3,695.4
|
|
3,810.3
|
|
|||
|
Commitments and contingencies (Note 14)
|
|
|
|
||||
|
Shareholders’ equity:
|
|||||||
|
Preferred shares, $0.01 par value, 100.0 shares authorized, and no shares issued or outstanding for both periods
|
—
|
|
—
|
|
|||
|
Common shares, $0.01 par value, 1,000.0 shares authorized; 172.2 and 172.0 shares issued, respectively; 172.2 and 172.0 shares outstanding, respectively
|
1.7
|
|
1.7
|
|
|||
|
Paid-in capital
|
2,711.9
|
|
2,688.1
|
|
|||
|
Accumulated deficit
|
(1,760.5
|
)
|
(1,971.8
|
)
|
|||
|
Accumulated other comprehensive loss
|
(16.6
|
)
|
(6.3
|
)
|
|||
|
Total shareholders’ equity
|
936.5
|
|
711.7
|
|
|||
|
Total liabilities and shareholders’ equity
|
$
|
6,099.9
|
|
$
|
5,924.6
|
|
|
The accompanying notes are an integral part of the consolidated financial statements.
60
|
CDW CORPORATION AND SUBSIDIARIES
(in millions, except per-share amounts)
|
|||||||||||
|
|
Years Ended December 31,
|
||||||||||
|
|
2014
|
2013
|
2012
|
||||||||
|
Net sales
|
$
|
12,074.5
|
|
$
|
10,768.6
|
|
$
|
10,128.2
|
|
||
|
Cost of sales
|
10,153.2
|
|
9,008.3
|
|
8,458.6
|
|
|||||
|
Gross profit
|
1,921.3
|
|
1,760.3
|
|
1,669.6
|
|
|||||
|
Selling and administrative expenses
|
1,110.3
|
|
1,120.9
|
|
1,029.5
|
|
|||||
|
Advertising expense
|
138.0
|
|
130.8
|
|
129.5
|
|
|||||
|
Income from operations
|
673.0
|
|
508.6
|
|
510.6
|
|
|||||
|
Interest expense, net
|
(197.3
|
)
|
(250.1
|
)
|
(307.4
|
)
|
|||||
|
Net loss on extinguishments of long-term debt
|
(90.7
|
)
|
(64.0
|
)
|
(17.2
|
)
|
|||||
|
Other income, net
|
2.7
|
|
1.0
|
|
0.1
|
|
|||||
|
Income before income taxes
|
387.7
|
|
195.5
|
|
186.1
|
|
|||||
|
Income tax expense
|
(142.8
|
)
|
(62.7
|
)
|
(67.1
|
)
|
|||||
|
Net income
|
$
|
244.9
|
|
$
|
132.8
|
|
$
|
119.0
|
|
||
|
Net income per common share:
|
|||||||||||
|
Basic
|
$
|
1.44
|
|
$
|
0.85
|
|
$
|
0.82
|
|
||
|
Diluted
|
$
|
1.42
|
|
$
|
0.84
|
|
$
|
0.82
|
|
||
|
Weighted-average number of common shares outstanding:
|
|||||||||||
|
Basic
|
170.6
|
|
156.6
|
|
145.1
|
|
|||||
|
Diluted
|
172.8
|
|
158.7
|
|
145.8
|
|
|||||
|
Cash dividends declared per common share
|
$
|
0.1950
|
|
$
|
0.0425
|
|
$
|
—
|
|
||
The accompanying notes are an integral part of the consolidated financial statements.
61
|
CDW CORPORATION AND SUBSIDIARIES
CONSOLIDATED STATEMENTS OF COMPREHENSIVE INCOME
(in millions)
|
||||||||||||
|
|
Years Ended December 31,
|
|||||||||||
|
2014
|
2013
|
2012
|
||||||||||
|
Net income
|
$
|
244.9
|
|
$
|
132.8
|
|
$
|
119.0
|
|
|||
|
Foreign currency translation adjustment (net of tax benefit of $0.5 million, $0 million, and $0 million, respectively)
|
(10.3
|
)
|
(6.7
|
)
|
2.5
|
|
||||||
|
Other comprehensive (loss) income
|
(10.3
|
)
|
(6.7
|
)
|
2.5
|
|
||||||
|
Comprehensive income
|
$
|
234.6
|
|
$
|
126.1
|
|
$
|
121.5
|
|
|||
The accompanying notes are an integral part of the consolidated financial statements.
62
|
CDW CORPORATION AND SUBSIDIARIES
CONSOLIDATED STATEMENTS OF SHAREHOLDERS’ EQUITY (DEFICIT)
(in millions)
|
||||||||||||||||||||||||||||||
|
Preferred Stock
|
Common Stock
|
|||||||||||||||||||||||||||||
|
Shares
|
Amount
|
Shares
|
Amount
|
Paid-in
Capital
|
Accumulated
Deficit
|
Accumulated
Other
Comprehensive (Loss) Income
|
Total
Shareholders’ (Deficit)Equity |
|||||||||||||||||||||||
|
Balance at December 31, 2011
|
—
|
|
$
|
—
|
|
144.9
|
|
$
|
1.4
|
|
$
|
2,184.7
|
|
$
|
(2,191.3
|
)
|
$
|
(2.1
|
)
|
$
|
(7.3
|
)
|
||||||||
|
Equity-based compensation expense
|
—
|
|
—
|
|
—
|
|
—
|
|
22.1
|
|
—
|
|
—
|
|
22.1
|
|
||||||||||||||
|
Investment from CDW Holdings LLC
|
—
|
|
—
|
|
—
|
|
—
|
|
2.8
|
|
—
|
|
—
|
|
2.8
|
|
||||||||||||||
|
Repurchase of common shares
|
—
|
|
—
|
|
—
|
|
—
|
|
—
|
|
(0.7
|
)
|
—
|
|
(0.7
|
)
|
||||||||||||||
|
Accrued charitable contribution related to the MPK Coworker Incentive Plan II, net of tax
|
—
|
|
—
|
|
0.3
|
|
—
|
|
(1.4
|
)
|
—
|
|
—
|
|
(1.4
|
)
|
||||||||||||||
|
Net income
|
—
|
|
—
|
|
—
|
|
—
|
|
—
|
|
119.0
|
|
—
|
|
119.0
|
|
||||||||||||||
|
Incentive compensation plan units withheld for taxes
|
—
|
|
—
|
|
—
|
|
—
|
|
(0.5
|
)
|
—
|
|
—
|
|
(0.5
|
)
|
||||||||||||||
|
Foreign currency translation adjustment
|
—
|
|
—
|
|
—
|
|
—
|
|
—
|
|
—
|
|
2.5
|
|
2.5
|
|
||||||||||||||
|
Balance at December 31, 2012
|
—
|
|
$
|
—
|
|
145.2
|
|
$
|
1.4
|
|
$
|
2,207.7
|
|
$
|
(2,073.0
|
)
|
$
|
0.4
|
|
$
|
136.5
|
|
||||||||
|
Equity-based compensation expense
|
—
|
|
—
|
|
—
|
|
—
|
|
46.6
|
|
—
|
|
—
|
|
46.6
|
|
||||||||||||||
|
Issuance of common shares
|
—
|
|
—
|
|
26.8
|
|
0.3
|
|
424.4
|
|
—
|
|
—
|
|
424.7
|
|
||||||||||||||
|
Repurchase of common shares
|
—
|
|
—
|
|
—
|
|
—
|
|
—
|
|
(0.2
|
)
|
—
|
|
(0.2
|
)
|
||||||||||||||
|
Dividends declared
|
—
|
|
—
|
|
—
|
|
—
|
|
—
|
|
(7.3
|
)
|
|
|
(7.3
|
)
|
||||||||||||||
|
Reclassification to goodwill for accrued charitable contributions
|
—
|
|
—
|
|
—
|
|
—
|
|
9.4
|
|
—
|
|
—
|
|
9.4
|
|
||||||||||||||
|
Incentive compensation plan units withheld for taxes
|
—
|
|
—
|
|
—
|
|
—
|
|
—
|
|
(24.1
|
)
|
—
|
|
(24.1
|
)
|
||||||||||||||
|
Net income
|
—
|
|
—
|
|
—
|
|
—
|
|
—
|
|
132.8
|
|
—
|
|
132.8
|
|
||||||||||||||
|
Foreign currency translation adjustment
|
—
|
|
—
|
|
—
|
|
—
|
|
—
|
|
—
|
|
(6.7
|
)
|
(6.7
|
)
|
||||||||||||||
|
Balance at December 31, 2013
|
—
|
|
$
|
—
|
|
172.0
|
|
$
|
1.7
|
|
$
|
2,688.1
|
|
$
|
(1,971.8
|
)
|
$
|
(6.3
|
)
|
$
|
711.7
|
|
||||||||
|
Equity-based compensation expense
|
—
|
|
—
|
|
—
|
|
—
|
|
16.4
|
|
—
|
|
—
|
|
16.4
|
|
||||||||||||||
|
Stock options exercised
|
—
|
|
—
|
|
—
|
|
—
|
|
1.3
|
|
—
|
|
—
|
|
1.3
|
|
||||||||||||||
|
Excess tax benefits from equity-based compensation
|
—
|
|
—
|
|
—
|
|
—
|
|
0.3
|
|
—
|
|
—
|
|
0.3
|
|
||||||||||||||
|
Coworker stock purchase plan
|
—
|
|
—
|
|
0.2
|
|
—
|
|
5.8
|
|
—
|
|
—
|
|
5.8
|
|
||||||||||||||
|
Dividends declared
|
—
|
|
—
|
|
—
|
|
—
|
|
—
|
|
(33.6
|
)
|
—
|
|
(33.6
|
)
|
||||||||||||||
|
Net income
|
—
|
|
—
|
|
—
|
|
—
|
|
—
|
|
244.9
|
|
—
|
|
244.9
|
|
||||||||||||||
|
Foreign currency translation adjustment
|
—
|
|
—
|
|
—
|
|
—
|
|
—
|
|
—
|
|
(10.3
|
)
|
(10.3
|
)
|
||||||||||||||
|
Balance at December 31, 2014
|
—
|
|
$
|
—
|
|
172.2
|
|
$
|
1.7
|
|
$
|
2,711.9
|
|
$
|
(1,760.5
|
)
|
$
|
(16.6
|
)
|
$
|
936.5
|
|
||||||||
The accompanying notes are an integral part of the consolidated financial statements.
63
|
CDW CORPORATION AND SUBSIDIARIES
(in millions)
|
|||||||||||
|
|
Years Ended December 31,
|
||||||||||
|
|
2014
|
2013
|
2012
|
||||||||
|
Cash flows from operating activities:
|
|||||||||||
|
Net income
|
$
|
244.9
|
|
$
|
132.8
|
|
$
|
119.0
|
|
||
|
Adjustments to reconcile net income to net cash provided by operating activities:
|
|||||||||||
|
Depreciation and amortization
|
207.9
|
|
208.2
|
|
210.2
|
|
|||||
|
Equity-based compensation expense
|
16.4
|
|
46.6
|
|
22.1
|
|
|||||
|
Deferred income taxes
|
(89.1
|
)
|
(48.7
|
)
|
(56.3
|
)
|
|||||
|
Allowance for doubtful accounts
|
0.3
|
|
—
|
|
—
|
|
|||||
|
Amortization of deferred financing costs, debt premium, and debt discount, net
|
6.4
|
|
8.8
|
|
13.6
|
|
|||||
|
Net loss on extinguishments of long-term debt
|
90.7
|
|
64.0
|
|
17.2
|
|
|||||
|
Income from equity investments
|
(1.2
|
)
|
—
|
|
—
|
|
|||||
|
Other
|
0.5
|
|
1.7
|
|
1.0
|
|
|||||
|
Changes in assets and liabilities:
|
|||||||||||
|
Accounts receivable
|
(117.6
|
)
|
(170.8
|
)
|
(10.4
|
)
|
|||||
|
Merchandise inventory
|
44.2
|
|
(67.5
|
)
|
7.1
|
|
|||||
|
Other assets
|
(18.7
|
)
|
(10.1
|
)
|
(3.8
|
)
|
|||||
|
Accounts payable-trade
|
43.7
|
|
146.1
|
|
0.8
|
|
|||||
|
Other current liabilities
|
1.7
|
|
64.1
|
|
(2.1
|
)
|
|||||
|
Long-term liabilities
|
4.9
|
|
(8.9
|
)
|
(1.0
|
)
|
|||||
|
Net cash provided by operating activities
|
435.0
|
|
366.3
|
|
317.4
|
|
|||||
|
Cash flows from investing activities:
|
|||||||||||
|
Capital expenditures
|
(55.0
|
)
|
(47.1
|
)
|
(41.4
|
)
|
|||||
|
Payment for equity investment
|
(86.8
|
)
|
—
|
|
—
|
|
|||||
|
Payment of accrued charitable contribution related to the MPK Coworker Incentive Plan II
|
(20.9
|
)
|
—
|
|
—
|
|
|||||
|
Premium payments on interest rate cap agreements
|
(2.1
|
)
|
—
|
|
(0.3
|
)
|
|||||
|
Net cash used in investing activities
|
(164.8
|
)
|
(47.1
|
)
|
(41.7
|
)
|
|||||
|
Cash flows from financing activities:
|
|||||||||||
|
Proceeds from borrowings under revolving credit facility
|
—
|
|
63.0
|
|
289.0
|
|
|||||
|
Repayments of borrowings under revolving credit facility
|
—
|
|
(63.0
|
)
|
(289.0
|
)
|
|||||
|
Repayments of long-term debt
|
(15.4
|
)
|
(51.1
|
)
|
(201.0
|
)
|
|||||
|
Proceeds from issuance of long-term debt
|
1,175.0
|
|
1,535.2
|
|
135.7
|
|
|||||
|
Payments to extinguish long-term debt
|
(1,299.0
|
)
|
(2,047.4
|
)
|
(243.2
|
)
|
|||||
|
Payments of debt financing costs
|
(21.9
|
)
|
(6.1
|
)
|
(2.1
|
)
|
|||||
|
Investment from CDW Holdings LLC, net
|
—
|
|
—
|
|
2.8
|
|
|||||
|
Net change in accounts payable-inventory financing
|
75.5
|
|
7.4
|
|
(29.5
|
)
|
|||||
|
Proceeds from issuance of common shares
|
—
|
|
424.7
|
|
—
|
|
|||||
|
Proceeds from stock option exercises
|
1.3
|
|
—
|
|
—
|
|
|||||
|
Proceeds from Coworker Stock Purchase Plan
|
5.8
|
|
—
|
|
—
|
|
|||||
|
Dividends paid
|
(33.6
|
)
|
(7.3
|
)
|
—
|
|
|||||
|
Excess tax benefits from equity-based compensation
|
0.3
|
|
0.6
|
|
—
|
|
|||||
|
Payment of incentive compensation plan withholding taxes
|
—
|
|
(24.1
|
)
|
—
|
|
|||||
|
Repurchase of common shares
|
—
|
|
(0.2
|
)
|
(0.7
|
)
|
|||||
|
Net cash used in financing activities
|
(112.0
|
)
|
(168.3
|
)
|
(338.0
|
)
|
|||||
|
Effect of exchange rate changes on cash and cash equivalents
|
(1.8
|
)
|
(0.7
|
)
|
0.3
|
|
|||||
|
Net increase (decrease) in cash and cash equivalents
|
156.4
|
|
150.2
|
|
(62.0
|
)
|
|||||
|
Cash and cash equivalents – beginning of period
|
188.1
|
|
37.9
|
|
99.9
|
|
|||||
|
Cash and cash equivalents – end of period
|
$
|
344.5
|
|
$
|
188.1
|
|
$
|
37.9
|
|
||
|
Supplementary disclosure of cash flow information:
|
|||||||||||
|
Interest paid
|
$
|
(195.8
|
)
|
$
|
(267.6
|
)
|
$
|
(302.7
|
)
|
||
|
Taxes paid, net of taxes refunded
|
$
|
(241.2
|
)
|
$
|
(82.5
|
)
|
$
|
(123.2
|
)
|
||
|
Non-cash investing and financing activities:
|
|||||||||||
|
Capital expenditures accrued in accounts payable-trade
|
$
|
0.6
|
|
$
|
0.2
|
|
$
|
0.5
|
|
||
The accompanying notes are an integral part of the consolidated financial statements.
64
|
1.
|
Description of Business and Summary of Significant Accounting Policies
|
Description of Business
CDW Corporation ("Parent") is a Fortune 500 company and a leading provider of integrated information technology (“IT”) solutions to small, medium and large business, government, education and healthcare customers in the U.S. and Canada. The Company's offerings range from discrete hardware and software products to integrated IT solutions such as mobility, security, data center optimization, cloud computing, virtualization and collaboration.
Throughout this report, the terms “the Company” and “CDW” refer to Parent and its 100% owned subsidiaries.
Parent has two 100% owned subsidiaries, CDW LLC and CDW Finance Corporation. CDW LLC is an Illinois limited liability company that, together with its 100% owned subsidiaries, holds all material assets and conducts all business activities and operations of the Company. On August 6, 2010, CDW Finance Corporation, a Delaware corporation, was formed for the sole purpose of acting as co-issuer of certain debt obligations as described in Note 18 and does not hold any material assets or engage in any business activities or operations.
CDW Corporation was previously owned directly by CDW Holdings LLC ("CDW Holdings"), a company controlled by investment funds affiliated with Madison Dearborn Partners, LLC ("Madison Dearborn") and Providence Equity Partners L.L.C. ("Providence Equity," and together with Madison Dearborn, the "Sponsors"), certain other co-investors and certain members of CDW management. On July 2, 2013, Parent completed an initial public offering ("IPO") of its common stock. In connection with the IPO, CDW Holdings distributed all of its shares of Parent's common stock to its members in June 2013 in accordance with the members’ respective membership interests and was subsequently dissolved in August 2013. See Note 9 for additional discussion of the IPO.
Basis of Presentation
The accompanying consolidated financial statements have been prepared in conformity with accounting principles generally accepted in the United States of America (“GAAP”) and the rules and regulations of the U.S. Securities and Exchange Commission (“SEC”).
Principles of Consolidation
The accompanying consolidated financial statements include the accounts of Parent and its 100% owned subsidiaries. All intercompany transactions and accounts are eliminated in consolidation.
Use of Estimates
The preparation of the consolidated financial statements in accordance with GAAP requires management to make use of certain estimates and assumptions that affect the reported amounts of assets and liabilities and disclosure of contingent assets and liabilities at the date of the consolidated financial statements and the reported amounts of revenue and expenses during the reported periods. The Company bases its estimates on historical experience and on various other assumptions that management believes are reasonable under the circumstances, the results of which form the basis for making judgments about carrying values of assets and liabilities that are not readily apparent from other sources. Actual results could differ from those estimates.
Cash and Cash Equivalents
Cash and cash equivalents include all deposits in banks and short-term (original maturities of three months or less), highly liquid investments that are readily convertible to known amounts of cash and are so near maturity that there is insignificant risk of changes in value due to interest rate changes.
Accounts Receivable
Trade accounts receivable are recorded at the invoiced amount and typically do not bear interest. The Company provides allowances for doubtful accounts related to accounts receivable for estimated losses resulting from the inability of its customers to make required payments. The Company takes into consideration the overall quality of the receivable portfolio along with specifically-identified customer risks.
65
Merchandise Inventory
Inventory is valued at the lower of cost or market value. Cost is determined using a weighted-average cost method. Price protection is recorded when earned as a reduction to the cost of inventory. The Company decreases the value of inventory for estimated obsolescence equal to the difference between the cost of inventory and the estimated market value, based upon an aging analysis of the inventory on hand, specifically known inventory-related risks, and assumptions about future demand and market conditions.
Miscellaneous Receivables
Miscellaneous receivables generally consist of amounts due from vendors. The Company receives incentives from vendors related to cooperative advertising allowances, volume rebates, bid programs, price protection and other programs. These incentives generally relate to written vendor agreements with specified performance requirements and are recorded as adjustments to cost of sales or inventory, depending on the nature of the incentive.
Property and Equipment
Property and equipment are stated at cost, less accumulated depreciation. The Company calculates depreciation expense using the straight-line method over the estimated useful lives of the assets. Leasehold improvements are amortized over the shorter of their useful lives or the initial lease term. Expenditures for major renewals and improvements that extend the useful life of property and equipment are capitalized. Expenditures for maintenance and repairs are charged to expense as incurred. The following table shows estimated useful lives of property and equipment:
|
Classification
|
Estimated
Useful Lives
|
|
Machinery and equipment
|
5 to 10 years
|
|
Building and leasehold improvements
|
5 to 25 years
|
|
Computer and data processing equipment
|
3 to 5 years
|
|
Computer software
|
3 to 5 years
|
|
Furniture and fixtures
|
5 to 10 years
|
The Company has asset retirement obligations associated with commitments to return property subject to operating leases to its original condition upon lease termination. The Company’s asset retirement liability was
$0.5 million
as of December 31, 2014 and 2013.
Equity Investments
If the Company is not required to consolidate its investment in another entity because it does not have control, the Company uses the equity method if it (i) can exercise significant influence over the other entity and (ii) holds common stock of the other entity. Under the equity method, investments are carried at cost, plus or minus the Company’s share of equity in the increases and decreases in the investee’s net assets after the date of acquisition and adjustments for basis differences. The Company’s share of the net income or loss of equity method investees is included in other income, net in the consolidated statements of operations.
Goodwill and Other Intangible Assets
The Company is required to perform an evaluation of goodwill on an annual basis or more frequently if circumstances indicate a potential impairment. The annual test for impairment is conducted as of December 1. The Company’s reporting units used to assess potential goodwill impairment are the same as its operating segments. The Company has the option of performing a qualitative assessment of a reporting unit's fair value from the last quantitative assessment to determine if it is more likely than not that the reporting unit's goodwill is impaired or performing a quantitative assessment by comparing a reporting unit's estimated fair value to its carrying amount. Under the quantitative assessment, testing for impairment of goodwill is a two-step process. The first step compares the fair value of a reporting unit with its carrying amount, including goodwill. If the carrying amount of a reporting unit exceeds its fair value, the second step compares the implied fair value of reporting unit goodwill with the carrying amount of that goodwill to determine the amount of impairment loss. Fair value of a reporting unit is determined by using a weighted combination of an income approach and a market approach, as this combination is considered the most indicative of the Company’s fair value in an orderly transaction between market participants. This assessment uses significant
66
accounting judgments, estimates and assumptions. Any changes in the judgments, estimates or assumptions used could produce significantly different results. During the years ended
December 31, 2014, 2013 and 2012
, the Company concluded its goodwill was not impaired. See Note 4 for more information on the Company’s evaluations of goodwill for impairment.
Intangible assets with determinable lives are amortized on a straight-line basis over their respective estimated useful lives. The cost of computer software developed or obtained for internal use is capitalized and amortized on a straight-line basis over the estimated useful life of the software. These intangible assets are reviewed for impairment when indicators are present using undiscounted cash flows. The Company uses the undiscounted cash flows, excluding interest charges, to assess the recoverability of the carrying value of such assets. To the extent carrying value exceeds the undiscounted cash flows, an impairment loss is recorded based upon the excess of the carrying value over fair value. In addition, each quarter, the Company evaluates whether events and circumstances warrant a revision to the remaining estimated useful life of each of these intangible assets. If the Company were to determine that a change to the remaining estimated useful life of an intangible asset was necessary, then the remaining carrying amount of the intangible asset would be amortized prospectively over that revised remaining useful life. During the years ended
December 31, 2014, 2013 and 2012
,
no
impairment existed with respect to the Company’s intangible assets with determinable lives and no significant changes to the remaining useful lives were necessary. The following table shows estimated useful lives of definite-lived intangible assets:
|
Classification
|
Estimated
Useful Lives
|
|
Customer relationships
|
11 to 14 years
|
|
Trade name
|
20 years
|
|
Internally developed software
|
3 to 5 years
|
|
Other
|
1 to 10 years
|
Deferred Financing Costs
Deferred financing costs, such as underwriting, financial advisory, professional fees and other similar fees are capitalized and recognized in interest expense over the estimated life of the related debt instrument using the effective interest method or straight-line method, as applicable.
Derivatives
The Company has entered into interest rate cap agreements for the purpose of economically hedging its exposure to fluctuations in interest rates. These derivatives are recorded at fair value in the Company’s consolidated balance sheets.
The Company’s interest rate cap agreements are not designated as cash flow hedges of interest rate risk. Changes in fair value of the derivatives are recorded directly to interest expense in the Company’s consolidated statements of operations.
Fair Value Measurements
Fair value is defined under GAAP as the price that would be received to sell an asset or paid to transfer a liability in an orderly transaction between market participants at the measurement date. A fair value hierarchy has been established for valuation inputs to prioritize the inputs into three levels based on the extent to which inputs used in measuring fair value are observable in the market. Each fair value measurement is reported in one of the three levels which is determined by the lowest level input that is significant to the fair value measurement in its entirety. These levels are:
Level 1 – observable inputs such as quoted prices for identical instruments traded in active markets.
Level 2 – inputs are based on quoted prices for similar instruments in active markets, quoted prices for identical or similar instruments in markets that are not active, and model-based valuation techniques for which all significant assumptions are observable in the market or can be corroborated by observable market data for substantially the full term of the assets or liabilities.
Level 3 – inputs are generally unobservable and typically reflect management’s estimates of assumptions that market participants would use in pricing the asset or liability. The fair values are therefore determined using model-based techniques that include option pricing models, discounted cash flow models and similar techniques.
67
Accumulated Other Comprehensive (Loss) Income
Foreign currency translation adjustments are included in shareholders’ equity under accumulated other comprehensive (loss) income.
The components of accumulated other comprehensive (loss) income are as follows:
|
(in millions)
|
December 31,
|
||||||||||
|
|
2014
|
2013
|
2012
|
||||||||
|
Foreign currency translation adjustment
|
$
|
(16.6
|
)
|
$
|
(6.3
|
)
|
$
|
0.4
|
|
||
|
Accumulated other comprehensive (loss) income
|
$
|
(16.6
|
)
|
$
|
(6.3
|
)
|
$
|
0.4
|
|
||
Revenue Recognition
The Company is a primary distribution channel for a large group of vendors and suppliers, including original equipment manufacturers (“OEMs”), software publishers and wholesale distributors. The Company records revenue from sales transactions when title and risk of loss are passed to the customer, there is persuasive evidence of an arrangement for sale, delivery has occurred and/or services have been rendered, the sales price is fixed or determinable, and collectability is reasonably assured. The Company's shipping terms typically specify F.O.B. destination, at which time title and risk of loss have passed to the customer.
Revenues from the sales of hardware products and software products and licenses are generally recognized on a gross basis with the selling price to the customer recorded as sales and the acquisition cost of the product recorded as cost of sales. These items can be delivered to customers in a variety of ways, including (i) as physical product shipped from the Company's warehouse, (ii) via drop-shipment by the vendor or supplier, or (iii) via electronic delivery for software licenses. At the time of sale, the Company records an estimate for sales returns and allowances based on historical experience. The Company's vendor partners warrant most of the products the Company sells.
The Company leverages drop-shipment arrangements with many of its vendors and suppliers to deliver products to its customers without having to physically hold the inventory at its warehouses, thereby increasing efficiency and reducing costs. The Company recognizes revenue for drop-shipment arrangements on a gross basis upon delivery to the customer with contract terms that typically specify F.O.B. destination.
Revenue from professional services is either recognized as provided for services billed at an hourly rate or recognized using a proportional performance model for services provided at a fixed fee. Revenue from cloud computing solutions including Software as a Service ("SaaS") and Infrastructure as a Service ("IaaS") arrangements, as well as data center services such as managed and remote managed services, server co-location, internet connectivity and data backup and storage, is recognized over the period service is provided.
The Company also sells certain products for which it acts as an agent. Products in this category include the sale of third-party services, warranties, software assurance (“SA”) and third-party hosted SaaS and IaaS arrangements. SA is a product that allows customers to upgrade, at no additional cost, to the latest technology if new applications are introduced during the period that the SA is in effect. These sales do not meet the criteria for gross sales recognition, and thus are recognized on a net basis at the time of sale. Under net sales recognition, the cost paid to the vendor or third-party service provider is recorded as a reduction to sales, resulting in net sales being equal to the gross profit on the transaction.
The Company's larger customers are offered the opportunity by certain of its vendors to purchase software licenses and SA under enterprise agreements (“EAs”). Under EAs, customers are considered to be compliant with applicable license requirements for the ensuing year, regardless of changes to their employee base. Customers are charged an annual true-up fee for changes in the number of users over the year. With most EAs, the Company's vendors will transfer the license and bill the customer directly, paying resellers such as the Company an agency fee or commission on these sales. The Company records these fees as a component of net sales as earned and there is no corresponding cost of sales amount. In certain instances, the Company bills the customer directly under an EA and accounts for the individual items sold based on the nature of the item. The Company's vendors typically dictate how the EA will be sold to the customer.
From time to time, the Company sells some of its products and services as part of bundled contract arrangements containing multiple deliverables, which may include a combination of products and services. For each deliverable that represents a separate unit of accounting, total arrangement consideration is allocated based upon the relative selling
68
prices of each element. The allocated arrangement consideration is recognized as revenue in accordance with the principles described above. Selling prices are determined by using vendor specific objective evidence (“VSOE”) if it exists. Otherwise, selling prices are determined using third party evidence (“TPE”). If neither VSOE or TPE is available, the Company uses its best estimate of selling prices.
The Company records freight billed to its customers as net sales and the related freight costs as a cost of sales.
Deferred revenue includes (1) payments received from customers in advance of providing the product or performing services, and (2) amounts deferred if other conditions of revenue recognition have not been met.
The Company performs an analysis of the estimated number of days of sales in-transit to customers at the end of each period based on a weighted-average analysis of commercial delivery terms that includes drop-shipment arrangements. This analysis is the basis upon which the Company estimates the amount of sales in-transit at the end of the period and adjusts revenue and the related costs to reflect only what has been received by the customer. Changes in delivery patterns may result in a different number of business days used in making this adjustment and could have a material impact on the Company's revenue recognition for the period.
Sales Taxes
Sales tax amounts collected from customers for remittance to governmental authorities are presented on a net basis in the Company’s consolidated statements of operations.
Advertising
Advertising costs are generally charged to expense in the period incurred. Cooperative reimbursements from vendors are recorded in the period the related advertising expenditure is incurred. The Company classifies vendor consideration as a reduction to cost of sales.
Equity-Based Compensation
The Company measures all equity-based payments using a fair-value-based method and records compensation expense over the requisite service period using the straight-line method in its consolidated financial statements. Estimated forfeiture rates have been developed based upon historical experience.
Interest Expense
Interest expense is typically recognized in the period incurred at the applicable interest rate in effect. For increasing-rate debt, the Company determines the periodic interest cost using the effective interest method over the estimated outstanding term of the debt. The difference between interest expense recorded and cash interest paid is reflected as short-term or long-term accrued interest in the Company’s consolidated balance sheets.
Foreign Currency Translation
The Company’s functional currency is the U.S. dollar. The functional currency of the Company’s Canadian subsidiary is the local currency, the Canadian dollar. The functional currency of the Company's equity investment in Kelway TopCo Limited ("Kelway") is the local currency, the British pound sterling. Assets and liabilities of the Canadian subsidiary and the Company’s share of assets and liabilities in Kelway are translated at the spot rate in effect at the applicable reporting date and the consolidated results of operations of the Canadian subsidiary and the Company’s share of the net income or loss of Kelway are translated at the average exchange rates in effect during the applicable period. The resulting foreign currency translation adjustment is recorded as accumulated other comprehensive (loss) income, which is reflected as a separate component of shareholders’ equity.
Income Taxes
Deferred income taxes are provided to reflect the differences between the tax bases of assets and liabilities and their reported amounts in the consolidated financial statements using enacted tax rates in effect for the year in which the differences are expected to reverse. The Company performs an evaluation of the realizability of deferred tax assets on a quarterly basis. This evaluation requires management to make use of estimates and assumptions and considers all positive and negative evidence and factors, such as the scheduled reversal of temporary differences, the mix of earnings in the jurisdictions in which the Company operates, and prudent and feasible tax planning strategies.
69
The Company accounts for unrecognized tax benefits based upon its assessment of whether a tax benefit is more likely than not to be sustained upon examination by tax authorities. The Company reports a liability for unrecognized tax benefits resulting from unrecognized tax benefits taken or expected to be taken in a tax return and recognizes interest and penalties, if any, related to its unrecognized tax benefits in income tax expense.
|
2.
|
Recent Accounting Pronouncements
|
Stock Compensation - Performance Share Awards
In June 2014, the Financial Accounting Standards Board (the "FASB") issued Accounting Standards Update ("ASU") 2014-12, “Compensation - Stock Compensation,” which amended the standard on how to account for share-based payments when the terms of an award provide that a performance target could be achieved after the requisite service period. Under this ASU, a performance target that could be achieved after the requisite service period is required to be treated as a performance condition that affects the vesting of the award and should not be reflected in estimating the fair value of the award at the grant date. This ASU is effective for the first quarter of 2016 with early adoption permitted. The Company already accounts for performance shares utilizing the method outlined by this ASU and is not impacted by the new standard.
Revenue Recognition
In May 2014, the FASB issued ASU 2014-09, "Revenue from Contracts with Customers," which outlines a single comprehensive model for entities to use in accounting for revenue arising from contracts with customers and supersedes the most current revenue recognition standard. This ASU is effective for the Company for the first quarter of 2017 and early adoption is not permitted. This ASU allows for either a full retrospective adoption approach or a modified retrospective adoption approach. The Company is currently evaluating the impact that this ASU will have on its consolidated financial position, results of operations and cash flows.
|
3.
|
Property and Equipment
|
Property and equipment consisted of the following:
|
(in millions)
|
December 31,
|
||||||
|
|
2014
|
2013
|
|||||
|
Land
|
$
|
27.7
|
|
$
|
27.7
|
|
|
|
Machinery and equipment
|
54.3
|
|
53.0
|
|
|||
|
Building and leasehold improvements
|
105.1
|
|
104.8
|
|
|||
|
Computer and data processing equipment
|
65.6
|
|
61.2
|
|
|||
|
Computer software
|
10.6
|
|
30.9
|
|
|||
|
Furniture and fixtures
|
21.7
|
|
21.6
|
|
|||
|
Construction in progress
|
24.7
|
|
10.9
|
|
|||
|
Property and equipment
|
309.7
|
|
310.1
|
|
|||
|
Less: accumulated depreciation
|
172.5
|
|
179.0
|
|
|||
|
Property and equipment, net
|
$
|
137.2
|
|
$
|
131.1
|
|
|
During 2014, 2013 and 2012, the Company recorded disposals of
$32.0 million
,
$7.9 million
and
$12.2 million
, respectively, to remove assets that were no longer in use from property and equipment. The Company recorded a pre-tax loss of
$0.1 million
,
$0.0 million
and
$0.1 million
in 2014, 2013 and 2012, respectively, for certain disposed assets that were not fully depreciated.
Depreciation expense for the years ended December 31, 2014, 2013 and 2012 was
$25.8 million
,
$27.2 million
and
$32.0 million
, respectively.
|
4.
|
Goodwill and Other Intangible Assets
|
As described in Note 1, the Company is required to perform an evaluation of goodwill on an annual basis or more frequently if circumstances indicate a potential impairment. The annual test for impairment is conducted as of December 1. The Company’s reporting units used to assess potential goodwill impairment are the same as its operating segments. The Company has
two
reportable segments: Corporate, which is comprised primarily of business customers,
70
and Public, which is comprised of government entities and education and healthcare institutions. The Company also has
three
other operating segments, CDW Advanced Services, Canada, and Kelway, which do not meet the reportable segment quantitative thresholds and, accordingly, are combined together as “Other” for segment reporting purposes. The Company has the option of performing a qualitative assessment of a reporting unit's fair value from the last quantitative assessment to determine if it is more likely than not that the reporting unit's goodwill is impaired or performing a quantitative assessment by comparing a reporting unit's estimated fair value to its carrying amount. Under the quantitative assessment, testing for impairment of goodwill is a two-step process. The first step compares the fair value of a reporting unit with its carrying amount, including goodwill. If the carrying amount of a reporting unit exceeds its fair value, the second step compares the implied fair value of reporting unit goodwill with the carrying amount of that goodwill to determine the amount of impairment loss. Fair value of a reporting unit is determined by using a weighted combination of an income approach and a market approach, as this combination is considered the most indicative of the Company’s fair value in an orderly transaction between market participants. Under the income approach, the Company determined fair value based on estimated future cash flows of a reporting unit, discounted by an estimated weighted-average cost of capital, which reflects the overall level of inherent risk of a reporting unit and the rate of return an outside investor would expect to earn. Under the market approach, the Company utilized valuation multiples derived from publicly available information for guideline companies to provide an indication of how much a knowledgeable investor in the marketplace would be willing to pay for a company. The valuation multiples were applied to the reporting units. Determining the fair value of a reporting unit is judgmental in nature and requires the use of significant estimates and assumptions, including revenue growth rates, gross margins, operating margins, discount rates and future market conditions, among others.
December 1, 2014 Evaluation
The Company performed its annual evaluation of goodwill as of December 1, 2014 by utilizing a quantitative assessment for all reporting units. All reporting units passed the first step of the goodwill evaluation (with the fair value exceeding the carrying value by
169%
,
147%
,
276%
and
78%
for the Corporate, Public, Canada and CDW Advanced Services reporting units, respectively) and, accordingly, the Company was not required to perform the second step of the goodwill evaluation.
To determine the fair value of the reporting units, the Company used a
75%
/
25%
weighting of the income approach and market approach, respectively. Under the income approach, the Company estimated future cash flows of each reporting unit based on internally generated forecasts for the remainder of 2014 and the next
six
years. The Company used a
3.5%
long-term assumed consolidated annual revenue growth rate for periods after the six-year forecast. The estimated future cash flows for the Corporate and Public reporting units were discounted at
9.0%
; cash flows for the Canada and CDW Advanced Services reporting units were discounted at
9.3%
and
11.5%
, respectively, based on the future growth rates assumed in the discounted cash flows. Discount rates utilized during the 2014 goodwill evaluation declined compared to those used in 2013 as a result of the market performance of the Company's common stock and a lower equity risk premium with the exception of CDW Advanced Services. The discount rate for CDW Advanced Services increased to account for additional forecast risk.
December 1, 2013 Evaluation
The Company performed its annual evaluation of goodwill as of December 1, 2013 by utilizing a quantitative assessment for all reporting units. All reporting units passed the first step of the goodwill evaluation (with the fair value exceeding the carrying value by
107%
,
82%
,
167%
and
168%
for the Corporate, Public, Canada and CDW Advanced Services reporting units, respectively) and, accordingly, the Company was not required to perform the second step of the goodwill evaluation.
To determine the fair value of the reporting units, the Company used a
75%
/
25%
weighting of the income approach and market approach, respectively. Under the income approach, the Company estimated future cash flows of each reporting unit based on internally generated forecasts for the remainder of 2013 and the next
six
years. The Company used a
3.5%
long-term assumed consolidated annual revenue growth rate for periods after the six-year forecast. The estimated future cash flows for the Corporate and Public reporting units were discounted at
10.0%
; cash flows for the Canada and CDW Advanced Services reporting units were discounted at
10.3%
and
10.5%
, respectively, based on the future growth rates assumed in the discounted cash flows. Discount rates utilized during the 2013 goodwill evaluation declined compared to those used in 2012 as a result of the market performance of the Company's common stock and a lower equity risk premium.
December 1, 2012 Evaluation
71
The Company performed its annual evaluation of goodwill as of December 1, 2012 by utilizing a quantitative assessment for all reporting units. All reporting units passed the first step of the goodwill evaluation (with the fair value exceeding the carrying value by
49%
,
44%
,
104%
and
17%
for the Corporate, Public, Canada and CDW Advanced Services reporting units, respectively) and, accordingly, the Company was not required to perform the second step of the goodwill evaluation.
To determine the fair value of the reporting units, the Company used a
75%
/
25%
weighting of the income approach and market approach, respectively. Under the income approach, the Company estimated future cash flows of each reporting unit based on internally generated forecasts for the remainder of 2012 and the next
six
years. The Company used a
3.5%
long-term assumed consolidated annual revenue growth rate for periods after the six-year forecast. The estimated future cash flows for the Corporate and Public reporting units were discounted at
11.5%
; cash flows for the Canada and CDW Advanced Services reporting units were discounted at
11.8%
and
12.0%
, respectively, based on the future growth rates assumed in the discounted cash flows.
The following table presents the change in goodwill by segment for the years ended
December 31, 2014 and 2013
:
|
(in millions)
|
Corporate
|
Public
|
Other
(1)
|
Consolidated
|
|||||||||||
|
Balances as of December 31, 2012:
|
|||||||||||||||
|
Goodwill
|
$
|
2,794.4
|
|
$
|
1,261.4
|
|
$
|
107.3
|
|
$
|
4,163.1
|
|
|||
|
Accumulated impairment charges
|
(1,571.4
|
)
|
(354.1
|
)
|
(28.3
|
)
|
(1,953.8
|
)
|
|||||||
|
$
|
1,223.0
|
|
$
|
907.3
|
|
$
|
79.0
|
|
$
|
2,209.3
|
|
||||
|
2013 Activity:
|
|||||||||||||||
|
Translation adjustment
|
$
|
—
|
|
$
|
—
|
|
$
|
(2.1
|
)
|
$
|
(2.1
|
)
|
|||
|
Contingent consideration
(2)
|
8.8
|
|
4.0
|
|
0.3
|
|
13.1
|
|
|||||||
|
$
|
8.8
|
|
$
|
4.0
|
|
$
|
(1.8
|
)
|
$
|
11.0
|
|
||||
|
Balances as of December 31, 2013:
|
|||||||||||||||
|
Goodwill
|
$
|
2,803.2
|
|
$
|
1,265.4
|
|
$
|
105.5
|
|
$
|
4,174.1
|
|
|||
|
Accumulated impairment charges
|
(1,571.4
|
)
|
(354.1
|
)
|
(28.3
|
)
|
(1,953.8
|
)
|
|||||||
|
$
|
1,231.8
|
|
$
|
911.3
|
|
$
|
77.2
|
|
$
|
2,220.3
|
|
||||
|
2014 Activity:
|
|||||||||||||||
|
Translation adjustment
|
$
|
—
|
|
$
|
—
|
|
$
|
(2.7
|
)
|
$
|
(2.7
|
)
|
|||
|
$
|
—
|
|
$
|
—
|
|
$
|
(2.7
|
)
|
$
|
(2.7
|
)
|
||||
|
Balances as of December 31, 2014:
|
|||||||||||||||
|
Goodwill
|
$
|
2,803.2
|
|
$
|
1,265.4
|
|
$
|
102.8
|
|
$
|
4,171.4
|
|
|||
|
Accumulated impairment charges
|
(1,571.4
|
)
|
(354.1
|
)
|
(28.3
|
)
|
(1,953.8
|
)
|
|||||||
|
$
|
1,231.8
|
|
$
|
911.3
|
|
$
|
74.5
|
|
$
|
2,217.6
|
|
||||
|
(1)
|
Other is comprised of CDW Advanced Services, Canada, and Kelway reporting units. There is
no
goodwill attributable to the Kelway reporting unit.
|
|
(2)
|
During 2013, the Company recorded a
$13.1 million
net-of-tax addition to goodwill in connection with the settlement of the MPK Coworker Incentive Plan II and related charitable contribution. The charitable contribution was accounted for as additional purchase price (goodwill) in accordance with pre-2009 business combinations accounting guidance. See Note 10 for additional discussion of this transaction.
|
72
The following table presents a summary of intangible assets at
December 31, 2014 and 2013
:
|
(in millions)
|
|
|
|
|||||||||
|
December 31, 2014
|
Gross
Carrying
Amount
|
Accumulated
Amortization
|
Net Carrying Amount
|
|||||||||
|
Customer relationships
|
$
|
1,859.7
|
|
$
|
1,012.1
|
|
$
|
847.6
|
|
|||
|
Trade name
|
421.0
|
|
152.0
|
|
269.0
|
|
||||||
|
Internally developed software
|
110.1
|
|
58.9
|
|
51.2
|
|
||||||
|
Other
|
3.2
|
|
2.2
|
|
1.0
|
|
||||||
|
Total
|
$
|
2,394.0
|
|
$
|
1,225.2
|
|
$
|
1,168.8
|
|
|||
|
December 31, 2013
|
|
|
|
|||||||||
|
Customer relationships
|
$
|
1,860.8
|
|
$
|
872.8
|
|
$
|
988.0
|
|
|||
|
Trade name
|
421.0
|
|
130.9
|
|
290.1
|
|
||||||
|
Internally developed software
|
128.5
|
|
79.8
|
|
48.7
|
|
||||||
|
Other
|
3.1
|
|
1.9
|
|
1.2
|
|
||||||
|
Total
|
$
|
2,413.4
|
|
$
|
1,085.4
|
|
$
|
1,328.0
|
|
|||
During 2014, the Company recorded disposals of
$41.7 million
to remove fully amortized internally developed software assets that were no longer in use from intangible assets.
Amortization expense related to intangible assets for the years ended
December 31, 2014, 2013 and 2012
was
$182.1 million
,
$181.0 million
and
$178.2 million
, respectively.
Estimated future amortization expense related to intangible assets for the next five years is as follows:
|
(in millions)
|
|
||
|
Years ending December 31,
|
|
||
|
2015
|
$
|
180.7
|
|
|
2016
|
172.8
|
|
|
|
2017
|
167.1
|
|
|
|
2018
|
160.4
|
|
|
|
2019
|
158.9
|
|
|
|
5.
|
Inventory Financing Agreements
|
The Company has entered into agreements with certain financial intermediaries to facilitate the purchase of inventory from various suppliers under certain terms and conditions, as described below. These amounts are classified separately as accounts payable-inventory financing on the accompanying consolidated balance sheets. The Company does not incur any interest expense associated with these agreements as balances are paid when they are due.
The following table presents the amounts included in accounts payable-inventory financing:
|
(in millions)
|
December 31,
|
|||||||
|
2014
|
2013
|
|||||||
|
Revolving Loan inventory financing agreement
|
$
|
330.1
|
|
$
|
256.1
|
|
||
|
Other inventory financing agreements
|
2.0
|
|
0.5
|
|
||||
|
Accounts payable-inventory financing
|
$
|
332.1
|
|
$
|
256.6
|
|
||
As described in Note 7, in June 2014, the Company entered into a new senior secured asset-based revolving credit facility, which incorporates the previous inventory floorplan sub-facility and, among other changes, removes the
$400.0 million
limit on the size of the floorplan sub-facility. In connection with the floorplan sub-facility, the Company maintains an inventory financing agreement on an unsecured basis with a financial intermediary to facilitate
73
the purchase of inventory from this vendor (the “Revolving Loan inventory financing agreement”). Amounts outstanding under the Revolving Loan inventory financing agreement are unsecured and non-interest bearing.
The Company also maintains other inventory financing agreements with financial intermediaries to facilitate the purchase of inventory from certain vendors. At
December 31, 2014 and 2013
, amounts owed under other inventory financing agreements of
$2.0 million
and
$0.5 million
, respectively, were collateralized by the inventory purchased under these financing agreements and a second lien on the related accounts receivable.
|
6.
|
Lease Commitments
|
The Company is obligated under various non-cancelable operating lease agreements for office facilities that generally provide for minimum rent payments and a proportionate share of operating expenses and property taxes and include certain renewal and expansion options. For the years ended
December 31, 2014, 2013 and 2012
, rent expense under these lease arrangements was
$21.4 million
,
$20.7 million
and
$22.4 million
, respectively.
Future minimum lease payments are as follows:
|
(in millions)
|
|||
|
Years ending December 31,
|
|||
|
2015
|
$
|
19.1
|
|
|
2016
|
15.3
|
|
|
|
2017
|
16.1
|
|
|
|
2018
|
13.6
|
|
|
|
2019
|
12.8
|
|
|
|
Thereafter
|
50.6
|
|
|
|
Total future minimum lease payments
(1)
|
$
|
127.5
|
|
(1) Included in these amounts are future minimum lease payments commencing in the fourth quarter of 2016 that relate to a new lease entered into in December 2014 for the Company’s future headquarters in Lincolnshire, Illinois. Also reflected in these amounts is the future expiration of two leases in the first quarter of 2016 for facilities currently in use by the Company which the Company plans to consolidate into the new headquarters location and accordingly, these leases will not be renewed.
|
7.
|
Long-Term Debt
|
Long-term debt was as follows:
|
(dollars in millions)
|
December 31,
|
|||||||||
|
|
Interest Rate
(1)
|
2014
|
2013
|
|||||||
|
Senior secured asset-based revolving credit facility
|
—
|
%
|
$
|
—
|
|
$
|
—
|
|
||
|
Senior secured term loan facility
|
3.25
|
%
|
1,513.5
|
|
1,528.9
|
|
||||
|
Unamortized discount on senior secured term loan facility
|
(3.7
|
)
|
(4.4
|
)
|
||||||
|
Senior secured notes due 2018
|
—
|
%
|
—
|
|
325.0
|
|
||||
|
Senior notes due 2019
|
8.5
|
%
|
503.9
|
|
1,305.0
|
|
||||
|
Unamortized premium on senior notes due 2019
|
1.3
|
|
4.2
|
|
||||||
|
Senior notes due 2022
|
6.0
|
%
|
600.0
|
|
—
|
|
||||
|
Senior notes due 2024
|
5.5
|
%
|
575.0
|
|
—
|
|
||||
|
Senior subordinated notes due 2017
|
—
|
%
|
—
|
|
92.5
|
|
||||
|
Total long-term debt
|
3,190.0
|
|
3,251.2
|
|
||||||
|
Less current maturities of long-term debt
|
(15.4
|
)
|
(45.4
|
)
|
||||||
|
Long-term debt, excluding current maturities
|
$
|
3,174.6
|
|
$
|
3,205.8
|
|
||||
(1)
Interest rate at
December 31, 2014
.
At
December 31, 2014
, the Company was in compliance with the covenants under its various credit agreements and indentures as described below. Under the indenture governing the
8.5%
Senior Notes due 2019, which contains the
74
most restrictive restricted payment provisions in the Company’s various credit agreements and indentures, CDW LLC and its restricted subsidiaries are generally restricted from paying dividends and making other restricted payments. For the purpose of determining restricted payment capacity, consolidated net income or loss includes certain adjustments that are defined in the applicable indenture. At
December 31, 2014
, the amount of cumulative consolidated net income free of restrictions under the credit agreements and indentures ("Restricted Payment Capacity") was
$230.3 million
.
Senior Secured Asset-Based Revolving Credit Facility (“Revolving Loan”)
At
December 31, 2014
, the Company had
no
outstanding borrowings under the Revolving Loan,
$2.1 million
of undrawn letters of credit and
$312.3 million
reserved related to the floorplan sub-facility.
On June 6, 2014, the Company entered into the Revolving Loan, a new five-year
$1,250.0 million
senior secured asset-based revolving credit facility, with the facility being available to the Company for borrowings, issuance of letters of credit and floorplan financing for certain vendor products. The Revolving Loan matures on June 6, 2019, subject to an acceleration provision discussed below. The Revolving Loan replaces the Company’s previous revolving loan credit facility that was to mature on June 24, 2016. The Revolving Loan (i) increases the overall revolving credit facility capacity available to the Company from
$900.0 million
to
$1,250.0 million
, (ii) increases the maximum aggregate amount of increases that may be made to the revolving credit facility from
$200.0 million
to
$300.0 million
, (iii) maintains a maturity acceleration provision based upon excess cash availability whereby the Revolving Loan may mature
45
days prior to the final maturity of any then outstanding senior debt if excess cash availability does not exceed the outstanding borrowings of the subject maturing debt at the time of the test plus
$150.0 million
, (iv) decreases the fee on the unused portion of the revolving credit facility from either
37.5
or
50
basis points, depending on the amount of utilization, to
25
basis points, (v) decreases the applicable interest rate margin by
50
basis points, and (vi) amends the existing inventory floorplan sub-facility as discussed below. In connection with the termination of the previous facility, the Company recorded a loss on extinguishment of long-term debt of
$0.4 million
in the consolidated statement of operations for the year ended
December 31, 2014
, representing a write-off of a portion of unamortized deferred financing costs. Fees of
$6.4 million
related to the Revolving Loan were capitalized as deferred financing costs and are being amortized over the five-year term of the facility on a straight-line basis.
The Revolving Loan incorporates the previous inventory floorplan sub-facility and related Revolving Loan inventory financing agreement while removing the previous
$400.0 million
limit on the size of the floorplan sub-facility and the in-transit reserve of
15%
of open orders. At
December 31, 2014
, the financial intermediary reported an outstanding balance of
$312.3 million
under the Revolving Loan inventory financing agreement. The amount included on the Company's consolidated balance sheet as of
December 31, 2014
as accounts payable-inventory financing related to the Revolving Loan inventory financing agreement of
$330.1 million
includes a
$17.8 million
accrual for amounts in transit.
Borrowings under the Revolving Loan bear interest at a variable interest rate plus an applicable margin. The interest rate margin is based on one of two indices, either (i) LIBOR, or (ii) the Alternate Base Rate (“ABR”) with the ABR being the greater of (a) the prime rate, (b) the federal funds effective rate plus
50
basis points or (c) the one-month LIBOR plus
1.00%
. The applicable margin varies (
1.50%
to
2.00%
for LIBOR borrowings and
0.50%
to
1.00%
for ABR borrowings) depending upon average daily excess cash availability under the agreement evidencing the Revolving Loan and is subject to a reduction of
0.25%
if, and for as long as, CDW LLC's corporate credit rating from Standard & Poor’s Rating Services is BB or better and CDW LLC's corporate family rating from Moody’s Investors Service, Inc. is Ba3 or better (in each case with stable or better outlook).
Under the new Revolving Loan, the Company is permitted to borrow an aggregate amount of
$1,250.0 million
; however, its ability to borrow under the Revolving Loan is limited by a borrowing base. The borrowing base is (a) the sum of the products of the applicable advance rates on eligible accounts receivable and on eligible inventory as defined in the agreement less (b) any reserves. At
December 31, 2014
, the borrowing base was
$1,253.4 million
based on the amount of eligible inventory and accounts receivable balances as of November 30, 2014. The Company could have borrowed up to an additional
$935.6 million
under the Revolving Loan at
December 31, 2014
.
The ability to borrow under the Revolving Loan also remains limited by a minimum liquidity condition which provides that, if excess cash availability is less than the lesser of (i)
$125.0 million
and (ii) the greater of (A)
10.0%
of the borrowing base and (B)
$100.0 million
, the lenders are not required to lend any additional amounts under the Revolving Loan unless the consolidated fixed charge coverage ratio (as described in the agreement evidencing the Revolving Loan) is at least
1.00
to
1.00
.
75
CDW LLC is the borrower under the Revolving Loan. All obligations under the Revolving Loan are guaranteed by Parent and each of CDW LLC's direct and indirect, 100% owned, domestic subsidiaries. Borrowings under the Revolving Loan are collateralized by a first priority interest in inventory (excluding inventory collateralized under the inventory floorplan arrangements as described in Note 5), deposits, and accounts receivable, and a second priority interest in substantially all other assets. The Revolving Loan contains negative covenants that, among other things, place restrictions and limitations on the ability of Parent and each of CDW LLC's direct and indirect, 100% owned, domestic subsidiaries to dispose of assets, incur additional indebtedness, incur guarantee obligations, prepay other indebtedness, make distributions or other restricted payments, create liens, make equity or debt investments, make acquisitions, engage in mergers or consolidations, or engage in certain transactions with affiliates. The Revolving Loan also includes maintenance of a minimum average daily excess cash availability requirement. Should the Company fall below the minimum average daily excess cash availability requirement for
five
consecutive business days, the Company becomes subject to a fixed charge coverage ratio until such time as the daily excess cash availability requirement is met for
30
consecutive business days.
Senior Secured Term Loan Facility
On April 29, 2013, the Company entered into a seven-year,
$1,350.0 million
aggregate principal amount senior secured term loan facility (the "Term Loan"). The Term Loan was issued at a price that was
99.75%
of par, which resulted in a discount of
$3.4 million
. Substantially all of the proceeds from the Term Loan were used to repay the
$1,299.5 million
outstanding aggregate principal amount of the prior senior secured term loan facility (the "Prior Term Loan Facility"). In connection with this refinancing, the Company recorded a loss on extinguishment of long-term debt of
$10.3 million
in the consolidated statement of operations for the year ended December 31, 2013. This loss represented a write-off of the remaining unamortized deferred financing costs related to the Prior Term Loan Facility.
On July 31, 2013, the Company borrowed an additional
$190.0 million
aggregate principal amount under the Term Loan at a price that was
99.25%
of par, which resulted in a discount of
$1.4 million
. Such proceeds were used to redeem a portion of outstanding Senior Subordinated Notes. The discounts are reported on the consolidated balance sheet as a reduction to the face amount of the Term Loan and are being amortized to interest expense over the term of the related debt. Fees of
$6.1 million
related to the Term Loan were capitalized as deferred financing costs and are being amortized over the term of the facility using the effective interest method.
The Company is required to pay quarterly principal installments equal to
0.25%
of the original principal amount of the Term Loan, with the remaining principal amount payable on the maturity date of April 29, 2020. The quarterly principal installment payments commenced during the quarter ended June 30, 2013. At
December 31, 2014
, the outstanding principal amount of the Term Loan was
$1,513.5 million
, excluding
$3.7 million
in unamortized discount.
Borrowings under the Term Loan bear interest at either (a) the alternate base rate ("ABR") plus a margin or (b) LIBOR plus a margin; provided that for the purposes of the Term Loan, LIBOR shall not be less than
1.00%
per annum at any time ("LIBOR Floor"). The margin is based upon a net leverage ratio as defined in the agreement governing the Term Loan, ranging from
1.25%
to
1.50%
for ABR borrowings and
2.25%
to
2.50%
for LIBOR borrowings. The total net leverage ratio was
3.1
at
December 31, 2014
. An interest rate of
3.25%
, LIBOR Floor plus a
2.25%
margin, was in effect during the three-month period ended
December 31, 2014
.
In order to manage the risk associated with changes in interest rates on borrowings under the Term Loan, the Company has entered into interest rate cap agreements. The Company had
ten
interest rate cap agreements in effect through January 14, 2015 with a combined notional amount of
$1,150.0 million
which entitled the Company to payments from the counterparty of the amount, if any, by which three-month LIBOR exceeds a weighted average rate of
2.4%
during the agreement period. The fair value of these interest rate cap agreements was
zero
at both
December 31, 2014
and 2013.
In connection with the expiration of the ten interest rate cap agreements noted above, during the year ended
December 31, 2014
, the Company entered into
14
additional interest rate cap agreements with a combined notional amount of
$1,000.0 million
. Under these agreements, the Company made premium payments totaling
$2.1 million
to the counterparties in exchange for the right to receive payments equal to the amount, if any, by which three-month LIBOR exceeds
2.0%
during the agreement period. These interest rate cap agreements are effective from January 14, 2015 through January 14, 2017. The fair value of these interest rate cap agreements was
$1.7 million
at
December 31, 2014
.
The Company's interest rate cap agreements have not been designated as cash flow hedges of interest rate risk for GAAP accounting purposes. The interest rate cap agreements are recorded at fair value on the Company’s
76
consolidated balance sheet in Other Assets each period, with changes in fair value recorded directly to interest expense in the Company’s consolidated statements of operations. The fair value of the Company’s interest rate cap agreements is classified as Level 2 in the fair value hierarchy. The valuation of the interest rate cap agreements is derived by using a discounted cash flow analysis on the expected cash receipts that would occur if variable interest rates rise above the strike rates of the caps. This analysis reflects the contractual terms of the interest rate cap agreements, including the period to maturity, and uses observable market-based inputs, including LIBOR curves and implied volatilities. The Company also incorporates insignificant credit valuation adjustments to appropriately reflect the respective counterparty’s nonperformance risk in the fair value measurements. The counterparty credit spreads are based on publicly available credit information obtained from a third party credit data provider.
See Note 20 for a description of the interest rate cap agreements entered into during the first quarter of 2015.
On January 30, 2013, the Company made an optional prepayment of
$40.0 million
aggregate principal amount outstanding under the Prior Term Loan Facility. The optional prepayment satisfied the excess cash flow payment provision of the Prior Term Loan Facility with respect to the year ended December 31, 2012.
CDW LLC is the borrower under the Term Loan. All obligations under the Term Loan are guaranteed by Parent and each of CDW LLC's direct and indirect, 100% owned, domestic subsidiaries. The Term Loan is collateralized by a second priority interest in substantially all inventory (excluding inventory collateralized under the inventory floorplan arrangements as described in Note 5), deposits, and accounts receivable, and by a first priority interest in substantially all other assets. The Term Loan contains negative covenants that, among other things, place restrictions and limitations on the ability of Parent and each of CDW LLC's direct and indirect, 100% owned, domestic subsidiaries to dispose of assets, incur additional indebtedness, incur guarantee obligations, prepay other indebtedness, make distributions or other restricted payments, create liens, make equity or debt investments, make acquisitions, engage in mergers or consolidations, or engage in certain transactions with affiliates.
8.0%
Senior Secured Notes due 2018 (“Senior Secured Notes”)
At
December 31, 2014
, there were
no
outstanding Senior Secured Notes.
On August 5, 2014, the proceeds from the issuance of the 2022 Senior Notes discussed below, along with cash on hand, were deposited with the trustee to redeem all of the remaining
$325.0 million
aggregate principal amount of the Senior Secured Notes at a redemption price of
106.061%
of the principal amount redeemed, plus accrued and unpaid interest through the date of redemption. On the same date, the indenture governing the Senior Secured Notes was satisfied and discharged. The redemption date was September 5, 2014. In connection with this redemption, the Company recorded a loss on extinguishment of long-term debt of
$23.7 million
in the consolidated statement of operations for the year ended
December 31, 2014
, which was comprised of
$4.0 million
for the write-off of the unamortized deferred financing fees, a redemption premium of
$13.0 million
and a make-whole interest payment of
$6.7 million
.
On July 2, 2013, the Company used a portion of the net proceeds from the IPO to redeem
$175.0 million
aggregate principal amount of Senior Secured Notes. The redemption price of the Senior Secured Notes was
108.0%
of the principal amount redeemed, plus
$0.7 million
of accrued and unpaid interest to the date of redemption. The Company used cash on hand to pay such accrued and unpaid interest. In connection with this redemption, the Company recorded a loss on extinguishment of long-term debt of
$16.7 million
in the consolidated statement of operations for the year ended December 31, 2013. This loss represented
$14.0 million
in redemption premium and
$2.7 million
for the write-off of a portion of the remaining deferred financing costs related to the Senior Secured Notes.
8.5%
Senior Notes due 2019 (“2019 Senior Notes”)
At
December 31, 2014
, the outstanding principal amount of 2019 Senior Notes was
$503.9 million
, excluding
$1.3 million
in unamortized premium. The 2019 Senior Notes mature on April 1, 2019.
77
On December 1, 2014, the proceeds from the issuance of the 2024 Senior Notes discussed below, along with cash on hand, were deposited with the trustee to redeem
$541.4 million
aggregate principal amount of the 2019 Senior Notes at a redemption price of
106.202%
of the principal amount redeemed, plus accrued and unpaid interest through the date of redemption. The redemption date was December 31, 2014. In connection with this redemption, the Company recorded a loss on extinguishment of long-term debt of
$36.9 million
in the consolidated statement of operations for the year ended
December 31, 2014
, which was comprised of
$4.7 million
for the write-off of a portion of the unamortized deferred financing fees, a redemption premium of
$23.0 million
, and a make-whole interest payment of
$10.6 million
, partially offset by
$1.4 million
for the write-off of a portion of the unamortized premium.
On August 5, 2014, the proceeds from the issuance of the 2022 Senior Notes discussed below, along with cash on hand, were deposited with the trustee to redeem
$234.7 million
aggregate principal amount of the 2019 Senior Notes at a redemption price of
108.764%
of the principal amount redeemed, plus accrued and unpaid interest through the date of redemption. The redemption date was September 5, 2014. In connection with this redemption, the Company recorded a loss on extinguishment of long-term debt of
$22.1 million
in the consolidated statement of operations for the year ended
December 31, 2014
, which was comprised of
$2.2 million
for the write-off of a portion of the unamortized deferred financing fees, a redemption premium of
$10.0 million
, and a make-whole interest payment of
$10.6 million
, partially offset by
$0.7 million
for the write-off of a portion of the unamortized premium.
On March 20, 2014, the Company repurchased and subsequently canceled
$25.0 million
aggregate principal amount of the 2019 Senior Notes from an affiliate of Providence Equity in a privately negotiated transaction on an arms' length basis at a price of
109.75%
of the principal amount. Cash on hand was used to fund the repurchase of
$25.0 million
aggregate principal amount,
$2.4 million
of repurchase premium and
$1.0 million
in accrued and unpaid interest to the date of repurchase. In connection with this repurchase, the Company recorded a loss on extinguishment of long-term debt of
$2.7 million
in the Company's consolidated statement of operations for the year ended
December 31, 2014
. This loss represented
$2.4 million
in repurchase premium and
$0.3 million
for the write-off of a portion of the unamortized deferred financing costs related to the 2019 Senior Notes.
CDW LLC and CDW Finance Corporation are the co-issuers of the 2019 Senior Notes. Obligations under the 2019 Senior Notes are guaranteed on an unsecured senior basis by Parent and each of CDW LLC's direct and indirect, 100% owned, domestic subsidiaries. The 2019 Senior Note indenture contains negative covenants that, among other things, place restrictions and limitations on the ability of Parent and each of CDW LLC's direct and indirect, 100% owned, domestic subsidiaries to dispose of assets, incur additional indebtedness, incur guarantee obligations, prepay other indebtedness, make distributions or other restricted payments, create liens, make equity or debt investments, make acquisitions, engage in mergers or consolidations, or engage in certain transactions with affiliates. The 2019 Senior Notes do not contain any financial covenants.
6.0%
Senior Notes due 2022 ("2022 Senior Notes")
On August 5, 2014, CDW LLC and CDW Finance Corporation, as co-issuers, completed the issuance of
$600.0 million
aggregate principal amount of 2022 Senior Notes at par. Fees of
$8.0 million
related to the 2022 Senior Notes were capitalized as deferred financing costs and are being amortized over the term of the notes on a straight-line basis. The 2022 Senior Notes will mature on August 15, 2022 and bear interest at a rate of
6.00%
per annum, payable semi-annually on February 15 and August 15 of each year. The first interest payment date was February 15, 2015.
CDW LLC and CDW Finance Corporation are the co-issuers of the 2022 Senior Notes and the obligations under the notes are guaranteed by Parent and each of CDW LLC's direct and indirect, wholly owned, domestic subsidiaries. The 2022 Senior Notes indenture contains negative covenants that, among other things, place restrictions and limitations on the ability of Parent and each of CDW LLC's direct and indirect, 100% owned, domestic subsidiaries to enter into sale and lease-back transactions, incur additional secured indebtedness, and create liens. The indenture governing the 2022 Senior Notes does not contain any financial covenants.
5.5%
Senior Notes due 2024 ("2024 Senior Notes")
On December 1, 2014, CDW LLC and CDW Finance Corporation, as co-issuers, completed the issuance of
$575.0 million
aggregate principal amount of 2024 Senior Notes at par. Fees of
$7.5 million
related to the 2024 Senior Notes were capitalized as deferred financing costs and are being amortized over the term of the notes on a straight-line basis. The 2024 Senior Notes will mature on December 1, 2024 and bear interest at a rate of
5.50%
per annum, payable semi-annually on June 1 and December 1 of each year. The first interest payment date will be June 1, 2015.
78
CDW LLC and CDW Finance Corporation are the co-issuers of the 2024 Senior Notes and the obligations under the notes are guaranteed by Parent and each of CDW LLC's direct and indirect, wholly owned, domestic subsidiaries. The 2024 Senior Notes indenture contains negative covenants that, among other things, place restrictions and limitations on the ability of Parent and each of CDW LLC's direct and indirect, 100% owned, domestic subsidiaries to enter into sale and lease-back transactions, incur additional secured indebtedness, and create liens. The indenture governing the 2024 Senior Notes does not contain any financial covenants.
12.535%
Senior Subordinated Exchange Notes due 2017 (“Senior Subordinated Notes”)
At
December 31, 2014
, there were
no
outstanding Senior Subordinated Notes.
On May 9, 2014, the Company redeemed all of the remaining
$42.5 million
aggregate principal amount of Senior Subordinated Notes at a redemption price that was
104.178%
of the principal amount redeemed. Cash on hand was used to fund the redemption of
$42.5 million
aggregate principal amount,
$1.8 million
in redemption premium and
$0.4 million
in accrued and unpaid interest to the date of redemption. In connection with this redemption, the Company recorded a loss on extinguishment of long-term debt of
$2.2 million
in the consolidated statement of operations for the year ended
December 31, 2014
. This loss represented
$1.8 million
in redemption premium and
$0.4 million
for the write-off of the remaining deferred financing costs related to the Senior Subordinated Notes.
On January 22, 2014 and February 21, 2014, the Company redeemed
$30.0 million
and
$20.0 million
aggregate principal amounts of Senior Subordinated Notes, respectively, at redemption prices that were
104.178%
of the principal amounts redeemed. Cash on hand was used to fund the redemptions of
$50.0 million
aggregate principal amount,
$2.1 million
in redemption premiums and
$1.9 million
in aggregate accrued and unpaid interest to the dates of redemption. In connection with these redemptions, the Company recorded a loss on extinguishment of long-term debt of
$2.7 million
in the consolidated statement of operations for the year ended
December 31, 2014
. This loss represented
$2.1 million
in redemption premiums and
$0.6 million
for the write-off of a portion of the remaining deferred financing costs related to the Senior Subordinated Notes.
On October 18, 2013, the Company redeemed
$155.0 million
aggregate principal amount of Senior Subordinated Notes at a redemption price that was
104.178%
of the principal amount redeemed. A combination of cash on hand and the net proceeds from the sale of shares of common stock related to the underwriters' exercise in full of the overallotment option granted to them in connection with the IPO, in the amount of
$56.0 million
, was used to fund the redemption of
$155.0 million
aggregate principal amount,
$6.5 million
of redemption premium and
$0.2 million
in accrued and unpaid interest to the date of redemption. See Note 9 for additional discussion of the underwriters' overallotment option. In connection with this redemption, the Company recorded a loss on extinguishment of long-term debt of
$8.5 million
in the Company's consolidated statement of operations for the year ended December 31, 2013. This loss represented
$6.5 million
in redemption premium and
$2.0 million
for the write-off of a portion of the remaining unamortized deferred financing costs related to the Senior Subordinated Notes.
On August 1, 2013, the Company redeemed
$324.0 million
aggregate principal amount of Senior Subordinated Notes at a redemption price that was
106.268%
of the principal amount redeemed. The Company used a portion of the net proceeds from the IPO to redeem
$146.0 million
aggregate principal amount of Senior Subordinated Notes and incremental borrowings of
$190.0 million
under the Term Loan to redeem
$178.0 million
aggregate principal amount of Senior Subordinated Notes. The Company used cash on hand to pay
$12.0 million
of accrued and unpaid interest to the date of redemption. In connection with this redemption, the Company recorded a loss on extinguishment of long-term debt of
$24.6 million
in the consolidated statement of operations for the year ended December 31, 2013. This loss represented
$20.3 million
in redemption premium and
$4.3 million
for the write-off of a portion of the remaining deferred financing costs related to the Senior Subordinated Notes.
On March 8, 2013, the Company redeemed
$50.0 million
aggregate principal amount of Senior Subordinated Notes at a redemption price that was
106.268%
of the principal amount redeemed. Cash on hand was used to fund the redemption of
$50.0 million
aggregate principal amount,
$3.1 million
of redemption premium and
$2.5 million
in accrued and unpaid interest to the date of redemption. In connection with this redemption, the Company recorded a loss on extinguishment of long-term debt of
$3.9 million
in the Company's consolidated statement of operations for the year ended December 31, 2013. This loss represented
$3.1 million
in redemption premium and
$0.8 million
for the write-off of a portion of the remaining unamortized deferred financing costs related to the Senior Subordinated Notes.
79
Long-Term Debt Maturities
As of
December 31, 2014
, the maturities of long-term debt were as follows:
|
(in millions)
|
|
||
|
Years ending December 31,
|
|
||
|
2015
|
$
|
15.4
|
|
|
2016
|
—
|
|
|
|
2017
|
—
|
|
|
|
2018
|
—
|
|
|
|
2019
|
503.9
|
|
|
|
Thereafter
|
2,673.1
|
|
|
|
$
|
3,192.4
|
|
|
Fair Value
The fair value of the Company's long-term debt instruments at
December 31, 2014
was
$3,208.7 million
. The fair value of the 2019 Senior Notes, the 2022 Senior Notes, and the 2024 Senior Notes was estimated using quoted market prices for identical assets or liabilities that are traded in over-the-counter secondary markets that are not considered active. The fair value of the Term Loan was estimated using dealer quotes for identical assets or liabilities in markets that are not considered active. Consequently, the Company's long-term debt is classified as Level 2 within the fair value hierarchy.
At
December 31, 2014
, the carrying value of the Company's long-term debt was
$3,192.4 million
, excluding
$1.3 million
in unamortized premium and
$3.7 million
in unamortized discount.
Deferred Financing Costs
The following table summarizes the deferred financing costs activity for the years ended
December 31, 2014 and 2013
:
|
(in millions)
|
December 31,
|
||||||
|
2014
|
2013
|
||||||
|
Beginning balance
|
$
|
30.1
|
|
$
|
53.2
|
|
|
|
Additional costs capitalized
|
21.9
|
|
6.1
|
|
|||
|
Recognized in interest expense
|
(6.4
|
)
|
(9.1
|
)
|
|||
|
Write-off of unamortized deferred financing costs
|
(12.6
|
)
|
(20.1
|
)
|
|||
|
Ending balance
|
$
|
33.0
|
|
$
|
30.1
|
|
|
As of
December 31, 2014
and
December 31, 2013
, the weighted-average remaining life of unamortized deferred financing costs was
6.6
and
4.9
years, respectively.
|
8.
|
Income Taxes
|
Income before income taxes was taxed under the following jurisdictions:
|
(in millions)
|
Years Ended December 31,
|
||||||||||
|
|
2014
|
2013
|
2012
|
||||||||
|
Domestic
|
$
|
366.6
|
|
$
|
179.4
|
|
$
|
170.3
|
|
||
|
Foreign
|
21.1
|
|
16.1
|
|
15.8
|
|
|||||
|
Total
|
$
|
387.7
|
|
$
|
195.5
|
|
$
|
186.1
|
|
||
80
Components of income tax expense (benefit) consisted of the following:
|
(in millions)
|
Years Ended December 31,
|
||||||||||
|
|
2014
|
2013
|
2012
|
||||||||
|
Current:
|
|||||||||||
|
Federal
|
$
|
206.8
|
|
$
|
96.7
|
|
$
|
110.3
|
|
||
|
State
|
19.3
|
|
10.1
|
|
8.0
|
|
|||||
|
Foreign
|
5.8
|
|
4.6
|
|
5.1
|
|
|||||
|
Total current
|
231.9
|
|
111.4
|
|
123.4
|
|
|||||
|
Deferred:
|
|||||||||||
|
Domestic
|
(89.0
|
)
|
(48.6
|
)
|
(56.2
|
)
|
|||||
|
Foreign
|
(0.1
|
)
|
(0.1
|
)
|
(0.1
|
)
|
|||||
|
Total deferred
|
(89.1
|
)
|
(48.7
|
)
|
(56.3
|
)
|
|||||
|
Income tax expense
|
$
|
142.8
|
|
$
|
62.7
|
|
$
|
67.1
|
|
||
The reconciliation between the statutory tax rate expressed as a percentage of income before income taxes and the effective tax rate is as follows:
|
(dollars in millions)
|
Years Ended December 31,
|
|||||||||||||||||||
|
|
2014
|
2013
|
2012
|
|||||||||||||||||
|
Statutory federal income tax rate
|
$
|
135.7
|
|
35.0
|
%
|
$
|
68.4
|
|
35.0
|
%
|
$
|
65.1
|
|
35.0
|
%
|
|||||
|
State taxes, net of federal effect
|
6.5
|
|
1.6
|
|
(5.0
|
)
|
(2.6
|
)
|
0.4
|
|
0.2
|
|
||||||||
|
Equity-based compensation
|
1.1
|
|
0.3
|
|
1.5
|
|
0.7
|
|
5.7
|
|
3.1
|
|
||||||||
|
Effect of rates different than statutory
|
(1.9
|
)
|
(0.5
|
)
|
(1.4
|
)
|
(0.7
|
)
|
(1.4
|
)
|
(0.8
|
)
|
||||||||
|
Other
|
1.4
|
|
0.4
|
|
(0.8
|
)
|
(0.3
|
)
|
(2.7
|
)
|
(1.5
|
)
|
||||||||
|
Effective tax rate
|
$
|
142.8
|
|
36.8
|
%
|
$
|
62.7
|
|
32.1
|
%
|
$
|
67.1
|
|
36.0
|
%
|
|||||
The tax effect of temporary differences that give rise to the net deferred income tax liability is presented below:
|
(in millions)
|
December 31,
|
||||||
|
|
2014
|
2013
|
|||||
|
Deferred Tax Assets:
|
|||||||
|
Deferred interest
|
$
|
32.9
|
|
$
|
43.5
|
|
|
|
State net operating loss and credit carryforwards, net
|
18.8
|
|
21.1
|
|
|||
|
Payroll and benefits
|
27.0
|
|
16.2
|
|
|||
|
Rent
|
5.5
|
|
6.4
|
|
|||
|
Accounts receivable
|
6.3
|
|
5.4
|
|
|||
|
Equity compensation plans
|
6.5
|
|
1.6
|
|
|||
|
Trade credits
|
1.5
|
|
1.5
|
|
|||
|
Other
|
5.0
|
|
7.1
|
|
|||
|
Total deferred tax assets
|
103.5
|
|
102.8
|
|
|||
|
Deferred Tax Liabilities:
|
|||||||
|
Software and intangibles
|
425.3
|
|
486.2
|
|
|||
|
Deferred income
|
116.2
|
|
145.5
|
|
|||
|
Property and equipment
|
22.5
|
|
25.0
|
|
|||
|
Other
|
15.3
|
|
11.6
|
|
|||
|
Total deferred tax liabilities
|
579.3
|
|
668.3
|
|
|||
|
Deferred tax asset valuation allowance
|
—
|
|
—
|
|
|||
|
Net deferred tax liability
|
$
|
475.8
|
|
$
|
565.5
|
|
|
81
The Company has state income tax net operating loss carryforwards of
$124.0 million
, which will expire at various dates from 2015 through 2033 and state tax credit carryforwards of
$19.6 million
, which expire at various dates from 2016 through 2019.
The Company has not provided for U.S. federal income taxes or tax benefits on the undistributed earnings of its international subsidiary because such earnings are reinvested and it is currently intended that they will continue to be reinvested indefinitely. At
December 31, 2014
, the Company has not provided for federal income taxes on earnings of approximately
$66.6 million
from its international subsidiary.
The Company had
no
unrecognized tax benefits at
December 31, 2014, 2013 and 2012
.
In the ordinary course of business, the Company is subject to review by domestic and foreign taxing authorities, including the Internal Revenue Service (“IRS”). In general, the Company is no longer subject to audit by the IRS for tax years through 2010 and state, local or foreign taxing authorities for tax years through 2009. Various other taxing authorities are in the process of auditing income tax returns of the Company and its subsidiaries. The Company does not anticipate that any adjustments from the audits would have a material impact on its consolidated financial position, results of operations or cash flows.
The Company accrues net interest and penalties related to unrecognized tax benefits in income tax expense in its consolidated statements of operations. For the years ended
December 31, 2014, 2013 and 2012
, the Company had
no
liability recorded for the payment of interest and penalties on unrecognized tax benefits and did not recognize any such interest and penalty expense.
|
9.
|
Shareholders' Equity
|
The Company declared and paid cash dividends per common share during the periods presented as follows:
|
(in millions, except per share amounts)
|
Dividends Per Share
|
Amount
|
||||||
|
2014:
|
||||||||
|
First Quarter
|
$
|
0.0425
|
|
$
|
7.3
|
|
||
|
Second Quarter
|
0.0425
|
|
7.3
|
|
||||
|
Third Quarter
|
0.0425
|
|
7.3
|
|
||||
|
Fourth Quarter
|
0.0675
|
|
11.7
|
|
||||
|
2013:
|
||||||||
|
First Quarter
|
$
|
—
|
|
$
|
—
|
|
||
|
Second Quarter
|
—
|
|
—
|
|
||||
|
Third Quarter
|
—
|
|
—
|
|
||||
|
Fourth Quarter
|
0.0425
|
|
7.3
|
|
||||
See Note 20 for a discussion of the dividend declared during the first quarter of 2015. Future dividends will be subject to the approval of the Company's Board of Directors and will depend upon the Company’s results of operations, financial condition, business prospects, capital requirements, contractual restrictions, any potential indebtedness the Company may incur, restrictions imposed by applicable law, tax considerations and other factors that the Company’s Board of Directors deems relevant. In addition, the Company’s ability to pay dividends on its common stock will be limited by restrictions on the ability of subsidiaries to pay dividends or make distributions to the Company, in each case, under the terms of certain current and future agreements governing the Company’s indebtedness.
On November 6, 2014, the Company announced that its Board of Directors approved a
$500.0 million
share repurchase program effective immediately under which the Company may repurchase shares of its common stock in the open market or through privately negotiated transactions, depending on share price, market conditions and other factors. The share repurchase program does not obligate the Company to repurchase any dollar amount or number of shares, and repurchases may be commenced or suspended from time to time without prior notice. As of the date of this filing,
no
shares have been repurchased under the share repurchase program.
On January 1, 2014, the first offering period under the Company's Coworker Stock Purchase Plan (the “CSPP”) commenced. The CSPP provides the opportunity for eligible coworkers to acquire shares of the Company's common
82
stock at a
5%
discount from the closing market price on the final day of the offering period. There is
no
compensation expense associated with the CSPP.
On July 2, 2013, the Company completed an IPO of
23,250,000
shares of common stock. On July 31, 2013, the Company completed the sale of an additional
3,487,500
shares of common stock to the underwriters of the IPO pursuant to the underwriters' July 26, 2013 exercise in full of the overallotment option granted to them in connection with the IPO. Such shares were registered under the Securities Act of 1933, as amended, pursuant to the Company's Registration Statement on Form S-1, which was declared effective by the SEC on June 26, 2013. The shares of common stock are listed on the NASDAQ Global Select Market under the symbol “CDW.” The Company's shares of common stock were sold to the underwriters at a price of
$17.00
per share in the IPO and upon the exercise of the overallotment option, which together generated aggregate net proceeds of
$424.7 million
to the Company after deducting underwriting discounts, expenses and transaction costs.
The Company has completed the following secondary public offerings, whereby certain selling stockholders sold shares of common stock to the underwriters. The Company did not receive any proceeds from these sales of shares.
|
Secondary Offering Shares
|
Completion Date of Secondary Offering
|
Overallotment Shares
(1)
|
Completion Date of Overallotment Shares
|
Secondary Offering Expenses
(in millions)
|
||||||||
|
15,000,000
|
|
11/19/2013
|
2,250,000
|
12/18/2013
|
|
$
|
0.6
|
|
||||
|
10,000,000
|
|
3/12/2014
|
1,500,000
|
3/12/2014
|
|
$
|
0.4
|
|
||||
|
15,000,000
|
|
5/28/2014
|
2,250,000
|
6/4/2014
|
|
$
|
0.5
|
|
||||
|
15,000,000
|
|
9/8/2014
(2)
|
—
|
—
|
|
$
|
0.3
|
|
||||
|
15,000,000
|
|
12/8/2014
|
2,250,000
|
12/8/2014
|
|
$
|
0.2
|
|
||||
(1) Under each underwriting agreement, the selling stockholders granted the underwriters an option, exercisable for thirty days, to purchase up to the additional amount of shares noted.
(2) The option to purchase additional shares was not exercised in connection with the September 2014 secondary offering.
The following pre-tax IPO-related expenses and secondary-offering-related expenses were included within selling and administrative expenses in the consolidated statements of operations for the years ended December 31, 2014 and 2013, respectively.
|
(in millions)
|
Year Ended December 31,
|
||||||
|
2014
|
2013
|
||||||
|
Acceleration charge for certain equity awards and related employer payroll taxes
(1)
|
$
|
—
|
|
$
|
40.7
|
|
|
|
RDU Plan cash retention pool accrual
(2)
|
—
|
|
7.5
|
|
|||
|
Management services agreement termination fee
(3)
|
—
|
|
24.4
|
|
|||
|
Other expenses
(4)
|
1.4
|
|
2.4
|
|
|||
|
IPO- and secondary-offering-related expenses
|
$
|
1.4
|
|
$
|
75.0
|
|
|
(1) See Note 10 for additional discussion of the impact of the IPO on the Company's equity awards.
(2) See Note 12 for additional discussion of this transaction.
(3) Represents the payment of a termination fee to affiliates of the Sponsors in connection with the termination of the management services agreement with such entities.
(4) Other expenses include secondary-offering expenses of
$1.4 million
and
$0.6 million
for the years ended December 31, 2014 and 2013, respectively.
83
In June 2013, the Company’s Board of Directors and the Company's sole shareholder at that time, CDW Holdings, approved the reclassification of the Company’s Class A common shares and Class B common shares into a single class of common shares and a
143.0299613
-for-1 stock split, effective immediately. The par value of the common shares was maintained at
$0.01
per share. All references to common shares and per share amounts in the accompanying consolidated financial statements have been adjusted to reflect the reclassification and stock split on a retroactive basis.
In June 2013, the Company amended and restated its certificate of incorporation to authorize the issuance of
100,000,000
shares of preferred stock with a par value of
$0.01
.
No
shares of preferred stock have been issued or are outstanding as of December 31, 2014. Additionally, the amended and restated certificate of incorporation increased the number of authorized common shares to
1,000,000,000
.
|
10.
|
Equity-Based Compensation
|
The 2013 Long-Term Incentive Plan (“2013 LTIP”) provides for the grant of incentive stock options, nonqualified stock options, stock appreciation rights, restricted stock, restricted stock units, bonus stock and performance awards. The maximum aggregate number of shares that may be issued under the 2013 LTIP is
11,700,000
shares of the Company's common stock, in addition to the
3,798,508
shares of restricted stock granted in exchange for unvested Class B Common Units in connection with the Company's IPO, as discussed below. As of December 31, 2014,
7,541,891
shares were available for issuance under the 2013 LTIP which was approved by the Company's pre-IPO shareholders. Authorized but unissued shares are reserved for issuance in connection with equity-based awards.
The following table summarizes equity-based compensation expense, which is included in selling and administrative expenses, for the years ended
December 31, 2014, 2013 and 2012
:
|
(in millions)
|
Year Ended December 31,
|
|||||||||||
|
2014
|
2013
(1)
|
2012
(2)
|
||||||||||
|
Equity-based compensation expense
|
$
|
16.4
|
|
$
|
46.6
|
|
$
|
22.1
|
|
|||
|
Income tax benefit
|
(5.1
|
)
|
(16.5
|
)
|
(2.3
|
)
|
||||||
|
Total (net of tax)
|
$
|
11.3
|
|
$
|
30.1
|
|
$
|
19.8
|
|
|||
|
(1)
|
Includes pre-tax expense of
$36.7 million
related to the accelerated vesting of certain equity awards granted prior to our IPO. All unvested awards granted pursuant to the MPK Coworker Incentive Plan II (the “MPK Plan”) vested in connection with the IPO as discussed further below in the section labeled "MPK II Units."
|
|
(2)
|
Includes pre-tax expense of
$6.6 million
in connection with the modification of Class B Common Unit awards granted pursuant to the CDW Holdings LLC 2007 Incentive Equity Plan to the Company’s former Chief Executive Officer, as discussed further below in the section labeled "Class B Common Units."
|
The total unrecognized compensation cost related to nonvested awards was
$28.9 million
at
December 31, 2014
and is expected to be recognized over a weighted-average period of
2.3
years.
Stock Options
During the year ended
December 31, 2014
, the Company granted
1,245,513
stock options under the 2013 LTIP. These options vest annually over
three
years and have a contractual term of
10
years. The exercise price of a stock option is equal to the fair value of a share of the Company's common stock on the date of the grant. The Company uses the Black-Scholes option pricing model to estimate the fair value of stock options granted. The Black-Scholes option pricing model incorporates various assumptions including volatility, expected term, risk-free interest rates and dividend yields. The weighted-average assumptions used to value the stock options granted during the years ended
December 31, 2014 and 2013
are presented below.
84
|
|
Year Ended December 31,
|
|||||||
|
2014
|
2013
|
|||||||
|
Weighted-average grant date fair value
|
$
|
7.23
|
|
$
|
4.75
|
|
||
|
Weighted-average volatility
(1)
|
30.00
|
%
|
35.00
|
%
|
||||
|
Weighted-average risk-free rate
(2)
|
1.77
|
%
|
1.58
|
%
|
||||
|
Dividend yield
|
0.70
|
%
|
1.00
|
%
|
||||
|
Expected term (in years)
(3)
|
6.0
|
|
5.4
|
|
||||
|
(1)
|
Based upon an assessment of the two-year, five-year and implied volatility for the Company’s selected peer group, adjusted for the Company’s leverage.
|
|
(2)
|
Based on a composite U.S. Treasury rate.
|
|
(3)
|
Calculated using the simplified method. The simplified method defines the expected term as the average of the option’s contractual term and the option’s weighted-average vesting period. The Company utilizes this method as it has limited historical stock option data that is sufficient to derive a reasonable estimate of the expected stock option term.
|
The following table summarizes the Company's stock option activity for the year ended
December 31, 2014
:
|
Options
|
Number of Options
|
Weighted-Average Exercise Price
|
Weighted-Average Remaining Contractual Term (years)
|
Aggregate Intrinsic Value (millions)
|
||||||
|
Outstanding at January 1, 2014
|
1,280,255
|
|
$17.00
|
|||||||
|
Granted
|
1,245,513
|
|
24.40
|
|
||||||
|
Forfeited/Expired
|
(31,209
|
)
|
21.33
|
|
||||||
|
Exercised
|
(73,487
|
)
|
17.00
|
|
||||||
|
Outstanding at December 31, 2014
|
2,421,072
|
|
$20.75
|
8.3
|
$34.9
|
|||||
|
Exercisable at December 31, 2014
|
576,963
|
|
$17.00
|
7.2
|
$10.5
|
|||||
|
Vested and expected to vest at December 31, 2014
|
2,378,364
|
|
$20.74
|
8.3
|
$34.3
|
|||||
The total intrinsic value of stock options exercised during the years ended
December 31, 2014 and 2013
was
$1.0 million
and
zero
, respectively.
Restricted Stock Units ("RSUs")
Restricted stock units represent the right to receive unrestricted shares of the Company's stock at the time of vesting. RSUs generally cliff-vest at the end of
four
years.
The following table summarizes the Company's RSU activity for the year ended
December 31, 2014
:
|
Number of Units
|
Weighted-Average Grant-Date Fair Value
|
|||||
|
Nonvested at January 1, 2014
|
1,351,572
|
|
$
|
17.04
|
|
|
|
Granted
|
25,895
|
|
24.29
|
|
||
|
Vested/Settled
|
(5,984
|
)
|
17.00
|
|
||
|
Forfeited
|
(126,781
|
)
|
17.04
|
|
||
|
Nonvested at December 31, 2014
|
1,244,702
|
|
$
|
17.19
|
|
|
85
The weighted-average grant date fair value of RSUs granted during the year ended
December 31, 2014 and 2013
was
$24.29
and
$17.03
, respectively. The aggregate fair value of RSUs that vested during the years ended
December 31, 2014 and 2013
, was
$0.2 million
and
zero
, respectively.
Performance Share Units ("PSUs")
During the year ended
December 31, 2014
, the Company granted
417,784
PSUs under the 2013 LTIP which cliff-vest on December 31, 2016. The percentage of shares that shall vest will range from
0%
to
200%
of the number of PSUs granted based on the Company's performance against a cumulative adjusted free cash flow measure and cumulative non-GAAP net income per diluted share measure over a three-year performance period. The weighted-average grant-date fair value of the PSUs granted during the period was
$24.40
per unit. During the year ended
December 31, 2014
,
6,204
PSUs were forfeited at a weighted-average grant-date fair value of
$24.29
. As of
December 31, 2014
,
411,580
PSUs were outstanding at a weighted-average grant date fair value of
$24.40
.
No
units vested during the year ended December 31, 2014.
Restricted Stock
In connection with the IPO, CDW Holdings distributed all of its shares of the Company's common stock to its existing members in accordance with their respective membership interests. Common stock received by holders of Class B Common Units in connection with the distribution is subject to any vesting provisions previously applicable to the holder's Class B Common Units. Class B Common Unit holders received
3,798,508
shares of restricted stock with respect to Class B Common Units that had not yet vested at the time of the distribution. For the year ended
December 31, 2014
,
2,321,973
shares of such restricted stock vested/settled and
9,546
shares were forfeited. As of
December 31, 2014
,
260,514
shares of restricted stock were outstanding. The aggregate fair value of restricted stock that vested during the years ended
December 31, 2014 and 2013
was
$68.6 million
and
$26.7 million
, respectively.
Pre-IPO Equity Awards
Prior to the IPO, the Company had the following equity-based compensation plans in place:
Class B Common Units
The Board of Managers of CDW Holdings adopted the CDW Holdings LLC 2007 Incentive Equity Plan (the “Plan”) for coworkers, managers, consultants and advisors of the Company and its subsidiaries. The Plan permitted a committee designated by the Board of Managers of CDW Holdings (the “Committee”) to grant or sell to any participant Class A Common Units or Class B Common Units of CDW Holdings in such quantity, at such price, on such terms and subject to such conditions that were consistent with the Plan and as established by the Committee.
The Class B Common Units that were granted vested daily on a pro rata basis between the date of grant and the fifth anniversary thereof and were subject to repurchase by, with respect to vested units, or forfeiture to, with respect to unvested units, the Company upon the coworker's separation from service as was set forth in each holder’s Class B Common Unit Grant Agreement.
On June 30, 2011, the Board of Managers approved the terms of a modified Class B Common Unit grant agreement with the Company's former Chief Executive Officer, who retired as the Company's Chief Executive Officer effective October 1, 2011 but continued to serve as Chairman of the Board through December 31, 2012. As a result of this modification, the Company recorded incremental equity-based compensation expense of
$6.6 million
during the year ended December 31, 2012.
The grant date fair value of Class B Common Unit grants was calculated using the Option-Pricing Method. This method considered Class A Common Units and Class B Common Units as call options on the total equity value, giving consideration to liquidation preferences and conversion of the preferred units. Such Class A Common Units and Class B Common Units were modeled as call options that gave their owners the right, but not the obligation, to buy the underlying equity value at a predetermined (or exercise) price. Class B Common Units were considered to be call options with a claim on equity value at an exercise price equal to the remaining value immediately after the Class A Common Units and Class B Common Units with a lower participation threshold were liquidated. The Option-Pricing Method is highly sensitive to key assumptions, such as the volatility assumption. As such, the use of this method can be applied when the range of possible future outcomes is difficult to predict.
86
The following table summarizes the assumptions and resulting fair value of the Class B Common Unit grants for the years ended December 31, 2013 and 2012:
|
|
Years Ended December 31,
|
||||||
|
Assumptions
|
2013
|
2012
|
|||||
|
Weighted-average grant date fair value
|
$
|
119.00
|
|
$
|
125.65
|
|
|
|
Weighted-average volatility
(1)
|
65.50
|
%
|
65.26
|
%
|
|||
|
Weighted-average risk-free rate
(2)
|
0.18
|
%
|
0.19
|
%
|
|||
|
Dividend yield
|
0.00
|
%
|
0.00
|
%
|
|||
|
(1)
|
Based upon an assessment of the two-year, five-year and implied volatility for the Company’s selected peer group, adjusted for the Company’s leverage.
|
|
(2)
|
Based on a composite U.S. Treasury rate.
|
MPK II Units
Contemporaneous with the Acquisition, the Company agreed with Michael P. Krasny, CDW Corporation founder, former chairman and CEO and significant selling shareholder, to establish the MPK Plan for the benefit of all of the coworkers of the Company other than members of senior management who received incentive equity awards under the Plan.
The MPK Plan established an “account” for each eligible participant which was notionally credited with a number of Class A Common Units of CDW Holdings LLC on October 15, 2007, the day the plan was established. The notional units credited to participants' accounts were to cliff-vest at the end of
ten
years, subject to acceleration upon the occurrence of certain events. Notional units granted under the MPK Plan were valued on the grant date at
$1,000
per unit, the fair value equivalent of the Class A Common Units at the time the awards were granted.
On July 2, 2013, the Company completed an IPO of its common shares. Under the terms of the MPK Plan, vesting accelerated for all unvested units upon completion of the IPO. The Company recorded a pre-tax charge of
$36.7 million
for compensation expense related to the acceleration of the expense recognition for MPK Plan units in the year ended December 31, 2013. In connection with the completion of the IPO, the Company distributed common stock to each participant and withheld the number of shares of common stock equal to the required tax withholding for each participant. The Company paid required withholding taxes of
$24.0 million
to federal, state and foreign taxing authorities. This amount is reported as a financing activity in the consolidated statement of cash flows and as an increase to accumulated deficit in the consolidated statement of shareholders' equity for the year ended December 31, 2013. In addition, the Company paid
$4.0 million
of employer payroll taxes that are included as an operating activity in the consolidated statement of cash flows for the year ended December 31, 2013.
The following table sets forth a summary of pre-IPO equity plan activity for the year ended
December 31, 2013
:
|
Class B
Common Units
|
MPK Plan
Units
|
||||
|
Outstanding at January 1, 2013
|
216,483
|
|
66,137
|
|
|
|
Granted
|
400
|
|
—
|
|
|
|
Forfeited
|
(860
|
)
|
(2,228
|
)
|
|
|
Converted/Settled
(1)
|
(216,023
|
)
|
(63,909
|
)
|
|
|
Outstanding at December 31, 2013
|
—
|
|
—
|
|
|
|
Vested at December 31, 2013
|
—
|
|
—
|
|
|
|
(1)
|
As discussed above, the Class B Common Units and MPK Plan Units were converted/settled into shares of the Company's common stock upon completion of the IPO. The converted Class B Common Units, to the extent unvested at the time of the IPO, relate to the grants of restricted stock disclosed above.
|
In connection with the establishment of the MPK Plan, the Company agreed to make charitable contributions in amounts equal to the net income tax benefits derived from payouts to participants under the MPK Plan (net of any
87
related employer payroll tax costs). The contributions of these amounts are due by March 15 of the calendar year following the year in which the Company realizes the benefits of the deductions. This arrangement has been accounted for as contingent consideration. Pre-2009 business combinations were accounted for under a former accounting standard which, among other aspects, precluded the recognition of certain contingent consideration as of the business combination date. Instead, under the former accounting standard, contingent consideration is accounted for as additional purchase price (goodwill) at the time the contingency is resolved. As of December 31, 2013, the Company accrued
$20.9 million
related to this arrangement within other current liabilities, as the Company realized the tax benefit of the compensation deductions during the 2013 tax year. The Company made the related cash contribution during the first quarter of 2014.
|
11.
|
Earnings Per Share
|
The numerator for both basic and diluted earnings per share is net income. The denominator for basic earnings per share is the weighted-average number of common shares outstanding during the period. The 2013 denominator was impacted by the common shares issued during both the IPO and the underwriters' exercise in full of the overallotment option granted to them in connection with the IPO. Because such common shares were issued on July 2, 2013 and July 31, 2013, respectively, they are only partially reflected in the 2013 denominator. Such shares are fully reflected in the 2014 denominator. See Note 9 for additional discussion of the IPO.
The dilutive effect of outstanding restricted stock, restricted stock units, stock options, Coworker Stock Purchase Plan units and MPK Plan units is reflected in the denominator for diluted earnings per share using the treasury stock method.
The following is a reconciliation of basic shares to diluted shares:
|
Years Ended December 31,
|
||||||||
|
(in millions)
|
2014
|
2013
|
2012
|
|||||
|
Weighted-average shares - basic
|
170.6
|
|
156.6
|
|
145.1
|
|
||
|
Effect of dilutive securities
|
2.2
|
|
2.1
|
|
0.7
|
|
||
|
Weighted-average shares - diluted
|
172.8
|
|
158.7
|
|
145.8
|
|
||
There was an insignificant amount of potential common shares excluded from diluted earnings per share for the years ended December 31, 2014, 2013 and 2012, as their inclusion would have had an anti-dilutive effect.
|
12.
|
Deferred Compensation Plan
|
On March 10, 2010, in connection with the Company’s purchase of
$28.5 million
principal amount of its outstanding senior subordinated debt, the Company established the Restricted Debt Unit Plan (the “RDU Plan”), an unfunded nonqualified deferred compensation plan. The total number of RDUs that could be granted under the RDU Plan was
28,500
. As of
December 31, 2014
,
28,500
RDUs were outstanding. RDUs vested daily on a pro rata basis over the
three
-year period from January 1, 2012 (or, if later, the date of hire or the date of a subsequent RDU grant) through December 31, 2014. All outstanding RDUs were vested as of December 31, 2014. Participants have no rights to the underlying debt.
The total amount of compensation available to be paid under the RDU Plan was initially to be based on two components, a principal component and an interest component. The principal component credits the RDU Plan with a notional amount equal to the
$28.5 million
face value of the Senior Subordinated Notes (the "Debt Pool"), together with certain redemption premium equivalents as noted below. The interest component credited the RDU Plan with amounts equal to the interest that would have been earned on the Debt Pool from March 10, 2010 through maturity on October 12, 2017, except as discussed below. Interest amounts for 2010 and 2011 were deferred until 2012, and thereafter, interest amounts were paid to participants semi-annually on the interest payment due dates.
The Company used a portion of the IPO proceeds together with incremental borrowings to redeem
$324.0 million
of the total Senior Subordinated Notes outstanding on August 1, 2013. In connection with the IPO and the partial redemption of the Senior Subordinated Notes, the Company amended the RDU Plan to increase the retentive value of the plan. In accordance with the original terms of the RDU Plan, the principal component of the RDUs converted to a cash-denominated pool upon the redemption of the Senior Subordinated Notes. In addition, the Company added
$0.1
88
million
and
$1.4 million
to the principal component in the years ended December 31, 2014 and 2013, respectively, as redemption premium equivalents in accordance with the terms of the RDU plan.
Under the terms of the amended RDU Plan, upon the partial redemption of outstanding Senior Subordinated Notes, the RDUs ceased to accrue the proportionate related interest component credits. The amended RDU Plan provides participants the opportunity to share on a pro rata basis in cash retention pools payable to participants who satisfy certain retention requirements. The aggregate amount of the retention pools was determined to be
$15.0 million
based upon the amount of interest component credits that would have been allocated to the RDU Plan if the Senior Subordinated Notes had remained outstanding from August 1, 2013 through maturity. The Company recorded a pre-tax charge of
$7.5 million
in the year ended December 31, 2013 for payment of the first cash retention pool. The second cash retention pool payment is expected to be made to participants who remain employed through December 31, 2015 in the first quarter of 2016. Participants continued to accrue an interest component credit for the proportionate amount of Senior Subordinated Notes while outstanding, payable on the aforementioned semi-annual due dates; such payments, however, will be deducted from the second retention pool payment amount of
$7.5 million
.
Unrecognized compensation expense as of December 31, 2014 of approximately
$5 million
is expected to be recognized through 2015 and approximately
$3 million
in 2016 through 2017. Payments under the RDU Plan may be impacted if certain significant events occur or circumstances change that would impact the financial condition or structure of the Company.
Compensation expense of
$8.8 million
,
$16.8 million
, and
$8.4 million
related to the RDU Plan was recognized in the years ended
December 31, 2014, 2013 and 2012
, respectively. At
December 31, 2014 and 2013
, the Company had
$30.4 million
and
$21.8 million
of liabilities related to the RDU Plan recorded on the consolidated balance sheets, respectively.
Payment of the principal component of the RDU Plan is expected to be made on October 12, 2017, unless accelerated due to a sale of the Company.
|
13.
|
Profit Sharing and 401(k) Plan
|
The Company has a profit sharing plan that includes a salary reduction feature established under the Internal Revenue Code Section 401(k) covering substantially all coworkers. Company contributions to the profit sharing plan are made in cash and determined at the discretion of the Board of Directors. For the years ended
December 31, 2014, 2013 and 2012
, the amounts charged to expense for this plan totaled
$21.9 million
,
$17.3 million
and
$14.6 million
, respectively.
|
14.
|
Commitments and Contingencies
|
The Company is party to various legal proceedings that arise in the ordinary course of its business, which include commercial, intellectual property, employment, tort and other litigation matters. The Company is also subject to audit by federal, state and local authorities, and by various partners, group purchasing organizations and customers, including government agencies, relating to purchases and sales under various contracts. In addition, the Company is subject to indemnification claims under various contracts. From time to time, certain customers of the Company file voluntary petitions for reorganization or liquidation under the U.S. bankruptcy laws. In such cases, certain pre-petition payments received by the Company could be considered preference items and subject to return to the bankruptcy administrator.
As of December 31, 2014, the Company does not believe that there is a reasonable possibility that any material loss exceeding the amounts already recognized for these proceedings and matters, if any, has been incurred. However, the ultimate resolutions of these proceedings and matters are inherently unpredictable. As such, the Company’s financial condition and results of operations could be adversely affected in any particular period by the unfavorable resolution of one or more of these proceedings or matters.
|
15.
|
Equity Investments
|
On
November 10, 2014
, the Company acquired a
35%
non-controlling interest in Kelway, a UK-based IT solutions provider, which has global supply chain relationships that enable it to conduct business in over 100 countries. The Company paid
$86.8 million
to acquire its ownership interest in Kelway, with the option to purchase the remaining
65%
between June 2015 and June 2017. The Company accounts for its investment in Kelway using the equity method. As of
December 31, 2014
, the amount assigned to goodwill and definite-lived intangible assets related to the
89
Company's
35%
non-controlling equity investment in Kelway was
$119.2 million
, which represented the excess of the purchase price plus liabilities assumed less tangible assets acquired.
|
16.
|
Related Party Transactions
|
The Company had previously entered into a management services agreement with the Sponsors pursuant to which they had agreed to provide it with management and consulting services and financial and other advisory services. Pursuant to such agreement, the Sponsors received an annual management fee of
$5.0 million
and reimbursement of out-of-pocket expenses incurred in connection with the provision of such services. Such amounts were classified as selling and administrative expenses within the consolidated statements of operations. The management services agreement included customary indemnification and provisions in favor of the Sponsors.
On July 2, 2013, the Company completed an IPO of its common stock. Using a portion of the net proceeds from the IPO, the Company paid a
$24.4 million
termination fee to affiliates of the Sponsors in connection with the termination of the management services agreement with such entities that was effective upon completion of the IPO. The Company paid an annual management fee of
$2.5 million
and
$5.0 million
in the years ended December 31, 2013 and 2012, respectively. There was
no
management fee paid for the year ended December 31, 2014.
On March 20, 2014, the Company repurchased and subsequently canceled
$25.0 million
aggregate principal amount of the 2019 Senior Notes from an affiliate of Providence Equity. See Note 7 for additional information related to this transaction.
|
17.
|
Segment Information
|
Segment information is presented in accordance with a “management approach,” which designates the internal reporting used by the chief operating decision-maker for making decisions and assessing performance as the source of the Company's reportable segments. The Company's segments are organized in a manner consistent with which separate financial information is available and evaluated regularly by the chief operating decision-maker in deciding how to allocate resources and in assessing performance.
The Company has
two
reportable segments: Corporate, which is comprised primarily of business customers, and Public, which is comprised of government entities and education and healthcare institutions. The Company also has
three
other operating segments, CDW Advanced Services, Canada and Kelway, which do not meet the reportable segment quantitative thresholds and, accordingly, are combined together as “Other.” In November 2014, the Company acquired a
35%
non-controlling equity interest in Kelway. See Note 15 for additional information on Kelway.
The Company has centralized logistics and headquarters functions that provide services to the segments. The logistics function includes purchasing, distribution and fulfillment services to support both the Corporate and Public segments. As a result, costs and intercompany charges associated with the logistics function are fully allocated to both of these segments based on a percent of sales. The centralized headquarters function provides services in areas such as accounting, information technology, marketing, legal and coworker services. Headquarters' function costs that are not allocated to the segments are included under the heading of “Headquarters” in the tables below. Depreciation expense is included in Headquarters as it is not allocated among segments or used in measuring segment performance.
IPO- and secondary-offering related expenses primarily relating to coworker compensation were included within operating segment results for the year ended December 31, 2013. See Note 9 for additional discussion of IPO- and secondary-offering related expenses.
The Company allocates resources to and evaluates performance of its segments based on net sales, income (loss) from operations and Adjusted EBITDA, a non-GAAP measure as defined in the Company's credit agreements. However, the Company has concluded that income (loss) from operations is the more useful measure in terms of discussion of operating results, as it is a GAAP measure.
Segment information for total assets and capital expenditures is not presented, as such information is not used in measuring segment performance or allocating resources between segments.
90
Selected Segment Financial Information
The following table presents information about the Company’s segments for the years ended
December 31, 2014, 2013 and 2012
:
|
(in millions)
|
Corporate
|
Public
|
Other
|
Headquarters
|
Total
|
||||||||||||||
|
2014:
|
|||||||||||||||||||
|
Net sales
|
$
|
6,475.5
|
|
$
|
4,879.4
|
|
$
|
719.6
|
|
$
|
—
|
|
$
|
12,074.5
|
|
||||
|
Income (loss) from operations
|
439.8
|
|
313.2
|
|
32.9
|
|
(112.9
|
)
|
673.0
|
|
|||||||||
|
Depreciation and amortization expense
|
(96.3
|
)
|
(43.8
|
)
|
(8.8
|
)
|
(59.0
|
)
|
(207.9
|
)
|
|||||||||
|
2013:
|
|||||||||||||||||||
|
Net sales
|
$
|
5,960.1
|
|
$
|
4,164.5
|
|
$
|
644.0
|
|
$
|
—
|
|
$
|
10,768.6
|
|
||||
|
Income (loss) from operations
(1)
|
363.3
|
|
246.5
|
|
27.2
|
|
(128.4
|
)
|
508.6
|
|
|||||||||
|
Depreciation and amortization expense
|
(97.3
|
)
|
(44.0
|
)
|
(8.6
|
)
|
(58.3
|
)
|
(208.2
|
)
|
|||||||||
|
2012:
|
|||||||||||||||||||
|
Net sales
|
$
|
5,512.8
|
|
$
|
4,023.0
|
|
$
|
592.4
|
|
$
|
—
|
|
$
|
10,128.2
|
|
||||
|
Income (loss) from operations
|
349.0
|
|
246.7
|
|
18.6
|
|
(103.7
|
)
|
510.6
|
|
|||||||||
|
Depreciation and amortization expense
|
(97.6
|
)
|
(44.0
|
)
|
(9.3
|
)
|
(59.3
|
)
|
(210.2
|
)
|
|||||||||
(1) Includes
$75.0 million
of IPO- and secondary-offering related expenses, as follows: Corporate
$26.4 million
; Public
$14.4 million
; Other
$3.6 million
; and Headquarters
$30.6 million
.
Major Customers, Geographic Areas, and Product Mix
Net sales to the federal government were
$884.2 million
,
$764.4 million
and
$964.7 million
and accounted for approximately
7%
,
7%
and
10%
of total net sales in 2014, 2013 and 2012, respectively. Net sales to customers outside of the U.S., primarily in Canada, were approximately
4%
of the Company's total net sales in 2014, 2013 and 2012. Approximately
1%
of the Company’s long-lived assets were located outside of the U.S. as of December 31, 2014 and 2013.
The following table presents net sales by major category for the years ended
December 31, 2014, 2013 and 2012
. Categories are based upon internal classifications. Amounts for the years ended December 31, 2013 and 2012 have been reclassified for certain changes in individual product classifications to conform to the presentation for the year ended
December 31, 2014
.
|
|
Year Ended
December 31, 2014
|
Year Ended
December 31, 2013
|
Year Ended
December 31, 2012
|
|||||||||||||||||
|
Dollars in
Millions
|
Percentage
of Total Net
Sales
|
Dollars in
Millions
|
Percentage
of Total Net
Sales
|
Dollars in
Millions
|
Percentage
of Total Net
Sales
|
|||||||||||||||
|
Notebooks/Mobile Devices
|
$
|
2,352.3
|
|
19.5
|
%
|
$
|
1,698.4
|
|
15.8
|
%
|
$
|
1,462.8
|
|
14.4
|
%
|
|||||
|
NetComm Products
|
1,615.9
|
|
13.4
|
|
1,486.3
|
|
13.8
|
|
1,351.5
|
|
13.3
|
|
||||||||
|
Enterprise and Data Storage (Including Drives)
|
1,024.3
|
|
8.5
|
|
999.2
|
|
9.3
|
|
981.5
|
|
9.7
|
|
||||||||
|
Other Hardware
|
4,549.2
|
|
37.6
|
|
4,178.5
|
|
38.8
|
|
4,075.7
|
|
40.3
|
|
||||||||
|
Software
|
2,076.7
|
|
17.2
|
|
1,993.1
|
|
18.5
|
|
1,877.7
|
|
18.5
|
|
||||||||
|
Services
|
371.4
|
|
3.1
|
|
332.7
|
|
3.1
|
|
285.0
|
|
2.8
|
|
||||||||
|
Other
(1)
|
84.7
|
|
0.7
|
|
80.4
|
|
0.7
|
|
94.0
|
|
1.0
|
|
||||||||
|
Total net sales
|
$
|
12,074.5
|
|
100.0
|
%
|
$
|
10,768.6
|
|
100.0
|
%
|
$
|
10,128.2
|
|
100.0
|
%
|
|||||
|
(1)
|
Includes items such as delivery charges to customers and certain commission revenue.
|
91
|
18.
|
Supplemental Guarantor Information
|
The 2019 Senior Notes, the 2022 Senior Notes, and the 2024 Senior Notes are, and, prior to being redeemed in full, the Senior Subordinated Notes and the Senior Secured Notes, were guaranteed by Parent and each of CDW LLC’s direct and indirect, 100% owned, domestic subsidiaries (the “Guarantor Subsidiaries”). All guarantees by Parent and Guarantor Subsidiaries are and were joint and several, and full and unconditional; provided that guarantees by the Guarantor Subsidiaries (i) are subject to certain customary release provisions contained in the indentures governing the 2019 Senior Notes, the 2022 Senior Notes, and the 2024 Senior Notes, and (ii) were subject to certain customary release provisions contained in the indentures governing the Senior Subordinated Notes and the Senior Secured Notes until such indentures were satisfied and discharged in 2014. CDW LLC's Canada subsidiary (the “Non-Guarantor Subsidiary”) does not guarantee the debt obligations. CDW LLC and CDW Finance Corporation, as co-issuers, are 100% owned by Parent, and each of the Guarantor Subsidiaries and the Non-Guarantor Subsidiary is 100% owned by CDW LLC.
On May 9, 2014, all of the remaining
$42.5 million
aggregate principal amount of Senior Subordinated Notes was redeemed in full and the indenture governing the Senior Subordinated Notes was satisfied and discharged. See Note 7 for more information.
On August 5, 2014, CDW LLC and CDW Finance Corporation, as co-issuers, completed the issuance of
$600.0 million
aggregate principal amount of 2022 Senior Notes, which is guaranteed by Parent and the Guarantor Subsidiaries. The proceeds from this issuance, along with cash on hand, were used to redeem all of the remaining
$325.0 million
aggregate principal amount of the Senior Secured Notes and to redeem
$234.7 million
aggregate principal amount of the 2019 Senior Notes. The indenture governing the Senior Secured Notes was concurrently satisfied and discharged. See Note 7 for more information.
On December 1, 2014, CDW LLC and CDW Finance Corporation, as co-issuers, completed the issuance of
$575.0 million
aggregate principal amount of 2024 Senior Notes, which is guaranteed by Parent and the Guarantor Subsidiaries. The proceeds from this issuance, along with cash on hand, were used to redeem
$541.4 million
aggregate principal amount of the 8.5% Senior Notes. See Note 7 for more information.
The following tables set forth condensed consolidating balance sheets as of
December 31, 2014 and 2013
, consolidating statements of operations for the years ended
December 31, 2014, 2013 and 2012
, condensed consolidating statements of comprehensive income for the years ended
December 31, 2014, 2013 and 2012
, and condensed consolidating statements of cash flows for the years ended
December 31, 2014, 2013 and 2012
, in accordance with Rule 3-10 of Regulation S-X. The consolidating financial information includes the accounts of CDW Corporation (the “Parent Guarantor”), which has no independent assets or operations, the accounts of CDW LLC (the “Subsidiary Issuer”), the combined accounts of the Guarantor Subsidiaries, the accounts of the Non-Guarantor Subsidiary, and the accounts of CDW Finance Corporation (the “Co-Issuer”) for the periods indicated. The information was prepared on the same basis as the Company’s consolidated financial statements.
92
|
Condensed Consolidating Balance Sheet
|
|||||||||||||||||||||||||||
|
December 31, 2014
|
|||||||||||||||||||||||||||
|
(in millions)
|
Parent
Guarantor
|
Subsidiary
Issuer
|
Guarantor
Subsidiaries
|
Non-Guarantor
Subsidiary
|
Co-Issuer
|
Consolidating
Adjustments
|
Consolidated
|
||||||||||||||||||||
|
Assets
|
|||||||||||||||||||||||||||
|
Current assets:
|
|||||||||||||||||||||||||||
|
Cash and cash equivalents
|
$
|
—
|
|
$
|
346.4
|
|
$
|
—
|
|
$
|
24.6
|
|
$
|
—
|
|
$
|
(26.5
|
)
|
$
|
344.5
|
|
||||||
|
Accounts receivable, net
|
—
|
|
—
|
|
1,479.1
|
|
82.0
|
|
—
|
|
—
|
|
1,561.1
|
|
|||||||||||||
|
Merchandise inventory
|
—
|
|
—
|
|
333.9
|
|
3.6
|
|
—
|
|
—
|
|
337.5
|
|
|||||||||||||
|
Miscellaneous receivables
|
—
|
|
56.1
|
|
93.3
|
|
6.2
|
|
—
|
|
—
|
|
155.6
|
|
|||||||||||||
|
Prepaid expenses and other
|
—
|
|
11.0
|
|
46.0
|
|
1.5
|
|
—
|
|
(3.8
|
)
|
54.7
|
|
|||||||||||||
|
Total current assets
|
—
|
|
413.5
|
|
1,952.3
|
|
117.9
|
|
—
|
|
(30.3
|
)
|
2,453.4
|
|
|||||||||||||
|
Property and equipment, net
|
—
|
|
80.5
|
|
55.5
|
|
1.2
|
|
—
|
|
—
|
|
137.2
|
|
|||||||||||||
|
Equity investments
|
—
|
|
86.7
|
|
—
|
|
—
|
|
—
|
|
—
|
|
86.7
|
|
|||||||||||||
|
Goodwill
|
—
|
|
751.8
|
|
1,439.0
|
|
26.8
|
|
—
|
|
—
|
|
2,217.6
|
|
|||||||||||||
|
Other intangible assets, net
|
—
|
|
320.0
|
|
843.6
|
|
5.2
|
|
—
|
|
—
|
|
1,168.8
|
|
|||||||||||||
|
Deferred financing costs, net
|
—
|
|
33.0
|
|
—
|
|
—
|
|
—
|
|
—
|
|
33.0
|
|
|||||||||||||
|
Other assets
|
4.3
|
|
3.2
|
|
0.4
|
|
1.4
|
|
—
|
|
(6.1
|
)
|
3.2
|
|
|||||||||||||
|
Investment in and advances to subsidiaries
|
932.2
|
|
2,784.5
|
|
—
|
|
—
|
|
—
|
|
(3,716.7
|
)
|
—
|
|
|||||||||||||
|
Total assets
|
$
|
936.5
|
|
$
|
4,473.2
|
|
$
|
4,290.8
|
|
$
|
152.5
|
|
$
|
—
|
|
$
|
(3,753.1
|
)
|
$
|
6,099.9
|
|
||||||
|
Liabilities and Shareholders’ Equity
|
|||||||||||||||||||||||||||
|
Current liabilities:
|
|||||||||||||||||||||||||||
|
Accounts payable-trade
|
$
|
—
|
|
$
|
23.9
|
|
$
|
671.9
|
|
$
|
34.7
|
|
$
|
—
|
|
$
|
(26.5
|
)
|
$
|
704.0
|
|
||||||
|
Accounts payable-inventory financing
|
—
|
|
—
|
|
332.1
|
|
—
|
|
—
|
|
—
|
|
332.1
|
|
|||||||||||||
|
Current maturities of long-term debt
|
—
|
|
15.4
|
|
—
|
|
—
|
|
—
|
|
—
|
|
15.4
|
|
|||||||||||||
|
Deferred revenue
|
—
|
|
—
|
|
79.9
|
|
1.4
|
|
—
|
|
—
|
|
81.3
|
|
|||||||||||||
|
Accrued expenses
|
—
|
|
137.8
|
|
193.6
|
|
7.9
|
|
—
|
|
(4.1
|
)
|
335.2
|
|
|||||||||||||
|
Total current liabilities
|
—
|
|
177.1
|
|
1,277.5
|
|
44.0
|
|
—
|
|
(30.6
|
)
|
1,468.0
|
|
|||||||||||||
|
Long-term liabilities:
|
|||||||||||||||||||||||||||
|
Debt
|
—
|
|
3,174.6
|
|
—
|
|
—
|
|
—
|
|
—
|
|
3,174.6
|
|
|||||||||||||
|
Deferred income taxes
|
—
|
|
146.7
|
|
331.3
|
|
1.3
|
|
—
|
|
(4.3
|
)
|
475.0
|
|
|||||||||||||
|
Other liabilities
|
—
|
|
42.6
|
|
3.7
|
|
1.0
|
|
—
|
|
(1.5
|
)
|
45.8
|
|
|||||||||||||
|
Total long-term liabilities
|
—
|
|
3,363.9
|
|
335.0
|
|
2.3
|
|
—
|
|
(5.8
|
)
|
3,695.4
|
|
|||||||||||||
|
Total shareholders’ equity
|
936.5
|
|
932.2
|
|
2,678.3
|
|
106.2
|
|
—
|
|
(3,716.7
|
)
|
936.5
|
|
|||||||||||||
|
Total liabilities and shareholders' equity
|
$
|
936.5
|
|
$
|
4,473.2
|
|
$
|
4,290.8
|
|
$
|
152.5
|
|
$
|
—
|
|
$
|
(3,753.1
|
)
|
$
|
6,099.9
|
|
||||||
93
|
Condensed Consolidating Balance Sheet
|
|||||||||||||||||||||||||||
|
December 31, 2013
|
|||||||||||||||||||||||||||
|
(in millions)
|
Parent
Guarantor
|
Subsidiary
Issuer
|
Guarantor
Subsidiaries
|
Non-Guarantor
Subsidiary
|
Co-Issuer
|
Consolidating
Adjustments
|
Consolidated
|
||||||||||||||||||||
|
Assets
|
|||||||||||||||||||||||||||
|
Current assets:
|
|||||||||||||||||||||||||||
|
Cash and cash equivalents
|
$
|
—
|
|
$
|
196.5
|
|
$
|
—
|
|
$
|
14.0
|
|
$
|
—
|
|
$
|
(22.4
|
)
|
$
|
188.1
|
|
||||||
|
Accounts receivable, net
|
—
|
|
—
|
|
1,375.9
|
|
75.1
|
|
—
|
|
—
|
|
1,451.0
|
|
|||||||||||||
|
Merchandise inventory
|
—
|
|
—
|
|
378.9
|
|
3.1
|
|
—
|
|
—
|
|
382.0
|
|
|||||||||||||
|
Miscellaneous receivables
|
—
|
|
49.9
|
|
91.0
|
|
5.4
|
|
—
|
|
—
|
|
146.3
|
|
|||||||||||||
|
Prepaid expenses and other
|
—
|
|
10.7
|
|
33.4
|
|
5.1
|
|
—
|
|
(3.1
|
)
|
46.1
|
|
|||||||||||||
|
Total current assets
|
—
|
|
257.1
|
|
1,879.2
|
|
102.7
|
|
—
|
|
(25.5
|
)
|
2,213.5
|
|
|||||||||||||
|
Property and equipment, net
|
—
|
|
69.7
|
|
59.6
|
|
1.8
|
|
—
|
|
—
|
|
131.1
|
|
|||||||||||||
|
Goodwill
|
—
|
|
751.9
|
|
1,439.0
|
|
29.4
|
|
—
|
|
—
|
|
2,220.3
|
|
|||||||||||||
|
Other intangible assets, net
|
—
|
|
338.5
|
|
982.8
|
|
6.7
|
|
—
|
|
—
|
|
1,328.0
|
|
|||||||||||||
|
Deferred financing costs, net
|
—
|
|
30.1
|
|
—
|
|
—
|
|
—
|
|
—
|
|
30.1
|
|
|||||||||||||
|
Other assets
|
4.9
|
|
1.4
|
|
0.1
|
|
0.9
|
|
—
|
|
(5.7
|
)
|
1.6
|
|
|||||||||||||
|
Investment in and advances to subsidiaries
|
706.8
|
|
2,909.4
|
|
—
|
|
—
|
|
—
|
|
(3,616.2
|
)
|
—
|
|
|||||||||||||
|
Total assets
|
$
|
711.7
|
|
$
|
4,358.1
|
|
$
|
4,360.7
|
|
$
|
141.5
|
|
$
|
—
|
|
$
|
(3,647.4
|
)
|
$
|
5,924.6
|
|
||||||
|
Liabilities and Shareholders' Equity
|
|||||||||||||||||||||||||||
|
Current liabilities:
|
|||||||||||||||||||||||||||
|
Accounts payable-trade
|
$
|
—
|
|
$
|
21.4
|
|
$
|
637.3
|
|
$
|
26.5
|
|
$
|
—
|
|
$
|
(22.4
|
)
|
$
|
662.8
|
|
||||||
|
Accounts payable-inventory financing
|
—
|
|
—
|
|
256.6
|
|
—
|
|
—
|
|
—
|
|
256.6
|
|
|||||||||||||
|
Current maturities of long-term debt
|
—
|
|
45.4
|
|
—
|
|
—
|
|
—
|
|
—
|
|
45.4
|
|
|||||||||||||
|
Deferred revenue
|
—
|
|
—
|
|
89.9
|
|
4.9
|
|
—
|
|
—
|
|
94.8
|
|
|||||||||||||
|
Accrued expenses
|
—
|
|
163.5
|
|
175.1
|
|
7.5
|
|
—
|
|
(3.1
|
)
|
343.0
|
|
|||||||||||||
|
Total current liabilities
|
—
|
|
230.3
|
|
1,158.9
|
|
38.9
|
|
—
|
|
(25.5
|
)
|
1,402.6
|
|
|||||||||||||
|
Long-term liabilities:
|
|||||||||||||||||||||||||||
|
Debt
|
—
|
|
3,205.8
|
|
—
|
|
—
|
|
—
|
|
—
|
|
3,205.8
|
|
|||||||||||||
|
Deferred income taxes
|
—
|
|
178.3
|
|
388.4
|
|
1.6
|
|
—
|
|
(4.8
|
)
|
563.5
|
|
|||||||||||||
|
Other liabilities
|
—
|
|
36.9
|
|
3.6
|
|
1.4
|
|
—
|
|
(0.9
|
)
|
41.0
|
|
|||||||||||||
|
Total long-term liabilities
|
—
|
|
3,421.0
|
|
392.0
|
|
3.0
|
|
—
|
|
(5.7
|
)
|
3,810.3
|
|
|||||||||||||
|
Total shareholders’ equity
|
711.7
|
|
706.8
|
|
2,809.8
|
|
99.6
|
|
—
|
|
(3,616.2
|
)
|
711.7
|
|
|||||||||||||
|
Total liabilities and shareholders’ equity
|
$
|
711.7
|
|
$
|
4,358.1
|
|
$
|
4,360.7
|
|
$
|
141.5
|
|
$
|
—
|
|
$
|
(3,647.4
|
)
|
$
|
5,924.6
|
|
||||||
94
|
Consolidating Statement of Operations
|
|||||||||||||||||||||||||||
|
Year Ended December 31, 2014
|
|||||||||||||||||||||||||||
|
(in millions)
|
Parent
Guarantor
|
Subsidiary
Issuer
|
Guarantor
Subsidiaries
|
Non-Guarantor
Subsidiary
|
Co-Issuer
|
Consolidating
Adjustments
|
Consolidated
|
||||||||||||||||||||
|
Net sales
|
$
|
—
|
|
$
|
—
|
|
$
|
11,542.3
|
|
$
|
532.2
|
|
$
|
—
|
|
$
|
—
|
|
$
|
12,074.5
|
|
||||||
|
Cost of sales
|
—
|
|
—
|
|
9,684.9
|
|
468.3
|
|
—
|
|
—
|
|
10,153.2
|
|
|||||||||||||
|
Gross profit
|
—
|
|
—
|
|
1,857.4
|
|
63.9
|
|
—
|
|
—
|
|
1,921.3
|
|
|||||||||||||
|
Selling and administrative expenses
|
—
|
|
112.8
|
|
962.3
|
|
35.2
|
|
—
|
|
—
|
|
1,110.3
|
|
|||||||||||||
|
Advertising expense
|
—
|
|
—
|
|
134.0
|
|
4.0
|
|
—
|
|
—
|
|
138.0
|
|
|||||||||||||
|
(Loss) income from operations
|
—
|
|
(112.8
|
)
|
761.1
|
|
24.7
|
|
—
|
|
—
|
|
673.0
|
|
|||||||||||||
|
Interest (expense) income, net
|
—
|
|
(197.7
|
)
|
0.1
|
|
0.3
|
|
—
|
|
—
|
|
(197.3
|
)
|
|||||||||||||
|
Net loss on extinguishments of long-term debt
|
—
|
|
(90.7
|
)
|
—
|
|
—
|
|
—
|
|
—
|
|
(90.7
|
)
|
|||||||||||||
|
Management fee
|
—
|
|
3.9
|
|
—
|
|
(3.9
|
)
|
—
|
|
—
|
|
—
|
|
|||||||||||||
|
Other income, net
|
—
|
|
1.2
|
|
1.5
|
|
—
|
|
—
|
|
—
|
|
2.7
|
|
|||||||||||||
|
(Loss) income before income taxes
|
—
|
|
(396.1
|
)
|
762.7
|
|
21.1
|
|
—
|
|
—
|
|
387.7
|
|
|||||||||||||
|
Income tax benefit (expense)
|
—
|
|
141.0
|
|
(278.1
|
)
|
(5.7
|
)
|
—
|
|
—
|
|
(142.8
|
)
|
|||||||||||||
|
(Loss) income before equity in earnings of subsidiaries
|
—
|
|
(255.1
|
)
|
484.6
|
|
15.4
|
|
—
|
|
—
|
|
244.9
|
|
|||||||||||||
|
Equity in earnings of subsidiaries
|
244.9
|
|
500.0
|
|
—
|
|
—
|
|
—
|
|
(744.9
|
)
|
—
|
|
|||||||||||||
|
Net income
|
$
|
244.9
|
|
$
|
244.9
|
|
$
|
484.6
|
|
$
|
15.4
|
|
$
|
—
|
|
$
|
(744.9
|
)
|
$
|
244.9
|
|
||||||
95
|
Consolidating Statement of Operations
|
|||||||||||||||||||||||||||
|
Year Ended December 31, 2013
|
|||||||||||||||||||||||||||
|
(in millions)
|
Parent
Guarantor
|
Subsidiary
Issuer
|
Guarantor
Subsidiaries
|
Non-Guarantor
Subsidiary
|
Co-Issuer
|
Consolidating
Adjustments
|
Consolidated
|
||||||||||||||||||||
|
Net sales
|
$
|
—
|
|
$
|
—
|
|
$
|
10,293.3
|
|
$
|
475.3
|
|
$
|
—
|
|
$
|
—
|
|
$
|
10,768.6
|
|
||||||
|
Cost of sales
|
—
|
|
—
|
|
8,592.1
|
|
416.2
|
|
—
|
|
—
|
|
9,008.3
|
|
|||||||||||||
|
Gross profit
|
—
|
|
—
|
|
1,701.2
|
|
59.1
|
|
—
|
|
—
|
|
1,760.3
|
|
|||||||||||||
|
Selling and administrative expenses
|
24.4
|
|
103.9
|
|
957.3
|
|
35.3
|
|
—
|
|
—
|
|
1,120.9
|
|
|||||||||||||
|
Advertising expense
|
—
|
|
—
|
|
126.8
|
|
4.0
|
|
—
|
|
—
|
|
130.8
|
|
|||||||||||||
|
(Loss) income from operations
|
(24.4
|
)
|
(103.9
|
)
|
617.1
|
|
19.8
|
|
—
|
|
—
|
|
508.6
|
|
|||||||||||||
|
Interest (expense) income, net
|
—
|
|
(250.6
|
)
|
0.2
|
|
0.3
|
|
—
|
|
—
|
|
(250.1
|
)
|
|||||||||||||
|
Net loss on extinguishments of long-term debt
|
—
|
|
(64.0
|
)
|
—
|
|
—
|
|
—
|
|
—
|
|
(64.0
|
)
|
|||||||||||||
|
Management fee
|
—
|
|
4.3
|
|
—
|
|
(4.3
|
)
|
—
|
|
—
|
|
—
|
|
|||||||||||||
|
Other (expense) income, net
|
—
|
|
(0.5
|
)
|
1.2
|
|
0.3
|
|
—
|
|
—
|
|
1.0
|
|
|||||||||||||
|
(Loss) income before income taxes
|
(24.4
|
)
|
(414.7
|
)
|
618.5
|
|
16.1
|
|
—
|
|
—
|
|
195.5
|
|
|||||||||||||
|
Income tax benefit (expense)
|
9.2
|
|
142.2
|
|
(209.5
|
)
|
(4.6
|
)
|
—
|
|
—
|
|
(62.7
|
)
|
|||||||||||||
|
(Loss) income before equity in earnings of subsidiaries
|
(15.2
|
)
|
(272.5
|
)
|
409.0
|
|
11.5
|
|
—
|
|
—
|
|
132.8
|
|
|||||||||||||
|
Equity in earnings of subsidiaries
|
148.0
|
|
420.5
|
|
—
|
|
—
|
|
—
|
|
(568.5
|
)
|
—
|
|
|||||||||||||
|
Net income
|
$
|
132.8
|
|
$
|
148.0
|
|
$
|
409.0
|
|
$
|
11.5
|
|
$
|
—
|
|
$
|
(568.5
|
)
|
$
|
132.8
|
|
||||||
96
|
Consolidating Statement of Operations
|
|||||||||||||||||||||||||||
|
Year Ended December 31, 2012
|
|||||||||||||||||||||||||||
|
(in millions)
|
Parent
Guarantor
|
Subsidiary
Issuer
|
Guarantor
Subsidiaries
|
Non-Guarantor
Subsidiary
|
Co-Issuer
|
Consolidating
Adjustments
|
Consolidated
|
||||||||||||||||||||
|
Net sales
|
$
|
—
|
|
$
|
—
|
|
$
|
9,683.0
|
|
$
|
445.2
|
|
$
|
—
|
|
$
|
—
|
|
$
|
10,128.2
|
|
||||||
|
Cost of sales
|
—
|
|
—
|
|
8,071.5
|
|
387.1
|
|
—
|
|
—
|
|
8,458.6
|
|
|||||||||||||
|
Gross profit
|
—
|
|
—
|
|
1,611.5
|
|
58.1
|
|
—
|
|
—
|
|
1,669.6
|
|
|||||||||||||
|
Selling and administrative expenses
|
—
|
|
103.7
|
|
891.6
|
|
34.2
|
|
—
|
|
—
|
|
1,029.5
|
|
|||||||||||||
|
Advertising expense
|
—
|
|
—
|
|
125.1
|
|
4.4
|
|
—
|
|
—
|
|
129.5
|
|
|||||||||||||
|
(Loss) income from operations
|
—
|
|
(103.7
|
)
|
594.8
|
|
19.5
|
|
—
|
|
—
|
|
510.6
|
|
|||||||||||||
|
Interest (expense) income, net
|
—
|
|
(308.0
|
)
|
0.4
|
|
0.2
|
|
—
|
|
—
|
|
(307.4
|
)
|
|||||||||||||
|
Net loss on extinguishments of long-term debt
|
—
|
|
(17.2
|
)
|
—
|
|
—
|
|
—
|
|
—
|
|
(17.2
|
)
|
|||||||||||||
|
Management fee
|
—
|
|
3.8
|
|
—
|
|
(3.8
|
)
|
—
|
|
—
|
|
—
|
|
|||||||||||||
|
Other income (expense), net
|
—
|
|
—
|
|
0.2
|
|
(0.1
|
)
|
—
|
|
—
|
|
0.1
|
|
|||||||||||||
|
(Loss) income before income taxes
|
—
|
|
(425.1
|
)
|
595.4
|
|
15.8
|
|
—
|
|
—
|
|
186.1
|
|
|||||||||||||
|
Income tax benefit (expense)
|
—
|
|
210.6
|
|
(272.6
|
)
|
(5.1
|
)
|
—
|
|
—
|
|
(67.1
|
)
|
|||||||||||||
|
(Loss) income before equity in earnings of subsidiaries
|
—
|
|
(214.5
|
)
|
322.8
|
|
10.7
|
|
—
|
|
—
|
|
119.0
|
|
|||||||||||||
|
Equity in earnings of subsidiaries
|
119.0
|
|
333.5
|
|
—
|
|
—
|
|
—
|
|
(452.5
|
)
|
—
|
|
|||||||||||||
|
Net income
|
$
|
119.0
|
|
$
|
119.0
|
|
$
|
322.8
|
|
$
|
10.7
|
|
$
|
—
|
|
$
|
(452.5
|
)
|
$
|
119.0
|
|
||||||
97
|
Condensed Consolidating Statement of Comprehensive Income
|
|||||||||||||||||||||||||||
|
Year Ended December 31, 2014
|
|||||||||||||||||||||||||||
|
(in millions)
|
Parent
Guarantor
|
Subsidiary
Issuer
|
Guarantor
Subsidiaries
|
Non-Guarantor
Subsidiary
|
Co-Issuer
|
Consolidating
Adjustments
|
Consolidated
|
||||||||||||||||||||
|
Comprehensive income
|
$
|
234.6
|
|
$
|
234.6
|
|
$
|
484.6
|
|
$
|
5.1
|
|
$
|
—
|
|
$
|
(724.3
|
)
|
$
|
234.6
|
|
||||||
98
|
Condensed Consolidating Statement of Comprehensive Income
|
|||||||||||||||||||||||||||
|
Year Ended December 31, 2013
|
|||||||||||||||||||||||||||
|
(in millions)
|
Parent
Guarantor
|
Subsidiary
Issuer
|
Guarantor
Subsidiaries
|
Non-Guarantor
Subsidiary
|
Co-Issuer
|
Consolidating
Adjustments
|
Consolidated
|
||||||||||||||||||||
|
Comprehensive income
|
$
|
126.1
|
|
$
|
141.3
|
|
$
|
409.0
|
|
$
|
4.8
|
|
$
|
—
|
|
$
|
(555.1
|
)
|
$
|
126.1
|
|
||||||
99
|
Condensed Consolidating Statement of Comprehensive Income
|
|||||||||||||||||||||||||||
|
Year Ended December 31, 2012
|
|||||||||||||||||||||||||||
|
(in millions)
|
Parent
Guarantor
|
Subsidiary
Issuer
|
Guarantor
Subsidiaries
|
Non-Guarantor
Subsidiary
|
Co-Issuer
|
Consolidating
Adjustments
|
Consolidated
|
||||||||||||||||||||
|
Comprehensive income
|
$
|
121.5
|
|
$
|
121.5
|
|
$
|
322.8
|
|
$
|
13.2
|
|
$
|
—
|
|
$
|
(457.5
|
)
|
$
|
121.5
|
|
||||||
100
|
Condensed Consolidating Statement of Cash Flows
|
|||||||||||||||||||||||||||
|
Year Ended December 31, 2014
|
|||||||||||||||||||||||||||
|
(in millions)
|
Parent
Guarantor
|
Subsidiary
Issuer
|
Guarantor
Subsidiaries
|
Non-Guarantor
Subsidiary
|
Co-Issuer
|
Consolidating
Adjustments
|
Consolidated
|
||||||||||||||||||||
|
Net cash (used in) provided by operating activities
|
$
|
—
|
|
$
|
(120.4
|
)
|
$
|
547.7
|
|
$
|
11.8
|
|
$
|
—
|
|
$
|
(4.1
|
)
|
$
|
435.0
|
|
||||||
|
Cash flows from investing activities:
|
|||||||||||||||||||||||||||
|
Capital expenditures
|
—
|
|
(47.9
|
)
|
(7.1
|
)
|
—
|
|
—
|
|
—
|
|
(55.0
|
)
|
|||||||||||||
|
Payment for equity investments
|
—
|
|
(86.8
|
)
|
—
|
|
—
|
|
—
|
|
—
|
|
(86.8
|
)
|
|||||||||||||
|
Payment of accrued charitable contribution related to the MPK Coworker Incentive Plan II
|
—
|
|
(20.9
|
)
|
—
|
|
—
|
|
—
|
|
—
|
|
(20.9
|
)
|
|||||||||||||
|
Premium payments on interest rate cap agreements
|
—
|
|
(2.1
|
)
|
—
|
|
—
|
|
—
|
|
—
|
|
(2.1
|
)
|
|||||||||||||
|
Net cash used in investing activities
|
—
|
|
(157.7
|
)
|
(7.1
|
)
|
—
|
|
—
|
|
—
|
|
(164.8
|
)
|
|||||||||||||
|
Cash flows from financing activities:
|
|||||||||||||||||||||||||||
|
Repayments of long-term debt
|
—
|
|
(15.4
|
)
|
—
|
|
—
|
|
—
|
|
—
|
|
(15.4
|
)
|
|||||||||||||
|
Proceeds from issuance of long-term debt
|
—
|
|
1,175.0
|
|
—
|
|
—
|
|
—
|
|
—
|
|
1,175.0
|
|
|||||||||||||
|
Payments to extinguish long-term debt
|
—
|
|
(1,299.0
|
)
|
—
|
|
—
|
|
—
|
|
—
|
|
(1,299.0
|
)
|
|||||||||||||
|
Payment of debt financing costs
|
—
|
|
(21.9
|
)
|
—
|
|
—
|
|
—
|
|
—
|
|
(21.9
|
)
|
|||||||||||||
|
Net change in accounts payable-inventory financing
|
—
|
|
—
|
|
75.5
|
|
—
|
|
—
|
|
—
|
|
75.5
|
|
|||||||||||||
|
Proceeds from stock option exercises
|
—
|
|
1.3
|
|
—
|
|
—
|
|
—
|
|
—
|
|
1.3
|
|
|||||||||||||
|
Proceeds from Coworker stock purchase plan
|
—
|
|
5.8
|
|
—
|
|
—
|
|
—
|
|
—
|
|
5.8
|
|
|||||||||||||
|
Dividends paid
|
(33.6
|
)
|
—
|
|
—
|
|
—
|
|
—
|
|
—
|
|
(33.6
|
)
|
|||||||||||||
|
Excess tax benefits from equity-based compensation
|
—
|
|
0.3
|
|
—
|
|
—
|
|
—
|
|
—
|
|
0.3
|
|
|||||||||||||
|
Advances to/from affiliates
|
33.6
|
|
581.9
|
|
(616.1
|
)
|
0.6
|
|
—
|
|
—
|
|
—
|
|
|||||||||||||
|
Net cash provided by (used in) financing activities
|
—
|
|
428.0
|
|
(540.6
|
)
|
0.6
|
|
—
|
|
—
|
|
(112.0
|
)
|
|||||||||||||
|
Effect of exchange rate changes on cash and cash equivalents
|
—
|
|
—
|
|
—
|
|
(1.8
|
)
|
—
|
|
—
|
|
(1.8
|
)
|
|||||||||||||
|
Net increase in cash and cash equivalents
|
—
|
|
149.9
|
|
—
|
|
10.6
|
|
—
|
|
(4.1
|
)
|
156.4
|
|
|||||||||||||
|
Cash and cash equivalents – beginning of period
|
—
|
|
196.5
|
|
—
|
|
14.0
|
|
—
|
|
(22.4
|
)
|
188.1
|
|
|||||||||||||
|
Cash and cash equivalents – end of period
|
$
|
—
|
|
$
|
346.4
|
|
$
|
—
|
|
$
|
24.6
|
|
$
|
—
|
|
$
|
(26.5
|
)
|
$
|
344.5
|
|
||||||
101
|
Condensed Consolidating Statement of Cash Flows
|
|||||||||||||||||||||||||||
|
Year Ended December 31, 2013
|
|||||||||||||||||||||||||||
|
(in millions)
|
Parent
Guarantor |
Subsidiary
Issuer |
Guarantor
Subsidiaries |
Non-Guarantor
Subsidiary |
Co-Issuer
|
Consolidating
Adjustments |
Consolidated
|
||||||||||||||||||||
|
Net cash (used in) provided by operating activities
|
$
|
(15.2
|
)
|
$
|
(130.3
|
)
|
$
|
508.8
|
|
$
|
5.5
|
|
$
|
—
|
|
$
|
(2.5
|
)
|
$
|
366.3
|
|
||||||
|
Cash flows from investing activities:
|
|||||||||||||||||||||||||||
|
Capital expenditures
|
—
|
|
(40.8
|
)
|
(6.2
|
)
|
(0.1
|
)
|
—
|
|
—
|
|
(47.1
|
)
|
|||||||||||||
|
Net cash used in investing activities
|
—
|
|
(40.8
|
)
|
(6.2
|
)
|
(0.1
|
)
|
—
|
|
—
|
|
(47.1
|
)
|
|||||||||||||
|
Cash flows from financing activities:
|
|||||||||||||||||||||||||||
|
Proceeds from borrowings under revolving credit facility
|
—
|
|
63.0
|
|
—
|
|
—
|
|
—
|
|
—
|
|
63.0
|
|
|||||||||||||
|
Repayments of borrowings under revolving credit facility
|
—
|
|
(63.0
|
)
|
—
|
|
—
|
|
—
|
|
—
|
|
(63.0
|
)
|
|||||||||||||
|
Repayments of long-term debt
|
—
|
|
(51.1
|
)
|
—
|
|
—
|
|
—
|
|
—
|
|
(51.1
|
)
|
|||||||||||||
|
Proceeds from issuance of long-term debt
|
—
|
|
1,535.2
|
|
—
|
|
—
|
|
—
|
|
—
|
|
1,535.2
|
|
|||||||||||||
|
Payments to extinguish long-term debt
|
—
|
|
(2,047.4
|
)
|
—
|
|
—
|
|
—
|
|
—
|
|
(2,047.4
|
)
|
|||||||||||||
|
Payment of debt financing costs
|
—
|
|
(6.1
|
)
|
—
|
|
—
|
|
—
|
|
—
|
|
(6.1
|
)
|
|||||||||||||
|
Net change in accounts payable-inventory financing
|
—
|
|
—
|
|
7.4
|
|
—
|
|
—
|
|
—
|
|
7.4
|
|
|||||||||||||
|
Payment of incentive compensation plan withholding taxes
|
—
|
|
(4.0
|
)
|
(19.6
|
)
|
(0.5
|
)
|
—
|
|
—
|
|
(24.1
|
)
|
|||||||||||||
|
Net proceeds from issuance of common shares
|
424.7
|
|
—
|
|
—
|
|
—
|
|
—
|
|
—
|
|
424.7
|
|
|||||||||||||
|
Dividends paid
|
(7.3
|
)
|
—
|
|
—
|
|
—
|
|
—
|
|
—
|
|
(7.3
|
)
|
|||||||||||||
|
Advances to/from affiliates
|
(402.2
|
)
|
892.6
|
|
(490.4
|
)
|
—
|
|
—
|
|
—
|
|
—
|
|
|||||||||||||
|
Other financing activities
|
—
|
|
0.4
|
|
—
|
|
—
|
|
—
|
|
—
|
|
0.4
|
|
|||||||||||||
|
Net cash provided by (used in) financing activities
|
15.2
|
|
319.6
|
|
(502.6
|
)
|
(0.5
|
)
|
—
|
|
—
|
|
(168.3
|
)
|
|||||||||||||
|
Effect of exchange rate changes on cash and cash equivalents
|
—
|
|
—
|
|
—
|
|
(0.7
|
)
|
—
|
|
—
|
|
(0.7
|
)
|
|||||||||||||
|
Net increase in cash and cash equivalents
|
—
|
|
148.5
|
|
—
|
|
4.2
|
|
—
|
|
(2.5
|
)
|
150.2
|
|
|||||||||||||
|
Cash and cash equivalents – beginning of period
|
—
|
|
48.0
|
|
—
|
|
9.8
|
|
—
|
|
(19.9
|
)
|
37.9
|
|
|||||||||||||
|
Cash and cash equivalents – end of period
|
$
|
—
|
|
$
|
196.5
|
|
$
|
—
|
|
$
|
14.0
|
|
$
|
—
|
|
$
|
(22.4
|
)
|
$
|
188.1
|
|
||||||
102
|
Condensed Consolidating Statement of Cash Flows
|
|||||||||||||||||||||||||||
|
Year Ended December 31, 2012
|
|||||||||||||||||||||||||||
|
(in millions)
|
Parent
Guarantor |
Subsidiary
Issuer |
Guarantor
Subsidiaries |
Non-Guarantor
Subsidiary |
Co-Issuer
|
Consolidating
Adjustments |
Consolidated
|
||||||||||||||||||||
|
Net cash (used in) provided by operating activities
|
$
|
—
|
|
$
|
(204.3
|
)
|
$
|
514.2
|
|
$
|
1.3
|
|
$
|
—
|
|
$
|
6.2
|
|
$
|
317.4
|
|
||||||
|
Cash flows from investing activities:
|
|||||||||||||||||||||||||||
|
Capital expenditures
|
—
|
|
(27.0
|
)
|
(14.0
|
)
|
(0.4
|
)
|
—
|
|
—
|
|
(41.4
|
)
|
|||||||||||||
|
Premium payments on interest rate cap agreements
|
—
|
|
(0.3
|
)
|
—
|
|
—
|
|
—
|
|
—
|
|
(0.3
|
)
|
|||||||||||||
|
Net cash used in investing activities
|
—
|
|
(27.3
|
)
|
(14.0
|
)
|
(0.4
|
)
|
—
|
|
—
|
|
(41.7
|
)
|
|||||||||||||
|
Cash flows from financing activities:
|
|
|
|
|
|
|
|
||||||||||||||||||||
|
Proceeds from borrowings under revolving credit facility
|
—
|
|
289.0
|
|
—
|
|
—
|
|
—
|
|
—
|
|
289.0
|
|
|||||||||||||
|
Repayments of borrowings under revolving credit facility
|
—
|
|
(289.0
|
)
|
—
|
|
—
|
|
—
|
|
—
|
|
(289.0
|
)
|
|||||||||||||
|
Repayments of long-term debt
|
—
|
|
(201.0
|
)
|
—
|
|
—
|
|
—
|
|
—
|
|
(201.0
|
)
|
|||||||||||||
|
Proceeds from issuance of long-term debt
|
—
|
|
135.7
|
|
—
|
|
—
|
|
—
|
|
—
|
|
135.7
|
|
|||||||||||||
|
Payments to extinguish long-term debt
|
—
|
|
(243.2
|
)
|
—
|
|
—
|
|
—
|
|
—
|
|
(243.2
|
)
|
|||||||||||||
|
Payment of debt financing costs
|
—
|
|
(2.1
|
)
|
—
|
|
—
|
|
—
|
|
—
|
|
(2.1
|
)
|
|||||||||||||
|
Net change in accounts payable-inventory financing
|
—
|
|
—
|
|
(29.5
|
)
|
—
|
|
—
|
|
—
|
|
(29.5
|
)
|
|||||||||||||
|
Advances to/from affiliates
|
—
|
|
486.0
|
|
(486.5
|
)
|
0.5
|
|
—
|
|
—
|
|
—
|
|
|||||||||||||
|
Other financing activities
|
—
|
|
2.1
|
|
—
|
|
—
|
|
—
|
|
—
|
|
2.1
|
|
|||||||||||||
|
Net cash provided by (used in) financing activities
|
—
|
|
177.5
|
|
(516.0
|
)
|
0.5
|
|
—
|
|
—
|
|
(338.0
|
)
|
|||||||||||||
|
Effect of exchange rate changes on cash and cash equivalents
|
—
|
|
—
|
|
—
|
|
0.3
|
|
—
|
|
—
|
|
0.3
|
|
|||||||||||||
|
Net (decrease) increase in cash and cash equivalents
|
—
|
|
(54.1
|
)
|
(15.8
|
)
|
1.7
|
|
—
|
|
6.2
|
|
(62.0
|
)
|
|||||||||||||
|
Cash and cash equivalents – beginning of period
|
—
|
|
102.1
|
|
15.8
|
|
8.1
|
|
—
|
|
(26.1
|
)
|
99.9
|
|
|||||||||||||
|
Cash and cash equivalents – end of period
|
$
|
—
|
|
$
|
48.0
|
|
$
|
—
|
|
$
|
9.8
|
|
$
|
—
|
|
$
|
(19.9
|
)
|
$
|
37.9
|
|
||||||
103
|
19.
|
Selected Quarterly Financial Results (unaudited)
|
|
(in millions, except per-share amounts)
|
2014
|
||||||||||||||
|
|
First Quarter
|
Second Quarter
|
Third Quarter
|
Fourth Quarter
|
|||||||||||
|
Net Sales Detail:
|
|||||||||||||||
|
Corporate:
|
|||||||||||||||
|
Medium/Large
|
$
|
1,274.8
|
|
$
|
1,395.4
|
|
$
|
1,374.8
|
|
$
|
1,440.3
|
|
|||
|
Small Business
|
230.8
|
|
260.8
|
|
247.9
|
|
250.7
|
|
|||||||
|
Total Corporate
|
1,505.6
|
|
1,656.2
|
|
1,622.7
|
|
1,691.0
|
|
|||||||
|
Public:
|
|||||||||||||||
|
Government
|
254.2
|
|
313.1
|
|
441.3
|
|
440.8
|
|
|||||||
|
Education
|
321.6
|
|
527.0
|
|
632.8
|
|
342.6
|
|
|||||||
|
Healthcare
|
394.1
|
|
431.5
|
|
394.7
|
|
385.7
|
|
|||||||
|
Total Public
|
969.9
|
|
1,271.6
|
|
1,468.8
|
|
1,169.1
|
|
|||||||
|
Other
|
176.8
|
|
178.2
|
|
174.6
|
|
190.0
|
|
|||||||
|
Net sales
|
$
|
2,652.3
|
|
$
|
3,106.0
|
|
$
|
3,266.1
|
|
$
|
3,050.1
|
|
|||
|
Gross profit
|
$
|
425.2
|
|
$
|
496.9
|
|
$
|
507.3
|
|
$
|
491.9
|
|
|||
|
Income from operations
|
135.8
|
|
188.2
|
|
184.7
|
|
164.3
|
|
|||||||
|
Net income
|
50.9
|
|
86.6
|
|
55.6
|
|
51.8
|
|
|||||||
|
Net income per common share
(1)
:
|
|||||||||||||||
|
Basic
|
0.30
|
|
0.51
|
|
0.33
|
|
$
|
0.30
|
|
||||||
|
Diluted
|
0.30
|
|
0.50
|
|
0.32
|
|
$
|
0.30
|
|
||||||
|
(in millions, except per-share amounts)
|
2013
|
||||||||||||||
|
|
First Quarter
|
Second Quarter
|
Third Quarter
|
Fourth Quarter
|
|||||||||||
|
Net Sales Detail:
|
|||||||||||||||
|
Corporate:
|
|||||||||||||||
|
Medium/Large
(2)
|
$
|
1,180.5
|
|
$
|
1,308.5
|
|
$
|
1,241.3
|
|
$
|
1,322.3
|
|
|||
|
Small Business
(2)
|
223.4
|
|
228.9
|
|
224.5
|
|
230.7
|
|
|||||||
|
Total Corporate
|
1,403.9
|
|
1,537.4
|
|
1,465.8
|
|
1,553.0
|
|
|||||||
|
Public:
|
|||||||||||||||
|
Government
|
252.3
|
|
295.7
|
|
375.3
|
|
327.3
|
|
|||||||
|
Education
|
232.2
|
|
420.6
|
|
513.4
|
|
282.8
|
|
|||||||
|
Healthcare
|
362.3
|
|
366.3
|
|
355.9
|
|
380.4
|
|
|||||||
|
Total Public
|
846.8
|
|
1,082.6
|
|
1,244.6
|
|
990.5
|
|
|||||||
|
Other
|
161.0
|
|
159.3
|
|
153.9
|
|
169.8
|
|
|||||||
|
Net sales
|
$
|
2,411.7
|
|
$
|
2,779.3
|
|
$
|
2,864.3
|
|
$
|
2,713.3
|
|
|||
|
Gross profit
|
$
|
402.0
|
|
$
|
451.6
|
|
$
|
458.4
|
|
$
|
448.3
|
|
|||
|
Income from operations
(3)
|
120.1
|
|
153.6
|
|
92.9
|
|
142.0
|
|
|||||||
|
Net income (loss)
(3)
|
28.3
|
|
46.7
|
|
(2.2
|
)
|
60.0
|
|
|||||||
|
Net income (loss) per common share
(1)(3)
:
|
|||||||||||||||
|
Basic
|
0.19
|
|
0.32
|
|
(0.01
|
)
|
0.35
|
|
|||||||
|
Diluted
|
0.19
|
|
0.32
|
|
(0.01
|
)
|
0.35
|
|
|||||||
|
(1)
|
Basic and diluted net income (loss) per share are computed independently for each of the quarters presented. Therefore, the sum of quarterly basic and diluted per share information may not equal annual basic and diluted net income (loss) per share.
|
104
|
(2)
|
Net sales for the corporate channels (medium/large and small business) have been restated for all periods presented above to conform with the new corporate hierarchy presented for first quarter of 2014.
|
|
(3)
|
The third quarter of 2013 included pre-tax IPO-related charges of
$74.1 million
. See Note 9 for additional discussion of the IPO.
|
|
20.
|
Subsequent Events
|
During the first quarter of 2015, the Company entered into
six
interest rate cap agreements with a combined notional amount of
$400.0 million
. Under the agreements, the Company made premium payments totaling
$0.5 million
to the counterparties in exchange for the right to receive payments equal to the amount, if any, by which three-month LIBOR exceeds
2.0%
during the agreement period. The interest rate cap agreements are effective from January 14, 2015 through January 14, 2017.
On February 10, 2015, the Company announced that its board of directors declared a cash dividend on the Company's common stock of
$0.0675
per share. The dividend will be paid on March 10, 2015 to all stockholders of record as of the close of business on February 25, 2015. Future dividends will be subject to the approval of the Company's board of directors.
105
SCHEDULE II – VALUATION AND QUALIFYING ACCOUNTS
Years ended
December 31, 2014, 2013 and 2012
|
|
|
|
|
||||||||||||
|
(in millions)
|
Balance at
Beginning
of Period
|
Charged to
Costs and
Expenses
|
Deductions
|
Balance at
End of
Period
|
|||||||||||
|
Allowance for doubtful accounts:
|
|||||||||||||||
|
Year Ended December 31, 2014
|
$
|
5.4
|
|
$
|
5.4
|
|
$
|
(5.1
|
)
|
$
|
5.7
|
|
|||
|
Year Ended December 31, 2013
|
5.4
|
|
2.8
|
|
(2.8
|
)
|
5.4
|
|
|||||||
|
Year Ended December 31, 2012
|
5.4
|
|
3.9
|
|
(3.9
|
)
|
5.4
|
|
|||||||
|
Reserve for sales returns:
|
|||||||||||||||
|
Year Ended December 31, 2014
|
$
|
5.1
|
|
$
|
36.2
|
|
$
|
(36.2
|
)
|
$
|
5.1
|
|
|||
|
Year Ended December 31, 2013
|
4.4
|
|
35.0
|
|
(34.3
|
)
|
5.1
|
|
|||||||
|
Year Ended December 31, 2012
|
4.5
|
|
33.2
|
|
(33.3
|
)
|
4.4
|
|
|||||||
106
None.
Evaluation of Disclosure Controls and Procedures
The Company’s management, with the participation of the Company’s Chief Executive Officer and Chief Financial Officer, has evaluated the effectiveness of the Company’s disclosure controls and procedures (as such term is defined in Rule13a-15(e) or Rule 15d-15(e) under the Securities Exchange Act of 1934, as amended (the "Exchange Act")) as of the end of the period covered by this report. Based on such evaluation, the Company’s management, including the Company’s Chief Executive Officer and Chief Financial Officer, has concluded that, as of the end of such period, the Company’s disclosure controls and procedures were effective in recording, processing, summarizing, and reporting, on a timely basis, information required to be disclosed by the Company in the reports that it files or submits under the Exchange Act, and that information is accumulated and communicated to the Company’s management, including the Company’s Chief Executive Officer and Chief Financial Officer, as appropriate to allow timely discussions regarding required disclosure.
Management’s Annual Report on Internal Control over Financial Reporting
Management is responsible for establishing and maintaining adequate internal control over financial reporting, as defined in Rule 13a-15(f) and 15d-15(f) under the Exchange Act. Because of its inherent limitations, internal control over financial reporting may not prevent or detect misstatements and can provide only reasonable assurance with respect to financial statement preparation and presentation. Also, projections of any evaluation of effectiveness to future periods are subject to the risk that controls may become inadequate because of changes in conditions, or that the degree of compliance with policies or procedures may deteriorate.
Management assessed the effectiveness of the Company’s internal control over financial reporting as of December 31, 2014. Management based this assessment on the criteria set forth by the Committee of Sponsoring Organizations of the Treadway Commission (COSO) in “Internal Control — Integrated Framework (2013 framework).”
Based on its assessment, management concluded that, as of December 31, 2014, the Company’s internal control over financial reporting is effective.
Ernst & Young LLP, independent registered public accounting firm, has audited the consolidated financial statements of the Company and the Company's internal control over financial reporting and has included their reports herein.
Changes in Internal Control over Financial Reporting
There were no changes in the Company’s internal control over financial reporting during the fiscal quarter ended December 31, 2014 that have materially affected, or are reasonably likely to materially affect, the Company’s internal control over financial reporting.
107
Report of Independent Registered Public Accounting Firm
To the Board of Directors and Shareholders of
CDW Corporation
We have audited CDW Corporation and subsidiaries’ internal control over financial reporting as of December 31, 2014, based on criteria established in Internal Control-Integrated Framework issued by the Committee of Sponsoring Organizations of the Treadway Commission (2013 framework) (the COSO criteria). CDW Corporation and subsidiaries’ management is responsible for maintaining effective internal control over financial reporting, and for its assessment of the effectiveness of internal control over financial reporting included in the accompanying Management’s Annual Report on Internal Control over Financial Reporting. Our responsibility is to express an opinion on the company’s internal control over financial reporting based on our audit.
We conducted our audit in accordance with the standards of the Public Company Accounting Oversight Board (United States). Those standards require that we plan and perform the audit to obtain reasonable assurance about whether effective internal control over financial reporting was maintained in all material respects. Our audit included obtaining an understanding of internal control over financial reporting, assessing the risk that a material weakness exists, testing and evaluating the design and operating effectiveness of internal control based on the assessed risk, and performing such other procedures as we considered necessary in the circumstances. We believe that our audit provides a reasonable basis for our opinion.
A company’s internal control over financial reporting is a process designed to provide reasonable assurance regarding the reliability of financial reporting and the preparation of financial statements for external purposes in accordance with generally accepted accounting principles. A company’s internal control over financial reporting includes those policies and procedures that (1) pertain to the maintenance of records that, in reasonable detail, accurately and fairly reflect the transactions and dispositions of the assets of the company; (2) provide reasonable assurance that transactions are recorded as necessary to permit preparation of financial statements in accordance with generally accepted accounting principles, and that receipts and expenditures of the company are being made only in accordance with authorizations of management and directors of the company; and (3) provide reasonable assurance regarding prevention or timely detection of unauthorized acquisition, use, or disposition of the company’s assets that could have a material effect on the financial statements.
Because of its inherent limitations, internal control over financial reporting may not prevent or detect misstatements. Also, projections of any evaluation of effectiveness to future periods are subject to the risk that controls may become inadequate because of changes in conditions, or that the degree of compliance with the policies or procedures may deteriorate.
In our opinion, CDW Corporation and subsidiaries maintained, in all material respects, effective internal control over financial reporting as of December 31, 2014, based on the COSO criteria.
We also have audited, in accordance with the standards of the Public Company Accounting Oversight Board (United States), the consolidated balance sheets of CDW Corporation and subsidiaries as of December 31, 2014 and 2013, and the related consolidated statements of operations, comprehensive income, shareholders’ equity (deficit) and cash flows for each of the three years in the period ended December 31, 2014 of CDW Corporation and subsidiaries and our report dated February 26, 2015 expressed an unqualified opinion thereon.
|
/s/ Ernst & Young LLP
|
|
Chicago, Illinois
|
|
February 26, 2015
|
108
None.
109
We have adopted The CDW Way Code, our code of business conduct and ethics, that is applicable to all of our coworkers. Additionally, within The CDW Way Code is a Financial Integrity Code of Ethics that sets forth an even higher standard applicable to our executives, officers, members of our internal disclosure committee and all managers and above in our finance department. A copy of this code is available on our corporate website at
www.cdw.com
. If we make any substantive amendments to this code or grant any waiver from a provision to our chief executive officer, principal financial officer or principal accounting officer, we will disclose the nature of such amendment or waiver on our website or in a report on Form 8-K.
See Part I - “Executive Officers” for information about our executive officers, which is incorporated by reference in this Item 10. Other information required under this Item 10 is incorporated herein by reference to our definitive proxy statement for our 2015 annual meeting of stockholders on May 13, 2015 (“2015 proxy statement”), which we will file with the SEC on or before 120 days after our 2014 fiscal year-end.
Information required under this Item 11 is incorporated herein by reference to the 2015 proxy statement.
Information required under this Item 12 is incorporated herein by reference to the 2015 proxy statement.
Information required under this Item 13 is incorporated herein by reference to the 2015 proxy statement.
Information required under this Item 14 is incorporated herein by reference to the 2015 proxy statement.
110
|
(a)
|
Financial Statements and Schedules
|
The following documents are filed as part of this report:
|
(1)
|
Consolidated Financial Statements:
|
|
|
Page
|
|
(2)
|
Financial Statement Schedules:
|
All other schedules are omitted since the required information is not present or is not present in amounts sufficient to require submission of the schedule, or because the information required is included in the consolidated financial statements or notes thereto.
|
(b)
|
Exhibits
|
The information required by this Item is set forth on the exhibit index that follows the signature page of this report.
111
SIGNATURES
Pursuant to the requirements of Section 13 or 15(d) of the Securities Exchange Act of 1934, the registrant has duly caused this report to be signed on its behalf by the undersigned, thereunto duly authorized.
|
|
CDW CORPORATION
|
|||
|
Date:
|
February 26, 2015
|
|
By:
|
/s/ Thomas E. Richards
|
|
|
Thomas E. Richards
|
|||
|
|
Chairman, President and Chief Executive Officer
|
|||
Pursuant to the requirements of the Securities Exchange Act of 1934, this report has been signed below by the following persons on behalf of the registrant and in the capacities and on the dates indicated.
|
Signature
|
|
Title
|
|
Date
|
|
/s/ Thomas E. Richards
|
|
Chairman, President and Chief Executive Officer
(principal executive officer) and Director
|
|
February 26, 2015
|
|
Thomas E. Richards
|
|
|
||
|
/s/ Ann E. Ziegler
|
|
Senior Vice President and Chief Financial Officer
(principal financial officer)
|
February 26, 2015
|
|
|
Ann E. Ziegler
|
|
|
||
|
/s/ Virginia L. Seggerman
|
|
Vice President and Controller
(principal accounting officer)
|
|
February 26, 2015
|
|
Virginia L. Seggerman
|
|
|
||
|
/s/ Steven W. Alesio
|
|
Director
|
|
February 26, 2015
|
|
Steven W. Alesio
|
|
|
||
|
/s/ Barry K. Allen
|
|
Director
|
|
February 26, 2015
|
|
Barry K. Allen
|
|
|
||
|
/s/ Benjamin D. Chereskin
|
|
Director
|
|
February 26, 2015
|
|
Benjamin D. Chereskin
|
|
|
||
|
/s/ Glenn M. Creamer
|
|
Director
|
|
February 26, 2015
|
|
Glenn M. Creamer
|
|
|
||
|
/s/ Michael J. Dominguez
|
|
Director
|
|
February 26, 2015
|
|
Michael J. Dominguez
|
|
|
||
|
/s/ Paul J. Finnegan
|
|
Director
|
|
February 26, 2015
|
|
Paul J. Finnegan
|
|
|
||
|
/s/ David W. Nelms
|
|
Director
|
|
February 26, 2015
|
|
David W. Nelms
|
|
|
||
|
/s/ Robin P. Selati
|
|
Director
|
|
February 26, 2015
|
|
Robin P. Selati
|
|
|
||
|
/s/ Donna F. Zarcone
|
|
Director
|
|
February 26, 2015
|
|
Donna F. Zarcone
|
|
|
||
112
EXHIBIT INDEX
|
Exhibit
Number
|
|
Description
|
|
3.1
|
|
Fifth Amended and Restated Certificate of Incorporation of CDW Corporation, previously filed as Exhibit 3.1 with CDW Corporation’s Amendment No. 2 to Form S-1 filed on June 14, 2013 (Reg. No. 333-187472) and incorporated herein by reference.
|
|
3.2
|
|
Amended and Restated By-Laws of CDW Corporation, previously filed as Exhibit 3.2 with CDW Corporation’s Amendment No. 2 to Form S-1 filed on June 14, 2013 (Reg. No. 333-187472) and incorporated herein by reference.
|
|
3.3
|
|
Articles of Organization of CDW LLC, previously filed as Exhibit 3.3 with CDW Corporation's Form S-4 filed on September 7, 2010 (Reg. No. 333-169258) and incorporated herein by reference.
|
|
3.4
|
|
Amended and Restated Limited Liability Company Agreement of CDW LLC, previously filed as Exhibit 3.4 with CDW Corporation's Form S-4 filed on September 7, 2010 (Reg. No. 333-169258) and incorporated herein by reference.
|
|
3.5
|
|
Certificate of Incorporation of CDW Finance Corporation, previously filed as Exhibit 3.5 with CDW Corporation's Form S-4 filed on September 7, 2010 (Reg. No. 333-169258) and incorporated herein by reference.
|
|
3.6
|
|
By-Laws of CDW Finance Corporation, previously filed as Exhibit 3.6 with CDW Corporation's Form S-4 filed on September 7, 2010 (Reg. No. 333-169258) and incorporated herein by reference.
|
|
3.7
|
|
Amended and Restated Articles of Incorporation of CDW Technologies, Inc., previously filed as Exhibit 3.7 with CDW Corporation's Form S-4 filed on September 7, 2010 (Reg. No. 333-169258) and incorporated herein by reference.
|
|
3.8
|
|
Amended and Restated By-Laws of CDW Technologies, Inc., previously filed as Exhibit 3.8 with CDW Corporation's Form S-4 filed on September 7, 2010 (Reg. No. 333-169258) and incorporated herein by reference.
|
|
3.9
|
|
Articles of Organization of CDW Direct, LLC, previously filed as Exhibit 3.9 with CDW Corporation's Form S-4 filed on September 7, 2010 (Reg. No. 333-169258) and incorporated herein by reference.
|
|
3.10
|
|
Amended and Restated Limited Liability Company Agreement of CDW Direct, LLC, previously filed as Exhibit 3.10 with CDW Corporation's Form S-4 filed on September 7, 2010 (Reg. No. 333-169258) and incorporated herein by reference.
|
|
3.11
|
|
Articles of Organization of CDW Government LLC, previously filed as Exhibit 3.11 with CDW Corporation's Form S-4 filed on September 7, 2010 (Reg. No. 333-169258) and incorporated herein by reference.
|
|
3.12
|
|
Amended and Restated Limited Liability Company Agreement of CDW Government LLC, previously filed as Exhibit 3.12 with CDW Corporation's Form S-4 filed on September 7, 2010 (Reg. No. 333-169258) and incorporated herein by reference.
|
|
3.13
|
|
Articles of Incorporation of CDW Logistics, Inc., previously filed as Exhibit 3.14 with CDW Corporation's Form S-3 filed on July 31, 2014 (Reg. No. 333-197744) and incorporated herein by reference.
|
|
3.14
|
|
By-Laws of CDW Logistics, Inc., previously filed as Exhibit 3.14 with CDW Corporation's Form S-4 filed on September 7, 2010 (Reg. No. 333-169258) and incorporated herein by reference.
|
|
4.1
|
|
Specimen Common Stock Certificate, previously filed as Exhibit 4.1 with CDW Corporation’s Amendment No. 3 to Form S-1 filed on June 25, 2013 (Reg. No. 333-187472) and incorporated herein by reference.
|
|
4.2
|
|
Indenture, dated as of August 5, 2014, by and among CDW LLC, CDW Finance Corporation, the guarantors party thereto and U.S. Bank National Association, as trustee, previously filed as Exhibit 4.1 with CDW Corporation's Form 8-K filed on August 6, 2014 and incorporated herein by reference.
|
113
|
Exhibit
Number
|
|
Description
|
|
4.3
|
|
Form of 6% Senior Note (included as Exhibit A to Exhibit 4.1), previously filed as Exhibit 4.2 with CDW Corporation's Form 8-K filed on August 6, 2014 and incorporated herein by reference.
|
|
4.4
|
Senior Note Indenture, dated as of April 13, 2011, between CDW Escrow Corporation and U.S. Bank National Association as trustee, previously filed as Exhibit 4.1 with CDW Corporation's Form 8-K filed on April 14, 2011 and incorporated herein by reference.
|
|
|
4.5
|
|
Senior Note Supplemental Indenture, dated as of April 13, 2011, by and among CDW LLC, CDW Finance Corporation, the guarantors party thereto and U.S. Bank National Association as trustee, previously filed as Exhibit 4.2 with CDW Corporation's Form 8-K filed on April 14, 2011 and incorporated herein by reference.
\
|
|
4.6
|
|
Second Senior Note Supplemental Indenture, dated as of May 20, 2011, by and among CDW LLC, CDW Finance Corporation, CDW Escrow Corporation, the guarantors party thereto and U.S. Bank National Association as Trustee, previously filed as Exhibit 4.1 with CDW Corporation's Form 8-K filed on May 23, 2011 and incorporated herein by reference.
|
|
4.7
|
|
Third Senior Note Supplemental Indenture, dated as of February 17, 2012, by and among CDW LLC, CDW Finance Corporation, the guarantors party thereto and U.S. Bank National Association as Trustee, previously filed as Exhibit 4.5 with CDW Corporation's Form 8-K filed on February 17, 2012 and incorporated herein by reference.
|
|
4.8
|
|
Fourth Senior Note Supplemental Indenture, dated as of May 10, 2012, by and among CDW LLC, CDW Finance Corporation, the guarantors party thereto and U.S. Bank National Association as trustee, previously filed as Exhibit 4.3 with CDW Corporation's Form 8-K filed on May 11, 2012 and incorporated herein by reference.
|
|
4.9
|
|
Form of Senior Note (included as Exhibit A to Exhibit 4.5), previously filed as Exhibit 4.3 with CDW Corporation's Form 8-K filed on April 14, 2011 and incorporated herein by reference.
|
|
4.10
|
|
Base Indenture, dated as of December 1, 2014, by and among CDW LLC, CDW Finance Corporation, CDW Corporation, the guarantors party thereto and U.S. Bank National Association as trustee, previously filed as Exhibit 4.1 with CDW Corporation's Form 8-K filed on December 1, 2014 and incorporated herein by reference.
|
|
4.11
|
|
Supplemental Indenture, dated as of December 1, 2014, by and among CDW LLC, CDW Finance Corporation, CDW Corporation the guarantors party thereto and U.S. Bank National Association as trustee, previously filed as Exhibit 4.2 with CDW Corporation's Form 8-K filed on December 1, 2014 and incorporated herein by reference.
|
|
4.12
|
Form of 5.5% Senior Note (included as Exhibit B to Exhibit 4.12), previously filed as Exhibit 4.3 with CDW Corporation's Form 8-K filed on December 1, 2014 and incorporated herein by reference.
|
|
|
10.1
|
|
Amended and Restated Revolving Loan Credit Agreement, dated as of June 6, 2014, by and among CDW LLC, the lenders from time to time party thereto, JPMorgan Chase Bank, N.A., as administrative agent, GE Commercial Distribution Finance Corporation, as floorplan funding agent, and the joint lead arrangers, joint bookrunners, co-collateral agents, co-syndication agents and co-documentation agents party thereto, previously filed as Exhibit 10.1 with CDW Corporation's Form 8-K filed on June 9, 2014 (Reg. No. 333-197744) and incorporated herein by reference.
|
|
10.2
|
Term Loan Agreement, dated as of April 29, 2013, by and among CDW LLC, the lenders from time to time party thereto, Barclays Bank PLC, as administrative agent and collateral agent, and the joint lead arrangers, joint bookrunners, co-syndication agents and co-documentation agents party thereto, previously filed as Exhibit 10.1 with CDW Corporation’s Form 8-K filed on May 1, 2013 and incorporated herein by reference.
|
|
|
10.3
|
First Amendment to Term Loan Agreement, dated as of May 30, 2013, by and among CDW LLC, the lenders from time to time party thereto, and Barclays Bank PLC, as administrative agent and collateral agent, previously filed as Exhibit 10.3 with CDW Corporation’s Amendment No. 2 to Form S-1 filed on June 14, 2013 (Reg. No. 333-187472) and incorporated herein by reference.
|
|
|
10.4
|
Incremental Amendment, dated as of July 31, 2013, by and among CDW LLC, the lenders party thereto and Barclays Bank PLC, as administrative agent, previously filed as Exhibit 10.1 with CDW Corporation’s Form 8-K filed on August 1, 2013 and incorporated herein by reference.
|
|
114
|
Exhibit
Number
|
|
Description
|
|
10.5
|
Third Amendment to the Term Loan Agreement, dated as of September 12, 2013, by and among CDW LLC, the lenders from time to time party thereto and Barclays Bank PLC, as administrative agent and collateral agent, previously filed as Exhibit 10.2 with CDW Corporation's Form 10-Q filed on November 7, 2013 and incorporated herein by reference.
|
|
|
|
||
|
10.6
|
Second Amended and Restated Guarantee and Collateral Agreement, dated April 29, 2013, by and among CDW LLC, the guarantors party thereto and Barclays Bank PLC, as collateral agent, previously filed as Exhibit 10.2 with CDW Corporation’s Form 8-K filed on May 1, 2013 and incorporated herein by reference.
|
|
|
10.7
|
|
Management Services Agreement, dated as of October 12, 2007, by and between CDW Corporation, Madison Dearborn Partners V-B, L.P. and Providence Equity Partners L.L.C., previously filed as Exhibit 10.9 with CDW Corporation’s Form S-4 filed on September 7, 2010 (Reg. No. 333-169258) and incorporated herein by reference.
|
|
10.8
|
|
Termination Agreement, dated as of June 12, 2013, by and among CDW Corporation, Madison Dearborn Partners V-B, L.P. and Providence Equity Partners L.L.C., previously filed as Exhibit 10.6 with CDW Corporation’s Amendment No. 2 to Form S-1 filed on June 14, 2013 (Reg. No. 333-187472) and incorporated herein by reference.
|
|
10.9
|
|
Registration Agreement, dated as of October 12, 2007, by and among VH Holdings, Inc., CDW Holdings LLC, Madison Dearborn Capital Partners V-A, L.P., Madison Dearborn Capital Partners V-C, L.P., Madison Dearborn Partners V Executive-A, L.P., Providence Equity Partners VI L.P., Providence Equity Partners VI-A L.P., and the other securityholders party thereto, previously filed as Exhibit 10.10 with CDW Corporation's Form S-4 filed on September 7, 2010 (Reg. No. 333-169258) and incorporated herein by reference.
|
|
10.10
|
|
Withdrawal from Registration Agreement, dated as of November 12, 2013, by and between CDW Corporation and Paul S. Shain, previously filed as Exhibit 10.10 with CDW Corporation’s Form 10-K filed on March 5, 2014 and incorporated herein by reference.
|
|
10.11
|
|
Withdrawal from Registration Agreement, dated as of November 20, 2013, by and among CDW Corporation, James R. Shanks and BOS Holdings, LLC, previously filed as Exhibit 10.11 with CDW Corporation’s Form 10-K filed on March 5, 2014 and incorporated herein by reference.
|
|
10.12
|
|
Withdrawal from Registration Agreement, dated as of August 27, 2014, by and between CDW Corporation, John A. Edwardson and Whispering Pines Capital LLC , previously filed as Exhibit 10.1 with CDW Corporation’s Form 10-Q filed on November 12, 2014 and incorporated herein by reference.
|
|
10.13§
|
Amended and Restated Compensation Protection Agreement, dated as of March 24, 2014, by and among CDW Corporation, CDW LLC and Thomas E. Richards, previously filed as Exhibit 10.1 with CDW Corporation's Form 8-K filed on March 28, 2014 and incorporated herein by reference.
|
|
|
10.14§
|
|
Form of Compensation Protection Agreement (executive officers other than Thomas E. Richards), previously filed as Exhibit 10.2 with CDW Corporation's Form 8-K filed on March 28, 2014 and incorporated herein by reference.
|
|
10.15§
|
|
Form of Noncompetition Agreement under the Compensation Protection Agreement, previously filed as Exhibit 10.3 with CDW Corporation's Form 8-K filed on March 28, 2014 and incorporated herein by reference.
|
|
10.16§
|
|
Letter Agreement, dated as of September 13, 2011, by and between CDW Direct, LLC and Christina M. Corley, previously filed as Exhibit 10.31 with CDW Corporation's Form 10-K filed on March 9, 2012 and incorporated herein by reference.
|
|
10.17§
|
|
Form of Indemnification Agreement by and between CDW Corporation and its directors and officers, previously filed as Exhibit 10.32 with CDW Corporation’s Amendment No. 2 to Form S-1 filed on June 14, 2013 (Reg. No. 333-187472) and incorporated herein by reference.
|
|
10.18
|
|
Stockholders Agreement, dated as of June 10, 2013, by and among CDW Corporation, Madison Dearborn Capital Partners V-A, L.P., Madison Dearborn Capital Partners V-C, L.P., Madison Dearborn Capital Partners V Executive-A, L.P., Providence Equity Partners VI L.P., Providence Equity Partners VI-A L.P. and the other securityholders party thereto, previously filed as Exhibit 10.33 with CDW Corporation’s Amendment No. 2 to Form S-1 filed on June 14, 2013 (Reg. No. 333-187472) and incorporated herein by reference.
|
115
|
Exhibit
Number
|
|
Description
|
|
10.19§
|
|
CDW Corporation 2013 Senior Management Incentive Plan, previously filed as Exhibit 10.34 with CDW Corporation’s Amendment No. 2 to Form S-1 filed on June 14, 2013 (Reg. No. 333-187472) and incorporated herein by reference.
|
|
10.20§
|
|
CDW Corporation 2013 Long-Term Incentive Plan, previously filed as Exhibit 10.35 with CDW Corporation’s Amendment No. 2 to Form S-1 filed on June 14, 2013 (Reg. No. 333-187472) and incorporated herein by reference.
|
|
10.21§
|
|
CDW Corporation Coworker Stock Purchase Plan, previously filed as Exhibit 10.36 with CDW Corporation’s Amendment No. 2 to Form S-1 filed on June 14, 2013 (Reg. No. 333-187472) and incorporated herein by reference.
|
|
10.22§
|
|
Form of CDW Corporation Option Award Notice and Stock Option Agreement (executed by Thomas E. Richards), previously filed as Exhibit 10.37 with CDW Corporation’s Amendment No. 2 to Form S-1 filed on June 14, 2013 (Reg. No. 333-187472) and incorporated herein by reference.
|
|
10.23§
|
|
Form of CDW Corporation Option Award Notice and Stock Option Agreement (executed by Neal J. Campbell and Christina M. Corley), previously filed as Exhibit 10.38 with CDW Corporation’s Amendment No. 2 to Form S-1 filed on June 14, 2013 (Reg. No. 333-187472) and incorporated herein by reference.
|
|
10.24§
|
|
Form of CDW Corporation Restricted Stock Award Notice and Restricted Stock Award Agreement (executed by Thomas E. Richards, Dennis G. Berger, Douglas E. Eckrote, Christine A. Leahy, Jonathan J. Stevens and Ann E. Ziegler), previously filed as Exhibit 10.12 with CDW Corporation’s Form 10-Q filed on August 12, 2013 and incorporated herein by reference.
|
|
10.25§
|
|
Form of CDW Corporation Restricted Stock Award Notice and Restricted Stock Award Agreement (executed by Neal J. Campbell, Christina M. Corley, Christina V. Rother and Matthew A. Troka), previously filed as Exhibit 10.13 with CDW Corporation’s Form 10-Q filed on August 12, 2013 and incorporated herein by reference.
|
|
10.26§
|
CDW Amended and Restated Restricted Debt Unit Plan, previously filed as Exhibit 10.3 with CDW Corporation’s Form 10-Q filed on November 7, 2013 and incorporated herein by reference.
|
|
|
10.27§
|
Form of CDW Restricted Debt Unit Grant Notice and Agreement (executed by Thomas E. Richards, Dennis G. Berger, Douglas E. Eckrote, Christine A. Leahy, Jonathan J. Stevens and Ann E. Ziegler), previously filed as Exhibit 10.23 with CDW Corporation's Form S-4 filed on September 7, 2010 (Reg. No. 333-169258) and incorporated herein by reference.
|
|
|
10.28§
|
Form of CDW Restricted Debt Unit Grant Notice and Agreement (executed by Neal J. Campbell, Christina M. Corley, Christina V. Rother and Matthew A. Troka and to be used for certain future grantees), previously filed as Exhibit 10.24 with CDW Corporation's Form S-4 filed on September 7, 2010 (Reg. No. 333-169258) and incorporated herein by reference.
|
|
|
10.29§
|
Form of Stock Option Agreement (executive officers) under the CDW Corporation 2013 Long-Term Incentive Plan, previously filed as Exhibit 10.4 with CDW Corporation’s Form 10-Q filed on May 12, 2014 and incorporated herein by reference.
|
|
|
10.30§
|
Form of Performance Share Unit Award Agreement (executive officers) under the CDW Corporation 2013 Long-Term Incentive Plan, previously filed as Exhibit 10.5 with CDW Corporation’s Form 10-Q filed on May 12, 2014 and incorporated herein by reference.
|
|
|
10.31§*
|
Form of Performance Share Award Agreement (executive officers) under the CDW Corporation 2013 Long-Term Incentive Plan.
|
|
|
10.32§
|
Form of Non-Employee Director Restricted Stock Unit Award Agreement under the CDW Corporation 2013 Long-Term Incentive Plan, previously filed as Exhibit 10.6 with CDW Corporation’s Form 10-Q filed on May 12, 2014 and incorporated herein by reference.
|
|
|
12.1*
|
|
Computation of ratio of earnings to fixed charges.
|
|
21.1
|
|
List of subsidiaries, previously filed as Exhibit 21.1 with CDW Corporation's Form S-4 filed on April 13, 2012 (Reg. No. 333-180715) and incorporated herein by reference.
|
116
|
Exhibit
Number
|
|
Description
|
|
23.1*
|
Consent of Ernst & Young LLP.
|
|
|
31.1*
|
|
Certification of Chief Executive Officer pursuant to Rule 13a-14(a) or Rule 15d-14(a) under the Securities Exchange Act of 1934.
|
|
31.2*
|
|
Certification of Chief Financial Officer pursuant to Rule 13a-14(a) or Rule 15d-14(a) under the Securities Exchange Act of 1934.
|
|
32.1**
|
|
Certification of Chief Executive Officer pursuant to 18 U.S.C. 1350.
|
|
32.2**
|
|
Certification of Chief Financial Officer pursuant to 18 U.S.C. 1350.
|
|
101.INS*
|
XBRL Instance Document
|
|
|
101.SCH*
|
XBRL Taxonomy Extension Schema Document
|
|
|
101.CAL*
|
XBRL Taxonomy Extension Calculation Linkbase Document
|
|
|
101.DEF*
|
XBRL Taxonomy Extension Definition Linkbase Document
|
|
|
101.LAB*
|
XBRL Taxonomy Extension Label Linkbase Document
|
|
|
101.PRE*
|
XBRL Taxonomy Extension Presentation Linkbase Document
|
|
________________
|
*
|
Filed herewith
|
|
**
|
These items are furnished and not filed.
|
|
§
|
A management contract or compensatory arrangement required to be filed as an exhibit pursuant to Item 601 of Regulation S-K.
|
117
TABLE OF CONTENTS
Part IItem 1. BusinessItem 1A. Risk FactorsItem 1B. Unresolved Staff CommentsItem 2. PropertiesItem 3. Legal ProceedingsItem 4. Mine Safety DisclosuresPart IIItem 5. Market For Registrant S Common Equity, Related Stockholder Matters and Issuer Purchases Of Equity SecuritiesItem 6. Selected Financial DataItem 7. Management S Discussion and Analysis Of Financial Condition and Results Of OperationsItem 7A. Quantitative and Qualitative Disclosures Of Market RisksItem 8. Financial Statements and Supplementary DataItem 9. Changes in and Disagreements with Accountants on Accounting and Financial DisclosureItem 9A. Controls and ProceduresItem 9B. Other InformationPart IIIItem 10. Directors, Managers, Executive Officers and Corporate GovernanceItem 11. Executive CompensationItem 12. Security Ownership Of Certain Beneficial Owners and Management and Related Stockholder MattersItem 13. Certain Relationships and Related Transactions, and Director IndependenceItem 14. Principal Accountant Fees and ServicesPart IVItem 15. Exhibits and Financial Statement Schedules