CENTURY ALUMINUM CO
10-Ks and 10-Qs
|
|
|
|
|
|
|
|
|
|
|
|
|
|
|
|
|
|
|
|
|
|
|
|
|
|
|
|
|
|
|
|
|
|
|
|
|
|
|
|
|
|
|
|
|
|
|
|
|
|
|
|
|
|
|
|
|
|
|
UNITED STATES
SECURITIES AND EXCHANGE COMMISSION
Washington, D.C. 20549
FORM 10-K
ý
ANNUAL REPORT PURSUANT TO SECTION 13 OR 15(d) OF THE
SECURITIES EXCHANGE ACT OF 1934
FOR THE FISCAL YEAR ENDED
DECEMBER 31, 2018
OR
o
TRANSITION REPORT PURSUANT TO SECTION 13 OR 15(d) OF THE
SECURITIES EXCHANGE ACT OF 1934
Commission File Number 001-34474
CENTURY ALUMINUM COMPANY
(Exact name of registrant as specified in its charter)
|
Delaware
(State or other jurisdiction of incorporation or organization)
|
13-3070826
(IRS Employer Identification No.)
|
|
One South Wacker Drive
Suite 1000
Chicago, Illinois
(Address of registrant’s principal offices)
|
60606
(Zip Code)
|
Registrant’s telephone number, including area code: (312) 696-3101
Securities registered pursuant to Section 12(b) of the Act:
|
Title of each class:
|
Name of each exchange on which registered:
|
|
Common Stock, $0.01 par value per share
|
NASDAQ Stock Market LLC
|
|
(NASDAQ Global Select Market)
|
|
Securities registered pursuant to Section 12(g) of the Act: None
Indicate by check mark if the registrant is a well-known seasoned issuer, as defined in Rule 405 of the Securities Act. Yes
¨
No
ý
Indicate by check mark if the registrant is not required to file reports pursuant to Section 13 or Section 15(d) of the Act. Yes
¨
No
ý
Indicate by check mark whether the registrant (1) has filed all reports required to be filed by Section 13 or 15(d) of the Securities Exchange Act of 1934 during the preceding 12 months (or for such shorter period that the registrant was required to file such reports), and (2) has been subject to such filing requirements for the past 90 days. Yes
ý
No
¨
Indicate by check mark whether the registrant has submitted electronically and posted on its corporate website, if any, every Interactive Data File required to be submitted and posted pursuant to Rule 405 of Regulation S-T (§ 232.405 of this chapter) during the preceding 12 months (or for such shorter period that the registrant was required to submit and post such files). Yes
ý
No
¨
Indicate by check mark if disclosure of delinquent filers pursuant to Item 405 of Regulation S-K is not contained herein, and will not be contained, to the best of the registrant’s knowledge, in a definitive proxy or information statement incorporated by reference in Part III of this Form 10-K or any amendment to this Form 10-K.
ý
Indicate by check mark whether the registrant is a large accelerated filer, an accelerated filer, a non-accelerated filer, or a smaller reporting company. See the definitions of "large accelerated filer," "accelerated filer", "smaller reporting company" and "emerging growth company" in Rule 12b-2 of the Exchange Act. (Check one)
|
Large Accelerated Filer
|
x
|
Accelerated Filer
|
o
|
Non-Accelerated Filer
|
¨
|
Smaller Reporting Company
|
¨
|
Emerging Growth Company
|
¨
|
Indicate by check mark whether the registrant is a shell company (as defined in Rule 12b-2 of the Act). Yes
¨
No
ý
Based upon the closing price of the registrant’s common stock on the NASDAQ Global Select Market on
June 30, 2018
, the approximate aggregate market value of the common stock held by non-affiliates of the registrant was approximately
$782,000,000
. As of February 14, 2019,
88,103,440
shares of common stock of the registrant were issued and outstanding.
Documents Incorporated by Reference:
All or a portion of Items 10 through 14 in Part III of this Form 10-K are incorporated by reference to the Registrant’s definitive proxy statement on Schedule 14A for its
2019
Annual Meeting of Stockholders, which will be filed within 120 days after the close of the fiscal year covered by this report on Form 10-K, or if the Registrant’s Schedule 14A is not filed within such period, will be included in an amendment to this Report on Form 10-K which will be filed within such 120 day period.
|
TABLE OF CONTENTS
|
PAGE
|
|
|
|
PART I
|
|
|
|
PART II
|
|
|
|
PART III
|
|
|
|
PART IV
|
|
|
|
||
Forward-Looking Statements
This Annual Report on Form 10-K includes "forward-looking statements" within the meaning of the Private Securities Litigation Reform Act of 1995, which are subject to the "safe harbor" created by section 27A of the Securities Act of 1933, as amended (the "Securities Act"), and section 21E of the Securities Exchange Act of 1934, as amended (the "Exchange Act"). Forward-looking statements are statements about future events and are based on our current expectations. These forward-looking statements may be identified by the words "believe," "expect," "target," "anticipate," "intend," "plan," "seek," "estimate," "potential," "project," "scheduled," "forecast" or words of similar meaning, or future or conditional verbs such as "will," "would," "should," "could," "might," or "may."
Forward-looking statements in this Annual Report and in our other reports with the Securities and Exchange Commission (the "SEC"), for example, may include statements regarding:
|
•
|
Future global and local financial and economic conditions;
|
|
•
|
Our assessment of the aluminum market and aluminum prices (including premiums);
|
|
•
|
The future impact of any Section 232 relief, including tariffs or other trade remedies, to Century, on aluminum prices or more generally, the extent to which any such remedies may be changed, including through exclusions or exemptions, and the duration of any trade remedy;
|
|
•
|
Our ability to procure alumina, carbon products and other raw materials and our assessment of pricing and costs and other terms relating thereto;
|
|
•
|
Our assessment of power pricing and our ability to successfully obtain and/or implement long-term competitive power arrangements for our operations and projects, including at Mt. Holly;
|
|
•
|
Our ability to successfully manage transmission issues and market power price risk and to control or reduce power costs;
|
|
•
|
Our plans and expectations with respect to the future operation of our smelters and our other operations, including any plans and expectations to curtail or restart production at any of our operations;
|
|
•
|
Our intention and ability to bring our Hawesville smelter back to full production and any plans, expectations, costs or assumptions with respect thereto;
|
|
•
|
Any future impact of the May 2018 equipment failure at Sebree and related events on our financial and operating performance, including our expectations with respect to insurance coverage relating thereto;
|
|
•
|
Future investments in new technology or other production improvements;
|
|
•
|
Our ability to hire and retain qualified employees for our operations;
|
|
•
|
Our plans and expectations with respect to the sale or other disposition of our 40% interest in BHH;
|
|
•
|
The future financial and operating performance of the Company, its subsidiaries and its projects;
|
|
•
|
Future inventory, production, sales, cash costs and capital expenditures;
|
|
•
|
Future impairment charges or restructuring costs;
|
|
•
|
Our ability to access our existing or future financing arrangements and the terms of any such future financing arrangements;
|
|
•
|
Our ability to refinance or repay debt in the future;
|
|
•
|
Estimates of our pension and other postretirement liabilities and future payments, property plant and equipment impairment, environmental liabilities and other contingent liabilities and contractual commitments;
|
|
•
|
Future construction investment and development, including our expansion project at our Grundartangi smelter and our plans and expectations with respect thereto;
|
|
•
|
The anticipated impact of recent accounting pronouncements or changes in accounting principles;
|
|
•
|
Our anticipated tax liabilities, benefits or refunds including the realization of U.S. and certain foreign deferred tax assets and liabilities and the impact of tax reforms in the U.S. and foreign jurisdictions;
|
|
•
|
Our assessment of the ultimate outcome of outstanding litigation and environmental matters and liabilities relating thereto;
|
|
•
|
The impact of any new or changed law, regulations or other action affecting our business, including, without limitation, the impact of any trade actions, sanctions or other similar remedies or restrictions implemented by the U.S. or foreign governments;
|
|
•
|
Negotiations with labor unions representing certain of our employees; and
|
i
|
•
|
Our future business objectives, plans, strategies and initiatives including our competitive position and prospects.
|
Where we express an expectation or belief as to future events or results, such expectation or belief is expressed in good faith and believed to have a reasonable basis. However, our forward-looking statements are based on current expectations and assumptions that are subject to risks and uncertainties which may cause actual results to differ materially from future results expressed, projected or implied by those forward-looking statements. Important factors that could cause actual results and events to differ from those described in such forward-looking statements can be found in the risk factors and forward-looking statements cautionary language contained in
Item 1A. Risk Factors
in this Annual Report on Form 10-K, our Quarterly Reports on Form 10-Q and in other filings made with the SEC. Although we have attempted to identify those material factors that could cause actual results or events to differ from those described in such forward-looking statements, there may be other factors that could cause actual results or events to differ from those anticipated, estimated or intended. Many of these factors are beyond our ability to control or predict. Given these uncertainties, the reader is cautioned not to place undue reliance on our forward-looking statements. We undertake no obligation to update or revise publicly any forward-looking statements, whether as a result of new information, future events, or otherwise.
ii
PART I
Throughout this Annual Report on Form 10-K, and unless expressly stated otherwise or as the context otherwise requires, "Century Aluminum Company," "Century Aluminum," "Century," the "Company," "we," "us," and "our" refer to Century Aluminum Company and its subsidiaries.
Item 1. Business
Overview
Century Aluminum Company is a global producer of primary aluminum and operates aluminum reduction facilities, or "smelters," in the United States and Iceland. Aluminum is an internationally traded commodity, and its price is effectively determined on the London Metal Exchange (the "LME"), plus applicable regional and product premiums. Our primary aluminum facilities produce standard-grade and value-added primary aluminum products. Our current annual production capacity is approximately
1,016,000
tonnes per year ("tpy"). We produced approximately
753,000
tonnes of primary aluminum in
2018
.
In addition to our primary aluminum assets, we own a carbon anode production facility located in the Netherlands ("Vlissingen") and hold a 40% interest in Baise Haohai Carbon Co., Ltd. ("BHH"), a joint venture that owns and operates a carbon anode and cathode facility located in China. Carbon anodes are consumed in the production of primary aluminum. Both BHH and Vlissingen currently supply carbon anodes to our smelter in Grundartangi, Iceland. Each of our smelters in the United States sources anodes from on-site carbon anode production facilities.
We operate our business through one reportable segment, primary aluminum. Additional information about our segment reporting and certain geographic information is available in
Note 18. Business Segments
to the consolidated financial statements included herein.
Century Aluminum Company is a Delaware corporation with our principal executive offices located at One South Wacker Drive, Suite 1000, Chicago, Illinois 60606.
Strategic Objective
Our strategic objective is to maximize the financial returns we generate for our stockholders by: (a) optimizing our safety and environmental performance; (b) improving the competitiveness of our existing assets by managing costs and improving productivity and efficiency; (c) pursuing upstream investment opportunities in bauxite mining, alumina refining and the production of other key operating supplies; and (d) expanding our primary aluminum business by improving and investing in the facilities we currently own as well as constructing, investing in or acquiring additional capacity.
Primary Aluminum Facilities
Overview of Facilities
We operate three U.S. aluminum smelters, in Hawesville, Kentucky ("Hawesville"), Robards, Kentucky ("Sebree") and Goose Creek, South Carolina ("Mt. Holly"), and one aluminum smelter in Grundartangi, Iceland ("Grundartangi").
Grundartangi
The Grundartangi facility, located in Grundartangi, Iceland, is a primary aluminum reduction facility owned and operated by our wholly-owned subsidiary, Nordural Grundartangi ehf, and is our most modern facility. Grundartangi is currently in the process of a multi-year expansion project that has brought the annual production capacity from 280,000 tonnes to current capacity of 317,000 tonnes (
2018
volume) and is expected to ultimately increase annual production capacity to approximately 325,000 tonnes. Grundartangi produces standard-grade aluminum ingot and a primary foundry alloy product, which is a value-added product that is sold at a premium to standard-grade aluminum.
Hawesville
Hawesville, located adjacent to the Ohio River near Hawesville, Kentucky, is a primary aluminum reduction facility owned and operated by our wholly-owned subsidiary, Century Kentucky, Inc. ("CAKY"). Hawesville has an annual production capacity of approximately
250,000
tonnes. Approximately 60% of Hawesville's capacity was curtailed in the fourth quarter of
1
2015 as a result of significant declines in the LME price for aluminum. In 2018, we began the process of restarting capacity on the three potlines at Hawesville that had been curtailed. The first of these three lines was restarted in September 2018 and the second was restarted in December 2018. We expect that the third line will be restarted and back in operation during the first quarter of 2019. Each line represents incremental production of approximately 50,000 tonnes per year when fully operational.
Hawesville produces standard-grade and high-purity aluminum that can be cast into sow or delivered directly to nearby customers as molten metal.
Hawesville is our largest U.S. smelter and has the capacity to be the largest producer of high purity primary aluminum in North America. Four of Hawesville's five potlines are capable of producing high purity aluminum which is sold at a premium to standard-grade aluminum and is used extensively by the defense industry as well as for aerospace and other applications.
Sebree
Sebree, located adjacent to the Green River near Robards, Kentucky, is a primary aluminum reduction facility owned and operated by our wholly-owned subsidiary, Century Aluminum Sebree LLC ("Century Sebree"). Sebree has an annual production capacity of approximately
220,000
tonnes. Sebree produces standard-grade aluminum that can be cast into sow and value-added products, including billet, that are sold at a premium to standard-grade aluminum or delivered directly to nearby customers as molten metal. In May 2018, we temporarily curtailed one potline at Sebree due to an equipment failure. We returned the curtailed potline at Sebree back to service during the third quarter of 2018.
Mt. Holly
Mt. Holly, located in Goose Creek, South Carolina, is a primary aluminum reduction facility owned and operated by our wholly-owned subsidiary, Century Aluminum of South Carolina, Inc. ("CASC"). Mt. Holly has an annual production capacity of approximately
229,000
tonnes. The Mt. Holly facility is currently operating at approximately 50% of capacity while CASC pursues a long-term power solution. See "Key Production Costs — Electrical Power Supply Agreements" below for further discussion of our power arrangements at Mt. Holly.
Mt. Holly produces standard-grade aluminum that is cast into tee bars as well as several value-added products, including billet and foundry products. These value-added primary aluminum products are sold at a premium to standard-grade aluminum.
Primary Aluminum Production Capacity
Our primary aluminum smelters and their respective capacities are shown in the following table:
|
Facility
|
Ownership Percentage
|
Operational
|
Annual Production Capacity (tpy)
(1)
|
Actual 2018 Annual Production (tpy)
|
|||||
|
Grundartangi, Iceland
|
100%
|
1998
|
317,000
|
317,000
|
|||||
|
Hawesville, Kentucky USA
|
100%
|
1970
|
250,000
|
117,000
|
|||||
|
Sebree, Kentucky, USA
|
100%
|
1973
|
220,000
|
204,000
|
|||||
|
Mt. Holly, South Carolina USA
|
100%
|
1980
|
229,000
|
115,000
|
|||||
|
1,016,000
|
753,000
|
||||||||
|
(1)
|
The tonnes per year (tpy) figures in this column reflect an estimate of the facility's total production capacity based on plant design, historical operating results and operating efficiencies and does not necessarily represent each facility’s maximum production capability.
|
2
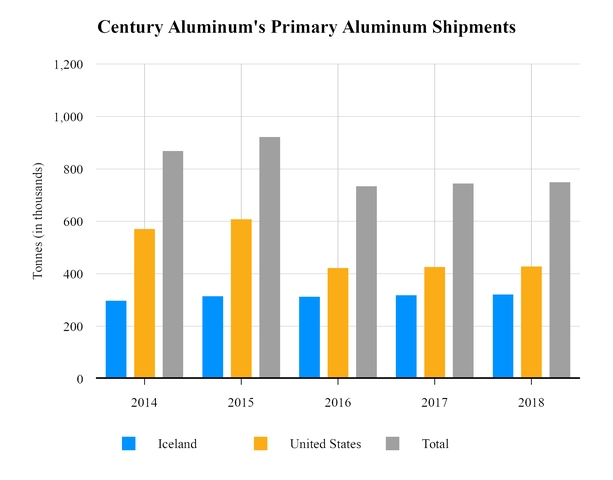
Primary Aluminum Shipment Volume
The following table shows our primary aluminum shipment volumes since 2014
(1)
.
|
(1)
|
Shipment volumes reflect (i) our acquisition of the remaining interest in Mt. Holly in December 2014; (ii) the partial curtailment of our Hawesville and Mt. Holly operations during the fourth quarter of 2015; and (iii) increases from the Hawesville restart in 2018, offset by lower production due to the temporary potline outage at Sebree.
|
Primary Aluminum Projects
Helguvik project
The Helguvik project is a greenfield project for an aluminum reduction facility in Helguvik, Iceland ("Helguvik" or the "Helguvik project"), owned by our wholly-owned subsidiary Nordural Helguvik ehf ("Nordural Helguvik"). The Helguvik project site is located approximately 30 miles from the city of Reykjavik, Iceland. Construction activity and spending on the project have remained curtailed since 2008 pending our ability to secure power delivery for the project at competitive prices. See "Key Production Costs — Electrical Power Supply Agreements" below for further discussion of our power arrangements at Helguvik.
Carbon Products Facilities
In addition to our primary aluminum assets, we also own a carbon anode production facility located in Vlissingen, the Netherlands, and a 40% interest in BHH, a joint venture that owns and operates a carbon anode and cathode facility located in the Guangxi Zhuang Autonomous Region of south China.
Vlissingen
3
Vlissingen is a carbon anode production facility owned and operated by Century Aluminum Vlissingen B.V. Vlissingen has an annual carbon anode production capacity of 145,000 tonnes. We acquired Vlissingen in 2012 and restarted the facility in late 2013 with an initial carbon anode production capacity of 75,000 tonnes. In 2015, we completed our project to expand its annual production capacity to 145,000 tonnes and we have begun a project to rebuild one of the baking furnaces at Vlissingen which is expected to increase annual carbon anode production capacity by an additional 12,000 tonnes per year. The rebuilt baking furnace is expected to be operational before the end of 2019. Vlissingen currently supplies carbon anodes to our smelter in Grundartangi, Iceland. Each of our smelters in the United States sources anodes from on-site carbon anode production facilities.
Baise Haohai Carbon Company, Ltd.
BHH is a carbon anode and cathode facility which commenced operations in 2008. BHH is operated as a joint venture between one of our wholly-owned subsidiaries, which owns a 40% stake in the company, and Guangxi Qiangqiang Carbon Co., Ltd., which holds the remaining 60% ownership interest and is the operator of this facility. The BHH facility has an annual carbon anode production capacity of 180,000 tonnes and an annual cathode baking and graphitization capacity of 20,000 tonnes. Following the completion of the construction of our second furnace at our carbon anode facility in Vlissingen, Netherlands, we made the decision to pursue an exit from this investment. There is no assurance that we will be successful in exiting this investment on terms that are acceptable to us or at all.
Pricing
Pricing for primary aluminum products is typically comprised of three components: (i) the base commodity price which is based on quoted prices on the LME and other exchanges, (ii) any regional premium (e.g., the Midwest premium for metal sold in the United States and the European Duty Paid premium for metal sold into Europe) and (iii) any product premium. Our operating results are highly sensitive to changes in the LME price of primary aluminum and the amount of regional delivery and product premiums. As a result, from time to time, we assess the appropriateness of mitigating the effects of fluctuations in the aluminum price through the use of fixed-price commitments, LME-linked supply contracts and financial instruments. See
Item 7A. Quantitative and Qualitative Disclosures about Market Risk
for further discussion of how we manage our exposure to market risk.
Customer Base
We have historically derived substantially all of our consolidated net sales from a small number of customers. For the year ended December 31, 2018, we derived approximately 64% of our consolidated sales from Glencore plc and its affiliates (together, "Glencore") and approximately 11% of our consolidated sales from Southwire Company ("Southwire"). We currently have agreements in place to sell a substantial portion of our 2019 production to these customers. We expect that the rest of our 2019 customer base will remain fairly concentrated among a small number of customers under short-term contracts.
Both Glencore and Southwire purchase aluminum produced at our North American smelters at prices based on the LME price for primary aluminum plus the Midwest regional premium and any additional market based product premiums. Glencore also purchases aluminum produced at our Grundartangi, Iceland smelter at prices based on the LME plus the European Duty Paid premium and any applicable product premiums. Glencore beneficially owns 42.9% of our outstanding common stock (47.2% on a fully diluted basis) and purchases the aluminum we produce for resale.
Key Production Costs
Alumina, electrical power, calcined petroleum coke and liquid pitch (the key raw materials for carbon anodes), and labor are the principal components of our cost of production. These components together represented over
75%
of our cost of goods sold for the year ended December 31,
2018
. For a description of certain risks related to our raw materials, supplies and labor, see
Item 1A. Risk Factors
in this Annual Report on Form 10-K.
4
Alumina Supply Agreements
While Century may enter into other purchases of alumina as market conditions change, a summary of our principal alumina supply agreements is provided below:
|
Supplier
|
Quantity
|
Term
|
Pricing
(2)
|
|||
|
Gramercy Alumina
|
Approximately 600,000 tpy
|
Through December 2019
|
Variable, API-based
|
|||
|
Concord Resources Ltd.
|
Approximately 120,000 tpy
|
Through December 2020
|
LME-linked
|
|||
|
Concord Resources Ltd.
|
Approximately 600,000 tpy
|
January 2020 through December 2024
|
Fixed, LME-linked, and API-linked components
|
|||
|
Glencore
(1)
|
Variable
|
Through December 2017
|
Variable, API-based
|
|||
|
(1)
|
Both parties are continuing to operate under the terms of this agreement while we negotiate a new agreement. Under the terms of this agreement, Glencore provides alumina supply for all of Century's requirements net of other contractual commitments.
|
|
(2)
|
"API" refers to a published alumina price index ("API").
|
Electrical Power Supply Agreements
The table below summarizes our long-term power supply agreements:
|
Facility
|
Supplier
|
Term
|
Pricing
|
||||
|
Grundartangi
|
Landsvirkjun
|
Through 2023 - 2036
|
Variable rate linked to (i) the LME price for primary aluminum or (ii) the Nord Pool power market
|
||||
|
Orkuveita Reykjavíkur ("OR")
|
|||||||
|
HS Orka hf ("HS")
|
|||||||
|
Hawesville
|
Kenergy Corporation ("Kenergy")
|
Through December 31, 2023
|
Variable rate based on market prices
|
||||
|
Sebree
|
Kenergy
|
Through December 31, 2023
|
Variable rate based on market prices
|
||||
|
Mt. Holly
|
South Carolina Public Service Authority
|
Through December 31, 2020
|
Variable rate based in part on a cost of service charge and in part on natural gas prices
|
||||
|
Helguvik
|
OR
|
Approximately 25 years from the dates of each phase of power delivery
|
Variable rate based on the LME price for primary aluminum
|
||||
Electrical power represents one of the largest components of our cost of goods sold. From time to time, we may enter into forward contracts or other hedging arrangements to mitigate our electrical power or natural gas price risk. The paragraphs below summarize the sources of power and the long-term power arrangements for each of our operations.
Grundartangi
. Power is currently supplied to Grundartangi from hydroelectric and geothermal sources under long-term power purchase agreements with HS, Landsvirkjun and OR at prices indexed to the price of primary aluminum, which provides a natural hedge for one of our largest production costs. Beginning in November of 2019, our contract with Landsvirkjun (covering approximately 30% of our current power requirements at Grundartangi) will be priced linked to the market price for power in the Nord Pool power market, the trading market for power in the Nordic countries and certain other areas of Europe.
5
We have entered into financial contracts to fix the forward price of approximately 4% of Grundartangi's total power requirements for the period from November 1, 2019 through December 31, 2020.
Grundartangi's power purchase agreements expire on various dates from 2023 through 2036 (subject to extension). Each power purchase agreement contains take-or-pay obligations with respect to a significant percentage of the total committed and available power under such agreement.
Hawesville
. CAKY is party to a power supply arrangement with Kenergy and EDF Trading North America, LLC (“EDF") which provides market-based power to the Hawesville smelter. Under this arrangement, the power companies purchase power on the open market and pass it through to Hawesville at Midcontinent Independent System Operator ("MISO") pricing plus transmission and other costs. The power supply arrangement with Kenergy has an effective term through December 2023. The arrangement with EDF to act as our market participant with MISO has an effective term through May 2020. Both of these agreements extend automatically year to year thereafter unless a one year notice of termination is given by either party.
Sebree
. Century Sebree is party to a power supply arrangement with Kenergy and EDF which provides market-based power to the Sebree smelter. Similar to the arrangement at Hawesville, the power companies purchase power on the open market and pass it through to Sebree at MISO pricing plus transmission and other costs. The power supply arrangement with Kenergy has an effective term through December 2023. The arrangement with EDF to act as our market participant with MISO has an effective term through May 2020. Both of these agreements extend automatically year to year thereafter unless a one year notice of termination is given by either party.
Mt. Holly
. CASC is party to a power agreement with the South Carolina Public Service Authority ("Santee Cooper") for power to the Mt. Holly smelter. Under this contract, 25% of Mt. Holly's electric power requirements is supplied from Santee Cooper's generation at cost-of-service based rates. The remaining 75% of Mt. Holly's electric power requirements is supplied from third-party generation at rates based on natural gas prices. The agreement with Santee Cooper has a term through December 31, 2020 and can be terminated by Mt. Holly on 120 days' notice. The agreement with the other power supplier has a term through December 31, 2020 and may be terminated by Mt. Holly on 60 days' notice.
Mt. Holly's inability to access the open market for 100% of its power requirements significantly impacts its ability to be competitive in the aluminum industry and puts its continued operation at risk. As a result of such uncompetitive power prices, Mt. Holly has already curtailed 50% of its production capacity. See
Item 1A. Risk Factors
. If we are unable to enter into a long term, market-based power arrangement for Mt. Holly, we may choose, or be forced, to curtail operations at the plant.
Helguvik
. Nordural Helguvik is party to a power agreement with OR for a portion of Helguvik’s expected power requirements to the Helguvik project. The first stage of power under the OR power purchase agreement (approximately 47.5 megawatts ("MW")) became available in the fourth quarter of 2011 and is currently being utilized at Grundartangi. The agreement contains certain conditions to OR’s obligations with respect to the remaining phases and OR has alleged that certain of these conditions have not been satisfied. We are in discussions with OR with respect to such conditions and other matters pertaining to this agreement.
See
Note 15. Commitments and Contingencies
to the consolidated financial statements included herein for additional information concerning our power arrangements.
Employees
As of December 31,
2018
, we had
2,069
employees.
Labor Agreements
The bargaining unit employees at our Grundartangi, Vlissingen, Hawesville and Sebree facilities are represented by labor unions, representing
65%
of our total workforce. Our employees at Mt. Holly are not represented by a labor union.
6
A summary of our key labor agreements is provided below:
|
Facility
|
Organization
|
Term
|
||
|
Grundartangi
|
Icelandic labor unions
|
Through December 31, 2019
|
||
|
Hawesville
|
USW
|
Through April 1, 2020
|
||
|
Sebree
|
USW
|
Through October 28, 2023
|
||
|
Vlissingen
|
FME
|
Through December 1, 2020
|
||
Approximately
84%
of Grundartangi’s workforce is represented by five labor unions, governed by a labor agreement that establishes wages and work rules for covered employees. The current agreement is effective through December 31, 2019.
100%
of Vlissingen's workforce is represented by the Federation for the Metal and Electrical Industry (the "FME"). The FME negotiates working conditions with trade unions on behalf of its members. The current labor agreement is effective through December 1, 2020.
Approximately
57%
of our U.S. based workforce is represented by the United Steel, Paper and Forestry, Rubber, Manufacturing, Energy, Allied Industrial and Service Workers International Union ("USW"). CAKY's Hawesville employees represented by the USW are under a collective bargaining agreement that expires on April 1, 2020. Century Sebree's employees represented by USW are under a collective bargaining agreement that expires on October 28, 2023.
Competition
The market for primary aluminum is global, and demand for aluminum varies widely from region to region. We compete with aluminum producers within the U.S. and internationally as well as with producers of alternative materials such as steel, copper, carbon fiber, composites, plastic and glass, each of which may be substituted for aluminum in certain applications. Our competitive position depends, in part, on the availability of electricity, alumina and our other key raw materials to our operations at competitive prices. We face global competition from companies who may have access to these key production costs at lower prices. Many of our competitors are also larger than we are and have vertically integrated operations with superior cost positions. As a result, these companies may be better able to withstand reductions in price or other adverse industry or economic conditions.
While we face significant competition, we also have several competitive advantages. We believe our key competitive advantages are:
Focus on upstream aluminum business.
We operate principally in the production of primary aluminum. By concentrating our activities in the upstream part of the aluminum industry, we are able to focus our resources on optimizing the cost effectiveness of our existing operations, minimizing overhead costs and maintaining a market position where our products are ultimately targeted toward a broad range of end uses.
Significant Internal Growth Opportunities.
In 2018, we began the process of restarting capacity on three potlines at Hawesville that had been curtailed since the fourth quarter of 2015. The first of these three lines was restarted in September 2018 and the second was restarted in December 2018. We expect that the third line will be restarted and back in operation during the first quarter of 2019. Operating Hawesville at full capacity would allow us to increase our annual production of aluminum by approximately 150,000 tonnes from recent levels. We are also in the process of a multi-year expansion project at our Grundartangi smelter that has brought Grundartangi’s annual production capacity from 280,000 tonnes to current capacity of 317,000 tonnes (2018 volume) and is expected to ultimately increase annual production capacity to approximately 325,000 tonnes.
Duty Free Access to our Major Customer Markets.
Our facilities benefit from international and national trade laws and regulations. For example, the European Union imposes import tariffs on primary aluminum from producers outside the European Economic Area (the "EEA"), which includes Iceland and the U.S. imposes a 10% tariff on certain primary aluminum imports into the United States. Our U.S. and Icelandic businesses currently access these respective markets duty-free which provides us with an advantage over our competitors who sell into these markets under these tariff regimes.
7
Close Proximity to our Major Customers.
Our U.S. facilities benefit from the proximity to our U.S. customer base, allowing us to capture the Midwest regional premium and providing a competitive advantage in freight costs over our competitors. The proximity to our customers also allows our Hawesville and Sebree plants to deliver a portion of their production in molten form, saving casting costs, and providing a competitive advantage over other potential suppliers. In Iceland, our proximity to European markets provides a competitive advantage for Grundartangi, including logistical benefits compared to our competitors outside the EEA.
Access to Competitive Power.
Our Kentucky operations benefit from market-based power contracts that provide electricity to these operations at competitive prices. Currently, all of our power under our power contract for our Grundartangi plant is indexed to the price of primary aluminum (and after November 2019, 70% of its power will continue to be indexed to the price of primary aluminum), which provides a natural hedge of one of our largest production costs. We continue to seek the ability to access the open market for 100% of our power requirements at Mt. Holly.
Diverse Value Added Product Portfolio.
Our Hawesville plant has the capacity to be the largest producer of high purity aluminum in the United States. Four of Hawesville’s five potlines are capable of producing high purity aluminum, which is used extensively by the defense industry as well as for certain aerospace applications. We also have the ability across our operations to cast a variety of aluminum products, both in terms of shapes and alloys. These high purity and value-added primary aluminum products are sold at a premium to standard-grade aluminum.
Sustainability
. Our Grundartangi plant receives 100% of its power requirements from clean hydroelectric and geothermal sources, reducing our fossil fuel usage and mitigating the impact of any current or future carbon regulations.
For additional information, see
Item 1A. Risk Factors
. We may be unable to continue to compete successfully in the highly competitive markets in which we operate.
Environmental Matters
We are subject to various environmental laws and regulations in the countries in which we operate. We have spent, and expect to continue to spend, significant amounts for compliance with those laws and regulations. In addition, some of our past manufacturing activities have resulted in environmental consequences that require remedial measures. Under certain environmental laws, which may impose liability regardless of fault, we may be liable for the costs of remediation of contaminated property, including our current and formerly owned or operated properties or adjacent areas, or for the amelioration of damage to natural resources. We believe, based on currently available information, that our current environmental liabilities are not likely to have a material adverse effect on Century. However, we cannot predict the requirements of future environmental laws and future requirements at current or formerly owned or operated properties or adjacent areas or the outcome of certain existing litigation to which we are a party. Such future requirements or events may result in unanticipated costs or liabilities that may have a material adverse effect on our financial condition, results of operations or liquidity. More information concerning our environmental contingencies can be found in
Note 15. Commitments and Contingencies
to the consolidated financial statements included herein.
Intellectual Property
We own or have rights to use a number of intellectual property rights relating to various aspects of our operations. We do not consider our business to be materially dependent on any of these intellectual property rights.
Disclosure Pursuant to Section 219 of the Iran Threat Reduction and Syria Human Rights Act
Section 219 of the Iran Threat Reduction and Syria Human Rights Act of 2012 (“ITRA”), effective August 10, 2012, added a new subsection (r) to Section 13 of the Exchange Act, which requires issuers that file periodic reports with the SEC to disclose in their annual and quarterly reports whether, during the reporting period, they or any of their “affiliates” (as defined in Rule 12b-2 under the Exchange Act) have knowingly engaged in specified activities or transactions relating to Iran, including activities not prohibited by U.S. law and conducted outside the U.S. by non-U.S. affiliates in compliance with applicable laws. Issuers must also file a notice with the SEC if any disclosable activity under ITRA has been included in an annual or quarterly report.
Because the SEC defines the term “affiliate” broadly, our largest stockholder may be considered an affiliate of the Company despite the fact that the Company has no control over its largest stockholder’s actions or the actions of its affiliates. As such, pursuant to Section 13(r)(1)(D)(iii) of the Exchange Act, the Company hereby discloses the following information provided by our largest stockholder regarding transactions or dealings with entities controlled by the Government of Iran (“the GOI”):
8
During the year ended December 31, 2018, non-U.S. affiliates of the largest stockholder of the Company (“the non-U.S. Stockholder Affiliates”) entered into sales and purchase contracts for agricultural products, metals, minerals, and energy products with, or for delivery to or from Iranian entities wholly or majority owned by the GOI. The non-U.S. Stockholder Affiliates performed their obligations under the contracts in compliance with applicable sanction laws and, where required, with the necessary prior approvals by the relevant governmental authorities.
The gross revenue of the non-U.S Stockholder Affiliates related to the contracts did not exceed the value of $1,049
million
for the year ended December 31, 2018.
The non-U.S. Stockholder Affiliates do not allocate net profit on a country-by-country or activity-by-activity basis, but estimate that the net profit attributable to the contracts would not exceed a small fraction of the gross revenue from such contracts. It is not possible to determine accurately the precise net profit attributable to such contracts.
The contracts disclosed above do not violate applicable sanctions laws administered by the U.S. Department of the Treasury, Office of Foreign Assets Control, and are not the subject of any enforcement action under Iran sanction laws.
In response to the re-imposition of certain US secondary sanctions, the non-U.S. Stockholder Affiliates wound down such activities to the extent necessary to avoid any sanctionable activity after such sanctions took effect.
The Company and its global subsidiaries had no transactions or activities requiring disclosure under ITRA, nor were we involved in the transactions described in this section. As of the date of this report, the Company is not aware of any other activity, transaction or dealing by it or any of its affiliates during the year ended December 31, 2018 that requires disclosure in this report under Section 13(r) of the Exchange Act.
Available Information
Additional information about Century may be obtained from our website, which is located at www.centuryaluminum.com. Our website provides access to periodic filings we have made through the EDGAR filing system of the SEC, including our annual reports on Form 10-K, quarterly reports on Form 10-Q, current reports on Form 8-K and any amendments to those reports. We also make available on our website a copy of our code of ethics that applies to all employees and ownership reports filed on Forms 3, 4 and 5 by our directors, executive officers and beneficial owners of more than 10% of our outstanding common stock. Reports that we have filed with the SEC are also available on the SEC website at www.sec.gov. In addition, we will make available free of charge copies of our Forms 10-K, Forms 10-Q and Forms 8-K upon request. Requests for these documents can be made by contacting our Investor Relations Department by mail at: One South Wacker Drive, Suite 1000, Chicago, IL 60606, or by phone at: (312) 696-3101. Information contained in our website is not incorporated by reference in, and should not be considered a part of, this Annual Report on Form 10-K.
9
Item 1A. Risk Factors
The following describes certain of the risks and uncertainties we face that could materially and adversely affect our business, financial
condition and results of operation, and cause our future results to differ materially from our current results and from those anticipated in our forward-looking statements. These risk factors should be considered together with the other risks and uncertainties described in
Item 7. Management’s Discussion and Analysis of Financial Condition and Results of Operations
and elsewhere herein. This list of significant risk factors is not all-inclusive or necessarily in order of importance.
Declines in aluminum prices could have a material adverse effect on our business, financial condition, and results of operations or cash flows.
Our operating results depend on the market for primary aluminum which can be volatile and subject to many factors beyond our control. The overall price of primary aluminum consists of three components: (i) the base commodity price, which is based on quoted prices on the LME and other exchanges; plus (ii) any regional premium (e.g., the Midwest premium for metal sold in the United States and the European Duty Paid premium for metal sold into Europe); plus (iii) any product premium.
The aluminum price is influenced by a number of factors, including global supply-demand balance, inventory levels, speculative activities by market participants, production activities by competitors, political and economic conditions, as well as production costs in major production regions. These factors can be highly speculative and difficult to predict which can lead to significant volatility in the aluminum price. The average LME price for aluminum during 2018 was
$2,110
per tonne, compared to
$1,968
per tonne in 2017 and
$1,604
per tonne in 2016. During 2018, the average U.S. Midwest premium was
$420
per tonne, compared to
$199
per tonne in 2017 and
$169
per tonne in 2016. During 2018, the average European Duty Paid premium was
$164
per tonne, compared to
$148
per tonne in 2017 and
$132
per tonne in 2016.
Declines in aluminum prices could cause us to curtail production at our operations or take other actions to reduce our cost of production, including deferring certain capital expenditures and maintenance costs and implementing workforce reductions. For example, as a result of aluminum price declines in 2015, we curtailed production at our Hawesville smelter by 60% and have only recently taken steps to restart the curtailed capacity at Hawesville. Declines in aluminum prices could also reduce our liquidity by lowering our borrowing availability under our asset-based revolving credit facilities (due to a lower market value of our inventory and accounts receivable). Significant or prolonged declines in aluminum prices (including regional, product and other premiums) in the future could result in additional curtailments and additional cost cutting measures. Any deferred costs could ultimately result in higher capital expenditures and maintenance costs than would have been incurred had such costs not been deferred and increase the costs to restore production capacity if market forces warrant. These factors may materially and adversely affect our liquidity, the amount of cash flow we have available for our capital expenditures and other operating expenses, our ability to access the credit and capital markets and our results of operations.
Excess capacity and over production of aluminum products may continue to materially disrupt world aluminum markets causing price deterioration and, in turn, adversely impact our sales, margins and profitability.
World aluminum prices have been significantly depressed in recent years due to large amounts of excess capacity and over production in China and other regions. Significant portions of world aluminum production would not be possible without financial and other support from governments and state-owned entities. This oversupply has caused world aluminum prices to be adversely impacted. Continued over production and the improper export of heavily subsidized aluminum products may continue to materially disrupt world aluminum markets resulting in depressed prices and, in turn, materially adversely impact our sales, margins and profitability.
Changes in trade laws or regulation may have an adverse effect on our sales margins and profitability.
Our businesses compete in a global marketplace and are subject to international and national trade laws and regulations. The breadth of these laws and regulations continues to expand. For example, both the European Union and the U.S. impose import tariffs on primary aluminum from foreign producers. Our Icelandic and U.S. businesses are currently able to access these respective markets duty-free. Any change to these import duties, including the granting of exemptions, a reduction in the tariff rate or a full repeal of the tariff scheme, would lessen or potentially eliminate the benefit we realize from these tariffs and would negatively impact our profitability. These or other changes in trade laws and regulations could affect the ultimate price we receive for our products, the prices and availability of our raw materials or our ability to access certain markets and could have a material adverse effect on our business, financial position, results of operations and liquidity.
Increases in our raw material costs and disruptions in our supply adversely affect our business
.
10
Our business depends upon the adequate supply of alumina, aluminum fluoride, calcined petroleum coke, pitch, carbon anodes and cathodes and other materials. The availability of our raw materials at competitive prices is critical to the profitability of our operations and increases in pricing and/or disruptions in our supply could have a material adverse effect on our business, financial position, results of operations and liquidity.
For some of these production inputs, such as alumina, coke and pitch, we do not have any internal production and rely on a limited number of suppliers for all of our requirements. Many of our supply agreements are short term or expire in the next few years. There is no assurance that we will be able to renew such agreements at commercially favorable terms, if at all.
Certain of our principal raw materials are commodities for which, at times, availability and pricing can be volatile due to a number of factors beyond our control, including general economic conditions, domestic and worldwide demand, labor costs, competition, weather conditions, major force majeure events, tariffs, sanctions and currency exchange rates.
The pricing under certain of our current alumina supply contracts is based on a published alumina index. As a result, our cost structure is exposed to market fluctuations and price volatility. For example, recent external events in the alumina markets have caused significant price volatility. In March 2018, the largest alumina refinery in the western world was forced to curtail 50% of its production following severe rainfall and concern from government regulators regarding water contamination. In April of 2018, the U.S. Department of the Treasury's Office of Foreign Assets Control ("OFAC") implemented sanctions on several Russian government officials, individuals and companies, including UC Rusal ("Rusal"). The Rusal sanctions caused significant volatility in the marketplace for aluminum and alumina, as many western consumers stopped transacting with Rusal in order to ensure compliance with the OFAC sanctions. OFAC removed the sanctions against Rusal in January 2019. These external events have had a significant adverse effect on our alumina costs. The alumina index price, for example, averaged approximately $
473
per tonne in 2018 and reached a high of $710 per tonne in April 2018. In comparison, the alumina index price averaged approximately $
354
per tonne for 2017 and $
254
per tonne for 2016.
Because we sell our products based on the LME price for primary aluminum, we are not able to pass on to our customers any increased cost of raw material that are not linked to the LME price. Due to the limited number of suppliers of these products, any disruption in supply could drive global price increases for such products and may require us to purchase these products on less favorable terms. In some instances, we may be unable to secure an alternative supply of these materials. Continued or additional disruptions in the global market could result in supply shortages or a prolonged period of elevated pricing and could impact our ability to operate our smelters which may have a material adverse effect on our business, financial position, results of operations and liquidity.
Increases in energy costs adversely affect our business.
Electrical power represents one of the largest components of our cost of goods sold. As a result, the availability of electricity at competitive prices is critical to the profitability of our operations.
Our Hawesville and Sebree plants receive all of their electricity requirements under market-based electricity contracts, and our Mt. Holly plant receives 75% of its electricity requirements under a market-based contract. Market-based electricity contracts expose us to market price volatility and fluctuations driven primarily by coal and natural gas prices and weather-influenced electric loads without any direct relationship to the price of aluminum. There can be no assurance that our market-based power supply arrangements at our Hawesville, Sebree and Mt. Holly plants will result in favorable electricity costs.
Power is currently supplied to Grundartangi from hydroelectric and geothermal sources under long-term power purchase agreements with HS, Landsvirkjun and OR at prices indexed to the price of primary aluminum. Linking the price of power to the price of aluminum provides a natural hedge of one of our largest production costs. Beginning in November 2019, one of our contracts (covering approximately 30% percent of our current power requirements at Grundartangi) will be priced linked to the market price for power in the Nord Pool power market, which will expose us to market price volatility and fluctuations based on the market price for power in the Nordic countries and certain other areas of Europe. These markets can also fluctuate significantly, without any direct relationship to the price of aluminum.
Any increase in our electricity and energy prices could have a material adverse effect on our business, financial position, results of operations and liquidity.
If we are unable to enter into a long term, market-based, power arrangement for Mt. Holly, we may choose, or be forced, to further curtail operations at the plant.
11
Mt. Holly is currently required to purchase 25% of its power requirements from Santee Cooper's generation at a standard cost-based industrial rate, which is the highest rate paid for power by any U.S. smelter and substantially higher than the rate Mt. Holly pays for market power. Mt. Holly's inability to access the open market for 100% of its power requirements significantly impacts its ability to be competitive in the aluminum industry. As a result of such uncompetitive power prices, Mt. Holly has curtailed approximately 50% of its production capacity. We continue to seek the ability to access the open market for 100% of our power requirements at Mt. Holly and to pursue every reasonable alternative available to us to achieve this objective. There can be no assurance, however, that we will be successful in these efforts. If we are unable to secure a long term power arrangement for 100% of Mt. Holly's power requirements on competitive terms, we may choose, or be forced, to further curtail operations at the plant.
Closure of the Mt. Holly facility would impose various costs on us that could have a material adverse effect on our business, financial condition, results of operations and liquidity and could cause us to write down the book value of the Mt. Holly facility. In addition, the ongoing uncertainty regarding the future operation of Mt. Holly may damage our relationships with our customers, suppliers, employees and other stakeholders and decrease the price we receive for our products, whether or not Mt. Holly is ultimately closed. Such actions and events could have a material adverse effect on our business, financial condition, results of operations and liquidity.
Losses caused by disruptions in our supply of power would adversely affect our operations.
We use large amounts of electricity to produce primary aluminum. Any loss or disruption of the power supply which reduces the amperage to our equipment or causes an equipment shutdown would result in a reduction in the volume of molten aluminum produced, and prolonged losses of power may result in the hardening or "freezing" of molten aluminum in the pots where it is produced, which could require an expensive and time consuming restart process.
Disruptions in the supply of electrical power to our facilities can be caused by a number of circumstances, including unusually high demand, blackouts, equipment or transformer failure, human error, malicious acts, natural disasters or other catastrophic events. Our market-based power supply arrangements further increase the risk that disruptions in the supply of electrical power to our domestic operations could occur. Under these arrangements, we have greater exposure to transmission line outages, problems with grid stability and limitations on energy import capability. An alternative supply of power in the event of a disruption may not be feasible.
Power disruptions have had a material negative impact on our results of operations. An equipment failure at our Sebree smelter in May 2018, for example, caused us to lose power to one of the three potlines at Sebree and forced us to temporarily stop production from that potline. We operate our smelters at close to peak amperage. Accordingly, even partial failures of high voltage equipment could affect our production. Disruptions in the supply of electrical power that do not result in production curtailment could cause us to experience pot instability that could decrease levels of productivity and incur losses.
We maintain property and business interruption insurance to mitigate losses resulting from catastrophic events, but are required to pay significant amounts under the deductible provisions of those insurance policies. In addition, the coverage under those policies may not be sufficient to cover all losses, or may not cover certain events. Certain of our insurance policies do not cover any losses that may be incurred if our suppliers are unable to provide power under certain circumstances. Certain losses or prolonged interruptions in our operations may trigger a default under certain of our outstanding indebtedness and could have a material adverse effect on our business, financial position, results of operations and liquidity.
The restart of production at our Hawesville smelter is subject to certain risks and uncertainties.
During 2018, we began restarting capacity on the three potlines at Hawesville that were curtailed in late 2015. The decision to move forward with the Hawesville restart project was based on certain market assumptions that are subject to risks outside of our control, specifically the LME price of aluminum, raw materials and premiums. Changes in these inputs may result in actual costs and returns that materially differ from the estimated costs and returns and our financial position and results of operations may be negatively affected as a result. Changes in these inputs may also make the Hawesville restart project uneconomic and we may decide at any time not to continue to fund this investment.
Operating Hawesville at full capacity is expected to eventually require rebuilding the two potlines that have been in continued operation. There can be no assurance that we will be able to restore Hawesville to full production within our projected budget and schedule. In addition to changes in market assumptions, other unforeseen difficulties could increase the cost of the project, delay the project or render the project not feasible. Any delay in the completion of the project or increased costs could have a material adverse effect on our business, financial position, results of operations and liquidity.
12
We expect to finance all phases of the Hawesville restart project through operating cash flows and existing cash, but our ability to finance the project through cash flows and existing cash could be impacted by our cash position and results of operations through the completion of this project. If we are unable to finance the Hawesville restart project through completion in accordance with our projections, it could have an adverse impact on our business, financial position, results of operations and liquidity.
Curtailment of aluminum production at our facilities could have a material adverse effect on our business, financial position, results of operations and liquidity.
The continued operation of our smelters depends on the market for primary aluminum and our underlying cost of production. Due to significant declines in the aluminum price during 2015, we made the decision to curtail 60% of production at our Hawesville smelter. We are also currently operating our Mt. Holly smelter at 50% capacity as a result of uncompetitive power prices. There can be no assurance that future deterioration in the price of aluminum or increases in our costs of production will not result in additional production curtailments at our smelters.
Curtailing production requires us to incur substantial expenses, both at the time of the curtailment and on an ongoing basis. Our facilities are subject to contractual and other fixed costs that continue even if we curtail operations at these facilities. These costs reduce the cost saving advantages of curtailing unprofitable aluminum production. If we are unable to realize the intended cost saving effects of any production curtailment, we may have to seek bankruptcy protection or be forced to divest some or all of our assets. The process of restarting production following curtailment is also expensive and time consuming. As a result, any decision to restart production would likely require market conditions significantly better than the market conditions at the time the decision to curtail was made. Any curtailments of our operations, or actions taken to seek bankruptcy protection or divest some or all of our assets, could have a material adverse effect on our business, financial position, results of operations and liquidity.
We may be unable to realize the expected benefits of our capital projects.
From time to time, we undertake strategic capital projects in order to enhance, expand and/or upgrade our facilities and operational capabilities. For instance, within the past several years, we have undertaken major expansions of our Grundartangi and Vlissingen facilities. Our ability to complete these projects and the timing and costs of doing so are subject to various risks, many of which are beyond our control. Additionally, the start-up of operations after such projects have been completed is also subject to risk. Our ability to achieve the anticipated increased revenues or otherwise realize acceptable returns on these investments is subject to a variety of market, operational, permitting, and labor-related factors. Any failure to complete these projects, or any delays or failure to achieve the anticipated results from the implementation of any such projects, could have a material adverse effect on our business, financial condition, results of operations and liquidity.
Our failure to maintain satisfactory labor relations could adversely affect our business.
The bargaining unit employees at our Grundartangi, Hawesville, Sebree and Vlissingen facilities are represented by labor unions, representing approximately
65%
of our total workforce as of December 31, 2018. Our Grundartangi and Vlissingen labor agreements are scheduled to expire on December 31, 2019 and December 1, 2020, respectively. Our Hawesville and Sebree labor agreements are scheduled to expire April 1, 2020 and October 28, 2023, respectively.
While we are hopeful to reach agreement with the labor unions to renew these agreements on acceptable terms, there is no assurance that we will be successful in doing so. If we fail to maintain satisfactory relations with any labor union representing our employees, our labor contracts may not prevent a strike or work stoppage at any of these facilities in the future. As part of any negotiation with a labor union, we may reach agreements with respect to future wages and benefits that may have a material adverse effect on our future business, financial condition, results of operations and liquidity. In addition, negotiations could divert management attention or result in strikes, lock-outs or other work stoppages. Any threatened or actual work stoppage in the future or inability to renegotiate our collective bargaining agreements could prevent or significantly impair our ability to conduct production operations at our facilities subject to these collective bargaining agreements, which could have a material adverse effect on our business, financial position, results of operations and liquidity.
Certain of our raw material and services contracts contain "take-or-pay" obligations.
We have obligations under certain contracts to take-or-pay for specified raw materials or services over the term of those contracts regardless of our operating requirements. To the extent that we curtail production at any of our operations, we may continue to be obligated to take or pay for goods or services under these contracts as if we were operating at full production, which reduces the cost savings advantages of curtailing aluminum production. Our financial position and results of operations
13
may also be adversely affected by the market price for such materials or services as we will continue to incur costs under these contracts to meet or settle our contractual take-or-pay obligations. If we were unable to use such materials or services in our operations or sell them at prices consistent with or greater than our contract costs, we could incur significant losses under these contracts. In addition, these commitments may also limit our ability to take advantage of favorable changes in the market prices for such materials and may have a material adverse effect on our business, financial position, results of operations and liquidity.
We have historically derived substantially all of our revenue from a small number of customers, and we could be adversely affected by the loss of a major customer or changes in the business or financial condition of our major customers.
We have historically derived substantially all of our consolidated net sales from a small number of customers. For the year ended December 31, 2018 we derived approximately 75% of our consolidated net sales from two major customers and we currently have agreements in place to sell a substantial portion of our 2019 production to these same customers. We expect that the rest of our 2019 customer base will remain fairly concentrated among a small number of customers under short-term contracts.
Any material non-payment or non-performance by one of these customers, a significant dispute with one of these customers, a significant downturn or deterioration in the business or financial condition of any of these customers, early termination of our sales agreement with any of these customers, or any other event significantly negatively impacting the contractual relationship with one of these customers could adversely affect our financial condition and results of operations. If, in such an event, we are unable to sell the affected production volume to another customer, or we sell the affected production to another customer on terms that are materially less advantageous to us, our revenues could be negatively impacted.
International operations expose us to political, regulatory, currency and other related risks.
We receive a significant portion of our revenues and cash flow from our operations in Iceland. These operations expose us to risks, including unexpected changes in foreign laws and regulations, political and economic instability, challenges in managing foreign operations, increased costs to adapt our systems and practices to those used in foreign countries, taxes, export duties, currency restrictions and exchange, tariffs and other trade barriers, and the burdens of complying with a wide variety of foreign laws and regulations. Changes in foreign laws and regulations are generally beyond our ability to control, influence or predict and future adverse changes in these laws could have a material adverse effect on our business, financial position, results of operations and liquidity.
In addition, we may be exposed to fluctuations in currency exchange rates. As a result, an increase in the value of foreign currencies relative to the U.S. dollar could increase the U.S. dollar cost of our operating expenses which are denominated and payable in those currencies. To the extent we explore additional opportunities outside the U.S., our currency risk with respect to the Icelandic krona, the euro and other foreign currencies may increase.
Because we own less than a majority of BHH, we cannot exercise complete control over its operations
.
We have a joint venture agreement pursuant to which we hold a 40% stake in BHH, a carbon anode and cathode facility located in the Guangxi Zhuang Autonomous Region of south China. Because we beneficially own less than a majority of the ownership interests in BHH, we have limited control of the operations of this facility and we must depend in part on our co-owner to operate such assets. Our co-owner may have interests, objectives and incentives with respect to such assets that differ from our own and there can be no assurance that BHH will be operated in accordance with our best interests.
We require substantial resources to pay our operating expenses and fund our capital expenditures.
We require substantial resources to pay our operating expenses and fund our capital expenditures. If we are unable to generate funds from our operations to pay our operating expenses and fund our capital expenditures and other obligations, our ability to continue to meet these cash requirements in the future could require substantial liquidity and access to sources of funds, including from capital and credit markets.
If funding is not available when needed, or is available only on unacceptable terms, we may be unable to respond to competitive pressures, take advantage of market opportunities or fund operations, capital expenditure or other obligations, any of which could have a material adverse effect on our business, financial position, results of operations and liquidity.
14
A deterioration in our financial condition or credit rating could limit our ability to access the credit and capital markets on acceptable terms or to enter into hedging and financial transactions, and could adversely affect our financial condition and our business relationships.
Our credit rating has been adversely affected by unfavorable market and financial conditions. Our existing credit rating, or any future negative actions the credit agencies may take, could increase our borrowing costs, limiting our ability to access the credit and capital markets, and have an adverse effect on our relationships with customers, suppliers and hedging counterparties. An inability to access the credit and capital markets when needed in order to refinance our existing debt or raise new debt or equity could have a material adverse effect on our business, financial position, results of operations and liquidity.
We require significant cash flow to meet our debt service requirements, which increases our vulnerability to adverse economic and industry conditions, reduces cash available for other purposes and limits our operational flexibility.
As of December 31, 2018, we had an aggregate of approximately
$279.7 million
of outstanding debt and we may incur additional debt in the future.
The level of our debt could have important consequences, including:
|
•
|
increasing our vulnerability to adverse economic and industry conditions;
|
|
•
|
reducing cash flow available for other purposes, including capital expenditures, acquisitions, dividends, working capital and other general corporate purposes; and
|
|
•
|
limiting our flexibility in planning for, or reacting to, competitive and other changes in our business and the industry in which we operate.
|
We have various obligations to make payments in cash, including contractual commitments, pension funding, and certain contingent obligations, that will reduce the amount of cash available to make interest payments required on our outstanding debt and for other uses. Our industrial revenue bonds ("IRBs") and any borrowings on our U.S. and Iceland revolving credit facilities are at variable interest rates, and future borrowings required to fund working capital at our businesses, capital expenditures, acquisitions, or other strategic opportunities may be at variable rates. An increase in interest rates would increase our debt service obligations under these instruments, further limiting cash flow available for other uses.
Our ability to pay interest on and to repay or refinance our debt and to satisfy other commitments will depend upon our access to additional sources of liquidity and future operating performance, which is subject to general economic, financial, competitive, legislative, regulatory, business and other factors, including market prices for primary aluminum, that are beyond our control. Accordingly, there can be no assurance that our business will generate sufficient cash flow from operations or that future borrowings will be available to us in an amount sufficient to enable us to pay debt service obligations, refinance our existing debt or to fund our other liquidity needs. If we are unable to meet our debt service obligations or fund our other liquidity needs, we could attempt to restructure or refinance our debt or seek additional equity or debt capital. There can be no assurance that we would be able to accomplish those actions on satisfactory terms, or at all, and if we are unable to ultimately meet our debt service obligations and fund our other liquidity needs, it may have a material adverse effect on our business, financial position, results of operations and liquidity.
Despite our substantial level of debt, we may incur more debt, which could exacerbate any or all of the risks described above.
We may incur substantial additional debt in the future. Although the loan and security agreement governing our U.S. revolving credit facility and the indenture governing the 7.5% Senior Secured Notes due 2021 (the "2021 Notes") limit our ability and the ability of certain of our subsidiaries to incur additional debt, these restrictions are subject to a number of qualifications and exceptions and, under certain circumstances, debt incurred in compliance with these restrictions could be substantial. In addition, the loan and security agreement governing our U.S. revolving credit facility and the indenture governing the 2021 Notes do not prevent us from incurring certain obligations that do not constitute debt as defined in these agreements. To the extent that we incur additional debt or such other obligations, the risks associated with our substantial debt described above, including our possible inability to service our debt or other obligations, would increase.
Our debt instruments subject us to covenants and restrictions.
Our existing debt instruments contain various covenants that restrict the way we conduct our business and limit our ability to incur debt, pay dividends and engage in transactions such as acquisitions and investments, among other things, which may
15
impair our ability to obtain additional liquidity and grow our business. Any failure to comply with those covenants would likely constitute a breach under such debt instruments which may result in the acceleration of all or a substantial portion of our outstanding indebtedness and termination of commitments under our revolving credit facility. If our indebtedness is accelerated, we may be unable to repay the required amounts and our secured lenders could foreclose on any collateral securing our secured debt. Any of the foregoing actions could have a material adverse effect on our business, financial condition, results of operations and liquidity.
We depend upon intercompany transfers from our subsidiaries to meet our debt service obligations.
We are a holding company and conduct all of our operations through our subsidiaries. As a holding company, our results of operations depend on the results of operations of our subsidiaries. Moreover, our ability to meet our debt service obligations depends upon the receipt of intercompany transfers from our subsidiaries. The ability of our subsidiaries to pay dividends or make other payments or advances to us will depend on their operating results and will be subject to applicable laws and any restrictions or prohibitions on intercompany transfers by those subsidiaries contained in agreements governing the debt or other obligations of such subsidiaries.
The failure of our information technology systems and/or difficulties or delays in implementing new information technology systems could have a material adverse effect on our business, results of operations and financial position.
We depend on our information technology systems to effectively manage significant aspects of our business including, without limitation, production process control, metal inventory management, and reporting financial and operational results. We are currently in the process of a company-wide deployment of a new enterprise resource planning system. Deployment of new information systems and technologies involves risks and uncertainties. Any disruptions, delays, or deficiencies in the design, implementation, or transition of such systems could result in increased costs, disruptions in our business, and/or adversely affect our ability to timely report our financial results.
Our information technology systems may also be vulnerable to damage or interruption from circumstances largely beyond our control, including, without limitation, fire, natural disasters, power outages, systems failure, security breaches, and cyber-attacks, which include viruses, malware, and ransom attacks. Cybersecurity incidents, in particular, continue to become more sophisticated and include, but are not limited to, malicious software, attempts to gain unauthorized access to data and other electronic security breaches that could lead to disruptions in systems, unauthorized release of confidential or otherwise protected information and the corruption of data.
We have taken measures to minimize the risks related to information technology systems. However, there is no assurance that these measures will be adequate. Any failure or interruption of our current information technology systems, and/or any failure resulting from a transition to new information technology systems, could have a material adverse effect on our business, results of operations and financial position.
Climate change legislation or environmental regulations may adversely impact our operations.
Climate change and greenhouse gas emissions have been the subject of significant public and scientific attention in the countries in which we operate. In turn, a number of governments or governmental bodies in these countries have introduced legislative and regulatory change in response to the potential impacts of climate change. These regulations could have a variety of adverse effects on our business.
For example, electricity represents our single largest operating cost and the availability of electricity at competitive prices is critical to the profitability of our operations. Some of the power we purchase in the United States is generated at coal-based power plants, which have been, and are likely to continue to be, significantly impacted by these regulations. Any resulting increase in our operating costs could have a material adverse effect on our business, financial position, results of operations and liquidity. Even small increases in power prices could have a disproportionate impact on our business if such price increases are not supported by then current aluminum prices.
In addition, as a member of the EEA and a signatory to the Kyoto Protocol, Iceland has implemented legislation to abide by the Kyoto Protocol and Directive 2003/87/EC of the European Parliament (the "Directive") which establishes a "cap and trade" scheme for greenhouse gas emission allowance trading. Iceland is complying with the Directive by participating in the European Union ("EU") Emission Trading System which requires us to purchase carbon dioxide allowances for our Grundartangi smelter. Although we receive approximately 70% of needed emission allowances for the Grundartangi smelter free of charge, changes to these regulations, or the implementation of new regulations, could cause our cost of allowances to rise or impose other costs.
16
The future impact of these or other potential regulatory changes is uncertain and may be either voluntary or legislated and may impact our operations directly or indirectly through customers or our supply chain. We may incur increased capital expenditures resulting from compliance with such regulatory changes, increased energy costs, costs associated with a "cap and trade" system, increased insurance premiums and deductibles, a change in competitive position relative to industry peers and changes to profit or loss arising from increased or decreased demand for goods produced by us and indirectly, from changes in cost of goods sold. For example, "cap and trade" legislation may impose significant additional costs to our power suppliers that could lead to significant increases in our energy costs. In addition, the potential physical impacts of climate change on our operations are highly uncertain and will be particular to the geographic circumstances. These may include changes in rainfall patterns, shortages of water or other natural resources, changing sea levels, changing storm patterns and intensities, and changing temperature levels. Any adverse regulatory and physical changes may have a material adverse effect on our business, financial position, results of operations and liquidity.
We and our suppliers are subject to a variety of environmental laws and regulations that may have a material adverse effect on our business, financial position, results of operations and liquidity.
Our operations may impact the environment and our properties may have environmental contamination, which could result in material liabilities to us. We are obligated to comply with various foreign, federal, state and other environmental laws and regulations, including the environmental laws and regulations of the United States, Iceland, China and the EU. Environmental laws and regulations may expose us to costs or liabilities relating to our manufacturing operations or property ownership. We incur operating costs and capital expenditures on an ongoing basis to comply with applicable environmental laws and regulations. We also are currently, and may in the future be, responsible for the cleanup of contamination at some of our current and former facilities or for the amelioration of damage to natural resources. Environmental laws may impose cleanup liability on owners and occupiers of contaminated property, including past or divested properties, regardless of whether the owners or occupiers caused the contamination or whether the activity that resulted in the contamination was lawful at the time it was conducted. Liability may also be imposed on a joint and several basis, such that we may be held responsible for more than our share of the contamination or other damages.
If more stringent compliance or cleanup standards under environmental laws or regulations are imposed, previously unknown environmental conditions or damages to natural resources are discovered or alleged, or if contributions from other responsible parties with respect to sites for which we have cleanup responsibilities are not available, we may be subject to additional liability, which may have a material adverse effect on our business, financial condition, results of operations and liquidity. Further, additional environmental matters for which we may be liable may arise in the future at our present sites where no problem is currently known, with respect to sites previously owned or operated by us, by related corporate entities or by our predecessors, or at sites that we may acquire or operate in the future. In addition, overall production costs may become prohibitively expensive and prevent us from effectively competing in price sensitive markets if future capital expenditures and costs for environmental compliance or cleanup are significantly greater than expected.
In addition, many of our key suppliers are subject to environmental laws and regulations that may affect their costs of production resulting in an increase in the price of the products that we purchase from them. For instance, some of the power we purchase in the United States is generated at coal-based power plants, which are subject to significant environmental regulation. Application of existing and new environmental laws and regulations to us and/or our key suppliers may have a material adverse effect on our business, financial position, results of operations and liquidity.
Our operations are subject to a variety of laws that regulate the protection of the health and safety of our employees, and changes in health and safety regulation could result in significant costs, which could have a material adverse effect on our business, financial position, results of operations and liquidity.
We are subject to various foreign, federal and state laws that regulate the protection of the health and safety of our workers. Changes in existing laws, possible future laws and regulations or more restrictive interpretations of current laws and regulations by governmental authorities, could cause additional expense, capital expenditures or impose restrictions on our operations. For example, we are subject to the requirements of the U.S. Occupational Safety and Health Administration (“OSHA”). On January 9, 2017, OSHA published a new standard for workplace exposure to beryllium, contained in alumina. The new standard would, among other things, lower the permissible exposure limits and establish new requirements for respiratory protection, personal protective clothing and equipment, medical surveillance, hazard communication, and recordkeeping, among others. Companies are required to comply with various elements of the new standard between March 2018 and March 2020; however, we have filed a petition with the U.S. Court of Appeals to review the final rule and are in negotiations with OSHA regarding certain changes to the rule and its application to us. In the event we are unable to reach an agreement with OSHA, we will proceed with our petition challenging the rule. Compliance with the new standard could require significant capital expenditure and would likely increase our production costs. The ultimate impact, if any, of this new
17
standard will depend on the nature and extent of the final rule as implemented, the cost of and our ability to meet the new standard, the potential impact on alumina costs, and other factors. Failure to comply with applicable laws and regulations that regulate the protection of the health and safety of our workers may result in enforcement actions, including orders issued by regulatory or judicial authorities causing operations to cease or be curtailed, which may require corrective measures including capital expenditures, installation of additional equipment or remedial actions. Any such penalties, fines, sanctions or shutdowns could have a material adverse effect on our business and results of operations.
Glencore may exercise substantial influence over us, and they may have interests that differ from those of our other stockholders.
Glencore beneficially owns approximately
42.9%
of our outstanding common stock and all of our outstanding Series A Convertible Preferred stock. In addition, one of our five directors is a Glencore employee. During the year ended December 31, 2018, we derived approximately
64%
of our consolidated sales from Glencore and we expect to sell a significant portion of our production to Glencore in 2019. Century and Glencore enter into various transactions such as the purchase and sale of primary aluminum, purchase and sale of alumina, tolling agreements and certain forward financial contracts. Because of the interests described above, Glencore may have substantial influence over our business, and on the outcome of any matters submitted to our stockholders for approval.
In addition, certain decisions concerning our operations or financial structure may present conflicts of interest between Glencore and our other stockholders. For example, Glencore may in the future engage in a wide variety of activities in our industry that may result in conflicts of interest with respect to matters affecting us. Glencore may also make investments in businesses that directly or indirectly compete with us, or may pursue acquisition opportunities that may be complementary to our business and, as a result, those acquisition opportunities may not be available to us.
Acquisitions could disrupt our operations and harm our operating results.
We have a history of making acquisitions and we expect to opportunistically seek to make acquisitions in the future. We are subject to numerous risks as a result of our acquisition strategy, including the following:
•
we may spend time and money pursuing acquisitions that do not close;
•
acquired companies may have contingent or unidentified liabilities;
•
it may be challenging for us to manage our existing business as we integrate acquired operations; and
•
we may not achieve the anticipated benefits from our acquisitions.
We are subject to numerous risks following the consummation of any acquisition, including, for example, that we may incur costs and expenses associated with any unidentified or potential liabilities, we may not achieve anticipated revenue and cost benefits from the acquisitions and unforeseen difficulties may arise in integrating the acquired operations into our existing operations. Accordingly, our past or future acquisitions might not ultimately improve our competitive position and business prospects as anticipated and may subject us to additional liabilities that could have a material adverse effect on our business, financial position, results of operations and liquidity.
Our ability to utilize certain net operating loss carryforwards to offset future taxable income may be significantly limited if we experience an "ownership change" under the Internal Revenue Code.
As of December 31, 2018, we had federal net operating loss carryforwards of approximately
$1.5 billion
which could offset future taxable income. Our ability to utilize our deferred tax assets to offset future federal taxable income may be significantly limited if we experience an "ownership change" as defined in Section 382 of the Internal Revenue Code of 1986, as amended (the "Code"). In general, an ownership change would occur if our "five-percent shareholders," as defined under the Code, collectively increase their ownership in us by more than fifty percentage points over a rolling three-year period. Future transactions in our stock that may not be in our control may cause us to experience such an ownership change and thus limit our ability to utilize net operating losses, tax credits and other tax assets to offset future taxable income.
We may be unable to continue to compete successfully in the highly competitive markets in which we operate.
We are engaged in a highly competitive industry. Aluminum also competes with other materials, such as steel, copper, plastics, composite materials and glass, among others, for various applications. Many of our competitors are larger than we are and have greater financial and technical resources than we do. These larger competitors may be better able to withstand reductions in price or other adverse industry or economic conditions. Similarly, many of our competitors have vertically integrated upstream operations with resulting superior cost positions to ours and may be better able to withstand reductions in
18
price or other adverse industry or economic conditions. If we are not able to compete successfully, our business, financial position, results of operations and cash flows could be materially and adversely affected.
Unpredictable events may interrupt our operations, which, may adversely affect our business.
Our operations may be susceptible to unpredictable events, including accidents, transportation and supply interruptions, labor disputes, equipment failure, information system breakdowns, natural disasters, dangerous weather conditions, river conditions, political unrest and other events. Operational malfunctions or interruptions at one or more of our facilities could result in substantial losses in our production capacity, personal injury or death, damage to our properties or the properties of others, monetary losses and potential legal liability.
Iceland, for example, has suffered several natural disasters and extreme weather events, including significant volcanic eruptions and earthquakes which can lead to disruption in power transmission or other impacts to our operations. Insufficient rain in Iceland has and could in the future lead to low water levels in the reservoirs which has resulted and may again result in curtailments in power which is provided to our Grundartangi, Iceland smelter from hydroelectric and geothermal sources.
We accept delivery of necessary raw materials to our operations using public infrastructure such as river systems and seaports. Deterioration of such infrastructure and/or other adverse conditions could result in transportation delays or interruptions and increased costs, as occurred during the third quarter of 2017 when lock closures on the Ohio River impacted our alumina supply and forced us to find alternative means to transport alumina to our Kentucky operations at increased cost. Any delay in the delivery of raw materials necessary for our production could impact our ability to operate our plants and have a material adverse effect on our business, financial condition or results of operation.
Future unpredictable events may adversely affect our ability to conduct business and may require substantial capital expenditures and operating expenses to remediate damage and restore operations at our production facilities. Although we maintain insurance to mitigate losses resulting from such events, our coverage may not be sufficient to cover all losses, may have high deductibles or may not cover certain events at all. To the extent these losses are not covered by insurance, our financial condition, results of operations and cash flows could be materially and adversely affected.
Item 1B. Unresolved Staff Comments
We have no unresolved comments from the staff of the SEC.
Item 2. Properties
Our principal executive office is located at 1 South Wacker Drive, Chicago, Illinois 60606. We own and operate aluminum smelters in the United States and Iceland. We also own a carbon anode production facility located in the Netherlands and a 40% interest in a carbon anode and cathode facility located in China. We lease certain of our facilities under long-term operating leases, however we do not believe that this fact materially affects the continued use of these properties. We believe all of our facilities are suitable and adequate for our current operations. Our significant properties are listed below. Additional information about the age, location and productive capacity of our facilities is available in the "Overview" section of
Item 1. Business
.
|
Facility
|
Ownership
|
|
|
Hawesville
|
100% Owned
|
|
|
Sebree
|
100% Owned
|
|
|
Mt. Holly
|
100% Owned
|
|
|
Grundartangi
|
Facility 100% owned; long-term ground lease
|
|
|
Helguvik
|
Facility 100% owned; long-term ground lease
|
|
|
Vlissingen
|
Facility 100% owned; long-term ground lease
|
|
|
Chicago Corporate Office
|
Long-term office lease
|
|
19
Item 3. Legal Proceedings
We are a party from time to time in various legal actions arising in the normal course of business, the outcomes of which, in the opinion of management, neither individually nor in the aggregate are likely to result in a material adverse effect on our financial position, operating results and cash flows. For information regarding material legal proceedings pending against us at
December 31, 2018
, refer to
Note 15. Commitments and Contingencies
to the consolidated financial statements included herein.
Item 4. Mine Safety Disclosures
Not applicable.
20
PART II
Item 5. Market for Registrant's Common Equity, Related Stockholder Matters and Issuer Purchases of Equity Securities
Market Information
Our common stock trades on the NASDAQ Global Market under the symbol: CENX.
Holders
As of February 14, 2019, there were
78
holders of record of our common stock, which does not include the number of beneficial owners whose common stock was held in street name or through fiduciaries.
Dividend Information
We did not declare dividends on our common stock in
2018
or
2017
. We do not plan to declare cash dividends in the foreseeable future. Any declaration of dividends is at the discretion of our Board of Directors.
Our U.S. revolving credit facility and the indenture governing our 2021 Notes contain restrictions which limit our ability to pay dividends. Additional information about the terms of our long-term borrowing agreements is available at
Note 6. Debt
to the consolidated financial statements included herein.
21
Stock Performance Graph
The following line graph compares Century Aluminum Company’s cumulative total return to stockholders with the cumulative total return of the S&P 500 Index and the Morningstar Aluminum Index. These comparisons assume the investment of $100 on December 31,
2013
and the reinvestment of dividends.
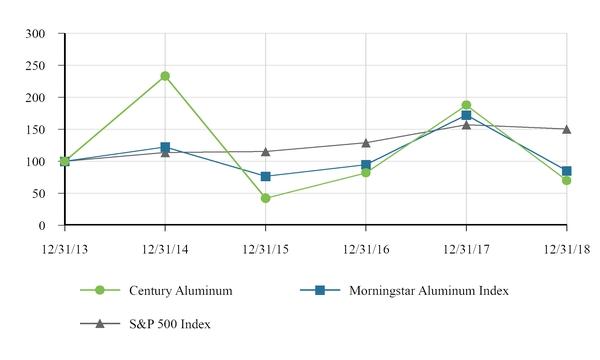
Comparison of Cumulative Total Return to Stockholders from December 31,
2013
through December 31,
2018
|
As of December 31,
|
2013
|
2014
|
2015
|
2016
|
2017
|
2018
|
|||||||||||||||||
|
Century Aluminum Company
|
$
|
100
|
|
$
|
233
|
|
$
|
42
|
|
$
|
82
|
|
$
|
188
|
|
$
|
70
|
|
|||||
|
Morningstar Aluminum Index
|
100
|
|
122
|
|
77
|
|
95
|
|
172
|
|
85
|
|
|||||||||||
|
S&P 500 Index
|
100
|
|
114
|
|
115
|
|
129
|
|
157
|
|
150
|
|
|||||||||||
Issuer Purchases of Equity Securities during the three months ended December 31,
2018
There were no issuer purchases of equity securities during the three months ended December 31,
2018
. See
Item 7. Management's Discussion and Analysis of Financial Condition and Results of Operations - Liquidity and Capital Resources Other Items
for a discussion of the current stock repurchase authorization.
22
Item 6. Selected Financial Data
The following table presents selected consolidated financial data for each of the last five fiscal years and should be read in conjunction with
Item 7. Management’s Discussion and Analysis of Financial Condition and Results of Operations
and
Item 8. Financial Statements and Supplementary Data
and notes thereto.
|
|
Year Ended December 31,
|
||||||||||||||||||
|
|
2018
|
2017
(6)
|
2016
(1) (6)
|
2015
(2) (6)
|
2014
(3) (6)
|
||||||||||||||
|
(dollars in millions, except per share amounts)
|
|||||||||||||||||||
|
Net sales
|
$
|
1,893.2
|
|
$
|
1,589.1
|
|
$
|
1,319.1
|
|
$
|
1,949.9
|
|
$
|
1,931.0
|
|
||||
|
Gross profit (loss)
|
(22.9
|
)
|
131.3
|
|
(6.1
|
)
|
38.7
|
|
198.4
|
|
|||||||||
|
Operating income (loss)
|
(59.0
|
)
|
97.2
|
|
(227.9
|
)
|
(36.5
|
)
|
143.5
|
|
|||||||||
|
Net income (loss)
|
(66.2
|
)
|
48.6
|
|
(252.4
|
)
|
(59.3
|
)
|
126.5
|
|
|||||||||
|
Earnings (loss) per share:
|
|
|
|
|
|
|
|
|
|||||||||||
|
Basic
|
$
|
(0.76
|
)
|
$
|
0.51
|
|
$
|
(2.90
|
)
|
$
|
(0.68
|
)
|
$
|
1.31
|
|
||||
|
Diluted
|
(0.76
|
)
|
0.51
|
|
(2.90
|
)
|
(0.68
|
)
|
1.30
|
|
|||||||||
|
Total assets
|
$
|
1,537.5
|
|
$
|
1,581.6
|
|
$
|
1,540.3
|
|
$
|
1,752.5
|
|
$
|
2,025.1
|
|
||||
|
Total debt
(4)
|
279.7
|
|
256.0
|
|
255.5
|
|
255.1
|
|
254.7
|
|
|||||||||
|
Long-term debt obligations
(5)
|
248.6
|
|
248.2
|
|
247.7
|
|
247.3
|
|
246.9
|
|
|||||||||
|
Other information
|
|||||||||||||||||||
|
Primary aluminum shipments, in tonnes:
|
|||||||||||||||||||
|
Direct
|
749,850
|
|
743,198
|
|
687,700
|
|
823,751
|
|
728,377
|
|
|||||||||
|
Toll
|
—
|
|
—
|
|
46,125
|
|
98,207
|
|
138,748
|
|
|||||||||
|
Average price per tonne:
|
|||||||||||||||||||
|
Direct shipments
|
$
|
2,505
|
|
$
|
2,126
|
|
$
|
1,825
|
|
$
|
2,169
|
|
$
|
2,333
|
|
||||
|
Toll shipments
|
—
|
|
—
|
|
1,172
|
|
1,374
|
|
1,554
|
|
|||||||||
|
LME
|
2,110
|
|
1,968
|
|
1,604
|
|
1,663
|
|
1,867
|
|
|||||||||
|
Midwest premium
|
420
|
|
199
|
|
169
|
|
279
|
|
450
|
|
|||||||||
|
European Duty Paid premium
|
164
|
|
148
|
|
132
|
|
236
|
|
424
|
|
|||||||||
|
(1)
|
In 2016, the Helguvik project in Iceland was determined to be impaired and charges of $152.2 million were recorded.
|
|
(2)
|
In 2015, our Ravenswood smelter was permanently closed. Also, in the fourth quarter of 2015, operations at Hawesville and Mt. Holly were partially curtailed.
|
|
(3)
|
In December 2014, the remaining interest in Mt. Holly was acquired.
|
|
(4)
|
Total debt includes all long-term debt obligations and any debt classified as short-term obligations, net of any debt discounts, including current portion of long-term debt, borrowings under our revolving credit facilities and the IRBs.
|
|
(5)
|
Long-term debt obligations are all payment obligations under long-term borrowing arrangements, excluding the current portion of the long-term debt.
|
|
(6)
|
As adjusted due to the adoption of ASU 2017- 07 "Compensation- Retirement Benefits (Topic 715): Improving the Presentation of Net Periodic Pension Cost and Net Periodic Benefit Cost."
|
23
Item 7. Management's Discussion and Analysis of Financial Condition and Results of Operations
This Management’s Discussion and Analysis (“MD&A”) provides information that management believes is relevant to an assessment and understanding of the consolidated financial condition and results of operations of Century Aluminum Company and its subsidiaries (collectively, “Century,” the “Company,” “our” and “we”) and should be read in conjunction with the accompanying consolidated financial statements and related notes thereto in
Item 8. Financial Statements and Supplementary Data
and in
Item 1A. Risk Factors
. This MD&A contains “forward-looking statements” - See “Forward-Looking Statements” above.
Overview
We are a global producer of primary aluminum with aluminum reduction facilities, or "smelters," in the United States and Iceland. The key determinants of our results of operations and cash flow from operations are as follows:
|
•
|
the price of primary aluminum, which is based on the LME and other exchanges, plus any regional premiums and value-added product premiums;
|
|
•
|
the cost of goods sold, the principal components of which are electrical power, alumina, carbon products and labor, which in aggregate represent more than 75% of our cost of goods sold; and
|
|
•
|
our production volume.
|
Pricing of aluminum
The overall price of primary aluminum consists of three components: (i) the base commodity price, which is based on quoted prices on the LME and other exchanges; plus (ii) any regional premium (e.g., the Midwest premium for metal sold in the United States and the European Duty Paid premium for metal sold into Europe); plus (iii) any product premium. Each of these price components has its own drivers and variability.
The aluminum price is influenced by a number of factors, including global supply-demand balance, inventory levels, speculative activities by market participants, production activities by competitors and political and economic conditions, as well as production costs in major production regions. These factors can be highly speculative and difficult to predict which can lead to significant volatility in the aluminum price. Increases or decreases in primary aluminum prices result in increases and decreases in our revenues (assuming all other factors are unchanged). Information regarding financial contracts is included in
Note 19. Derivatives.
24
The historic volatility of the price of aluminum is reflected in the chart below:
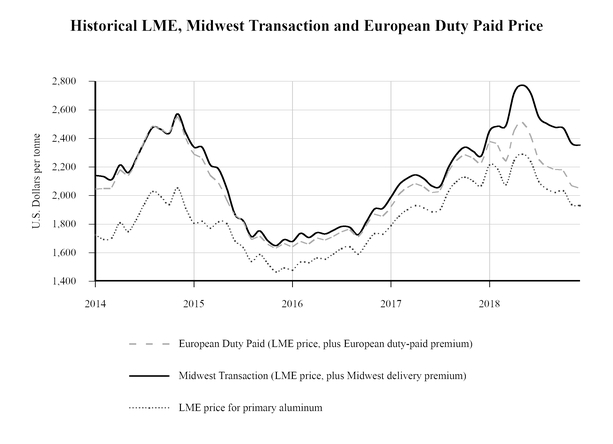
During
2018
, global, macroeconomic conditions, including continued global overcapacity caused by state-sponsored subsidy programs, contributed to a 16% decrease in the LME spot price for primary aluminum for the year with a monthly average price in May 2018 of $2,291 compared to a monthly average price in December 2018 of $1,931. The average LME price for primary aluminum was
$2,110
per tonne in 2018, compared to
$1,968
per tonne in
2017
, and
$1,604
in
2016
. During 2018, the average U.S. Midwest premium was $420 per tonne compared to $199 per tonne in 2017 and $169 per tonne in 2016. During 2018, the average European Duty Paid premium was $164 per tonne compared to $148 per tonne in 2017 and $132 per tonne in 2016.
Our results generally reflect the average LME price for primary aluminum on a two-month lag basis.
Energy, Key Supplies and Raw Materials
Our operating costs are significantly impacted by changes in the prices of the materials used in the production of aluminum, including electrical power, alumina and carbon products. Because we sell our products based principally on the LME price for primary aluminum, regional premiums and value-added product premiums, we cannot pass on increased production costs to our customers. Although we attempt to mitigate the effects of price fluctuations from time to time through the use of various fixed-price commitments, financial instruments and also by negotiating LME-based pricing in some of our raw materials and electrical power contracts, these efforts also limit our ability to take advantage of favorable changes in the market prices for primary aluminum or raw materials and may affect our financial position, results of operations and cash flows.
Over the past several years, major alumina suppliers have been systematically moving their alumina sales contracts away from LME aluminum-based pricing to published alumina spot or index pricing, thus de-linking the price for alumina from the aluminum price. Reflecting this, the pricing under certain of our alumina supply contracts is based on a published alumina index. As a result, our cost structure is exposed to alumina market fluctuations and price volatility. Various external events in the alumina markets during 2018 caused significant increases in the price of alumina resulting in the ratio of alumina prices to aluminum prices to well exceed historical levels. The alumina index price, for example, averaged approximately $473 per tonne in 2018 and reached a high of $710 per tonne in April 2018. In comparison, the alumina index price averaged
25
approximately $
354
per tonne for
2017
. There is typically a one-to-three month lag on cost utilization for alumina and certain of our other key raw materials depending on the terms of our contracts, the timing of shipments and inventory levels.
Electrical power represents one of our largest operating costs. As a result, the availability of reliable electrical power at competitive prices is critical to the profitability of our operations. Currently, our Hawesville and Sebree plants receive all of their electricity requirements under market-based power agreements and our Mt. Holly plant receives 75% of its electricity requirements under a market-based contract. Our Grundartangi plant is also currently supplied power at prices linked to the LME price for aluminum, however, beginning in November of 2019, approximately 30% of our power requirements at Grundartangi will be priced linked to the market price for power in the Nord Pool power market. Market-based energy prices are driven in large part by coal and natural gas prices and weather-influenced electric loads. In
2018
, both coal and natural gas prices were relatively low, weather conditions were moderate and the market-based energy prices we realized under these agreements were substantially below the cost-based utility rate that the smelters would otherwise have paid.
Mt. Holly is currently required to purchase 25% of its power requirements from Santee Cooper at a standard cost-based industrial rate, which is the highest rate for power paid by any U.S. smelter and substantially higher than the rate Mt. Holly pays for market power. Mt. Holly's inability to access the open market for 100% of its power requirements significantly impacts its ability to be competitive in the aluminum industry and puts its continued operation at risk. As a result of such uncompetitive power prices, Mt. Holly has already curtailed 50% of its production capacity. We continue to seek the ability to access the open market for 100% of our power requirements at Mt. Holly but there can be no assurance that we will be successful in these efforts. See
Item 1A. Risk Factors
. If we are unable to enter into a long-term, market-based, power arrangement for Mt. Holly, we may choose, or be forced, to further curtail operations at the plant.
Production/Shipment Volumes
Shipment volume is another key determinant of our financial results. In normal circumstances, fluctuations in production and shipment volumes, other than through acquisitions or expansions, are generally small period over period. U.S. shipments for
2018
reflect increases from the Hawesville restart offset by lower production from the Sebree line loss. The increase in Iceland production from 2016 to
2018
reflects our multi-year expansion project. Any adverse changes in the conditions that affect shipment volumes could have a material adverse effect on our results of operations and cash flows.
The following table sets forth, for the periods indicated, the shipment volumes and revenues for primary aluminum shipments:
|
SHIPMENTS - PRIMARY ALUMINUM
(1)
|
||||||||||||||||||||
|
United States
|
Iceland
|
Total
|
||||||||||||||||||
|
|
Tonnes
|
Revenue $
|
Tonnes
|
Revenue $
|
Tonnes
|
Revenue $
|
||||||||||||||
|
(dollars in millions)
|
||||||||||||||||||||
|
2018
|
428,389
|
|
$
|
1,126.4
|
|
321,461
|
|
$
|
752.3
|
|
749,850
|
|
$
|
1,878.7
|
|
|||||
|
2017
|
425,669
|
|
929.6
|
|
317,529
|
|
650.7
|
|
743,198
|
|
1,580.3
|
|
||||||||
|
2016
|
422,139
|
|
799.2
|
|
311,686
|
|
510.2
|
|
733,825
|
|
1,309.4
|
|
||||||||
(1)
Excludes scrap aluminum sales
Results of Operations
The following discussion for the year ended December 31,
2018
reflects the Sebree equipment failure and the incremental production from two lines at Hawesville. Results for the year reflect no change in Mt. Holly and Grundartangi production capacities.
Year Ended December 31,
2018
Compared to Year Ended December 31,
2017
Net sales:
Net sales for the twelve months ended December 31,
2018
improved $304.1 million compared to the same period in
2017
, driven by higher price realizations of $265.1 million primarily resulting from increases in the LME and U.S. Midwest premium prices for primary aluminum and $39.0 million in volume and product mix year over year.
Gross profit
: Gross profit for the twelve months ended December 31, 2018 decreased by $154.2 million compared to the same period in 2017, driven primarily by higher alumina and other raw material price realizations of $301.7 million,
26
unfavorable operating expenses of $92.7 million (due to increased production volume at Hawesville, the Sebree equipment failure, and lower of cost or net realizable value from increasing alumina prices), and unfavorable power prices of $28.8 million. These decreases to gross profit are partially offset by favorable price realizations of the LME and U.S. Midwest premium of $265.1 million and net favorable volume and product mix impacts of $3.9 million.
Selling, general and administrative expenses:
Selling, general and administrative expenses decreased $4.6 million in 2018 compared to
2017
, due primarily to favorable decreases in stock compensation expense (reflecting our lower stock price) and professional fees.
Helguvik (gains) losses:
During
2018
and 2017, we extinguished a portion of our contractual commitments associated with the construction of the Helguvik project. Such extinguishment resulted in a gain in 2018 of $
4.5 million
recognized in Helguvik (gains) losses in the consolidated statements of operations compared to a gain of
$7.3 million
for the year ended 2017.
Ravenswood (gains) losses:
In 2017, the Ravenswood retiree medical class action lawsuit was settled. As a result, we recognized a non-cash gain of $5.5 million in 2017 reflecting the present value discount of the original settlement agreement of $23 million which was recorded in 2016 - see
Note 15. Commitments and Contingencies
. There were no gains or losses recorded for the year ended
2018
.
Net (gain) loss on forward and derivative contracts:
In
2018
, we recognized gains of $6.3 million primarily related to Nord Pool and LME fixed forward financial sales contracts entered into in early
2017
for power consumption starting November 2019 through December 2020; the gains were primarily driven by the increase in the Nord Pool price during
2018
. In
2017
, we recorded losses of $16.5 million primarily related to LME fixed forward financial sales contracts that were entered into in early 2016 for shipments through December 31,
2017
; the losses were driven by the increase in the LME during
2017
.
Income tax expense:
We have a valuation allowance against all of our U.S. and certain foreign deferred tax assets. We recognized a $0.2 million income tax benefit in 2018 as compared to income tax expense of $7.6 million in 2017. The reduction in tax expense year over year primarily relates to a decrease in earnings of certain of our foreign entities.
Year Ended December 31, 2017 Compared to Year Ended December 31, 2016
Net sales:
Net sales for the twelve months ended December 31, 2017 improved $270.0 million compared to the same period in 2016, driven by higher price realizations of $264.5 million primarily resulting from increases in the LME price for primary aluminum, an increase due to a shift from toll to direct sales of $24.4 million and an increase in shipment volumes of $17.7 million, partially offset by unfavorable product mix and product premiums of $36.6 million reflecting a heavier mix of sow and molten product in 2017 compared to 2016 and a decrease in value-added product premiums year over year.
Gross profit
: Gross profit for the twelve months ended December 31, 2017 improved $137.4 million compared to the same period in 2016, driven primarily by higher price realizations of $264.5 million, favorable operating expenses of $11.4 million and favorable volume of $1.4 million, partially offset by unfavorable raw material prices of $88.2 million, unfavorable power prices of $35.2 million ($19.6 million of which relates to increases in Iceland power prices, which are linked to the LME), unfavorable product mix and product premiums of $16.2 million and other of $0.3 million.
Selling, general and administrative expenses:
Selling, general and administrative expenses increased $5.9 million compared to 2016, due primarily to an increase in stock compensation expense of $2.9 million reflecting our higher stock price, an increase in professional fees of $2.9 million related to spending on several corporate projects including a multi-year upgrade in our enterprise resource planning systems and relocating our IT support group to be closer to a large talent pool and other of $0.1 million.
Helguvik (gains) losses:
During 2017, we extinguished a portion of our contractual commitments associated with the construction of the Helguvik project. Such extinguishment resulted in a gain of $7.3 million recognized in Helguvik (gains) losses in the consolidated statements of operations.
Ravenswood (gains) losses:
In 2017, the Ravenswood retiree medical class action lawsuit was settled. As a result, we recognized a non-cash gain of $5.5 million reflecting the present value discount of the original settlement agreement of $23.0 million which was recorded in 2016 - see
Note 15. Commitments and Contingencies
. Also in 2016, we recorded an impairment charge of $3.8 million based on our agreement to sell our net assets in Ravenswood - see
Note 4. Helguvik and Ravenswood Gains and (Losses)
.
27
Net (gain) loss on forward and derivative contracts:
In 2017, we recognized losses of $16.5 million primarily related to LME fixed forward financial sales contracts that were entered into in early 2016 for shipments through December 31, 2017; the losses were driven by the increase in the LME during 2017. In 2016, we recorded gains of $3.5 million primarily related to LME fixed forward financial sales contracts that were also entered into in early 2016 for shipments through December 31, 2016.
Income tax expense:
We have a valuation allowance against all of our U.S. and certain foreign tax assets. The period to period differences in income tax expense are primarily due to the change in earnings of certain of our foreign entities that are not subject to a valuation allowance while the entities that are subject to a valuation allowance are unable to recognize a tax benefit for their losses.
Liquidity and Capital Resources
Liquidity
Our principal sources of liquidity are available cash, cash flow from operations and borrowing capacity under our existing revolving credit facilities. We have also raised capital in the past through the public equity and debt markets, and we regularly explore various other financing alternatives. Our principal uses of cash include the funding of operating costs (including post-retirement benefits), debt service requirements, the funding of capital expenditures, investments in our growth activities and in related businesses, working capital and other general corporate requirements. Although we believe that cash provided from operations and financing activities will be adequate to cover our operations and business needs over the next 12 months, adverse changes in the price of aluminum or our principal costs of production could materially impact our ability to generate and raise cash. For an analysis of risks facing our business see
Item 1A. Risk Factors
.
Available Cash
Our available cash and cash equivalents balance at
December 31, 2018
was $38.9 million compared to $167.2 million at
December 31, 2017
.
Sources and Uses of Cash
Our cash flows from operating, investing and financing activities as reflected in the consolidated statement of cash flows for the twelve months ended
December 31, 2018
,
2017
and
2016
are summarized below:
|
Twelve months ended December 31,
|
|||||||||||
|
|
2018
|
2017
|
2016
|
||||||||
|
|
(dollars in millions)
|
||||||||||
|
Net cash provided by (used in) operating activities
|
$
|
(69.1
|
)
|
$
|
51.5
|
|
$
|
38.2
|
|
||
|
Net cash (used in) investing activities
|
(82.9
|
)
|
(17.4
|
)
|
(20.9
|
)
|
|||||
|
Net cash provided by financing activities
|
23.7
|
|
0.4
|
|
—
|
|
|||||
|
Change in cash, cash equivalents and restricted cash
|
$
|
(128.3
|
)
|
$
|
34.5
|
|
$
|
17.3
|
|
||
Year Ended December 31,
2018
Compared to Year Ended December 31,
2017
Net cash used in operating activities for
2018
was
$69.1 million
, compared to net cash provided by operating activities of
$51.5 million
for
2017
. The increase in net cash used in operating activities was primarily driven by the year-over-year net loss compared to net income.
The increase in net cash used in investing activities was due to higher capital expenditures related to our investment in the Hawesville restart project in 2018, compared with proceeds from the sale of our Ravenswood facility received in 2017 that partially offset purchases of property, plant and equipment.
28
Net cash provided by financing activities increased by $23.3 million during
2018
due to outstanding borrowings on our U.S. revolving credit facility. Borrowings are short term in nature to fund working capital requirements and are repaid on a continuous basis.
Year Ended December 31,
2017
Compared to Year Ended December 31,
2016
Net cash provided by operating activities for
2017
was
$51.5 million
, compared to
$38.2 million
for
2016
. The increase in cash provided by operating activities was driven by an increase in earnings primarily due to higher realized prices year-over-year, partially offset by cash used to fund increases in working capital due to higher raw material costs and to support an increase in trade accounts receivable resulting from longer payment terms as we increased direct sales to customers other than Glencore.
Net cash used in investing activities for
2017
was
$17.4 million
compared to
$20.9 million
for
2016
. While
2017
capital expenditures increased $9.9 million over
2016
, this was more than offset by $13.6 million of proceeds received in
2017
from the sale of our Ravenswood facility.
Net cash provided by financing activities for
2017
and
2016
was essentially flat for both years.
Availability Under Our Credit Facilities
The U.S. revolving credit facility, dated May 2018, provides for borrowings of up to
$175.0
million in the aggregate including up to $110.0 million under a letter of credit sub-facility, and also includes an uncommitted accordion feature whereby borrowers may increase the capacity of the U.S. revolving credit facility by up to $50.0 million, subject to agreement with the lenders. The U.S. revolving credit facility matures on the sooner of May 2023 or six months before the stated maturity of our outstanding senior secured notes. Any letters of credit issued and outstanding under the U.S. revolving credit facility reduce our borrowing availability on a dollar-for-dollar basis.
We have also entered into, through our wholly-owned subsidiary Nordural Grundartangi ehf, a $50.0 million revolving credit facility, dated November 2013, as amended (the "Iceland revolving credit facility"). The Iceland revolving credit facility matures in November 2020.
The availability of funds under our credit facilities is limited by a specified borrowing base consisting of certain accounts receivable, inventory and qualified cash deposits which meet the lenders' eligibility criteria. Restarts of previously curtailed operations increase our borrowing base by increasing our accounts receivable and inventory balances; whereas, curtailments of production capacity decrease our borrowing base by reducing our accounts receivable and inventory balances. As of
December 31, 2018
, our U.S. revolving credit facility had
$23.3 million
in borrowings and $
44.8 million
in letters of credit outstanding. Of the outstanding letters of credit,
62%
related to our domestic power commitments and the remainder secured certain debt and workers’ compensation commitments.
As of
December 31, 2018
, our credit facilities had
$156.9 million
of net availability after consideration of our outstanding borrowings and letters of credit. We may borrow and make repayments under our credit facilities in the ordinary course based on a number of factors, including the timing of payments from our customers and payments to our suppliers.
Our credit facilities contain customary covenants, including restrictions on mergers and acquisitions, indebtedness, affiliate transactions, liens, dividends and distributions, dispositions of collateral, investments and prepayments of indebtedness, including, a springing financial covenant that requires us to maintain a fixed charge coverage ratio of at least 1.0 to 1.0 any time availability under the U.S. revolving credit facility is less than or equal to $17.5 million. Our Icelandic credit facility also contains a covenant that requires Grundartangi to maintain a minimum equity ratio.
As of December 31, 2018
, we were in compliance with all such covenants.
Senior Secured Notes
We have $250 million in 7.5% senior secured notes payable that will mature in June 2021 ("2021 Notes"). Interest on the 2021 Notes is payable semi-annually.
The indenture governing the 2021 Notes contains customary covenants which may limit our ability, and the ability of certain of our subsidiaries, to: (i) incur additional debt; (ii) incur additional liens; (iii) pay dividends or make distributions in respect of capital stock; (iv) purchase or redeem capital stock; (v) make investments or certain other restricted payments;
29
(vi) sell assets; (vii) issue or sell stock of certain subsidiaries; (viii) enter into transactions with shareholders or affiliates; and (ix) effect a consolidation or merger.
Contingent Commitments
We have a contingent obligation in connection with the “unwind” of a contractual arrangement between CAKY, Big Rivers and a third party and the execution of a long-term cost-based power contract with Kenergy, a member of a cooperative of Big Rivers, in July 2009. This contingent obligation consists of the aggregate payments made to Big Rivers by the third party on CAKY’s behalf in excess of the agreed upon base amount under the long-term cost-based power contract with Kenergy. As of
December 31, 2018
, the principal and accrued interest for the contingent obligation was $
23.8 million
, which was fully offset by a derivative asset. We may be required to make installment payments for the contingent obligation in the future. These payments are contingent based on the LME price of primary aluminum and the level of Hawesville’s operations. Based on the LME forward market at
December 31, 2018
and management’s estimate of the LME forward market beyond the quoted market period, we have assessed that we will not be required to make payments on the contingent obligation during the term of the agreement through 2028. There can be no assurance that circumstances will not change thus accelerating the timing of such payments.
Employee Benefit Plan Contributions
In 2013, we entered into a settlement agreement with the PBGC regarding an alleged "cessation of operations" at our Ravenswood facility. Pursuant to the terms of the agreement, we agreed to make additional contributions (above any minimum required contributions) to our defined benefit pension plans totaling approximately $17.4 million. Under certain circumstances, in periods of lower primary aluminum prices relative to our cost of operations, we are able to defer one or more of these payments, but would then be required to provide the PBGC with acceptable security for deferred payments. We did not make any contributions during the years ended December 31, 2018, 2017 and 2016. We have elected to defer certain payments under the PBGC agreement and have provided the PBGC with the appropriate security. The remaining contributions under this agreement are approximately
$9.6
million.
Section 232 Aluminum Tariff
On March 23, 2018, the U.S. implemented a 10% tariff on imported primary aluminum products into the U.S. These tariffs are intended to protect U.S. national security by incentivizing the restart of primary aluminum production in the U.S., reducing reliance on imports and ensuring that domestic producers, like Century, can supply all the aluminum necessary for critical industries and national defense. In addition to primary aluminum products, the tariffs also cover certain other semi-finished products. All imports that directly compete with our products are covered by the tariff, with the exception of imports from Australia (which are not subject to a tariff) and Argentina (which are subject to a quota) or imports that receive a product exclusion from the Department of Commerce.
Other Items
During 2018, we began restarting production on the three potlines at Hawesville that were curtailed in late 2015. The first of these three lines was restarted in September 2018 and the second was restarted in December 2018. We expect that the third line will be restarted and back in operation during the first quarter of 2019. Through
December 31, 2018
, we have invested $68.3 million of the anticipated $75.0 million on phase one of the Hawesville restart project. We project an additional $75.0 million to rebuild the pots associated with the 100,000 tonnes of production that was not curtailed and the implementation of new anode and rodding technology across all production, expected to occur in the future subject to market conditions. We expect to fund all amounts relating to this project through operating cash flows and existing cash.
In May 2018, we temporarily curtailed one potline at our Sebree aluminum smelter due to an equipment failure. We returned the curtailed potline at Sebree back to service during the third quarter. We expect all losses arising from the Sebree equipment failure will be covered under our insurance policies, less $7.0 million in deductibles. As of
December 31, 2018
, we received $8.0 million of insurance proceeds which are included in cost of goods sold for the year.
In 2011, our Board of Directors approved a
$60.0 million
common stock repurchase program and subsequently increased this program by
$70.0 million
in the first quarter of 2015. Under the program, Century is authorized to repurchase up to
$130.0 million
of our outstanding shares of common stock, from time to time, on the open market at prevailing market prices, in block trades or otherwise. The timing and amount of any shares repurchased will be determined by our management based on its evaluation of market conditions, the trading price of our common stock and other factors. We made no repurchases during the
30
years ended 2018, 2017, and 2016. As of
December 31, 2018
, we had
$43.7
million remaining under the repurchase program authorization. The repurchase program may be expanded, suspended or discontinued by our Board, in its sole discretion, at any time.
In November 2009, Century Aluminum of West Virginia ("CAWV") filed a class action complaint for declaratory judgment against the United Steel, Paper and Forestry, Rubber, Manufacturing, Energy, Allied Industrial and Service Workers International Union ("USW"), the USW’s local and certain CAWV retirees, individually and as class representatives ("CAWV Retirees"), seeking a declaration of CAWV’s rights to modify/terminate retiree medical benefits. Later in November 2009, the USW and representatives of a retiree class filed a separate suit against CAWV, Century Aluminum Company, Century Aluminum Master Welfare Benefit Plan, and various John Does with respect to the foregoing.
On August 18, 2017, the District Court for the Southern District of West Virginia approved a settlement agreement in respect of these actions. Under the terms of the settlement agreement, CAWV agreed to make payments into a trust for the benefit of the CAWV Retirees in the aggregate amount of $23.0 million over the course of ten years. Upon approval of the settlement, we paid $5.0 million to the aforementioned trust in September 2017 and agreed to pay the remaining amounts under the settlement agreement in annual increments of $2.0 million for nine years. At December 31, 2018, we had $2.0 million in other current liabilities and $9.8 million in other liabilities related to this agreement.
We are a defendant in several actions relating to various aspects of our business. While it is impossible to predict the ultimate disposition of any litigation, we do not believe that any of these lawsuits, either individually or in the aggregate, will have a material adverse effect on our financial condition, results of operations or liquidity. See
Note 15. Commitments and Contingencies
to the consolidated financial statements included herein for additional information.
Capital Resources
We intend to finance our future recurring capital expenditures from available cash, cash flow from operations and available borrowing capacity under our existing revolving credit facilities. For major investment projects we would likely seek financing from various capital and loan markets, and may potentially pursue the formation of strategic alliances. We may be unable, however, to issue additional debt or equity securities, or enter into other financing arrangements on attractive terms, or at all, due to a number of factors including a lack of demand, unfavorable pricing, poor economic conditions, unfavorable interest rates, or our financial condition or credit rating at the time. Future uncertainty in the U.S. and international markets and economies may adversely affect our liquidity, our ability to access the debt or capital markets and our financial condition.
Capital expenditures for the year ended
December 31, 2018
were $22.7 million, excluding expenditures of $68.3 million associated with the restart at Hawesville. We estimate our total capital spending excluding the Hawesville restart in 2019 will be approximately $30.0 million, primarily related to our ongoing maintenance and investment projects at our smelters.
Critical Accounting Estimates
Our significant accounting policies are described in
Note 1. Summary of Significant Accounting Policies
to the consolidated financial statements. The preparation of the financial statements requires that management make judgments, assumptions and estimates in applying these accounting policies. Those judgments are normally based on knowledge and experience about past and current events and on assumptions about future events. Critical accounting estimates require management to make assumptions about matters that are highly uncertain at the time of the estimate and a change in these estimates may have a material impact on our financial position or results of operations. Significant judgments and estimates made by our management include expenses and liabilities related to inventories, pensions and OPEB, deferred tax assets and property, plant and equipment. Our management has discussed the development and selection of these critical accounting estimates with the audit committee of our Board of Directors and the Audit Committee has reviewed our disclosure.
Inventories
Our inventories are stated at lower of cost or net realizable value ("NRV").
Our estimate of the market value of our inventories involves establishing a net realizable value for both finished goods and the components of inventory that will be converted to finished goods, raw materials and work in process. This requires management to use its judgment when making assumptions about future selling prices and the costs to complete our inventory during the period in which it will be sold.
31
Our assumptions are subject to inherent uncertainties given the volatility surrounding the market price for primary aluminum sales and the market price for our major inputs, alumina and electrical power. In 2018, increasing alumina prices resulted in a $36.5 million lower of cost or NRV adjustment.
Although we believe that the assumptions used to estimate the market value of our inventory are reasonable, actual market conditions at the time our inventory is sold may be more or less favorable than management’s current estimates.
Pension and Other Postretirement Benefit Liabilities
We sponsor several pension and other postretirement benefit plans. Our liabilities under these defined benefit plans are determined using methodologies that involve several actuarial assumptions, the most significant of which are the discount rate, health care cost inflation rate and the long-term rate of return on plan assets. We review our actuarial assumptions on an annual basis and make modifications to the assumptions when appropriate.
Discount Rate Selection
We select a discount rate for purposes of measuring obligations under defined benefit plans by matching cash flows separately for each plan to the yields on high-quality zero coupon bonds. We use the Ryan Above Median Yield Curve (the "Ryan Curve"). We believe the projected cash flows used to determine the Ryan Curve rate provide a good approximation of the timing and amounts of our defined benefit payments under our plans and no adjustment to the Ryan Curve rate has been made.
|
Weighted Average Discount Rate Assumption for:
|
2018
|
2017
|
|
|
Pension plans
|
4.39%
|
3.69%
|
|
|
OPEB plans
|
4.27%
|
3.66%
|
|
A change of a half percentage point in the discount rate for our defined benefit plans would have the following effects on our obligations under these plans as of December 31,
2018
:
|
Effect of changes in the discount rates on the Projected Benefit Obligations for:
|
50 basis point increase
|
50 basis point decrease
|
|||||
|
|
(dollars in millions)
|
||||||
|
Pension plans
|
$
|
(6.9
|
)
|
$
|
5.1
|
|
|
|
OPEB plans
|
(5.2
|
)
|
5.5
|
|
|||
Medical Trend Rate
Measurement of our postretirement benefit obligations requires the use of several assumptions about factors that will affect the amount and timing of future benefit payments. The assumed health care cost trend rates are the most critical estimates for measurement of the postretirement benefit obligation. Changes in the health care cost trend rates have a significant effect on the amounts reported for the health care benefit obligation.
Medical cost inflation is initially estimated to be
6.7%
and
7.4%
for pre and post-65 participants, respectively, declining to
4.5%
over
twelve
years and thereafter. A one-percentage-point change in the assumed health care cost trend rate would have had the following effects in
2018
:
|
|
1% Increase
|
1% Decrease
|
|||||
|
|
(dollars in millions)
|
||||||
|
Effect on total of service and interest cost components
|
$
|
0.4
|
|
$
|
(0.4
|
)
|
|
|
Effect on accumulated postretirement benefit obligation
|
10.6
|
|
(9.1
|
)
|
|||
Long-term Rate of Return on Plan Assets Assumption
32
Our expected long-term rate of return on plan assets is derived from our asset allocation strategies and anticipated future long-term performance of individual asset classes. Our analysis gives consideration to recent plan performance and historical returns; however, the assumptions are primarily based on long-term, prospective rates of return. The weighted average long-term rate of return on plan assets for our defined benefit pension plans is
7.18%
for
2018
.
Based on information provided by independent actuaries and other relevant sources, the Company believes that the assumptions used to estimate expenses, assets and liabilities of pensions and other postretirement benefits are reasonable; however, changes in these assumptions could impact the Company’s financial position, results of operations or cash flows.
Deferred Income Tax Assets
We regularly assess the likelihood that deferred tax assets will be recovered from future taxable income. To the extent we believe that it is more likely than not that a deferred tax asset will not be realized, a valuation allowance is established. The amount of a valuation allowance is based upon our best estimate of our ability to realize the net deferred tax assets. We have a valuation allowance of $552.5 million recorded for all of our U.S. deferred tax assets and a portion of our Icelandic deferred tax assets as of December 31,
2018
.
Property, Plant and Equipment Impairment
We review our property, plant and equipment for impairment whenever events or circumstances indicate that the carrying amount of these assets (asset group) may not be recoverable. The carrying amount of the assets (asset group) is not recoverable if it exceeds the sum of the undiscounted cash flows expected to result from the use and eventual disposition of the assets (asset group). In that case, an impairment loss would be recognized for the amount by which the carrying amount exceeds the fair value of the assets (asset group), with the fair value determined using a discounted cash flow calculation. These estimates of future cash flows include management’s assumptions about the expected use of the assets (asset group), the remaining useful life, expenditures to maintain the service potential, market and cost assumptions.
Determination as to whether and how much an asset is impaired involves significant management judgment involving highly uncertain matters, including estimating the future sales volumes, future selling prices and costs, alternative uses for the asset, and estimated proceeds from the disposal of the asset.
Other Contingencies
We are a defendant in several actions relating to various aspects of our business. While it is impossible to predict the ultimate disposition of any litigation, we do not believe that any of these lawsuits, either individually or in the aggregate, will have a material adverse effect on our financial condition, results of operations or liquidity. See
Note 15. Commitments and Contingencies
to the consolidated financial statements included herein for additional information.
Recently Issued Accounting Standards Updates
Information regarding recently issued accounting pronouncements is included in
Note 1. Summary of Significant Accounting Policies
to the consolidated financial statements included herein.
33
Contractual Obligations
In the normal course of business, we have entered into various contractual obligations that will be settled in cash. These obligations consist primarily of long-term debt obligations and purchase obligations. The expected future cash flows required to meet these obligations through the year 2028 are shown in the table below. More information is available about these contractual obligations in the notes to the consolidated financial statements included herein.
|
|
Payments Due by Period
|
||||||||||||||||||||||||||
|
Total
|
2019
|
2020
|
2021
|
2022
|
2023
|
Thereafter
|
|||||||||||||||||||||
|
(dollars in millions)
|
|||||||||||||||||||||||||||
|
Long-term debt
(1)
|
$
|
258
|
|
$
|
—
|
|
$
|
—
|
|
$
|
250
|
|
$
|
—
|
|
$
|
—
|
|
$
|
8
|
|
||||||
|
Estimated interest payments
(2)
|
47
|
|
19
|
|
19
|
|
8
|
|
—
|
|
—
|
|
1
|
|
|||||||||||||
|
Operating lease obligations
(3)
|
29
|
|
3
|
|
3
|
|
3
|
|
3
|
|
3
|
|
14
|
|
|||||||||||||
|
Purchase obligations
(4)
|
2,490
|
|
623
|
|
375
|
|
324
|
|
328
|
|
332
|
|
508
|
|
|||||||||||||
|
Other long-term liabilities
(5)
|
19
|
|
2
|
|
10
|
|
3
|
|
2
|
|
2
|
|
—
|
|
|||||||||||||
|
Total
|
$
|
2,843
|
|
$
|
647
|
|
$
|
407
|
|
$
|
588
|
|
$
|
333
|
|
$
|
337
|
|
$
|
531
|
|
||||||
|
(1)
|
Long-term debt includes principal repayments on our 2021 Notes and the IRB. Payments are based on the assumption that all outstanding debt instruments will remain outstanding until their respective due dates. For our contingent obligation, based on the LME forward market prices for primary aluminum at December 31, 2018 and management's estimate of the LME forward market for periods beyond the quoted periods, we have assessed that we will not have any payment obligations through the term of the agreement, which expires in 2028.
|
|
(2)
|
Estimated interest payments on our long-term debt assume that all outstanding debt instruments will remain outstanding until their respective due dates. Our estimated future interest payments for any debt with a variable rate are based on the assumption that the
December 31, 2018
rate for that debt continues until the respective due date. We assume that no interest payments on the contingent obligation will be paid through the term of agreement, see above.
|
|
(3)
|
Operating leases include long-term leases for land, productive facilities and office space.
|
|
(4)
|
Purchase obligations include long-term alumina and power contracts, excluding market-based power and raw material requirements contracts. For contracts with LME-based pricing provisions, including our long-term Icelandic power contracts, we assumed a LME price using the LME forward curve as of
December 31, 2018
.
|
|
(5)
|
Other long-term liabilities include asset retirement obligations. Asset retirement obligations are primarily estimated disposal costs for spent potliner used in the reduction cells of our domestic smelters.
|
Material Commitments
We also have outstanding commitments related to pension, supplemental executive retirement benefit ("SERB") plans, OPEB and workers' compensation obligations. As of
December 31, 2018
, estimated future payments related to these obligations through the year 2028 amount to approximately $205 million, $17 million, $75 million and $10 million, respectively.
Item 7A. Quantitative and Qualitative Disclosures about Market Risk
Commodity Price and Raw Material Costs Sensitivities
Aluminum is an internationally traded commodity, and its price is effectively determined on the LME plus any regional premium (e.g. the Midwest premium for aluminum sold in the United States and the European Duty Paid premium for metal sold into Europe) and any product premiums. From time to time, we may manage our exposure to fluctuations in the LME price of primary aluminum and/or the regional premium through financial instruments designed to protect our downside price risk exposure. From time to time, we also enter into financial contracts to offset fixed price sales arrangements with certain of our customers (the "fixed for floating swaps").
We are also exposed to price risk for alumina which is one of the largest components of our cost of goods sold. Much of the alumina we purchase is priced based on a published alumina index. As a result, our cost structure is exposed to market fluctuations and price volatility. Because we sell our products based principally on the LME price for primary aluminum, regional premiums and value-added product premiums, we cannot directly pass on increased production costs to our customers. From time to time, we may manage our exposure to fluctuations in our alumina costs by purchasing certain of our alumina
34
requirements under supply contracts with prices tied to the same indices as our aluminum sales contracts (the LME price of primary aluminum).
Market-Based Power Price Sensitivity
Market-Based Electrical Power Agreements
Hawesville and Sebree have market-based electrical power agreements pursuant to which EDF and Kenergy purchase electrical power on the open market and pass it through at MISO energy pricing, plus transmission and other costs incurred by them. Seventy-five percent (75%) of Mt. Holly's electric power requirement were supplied at rates based on natural gas prices. See
Item 1. Business - Key Production Costs - Electrical Power Supply Agreements
for additional information about these market-based power agreements.
Power is supplied to Grundartangi from hydroelectric and geothermal sources under long-term power purchase agreements. These power purchase agreements, which will expire on various dates from 2023 through 2036 (subject to extension), primarily provide power at LME-based variable rates. However, Grundartangi has agreed to pay for thirty percent (30%) of its power from November 1, 2019 through December 31, 2023 at prices linked to the price for power in the Nord Pool power market. From time to time, we may manage our exposure to fluctuations in the market price of power through financial instruments designed to protect our downside risk exposure.
Electrical Power Price Sensitivity
With the movement toward market-based power supply agreements, we have increased our electrical power price risk for our operations, whether due to fluctuations in the price of power available on the MISO or Nord Pool power markets or the price of natural gas. Power represents one of our largest operating costs, so changes in the price and/or availability of market power could significantly impact the profitability and viability of our operations. Transmission line outages, problems with grid stability or limitations on energy import capability could also increase power prices, disrupt production through pot instability or force a curtailment of all or part of the production at these facilities. In addition, indirect factors that lead to power cost increases, such as any increasing prices for natural gas or coal, fluctuations in or extremes in weather patterns or new or more stringent environmental regulations may severely impact our financial condition, results of operations and liquidity.
The consumption shown in the table below is at normal capacity levels and does not reflect partial production curtailments.
|
Electrical power price sensitivity by location:
|
|||||||||||||||||||
|
Hawesville
|
Sebree
|
Mt. Holly
|
Grundartangi
|
Total
|
|||||||||||||||
|
Expected average load (in megawatts ("MW"))
|
482
|
|
385
|
|
400
|
|
537
|
|
1,804
|
|
|||||||||
|
Annual expected electrical power usage (in megawatt hours ("MWh"))
|
4,222,320
|
|
3,372,600
|
|
3,504,000
|
|
4,704,120
|
|
15,803,040
|
|
|||||||||
|
Annual cost impact of an increase or decrease of $1 per MWh (in millions)
|
$
|
4.2
|
|
$
|
3.4
|
|
$
|
3.5
|
|
$
|
4.7
|
|
$
|
15.8
|
|
||||
Foreign Currency
We are exposed to foreign currency risk due to fluctuations in the value of the U.S. dollar as compared to the Iceland krona ("ISK"), the euro, the Chinese renminbi and other currencies. Grundartangi’s labor costs, part of its maintenance costs and other local services are denominated in ISK and a portion of its anode costs are denominated in euros and Chinese renminbi. We also have deposits denominated in ISK in Icelandic banks, and our estimated payments of Icelandic income taxes and any associated refunds are denominated in ISK. Further, Vlissingen's labor costs, maintenance costs and other local services are denominated in euros and our existing Nord Pool power price swaps described above are settled in euros. As a result, an increase or decrease in the value of those currencies relative to the U.S. dollar would affect Grundartangi’s operating margins.
We may manage our exposure by entering into foreign currency forward contracts or option contracts for forecasted transactions and projected cash flows for foreign currencies in future periods. In 2018, we entered into financial contracts to hedge the risk of fluctuations associated with the euro under our power price swaps described above (the "FX swaps").
35
Natural Economic Hedges
Any analysis of our exposure to the commodity price of aluminum should consider the impact of natural hedges provided by certain contracts that contain pricing indexed to the LME price for primary aluminum. In
2018
, a substantial portion of Grundartangi’s electrical power requirements were indexed to the LME price for primary aluminum and provide a natural hedge for a portion of our production.
Risk Management
Any metals, power, natural gas and foreign currency risk management activities are subject to the control and direction of senior management within guidelines established by Century’s Board of Directors. These activities are regularly reported to Century’s Board of Directors.
Fair Values and Sensitivity Analysis
The following tables present the fair value of our derivative asset and liabilities as of year end 2018 and 2017 and the effect on the fair value of a hypothetical ten percent (10%) adverse change in the market prices in effect at December 31, 2018 and 2017. Our risk management activities do not include any trading or speculative transactions.
|
|
Asset Fair Value
|
Fair Value with 10% Adverse Price Change
|
|||||||||||
|
2018
|
2017
|
2018
|
2017
|
||||||||||
|
Commodity contracts
(1)
|
$
|
8.2
|
|
$
|
1.7
|
|
$
|
(1.1
|
)
|
$
|
(1.3
|
)
|
|
|
Foreign exchange contracts
(2)
|
—
|
|
—
|
|
—
|
|
—
|
|
|||||
|
Total
|
$
|
8.2
|
|
$
|
1.7
|
|
$
|
(1.1
|
)
|
$
|
(1.3
|
)
|
|
|
|
Liability Fair Value
|
Liability Fair Value with 10% Adverse Price Change
|
|||||||||||
|
2018
|
2017
|
2018
|
2017
|
||||||||||
|
Commodity contracts
(1)
|
$
|
2.2
|
|
$
|
1.2
|
|
$
|
5.4
|
|
$
|
1.8
|
|
|
|
Foreign exchange contracts
(2)
|
0.3
|
|
—
|
|
1.6
|
|
—
|
|
|||||
|
Total
|
$
|
2.5
|
|
$
|
1.2
|
|
$
|
7.0
|
|
$
|
1.8
|
|
|
(1)
Commodity contracts reflect our outstanding "LME forward financial sales contracts," "MWP forward financial sales contracts," "fixed for floating swaps," and "power price swaps."
(2)
Foreign exchange contracts reflect our outstanding "FX swaps."
36
Item 8. Financial Statements and Supplementary Data
INDEX TO FINANCIAL STATEMENTS
|
|
Page
|
|
|
|
|
Reports of Independent Registered Public Accounting Firm
|
|
|
Consolidated Statements of Operations for the Years Ended December 31, 2018, 2017 and 2016
|
|
|
Consolidated Statements of Comprehensive Income (Loss) for the Years Ended December 31, 2018, 2017 and 2016
|
|
|
Consolidated Balance Sheets at December 31, 2018 and 2017
|
|
|
Consolidated Statements of Shareholders’ Equity for the Years Ended December 31, 2018, 2017 and 2016
|
|
|
Consolidated Statements of Cash Flows for the Years Ended December 31, 2018, 2017 and 2016
|
|
|
Notes to the Consolidated Financial Statements
|
|
37
REPORT OF INDEPENDENT REGISTERED PUBLIC ACCOUNTING FIRM
To the shareholders and the Board of Directors of Century Aluminum Company
Opinion on the Financial Statements
We have audited the accompanying consolidated balance sheets of Century Aluminum Company and subsidiaries (the "Company") as of December 31, 2018 and 2017, the related consolidated statements of operations, comprehensive income (loss), shareholders' equity, and cash flows, for each of the three years in the period ended December 31, 2018, and the related notes (collectively referred to as the "financial statements"). In our opinion, the financial statements present fairly, in all material respects, the financial position of the Company as of December 31, 2018 and 2017, and the results of its operations and its cash flows for each of the three years in the period ended December 31, 2018, in conformity with accounting principles generally accepted in the United States of America.
We have also audited, in accordance with the standards of the Public Company Accounting Oversight Board (United States) (PCAOB), the Company's internal control over financial reporting as of December 31, 2018, based on criteria established in
Internal Control - Integrated Framework (2013)
issued by the Committee of Sponsoring Organizations of the Treadway Commission and our report dated February 28, 2019, expressed an unqualified opinion on the Company's internal control over financial reporting.
Basis for Opinion
These financial statements are the responsibility of the Company's management. Our responsibility is to express an opinion on the Company's financial statements based on our audits. We are a public accounting firm registered with the PCAOB and are required to be independent with respect to the Company in accordance with the U.S. federal securities laws and the applicable rules and regulations of the Securities and Exchange Commission and the PCAOB.
We conducted our audits in accordance with the standards of the PCAOB. Those standards require that we plan and perform the audit to obtain reasonable assurance about whether the financial statements are free of material misstatement, whether due to error or fraud. Our audits included performing procedures to assess the risks of material misstatement of the financial statements, whether due to error or fraud, and performing procedures that respond to those risks. Such procedures included examining, on a test basis, evidence regarding the amounts and disclosures in the financial statements. Our audits also included evaluating the accounting principles used and significant estimates made by management, as well as evaluating the overall presentation of the financial statements. We believe that our audits provide a reasonable basis for our opinion.
/s/ Deloitte & Touche LLP
Chicago, Illinois
February 28, 2019
We have served as the Company's auditor since 1992.
38
REPORT OF INDEPENDENT REGISTERED PUBLIC ACCOUNTING FIRM
To the shareholders and the Board of Directors of Century Aluminum Company
Opinion on Internal Control over Financial Reporting
We have audited the internal control over financial reporting of Century Aluminum Company and subsidiaries (the “Company”) as of December 31, 2018, based on criteria established in
Internal Control - Integrated Framework (2013)
issued by the Committee of Sponsoring Organizations of the Treadway Commission (COSO). In our opinion, the Company maintained, in all material respects, effective internal control over financial reporting as of December 31, 2018, based on criteria established in
Internal Control - Integrated Framework (2013)
issued by COSO.
We have also audited, in accordance with the standards of the Public Company Accounting Oversight Board (United States) (PCAOB), the consolidated financial statements as of and for the year ended December 31, 2018, of the Company and our report dated February 28, 2019, expressed an unqualified opinion on those financial statements.
Basis for Opinion
The Company’s management is responsible for maintaining effective internal control over financial reporting and for its assessment of the effectiveness of internal control over financial reporting, included in the accompanying management report on Internal Control over Financial Reporting. Our responsibility is to express an opinion on the Company’s internal control over financial reporting based on our audit. We are a public accounting firm registered with the PCAOB and are required to be independent with respect to the Company in accordance with the U.S. federal securities laws and the applicable rules and regulations of the Securities and Exchange Commission and the PCAOB.
We conducted our audit in accordance with the standards of the PCAOB. Those standards require that we plan and perform the audit to obtain reasonable assurance about whether effective internal control over financial reporting was maintained in all material respects. Our audit included obtaining an understanding of internal control over financial reporting, assessing the risk that a material weakness exists, testing and evaluating the design and operating effectiveness of internal control based on the assessed risk, and performing such other procedures as we considered necessary in the circumstances. We believe that our audit provides a reasonable basis for our opinion.
Definition and Limitations of Internal Control over Financial Reporting
A company’s internal control over financial reporting is a process designed to provide reasonable assurance regarding the reliability of financial reporting and the preparation of financial statements for external purposes in accordance with generally accepted accounting principles. A company’s internal control over financial reporting includes those policies and procedures that (1) pertain to the maintenance of records that, in reasonable detail, accurately and fairly reflect the transactions and dispositions of the assets of the company; (2) provide reasonable assurance that transactions are recorded as necessary to permit preparation of financial statements in accordance with generally accepted accounting principles, and that receipts and expenditures of the company are being made only in accordance with authorizations of management and directors of the company; and (3) provide reasonable assurance regarding prevention or timely detection of unauthorized acquisition, use, or disposition of the company’s assets that could have a material effect on the financial statements.
Because of its inherent limitations, internal control over financial reporting may not prevent or detect misstatements. Also, projections of any evaluation of effectiveness to future periods are subject to the risk that controls may become inadequate because of changes in conditions, or that the degree of compliance with the policies or procedures may deteriorate.
/s/ Deloitte & Touche LLP
Chicago, Illinois
February 28, 2019
39
|
CENTURY ALUMINUM COMPANY
|
|||||||||||
|
CONSOLIDATED STATEMENTS OF OPERATIONS
|
|||||||||||
|
(in millions, except per share amounts)
|
|||||||||||
|
|
Year Ended December 31,
|
||||||||||
|
|
2018
|
2017*
|
2016*
|
||||||||
|
NET SALES:
|
|
|
|
|
|||||||
|
Related parties
|
$
|
1,204.5
|
|
$
|
1,198.1
|
|
$
|
1,178.6
|
|
||
|
Other customers
|
688.7
|
|
391.0
|
|
140.5
|
|
|||||
|
Total net sales
|
1,893.2
|
|
1,589.1
|
|
1,319.1
|
|
|||||
|
Cost of goods sold
|
1,916.1
|
|
1,457.8
|
|
1,325.2
|
|
|||||
|
Gross profit (loss)
|
(22.9
|
)
|
131.3
|
|
(6.1
|
)
|
|||||
|
Selling, general and administrative expenses
|
40.2
|
|
44.8
|
|
38.9
|
|
|||||
|
Helguvik (gains) losses
|
(4.5
|
)
|
(7.3
|
)
|
152.2
|
|
|||||
|
Ravenswood (gains) losses
|
—
|
|
(5.5
|
)
|
26.8
|
|
|||||
|
Other operating expense - net
|
0.4
|
|
2.1
|
|
3.9
|
|
|||||
|
Operating income (loss)
|
(59.0
|
)
|
97.2
|
|
(227.9
|
)
|
|||||
|
Interest expense
|
(22.4
|
)
|
(22.2
|
)
|
(22.2
|
)
|
|||||
|
Interest income
|
1.5
|
|
1.4
|
|
0.8
|
|
|||||
|
Net gain (loss) on forward and derivative contracts
|
6.3
|
|
(16.5
|
)
|
3.5
|
|
|||||
|
Other income (expense) - net
|
3.0
|
|
(4.5
|
)
|
(5.1
|
)
|
|||||
|
Income (loss) before income taxes and equity in earnings of joint ventures
|
(70.6
|
)
|
55.4
|
|
(250.9
|
)
|
|||||
|
Income tax benefit (expense)
|
0.2
|
|
(7.6
|
)
|
(2.8
|
)
|
|||||
|
Income (loss) before equity in earnings of joint ventures
|
(70.4
|
)
|
47.8
|
|
(253.7
|
)
|
|||||
|
Equity in earnings of joint ventures
|
4.2
|
|
0.8
|
|
1.3
|
|
|||||
|
Net income (loss)
|
$
|
(66.2
|
)
|
$
|
48.6
|
|
$
|
(252.4
|
)
|
||
|
INCOME (LOSS) PER COMMON SHARE:
|
|
|
|
|
|
|
|||||
|
Basic
|
$
|
(0.76
|
)
|
$
|
0.51
|
|
$
|
(2.90
|
)
|
||
|
Diluted
|
$
|
(0.76
|
)
|
$
|
0.51
|
|
$
|
(2.90
|
)
|
||
* As adjusted due to the adoption of ASU 2017-07 Compensation - Retirement Benefits (Topic 715): Improving the Presentation of Net Periodic Pension Cost and Net Periodic Postretirement Benefit Cost
See notes to consolidated financial statements.
40
|
CENTURY ALUMINUM COMPANY
|
|||||||||||
|
CONSOLIDATED STATEMENTS OF COMPREHENSIVE INCOME (LOSS)
|
|||||||||||
|
(in millions)
|
|||||||||||
|
|
Year Ended December 31,
|
||||||||||
|
|
2018
|
2017
|
2016
|
||||||||
|
Comprehensive income (loss):
|
|
|
|||||||||
|
Net income (loss)
|
$
|
(66.2
|
)
|
$
|
48.6
|
|
$
|
(252.4
|
)
|
||
|
Other comprehensive income (loss) before income tax effect:
|
|||||||||||
|
Net income (loss) on foreign currency cash flow hedges reclassified as income
|
(0.2
|
)
|
(0.2
|
)
|
4.3
|
|
|||||
|
Defined benefit plans and other postretirement benefits:
|
|||||||||||
|
Net gain (loss) arising during the period
|
(6.8
|
)
|
(7.2
|
)
|
(9.5
|
)
|
|||||
|
Prior service benefit (cost) arising during the period
|
(0.6
|
)
|
27.4
|
|
—
|
|
|||||
|
Amortization of prior service benefit (cost) during the period
|
(7.1
|
)
|
(4.9
|
)
|
(2.7
|
)
|
|||||
|
Amortization of net gain (loss) during the period
|
9.2
|
|
8.6
|
|
8.2
|
|
|||||
|
Other comprehensive income (loss) before income tax effect
|
(5.5
|
)
|
23.7
|
|
0.3
|
|
|||||
|
Income tax effect
|
(1.5
|
)
|
(1.5
|
)
|
(1.5
|
)
|
|||||
|
Other comprehensive income (loss)
|
(7.0
|
)
|
22.2
|
|
(1.2
|
)
|
|||||
|
Total comprehensive income (loss)
|
$
|
(73.2
|
)
|
$
|
70.8
|
|
$
|
(253.6
|
)
|
||
See notes to consolidated financial statements.
41
|
CENTURY ALUMINUM COMPANY
|
|||||||
|
CONSOLIDATED BALANCE SHEETS
|
|||||||
|
(in millions)
|
|||||||
|
December 31,
|
|||||||
|
2018
|
2017
|
||||||
|
ASSETS
|
|
||||||
|
Cash and cash equivalents
|
$
|
38.9
|
|
$
|
167.2
|
|
|
|
Restricted cash
|
0.8
|
|
0.8
|
|
|||
|
Accounts receivable - net
|
82.5
|
|
43.1
|
|
|||
|
Due from affiliates
|
22.7
|
|
10.4
|
|
|||
|
Inventories
|
343.8
|
|
317.5
|
|
|||
|
Prepaid and other current assets
|
18.0
|
|
14.7
|
|
|||
|
Total current assets
|
506.7
|
|
553.7
|
|
|||
|
Property, plant and equipment - net
|
967.3
|
|
971.9
|
|
|||
|
Other assets
|
63.5
|
|
56.0
|
|
|||
|
TOTAL
|
$
|
1,537.5
|
|
$
|
1,581.6
|
|
|
|
LIABILITIES AND SHAREHOLDERS’ EQUITY
|
|||||||
|
LIABILITIES:
|
|
|
|||||
|
Accounts payable, trade
|
$
|
119.4
|
|
$
|
89.9
|
|
|
|
Due to affiliates
|
10.3
|
|
20.4
|
|
|||
|
Accrued and other current liabilities
|
52.5
|
|
61.4
|
|
|||
|
Accrued employee benefits costs
|
11.0
|
|
11.0
|
|
|||
|
Revolving credit facility
|
23.3
|
|
—
|
|
|||
|
Industrial revenue bonds
|
7.8
|
|
7.8
|
|
|||
|
Total current liabilities
|
224.3
|
|
190.5
|
|
|||
|
Senior notes payable
|
248.6
|
|
248.2
|
|
|||
|
Accrued pension benefits costs - less current portion
|
50.9
|
|
38.9
|
|
|||
|
Accrued postretirement benefits costs - less current portion
|
101.2
|
|
113.0
|
|
|||
|
Other liabilities
|
46.0
|
|
57.9
|
|
|||
|
Deferred taxes
|
104.3
|
|
103.5
|
|
|||
|
Total noncurrent liabilities
|
551.0
|
|
561.5
|
|
|||
|
COMMITMENTS AND CONTINGENCIES (NOTE 15)
|
—
|
|
—
|
|
|||
|
SHAREHOLDERS’ EQUITY:
|
|
|
|||||
|
Preferred stock (Note 7)
|
0.0
|
|
0.0
|
|
|||
|
Common stock (Note 7)
|
1.0
|
|
0.9
|
|
|||
|
Additional paid-in capital
|
2,523.0
|
|
2,517.4
|
|
|||
|
Treasury stock, at cost
|
(86.3
|
)
|
(86.3
|
)
|
|||
|
Accumulated other comprehensive loss
|
(98.7
|
)
|
(91.7
|
)
|
|||
|
Accumulated deficit
|
(1,576.8
|
)
|
(1,510.7
|
)
|
|||
|
Total shareholders’ equity
|
762.2
|
|
829.6
|
|
|||
|
TOTAL
|
$
|
1,537.5
|
|
$
|
1,581.6
|
|
|
See notes to consolidated financial statements.
42
|
CENTURY ALUMINUM COMPANY
|
||||||||||||||||||||||||||||
|
CONSOLIDATED STATEMENTS OF SHAREHOLDERS’ EQUITY
|
||||||||||||||||||||||||||||
|
(in millions)
|
||||||||||||||||||||||||||||
|
|
Preferred stock
|
Common stock
|
Additional paid-in capital
|
Treasury stock, at cost
|
Accumulated other comprehensive loss
|
Accumulated
deficit
|
Total shareholders’ equity
|
|||||||||||||||||||||
|
Balance, December 31, 2015
|
$
|
0.0
|
|
$
|
0.9
|
|
$
|
2,513.6
|
|
$
|
(86.3
|
)
|
$
|
(112.7
|
)
|
$
|
(1,306.8
|
)
|
$
|
1,008.8
|
|
|||||||
|
Net loss – 2016
|
—
|
|
—
|
|
—
|
|
—
|
|
—
|
|
(252.4
|
)
|
(252.4
|
)
|
||||||||||||||
|
Other comprehensive loss
|
—
|
|
—
|
|
—
|
|
—
|
|
(1.2
|
)
|
—
|
|
(1.2
|
)
|
||||||||||||||
|
Share-based compensation
|
—
|
|
—
|
|
1.5
|
|
—
|
|
—
|
|
—
|
|
1.5
|
|
||||||||||||||
|
Conversion of preferred stock to common stock
|
—
|
|
0.0
|
|
(0.0)
|
|
—
|
|
—
|
|
—
|
|
—
|
|
||||||||||||||
|
Balance, December 31, 2016
|
$
|
0.0
|
|
$
|
0.9
|
|
$
|
2,515.1
|
|
$
|
(86.3
|
)
|
$
|
(113.9
|
)
|
$
|
(1,559.3
|
)
|
$
|
756.7
|
|
|||||||
|
Net income – 2017
|
—
|
|
—
|
|
—
|
|
—
|
|
—
|
|
48.6
|
|
48.6
|
|
||||||||||||||
|
Other comprehensive income
|
—
|
|
—
|
|
—
|
|
—
|
|
22.2
|
|
—
|
|
22.2
|
|
||||||||||||||
|
Share-based compensation
|
—
|
|
0.0
|
|
2.3
|
|
—
|
|
—
|
|
—
|
|
2.3
|
|
||||||||||||||
|
Conversion of preferred stock to common stock
|
—
|
|
0.0
|
|
(0.0)
|
|
—
|
|
—
|
|
—
|
|
—
|
|
||||||||||||||
|
Balance, December 31, 2017
|
$
|
0.0
|
|
$
|
0.9
|
|
$
|
2,517.4
|
|
$
|
(86.3
|
)
|
$
|
(91.7
|
)
|
$
|
(1,510.7
|
)
|
$
|
829.6
|
|
|||||||
|
Net loss – 2018
|
—
|
|
—
|
|
—
|
|
—
|
|
—
|
|
(66.2
|
)
|
(66.2
|
)
|
||||||||||||||
|
Other comprehensive loss
|
—
|
|
—
|
|
—
|
|
—
|
|
(7.0
|
)
|
—
|
|
(7.0
|
)
|
||||||||||||||
|
Share-based compensation
|
—
|
|
0.1
|
|
5.6
|
|
—
|
|
—
|
|
—
|
|
5.7
|
|
||||||||||||||
|
Conversion of preferred stock to common stock
|
—
|
|
0.0
|
|
(0.0)
|
|
—
|
|
—
|
|
—
|
|
—
|
|
||||||||||||||
|
Balance, December 31, 2018
|
$
|
0.0
|
|
$
|
1.0
|
|
$
|
2,523.0
|
|
$
|
(86.3
|
)
|
$
|
(98.7
|
)
|
$
|
(1,576.8
|
)
|
$
|
762.2
|
|
|||||||
See notes to consolidated financial statements.
43
|
CENTURY ALUMINUM COMPANY
|
|||||||||||
|
CONSOLIDATED STATEMENTS OF CASH FLOWS
|
|||||||||||
|
(in millions)
|
|||||||||||
|
|
Year Ended December 31,
|
||||||||||
|
|
2018
|
2017*
|
2016*
|
||||||||
|
CASH FLOWS FROM OPERATING ACTIVITIES:
|
|
|
|
|
|
||||||
|
Net income (loss)
|
$
|
(66.2
|
)
|
$
|
48.6
|
|
$
|
(252.4
|
)
|
||
|
Adjustments to reconcile net income (loss) to net cash provided by (used in) operating activities:
|
|||||||||||
|
Lower of cost or NRV inventory adjustment
|
36.5
|
|
(1.1
|
)
|
(0.7
|
)
|
|||||
|
Unrealized (gains) on forward and derivative contracts
|
(6.5
|
)
|
—
|
|
—
|
|
|||||
|
Depreciation and amortization
|
90.1
|
|
84.2
|
|
84.8
|
|
|||||
|
Helguvik (gains) losses
|
(4.5
|
)
|
(7.3
|
)
|
152.2
|
|
|||||
|
Ravenswood (gains) losses
|
—
|
|
(5.5
|
)
|
3.8
|
|
|||||
|
Other non-cash items - net
|
(13.2
|
)
|
(6.7
|
)
|
1.8
|
|
|||||
|
Change in operating assets and liabilities:
|
|||||||||||
|
Accounts receivable - net
|
(39.4
|
)
|
(30.6
|
)
|
(3.0
|
)
|
|||||
|
Due from affiliates
|
(12.4
|
)
|
6.3
|
|
0.8
|
|
|||||
|
Inventories
|
(62.8
|
)
|
(67.5
|
)
|
0.9
|
|
|||||
|
Prepaid and other current assets
|
(0.9
|
)
|
7.8
|
|
18.3
|
|
|||||
|
Accounts payable, trade
|
30.5
|
|
4.7
|
|
2.3
|
|
|||||
|
Due to affiliates
|
(10.1
|
)
|
4.8
|
|
7.2
|
|
|||||
|
Accrued and other current liabilities
|
(11.1
|
)
|
14.5
|
|
(3.9
|
)
|
|||||
|
Ravenswood retiree legal settlement
|
(2.0
|
)
|
(5.0
|
)
|
23.0
|
|
|||||
|
Other - net
|
2.9
|
|
4.3
|
|
3.1
|
|
|||||
|
Net cash provided by (used in) operating activities
|
(69.1
|
)
|
51.5
|
|
38.2
|
|
|||||
|
CASH FLOWS FROM INVESTING ACTIVITIES:
|
|
|
|
|
|
|
|||||
|
Purchase of property, plant and equipment
|
(83.0
|
)
|
(31.8
|
)
|
(21.9
|
)
|
|||||
|
Proceeds from sale of property, plant and equipment
|
0.1
|
|
14.4
|
|
1.0
|
|
|||||
|
Net cash (used in) investing activities
|
(82.9
|
)
|
(17.4
|
)
|
(20.9
|
)
|
|||||
|
CASH FLOWS FROM FINANCING ACTIVITIES:
|
|||||||||||
|
Borrowings under revolving credit facilities
|
120.1
|
|
1.3
|
|
1.2
|
|
|||||
|
Repayments under revolving credit facilities
|
(96.8
|
)
|
(1.3
|
)
|
(1.2
|
)
|
|||||
|
Issuance of common stock
|
0.4
|
|
0.4
|
|
—
|
|
|||||
|
Net cash provided by financing activities
|
23.7
|
|
0.4
|
|
—
|
|
|||||
|
CHANGE IN CASH, CASH EQUIVALENTS, AND RESTRICTED CASH
|
(128.3
|
)
|
34.5
|
|
17.3
|
|
|||||
|
Cash, cash equivalents and restricted cash, beginning of year
|
168.0
|
|
133.5
|
|
116.2
|
|
|||||
|
Cash, cash equivalents and restricted cash, end of year
|
$
|
39.7
|
|
$
|
168.0
|
|
$
|
133.5
|
|
||
|
Supplemental Cash Flow Information:
|
|||||||||||
|
Cash paid for:
|
|||||||||||
|
Interest
|
$
|
19.7
|
|
$
|
19.5
|
|
$
|
19.5
|
|
||
|
Taxes
|
13.1
|
|
5.6
|
|
13.9
|
|
|||||
|
Non-cash investing activities:
|
|||||||||||
|
Capital expenditures
|
8.0
|
|
0.6
|
|
3.0
|
|
|||||
* As adjusted due to the adoption of ASU 2016-18 "Statement of Cash Flows (Topic 230) Restricted Cash."
See notes to consolidated financial statements
.
44
CENTURY ALUMINUM COMPANY
NOTES TO THE CONSOLIDATED FINANCIAL STATEMENTS
(amounts in millions, except share and per share amounts
)
1. Summary of Significant Accounting Policies
Organization —
Century Aluminum Company ("Century Aluminum," "Century," the "Company", "we", "us", "our" or "ours") is a holding company, whose principal subsidiaries are Century Kentucky, Inc. (together with its subsidiaries, "CAKY"), Nordural ehf ("Nordural"), Century Aluminum Sebree LLC ("Century Sebree") and Century Aluminum of South Carolina ("CASC"). CAKY operates a primary aluminum reduction facility in Hawesville, Kentucky ("Hawesville"). Nordural Grundartangi ehf, a subsidiary of Nordural, operates a primary aluminum reduction facility in Grundartangi, Iceland ("Grundartangi"). Century Sebree operates a primary aluminum reduction facility in Robards, Kentucky ("Sebree"). CASC operates a primary aluminum reduction facility in Goose Creek, South Carolina ("Mt. Holly"). Nordural Helguvik ehf, a subsidiary of Nordural, owns a greenfield primary aluminum project in Helguvik, Iceland ("Helguvik" or the "Helguvik project"), construction of which is currently curtailed.
In addition to our primary aluminum assets, our subsidiary, Century Vlissingen, owns and operates a carbon anode production facility located in Vlissingen, the Netherlands ("Vlissingen"). We also own a
40%
stake in Baise Haohai Carbon Co., Ltd. ("BHH"), a joint venture that owns and operates a carbon anode and cathode facility located in the Guangxi Zhuang Autonomous Region of south China. Carbon anodes are used in the production of primary aluminum and both BHH and Vlissingen currently supply carbon anodes to Grundartangi.
As of December 31, 2018
, Glencore owns
42.9%
of Century’s outstanding common stock (
47.2%
on a fully-diluted basis assuming the conversion of all of the Series A Convertible Preferred Stock) and all of our outstanding Series A Convertible Preferred stock. See
Note 7. Shareholders' Equity
for a full description of our outstanding Series A Convertible Preferred stock. From time to time Century and Glencore enter into various transactions for the purchase and sale of primary aluminum, purchase and sale of alumina, tolling agreements and certain forward financial contracts. See
Note 2. Related Party Transactions
.
Basis of Presentation —
The consolidated financial statements include the accounts of Century Aluminum Company and our subsidiaries, after elimination of all intercompany transactions and accounts. Our interest in the BHH joint venture is accounted for under the equity method on a one-quarter lag.
The consolidated financial statements are prepared in accordance with generally accepted accounting principles in the United States ("U.S. GAAP"). The preparation of financial statements in conformity with U.S. GAAP requires management to make estimates and assumptions that affect the reported amounts of assets and liabilities and disclosures of contingent assets and liabilities at the date of the financial statements and the reported amounts of revenues and expenses during the reporting period. Actual results could differ from those estimates.
Revenue recognition —
See
Note 3. Revenue
.
Cash and Cash Equivalents —
Cash and cash equivalents are comprised of cash, money market funds and short-term investments having original maturities of three months or less. The carrying amount of cash equivalents approximates fair value.
Accounts Receivable and Due from Affiliates —
These amounts are net of an allowance for uncollectible accounts and credit memos of $
1.0
at December 31,
2018
and
2017
.
Inventories —
Our inventories are stated at the lower of cost or net realizable value, using the first-in, first-out ("FIFO") and the weighted average cost method. Due to the nature of our business, our inventory values are subject to market price changes and these changes can have a significant impact on cost of goods sold and gross profit in any period. Reductions in net realizable value below cost basis at the end of a period will have an impact on our cost of goods sold as this inventory is sold in subsequent periods.
45
CENTURY ALUMINUM COMPANY
NOTES TO THE CONSOLIDATED FINANCIAL STATEMENTS
(amounts in millions, except share and per share amounts)
Property, Plant and Equipment
— Property, plant and equipment is stated at cost. Additions and improvements are capitalized. Asset and accumulated depreciation accounts are relieved for dispositions with resulting gains or losses included in
Other income (expense) – net
. Maintenance and repairs are expensed as incurred. Depreciation of plant and equipment is provided for by the straight-line method over the following estimated useful lives:
Building and improvements
10
to
45
years
Machinery and equipment
5
to
35
years
Technology and software
3
to
7
years
During 2018, we began restarting the curtailed capacity at our Hawesville facility, which may ultimately involve rebuilding all five potlines. The nature, size and scope of this effort represents a discrete construction project. All associated costs that meet the capitalization criteria will be capitalized as a component of property, plant and equipment.
Impairment of long-lived assets —
We evaluate our property, plant and equipment for potential impairment whenever events or circumstances indicate that the carrying amount of these assets may not be recoverable. If deemed unrecoverable, an impairment loss would be recognized for the amount by which the carrying amount exceeds the fair value of the assets. Impairment evaluation and fair value is based on estimates and assumptions that take into account our business plans and a long-term investment horizon. See
Note 4. Helguvik and Ravenswood Gains and (Losses)
for impairment losses recognized in 2016.
Income Taxes —
We account for income taxes using the asset and liability method, whereby deferred income taxes reflect the net tax effect of temporary differences between the carrying amounts of assets and liabilities for financial reporting purposes and the amounts used for income tax purposes. In evaluating our ability to realize deferred tax assets, we use judgment to determine if it is more likely than not that some portion or all of a deferred tax asset will not be realized, and if a corresponding valuation allowance is required.
Defined Benefit Pension and Other Postretirement Benefits —
We sponsor defined benefit pension and OPEB plans for certain of our domestic hourly and salaried employees and a supplemental executive retirement benefit plan for certain current and former executive officers. Plan assets and obligations are measured annually or more frequently if there is a re-measurement event, based on the Company’s measurement date utilizing various actuarial assumptions. We attribute the service costs for the plans over the working lives of plan participants. The effects of actual results differing from our assumptions and the effects of changing assumptions are considered actuarial gains or losses. Actuarial gains or losses are recorded in Accumulated Other Comprehensive Income (Loss).
We contribute to our defined benefit pension plans based upon actuarial and economic assumptions designed to achieve adequate funding of the projected benefit obligations and to meet the minimum funding requirements.
Postemployment Benefits —
We provide certain postemployment benefits to certain former and inactive employees and their dependents during the period following employment, but before retirement. These benefits include salary continuance, supplemental unemployment and disability healthcare. We recognize the estimated future cost of providing postemployment benefits on an accrual basis over the active service life of the employee.
Derivative and Hedging —
As a global producer of primary aluminum, our operating results and cash flows from operations are subject to risk of fluctuations in the market prices of primary aluminum. We may from time to time enter into financial contracts to manage our exposure to such risk. Derivative instruments may consist of variable to fixed financial contracts and back-to-back fixed to floating arrangements for a portion of our sale of primary aluminum, where we receive fixed and pay floating prices from our customers and to counterparties, respectively. These derivatives are not designated as cash flow hedges.
Derivative and hedging instruments are recorded in prepaid and other current assets, other assets, accrued and other current liabilities and other long term liabilities in the consolidated balance sheets at fair value. We value our derivative and hedging instruments using quoted market prices and other significant unobservable inputs.
We recognize changes in fair value and settlements of derivative instruments in net gain (loss) on forward and derivative contracts in the consolidated statements of operations as they occur.
Foreign Currency –
We are exposed to foreign currency risk due to fluctuations in the value of the U.S. dollar as compared to the euro, the Icelandic krona ("ISK") and the Chinese renminbi. Grundartangi and Vlissingen use the U.S. dollar as their functional currency, as contracts for sales and purchases of alumina and power are denominated in U.S. dollar. BHH
46
CENTURY ALUMINUM COMPANY
NOTES TO THE CONSOLIDATED FINANCIAL STATEMENTS
(amounts in millions, except share and per share amounts)
uses the renminbi as its functional currency. Transactions denominated in currencies other than the functional currency are recorded based on exchange rates at the time such transactions arise and any transaction gains and losses are reflected in
Other income (expense) – net
in the consolidated statements of operations.
Financial Instruments —
Receivables, certain life insurance policies, payables, borrowings under revolving credit facilities and debt related to industrial revenue bonds ("IRBs") are carried at amounts that approximate fair value.
Earnings per share —
Basic earnings (loss) per share ("EPS") amounts are calculated by dividing earnings (loss) available to common stockholders by the weighted average number of common shares outstanding. Diluted EPS amounts assume the issuance of common stock for all potentially dilutive common shares outstanding. Because our capital structure consists of common stock and participating convertible preferred stock, we use the two-class method to calculate basic EPS, and incorporate the use of such method to determine diluted EPS.
Our Series A Convertible Preferred Stock is a non-cumulative perpetual participating convertible preferred stock with no set dividend preferences. In periods where we report net losses, we do not allocate these losses to the convertible preferred stock for the computation of basic or diluted EPS.
Asset Retirement Obligations —
We are subject to environmental regulations which create certain legal obligations related to the normal operations of our domestic primary aluminum smelter operations. Our asset retirement obligations ("AROs") consist primarily of costs associated with the disposal of spent potliner used in the reduction cells of our domestic facilities. AROs are recorded on a discounted basis at the time the obligation is incurred (when the potliner is put in service) and accreted over time for the change in the present value of the liability. We capitalize the asset retirement costs by increasing the carrying amount of the related long-lived assets and depreciating these assets over their remaining useful lives.
Certain conditional asset retirement obligations ("CAROs") relate to the remediation of our primary aluminum facilities for hazardous material, such as landfill materials and asbestos which have not been recorded because they have an indeterminate settlement date. CAROs are a legal obligation to perform an asset retirement activity in which the timing and (or) method of settlement are conditional on a future event that may or may not be within our control.
Concentrations of Credit Risk —
Financial instruments, which potentially expose us to concentrations of credit risk, consist principally of trade receivables. Our limited customer base increases our concentrations of credit risk with respect to trade receivables. We routinely assess the financial strength of our customers and collectability of our trade receivables.
Share-Based Compensation —
We measure the cost of employee services received in exchange for an award of equity instruments based on the fair value of the award on the grant date. We recognize the cost over the period during which an employee is required to provide service in exchange for the award. We issue shares to satisfy the requirements of our share-based compensation plans. At this time, we do not plan to issue treasury shares to support our share-based compensation plans, but we may in the future. We award performance units to certain officers and employees. The performance units may be settled in cash or common stock at the discretion of the Board. We have not issued any stock options since 2009.
Recently Issued Accounting Standards
In March 2017, the Financial Accounting Standards Board (“FASB”) issued Accounting Standards Update (“ASU”) 2017-07 Compensation - Retirement Benefits (Topic 715): Improving the Presentation of Net Periodic Pension Cost and Net Periodic Postretirement Benefit Cost (“ASU 2017-07”) which requires an entity to report the service cost component of pension cost and postretirement benefit cost as compensation expense during the employee's service period. The other components of net periodic pension benefit costs and post retirement benefit costs will be presented outside a subtotal of income from operations.
Prior to the adoption of ASU 2017-07, pension and OPEB costs were reported as cost of goods sold and selling, general and administrative expenses on the Company's consolidated statements of operations. The Company adopted ASU 2017-07 during 2018, which resulted in the retrospective reclassification of
$3.3
million and
$6.2
million from operating income (loss) to other income (expense) - net on the consolidated statements of operations for the years ended December 31, 2017 and 2016, respectively.
In November 2016, the FASB issued ASU 2016-18 "Statement of Cash Flows (Topic 230) Restricted Cash." The Company adopted ASU 2016-18 during 2018. The adoption of this standard did not have a material impact on the Company's consolidated financial statements.
47
CENTURY ALUMINUM COMPANY
NOTES TO THE CONSOLIDATED FINANCIAL STATEMENTS
(amounts in millions, except share and per share amounts)
In February 2016, the FASB” issued ASU 2016-02, “Leases (Topic 842)” which supersedes the existing guidance on accounting for leases in “Leases (Topic 840)”. The objective of ASU 2016-02 is to provide enhanced transparency and comparability among organizations by, among other things, recognizing right-of-use assets and lease liabilities on the balance sheet for all leases other than those that meet the definition of short-term leases and disclosing qualitative and quantitative information about lease arrangements. ASU 2016-02 is effective for Century beginning January 1, 2019 and will be adopted using a modified retrospective approach.
Through December 31, 2018, we have completed our review of our 2018 leases and contractual agreements that fall within the scope of ASU 2016-02. Based on our assessment completed to date, we expect the adoption of ASU 2016-02 will impact the balance sheet with the addition of right-to-use assets and corresponding lease liabilities in the range of
$20.0 million
to
$26.0 million
for the Company’s operating leases as defined under previous accounting guidance. We do not anticipate the adoption of this standard to have any impact on our cash flows. The Company will elect the package of practical expedients on adoption, which will retain the lease identification, classification and initial direct costs for leases that commenced prior to the adoption date. Additionally, the Company will elect the recognition exemption which allows the Company to not recognize lease assets and lease liabilities on the Consolidated Balance Sheet for leases with an initial term of 12 months or less and to not separate associated lease and non-lease components within a contract as permitted by the standards. In conjunction with the aforementioned implementation activities, we have continued enhancing our internal processes and controls to capture arrangements that are likely to be in scope of the standard upon and post adoption. We continue to monitor modifications, clarifications and interpretations undertaken by the FASB and the SEC and changes in our business and new arrangements, which may impact our current conclusions.
48
CENTURY ALUMINUM COMPANY
NOTES TO THE CONSOLIDATED FINANCIAL STATEMENTS
(amounts in millions, except share and per share amounts)
2. Related Party Transactions
The significant related party transactions occurring during the years ended December 31,
2018
,
2017
and
2016
are described below. We believe all of our transactions with Glencore and BHH were at prices that approximate market.
Glencore ownership
As of December 31, 2018
, Glencore plc and its affiliates (together "Glencore") beneficially owned
42.9%
of Century’s outstanding common stock (
47.2%
on a fully-diluted basis assuming the conversion of all of the Series A Convertible Preferred Stock) and all of our outstanding Series A Convertible Preferred stock. See
Note 7. Shareholders' Equity
for a full description of our outstanding Series A Convertible Preferred stock. From time to time Century and Glencore enter into various transactions for the purchase and sale of primary aluminum, purchase of alumina, tolling agreements and certain forward financial contracts.
Sales to Glencore
For the year ended
December 31, 2018
, we derived approximately
64%
of our consolidated sales from Glencore. Glencore purchases the aluminum we produce for resale.
Glencore purchases aluminum produced at our North American smelters at prices based on the LME plus the Midwest regional premium and any additional negotiated product premiums. Glencore purchases aluminum produced at our Grundartangi, Iceland smelter at prices based on the LME plus the European Duty Paid premium and any applicable product premiums.
In 2016, we were party to a tolling arrangement with Glencore that provided for delivery of primary aluminum produced at Grundartangi. We received tolling fees from Glencore under this tolling agreement based on the LME price for primary aluminum plus a portion of the European Duty Paid premium.
Purchases from Glencore
We purchase a portion of our alumina requirements from Glencore. Alumina purchases from Glencore during 2018 were priced based on a published alumina index.
Transactions with BHH
We own a
40%
stake in BHH and have an agreement to purchase carbon anodes from them for use in our manufacturing operations. We have begun a project to rebuild one of our baking furnaces at Vlissingen, which is expected to increase annual carbon anode production capacity by an additional
12,000
tonnes per year. The rebuilt baking furnace is expected to be operational before the end of 2019. We expect to meet the requirement of carbon anodes at Grundartangi through Vlissingen and BHH.
Summary
A summary of the aforementioned significant related party transactions for the years ended December 31,
2018
,
2017
and
2016
is as follows:
|
|
Year Ended December 31,
|
||||||||||
|
|
2018
|
2017
|
2016
|
||||||||
|
Net sales to Glencore
|
$
|
1,204.5
|
|
$
|
1,198.1
|
|
$
|
1,178.6
|
|
||
|
Purchases from Glencore
|
319.6
|
|
253.0
|
|
231.9
|
|
|||||
|
Purchases from BHH
|
28.4
|
|
15.8
|
|
10.1
|
|
|||||
49
CENTURY ALUMINUM COMPANY
NOTES TO THE CONSOLIDATED FINANCIAL STATEMENTS
(amounts in millions, except share and per share amounts)
3. Revenue
On January 1, 2018, we adopted ASC 606, “Revenue from Contracts with Customers” and the related amendments (“ASC 606”) to contracts not completed as of the adoption date using the modified retrospective method. Accordingly, the comparative information has not been restated and continues to be reported under the accounting standards in effect for those periods. The cumulative effect of initially applying this standard was zero. The adoption of ASC 606 did not result in a change to the amount or timing of our revenue recognition.
We disaggregate our revenue by geographical region as follows:
|
Year ended December 31,
|
||||||||||||
|
Net Sales
|
2018
|
2017
|
2016
|
|||||||||
|
United States
|
$
|
1,138.6
|
|
$
|
938.4
|
|
$
|
808.9
|
|
|||
|
Iceland
|
754.6
|
|
650.7
|
|
510.2
|
|
||||||
|
Total
|
$
|
1,893.2
|
|
$
|
1,589.1
|
|
$
|
1,319.1
|
|
|||
We enter into contracts to sell primary aluminum to our customers. Revenue is recognized when our performance obligations with our customer are satisfied. Our obligations under the contracts are satisfied when we transfer control of our primary aluminum to our customer which is generally upon shipment or delivery to customer directed locations. The amount of consideration we receive, thus the revenue we recognize, is a function of volume delivered, market price of primary aluminum, as determined on the LME, plus regional premiums and any value-added product premiums.
The payment terms and conditions in our contracts vary and are not significant to our revenue. We complete an appropriate credit evaluation for each customer at contract inception. Customer payments are due in arrears and are recognized as accounts receivable - net and due from affiliates in our consolidated balance sheets. Accounts receivable - net increased $
39.4 million
from December 31, 2017 to December 31, 2018, driven primarily by the increase in direct sales to end users with longer payment terms than our related party customer.
In connection with our sales agreement with Glencore, we invoice Glencore prior to physical shipment of goods for substantially all production generated from each of our U.S. domestic smelters. For those sales, revenue is recognized only when Glencore has specifically requested such treatment and has made a commitment to purchase the product. The goods must be complete, ready for shipment and separated from other inventory with control over the goods passing to Glencore. We must retain no further performance obligations.
50
CENTURY ALUMINUM COMPANY
NOTES TO THE CONSOLIDATED FINANCIAL STATEMENTS
(amounts in millions, except share and per share amounts)
4. Helguvik and Ravenswood Gains and (Losses)
Helguvik
In November 2016, the arbitration panel in the proceedings between Nordural Helguvik ehf and HS concluded that our agreement with HS was no longer in force. We determined that the lack of a power agreement for the entirety of the project requirements represented an indicator of impairment associated with the Helguvik project.
Our analysis of the project indicated the undiscounted cash flows did not exceed the carrying value of the Helguvik project. Discounted cash flows were utilized to reduce the carrying value of the Helguvik project to fair value. We considered future development plans for the project, the lack of a power agreement for the entirety of the project requirements and long-term forward prices of LME and European Duty Paid premium along with alumina and power costs. As a result, we recorded an impairment loss of
$152.2 million
representing the net book value of the Helguvik project as of December 31, 2016.
During 2018 and 2017, we extinguished our contractual commitments associated with the construction of the Helguvik project. Such extinguishment resulted in gains of
$4.5 million
and
$7.3 million
recognized in Helguvik (gains) losses in the consolidated statements of operations for the years ended December 31, 2018 and 2017, respectively.
Ravenswood
In July 2015, we announced the permanent closure of our Ravenswood, West Virginia aluminum smelter ("Ravenswood"). Ravenswood had been idled since February 2009. The decision to permanently close Ravenswood was based on the inability to secure a competitive power contract for the smelter, compounded by challenging aluminum market conditions largely driven by increased exports of aluminum from China.
In June 2015, we recorded an impairment charge of
$30.9 million
to write down the asset values related to Ravenswood. Based on an asset purchase agreement for the sale of assets entered into in 2016, we recorded an additional impairment charge of
$3.8 million
, included in Ravenswood (gains) losses in the consolidated statements of operations for the year ended December 31, 2016. In January 2017, we completed our sale of the Ravenswood facility for
$13.6 million
in net proceeds from the buyer.
5. Fair Value Measurements
We measure certain of our assets and liabilities at fair value. Fair value represents the price that would be received to sell an asset or paid to transfer a liability in an orderly transaction between market participants at the measurement date.
In general, reporting entities should apply valuation techniques to measure fair value that maximize the use of observable inputs and minimize the use of unobservable inputs. Observable inputs are developed using market data and reflect assumptions that market participants would use when pricing the asset or liability. Unobservable inputs are developed using the best information available about the assumptions that market participants would use when pricing the asset or liability.
The fair value hierarchy provides transparency regarding the inputs we use to measure fair value. We categorize each fair value measurement in its entirety into the following three levels, based on the lowest level input that is significant to the entire measurement:
|
•
|
Level 1 Inputs – quoted prices (unadjusted) in active markets for identical assets or liabilities that the reporting entity can access at the measurement date.
|
|
•
|
Level 2 Inputs – inputs other than quoted prices included within Level 1 that are observable for the asset or liability, either directly or indirectly.
|
|
•
|
Level 3 Inputs – unobservable inputs for the asset or liability.
|
51
CENTURY ALUMINUM COMPANY
NOTES TO THE CONSOLIDATED FINANCIAL STATEMENTS
(amounts in millions, except share and per share amounts)
|
Recurring Fair Value Measurements
|
As of December 31, 2018
|
|||||||||||||||
|
|
Level 1
|
Level 2
|
Level 3
|
Total
|
||||||||||||
|
ASSETS:
|
|
|
|
|
||||||||||||
|
Cash equivalents
|
$
|
7.5
|
|
$
|
—
|
|
$
|
—
|
|
$
|
7.5
|
|
||||
|
Trust assets
(1)
|
0.1
|
|
—
|
|
—
|
|
0.1
|
|
||||||||
|
Surety bonds
|
2.1
|
|
—
|
|
—
|
|
2.1
|
|
||||||||
|
Derivative instruments
|
—
|
|
3.2
|
|
5.0
|
|
8.2
|
|
||||||||
|
TOTAL
|
$
|
9.7
|
|
$
|
3.2
|
|
$
|
5.0
|
|
$
|
17.9
|
|
||||
|
LIABILITIES:
|
|
|
|
|
|
|
|
|
||||||||
|
Contingent obligation – net
(2)
|
$
|
—
|
|
$
|
—
|
|
$
|
—
|
|
$
|
—
|
|
||||
|
Derivative instruments
|
—
|
|
2.0
|
|
0.5
|
|
2.5
|
|
||||||||
|
TOTAL
|
$
|
—
|
|
$
|
2.0
|
|
$
|
0.5
|
|
$
|
2.5
|
|
||||
|
Recurring Fair Value Measurements
|
As of December 31, 2017
|
|||||||||||||||
|
|
Level 1
|
Level 2
|
Level 3
|
Total
|
||||||||||||
|
ASSETS:
|
|
|
|
|
||||||||||||
|
Cash equivalents
|
$
|
142.8
|
|
$
|
—
|
|
$
|
—
|
|
$
|
142.8
|
|
||||
|
Trust assets
(1)
|
1.8
|
|
—
|
|
—
|
|
1.8
|
|
||||||||
|
Surety bonds
|
1.6
|
|
—
|
|
—
|
|
1.6
|
|
||||||||
|
Derivative instruments
|
—
|
|
—
|
|
1.7
|
|
1.7
|
|
||||||||
|
TOTAL
|
$
|
146.2
|
|
$
|
—
|
|
$
|
1.7
|
|
$
|
147.9
|
|
||||
|
LIABILITIES:
|
|
|
|
|
|
|
|
|
||||||||
|
Contingent obligation – net
(2)
|
$
|
—
|
|
$
|
—
|
|
$
|
—
|
|
$
|
—
|
|
||||
|
Derivative instruments
|
—
|
|
—
|
|
1.2
|
|
1.2
|
|
||||||||
|
TOTAL
|
$
|
—
|
|
$
|
—
|
|
$
|
1.2
|
|
$
|
1.2
|
|
||||
|
(1)
|
Trust assets are currently invested in money market funds. These trust assets are held to fund the non-qualified supplemental executive pension benefit obligations for certain of our officers.
|
|
(2)
|
See
Note 6 Debt
for additional information about the contingent obligation.
|
The following section describes the valuation techniques and inputs used for fair value measurements categorized within Level 2 or Level 3 of the fair value hierarchy:
|
Level 2 and Level 3 Fair Value Measurements:
|
||||||
|
Asset / Liability
|
Level
|
Valuation Techniques
|
Inputs
|
|||
|
LME forward financial sales contracts
|
3
|
Discounted cash flows
|
Quoted LME forward market, discount rate
|
|||
|
MWP forward financial sales contracts
|
2
|
Discounted cash flows
|
Quoted MWP forward market
|
|||
|
Fixed for floating swaps
|
2
|
Discounted cash flows
|
Quoted LME forward market, quoted MWP forward market
|
|||
|
Power price swaps
|
3
|
Discounted cash flows
|
Quoted Nordpool forward market, discount rate
|
|||
|
FX swaps
|
3
|
Discounted cash flows
|
Euro/USD forward exchange rate, discount rate
|
|||
|
Contingent obligation
|
3
|
Discounted cash flows
|
Quoted LME forward market, management's estimates of the LME forward market prices for periods beyond the quoted periods, management's estimates of future level of operations
|
|||
52
CENTURY ALUMINUM COMPANY
NOTES TO THE CONSOLIDATED FINANCIAL STATEMENTS
(amounts in millions, except share and per share amounts)
6. Debt
|
|
December 31,
|
||||||
|
|
2018
|
2017
|
|||||
|
Debt classified as current liabilities:
|
|
|
|||||
|
Hancock County industrial revenue bonds ("IRBs") due April 2028, interest payable quarterly (variable interest rates (not to exceed 12%))
(1)
|
$
|
7.8
|
|
$
|
7.8
|
|
|
|
U.S. Revolving Credit Facility
(2)
|
23.3
|
|
—
|
|
|||
|
Debt classified as non-current liabilities:
|
|
|
|
||||
|
7.5% senior secured notes due June 2021, net of debt discount of $1.4 million and $1.8 million, respectively, interest payable semiannually
|
248.6
|
|
248.2
|
|
|||
|
Total
|
$
|
279.7
|
|
$
|
256.0
|
|
|
|
(1)
|
The IRBs are classified as current liabilities because they are remarketed weekly and could be required to be repaid upon demand if there is a failed remarketing. The IRB interest rate at December 31,
2018
was
1.90%
.
|
|
(2)
|
The U.S. revolving credit facility is classified as a current liability because we repay amounts outstanding and re-borrow funds based on our working capital requirements. For borrowings that we expect to repay within a month, we generally elect to incur interest at a base rate plus applicable margin as defined within the agreement. The interest rate at
December 31, 2018
was
5.75%
.
|
U.S. Revolving Credit Facility
General
. We and certain of our direct and indirect domestic subsidiaries have a senior secured revolving credit facility with a syndicate of lenders (the "U.S. revolving credit facility"). The U.S. revolving credit facility provides for borrowings of up to
$175.0
million in the aggregate, including up to
$110.0 million
under a letter of credit sub-facility, and also includes an uncommitted accordion feature whereby borrowers may increase the capacity of the U.S. revolving credit facility by up to
$50.0 million
, subject to agreement with the lenders.
The U.S. revolving credit facility matures on the sooner of May 2023 or six months before the stated maturity of our outstanding senior secured notes. Any letters of credit issued and outstanding under the U.S. revolving credit facility reduce our borrowing availability on a dollar-for-dollar basis. At
December 31, 2018
, there were
$23.3 million
in outstanding borrowings under our U.S. revolving credit facility. Principal payments, if any, are due upon maturity of the U.S. revolving credit facility.
Status of our U.S. revolving credit facility:
|
December 31, 2018
|
|||
|
Credit facility maximum amount
|
$
|
175.0
|
|
|
Borrowing availability
|
175.0
|
|
|
|
Outstanding letters of credit issued
|
44.8
|
|
|
|
Outstanding borrowings
|
23.3
|
|
|
|
Borrowing availability, net of outstanding letters of credit and borrowings
|
$
|
106.9
|
|
Borrowing Base
. The availability of funds under the U.S. revolving credit facility is limited by a specified borrowing base consisting of the Borrower's accounts receivable and inventory which meet the eligibility criteria.
Guaranty
. The Borrowers' obligations under the U.S. revolving credit facility are guaranteed by certain of our domestic subsidiaries and secured by a continuing lien upon and a security interest in all of the Borrowers' accounts receivable, inventory and certain bank accounts. Each Borrower is liable for any and all obligations under the U.S. revolving credit facility on a joint and several basis.
Interest Rates and Fees
. Any amounts outstanding under the U.S. revolving credit facility will bear interest at our option of either LIBOR or a base rate, plus, in each case, an applicable interest margin. The applicable interest margin is determined based on the average daily availability for the immediately preceding quarter. In addition, we pay an unused line fee on
53
CENTURY ALUMINUM COMPANY
NOTES TO THE CONSOLIDATED FINANCIAL STATEMENTS
(amounts in millions, except share and per share amounts)
undrawn amounts, less the amount of our letters of credit exposure. For standby letters of credit, we are required to pay a fee on the face amount of such letters of credit that varies depending on whether the letter of credit exposure is cash collateralized.
Prepayments
. We can make prepayments of amounts outstanding under the U.S. revolving credit facility, in whole or in part, without premium or penalty, subject to standard LIBOR breakage costs, if applicable. We may be required to apply the proceeds from sales of collateral accounts, other than sales of inventory in the ordinary course of business, to repay amounts outstanding under the revolving credit facility and correspondingly reduce the commitments there under.
Covenants
. The U.S. revolving credit facility contains customary covenants, including restrictions on mergers and acquisitions, indebtedness, affiliate transactions, liens, dividends and distributions, dispositions of collateral, investments and prepayments of indebtedness, as well as a covenant that requires the Borrowers to maintain certain minimum liquidity or availability requirements.
Events of Default
. The U.S. revolving credit facility also includes customary events of default, including nonpayment, misrepresentation, breach of covenant, bankruptcy, change of ownership, certain judgments and certain cross defaults. Upon the occurrence of an event of default, commitments under the U.S. revolving credit facility may be terminated and amounts outstanding may be accelerated and declared immediately due and payable.
Iceland Revolving Credit Facility
General
. Our wholly-owned subsidiary, Nordural Grundartangi ehf ("Grundartangi"), has entered into a
$50.0
million revolving credit facility agreement with Landsbankinn hf., dated November 2013 as amended. Under the terms of the Iceland revolving credit facility, when Grundartangi borrows funds it will designate a repayment date, which may be any date prior to the maturity of the Iceland revolving credit facility. The Iceland revolving credit facility has a term through November 2020.
Status of our Iceland revolving credit facility:
|
December 31, 2018
|
|||
|
Credit facility maximum amount
|
$
|
50.0
|
|
|
Borrowing availability
|
50.0
|
|
|
|
Outstanding letters of credit issued
|
—
|
|
|
|
Outstanding borrowings
|
—
|
|
|
|
Borrowing availability, net of outstanding letters of credit and borrowings
|
$
|
50.0
|
|
Borrowing Base
. The availability of funds under the Iceland revolving credit facility is limited by a specified borrowing base consisting of inventory and accounts receivable of Grundartangi.
Security
. Grundartangi's obligations under the Iceland revolving credit facility are secured by a general bond under which Grundartangi's inventory and accounts receivable are pledged to secure full payment of the loan.
Interest Rates and Fees
. Any amounts outstanding under the Iceland revolving credit facility will bear interest at LIBOR plus a margin per annum.
Prepayments
. Any outstanding borrowings may be prepaid without penalty or premium (except incurred breakage costs) in whole or in part.
Covenants
. The Iceland revolving credit facility contains customary covenants, including restrictions on mergers and acquisitions, dispositions of assets, compliance with permits, laws and payment of taxes, as well as a covenant that requires Grundartangi to maintain a certain minimum equity ratio.
Events of Default
. The Iceland revolving credit facility also includes customary events of default, including nonpayment, loss of license, cessation of operations, unlawfulness, breach of covenant, bankruptcy, change of ownership, certain judgments and certain cross defaults. Upon the occurrence of an event of default, commitments under the Iceland revolving credit facility may be terminated and amounts outstanding may be accelerated and declared immediately due and payable.
54
CENTURY ALUMINUM COMPANY
NOTES TO THE CONSOLIDATED FINANCIAL STATEMENTS
(amounts in millions, except share and per share amounts)
7.5% Notes due 2021
General.
In June 2013, we issued
$250.0
million of our
7.5%
Notes due June 2021 in a private offering exempt from the registration requirements of the Securities Act of 1933, as amended. The 2021 Notes were issued at a discount and we received proceeds of
$246.3
million, prior to payment of financing fees and related expenses. The 2021 Notes bear interest at a rate of
7.5%
per annum on the principal amount,
payable semi-annually in arrears in cash on June 1st and December 1st of each
year. The Notes are senior secured obligations of Century, ranking equally in right of payment with all existing and future senior indebtedness of Century, but effectively senior to unsecured debt to the extent of the value of the collateral. The maturity date for the payment of principal is June 2021.
Fair Value.
Fair value for our 2021 Notes, based on the latest trading data available, was
$247.9
million and
$258.3
million, as of
December 31, 2018
and
2017
, respectively. Although we use quoted market prices for identical debt instruments, the markets on which they trade are not considered to be active and are therefore considered Level 2 fair value measurements.
Guaranty.
Our obligations under
the 2021 Notes are guaranteed by all of our existing and
future domestic restricted subsidiaries (the "Guarantor Subsidiaries"), except for foreign owned holding companies and any domestic restricted subsidiary that owns no assets other than equity interests or other investments in foreign subsidiaries, which guaranty shall in each case be a senior secured obligation of such Guarantor Subsidiaries, ranking equally in right of payment with all existing and future senior indebtedness of such Guarantor Subsidiaries but effectively senior to unsecured debt.
Collateral.
Our obligations under the 2021 Notes due and the Guarantor Subsidiaries' obligations under the guarantees are secured by a pledge of and lien on (subject to certain exceptions):
|
(i)
|
all of our and the Guarantor Subsidiaries' property, plant and equipment;
|
|
(ii)
|
all equity interests in domestic subsidiaries directly owned by us and the Guarantor Subsidiaries and
65%
of equity interests in foreign subsidiaries or foreign holding companies directly owned by us and the Guarantor Subsidiaries;
|
|
(iii)
|
intercompany notes owed by any non-guarantor to us or any Guarantor Subsidiary to us; and
|
|
(iv)
|
proceeds of the foregoing.
|
Under certain circumstances, we may incur additional debt that also may be secured by liens on the collateral that are equal to or have priority over the liens securing the 2021 Notes.
Redemption Rights.
We may redeem the 2021 Notes, in whole or in part, for
101.875%
of the outstanding principal amount plus accrued and unpaid interest before June 1, 2019 or for
100%
of the outstanding principal amount plus accrued and unpaid interest on June 1, 2019 and thereafter.
Upon a change of control (as defined in the indenture governing the 2021 Notes), we will be required to make an offer to purchase the 2021 Notes at a purchase price equal to
101%
of the outstanding principal amount of the 2021 Notes on the date of the purchase, plus accrued interest to the date of purchase.
Covenants.
The indenture governing the 2021 Notes contains customary covenants which may limit our ability, and the ability of certain of our subsidiaries, to: (i) incur additional debt; (ii) incur additional liens; (iii) pay dividends or make distributions in respect of capital stock; (iv) purchase or redeem capital stock; (v) make investments or certain other restricted payments; (vi) sell assets; (vii) issue or sell stock of certain subsidiaries; (viii) enter into transactions with shareholders or affiliates; and (ix) effect a consolidation or merger.
Contingent Obligation
We have a contingent obligation in connection with the “unwind” of a contractual arrangement between CAKY, Big Rivers and a third party and the execution of a long-term cost-based power contract with Kenergy, a member of a cooperative of Big Rivers, in July 2009. This contingent obligation consists of the aggregate payments made to Big Rivers by the third party on CAKY’s behalf in excess of the agreed upon base amount under the long-term cost-based power contract with Kenergy. Our obligation to make repayments is contingent upon certain operating criteria for Hawesville and the LME price of primary aluminum. When the conditions for repayment are met, and for so long as those conditions continue to be met, we will be obligated to make principal and interest payments, in up to 72 monthly payments. Interest accrues at an annual rate equal to
10.94%
and the term of the agreement is through December 2028.
55
CENTURY ALUMINUM COMPANY
NOTES TO THE CONSOLIDATED FINANCIAL STATEMENTS
(amounts in millions, except share and per share amounts)
Based on the LME forward market prices for primary aluminum at
December 31, 2018
and management's estimate of the LME forward market for periods beyond the quoted periods, we recognized a derivative asset which offsets our contingent obligation. As a result, our net liability decreased and we recognized a gain of
$1.4 million
for each of the years ended
December 31, 2018
and
2017
. These amounts are exactly offset by interest expense on the contingent obligation which is recorded in interest expense. In addition, we believe that we will not have any payment obligations for the contingent obligation through the term of the agreement, which expires in 2028. However, future increases in the LME forward market may result in a partial or full derecognition of the derivative asset and a corresponding recognition of a loss.
The following table provides information about the balance sheet location and gross amounts offset:
|
Offsetting of financial instruments and derivatives
|
Balance sheet location
|
December 31, 2018
|
December 31, 2017
|
|||||||
|
Contingent obligation – principal
|
Other liabilities
|
$
|
(12.9
|
)
|
$
|
(12.9
|
)
|
|||
|
Contingent obligation – accrued interest
|
Other liabilities
|
(10.9
|
)
|
(9.5
|
)
|
|||||
|
Contingent obligation – derivative asset
|
Other liabilities
|
23.8
|
|
22.4
|
|
|||||
|
$
|
—
|
|
$
|
—
|
|
|||||
Industrial Revenue Bonds
As part of the purchase price for our acquisition of the Hawesville facility, we assumed IRBs which were issued in connection with the financing of certain solid waste disposal facilities constructed at the Hawesville facility. The IRBs bear interest at a variable rate not to exceed
12%
per annum determined weekly based upon prevailing rates for similar bonds in the industrial revenue bond market and interest on the IRBs is paid quarterly. The IRBs are secured by a letter of credit issued under our revolving credit facility and mature in April 2028.
7. Shareholders' Equity
Common Stock
As of
December 31, 2018
and
2017
, we had
195,000,000
shares of common stock,
$0.01
cent par value, authorized under our Restated Certificate of Incorporation, of which
95,289,961
shares were issued and
88,103,440
shares were outstanding at
December 31, 2018
;
94,731,298
shares were issued and
87,544,777
shares were outstanding at
December 31, 2017
.
The rights, preferences and privileges of holders of our common stock are subject to, and may be adversely affected by, the rights of the holders of shares of any series of our preferred stock which are currently outstanding, including our Series A Convertible Preferred Stock, or which we may designate and issue in the future.
Preferred Stock
As of
December 31, 2018
and
2017
, we had
5,000,000
shares of preferred stock,
$0.01
cent par value per share, authorized under our Restated Certificate of Incorporation. Our Board of Directors may issue preferred stock in one or more series and determine for each series the dividend rights, conversion rights, voting rights, redemption rights, liquidation preferences, sinking fund terms and the number of shares constituting that series, as well as the designation thereof. Depending upon the terms of preferred stock established by our Board of Directors, any or all of the preferred stock could have preference over the common stock with respect to dividends and other distributions and upon the liquidation of Century. In addition, issuance of any shares of preferred stock with voting powers may dilute the voting power of the outstanding common stock.
56
CENTURY ALUMINUM COMPANY
NOTES TO THE CONSOLIDATED FINANCIAL STATEMENTS
(amounts in millions, except share and per share amounts)
Series A Convertible Preferred Stock
Shares Authorized and Outstanding.
In 2008, we issued
160,000
shares of our Series A Convertible Preferred Stock. Glencore holds all of the issued and outstanding Series A Convertible Preferred Stock. At
December 31, 2018
and
December 31, 2017
,
71,967
shares and
74,364
were outstanding, respectively.
The issuance of common stock under our stock incentive programs, debt exchange transactions and any stock offering that excludes Glencore participation triggers anti-dilution provisions of the preferred stock agreement and results in the automatic conversion of Series A Convertible Preferred Stock shares into shares of common stock. The conversion of preferred to common shares is
100
shares of common for each share of preferred stock. Our Series A Convertible Preferred Stock has a par value of
$0.01
per share.
The Common and Preferred Stock Activity table below contains additional information about preferred stock conversions during
2018
,
2017
and
2016
:
|
Common and Preferred Stock Activity:
|
Preferred stock
|
Common stock
|
||||||
|
(in shares)
|
Series A Convertible
|
Treasury
|
Outstanding
|
|||||
|
Balance as of December 31, 2015
|
76,539
|
|
7,186,521
|
|
87,038,050
|
|
||
|
Repurchase of common stock
|
—
|
|
—
|
|
—
|
|
||
|
Conversion of convertible preferred stock
|
(914
|
)
|
—
|
|
91,362
|
|
||
|
Issuance for share-based compensation plans
|
—
|
|
—
|
|
121,485
|
|
||
|
Beginning balance as of December 31, 2016
|
75,625
|
|
7,186,521
|
|
87,250,897
|
|
||
|
Repurchase of common stock
|
—
|
|
—
|
|
—
|
|
||
|
Conversion of convertible preferred stock
|
(1,261
|
)
|
—
|
|
126,098
|
|
||
|
Issuance for share-based compensation plans
|
—
|
|
—
|
|
167,782
|
|
||
|
Beginning balance as of December 31, 2017
|
74,364
|
|
7,186,521
|
|
87,544,777
|
|
||
|
Repurchase of common stock
|
—
|
|
—
|
|
—
|
|
||
|
Conversion of convertible preferred stock
|
(2,397
|
)
|
—
|
|
239,748
|
|
||
|
Issuance for share-based compensation plans
|
—
|
|
—
|
|
318,915
|
|
||
|
Ending balance as of December 31, 2018
|
71,967
|
|
7,186,521
|
|
88,103,440
|
|
||
Dividend Rights.
So long as any shares of our Series A Convertible Preferred Stock are outstanding, we may not pay or declare any dividend or make any distribution upon or in respect of our common stock or any other capital stock ranking on a parity with or junior to the Series A Convertible Preferred Stock in respect of dividends or liquidation preference, unless we, at the same time, declare and pay a dividend or distribution on the shares of Series A Convertible Preferred Stock (a) in an amount equal to the amount such holders would receive if they were the holders of the number of shares of our common stock into which their shares of Series A Convertible Preferred Stock are convertible as of the record date fixed for such dividend or distribution, or (b) in the case of a dividend or distribution on other capital stock ranking on a parity with or junior to the Series A Convertible Preferred Stock in such amount and in such form as (based on the determination of holders of a majority of the Series A Convertible Preferred Stock) will preserve, without dilution, the economic position of the Series A Convertible Preferred Stock relative to such other capital stock.
Voting Rights.
The Series A Convertible Preferred Stock has no voting rights for the election of directors or on other matters where the shares of common stock have voting rights. However, we may not change the powers, preferences, or rights given to the Series A Convertible Preferred Stock, or authorize, create or issue any additional shares of Series A Convertible Preferred Stock without the affirmative vote of the holders of a majority of the shares of Series A Convertible Preferred Stock then outstanding (voting separately as a class).
Liquidation Rights.
Upon any liquidation, dissolution, or winding-up of Century, the holders of shares of Series A Convertible Preferred Stock are entitled to receive a preferential distribution of
$0.01
per share out of the assets available for distribution. In addition, upon any liquidation, dissolution or winding-up of Century, if our assets are sufficient to make any distribution to the holders of the common stock, then the holders of shares of Series A Convertible Preferred Stock are also entitled to share ratably with the holders of common stock in the distribution of Century’s assets (as though the holders of
57
CENTURY ALUMINUM COMPANY
NOTES TO THE CONSOLIDATED FINANCIAL STATEMENTS
(amounts in millions, except share and per share amounts)
Series A Convertible Preferred Stock were holders of that number of shares of common stock into which their shares of Series A Convertible Preferred Stock are convertible). However, the amount of any such distribution will be reduced by the amount of the preferential distribution received by the holders of the Series A Convertible Preferred Stock.
Transfer Restrictions.
Glencore is prohibited from transferring shares of Series A Convertible Preferred Stock to any party other than an affiliate who agrees to become bound by certain agreements associated with these shares.
Automatic Conversion.
The Series A Convertible Preferred Stock automatically converts, without any further act of Century or any holders of Series A Convertible Preferred Stock, into shares of common stock, at a conversion ratio of
100
shares of common stock for each share of Series A Convertible Preferred Stock, upon the occurrence of any of the following automatic conversion events:
|
•
|
If we sell or issue shares of common stock or any other stock that votes generally with our common stock, or the occurrence of any other event, including a sale, transfer or other disposition of common stock by Glencore, as a result of which the percentage of voting stock held by Glencore decreases, an amount of Series A Convertible Preferred Stock will convert to common stock to restore Glencore to its previous ownership percentage;
|
|
•
|
If shares of Series A Convertible Preferred Stock are transferred to an entity that is not an affiliate of Glencore, such shares of Series A Convertible Preferred Stock will convert to shares of our common stock, provided that such transfers may only be made pursuant to an effective registration statement;
|
|
•
|
Upon a sale of Series A Convertible Preferred Stock by Glencore in a Rule 144 transaction in which the shares of Series A Convertible Preferred Stock and our common stock issuable upon the conversion thereof are not directed to any purchaser, such shares of Series A Convertible Preferred Stock sold will convert to shares of our common stock; and
|
|
•
|
Immediately prior to and conditioned upon the consummation of a merger, reorganization or consolidation to which we are a party or a sale, abandonment, transfer, lease, license, mortgage, exchange or other disposition of all or substantially all of our property or assets, in one or a series of transactions where, in any such case, all of our common stock would be converted into the right to receive, or exchanged for, cash and/or securities, other than any transaction in which the Series A Convertible Preferred Stock will be redeemed.
|
Optional Conversion.
Glencore has the option to convert the Series A Convertible Preferred Stock in a tender offer or exchange offer, at the same conversion ratio as above, in which a majority of the outstanding shares of our common stock have been tendered by the holders thereof and not duly withdrawn at the expiration time of such tender or exchange offer, so long as the Series A Convertible Preferred Stock is tendered or exchanged in such offer.
Stock Combinations
–
Adjustments.
If, at any time while the Series A Convertible Preferred Stock is outstanding, Century combines outstanding common stock into a smaller number of shares, then the number of shares of common stock issuable on conversion of each share of Series A Convertible Preferred Stock will be decreased in proportion to such decrease in the aggregate number of shares of common stock outstanding.
Redemptions or Repurchases of Common Stock.
We may not redeem or repurchase our common stock unless we redeem or repurchase, or otherwise make a payment on, a pro-rata number of shares of the Series A Convertible Preferred Stock. These restrictions do not apply to our open market repurchases or our repurchases pursuant to our employee benefit plans.
Right of Redemption.
The Series A Convertible Preferred Stock will be redeemed by Century if any of the following events occur (at a redemption price based on the trading price of our common stock prior to the announcement of such event) and Glencore votes its shares of our common stock in opposition to such events:
|
•
|
We propose a merger, reorganization or consolidation, sale, abandonment, transfer, lease, license, mortgage, exchange or other disposition of all or substantially all of our property or assets where any of our common stock would be converted into the right to receive, or exchanged for, assets other than cash and/or securities traded on a national stock exchange or that are otherwise readily marketable, or
|
|
•
|
We propose to dissolve and wind up operations and any assets, other than cash and/or securities traded on a national stock exchange or that are otherwise readily marketable, are to be distributed to the holders of our common stock.
|
58
CENTURY ALUMINUM COMPANY
NOTES TO THE CONSOLIDATED FINANCIAL STATEMENTS
(amounts in millions, except share and per share amounts)
Stock Repurchase Program
In 2011, our Board of Directors authorized a
$60.0 million
stock repurchase program and during the first quarter of 2015, our Board of Directors increased the size of the program by
$70.0 million
. Under the program, Century is authorized to repurchase up to
$130.0 million
of our outstanding shares of common stock, from time to time, on the open market at prevailing market prices, in block trades or otherwise. The timing and amount of any shares repurchased will be determined by our management based on its evaluation of market conditions, the trading price of our common stock and other factors. The stock repurchase program may be suspended or discontinued at any time.
Shares of common stock repurchased are recorded at cost as treasury stock and result in a reduction of shareholders’ equity in the consolidated balance sheets. From time to time, treasury shares may be reissued as contributions to our employee benefit plans and for the conversion of convertible preferred stock. When shares are reissued, we use an average cost method for determining cost. The difference between the cost of the shares and the reissuance price is added to or deducted from additional paid-in capital.
Through
December 31, 2018
, we repurchased
7,186,521
shares of common stock for an aggregate purchase price of
$86.3
million. We have made
no
repurchases since April 2015 and have approximately
$43.7
million remaining under the repurchase program authorization as of
December 31, 2018
.
8. Inventories
Inventories, at December 31, consist of the following:
|
|
2018
|
2017
|
|||||
|
Raw materials
|
$
|
100.8
|
|
$
|
106.2
|
|
|
|
Work-in-process
|
49.5
|
|
49.6
|
|
|||
|
Finished goods
|
47.3
|
|
40.9
|
|
|||
|
Operating and other supplies
|
146.2
|
|
120.8
|
|
|||
|
Inventories
|
$
|
343.8
|
|
$
|
317.5
|
|
|
9. Property, Plant and Equipment
Property, plant and equipment, at December 31, consist of the following:
|
|
2018
|
2017
|
|||||
|
Land and improvements
|
$
|
41.8
|
|
$
|
41.8
|
|
|
|
Buildings and improvements
|
337.3
|
|
331.7
|
|
|||
|
Machinery and equipment
|
1,449.5
|
|
1,398.7
|
|
|||
|
Construction in progress
|
46.3
|
|
22.5
|
|
|||
|
|
1,874.9
|
|
1,794.7
|
|
|||
|
Less accumulated depreciation
|
(907.6
|
)
|
(822.8
|
)
|
|||
|
Property, plant and equipment - net
|
$
|
967.3
|
|
$
|
971.9
|
|
|
For the years ended December 31,
2018
,
2017
and
2016
, we recorded depreciation and amortization expense of
$90.1
million,
$84.2
million, and
$84.8
million, respectively. See
Note 4. Helguvik and Ravenswood Gains and (Losses)
regarding impairment of our Helguvik project.
59
CENTURY ALUMINUM COMPANY
NOTES TO THE CONSOLIDATED FINANCIAL STATEMENTS
(amounts in millions, except share and per share amounts)
10. Accumulated Other Comprehensive Loss ("AOCL")
|
Components of AOCL
|
2018
|
2017
|
|||||
|
Defined benefit plan liabilities
|
$
|
(107.3
|
)
|
$
|
(102.1
|
)
|
|
|
Unrealized gain (loss) on financial instruments
|
2.5
|
|
2.7
|
|
|||
|
Other comprehensive loss before income tax effect
|
(104.8
|
)
|
(99.4
|
)
|
|||
|
Income tax effect
(1)
|
6.1
|
|
7.7
|
|
|||
|
Accumulated other comprehensive loss
|
$
|
(98.7
|
)
|
$
|
(91.7
|
)
|
|
|
(1)
|
The allocation of the income tax effect to the components of other comprehensive loss is as follows:
|
|
2018
|
2017
|
||||||
|
Defined benefit plan liabilities
|
$
|
6.6
|
|
$
|
8.2
|
|
|
|
Unrealized loss on financial instruments
|
(0.5
|
)
|
(0.5
|
)
|
|||
The following table summarizes the changes in the accumulated balances for each component of AOCL:
|
Defined benefit plan and other postretirement liabilities
|
Unrealized gain (loss) on financial instruments
|
Total, net of tax
|
|||||||||
|
Balance, December 31, 2015
|
$
|
(110.7
|
)
|
$
|
(2.0
|
)
|
$
|
(112.7
|
)
|
||
|
Other comprehensive (loss) before reclassifications
|
(9.5
|
)
|
—
|
|
(9.5
|
)
|
|||||
|
Net amount reclassified to net income (loss)
|
4.0
|
|
4.3
|
|
8.3
|
|
|||||
|
Balance, December 31, 2016
|
(116.2
|
)
|
2.3
|
|
(113.9
|
)
|
|||||
|
Other comprehensive income before reclassifications
|
20.3
|
|
—
|
|
20.3
|
|
|||||
|
Net amount reclassified to net income (loss)
|
2.1
|
|
(0.2
|
)
|
1.9
|
|
|||||
|
Balance, December 31, 2017
|
(93.8
|
)
|
2.1
|
|
(91.7
|
)
|
|||||
|
Other comprehensive (loss) before reclassifications
|
(7.3
|
)
|
—
|
|
(7.3
|
)
|
|||||
|
Net amount reclassified to net income (loss)
|
0.4
|
|
(0.1)
|
0.3
|
|
||||||
|
Balance, December 31, 2018
|
$
|
(100.7
|
)
|
$
|
2.0
|
|
$
|
(98.7
|
)
|
||
60
CENTURY ALUMINUM COMPANY
NOTES TO THE CONSOLIDATED FINANCIAL STATEMENTS
(amounts in millions, except share and per share amounts)
Reclassifications out of AOCL were included in the consolidated statements of operations as follows:
|
AOCL Components
|
Location
|
2018
|
2017
|
2016
|
||||||||||
|
Defined benefit plan and other postretirement liabilities
|
Cost of goods sold
|
$
|
2.8
|
|
$
|
3.1
|
|
$
|
3.5
|
|
||||
|
Selling, general and administrative expenses
|
(1.9
|
)
|
(0.4
|
)
|
0.5
|
|
||||||||
|
Other operating expense, net
|
1.2
|
|
1.0
|
|
1.6
|
|
||||||||
|
Income tax expense
|
(1.6
|
)
|
(1.6
|
)
|
(1.5
|
)
|
||||||||
|
Net of tax
|
$
|
0.5
|
|
$
|
2.1
|
|
$
|
4.1
|
|
|||||
|
Gain (loss) on financial instruments
|
Cost of goods sold
|
$
|
(0.2
|
)
|
$
|
(0.2
|
)
|
$
|
(0.2
|
)
|
||||
|
Helguvik impairment
|
—
|
|
—
|
|
4.5
|
|
||||||||
|
Income tax benefit
|
0.0
|
|
0.0
|
|
(0.0
|
)
|
||||||||
|
Net of tax
|
$
|
(0.2
|
)
|
$
|
(0.2
|
)
|
$
|
4.3
|
|
|||||
11. Pension and Other Postretirement Benefits
Pension Benefits
We maintain noncontributory defined benefit pension plans for certain domestic hourly and salaried employees. For the eligible domestic salaried employees, plan benefits are based primarily on years of service and average compensation during the later years of employment. For hourly employees, plan benefits are based primarily on a formula that provides a specific benefit for each year of service. Our funding policy is to contribute amounts based upon actuarial and economic assumptions designed to achieve adequate funding of the projected benefit obligations and to meet the minimum funding requirements of the Employee Retirement Income Security Act of 1974 ("ERISA"). In addition, we maintain the SERB plan for certain current and former executive officers, which is frozen to future accruals.
Plan Merger
In 2017, the Century Aluminum Employees Retirement Plan was merged into the CAWV Hourly Employees Pension Plan and the resulting plan was renamed the Century Aluminum Consolidated Retirement Plan. The benefits of the participants from the Century Aluminum Employee Retirement Plan were not affected by this merger.
PBGC Settlement
In 2013, we entered into a settlement agreement with the Pension Benefit Guaranty Corporation ("PBGC") regarding an alleged "cessation of operations" at our Ravenswood facility. Pursuant to the terms of the agreement, we would make additional contributions (above any minimum required contributions) to our defined benefit pension plans totaling approximately
$17.4
million over the term of the agreement. Under certain circumstances, in periods of lower primary aluminum prices relative to our cost of operations, we are able to defer one or more of these payments, but would then be required to provide the PBGC with acceptable security for deferred payments. We did not make any contributions during the years ended December 31, 2018, 2017 and 2016. We have elected to defer certain payments under the PBGC agreement and have provided the PBGC with the appropriate security. The remaining contributions under this agreement are approximately $
9.6 million
.
Other Postretirement Benefits (OPEB)
In addition to providing pension benefits, we provide certain healthcare and life insurance benefits for certain domestic retired employees. We accrue the estimated cost of providing postretirement benefits during the working careers of those employees who could become eligible for such benefits when they retire. We fund these benefits as the retirees submit claims.
61
CENTURY ALUMINUM COMPANY
NOTES TO THE CONSOLIDATED FINANCIAL STATEMENTS
(amounts in millions, except share and per share amounts)
Retiree medical welfare changes
Under the current Hawesville labor agreement, employees who retire during the term of the labor agreement have been divided into sub-groups based on attributes such as Medicare eligibility, hire date, age and years of service. Levels of benefits are defined for the sub-groups and range from no substantive change from the benefits provided under the previous labor agreement to replacement of the defined retiree medical benefit program with individual health reimbursement accounts for each eligible participant. The health reimbursement accounts will be funded by CAKY based on established rates per hour worked by each eligible participant. Eligible participants will be able to withdraw from their health reimbursement accounts to fund their own retiree medical coverage.
During 2017, the Company amended its non-union retiree medical and life insurance benefits to align the Company’s benefits with the market and achieve a uniform retiree medical benefit design across the Company’s U.S. locations. Effective January 1, 2018, non-union retiree medical and life insurance benefits are restricted to current participants who meet the eligibility criteria as of January 1, 2018. Additionally, effective January 1, 2019, Century will no longer administer non-union retiree medical, prescription drug, dental, or vision benefits and instead will make fixed health reimbursement account contributions. The amendment decreased the projected benefit obligations by approximately
$18.8
million and a curtailment benefit of
$1.4
million was recorded in 2017.
Obligations and Funded Status
The change in benefit obligations and change in plan assets as of December 31 are as follows:
|
|
Pension
|
OPEB
|
|||||||||||||
|
|
2018
|
2017
|
2018
|
2017
|
|||||||||||
|
Change in benefit obligation:
|
|
|
|
|
|||||||||||
|
Benefit obligation at beginning of year
|
$
|
344.1
|
|
$
|
328.0
|
|
$
|
120.8
|
|
$
|
133.9
|
|
|||
|
Service cost
|
4.3
|
|
4.4
|
|
0.2
|
|
0.8
|
|
|||||||
|
Interest cost
|
12.4
|
|
13.3
|
|
4.2
|
|
5.3
|
|
|||||||
|
Plan amendments
|
0.5
|
|
—
|
|
0.1
|
|
(27.4
|
)
|
|||||||
|
Actuarial (gain) loss
|
(28.0
|
)
|
18.5
|
|
(10.5
|
)
|
14.7
|
|
|||||||
|
Medicare Part D
|
—
|
|
—
|
|
0.3
|
|
0.4
|
|
|||||||
|
Benefits paid
|
(18.9
|
)
|
(20.1
|
)
|
(6.4
|
)
|
(6.9
|
)
|
|||||||
|
Benefit obligation at end of year
|
$
|
314.4
|
|
$
|
344.1
|
|
$
|
108.7
|
|
$
|
120.8
|
|
|||
|
|
Pension
|
OPEB
|
|||||||||||||
|
|
2018
|
2017
|
2018
|
2017
|
|||||||||||
|
Change in plan assets:
|
|
|
|
|
|||||||||||
|
Fair value of plan assets at beginning of year
|
$
|
303.4
|
|
$
|
276.7
|
|
$
|
—
|
|
$
|
—
|
|
|||
|
Actual return on plan assets
|
(24.6
|
)
|
45.0
|
|
—
|
|
—
|
|
|||||||
|
Employer contributions
|
1.8
|
|
1.8
|
|
6.1
|
|
6.5
|
|
|||||||
|
Medicare Part D subsidy received
|
—
|
|
—
|
|
0.3
|
|
0.4
|
|
|||||||
|
Benefits paid
|
(18.9
|
)
|
(20.1
|
)
|
(6.4
|
)
|
(6.9
|
)
|
|||||||
|
Fair value of assets at end of year
|
$
|
261.7
|
|
$
|
303.4
|
|
$
|
—
|
|
$
|
—
|
|
|||
62
CENTURY ALUMINUM COMPANY
NOTES TO THE CONSOLIDATED FINANCIAL STATEMENTS
(amounts in millions, except share and per share amounts)
|
|
Pension
|
OPEB
|
|||||||||||||
|
|
2018
|
2017
|
2018
|
2017
|
|||||||||||
|
Funded status of plans:
|
|
|
|
|
|||||||||||
|
Funded status
|
$
|
(52.7
|
)
|
$
|
(40.7
|
)
|
$
|
(108.7
|
)
|
$
|
(120.8
|
)
|
|||
|
Amounts recognized in the Consolidated Balance Sheets:
|
|||||||||||||||
|
Non-current assets
|
—
|
|
—
|
|
—
|
|
—
|
|
|||||||
|
Current liabilities
|
(1.8
|
)
|
(1.8
|
)
|
(7.5
|
)
|
(7.5
|
)
|
|||||||
|
Non-current liabilities
|
(50.9
|
)
|
(38.9
|
)
|
(101.2
|
)
|
(113.3
|
)
|
|||||||
|
Net amount recognized
|
$
|
(52.7
|
)
|
$
|
(40.7
|
)
|
$
|
(108.7
|
)
|
$
|
(120.8
|
)
|
|||
|
Amounts recognized in accumulated other comprehensive loss (pre-tax):
|
|
|
|
|
|||||||||||
|
Net loss
|
$
|
83.7
|
|
$
|
71.2
|
|
$
|
43.9
|
|
$
|
58.4
|
|
|||
|
Prior service cost (benefit)
|
1.4
|
|
1.0
|
|
(21.6
|
)
|
(28.9
|
)
|
|||||||
|
Total
|
$
|
85.1
|
|
$
|
72.2
|
|
$
|
22.3
|
|
$
|
29.5
|
|
|||
Pension Plans That Are Not Fully Funded
At December 31, 2018, the projected benefit obligation, accumulated benefit obligation and fair value of plan assets for pension plans with accumulated benefit obligations in excess of plan assets were $
314.4 million
,
$310.0 million
, and
$261.7 million
, respectively.
At December 31, 2017, the projected benefit obligation, accumulated benefit obligation and fair value of plan assets for pension plans with accumulated benefit obligations in excess of plan assets were $
344.1 million
,
$339.4 million
and
$303.4 million
, respectively.
Components of net periodic benefit cost and other amounts recognized in other comprehensive loss:
Net Periodic Benefit Cost:
|
|
Year Ended December 31,
|
||||||||||||||||||||||
|
|
Pension
|
OPEB
|
|||||||||||||||||||||
|
|
2018
|
2017
|
2016
|
2018
|
2017
|
2016
|
|||||||||||||||||
|
Service cost
|
$
|
4.3
|
|
$
|
4.4
|
|
$
|
4.6
|
|
$
|
0.2
|
|
$
|
0.8
|
|
$
|
1.0
|
|
|||||
|
Interest cost
|
12.4
|
|
13.3
|
|
13.9
|
|
4.2
|
|
5.3
|
|
5.6
|
|
|||||||||||
|
Expected return on plan assets
|
(21.1
|
)
|
(19.0
|
)
|
(18.8
|
)
|
—
|
|
—
|
|
—
|
|
|||||||||||
|
Amortization of prior service costs
|
0.1
|
|
0.1
|
|
0.1
|
|
(7.3
|
)
|
(3.7
|
)
|
(2.7
|
)
|
|||||||||||
|
Amortization of net loss
|
5.2
|
|
4.7
|
|
4.7
|
|
4.0
|
|
3.9
|
|
3.5
|
|
|||||||||||
|
Curtailment (benefit) cost
|
—
|
|
—
|
|
—
|
|
—
|
|
(1.4
|
)
|
—
|
|
|||||||||||
|
Net periodic benefit cost
|
$
|
0.9
|
|
$
|
3.5
|
|
$
|
4.5
|
|
$
|
1.2
|
|
$
|
4.9
|
|
$
|
7.4
|
|
|||||
63
CENTURY ALUMINUM COMPANY
NOTES TO THE CONSOLIDATED FINANCIAL STATEMENTS
(amounts in millions, except share and per share amounts)
Other changes in Plan Assets and Benefit Obligations Recognized in Other Comprehensive Loss (pre-tax):
|
|
Year Ended December 31,
|
||||||||||||||
|
|
Pension
|
OPEB
|
|||||||||||||
|
|
2018
|
2017
|
2018
|
2017
|
|||||||||||
|
Net loss (gain)
|
$
|
17.6
|
|
$
|
(7.5
|
)
|
$
|
(10.5
|
)
|
$
|
14.7
|
|
|||
|
Prior service cost (benefit)
|
0.5
|
|
—
|
|
0.1
|
|
(27.4
|
)
|
|||||||
|
Amortization of net loss, including recognition due to settlement
|
(5.2
|
)
|
(4.7
|
)
|
(4.0
|
)
|
(3.9
|
)
|
|||||||
|
Amortization of prior service (cost) benefit, including recognition due to curtailment
|
(0.1
|
)
|
(0.1
|
)
|
7.2
|
|
5.1
|
|
|||||||
|
Total amount recognized in other comprehensive loss
|
12.8
|
|
(12.3
|
)
|
(7.2
|
)
|
(11.5
|
)
|
|||||||
|
Net periodic benefit cost
|
0.9
|
|
3.5
|
|
1.2
|
|
4.9
|
|
|||||||
|
Total recognized in net periodic benefit cost and other comprehensive loss
|
$
|
13.7
|
|
$
|
(8.8
|
)
|
$
|
(6.0
|
)
|
$
|
(6.6
|
)
|
|||
|
Amounts in accumulated other comprehensive loss expected to be recognized as components of net periodic benefit cost during 2019
|
|||||||
|
|
Pension
|
OPEB
|
|||||
|
Amortization of net loss
|
$
|
5.9
|
|
$
|
3.7
|
|
|
|
Amortization of prior service cost (benefit)
|
0.1
|
|
(7.2
|
)
|
|||
Weighted average assumptions used to determine benefit obligations at December 31:
|
|
Pension
|
OPEB
|
|||||
|
|
2018
|
2017
|
2018
|
2017
|
|||
|
Discount rate
(1)
|
4.39%
|
3.69%
|
4.27%
|
3.66%
|
|||
|
Rate of compensation increase
(2)
|
3%/3.5%
|
3%/4%
|
3%/3.5%
|
3%/4%
|
|||
|
Measurement date
|
12/31/2018
|
12/31/2017
|
12/31/2018
|
12/31/2017
|
|||
Weighted average assumptions used to determine net periodic benefit cost for the years ended December 31:
|
|
Pension
|
OPEB
|
|||||||||
|
|
2018
|
2017
|
2016
|
2018
|
2017
|
2016
|
|||||
|
Measurement date
|
12/31/2017
|
12/31/2016
|
12/31/2015
|
12/31/2017
|
12/31/2016
|
12/31/2015
|
|||||
|
Fiscal year end
|
12/31/2018
|
12/31/2017
|
12/31/2016
|
12/31/2018
|
12/31/2017
|
12/31/2016
|
|||||
|
Discount rate
(1)
|
3.69%
|
4.15%
|
4.44%
|
3.66%
|
4.05%
|
4.50%
|
|||||
|
Rate of compensation increase
(2)
|
3%/4%
|
3%/4%
|
3%/4%
|
3%/4%
|
3%/4%
|
3%/4%
|
|||||
|
Expected return on plan assets
(3)
|
7.18%
|
6.82%
|
7.10%
|
—
|
—
|
—
|
|||||
|
(1)
|
We use the Ryan Above Median Yield Curve to determine the discount rate.
|
|
(2)
|
For 2018, the rate of compensation increase is
3%
per year for the first year and
3.5%
per year thereafter. For 2017, the rate of compensation increase is
3%
for the first two years and
4%
per year thereafter. For 2016, the rate of compensation increase is
3%
per year for the first three years and
4%
per year thereafter.
|
|
(3)
|
The rate for each of our defined benefit plans was selected by taking into account our expected asset mix and is based on historical performance as well as expected future rates of return on plan assets.
|
For measurement purposes, medical cost inflation is initially estimated to be
6.7%
, and
7.4%
for pre and post-65 participants, respectively, declining to
4.5%
over twelve years and continuing thereafter.
64
CENTURY ALUMINUM COMPANY
NOTES TO THE CONSOLIDATED FINANCIAL STATEMENTS
(amounts in millions, except share and per share amounts)
Assumed health care cost trend rates have a significant effect on the amounts reported for the health care benefit obligations. A one-percentage-point change in the assumed health care cost trend rate would have had the following effects in
2018
:
|
|
1% Increase
|
1% Decrease
|
|||||
|
Effect on total of service and interest cost
|
$
|
0.4
|
|
$
|
(0.4
|
)
|
|
|
Effect on accumulated postretirement benefit obligation
|
10.6
|
|
(9.1
|
)
|
|||
Benefit Plan Assets
Pension Plan Investment Strategy and Policy
The Pension Plans’ assets are invested in a prudent manner for the exclusive purpose of providing benefits to participants.
Other objectives are to:
|
•
|
Provide a total return that, over the long term, provides sufficient assets to fund the pension plan liabilities subject to a level of risk, contributions and pension expense deemed appropriate by the company.
|
|
•
|
Minimize, where possible, pension expense volatility, and inclusion of liability driven investing as an investment strategy when appropriate. As the funding ratio improves, the objectives will evolve to minimize the funded status volatility.
|
|
•
|
Diversify investments within asset classes to reduce the impact of losses in single investments.
|
The assets of the Pension Plans are invested in compliance with ERISA, as amended, and any subsequent applicable regulations and laws.
Performance
Our performance objective is to outperform the return of weighing passive investment alternatives by the policy target allocations after fees at a comparable level of risk. This investment objective is expected to be achieved over the long term and is measured over rolling multi-year periods. Peer-relative performance comparisons will also be considered especially when performance deviates meaningfully from market indexes. Investment objectives for each asset class are included below.
Asset Allocation Policy
Asset allocation policy is the principal method for achieving the Pension Plans' investment objectives stated above. The Pension Plans’ weighted average long-term strategic asset allocation policy targets are as follows:
|
|
Pension Plan Asset Allocation
|
||||
|
|
2018 Target
|
December 31, 2018
|
December 31, 2017
|
||
|
Equities:
|
|
|
|
||
|
U.S. equities
|
26%
|
25%
|
29%
|
||
|
International equities
|
22%
|
19%
|
26%
|
||
|
Fixed income
|
52%
|
56%
|
45%
|
||
|
|
|
100%
|
100%
|
||
U.S. and international equities are held for their long-term expected return premium over fixed income investments and inflation. Fixed income is held for diversification relative to equities.
The strategic role of U.S. and international equities is to:
|
•
|
Provide higher expected returns of the major asset classes.
|
65
CENTURY ALUMINUM COMPANY
NOTES TO THE CONSOLIDATED FINANCIAL STATEMENTS
(amounts in millions, except share and per share amounts)
|
•
|
Maintain a diversified exposure within the U.S. and international stock markets through the use of multi-manager portfolio strategies.
|
|
•
|
Achieve returns in excess of passive indexes through the use of active investment managers and strategies.
|
The strategic role of fixed income is to:
|
•
|
Diversify the Pension Plans’ equity exposure by investing in fixed income securities that exhibit a low correlation to equities, thereby lowering the overall return volatility of the entire investment portfolio.
|
|
•
|
Maintain a diversified exposure within the U.S. fixed income market through the use of multi-manager portfolio strategies.
|
|
•
|
Achieve returns in excess of passive indexes through the use of active investment managers and strategies.
|
The long-term strategic asset allocation policy is reviewed regularly or whenever significant changes occur to Century’s or the Pension Plans' financial position and liabilities.
Fair Value Measurements of Pension Plan assets
The following table sets forth by level the fair value hierarchy our Pension Plans' assets. These assets are classified in their entirety based on the lowest level of input that is significant to the fair value measurement. Our assessment of the significance of a particular input to the fair value measurement requires judgment, and may affect the valuation of fair value assets and liabilities and the placement within the fair value hierarchy levels.
Fair Value of Pension Plans’ assets included under the fair value hierarchy:
|
As of December 31, 2018
|
Level 1
|
Level 2
|
Level 3
|
Total
|
|||||||||||
|
Equities:
|
|
|
|
|
|||||||||||
|
U.S. equities
|
$
|
66.5
|
|
$
|
—
|
|
$
|
—
|
|
$
|
66.5
|
|
|||
|
International equities
|
49.0
|
|
—
|
|
—
|
|
49.0
|
|
|||||||
|
Fixed income
|
146.2
|
|
—
|
|
—
|
|
146.2
|
|
|||||||
|
Total
|
$
|
261.7
|
|
$
|
—
|
|
$
|
—
|
|
$
|
261.7
|
|
|||
|
As of December 31, 2017
|
|
|
|
|
|
|
|
|
|||||||
|
Equities:
|
|
|
|
|
|
|
|
|
|||||||
|
U.S. equities
|
$
|
86.5
|
|
$
|
—
|
|
$
|
—
|
|
$
|
86.5
|
|
|||
|
International equities
|
79.1
|
|
—
|
|
—
|
|
79.1
|
|
|||||||
|
Fixed income
|
137.7
|
|
—
|
|
—
|
|
137.7
|
|
|||||||
|
Total
|
$
|
303.3
|
|
$
|
—
|
|
$
|
—
|
|
$
|
303.3
|
|
|||
Our Pension Plans’ assets are held in certain mutual funds. The fair value of the mutual funds is based on the Net Asset Value ("NAV") which is calculated every business day. The value of the underlying securities within the mutual funds are determined as follows:
|
•
|
U.S. listed equities; equity and fixed income options: Last sale price; last bid price if no last sale price;
|
|
•
|
U.S. over-the-counter equities: Official closing price; last bid price if no closing price;
|
|
•
|
Foreign equities: Official closing price, where available, or last sale price; last bid price if no official closing price; and
|
|
•
|
Municipal bonds, US bonds, Eurobonds/foreign bonds: Evaluated bid price; broker quote if no evaluated bid price.
|
Our other postretirement benefit plans are unfunded. We fund these benefits as the retirees submit claims.
66
CENTURY ALUMINUM COMPANY
NOTES TO THE CONSOLIDATED FINANCIAL STATEMENTS
(amounts in millions, except share and per share amounts)
Pension and OPEB Cash Flows
During 2018 and 2017, we made contributions of approximately
$1.8 million
and
$1.8 million
, respectively, to the qualified defined benefit and SERB plans we sponsor.
We expect to make the following contributions for
2019
:
|
|
2019
|
||
|
Expected pension plan contributions
|
$
|
1.8
|
|
|
Expected OPEB benefits payments
|
7.5
|
|
|
Estimated Future Benefit Payments
The following table provides the estimated future benefit payments for the pension and other postretirement benefit plans:
|
|
Pension Benefits
|
OPEB Benefits
|
|||||
|
2019
|
$
|
20.6
|
|
$
|
7.5
|
|
|
|
2020
|
20.8
|
|
7.4
|
|
|||
|
2021
|
20.9
|
|
7.6
|
|
|||
|
2022
|
21.1
|
|
7.6
|
|
|||
|
2023
|
21.1
|
|
7.6
|
|
|||
|
2024 – 2028
|
100.6
|
|
37.0
|
|
|||
Participation in Multi-employer Pension Plans
The union-represented employees at Hawesville are part of a United Steel, Paper and Forestry, Rubber, Manufacturing, Energy, Allied Industrial and Service Workers International Union ("USWA") sponsored multi-employer plan. Our contributions to the plan are determined at a fixed rate per hour worked. Currently, we do not have any plans to withdraw from or curtail participation in this plan. The risks of participating in a multi-employer plan are different from single-employer plans in the following respects:
|
•
|
Assets contributed to the multi-employer plan by one employer may be used to provide benefits to employees of other participating employers.
|
|
•
|
If a participating employer stops contributing to the plan, the unfunded obligations of the plan may be borne by the remaining participating employers.
|
|
•
|
If a participating employer chooses to stop participating in a multi-employer plan, the employer may be required to pay the plan an amount based on the underfunded status of the plan, referred to as a withdrawal liability.
|
Century’s participation in the plan for the year ended December 31,
2018
, is outlined in the table below.
|
Fund
|
Steelworkers Pension Trust
|
|
|
EIN / PN
|
23-6648508/499
|
|
|
Pension Protection Act Zone Status 2018 (1)
|
Green
|
|
|
Pension Protection Act Zone Status 2017 (1)
|
Green
|
|
|
Subject to Financial Improvement/Rehabilitation Plan
|
No
|
|
|
Contributions of Century Aluminum 2018
|
$1.0
|
|
|
Contributions of Century Aluminum 2017
|
$0.8
|
|
|
Contributions of Century Aluminum 2016
|
$0.8
|
|
|
Withdrawal from Plan Probable
|
No
|
|
|
Surcharge Imposed
|
No
|
|
|
Expiration Date of Collective Bargaining Agreement
|
April 1, 2020
|
|
67
CENTURY ALUMINUM COMPANY
NOTES TO THE CONSOLIDATED FINANCIAL STATEMENTS
(amounts in millions, except share and per share amounts)
|
(1)
|
The most recent Pension Protection Act zone status available in
2018
and
2017
is for the plan's year-end December 31,
2017
and December 31,
2016
, respectively. The zone status is based on information that Century received from the plan as well as publicly available information per the Department of Labor and is certified by the plan’s actuary. Among other factors, plans in the green zone are at least 80 percent funded.
|
Century 401(k) Plans
We sponsor a tax-deferred savings plan under which eligible domestic employees may elect to contribute specified percentages of their compensation with Century. We match a portion of participants' contributions to the savings plan. Employee and matching contributions are considered fully vested immediately upon participation in the plan. Concurrent with the 2014 amendment to the Salaried Pension Plan that eliminated future accruals for participants who are under age
50
as of January 1, 2015 and closed the plan to new entrants, the Company increased the proportional match of contributions made to those affected by the amendment. The expense related to the plan was
$4.4 million
,
$4.5 million
, and
$3.9 million
for 2018, 2017, and 2016, respectively.
12. Share-based Compensation
Amended and Restated Stock Incentive Plan.
We award restricted share units and grant qualified incentive and nonqualified stock options to our salaried officers, non-employee directors, and other key employees from our Amended and Restated Stock Incentive Plan (the "Stock Incentive Plan"). The Stock Incentive Plan has
10,000,000
shares authorized for issuance with approximately
4,827,840
shares remaining at
December 31, 2018
. Our share-based compensation consists of service-based and performance-based share awards that typically vest over a period of
three
years from the date of grant, provided that the recipient is still our employee at the time of vesting. Our independent non-employee directors receive annual grants of service-based share awards that typically vest following
12
months of service. In the past, we have granted stock options that have a term of
10
years and typically vest
one-third
on the grant date and an additional
one-third
on the first and second anniversary dates of the grant. Our most recent grant of stock options was in 2009.
As of
December 31, 2018
, options to purchase
117,110
shares of common stock and
658,906
service-based share awards were outstanding.
A summary of activity under our Stock Incentive Plan during the year ended
December 31, 2018
is presented below:
|
Options
|
Number
|
Weighted Average Exercise Price
|
Weighted Average Remaining Contractual Term (years)
|
Aggregate Intrinsic Value
|
|||||||||
|
Outstanding at January 1, 2018
|
166,757
|
|
$
|
11.02
|
|
|
|
||||||
|
Exercised
|
(32,147
|
)
|
6.55
|
|
|
|
|||||||
|
Forfeited/expired
|
(17,500
|
)
|
49.18
|
|
|
|
|||||||
|
Outstanding, fully vested and exercisable at December 31, 2018
(1)
|
117,110
|
|
$
|
6.55
|
|
0.34
|
$
|
0.1
|
|
||||
|
(1)
|
As the result of actions in 2011 that were determined to be a "change of control" under the Stock Incentive Plan, all options will remain exercisable for their respective remaining term, regardless of whether the awardees remain employees of Century. All of the outstanding options at
December 31, 2018
have an exercise price of
$6.55
per share and expire in
May 2019
.
|
Long-Term Incentive
Plan. We also grant annual long-term incentive awards under our Amended and Restated Long-Term Incentive Plan (the "LTIP"). The LTIP is designed to provide senior-level employees the opportunity to earn long-term incentive awards through the achievement of performance goals and to align compensation with the interests of our stockholders. This is achieved by linking compensation to share price appreciation and total stockholder return over a multi-year period. Awards made under the LTIP are granted subject to the Stock Incentive Plan to the extent the award is deliverable in stock. We provide
two
types of LTIP awards: time-vested share units and performance units.
68
CENTURY ALUMINUM COMPANY
NOTES TO THE CONSOLIDATED FINANCIAL STATEMENTS
(amounts in millions, except share and per share amounts)
Time-vested share units are stock-settled awards which do not contain any performance-based vesting requirements. Performance units can be settled in cash or stock and vest based on the achievement of pre-determined performance metrics at the discretion of the Board. Our performance unit liability was approximately $
2.2 million
and
$7.5 million
as of
December 31, 2018
and
2017
, respectively. Both the performance units and time-vested share units vest, in their entirety, after
three
years.
|
Service-based share awards
|
Number
|
||
|
Outstanding at January 1, 2018
|
845,408
|
|
|
|
Granted
|
295,434
|
|
|
|
Vested
|
(443,265
|
)
|
|
|
Forfeited
|
(38,671
|
)
|
|
|
Outstanding at December 31, 2018
|
658,906
|
|
|
|
|
Year ended December 31,
|
||||||||||
|
Service-based share awards
|
2018
|
2017
|
2016
|
||||||||
|
Weighted average per share fair value of service-based share grants
|
$
|
20.21
|
|
$
|
8.92
|
|
$
|
7.14
|
|
||
|
Total intrinsic value of option exercises
|
444
|
|
624
|
|
—
|
|
|||||
Fair Value Measurement of Share-Based Compensation Awards.
We estimate the fair value of each stock option award using the Black-Scholes model on the date of grant. We have not granted any stock options since 2009. For our service-based awards, fair value is equal to the closing stock price on the date of grant. For our performance-based awards, fair value is equal to the closing stock price at each reporting period end.
The following table summarizes the compensation cost recognized for the years ended December 31,
2018
,
2017
and
2016
for all options, service-based and performance-based share awards. The compensation cost is included as part of selling, general and administrative expenses in our Consolidated Statements of Operations.
|
|
Year ended December 31,
|
||||||||||
|
|
2018
|
2017
|
2016
|
||||||||
|
Share-based compensation expense reported:
|
|
|
|
||||||||
|
Performance-based share expense
|
$
|
(0.1
|
)
|
$
|
4.0
|
|
$
|
2.4
|
|
||
|
Service-based share expense
|
3.8
|
|
3.4
|
|
2.1
|
|
|||||
|
Total share-based compensation expense before income tax
|
3.7
|
|
7.4
|
|
4.5
|
|
|||||
|
Income tax
|
—
|
|
—
|
|
—
|
|
|||||
|
Total share-based compensation expense, net of income tax
|
$
|
3.7
|
|
$
|
7.4
|
|
$
|
4.5
|
|
||
No share-based compensation cost was capitalized during these periods and there were no significant modifications of any share-based awards in
2018
,
2017
and
2016
. As of December 31,
2018
, we had unrecognized compensation cost of
$6.6 million
before taxes. This cost will be recognized over a weighted average period of
two years
.
13. Earnings (Loss) Per Share
Basic EPS amounts are calculated by dividing net income (loss) allocated to common stockholders by the weighted average number of common shares outstanding. Diluted EPS amounts assume the issuance of common stock for all potentially dilutive common shares outstanding.
69
CENTURY ALUMINUM COMPANY
NOTES TO THE CONSOLIDATED FINANCIAL STATEMENTS
(amounts in millions, except share and per share amounts)
The following table shows the basic and diluted earnings (loss) per share for
2018
,
2017
, and
2016
:
|
|
For the year ended December 31, 2018
|
|||||||||
|
|
Net (Loss)
|
Shares
(in millions)
|
Per Share
|
|||||||
|
Net loss
|
$
|
(66.2
|
)
|
|
|
|||||
|
Amount allocated to common stockholders
|
100
|
%
|
|
|
|
|||||
|
Basic and Diluted EPS:
(1)
|
$
|
(66.2
|
)
|
87.6
|
|
$
|
(0.76
|
)
|
||
|
|
For the year ended December 31, 2017
|
|||||||||
|
|
Net Income
|
Shares
(in millions)
|
Per Share
|
|||||||
|
Net income
|
$
|
48.6
|
|
|
|
|||||
|
Amount allocated to common stockholders
|
92
|
%
|
|
|
|
|||||
|
Basic EPS:
|
|
|
|
|
|
|||||
|
Net income allocated to common stockholders
|
$
|
44.7
|
|
87.3
|
|
$
|
0.51
|
|
||
|
Effect of dilutive securities:
|
||||||||||
|
Share-based compensation
|
0.7
|
|
||||||||
|
Diluted EPS:
|
$
|
44.7
|
|
88.0
|
|
$
|
0.51
|
|
||
|
|
For the year ended December 31, 2016
|
|||||||||
|
|
Net (Loss)
|
Shares
(in millions)
|
Per Share
|
|||||||
|
Net loss
|
$
|
(252.4
|
)
|
|
|
|||||
|
Amount allocated to common stockholders
|
100
|
%
|
|
|
|
|||||
|
Basic and Diluted EPS:
(1)
|
$
|
(252.4
|
)
|
87.1
|
|
$
|
(2.90
|
)
|
||
|
Securities excluded from the calculation of diluted EPS (in millions):
|
2018
(1)
|
2017
|
2016
(1)
|
|||||
|
Share-based compensation
|
1.4
|
|
0.6
|
|
0.9
|
|
||
|
(1)
|
In periods when we report a net loss, all share-based compensation awards are excluded from the calculation of diluted weighted average shares outstanding because of their anti-dilutive effect on earnings (loss) per share.
|
14. Income Taxes
On December 22, 2017, the President of the United States signed into law tax reform legislation (informally known as the Tax Cuts and Jobs Act (the “Act” or “Tax Act”)) that made significant changes to various areas of U.S. federal income tax law. The Tax Act reduced the U.S. federal corporate tax rate from 35 percent to 21 percent, required companies to pay a one-time transition tax on earnings of certain foreign subsidiaries that were previously tax deferred, created new taxes on certain foreign earnings, acceleration of expensing of certain business assets and reductions in the amount of executive pay that could qualify as a tax deduction.
ASC 740 requires us to recognize the effect of the tax law changes in the period of enactment. However, the SEC staff issued Staff Accounting Bulletin (SAB) 118 which allowed us to record provisional amounts during a measurement period which is similar to the measurement period used when accounting for business combinations. As of December 31, 2017, in accordance with SAB 118, the Company made a reasonable estimate of: (i) the one-time transition tax, and (ii) the effects on the Company’s existing deferred tax balances. In the current period, the Company finalized its accounting for the tax effects of enactment of the Tax Act and concluded that no material adjustments were required as of December 31, 2018.
70
CENTURY ALUMINUM COMPANY
NOTES TO THE CONSOLIDATED FINANCIAL STATEMENTS
(amounts in millions, except share and per share amounts)
In January 2018, the FASB released guidance on the accounting for tax on the global intangible low-taxed income ("GILTI") provisions of the Tax Act. The GILTI provisions impose a tax on foreign income in excess of a deemed return on tangible assets of foreign corporations. U.S. GAAP allows companies to make an accounting policy election to either treat taxes due on future GILTI inclusions in U.S. taxable income as a current-period expense when incurred (“period cost method”) or factor such amounts into the measurement of its deferred taxes (“deferred method”). We have elected to use the period cost method and the impact was immaterial.
|
The components of pre-tax book income (loss) consist of the following:
|
|||||||||||
|
|
Year Ended December 31,
|
||||||||||
|
|
2018
|
2017
|
2016
|
||||||||
|
U.S.
|
$
|
(39.7
|
)
|
$
|
26.8
|
|
$
|
(86.6
|
)
|
||
|
Foreign
|
(30.9
|
)
|
28.6
|
|
(164.3
|
)
|
|||||
|
Total
|
$
|
(70.6
|
)
|
$
|
55.4
|
|
$
|
(250.9
|
)
|
||
|
Significant components of income tax expense consist of the following:
|
|||||||||||
|
|
Year Ended December 31,
|
||||||||||
|
|
2018
|
2017
|
2016
|
||||||||
|
Current:
|
|
|
|
||||||||
|
U.S. federal current expense (benefit)
|
$
|
0.0
|
|
$
|
(0.1
|
)
|
$
|
(0.2
|
)
|
||
|
State current expense (benefit)
|
(1.1
|
)
|
1.2
|
|
(0.1
|
)
|
|||||
|
Foreign current expense
|
0.8
|
|
12.3
|
|
5.7
|
|
|||||
|
Total current expense (benefit)
|
(0.3
|
)
|
13.4
|
|
5.4
|
|
|||||
|
Deferred:
|
|
|
|
|
|
|
|||||
|
U.S. federal deferred benefit
|
(1.6
|
)
|
(2.5
|
)
|
(1.6
|
)
|
|||||
|
State deferred benefit
|
—
|
|
(0.0
|
)
|
—
|
|
|||||
|
Foreign deferred tax expense (benefit)
|
1.7
|
|
(3.3
|
)
|
(1.0
|
)
|
|||||
|
Total deferred expense (benefit)
|
0.1
|
|
(5.8
|
)
|
(2.6
|
)
|
|||||
|
Total income tax expense (benefit)
|
$
|
(0.2
|
)
|
$
|
7.6
|
|
$
|
2.8
|
|
||
|
A reconciliation of the statutory U.S. Federal income tax rate to the effective income tax rate on income (loss) is as follows:
|
||||||||
|
|
2018
|
2017
|
2016
|
|||||
|
Federal Statutory Rate
|
21.0
|
%
|
35.0
|
%
|
35.0
|
%
|
||
|
Permanent differences
|
(25.7
|
)
|
57.5
|
|
7.7
|
|
||
|
State taxes, net of Federal benefit
|
3.5
|
|
(6.6
|
)
|
6.1
|
|
||
|
Rate change
|
(0.6
|
)
|
370.5
|
|
(4.2
|
)
|
||
|
Foreign earnings taxed at different rates than U.S.
|
11.8
|
|
(40.5
|
)
|
(13.5
|
)
|
||
|
Valuation allowance
|
81.2
|
|
(401.4
|
)
|
(27.5
|
)
|
||
|
Transition tax
|
(13.8
|
)
|
—
|
|
—
|
|
||
|
Net operating loss expiration and remeasurement
|
(75.8
|
)
|
—
|
|
—
|
|
||
|
Changes in uncertain tax reserves
|
(1.4
|
)
|
3.8
|
|
(1.0
|
)
|
||
|
Other
|
0.1
|
|
(4.6
|
)
|
(3.7
|
)
|
||
|
Effective tax rate
|
0.3
|
%
|
13.7
|
%
|
(1.1
|
)%
|
||
For the period ending December 31, 2018, the effective tax rate of
0.3%
was lower than the statutory US tax rate of 21% primarily as a result of the non-recognition of current year domestic and foreign losses.
71
CENTURY ALUMINUM COMPANY
NOTES TO THE CONSOLIDATED FINANCIAL STATEMENTS
(amounts in millions, except share and per share amounts)
For the period ending December 31, 2017, the Company’s U.S. deferred tax asset and related valuation allowance decreased by
$205.2 million
as a result of the Act in 2017. As the U.S. deferred tax asset had a full valuation allowance, this change in rate from 35% to 21% had no impact on the Company’s financial position or results of operations. The increase in permanent differences is a result of tax law changes related to our foreign operations. The effect of earnings of foreign subsidiaries includes the difference between the U.S. statutory rate and local jurisdiction tax rates.
Deferred income taxes reflect the net tax effects of temporary differences between the carrying amounts of assets and liabilities for financial reporting purposes and the amounts used for income tax purposes.
The significant components of our deferred tax assets and liabilities as of December 31 are as follows:
|
|
2018
|
2017
|
|||||
|
Deferred tax assets:
|
|
|
|||||
|
Accrued postretirement benefit cost
|
$
|
40.3
|
|
$
|
39.4
|
|
|
|
Accrued liabilities
|
10.9
|
|
3.1
|
|
|||
|
Share-based compensation
|
2.1
|
|
1.3
|
|
|||
|
Goodwill
|
0.4
|
|
2.0
|
|
|||
|
Net operating losses and tax credits
|
482.8
|
|
551.1
|
|
|||
|
Foreign basis differences
|
13.5
|
|
13.9
|
|
|||
|
Ravenswood retiree legal settlement
|
2.4
|
|
3.1
|
|
|||
|
Other
|
1.9
|
|
3.1
|
|
|||
|
Total deferred tax assets
|
554.3
|
|
617.0
|
|
|||
|
Valuation allowance
|
(552.5
|
)
|
(607.8
|
)
|
|||
|
Net deferred tax assets
|
$
|
1.8
|
|
$
|
9.2
|
|
|
|
Deferred tax liabilities:
|
|
|
|
|
|||
|
Tax over financial statement depreciation
|
$
|
(103.9
|
)
|
$
|
(109.7
|
)
|
|
|
Total deferred tax liabilities
|
(103.9
|
)
|
(109.7
|
)
|
|||
|
Net deferred tax liability
|
$
|
(102.1
|
)
|
$
|
(100.5
|
)
|
|
We regularly assess the likelihood that deferred tax assets will be recovered from future taxable income. To the extent we believe that it is more likely than not that a deferred tax asset will not be realized, a valuation allowance is established. When a valuation allowance is established or increased, an income tax charge is included in the consolidated statement of operations and net deferred tax assets are adjusted accordingly. Future changes in tax laws, statutory tax rates and taxable income levels could result in actual realization of the deferred tax assets being materially different from the amounts provided for in the consolidated financial statements. If the actual recovery amount of the deferred tax asset is less than anticipated, we would be required to write-off the remaining deferred tax asset and increase the tax provision.
We have a valuation allowance of
$552.5 million
recorded for all of our U.S. deferred tax assets, and a portion of our Icelandic deferred tax assets as of December 31, 2018. The Company is subject to the provisions of ASC 740-10, Income Taxes, which requires that the effect on deferred tax assets and liabilities of a change in tax rates be recognized in the period the tax rate change was enacted. The overall reduction in deferred tax assets, and the related valuation allowances, are primarily a result of the enactment of the Tax Act in 2017 and the expiration of certain NOLs.
The changes in the valuation allowance are as follows:
72
CENTURY ALUMINUM COMPANY
NOTES TO THE CONSOLIDATED FINANCIAL STATEMENTS
(amounts in millions, except share and per share amounts)
|
|
2018
|
2017
|
2016
|
||||||||
|
Beginning balance, valuation allowance
|
$
|
607.8
|
|
$
|
839.1
|
|
$
|
768.8
|
|
||
|
Remeasurement of deferred tax assets
|
(32.1
|
)
|
(205.2
|
)
|
—
|
|
|||||
|
Release of valuation allowance
|
—
|
|
—
|
|
(6.0
|
)
|
|||||
|
Expiration of net operating losses
|
(12.3
|
)
|
—
|
|
—
|
|
|||||
|
Other change in valuation allowance
|
(11.0
|
)
|
(26.1
|
)
|
76.3
|
|
|||||
|
Ending balance, valuation allowance
|
$
|
552.5
|
|
$
|
607.8
|
|
$
|
839.1
|
|
||
The significant components of our net operating loss carryforwards ("NOLs") are as follows:
|
|
2018
|
2017
|
|||||
|
Federal
(1)
|
$
|
1,470.4
|
|
$
|
1,514.2
|
|
|
|
State
(2)
|
2,205.0
|
|
2,480.5
|
|
|||
|
Foreign
(3)
|
398.2
|
|
532.6
|
|
|||
|
(1)
|
The federal NOL begins to expire in
2028
.
|
|
(2)
|
The state NOLs begin to expire in
2027
.
|
|
(3)
|
The Icelandic NOL begins to expire in 2019; the Netherlands NOL begins to expire in
2022
.
|
Our ability to utilize our deferred tax assets to offset future federal taxable income may be significantly limited if we experience an "ownership change" as defined in the Code. In general, an ownership change would occur if our "five-percent shareholders," as defined under the Code, collectively increase their ownership in us by more than 50 percentage points over a rolling three-year period. Future transactions in our stock that may not be in our control may cause us to experience such an ownership change and thus limit our ability to utilize net operating losses, tax credits and other tax assets to offset future taxable income.
A reconciliation of the beginning and ending amounts of gross unrecognized tax positions (excluding interest) is as follows:
|
|
2018
|
2017
|
2016
|
||||||||
|
Balance as of January 1,
|
$
|
8.4
|
|
$
|
6.4
|
|
$
|
3.8
|
|
||
|
Additions based on tax positions related to the current year
|
2.0
|
|
2.1
|
|
2.7
|
|
|||||
|
Decreases due to lapse of applicable statute of limitations
|
(0.9
|
)
|
(0.1
|
)
|
(0.1
|
)
|
|||||
|
Settlements
|
—
|
|
—
|
|
—
|
|
|||||
|
Balance as of December 31,
|
$
|
9.5
|
|
$
|
8.4
|
|
$
|
6.4
|
|
||
Included in the above balances are tax positions whose tax characterization is highly certain but for which there is uncertainty about the timing of tax return inclusion. Because of the impact of deferred tax accounting, other than interest and penalties, the timing would not impact the annual effective tax rate but could accelerate the payment of cash to the taxing authority to an earlier period. The remaining amounts of unrecognized tax positions would affect our effective tax rate if recognized. It is our policy to recognize potential accrued interest and penalties related to unrecognized tax positions in income tax expense.
The components of our unrecognized tax positions are as follows:
|
|
2018
|
2017
|
2016
|
||||||||
|
Highly certain tax positions
|
$
|
7.9
|
|
$
|
8.3
|
|
$
|
6.3
|
|
||
|
Other unrecognized tax benefits
|
1.6
|
|
0.1
|
|
0.1
|
|
|||||
|
Gross unrecognized tax benefits
|
$
|
9.5
|
|
$
|
8.4
|
|
$
|
6.4
|
|
||
|
Accrued interest and penalties related to unrecognized tax positions
|
$
|
0.1
|
|
$
|
0.0
|
|
$
|
—
|
|
||
We do not expect a significant change in the balance of unrecognized tax benefits within the next twelve months.
73
CENTURY ALUMINUM COMPANY
NOTES TO THE CONSOLIDATED FINANCIAL STATEMENTS
(amounts in millions, except share and per share amounts)
Century and its subsidiaries file income tax returns in the U.S. federal jurisdiction, various state and local jurisdictions, and several foreign jurisdictions.
Our federal income tax returns have been reviewed by the IRS through 2010. However, we have NOLs beginning in 2008 that are available for carryforward to future years. Under U.S. tax law, NOLs may be adjusted by the IRS until the statute of limitations expires for the year in which the NOL is used. Accordingly, our 2008 and later NOLs may be reviewed until they are used or expire. Material state and local income tax matters have been concluded for years through 2006. The majority of our state returns beginning in 2008 are subject to examination.
Our Icelandic tax returns are subject to examination beginning with the 2013 tax year.
As of December 31, 2018 and 2017 we had income taxes payable of
$0.4 million
and
$12.2 million
, respectively. The income taxes payable are included within accrued and other current liabilities in our Consolidated Balance Sheets.
15. Commitments and Contingencies
Environmental Contingencies
Based upon all available information, we believe our current environmental liabilities do not have, and are not likely to have, a material adverse effect on our financial condition, results of operations or liquidity. However, because of the inherent uncertainties in estimating environmental liabilities primarily due to unknown facts and circumstances and changing governmental regulations and legal standards regarding liability, there can be no assurance that future capital expenditures and costs for environmental compliance at currently or formerly owned or operated properties will not result in liabilities that may have a material adverse effect on our financial condition, results of operations or liquidity.
It is our policy to accrue for costs associated with environmental assessments and remedial efforts when it becomes probable that a liability has been incurred and the costs can be reasonably estimated. All accrued amounts have been recorded without giving effect to any possible future recoveries. Costs for ongoing environmental compliance, including maintenance and monitoring are expensed as incurred.
Vernon
In July 2006, we were named as a defendant, together with certain affiliates of Alcan Inc., in a lawsuit brought by Alcoa Inc. seeking to determine responsibility for certain environmental indemnity obligations related to the sale of a cast aluminum plate manufacturing facility located in Vernon, California, which we purchased from Alcoa Inc. in December 1998, and sold to Alcan Rolled Products-Ravenswood LLC in July 1999. The complaint also seeks costs and attorney fees. The matter was stayed by the court in 2008 to allow for the remediation of environmental areas at the site. On June 30, 2016, the U.S. District Court for the District of Delaware ordered the stay lifted and reopened the case. Discovery is expected to be completed in the second quarter of 2019, and trial is currently set to begin in the second quarter of 2020. At this stage, we cannot predict the ultimate outcome of this action or estimate a range of possible losses related to this matter.
Matters relating to the St. Croix Alumina Refining Facility
We are a party to a United States Environmental Protection Agency Administrative Order on Consent (the "Order") pursuant to which certain past and present owners of an alumina refining facility at St. Croix, Virgin Islands (the "St. Croix Alumina Refinery") have agreed to carry out a Hydrocarbon Recovery Plan to remove and manage hydrocarbons floating on groundwater underlying the facility. Pursuant to the Hydrocarbon Recovery Plan, recovered hydrocarbons and groundwater are delivered to the adjacent petroleum refinery where they are received and managed. At this time, we are not able to estimate the amount of any future potential payments under this indemnification to comply with the Order, but we do not anticipate that any such amounts will have a material adverse effect on our financial condition, results of operations or liquidity, regardless of the final outcome.
74
CENTURY ALUMINUM COMPANY
NOTES TO THE CONSOLIDATED FINANCIAL STATEMENTS
(amounts in millions, except share and per share amounts)
In December 2010, Century was among several defendants named in a lawsuit filed by plaintiffs who either worked, resided or owned property in the area downwind from the St. Croix Alumina Refinery. In March 2011, Century was also named a defendant in a nearly identical suit brought by certain additional plaintiffs. The plaintiffs in both suits allege damages caused by the presence of red mud and other particulates coming from the alumina facility and are seeking unspecified monetary damages, costs and attorney fees as well as certain injunctive relief. We tendered indemnity and defense to St. Croix Alumina LLC and Alcoa Alumina & Chemical LLC under the terms of an acquisition agreement relating to the facility and have filed motions to dismiss plaintiffs’ claims. In August 2015, the Superior Court of the Virgin Islands, Division of St. Croix denied the motions to dismiss but ordered all plaintiffs to refile individual complaints. On February 28, 2018, plaintiffs in both cases filed a Motion for Voluntary Dismissal of Century without prejudice to refiling. At this time, it is not possible to predict the ultimate outcome of or to estimate a range of possible losses for any of the foregoing actions relating to the St. Croix Alumina Refinery.
Legal Contingencies
In addition to the foregoing matters, we have pending against us or may be subject to various lawsuits, claims and proceedings related primarily to employment, commercial, stockholder, safety and health matters. While the results of such litigation matters and claims cannot be predicted with certainty, we believe that the final outcome of such matters will not have a material adverse impact on our financial condition, results of operations or liquidity. However, because of the nature and inherent uncertainties of litigation, should the outcome of these actions be unfavorable, our business, financial condition, results of operations and liquidity could be materially and adversely affected.
In evaluating whether to accrue for losses associated with legal contingencies, it is our policy to take into consideration factors such as the facts and circumstances asserted, our historical experience with contingencies of a similar nature, the likelihood of our prevailing and the severity of any potential loss. For some matters, no accrual is established because we have assessed our risk of loss to be remote. Where the risk of loss is probable and the amount of the loss can be reasonably estimated, we record an accrual, either on an individual basis or with respect to a group of matters involving similar claims, based on the factors set forth above.
When we have assessed that a loss associated with legal contingencies is reasonably possible, we determine if estimates of possible losses or ranges of possible losses are in excess of related accrued liabilities, if any. Based on current knowledge, management has ascertained estimates for losses that are reasonably possible and management does not believe that any reasonably possible outcomes in excess of our accruals, if any, either individually or in aggregate, would be material to our financial condition, results of operations, or liquidity. We reevaluate and update our assessments and accruals as matters progress over time.
Ravenswood Retiree Medical Benefits changes
In November 2009, Century Aluminum of West Virginia ("CAWV") filed a class action complaint for declaratory judgment against the United Steel, Paper and Forestry, Rubber, Manufacturing, Energy, Allied Industrial and Service Workers International Union ("USW"), the USW’s local and certain CAWV retirees, individually and as class representatives ("CAWV Retirees"), seeking a declaration of CAWV’s rights to modify/terminate retiree medical benefits. Later in November 2009, the USW and representatives of a retiree class filed a separate suit against CAWV, Century Aluminum Company, Century Aluminum Master Welfare Benefit Plan, and various John Does with respect to the foregoing.
On August 18, 2017, the District Court for the Southern District of West Virginia approved a settlement agreement in respect of these actions. Under the terms of the settlement agreement, CAWV agreed to make payments into a trust for the benefit of the CAWV Retirees in the aggregate amount of $
23.0 million
over the course of
10
years. Upon approval of the settlement, we paid $
5.0 million
to the aforementioned trust in September 2017 and recognized a gain of
$5.5 million
to arrive at the-then net present value of the
$12.5 million
. CAWV has agreed to pay the remaining amounts under the settlement agreement in annual increments of
$2.0 million
for
nine
years. As of December 31, 2018,
$2.0 million
was recorded in other current liabilities and $
9.8 million
was recorded in other liabilities.
PBGC Settlement
In 2013, we entered into a settlement agreement with the Pension Benefit Guarantee Corporation (the "PBGC") regarding an alleged "cessation of operations" at our Ravenswood facility. Pursuant to the terms of the agreement, we agreed to make additional contributions (above any minimum required contributions) to our defined benefit pension plans totaling approximately
$17.4 million
. Under certain circumstances, in periods of lower primary aluminum prices relative to our cost of operations, we are able to defer one or more of these payments, provided that we provide the PBGC with acceptable security for
75
CENTURY ALUMINUM COMPANY
NOTES TO THE CONSOLIDATED FINANCIAL STATEMENTS
(amounts in millions, except share and per share amounts)
such deferred payments. We did not make any contributions during the years ended December 31, 2018, 2017 and 2016. We have elected to defer certain payments under the PBGC agreement and have provided the PBGC with the appropriate security. The remaining contributions under this agreement are approximately
$9.6 million
.
Power Commitments and Contingencies
Hawesville
Hawesville has a power supply arrangement with Kenergy and EDF Trading North America, LLC (“EDF") which provides market-based power to the Hawesville smelter. Under this arrangement, the power companies purchase power on the open market and pass it through to Hawesville at Midcontinent Independent System Operator ("MISO") pricing plus transmission and other costs. The power supply arrangement with Kenergy has an effective term through December 2023. The arrangement with EDF to act as our market participant with MISO has an effective term through May 2020. Each of these agreements provides for automatic extension on a year-to-year basis unless a
one year
notice is given.
Sebree
Sebree has a power supply arrangement with Kenergy and EDF which provides market-based power to the Sebree smelter. Similar to the arrangement at Hawesville, the power companies purchase power on the open market and pass it through to Sebree at MISO pricing plus transmission and other costs. The power supply arrangement with Kenergy has an effective term through December 2023. The arrangement with EDF to act as our market participant with MISO has an effective term through May 2020. Each of these agreements provides for automatic extension on a year-to-year basis unless a
one year
notice is given.
Mt. Holly
Mt. Holly has a power supply arrangement pursuant to which
25%
of the Mt. Holly load is served from the South Carolina Public Service Authority’s ("Santee Cooper") generation at a cost-based industrial rate and
75%
of the Mt. Holly load is sourced from a supplier that is outside Santee Cooper’s service territory at market prices that are tied to natural gas prices. The agreement with Santee Cooper has a term through December 31, 2020 and can be terminated by Mt. Holly on a
120
days' notice. The agreement with the other power supplier has a term through December 31, 2020 and may be terminated by Mt. Holly on
60
days' notice.
Grundartangi
Grundartangi has power purchase agreements for approximately
525
MW with HS Orka hf ("HS"), Landsvirkjun and Orkuveita Reykjavikur ("OR") to provide power to its Grundartangi smelter. These power purchase agreements expire on various dates from 2019 through 2036 (subject to extension). The power purchase agreements with HS and OR both provide power at LME-based variable rates for the duration of these agreements. The power purchase agreement with Landsvirkjun for
161
MW provides power at LME-based variable rates through October 2019 and rates linked to the Nord Pool power market from November 2019 through the expiration of the agreement on December 31, 2023.
Helguvik
Nordural Helguvik ehf ("Helguvik") has a power purchase agreement with OR to provide a portion of the power requirements to the Helguvik project. The agreement would provide power at LME-based variable rates and contain take-or-pay obligations with respect to a significant percentage of the total committed and available power under such agreement. The first phase of power under the OR purchase agreement (approximately
47.5
MW) became available in the fourth quarter of 2011 and is currently being utilized at Grundartangi. The agreement also contains certain conditions to OR’s obligations with respect to the remaining phases and OR has alleged that certain of these conditions have not been satisfied. We are in discussions with OR with respect to such conditions and other matters pertaining to this agreement.
Other Commitments and Contingencies
Labor Commitments
The bargaining unit employees at our Grundartangi, Vlissingen, Hawesville and Sebree facilities are represented by labor unions, representing approximately
65%
of our total workforce.
76
CENTURY ALUMINUM COMPANY
NOTES TO THE CONSOLIDATED FINANCIAL STATEMENTS
(amounts in millions, except share and per share amounts)
Approximately
84%
of Grundartangi’s work force is represented by
five
labor unions, governed by a labor agreement which is effective through December 31, 2019 that establishes wages and work rules for covered employees.
100%
of Vlissingen's work force is represented by the Federation for the Metal and Electrical Industry ("FME") by a labor agreement that is effective through December 1, 2020.
Approximately
57%
of our U.S. based work force is represented by USW. The labor agreement for Hawesville employees is effective through April 1, 2020. Century Sebree's labor agreement with the USW for its employees is effective through October 28, 2023. Mt. Holly employees are not represented by a labor union.
16. Asset Retirement Obligations
The reconciliation of the changes in our AROs is presented below:
|
|
Year ended December 31,
|
||||||
|
|
2018
|
2017
|
|||||
|
Beginning balance, ARO liability
|
$
|
28.5
|
|
$
|
35.4
|
|
|
|
Additional ARO liability incurred
|
3.6
|
|
1.4
|
|
|||
|
ARO liabilities settled
|
(6.5
|
)
|
(9.9
|
)
|
|||
|
Accretion expense
|
1.9
|
|
1.9
|
|
|||
|
Revisions in estimated cash flows
|
(9.3
|
)
|
(0.3
|
)
|
|||
|
Ending balance, ARO liability
|
$
|
18.2
|
|
$
|
28.5
|
|
|
Revisions in estimated cash flows during 2018 were related to a change in estimate of future disposal costs of spent potliners.
17. Quarterly Information (Unaudited)
Financial results by quarter for the years ended December 31,
2018
and
2017
are as follows:
|
|
Net sales
|
Gross profit (loss)
|
Net income (loss)
|
Net income (loss) allocated to common stockholders
|
Basic
earnings (loss) per share
|
Diluted earnings (loss) per share
|
|||||||||||||||||
|
2018
|
|
|
|
|
|
||||||||||||||||||
|
4th Quarter
(1)
|
$
|
486.9
|
|
$
|
(59.3
|
)
|
$
|
(65.0
|
)
|
$
|
(65.0
|
)
|
$
|
(0.74
|
)
|
$
|
(0.74
|
)
|
|||||
|
3rd Quarter
(2)
|
481.8
|
|
(11.8
|
)
|
(20.3
|
)
|
(20.3
|
)
|
(0.23
|
)
|
(0.23
|
)
|
|||||||||||
|
2nd Quarter
(3)
|
470.0
|
|
33.7
|
|
19.4
|
|
17.9
|
|
0.20
|
|
0.20
|
|
|||||||||||
|
1st Quarter
|
454.5
|
|
14.5
|
|
(0.3
|
)
|
(0.3
|
)
|
(0.00
|
)
|
(0.00
|
)
|
|||||||||||
|
2017
|
|
|
|
|
|
|
|
|
|
|
|||||||||||||
|
4th Quarter
(4)
|
$
|
433.9
|
|
$
|
47.9
|
|
$
|
35.8
|
|
$
|
33.0
|
|
$
|
0.38
|
|
$
|
0.37
|
|
|||||
|
3rd Quarter
|
400.6
|
|
41.4
|
|
20.8
|
|
19.1
|
|
0.22
|
|
0.22
|
|
|||||||||||
|
2nd Quarter
|
388.8
|
|
22.5
|
|
7.1
|
|
6.6
|
|
0.08
|
|
0.07
|
|
|||||||||||
|
1st Quarter
(5)
|
365.8
|
|
16.8
|
|
(15.1
|
)
|
(15.1
|
)
|
(0.17
|
)
|
(0.17
|
)
|
|||||||||||
|
(1)
|
The fourth quarter of 2018 was unfavorably impacted by realization of a lower of cost or net realizable value adjustment of
$30.6 million
.
|
|
(2)
|
The third quarter of 2018 was favorably impacted by a
$4.5 million
gain on the extinguishment of the remainder of our contractual commitments associated with the construction of the Helguvik project.
|
|
(3)
|
The second quarter of 2018 reflects our temporary curtailment of one potline at our Sebree aluminum smelter due to an equipment failure that was brought back online in the third quarter.
|
77
CENTURY ALUMINUM COMPANY
NOTES TO THE CONSOLIDATED FINANCIAL STATEMENTS
(amounts in millions, except share and per share amounts)
|
(4)
|
The fourth quarter of 2017 was favorably impacted by a
$7.3
million gain on the extinguishment of a portion of our contractual commitments associated with the construction of the Helguvik project.
|
|
(5)
|
The first quarter of 2017 was unfavorably impacted by net losses on forward and derivative contracts of
$16.1
million.
|
18. Business Segments
Century Aluminum is a producer of primary aluminum, which trades as a global commodity. We are organized as a holding company with each of our operating primary aluminum smelters managed and operated as a separate facility reporting to our corporate headquarters. Each of our operating primary aluminum smelters meets the definition of an operating segment. We evaluated the similar economic and other characteristics, including nearly identical products, production processes, customers and distribution and have aggregated our
four
operating segments into
one
reportable segment, primary aluminum, based on these factors. In addition, all of our primary aluminum smelters share several key economic factors inherent in their common products and production processes. For example, all of our facilities' revenue is based on the LME price for primary aluminum.
A reconciliation of our consolidated assets to the total of primary aluminum segment assets is provided below.
|
Segment assets
(1)
|
2018
|
2017
|
2016
|
||||||||
|
Primary
|
$
|
1,480.7
|
|
$
|
1,531.0
|
|
$
|
1,493.0
|
|
||
|
Corporate, unallocated
|
56.8
|
|
50.6
|
|
47.3
|
|
|||||
|
Total assets
|
$
|
1,537.5
|
|
$
|
1,581.6
|
|
$
|
1,540.3
|
|
||
|
(1)
|
Segment assets include accounts receivable, due from affiliates, prepaid and other current assets, inventory, intangible assets and property, plant and equipment — net; the remaining assets are unallocated corporate assets.
|
Geographic information
Included in the consolidated financial statements are the following amounts related to geographic locations:
|
|
2018
|
2017
|
2016
|
||||||||
|
Net sales:
|
|
|
|
||||||||
|
United States
|
$
|
1,138.6
|
|
$
|
938.4
|
|
$
|
808.9
|
|
||
|
Iceland
|
754.6
|
|
650.7
|
|
510.2
|
|
|||||
|
Long-lived assets:
(1)
|
|
|
|
|
|
|
|||||
|
United States
|
$
|
396.0
|
|
$
|
370.0
|
|
$
|
395.1
|
|
||
|
Iceland
|
554.3
|
|
583.0
|
|
625.9
|
|
|||||
|
Other
|
76.5
|
|
75.0
|
|
78.7
|
|
|||||
|
(1)
|
Includes long-lived assets other than financial instruments and deferred taxes.
|
Major customer information
In 2018, revenues from two customers exceeded
10%
of our net sales compared to one customer in 2017 and 2016. A loss of these customers could have a material adverse effect on our results of operations. The net sales related to the customers is as follows:
|
|
Year Ended December 31,
|
||||||||||
|
|
2018
|
2017
|
2016
|
||||||||
|
Glencore
|
$
|
1,204.5
|
|
$
|
1,198.1
|
|
$
|
1,178.6
|
|
||
|
Southwire
|
222.4
|
|
77.2
|
|
—
|
|
|||||
78
CENTURY ALUMINUM COMPANY
NOTES TO THE CONSOLIDATED FINANCIAL STATEMENTS
(amounts in millions, except share and per share amounts)
19. Derivatives
As of December 31, 2018, we had an open position of
58,106
tonnes related to LME forward financial sales contracts to fix the forward LME price. These contracts are expected to settle monthly, between November 2019 and December 2020. In 2018, we also entered into Midwest Premium ("MWP") forward financial sales contracts to fix the forward MWP price. These contracts are expected to settle monthly through December 2019. As of December 31, 2018, we had an open position of
36,000
tonnes.
We have financial contracts with various counterparties to offset fixed price sales arrangements with certain of our customers (the “fixed for floating swaps”) to remain exposed to the LME price. As of December 31, 2018, we had open positions related to such arrangements of 12,019 tonnes settling at various dates through March 2020.
In 2017, we entered into financial contracts to fix the forward price of approximately
4%
of Grundartangi's total power requirements for the period November 2019 through December 2020 (the “power price swaps”). As of December 31, 2018, we had an open position of
256,200
MWh related to the power price swaps. Because the power price swaps are settled in euros, in 2018 we entered into financial contracts to hedge the risk of fluctuations associated with the euro (the "FX swaps"). As of December 31, 2018, we had open positions related to the FX swaps for
€2.8 million
euros that settle monthly from November 2019 through December 2020.
The following table sets forth the Company's derivative assets and liabilities that were accounted for at fair value and not designated as hedging instruments as of December 31, 2018 and 2017:
|
|
Asset Fair Value
|
||||||
|
2018
|
2017
|
||||||
|
Commodity contracts
(1)
|
$
|
8.2
|
|
$
|
1.7
|
|
|
|
Foreign exchange contracts
(2)
|
—
|
|
—
|
|
|||
|
Total
|
$
|
8.2
|
|
$
|
1.7
|
|
|
|
|
Liability Fair Value
|
||||||
|
2018
|
2017
|
||||||
|
Commodity contracts
(1)
|
$
|
2.2
|
|
$
|
1.2
|
|
|
|
Foreign exchange contracts
(2)
|
0.3
|
|
—
|
|
|||
|
Total
|
$
|
2.5
|
|
$
|
1.2
|
|
|
(1)
Commodity contracts reflect our outstanding LME forward financial sales contracts, MWP forward financial sales contracts, fixed for floating swaps, and power price swaps.
(2)
Foreign exchange contracts reflect our outstanding FX swaps.
The following table summarizes the net gain (loss) on forward and derivative contracts for the years ended December 31, 2018, 2017, and 2016:
|
Year Ended December 31,
|
|||||||||||
|
2018
|
2017
|
2016
|
|||||||||
|
Commodity contracts
|
$
|
6.6
|
|
$
|
(16.5
|
)
|
$
|
3.5
|
|
||
|
Foreign exchange contracts
|
(0.3
|
)
|
—
|
|
—
|
|
|||||
|
Total
|
$
|
6.3
|
|
$
|
(16.5
|
)
|
$
|
3.5
|
|
||
20. Condensed Consolidating Financial Information
79
CENTURY ALUMINUM COMPANY
NOTES TO THE CONSOLIDATED FINANCIAL STATEMENTS
(amounts in millions, except share and per share amounts)
Our 2021 Notes are guaranteed by each of our material existing and future domestic subsidiaries (The "Guarantor Subsidiaries"), except for Nordural US LLC, Century Aluminum Development LLC and Century Aluminum of West Virginia, Inc. The Guarantor Subsidiaries are
100%
owned by Century. All guarantees are full and unconditional; all guarantees are joint and several. These notes are not guaranteed by our foreign subsidiaries (such foreign subsidiaries, Nordural US LLC, Century Aluminum Development LLC and Century Aluminum of West Virginia, Inc., collectively the "Non-Guarantor Subsidiaries"). We allocate corporate expenses or income to our subsidiaries and charge interest on certain intercompany balances.
The following summarized condensed consolidating statements of comprehensive income (loss) for the twelve months ended December 31, 2018, 2017 and 2016, condensed consolidating balance sheets as of December 31, 2018 and December 31, 2017 and the condensed consolidating statements of cash flows for the twelve months ended December 31, 2018, 2017 and 2016 present separate results for Century, the Guarantor Subsidiaries, the Non-Guarantor Subsidiaries, consolidating adjustments and total consolidated amounts.
|
Condensed Consolidating Statements of Comprehensive Income (Loss)
|
||||||||||||||||||||
|
For the year ended December 31, 2018
|
||||||||||||||||||||
|
The Company
|
Combined Guarantor Subsidiaries
|
Combined Non-Guarantor Subsidiaries
|
Consolidating Adjustments
|
Total Consolidated
|
||||||||||||||||
|
NET SALES:
|
||||||||||||||||||||
|
Related parties
|
$
|
—
|
|
$
|
453.6
|
|
$
|
750.9
|
|
$
|
—
|
|
$
|
1,204.5
|
|
|||||
|
Other customers
|
—
|
|
685.0
|
|
3.7
|
|
—
|
|
688.7
|
|
||||||||||
|
Total net sales
|
—
|
|
1,138.6
|
|
754.6
|
|
—
|
|
1,893.2
|
|
||||||||||
|
Cost of goods sold
|
—
|
|
1,169.2
|
|
746.9
|
|
—
|
|
1,916.1
|
|
||||||||||
|
Gross profit (loss)
|
—
|
|
(30.6
|
)
|
7.7
|
|
—
|
|
(22.9
|
)
|
||||||||||
|
Selling, general and administrative expenses
|
23.3
|
|
11.6
|
|
5.3
|
|
—
|
|
40.2
|
|
||||||||||
|
Helguvik (gains)
|
—
|
|
—
|
|
(4.5
|
)
|
—
|
|
(4.5
|
)
|
||||||||||
|
Other operating expense - net
|
—
|
|
—
|
|
0.4
|
|
—
|
|
0.4
|
|
||||||||||
|
Operating income (loss)
|
(23.3
|
)
|
(42.2
|
)
|
6.5
|
|
—
|
|
(59.0
|
)
|
||||||||||
|
Interest expense
|
(20.6
|
)
|
(1.6
|
)
|
(0.2
|
)
|
—
|
|
(22.4
|
)
|
||||||||||
|
Intercompany Interest
|
36.3
|
|
9.5
|
|
(45.8
|
)
|
—
|
|
—
|
|
||||||||||
|
Interest income
|
0.3
|
|
—
|
|
1.2
|
|
—
|
|
1.5
|
|
||||||||||
|
Net gain on forward and derivative contracts
|
1.3
|
|
1.4
|
|
3.6
|
|
—
|
|
6.3
|
|
||||||||||
|
Other income (expense) - net
|
2.1
|
|
(1.9
|
)
|
2.8
|
|
—
|
|
3.0
|
|
||||||||||
|
Income (loss) before income taxes and equity in earnings of joint ventures
|
(3.9
|
)
|
(34.8
|
)
|
(31.9
|
)
|
—
|
|
(70.6
|
)
|
||||||||||
|
Income tax (expense) benefit
|
2.6
|
|
—
|
|
(2.4
|
)
|
—
|
|
0.2
|
|
||||||||||
|
Income (loss) before equity in earnings of joint ventures
|
(1.3
|
)
|
(34.8
|
)
|
(34.3
|
)
|
—
|
|
(70.4
|
)
|
||||||||||
|
Equity in earnings (loss) of joint ventures
|
(64.9
|
)
|
0.6
|
|
4.2
|
|
64.3
|
|
4.2
|
|
||||||||||
|
Net income (loss)
|
(66.2
|
)
|
(34.2
|
)
|
(30.1
|
)
|
64.3
|
|
(66.2
|
)
|
||||||||||
|
Other comprehensive income (loss) before income tax effect
|
(5.5
|
)
|
(24.2
|
)
|
5.2
|
|
19.0
|
|
(5.5
|
)
|
||||||||||
|
Income tax effect
|
(1.5
|
)
|
—
|
|
—
|
|
—
|
|
(1.5
|
)
|
||||||||||
|
Other comprehensive income (loss)
|
(7.0
|
)
|
(24.2
|
)
|
5.2
|
|
19.0
|
|
(7.0
|
)
|
||||||||||
|
Total comprehensive income (loss)
|
$
|
(73.2
|
)
|
$
|
(58.4
|
)
|
$
|
(24.9
|
)
|
$
|
83.3
|
|
$
|
(73.2
|
)
|
|||||
80
CENTURY ALUMINUM COMPANY
NOTES TO THE CONSOLIDATED FINANCIAL STATEMENTS
(amounts in millions, except share and per share amounts)
|
Condensed Consolidating Statements of Comprehensive Income (Loss)
|
||||||||||||||||||||
|
For the year ended December 31, 2017*
|
||||||||||||||||||||
|
The Company
|
Combined Guarantor Subsidiaries
|
Combined Non-Guarantor Subsidiaries
|
Consolidating Adjustments
|
Total Consolidated
|
||||||||||||||||
|
NET SALES:
|
||||||||||||||||||||
|
Related parties
|
$
|
—
|
|
$
|
547.5
|
|
$
|
650.6
|
|
$
|
—
|
|
$
|
1,198.1
|
|
|||||
|
Other customers
|
—
|
|
390.9
|
|
0.1
|
|
—
|
|
391.0
|
|
||||||||||
|
Total net sales
|
—
|
|
938.4
|
|
650.7
|
|
—
|
|
1,589.1
|
|
||||||||||
|
Cost of goods sold
|
—
|
|
885.5
|
|
572.3
|
|
—
|
|
1,457.8
|
|
||||||||||
|
Gross profit
|
—
|
|
52.9
|
|
78.4
|
|
—
|
|
131.3
|
|
||||||||||
|
Selling, general and administrative expenses
|
27.2
|
|
12.9
|
|
4.7
|
|
—
|
|
44.8
|
|
||||||||||
|
Helguvik (gains)
|
—
|
|
—
|
|
(7.3
|
)
|
—
|
|
(7.3
|
)
|
||||||||||
|
Ravenswood (gains)
|
—
|
|
—
|
|
(5.5
|
)
|
—
|
|
(5.5
|
)
|
||||||||||
|
Other operating expense - net
|
—
|
|
—
|
|
2.1
|
|
—
|
|
2.1
|
|
||||||||||
|
Operating income (loss)
|
(27.2
|
)
|
40.0
|
|
84.4
|
|
—
|
|
97.2
|
|
||||||||||
|
Interest expense
|
(20.4
|
)
|
(1.6
|
)
|
(0.2
|
)
|
—
|
|
(22.2
|
)
|
||||||||||
|
Intercompany Interest
|
37.3
|
|
8.6
|
|
(45.9
|
)
|
—
|
|
—
|
|
||||||||||
|
Interest income
|
0.5
|
|
—
|
|
0.9
|
|
—
|
|
1.4
|
|
||||||||||
|
Net gain (loss) on forward and derivative contracts
|
—
|
|
(17.0
|
)
|
0.5
|
|
—
|
|
(16.5
|
)
|
||||||||||
|
Other income (expense) - net
|
0.2
|
|
0.4
|
|
(5.1
|
)
|
—
|
|
(4.5
|
)
|
||||||||||
|
Income (loss) before income taxes and equity in earnings of joint ventures
|
(9.6
|
)
|
30.4
|
|
34.6
|
|
—
|
|
55.4
|
|
||||||||||
|
Income tax (expense) benefit
|
0.5
|
|
0.9
|
|
(9.0
|
)
|
—
|
|
(7.6
|
)
|
||||||||||
|
Income (loss) before equity in earnings of joint ventures
|
(9.1
|
)
|
31.3
|
|
25.6
|
|
—
|
|
47.8
|
|
||||||||||
|
Equity in earnings (loss) of joint ventures
|
57.7
|
|
2.7
|
|
0.8
|
|
(60.4
|
)
|
0.8
|
|
||||||||||
|
Net income
|
48.6
|
|
34.0
|
|
26.4
|
|
(60.4
|
)
|
48.6
|
|
||||||||||
|
Other comprehensive income before income tax effect
|
23.7
|
|
12.7
|
|
1.5
|
|
(14.2
|
)
|
23.7
|
|
||||||||||
|
Income tax effect
|
(1.5
|
)
|
—
|
|
0.0
|
|
0.0
|
|
(1.5
|
)
|
||||||||||
|
Other comprehensive income
|
22.2
|
|
12.7
|
|
1.5
|
|
(14.2
|
)
|
22.2
|
|
||||||||||
|
Total comprehensive income
|
$
|
70.8
|
|
$
|
46.7
|
|
$
|
27.9
|
|
$
|
(74.6
|
)
|
$
|
70.8
|
|
|||||
*As adjusted due to the adoption of ASU 2017-07
81
CENTURY ALUMINUM COMPANY
NOTES TO THE CONSOLIDATED FINANCIAL STATEMENTS
(amounts in millions, except share and per share amounts)
|
Condensed Consolidating Statements of Comprehensive Income (Loss)
|
||||||||||||||||||||
|
For the year ended December 31, 2016*
|
||||||||||||||||||||
|
The Company
|
Combined Guarantor Subsidiaries
|
Combined Non-Guarantor Subsidiaries
|
Consolidating Adjustments
|
Total Consolidated
|
||||||||||||||||
|
NET SALES:
|
||||||||||||||||||||
|
Related parties
|
$
|
—
|
|
$
|
668.5
|
|
$
|
510.1
|
|
$
|
—
|
|
$
|
1,178.6
|
|
|||||
|
Other customers
|
—
|
|
140.4
|
|
0.1
|
|
—
|
|
140.5
|
|
||||||||||
|
Total net sales
|
—
|
|
808.9
|
|
510.2
|
|
—
|
|
1,319.1
|
|
||||||||||
|
Cost of goods sold
|
—
|
|
857.7
|
|
467.5
|
|
—
|
|
1,325.2
|
|
||||||||||
|
Gross profit (loss)
|
—
|
|
(48.8
|
)
|
42.7
|
|
—
|
|
(6.1
|
)
|
||||||||||
|
Selling, general and administrative expenses
|
19.4
|
|
9.9
|
|
9.6
|
|
—
|
|
38.9
|
|
||||||||||
|
Helguvik impairment
|
—
|
|
—
|
|
152.2
|
|
—
|
|
152.2
|
|
||||||||||
|
Ravenswood losses
|
—
|
|
—
|
|
26.8
|
|
—
|
|
26.8
|
|
||||||||||
|
Other operating expense - net
|
—
|
|
—
|
|
3.9
|
|
—
|
|
3.9
|
|
||||||||||
|
Operating income (loss)
|
(19.4
|
)
|
(58.7
|
)
|
(149.8
|
)
|
—
|
|
(227.9
|
)
|
||||||||||
|
Interest expense
|
(20.3
|
)
|
(1.7
|
)
|
(0.2
|
)
|
—
|
|
(22.2
|
)
|
||||||||||
|
Intercompany Interest
|
39.2
|
|
8.1
|
|
(47.3
|
)
|
—
|
|
—
|
|
||||||||||
|
Interest income
|
0.2
|
|
0.0
|
|
0.6
|
|
—
|
|
0.8
|
|
||||||||||
|
Net gain on forward and derivative contracts
|
—
|
|
3.5
|
|
—
|
|
—
|
|
3.5
|
|
||||||||||
|
Other income (expense) - net
|
(0.1
|
)
|
(4.7
|
)
|
(0.3
|
)
|
—
|
|
(5.1
|
)
|
||||||||||
|
Loss before income taxes and equity in earnings of joint ventures
|
(0.4
|
)
|
(53.5
|
)
|
(197.0
|
)
|
—
|
|
(250.9
|
)
|
||||||||||
|
Income tax (expense) benefit
|
1.9
|
|
—
|
|
(4.7
|
)
|
—
|
|
(2.8
|
)
|
||||||||||
|
Loss before equity in earnings (loss) of joint ventures
|
1.5
|
|
(53.5
|
)
|
(201.7
|
)
|
—
|
|
(253.7
|
)
|
||||||||||
|
Equity in earnings (loss) of subsidiaries and joint ventures
|
(253.9
|
)
|
12.5
|
|
1.3
|
|
241.4
|
|
1.3
|
|
||||||||||
|
Net loss
|
(252.4
|
)
|
(41.0
|
)
|
(200.4
|
)
|
241.4
|
|
(252.4
|
)
|
||||||||||
|
Other comprehensive income before income tax effect
|
0.3
|
|
1.9
|
|
5.1
|
|
(7.0
|
)
|
0.3
|
|
||||||||||
|
Income tax effect
|
(1.5
|
)
|
—
|
|
0.0
|
|
0.0
|
|
(1.5
|
)
|
||||||||||
|
Other comprehensive income (loss)
|
(1.2
|
)
|
1.9
|
|
5.1
|
|
(7.0
|
)
|
(1.2
|
)
|
||||||||||
|
Total comprehensive loss
|
$
|
(253.6
|
)
|
$
|
(39.1
|
)
|
$
|
(195.3
|
)
|
$
|
234.4
|
|
$
|
(253.6
|
)
|
|||||
*As adjusted due to the adoption of ASU 2017-07
82
CENTURY ALUMINUM COMPANY
NOTES TO THE CONSOLIDATED FINANCIAL STATEMENTS
(amounts in millions, except share and per share amounts)
|
Condensed Consolidating Balance Sheet
|
||||||||||||||||||||
|
As of December 31, 2018
|
||||||||||||||||||||
|
The Company
|
Combined Guarantor Subsidiaries
|
Combined Non-Guarantor Subsidiaries
|
Consolidating Adjustments
|
Total Consolidated
|
||||||||||||||||
|
Cash & cash equivalents
|
$
|
0.1
|
|
$
|
0.0
|
|
$
|
38.8
|
|
$
|
—
|
|
$
|
38.9
|
|
|||||
|
Restricted cash
|
—
|
|
0.8
|
|
—
|
|
—
|
|
0.8
|
|
||||||||||
|
Accounts receivable - net
|
0.5
|
|
81.8
|
|
0.2
|
|
—
|
|
82.5
|
|
||||||||||
|
Due from affiliates
|
—
|
|
13.1
|
|
9.6
|
|
—
|
|
22.7
|
|
||||||||||
|
Inventories
|
—
|
|
210.7
|
|
133.1
|
|
—
|
|
343.8
|
|
||||||||||
|
Prepaid and other current assets
|
6.4
|
|
3.4
|
|
8.2
|
|
—
|
|
18.0
|
|
||||||||||
|
Total current assets
|
7.0
|
|
309.8
|
|
189.9
|
|
—
|
|
506.7
|
|
||||||||||
|
Property, plant and equipment - net
|
20.6
|
|
320.7
|
|
626.0
|
|
—
|
|
967.3
|
|
||||||||||
|
Investment in subsidiaries
|
668.3
|
|
54.5
|
|
—
|
|
(722.8
|
)
|
—
|
|
||||||||||
|
Due from affiliates - long term
|
751.7
|
|
517.6
|
|
7.2
|
|
(1,276.5
|
)
|
—
|
|
||||||||||
|
Other assets
|
29.8
|
|
2.1
|
|
31.6
|
|
—
|
|
63.5
|
|
||||||||||
|
TOTAL
|
1,477.4
|
|
1,204.7
|
|
854.7
|
|
(1,999.3
|
)
|
1,537.5
|
|
||||||||||
|
Accounts payable, trade
|
3.7
|
|
84.1
|
|
31.6
|
|
—
|
|
119.4
|
|
||||||||||
|
Due to affiliates
|
—
|
|
—
|
|
10.3
|
|
—
|
|
10.3
|
|
||||||||||
|
Accrued and other current liabilities
|
15.8
|
|
22.8
|
|
13.9
|
|
—
|
|
52.5
|
|
||||||||||
|
Accrued employee benefits costs
|
1.9
|
|
8.3
|
|
0.8
|
|
—
|
|
11.0
|
|
||||||||||
|
Revolving credit facility
|
23.3
|
|
—
|
|
—
|
|
—
|
|
23.3
|
|
||||||||||
|
Industrial revenue bonds
|
—
|
|
7.8
|
|
—
|
|
—
|
|
7.8
|
|
||||||||||
|
Total current liabilities
|
44.7
|
|
123.0
|
|
56.6
|
|
—
|
|
224.3
|
|
||||||||||
|
Senior notes payable
|
248.6
|
|
—
|
|
—
|
|
—
|
|
248.6
|
|
||||||||||
|
Accrued pension benefits costs - less current portion
|
23.2
|
|
20.7
|
|
7.0
|
|
—
|
|
50.9
|
|
||||||||||
|
Accrued postretirement benefits costs - less current portion
|
0.7
|
|
98.9
|
|
1.6
|
|
—
|
|
101.2
|
|
||||||||||
|
Other liabilities
|
2.8
|
|
23.5
|
|
19.7
|
|
—
|
|
46.0
|
|
||||||||||
|
Due to affiliates - long term
|
395.4
|
|
307.6
|
|
573.5
|
|
(1,276.5
|
)
|
—
|
|
||||||||||
|
Deferred taxes
|
(0.2
|
)
|
1.8
|
|
102.7
|
|
—
|
|
104.3
|
|
||||||||||
|
Total noncurrent liabilities
|
670.5
|
|
452.5
|
|
704.5
|
|
(1,276.5
|
)
|
551.0
|
|
||||||||||
|
Preferred stock
|
0.0
|
|
—
|
|
—
|
|
—
|
|
0.0
|
|
||||||||||
|
Common stock
|
1.0
|
|
—
|
|
0.1
|
|
(0.1
|
)
|
1.0
|
|
||||||||||
|
Other shareholders' equity
|
761.2
|
|
629.2
|
|
93.5
|
|
(722.7
|
)
|
761.2
|
|
||||||||||
|
Total shareholders' equity
|
762.2
|
|
629.2
|
|
93.6
|
|
(722.8
|
)
|
762.2
|
|
||||||||||
|
TOTAL
|
$
|
1,477.4
|
|
$
|
1,204.7
|
|
$
|
854.7
|
|
$
|
(1,999.3
|
)
|
$
|
1,537.5
|
|
|||||
83
CENTURY ALUMINUM COMPANY
NOTES TO THE CONSOLIDATED FINANCIAL STATEMENTS
(amounts in millions, except share and per share amounts)
|
Condensed Consolidating Balance Sheet
|
||||||||||||||||||||
|
As of December 31, 2017
|
||||||||||||||||||||
|
The Company
|
Combined Guarantor Subsidiaries
|
Combined Non-Guarantor Subsidiaries
|
Consolidating Adjustments
|
Total Consolidated
|
||||||||||||||||
|
Cash & cash equivalents
|
$
|
64.3
|
|
$
|
(0.1
|
)
|
$
|
103.0
|
|
$
|
—
|
|
$
|
167.2
|
|
|||||
|
Restricted cash
|
—
|
|
0.8
|
|
—
|
|
—
|
|
0.8
|
|
||||||||||
|
Accounts receivable - net
|
—
|
|
42.8
|
|
0.3
|
|
—
|
|
43.1
|
|
||||||||||
|
Due from affiliates
|
0.1
|
|
10.3
|
|
—
|
|
—
|
|
10.4
|
|
||||||||||
|
Inventories
|
0.2
|
|
205.1
|
|
112.2
|
|
—
|
|
317.5
|
|
||||||||||
|
Prepaid and other current assets
|
3.3
|
|
0.8
|
|
10.6
|
|
—
|
|
14.7
|
|
||||||||||
|
Total current assets
|
67.9
|
|
259.7
|
|
226.1
|
|
—
|
|
553.7
|
|
||||||||||
|
Property, plant and equipment - net
|
19.4
|
|
295.8
|
|
656.7
|
|
—
|
|
971.9
|
|
||||||||||
|
Investment in subsidiaries
|
751.8
|
|
54.0
|
|
—
|
|
(805.8
|
)
|
—
|
|
||||||||||
|
Due from affiliates - long term
|
513.3
|
|
349.6
|
|
9.4
|
|
(872.3
|
)
|
—
|
|
||||||||||
|
Other assets
|
28.0
|
|
34.1
|
|
25.9
|
|
(32.0
|
)
|
56.0
|
|
||||||||||
|
TOTAL
|
1,380.4
|
|
993.2
|
|
918.1
|
|
(1,710.1
|
)
|
1,581.6
|
|
||||||||||
|
Accounts payable, trade
|
6.3
|
|
51.4
|
|
32.2
|
|
—
|
|
89.9
|
|
||||||||||
|
Due to affiliates
|
0.4
|
|
2.6
|
|
17.4
|
|
—
|
|
20.4
|
|
||||||||||
|
Accrued and other current liabilities
|
16.0
|
|
19.3
|
|
26.1
|
|
—
|
|
61.4
|
|
||||||||||
|
Accrued employee benefits costs
|
1.9
|
|
8.3
|
|
0.8
|
|
—
|
|
11.0
|
|
||||||||||
|
Industrial revenue bonds
|
—
|
|
7.8
|
|
—
|
|
—
|
|
7.8
|
|
||||||||||
|
Total current liabilities
|
24.6
|
|
89.4
|
|
76.5
|
|
—
|
|
190.5
|
|
||||||||||
|
Senior notes payable
|
248.2
|
|
—
|
|
—
|
|
—
|
|
248.2
|
|
||||||||||
|
Accrued pension benefits costs - less current portion
|
39.5
|
|
18.3
|
|
13.1
|
|
(32.0
|
)
|
38.9
|
|
||||||||||
|
Accrued postretirement benefits costs - less current portion
|
0.9
|
|
110.4
|
|
1.7
|
|
—
|
|
113.0
|
|
||||||||||
|
Other liabilities
|
3.5
|
|
32.0
|
|
22.4
|
|
—
|
|
57.9
|
|
||||||||||
|
Due to affiliates - long term
|
234.1
|
|
53.8
|
|
584.4
|
|
(872.3
|
)
|
—
|
|
||||||||||
|
Deferred taxes
|
—
|
|
1.7
|
|
101.8
|
|
—
|
|
103.5
|
|
||||||||||
|
Total noncurrent liabilities
|
526.2
|
|
216.2
|
|
723.4
|
|
(904.3
|
)
|
561.5
|
|
||||||||||
|
Preferred stock
|
0.0
|
|
—
|
|
—
|
|
—
|
|
0.0
|
|
||||||||||
|
Common stock
|
0.9
|
|
—
|
|
0.1
|
|
(0.1
|
)
|
0.9
|
|
||||||||||
|
Other shareholders' equity
|
828.7
|
|
687.6
|
|
118.1
|
|
(805.7
|
)
|
828.7
|
|
||||||||||
|
Total shareholders' equity
|
829.6
|
|
687.6
|
|
118.2
|
|
(805.8
|
)
|
829.6
|
|
||||||||||
|
TOTAL
|
$
|
1,380.4
|
|
$
|
993.2
|
|
$
|
918.1
|
|
$
|
(1,710.1
|
)
|
$
|
1,581.6
|
|
|||||
84
CENTURY ALUMINUM COMPANY
NOTES TO THE CONSOLIDATED FINANCIAL STATEMENTS
(amounts in millions, except share and per share amounts)
|
Condensed Consolidating Statement of Cash Flows
|
||||||||||||||||||||
|
For the year ended December 31, 2018
|
||||||||||||||||||||
|
The Company
|
Combined Guarantor Subsidiaries
|
Combined Non-Guarantor Subsidiaries
|
Consolidating Adjustments
|
Total Consolidated
|
||||||||||||||||
|
Net cash provided by (used in) operating activities
|
$
|
(53.0
|
)
|
$
|
(19.5
|
)
|
$
|
3.4
|
|
$
|
—
|
|
$
|
(69.1
|
)
|
|||||
|
Purchase of property, plant and equipment
|
(4.4
|
)
|
(65.1
|
)
|
(13.5
|
)
|
—
|
|
(83.0
|
)
|
||||||||||
|
Proceeds from sale of property, plant and equipment
|
—
|
|
—
|
|
0.1
|
|
—
|
|
0.1
|
|
||||||||||
|
Intercompany transactions
|
21.6
|
|
54.7
|
|
2.2
|
|
(78.5
|
)
|
—
|
|
||||||||||
|
Net cash provided by (used in) investing activities
|
17.2
|
|
(10.4
|
)
|
(11.2
|
)
|
(78.5
|
)
|
(82.9
|
)
|
||||||||||
|
Borrowings under revolving credit facilities
|
120.1
|
|
—
|
|
—
|
|
—
|
|
120.1
|
|
||||||||||
|
Repayments under revolving credit facilities
|
(96.8
|
)
|
—
|
|
—
|
|
—
|
|
(96.8
|
)
|
||||||||||
|
Issuance of common stock
|
0.4
|
|
—
|
|
—
|
|
—
|
|
0.4
|
|
||||||||||
|
Intercompany transactions
|
(52.1
|
)
|
30.0
|
|
(56.4
|
)
|
78.5
|
|
—
|
|
||||||||||
|
Net cash provided by (used in) financing activities
|
(28.4
|
)
|
30.0
|
|
(56.4
|
)
|
78.5
|
|
23.7
|
|
||||||||||
|
CHANGE IN CASH, CASH EQUIVALENTS, AND RESTRICTED CASH
|
(64.2
|
)
|
0.1
|
|
(64.2
|
)
|
—
|
|
(128.3
|
)
|
||||||||||
|
Cash, cash equivalents, and restricted cash, beginning of period
|
64.3
|
|
0.7
|
|
103.0
|
|
—
|
|
168.0
|
|
||||||||||
|
Cash, cash equivalents, and restricted cash, end of period
|
$
|
0.1
|
|
$
|
0.8
|
|
$
|
38.8
|
|
$
|
—
|
|
$
|
39.7
|
|
|||||
85
CENTURY ALUMINUM COMPANY
NOTES TO THE CONSOLIDATED FINANCIAL STATEMENTS
(amounts in millions, except share and per share amounts)
|
Condensed Consolidating Statement of Cash Flows
|
||||||||||||||||||||
|
For the year ended December 31, 2017*
|
||||||||||||||||||||
|
The Company
|
Combined Guarantor Subsidiaries
|
Combined Non-Guarantor Subsidiaries
|
Consolidating Adjustments
|
Total Consolidated
|
||||||||||||||||
|
Net cash provided by (used in) operating activities
|
$
|
(34.5
|
)
|
$
|
(7.0
|
)
|
$
|
96.0
|
|
$
|
(3.0
|
)
|
$
|
51.5
|
|
|||||
|
Purchase of property, plant and equipment
|
(10.9
|
)
|
(8.1
|
)
|
(12.8
|
)
|
—
|
|
(31.8
|
)
|
||||||||||
|
Proceeds from sale of property, plant and equipment
|
—
|
|
0.9
|
|
13.5
|
|
—
|
|
14.4
|
|
||||||||||
|
Intercompany transactions
|
75.6
|
|
6.2
|
|
(7.6
|
)
|
(74.2
|
)
|
—
|
|
||||||||||
|
Net cash provided by (used in) investing activities
|
64.7
|
|
(1.0
|
)
|
(6.9
|
)
|
(74.2
|
)
|
(17.4
|
)
|
||||||||||
|
Borrowings under revolving credit facilities
|
1.3
|
|
—
|
|
—
|
|
—
|
|
1.3
|
|
||||||||||
|
Repayments under revolving credit facilities
|
(1.3
|
)
|
—
|
|
—
|
|
—
|
|
(1.3
|
)
|
||||||||||
|
Issuance of common stock
|
0.4
|
|
—
|
|
—
|
|
—
|
|
0.4
|
|
||||||||||
|
Intercompany transactions
|
(3.1
|
)
|
8.2
|
|
(82.3
|
)
|
77.2
|
|
—
|
|
||||||||||
|
Net cash provided by (used in) financing activities
|
(2.7
|
)
|
8.2
|
|
(82.3
|
)
|
77.2
|
|
0.4
|
|
||||||||||
|
CHANGE IN CASH, CASH EQUIVALENTS, AND RESTRICTED CASH
|
27.5
|
|
0.2
|
|
6.8
|
|
—
|
|
34.5
|
|
||||||||||
|
Cash, cash equivalents, and restricted cash, beginning of period
|
36.8
|
|
0.5
|
|
96.2
|
|
—
|
|
133.5
|
|
||||||||||
|
Cash, cash equivalents, and restricted cash, end of period
|
$
|
64.3
|
|
$
|
0.7
|
|
$
|
103.0
|
|
$
|
—
|
|
$
|
168.0
|
|
|||||
*As adjusted due to the adoption of ASU 2016-18.
86
CENTURY ALUMINUM COMPANY
NOTES TO THE CONSOLIDATED FINANCIAL STATEMENTS
(amounts in millions, except share and per share amounts)
|
Condensed Consolidating Statement of Cash Flows
|
||||||||||||||||||||
|
For the year ended December 31, 2016*
|
||||||||||||||||||||
|
The Company
|
Combined Guarantor Subsidiaries
|
Combined Non-Guarantor Subsidiaries
|
Consolidating Adjustments
|
Total Consolidated
|
||||||||||||||||
|
Net cash provided by operating activities
|
$
|
(63.4
|
)
|
$
|
19.0
|
|
$
|
82.6
|
|
$
|
—
|
|
$
|
38.2
|
|
|||||
|
Purchase of property, plant and equipment
|
(1.4
|
)
|
(7.8
|
)
|
(12.7
|
)
|
—
|
|
(21.9
|
)
|
||||||||||
|
Proceeds from sale of property, plant and equipment
|
—
|
|
—
|
|
1.0
|
|
—
|
|
1.0
|
|
||||||||||
|
Intercompany transactions
|
27.8
|
|
(15.4
|
)
|
(0.9
|
)
|
(11.5
|
)
|
—
|
|
||||||||||
|
Net cash used in investing activities
|
26.4
|
|
(23.2
|
)
|
(12.6
|
)
|
(11.5
|
)
|
(20.9
|
)
|
||||||||||
|
Borrowings under revolving credit facilities
|
1.2
|
|
—
|
|
—
|
|
—
|
|
1.2
|
|
||||||||||
|
Repayments under revolving credit facilities
|
(1.2
|
)
|
—
|
|
—
|
|
—
|
|
(1.2
|
)
|
||||||||||
|
Intercompany transactions
|
15.4
|
|
7.5
|
|
(34.4
|
)
|
11.5
|
|
—
|
|
||||||||||
|
Net cash used in financing activities
|
15.4
|
|
7.5
|
|
(34.4
|
)
|
11.5
|
|
—
|
|
||||||||||
|
CHANGE IN CASH, CASH EQUIVALENTS, AND RESTRICTED CASH
|
(21.6
|
)
|
3.3
|
|
35.6
|
|
—
|
|
17.3
|
|
||||||||||
|
Cash, cash equivalents, and restricted cash, beginning of period
|
58.4
|
|
(2.8
|
)
|
60.6
|
|
—
|
|
116.2
|
|
||||||||||
|
Cash, cash equivalents, and restricted cash, end of period
|
$
|
36.8
|
|
$
|
0.5
|
|
$
|
96.2
|
|
$
|
—
|
|
$
|
133.5
|
|
|||||
*As adjusted due to the adoption of ASU 2016-18.
87
Item 9. Changes in and Disagreements with Accountants on Accounting and Financial Disclosure
Not applicable.
Item 9A. Controls and Procedures
Disclosure Controls and Procedures
As of December 31,
2018
, we carried out an evaluation, under the supervision and with the participation of our management, including our Chief Executive Officer and Chief Financial Officer, of the effectiveness of our disclosure controls and procedures. Based upon that evaluation, our management, including the Chief Executive Officer and Chief Financial Officer, concluded that our disclosure controls and procedures were effective.
Internal Control over Financial Reporting
Management is responsible for establishing and maintaining an adequate system of internal control over financial reporting for the Company. This system is designed to provide reasonable assurance regarding the reliability of financial reporting and the preparation of financial statements for external purposes in accordance with generally accepted accounting principles. Because of its inherent limitations, a system of internal control over financial reporting can provide only reasonable assurance and may not prevent or detect misstatements. Further, because of changes in conditions, effectiveness of internal control over financial reporting may vary over time. Our system of internal control contains self-monitoring mechanisms, and actions are taken to correct deficiencies as they are identified.
As required by Section 404 of the Sarbanes-Oxley Act, management conducted an evaluation of the effectiveness of the system of internal control over financial reporting for the year ended December 31,
2018
. Management’s evaluation was based on the framework in
Internal Control - Integrated Framework (2013)
issued by the Committee of Sponsoring Organizations (COSO) of the Treadway Commission. Based on this evaluation, management concluded that our system of internal control over financial reporting was effective as of December 31,
2018
. The effectiveness of our internal control over financial reporting has been audited by Deloitte & Touche LLP, an independent registered public accounting firm.
Changes in Internal Control over Financial Reporting
During the three months ended December 31,
2018
, there were no changes in our internal control over financial reporting that materially affected, or are reasonably likely to materially affect, our internal control over financial reporting.
Item 9B. Other Information
None.
88
PART III
Item 10. Directors, Executive Officers and Corporate Governance
This Item is incorporated by reference to our definitive proxy statement on Schedule 14A, which will be filed by
May 1, 2019
, or if our proxy statement is not filed by that date, will be included in an amendment to this Report on Form 10-K, which will be filed by
May 1, 2019
.
Item 11. Executive Compensation
This Item is incorporated by reference to our definitive proxy statement on Schedule 14A, which will be filed by
May 1, 2019
, or if our proxy statement is not filed by that date, will be included in an amendment to this Report on Form 10-K, which will be filed by
May 1, 2019
.
Item 12. Security Ownership of Certain Beneficial Owners and Management and Related Stockholder Matters
This Item is incorporated by reference to our definitive proxy statement on Schedule 14A, which will be filed by
May 1, 2019
, or if our proxy statement is not filed by that date, will be included in an amendment to this Report on Form 10-K, which will be filed by
May 1, 2019
.
Item 13. Certain Relationships and Related Transactions and Director Independence
This Item is incorporated by reference to our definitive proxy statement on Schedule 14A, which will be filed by
May 1, 2019
, or if our proxy statement is not filed by that date, will be included in an amendment to this Report on Form 10-K, which will be filed by
May 1, 2019
.
Item 14. Principal Accountant Fees and Services
This Item is incorporated by reference to our definitive proxy statement on Schedule 14A, which will be filed by
May 1, 2019
, or if our proxy statement is not filed by that date, will be included in an amendment to this Report on Form 10-K, which will be filed by
May 1, 2019
.
PART IV
Item 15. Exhibits and Financial Statement Schedules
(a) (1) List of Financial Statements
The following consolidated financial statements of Century Aluminum Company and the Independent Auditors’ Reports are included in Part II, Item 8 of this Form 10-K:
Reports of Independent Registered Public Accounting Firm
Consolidated Statements of Operations for the years ended December 31,
2018
,
2017
and
2016
Consolidated Statements of Comprehensive Income (Loss) for the years ended December 31,
2018
,
2017
and
2016
Consolidated Balance Sheets as of December 31,
2018
and
2017
Consolidated Statements of Shareholders’ Equity for the years ended December 31,
2018
,
2017
and
2016
Consolidated Statements of Cash Flows for the years ended December 31,
2018
,
2017
and
2016
Notes to the consolidated financial statements
89
(a) (2) List of financial Statement Schedules
None. All required information has been included in the consolidated financial statements or notes thereto.
(a) (3) List of Exhibits
|
Exhibit Index
|
|||||
|
|
|
Incorporated by Reference
|
|
||
|
Exhibit Number
|
Description of Exhibit
|
Form
|
File No.
|
Filing Date
|
Filed Herewith
|
|
3.1
|
10-Q
|
001-34474
|
November 9, 2012
|
||
|
3.2
|
8-K
|
001-34474
|
September 18, 2012
|
||
|
3.3
|
8-K
|
001-34474
|
December 14, 2015
|
||
|
4.1
|
10-K
|
001-34474
|
February 28, 2018
|
||
|
4.2
|
8-K
|
000-27918
|
July 8, 2008
|
||
|
4.3
|
8-K
|
001-34474
|
June 10, 2013
|
||
|
4.4
|
10-K
|
001-34474
|
March 2, 2015
|
||
|
4.5
|
8-K
|
001-34474
|
June 10, 2013
|
|
|
|
10.1
|
8-K
|
001-34474
|
June 10, 2013
|
||
|
10.2
|
8-K
|
001-34474
|
June 10, 2013
|
||
|
10.3
|
10-Q
|
001-34474
|
November 2, 2018
|
||
|
10.4
|
10-K
|
001-34474
|
March 14, 2014
|
||
|
10.5
|
8-K
|
011-34474
|
April 15, 2016
|
||
90
|
10.6
|
10-K
|
01134474
|
February 28, 2018
|
||
|
10.7
|
10-K
|
001-34474
|
March 14, 2014
|
||
|
10.8
|
8-K
|
000-27918
|
July 8, 2008
|
||
|
10.9
|
8-K
|
000-27918
|
July 8, 2008
|
||
|
10.10
|
10-K
|
001-34474
|
March 16, 2010
|
||
|
10.11
|
8-K
|
000-27918
|
July 8, 2008
|
||
|
10.12
|
10-Q
|
001-34474
|
May 1, 2015
|
||
|
10.13
|
8-K
|
00134474
|
July 16, 2018
|
||
|
10.14
|
8-K
|
001-34474
|
June 27, 2014
|
||
|
10.15
|
10-Q
|
000-27918
|
August 10, 2009
|
||
|
10.16
|
10-K
|
001-34474
|
March 16, 2010
|
||
|
10.17
|
8-K
|
001-34474
|
June 27, 2014
|
||
|
10.18
|
10-K
|
001-34474
|
March 2, 2015
|
||
|
10.19
|
8-K
|
001-34474
|
March 25, 2013
|
||
|
10.20
|
8-K
|
001-34474
|
June 27, 2014
|
||
|
10.21
|
8-K
|
001-34474
|
March 24, 2016
|
||
|
10.22
|
8-K
|
001-34474
|
December 14, 2015
|
||
|
10.23
|
8-K
|
001-34474
|
June 27, 2014
|
||
|
10.24
|
8-K
|
001-34474
|
March 24, 2016
|
||
|
10.25
|
10-K
|
000-27918
|
March 16, 2006
|
||
|
10.26
|
10-Q
|
001-34474
|
August 9, 2011
|
||
|
10.27
|
8-K
|
000-27918
|
August 16, 2005
|
||
91
|
10.28
|
10-K
|
000-27918
|
March 16, 2006
|
|
|
|
10.29
|
10-K
|
001-34474
|
March 7, 2016
|
||
|
10.30
|
10-K
|
001-34474
|
March 7, 2016
|
||
|
10.31
|
8-K
|
001-34474
|
December 5, 2014
|
|
|
|
21.1
|
|
|
|
X
|
|
|
23.1
|
|
|
|
X
|
|
|
24.1
|
|
|
|
X
|
|
|
31.1
|
|
|
|
X
|
|
|
31.2
|
X
|
||||
|
32.1
|
|
|
|
X
|
|
|
32.2
|
X
|
||||
|
101.INS
|
XBRL Instance Document
|
|
|
|
X
|
|
101.SCH
|
XBRL Taxonomy Extension Schema
|
|
|
|
X
|
|
101.CAL
|
XBRL Taxonomy Extension Calculation Linkbase
|
|
|
|
X
|
|
101.DEF
|
XBRL Taxonomy Extension Definition Linkbase
|
|
|
|
X
|
|
101.LAB
|
XBRL Taxonomy Extension Label Linkbase
|
|
|
|
X
|
|
101.PRE
|
XBRL Taxonomy Extension Presentation Linkbase
|
|
|
|
X
|
|
*
|
Management contract or compensatory plan.
|
||||
|
**
|
Confidential Information was omitted from this exhibit pursuant to a request for confidential treatment filed separately with the SEC.
|
||||
92
SIGNATURES
Pursuant to the requirements of Section 13 or 15(d) of the Securities Exchange Act of 1934, the Registrant has duly caused this report to be signed on its behalf by the undersigned, thereunto duly authorized.
|
|
|
Century Aluminum Company
|
|
|
By:
|
/s/ MICHAEL A. BLESS
|
|
|
|
Michael A. Bless
|
|
|
|
President and Chief Executive Officer (Principal Executive Officer)
|
|
|
Dated:
|
February 28, 2019
|
93
Pursuant to the requirements of the Securities Exchange Act of 1934, this report has been signed below by the following persons on behalf of the Registrant and in the capacities and on the date indicated.
|
Signature
|
Title
|
Date
|
||
|
/s/ MICHAEL A. BLESS |
President and Chief Executive Officer and Director (Principal Executive Officer)
|
February 28, 2019
|
||
|
Michael A. Bless
|
||||
|
*
|
Chairman
|
February 28, 2019
|
||
|
Andrew Michelmore
|
||||
|
*
|
Director
|
February 28, 2019
|
||
|
Jarl Berntzen
|
||||
|
*
|
Director
|
February 28, 2019
|
||
|
Errol Glasser
|
||||
|
*
|
Director
|
February 28, 2019
|
||
|
Wilhelm van Jaarsveld
|
||||
|
/s/ CRAIG C. CONTI
|
Executive Vice President and Chief Financial Officer
(Principal Financial Officer)
|
February 28, 2019
|
||
|
Craig C. Conti
|
||||
|
/s/ ELISABETH INDRIANI
|
Global Controller
(Principal Accounting Officer)
|
February 28, 2019
|
||
|
Elisabeth Indriani
|
||||
|
*By: /s/ JESSE E. GARY
|
||||
|
Jesse E. Gary, as Attorney-in-fact
|
||||
94
TABLE OF CONTENTS
Part IItem 1. BusinessItem 1A. Risk FactorsItem 1B. Unresolved Staff CommentsItem 2. PropertiesItem 3. Legal ProceedingsItem 4. Mine Safety DisclosuresPart IIItem 5. Market For Registrant's Common Equity, Related Stockholder Matters and Issuer Purchases Of Equity SecuritiesItem 6. Selected Financial DataItem 7. Management's Discussion and Analysis Of Financial Condition and Results Of OperationsItem 7A. Quantitative and Qualitative Disclosures About Market RiskItem 8. Financial Statements and Supplementary DataItem 9. Changes in and Disagreements with Accountants on Accounting and Financial DisclosureItem 9A. Controls and ProceduresItem 9B. Other InformationPart IIIItem 10. Directors, Executive Officers and Corporate GovernanceItem 11. Executive CompensationItem 12. Security Ownership Of Certain Beneficial Owners and Management and Related Stockholder MattersItem 13. Certain Relationships and Related Transactions and Director IndependenceItem 14. Principal Accountant Fees and ServicesPart IVItem 15. Exhibits and Financial Statement Schedules