UNITED
STATES
SECURITIES
AND EXCHANGE COMMISSION
Washington,
D.C. 20549
FORM
20-F
☐
REGISTRATION
STATEMENT PURSUANT TO SECTION 12(b) OR (g) OF THE SECURITIES
EXCHANGE ACT OF 1934
OR
☒
ANNUAL
REPORT PURSUANT TO SECTION 13 OR 15(d) OF THE SECURITIES EXCHANGE
ACT OF 1934
For
the fiscal year ended December 31, 2018
OR
☐
TRANSITION
REPORT PURSUANT TO SECTION 13 OR 15(d) OF THE SECURITIES EXCHANGE
ACT OF 1934
For
the transition period from __________________ to
__________________.
OR
☐
SHELL
COMPANY REPORT PURSUANT TO SECTION 13 OR 15(d) OF THE SECURITIES
EXCHANGE ACT OF 1934
Date
of event requiring this shell company report
__________________.
Commission
file number 001-38376
Central
Puerto S.A.
(Exact
name of Registrant as specified in its charter)
Port
Central S.A.
(Translation
of Registrant’s name into English)
REPUBLIC
OF ARGENTINA
(Jurisdiction
of incorporation or organization)
Avenida
Thomas Edison 2701
C1104BAB
Buenos Aires
Republic
of Argentina
(Address
of principal executive offices)
Fernando
Roberto Bonnet
Avenida
Thomas Edison 2701
C1104BAB
Buenos Aires
Republic
of Argentina.
Facsimile:
+54 (11) 4317-5900
Email:
inversores@centralpuerto.com
(Name,
Telephone, E-mail and/or Facsimile number and Address of Company
Contact Person)
Securities
registered or to be registered pursuant to Section 12(b) of
the Act.
|
Title
of each class
|
Name
of each exchange on which registered
|
|
American
Depositary Shares, each representing 10 common shares of Central
Puerto S.A.*
|
New
York Stock Exchange*
|
*
Not for trading,
but only in connection with the registration of American Depositary
Shares pursuant to the requirements of the New York Stock
Exchange.
Securities
registered or to be registered pursuant to Section 12(g) of
the Act.
None
Securities for
which there is a reporting obligation pursuant to
Section 15(d) of the Act.
None
Indicate the number
of outstanding shares of each of the issuer’s classes of
capital or common stock as of the close of the period covered by
the annual report.
|
Title
of each class
|
Outstanding
at December 31, 2018
|
|
Common
shares, nominal value Ps.1.00 per share
|
1,514,022,256
|
Indicate by check
mark if the registrant is a well-known seasoned issuer, as defined
in Rule 405 of the Securities Act.
Yes ☒ No
☐
If this report is
an annual or transition report, indicate by check mark if the
registrant is not required to file reports pursuant to Section 13
or 15(d) of the Securities Exchange Act of 1934.
Yes ☐ No
☒
Indicate by check
mark whether the registrant (1) has filed all reports required
to be filed by Section 13 or 15(d) of the Securities Exchange
Act of 1934 during the preceding 12 months (or for such
shorter period that the registrant was required to file such
reports), and (2) has been subject to such filing requirements
for the past 90 days.
Yes ☒ No ☐
Indicate by check
mark whether the registrant has submitted electronically every
Interactive Data File required to be submitted and posted pursuant
to Rule 405 of Regulation S-T (§232.405 of this
chapter) during the preceding 12 months (or for such shorter
period that the registrant was required to submit and post such
files).
Yes ☒ No ☐
Indicate by check
mark whether the registrant is a large accelerated filer, an
accelerated filer, a non-accelerated filer, or an emerging growth
company. See definition of “large accelerated filer,”
“accelerated filer,” and “emerging growth
company” in Rule 12b-2 of the Exchange Act.
Large accelerated
filer ☐
Accelerated filer
☐
Non-accelerated
filer ☒
Emerging growth company ☒
If an emerging
growth company that prepares its financial statements in accordance
with U.S. GAAP, indicate by check mark if the registrant has
elected not to use the extended transition period for complying
with any new or revised financial accounting standards†
provided pursuant to Section 13(a) of the Exchange Act.
☐
† The term
“new or revised financial accounting standard” refers
to any update issued by the Financial Accounting Standards Board to
its Accounting Standards Codification after April 5,
2012.
Indicate by check
mark which basis of accounting the registrant has used to prepare
the financial statements included in this filing:
U.S.
GAAP ☐
International Financial Reporting Standards as
issued Other ☐
by the
International Accounting Standards Board ☒
If
“Other” has been checked in response to the previous
question, indicate by check mark which financial statement item the
registrant has elected to follow.
Item 17 ☐ Item 18 ☐
If this is an
annual report, indicate by check mark whether the registrant is a
shell company (as defined in Rule 12b-2 of the Exchange
Act).
Yes ☐
No ☒
(APPLICABLE ONLY TO
ISSUERS INVOLVED IN BANKRUPTCY PROCEEDINGS DURING THE PAST FIVE
YEARS)
Indicate by check
mark whether the registrant has filed all documents and reports
required to be filed by Sections 12, 13 or 15(d) of the Securities
Exchange Act of 1934 subsequent to the distribution of securities
under a plan confirmed by a court.
Yes ☐
No ☐
TABLE OF CONTENTS
|
|
|
PAGE
|
|
Item 1.
|
Identity of
Directors, Senior Management and Advisors
|
1
|
|
Item 2.
|
Offer Statistics
and Expected Timetable
|
1
|
|
Item 3.
|
Key
Information
|
1
|
|
Item 3.A.
|
Selected Financial
Data
|
1
|
|
Item 3.B
|
Capitalization and
indebtedness
|
4
|
|
Item 3.C
|
Reasons for the
offer and use of proceeds
|
4
|
|
Item 3.D
|
Risk
Factors
|
5
|
|
Item 4.
|
Information of the
Company
|
33
|
|
Item 4.A
|
History and
development of the Company
|
38
|
|
Item
4.B
|
Business
overview
|
42
|
|
Item 4.C
|
Organizational
structure
|
124
|
|
Item 4.D
|
Property, plants
and equipment
|
124
|
|
Item
5.
|
Operating and
Financial Review and Prospects
|
125
|
|
Item
5.A
|
Operating
Results
|
125
|
|
Item
5.B
|
Liquidity and
Capital Resources
|
149
|
|
Item
5.C
|
Research and
Development, patents and licenses, etc.
|
156
|
|
Item
5.D
|
Trend
Information
|
156
|
|
Item
5.E
|
Off-balance sheet
arrangements
|
159
|
|
Item
5.F
|
Contractual
Obligations
|
159
|
|
Item
5.G
|
Safe
Harbor
|
160
|
|
Item 6.
|
Directors, Senior
Management and Employees
|
160
|
|
Item 7.
|
Shareholders and
Related Party Transactions
|
172
|
|
Item
7.A.
|
Major
Shareholders
|
172
|
|
Item
7.B
|
Related Party
Transactions
|
173
|
|
Item
7.C
|
Interests of
experts and counsel
|
175
|
|
Item 8.
|
Financial
Information
|
175
|
|
Item
8.A.
|
Consolidated
Statements and Other Financial Information.
|
175
|
|
Item
8.B
|
Significant
Changes
|
176
|
|
Item 9.
|
The Offer and
Listing
|
178
|
|
Item
9.A.
|
Offer and listing
details
|
178
|
|
Item
9.B.
|
Plan of
Distribution
|
178
|
|
Item
9.C.
|
Markets
|
178
|
|
Item
9.D.
|
Selling
Shareholders
|
178
|
|
Item
9.E.
|
Dilution
|
178
|
|
Item
9.F.
|
Expenses of the
issue
|
178
|
|
Item 10.
|
Additional
Information
|
178
|
|
Item 10.A.
|
Share
capital
|
178
|
|
Item 10.B.
|
Memorandum and
articles of association
|
178
|
|
|
|
|
|
Item 10.C
|
Material
contracts
|
183
|
|
Item 10.D
|
Exchange
Controls
|
183
|
|
Item 10.E
|
Taxation
|
185
|
|
Item
10.F
|
Dividends and
paying agents
|
192
|
|
Item
10.G
|
Statement by
experts
|
192
|
|
Item
10.H
|
Documents on
display
|
192
|
|
Item
10.I.
|
Subsidiary
Information
|
193
|
|
Item
11.
|
Quantitative and
Qualitative Disclosures about Market Risk
|
193
|
|
Item
12.
|
Description of
Securities Other Than Equity Securities
|
196
|
|
Item
12.A
|
Debt
Securities
|
196
|
|
Item
12.B
|
Warrants and
Rights
|
196
|
|
Item
12.C
|
Other
Securities
|
196
|
|
Item
12.D
|
American Depositary
Shares
|
196
|
|
Item
13.
|
Defaults, Dividend
Arrearages and Delinquencies
|
197
|
|
Item
14.
|
Material
Modifications to the Rights of Security Holders and Use of
Proceeds
|
197
|
|
Item
15.
|
Controls and
Procedures
|
198
|
|
Item
16.A
|
Audit committee
financial expert
|
198
|
|
Item
16.B
|
Code of
Ethics
|
198
|
|
Item
16.C
|
Principal
Accountant Fees and Services
|
199
|
|
Item
16.D
|
Exemptions from the
Listing Standards for Audit Committees
|
199
|
|
Item
16.E
|
Purchases of Equity
Securities by the Issuer and Affiliated Purchasers
|
199
|
|
Item
16.F
|
Change in
Registrant’s Certifying Accountant
|
199
|
|
Item
16.G
|
Corporate
Governance
|
199
|
|
Item
16.H.
|
Mine Safety
Disclosure
|
203
|
|
Item
17.
|
Financial
Statements
|
203
|
|
Item
18.
|
Financial
Statements
|
203
|
|
Item
19.
|
Exhibits
|
203
|
CERTAIN DEFINITIONS
In this annual
report, except where otherwise indicated or where the context
otherwise requires:
●
“
Argentine Corporate Law
” refers to Law No. 19,550, as
amended;
●
“BYMA”
refers to
Bolsas y Mercados
Argentinos S.A.
;
●
“
CAMMESA
”
refers to
Compañ’a
Administradora del Mercado Mayorista Eléctrico Sociedad
Anónima
. See “Item 4.B, Business
Overview
—
The Argentine
Electric Power Sector
—
General Overview of Legal
Framework
—
CAMMESA;
”
●
“CTM”
refers to
Centrales Térmicas
Mendoza S.A.
;
●
“CVO”
refers to the thermal plant
Central Vuelta de
Obligado
;
●
“CVO
Agreement” refers to the Agreement for Project Management and
Operation, Increase of Thermal Generation Availability and
Adaptation of Remuneration for Generation 2008-2011” executed
on November 25, 2010 among the Secretariat of Energy and Central
Puerto along with other electric power generators;
●
“CVOSA”
refers to
Central Vuelta de
Obligado S.A.
;
●
“Ecogas”
refers collectively to
Distribuidora de Gas Cuyana
(“DGCU”) and
Distribuidora de Gas del Centro
(“DGCE”);
●
“
Energía Base
”
refers to the regulatory framework
established under Resolution SE No. 95/13, as amended, and, from
February 2017 to February 2019, regulated by Resolution SEE No.
19/17, and since March 2019, regulated by Resolution No. 1/19 of
the Secretary of Renewable Resources and Electric Market of the
National Ministry of Economy. See
“
Item 4.B, Business
Overview
—
The Argentine
Electric Power Sector;
”
●
“
Energía Plus
”
refers to the regulatory framework
established under Resolution SE No. 1281/06, as amended. See
“
Item 4.B, Business
Overview
—
The Argentine
Electric Power Sector
—
Structure of the
Industry
—
Energ
’
a
Plus;
”
●
“
FONINVEMEM
” or “FONI”
refers to the
Fondo para
Inversiones Necesarias que Permitan Incrementar la Oferta de
Energía Eléctrica en el Mercado Eléctrico
Mayorista
(the Fund for Investments Required to Increase the
Electric Power Supply). See
“
Item 4.B, Business
Overview
—
The Argentine
Electric Power Sector
—
Structure of the
Industry
—
The FONINVEMEM
and Similar Programs;
”
●
“FONINVEMEM
Plants” refers to the plants Jos
é
de San Martín, Manuel Belgrano
and Vuelta de Obligado;
●
“
HPDA
”
refers
Hidroeléctrica Piedra del
Águila S.A.
, the corporation that previously owned the
Piedra del Aguila plant;
●
“IEASA”
refers to
Integracion
Energética Argentina S.A.;
●
“IGCE”
refers to
Inversora de Gas del
Centro S.A.;
●
“IGCU”
refers to
Inversora de Gas Cuyana
S.A.;
●
“
La Plata Plant Sale
”
refers to the sale of the La Plata
plant to YPF EE, effective as of January 5, 2018. For further
information on the La Plata Plant Sale, see
“Item 4.A. History and development of the
Company—
La Plata Plant Sale;
”
●
“
La Plata Plant Sale Effective
Date
”
is January 5, 2018.
For more information on the La Plata Plant Sale Effective Date, see
“Item 4.A. History and
development of the Company—
La Plata Plant
Sale;
”
●
“
LPC
”
refers to
La Plata Cogeneración
S.A.
, the corporation that owned the La Plata plant prior to
us;
●
“
LVFVD
”
refers to
liquidaciones de venta con
fecha de vencimientos a definir
, or receivables from CAMMESA
without a fixed due date. See
“
Item 4.B, Business
Overview
—
FONINVEMEM and
Similar Programs;
”
●
“MATER”
refers to Term Market for Renewable Energy (“MATER”)
Resolution No. 281-E/17;
●
“
MULC
”
refers to the foreign exchange
market;
●
“Resolution
SRRyME No. 1/19” refers to the resolution No. 1/19 issued by
the Secretary of Renewable Resources and Electric Markey of the
National Ministry of Economy by which the Secretary modified the
remuneration scheme (for capacity and energy) applicable to
Authorized Generators (electricity generators which do not have
contracts in the term market in any of its modalities) acting in
the WEM;
●
“
sales under contracts
”
refers collectively to (i) term
market sales of energy under contracts with private and public
sector counterparties, (ii) sales of energy sold under the
Energía Plus and (iii) sales of energy under the RenovAr
Program;
●
the
“
spot market
”
refers to energy sold by generators
to the WEM and remunerated by CAMMESA pursuant to the framework in
place prior to the Energía Base. See
“
Item 4.B, Business
Overview
—
The Argentine
Electric Power Sector
—
Structure of the
Industry
—
Electricity
Dispatch and Spot Market Pricing prior to Resolution SE No.
95/13;
”
●
“
PPA
”
refers to capacity and energy
supply agreements with customers;
●
“
YPF
”
refers to YPF S.A.,
Argentina
’
s state-owned
oil and gas company;
●
“
YPF EE
”
refers to YPF Energía
El
é
ctrica S.A., a
subsidiary of YPF; and
●
“
WEM
”
refers to the Argentine
Mercado
Eléctrico Mayorista
, the wholesale electric power
market. See
“
Item 4.B,
Business Overview
—
The
Argentine Electric Power Sector
—
General Overview of Legal
Framework
—
CAMMESA.
”
PRESENTATION OF FINANCIAL AND OTHER INFORMATION
Financial Statements
We maintain our
financial books and records and publish our consolidated financial
statements (as defined below) in Argentine pesos, which is our
functional currency. This annual report contains our audited
consolidated financial statements as of December 31, 2018 and 2017
and for each of the years ended December 31, 2018, 2017 and 2016
(our
“
audited
consolidated financial statements
”), which were approved by our board of
directors (our “Board of Directors”) on April 24,
2019.
We prepare our
audited consolidated financial statements in Argentine pesos and in
conformity with the IFRS as issued by the IASB.
In accordance with
IAS 29, the restatement of the financial statements is necessary
when the functional currency of an entity is the currency of a
hyperinflationary economy. To define a hyperinflationary state, IAS
29 provides a series of non-exclusive guidelines that consist of
(i) analyzing the behavior of the population, prices, interest
rates and wages before the evolution of price indexes and the loss
of the currency’s purchasing power, and (ii) as a
quantitative characteristic, verifying if the three-year cumulative
inflation rate approaches or exceeds 100%. Even if in recent years
there was an important increase in the general level of prices, the
three-year cumulative inflation was below 100%. However, due to
macroeconomic factors, the triennial inflation was above that
figure in 2018. Moreover, the goals of the Argentine government and
other available projections show that this trend will not be
reverted in the short term. So as to evaluate the mentioned
quantitative condition and to restate the financial statements, the
Argentine Securities Commission established that the series of
indexes to be used in the IAS 29 application is the one established
by the Argentine Federation of Professional Councils in Economic
Sciences. According to said index, inflation was 47.64%, 24.79% and
34.59% in the years ended December 31, 2018, 2017 and 2016,
respectively. See “
Risks
Relating to Argentina—
As of July 1, 2018, the
Argentine Peso qualifies as a currency of a hyperinflationary
economy and we are required to restate our historical financial
statements to apply inflationary adjustments, which could adversely
affect our results of operations and financial condition and those
of our Argentine subsidiaries” and “
—If the current levels of inflation do not
decrease, the Argentine economy could be adversely
affected.”
Therefore, our
audited consolidated financial statements included herein,
including the figures for the previous periods (this fact not
affecting the decisions taken on the financial information for such
periods), and, unless otherwise stated, the financial information
included elsewhere in this annual report, were restated to consider
the changes in the general purchasing power of the functional
currency of the Company (Argentine peso) pursuant to IAS 29 and
General Resolution no. 777/2018 of the Argentine Securities
Commission. Consequently, the financial statements are stated in
the current measurement unit as of December 31, 2018.
The information included in our
audited
consolidated financial statements
is
not comparable to the financial statements previously published by
us.
For more information, see
“Item 5.A. Operating
Results—
Factors Affecting our Results of
Operations
—
Inflation
” and Note 2.1.2 to our
audited
consolidated financial statements.
Because we qualify
as an emerging growth company (an
“
EGC
”
) as defined in Section 2(a)(19) of
the U.S. Securities Act of 1933, as amended (the
“
Securities Act
”
), we have elected to provide in
this annual report more limited disclosures than an issuer that
would not qualify as an EGC would be required to provide. We remind
investors that we are required to file financial statements and
other periodic reports with the CNV because we are a public company
in Argentina. Investors can access our historical financial
statements published in Spanish on the CNV
’
s website at www.cnv.gob.ar. The
information found on the CNV
’
s website is not a part of this
annual report. Investors are cautioned not to place undue reliance
on our financial statements not included in this annual
report.
Currency and Rounding
All references
herein to
“
pesos,
”
“
Argentine pesos
”
or
“
Ps.
”
are to Argentine pesos, the legal
currency of Argentina. All references to
“
U.S. dollars,
”
“
dollars
”
or
“
US$
”
are to U.S. dollars. All references
to
“
SEK$
”
are to Swedish krona. A
“
billion
”
is a thousand million.
Solely for the
convenience of the reader, we have translated certain amounts
included in this annual report from pesos into U.S. dollars, unless
otherwise indicated, using the seller rate for U.S. dollars quoted
by the Banco de la Nación Argentina for wire transfers
(
divisas
) as of December
28, 2018, of Ps.37.70 per US$1.00. The Federal Reserve Bank of New
York does not report a noon buying rate for pesos. The U.S. dollar
equivalent information presented in this annual report is provided
solely for the convenience of the reader and should not be
construed to represent that the peso amounts have been, or could
have been or could be, converted into U.S. dollars at such rates or
at any other rate. See “Item 3.A. Selected Financial
Data
—Exchange
Rates.”
Certain figures
included in this annual report and in the audited consolidated
financial statements contained herein have been rounded for ease of
presentation. Percentage figures included in this annual report
have in some cases been calculated on the basis of such figures
prior to rounding. For this reason, certain percentage amounts in
this annual report may vary from those obtained by performing the
same calculations using the figures in this annual report and in
the consolidated financial statements contained herein. Certain
other amounts that appear in this annual report may not sum due to
rounding.
Market Share and Other Information
The information set
forth in this annual report with respect to the market environment,
market developments, growth rates and trends in the markets in
which we operate is based on information published by the Argentine
federal and local governments through the
Instituto Nacional de
Estad’siticas y Censos
(the National Statistics and
Census Institute, or
“
INDEC
”
), the Ministry of Interior, the
Ministry of Energy, the Central Bank, CAMMESA, the
Dirección General de
Estadística y Censos de la Ciudad de Buenos Aires
(General Directorate of Statistics and Census of the City of Buenos
Aires) and the
Dirección Provincial de
Estadística y Censos de la Provincia de San Luis
(Provincial Directorate of Statistics and Census of the Province of
San Luis), as well as on independent third-party data, statistical
information and reports produced by unaffiliated entities, as well
as on our own internal estimates. In addition, this annual report
contains information from Vaisala, Inc. (
“
Vaisala - 3 Tier
”
), a company that develops,
manufactures and markets products and services for environmental
and industrial measurement.
This annual report
also contains estimates that we have made based on third-party
market data. Market studies are frequently based on information and
assumptions that may not be exact or appropriate.
Although we have no
reason to believe any of this information or these sources are
inaccurate in any material respect, we have not verified the
figures, market data or other information on which third parties
have based their studies, nor have we confirmed that such third
parties have verified the external sources on which such estimates
are based. Therefore, we do not guarantee, nor do we assume
responsibility for, the accuracy of the information from
third-party studies presented in this annual report.
This annual report
also contains estimates of market data and information derived
therefrom which cannot be gathered from publications by market
research institutions or any other independent sources. Such
information is based on our internal estimates. In many cases there
is no publicly available information on such market data, for
example from industry associations, public authorities or other
organizations and institutions. We believe that these internal
estimates of market data and information derived therefrom are
helpful in order to give investors a better understanding of the
industry in which we operate as well as our position within this
industry. Although we believe that our internal market observations
are reliable, our estimates are not reviewed or verified by any
external sources. These may deviate from estimates made by our
competitors or future statistics provided by market research
institutes or other independent sources. We cannot assure you that
our estimates or the assumptions are accurate or correctly reflect
the state and development of, or our position in, the
industry.
FORWARD-LOOKING STATEMENTS
This annual report
contains estimates and forward-looking statements, principally in
“Item 3.D.
Risk
Factors,
” “Item
4.B.
Business Overview
”
and “Item 5.
Operating and Financial Review and
Prospects.
”
Our estimates and
forward-looking statements are mainly based on our current beliefs,
expectations and estimates of future courses of action, events and
trends that affect or may affect our business and results of
operations. Although we believe that these estimates and
forward-looking statements are based upon reasonable assumptions,
they are subject to several risks and uncertainties and are made in
light of information currently available to us.
Many important
factors, in addition to those discussed elsewhere in this annual
report, could cause our actual results to differ substantially from
those anticipated in our forward-looking statements, including,
among other things:
●
changes in general
economic, financial, business, political, legal, social or other
conditions in Argentina;
●
changes in
conditions elsewhere in Latin America or in either developed or
emerging markets;
●
changes in capital
markets in general that may affect policies or attitudes toward
lending to or investing in Argentina or Argentine companies,
including volatility in domestic and international financial
markets;
●
increased
inflation;
●
fluctuations in
exchange rates, including a significant devaluation of the
Argentine peso;
●
changes in the law,
norms and regulations applicable to the Argentine electric power
and energy sector, including changes to the current regulatory
frameworks, changes to programs established to incentivize
investments in new generation capacity and reductions in government
subsidies to consumers;
●
our ability to
develop our expansion projects and to win awards for new potential
projects;
●
increases in
financing costs or the inability to obtain additional debt or
equity financing on attractive terms, which may limit our ability
to fund new activities;
●
government
intervention, including measures that result in changes to the
Argentine labor market, exchange market or tax system;
●
adverse legal or
regulatory disputes or proceedings;
●
changes in the
price of energy, power and other related services;
●
changes in the
prices and supply of natural gas or liquid fuels;
●
changes in the
amount of rainfall and accumulated water;
●
changes in
environmental regulations, including exposure to risks associated
with our business activities;
●
risks inherent to
the demand for and sale of energy;
●
the operational
risks related to the generation, as well as the transmission and
distribution, of electric power;
●
ability to
implement our business strategy, including the ability to complete
our construction and expansion plans in a timely manner and
according to our budget;
●
competition in the
energy sector, including as a result of the construction of new
generation capacity;
●
exposure to credit
risk due to credit arrangements with CAMMESA;
●
our ability to
retain key members of our senior management and key technical
employees;
●
our relationship
with our employees; and
●
other factors
discussed under
“Item
3.D.—
Risk Factors
”
in this annual report.
The words
“
believe,
”
“
may,
”
“
will,
”
“
aim,
”
“
estimate,
”
“
continue,
”
“
anticipate,
”
“
intend,
”
“
expect,
”
“
forecast
”
and similar words are intended to
identify forward-looking statements. Forward-looking statements
include information concerning our possible or assumed future
results of operations, business strategies, financing plans,
competitive position, industry environment, potential growth
opportunities, the effects of future regulation and the effects of
competition. Forward-looking statements speak only as of the date
they were made, and we do not undertake any obligation to update
publicly or to revise any forward-looking statements after we
distribute this annual report because of new information, future
events or other factors, except as required by applicable law. In
light of the risks and uncertainties described above, the
forward-looking events and circumstances discussed in this annual
report might not occur and do not constitute guarantees of future
performance. Because of these uncertainties, you should not make
any investment decisions based on these estimates and
forward-looking statements.
Not
applicable.
Not
applicable.
The following
tables present selected consolidated financial data for us as of
the dates and for the periods indicated. You should read this
information in conjunction with our audited consolidated financial
statements and related notes beginning on page F-1, and the
information under “Item 5.A Operating Results” included
elsewhere in this annual report.
The selected
consolidated financial data as of December 31, 2018 and 2017 and
for the years ended December 31, 2018, 2017 and 2016 has been
derived from our audited consolidated financial statements included
in this annual report. Prior period amounts have been restated to
reflect the La Plata plant operations as discontinued operations in
all periods presented. Please see Note 21 to our audited
consolidated financial statements for further information on how we
have accounted for the La Plata Plant Sale in our audited
consolidated financial statements. Our historical results are not
necessarily indicative of our future results. Our audited
consolidated financial statements have been audited by Pistrelli,
Henry Martin y Asociados S.R.L. (a member firm of Ernst & Young
Global), an independent registered public accounting firm, whose
audit report is included elsewhere in this annual
report.
In accordance with
IAS 29, the restatement of the financial statements is necessary
when the functional currency of an entity is the currency of a
hyperinflationary economy. To define a hyperinflationary state, IAS
29 provides a series of non-exclusive guidelines that consist of
(i) analyzing the behavior of the population, prices, interest
rates and wages before the evolution of price indexes and the loss
of the currency’s purchasing power, and (ii) as a
quantitative characteristic, verifying if the three-year cumulative
inflation rate approaches or exceeds 100%. Even if in the recent
years there was an important increase in the general level of
prices, the three-year cumulative inflation was below 100%.
However, due to macroeconomic factors, the triennial inflation was
above that figure in 2018. Moreover, the goals of the Argentine
government and other available projections show that this trend
will not be reverted in the short term. So as to evaluate the
mentioned quantitative condition and to restate the financial
statements, the Argentine Securities Commission established that
the series of indexes to be used in the IAS 29 application is the
one established by the Argentine Federation of Professional
Councils in Economic Sciences. According to said index, inflation
was 47.64%, 24.79% and 34.59% in the years ended December 31, 2018,
2017 and 2016, respectively. See “
Risks Relating to Argentina—
As of
July 1, 2018, the Argentine Peso qualifies as a currency of a
hyperinflationary economy and we are required to restate our
historical financial statements to apply inflationary adjustments,
which could adversely affect our results of operations and
financial condition and those of our Argentine subsidiaries”
and “
—If the current
levels of inflation do not decrease, the Argentine economy could be
adversely affected.”
Therefore, our
audited consolidated financial statements included herein,
including the figures for the previous periods (this fact not
affecting the decisions taken on the financial information for such
periods), and, unless otherwise stated, the financial information
included elsewhere in this annual report, were restated to consider
the changes in the general purchasing power of the functional
currency of the Company (Argentine peso) pursuant to IAS 29 and
General Resolution no. 777/2018 of the Argentine Securities
Commission. Consequently, the financial statements are stated in
the current measurement unit as of December 31, 2018.
The information included in our
audited
consolidated financial statements
, is
not comparable to the financial statements previously published by
us.
For more information, see
“Item 5.A. Operating
Results—
Factors Affecting our Results of
Operations
—
Inflation
” and Note 2.1.2 to our
audited
consolidated financial statements.
The selected
financial data as of and for the year ended December 31, 2015 has
not been presented as this cannot be provided on a restated basis
without unreasonable effort or expense.
We maintain our
financial books and records and publish our audited consolidated
financial statements in Argentine pesos, which is our functional
currency. We prepare our audited consolidated financial statements
in Argentine pesos and in conformity with IFRS as issued by the
IASB.
Solely for
convenience of the reader, Peso amounts as of and for the year
ended December 31, 2018 have been translated into U.S.
dollars. The rate used to translate such amounts as of December 31,
2018 was Ps. 37.70 to US$1.00, which was the reference exchange
rate reported by the Banco de la Nación Argentina for wire
transfers (
divisas
) as of
December 28, 2018. The U.S. dollar equivalent information presented
in this annual report is provided solely for the convenience of the
reader and should not be construed to represent that the Peso
amounts have been, or could have been or could be, converted into,
U.S. dollars at such rates or any other rate. See “Item 3.A.
Selected Financial Data
—Exchange
Rates.”
1
|
|
Year Ended December
31,
|
|||
|
|
(in thousands of
US$)
(1)
|
(in thousands of
Ps.)
|
||
|
|
2018
|
2018
|
2017
|
2016
|
|
Continuing
operations
|
|
|
|
|
|
Revenues
|
378,392
|
14,265,370
|
9,638,568
|
7,044,039
|
|
Cost of
sales
|
(172,061
)
|
(6,486,698
)
|
(5,199,149
)
|
(4,980,226
)
|
|
Gross
income
|
206,331
|
7,778,672
|
4,439,419
|
2,063,813
|
|
Administrative and
selling expenses
|
(36,852
)
|
(1,389,336
)
|
(1,056,257
)
|
(892,626
)
|
|
Other operating
income
|
350,739
|
13,222,842
|
930,062
|
2,324,243
|
|
Other operating
expenses
|
(3,525
)
|
(132,881
)
|
(140,138
)
|
(171,952
)
|
|
CVO receivables
update
|
292,229
|
11,017,014
|
-
|
-
|
|
Operating
income
|
808,922
|
30,496,311
|
4,173,086
|
3,323,478
|
|
Loss on net
monetary position
|
(107,061
)
|
(4,036,196
)
|
(151,904
)
|
(1,836,626
)
|
|
Finance
income
|
60,483
|
2,280,193
|
1,558,816
|
873,915
|
|
Finance
expenses
|
(167,132
)
|
(6,300,881
)
|
(1,200,654
)
|
(1,205,447
)
|
|
Share of the profit
of associates
|
28,493
|
1,074,185
|
1,173,004
|
422,650
|
|
Income
before income tax from continuing operations
|
623,705
|
23,513,612
|
5,552,348
|
1,577,970
|
|
Income tax for the
year
|
(175,182
)
|
(6,604,351
)
|
(1,081,177
)
|
(1,006,417
)
|
|
Net
income for the year from continuing operations
|
448,523
|
16,909,261
|
4,471,171
|
571,553
|
|
Discontinued
operations
|
|
|
|
|
|
Income after tax
for the year from discontinued operations
|
7,326
|
276,177
|
791,274
|
806,989
|
|
Net
income for the year
|
455,849
|
17,185,438
|
5,262,445
|
1,378,542
|
|
Other comprehensive
income, net
|
(5,136
)
|
(193,613
)
|
(520,885
)
|
357,911
|
|
Total
comprehensive income for the year
|
450,172
|
16,991,825
|
4,741,560
|
1,736,453
|
|
Number
of Outstanding Shares (basic and diluted)
|
1,505,170,408
|
1,505,170,408
|
1,505,170,408
|
1,505,170,408
|
|
Net
income per share (basic and diluted)
|
0.30
|
11.64
|
3.52
|
0.92
|
|
Net
income per share from continuing operations (Ps.)
|
0.30
|
11.46
|
2.99
|
0.38
|
|
Cash
dividend per share (Ps.)
|
0.02
|
0.94
|
1.25
|
1.69
|
_____________
(1)
Solely for the
convenience of the reader, peso amounts as of December 31, 2018
have been translated into U.S. dollars at the exchange rate as of
December 28, 2018 of Ps. 37.70 to US$1.00. See “Exchange
Rates” and “Presentation of Financial and Other
Information” for further information on recent fluctuations
in exchange rates.
Selected Consolidated Statement of Financial Position
|
|
As of December
31,
|
|||
|
|
(in thousands of
US$)
(1)
|
(in thousands of
Ps.)
|
||
|
|
2018
|
2018
|
2017
|
2016
|
|
Capital
stock
|
40,160
|
1,514,022
|
1,514,022
|
1,514,022
|
|
Equity
|
873,444
|
32,928,854
|
17,031,535
|
13,676,029
|
|
Total
Assets
|
1,518,828
|
57,259,866
|
34,348,994
|
30,398,781
|
(1)
Solely for the
convenience of the reader, peso amounts as of December 31, 2018
have been translated into U.S. dollars at the exchange rate as of
December 28, 2018 of Ps.37.70 to US$1.00. See
“—Exchange Rates” and “Presentation of
Financial and Other Information” for further information on
recent fluctuations in exchange rates.
2
|
|
As of December
31,
|
||
|
|
(in thousands of
US$)
(1)
|
(in thousands of
Ps.)
|
|
|
|
2018
|
2018
|
2017
|
|
Non-current
assets
|
|
|
|
|
Property, plant and
equipment
|
598,605
|
22,567,418
|
17,451,669
|
|
Intangible
assets
|
59,290
|
2,235,230
|
1,988,603
|
|
Investment in
associates
|
53,006
|
1,998,336
|
1,830,138
|
|
Trade and other
receivables
(2)
|
442,218
|
16,671,608
|
3,842,054
|
|
Other non-financial
assets
|
5,914
|
222,955
|
18,782
|
|
Deferred tax
asset
|
-
|
-
|
2,996
|
|
Inventories
|
1,981
|
74,687
|
71,187
|
|
Total
non-current
assets
|
1,161,014
|
43,770,234
|
25,205,429
|
|
Current
assets
|
|
|
|
|
Inventories
|
5,859
|
220,896
|
194,640
|
|
Other non-financial
assets
|
13,133
|
495,130
|
695,313
|
|
Trade and other
receivables
(2)
|
280,611
|
10,579,028
|
5,733,942
|
|
Other financial
assets
|
52,112
|
1,964,630
|
1,639,941
|
|
Cash and cash
equivalents
|
6,099
|
229,948
|
130,863
|
|
Total
current
assets
|
357,814
|
13,489,632
|
8,394,699
|
|
Assets
held for
sale
|
-
|
-
|
748,866
|
|
Total
assets
|
1,518,828
|
57,259,866
|
34,348,994
|
|
Equity
and liabilities
|
|
|
|
|
Equity
|
|
|
|
|
Capital
stock
|
40,160
|
1,514,022
|
1,514,022
|
|
Adjustment to
capital
stock
|
303,505
|
11,442,144
|
11,442,144
|
|
Legal
reserve
|
10,170
|
383,393
|
162,480
|
|
Voluntary
reserve
|
116,877
|
4,406,281
|
1,019,873
|
|
Retained
earnings
|
390,327
|
14,715,337
|
2,206,313
|
|
Accumulated other
comprehensive
income
|
-
|
-
|
207,999
|
|
Non-controlling
interests
|
12,405
|
467,677
|
478,704
|
|
Total
equity
|
873,444
|
32,928,854
|
17,031,535
|
|
Non-current
liabilities
|
|
|
|
|
Other non-financial
liabilities
|
51,960
|
1,958,883
|
692,009
|
|
Other loans and
borrowings
|
138,038
|
5,204,030
|
2,183,278
|
|
Borrowings from
CAMMESA
|
26,639
|
1,004,304
|
1,558,485
|
|
Compensation and
employee benefits
liabilities
|
3,938
|
148,470
|
166,983
|
|
Deferred income tax
liabilities
|
127,145
|
4,793,384
|
3,847,033
|
|
Total
non-current
liabilities
|
347,720
|
13,109,071
|
8,447,788
|
|
Current
liabilities
|
|
|
|
|
Trade and other
payables
|
45,886
|
1,729,909
|
1,501,885
|
|
Other non-financial
liabilities
|
44,056
|
1,660,944
|
973,971
|
|
Other loans and
borrowings
|
48,088
|
1,812,910
|
2,588,283
|
|
Borrowings from
CAMMESA
|
17,843
|
672,668
|
746,503
|
|
Compensation and
employee benefits
liabilities
|
10,376
|
391,168
|
477,136
|
|
Income tax
payable
|
117,158
|
4,416,843
|
1,619,402
|
|
Provisions
|
14,257
|
537,499
|
610,476
|
|
Total
current
liabilities
|
297,664
|
11,221,941
|
8,517,656
|
|
Liabilities
directly associated with the assets held for sale
|
-
|
-
|
352,015
|
|
|
297,664
|
11,221,941
|
8,869,671
|
|
Total
liabilities
|
645,385
|
24,331,012
|
17,317,459
|
|
Total
equity and
liabilities
|
1,518,828
|
57,259,866
|
34,348,994
|
(1)
Solely for the
convenience of the reader, peso amounts as of December 31, 2018
have been translated into U.S. dollars at the exchange rate as of
December 28, 2018 of Ps.37.70 to US$1.00. See
“—Exchange Rates” and “Presentation of
Financial and Other Information” for further information on
recent fluctuations in exchange rates.
(2)
Trade and other
receivables include receivables from CAMMESA. See “Item 5.
Operating and Financial Review and Prospects—Liquidity and
Capital Resources,” and “—Receivables from
CAMMESA.”
Exchange Rates
From April 1, 1991
until the end of 2001, Law No. 23,928 (the
“
Convertibility Law
”
) established a regime under which
the Central Bank was obliged to sell U.S. dollars at a fixed rate
of one peso per U.S. dollar. On January 6, 2002, the Argentine
Congress enacted the Public Emergency Law, formally ending the
regime of the Convertibility Law, abandoning over ten years of U.S.
dollar-peso parity and eliminating the requirement that the Central
Bank
’
s reserves in gold,
foreign currency and foreign currency denominated debt be at all
times equivalent to 100% of the monetary base.
The Public
Emergency Law, which was in effect until December 31, 2017, granted
the Argentine government the power to set the exchange rate between
the peso and foreign currencies and to issue regulations related to
the MULC. Following a brief period during which the Argentine
government established a temporary dual exchange rate system,
pursuant to the Public Emergency Law, the peso has been allowed to
float freely against other currencies since February 2002. However,
the Argentine Central Bank has had the power to intervene in the
exchange rate market by buying and selling foreign currency for its
own account, a practice in which it engaged on a regular basis. In
recent years and particularly since 2011, the Argentine government
has increased controls on exchange rates and the transfer of funds
into and out of Argentina.
With
the tightening of exchange controls beginning in late 2011, in
particular with the introduction of measures that allowed limited
access to foreign currency by private sector companies and
individuals (such as requiring an authorization of tax authorities
to access the foreign currency exchange market), the implied
exchange rate, as reflected in the quotations for Argentine
securities that trade in foreign markets, compared to the
corresponding quotations in the local market, increased
significantly over the official exchange rate. Most of the foreign
exchange restrictions were gradually lifted in since December 2015,
and finally on May 19, 2017, the Central Bank issued Communication
“
A
”
6244, which substantially modified
the applicable foreign exchange regulations and eliminated the set
of restrictions for accessing the MULC. As a result of the
elimination of the limit amount for the purchase of foreign
currency without specific allocation or need of prior approval the
substantial spread between the official exchange rate and the
implicit exchange rate derived from securities transactions has
substantially decreased. In addition, by virtue of the 2018 IMF
Agreement (see “Item 4. Information of the
Company
—
Recent Political
and Economic Developments in Argentina
— IMF Agreement
”), on September
28, 2018.
As of October 1, 2018, the
BCRA introduced an exchange rate band. The peso’s exchange
rate with the U.S. Dollar was allowed to fluctuate between Ps.34.00
and Ps.44.00 per US$1.00 (range that was adjusted daily at an
annual rate of 3% until December 2018, and for the first quarter of
2019, is adjusted daily at an annual rate of 2%) without the
BCRA’s intervention. On April 29, 2019, the Monetary Policy
Counsel (Comité de Política Monetaria) of the Central
Bank (the “COPOM”) decided to introduce changes to the
monetary policy, with an aim to reducing volatility in the foreign
exchange market. According to the new scheme: (i) if the exchange
rate is between Ps. 39.755 and Ps. 51.488, the Central Bank may
intervene, subject to market conditions, in the foreign exchange
market and sell U.S. dollars in the market, and (ii) if
the
exchange rate is above Ps. 51.488, the Central
Bank will sell foreign currency for up to 250 million U.S. dollars
daily. Also, the Central Bank could decide to perform additional
interventions. The Argentine pesos resulting from such sales will
be discounted from the monetary base. The COPOM also confirmed that
the Central Bank will not intervene until June 2019 in the foreign
exchange market if the exchange rate decreases below Ps.
39.755.
3
After several years
of moderate variations in the nominal exchange rate, in 2012 the
peso depreciated approximately 14% with respect to the U.S. dollar.
This was followed in 2013 and 2014 by a depreciation of the peso
with respect to the U.S. dollar that exceeded 30%, including a loss
of approximately 23% in January 2014. In 2015, the peso depreciated
approximately 52% with respect to the U.S. dollar, including,
approximately, a 10% devaluation from January 1, 2015 to September
30, 2015 and a 38% devaluation during the last quarter of the year,
mainly concentrated after December 16, 2015 when certain exchange
controls were lifted. In 2016, 2017 and 2018, the peso depreciated
approximately 21.86%, 17.36% and 102.16%, respectively, in each
case, with respect to the U.S. dollar. The peso depreciated
approximately 19.10% from December 28, 2018 through April 25,
2019.
The following table
sets forth the annual high, low, average and period-end exchange
rates for the periods indicated, expressed in pesos per U.S. dollar
and not adjusted for inflation. There can be no assurance that the
peso will not depreciate or appreciate again in the future. The
Federal Reserve Bank of New York does not report a buying rate for
pesos.
|
|
Exchange
Rates
|
|||
|
|
High
(1)
|
Low
(1)
|
Average
(1)(2)
|
Period-end
(1)
|
|
2014
|
8.5570
|
6.5210
|
8.1196
|
8.5510
|
|
2015
|
13.4000
|
8.5550
|
9.2653
|
13.0400
|
|
2016
|
16.0300
|
13.2000
|
14.8403
|
15.8900
|
|
2017
|
19.2000
|
15.1900
|
16.5704
|
18.6490
|
|
2018
|
41.2500
|
18.4100
|
28.1762
|
37.7000
|
|
October
|
40.5000
|
35.9500
|
37.2065
|
35.9500
|
|
November
|
39.0500
|
35.4000
|
36.4555
|
37.7200
|
|
December
|
38.6000
|
36.5000
|
37.8350
|
37.7000
|
|
2019
|
|
|
|
|
|
January
|
37.7100
|
36.9000
|
37.3836
|
37.3500
|
|
February
|
39.6700
|
37.1700
|
38.4045
|
39.1500
|
|
March
|
42.5000
|
39.8100
|
41.1120
|
43.3500
|
|
April
(3)
|
44.9000
|
41.6200
|
42.9719
|
44.9000
|
(1)
Pesos to U.S.
dollars exchange rate as quoted by the Banco de la Naci
ó
n Argentina for wire transfers
(
divisas
).
(2)
Average of the
exchange rates based on working day
’
s averages for each
month.
(3)
Through April 25,
2019.
Not
applicable.
Not
applicable.
You should carefully consider the risks described below, as well as
the other information in this annual report. Our business, results
of operations, financial condition or prospects could be materially
and adversely affected if any of these risks occurs, and as a
result, the market price of our common shares and ADSs could
decline. The risks described below are those known to us and that
we currently believe may materially affect us.
4
Risks Relating to Argentina
Substantially all of our revenues are generated in Argentina and
thus are highly dependent on economic and political conditions in
Argentina
Central Puerto is
an Argentine corporation (
sociedad anónima
).
All of our assets and operations are located in Argentina.
Accordingly, our financial condition and results of operations
depend to a significant extent on macroeconomic, regulatory, social
and political conditions prevailing in Argentina, including the
level of growth, inflation rates, foreign exchange rates, interest
rates and international developments and conditions that may affect
Argentina. Between 2007 and 2015, the Fern
á
ndez de Kirchner administrations
increased direct intervention in the Argentine economy, including
the implementation of expropriation measures, price controls,
exchange controls and changes in laws and regulations affecting
foreign trade and investment. These measures had a material adverse
effect on private sector entities, including us. It is possible
that similar measures could be adopted by the current or future
Argentine government or that economic, social and political
developments in Argentina, over which we have no control, could
have a material adverse effect on the Argentine economy and, in
turn, adversely affect our financial condition and results of
operations. See
“
Management
’
s Discussion and Analysis of
Financial Condition and Results of Operations
—
Factors Affecting our Results of
Operations
—
Argentine
Economic Conditions.
”
The Argentine economy remains vulnerable and any significant
decline could adversely affect our results of
operations
The Argentine
economy has experienced significant volatility in recent decades,
characterized by periods of low or negative growth, high levels of
inflation and currency devaluation. Sustainable economic growth in
Argentina is dependent on a variety of factors, including the
international demand for Argentine exports, the stability and
competitiveness of the peso against foreign currencies, confidence
among consumers and foreign and domestic investors, a stable rate
of inflation, national employment levels and the circumstances of
Argentina
’
s regional
trade partners.
Argentina’s
economy contracted during 2018 and the country’s economy
remains vulnerable and unstable notwithstanding efforts by the
Argentine government to address inflation and foreign exchange
instability, as reflected by the following economic
conditions:
●
inflation remains
high and may continue at similar levels in the future; according to
a report published by INDEC, cumulative consumer price inflation
from December 2017 to December, 2018 was 47.64%, and inflation
during January 2019 and February 2019, was 2.9% and 3.8%,
respectively;
●
according to the
revised calculation of the 2004 GDP published by the INDEC in March
2017, which forms the basis for the real GDP calculation for every
year after 2004, GDP decreased by 2.3% in 2016 (as compared to
2015) and increased by 2.6% in 2015, as compared to a decline of
2.5% in 2014 and growth of 2.4% in 2013. According to data
published by the INDEC on March 22, 2018 GDP for 2017 increased by
2.9%. According to preliminary data published by the INDEC on March
22, 2018, GDP for 2018 decreased 2.5%. Argentina’ s GDP
performance has depended to a significant extent on high commodity
prices which, despite having favorable long-term trends, are
volatile in the short-term and beyond the control of the Argentine
government and private sector;
●
Argentina
’
s
public debt as a percentage of GDP remains high;
●
the discretionary
increase in public expenditures has resulted, and could continue to
result, in a fiscal deficit;
●
investment as a
percentage of GDP remains too low to sustain the growth rate of the
past decade;
●
a significant
number of protests or strikes could take place, as has occurred in
the past, which could adversely affect various sectors of the
Argentine economy;
●
energy or natural
gas supply may not be sufficient to supply industrial activity
(thereby limiting industrial development) and
consumption;
●
unemployment and
informal employment remain high, according to INDEC, unemployment
rate during the fourth quarter of 2018 was 9.1%; and
●
in the climate
created by the above mentioned conditions, demand for foreign
currency could grow, generating a capital flight effect as in
recent years.
5
Argentina’s
fiscal imbalances, its dependence on foreign revenues to cover its
fiscal deficit, and material rigidities that have historically
limited the ability of the economy to absorb and adapt to external
factors, have added to the severity of the current
crisis.
As in the recent
past, Argentina
’
s economy
may be adversely affected if political and social pressures inhibit
the implementation by the Argentine government of policies designed
to control inflation, generate growth and enhance consumer and
investor confidence, or if policies implemented by the Argentine
government that are designed to achieve these goals are not
successful. These events could materially adversely affect our
financial condition and results of operations.
Any decline in
economic growth, increased economic instability or expansion of
economic policies and measures taken by the Argentine government to
control inflation or address other macroeconomic developments that
affect private sector entities such as us, all developments over
which we have no control, could have an adverse effect on our
financial condition or results of operations.
Certain risks are inherent in any investment in a company operating
in a developing country such as Argentina
Argentina is
developing country and investing in developing countries generally
carries risks. These risks include political, social and economic
instability that may affect Argentina’s economic results
which can stem from many factors, including the
following:
●
high interest
rates;
●
abrupt changes in
currency values;
●
high levels of
inflation;
●
exchange
controls;
●
wage and price
controls;
●
regulations to
import equipment and other necessities relevant for
operations;
●
changes in
governmental economic, administrative or tax policies;
and
●
political and
social tensions.
Any of these
factors, as well as volatility in the capital markets, may
adversely affect our business, results of operations, financial
condition, the value of our ADSs, and our ability to meet our
financial obligations.
Economic and political developments in Argentina, including the
upcoming presidential and congressional elections, and future
policies of the Argentine government, may affect the economy, as
well as the operations of the energy industry, including the
operations of Central Puerto
Since assuming
office on December 10, 2015, the Macri administration has announced
and implemented several significant economic and policy reforms
(see “Item 4. Information of the Company
—
Recent Political and Economic
Developments in Argentina.”) As of the date of this annual
report, the long-term impact of these measures and any future
measures taken by the current administration on the Argentine
economy as a whole and the energy sector in particular remains
uncertain.
The Macri
administration’s political party
Cambiemos
does not have
a majority of seats in the Argentine Congress and, therefore, it
may be difficult to adopt some of those measures unless he obtains
support from the opposition, creating uncertainty as to the ability
of the Macri administration to pass any measure that it expects to
implement. In addition, recent judicial decisions substantially
limiting the Macri administration
’
s efforts to raise tariffs and
protests throughout Argentina in respect of such efforts have added
to political uncertainty. This political uncertainty in respect of
economic measures could lead to volatility in the market prices of
securities of Argentine companies.
The fiscal,
monetary and currency adjustments undertaken by the Macri
administration may subdue growth in the short-term. For example,
immediately after the foreign exchange controls were lifted on
December 16, 2015, the dismantling of the multiple exchange regime
resulted in the official peso exchange rate (available only for
certain types of transactions) falling in value by 40.1%, as the
peso-U.S. dollar exchange rate reached Ps.13.76 to US$1.00 on
December 17, 2015. See “
—Significant fluctuations in the value of
the peso could adversely affect the Argentine economy and, in turn,
adversely affect our results of operations”
On April
25, 2019, the exchange rate was Ps.44.90 to US$1.00, as quoted by
the Banco de la Naci
ó
n
Argentina for wire transfers (
divisas
).
6
As of the date of
this annual report, the impact that these measures and any future
measures taken by the current administration will have on the
Argentine economy as a whole and the electric power industry in
particular cannot be predicted. The planned economic liberalization
could be disruptive to the economy and fail to benefit, or harm,
our business. In particular, we have no control over the
implementation of the reforms to the regulatory framework that
governs our operations and cannot guarantee that these reforms will
be implemented or implemented in a manner that will benefit our
business. The failure of these measures to achieve their intended
goals could adversely affect the Argentine economy, which, in turn
may have an adverse effect on our financial condition and results
of operations.
Further,
presidential and congressional elections in Argentina are scheduled
to take place in October 2019, and their impact on the future
economic and political environment is uncertain, but likely to be
material. This uncertainty may itself have a material adverse
effect on Argentina’s economy. No assurances can be made as
to the policies that may be implemented by a new Argentine
administration, or that political developments in Argentina will
not adversely affect the Argentine economy and our business,
financial condition and results of operations. In addition, we
cannot assure you that future economic, regulatory, social and
political developments in Argentina will not impair our business,
financial condition or results of operations, or cause the market
value of our shares to decline.
If the current levels of inflation do not decrease, the Argentine
economy could be adversely affected
Historically,
inflation has materially undermined the Argentine economy and the
Argentine government
’
s
ability to create conditions that permit growth. In recent years,
Argentina has experienced high inflation rates. See
“—
The credibility of several
Argentine economic indices has been called into question, which has
led to a lack of confidence in the Argentine economy and could
affect your evaluation of the market value of the ADSs
”
below.
During 2016, the
City of Buenos Aires CPI inflation rate was 41.05%, while according
to the Province of San Luis CPI, the inflation rate was 31.53%.
During 2017, the INDEC’s CPI inflation rate was recorded at
24.8%. The CPI for 2018 was 47.64%, the highest rate since 1991. In
the past, and particularly throughout the Fern
á
ndez de Kirchner administration, the
Argentine government has implemented programs to control inflation
and monitor prices for essential goods and services, including
attempts to freeze the price of certain supermarket products and
price support arrangements agreed between the Argentine government
and private sector companies in several industries and markets,
that did not address the structural causes of inflation and failed
to reduce inflation.
High inflation
rates affect Argentina
’
s
foreign competitiveness, social and economic inequality, negatively
impacts employment, consumption and the level of economic activity
and undermine confidence in Argentina
’
s banking system, which could
further limit the availability of and access by local companies to
domestic and international credit.
Inflation remains a
challenge for Argentina given its persistent nature in recent
years. The Argentine government announced its intention to reduce
the primary fiscal deficit as a percentage of GDP over time and
also reduce the Argentine government
’
s reliance on Central Bank financing
(see “Item 4. Information of the Company
—
Recent Political and Economic
Developments in Argentina”). If, despite the measures adopted
by the Argentine government, these measures fail to address
Argentina
’
s structural
inflationary imbalances, the current levels of inflation may
continue and have an adverse effect on Argentina
’
s economy and can also lead to an
increase in Argentina
’
s
debt. Moreover, certain objectives of the Argentine government,
such as the increase in tariffs to incentivize investment in the
energy sector, may create inflationary pressures. Inflation in
Argentina has contributed to a material increase in our costs of
operation, in particular labor costs, and negatively impacted our
financial condition.
Inflation rates
could escalate in the future, and there is uncertainty regarding
the effects that the measures adopted, or that may be adopted in
the future, by the Argentine government to control inflation may
have. See
“—
Government intervention may
adversely affect the Argentine economy and, as a result, our
business and results of operations.
”
Increased inflation could adversely
affect the Argentine economy, which in turn may have an adverse
effect on our financial condition and results of operations. See
“
Item 5.A. Operating
Results
—
Factors Affecting
Our Results of Operations
—
Inflation.
”
As of July 1, 2018, the Argentine Peso qualifies as a currency of a
hyperinflationary economy and we are required to restate our
historical financial statements to apply inflationary adjustments,
which could adversely affect our results of operations and
financial condition and those of our Argentine
subsidiaries.
Pursuant to the
International Accounting Standard 29, Financial Reporting in
Hyperinflationary Economies (“IAS 29”), the financial
statements of entities whose functional currency is that of a
hyperinflationary economy must be adjusted for the effects of
changes in a general price index. IAS 29 does not prescribe when
hyperinflation arises and the International Accounting Standards
Board (“IASB”) does not identify specific
hyperinflationary jurisdictions. However, IAS 29 provides a series
of non-exclusive guidelines that consist of (i) analyzing the
behavior of the population, prices, interest rates and wages before
the evolution of price indexes and the loss of the currency’s
purchasing power, and (ii) as a quantitative characteristic,
verifying if the three-year cumulative inflation rate approaches or
exceeds 100%. In June 2018, the International Practices Task Force
of the Centre for Quality (“IPTF”), which monitors
countries experiencing high inflation, categorized Argentina as a
country with projected three-year cumulative inflation rate greater
than 100%. In addition, certain qualitative macroeconomic factors
provided under IAS 29 were also identified. Therefore, Argentine
companies using IFRS, such as us, are required to apply IAS 29 to
their financial statements for periods ending on and after July 1,
2018.
7
Adjustments to
reflect inflation, including tax indexation, such as those required
by IAS 29, were originally prohibited pursuant to Law No. 23,928
(the “Law 23,928”). In addition, Decree No. 664/03,
issued by the Argentine government, instructed regulatory
authorities, such as the Argentine Securities Commission
(
Comisión Nacional de
Valores
) (“CNV”), to accept only financial
statements reported in constant currency. However, on December 4,
2018, Law 27,468 (“Law 27,468”) abrogated Decree No.
664/03 and amended Law 23,928 indicating that the prohibition of
inflation adjustments no longer applies to financial statements
submitted for regulatory purposes. Certain regulatory authorities,
such as the CNV, now require that financial statements for periods
ended on and after December 31, 2018 should be adjusted for
inflation pursuant to IAS 29.
As a
result,
our audited consolidated financial statements
included in this annual report, including the figures for the
previous periods (this fact not affecting the decisions taken on
the financial information for such periods), and, unless otherwise
stated, the financial information included elsewhere in this annual
report,
were restated to consider the
changes in the general purchasing power of the functional currency
of the Company (Argentine peso) pursuant to IAS 29 and General
Resolution no. 777/2018 of the Argentine Securities
Commission.
Law 27,468 also
substituted the WPI (as defined below) for the CPI as the index to
benchmark tax indexation, and modified the standards for triggering
the tax indexation procedure. In addition, Law 27,468 provides that
during the first three years beginning on January 1, 2018, tax
indexation will be required if the variation of the Consumer Price
Index (“CPI”) exceeds 55% in 2018, 30% in 2019 and 15%
in 2020. The tax indexation determined during any such year will be
allocated as follows: 1/3 in that same year, and the remaining 2/3
in equal parts in the following two years. From January 1, 2021,
the tax indexation procedure will be triggered under similar
standards as those set forth by IAS 29.
Accordingly, we
have recognized a loss regarding the effect of adjustment by
inflation of Ps. 4,036 million, Ps. 152 million
and Ps. 1,837 million
in our financial
statements for the years ended 2018, 2017 and 2016, respectively.
See Note 2.1.2 to our financial statements.
The credibility of several Argentine economic indices has been
called into question, which has led to a lack of confidence in the
Argentine economy and could affect your evaluation of the market
value of the ADSs
During the
administrations of Kirchner and Fern
á
ndez de Kirchner, the INDEC, the
Argentine government
’
s
principal statistical agency, underwent institutional and
methodological reforms that gave rise to controversy regarding the
reliability of the information that it produced. Reports published
by the IMF had stated that their staff used alternative measures of
inflation for macroeconomic surveillance, including data produced
by private sources, which have shown inflation rates considerably
higher than those published by the INDEC between 2007 and 2015. The
IMF also censured Argentina for failing to make sufficient
progress, as required under the Articles of Agreement of the IMF,
in adopting remedial measures to address the quality of official
data, including inflation and GDP data.
On January 8, 2016,
based on its determination that the INDEC had failed to produce
reliable statistical information, particularly with respect to its
CPI, GDP, foreign trade and poverty data, the Macri administration
declared the national statistical system and the INDEC in a state
of administrative emergency through December 31, 2016, which was
not renewed. The INDEC suspended publication of certain statistical
data until it completed reorganization of its technical and
administrative structure to recover its ability to produce
sufficient and reliable statistical information. During the first
six months of this reorganization period, the INDEC published
official CPI figures published by the City of Buenos Aires and the
Province of San Luis for reference. On June 29, 2016, the INDEC
published a report that included revised GDP data for the years
2004 through 2015. Among other adjustments, in calculating GDP for
2004, the INDEC made changes to the composition of GDP that
resulted in a downward adjustment of approximately 12% for that
year. In calculating real GDP for subsequent years based on the
revised 2004 GDP, the INDEC used deflators that are consistent with
its revised methodology to calculate inflation. By understating
inflation in the past, the INDEC had overstated growth in real
terms. The adjustments made by the INDEC resulted in a
determination of real GDP growth for the period 2004-2014 of 44.8%,
as opposed to a 63% growth in real terms for the same period
resulting from the information used prior to June 29,
2016.
Following the
publication of revised data and a new inflation index, on November
9, 2016, the IMF lifted the censorship against Argentina, stating
that the country had resumed the publication of data in a manner
consistent with its obligations under the Articles of Agreement of
the IMF.
The Argentine
government
’
s reforms seek
to produce official data that meets international standards. In
order to be effective, however, reforms require certain
implementation steps and the timely collection of data, the success
of which may be outside of the Argentine government
’
s control. If these reforms cannot
be successfully implemented, such failure may adversely affect the
Argentine economy, in particular by undermining consumer and
investor confidence. The INDEC
’
s past or future data may be
materially revised to reveal a different economic or financial
situation in Argentina, which could affect investors
’
perception of Argentina, including
the market value of the ADSs. In addition, the failure or delays in
implementing the expected changes may impair other measures taken
by the Central Bank to tackle inflation. This, in turn, could have
a negative impact on Argentina
’
s economy and, as a result, could
have an adverse effect on our ability to access international
capital markets to finance our operations and growth, adversely
affecting our results of operations and financial
condition.
8
Significant fluctuations in the value of the peso could adversely
affect the Argentine economy and, in turn, adversely affect our
results of operations
The depreciation of
the peso may have a negative impact on the ability of certain
Argentine businesses to service their foreign currency-denominated
debt, lead to inflation, significantly reduce real wages and
jeopardize the stability of businesses, such as ours, whose success
depends on domestic market demand and adversely affect the
Argentine government
’
s
ability to honor its foreign debt obligations. After several years
of moderate variations in the nominal exchange rate, the peso
depreciated more than 30% with respect to the U.S. dollar in each
of 2013 and 2014. In 2015, the peso depreciated approximately 52%
with respect to the U.S. dollar, including a 10% depreciation from
January 1, 2015 to September 30, 2015 and a 38% depreciation during
the last quarter of the year, mainly concentrated after December
16, 2015 once the Macri administration eliminated exchange controls
imposed by the prior administration. In 2016, 2017 and 2018, the
peso depreciated approximately 21.86%, 17.36% and 102.16%
respectively, in each case, with respect to the U.S. dollar. The
peso depreciated approximately 19.10% from December 28, 2018
through April 25, 2019. On April 25, 2019, the exchange rate was
Ps. 44.90 to US$1.00, as quoted by the Banco de la Naci
ó
n Argentina for wire transfers
(
divisas
).
As a
result of the increased volatility of the Argentine peso (see
“Item 3.A. Selected Financial Data
—Exchange Rates”)
, the
Argentine government announced several measures aimed at restoring
market’s confidence and stabilize the value of the Argentine
peso. Measures implemented by the Argentine government include,
among others, the 2018 IMF Agreement (see “Item 4.
Information of the Company
—
Recent Political and Economic
Developments in Argentina
— IMF
Agreement
”), increase of interest rates and sale of
the Central Bank’s foreign currency reserves. More recently,
and by virtue of the 2018 IMF Agreement, a new regime was
established. This regime sets forth a strict control of the local
monetary base, in an attempt to reduce the demand for foreign
currency.
As of October 1, 2018, the BCRA
introduced an exchange rate band. The peso’s exchange rate
with the U.S. Dollar was allowed to fluctuate between Ps.34.00 and
Ps.44.00 per US$1.00 (range that was adjusted daily at an annual
rate of 3% until December 2018, and for the first quarter of 2019,
is adjusted daily at an annual rate of 2%) without the BCRA’s
intervention. On April 29, 2019, the Monetary Policy Counsel
(Comité de Política Monetaria) of the Central Bank (the
“COPOM”) decided to introduce changes to the monetary
policy, with an aim to reducing volatility in the foreign exchange
market. According to the new scheme: (i) if the exchange rate is
between Ps. 39.755 and Ps. 51.488, the Central Bank may intervene,
subject to market conditions, in the foreign exchange market and
sell U.S. dollars in the market, and (ii) if
the
exchange
rate is above Ps. 51.488, the Central Bank will sell foreign
currency for up to 250 million U.S. dollars daily. Also, the
Central Bank could decide to perform additional interventions. The
Argentine pesos resulting from such sales will be discounted from
the monetary base. The COPOM also confirmed that the Central Bank
will not intervene until June 2019 in the foreign exchange market
if the exchange rate decreases below Ps.
39.755.
The Argentine
macroeconomic environment, in which we operate, was affected by the
depreciation referred to above, which had an effect on our
financial and economic position. If the Peso depreciates further,
all of the negative effects on the Argentine economy related to
such depreciation could recur, with adverse consequences to our
business, financial condition and results of operations. In
addition, we cannot predict whether the Argentine government will
be able to comply with all terms of the 2018 IMF Agreement. The
ability of the Argentine government to stabilize the foreign
exchange market, restore economic growth and meet the terms of the
2018 IMF Agreement, is uncertain.
In addition, the
Republic’s future tax revenue and fiscal results may be
insufficient to meet its debt service obligations and the Republic
may have to rely in part on additional financing from domestic and
international capital markets, the IMF and other potential
creditors, in order to meet future debt service obligations. In the
future, the Republic may not be able or willing to access
international or domestic capital markets, which could have a
material adverse effect on the Republic’s ability to make
payments on its outstanding public debt, and in turn, could
materially adversely affect our financial condition and results of
operations.
Government intervention may adversely affect the Argentine economy
and, as a result, our business and results of
operations
The two
administrations of President Fern
á
ndez de Kirchner, who governed from
2007 through December 9, 2015, increased state intervention in the
Argentine economy, including through expropriation and
nationalization measures, price controls and pervasive exchange
controls.
In 2008, the
Fern
á
ndez de Kirchner
administration absorbed and replaced the former private pension
system for a public
“
pay
as you go
”
pension
system. As a result, all resources administered by the private
pension funds, including significant equity interests in a wide
range of listed companies, were transferred to a separate fund
(
Fondo de
Garant’a de Sustentabilidad
, or the
“
FGS
”
) to be administered by the National
Social Security Administration (
Administración Nacional
de la Seguridad Social
, or the
“
ANSES
”
). The dissolution of the private
pension funds and the transfer of their financial assets to the FGS
have had important repercussions on the financing of private sector
companies. Debt and equity instruments that previously could be
placed with pension fund administrators are now entirely subject to
the discretion of the ANSES. Since acquiring equity interests in
privately owned companies, through the process of replacing the
pension system, the ANSES is entitled to designate representatives
of the Argentine government to the boards of directors of those
entities. Pursuant to Decree No. 1,278/12, issued by the executive
branch on July 25, 2012, the ANSES
’
s representatives must report
directly to the Ministry of Economy and are subject to a mandatory
information-sharing regime, under which, among other obligations,
the representatives must immediately inform the Ministry of Economy
of the agenda for each board of directors
’
meeting and provide related
documentation.
9
In December 2012
and August 2013, the National Congress established new regulations
related to domestic capital markets. In general, these regulations
allowed greater national government intervention in the capital
markets, authorizing, for example, the CNV to designate inspectors
with the ability to veto, under certain circumstances, the
decisions of the board of directors of companies that are listed in
authorized markets and such companies’ board of directors for
a period of up to 180 days. On November 17, 2016, the Macri
government presented a bill to the National Congress to amend the
Capital Markets Law, which could, among other significant changes,
eliminate such powers to designate inspectors and suspend the board
of directors for a period of up to 180 days.
In May 2013, the
Argentine Congress passed a law providing for the expropriation of
51% of the share capital of YPF (
Yacimientos Petroliferos Fiscales
S.A.
), the principal Argentine oil company, which shares
were owned by Repsol, S.A. and its affiliates. In February 2015,
the Argentine government sent a bill to the Argentine Congress in
order to revoke certain train concessions, return the national rail
network to state control and provide authority to review all
concessions currently in effect. The bill was enacted on
May 20, 2015 as Law No. 27,132.
In addition, on
September 23, 2015 the Argentine Congress passed Law
No. 27,181, which limits the sale of the Argentine
government’s shares held in Argentine companies without prior
approval of two-thirds of the members of the Argentine Congress,
with the exception of the Argentine government’s shareholding
in YPF. That law has been abrogated by the new Administration
through Law No. 27,260, the
“Ley de Sinceramiento Fiscal y
Reparación Histórica a los Jubilados”
, dated
on May 26, 2016.
Notwithstanding the
measures recently adopted by the Macri administration, in the
future, the Argentine government could re-introduce regulations
that result in an increased government intervention. It is widely
reported by private sector economists that expropriations, price
controls, exchange controls and other direct involvement by the
Fern
á
ndez de Kirchner
administration in the economy had an adverse impact on the level of
investment in Argentina, the access of Argentine companies to the
international capital markets and Argentina
’
s commercial and diplomatic
relations with other countries. Further actions taken by the
Argentine government concerning the economy, including decisions
with respect to interest rates, taxes, price controls, salary
increases, provision of additional employee benefits and foreign
exchange controls could continue to have a material adverse effect
on Argentina
’
s economic
growth and in turn affect our financial condition and results of
operations. Moreover, any additional Argentine government policies
established to preempt, or in response to, social unrest could
adversely and materially affect the economy, and therefore our
business, results of operations and financial
condition.
Government measures, as well as pressure from labor unions, could
require salary increases or added benefits, all of which could
increase companies’ operating costs
In the past, the
Argentine government has passed laws and regulations forcing
privately owned companies to maintain certain wage levels and
provide added benefits for their employees. Additionally, both
public and private sector employers have been subject to strong
pressure from the workforce and trade unions to grant salary
increases and certain benefits. See
“—
Risks Relating to Our
Business
—
We could be
affected by material actions taken by the trade unions.
”
Labor relations in
Argentina are governed by specific legislation, such as Labor Law
No. 20,744 and Collective Bargaining Law No. 14,250, which, among
other things, dictate how salary and other labor negotiations are
to be conducted. Every industrial or commercial activity is
regulated by a specific collective bargaining agreement
(
“
CBA
”
) that groups companies together
according to industry sector and trade union. Although the process
of negotiation is standardized, each chamber of industrial or
commercial activity separately negotiates the increases of salaries
and labor benefits with the relevant trade union of such commercial
or industrial activity.
Argentine
employers, both in the public and private sectors, have experienced
significant pressure from their employees and labor organizations
to increase wages and to provide additional employee benefits. In
August 2012, the Argentine government established a 25% increase in
minimum monthly salary to Ps.2,875, effective as of February 2013.
The Argentine government increased the minimum salary to Ps.3,300
in August 2013, to Ps.3,600 in January 2014, to Ps.4,400 in
September 2014 and to Ps.5,588 in August 2015. It further decreed
an increase of the minimum salary to Ps.6,060 in January 2016, to
Ps.6,810 in June 2016, to Ps.7,560 in September 2016 and to
Ps.8,060 in January 2017. In June 2017, the Ministry of Labor
raised the minimum salary to Ps.10,000, effective in three
tranches: Ps.8,860 as of July 2017, Ps.9,500 as of January 2018,
and Ps.10,000 as of July 2018. In August 2018, the Ministry of
Labor raised the minimum salary to Ps. 10,700 as of September
2018, Ps. 11,300 as of December 2018, and Ps. 12,500 as of March
2019. Due to high levels of inflation, both public and private
sector employers are experiencing significant pressure from unions
and their employees to further increase salaries. In 2015, the
INDEC published the
Coeficiente de Variación
Salarial
(Salary Variation Index, or the
“
CVS
”
), an index that shows the evolution
of salaries. The Salaries Index showed an increase of approximately
27.30% and 30.41% in registered private sector salaries in 2017 and
2018, respectively.
10
In the future, the
Argentine government could take new measures requiring salary
increases or additional benefits for workers, and the labor force
and labor unions may apply pressure for such measures. Any such
increase in wage or worker benefit could result in added costs and
reduced results of operations for Argentine companies, including
us. Such added costs could adversely affect our business, financial
condition and result of operations.
The implementation of new exchange controls and restrictions on
capital inflows and outflows could limit the availability of
international credit and could threaten the financial system,
adversely affecting the Argentine economy and, as a result, our
business
In 2001 and 2002,
Argentina imposed exchange controls and transfer restrictions,
substantially limiting the ability of companies to retain foreign
currency or make payments abroad. After 2002, these restrictions,
including those requiring the Central Bank
’
s prior authorization for the
transfer of funds abroad to pay principal and interest on debt
obligations, were substantially eased through 2007. In addition to
the foreign exchange restrictions applicable to outflows, in June
2005 the Argentine government adopted various rules and regulations
that established restrictive controls on capital inflows into
Argentina, including a requirement that, for certain funds remitted
into Argentina, an amount equal to 30% of the funds must be
deposited into an account with a local financial institution as a
U.S. dollar deposit for a one-year period without any accrual of
interest, benefit or other use as collateral for any
transaction.
From 2011 and until
President Macri assumed office in December 2015, the Argentine
government increased controls on the sale of foreign currency and
the acquisition of foreign assets by local residents, limiting the
possibility of transferring funds abroad. Furthermore, under
regulations issued since 2012 certain foreign exchange transactions
were subject to prior approval by the Federal Administration of
Public Income (
“
AFIP
”
). Through a combination of foreign
exchange and tax regulations, the Fern
á
ndez de Kirchner administration
significantly curtailed access to the MULC by individuals and
private-sector entities. In addition, during the last few years
under the Fern
á
ndez de
Kirchner administration, the Central Bank exercised a
de facto
prior approval
power for certain foreign exchange transactions otherwise
authorized to be carried out under the applicable regulations, such
as dividend payments or repayment of principal of intercompany
loans as well as the import of goods, by means of regulating the
amount of foreign currency available to companies to conduct such
transactions. The number of exchange controls introduced in the
past and in particular after 2011 during the Fern
á
ndez de Kirchner administration gave
rise to an unofficial U.S. dollar trading market, and the peso/U.S.
dollar exchange rate in such market substantially differed from the
official peso/U.S. dollar exchange rate. See
“
Exchange Controls.
”
Additionally, the
level of international reserves deposited with the Central Bank
significantly decreased from US$47.4 billion as of November 1, 2011
to US$25.6 billion as of December 31, 2015, resulting in a reduced
capacity of the Argentine government to intervene in the MULC and
to provide access to such markets to private sector entities like
us. The Macri administration announced a program intended to
increase the level of international reserves deposited with the
Central Bank through the execution of certain agreements with
several Argentine and foreign entities. As a result of the measures
taken under such program and due to the issuance by the Argentine
government of US$16.5 billion and US$2.75 billion of new debt
securities in the international capital markets on April 22, 2016
and July 6, 2016, respectively, the level of international reserves
increased to US$38.8 billion as of December 31, 2016. As of
December 31, 2018, the level of international reserves of the
Central Bank totaled US$65.8 billion.
Since assuming
office, the Macri administration gradually implemented a series of
reforms related to the foreign exchange restrictions, including
certain currency controls, which had been imposed under the
Fern
á
ndez de Kirchner
administration, in order to provide greater flexibility and access
to the MULC. On August 8, 2016 the Central Bank issued
Communication
“
A
”
6037, which substantially modified
the applicable foreign exchange regulations and eliminated the set
of restrictions for accessing the MULC. Effective as of July 1,
2017, pursuant to Communication
“
A
”
6244, all regulations that
restricted access to the MULC were repealed, leaving in place only
the obligation to comply with a reporting regime. Pursuant to
Communication
“
A
”
6401, dated December 26, 2017, a
new reporting regime was created, pursuant to which the
“
Survey on the issuance
of foreign notes and liabilities by the financial and private
non-financial sector,
”
established by Communication
“
A
”
3602, and the
“
Survey on direct
investments,
”
established
by Communication
“
A
”
4237, were replaced by a unified
report on direct investments and debt. Moreover, by virtue of
Communication “A” 6443, which came into force as of
March 1, 2018, any company from any sector, which usually operates
through the Exchange Market can act as an exchange agency by only
registering in the exchange operators’ registry. Argentine
residents must comply with the reporting regime, even when the
funds have not been sold in the MULC and/or there is no expectation
to access the MULC in the future in relation to the funds that must
be reported. For further information, see
“
Exchange Controls.
”
11
Notwithstanding the
measures adopted by the Argentine government, in the future the
Argentine government could impose further exchange controls,
transfer restrictions or restrictions on the movement of capital
and/or take other measures in response to capital flight or a
significant depreciation of the peso, which could limit our ability
to access the international capital markets and impair our ability
to make interest, principal or dividend payments abroad. Such
measures could lead to renewed political and social tensions and
undermine the Argentine government
’
s public finances, which could
adversely affect Argentina
’
s economy and prospects for economic
growth and, consequently, adversely affect our business and results
of operations.
A lack of financing for Argentine companies due to the unresolved
litigation with holdout bondholders may negatively impact our
financial condition or cash flows
In 2005 and 2010,
Argentina conducted exchange offers to restructure part of its
sovereign debt that had been in default since the end of 2001. As a
result of these exchange offers, Argentina restructured over 92% of
its eligible defaulted debt.
Commencing in 2002,
holdout creditors filed numerous lawsuits against Argentina in
several jurisdictions, including the United States, Italy, Germany
and Japan. These lawsuits generally assert that Argentina failed to
make timely payments of interest and/or principal on their bonds,
and seek judgments for the outstanding principal of and/or accrued
interest on those bonds. Judgments have been issued in numerous
proceedings in the United States and Germany, but to date creditors
have not succeeded, with a few minor exceptions, in executing those
judgments. In 2012, plaintiffs in New York obtained a U.S. district
court order enjoining Argentina from making interest payments in
full on the bonds issued pursuant to the 2005 and 2010 exchange
offers unless Argentina paid the plaintiffs in full, under the
theory that the former payments violated the
pari passu
clause in
the 1994 Fiscal Agency Agreement (the
“
FAA
”
) governing those non-performing
bonds. The Second Circuit Court of Appeals affirmed the so-called
pari passu
injunctions, and on June 16, 2014 the U.S. Supreme Court denied
Argentina
’
s petition for
a writ of certiorari and the
pari passu
injunctions
became effective on June 18 of that year.
In 2014, the
Argentine government took a number of steps intended to continue
servicing the bonds issued in the 2005 and 2010 exchange offers,
which had limited success.
The Argentine
government engaged in negotiations with holders of defaulted bonds
in December 2015 with a view to bringing closure to fifteen years
of litigation. In February 2016, the Argentine government entered
into an agreement in principle to settle with certain holders of
defaulted debt and put forward a proposal to other holders of
defaulted debt, including those with pending claims in U.S. courts,
subject to two conditions: (i) obtaining approval by the Argentine
Congress and the lifting of the
pari passu
injunctions.
On March 2, 2016, the U.S. district court agreed to vacate the
pari passu
injunctions, subject to two conditions: first, the repeal of all
legislative obstacles to settlement with holders of defaulted debt
securities issued under the FAA; and (ii) full payment to holders
of
pari
passu
injunctions with whom the Argentine government had
entered into an agreement in principle on or before February 29,
2016. The U.S. district court
’
s order was affirmed by the Second
Circuit Court of Appeals on April 13, 2016. On June 30, 2016, the
Argentine Congress repealed the legislative obstacles to the
settlement and approved the settlement proposal. On April 22, 2016,
Argentina issued US$16.5 billion of new debt securities in the
international capital markets, and applied US$9.3 billion of these
proceeds to satisfy settlement payments on agreements with holders
with claims amounting to approximately US$4.2 billion. The District
Court ordered the vacatur of all
pari passu
injunctions
upon confirmation of such payments.
As of the date of
this annual report, litigation initiated by bondholders that have
not accepted Argentina
’
s
settlement offer continues in several jurisdictions, although the
size of the claims involved has decreased
significantly.
Although the
vacatur of the
pari passu
injunctions
removed a material obstacle to access to capital markets by the
Argentine government, future transactions may be affected as
litigation with holdout bondholders continues, which in turn could
affect the Argentine government
’
s ability to access international
credit markets, thus affecting our ability to finance our
growth.
High public expenditures could result in long-lasting adverse
consequences for the Argentine economy
In recent years,
the Argentine government has substantially increased public
expenditures. In 2016 and 2017, national public sector expenditures
increased by 37.0% and 21.8% year over year, respectively (measured
in nominal Argentine pesos) and the
government reported
a primary fiscal deficit of 4.6% and 3.8% of GDP, according to the
Argentine Ministry of Treasury. In 2018, national public sector
expenditures increased by 22.4%, and the
government reported
a primary fiscal deficit of 2.4% of GDP. During recent years, the
Argentine government has resorted to the Central Bank and to the
ANSES to alleviate part of its funding requirements. Moreover, the
primary fiscal balance could be negatively affected in the future
if public expenditures continue to increase at a rate higher than
revenues due to, for example, social security benefits, financial
assistance to provinces with financial problems and increased
spending on public works and subsidies, including subsidies to the
energy and transportation sectors. A further deterioration in
fiscal accounts could negatively affect the government
’
s ability to access the long-term
financial markets and could in turn result in more limited access
to such markets by Argentine companies. Additionally, a further
deterioration in fiscal accounts could affect the Argentine
government
’
s ability to
continue subsidies for consumers in the energy sector.
12
A decline in international prices for Argentina’s main
commodity exports could have an adverse effect on Argentina’s
economic growth
Argentina
’
s
financial recovery from the 2001-2002 crisis occurred in a context
of price increases for Argentina
’
s commodity exports, such as soy.
High commodity prices contributed to the increase in Argentine
exports since the third quarter of 2002 and to high government tax
on revenues from export withholdings. However, the reliance on the
export of certain commodities has caused the Argentine economy to
be more vulnerable to fluctuations in their prices.
Commodity prices,
including for soy, have declined significantly since peak prices
due in part to slower growth in China. In addition, from the end of
2017 until April 2018, rains below the average, for several months,
plunged Argentina into a severe drought that is presumed to have
been the worst drought in the country in a 50 years period. The
effects of the drought in agriculture caused important economic
problems in the country, with a fall in the soybean harvest of 31%
over the previous year, and corn, by 20%, which implied losses by
US$6 billion. A continuing decline in the international prices for
Argentina
’
s main
commodity exports or any future climatic conditions that may have
an adverse effect in agriculture could have a negative impact on
the levels of government revenues and the government
’
s ability to service its sovereign
debt, and could either generate recessionary or inflationary
pressures, depending on the government
’
s reaction. Either of these results
would adversely impact Argentina
’
s economy and, therefore, our
financial condition.
The Argentine economy could be adversely affected by economic
developments in other markets and by more general
“contagion” effects
Weak, flat or
negative economic growth of any of Argentina
’
s major trading partners, such as
Brazil, China or the United States, could have a material
adverse effect on Argentina’s trade balance and adversely
affect Argentina’s economic growth. The economic performance
of other trading partners such as Chile, Spain and Canada may also
affect Argentina’s trade balance.
The economy of
Brazil, Argentina
’
s
largest export market and the principal source of imports, has
experienced heightened negative pressure due to the uncertainties
stemming from ongoing political crisis and extensive corruption
investigations. The Brazilian economy contracted by 3.6% during
2016. Although the Brazilian economy slightly expanded by 1% during
2017 and 1.1% during 2018, a deterioration of economic conditions
in Brazil may reduce demand for Argentine exports and create
advantages for Brazilian imports. In October 2018, candidate Jair
Bolsonaro was elected president of Brazil. As a result, uncertainty
and expectations have increased in relation to the future
management of the president who, might include substantial economic
reforms and changes in Brazil’s foreign policy, as stated
during his campaign. A further deterioration of economic conditions
in Brazil could reduce the demand for Argentine exports and
generate advantages for Brazilian imports. There is a possibility
that continued uncertainty with respect to Brazil’s economic
and political conditions or the occurrence of an economic and
political crisis in Brazil might result in an impact on the
Argentine economy, and in turn, have a material adverse effect on
our business, financial condition and result of
operations.
The Argentine
economy may be affected by
“
contagion
”
effects. International
investors
’
reactions to
events occurring in one developing country sometimes appear to
follow a
“
contagion
”
pattern, in which an entire region
or investment class is disfavored by international investors. In
the past, the Argentine economy has been adversely affected by such
contagion effects on a number of occasions, including the 1994
Mexican financial crisis, the 1997 Asian financial crisis, the 1998
Russian financial crisis, the 1999 depreciation of the Brazilian
real, the 2001 collapse of Turkey
’
s fixed exchange rate regime and the
global financial crisis that began in 2008.
The Argentine
economy may also be affected by conditions in developed economies,
such as the United States, that are significant trading partners of
Argentina or have influence over world economic cycles. If interest
rates increase significantly in developed economies, including the
United States, Argentina and its developing economy trading
partners, such as Brazil, could find it more difficult and
expensive to borrow capital and refinance existing debt, which
could adversely affect economic growth in those countries.
Decreased growth on the part of Argentina
’
s trading partners could have a
material adverse effect on the markets for Argentina
’
s exports and, in turn, adversely
affect economic growth. Any of these potential risks to the
Argentine economy could have a material adverse effect on our
business, financial condition and result of
operations.
On June 23, 2016,
the United Kingdom voted in favor of exiting the European Union. As
of the date of this annual report, the actions that the United
Kingdom will take to effectively exit from the European Union or
the length of such process are uncertain. The results of the United
Kingdom
’
s referendum have
caused, and are anticipated to continue causing, volatility in the
financial markets, which may in turn have a material adverse effect
on our business, financial condition and results of operations. The
UK is due to leave the EU on 29 March 2019 at 11 pm UK time, when
the period for negotiating a Withdrawal Agreement will end unless
an extension is agreed. Brexit could lead to additional political,
legal and economic instability in the European Union and produce a
negative impact on the commercial exchange of Argentina with that
region.
13
On November 8,
2016, Mr. Donald J. Trump was elected president of the United
States. The results of the presidential election have created
significant uncertainty about the future relationship between the
United States and other countries, including with respect to the
trade policies, treaties, government regulations and tariffs that
could apply to trade between the United States and other nations.
Even though President Trump's protectionist measures are not, for
the time being, aimed at Argentina, we cannot predict how they will
evolve, nor will the effect that the same or any other measure
taken by the Trump administration could cause on global economic
conditions and the stability of global financial markets.
Furthermore, the ongoing trade dispute between United States and
China due to tariffs placed on goods traded between them, might
have a potential impact in trade-dependent countries such as
Argentina.
During August 2018,
an increase in inflation and a sustained deficit in current
accounts, as well as the protectionist measures taken by the United
States, doubling the tariffs on steel and aluminum from Turkey,
caused a collapse of the Turkish lira against the Dollar that
triggered a wave of sales of assets from emerging markets and the
significant fall in the prices of shares from these markets,
generating a contagion effect in international markets and several
stock exchanges in the world, including Argentina.
These developments,
or the perception that any of them could occur, may have a material
adverse effect on global economic conditions and the stability of
global financial markets. Any of these factors could depress
economic activity and restrict our access to suppliers and have a
material adverse effect on our business, financial condition and
results of operations.
The Argentine banking system may be subject to instability which
may affect our operations
The Argentine
banking system has experienced several crisis in the past. Among
those, the Argentine banking system collapsed in 2001 and 2002,
when the Argentine government restricted bank withdrawals and
required mandatory conversion of dollar deposits to pesos. From
2005 to 2007, a period of economic growth coupled with relative
stability of the country’s exchange rate and inflation
resulted in the restoration of public confidence, a gradual
accumulation of deposits in Argentine financial institutions, and
improved liquidity of the financial system. However, since 2008
certain events such as internal conflicts with certain sectors of
the Argentine economy, the international financial crisis and the
increased regulation on the foreign exchange market, have decreased
depositors’ confidence. In recent years, the Argentine
financial system grew significantly with a marked increase in loans
and private deposits, showing a recovery of credit activity. In
spite of the fact that the financial system’s deposits
continue to grow, they are mostly short-term deposits and the
sources of medium and long-term funding for financial institutions
are currently limited. In 2018, private deposits in pesos rose by
41% year-over-year, fueled by the growth of time deposits with a
66% increase, while savings and current accounts each experienced a
23% increase year-over-year. In contrast, peso-denominated loans
increased at a slower pace than prior years. Meanwhile, loans in
foreign currency (composed mainly of corporate loans) showed less
dynamism, increasing by 4% at the end of 2018.
Financial
institutions are particularly subject to significant regulation
from multiple regulatory authorities, all of whom may, among other
things, establish limits on commissions and impose sanctions on the
financial institutions. The lack of a stable regulatory framework
could impose significant limitations on the activities of the
financial institutions and could induce uncertainty with respect to
the financial system stability.
Despite the strong
liquidity currently prevailing in Argentina’s financial
system, a new crisis or the consequent instability of one or more
of the larger banks, public or private, could have a material
adverse effect on the prospects for economic growth and political
stability in Argentina, resulting in a loss of consumer confidence,
lower disposable income and fewer financing alternatives for
consumers. These conditions would have a material adverse effect on
us.
Exchange controls
and restrictions on transfers abroad and capital inflows have
limited, and could limit in the future, the availability of
international credit.
Failure to adequately address actual and perceived risks of
institutional deterioration and corruption may adversely affect
Argentina’s economy and financial condition, which in turn
could adversely affect our business, financial condition and
results of operations
A lack of a solid
institutional framework and corruption have been identified as, and
continue to be a significant problem for Argentina. In Transparency
International’s 2017 Corruption Perceptions Index survey of
180 countries, Argentina was ranked 85, improving from the previous
survey in 2016. In the World Bank’s Doing Business 2018
report, Argentina ranked 117 out of 190 countries, down from 116 in
2017.
14
Recognizing that
the failure to address these issues could increase the risk of
political instability, distort decision-making processes and
adversely affect Argentina’s international reputation and
ability to attract foreign investment, the Macri administration has
announced several measures aimed at strengthening Argentina’s
institutions and reducing corruption. These measures include the
reduction of criminal sentences in exchange for cooperation with
the government in corruption investigations, increased access to
public information, the seizing of assets from corrupt officials,
increasing the powers of the Anticorruption Office (Oficina
Anticorrupción) and the passing of a new public ethics law,
among others. The Argentine government’s ability to implement
these initiatives is uncertain as it would require the involvement
of the judicial branch, which is independent, as well as
legislative support from opposition parties.
Argentina’s
political environment has historically influenced, and continues to
influence, the performance of the country’s economy.
Political crises have affected and continue to affect the
confidence of investors and the general public, which have
historically resulted in economic deceleration and heightened
volatility in the securities with underlying Argentine risk. The
recent economic instability in Argentina has contributed to a
decline in market confidence in the Argentine economy as well as to
a deteriorating political environment. Weak macroeconomic
conditions in Argentina have continued in 2018 and may be
accentuated in 2019 as a result of the upcoming presidential and
congressional elections.
In addition,
various ongoing investigations into allegations of money laundering
and corruption being conducted by the Office of the Argentine
Federal Prosecutor, including the largest such investigation, known
as “Los Cuadernos de las Coimas,” or “the
Chauffeur's Books” have negatively impacted the Argentine
economy and political environment. Certain government officials of
the Kirchner and Fernández de Kirchner administrations as well
as high ranked officers of companies holding government contracts
or concessions have faced or are currently facing allegations of
corruption and money laundering as a result of these
investigations. These individuals are alleged to have accepted or
paid, as applicable, bribes by means of kickbacks on contracts
granted by the government to several infrastructure, energy and
construction companies. The proceeds from these kickbacks allegedly
financed the political campaigns of political parties forming the
previous government that was led by former President Cristina
Fernandez de Kirchner. These funds were unaccounted for or not
publicly disclosed and were allegedly used to personally enrich
certain individuals. Several senior politicians, including members
of Congress, and high-ranking executives and officers of major
companies in Argentina (i) have been arrested on account of various
charges relating to corruption, (ii) entered into plea agreements
with prosecutors and (iii) have resigned or been removed from their
positions. The potential outcome of the Chauffer’s Books as
well as other ongoing corruption-related investigations is
uncertain, but they have already had an adverse impact on the
reputation of those companies that have been implicated, as well as
on the general market perception of the economy, political
environment and the capital markets in Argentina. We have no
control over and cannot predict for how long the corruption
investigations will continue nor whether such investigations or
allegations (or any other future investigations or allegations)
will lead to further political and economic instability. In
addition, we cannot predict the outcome of any such allegations nor
their effect on the different sectors of the Argentine economy. See
also “
—
We
are subject to anticorruption, anti-bribery, anti-money laundering
and other laws and regulations.”
Risks Relating to the Electric Power Sector in
Argentina
The Argentine government has intervened in the electric power
sector in the past, and is likely to continue
intervening
Historically, the
Argentine government has played an active role in the electric
power industry through the ownership and management of state-owned
companies engaged in the generation, transmission and distribution
of electric power. Since 1992 and the privatization of several
state-owned companies, the Argentine government has reduced its
control over the industry. However, as is the case in most other
countries, the Argentine electric power industry remains subject to
strict regulation and government intervention. Moreover, to address
the Argentine economic crisis of 2001 and 2002, the Argentine
government adopted Law No. 25,561 (the
“
Public Emergency Law
”
) and other regulations, which made
a number of material changes to the regulatory framework applicable
to the electric power sector. These changes have had significant
adverse effects on electric power generation, distribution and
transmission companies and included the freezing of distribution
margins, the revocation of adjustment and inflation indexation
mechanisms for tariffs, a limitation on the ability of electric
power distribution companies to pass on to the consumer increases
in costs due to regulatory charges and the introduction of a new
price-setting mechanism in the WEM, all of which had a significant
impact on electric power generators and caused substantial price
differences within the market.
The
Fern
á
ndez de Kirchner
administration continued to intervene in the electric power
industry by, for example, granting temporary margin increases,
proposing a new tariff regime for residents of poverty-stricken
areas, increasing remunerations earned by generators for capacity,
operation and maintenance services, creating specific charges to
raise funds that are transferred to government-managed trust funds
that finance investments in generation and distribution
infrastructure and mandating investments for the construction of
new generation plants and the expansion of existing transmission
and distribution networks.
15
For example, in
March 2013, pursuant to Resolution No. 95/13, issued by the former
Secretariat of Energy, the Fern
á
ndez de Kirchner administration
suspended the renewal of sales contracts in the term market and
execution of new agreements in the WEM, and ordered that any demand
not satisfied by Argentine generators must be directly supplied by
CAMMESA. As a result, Argentine generators are required to supply
capacity and energy to CAMMESA at prices fixed by the former
Secretariat of Energy.
Since the Macri
administration assumed office, the Argentine government has
initiated significant reforms to the Argentine electric power
industry. On December 16, 2015, the Macri administration declared a
state of emergency with respect to the national electric power
system that remained in effect until December 31, 2017. The state
of emergency allowed the Argentine government to take actions
designed to guarantee the supply of electric power in Argentina,
such as instructing the Ministry of Energy and Mining to elaborate
and implement, with the cooperation of all federal public entities,
a coordinated program to guarantee the quality and security of the
electric power system and rationalize public entities
’
consumption of energy. In addition,
the Argentine government and certain provincial governments have
approved significant price adjustments and tariff increases
applicable to certain generation and distribution companies.
Following the tariff increases, preliminary injunctions suspending
such increases were requested by customers, politicians and
non-governmental organizations that defend customers
’
rights, which preliminary
injunctions were granted by Argentine courts. Among the different
rulings in this respect, two recent rulings issued by the Second
Division of the Federal Court of Appeals for the City of La Plata
and a federal judge from the San Martín district court led to
the suspension of end-users tariff increases of electric power in
the Province of Buenos Aires and in the whole territory of
Argentina, respectively. Pursuant to these injunctions, (i) the
end-user tariff increases granted as of February 1, 2016 were
suspended retroactively to that date, (ii) end-user bills sent to
customers were not to include the increase and (iii) the amounts
already collected from end-users as a consequence of consumption
recorded before these rulings had to be reimbursed. However, on
September 6, 2016, the Supreme Court denied these injunctions that
suspended end-users electric power tariff increases, arguing formal
objections and procedural defects and therefore, as of the date of
this annual report, increases of the electric power end-users
tariffs are not suspended.
Pursuant to
Resolution No. 522/16, the ENRE ordered a public hearing to be held
to evaluate the proposals for the full tariff review filed by
EDENOR and EDESUR for the period from January 1, 2017 to December
31, 2021. The hearing was held on October 28, 2016. A non-binding
public hearing was conducted by the Ministry of Energy and Mining
and the ENRE to discuss tariff proposals submitted by distribution
companies covering the greater Buenos Aires area (with
approximately 15 million inhabitants), including Edenor, for the
2017-2021 period within the framework of the RTI. Following such
hearing, on January 31, 2017, the ENRE issued Resolution No. 63/17,
pursuant to which such administrative authority approved the
tariffs to be applied by EDENOR. In the same sense, Resolution No.
64/17 approved EDESUR
’
s
tariffs.
On February 1,
2017, the ENRE enacted several resolutions, which, among other
policy changes, implemented a reduction of electric power tariff
subsidies and an increase in electric power tariffs for residential
customers. Such increases ranged between 61% and 148%, depending on
to the amount of the consumer
’
s electric power
consumption.
Regarding
transmission tariffs, seven public hearings were held pursuant to
Resolutions Nos. 601/16, 602/16, 603/16, 604/16, 605/16, 606/16 and
607/16 of the ENRE. In such public hearings, the tariff proposals
filed by transmission companies Transener S.A., Distrocuyo S.A.,
Transcomahue S.A., Ente Provincial de Energía de
Neuqu
é
n, Transba S.A.,
Transnea S.A., Transnoa S.A. and Transpa S.A. for the period from
January 1, 2017 to December 31, 2021 were evaluated. Pursuant to
Resolutions Nos. 66/17, 68/17, 69/17, 71/17, 73/17, 75/17, 77/17
and 79/17, the ENRE approved the new applicable tariffs for such
companies.
Additionally, in
March 2016, the Secretariat of Electric Energy enacted Resolution
SEE No. 22/16, through which it adjusted the electric power prices
for the sale of energy by generation companies under the
Energía Base. See
“
See
“
Management
’
s Discussion and Analysis of
Financial Condition and Results of Operations
—
Factors Affecting Our Results of
Operations
—
Our
Revenues
—
The Energía
Base.
”
The Secretariat of
Electric Energy cited the fact that WEM prices have been distorted
and discourage private sector investment in power generation and
that it was necessary to raise tariffs to partially compensate for
increasing operation and maintenance costs and to improve the cash
flow generation capacity of these companies. On February 1, 2017,
the tariff revision process was completed and the new tariff scheme
for the following five-year period was enacted.
In a change of its
criteria on policies applied in the electric power industry, on
April 17, 2019, the Macri Administration announced that the tariffs
applied by electricity distribution companies will not be increased
during the rest of 2019.
In addition, by
means of Resolution SRRyME No. 1/19, the Argentine Government
reduced prices for power capacity and energy under Energía
Base, which had been previously increased by Resolution SEE No.
19/17. This change was defined as a transition measure by the
recitals of Resolution SRRyME No. 1/19. However, we cannot assure
you that further reductions of these tariffs will not occur in the
future. Moreover, although under Resolution SRRyME No. 1/19 power
capacity and energy tariffs are set in U.S. dollars, we cannot
assure that Energía Base prices in the future will remain
denominated in this currency.
16
The Argentine
government has also established public bidding processes for the
development of new generation projects from both thermal and
renewable sources. These measures aim not only to satisfy domestic
electric power demand, but also to promote investments in the
electric power sector and improve the economic situation of the
WEM, which, as discussed above, has faced challenges since
2001.
Notwithstanding the
recent measures adopted by the Argentine government, we cannot
guarantee that the expected changes to the electric power sector
will happen as expected, within the anticipated timeframe or at
all. It is possible that certain measures may be adopted by the
Argentine government that could have a material adverse effect on
our business and results of operations, or that the Argentine
government may adopt emergency legislation similar to the Public
Emergency Law or other similar resolutions in the future that could
have a direct impact on the regulatory framework of the electric
power industry and indirectly adversely affect the electric power
generation industry, and therefore, our business, financial
condition and results of operations.
Electricity generators, distributors and transmitters have been
materially and adversely affected by emergency measures adopted in
response to Argentina’s economic crisis of 2001 and 2002,
many of which remain in effect
Since the Argentine
economic crisis of 2001 and 2002, Argentina
’
s electric power sector has been
characterized by government regulations and policies that have
resulted in significant distortions in the electric power market,
particularly with respect to prices, throughout the whole value
chain of the sector (generation, transmission and distribution).
Historically, Argentine electric power prices were calculated in
U.S. dollars and margins were adjusted periodically to reflect
variations in relation to costs. In January 2002, the Public
Emergency Law authorized the Argentine government to renegotiate
its public utility contracts. Under this law, the Argentine
government revoked provisions in the public utility contracts
related to the adjustment and inflation indexation mechanism.
Instead, the tariffs on such contracts were frozen and converted
from their original U.S. dollar values to Argentine pesos at a rate
of Ps.1.00 per US$1.00. For further information on the changes to
the legal framework of the Argentine electric power industry caused
by the Public Emergency Law, see
“
The Argentine Electric Power
Sector.
”
These measures,
coupled with the effect of high inflation and the depreciation of
the peso in recent years, led to a significant decline in revenues
and a significant increase of costs in real terms, which could no
longer be recovered through margin adjustments or market
price-setting mechanisms. This situation, in turn, led many public
utility companies to suspend payments on their financial debt
(which continued to be denominated in U.S. dollars despite the
pesification of revenues), effectively preventing these companies
from obtaining further financing in the domestic or international
credit markets and making additional investments.
After declaring a
state of emergency with respect to the national electrical system,
the Argentine government increased electric power tariffs in the
WEM under the Energía Base. Preliminary injunctions suspending
such increases were requested by customers, politicians and
non-governmental organizations, and recent rulings suspended the
increases in the whole territory of Argentina. On September 6,
2016, the Supreme Court denied these injunctions that suspended
end-users electric power tariff increases, and a public hearing to
evaluate the proposals for a full tariff review filed by EDENOR and
EDESUR was held on October 28, 2016. The tariff increases were
approved on January 31, 2017. In addition, the Argentine government
issued Resolution SE No. 21/16 calling for a public bid process for
the installation of new generation capacity from both thermal and
renewable sources, offering generators U.S. dollar-denominated
rates linked to generation costs for newly available generation
capacity. However, tariffs under the Energía Base remain well
below historical levels, although there have been important
increases and, they are now denominated in U.S. dollars which
mitigates the effect of variations in the foreign exchange rate.
These measures, or any future measures, may not be sufficient to
address the structural problems created by the economic crisis of
2001 and 2002 and its aftermath, and measures similar to those
adopted during the economic crisis may not be enacted in the
future.
On March 1, 2019,
by means of Resolution SRRyME No. 1/19, the Argentine Government
reduced prices for power capacity and energy under Energía
Base, which had been previously increased by Resolution SEE No.
19/17. This change was defined as a transition measure by the
recitals of Resolution SRRyME No. 1/19. However, we cannot assure
you that further reductions of these tariffs will not occur.
Moreover, although under Resolution SRRyME No. 1/19 power capacity
and energy tariffs are set in U.S. dollars, we cannot assure you
that Energía Base prices in the future will remain denominated
in this currency.
17
We have, in the recent past, been unable to collect payments, or to
collect them in a timely manner, from CAMMESA and other customers
in the electric power sector
For the years ended
December 31, 2018 and 2017, approximately 90.91% and 93.97%,
respectively, of our revenues from continuing operations came from
our sales to CAMMESA (under the Energía Base, Resolution. SEE
70/18, the spot market and remuneration under Resolution No.
724/2008, relating to agreements with CAMMESA to improve existing
power generation capacity), or 90.91% in 2018 and 82.87% in 2017
over our total revenues, from both continuing and discontinuing
operations. In addition, we receive significant cash flows from
CAMMESA in connection with the FONINVEMEM and similar programs.
Payments to us by CAMMESA, including installments in connection
with returns from FONINVEMEM and similar programs, depend upon
payments that CAMMESA in turn receives from other WEM agents such
as electric power distributors as well as the Argentine
government.
Regarding the CVO
Agreement, effective as of March 20, 2018, CAMMESA granted the CVO
Commercial Approval in the WEM, as a combined cycle, of the thermal
plant Central Vuelta de Obligado, which entitled us to receive the
collection of the trade receivables under the CVO Agreement. A PPA
between the CVO Trust and CAMMESA, through which the CVO Trust
makes energy sales and, consequently, receives the cash flow to pay
the trade receivables, had to be signed in order to start the
collections.
The PPA agreement
was signed on February 7, 2019, with retroactive effect to March
20, 2018.
As a result, the
original amortization schedule from the CVO Agreement is in full
force and effect.
The unpaid
installments corresponding to the March-December 2018 period add up
to US$ 78.15 million (including VAT, corresponding to installments
1 to 10). As of the day of this annual report, we continue in
negotiations with CAMMESA to collect such unpaid amounts as soon as
possible, plus the accrued interest between each due date and the
effective payment date.
Despite the
referred unpaid installments, as of the date of this annual report,
we received the payment related to January and February 2019
(corresponding to installments 11 and 12, respectively) pursuant to
the CVO Agreement’s original disbursement schedule, at the
exchange rate of the last date of each month, on its respective due
dates, in March and April 2019, respectively.
We are also
entitled to receive the foreign exchange difference accrued for the
Energía Base and FONI trade receivables, between the last date
of the month of each monthly transaction of Energía Base or
FONI installment, and the day prior to the due date of such monthly
transaction or installment. These amounts should be paid one day
after the due date of the payment of each monthly transaction of
Energía Base or FONI installment. However, for the January
2019 installment, with due date on March 14, 2019, the foreign
exchange difference was payed on April 5, 2019. The foreign
exchange difference on the February 2019 monthly transaction of
Energía Base and FONI installments has not been collected as
of the date of this annual report.
In recent years,
due to regulatory conditions in Argentina
’
s electric power sector that
affected the profitability and economic viability of power
utilities, certain WEM agents defaulted on their payments to
CAMMESA, which adversely affected CAMMESA
’
s ability to meet its payment
obligations to electric power generators, including us. In the
recent past, when CAMMESA experienced a lack of funds to pay to
generators, a significant amount of unpaid balances were converted
into LVFVD. See
“
Business
—
FONINVEMEM and Similar
Programs.
”
As a
consequence of delays in payments that CAMMESA received from other
WEM agents in the past, we also saw delays in the payments we
received under the Energía Base, receiving payments from
CAMMESA within approximately 90 days of month-end, rather than the
required 42 days after the date of billing. Such payment delays
resulted in higher working capital requirements that we would
typically finance with our own financing sources. From September
2016 to November 2017 CAMMESA has paid without delays, and since
then, there were short periods in which CAMMESA experienced delays
in paying (for more information on the duration of these delays see
“Item 11. Quantitative and Qualitative Disclosures about
Market Risk
—
Credit
Risk”). For example, for the monthly transaction related to
Energía Base of January 2019, with due date on March 13, 2019,
we collected 50% on that date, 22% on March 19, 2019, 22% on April
1, 2019, and the rest on April 5, 2019. For the monthly transaction
related to Energía Base of February 2019, with due date on
April 11, 2019, we collected 41% on that date, and 20% on April 17,
2019, and we expect to collect the balance in the upcoming weeks.
For these delays, we are entitled to receive interests from
CAMMESA. Payments related to PPAs under the Renovar Regulatory
Framework have not suffered delays. CAMMESA may once again be
unable to make payments to generators both in respect of energy
dispatched and generation capacity availability on a timely basis
or in full, which may substantially and adversely affect our
financial position and the results of our operations.
18
Electricity demand may be affected by tariff increases, which could
lead generation companies like us to record lower
revenues
During the 2001 and
2002 economic crisis, electric power demand in Argentina decreased
due to the decline in the overall level of economic activity and
the deterioration in the ability of many consumers to pay their
electric power bills. In the years following the 2001 and 2002
economic crisis, electric power demand experienced significant
growth, increasing at an estimated average of approximately 3.86%
per annum from 2002 through 2015 (despite a decline in 2009), due
to its reduced cost as a result of certain energy subsidies,
freezing of margins and elimination of inflation adjustment
provisions in distribution concessions. In March 2016, the
Argentine government unified and increased wholesale energy prices
for all consumption in Argentina, eliminated certain energy
subsidies and implemented an incentive plan (through discounts) for
residential customers whose electric power consumption is at least
10.00% lower than their consumption for the same month of the
previous year. These measures are currently in an early stage of
implementation, and we cannot ascertain as of the date of this
annual report what the effect on our revenues could be. Any
significant increase in energy prices to consumers (whether through
a tariff increase or through a cut in consumer subsidies) could
result in a decline in demand for the energy that we generate. Any
material adverse effect on electric power demand, in turn, could
lead electric power generation companies, like us, to record lower
revenues and results of operations than currently
anticipated.
Argentina has certain energy transmission and distribution
limitations that adversely affect the capacity of electric power
generators to deliver all of the energy they are able to produce,
which results in reduced sales
The energy that
generators are able to deliver to the transmission system for the
further delivery to the distribution system at all times depends on
the capacity of the transmission and distribution systems that
connects them to it. The transmission and distribution system are
currently operating at near full capacity and both transmission and
distributors may not be able to guarantee an increased supply of
electric power to their customers. In the past years, the increase
in demand for electric power resulted in blackouts in Buenos Aires
and other cities around Argentina, which results in excess capacity
for generators. As a result, the amount of hydroelectric energy and
thermal energy generated is larger than what the transmission and
distribution systems are capable of transmitting or distributing.
Any transmission or distribution limitation for generators could
reduce the energy sold, which could adversely affect our financial
condition.
Our equipment, facilities and operations are subject to
environmental, health and safety regulations
Our generation
business is subject to federal and provincial laws, as well as to
the supervision of governmental agencies and regulatory authorities
in charge of enforcing environmental laws and policies. We operate
in compliance with applicable laws and in accordance with
directives issued by the relevant authorities and CAMMESA; however,
it is possible that we could be subject to controls, which could
result in penalties to be imposed on us, such as the termination of
the HPDA Concession Agreement. In addition, future environmental
regulations could require us to make investments in order to comply
with the requirements set by the authorities, instead of making
other scheduled investments and, as a result, could have a material
adverse effect on our financial condition and our results of
operations.
We operate in a heavily regulated sector that imposes significant
costs on our business, and we could be subject to fines and
liabilities that could have a material adverse effect on our
results of operations
We are subject to a
wide range of federal, provincial and municipal regulations and
supervision, including laws and regulations pertaining to tariffs,
labor, social security, public health, consumer protection, the
environment and competition. Furthermore, Argentina has 23
provinces and one autonomous city (the City of Buenos Aires), each
of which, under the Argentine National Constitution, has power to
enact legislation concerning taxes, environmental matters and the
use of public space. Within each province, municipal governments
can also have powers to regulate such matters. Although the
generation of electric power is considered an activity of general
interest (
actividad de interés
general
) subject to federal legislation, due to the fact
that our facilities are located throughout various provinces, we
are also subject to provincial and municipal legislation. Future
developments in the provinces and municipalities concerning taxes
(including sales, security and health and general services taxes),
environmental matters, the use of public space or other matters
could have a material adverse effect on our business, results of
operations and financial condition. Compliance with existing or
future legislation and regulations could require us to make
material expenditures and divert funds away from planned
investments in a manner that could have a material adverse effect
on our business, results of operations and financial
condition.
In addition, our
failure to comply with existing regulations and legislation, or
reinterpretations of existing regulations and new legislation or
regulations, such as those relating to fuel and other storage
facilities, volatile materials, cyber security, emissions or air
quality, hazardous and solid waste transportation and disposal and
other environmental matters, or changes in the nature of the energy
regulatory process may subject us to fines and penalties and have a
significant adverse impact on our financial results.
19
A cyberattack could adversely affect our business, balance sheet,
results of operations and cash flow
We depend on the
efficient and uninterrupted operation of our inter-plant
communication systems, for which we have all our links redundant,
providing greater security and minimizing the risks of outage.
Additionally, we have redundant links with CAMMESA. Temporary or
long-lasting failures of our inter-plant communication systems,
including their links redundant, could have a material adverse
effect on our operations. In general, information security risks
have increased in recent years as a result of the proliferation of
new and more sophisticated technologies and also due to cyberattack
activities. As part of our development and initiatives, more
equipment and systems have been connected to the Internet. We also
rely on digital technology including information systems to process
financial and operational information. Due to the critical nature
of our infrastructure and our business and the increased
accessibility allowed through the Internet connection, we could
face an increased risk of cyberattacks such as computer break-ins,
phishing, identity theft and other disruptions that could
negatively affect the security of information stored in and
transmitted through our computer systems and network
infrastructure. In the event of a cyberattack, we could experience
an interruption of our commercial operations, material damage and
loss of customer information; a substantial loss of income,
suffering response costs and other economic losses; and it could
subject us to more regulation and litigation and damage to our
reputation. Although we intend to continue to implement security
technology devices and establish operational procedures to prevent
disruption resulting from, and counteract the negative effects of
cybersecurity incidents, it is possible that not all of our current
and future systems are or will be entirely free from vulnerability
and these security measures will not be successful. Accordingly,
cybersecurity is a material risk for us and a cyber-attack could
adversely affect our business, results of operations and financial
condition.
Our power plants are subject to the risk of mechanical or
electrical failures and any resulting unavailability may affect our
ability to fulfill our contractual and other commitments and thus
adversely affect our business and financial
performance
Our power
generation units are at risk of mechanical or electrical failure
and may experience periods of unavailability affecting our ability
to generate electric power. For example, certain of our
turbogenerators at the Puerto Complex, including generators 5, 6, 7
and 8, began operating in the 1960s and are, therefore, over 50
years old. Because of their age, these generators may face a higher
risk of mechanical or electrical failure. Our combined cycle plant
located in the Puerto Complex has suffered major failures in the
past, for example in the rotor of one of the gas turbines and in
the generator. Any unplanned unavailability of our generation
facilities may adversely affect our financial condition or results
of operations.
Risks arise for our business from technological change in the
energy market
The energy market
is subject to far-reaching technological change, both on the
generation side and on the demand side. For example, with respect
to energy generation, the development of energy storage devices
(battery storage in the megawatt range) or facilities for the
temporary storage of power through conversion to gas (so-called
“
power-to-gas-technology
”
), the increase in energy supply due
to new technological applications such as fracking or the
digitalization of generation and distribution networks should be
mentioned.
New technologies to
increase energy efficiency and improve heat insulation, for the
direct generation of power at the consumer level, or that improve
refeeding (for example, by using power storage for renewable
generation) may, on the demand side, lead to structural market
changes in favor of energy sources with low or zero carbon dioxide
emissions or in favor of decentralized power generation, (for
instance, via small-scale power plants within or close to
residential areas or industrial facilities.)
If our business is
unable to react to changes caused by new technological developments
and the associated changes in market structure, our equity,
financial or other position, or our results, operation and
business, could be materially and adversely affected.
We may face competition
The power
generation markets in which we operate are characterized by
numerous strong and capable participants, many of which may have
extensive and diversified developmental or operating experience
(including both domestic and international) and financial resources
similar to or significantly greater than ours. See
“Item 4.B.
Business
Overview
—
Competition.
”
An increase in competition could
cause reductions in prices and increase acquisition prices for
fuel, raw materials and existing assets and, therefore, adversely
affect our results of operations and financial
condition.
We compete with
other generation companies for the megawatt of capacity that are
allocated through public auction processes. On October 7, 2016, the
Ministry of Energy finalized the auction process for the
installation of new renewable energy units and granted awards in
the amount of 1,108.65 MW, including one biomass project, 12 wind
energy projects and four solar energy projects. Of these, we were
awarded one wind energy project for 99 MW of generating capacity at
the price of US$61.50 per MWh. On October 31, 2016, the Ministry of
Energy and Mining, pursuant to Resolution No. 252/16, launched
Round 1.5 of the RenovAR Program as a continuation of Round 1 and
on November 25, 2016, granted awards in the amount of 1281.5 MW,
including 10 wind energy projects and 20 solar energy projects. Of
these, we were awarded one wind energy project for 48 MW of
generating capacity at the price of US$59.38 per MWh. Following
Rounds 1 and 1.5 of the RenovAR Program, the Ministry of Energy and
Mining pursuant to Resolution No. 275/17, which launched Round 2 of
the program on August 17, 2017, granted awards in the amount of
2,043 MW of renewable power capacity. We submitted bids for Round 2
of the RenovAR Program on October 19, 2017 and, on November 29,
2017, we were awarded a wind energy project called,
“
La Genoveva I,
”
which will allow us to add an
additional capacity of 86.6 MW to our portfolio and to continue to
build a presence in the renewable energies sector.
20
The Secretariat of
Electric Energy, pursuant to Resolution SEE No. 287-E/17, called
for proposals for supply of electric power to be generated through
existing units, the conversion of open combined cycle units into
closed combined cycle units or the installation of co-generation
units. We submitted bids on August 9, 2017, and, on September 25,
2017, we were awarded the two co-generation projects. Our Terminal
6 San Lorenzo and Luj
á
n de
Cuyo projects have the following two sources of income: (i)
electric power and electric energy sales to CAMMESA through PPAs
with a 15-year term which are priced in U.S. dollars and (ii) steam
sales pursuant to separate steam supply agreements with T6
Industrial S.A. and YPF, respectively, which are priced in U.S.
dollars.
In addition, we
have acquired four heavy-duty, highly efficient gas turbines and
130 hectares of land in the north of the Province of Buenos Aires.
We expect that these assets will potentially allow us to develop
new power capacity. For example, we are currently installing one of
the Siemens gas turbines, with a capacity of 286 MW, for the
Terminal 6 San Lorenzo co-generation project described above. Our
objective is to develop new generating capacity, through one or
more projects, using the remaining three units and the
aforementioned land, in which we have already invested US$134
million, to install new generation capacity, through one or more
potential future projects. This could add 969 MW to our installed
capacity through one or more projects under a simple cycle
configuration. Because of the competition among generation
companies in these auction processes, we cannot predict whether we
will be awarded the projects and whether we will be able to utilize
these assets as intended. In addition, as of the date of this
annual report, we have already paid SEK$381.37 million (which,
converted at the exchange rate quoted by the Central Bank as of the
date of each payment, equals US$45.46 million) to purchase two
additional Siemens gas turbines for our Luján de Cuyo
project.
We and our
competitors are connected to the same electrical grid that has
limited capacity for transportation, which, under certain
circumstances, may reach its capacity limits. Therefore, new
generators may connect, or existing generators may increase, their
outputs and dispatch more electric power to the same grid that
would prevent us from delivering our energy to our customers. In
addition, the Argentine government (or any other entity on its
behalf) might not make the necessary investments to increase the
system
’
s capacity, which,
in case there is an increase of energy output, would allow us and
existing and new generators to efficiently dispatch our energy to
the grid and to our customers. As a result, an increase in
competition could affect our ability to deliver our product to our
customers, which would adversely affect our business, results of
operations and financial condition.
Our business is subject to risks arising from natural disasters,
catastrophic accidents and terrorist attacks
Our generation
facilities, or the third-party fuel transportation or electric
power transmission infrastructure that we rely on, may be damaged
by flooding, fires, earthquakes and other catastrophic disasters
arising from natural or accidental or intentional human causes. We
could experience severe business disruptions, significant decreases
in revenues based on lower demand arising from catastrophic events,
or significant additional costs to us not otherwise covered by
business interruption insurance clauses. There may be an important
time lag between a major accident, catastrophic event or terrorist
attack and our definitive recovery from our insurance policies,
which typically carry non-recoverable deductible amounts, and in
any event are subject to caps per event. In addition, any of these
events could cause adverse effects on the energy demand of some of
our customers and of consumers generally in the affected market.
Some of these considerations, could have a material adverse effect
on our business, financial condition and our result of
operations.
We may be subject to expropriation or similar risks
All or
substantially all of our assets are located in Argentina. We are
engaged in the business of power generation and, as such, our
business or our assets may be considered by the government to be a
public service or essential for the provision of a public service.
Therefore, our business is subject to political uncertainties,
including expropriation or nationalization of our business or
assets, loss of concessions, renegotiation or annulment of existing
contracts, and other similar risks. For example, the HPDA
Concession Agreement pursuant to which we are permitted to operate
our Piedra del
Á
guila
plant expires on December 29, 2023.
In such an event,
we may be entitled to receive compensation for the transfer of our
assets. However, the price received may not be sufficient, and we
may need to take legal actions to claim appropriate compensation.
Our business, financial condition and results of our operations
could be adversely affected by the occurrence of any these
events.
21
Changes in regulatory frameworks under which we sell our
electricity may affect our financial condition and results of
operations
We currently sell
our capacity availability and electricity under various regulatory
frameworks, including the Energía Base and Energía Plus.
See
“Item 4.B.
Business
Overview
—
Our
Customers
”
and
“Item 4.B. Business
Overview
—
The Argentine
Electric Power Sector.
”
On December 16,
2016, the Argentine government declared a state of emergency with
respect to the national electrical system until December 31, 2017.
We cannot assure you what further changes the Argentine government
may make to the Energía Base or the other regulatory
frameworks under which we sell power availability or electricity,
including whether these changes future changes will not negatively
impact our results of operations. Moreover, we cannot assure you
under what regulatory framework we will be able to sell our
generation capacity and electricity in the future.
On March 1, 2019,
by means of Resolution SRRyME No. 1/19, the Argentine Government
reduced prices for power capacity and energy under Energía
Base, which had been previously increased by Resolution SEE No.
19/17. This change was defined as a transition measure by the
recitals of Resolution SRRyME No. 1/19. However, we cannot assure
you that further reductions of these tariffs will not occur.
Moreover, although under Resolution SRRyME No. 1/19 power capacity
and energy tariffs are set in U.S. dollars, we cannot assure you
that Energía Base prices in the future will remain denominated
in this currency.
We cannot assure
you that changes in the current applicable laws and regulations, or
adverse judicial or administrative interpretations of such laws and
regulations, will not adversely affect our results of operations.
In addition, some of the measures proposed by the new government
may also generate political and social opposition, which may in
turn prevent the new government from adopting such measures as
proposed.
Risks Relating to Our Business
Our results depend largely on the compensation established by the
Secretariat of Electric Energy and received from
CAMMESA
Since the enactment
of Resolution SE No. 95/13, issued by the former Secretariat of
Electric Energy, as amended, our compensation has depended largely
on the variable compensation determined by energy output and
availability. This resolution was replaced in February 2017 by
Resolution SEE No. 19/17, issued by Secretariat of Electric Energy,
which in turn was replaced by Resolution No. 1/19 of the Secretary
of Renewable Resources and Electric Markey of the National Ministry
of Economy (the “Resolution SRRyME No. 1/19”). Except
for sales under contracts, revenues from energy production are
calculated and paid by CAMMESA pursuant to a fixed and variable
costs system arising from the Resolution SRRyME No. 1/19, which
also establishes that CAMMESA will convert prices nominated in US$
into ARS applying the exchange rate informed by the Argentine
Central Bank in accordance with its Communication “A”
3500, of the day prior to the expiry date of the economic
transaction. See
“
Item
5.A. Operating Results
—
Factors Affecting Our Results of
Operations
—
Our
Revenues
—
The Energía
Base
”
and
“Item 3.D.
Risk Factors
—
Risks Relating to the Electric Power
Sector in Argentina
—
We
have, in the recent past, been unable to collect payments, or to
collect them in a timely manner, from CAMMESA and other customers
in the electric power sector.
”
The tariffs under the Energía
Base had been increased in February, May and November 2017 pursuant
to Resolution SEE No. 19/17, and since March 1, 2019, pursuant to
Resolution SRRyME No. 1/19, the prices for power capacity and
energy under Energía Base have been decreased. This change was
defined as a transition measure by the recitals of Resolution
SRRyME No. 1/19. However, we cannot assure you that further
reductions of these tariffs will not occur. Moreover, although
under Resolution SRRyME No. 1/19 power capacity and energy tariffs
are set in U.S. dollars, we cannot assure you that Energía
Base prices in the future will remain denominated in this
currency.
As a result of this
system, our revenues are highly dependent on actions taken by
regulatory authorities. Additionally, there are several bills
submitted to the National Congress by legislators of the opposition
which establish that until December 21, 2019, tariffs applied by
electricity Distributors, must not be increased, and, in the case
of some of those bills, that also tariffs must return to the values
in force on December 31, 2018 or January 1, 2017, depending on the
bill. In the event that these projects prosper and become a law,
the current compensation system could be changed. Any change in the
current system could have a material adverse effect on our revenues
and, as a result, our results of operations.
Factors beyond our control may affect our ability to win public
bids for new generation capacity, or affect or delay the completion
of new power plants once we have been awarded projects
Our business plan
contemplates an investment in new energy generation projects in
order to expand our generating capacity by more than 659 MW. This
includes more than 235.95 MW from renewable sources, including wind
and solar energy projects, as well as the installation of new
thermal generation units with an installed generating capacity of
423 MW.
22
Following Rounds 1
and 1.5 of the RenovAR Program, the Ministry of Energy and Mining
pursuant to Resolution No. 275/17, which launched Round 2 of the
program on August 17, 2017 and granted awards in the amount of
2,043 MW of renewable power capacity. We submitted bids for Round 2
of the RenovAR Program on October 19, 2017 and, on November 29,
2017, we were awarded a wind energy project called,
“
La Genoveva I,
”
which will allow us to add an
additional capacity of 86.6 MW to our portfolio and to continue to
build a presence in the renewable energies sector.
The Secretariat of
Electric Energy, pursuant to Resolution SEE No. 287-E/17, called
for proposals for supply of electric power to be generated through
existing units, the conversion of open combined cycle units into
closed combined cycle units or the installation of co-generation
units. We submitted bids on August 9, 2017, and, on September 25,
2017, we were awarded the two co-generation projects with the
characteristics set forth in the table below. The Terminal 6 San
Lorenzo and Luj
á
n de Cuyo
projects have the following two sources of income: (i) electric
power sales to CAMMESA through PPAs with a 15-year term which are
priced in U.S. dollars; and (ii) steam sales pursuant to separate
steam supply agreements with T6 Industrial S.A. and YPF,
respectively, which are priced in U.S. dollars.
In addition, we
have acquired four heavy-duty, highly efficient gas turbines and
130 hectares of land in the north of the Province of Buenos Aires.
We expect that these assets will potentially allow us to develop
new power capacity. For example, we are currently installing one of
the Siemens gas turbines, with a capacity of 286 MW, for the
Terminal 6 San Lorenzo co-generation project described above. Our
objective is to develop new generating capacity, through one or
more projects, using the remaining three units and the
aforementioned land, in which we have already invested US$134
million, to install new generation capacity, through one or more
potential future projects. This could add 969 MW to our installed
capacity through one or more projects under a simple cycle
configuration. Because of the competition among generation
companies in these auction processes, we cannot predict whether we
will be awarded the projects and whether we will be able to utilize
these assets as intended. In addition, as of the date of this
annual report, we have already paid SEK$381.37 million (which,
converted at the exchange rate quoted by the Central Bank as of the
date of each payment, equals US$45.46 million) to purchase two
additional Siemens gas turbines for our Luján de Cuyo
project.
Delays in
construction or commencement of operations of expanded capacity in
our existing power plants or our new power plants could lead to an
increase in our financial needs and also cause our financial
returns on new investments to be lower than expected, which could
materially adversely affect our financial condition and results of
operations.
Factors that may
impact our ability to commence operations at our existing power
plants or build new power plants include: (i) the failure of
contractors to complete or commission the facilities or auxiliary
facilities by the agreed-upon date or within budget; (ii) the
unexpected delays of third parties such as gas or electric power
distributors in providing or agreeing to project milestones in the
construction or development of necessary infrastructure linked to
our generation business; (iii) the delays or failure by our turbine
suppliers in providing fully operational turbines in a timely
manner; (iv) difficulty or delays in obtaining the necessary
financing in terms satisfactory to us or at all; (v) delays in
obtaining regulatory approvals, including environmental permits;
(vi) court rulings against governmental approvals already granted,
such as environmental permits; (vii) shortages or increases in the
price of equipment reflected through change orders, materials or
labor; (viii) opposition by local and/or international political,
environmental and ethnic groups; (ix) strikes; (x) adverse changes
in the political and regulatory environment in Argentina; (xi)
unforeseen engineering, environmental and geological problems; and
(xii) adverse weather conditions, natural disasters, accidents or
other unforeseen events. Any cost overruns could be material. In
addition, any of these other factors may cause delays in the
completion of expanded capacity at our existing power plants or the
construction of our new power plant, which could have a material
adverse effect on our business, financial condition and results of
operations. These delays may also result in short-term sanctions by
CAMMESA and, in extreme cases, sanctions for the duration of the
contract.
Our business may require substantial capital expenditures for
ongoing maintenance requirements and the expansion of our installed
generation capacity
Incremental capital
expenditures may be required to fund ongoing maintenance necessary
to maintain our power generation and operating performance and
improve the capabilities of our electric power generation
facilities. Furthermore, capital expenditures will be required to
finance the cost of our current and future expansion of our
generation capacity. If we are unable to finance any such capital
expenditures in terms satisfactory to us or at all, our business
and the results of our operations and financial condition could be
adversely affected. Our financing ability may be limited by market
restrictions on financing availability for Argentine companies. See
“—
Risk Relating to
Argentina
—
A lack of
financing for Argentine companies due to the unresolved litigation
with holdout bondholders, may negatively impact our financial
condition or cash flows
”
and
“
Item 4.B. Business
Overview.
”
23
The non-renewal or early termination of the HPDA Concession
Agreement would adversely affect our results of
operations
The HPDA Concession
Agreement executed between us and the Argentine government,
pursuant to which we are permitted to operate our Piedra del
Á
guila plant, expires on
December 29, 2023. This plant has a total installed capacity of
1,440 MW, and it represented approximately 29.07% of our generation
from continuing operations and 29.07% of our total generation, and
16.66% of our revenues from continuing operations in 2018 and
16.66% of our total revenues in 2018. We currently intend to renew
the HPDA Concession Agreement prior to its expiration. If the HPDA
Concession Agreement expires without renewal, we will be required
to revert the assets to the Argentine government. The HPDA
Concession Agreement also contains various requirements related to
the operation of the hydroelectric plant and compliance with laws
and regulations. The non-performance of the HPDA Concession
Agreement could give rise to certain penalties and even the
termination of the concession. If the concession were terminated,
it would be granted to a new company organized by the Argentine
government and a tender offer would be carried out for selling the
new company
’
s shares of
stock. The proceeds to be received by us in such tender offer would
be calculated based on a formula in which the proceeds of the
tender decrease as the expiration of the concession term comes
closer. Any non-renewal or early termination of the HPDA Concession
Agreement would materially and adversely affect our financial
condition and results of operation.
Our interests in TJSM, TMB and CVOSA will be significantly
diluted
As of the date of
this annual report, we have a 30.8752% interest in TJSM and a
30.9464% interest in TMB, both companies that are engaged in
managing the purchase of equipment, building, operating and
maintaining power plants constructed under the FONINVEMEM program.
We have the right to name two out of nine directors on the board of
directors of each company. As of the date of this annual report, we
also own 56.19% of CVOSA, the company that operates the thermal
power plant in Timbues. After ten years of operations of each
company (which will occur on February 2, 2020 for TJSM, January 7,
2020 for TMB and March 20, 2028 for CVOSA), each company is
entitled to receive property rights to such power plants from the
respective trusts currently holding such power plants. At such
time, since the Argentine government financed part of the
construction, it will be incorporated as a shareholder of TJSM, TMB
and CVOSA, and our interests in TJSM, TMB and CVOSA will be
significantly diluted. In the case of TJSM and TMB, we cannot
estimate the exact effects of such potential dilution due to the
fact that the Argentine government
’
s stake in these companies depends
on the funds provided by the Argentine government for the
construction of each plant, which has not yet been defined. In the
case of CVOSA, although the effect of the potential dilution has
also not yet been defined for the same reasons, the Argentine
government
’
s stake in
CVOSA will be at least 70% pursuant to FONINVEMEM arrangements for
CVOSA. Any dilution of our interest in TJSM, TMB or CVOSA could
reduce our income, which could adversely affect our results of
operations. See
“Item
4.B.
Business Overview
—
FONINVEMEM and Similar
Programs.
”
Future changes in the rainfall amounts in the Limay River basin
could adversely affect the revenues from the Piedra del Águila
concession and, therefore, our financial results
As a hydroelectric
facility, Piedra del
Á
guila depends on the availability of
water resources in the Limay River basin for electric power
generating purposes, which in turn depends on the rainfall amounts
in the area. In 1996, 2007 and 2012, and in particular in 1998,
1999 and 2016, the area experienced record-low rainfall levels.
Lack of water resulted in lower electric power generation and,
therefore, lower revenue. However, rainfall levels, and therefore
electric generation, were significantly higher than average during
1995, 2001, 2002, 2005 and 2006. For more information about Piedra
del
Á
guila
’
s seasonality, see
“Item 4.B.
Business
Overview
—
Seasonality.
”
In the event of
critically low water levels, the Intergovernmental Basin Authority,
which is in charge of managing the basin of the Limay,
Neuqu
é
n and Negro rivers,
is entitled to manage the water flows according to its flow control
standards, which could result in lower water resources for us,
which in turn, would result in decreased generation activities.
Further, under the HPDA Concession Agreement, we are not entitled
to receive any compensation for revenue losses as a result of such
actions.
The Limay River
basin
’
s flow may not be
sufficient to maintain a regular generation level at Piedra del
Á
guila and the enforcement
authority may implement unfavorable measures for Piedra del
Á
guila, and therefore, for
us, which could adversely affect our financial condition and our
results of operations.
Our ability to operate wind farms profitably is highly dependent on
suitable wind and associated weather conditions
The amount of
energy generated by, and the profitability of, wind farms are
highly dependent on climate conditions, particularly wind
conditions, which can vary materially across locations, seasons and
years. Variations in wind conditions at wind farm sites occur as a
result of daily, monthly and seasonal fluctuations in wind currents
and, over the longer term, as a result of more general climate
changes and shifts. Because turbines will only operate when wind
speeds fall within certain specific ranges that vary by turbine
type and manufacturer, if wind speeds fall outside or towards the
lower end of these ranges, energy output at our wind farms would
decline.
24
If in the future
the wind resource in the areas where our wind farms are located is
lower than expected, electricity production at such wind farms
would be lower than expected and consequently could materially
adversely affect our results of operations.
Our insurance policies may not fully cover damage, and we may not
be able to obtain insurance against certain risks
We maintain
insurance policies intended to mitigate our losses due to customary
risks. These policies cover our assets against loss for physical
damage, loss of revenue and also third-party liability. However, we
may not have sufficient insurance to cover any particular risk or
loss. If an accident or other event occurs that is not covered by
our current insurance policies, such as cybersecurity risk, we may
experience material losses or have to disburse significant amounts
from our own funds, all of which could have a material adverse
effect on our operations and financial position. In addition, an
insufficiency in our insurance policies could have an adverse
effect on us. In such case, our financial condition and our results
of operations could be adversely affected. See
“Item 4.B.
Business
Overview
—
Insurance.
”
Our generation operations require us to handle hazardous elements
such as fuels, which could potentially result in damage to our
facilities or injuries to our personnel
Although we comply
with all applicable environmental safety laws and best practices,
any accident involving the fuels with which we operate could have
adverse environmental consequences and could damage our industrial
facilities or our personnel.
Any structural
damage to the dam or any other structure located in any of our
hydroelectric plants could compromise its electric power generating
capacity. Any generation constraints resulting from structural
damage could have a material adverse effect on our financial
condition and results of operations.
We may be exposed to lawsuits and or administrative proceedings
that could adversely affect our financial condition and results of
operations
In the ordinary
course of our business we enter into agreements with CAMMESA and
other parties. Litigation and/or regulatory proceedings are
inherently unpredictable, and excessive verdicts do occur. Adverse
outcomes in lawsuits and investigations could result in significant
monetary damages, including indemnification payments, or injunctive
relief that could adversely affect our ability to conduct our
business and may have a material adverse effect on our financial
condition and results of operations.
Energy demand is seasonal, largely due to climate
conditions
Energy demand
fluctuates according to the season and climate conditions may
materially and adversely impact energy demand. During the summer
(December through March), energy demand may increase significantly
due to the need for air conditioning and, during winter (June
through August), energy demand may fluctuate according to the needs
for lighting and heating. As a result, seasonal changes could
materially and adversely affect the demand for energy and,
consequently, affect our results of operations and financial
condition (in particular sales derived from the Energía Plus
regulatory framework, which is dependent on demand rather than on
capacity committed under contract).
We may undertake acquisitions and investments to expand or
complement our operations that could result in operating
difficulties or otherwise adversely affect our financial conditions
and results of operations
In order to expand
our business, from time to time, we may carry out acquisitions and
investments which offer added value and are consistent with or
complementary to our business strategy.
For example, in
2015, we acquired: (i) a direct and indirect interest of 24.99% in
DGCU
’
s stock capital; and
(ii) a direct and indirect interest of 44.10% of DGCE
’
s stock capital, both of which
operate in a highly regulated industry. The results of these
companies
’
operations are
influenced by the applicable regulatory framework and the
interpretation and enforcement of such regulatory framework by
ENARGAS, the governmental authority created to regulate privatized
natural gas transmission and distribution companies. Their licenses
are subject to revocation under certain circumstances. If any of
these events were to occur, it could have a material adverse effect
on them and, as a result, on us. In connection with potential
acquisition and investment transactions, we may be exposed to
various risks, including those arising from: (i) not having
accurately assessed the value, future growth potential, strengths,
weaknesses and potential profitability of potential acquisition
targets; (ii) difficulties in successfully integrating, operating,
maintaining or managing newly-acquired operations, including
personnel; (iii) unexpected costs of such transactions; (iv)
difficulties in obtaining the necessary financing and successfully
reaching any required financial closing; or (v) unexpected
contingent or other liabilities or claims that may arise from such
transactions. If any of these risks were to materialize, it could
adversely affect our financial condition and results of
operations.
25
If we were to acquire another energy company in the future, such
acquisition could be subject to the Argentine Antitrust
Authority’s approval
The Antitrust Law
provides that any transactions involving the acquisition, transfer
or control of another company
’
s assets will be subject to the
Comisión
Nacional de Defensa de la Competencia (CNDC)
(
“
Argentine Antitrust
Authority
”
) prior consent
and approval in the event that (i) the total revenues of the
companies involved for the last fiscal year exceeds the sum of
Ps.200 million in Argentina; and (ii) the transaction amount or the
value of the transferred assets located in Argentina exceeds Ps.20
million.
The Argentine
Antitrust Authority will determine whether any acquisition subject
to its prior approval negatively impacts competitive conditions in
the markets in which we compete or adversely affects consumers in
these markets. Although we are not contemplating any business
combination as of the date of this annual report, if the Argentine
Antitrust Authority were to reject any business combination or if
such authority were to take any action to impose conditions or
performance commitments on us as part of the approval process for
any business combination, it could adversely affect our financial
condition and results of operations and prevent us from achieving
the anticipated benefits of such acquisition.
We depend on senior management and other key personnel for our
current and future performance
Our current and
future performance depends to a significant degree on our qualified
senior management team, and on our ability to attract and retain
qualified management. Our future operations could be harmed if any
of our senior executives or other key personnel ceased working for
us. Competition for senior management personnel is intense, and we
may not be able to retain our personnel or attract additional
qualified personnel. The loss of a member of senior management may
require the remaining executive officers to divert immediate and
substantial attention to fulfilling his or her duties and of
seeking a replacement. Any inability to fill vacancies in our
senior executive positions on a timely basis could harm our ability
to implement our business strategy, which would harm our business
and results of operations.
We could be affected by material actions taken by the trade
unions
Although we have
stable relationships with our work force, in the past we
experienced organized work stoppages and strikes, and we may face
such work stoppages or strikes in the future. Labor claims are
common in the Argentina energy sector, and in the past, unionized
employees have blocked access and caused damages to the facilities
of various companies in the industry. Moreover, we have no
insurance coverage for business interruptions caused by
workers
’
actions, which
could have an adverse effect on our results of
operations.
We are subject to anticorruption, anti-bribery, anti-money
laundering and other laws and regulations
We are subject to
anti-corruption, anti-bribery, anti-money laundering and other laws
and regulations. We may be subject to investigations and
proceedings by authorities for alleged infringements of these laws.
Although we perform compliance processes and maintain internal
control systems, these proceedings may result in fines or other
liabilities and could have a material adverse effect on our
reputation, business, financial conditions and result of
operations. If any such subsidiaries, employees or other persons
engage in fraudulent, corrupt or other unfair business practices or
otherwise violate applicable laws, regulations or internal
controls, we could become subject to one or more enforcement
actions or otherwise be found to be in violation of such laws,
which may result in penalties, fines and sanctions and in turn
adversely affect our reputation, business, financial condition and
result of operations.
Our ability to generate electricity at our thermal generation
plants partially depends on the availability of natural gas and, to
a lesser extent, liquid fuel.
The supply and
price of natural gas and liquid fuel used in our thermal generation
plants has been in the past, and may in the future be, affected by,
among other things, the availability of natural gas and liquid fuel
in Argentina, given the current shortage of natural gas supply and
declining reserves in Argentina. In particular, many oil and gas
fields in Argentina are mature and in recent years have not been
subject to significant investment into development and exploration
activities and, therefore, reserves are likely to be
depleted.
Pursuant to
Resolution No. 95/2013, as amended, CAMMESA is in charge of
managing and supplying all fuels required to run our thermal
plants. If in the future we were to become required to purchase our
own natural gas or liquid fuel from third parties, we cannot assure
you that we will be able to purchase natural gas or liquid fuel at
prices that are fully reimbursable by CAMMESA and, even if CAMMESA
accepted to reimburse us for such amounts, it may be uncertain when
such reimbursements would occur. In addition, natural gas delivery
depends on the infrastructure (including barge facilities, roadways
and natural gas pipelines) available to serve each generation
facility. As a result, our thermal plants are subject to the risks
of disruptions or curtailments in the fuel delivery chain and
infrastructure. Any such disruption or curtailment may result in
the unavailability, or higher prices, of natural gas or liquid
fuel. Moreover, if in the future we are required to purchase our
own natural gas or liquid fuel from third parties at prices that
are not fully reimbursable by CAMMESA, such situation may have a
material adverse effect on our financial condition and results of
operations.
26
We may be adversely affected by changes in LIBOR reporting
practices or the method in which LIBOR is determined
As of December 31,
2018, we had trade receivables under the CVO Agreement for US$548
million (including VAT), plus accrued interests after the CVO
Commercial Approval which were indexed to the London Interbank
Offered Rate (“LIBOR”). In an announcement on 27 July
2017, the U.K. Financial Conduct Authority (FCA), which is the
competent authority for the regulation of benchmarks in the UK,
advocated a transition away from reliance on LIBOR to alternative
reference rates and stated that it would no longer persuade or
compel banks to submit rates for the calculation of the LIBOR rates
after 2021 (the “FCA Announcement”). The FCA
Announcement formed part of ongoing global efforts to reform LIBOR
and other major interest rate benchmarks. At this time, the nature
and overall timeframe of the transition away from LIBOR is
uncertain and no consensus exists as to what rate or rates may
become accepted alternatives to LIBOR. It is not possible to
predict the further effect of the rules of the FCA, any changes in
the methods by which LIBOR is determined, or any other reforms to
LIBOR that may be enacted in the United Kingdom, the European Union
or elsewhere. Any such developments may cause LIBOR to perform
differently than in the past, or cease to exist. In addition, any
other legal or regulatory changes made by the FCA, ICE Benchmark
Administration Limited, the European Money Markets Institute
(formerly Euribor-EBF), the European Commission or any other
successor governance or oversight body, or future changes adopted
by such body, in the method by which LIBOR is determined or the
transition from LIBOR to a successor benchmark may result in, among
other things, a sudden or prolonged increase or decrease in LIBOR,
a delay in the publication of LIBOR, and changes in the rules or
methodologies in LIBOR, which may discourage market participants
from continuing to administer or to participate in LIBOR’s
determination, and, in certain situations, could result in LIBOR no
longer being determined and published. If a published
U.S. Dollar LIBOR rate is unavailable after 2021, the interest
rates on our debt which is indexed to LIBOR will be determined
using various alternative methods, any of which may result in
interest obligations which are more than or do not otherwise
correlate over time with the payments that would have been made on
such debt if U.S. Dollar LIBOR was available in its current
form. Further, the same costs and risks that may lead to the
discontinuation or unavailability of U.S. Dollar LIBOR may
make one or more of the alternative methods impossible or
impracticable to determine. Any of these proposals or consequences
could have a material adverse effect on our financing costs or in
the valuation of the trade receivables under the CVO
Agreement.
Risks Relating to our Shares and ADSs
It may be difficult for you to obtain or enforce judgments against
us
We are incorporated
in Argentina. All of our directors and executive officers reside
outside the United States, and substantially all of our and their
assets are located outside the United States. As a result, it may
not be possible for you to effect service of process within the
United States upon these persons or to enforce judgments against
them or us in U.S. courts. We have been advised by our special
Argentine counsel, Bruchou, Fern
á
ndez Madero & Lombardi, that
there is doubt as to the enforceability in original actions in
Argentine courts of liabilities predicated solely on U.S. federal
securities laws and as to the enforceability in Argentine courts of
judgments of U.S. courts obtained in actions predicated upon the
civil liability provisions of U.S. federal securities laws. The
enforcement of such judgments will be subject to compliance with
certain requirements under Argentine law, such as Articles 517
through 519 of the Argentine Code of Civil and Commercial
Procedure, including the condition that such judgments do not
violate the principles of public policy of Argentine Law, as
determined by an Argentine court. In addition, an Argentine court
will not order an attachment on property located in Argentina and
determined by such court to be essential for the provision of a
public service.
Future exchange controls and restrictions on the repatriation of
capital from Argentina may impair the ability of holders of ADSs to
receive dividends and distributions on, and the proceeds of any
sale of, the shares underlying the ADSs, which could affect the
market value of the ADSs
In 2001 and 2002
Argentina imposed exchange controls and transfer restrictions,
substantially limiting the ability of companies to retain foreign
currency or make payments abroad, including payments of dividends.
In addition, new regulations were issued in the last quarter of
2011, which significantly curtailed access to the MULC by
individuals and private sector entities. More recently, since
December 2015 the new Argentine administration has lifted many of
the foreign exchange restrictions imposed in 2011, including the
lifting of certain restrictions for the repatriation of portfolio
investment by non-resident investors. As a consequence, with
respect to the proceeds of any sale of common shares underlying the
ADSs, as of the date of this annual report, the conversion from
pesos into U.S. dollars and the remittance of such U.S. dollars
abroad is not subject to prior approval of the Argentine Central
Bank, provided that the foreign beneficiary is either a natural or
legal person residing in or incorporated and established in
jurisdictions, territories or associated states that are considered
“
cooperators for the
purposes of fiscal transparency.
”
27
Argentina may
impose new stricter exchange controls and transfer restrictions in
the future, among other things, in response to capital flight or a
significant depreciation of the peso. In such a case, the ADS
Depositary may be prevented from converting pesos it receives in
Argentina for the account of the ADS holders. If this conversion is
not possible, the deposit agreement allows the ADS Depositary to
distribute the foreign currency only to those ADS holders to whom
it is possible to do so. If the exchange rate fluctuates
significantly during a time when the ADS Depositary cannot convert
the foreign currency, holders of our ADSs may lose some or all of
the value of the dividend distribution. Also, if payments cannot be
made in U.S. dollars abroad, the repatriation of any funds
collected by foreign investors in pesos in Argentina may be subject
to restriction. In such event, the ability of our foreign
shareholders and holders of ADSs to obtain the full value of their
shares and ADSs and the market value of our shares and ADSs may be
adversely affected.
We will be traded on more than one market and this may result in
price variations; in addition, investors may not be able to easily
move shares for trading between such markets
Our common shares
are listed on the BYMA and, since February 2, 2018, our ADSs are
listed on the NYSE. Any markets that may develop for our common
shares or for the ADSs may not have liquidity and the price at
which the common shares or the ADSs may be sold is
uncertain.
Trading in the ADSs
or our common shares on these markets takes place in different
currencies (U.S. dollars on the NYSE and pesos on the BYMA), and at
different times (resulting from different time zones, different
trading days and different public holidays in the United States and
Argentina). The trading prices of the securities on these two
markets may differ due to these and other factors. Any decrease in
the price of our common shares on the BYMA could cause a decrease
in the trading price of the ADSs on the NYSE. Investors could seek
to sell or buy our shares to take advantage of any price
differences between the markets through a practice referred to as
arbitrage. Any arbitrage activity could create unexpected
volatility in both our share prices on one exchange, and the ADSs
available for trading on the other exchange. In addition, holders
of ADSs will not be immediately able to surrender their ADSs and
withdraw the underlying common shares for trading on the other
market without effecting necessary procedures with the ADS
Depositary. This could result in time delays and additional cost
for holders of ADSs.
Under Argentine Corporate Law, shareholder rights may be fewer or
less well defined than in other jurisdictions
Our corporate
affairs are governed by our bylaws and by Argentine Law No. 19,550,
as amended (the
“
Argentine Corporate Law
”
), which differ from the legal
principles that would apply if we were incorporated in a
jurisdiction in the United States (such as Delaware or New York),
or in other jurisdictions outside Argentina. Thus, the rights of
holders of our ADSs or holders of our common shares under the
Argentine Corporate Law to protect their interests relative to
actions by our Board of Directors may be fewer and less well
defined than under the laws of those other jurisdictions. Although
insider trading and price manipulation are illegal under Argentine
law, the Argentine securities markets may not be as highly
regulated or supervised as the U.S. securities markets or markets
in some of the other jurisdictions. In addition, rules and policies
against self-dealing and regarding the preservation of shareholder
interests may be less well defined and enforced in Argentina than
in the United States, or other jurisdictions outside Argentina,
putting holders of our common shares and the ADSs at a potential
disadvantage.
Holders of our common shares and the ADSs located in the United
States may not be able to exercise preemptive or accretion
rights
Under the Argentine
Corporate Law, if we issue new shares as part of a capital
increase, our shareholders may have the right to subscribe to a
proportional number of shares to maintain their existing ownership
percentage. Rights to subscribe for shares in these circumstances
are known as preemptive rights. In addition, shareholders are
entitled to the right to subscribe for the unsubscribed shares
remaining at the end of a preemptive rights offering on a pro rata
basis, known as accretion rights. Upon the occurrence of any future
increase in our capital stock, United States holders of common
shares or ADSs will not be able to exercise the preemptive and
related accretion rights for such common shares or ADSs unless a
registration statement under the Securities Act is effective with
respect to such common shares or ADSs or an exemption from the
registration requirements of the Securities Act is available. We
are not obligated to file a registration statement with respect to
those common shares or ADSs. We may not file such a registration
statement, or an exemption from registration may not be available.
Unless those common shares or ADSs are registered or an exemption
from registration applies, a U.S. holder of our common shares or
ADSs may receive only the net proceeds from those preemptive rights
and accretion rights if those rights can be sold by the ADS
Depositary; if they cannot be sold, they will be allowed to lapse.
Furthermore, the equity interest of holders of common shares or
ADSs located in the United States may be diluted proportionately
upon future capital increases.
28
Voting rights, and other rights, with respect to the ADSs are
limited by the terms of the deposit agreement
Holders may
exercise voting rights with respect to the common shares underlying
ADSs only in accordance with the provisions of the deposit
agreement. There are no provisions under Argentine law or under our
bylaws that limit ADS holders
’
ability to exercise their voting
rights through the ADS Depositary with respect to the underlying
common shares, except if the ADS Depositary is a foreign entity and
it is not registered with the IGJ. The ADS Depositary is registered
with the IGJ. However, there are practical limitations upon the
ability of ADS holders to exercise their voting rights due to the
additional procedural steps involved in communicating with such
holders. For example, Law No. 26,831 requires us to notify our
shareholders by publications in certain official and private
newspapers of at least 20 and no more than 45 days in advance of
any shareholders
’
meeting. ADS holders will not receive any notice of a
shareholders
’
meeting
directly from us. In accordance with the deposit agreement, we will
provide the notice to the ADS Depositary, which will in turn, if we
so request, as soon as practicable thereafter provide to each ADS
holder:
●
the notice of such
meeting;
●
voting instruction
forms; and
●
a statement as to
the manner in which instructions may be given by
holders.
To exercise their
voting rights, ADS holders must then provide instructions to the
ADS Depositary how to vote the shares underlying ADSs. Because of
the additional procedural step involving the ADS Depositary, the
process for exercising voting rights will take longer for ADS
holders than for holders of our common shares. Except as described
in this annual report, holders of the ADS will not be able to
exercise voting rights attaching to the ADSs.
Also, section 7.6
of the deposit agreement provides that each of the parties to the
deposit agreement (including, without limitation, each holder and
beneficial owner) waives, to the fullest extent permitted by
applicable law, any and all right to trial by jury in any legal
proceeding against us and/ or the ADS Depositary. This provision
may have the effect of limiting and discouraging lawsuits against
us and/ or the ADS Depositary. Moreover, you may not be able to
exercise your right to vote and you may have no legal remedy if the
shares underlying your ADSs are not voted as you
requested.
The relative volatility and illiquidity of the Argentine securities
markets may substantially limit our ADS holders’ ability to
sell common shares underlying the ADSs at the price and time they
desire
Investing in
securities that trade in developing countries, such as Argentina,
often involves greater risk than investing in securities of issuers
in the United States (see “
Risks
Relating to Argentina—
Certain risks are inherent in
any investment in a company operating in a developing country such
as Argentina”). The Argentine securities market is
substantially smaller, less liquid, more concentrated and can be
more volatile than major securities markets in the United States,
and is not as highly regulated or supervised as some of these other
markets. There is also significantly greater concentration in the
Argentine securities market than in major securities markets in the
United States. During December 2017, the ten largest Argentine
companies in terms of their weight in the MERVAL index represented
approximately 63.19% of its composition. Accordingly, although
holders of our ADSs are entitled to withdraw the common shares
underlying the ADSs from the ADS Depositary at any time, their
ability to sell such shares at a price and time at which they wish
to do so may be substantially limited. Furthermore, new capital
controls imposed by the Central Bank could have the effect of
further impairing the liquidity of the BYMA by making it
unattractive for non-Argentines to buy shares in the secondary
market in Argentina. See
“Item
10.D.—
Exchange Controls.
”
If there are substantial sales of our common shares or the ADSs,
the price of the common shares or of the ADSs could
decline
Sales of
substantial number of our common shares or the ADSs could cause a
decline in the market price of our common shares. In addition, if
our significant shareholders, directors and members of senior
management listed in
“Item 6.
Directors, Senior Management and Employees—
Senior
Officers
”
, who, as of
April 15, 2019, own in aggregate 35.55% of our outstanding common
shares, sell our common shares or the ADSs or the market perceives
that they intend to sell them, the market price of our common
shares or the ADSs could drop significantly. Also, the Argentine
government authorized the Ministry of Energy and Mining to promote
the measures necessary to proceed with the sale, assignment or
transfer of the equity interest owned by the Argentine government
in power plants, including its interest in our Company
(representing 8.25% of our outstanding shares). See
“Item 4.B. Business Overview—The
Argentine Electric Power Sector—General Overview of Legal
Framework—Changes to the Electric Power Sector under the
Macri Administration
.
”
29
Our shareholders may be subject to liability for certain votes of
their securities
Our shareholders
are not liable for our obligations. Instead, shareholders are
generally liable only for the payment of the shares they subscribe.
However, shareholders who have a conflict of interest with us and
who do not abstain from voting may be held liable for damages to
us, but only if the transaction would not have been approved
without such shareholders
’
votes. Furthermore, shareholders
who willfully or negligently vote in favor of a resolution that is
subsequently declared void by a court as contrary to Argentine
Corporate Law or our bylaws may be held jointly and severally
liable for damages to us or to other third parties, including other
shareholders.
We are an “emerging growth company” and are availing
ourselves of reduced disclosure requirements applicable to emerging
growth companies, which could make the ADSs or our common shares
less attractive to investors
We are an EGC as
defined in the U.S. Jumpstart Our Business Startups Act of 2012,
and we take advantage of certain exemptions from various reporting
requirements that are applicable to other public companies that are
not
“
emerging growth
companies
”
including not
being required to comply with the auditor attestation requirements
of Section 404(b) of the Sarbanes-Oxley Act and reduced disclosure
obligations regarding executive compensation.
We cannot predict
if investors will find the ADSs or our common shares less
attractive because we may rely on these exemptions. If some
investors find the ADSs or our common shares less attractive as a
result, there may be a less active trading market for the ADSs or
our common shares and the price of the ADSs or our common shares
may be more volatile. We may take advantage of these reporting
exemptions until we are no longer an EGC.
We will cease to be
an EGC upon the earliest of: (1) the last day of the fiscal year
during which we have revenue of US$1.07 billion or more, (2) the
last day of the fiscal year following the fifth anniversary of the
date of this prospects, (3) the date on which we have issued more
than US$1 billion in non-convertible debt during the previous
three-year period or (4) when we become a
“
large accelerated filer,
”
as defined in Rule 12b-2 under the
Exchange Act.
As a foreign private issuer, we are exempt from a number of rules
under the U.S. securities laws and are permitted to file less
information with the Commission than a U.S. company. This may limit
the information available to holders of our ADSs
We are a
“
foreign private
issuer,
”
as defined in
the SEC
’
s rules and
regulations and, consequently, we are not subject to all of the
disclosure requirements applicable to companies organized within
the United States. For example, we are exempt from certain rules
under the Exchange Act that regulate disclosure obligations and
procedural requirements related to the solicitation of proxies,
consents or authorizations applicable to a security registered
under the Exchange Act. In addition, our officers and directors are
exempt from the reporting and
“
short-swing
”
profit recovery provisions of
Section 16 of the Exchange Act and related rules with respect to
their purchases and sales of our securities. Moreover, while we
expect to submit quarterly interim consolidated financial data to
the Commission under cover of the Commission
’
s Form 6-K, we are not required to
file periodic reports and financial statements with the Commission
as frequently or as promptly as U.S. public companies. Accordingly,
there may be less information concerning our company publicly
available than there is for U.S. public companies.
As a foreign private issuer, we are not subject to certain NYSE
corporate governance rules applicable to U.S. listed
companies
We rely on a
provision in the NYSE Listed Company Manual that allows us to
follow Argentine law with regard to certain aspects of corporate
governance. This allows us to follow certain corporate governance
practices that differ in significant respects from the corporate
governance requirements applicable to U.S. companies listed on the
NYSE.
For example, we are
exempt from NYSE regulations that require a listed U.S. company,
among other things, to:
●
have a majority of
our board of directors be independent;
●
establish a
nominating and compensation composed entirely of independent
directors;
●
adopt and disclose
a code of business conduct and ethics for directors, officers and
employees; and
●
have an executive
session of solely independent directors each year.
The market price for our common shares or ADSs could be highly
volatile
The market price
for our common shares or the ADSs after the global offering is
likely to fluctuate significantly from time to time in response to
factors including:
30
●
fluctuations in our
periodic operating results;
●
changes in
financial estimates, recommendations or projections by securities
analysts;
●
changes in
conditions or trends in our industry;
●
changes in the
economic performance or market valuation of our
competitors;
●
announcements by
our competitors of significant acquisitions, divestitures,
strategic partnerships, joint ventures or capital
commitments;
●
events affecting
equities markets in the countries in which we operate;
●
legal or regulatory
measures affecting our financial conditions;
●
departures of
management and key personnel; or
●
potential
litigation or the adverse resolution of pending litigation against
us or our subsidiaries.
Volatility in the
price of our common shares or the ADSs may be caused by factors
outside of our control and may be unrelated or disproportionate to
our operating results. In particular, announcements of potentially
adverse developments, such as proposed regulatory changes, new
government investigations or the commencement or threat of
litigation against us, as well as announced changes in our business
plans or those of competitors, could adversely affect the trading
price of our common shares or the ADSs, regardless of the likely
outcome of those developments or proceedings. Moreover, statements
made about our Company, whether publicly or in private, may be
misconstrued, particularly if read out of context. In a personal
message in Spanish to an acquaintance in Argentina in December
2017, which was retransmitted without authorization, Mr.
P
é
r
è
s Moore, the former Chairman of our
Board of Directors, stated in effect that Central Puerto is a
valuable company, that its stock has risen substantially, and that
whether there could be upside remains to be discussed.
Mr. P
é
r
è
s Moore did not intend to express any
view about the future value of the shares, other than the
uncertainty derived from factors such as the ones described in this
risk factor.
Broad market and
industry factors could adversely affect the market price of our
common shares or ADSs at any time, regardless of our actual
operating performance.
If we fail to maintain an effective system of internal control over
financial reporting, we may not be able to accurately report our
financial results or prevent fraud. As a result, shareholders could
lose confidence in our financial and other public reporting, which
would harm our business and the trading price of our common
shares.
Effective internal
controls over financial reporting are necessary for us to provide
reliable financial reports and, together with adequate disclosure
controls and procedures, are designed to prevent fraud. Any failure
to achieve and maintain effective internal controls over financial
reporting, implement required new or improved controls, or
difficulties encountered in their implementation could cause us to
fail to meet our reporting obligations, which in turn could have a
material adverse effect on our business and our common shares or
the ADSs. In addition, any testing by us conducted in connection
with Section 404 of the Sarbanes-Oxley Act of 2002, or any
subsequent testing by our independent registered public accounting
firm, may reveal deficiencies in our internal controls over
financial reporting that are deemed to be material weaknesses or
that may require prospective or retroactive changes to our
financial statements or identify other areas for further attention
or improvement. Matters impacting our internal controls may cause
us to be unable to report our financial information on a timely
basis and thereby subject us to adverse regulatory consequences,
including sanctions by the SEC. There also could be a negative
reaction in the financial markets due to a loss of investor
confidence in us and the reliability of our consolidated financial
statements. Confidence in the reliability of our consolidated
financial statements also could suffer if we or our independent
registered public accounting firm were to report a material
weakness in our internal controls over financial reporting. This
could in turn limit our access to capital markets and possibly,
harm our results of operations, and lead to a decline in the
trading price of our common shares or the ADSs.
We will be required
to disclose changes made in our internal controls and procedures
and our management will be required to assess the effectiveness of
these controls annually. However, for as long as we are an
“emerging growth company” under the JOBS Act, our
independent registered public accounting firm will not be required
to attest to the effectiveness of our internal controls over
financial reporting pursuant to Section 404. We could be an
“emerging growth company” until December 31, 2023,
although circumstances could cause us to lose that status earlier
(see “—We are an “emerging growth company”
and are availing ourselves of reduced disclosure requirements
applicable to emerging growth companies, which could make the ADSs
or our common shares less attractive to investors.”) An
independent assessment of the effectiveness of our internal
controls could detect problems that our management’s
assessment might not. Undetected material weaknesses in our
internal controls could lead to financial statement restatements
and require us to incur the expense of remediation.
31
The protections afforded to minority shareholders in Argentina are
different from and more limited than those in the United States and
may be more difficult to enforce
Under Argentine
law, the protections afforded to minority shareholders are
different from, and much more limited than, those in the United
States. For example, the legal framework with respect to
shareholder disputes, such as derivative lawsuits and class
actions, is less developed under Argentine law than under U.S. law
as a result of Argentina
’
s short history with these types of
claims and few successful cases. In addition, there are different
procedural requirements for bringing these types of shareholder
lawsuits. As a result, it may be more difficult for our minority
shareholders to enforce their rights against us or our directors or
controlling shareholder than it would be for shareholders of a U.S.
company.
Holders of our common shares may determine not to pay any
dividends
In accordance with
the Argentine General Corporate Law 19,550, as amended, which we
refer to as the Argentine Corporate Law, after allocating at least
5% of our annual net earnings to constitute a mandatory legal
reserve, we may pay dividends to shareholders out of net and
realized profits, if any, as set forth in our consolidated
financial statements prepared in accordance with IFRS. The
approval, amount and payment of dividends are subject to the
approval by our shareholders at our annual ordinary
shareholders’ meeting. The approval of dividends requires the
affirmative vote of a majority of the shareholders entitled to vote
at the meeting. As a result, we cannot assure you that we will be
able to generate enough net and realized profits so as to pay
dividends or that our shareholders will decide that dividends will
be paid.
We may be a passive foreign investment company for U.S. federal
income tax purposes
A non-U.S.
corporation will be considered a passive foreign investment
company, which we refer to as a PFIC, for U.S. federal income tax
purposes in any taxable year in which 75% or more of its gross
income is
“
passive
income
”
or 50% or more of
its assets (determined based on a quarterly average) constitute
“
passive
assets.
”
The
determination as to whether a non-U.S. corporation is a PFIC is
based upon the application of complex U.S. federal income tax rules
(which are subject to differing interpretations), the composition
of income and assets of the non-U.S. corporation from time to time
and, in certain cases, the nature of the activities performed by
its officers and employees.
Based upon our
current and projected income, assets and activities, we do not
expect to be considered a PFIC for our current taxable year or for
future taxable years. However, because the determination of whether
we are a PFIC will be based upon the composition of our income,
assets and the nature of our business, as well as the income,
assets and business of entities in which we hold at least a 25%
interest, from time to time, and because there are uncertainties in
the application of the relevant rules, there can be no assurance
that we will not be considered a PFIC for any taxable
year.
If we are a PFIC
for any taxable year during which a U.S. Holder, as defined in
“Item 10.E.
Taxation
—
Certain United
States Federal Income Tax Considerations,
”
holds the ADSs or common shares,
the U.S. Holder might be subject to increased U.S. federal income
tax liability and to additional reporting obligations. See
“Item 10.E.
Taxation
—
Certain United
States Federal Income Tax Considerations
—
Passive Foreign Investment
Company.
”
U.S. Holders
are encouraged to consult their own tax advisors regarding the
applicability of the PFIC rules to their purchase, ownership and
disposition of the ADSs or common shares.
The requirements of being a public company may strain our resources
and distract our management, which could make it difficult to
manage our business
Since the global
offering, we are required to comply with various regulatory and
reporting requirements, including those required by the Commission
in addition to our existing reporting requirements by the CNV.
Complying with these reporting and regulatory requirements will be
time consuming, resulting in increased costs to us or other adverse
consequences. As a public company, we will be subject to the
reporting requirements of the Exchange Act, and the requirements of
the Sarbanes-Oxley Act, as well as to the Argentine Capital Markets
Law and CNV rules. These requirements may place a strain on our
systems and resources. The Exchange Act applicable to us requires
that we file annual and current reports with respect to our
business and financial condition. Likewise, CNV rules require that
we make annual and quarterly filings and that we comply with
disclosure obligations including current reports. The
Sarbanes-Oxley Act requires that we maintain effective disclosure
controls and procedures and internal controls over financial
reporting. To maintain and improve the effectiveness of our
disclosure controls and procedures, we committed significant
resources, hired additional staff and provided additional
management oversight. We are implementing additional procedures and
processes for the purpose of addressing the standards and
requirements applicable to public companies. These activities may
divert management
’
s
attention from other business concerns, which could have a material
adverse effect on our business, results of operations and financial
condition.
32
Recent Political and Economic Developments in
Argentina
Since assuming
office, the Macri administration has announced and implemented
several significant economic and policy reforms,
including:
●
INDEC reforms
. On
January 8, 2016, based on its determination that the INDEC had
failed to produce reliable statistical information, particularly
with respect to the CPI, GDP, poverty and foreign trade data, the
Macri administration declared the national statistical system and
the INDEC in a state of administrative emergency through December
31, 2016, which was not renewed. The INDEC implemented certain
methodological reforms and adjusted certain macroeconomic
statistics on the basis of these reforms. See
“Item 3.D.
Risk Factors
—
Risks Relating to
Argentina
—
The credibility
of several Argentine economic indices has been called into
question, which has led to a lack of confidence in the Argentine
economy and could affect your evaluation of the market value of the
ADSs.
”
As of the date of
this annual report, the INDEC has published certain revised data,
including GDP, poverty, foreign trade and balance of payment
statistics.
●
Agreement with holdout
creditors.
The Macri administration has reached agreements
with a large majority of holdout creditors (in terms of claims) and
regained access to the international financial markets for the
country. For more information on these agreements, see
“Item 3.D.
Risk Factors
—
Risks Relating to
Argentina
—
A lack of
financing for Argentine companies due to the unresolved litigation
with holdout bondholders may negatively impact our financial
condition or cash flows.
”
●
Foreign exchange
reforms.
The Macri administration eliminated a significant
portion of foreign exchange restrictions, including currency
controls that were imposed by the previous administration. With the
aim of providing more flexibility to the foreign exchange system
and promoting competition, the Decree N° 27/2018 published on
January 11, 2018 created the free-floating exchange market (the
“Exchange Market”). Furthermore, on August 8,
2016, the Central Bank introduced material changes to the foreign
exchange regime and established a new framework by means of
Communication “A” 6037 and Communication
“A” 6244 which significantly eased access to the
Exchange Market. Furthermore, on December 26, 2017, by virtue of
Communication “A” 6401, the Central Bank replaced the
reporting regimes set forth by Communications “A” 3602
and “A” 4237 with a new, unified regime applicable for
information as of December 31, 2017. The unified reporting regime
involves an annual mandatory statement filing for every person
whose total flow of funds or balance of assets and liabilities is
or exceeds US$1 million during the previous calendar
year. Moreover, by virtue of Communication “A”
6443, which came into force as of March 1, 2018, any company from
any sector, which usually operates through the Exchange Market can
act as an exchange agency by only registering in the exchange
operators’ registry. See
“Item 10.D
Exchange
Controls.”
●
Foreign trade reforms
.
The Macri administration eliminated or reduced the export duties
applicable to several agricultural products and eliminated the
export duties applicable to most exports of industrial and mining
products. On January 2, 2017, the Argentine government enacted
a further reduction of the export duties rate set for soybean and
soybean products, setting a monthly 0.5% cut on the export duties
rate beginning on January 2018 and until December 2019. In
addition, importers were offered short-term debt securities issued
by the Argentine government to repay outstanding commercial debt
for the import of goods. Notwithstanding the aforementioned, as
part of the reform package intended to reduce the fiscal deficit
and enhance public accounts, the Executive Branch of Argentina
published Decree No. 793/2018, which established a 12% duty on all
exported consumption products included in the Mercosur Common
Nomenclature, (
Nomenclatura Comun
del Mercosur
) (the “NCM”) that will remain in
effect until December 31, 2020. Decree No. 793/2018 caps the
rate for export duties on most products at Ps.4.00/U.S.$1.00 based
on the taxable base or free on-board value, depending on the
product. However, the exchange rate cap for certain products
(mainly manufactured goods) is Ps.3.00/U.S.$1.00 of the taxable
base or free on-board value, depending on the product. As an
additional measure, Decree No. 793/2018 reduced export duties on
soybean by-products to 18%, 16% or 11%, depending on the
product.
●
Fiscal policy.
The Macri administration
took steps to anchor the fiscal accounts, reducing the primary
fiscal deficit by approximately 1.3% of GDP in December 2015
through a series of taxation and other measures and announced its
intention to reduce the primary fiscal deficit in 2016 and 2017
from approximately 5.8% of GDP in 2015, in part by eliminating
public services subsidies that were in place, such as those
applying to electric power and gas services. For 2017 and 2018, the
aggregate primary fiscal deficit was reported to be 3.8% and 2.4%
of GDP, respectively. The Macri administration’s aim is to
achieve a primary fiscal deficit of 2.2% GDP in 2019, and 1.2% in
2020.
33
●
Correction of monetary imbalances and changes
in monetary policy
. The Central Bank aims to ensure that, in
the period from October 2018 until June 2019, the monetary base
will register a zero growth (based on a monthly average), through
its Monetary Aggregates Regime (Agregados Monetarios) as agreed in
the 2018 IMF Agreement. On September 28, 2018, in connection with
the 2018 IMF Agreement, the Monetary Policy Committee of the
Central Bank announced the goal of achieving a zero percent growth
rate in the monetary base until June 2019. This monetary goal would
be achieved through daily operations of LELIQS, which began on
October 1, 2018. LELIQS are seven-day peso-denominated securities
that can be purchased exclusively by banks. On the first tender
offer of LELIQS, the Central Bank awarded Ps.71,060 million at a
67.1% average rate. The Central Bank is expected to continue to
perform daily operations of LELIQS until the zero percent goal is
achieved. See “Item 3.D. Risk Factors—Risks Relating to
Argentina—Significant fluctuations in the value of the peso
could adversely affect the Argentine economy and, in turn,
adversely affect our results of operations” and
“—the IMF Agreement” below.
●
Domestic capital markets.
On May 9,
2018, the Productive Financing Law No. 27,440 was
enacted
.
This law amends
the existing legislation with the aim of promoting the development
of the domestic capital markets. The Productive Financing Law
seeks, among other things, to broaden the base of investors and
companies that take part in the capital markets, promoting
financing especially for micro-, small- and medium-sized companies
(“MiPyMEs”) seeking to create a framework which eases
access to financing for such companies. Furthermore, the law
eliminates certain controversial articles of the previous Capital
Markets Law No. 26,831 which gave the CNV the authority to
intervene the management of publicly traded companies. (See
“
Item 3.D.
Risk
Factors
—
Risks Relating to
Argentina
—
Government
intervention may adversely affect the Argentine economy and, as a
result, our business and results of
operations.”)
●
Corporate Criminal Liability Law
(
Ley de Responsabilidad Penal
Empresaria
): On November 8, 2017, the Lower House of
the Argentine Congress approved the bill (Law No. 27,401) providing
for the criminal liability of corporate entities for criminal
offences against public administration and transnational bribery
committed by, among others, its attorneys-in-fact, directors,
managers, employees, or representatives. According to the law, a
company may be held liable if such offences were committed,
directly or indirectly, in its name, behalf or interest, the
company obtained or may have obtained a benefit therefrom, and the
offence resulted from a company’s ineffective control.
Companies found liable under this law may be subject to various
sanctions, including, among others, fines ranging from two to five
times of the undue benefit obtained, total or partial suspension of
commercial activities, suspension to participate in bidding
processes or activity linked to the National State, dissolution and
liquidation of legal status, loss or suspension of benefits or
government subsidies that they may have and the publication of the
conviction sentence for two days, in a national
newspaper.
●
Social security reform bill
. On
December 19, 2017, the Argentine Congress passed the social
security reform bill which, among other amendments, modified the
adjustment formula in the retirement system with a view to
supplying the necessary funds of ANSES to guarantee that retirees
who earn the minimum pension receive 82% of the minimum salary.
Social security payments shall be subject to a certain adjustment
formula to be applied every year in March, June, September and
December. The formula to calculate the security payments shall be
based (i) 70% on the CPI published by INDEC and (ii) 30% on the
Remuneración Imponible
Promedio de los Trabajadores Estables
(“RIPTE”
per its initials in Spanish) variation, which is an indicator
published by the Ministry of Labor which measures the evolution of
public sector salaries. Moreover, instead of the biannual increase,
a quarterly increase will be applied. After the passing of the
draft bill, on December 20, 2017, Decree No. 1058 was
published and, with the aim of avoiding divergence with the
application of the previous formula, established a compensatory
bonus for retirees, pensioners and beneficiaries of the universal
insurance per child (
asignación universal por
hijo
).
●
Tax reform
. On December 27, 2017,
the Argentine Congress approved a tax reform that was published on
December 29, 2017 as Law No. 27,430 (the “Tax
Reform”). The reform is intended to eliminate certain
inefficiencies in the Argentine tax regime, diminish tax evasion,
broaden income taxes to cover more individuals and encourage
investment, with the long-term goal of restoring fiscal balance.
The reform is part of a larger program announced by President
Macri, intended to increase employment, make the Argentine economy
more competitive (by reducing the fiscal deficit, for example) and
sustainably diminish poverty. The main aspects of the Tax Reform
include: (i) capital gains realized by individuals that are
Argentine tax residents on sales of real estate (subject to certain
exceptions, including a primary residence exemption) acquired after
January 1, 2018 will be subject to tax at the rate of 15%,
calculated on the difference between the transfer price and the
acquisition cost adjusted for inflation; (ii) income obtained
from currently exempt bank deposits and sales of securities
(including government securities) by individuals that are Argentine
tax residents, will be subject to tax at the rate of (a) 5% in the
case of those denominated in Pesos, subject to fixed interest rate
and not indexed, and (b) 15% for those denominated in a foreign
currency or indexed; (iii) income obtained from the sales of shares
made on an Argentine stock exchange will be exempt, subject to
compliance with certain requirements; (iv) corporate income
tax rate will initially decline to 30% for fiscal periods starting
after January 1, 2018 and up to December 31, 2019 and to 25% for
fiscal periods starting after January 1, 2020; (v) social security
contributions will be gradually increased to 19.5% starting in
2022, in lieu of the differential scales currently in effect; and
(iv) the percentage of tax debits and credits that can be
credited towards income tax will be gradually increased over a five
year period. In addition, on April 9, 2018, Decree No. 279/2018 was
published in the Official Gazette and General Resolution (AFIP) No.
4227/2018 was published on April 12, 2018 regulating the Tax Reform
Law relating to, among other aspects, the income tax applicable to
Foreign Beneficiaries derived from financial transactions. Decree
No. 1170/2018 was published on December 27, 2018 introducing the
implementing regulations of the Tax Reform. For further
information, see “Item 10.E. Taxation—Material
Argentine Tax Considerations” below.
34
●
National electric power state
of emergency and reforms
. Following years of very limited
investment in the energy sector, as well as the continued freeze on
electric power and natural gas tariffs since the 2001-2002 economic
crisis, Argentina began to experience energy shortages in 2011. In
response to the growing energy crisis. In December 2015, the Macri
administration declared a state of emergency with respect to the
national electric power system, which remained in effect until
December 31, 2017. The state of emergency allowed the Argentine
government to take actions designed to ensure the supply of
electric power to the country, such as instructing the Ministry of
Energy and Mining to design and implement, with the cooperation of
all federal public entities, a coordinated program to guarantee the
quality and security of the electric power system. In addition, the
Macri administration announced the elimination of certain energy
subsidies and a substantial increase in electric power rates. By
correcting tariffs and subsidies and modifying the regulatory
framework, the Macri administration aims to correct distortions in
the energy sector and stimulate investment. Following tariff
increases, preliminary injunctions suspending such increases were
requested by customers, politicians and non-governmental
organizations that defend customers
’
rights, which preliminary
injunctions were granted by Argentine courts. Among the different
rulings in this respect, two separate rulings led to the suspension
of end-users tariff increases of electric power in the Province of
Buenos Aires and in the whole territory of Argentina. However, on
September 6, 2016, the Supreme Court denied these injunctions that
suspended end-users electric power tariff increases, arguing formal
objections and procedural defects and therefore, as of the date of
this annual report, increases of the electric power end-users
tariffs are not suspended. In addition, to further address
the potential impact of the new tariff scheme during the 2018
winter peak season of natural gas consumption by retail customers,
an optional program was implemented through Resolution No. 97/2018
issued by the Argentine Gas Regulator (Ente Nacional Regulador del
Gas) under which consumers would finance the payment of up to 25%
of natural gas monthly bills for the 2018 winter peak season.
Finally, on May 9, 2018, the lower house of the National Congress
approved a bill to modify the current tariff scheme for natural gas
for local companies and PyMES and the Senate approved it on May 30,
2018, however, the President vetoed it on the same
day.
●
Public Private Participation Law.
On
November 16, 2016, the Public Private Participation Law was
passed by Congress, and has been regulated by Decree
No. 118/2017. This new regime seeks to replace existing
regulatory frameworks (Decrees Nos. 1299/00 and 967/05) and
supports the use of public price participation schemes for a large
variety of purposes including the design, construction, extension,
improvement, provision, exploitation and/or operation and financing
of infrastructure development, provision of services or other
activities, provision of services productive, investments, applied
research, technological innovation and associated services. The
Public Participation Law also includes certain protection
mechanisms in favor of the private sector (contractors and lenders)
in order to promote the development of these associative
schemes.
●
Fiscal consensus.
In addition, on
November 16, 2017, the Argentine government, the governors of
the majority of Argentine provinces, including the Province of
Buenos Aires, and the Head of Government of the City of Buenos
Aires entered into an agreement pursuant to which some guidelines
were established in order to harmonize the tax structures of the
different provinces and the City of Buenos Aires. Among other
commitments, the provinces and the City of Buenos Aires agreed to
gradually reduce the tax rates applicable to stamp tax and turnover
tax within a five-year period and withdraw their judicial claims
against the Argentine government in connection with the federal
co-participation regime. In exchange for this, the Argentine
government, among other commitments, agreed to (i) compensate
the provinces and the City of Buenos Aires (provided they enter
into the agreement) for the effective reduction of its resources in
2018, resulting from the proposed elimination of section 104 of Law
No. 20,628 and amendments (the “Income Tax Law”),
quarterly updating such compensation in the following years, and
(ii) issue a 11-year bond where funds generate services for
Ps.5,000 million in 2018 and Ps.12,000 every year starting
from 2019, to be distributed among all the provinces, with the
exception of the Province of Buenos Aires and the City of Buenos
Aires, according to the effective distribution coefficients
resulting from the federal co-participation regime. The provincial
governments which took part in this agreement have committed to
file, within the next 30 days after the execution of the agreement,
the necessary draft bills for its implementation and authorize
their respective executive branches to ensure its fulfilment. This
agreement shall only be effective in those provinces where the
respective legislative branches have passed it. In this sense, on
December 22, 2017, the Argentine Congress passed the projects
on fiscal consensus and fiscal liability (“
Consenso Fiscal
” and
“
Responsabilidad
Fiscal,
” respectively), with some amendments. As of
the date of this annual report, all of the provinces and the City
of Buenos Aires, except for provinces of San Luis and La Pampa,
have entered into this agreement.
35
●
Increase in public transportation
tariffs.
As a part of a comprehensive program for public
transportation tariffs, during 2018, Argentina implemented several
increases in the tariffs for public transportation, as well as a
new multi-disciplinary system for riders utilizing multiple public
transport platforms.
●
IMF Agreement
. On June 7, 2018,
Argentina and the IMF announced that a technical agreement on a
U.S.$50 billion three-year stand-by agreement was reached, which
was approved on June 20, 2018, by the IMF’s Executive Board
(the “
IMF
Agreement
”). On June 21, 2018, the IMF made the first
disbursement under the IMF Agreement in an amount of U.S.$15
billion. Notwithstanding the foregoing, on September 26, 2018,
Argentina announced that a revised technical agreement with the IMF
was reached, which underpinned the IMF Agreement. The revised
agreement with the IMF was approved by the IMF’s Executive
Board on October 26, 2018 (the “
Revised Agreement
” and
together with the IMF Agreement, the “
2018 IMF Agreement
”), and
includes an increase in the IMF’s available funds by U.S.$19
billion through the end of 2019 and brings the total amount
available under the program to U.S.$57.1 billion through 2021. On
October 30, 2018, the Argentine government received the first
disbursement under the Revised Agreement from the IMF in an
aggregate amount of U.S.$5.7 billion. In addition, the funds
available under the 2018 IMF Agreement will no longer be treated as
precautionary, as the authorities have indicated that they intend
to use IMF financing for budget support. In return, the Argentine
government covenanted to make progress in order to achieve fiscal
balance by 2019, bringing the primary deficit to 0% of GDP in that
year and surplus of 1% in 2020 and, in turn, the Central Bank will
not be able to raise the base monetary policy until June 2019.
Moreover,
as of October 1, 2018, the BCRA introduced an
exchange rate band. The peso’s exchange rate with the U.S.
Dollar was allowed to fluctuate between Ps.34.00 and Ps.44.00 per
US$1.00 (range that was adjusted daily at an annual rate of 3%
until December 2018, and for the first quarter of 2019, is adjusted
daily at an annual rate of 2%) without the BCRA’s
intervention. On April 29, 2019, the Monetary Policy Counsel
(Comité de Política Monetaria) of the Central Bank (the
“COPOM”) decided to introduce changes to the monetary
policy, with an aim to reducing volatility in the foreign exchange
market. According to the new scheme: (i) if the exchange rate is
between Ps. 39.755 and Ps. 51.488, the Central Bank may intervene,
subject to market conditions, in the foreign exchange market and
sell U.S. dollars in the market, and (ii) if
the
exchange
rate is above Ps. 51.488, the Central Bank will sell foreign
currency for up to 250 million U.S. dollars daily. Also, the
Central Bank could decide to perform additional interventions. The
Argentine pesos resulting from such sales will be discounted from
the monetary base. The COPOM also confirmed that the Central Bank
will not intervene until June 2019 in the foreign exchange market
if the exchange rate decreases below Ps.
39.755.
●
Ministries Reforms
. On
September 3, 2018, President Macri announced that the number of
ministries would be reduced from 19 to 10.
●
Asset Seizure Decree
: On January 22,
2019, the Macri administration published the Decree No.62/2019
related to asset seizure (Extinción de Dominio), which allows
courts to seize assets found related to acts of corruption or drug
smuggling, whether the defendant has been found guilty or not
before a criminal court. The aforementioned Decree also includes
provisions for the creation of a special Ombudsman's Office to
monitor future asset seizures.
●
Resolution SRRyME No. 1/19
: By means of
this resolution, the Secretary of Renewable Resources and Electric
Market of the National Ministry of Economy modified the
remuneration scheme (for capacity and energy) applicable to
Authorized Generators (electricity generators which do not have
contracts in the term market in any of its modalities) acting in
the WEM. According to the recitals of this resolution, the
remuneration scheme set forth therein aims at being applied
transitorily, until the gradual definition and implementation of
regulatory mechanisms oriented at achieving an autonomous,
competitive and sustainable operation that allows the free
contracting between offer and demand, and a technical, economical
and operational functioning that makes it possible to integrate the
different generation technologies to ensure a trustworthy system at
a minimal cost. For further detail, please see “Item 4.B.
Business Overview—The Argentine Electric Power
Sector—Remuneration Scheme—The Current Remuneration
Scheme”.
Pursuant to
Resolution No. 522/16, the ENRE ordered a public hearing to be held
to evaluate the proposals for the full tariff review filed by
EDENOR and EDESUR for the period beginning January 1, 2017 to
December 31, 2021. The hearing was held on October 28, 2016 and,
following such hearing, on January 31, 2017, the ENRE issued
Resolution No. 63/17, by virtue of which such administrative
authority approved the tariffs to be applied by EDENOR. Similarly,
Resolution No. 64/17 approved EDESUR
’
s tariffs. With regards to
transmission tariffs, seven public hearings were held pursuant to
Resolutions Nos. 601/16, 602/16, 603/16, 604/16, 605/16, 606/16,
607/16 of the ENRE. In such public hearings the tariff proposals
filed by transmission companies Transener S.A, Distrocuyo S.A.,
Transcomahue S.A., Ente Provincial de Energía de
Neuqu
é
n, Transba S.A.,
Transnea S.A., Transnoa S.A., and Transpa S.A. for the period
beginning January 1, 2017 to December 31, 2021 were evaluated.
Pursuant to Resolutions Nos. 66/17, 68/17, 69/17, 71/17, 73/17,
75/17, 77/17 and 79/17, the ENRE approved the new applicable
tariffs of such companies.
36
See “Item
3.D. Risk Factors— Risks Relating to Argentina—Economic
and political developments in Argentina, including the upcoming
presidential and congressional elections, and future policies of
the Argentine government, may affect the economy, as well as the
operations of the energy industry, including the operations of
Central Puerto.”
Recent Developments
Brigadier López Plant - National and International Public Bid
No. CTBL 01/2018 (the “IEASA Bid”) called by
Integracion Energética Argentina S.A.
(“IEASA”)
On February 27,
2019, Central Puerto was notified that it had been awarded the
IEASA Bid called by IEASA to acquire the Central
Termoeléctrica Brigadier López power plant (the
“
Brigadier López
Power Plant”) and certain assets and liabilities relating to
such plant.
Pursuant to the
terms of the IEASA Bid, Central Puerto would be subject to a US$ 10
million penalty if it failed to honor its obligations under the
terms and conditions of the IEASA Bid. Regarding this, we provided
IEASA with a US$ 10 million first demand guarantee for the
maintenance of the offer, which guarantee expires on May 31, 2019
and entitles IEASA to execute it if we fail to honor our
obligations under the terms and conditions of the IEASA Bid. If
IEASA does not execute the first demand guarantee within 7 days
after its expiration, such first demand guarantee will
terminate.
In addition, the
acquisition of the Brigadier López Power Plant was subject to
the satisfaction of certain conditions that had to occur prior to
April 1, 2019. As of the date of this annual report, the
acquisition of the Brigadier López Power Plant could not be
consummated given that certain conditions to the IEASA Bid were not
satisfied, such as the proper issuance by CNV of an unconditional
authorization to the terms of the amended financial trust agreement
relating to the Brigadier Lopez Power Plant. In addition, there is
a discrepancy between Central Puerto and IEASA regarding the
satisfaction of certain conditions upon which closing of the
acquisition of the Brigadier López Power Plant was subject to.
Also, Resolution SRRyME N° 1/2019 adversely affected our
ability to obtain financing in connection with the acquisition of
the Brigadier Lopez Power Plant. As of the original closing date,
April 1, 2019, certain of the conditions to closing of the
acquisition had not been satisfied, and an extension of such
closing date was necessary. However, Central Puerto and IEASA
failed to agree on such extension. On April 26, 2019, Central
Puerto duly notified IEASA of such failure to agree on an
extension.
Borrowing from KFW
On March 26, 2019
the Company, as borrower, entered into a loan agreement with
Kreditanstalt für Wiederaufbau (“KfW”) for an
amount of US $ 56,000,000 to finance the acquisition of two SGT-800
gas turbines (with a power of 89 MW) and equipment from Siemens
Industrial Turbomachinery AB, Sweden, (“Siemens
Sweden”) and related services from Siemens S.A., Argentina,
(“Siemens Argentina”) for the Luján de Cuyo
project. To secure our obligations under the loan agreement with
KfW, we have agreed to maintain a cash reserve account pledged in
favor of KfW. The loan agreement also contains other customary
covenants and events of default for facilities of this type, and is
governed by German law. As of the date of this annual report, we
are working to satisfy all the conditions prior to the disbursement
of this loan.
Collection from CVO Agreement
Effective as of
March 20, 2018, CAMMESA granted the CVO Commercial Approval in the
WEM, as a combined cycle, of the thermal plant Central Vuelta de
Obligado, which entitled us to receive the collection of the trade
receivables under the CVO Agreement. A PPA between the CVO Trust
and CAMMESA, through which the CVO Trust makes energy sales and,
consequently, receives the cash flow to pay the trade receivables,
had to be signed in order to start the collections.
The PPA agreement
was signed on February 7, 2019, with retroactive effect to March
20, 2018.
As a result, the
original amortization schedule from the CVO Agreement is in full
force and effect.
The unpaid
installments corresponding to the March-December 2018 period add up
to US$ 78.15 million (including VAT, corresponding to installments
1 to 10). As of the day of this annual report, we continue in
negotiations with CAMMESA to collect such unpaid amounts as soon as
possible, plus the accrued interest between each due date and the
effective payment date.
Despite the
referred unpaid installments, as of the date of this annual report,
we received the payment related to January and February 2019
(corresponding to installments 11 and 12, respectively) pursuant to
the CVO Agreement’s original disbursement schedule, at the
exchange rate of the last date of each month, on its respective due
dates, in March and April 2019, respectively.
We are also
entitled to receive the foreign exchange difference accrued for the
CVO trade receivables, between the last date of the month of each
installment, and the day prior to the due date of such installment.
These amounts should be paid one day after the due date of the
payment of each CVO installment. However, for the January 2019 the
CVO installment, with due date on March 14, 2019, the foreign
exchange difference was payed on April 5, 2019. The foreign
exchange difference on the February 2019 CVO installment has not
been collected as of the date of this annual report.
37
Shareholders
General Meeting
On March 11, 2019,
the Board of Directors of Central Puerto convened an Ordinary and
Extraordinary Shareholders General Meeting for April 30, 2019, to
discuss the following items of the agenda: (i) Appointment of two
shareholders to execute the minute; (ii) Consideration of the
fiscal year ended on December 31, 2018; (iii) Consideration of the
result of the exercise and the rest of the results not assigned and
the proposal of the Board of Directors; (iv) Consideration and
approval of the payment of the Profit Sharing Bonds for Personnel
(
Bono de
Participación
) provided in articles 12 and 13 of the
by-laws; (v) Consideration of the performance of the Board of
Directors of the Company in the fiscal year ended on December 31,
2018; (v) Consideration of the performance of the Supervisory
Committee of the Company in the fiscal year ended on December 31,
2018.; (vi) Consideration of the remunerations of the members of
the Board of Directors of the Company for the fiscal year ended on
December 31, 2018; (vi) Consideration of the advance payment of
fees to the Board of Directors for the fiscal year that will end on
December 31, 2019; (vii) Consideration of the remuneration of the
members of the Supervisory Committee of the Company regarding to
the fiscal year ended on December 31, 2018, and the fees regime for
the fiscal year that will end on December 31, 2019; (viii)
Determination of the number of members of the Alternate Board of
Directors, and appointment of the members of the Board of Directors
regular and alternates. Continuity of the current president until
the appointment to be made by the Company’s Board of
Directors; (ix) Appointment of the members of the Supervisory
Committee, regular and alternate, for the fiscal year that will
close on December 31, 2019; (x) Consideration of the remuneration
of the accountant of the Company, regarding to the annual
accounting documentation for the fiscal year 2018; (xi) Appointment
of the regular and alternate accountant for the fiscal year that
will end on December 31, 2019; (xii) Approval of the Annual Budget
for the operation of the Audit Committee; and (xiii) Granting of
authorizations.
Central Puerto S.A.
is incorporated as a sociedad anónima under the laws of
Argentina. Our principal executive offices are located at Avenida
Thomas Edison 2701, C1104BAB Buenos Aires, Republic of Argentina.
Our telephone number is +54 (11) 4317-5900.
We were
incorporated pursuant to Executive Decree No. 122/92 on February
26, 1992. We were formed in connection with the privatization
process involving
Servicios Eléctricos del
Gran Buenos Aires
(
“
SEGBA
”
) in which SEGBA
’
s electric power generation,
transportation, distribution and sales activities were privatized.
We were registered with the Public Registry of Commerce of the City
of Buenos Aires on March 13, 1992 and created for a term of 99
years from the date of such registration.
In April 1992,
Central Puerto, the consortium-awardee, took possession over
SEGBA
’
s Central Nuevo
Puerto (
“
Nuevo
Puerto
”
) and Central
Puerto Nuevo (
“
Puerto
Nuevo
”
) plants, and we
began operations. In November 1999, the Puerto combined cycle
plant, which was built on lands owned by Nuevo Puerto in the City
of Buenos Aires, started to operate. In 2001, Central Puerto was
acquired by the French company, Total S.A. At the end of 2006,
Sociedad Argentina
de Energía S.A.
(
“
SADESA
”
) acquired a controlling interest in
Central Puerto.
Our shares are
listed on the Argentine stock market Bolsas y Mercados Argentinos
S.A. (the “BYMA”) and, since February 2, 2018, have
been listed on the NYSE under the symbol
“
CEPU.
”
The SEC maintains
an internet site that contains reports and other information
regarding issuers who, like us, file electronically with the
SEC.
The
address of that website is
http://www.sec.gov
.
Central Puerto routinely posts important information for investors
in the Investor Relations support section on its website,
www.centralpuerto.com
.
From time to time, Central Puerto may use its website as a channel
of distribution of material Company information. Accordingly,
investors should monitor Central Puerto’s Investor Support
website, in addition to following the Company’s press
releases, SEC filings, public conference calls and webcasts. The
information contained on, or that may be accessed through, the
Company’s website is not incorporated by reference into, and
is not a part of, this annual report.
38
The below chart
illustrates the development of our company through the years and
the important milestones for Central Puerto and for the companies
that were absorbed in the 2014 Merger and 2016 Merger:
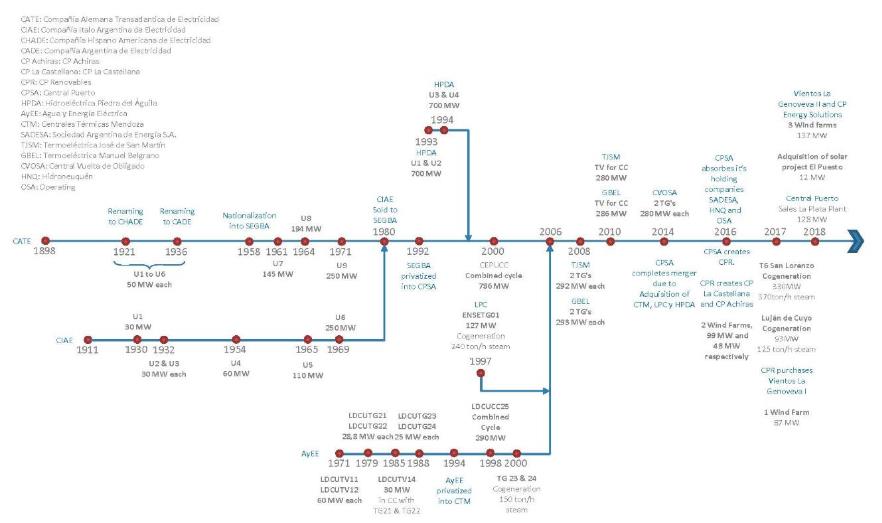
The 2014 Merger
On October 1, 2014,
we merged with three operating companies under the common control
of SADESA: (i) HPDA, (ii) CTM and (iii) LPC. The purpose of the
merger was to optimize operations and achieve synergies among the
businesses. As a result of the merger, we increased our share
capital from Ps.88,505,982 to Ps.199,742,158. We refer to this
merger as the
“
2014
Merger.
”
Following the
2014 Merger, each of HPDA, CTM and LPC were dissolved.
Prior to the 2014
Merger, we owned and operated three thermal generation plants for
electric power generation located within one complex in the City of
Buenos Aires. Our Nuevo Puerto and Puerto Nuevo thermal generation
plants are equipped with five steam turbine-generator units in the
aggregate and have an installed capacity of 360 MW and 589MW,
respectively. The third plant, the Puerto combined cycle plant has
two gas turbines, two heat recovery steam generators and a steam
turbine, and it has a total installed capacity of 765 MW. Prior to
the 2014 Merger, we had a total installed capacity of 1,714 MW and
were already one of the major SADI electric power
generators.
As a result of the
2014 Merger, we added the Luj
á
n de Cuyo plant, the La Plata plant,
which, effective as of January 5, 2018, we sold to YPF EE (for
further information see
“Item
4.A. History and development of the Company—
La Plata
Plant Sale
”
), and the
Piedra del
Á
guila
hydroelectric complex.
As of December 31,
2018, we owned and operated five thermal generation plants, one
hydroelectric generation plant and two wind farms, for the
generation of electric power across six complexes in Argentina. We
had a combined installed capacity of 3,810 MW and have
significantly improved our position as a major SADI electric power
generator, producing approximately 17.0% of the energy generated by
private sector SADI generators in 2018.
Hidroeléctrica Piedra del Águila S.A. (HPDA)
HPDA was a
sociedad
anónima
(corporation) incorporated in 1993 that
operated the Piedra del
Á
guila hydroelectric complex with an
installed capacity of 1,440MW since it started commercial operation
in 1993. HPDA entered into the HPDA Concession Agreement (as
defined below) to operate and maintain the Piedra del
Á
guila hydroelectric complex, and the
HPDA Concession Agreement was assigned to us during the 2014
Merger. For more information regarding the HPDA and the HPDA
Concession Agreement, see
“—
Electricity Generation from
our Hydroelectric Complex
—
Piedra del
Á
guila.
”
HPDA
’
s controlling shareholder was
Hidroneuqu
é
n S.A.
(
“
HNQ
”
), a company that was under the
control of the SADESA group, which held a 59.00% interest. The
remaining shareholders were: (i) the Argentine government (26.00%
interest), (ii) the Province of Neuqu
é
n (13.00% interest) and (iii)
HPDA
’
s Employee Stock
Ownership Program (2.00% interest). HPDA held 21.00% of the shares
of CVOSA, the company that operates the thermal power plant in
Timbues. Following the 2014 Merger, CVOSA became our
subsidiary.
39
Centrales Térmicas Mendoza S.A. (CTM)
CTM was a
sociedad
anónima
(corporation) incorporated in 1993 focused on
electric power generation and steam production. Before the 2014
merger, CTM was focused on two primary activities: electric power
generation and steam production. CTM owned the Luj
á
n de Cuyo plant located in
Luj
á
n de Cuyo in the
Province of Mendoza, which began commercial operation in 1971 with
the installation of its first two steam turbines, had an installed
capacity of 509 MW and was the top producer of electric power in
the Cuyo region. For more information regarding CTM
’
s operations that were transferred
to us in the 2014 Merger, see
“—
Electricity Generation from
our Thermal Generation Plants
—
Luj
á
n de Cuyo plant.
”
CTM
’
s controlling shareholder was
Operating S.A. (
“
OSA
”
), a company that was under the
control of the SADESA group and which held a 94.10% interest. The
other shareholder was Empresa Mendocina de Energía SAPEM,
which held the remaining 5.89% interest. CTM held a minority
interest in CVOSA, representing 9.36% of its capital
stock.
La Plata Cogeneración S.A. (LPC)
LPC was a
sociedad
anónima
(corporation) incorporated originally under the
name CMS Ensenada S.A. in 1994. LPC
’
s principal business activities were
electric power generation and steam production. On August 23, 1994,
LPC entered into a
unión transitoria de
empresas
(similar to a joint venture) with Empresa de
Energía y Vapor S.A. In March 1997, LPC acquired Empresa de
Energía y Vapor S.A. LPC owned the La Plata plant, which has
an installed capacity of 128 MW and started its operations in 1997.
The La Plata plant is installed on property owned by
YPF
’
s La Plata refinery,
and it is the first co-generation plant commissioned as such within
the WEM. For more information regarding LPC
’
s operations that were transferred
to us in the 2014 Merger, see
“—
Electricity Generation from
our Thermal Generation Plants
—
La Plata Plant.
”
LPC
’
s controlling shareholder was OSA,
which held a 96.69% interest. The other shareholder was Proener
S.A.U., which held the remaining 3.31% interest. LPC held minority
interests in (i) CVOSA, representing 9.36% of its stock capital,
(ii) Central Puerto, representing 14.03% of its stock capital, and
(iii) OSA, representing 3.21% of its stock capital.
Effective as of
January 5, 2018, we sold the La Plata plant to YPF EE. For further
information, see “
Item 4.A.
History and development of the Company
—La Plata Plant
Sale”).
Distribuidora de Gas Cuyana S.A. (DGCU) and Distribuidora de Gas
del Centro S.A. (DGCE)
In addition, on
January 7, 2015, acting individually, but simultaneously with other
investors, we acquired non-controlling equity interests in DGCU
(whose shares are listed on BYMA) and DGCE. Taking into account
direct and indirect interests, we acquired (i) a 22.49% equity
stake in DGCU and (ii) a 39.69% equity stake in DGCE.
DGCU
DGCU was
incorporated in 1992 by the Argentine government as part of the
privatization of Gas del Estado S.E. (
“
GES
”
). The executive branch enacted
Executive Order No. 2,453 in December 1992, whereby it granted a
utility license to DGCU to distribute Natural gas through the
networks in the provinces of Mendoza, San Juan and San Luis, for a
term of 35 years from the date of taking possession (which occurred
on December 28, 1992) with an option to extend it for ten
additional years.
In December 1992, a
transfer agreement was executed to transfer 60.00% of
DGCU
’
s shares. The
agreement was entered into among the Argentine government, GES, the
Province of Mendoza and IGCU
,
which formed the
consortium that became the successful bidder in the bidding process
at such time. On such date, GES transferred to DGCU the assets used
in the licensed utility service, net of liabilities, as an
irrevocable capital contribution pursuant to Executive Orders No.
1,189/92 and 2,453/92, and DGCU took possession of the facilities
and commenced operations.
As of the date of
this annual report, IGCU holds a 51.00% interest in DGCU, and we
hold a 44.10% interest in IGCU. Therefore, we indirectly hold a
22.49% equity interest in DGCU.
DGCE
DGCE was
incorporated in 1992 by the Argentine government as part of the
privatization of GES. The executive branch enacted Executive Order
No. 2,454/92 in December 1992, whereby it granted a utility license
to DGCE to distribute natural gas through the networks in the
provinces of C
ó
rdoba,
Catamarca and La Rioja for a term of 35 years from the date of
taking possession (which occurred on December 28, 1992) with an
option to extend it for ten additional years.
40
In December 1992, a
transfer agreement was executed to transfer 60.00% of
DGCE
’
s shares. The
agreement was entered into among the Argentine government, GES and
IGCE, which formed the consortium that became the successful bidder
in the bidding process at such time. On such date, GES. transferred
to DGCE the assets used in the licensed utility service, net of
liabilities, as an irrevocable capital contribution pursuant to
Executive Orders No. 1,189/92 and 2,454/92, and DGCE took
possession of the facilities and commenced operations.
As of the date of
this annual report, we hold a 44.10% interest in IGCE and a direct
17.20% interest in DGCE. Therefore, we hold, both directly and
indirectly, a 39.69% in DGCE.
IGCE is the
controlling shareholder of Energía Sudamericana S.A.
(
“
ESSA
”
), which is a private company not
listed in any commercial stock exchange, and which prepares its
financial statements in accordance with Argentine GAAP. However,
there are no relevant differences between Argentine GAAP applicable
to ESSA and the IFRS that we apply to our financial statements.
ESSA
’
s principal activity
is the sale of natural gas. We also own a 2.45% direct equity
interest in ESSA.
Ecogas had a gas
distribution network covering 31,637 km and served approximately
1,330,923 customers as of December 31, 2018. In 2017, Ecogas
distributed an average of 14.21 million cubic meters of natural gas
per day; and in 2018, Ecogas distributed an average of 13.80
million cubic meters of natural gas per day. This volume of
distribution represented approximately 15.70% and 14.21% of the gas
delivered by all the distribution companies in Argentina in 2018
and in 2017, respectively, according to data from
Ecogas.
Potential sale of our interes in Ecogas
At a meeting of our
shareholders on December 16, 2016, in accordance with the strategic
objective of focusing on assets within the energy industry, the
shareholders considered a potential sale of our equity interests in
Ecogas to Magna Energía S.A., but voted to postpone the
decision.
We are currently
assessing various strategic opportunities regarding DGCU and DGCE,
including a possible partial or total sale of our equity interest
in them. On January 26, 2018, the shareholders of DGCE approved the
admission of DGCE to the public offering regime in Argentina. On
March 14, 2018, the Company authorized the offer of up to
10,075,952 common class B shares of DGCE with a face value of one
Argentine peso (Ps. 1) per share, in a potential public offering
authorized by the CNV, subject to market conditions. This
authorization was encompassed within the February 23, 2018
authorization of the Board of Directors of Central Puerto, for the
sale of up to 27,597,032 common B shares of DGCE. As of the date of
this annual report, we continue to evaluate this
strategy.
Control Acquisition by Tender Offer of Third Parties in respect of
DGCU shares
On January 7, 2015,
the Company acquired 49% of interests in IGCU, the parent company
of DGCU and, as a result, the Company held indirectly 24.49% of
DGCU
’
s capital stock.
Following this acquisition, Magna, RPBC , Central Puerto and Mr.
Federico Tomasevich (jointly, the
“
Offerors
”
) resolved to participate
proportionally in the tender offer for DGCU
’
s shares with voting rights that
were publicly listed on the BYMA in order to acquire the remaining
outstanding shares of DGCU that the Offerors did not already own.
On October 30, 2015, the board of directors of the CNV approved the
tender offer. Upon termination of the offer in January 2016, since
no acceptances were tendered, no shares were acquired in this
tender offer. As of the date of this annual report, we own a 44.10%
interest in IGCU and, as a result, we indirectly hold a 22.49%
equity interest in DGCU. For further information on the potential
merger of IGCE and IGCU, see “—Preliminary Merger
Agreement between IGCE, IGCU, RPBC and MAGNA.”
Preliminary Merger Agreement between IGCE, IGCU, RPBC and
MAGNA
On March 28, 2018,
the Board of Directors of IGCE, IGCU, RPBC Gas S.A.
(“RPBC”) and Magna Inversiones S.A.
(“Magna”), approved the Preliminary Merger Agreement
(
Compromiso Previo de
Fusión
) of the aforementioned companies (the
“Merger”), in which IGCE will act as the surviving
company and IGCU, RPBC and Magna, as absorbed
companies.
On July 23, 2018,
the merging companies’ resolutions resolved to (i) approve
the use of the balance sheets of the merging companies as of
December 31, 2017, as special merger balances; (ii) approve the
General Consolidated Special Balance Sheet of Merger as of December
31, 2017; (iii) approve the merger of the merging companies, ad
referendum of the approval of the National Gas Regulation Entity
(Ente Nacional Regulador del Gas) (ENARGAS); (iv) ratify the
Preliminary Merger Agreement; (v) approve the exchange ratio of the
merger; (vi) approve the early dissolution without liquidation of
MAGNA, RPBC and IGCU, ad referendum of the approval of ENARGAS; and
(vii) authorize the President or the Vice President of the merging
companies, in case of absence or impediment of the President, to
agree the text and execute the final merger agreement.
41
On January 11,
2019, ENARGAS issued a resolution not granting authorization for
the Merger under the terms agreed among the entities and, on
January 25, 2019, the regulated companies, IGCU and IGCE, appealed
the decision before the Energy Government Secretariat
(Secretar’a de Gobierno de Energía).
The 2016 Merger
On January 1, 2016,
we merged with three holding companies: (i) SADESA, (ii) HNQ and
(iii) OSA. The purpose of the merger was to reorganize and optimize
our corporate structure. As a result of the merger, we reduced our
share capital from Ps.199,742,158 to Ps.189,252,782. We refer to
this merger as the
“
2016
Merger.
”
Following the
2016 Merger, each of SADESA, HNQ and OSA were
dissolved.
SADESA was a
holding company with control over Central Puerto, HNQ and OSA that,
prior to the 2016 Merger, held a 26.18% direct interest in Central
Puerto, a 63.73% interest in HNQ, a 96.79% interest in OSA and a
5.10% direct interest in Proener S.A.U. HNQ was a holding company
that prior to the 2016 Merger held a 17.74% interest in Central
Puerto. OSA was a holding company that prior to the 2016 Merger
held a 30.39% interest in Central Puerto, a 94.90% interest in
Proener S.A.U. and a 20.00% interest in TGM. TGM is dedicated to
the operation, maintenance and commercialization of an
international gas pipeline between Argentina and
Brazil.
La Plata Plant Sale
On December 20,
2017, YPF EE accepted our offer to sell the La Plata plant for a
total sum of US$31.5 million (without VAT), subject to certain
conditions. On February 8, 2018, after such conditions were met,
the plant was transferred to YPF EE, including generation assets,
personnel and agreements related to the operation and/or
maintenance of the La Plata plant’s assets, with effective
date January 5, 2018. Consequently, as of December 31, 2017, the La
Plata plant was classified as a disposal group held for sale and
its respective results were classified for the years ended December
31, 2018, 2017 and 2016 as discontinued operations. See“Item
5.A. Operating Results—Factors Affecting our Results of
Operations—Sale of the La Plata Plant” and Note 21 to
our audited consolidated financial statements.
The contract
between us and Transportadora de Gas del Sur (“TGS”)
for the natural gas transportation capacity has remained effective
after the sale of the La Plata plant. Pursuant to the terms of our
agreement with YPF, we resell our gas transportation capacity to
YPF through the resale system established by Resolution ENARGAS
419/97. The resale under such system is open to third parties and
consequentially does not ensure that YPF will receive the gas
transportation capacity needed to operate the La Plata plant.
Therefore, on January 25, 2018, we requested to be registered with
the Ministry of Energy and the ENARGAS as a natural gas seller to
permit the resale of our gas transportation capacity to YPF without
the risk of intervention from interested third parties. On July 20,
2018, we were effectively registered as natural gas
sellers.
Overview
We are one of the
largest private sector power generation companies in Argentina, as
measured by generated power, according to data from CAMMESA. In the
year ended December 31, 2018, we generated a total of 14,479 net
GWh of power, representing approximately 17.00% of the power
generated by private sector generation companies in the country
during such period, according to data from CAMMESA. We had an
installed generating capacity of 3,810 MW as of December 31, 2018.
These figures exclude the La Plata plant which, effective as of
January 5, 2018, we sold the La Plata plant to YPF EE. For further
information, see “
Item 4.A.
History and development of the Company
—La Plata Plant
Sale”).
We have a
generation asset portfolio that is geographically and
technologically diversified. Our facilities are distributed across
the City of Buenos Aires and the provinces of Buenos Aires,
Córdoba, Mendoza, Neuqu
é
n and Río Negro. We use
conventional and renewable technologies (including hydro power) to
generate power, and our power generation assets include combined
cycle, gas turbine, steam turbine, co-generation, hydroelectric,
and wind turbines.
The following table
presents a brief description of the power plants we owned and
operated as of December 31, 2018.
42
|
Power
plant
|
Location
|
Installed
capacity (MW)
|
Technology
|
|
Puerto
Nuevo
(1)
|
City of Buenos
Aires
|
589
|
Steam
turbines
|
|
Nuevo
Puerto
(1)
|
City of Buenos
Aires
|
360
|
Steam
turbines
|
|
Puerto combined
cycle
(1)
|
City of Buenos
Aires
|
765
|
Combined
cycle
|
|
Luján de Cuyo
plant
|
Province of
Mendoza
|
509
|
Steam turbines, gas
turbines, two cycles and mini-hydro turbine generator,
producing electric power and steam
|
|
Piedra del Aguila
plant
|
Piedra del Aguila
(Limay River, bordering provinces of Neuquén and Río
Negro)
|
1,440
|
Hydroelectric
plant
|
|
La Castellana I
wind farm
(2)
|
Province of Buenos
Aires
|
99
|
Wind
turbines
|
|
Achiras I wind
farm
(2)
|
Province of
Córdoba
|
48
|
Wind
turbines
|
|
Total
|
|
3,810
MW
|
|
(1)
Part of the
“
Puerto
Complex
”
as defined in
“
Business.
”
(2)
La Castellana I and
Achiras I wind farms are owned by CP La Castellana S.A.U. and CP
Achiras S.A.U., respectively, both of which are fully owned
subsidiaries of CP Renovables S.A. As of the date of this annual
report, we own a 70.19% interest in CP Renovables. See “Item
4.B. Business Overview
—
Our Subsidiaries”
In addition, we
participate in an arrangement known as the FONINVEMEM, which is
managed by CAMMESA at the instruction of the Ministry of Energy.
The prior Argentine government
’
s administration created the
FONINVEMEM with the purpose of repaying power generation companies,
like us, the existing receivables for electric power sales between
2004 and 2011 and funding the expansion and development of new
power capacity.
As a result of our
participation in this arrangement, we receive monthly payments for
certain of our outstanding receivables with CAMMESA. In addition,
we have an equity interest in the companies that operate the
FONINVEMEM
’
s new combined
cycle projects, which will be entitled to take ownership of the
combined cycle projects on a date ten years from the date of their
initial operation. Under this arrangement, we began collecting our
outstanding receivables from electric power sales from January 2004
through December 2007 from CAMMESA, denominated in U.S. dollars,
over the ten-year period once the TJSM and TMB combined cycles
became operational in March 2010.
In addition,
effective as of March 20, 2018, CAMMESA granted the CVO Commercial
Approval in the WEM of units TG11, TG12 and TV10, as a combined
cycle of the thermal plant Central Vuelta de Obligado, located in
the Province of Santa Fe, with an installed capacity of 816 MW of
gross capacity and 778.884 MW of net power output to the grid. As a
consequence of the CVO Commercial Approval and pursuant to the
“Agreement for Project Management and Operation, Increase of
Thermal Generation Availability and Adaptation of Remuneration for
Generation 2008-2011” executed on November 25, 2010 among the
Secretariat of Energy and Central Puerto along with other electric
power generators (the “CVO Agreement”), we are entitled
to collect LVFVD accrued between 2008 and September 2010, after
adding the interest established by Art. 3 of Resolution SE 406/03
and converted into US dollars at the exchange rate of the date of
the CVO Agreement. Pursuant to the Agreement for LVFVD during
2008-2011, this capital accrues interest, starting from the date of
the CVO Agreement (i.e., November 25, 2010), at 30-day LIBOR plus
5.00%. Additionally, certain receivables that accrued after
September 2010 and were also included in the CVO Agreement, accrue
interest at 30-day LIBOR plus 5.00%, starting from the due date of
each of these receivables.
The total estimated
amount due to us under the CVO Agreement is US$548 million
(including VAT), plus accrued interests after the CVO Commercial
Approval, which will be collected in 120 equal, consecutive,
monthly installments, starting from the date of CVO Commercial
Approval, accruing interest at 30-day LIBOR plus 5.00% interest. As
a result of the conversion of the LVFVD into US dollars detailed in
the previous paragraph, we had a one-time income, before income
tax, of Ps. 11,017 million, measured in current unit as of December
31, 2018 (or Ps. 7,959 million, measured in nominal terms), at an
exchange rate of Ps. 20.17 to US$1.00, which was the spot bid
exchange rate reported by the Banco de la Naci
ó
n Argentina for wire transfers
(
divisas
)
as of March 20, 2018, which was recognized by us in the
consolidated income statement for the year ended December 31, 2018)
under “CVO receivable update”. See
“Item 4.B. Business
Overview—
Our Competitive Strengths
—
Strong cash flow generation,
supported by U.S. dollar denominated cash flows
”
for more information on FONINVEMEM
and on the Commercial Approval of the thermal plant Central Vuelta
de Obligado.
Effective as of
March 20, 2018, CAMMESA granted the CVO Commercial Approval in the
WEM, as a combined cycle, of the thermal plant Central Vuelta de
Obligado, which entitled us to receive the collection of the trade
receivables under the CVO Agreement. A PPA between the CVO Trust
and CAMMESA, through which the CVO Trust makes energy sales and,
consequently, receives the cash flow to pay the trade receivables,
had to be signed in order to start the collections.
The PPA agreement
was signed on February 7, 2019, with retroactive effect to March
20, 2018.
As a result, the
original amortization schedule from the CVO Agreement is in full
force and effect.
The unpaid
installments corresponding to the March-December 2018 period add up
to US$ 78.15 million (including VAT, corresponding to installments
1 to 10). As of the day of this annual report, we continue in
negotiations with CAMMESA to collect such unpaid amounts as soon as
possible, plus the accrued interest between each due date and the
effective payment date.
43
Despite the
referred unpaid installments, as of the date of this annual report,
we received the payment related to January and February 2019
(corresponding to installments 11 and 12, respectively) pursuant to
the CVO Agreement’s original disbursement schedule, at the
exchange rate of the last date of each month, on its respective due
dates, in March and April 2019, respectively.
We hold equity
interests in the companies that operate the following FONINVEMEM
thermal power plants:
|
Power
plant
|
Location
|
Installed
capacity (MW)
|
Technology
|
% Interest in
the operating company
(1)
|
|
San Martín
|
Timbues, Province
of Santa Fe
|
865
|
Combined cycle
plant, which became operational in 2010
|
30.8752%
|
|
Manuel
Belgrano
|
Campana, Province
of Buenos Aires
|
873
|
Combined cycle
plant, which became operational in 2010
|
30.9464%
|
|
Vuelta de
Obligado
|
Timbues, Province
of Santa Fe
|
816
|
Combined cycle
plant, which became operational in March 2018
|
56.1900%
|
(1)
In each case, we
are the private sector generator with the largest ownership stake.
After ten years operating each company, all governmental entities
that financed the constructions of such plants will be incorporated
as shareholders of TJSM, TMB and CVOSA, our interests in TJSM, TMB
and CVOSA will be significantly diluted. See
“Item 3.D.
Risk Factors
—
Risks Relating to Our
Business
—
Our interests in
TJSM, TMB and CVOSA will be significantly diluted.
”
The following set
of graphs shows our total assets under the FONINVEMEM
program:
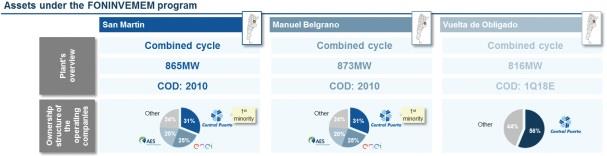
1
Enel includes Enel
Generaci
ó
n Costanera S.A.,
Central Dock Sud S.A. and Enel Generaci
ó
n El Choc
ó
n S.A.
Source: TJSM, TMB
and CVOSA
44
The following
graphic breaks down where our plants and power investments are
located in Argentina and their installed capacity:
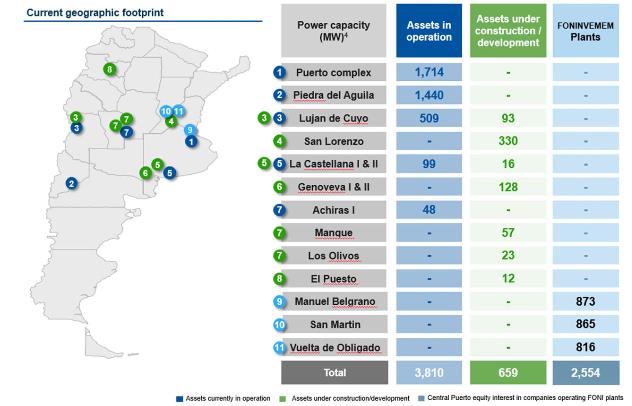
(1)
“
Assets under
construction/development
”
refers to (a) the wind farms La Castellana II, La Genoveva II,
Manque (previously a part of Achiras II), Los Olivos (previously a
part of Achiras II) and La Genoveva I, which are under construction
and are expected to be finished in the third quarter of 2019,
fourth quarter of 2019, first quarter of 2020 and second quarter of
2020, respectively; (b) the Luj
á
n de Cuyo co-generation unit, which
is under construction and is expected to be finished in the fourth
quarter of 2019; (c) the Terminal 6 Plant, which is under
construction and is expected to be finished in the second quarter
of 2020; and (d) the solar farm El Puesto, which is under
development and is expected to be finished in the third quarter of
2020.
(2)
“
FONINVEMEM Plants
”
refers to the plants
Jos
é
de San Martín,
Manuel Belgrano and Vuelta de Obligado that we expect to be
transferred from FONINVEMEM trusts to the operating companies,
TJSM, TMB and CVOSA, respectively, after the first ten years of
operation as a result of the FONINVEMEM program and other similar
programs. For a description of when we expect this transfer to
occur and other information, see
“Item 4.B.
Business
Overview
—
FONINVEMEM and
Similar Programs.
”
(3)
The graphic
excludes the La Plata plant which, effective as of January 5, 2018,
we sold to YPF EE. For further information, see “Item 4.A.
History and development of the Company—La Plata Plant
Sale.”
(4)
Power capacity
numbers have been rounded. The power capacity with respect to the
assets under construction/development is the awarded power
capacity.
Note: Numbers in
the map have been round-up.
In the year ended
December 31, 2018, we had revenues for continuing operations of
Ps.14.27 billion (or US$378 million).
In the year ended
December 31, 2018, we sold approximately 97.68% of our electric
energy sales (in MWh) under the Energía Base. Sales under
Energía Base accounted for 73.06% of our revenues in the year
ended December 31, 2018. In the year ended December 31, 2016,
tariffs under the Energía Base were paid by CAMMESA based on a
fixed and variable costs system which was determined by the former
Secretariat of Electric Energy pursuant to Resolution SE No. 95/13,
as amended. These tariffs were adjusted annually, denominated in
pesos, and remained unchanged throughout the year. From February
2017 to February 2019, the Energía Base was regulated by
Resolution SEE No. 19/17, which replaced Resolution SE No. 95/13,
as amended. Resolution SEE No. 19/17 increased the Energía
Base
’
s tariffs and
denominated them in U.S. dollars. Since March 2019, Energía
Base has been regulated by Resolution SRRyME No. 1/19, which
abrogated Resolution SE No. 19/17. Resolution SRRyME No. 1/19
decreased the tariffs for the energy and power. Under the
Energía Base, the fuel required to produce the energy we
generate is, generally, supplied by CAMMESA free of charge, and the
price we receive as generators, for sales not made under term
contracts, is determined by the Resolution SRRyME No. 1/19 without
accounting for the fuel CAMMESA supplies. Our compensation under
the Energía Base depends to a large extent on the availability
and energy output of our plants, and in the case of the thermal
units, the utilization factor of each machine.
45
On November 7,
2018, pursuant to Res. SEE 70/18, the Argentine government
authorized generators to purchase their own fuel for assets under
the Energía Base Regulatory framework. If generation companies
opt to take this option, CAMMESSA values and pays the generators
their respective fuel costs in accordance with the Variable Costs
of Production (CVP) declared by each generator to CAMMESA. The
agency in charge of dispatch (Organismo Encargado del Despacho or
“OED” using the Spanish acronym) -CAMMESA- will
continue to supply the fuel for those generation companies that do
not elect to take this option. In accordance to Res. SEE 70/18, in
November 2018, we started purchasing fuel for our Luján de
Cuyo combined cycle, and in December 2018, for all our thermal
units. In the year ended December 31, 2018, income under Res. SEE
70/18 accounted for 13.63% of our revenues.
Additionally, we
have sales under contracts, including (i) term market sales under
contract, (ii) Energía Plus sales under contract; and (iii)
sales of energy under the RenovAr Program. Term market sales under
contract include sales of electric power under negotiated contracts
with private and public sector counterparties such as YPF. Sales
under contracts generally involve PPAs with customers and are
contracted in U.S. dollars. The prices in these contracts include
the price of fuel used for generation, the cost of which is assumed
by the generator. For terms longer than one year, these contracts
typically include electric power price updating mechanisms in the
case of fuel price variations or the generator being required to
use liquid fuels in the event of a shortage of natural gas. For
more information regarding our main clients for term market sales
under contract, see
“
Business
—
Our Customers.
”
Term market sales under contract
accounted for 0.32% of our electric power sales (in MWh) and 0.37%
of our revenues for the year ended December 31, 2018. In our
Luj
á
n de Cuyo plant, we
are also permitted to sell a minor portion (up to 16 MW) of our
generation capacity and electric power under negotiated contracts
with private sector counterparties under the Energía Plus, to
encourage private sector investments in new generation facilities.
Energía Plus sales under contracts accounted for 0.48% of our
electric power sales (in MWh) and 1.72% of our revenues for the
year ended December 31, 2018. These contracts typically have one to
two year terms, are denominated in U.S. dollars and are paid in
pesos at the exchange rate as of the date of payment. Under the
rules and regulations of the Energía Plus, the generator buys
the fuel to cover the committed demand of electric power and
supplies the electric power to large electric power consumers at
market prices, denominated in U.S. dollars, previously agreed
between the generator and its clients. Sales under RenovAr Program
accounted for 1.52% of our electric power sales (in MWh) and 4.20%
of our revenues for the year ended December 31, 2018. See
“Item 4.B. Business
Overview—
The Argentine Electric Power
Sector.
”
We also received
remuneration under Resolution No. 724/2008, relating to agreements
with CAMMESA to improve existing power generation capacity, which
is denominated in U.S. dollars and is paid in pesos at the exchange
rate as of the date of payment. Revenues under Resolution No.
724/2008, accounted for 2.11% of our revenues for the year ended
December 31, 2018. See
“Item
5.
Operating and Financial Review and Prospects
—
Electric Power Sold on the Spot
Market.
”
We also produce
steam. As of December 31, 2018 we had an installed capacity of 150
tons per hour. Steam sales accounted for 1.72% of our revenues for
the year ended December 31, 2018. Our production of steam for the
year ended December 31, 2018 was 1,103 thousand metric tons. Our
Luj
á
n de Cuyo plant,
supplies steam under negotiated contracts with YPF.
After the La Plata
Plant Sale, the contract between us and TGS for the natural gas
transportation capacity has remained effective. Pursuant to the
terms of our agreement with YPF, we resell our gas transportation
capacity to YPF through the resale system established by Resolution
ENARGAS 419/97. The resale under such system is open to third
parties and consequentially does not ensure that YPF will receive
the gas transportation capacity needed to operate the La Plata
plant. Therefore, on January 25, 2018, we requested to be
registered with the Ministry of Energy and the ENARGAS as a natural
gas seller to permit the resale of our gas transportation capacity
to YPF without the risk of intervention from interested third
parties. On July 20, 2018, we were effectively registered as
natural gas sellers. The resell to YPF of our natural gas
transportation capacity accounted for 1.36% of our revenues for the
year ended December 31, 2018.
In addition, we
have income derived from the operating fee that we receive for the
management of the Central Vuelta de Obligado plant. The income from
the management of the Central Vuelta de Obligado plant accounted
for 1.83% of our revenues for the year ended December 31,
2018.
Our Luj
á
n de Cuyo plant has a combined heat
and power (CHP) unit in place, which supplies 150 metric tons per
hour of steam to YPF
’
s
refinery in Luj
á
n de Cuyo
under a steam supply agreement. This contract is denominated and
invoiced in U.S. dollars, but can be adjusted in the event of
variations in U.S. dollar-denominated prices for fuel necessary for
power generation. On February 8, 2018, we entered into an agreement
to extend our steam supply agreement with YPF at our
Luj
á
n de Cuyo plant for a
period of up to 24 months from January 1, 2019 under the same terms
as our existing steam supply agreement. On December 15, 2017, we
also executed a new steam supply contract with YPF for a period of
15 years that will replace our existing contract with YPF and will
begin when the new co-generation unit at our Luj
á
n de Cuyo plant begins operation,
which is expected to occur in December 2019. For further
information on the steam supply agreements with YPF for the
Luj
á
n de Cuyo plant, see
“Item 5.A. Operating
Results—Factors Affecting Our Results of
Operations—Sales Under Contracts, Steam Sales and Resale of
Natural Gas Transportation Capacity —Steam supply to
YPF—Luján de Cuyo plant”.
46
The following graph
breaks down our revenues from continuing operations in the year
ended December 31, 2018 by regulatory framework:
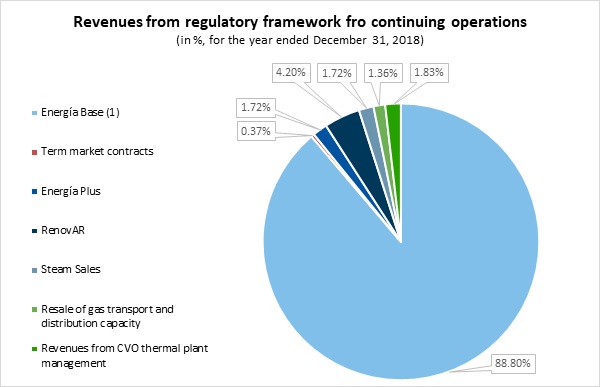
Source: Central
Puerto. (1) Includes (i) sales of energy and power to CAMMESA
remunerated under Resolution No. 95 and Resolution No. 19/2017 (ii)
sales of energy and power to CAMMESA not remunerated under
Resolution No. 95, (iii) remuneration under Resolution No. 724/2008
relating to agreements with CAMMESA to improve existing Argentine
power generation capacity and (iv) income related to Res. SEE 70/18
(see ““
Item 4.B. Business
Overview—
The Argentine Electric Power
Sector
—
Remuneration
Scheme
—
The Current
Remuneration Scheme
—
Resolution SEE 70/18 - Option to
purchase fuel for units under Energía Base Regulatory
Framework.”). See
“Item
4.B. Business Overview—
The Argentine Electric Power
Sector
—
Structure of the
Industry
—
Shortages in the
Stabilization Fund and Responses from the Argentine
Government
—
The National
Program.
”
Note: As of March
1, 2019, a new remuneration scheme for Energía Base came into
force with Resolution SRRyME No. 1/19. For more information
see “
Item 4.B. Business
Overview—
The Argentine Electric Power
Sector
—
Remuneration
Scheme
—
The Current
Remuneration Scheme.”
47
The following graph
breaks down our electric energy sales from continuing operations in
the year ended December 31, 2018 by regulatory
framework:
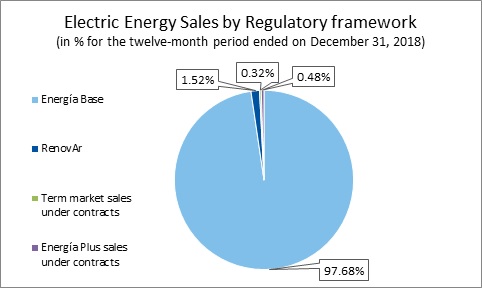
Source: Central
Puerto.
Note: As of March
1, 2019, a new remuneration scheme for Energía Base came into
force with Resolution SRRyME No. 1/19. For more information
see “
Item 4.B. Business
Overview—
The Argentine Electric Power
Sector
—
Remuneration
Scheme
—
The Current
Remuneration Scheme.”
As of the date of
this annual report, we have significant plans underway to expand
our generating capacity through renewable energy projects,
including our five wind energy projects with expected generating
capacity of 86.60 MW (La Genoveva I), 15.75 MW (La Castellana II),
57 MW (Manque, previously part of Achiras II), 22.80 MW (Los
Olivos, previously part of Achiras II) and 41.80 MW (La Genoveva
II), and one solar project with an expected installed capacity of
12 MW (El Puesto). In 2016, we formed a subsidiary, CP Renovables
S.A. (
“
CP
Renovables
”
), to develop,
construct and operate renewable energy generation projects. As of
the date of this annual report, we own a 70.19% interest in CP
Renovables. The remaining 29.81% interest is owned by Guillermo
Pablo Reca.
In 2015 and 2016,
we acquired four heavy-duty, highly efficient gas turbines: (i) one
GE gas turbine with a capacity of 373 MW; (ii) two Siemens gas
turbines, each with a capacity of 298 MW; and (iii) one Siemens gas
turbine with a capacity of 286 MW, which we are currently
installing in our Terminal 6 San Lorenzo co-generation project.
Additionally, we have also acquired 130 hectares of land in the
north of the Province of Buenos Aires, in a location that provides
excellent conditions for fuel delivery and access to power
transmission lines. In addition, as of the date of this annual
report, we have already paid SEK$381.37 million (which, converted
at the exchange rate quoted by the Central Bank as of the date of
each payment, equals US$45.46 million) to purchase two additional
Siemens gas turbines for our Luj
á
n de Cuyo project.
We also own
long-term significant non-controlling investments in companies that
have utility licenses to distribute natural gas through their
networks in the provinces of Mendoza, San Juan, San Luis,
C
ó
rdoba, Catamarca and La
Rioja. Taking into account direct and indirect interests, we hold
(i) a 22.49% equity stake in DGCU and (ii) a 39.69% equity stake in
DGCE (Ecogas). Ecogas had a gas distribution network covering
31,637 km and served approximately 1,330,923 customers as of
December 31, 2018. In the year ended December 31, 2018, Ecogas
distributed an average of 13.80 million cubic meters of natural gas
per day; and in 2017, Ecogas distributed an average of 14.21
million cubic meters of natural gas per day. This volume of
distribution represented approximately 15.70% and 14.21% of the gas
delivered by all the distribution companies in Argentina in 2018
and in 2017, respectively, according to data from Ecogas. In the
year ended December 31, 2018 our interest in Ecogas produced
Ps.1.01 billion in share of profit of an associate, which
represented 5.88% of our net income for such period.
At a meeting of our
shareholders on December 16, 2016, in accordance with the strategic
objective of focusing on assets within the energy industry, the
shareholders considered a potential sale of our equity interests in
Ecogas to Magna Energía S.A. but voted to postpone the
decision. We are currently assessing various strategic
opportunities regarding DGCU and DGCE, including a possible partial
or total sale of our equity interest in them. On January 26, 2018,
the shareholders of DGCE approved the admission of DGCE to the
public offering regime in Argentina. On March 14, 2018, the Company
authorized the offer of up to 10,075,952 common class B shares of
DGCE, in a potential public offering authorized by the CNV, subject
to market conditions. This authorization was encompassed within
February 23, 2018 authorization of the Board of Directors for the
sale of up to 27,597,032 common B shares of DGCE. As of the date of
this annual report, we continue to evaluate this
strategy.
48
Our Competitive Strengths
We believe that we
have achieved a strong competitive position in the Argentine power
generation sector primarily as a result of the following
strengths:
●
One of the
largest private sector power companies in
Argentina
.
We are one of the
largest private sector power generation companies in Argentina, as
measured by power generated, according to data from CAMMESA. In the
year ended December 31, 2018, we generated a total of 14,479 net
GWh of power for continuing operations and 10 net GWh of power
from the discontinued operations of the La Plata plant (see
“
Item 4.A. History and
development of the Company
—La Plata plant
Sale”). As of December 31, 2018, we had an installed
generating capacity of 3,810 MW. Our leading position allows us to
develop a range of sales and marketing strategies, without
depending on any one market in particular. Additionally, our size
within the Argentine market positions us well to take advantage of
future developments as investments are made in the electric power
generation sector. Our ample installed capacity is also an
advantage, as we have sufficient capacity to support large,
negotiated contracts.
The following
graphs shows the SADI
’
s
total power generation by private companies and market share for
2018 (grouped by related companies and subsidiaries):

Source: CAMMESA.
(i) Enel includes Enel Generaci
ó
n Costanera S.A., Central Dock Sud
S.A. and Enel Generaci
ó
n
El Choc
ó
n S.A.; (ii) Pampa
Energía includes Central T
é
rmica G
ü
emes S.A., Central T
é
rmica Loma la Lata S.A., Inversora
Piedra Buena S.A., Inversora Diamante S.A., CTG and Inversora
Nihuiles, and Petrobras Argentina S.A.; and (iii) AES Argentina
Generaci
ó
n includes
Central T
é
rmica San
Nicol
á
s S.A. and
Hidroel
é
ctrica
Alicur
á
S.A.
●
High
quality assets with strong operational performance
. We have
a variety of high quality power generation assets, including
combined cycle turbines, gas turbines, steam turbines,
hydroelectric technology and steam and power co-generation
technology, with a combined installed generating capacity of 3,810
MW. Our efficiency levels compare favorably to those of our
competitors due to our efficient technologies. The following chart
shows the efficiency level for the period between November 2018 and
April 2019 of each of our generating units compared to our main
competitors based on heat rate, which is the amount of energy used
by an electric power generator or power plant to generate one kWh
of electric power.
49
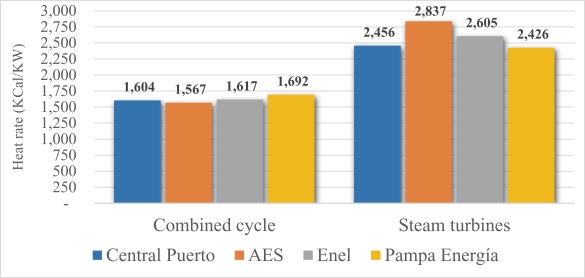
Source:
CAMMESA.
The following chart
shows the availability ratio of our thermal assets as compared to
the market average:
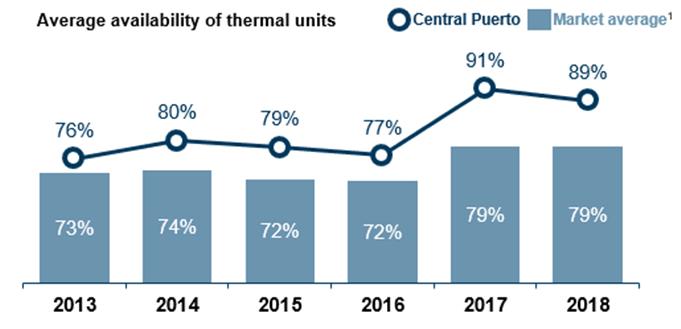
Source: Central
Puerto, CAMMESA.
1
Average
market availability for thermal units, excluding the La Plata plant
thermal units (see “
Item 4.A.
History and development of the Company
—La Plata Plant
Sale”).
We have long-term
maintenance contracts with the manufacturers of our combined cycle
units and co-generation plants with the largest capacity, namely
the Puerto combined cycle unit (CEPUCC) and the LDCUDCC25 combined
cycle unit at the Luj
á
n de
Cuyo plant and the co-generation units at the Luj
á
n de Cuyo plant (LDCUTG23 and
LDCUTG24), under which the manufacturers provide maintenance using
best practices recommended for such units. Our remaining units
receive maintenance through our highly trained and experienced
personnel, who strictly follow the recommendations and best
practice established by the manufacturers of such units. We are
also capable of generating power from several sources of fuel,
including natural gas, diesel oil and fuel oil. In addition, in
recent years we have invested in adapting our facilities to be able
to generate power from biofuels, and we have developed business
relationships over the years with strategic companies from the oil
and gas and the biofuel sectors. Our power generation units are
also favorably positioned along the system
’
s power dispatch curve (the WEM
marginal cost curve) as a result of our technologically diverse
power generation assets and high level of efficiency in terms of
fuel consumption, which ensures ample dispatch of energy to the
system, even when taking into account new capacity additions
expected in the coming years that were awarded pursuant to auctions
to increase thermal generation capacity and capacity from renewable
energy sources.
●
Diversified
and strategically located power sector assets
. Our business
is both geographically and technologically diverse. Our assets are
critical to the Argentine electric power network due to the
flexibility provided by the large fuel storage capacity, that
allows us to store 32,000 tons of fuel oil (enough to cover 6.3
days of consumption) and 20,000 tons of gas oil (enough to cover
5.7 days of consumption) at our thermal generation plants, in
addition to our access to deep water docks, our dam water capacity
and our ability to store energy for 45 days operating at full
capacity at Piedra del
Á
guila. The prices for power
transmission are regulated and based on the distance from the
generating company to the user, among other factors. In this
regard, our thermal power plants are strategically located in
important city centers or near some of the system
’
s largest customers, which
constitutes a significant competitive advantage. For example,
approximately 38% of Argentine energy consumption was concentrated
within the metropolitan area of Buenos Aires during 2018. Because
the lack of capacity in SADI limits the efficient distribution of
energy generated in other geographic areas, our generation plants
in Buenos Aires and Mendoza are essential to the supply of energy
to meet the high demand in these areas. In addition, this need to
generate energy close to a high consumption area in Argentina means
that our plants are less affected by the installation of new
capacity in other regions.
50
The diversification
of our fuel sources enables us to generate energy in different
contexts, as shown in the following chart:
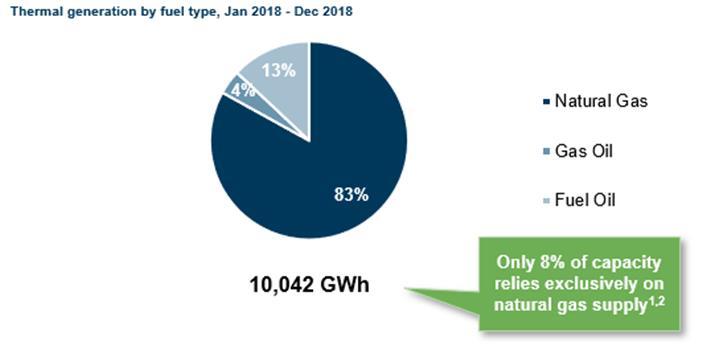
Source: Central
Puerto
_____________
(1)
Excludes thermal
generation from the La Plata plant (see “
Item 4.A. History and development of the
Company
—La Plata Plant Sale”).
(2)
Lujan de
Cuyo’s Siemens Combined Cycle unit (306 MW installed
capacity) is CEPU’s only unit relying exclusively on natural
gas.
●
Attractive
growth pipeline
.
We have identified
opportunities to improve our strategic position as a leader among
conventional power generation technologies by expanding our thermal
generation and renewable energy capacity.
Thermal
Generation
.
In
2015 and 2016, we acquired four heavy-duty, highly efficient gas
turbines: (i) one GE gas turbine with a capacity of 373 MW; (ii)
two Siemens gas turbines, each with a capacity of 298 MW; and (iii)
one Siemens gas turbine with a capacity of 286 MW. We also acquired
130 hectares of land in the north of the Province of Buenos Aires,
which we believe will allow us to develop new projects that could
add 1,255 MW to our total installed capacity under a simple cycle
configuration or through combined cycle operations. For example, we
are currently using a Siemens gas turbine, with a capacity of 286
MW, for the Terminal 6 San Lorenzo co-generation project. Our
objective is to use the remaining three units and the
aforementioned land, in which we have already invested US$134
million, to install new generation capacity, through one or more
potential future projects. In addition, as of the date of this
annual report, we have already paid SEK$381.37 million (which,
converted at the exchange rate quoted by the Central Bank as of the
date of each payment, equals US$45.46 million) to purchase two
additional Siemens gas turbines for our Luj
á
n de Cuyo project.
Regarding the
financing of the thermal project Luján de Cuyo, on March 26,
2019, the Company, as borrower, entered into a loan agreement with
KfW for an amount of US $ 56,000,000 to finance the acquisition of
the two Siemens SGT-800 gas turbines referenced above (with a power
of 89 MW) and equipment from Siemens Sweden and related services
from Siemens Argentina (for more information see “Item 4.
Information of the Company
—Recent Developments—
Borrowing
from KFW
.”)
As of the
date of this annual report, we are working to satisfy all the
conditions prior to the disbursement of this loan.
The Secretariat of
Electric Energy, pursuant to Resolution SEE No. 287-E/17, called
for proposals for supply of electric power to be generated through
existing units, the conversion of open combined cycle units into
closed combined cycle units or the installation of co-generation
units. We submitted bids on August 9, 2017, and, on September 25,
2017, we were awarded two co-generation projects at Terminal 6 San
Lorenzo (with an awarded electric capacity of 330 MW and 317 MW for
the winter and summer, respectively) and Luj
á
n de Cuyo (with an awarded electric
capacity of 93 MW and 89 MW for the winter and summer,
respectively).
51
We are evaluating
additional projects for future bidding processes the Argentine
government may launch in connection with the other categories set
forth in Resolution SEE No. 420-E/16. After the previous two
bidding processes of Resolution SEE 21/16 and Resolution SEE
287/17, the Argentine government awarded projects with an awarded
capacity of 2.9 GW and 1.8 GW, respectively.
Renewable
Generation
.
In
addition, we are developing five wind energy projects and one solar
energy project in Argentina with the following characteristics (the
“Renewable Projects”):
|
|
La Genoveva
I
|
La Castellana
II
|
Manque
(previously part of Achiras II)
|
Los Olivos
(previously part of Achiras II)
|
La Genoveva
II
|
El
Puesto
|
|
Location
|
Province of Buenos
Aires
|
Province of Buenos
Aires
|
Province of
Córdoba
|
Province of
Córdoba
|
Province of Buenos
Aires
|
Province of
Catamarca
|
|
Expected commercial
operation date
|
May 2020
(1)
|
July
2019
|
January
2020
|
January
2020
|
August
2019
|
August
2020
|
|
Estimated total
capital expenditure (excluding VAT) (2)
|
US$110
million
|
US$16
million
|
US$64
million
|
US$25
million
|
US$46
million
|
US$11
million
|
|
Awarded electric
capacity
|
86.60
MW
|
15.75
MW
|
57.00
MW
|
22.80
MW
|
41.80
MW
|
12 MW
|
|
Regulatory
Framework
|
RenovAr
2.0
|
MATER
|
MATER
|
MATER
|
MATER
|
MATER
|
|
Awarded price per
MWh
|
US$40.90
|
N/A
|
N/A
|
N/A
|
N/A
|
N/A
|
|
Contract
length
|
20 years, starting
from commercial operation
|
N/A
|
N/A
|
N/A
|
N/A
|
N/A
|
|
Power purchase
agreement signing date
|
July
2018
|
N/A
|
N/A
|
N/A
|
N/A
|
N/A
|
|
Number of
units
|
21 wind
turbines
|
4 wind
turbines
|
15 wind
turbines
|
6 wind
turbines
|
11 wind
turbines
|
43,000 solar
modules
(3)
|
|
Wind turbine
provider
|
Vestas
|
Vestas
|
Vestas
|
Vestas
|
Vestas
|
To be
defined
|
(1)
The commercial
operation date (COD) committed with CAMMESA of La Genoveva I is 720
days after the PPA signing date, which was on July 27,
2018.
(2)
As of December 31,
2018, the executed capital expenditures for La Genoveva I, La
Castellana II, Achiras II (which after December 31, 2018, was
separated into Manque and Los Olivos projects), La Genoveva II and
El Puesto were Ps. 604.42 million, Ps. 410.68 million,
Ps. 426.79 million, Ps. 1,110.13 million, Ps. 12.71
million, respectively, in each case, plus the applicable value
added tax.
(3)
Estimated amount of
modules.
Other than the
Borrowing from KFW described in this annual report (see “Item
4.B. Information of the Company—Recent
Developments—Borrowing from KFW”), our expansion
projects are being developed with equity from Central Puerto and
its subsidiaries. However, we may explore alternative financing
options if the conditions are favorable.
In connection with
the Renewable Projects, we have already obtained energy production
assessments prepared by an independent expert, regulatory approvals
of the environmental impact studies, relevant municipal
qualifications and regulatory approvals of the electrical studies
in connection with access to the transmission network. In addition,
we have three usufructs over the land in the Province of Buenos
Aires to be used for our La Castellana II, La Genoveva I and La
Genoveva II projects and in the Province of Catamarca for the El
Puesto project, and we own the necessary land in the Province of
C
ó
rdoba to be used for our
Manque and Los Olivos projects, which together were previously
known as Achiras II project. We have begun construction of the
facilities and have executed contracts with suppliers to acquire
and maintain the wind turbines and solar panels of the Renewable
Projects.
In connection with
our renewable energy efforts, Law No. 27,191, provides that Large
Users, whose demand exceeds 300 KW of average annual power, should
comply with the obligation to purchase renewable energy by entering
into a contract with a generating company or through
self-generation. The Ministry of Energy and Mining through
Resolution 281-E/ 2017, established the regulatory framework that
allows Large Users to purchase renewable energy from private
generating companies and the conditions for granting the
“
dispatch
priority
”
that allows
such transactions to take place and ensures that the private
generating companies will not be restricted in the future in its
generation dispatch (see
“Item
4.B. Business Overview—
The Argentine Electric Power
Sector
—
Resolution No.
281-E/17: The Renewable Energy Term Market in Argentina
”
). As of the date of this annual
report, we have already signed long-term PPA contracts with private
customers for 61% of the estimated energy generation capacity of
our term market projects (considering the median -Percentile 50%-
of the expected energy production) developed under Resolution No.
281-E/17 regulatory framework, which are currently under
construction.
However, we
cannot assure you that the Argentine government will open new
auction processes, or our bids will be successful or that we will
be able to enter into PPAs in the future. See
“Item 3D.
Risk Factors
—
Risks Relating to our
Business
—
Factors beyond
our control may affect our ability to win public bids for new
generation capacity, or affect or delay the completion of new power
plants once we have been awarded projects.
”
52
●
Strong cash
flow generation, supported by U.S. dollar denominated cash
flows
.
We have strong,
stable cash flows, mainly through payments we receive from CAMMESA,
primarily as a result of the power generation remuneration
structure in Argentina. Such payments principally depend on two
factors: (i) the availability of power capacity and (ii) the amount
of power generated. Both variables have been relatively stable in
recent years, as a result of the diversified technology and high
efficiency of our power generation units. Certain of these cash
flows were previously denominated and paid by CAMMESA in Argentine
pesos. However, after February 2017, under Resolution SEE No.
19/17, payments under the Energía Base are denominated in U.S.
dollars but paid in pesos. Resolution SRRyME No. 1/19, in force
since March 1, 2019, abrogated Resolution SEE No. 19/17 and
replaced the regime set forth in this last resolution, and provided
that while payments are denominated in U$S, they will be made in
Argentine pesos. Although Resolution SRRyME 1/19 reduced the prices
for energy and power for the thermal units under Energía Base
regulatory framework, we believe that, in terms of revenues, the
income from our new projects will offset the tariff decrease. In
addition, our cash flows have little exposure to the fuel price
changes as the fuel needed to produce the energy under the
Energía Base is supplied by CAMMESA without charge or offset
in the revenues we receive, and our term market sales under
contracts typically include price adjustment mechanisms based on
fuel price variations. In addition to these payments, our cash flow
is supported by the U.S. dollar-denominated payments we receive
from CAMMESA, related to our credits pursuant to the San
Martín and Manuel Belgrano FONINVEMEM arrangements, which
began in March 2010 and are expected to continue until March 2020.
During the year ended December 31, 2018, we received Ps.515.26
million (US$ 19.81 million in U.S. dollar-denominated payments) in
principal and Ps.33.14 million (US$ 1.31 million in U.S.
dollar-denominated payments) in interest for these receivables
(including VAT).
As of March 20,
2018, CAMMESA granted the CVO Commercial Approval in the WEM, as a
combined cycle, of the thermal plant Central Vuelta de Obligado,
which entitled us to receive the collection of the trade
receivables under the CVO Agreement. A PPA between the CVO Trust
and CAMMESA, through which the CVO Trust makes energy sales and,
consequently, receives the cash flow to pay the trade receivables,
had to be signed in order to start the collections.
The PPA agreement
was signed on February 7, 2019, with retroactive effect to March
20, 2018.
As a result, the
original amortization schedule from the CVO Agreement is in full
force and effect.
The unpaid
installments corresponding to the March-December 2018 period add up
to US$ 78.15 million (including VAT, corresponding to installments
1 to 10). As of the day of this annual report, we continue in
negotiations with CAMMESA to collect such unpaid amounts as soon as
possible, plus the accrued interest between each due date and the
effective payment date.
Despite the
referred unpaid installments, as of the date of this annual report,
we received the payment related to January and February 2019
(corresponding to installments 11 and 12, respectively) pursuant to
the CVO Agreement’s original disbursement schedule, at the
exchange rate of the last date of each month, on its respective due
dates, in March and April 2019, respectively.
.
●
Strong
financial position and ample room for additional leverage.
We benefit from a strong financial position, operating efficiency
and a low level of indebtedness, allowing us to deliver on our
business growth strategy and create value for our shareholders. In
terms of our financial position, our total cash and cash
equivalents and current other financial assets was Ps. 2.20 billion
(US$58 million) as of December 31, 2018. As of the date of this
annual report, we also have uncommitted lines of credit with
commercial banks, totaling approximately Ps. 5.91
billion.
●
Solid and experienced
management team with a successful track record in delivering
growth
. Our executive officers have vast experience and a
long track record in corporate management with, on average, 18
years of experience in the industry. Our management has diverse
experience navigating different business cycles, markets and
sectors, as evidenced by the growth and expansion we have undergone
since the early 1990s. They also have a proven track record in
acquisitions and accessing financial markets. For example, in 2007,
HPDA successfully issued bonds in an aggregate principal amount of
US$100 million, which were paid in full in 2016. In addition, in
2015, jointly with an investment consortium, we acquired
non-controlling equity interests in Ecogas, which distributes
natural gas through its network covering 31,637 km and serving
approximately 1,330,923 customers as of December 31, 2018, further
diversifying our interest in the sector. We believe that our
management team has been successful in identifying attractive
investment opportunities, structuring innovative business plans and
completing complex transactions efficiently.
53
Our management has
significant in-country know-how, with professionals who have taken
an active role in project development and construction, developing
private and public investment plans with both Argentine and
international partners. In addition, our management team has
business experience at the international and national level, are
familiar with the operation of our assets in a constantly-changing
business environment and are strongly committed to our day-to-day
decision-making process.
Finally, our
executive officers have a solid understanding of
Argentina
’
s historically
volatile business environment. They have built and maintained
mutually beneficial and long-lasting relationships with a
diversified group of suppliers and customers, and have cultivated
relationships with regulatory authorities.
●
Strong
corporate governance
. We have adopted a corporate governance
code to put into effect corporate governance best practices, which
are based on strict standards regarding transparency, efficiency,
ethics, investor protection and equal treatment of investors. The
corporate governance code follows the guidelines established by the
CNV. We have also adopted a code of ethics and an internal conduct
code designed to establish guidelines with respect to professional
conduct, morals and employee performance. In addition, the majority
of our Board of Directors qualifies as
“
independent
”
in accordance with the criteria
established by the CNV, which may differ from the independence
criteria of the NYSE and NASDAQ.
Our Business Strategy
We seek to
consolidate and grow our position in the Argentine energy industry
by maintaining our existing asset base and by acquiring and
developing new assets related to the sector. The key components of
our strategy are as follows:
●
Capitalizing
on expected growth initiatives while leveraging opportunities in an
improved regulatory environment
. Historically, Argentine
regulations in the energy generation sector have hindered growth in
the sector. Investment in the Argentine power and energy sector has
been low since the 2001-2002 economic crisis in Argentina and the
resulting regulatory changes in 2002 wherein the Argentine
government set power generation tariffs in pesos and capped energy
generation, transportation and distribution tariffs, which resulted
in a steady decrease of the U.S. dollar value of these tariffs in
subsequent years. Since the Macri administration assumed office, it
has significantly curtailed currency controls and import-export
taxes, and demonstrated a willingness to adjust tariffs applicable
to power distributors, generators and transporters. As a response
to the current electric power shortage, the Argentine government
has declared a state of emergency for the national power system,
has opened auction processes for the acquisition of power from
renewable energy and the increase thermal generation capacity. In
addition, the Argentine government has set forth overall guidelines
for the development of energy projects, the procedures for
compliance with energy goals and bids for thermal generation
capacity and associated power generation to meet energy demand
requirements in Argentina through 2018. For information about the
call for bids, see the discussion of Resolution SEE No. 21/16,
Resolution SEE No. 71/16 (complemented by Resolution No. 136/16 of
the Ministry of Energy) and Resolution SEE No. 287-E/17 in
“Item 4.B. Business
Overview—
The Argentine Electric Power
Sector.
”
We expect
investment in the power generation sector to grow as a result of
these reforms. We believe we are well-positioned to capitalize on
the Argentine government
’
s focus on expanding generation
capacity, given our strong track record and competitive advantages,
including our low level of indebtedness and technologically diverse
and highly efficient power generation assets. In this respect, we
plan to expand our generation capacity from thermal and renewable
sources. As an example, we have acquired 130 hectares of land in
the north of the Province of Buenos Aires near the Parana River and
have purchased four thermal generation units with the intention of
expanding our current generating capacity, one of which will be
used for the Terminal 6 San Lorenzo thermal project. We intend to
present a bid for new thermal generation capacity, through one or
more projects, in future bidding processes, and we continue to
analyze other project and investment opportunities in the
sector.
●
Consolidating
our leading position in the energy sector
. We seek to
consolidate our position in the energy sector by analyzing
value-generating alternatives through investments with a balanced
approach to profitability and risk exposure. We are committed to
maintaining our high operating standards and availability levels.
To this end, we follow a strict maintenance strategy for our units
based on recommendations from their manufacturers, and we perform
periodic preventative and predictive maintenance tasks. We plan to
focus our efforts on optimizing our current resources from a
business, administrative and technological perspective, in addition
to capitalizing on operating synergies from future businesses that
rely on similar systems, know-how, customers and
suppliers.
54
●
Becoming a
leading company in renewable energy in Argentina
. Several
research studies from organizations such as the
Cámara Argentina de
Energías Renovables
suggest that Argentina has a
significant potential in renewable energy (mainly in wind and solar
energy). We also believe that renewable energy will become a larger
part of the installed capacity in Argentina. The Ministry of Energy
and Mining, through Law No. 27,191, has established a target for
renewable energy sources to account for 20% of
Argentina
’
s electric
power consumption by December 31, 2025. We intend to capitalize on
this opportunity by expanding our investments into renewable energy
generation. In order to achieve this goal, we are strengthening our
renewable energy portfolio. In August 2018 and September 2018 our
wind farms La Castellana I and Achiras I started operations.
Additionally, we are also expanding our portfolio to five wind
energy projects (La Castellana II, Manque and Los Olivos (which
together were previously known as Achiras II), La Genoveva I and La
Genoveva II) and one solar project (El Puesto) that are expected to
increase our generating capacity by 15.75 MW, 57 MW, 22.8 MW, 86.6
MW, 41.8 MW and 12 MW, respectively, and exploring several other
options to diversify our generation assets to include sustainable
power generation sources. In 2016, we formed our subsidiary, CP
Renovables, to develop, construct and operate renewable energy
generation projects.
●
Maintaining
a strong financial position and sound cash flow levels.
We
have a low level of debt, which reflects our strong financial
position and additional debt capacity. We believe our strong
financial position is the result of our responsible financial
policies and stable cash flows. We seek to preserve our current
cash flow levels in the coming years by, among other things,
keeping a rigorous maintenance program for our production units,
which we expect will help us continue the positive operational
results we have experienced, particularly with regard to our
electric power dispatch availability. We intend to fund our
expansion plans primarily with loan arrangements, such as credit
facilities and project financing in the case of our renewable
energy projects. Each of CP La Castellana and CP Achiras entered
into loans to fund the development of renewable energy projects
they were awarded and to purchase wind turbines. Additionally, we
hope that the expected new capacity from these projects will allow
us to further increase our cash flow, while enhancing our financial
position.
Our Subsidiaries
Central Vuelta de Obligado S.A.
CVOSA is a private,
unlisted company, engaged in managing the purchase of equipment and
building, operating and maintaining the CVOSA power plant that is
being constructed under a program substantially similar to the
FONINVEMEM program. In the year ended December 31, 2018, CVOSA
accounted for 56.19 % of our net income.
We have 56.19 % of
the voting rights in CVOSA, which grants us the power to
unilaterally approve resolutions for which a majority is required
at the relevant shareholders meeting. However, pursuant to a
shareholders
’
agreement
entered into among Endesa Costanera S.A., Hidroel
é
ctrica El Chocon S.A., Central Dock
Sud S.A. (the
“
Other
CVOSA Shareholders
”
) and
us, we will only be able to approve the following decisions with
the affirmative vote of the Other CVOSA Shareholders: (i) entering
into a merger, spin-off, transformation or liquidation; (ii)
increasing or decreasing the capital stock; (iii) receiving capital
contributions; (iv) entering into transactions with related
parties; (v) amending the bylaws; (vi) entering into an operating
and maintenance agreement for the Vuelta de Obligado power plant;
(vii) approving the trust agreement in connection with the Vuelta
de Obligado power plant and its amendments; (viii) filing any
lawsuit against any governmental authorities, CAMMESA and/or the
FONINVEMEM trust fund currently holding the Vuelta de Obligado
power plant; (ix) entering into engineering services, gas supply
and transportation agreements; and (x) entering into a power
purchase agreement with CAMMESA for the Vuelta de Obligado power
plant. If such decisions are to be decided at a board of
directors
’
meeting, they
can only be approved with the affirmative vote of at least one
member of the board of directors appointed by the Other CVOSA
Shareholders.
The board of
directors of CVOSA consists of four members, two of which are
appointed by us and the remaining two, by the Other CVOSA
Shareholders. In addition, we have the right to appoint the
chairman of the board of directors of CVOSA, who has double vote in
case of a tie. In addition, we have the right to appoint one member
of the supervisory committee of CVOSA.
Pursuant to the
terms of the FONINVEMEM agreement relating to the Vuelta de
Obligado power plant, on the tenth anniversary of the start of
operations of the Vuelta de Obligado power plant, which occurred on
March 20, 2018, all governmental entities that financed the
construction of the Vuelta de Obligado power plant have the right
to be incorporated as shareholders of CVOSA, which in turn may
dilute our interest in CVOSA. See
“Item 3.D.
Risk Factors
—
Risks Relating to Our
Business
—
Our interests in
TJSM, TMB and CVOSA will be significantly diluted.
”
If such dilution were to occur, we
may no longer control CVOSA.
Proener S.A.U.
Proener S.A.U. is a
private, unlisted company. We hold a 100.00% interest in Proener
S.A.U., a company engaged in the commercialization and
transportation of fuels, both domestically in Argentina and
internationally, and providing consulting and technical assistance
services to the energy industry. In the year ended December 31,
2018, Proener S.A.U. accounted for a loss equaling 0.04 % of our
net income.
55
Central Aimé Painé S.A.
Central
Aim
é
Pain
é
S.A. is a private, unlisted company.
We hold a 97.00% interest in Central Aim
é
Pain
é
S.A., a company engaged in managing
the purchase of equipment and building, operating, and maintaining
power plants, both domestically in Argentina and internationally.
In the year ended December 31, 2018, Central Aim
é
Pain
é
S.A. did not account for any of our
net income.
CP Renovables S.A.
CP Renovables S.A.
is a private, unlisted company, in which we hold a 70.19% interest
in the capital stock. CP Renovables S.A. invests in renewable
energy assets. In the year ended December 31, 2018, CP Renovables
S.A. accounted for a loss, without taking into account the results
of its subsidiaries, mainly CP Achiras and CP La Castellana,
equaling 0.13% of our net income.
On January 18,
2017, we entered into a shareholders agreement with the minority
shareholder of CP Renovables, Guillermo Pablo Reca. The
shareholders agreement was amended and restated on November 28,
2018. For further information, see
“
Item 7.B. Related Party
Transactions
—
CP
Renovables Shareholders Agreement.
”
CP Achiras S.A.U.
CP Achiras S.A.U.
is a private, unlisted company. CP Renovables S.A. holds a 100%
interest in the capital stock of CP Achiras S.A.U., a company
engaged in the generation and commercialization of electric power
through renewable sources. In the year ended December 31, 2018, CP
Achiras accounted for a loss equaling 1.56% of our net
income.
CPR Energy Solutions S.A.U. (previously known as “CP Achiras
II S.A.U.”)
CPR Energy
Solutions S.A.U. is a private, unlisted company. CP Renovables
holds a 100% interest in the capital stock of CPR Energy Solutions
S.A.U., a company engaged in generation and commercialization of
electric power through renewable sources. In the year ended
December 31, 2018, CPR Energy Solutions S.A.U. did not account for
any of our net income.
CP Patagones S.A.U.
CP Patagones S.A.U.
is a private, unlisted company. CP Renovables holds a 100% interest
in the capital stock of CP Patagones S.A.U., a company engaged in
generation and commercialization of electric power through
renewable sources. In the year ended December 31, 2018, CP
Patagones S.A.U. did not account for any of our net
income.
CP La Castellana S.A.U.
CP La Castellana is
a private, unlisted company. CP Renovables holds a 100% interest in
the capital stock of CP La Castellana, a company engaged in
generation and commercialization of electric power through
renewable sources. In the year ended December 31, 2018, CP La
Castellana accounted for a loss equaling 3.30% of our net
income.
Parques Eólicos Australes S.A.
Parques
E
ó
licos Australes S.A. is
a private, unlisted company. CP Renovables holds a 99% interest in
the capital stock of Parques E
ó
licos Australes S.A., a company
engaged in the generation and commercialization of electric power
through renewable sources. This entity is currently undergoing a
liquidation process due to the lack of operations. In the year
ended December 31, 2018, Parques E
ó
licos Australes S.A. did not account
for any of our net income.
Vientos La Genoveva S.A.U.
Vientos La Genoveva
S.A.U. is a private, unlisted company. On March 7, 2018, our
subsidiary CP Renovables S.A. acquired 100% of the equity interests
in Vientos La Genoveva S.A. and, on that same date, transformed it
into a S.A.U. On August 6, 2018, we purchased from our subsidiary,
CP Renovables S.A., 100% of the equity interests in Vientos La
Genoveva S.A.U. Vientos La Genoveva is a company engaged in
generation and commercialization of electric power through
renewable sources. In the year ended December 31, 2018, Vientos La
Genoveva accounted for a loss equaling 0.25% of our net
income.
56
Vientos La Genoveva II S.A.U.
Vientos La Genoveva
II S.A.U. is a private, unlisted company. On June 28, 2018, our
subsidiary CP Renovables S.A. acquired 100% of the equity interests
in Vientos La Genoveva II S.A. and, and was later transformed it
into a S.A.U. On August 6, 2018, we purchased from our subsidiary,
CP Renovables S.A., 100% of the equity interests in Vientos La
Genoveva II S.A.U. In the year ended December 31, 2018, Vientos La
Genoveva accounted for a loss equaling 0.83% of our net
income.
CP Manque S.A.U.
CP Manque S.A.U. is
a private, unlisted company. CP Renovables holds a 100% interest in
the capital stock of CP Manque S.A.U., a company engaged in
generation and commercialization of electric power through
renewable sources. In the year ended December 31, 2018, CP Manque
S.A.U. did not account for any of our net income.
CP Los Olivos S.A.U.
CP Los Olivos
S.A.U. is a private, unlisted company. CP Renovables holds a 100%
interest in the capital stock of CP Los Olivos S.A.U., a company
engaged in generation and commercialization of electric power
through renewable sources. In the year ended December 31, 2018, CP
Los Olivos S.A.U. did not account for any of our net
income.
Our Affiliates
Termoeléctrica José de San Martín S.A. (TJSM) and
Termoeléctrica Manuel Belgrano S.A. (TMB)
TJSM and TMB are
private, unlisted companies, which are engaged in managing the
purchase of equipment, and building, operating and maintaining the
San Martín and Belgrano power plants, respectively, each
constructed under the FONINVEMEM program. In the year ended
December 31, 2018, TJSM and TMB accounted for 0.20% and 0.17% of
our net income, respectively.
We have 30.8752% of
the voting rights in TJSM and 30.9464% of the voting rights in TMB.
While we do not have control over these companies, pursuant to a
shareholders
’
agreement
entered into among Endesa Costanera S.A., Hidroel
é
ctrica El Choc
ó
n S.A. Central Dock Sud S.A, AES
Argentina Generaci
ó
n S.A.,
Central Dique S.A. and us, certain material actions can only be
approved with our affirmative vote, such as, among others, entering
into power purchase agreements with CAMMESA, engineering services
agreements, gas supply and transportation agreements, and
transactions with related parties.
The board of
directors of each of TJSM and TMB consists of nine members, two of
which are appointed by us. In addition, we have the right to
appoint one alternate member of the supervisory committee of each
company.
Pursuant to the
terms of the FONINVEMEM agreements relating to the San Martín
and Belgrano power plants, on the tenth anniversary of the start of
operations of each of the San Martín and Belgrano power
plants, all governmental entities that financed the construction of
the San Martín and Belgrano power plants, respectively, have
the right to be incorporated as shareholders of TJSM or TMB, as
applicable, which in turn may dilute our interest in TJSM and TMB.
See
“Item 3.D.
Risk
Factors
—
Risks Relating to
Our Business
—
Our
interests in TJSM, TMB and CVOSA will be significantly
diluted.
”
If such
dilution were to occur, we may no longer have veto rights or the
right to appoint any members of the board of directors and
supervisory committee pursuant to the terms of the TJSM and TMB
shareholders agreements.
In addition, the
bylaws of TJSM and TMB provide that shareholders of such companies
(including the Argentine government once it becomes a shareholder
to TJSM and TMB) have a right of first refusal in connection with
any transfer of shares other than to persons controlled by, or
controlling, such shareholders. The right of first refusal shall
not be applicable upon the transfer of shares to the Argentine
government, pursuant to the San Martín and Manuel Belgrano
FONINVEMEM arrangements (See
“Item 4.B.
Business
Overview
—
FONINVEMEM and
Similar Programs.
”
)
Ecogas Group - Inversora de Gas del Centro S.A. (IGCE)
IGCE is a private,
unlisted company. Its only significant asset is a 51.00% interest
in DGCE, a company engaged in the distribution of natural gas in
the provinces of C
ó
rdoba,
La Rioja and Catamarca. We hold a 44.10% interest in IGCE and a
direct 17.20% interest in DGCE. Therefore, we hold, both directly
and indirectly, a 39.69% of DGCE
’
s capital stock.
57
Ecogas Group - Inversora de Gas Cuyana S.A. (IGCU)
IGCU is a private,
unlisted company. Its only significant asset is a 51.00% interest
in DGCU, a company engaged in the distribution of natural gas in
the provinces of Mendoza, San Juan and San Luis. We hold a 44.10%
interest in IGCU, and therefore, indirectly have a 22.49% interest
in DGCU
’
s capital
stock.
In the year ended
December 31, 2018, IGCU and IGCE (including a direct interest in
DGCE) accounted for 5.77% of our net income (see "Item 4.A. History
and development of the Company—
Distribuidora de Gas Cuyana S.A. (DGCU) and
Distribuidora de Gas del Centro S.A. (DGCE)
—Potential
sale of our interes in Ecogas" and " Item 4.A. History and
development of the Company—Preliminary Merger Agreement
between IGCE, IGCU, RPBC and MAGNA").
Transportadora de Gas del Mercosur S.A. (TGM)
TGM is a private,
unlisted company. We hold a 20.00% interest in the capital stock of
TGM, which owns a natural gas pipeline extending from Aldea
Brasilera (in the Province of Entre Rios) to Paso de los Libres (in
the Province of Corrientes). In the year ended December 31, 2018,
TGM accounted for a loss equaling 0.01% of our net
income.
The remaining
80.00% is owned by Total Gas y Electricidad Argentina S.A.
(32.68%), Tecpetrol S.A. (21.79)%, RPM Gas S.A. (14.63%) and
Compa
ñ’
a General de
Combustibles S.A. (10.90%).
The pipeline is
approximately 450 km long and its transportation capacity reaches
up to 15 million cubic meters per day. In 2009, TGM terminated its
contract with YPF, TGM
’
s
only customer at the time, as a result of YPF
’
s repeated breaches. On December 22,
2017, YPF agreed to pay TGM, without recognizing any facts or
rights, US$114 million in order to end TGM
’
s claim against YPF. On April 16,
2018, after collecting payments made by YPF, TGM distributed
Ps1,153.20 million (US$57.03 million), from which we received
US$11,406,528 (Ps.230.64 million, at the exchange rate of that
moment and Ps.310.76 million at the current measurement unit as of
December 31, 2018), according to our equity interest in the
company.
Energía Sudamericana S.A.
Energía
Sudamericana S.A. is a private, unlisted company, engaged in
natural gas commercialization. We hold a 2.45% direct interest in
the capital stock of Energía Sudamericana S.A., and a 42.55%
indirect interest in its capital stock, through our equity interest
in IGCE. In the year ended December 31, 2018, Energía
Sudamericana S.A. did not account for any of our net
income.
The breakdown for
the Company
’
s total net
income for the year ended December 31, 2018 is as follows: (i)
Proener S.A.U. accounted for a loss equaling 0.04% of our net
income; (ii) CP Renovables accounted for a loss, without taking
into account the results of its subsidiaries, mainly CP Achiras and
CP La Castellana, equaling 0.13
% of our net
income; (iii) CP Achiras accounted for a loss equaling 1.56% of our
net income; (iv) CP La Castellana accounted for a loss equaling
3.30% of our net income; (v) TJSM accounted for 0.20% of our net
income; (vi) TMB accounted for 0.17% of our net income; (vii) the
Ecogas Group, which includes IGCU and IGCE (including a direct
interest in DGCE) accounted for 5.77% of our net income; (viii)
Vientos La Genoveva accounted for a loss equaling 0.25
% of our net
income; (ix) Vientos la Genoveva II accounted for a loss equaling
0.83% of our net income; (x) TGM accounted for a loss equaling
0.01% of our net income; (xi) CVOSA accounted for 0.21% of our net
income; and (xii) Central Puerto (on an unconsolidated basis)
accounted for 102.89% of our net income.
Business Overview
All of our
operations are concentrated in five complexes in Argentina, and our
portfolio can be divided into two types of electric power
generation plants: (i) electric power generation from conventional
sources and (ii) electric power generation from renewable
sources.
58
The table below
details certain operating features regarding the five primary
complexes for the periods indicated:
Continuing operations:
|
|
For the year ended December
31,
|
||
|
|
2018
|
2017
|
2016
|
|
Generation—GWh/year
|
|
|
|
|
Puerto
Complex
|
7,053
|
8,737
|
9,197
|
|
Luján de Cuyo
plant
|
2,996
|
3,170
|
3,092
|
|
Piedra del
Águila plant
|
4,209
|
3,719
|
2,351
|
|
La Castellana
I
|
148
|
-
|
-
|
|
Achiras
I
|
73
|
-
|
-
|
|
Total
|
14,479
|
15,627
|
14,639
|
|
Sales
under the Energía Base and electric power sales on the spot
market—GWh/year
|
|
|
|
|
Puerto
Complex
|
7,027
|
8,679
|
9,133
|
|
Luján de Cuyo
plant
|
2,923
|
3,158
|
3,085
|
|
Piedra del
Águila plant
|
4,209
|
3,719
|
2,351
|
|
La Castellana
I
|
-
|
-
|
-
|
|
Achiras
I
|
-
|
-
|
-
|
|
Total
|
14,159
|
15,557
|
14,569
|
|
Sales
under contract—GWh/year
|
|
|
|
|
Puerto
Complex
|
30
|
61
|
63
|
|
Luján de Cuyo
plant
|
86
|
101
|
63
|
|
Piedra del
Águila plant
|
-
|
-
|
-
|
|
La Castellana
I
|
148
|
-
|
-
|
|
Achiras
I
|
73
|
-
|
-
|
|
Total
|
344
|
162
|
126
|
|
Energy
purchases—GWh/year
|
|
|
|
|
Puerto
Complex
|
3
|
3
|
1
|
|
Luján de Cuyo
plant
|
13
|
90
|
55
|
|
Piedra del
Águila plant
|
-
|
-
|
-
|
|
Total
|
77
|
92
|
56
|
|
Steam
production (metric tons/year)
|
|
|
|
|
Luján de Cuyo
plant
|
1,102,515
|
1,177,661
|
1,114,908
|
|
Total
|
1,102,515
|
1,177,661
|
1,114,908
|
|
Natural
gas consumption—MMm
3
/year
|
|
|
|
|
Puerto
Complex
|
1,301
|
1,132
|
790
|
|
Luján de Cuyo
plant
|
599
|
605
|
454
|
|
Piedra del
Águila plant
|
-
|
-
|
-
|
|
Total
|
1,900
|
1,737
|
1,244
|
|
Gas
oil consumption—thousands of m
3
/year
|
|
|
|
|
Puerto
Complex
|
84
|
218
|
353
|
|
Luján de Cuyo
plant
|
-
|
-
|
-
|
|
Piedra del
Águila plant
|
-
|
-
|
-
|
|
Total
|
84
|
218
|
353
|
|
Fuel
oil consumption—thousands of tons/year
|
|
|
|
|
Puerto
Complex
|
288
|
643
|
939
|
|
Luján de Cuyo
plant
|
33
|
41
|
162
|
|
Piedra del
Águila plant
|
-
|
-
|
-
|
|
Total
|
321
|
684
|
1,102
|
|
Availability
of thermal units—% per year
(1)
|
|
|
|
|
Puerto
Complex
|
87.90
%
|
91
%
|
75
%
|
|
Luján de Cuyo
plant
|
89.77
%
|
93
%
|
81
%
|
|
Piedra del
Águila plant
|
100
%
|
100
%
|
100
%
|
|
Weighted
average for thermal units
|
88.77
%
|
91.70
%
|
76.22
%
|
|
Weighted
average for the Company
(1)
|
92.76
%
|
94.97
%
|
85.57
%
|
Source:
CAMMESA.
_____________
(1)
Weighted average
based on the power capacity of each unit.
59
Discontinued operations
(1)
:
|
|
For the year ended December
31,
|
||
|
|
2018 (1)
|
2017
|
2016
|
|
Generation—GWh/year
|
|
|
|
|
La Plata
plant
|
10
|
837
|
905
|
|
Total
|
10
|
837
|
905
|
|
Sales
under the Energía Base and electric power sales on the spot
market—GWh/year
|
|
|
|
|
La Plata
plant
|
10
|
355
|
309
|
|
Total
|
10
|
355
|
309
|
|
Sales
under contract—GWh/year
|
|
|
|
|
La Plata
plant
|
-
|
533
|
641
|
|
Total
|
-
|
533
|
641
|
|
Energy
purchases—GWh/year
|
|
|
|
|
La Plata
plant
|
-
|
51
|
45
|
|
Total
|
-
|
51
|
45
|
|
Steam
production (metric tons/year)
|
|
|
|
|
La Plata
plant
|
19,392
|
1,599,476
|
1,708,465
|
|
Total
|
19,392
|
1,599,476
|
1,708,465
|
|
Natural
gas consumption—MMm
3
/year
|
|
|
|
|
La Plata
plant
|
4
|
199
|
181
|
|
Total
|
4
|
199
|
181
|
|
Gas
oil consumption—thousands of m
3
/year
|
|
|
|
|
La Plata
plant
|
-
|
-
|
9
|
|
Total
|
-
|
-
|
9
|
|
Fuel
oil consumption—thousands of tons/year
|
|
|
|
|
La Plata
plant
|
-
|
-
|
-
|
|
Total
|
-
|
-
|
-
|
|
Availability—%
per year
(1)
|
|
|
|
|
La Plata
plant
|
100
%
|
85
%
|
91
%
|
Source:
CAMMESA.
_____________
(1)
Effective as of
January 5, 2018, we sold the La Plata plant to YPF EE. For further
information, see “
Item 4.A.
History and development of the Company
—La Plata Plant
Sale”. Figures only include information through January 5,
2018.
60
Additionally, the
table below details shows the availability features regarding the
three FONINVEMEM Plants for 2018:
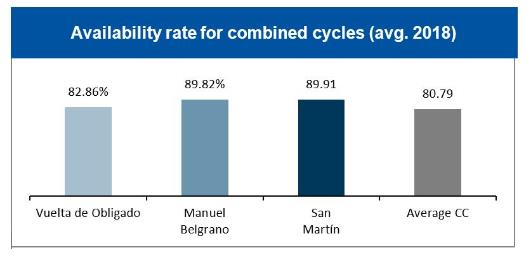
Source: Central
Puerto, CAMMESA
The following graph
shows the evolution of Central Puerto
’
s electric power generation for the
period 2014-2018:
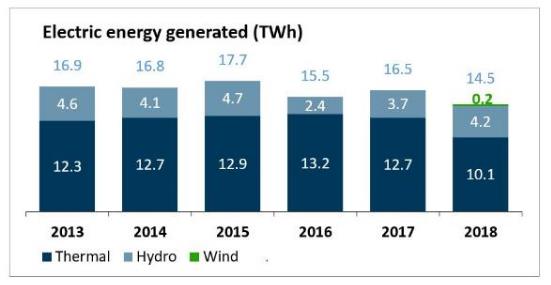
Source: CAMMESA.
The graph (i) includes generation of companies that were absorbed
by Central Puerto in 2014 (see Business Section
—
The 2014 merger) and (ii) excludes
the La Plata plant, which effective as of January 5, 2018, we sold
to YPF EE. For further information, see “
Item 4.A. History and development of the
Company
—La Plata Plant Sale”.
)
The reduction of the year 2018, was
influenced by (i) the sale of the La Plata Plant, and (ii) a
3-months long-term maintenance in our Puerto Combined Cycle
(765MW).
Electricity Generation from our Thermal Generation
Plants
As of December 31,
2018, we owned five thermal generation plants across two complexes:
Puerto Complex and Luj
á
n
de Cuyo. Effective as of January 5, 2018, we sold the La Plata
plant to YPF EE. For further information, see “
Item 4.A. History and development of the
Company
—La Plata Plant Sale”.
)
61
Puerto Complex
Our Puerto Complex
is composed of two facilities, Nuevo Puerto, including the Puerto
combined cycle plant, and Puerto Nuevo (collectively, the
“
Puerto
Complex
”
), located in the
port of the City of Buenos Aires on the bank of the Río de la
Plata. The two facilities are close to one another inside a complex
of 246,475 square meters with a total installed capacity of
1,714MW. Nuevo Puerto
’
s
facilities (which includes both the Nuevo Puerto plant and the
Puerto combined cycle plant) has 70,518 square meters. Puerto Nuevo
has approximately 92,370 square meters.
Nuevo
Puerto
’
s facilities were
completed in 1926 and Puerto Nuevo
’
s facilities were completed in 1930.
The two facilities were merged into a single company in the 1980s
within SEGBA, which was later converted to Central Puerto after the
privatization in 1992.
Nuevo Puerto is
located at Av. Thomas Edison 2001/2151 in the City of Buenos Aires
in the northern part of the complex and has two conventional steam
turbine generator sets (steam turbine units 5 and 6). The plant is
capable of running on natural gas and fuel oil and has a current
installed capacity of 360 MW.
The Puerto combined
cycle plant was built at Nuevo Puerto
’
s facilities and commenced
commercial operations in 2000. The Puerto combined cycle plant has
an installed capacity of 765 MW and is composed of two GE 9FA gas
turbines, two heat recovery steam generators and a GE D11 steam
turbine. The Puerto combined cycle plant is one of the most modern
and efficient plants in Argentina and is capable of running on
natural gas and gas oil. In addition, since 2011, the facilities
were modified to allow for the use of a blend of up to 20.00% gas
oil and biodiesel when running on liquid fuel.
Puerto Nuevo is
located at Av. Thomas Edison 2701 in the City of Buenos Aires in
the southern part of the complex and has three conventional steam
turbine generator sets (steam turbine units 7, 8 and 9). The plant
is capable of running on natural gas and fuel oil and has an
installed capacity of 589 MW.
Technology
. The
steam turbine generators at both facilities include turbines with
high, medium and low pressure stages that run on superheated steam
from a dedicated conventional heat generator. The steam turbine
generator works on a cycle. Water flows towards a heat generator
that creates steam. The expansion of the steam makes the turbine
rotate, triggering an electric power producing generator. Once the
steam has been used in the turbine, it is collected in condensers
where it returns to its liquid form, and the water flows again
towards the heat generator to produce more steam and feed the
turbine again.
The combined cycle
technology is one of the most efficient fossil fuel-based electric
power generation technologies available. It works by first feeding
each gas turbine with a mix of fuel and air. The gas that is
produced from this process expands rapidly due to combustion and
the generator and turbine ultimately convert the resulting
rotational energy into electric power. The exhaust gas from each
turbine is collected and channeled to a heat recovery steam
generator (HRSG) that uses the heat energy contained in the gas
turbine exhaust gas to produce steam. The steam that is produced is
injected into a steam turbine where it expands and transmits energy
to the turbine, which converts the energy into electric power
through a generator. Similar to the case of a conventional steam
turbine, the steam is condensed and sent back to the circuit to
produce more steam.
Location
. The
Puerto Complex is located inside the port of the City of Buenos
Aires and has a right-of-way to use the port facilities, allowing
it to receive and store fuel on a large scale. The liquid fuel (gas
oil, fuel oil and biodiesel) is delivered by ships that dock near
the premises, where the fuel is directly unloaded at the complex.
To provide operating flexibility, the Puerto Nuevo and Nuevo Puerto
facilities have underground connection systems, which are used to
move fuel between plants based on each plant
’
s delivery needs.
The Puerto
Complex
’
s location on the
bank of the Río de la Plata is also convenient in terms of
water supply, which is a basic input for our plants. Water is
integral both for creating steam and cooling the generation units.
Puerto Nuevo and Nuevo Puerto have water treatment facilities that
are capable of taking water from the river and delivering it at the
quality required for each stage of the electric power generation
process.
We currently own
the property where the Nuevo Puerto, Puerto combined cycle and
Puerto Nuevo plants are located.
Supply
. The
electric power produced at each plant is delivered to the SADI
through a transformer belonging to our generation units. The
transformer adjusts the generator output voltage to the voltage
required by the network. The electric power is delivered at 132 KV
sub-stations neighboring the plants, which are currently operated
by Edenor S.A. (the holder of the electric power distribution
concession in the area where the Puerto Complex is
located).
62
Luján de Cuyo Plant
The Luj
á
n de Cuyo plant is located in
Luj
á
n de Cuyo, Mendoza and
has an installed capacity of 509 MW. The plant began operating in
1971.
Technology
. The
Luj
á
n de Cuyo plant has
nine generating units, five gas turbines, four steam turbines and a
mini-hydroelectric turbine (which began operating in 2013). The
plant has a total installed capacity of 509 MW.
The main generator
is a combined cycle unit composed of a Siemens gas turbine (TG25)
and a Sk
ö
da steam turbine
(TV15). We believe this technology is state-of-the-art and our
combined cycle unit is highly efficient.
The plant also has
a combined heat and power (CHP) unit in place, which supplies 125
tons per hour of steam to YPF
’
s refinery in Luj
á
n de Cuyo under a steam provision
contract. The plant has two Alstom-branded Frame5-type gas turbines
(TG23 and TG24) and two HRSGs. The steam flows into YPF
’
s facilities through a steam duct
that connects the plant to the refinery. Both gas turbines can
operate on natural gas or gas oil.
There is also an
ABB combined cycle unit in place composed of two gas turbines
(TG21, TG22) and a steam turbine (TV14), which operates on natural
gas or gas oil, or on blends of gas oil and biodiesel (up to
30.00%). As of the date of this annual report, TG21 is out of
service and has been out of service since 2014. We are considering
whether to repair the unit and assessing the economic and financial
costs of such potential work. The capacity of this equipment was
not taken into account for purposes of describing the total
capacity of the Luj
á
n de
Cuyo plant in this annual report.
In 2013, a mini
hydroelectric turbine began operations under the GENREN program, a
renewable energy program sponsored by the
Ministerio de
Planificación
(Planning Ministry), (currently the
Ministry of Energy). The operation consists of a turbine and a 1 MW
Ossberger generator and relies on the waterfall inside the
Luj
á
n de Cuyo
plant
’
s premises to
generate energy. The waterfall is connected to the Mendoza River,
and the water from the waterfall is channeled towards the plant to
cool the steam turbine condensers.
In 2013, we also
made the necessary investments to generate and sell electric power
in the Energía Plus. To such end, we augmented the
combined-cycle facilities (TG25-TV15) to increase the power of the
generator assembly by 16 MW. Under the rules and regulations of the
Energía Plus, the generator buys the fuel to cover the
committed demand of electric power and supplies the energy to large
electric power consumers at market prices, denominated in U.S.
dollars, previously agreed between the generator and its clients.
Under these agreements, the generator needs to have a contract for
the supply of fuel for generation purposes to cover the committed
demand.
Location
. The
plant is located inside the Provincial Industrial park in
Luj
á
n de Cuyo, Mendoza.
The plant is close to other industrial facilities, including
YPF
’
s Luj
á
n de Cuyo refinery.
The premises on
which the Luj
á
n de Cuyo
plant is located are on the banks of the Mendoza River, a major
river in the Mendoza province. The Luj
á
n de Cuyo plant
’
s access to water from the Mendoza
River provides it with a source of water to supply the generation
process and to cool the condensers. The facility has a water
treatment plant with production levels suitable to meet its
requirements.
Supply
. The
electric power generated by the units installed in the
Luj
á
n de Cuyo plant is
delivered to the SADI through a connection between the network and
the Luj
á
n de Cuyo 132 KV
sub-station, which is adjacent to the plant. The sub-station is
operated by Distrocuyo, an operator of the trunk pipeline system
from the Cuyo region. Steam is delivered to YPF pursuant to
separate contract (apart from the La Plata plant YPF agreement)
through a short pipeline that connects our Luj
á
n de Cuyo plant with YPF
’
s adjacent Luj
á
n de Cuyo refinery.
Because the
Luj
á
n de Cuyo plant is
land-locked, liquid fuels must be transported by land, typically by
truck. To accommodate the fuel supply chain, the plant has an
unloading area for trucks with facilities equipped to receive gas
oil, fuel oil and biodiesel. YPF is required to supply natural gas
to be used on-site, and, in the event of a shortage, YPF is
required to supply gas oil for up to 45 days per year. The location
of the YPF-owned Luj
á
n de
Cuyo refinery makes the logistics process easier due to the
proximity of the Luj
á
n de
Cuyo refinery to the Luj
á
n
de Cuyo plant.
Maintenance
The plants have
repair shops, warehouses and facilities suitable for the operation
and maintenance of the units. Maintenance of the plants is
coordinated with CAMMESA in order to avoid shortage in the power
grid. Repair and maintenance procedures are key to the success of
our business and are conducted according to unit type by either our
own staff or under long-term service agreements executed with
leading global companies in the construction and maintenance of
thermal generation plants, such as (i) General Electric, which is
in charge of the maintenance of the Puerto combined cycle plant and
part of the Luj
á
n de
Cuyo-based units, and (ii) Siemens, which is in charge of the
maintenance of the combined cycle unit based in Luj
á
n de Cuyo, under a contract that
includes the provision of parts and labor.
63
Under long-term
service agreements, suppliers provide materials, spare parts, labor
and on-site engineering guidance in connection with scheduled
maintenance activities, in accordance with the applicable technical
recommendations.
Our own staff is in
charge of the maintenance of the steam turbine generator sets. We
maintain an inventory of the necessary spare parts on-site, which
ensures the immediate availability of parts when needed. This
reduces the time it takes to replace the spare parts while ensuring
a supply of spare parts that may no longer be available in the
market.
Our accurate
planning of in-house maintenance and outsourced maintenance by
General Electric and Siemens under the long-term service agreements
allows us to minimize downtime and reduce the government imposed
outage rate of the units, thus maximizing their
efficiency.
Fuel and Water Supply for Thermal Generation
Our conventional
resource plants operate on three different types of fuel: (i)
natural gas in all units, (ii) fuel oil in the steam turbines
exclusively and (iii) gas oil in the gas turbines and combined
cycle units. In addition, a mix of bio-diesel and gas oil may be
used in certain percentages in our dual combined cycle
units.
The table below
shows the potential consumption (calculated as the standard
consumption declared by CAMMESA based on the unit
manufacturer
’
s
specifications, assuming the unit produces energy throughout the
entire day) of fossil fuel by the units in the conventional
resource plants we owned as of December 31, 2018:
|
Plant
|
|
Unit
|
Natural gas (thousands of m
3
/day)
|
Gas oil (m
3
/day)
|
Fuel oil (tons/day)
|
|
Puerto combined
cycle
|
|
CEPUCC11
|
1,749
|
1,832
|
-
|
|
Puerto combined
cycle
|
|
CEPUCC12
|
1,749
|
1,832
|
-
|
|
Nuevo
Puerto
|
|
NPUETV05
|
830
|
-
|
715
|
|
Nuevo
Puerto
|
|
NPUETV06
|
1,610
|
-
|
1,458
|
|
Puerto
Nuevo
|
|
PNUETV07
|
1,100
|
-
|
888
|
|
Puerto
Nuevo
|
|
PNUETV08
|
1,421
|
-
|
1,178
|
|
Puerto
Nuevo
|
|
PNUETV09
|
1,629
|
-
|
1,393
|
|
Subtotal
Puerto
Complex
|
|
|
10,088
|
3,664
|
5,633
|
|
Luján de
Cuyo
|
|
LDCUCC22
|
250
|
246
|
-
|
|
Luján de
Cuyo
|
|
LDCUCC25
|
1,414
|
-
|
-
|
|
Luján de
Cuyo
|
|
LDCUTV11
|
450
|
-
|
412
|
|
Luján de
Cuyo
|
|
LDCUTV12
|
461
|
-
|
421
|
|
Luján de
Cuyo
|
|
LDCUTG23
|
69
|
67
|
-
|
|
Luján de
Cuyo
|
|
LDCUTG24
|
69
|
67
|
-
|
|
Subtotal
Luján de Cuyo
plant
|
|
|
2,713
|
380
|
833
|
|
Total
Central
Puerto
|
|
|
12,800
|
4,044
|
6,466
|
Our exposure to
changes in fuel prices is limited because, under the existing
regulations, the necessary fuel to produce our base energy is
supplied by CAMMESA without any charge. Similarly, in the case of
our PPA contracts, variations in the cost of fuel are taken into
account to determine the price of the electric power sold. In the
same way, the price that the generators receive for this energy is
determined by the Secretariat of Electric Energy, without
provisions for the price of the fuel supplied.
With respect to
water consumption, water has an associated cost only in certain
specific cases since we produce the necessary water with our own
facilities. In the case of the supply of steam to YPF
’
s Luj
á
n de Cuyo plant in Mendoza, we pay
for the water when the water consumption thresholds set forth in
the contract with YPF are exceeded.
Electricity Generation from our Hydroelectric Complex
Piedra del Águila
The Piedra del
Á
guila hydroelectric
complex is the largest private sector hydroelectric generation
complex in Argentina. It was completed in 1994 and is located
approximately 1,200 kilometers to the southwest of Buenos Aires at
the edge of Limay River and on the border of the Neuqu
é
n and Río Negro provinces.
Piedra del
Á
guila has an
installed capacity of 1,440 MW from four 360 MW generating
units.
Piedra del
Á
guila has a gravity dam
made of concrete, with a maximum height of 170 meters from its
foundation, a power plant with four generating turbines of 360 MW
each, intake and pipeline works, a spillway with an unloading
capacity of 10,000 cubic meters per second, river diversion works,
unloading equipment with a capacity of 1,500 cubic meters per
second, and construction facilities, including access roads, a
bridge and electric power supply. The dam is designed to be able to
accommodate two additional turbines of 360 MW, although, as of the
date of this annual report, we do not plan to have them installed
(they would provide the plant with increased power to supply demand
peaks, but would not change the electric power generated per year
since such generation depends on river water levels).
64
Water resources
allow Piedra del
Á
guila to
generate an average of 4,659 GWh per year (based on historical
operations between 1994 and 2018, exclusive of electric power
generated for internal use). During this period, the maximum
generation in a single year was 7,333 GWh in 2006 and the lowest
was 2,351 GWh in 2016.
The following table
shows the electric power generated by Piedra del
Á
guila during the period
1994-2018:
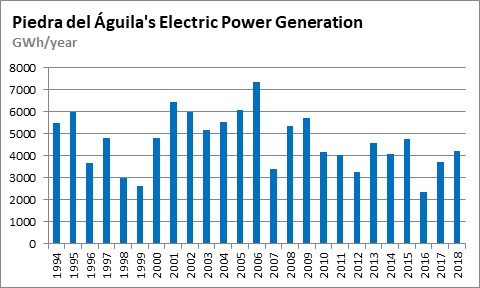
Source:
CAMMESA
The Dam
. The
Piedra del
Á
guila dam is
composed of approximately 2.8 million cubic meters of waterproof
concrete. It is 860 meters long and approximately 170 meters high
(from its foundation). The storage capacity of the dam totals 12
billion cubic meters, out of which six billion cubic meters are
usable, which would allow for 45 days
’
generation at a capacity of 1,440
MW on a 24-hour basis.
Safety of the
Paleochannel
. On the left bank of the dam there is a fluvial
valley filled with basalt, which we refer to as the
“
paleochannel.
”
This natural structure consists of
the second part of the river closing, which was made waterproof to
ensure stability. The paleochannel contained a potential leakage
zone on the left bank. To mitigate risks associated with this
potential leakage zone, a number of works were performed to reduce
drainage gradients and ensure stability prior to the initial
filling of the dam:
●
Cutoff Curtain
: To make
the alluvial fill between the bedrock and the basalt contact area
watertight, a cutoff curtain was created through grouting and
chemical injections from horizontal tunnels of about 1,200 meters
in length that were dug into the massif.
●
Diaphragm Wall
: This is
a transition concrete structure of about 150 meters in length that
connects the cutoff curtain to the dam.
●
Drainage Curtain
: This
is a horizontal tunnel of over 400 meters in length dug in the rock
massif that covers the entire transversal section of the
paleochannel, from which drillings were performed to capture the
leakage water that passes the cutoff curtain.
●
Drainage Wells
: These
consist of five vertical wells of about 40 meters in depth and five
meters in diameter located in a downstream area of the drainage
curtain, from which sub-horizontal holes were drilled directed
towards the basalt-alluvium contact to capture the water draining
through such highly permeable zone.
●
Pumping System
: This
consists of ten electric pumps installed in a gallery located in
the amphitheater (the area at the bottom of the paleochannel
massif) intended to maintain piezometric levels of one of the
existing aquifers in the alluvium at predetermined levels to ensure
the zone stability.
65
The Power
plant
. The hydroelectric generation plant is located at the
foot of the dam and has four Francis-type turbines with
corresponding generators, transformers for each generator and
operating, control and auxiliary equipment. The turbines are
hydraulic turbines composed of vertical axes with a spiral steel
casing. Each turbine has a rated capacity of 360 MW and a rated
hydraulic load of 350 cubic meters per second and is designed to
rotate at 125 rpm.
Each generator has
a corresponding set-up transformer of 500 kV, which consists of a
dual guide rod system, with a single SF-6 iron-isolated switch, to
which all generating units are connected. The switch is connected
to the SADI
’
s transformer
substation through two transmission lines. Energy is delivered at
Piedra del
Á
guila
’
s 500 KV plant, which is operated by
Compañ’a de
Transporte de Energía Eléctrica en Alta Tensión
S.A.
(
“
Transener
”
), which owns, operates and
maintains the largest high voltage electric power transmission
system in Argentina.
During the
shutdowns and start-ups of the power station, there are two 13.2 kV
lines in place that serve as auxiliary service related to the local
distribution network operated by Neuqu
é
n
’
s energy regulatory authorities, two
back-up generators, and two 110V stationary batteries, each of
which is capable of supplying electric power.
The operation and
maintenance of a hydroelectric plant are relatively simple compared
to the labor-intensive requirements of thermal plants. To operate
the plant, we mainly monitor the water flow, the electric power
generation and the related equipment. The plant
’
s operations staff is organized into
several departments: (i) civil engineering (in charge of monitoring
the equipment and the dam structure); (ii) operations (in charge of
monitoring the delivery of the electric power); (iii) special
services and technical support; and (iv) administration. Our
employees are in charge of plant maintenance.
Operation and
maintenance of the hydroelectric plant are managed in accordance
with manufacturers
’
recommendations and industry standards. To monitor management of
the plant, we use performance metrics specified in Standard 762 of
the Institute of Electrical and Electronics Engineers
(IEEE).
All ordinary
operation and maintenance tasks are performed by company personnel.
Electromechanical maintenance of generators and auxiliary equipment
focuses on fault prediction and prevention and is intended to
minimize corrective maintenance and maximize availability of the
generators.
Generators are
operated in accordance with the requirements of the
Organismo Encargado del
Despacho
(OED) (the
“
Dispatching Agency
”
) and in compliance with the
Normas de Manejo
de Aguas
(NMA
)
(Water Management
Standards). Water management and dam operation are overseen by the
Autoridad
Interjurisdiccional de Cuencas
(Intergovernmental Basin
Authority).
The status of the
dam and paleochannel is audited every five years by an independent
expert panel under the supervision of the
Organismo Regulador de
Seguridad de Presas
(ORSEP) (Dam Safety Regulator). Fish and
water quality are also monitored in the dam and tributaries at
least four times per year.
The HPDA Concession
Agreement
. We entered into a concession agreement with the
Argentine government that expires on December 29, 2023 (the
“
HPDA Concession
Agreement
”
). Under the
HPDA Concession Agreement, we are entitled to generate and sell
electric power and use certain state-owned property, including the
plant and its water resources. We can use the plant solely for the
purpose of generating electric power. The Argentine government and
the Intergovernmental Basin Authority are entitled to allocate or
use in any other manner the current or future water resources
without any obligation to compensate us. The HPDA Concession
Agreement and the rights granted therein may not be assigned
without the Argentine government
’
s prior consent. Upon the expiration
of the concession term, the Argentine government will recover
possession of the plant without any obligation to compensate us. We
currently intend to seek the renewal of the HPDA Concession
Agreement prior to its expiration.
Below we summarize
certain terms of the HPDA Concession Agreement:
●
Operations
: We are
required to comply with certain standards and conduct certain
activities, including maintaining Ps.2.7 million as a guarantee,
maintaining the plant and complying with certain safety and
environmental obligations, contributing to a repair fund,
maintaining books and maintaining insurance, among
others.
●
Mandatory works
: The
Argentine government may require us to carry out works jointly
funded by it and us.
●
Fees and royalties
: The
Intergovernmental Basin Authority is entitled to a fee of 2.50% of
the plant
’
s revenues, and
the provinces of Río Negro and Neuqu
é
n are entitled to royalties of 12.00%
of such revenues.
●
Indemnity
: The
Argentine government indemnifies us in certain circumstances,
including, among others, for damages or repairs that are not
attributable to us or our agents and damages caused by downstream
waters, in each case subject to certain conditions. We also
indemnify the Argentine government in certain
circumstances.
66
●
Fines
: Any delay or
failure by us to comply with the provisions of the HPDA Concession
Agreement or the regulations concerning the generation and sale of
electric power may result in fines imposed by the applicable
regulatory authorities, calculated as a percentage of the plant
annual revenues, depending on the type of breach. The Argentine
government may require that CAMMESA make payment of the fines
directly to the Argentine government out of proceeds from the
electric power sold in the WEM.
●
Termination
: We and the
Argentine government may terminate the HPDA Concession Agreement in
certain circumstances in which we fail to perform our obligations
under the agreement and in which we are subject to fines or do not
comply with the certain laws and regulations, among
others.
Supply
.
Substantially all of the electric power produced by Piedra del
Á
guila and other
generators in the Comahue area is transported to locations where
demand is higher. Demand is highest primarily in the Buenos Aires
metropolitan area, which is located some 1,200 kilometers away from
the plant. The distribution system from the Comahue region
comprises two corridors with a total of four 500 kV transmission
lines (the last of them started to operate in December 1999), in
addition to a fifth line that connects Comahue to the Cuyo region,
which started to operate in September 2011. Since the end of the
construction of these last two lines, the plants in the Comahue
region have been able to use the entire generation
capacity.
Relationship with
Provincial Governments
. As members of the governing body of
the Intergovernmental Basin Authority, the governments of
Neuqu
é
n and Río Negro
are involved in the regulatory oversight of the water resources
used by Piedra del
Á
guila.
In accordance with the HPDA Concession Agreement and Section 43 of
Law No. 15,336, we are required to pay a 12.00% royalty on the
revenues derived from electric power generation. This royalty is
distributed between the provinces of Neuqu
é
n and Río Negro in equal parts.
The government of Neuqu
é
n
owns a 4.13% stake in us.
Electricity Generation from our Wind Generation Plants
As of the date of
this annual report we operate two wind farms: La Castellana I and
Achiras I.
La Castellana I Wind Farm
La Castellana I is
a wind farm operated by CP La Castellana S.A.U., a wholly-owned
subsidiary of CP Renovables, in which we have a majority interest.
The wind farm is located in the south of the province of Buenos
Aires, near the cities of Villarino and Bahía Blanca, and
started its operations in August 2018.
It has a total
installed capacity of 99 MW, from 32 wind turbines, supplied from
Nordex-Acciona, of 3.15 MW each.
Achiras I Wind Farm
Achiras I is a wind
farm operated by CP Achiras S.A.U., a wholy-owned subsidiary of CP
Renovables, in which we have a majority interest. The wind farm is
located in the east of the province of Córdoba, near the city
of Achiras, and started its operations in September
2018.
It has a total
installed capacity of 48 MW, from 15 wind turbines, supplied from
Nordex-Acciona, of 3.2 MW each.
FONINVEMEM and Similar Programs
Following
Argentina’s economic crisis in 2001 and 2002 and the
subsequent devaluation of the peso, there were significant
imbalances between the electric power prices generators received
and their operating costs. As resources in the country’s
Stabilization Fund, a fund administered by CAMMESA intended to make
up for fluctuations between the seasonal price paid by distributors
and the spot price in the WEM, became scarce due to the Argentine
government’s decision to maintain seasonal prices (the energy
prices paid by distributors) below the spot price paid to
generators, the Argentine government, through a series of
resolutions, fixed a set of priorities with respect to payments
made from this fund. This resulted in a system under which
generators collected payment for only variable generation costs and
power capacity, while the resulting monthly obligations to
generators for the unpaid balance were to be considered
LVFVD.
In 2004, through
Resolution SE No. 826/2004, generators with receivables due to the
lack of funds in the Stabilization Fund (including us) were invited
to participate in forming the FONINVEMEM, created by Resolution SE
No. 712/04. The FONINVEMEM allowed electric energy generators to
link the collection of their outstanding receivables relating to
electric power sales to CAMMESA from January 2004 through December
2006 to one or more combined cycle projects, with a right to
receive payment of their receivables once the new combined cycle
plants built with FONINVEMEM financing become
operational.
In December 2004,
we agreed to participate in the creation of the FONINVEMEM. We
entered into an agreement on October 17, 2005, which stated that
generators would receive (i) their receivables relating to sales of
electric power from January 2004 through December 2006, amounting
to US$157 million in our case,
plus
an interest rate
of 360-day LIBOR (which as of December 31, 2018 was 3.005%)
plus
1.00%
in 120 equal, consecutive monthly installments and (ii) their
proportional equity interest in the generating companies formed for
such projects, TJSM and TMB, which are in charge of managing the
purchase of equipment, and of building, operating and maintaining
each of the new power plants, and after ten years of operation
would receive the property of these plants. The generation plants
are not owned by TJSM and TMB but rather owned by two trusts,
created by the Argentine government, that receive revenue from the
sale of electric power generated by the plants, among others, to
repay the LVFVD receivables.
67
On October 16,
2006, we entered into two pledge agreements with the former
Secretariat of Electric Energy to guarantee our performance
obligations in favor of the two trusts under certain construction
management and operation management agreements and provided as
collateral: (a) 100% of our shares in TJSM and TMB and (b) 50% of
the rights conferred by our LVFVD receivables for the duration of
the construction management agreement and the operation management
agreement.
On July 13, 2007,
we agreed to include 50.00% of our total receivables relating to
the sale of electric power to CAMMESA from January through December
2007 in the FONINVEMEM arrangement, which totaled US$30.3 million.
These receivables are also reimbursed in 120 equal, consecutive
monthly installments starting from the commercial launch date of
the plants, converted into U.S. dollars at the applicable exchange
rate pursuant to the FONINVEMEM arrangement, with an interest rate
of 360-day LIBOR (which as of December 31, 2018 was 3.005%)
plus
2.00%.
We received no additional equity interest in TJSM and TMB as a
result of the inclusion of these additional receivables in the
FONINVEMEM arrangement.
After the
commercial authorization was granted to the Manuel Belgrano power
plant (on January 7, 2010) and the San Martín power plant (on
February 2, 2010), we started to collect monthly payments of the
receivables. As of December 31, 2018, the balance owed to us under
the FONINVEMEM arrangement relating to the sale of electric power
to CAMMESA from January 2004 through December 2007 totaled US$23.83
million. During the year ended December 31, 2018, we received
Ps.515.26 million (US$ 19.81 million in U.S. dollar-denominated
payments) in principal and Ps.33.14 million (US$ 1.31 million in
U.S. dollar-denominated payments) in interest for these receivables
(including VAT).
We own 30.8752 % of
TJSM and 30.9464 % of TMB. The operating companies have a variable
revenue (US$1.00 per MW generated) and a fixed revenue to
compensate for their operating costs. In 2018, we received
dividends from our equity interests in TJSM and TMB in the amount
of Ps.31.00 million and Ps.22.78 million, respectively, in nominal
terms.
With respect to the
sale of electric power to CAMMESA from 2008 to 2011, on December
28, 2010, our Board of Directors approved an agreement with the
former Secretariat of Electric Energy that established, among other
agreements, a framework to determine a mechanism to settle
receivables accrued by generators over the 2008-2011 period. For
that purpose, (i) the construction of the new generation plant,
CVOSA, was agreed upon, with receivables earned from January 1,
2008 through December 31, 2011 to be paid starting as of the
commercial launch date of the CVOSA plant
’
s combined cycle unit; (ii) a
managing company for this project, CVOSA, was created in which we
hold a controlling interest and (iii) a trust was created by the
Argentine government to hold the property of the plant under
construction. The combined cycle unit commenced operations on March
20, 2018.
After the CVOSA
power plant became operational, in the case of receivables accrued
between 2008 and September 2010, the amount due was converted into
U.S. dollars at the exchange rate effective at the date of the CVO
agreement (i.e., November 25, 2010), which was Ps.3.97 per U.S.
dollar. Additionally, certain receivables that accrued after
September 2010 and that were also included in the CVO Agreement,
were converted into U.S. dollars at the exchange rate effective at
the due date of each monthly sale transaction. The total estimated
amount due to us under the Agreement for the LVFVD 2008-2011 is
US$548 million (including VAT), plus the accrued interests after
the CVO Commercial Approval. As a result of the conversion of the
LVFVD into U.S. dollars detailed in the previous paragraph, we had
a one-time gain, before income tax, of Ps. 11,017 million, measured
in current unit as of December 31, 2018 (or Ps. 7,959 million,
expressed in nominal terms), at an exchange rate of Ps. 20.17 to
US$1.00, which was the spot bid exchange rate reported by the Banco
de la Naci
ó
n Argentina for
wire transfers (
divisas
) as of March
20, 2018, which was recognized by us in the consolidated income
statement for the year ended December 31, 2018. under “CVO
receivables update”. Under the CVO Agreement, we are entitled
to receive payment for the LVFVD 2008-2011 receivables in the form
of 120 equal, consecutive monthly installments, starting from March
20, 2018, the date of commencement of commercial operations of the
combined cycle plant, bearing interest at a nominal annual rate of
30-day LIBOR (which as of December 31, 2018 was 2.503%)
plus
5.00%.
The U.S. denominated monthly payments under the CVO Agreement are
payable in pesos, converted at the applicable exchange rate in
place at the time of each monthly payment.
As of March 20,
2018, CAMMESA granted the CVO Commercial Approval in the WEM, as a
combined cycle, of the thermal plant Central Vuelta de Obligado. A
PPA between the CVO Trust and CAMMESA, through which the CVO Trust
makes energy sales and, consequently, receives the cash flow to pay
the trade receivables, had to be signed in order to start the
collections.
68
The PPA agreement
was signed on February 7, 2019, with retroactive effect to March
20, 2018.
As a result, the
original amortization schedule from the CVO Agreement is in full
force and effect.
The unpaid
installments corresponding to the March-December 2018 period add up
to US$ 78.15 million (including VAT, corresponding to installments
1 to 10). As of the day of this annual report, we continue in
negotiations with CAMMESA to collect such unpaid amounts as soon as
possible, plus the accrued interest between each due date and the
effective payment date.
Despite the
referred unpaid installments, as of the date of this annual report,
we received the payment related to January and February 2019
(corresponding to installments 11 and 12, respectively) pursuant to
the CVO Agreement’s original disbursement schedule, at the
exchange rate of the last date of each month, on its respective due
dates, in March and April 2019, respectively. In accordance with
the agreements for each project, after the first ten years of
operation, ownership of the combined cycle plants will be
transferred from the respective trusts to the operating companies,
and the operating companies will begin to receive the revenue from
the sale of electric power generated by the plants. At such time,
since the Argentine government financed part of the construction,
it will be incorporated as shareholder of TJSM, TMB and CVOSA, and
our interests in TJSM, TMB and CVOSA will be significantly diluted.
In the case of TJSM and TMB, we cannot estimate the exact effects
of such potential dilution due to the fact that the Argentine
government
’
s stake in
these companies depends on the funds provided by the Argentine
government for the construction of each plant, which has not yet
been defined. In the case of CVOSA, although the effect of the
potential dilution has also not yet been defined for the same
reasons, the Argentine government
’
s stake in CVOSA will be at least
70% due to an agreement between the parties. Any dilution of our
interest in TJSM, TMB or CVOSA could reduce our income, which could
adversely affect our results of operations. See
“Item 4.B.
Business
Overview
—
FONINVEMEM and
Similar Programs.
”
See
“Item 3.D.
Risk
Factors
—
Our interests in
TJSM, TMB and CVOSA will be significantly diluted.
”
Market Area and Distribution Network
Market Area
Our plants are
located at various locations in Argentina. All of them are
connected to the SADI, enabling coverage for residential and
industrial users nationwide. The following graphic breaks down
where our plants are located in Argentina and the energy generation
capacity of each plant:
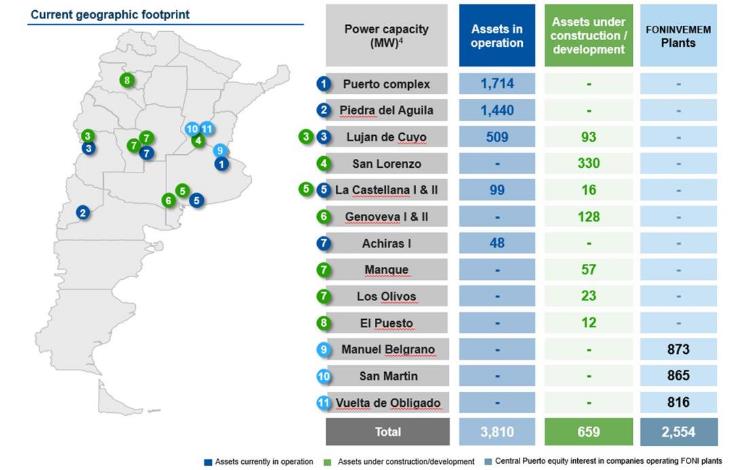
69
(1)
“
Assets under
construction/development
”
refers to (a) the wind farms La Castellana II, La Genoveva II,
Manque (previously a part of Achiras II), Los Olivos (previously a
part of Achiras II) and La Genoveva I, which are under construction
and are expected to be finished in the third quarter of 2019,
fourth quarter of 2019, first quarter of 2020, and second quarter
of 2020, respectively; (b) the Luj
á
n de Cuyo co-generation unit, which
is under construction and is expected to be finished in the fourth
quarter of 2019; (c) the Terminal 6 Plant, which is under
construction and is expected to be finished in the second quarter
of 2020; and (d) the solar farm El Puesto, which is under
development and is expected to be finished in the third quarter of
2020.
(2)
“
FONINVEMEM Plants
”
refers to the plants
Jos
é
de San Martín,
Manuel Belgrano and Vuelta de Obligado that we expect to be
transferred from FONINVEMEM trusts to the operating companies,
TJSM, TMB and CVOSA, respectively, after the first ten years of
operation as a result of the FONINVEMEM program and other similar
programs. For a description of when we expect this transfer to
occur and other information, see
“Item 4.B.
Business
Overview
—
FONINVEMEM and
Similar Programs.
”
(3)
The graphic
excludes the La Plata plant which, effective as of January 5, 2018,
we sold to YPF EE. For further information, see “Item 4.A.
History and development of the Company—La Plata Plant
Sale.”
(4)
Power capacity
numbers have been rounded. The power capacity with respect to the
assets under construction/development is the expected power
capacity.
Note: Numbers on
the map have been round-up.
Puerto plants
: The
Puerto Nuevo, Nuevo Puerto and Puerto combined cycle plants are
situated in a unique location within the port of the City of Buenos
Aires, one of the most populated metropolitan areas in the world,
which reduces costs arising from lost power during transmission. In
addition, the plants have three docks for unloading liquid fuels
from large vessels, thus facilitating the supply of
fuel.
Luján de Cuyo
plant
: The Luj
á
n de
Cuyo plant is located within YPF
’
s Luj
á
n de Cuyo refinery and supplies steam
to such refinery. This location enables it to obtain gas oil
supplies from the refinery itself in case of natural gas
shortages.
Piedra del Águila
Hydroelectric Complex
: the Piedra del
Á
guila hydroelectric complex is
located on the Limay river, which serves as the border between the
Provinces of Río Negro and Neuqu
é
n. The dam is close to the city of
Neuqu
é
n and is able to
supply energy to cities far from the complex through existing
transmission lines.
La Castellana I Wind Farm
: La
Castellana I wind farm is located in the province of Buenos Aires,
near the cities of Villarino and Bahía Blanca.
Achiras I Wind Farm
: Achiras I wind
farm is located in the province of Córdoba, near the City of
Achiras.
Distribution Network
All of our plants
are connected to the SADI, which allows us to reach almost all the
users in the country. The SADI permits interaction among all agents
in the Argentine WEM and allows generating companies to dispatch
power to Large Users and distributors through the transmission
companies. The system is regulated and allows participation of all
WEM agents (generators, transmission companies, distributors, Large
Users and the Argentine government through CAMMESA), thus
preventing discrimination among any involved
participants.
The prices for
power transmission are regulated and based on the distance from the
generating company to the user, among other factors. In this
regard, our thermal power plants are strategically located in
important city centers or near some of the system
’
s largest customers (
e.g.
, YPF
’
s refineries), which constitutes a
significant competitive advantage.
Our Customers
|
|
|
|
For the year ended December
31,
|
|
|
Modality
continuing operations
|
|
Main
clients
|
2018
|
|
|
|
|
|
(in thousands of Ps.)
|
percentage of revenues
|
|
Energía
Base
(1)
(Resolution SE No. 19/2017, SGE 70 and 95/2013, as
amended)
(2)
(3)
|
|
CAMMESA
|
12,667,903
|
88.80%
|
|
RenovAr Program
sales under contracts
|
|
CAMMESA
|
599,314
|
4.20%
|
|
Term market sales
under contracts
|
|
CAMMESA,
Compañ’a Mega S.A., IEASA
|
52,666
|
0.37%
|
|
Energía Plus
sales under contracts
|
|
Pirelli
Neumáticos S.A., Banco de Galicia y Buenos Aires S.A.,
PBBPolisur S.A.Metrive S.A. Pet Food Saladillo S.A., Banco
Supervielle S.A.
|
244,822
|
1.72%
|
|
Steam
sales
|
|
YPF
|
245,950
|
1.72%
|
|
Resale of gas
transportation and distribution capacity
|
|
YPF
|
193,889
|
1.36%
|
|
Revenues from CVO
thermal plant management
|
|
Fideicomiso Central
Vuelta de Obligado
|
260,826
|
1.83%
|
(1)
As of March 1,
2019, a new remuneration scheme for Energía Base came into
force with Resolution SRRyME No. 1/19. For more information
see “
Item 4.B. Business
Overview—
The Argentine Electric Power
Sector
—
Remuneration
Scheme
—
The Current
Remuneration Scheme.”
70
(2)
Includes income
under Res. SEE 70/18. See “
Item
4.B. Business Overview—
The Argentine Electric Power
Sector
—
Remuneration
Scheme
—
The Current
Remuneration Scheme
—
Resolution SEE 70/18 - Option to
purchase fuel for units under Energía Base Regulatory
Framework.”
(3)
Includes (i) sales
of energy and power not remunerated under Resolution No. 95 and,
(ii) remuneration under Resolution No. 724/2008 relating to
agreements with CAMMESA to improve existing Argentine power
generation capacity., (iii) additional trust remuneration revenues
in the form of LVFVD from CAMMESA, and (iv) non-recurring
maintenance remuneration revenues in the form of LVFVD from
CAMMESA. See
“Item 4.B. Business
Overview—
The Argentine Electric Power
Sector
—
Structure of the
Industry
—
Shortages in the
Stabilization Fund and Responses from the Argentine
Government
—
The National
Program
” and “Item 5.A.
Operating Results—Our Revenues—The Energía
Base.”
For a discussion of
the different regulatory regimes under which we sell our electric
power, see
“Operating and
Financial Review and Prospects—
Factors Affecting our
Results of Operation
—
Our
Revenues
”
and
“Item 4.B. Business
Overview—
The Argentine Electric Power
Sector
—
Structure of the
Industry.
”
Seasonality
Seasonality of Electricity Generation by Thermal
Facilities
The following
graphic breaks down our average thermal energy production from our
continuing operations over the last three years on a month-by-month
basis:
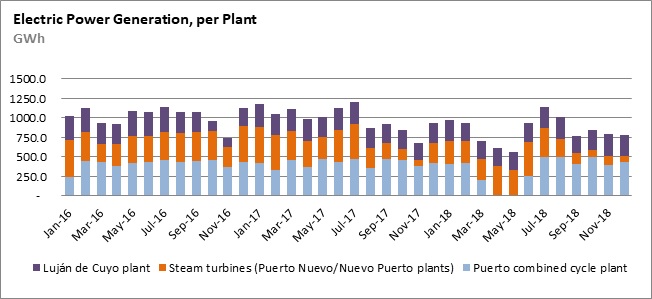
Source:
CAMMESA
Seasonality of Water Resources and Electricity Generation of Piedra
del Águila
The availability of
water is the key factor for determining Piedra de
Á
guila
’
s electric power generation capacity
and is tied to annual and seasonal changes in rains in the upstream
mountain area of Piedra del
Á
guila. Water levels generally
increase between May and December due to the winter rains and the
spring thaw, and we are able to produce more energy over such
periods.
71
The following
graphic breaks down our average hydroelectric energy production
over the last three years on a month-by-month basis:
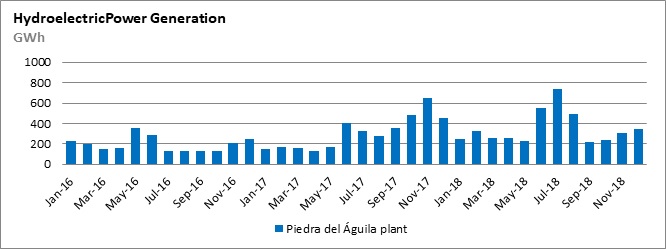
Source:
CAMMESA
Seasonality of Wind Resources and Electricity Generation of Achiras
I and La Castellana I wind farms
The availability of
wind resources is the key factor for determining Achiras I and La
Castellana I wind farms electric power generation capacity and is
tied to annual and seasonal changes in wind speed in the areas
where both farms are located. Wind speed is generally higher
between May and September and we are able to produce more energy
over such periods.
The following
graphic shows the energy production of our wind farms on a
month-by-month basis starting October 2018 (first full-month of
operation):

Source:
CAMMESA
Competition
The demand for
electric power in Argentina is served by a variety of generation
companies, both state-owned and private-owned. These companies
pursue the right to supply generation capacity and electric power
and to develop projects to serve the demand for electric power in
Argentina. Some of our foreign competitors are substantially larger
and have substantially greater resources than our company. Because
of the significant gap between the demand and supply of electric
power in Argentina (which has resulted in voluntary and forced
blackouts at times of seasonal peak consumption), there has not
been significant competitive pressure in the Argentine electric
power sector over the past 12 years. During 2017 (and particularly,
on February 24, 2017 pursuant to CAMMESA
’
s records), there was a historic
demand peak recorded totaling 25.6 GW, which was supplied by 24.6
GW of capacity domestically (out of a total installed capacity of
34.5 GW) and the remainder from Brazil and Uruguay. In 2018, 344
GWh of energy were imported, representing a 53.19 % decrease in
energy imports as compared to 2017.
Our primary
competitors in the electric power generation market are the Enel
group, AES Argentina Generaci
ó
n S.A. (an affiliate of the AES
Corporation) and Pampa Energía S.A.
72
Below we detail the
installed capacity of the main private sector generators in
Argentina:
|
Company and
subsidiaries
|
Power
(MW)
|
|
Central
Puerto
|
3,810
(1)(2)
|
|
The AES
Corporation
|
3,403
(3)
|
|
Grupo
Enel
|
3,941
(4)(2)
|
|
Pampa Energía
S.A.
|
3,871
(5)
|
Sources: (1) Based
on the documentation officially declared to CAMMESA by Central
Puerto for continuing operations (2) Based on company
’
s financial statements as of and for
the year ended December 31, 2018 and data from CAMMESA. (3) Based
on data form CAMMESA. Accounts for only assets located in
Argentina, operated by any of the following subsidiaries: AES
Argentina Generaci
ó
n S.A.,
AES Juramento S.A., AES Alicura S.A., AES Parana S.A. and
Termoandes S.A. (4) Based on data from CAMMESA. Includes Enel
Generaci
ó
n Costanera S.A.,
Enel Generaci
ó
n El
Choc
ó
n S.A. and a 40.00%
stake of Grupo Enel in Central Dock Sud S.A. (5) Based on
company’s financial statements as of and for the year ended
on December 31, 2018.
The following
graphs break down the market share of electric power generation
supplied by private sector companies in Argentina as of December
31, 2018, based on data published by CAMMESA:
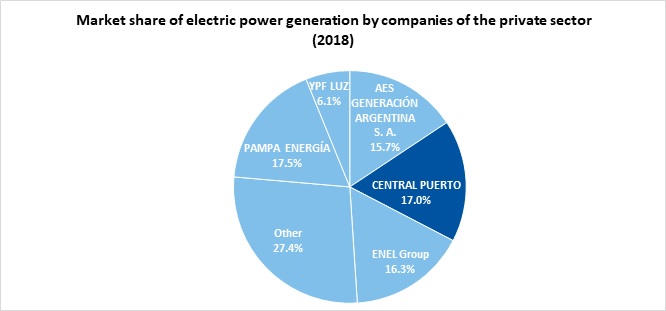
Source:
CAMMESA
73
The following
graphs break down total market share of electric power generation
supply and the market share from thermal units (from both private
and public sector generators) in Argentina as of December 31, 2018,
based on data published by CAMMESA:
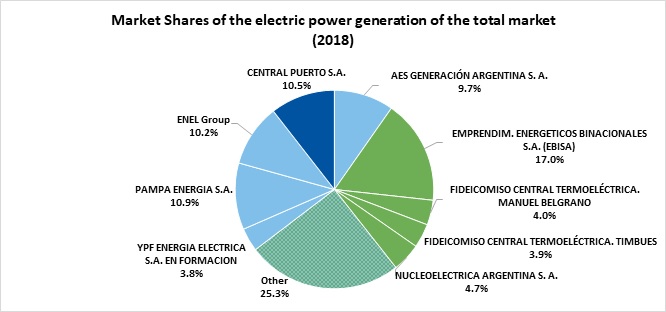
Source:
CAMMESA
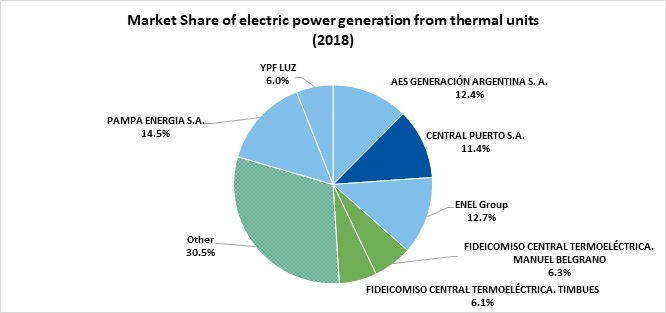
Source:
CAMMESA
The following table
shows the installed capacity in terms of MW assigned to each
regulatory framework (Energía Base, Energía Plus,
Resolution No. 220/07) for us and each of our main competitors as
of December 31, 2018:
|
In
MW
|
Energía
Base
|
Term
market
|
RenovAr
|
Res.
220/07
|
Energía
Plus
|
Total
|
|
Central
Puerto
(1)
|
3,640
|
7
|
148
|
-
|
16
|
3,810
|
|
AES Argentina
Group
|
2,989
|
-
|
-
|
-
|
305
|
3,294
|
|
ENEL
Group
|
3,941
|
-
|
-
|
-
|
-
|
3,941
|
|
Pampa Energía
S.A.
(2)
|
3,355
|
-
|
100
|
135
|
281
|
3,871
|
Our efficiency
levels compare favorably to those of our competitors due to our
efficient technologies. The following chart shows the efficiency
level of our most important generating units compared to the units
of the rest of the market based on heat rate, which is the amount
of energy used by an electrical generator or power plant to
generate one kWh of electric power:
74
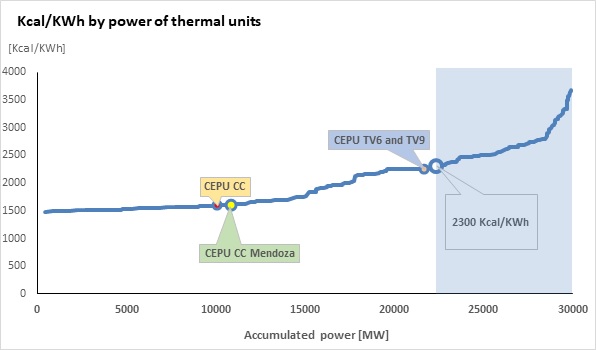
Source:
CAMMESA’s seasonal programing for the period Nov-18 to
April-19.
We are also one of
the largest consumers of natural gas in Argentina
’
s electric power sector, as well as
the one of the largest consumers of fuel oil, gas oil and
biodiesel. Although CAMMESA is our current supplier of biodiesel,
we have developed business relationships over the years with
strategic companies from the oil and gas and the biofuel sectors,
and in the past have participated in certain joint ventures with
some of them.
Insurance
We carry commercial
and personal insurance coverage for all power generation plants,
placed at different geographical locations within Argentina. The
following list includes all the insurance risk
covered:
●
Comprehensive operational
risk (physical property) and Loss of Profits
: Our coverage
extends to comprehensive operational risk, buildings, machinery
damages and breakdown, fire and acts of nature, among others, due
to sudden or accidental cause, directly or indirectly attributable
to any cause (including damages as a result of earthquakes at the
Piedra del
Á
guila and
Luj
á
n de Cuyo plants, in
which case there is a deductible of the greater of 5.00% of the
damages or US$1 million), including consequential lost profits due
to breakdown or damages to fixed assets for a maximum period of 18
months.
●
Primary
liability
: Our coverage extends to third party liability
against property damages, personal injuries or death resulting from
the development of the insured party
’
s activities up to US$10,000,000 per
generation plant.
●
Excess
liability
: Our coverage extends to third party liability
against property damages, personal injuries or death resulting from
the development of activities at any of the four locations of the
generation plants for up to US$50,000,000 in excess of the primary
liability coverage described in the previous bullet
point.
●
Port
liability
: In our capacity as port terminal operator, we
carry insurance covering our fuel loading and unloading operations
conducted at the port terminal, including consequential losses and
sudden and accidental pollution.
●
Directors
and officers liability
: We carry directors and officers
liability insurance against potential claims against such directors
and officers.
●
Vehicle
insurance
: Our insurance covers third party liability for
claims against the insured party for personal injuries or property
damages and physical damages to the insured vehicle as a result of
an accident, fire, robbery of theft.
75
●
Worker’s
compensation
: This policy provides coverage against any
accident occurring at work and such accidents occurring while
employees are commuting to the workplace.
●
Mandatory
life insurance
: This policy covers the death of
employees.
●
Optional
life insurance
: This policy covers total or permanent
disability due to disease or accident and partial losses due to
accident.
●
Transportation
:
This policy covers losses or damages resulting from collision,
overturn, fall or derailment of the carrier and other
catastrophes.
●
Combined
and comprehensive
: This policy covers the offices and
warehouses in the city of Neuqu
é
n. It provides coverage against
certain catastrophes.
●
Compulsory Environmental
Pollution Insurance
: This coverage protects against third
party personal injury; third party property losses; ecological
damage and costs incurred in provision of emergency services and
environmental clean-up.
In addition, we
intend to obtain customary insurance coverage for our electric
power generation plants currently under construction, as
appropriate.
We believe the
level of insurance and reinsurance coverage we maintain is
reasonably adequate in the light of the risks we are exposed to,
and is comparable to the level of insurance and reinsurance
coverage maintained by other similar companies doing business in
the same industry.
Environment
As of the date of
this annual report, we are not involved in pending or threatened
judicial proceedings in connection with environmental
issues.
As of the date of
this annual report, we have obtained or have applied for the
environmental permits required by the applicable environmental
regulations and our environmental management plans have been
approved by the applicable regulatory authorities. To maintain high
environmental standards, we carry out periodic controls in
accordance with applicable legislation.
We have developed a
broad environmental compliance and management program, which is
subject to periodic internal and external audits by T
Ü
V Rheinland.
In order to comply
with these policies, we routinely obtain quality certifications. In
September 2018, T
Ü
V
Rheinland completed a series of ISO recertification audits, after
which we were awarded the following certificates:
●
Puerto
Complex:
●
ISO 14001/2015:
Certificate No. 01 10406 1629668 good through July 12, 2019 (Nuevo
Puerto, Puerto Nuevo and Puerto combined cycle plants)
●
Luj
á
n de Cuyo plant:
●
ISO 14001/2015:
Certificate No. 01 10406 1629668 good through July 12,
2019
●
Piedra del
Á
guila plant:
●
ISO 14001/2015:
Certificate No. 01 10406 1629668 good through July 12,
2019
Additionally,
pursuant to Section 22 of Argentina
’
s Environmental Policy Law No.
25,675, any individual or legal entity, whether public or private,
engaged in activities that endanger the environment, ecosystems and
their constituent elements, including us, must carry insurance for
an amount sufficient to cover the cost of repairing the damages
such individual or legal entity may cause. We fully comply with
this regulation.
Security and Health
In managing
occupational safety and health we seek to protect people and our
own and third parties’ property, assuming that:
76
●
all accidents and
occupational diseases can be prevented;
●
compliance with
applicable occupational and health standards is the responsibility
of all individuals participating in activities in our facilities;
and
●
raising awareness
among individuals contributes to the welfare at the workplace and
to the improved individual and collective development of the
members of the work community.
Our commitment to
ongoing improvement compels us to review the sufficiency of our
current policy and its stated goals on an ongoing basis to ensure
conformance to the changes required by the market and the
applicable laws.
In order to comply
with these policies, we routinely pursue quality certifications. In
May 2016, T
Ü
V Rheinland
completed a series of ISO recertification audits, after which we
were awarded the following certificates:
●
Puerto
Complex:
●
ISO 9001/2015:
Certificate No. 01 10006 1629668 good through July 12, 2019 (Puerto
combined cycle plant)
●
Luj
á
n de Cuyo plant:
●
ISO 9001/2015:
Certificate No. 01 10006 1629668 good through July 12,
2019
●
Piedra del
Á
guila plant:
●
ISO 9001/2015:
Certificate No. 01 10006 1629668 good through July 12,
2019
●
OHSAS 18001/2007:
Certificate No. 01 11306 1629669 good through July 13,
2019
Integrated Management System with ISO Certifications
Our management has
put an integrated management system (
“
IMS
”
) in place for its electric power
and steam generation plants in order to meet the needs and
requirements of our internal policies and goals, as well as the
needs and requirements of our clients, the applicable laws and
regulations and ISO standards, namely, ISO 9001/2015 (quality), ISO
14001/2005 (environment) and OHSAS (Occupational Health and Safety
Assessment Series) 18001/2007 (occupational safety and health). Our
IMS is certified by renowned international entities and audited
from time to time, as required by the aforementioned
standards.
The IMS seeks to
achieve the following goals:
●
equip the plants
with useful and proactive management tools;
●
ensure process
quality;
●
satisfy
clients
’
requirements;
●
pursue ongoing
improvement in processes;
●
safeguard people
and our own and third party
’
s property;
●
prevent
pollution;
●
make efficient use
of resources;
●
preserve the
ecological balance; and
●
improve life
quality.
We identify the
processes and the necessary support for the accurate operation of a
sustainable, participatory and bureaucracy-free IMS that is useful
for implementing the principles established by management with
respect to environmental, quality, and occupational safety and
health policies and for ensuring the availability of human,
material and financial resources. We have used a management model
based on planning-doing-checking-acting in order to guarantee the
maintenance and ongoing improvement of the IMS in our facilities,
which involves one or several of the following
systems:
77
●
Quality Management
System
●
Environmental
Management System
●
Occupational Safety
and Health Management System
The individual
scope of the IMS at each plant is as follows:
●
Puerto
Complex:
●
Nuevo Puerto plant:
Environmental Management System with ISO 14001/2015
certificate
●
Puerto Nuevo plant:
Environmental Management System with ISO 14001/20015
certificate
●
Puerto combined
cycle plant: Environmental Management System with ISO 14001/2015
certificate and Quality Management System with ISO 9001/2015
certificate
Certification
body:
From 2004 through
2015: IRAM
From 2016-2019:
T
Ü
V Rheinland
●
Luj
á
n de Cuyo plant: Environmental
Management System with ISO 14001/2015 certificate and Quality
Management System with ISO 9001/2015 certificate
Certification
body:
From 2004 through
2015: SGS
From 2016 through
2019: T
Ü
V
Rheinland
●
Piedra del
Á
guila plant:
Environmental Management System with ISO 14001/2004 certificate,
Quality Management System with ISO 9001/2008 certificate and
Occupation Safety and Health Management System with OHSAS
18001/2007 certificate
Certification
body:
From 2004 through
2015: IRAM
From 2016 through
2018: T
Ü
V
Rheinland
It is our policy
that the IMS be reviewed upon a change to our organizational
structure, operating procedures, processes or facilities and that
it be updated as applicable. Once updated, the IMS is subject to a
comprehensive review considering the existing interrelations to
avoid overlap or omissions. Where no changes have occurred, the IMS
is reviewed every five years, unless a new version of the reference
ISO or OHSAS standards is released during that period, in which
case the IMS is adjusted to conform to the new
standards.
The Argentine Electric Power Sector
The following is a summary of certain matters relating to the
electric power industry in Argentina, including provisions of
Argentine laws and regulations applicable to the electric power
industry and to us. This summary is not intended to constitute a
complete analysis of all laws and regulations applicable to the
electric power industry. Investors are advised to review the
summary of such laws and regulations published by the Ministry of
Energy and Mining (former Secretariat of Electric Energy)
(www.minem.gob.ar), CAMMESA (www.cammesa.com.ar) and the Ente
Nacional Regulador de la Electricidad (Argentine Electricity
Regulatory Entity, or “ENRE”) (www.enre.gob.ar) and to
consult their respective business and legal advisors for a more
detailed analysis. None of the information on such websites is
incorporated by reference into this annual report.
78
History
During the majority
of the second half of the 20th century, the assets and operation of
the Argentine electric power sector were controlled by the
Argentine government. By 1990, virtually all of the electric power
supply in Argentina was controlled by the public sector (97% of
total generation). The Argentine government had assumed
responsibility for the regulation of the industry at the national
level and controlled all of the national electric power companies.
In addition, several Argentine provinces operated their own
electric power companies. As part of the economic plan adopted by
former President Carlos Menem, the Argentine government undertook
an extensive privatization program of all major state-owned
industries, including those in the electric power generation,
transmission and distribution sectors. Argentine Law No. 23,696
passed in 1989 (the
“
Federal Reform Law
”
) declared a state of emergency for
all public services and authorized the Argentine government to
reorganize and privatize public companies. The privatization had
two ultimate objectives: first, to reduce tariffs and improve
service quality through free competition in the market, and second,
to avoid the concentration of control of each of the three
subsectors of the market in a small group of participants and
thereby reduce their ability to fix prices. Separate limitations
and restrictions for each subsector were imposed in order to reach
these goals. In accordance with the Federal Reform Law, Decree No.
634/1991 established guidelines for the decentralization of the
electric power industry, for the basic structure of the electric
power market, and for the participation of private sector companies
in the generation, transmission, distribution and administration
sub-sectors.
General Overview of Legal Framework
Key Statutes and Complementary Regulations
The body of rules
that constitutes the basic regulatory framework of the Argentine
electric power sector currently in force are the following: (i) Law
No. 15,336, enacted on September 20, 1960, as amended by Law No.
24,065, passed on December 19, 1991, partially promulgated by
Decree No. 13/92, and regulated by Decree No. 1398/92 and Decree
No. 186/95 (collectively, the
“
Regulatory Framework
”
), (ii) Law 24,065 implemented
privatizations of government-owned companies in the electric power
sector and separated the industry vertically into four categories:
generation, transmission, distribution and demand, and it also
provided for the organization of the WEM (described in greater
detail below) based on the guidelines set forth in Decree No.
634/91; and (iii) Decree No. 186/95 also created the notion of
“
participant,
”
among which it is worth mentioning
the
“
trader,
”
which is defined as a company that
is not a WEM agent but trades electric power in bulk.
ENRE
Law No. 24,065 also
created the
Ente
Nacional de Regulador de la Electricidad
(Argentine National
Electricity Regulator) (ENRE) as an autonomous entity within the
scope of the former Secretariat of Electric Energy (currently, the
Ministry of Energy and Mining), the main duties of which are as
follows: (a) enforcing the Regulatory Framework and controlling the
rendering of public services and the performance of the obligations
set forth in the concession contracts at a national level; (b)
issuing the regulations applicable to the WEM agents; (c) setting
forth the basis for calculation of tariffs and approving the tariff
schedules of transmission and distribution companies holding
national concessions; (d) authorizing electrical conduit easements;
and (e) authorizing the construction of new facilities. Besides,
Law No. 24,065 has entrusted ENRE with a jurisdictional activity.
Any dispute arising between WEM agents should be subject to prior
compulsory jurisdiction of ENRE (subject to further judicial
review).
Pursuant to Decree
No. 258/16, the executive branch appointed nine interim members of
the ENRE
’
s board of
directors, and ordered the Ministry of Energy and Mining to put in
place an open call (
convocatoria abierta
)
to select the members of the ENRE
’
s board of directors.
The Government Secretary of Energy
In addition to the
ENRE, another of the main regulatory entities in Argentina is the
Government Secretary of Energy, the successor entity of the formers
Secretariat of Electric Energy, Secretariat of Energy and Ministry
of Energy and Mining. Its role is defined in Law No. 24,065 and
Decree No. 802/18. Its main duties are:
●
to participate in
the drafting and implementation of national energy
policies;
●
to enforce the laws
governing the development of the activities within its scope of
competence;
●
to participate in
the drafting of policies and regulations governing public services
within the scope of its competence;
●
to oversee the
entities and agencies governing works and public service
concessionaries;
79
●
to engage in
drafting regulations concerning licenses issued by the federal
government or the provinces for public services within the scope of
its competence;
●
to oversee the
regulatory entities and agencies of privatized areas or areas
operating under concessions within the scope of its competence;
and
●
to enforce the
Regulatory Framework and to oversee the regulations governing
tariffs, fees, duties and taxes.
Pursuant to
Resolution No. 64/18, the former Ministry of Energy and Mining
delegated some of its duties to the Undersecretariat of Electric
Energy. Such delegated duties include:
●
amending the Rules
to Access the Electricity Transportation System Existing Capacity
and Enlargement;
●
regulating the
International Interconnection Transmission System (the
“
IITS
”
);
●
amending the rules
governing the Procedures;
●
defining power and
energy amounts and other technical parameters that distributors and
Large Users are required to meet to access the WEM and authorizing
the entry of new players to the WEM;
●
authorizing
electric power imports and exports;
●
rendering final
administrative decisions with respect to appeals brought against
the ENRE
’
s resolutions,
which are the last administrative remedies that can be filed in
order to review the ENRE
’
s resolutions (the next step is a
judicial appeal);
●
exercising the
duties of the Ministry of Energy and Mining within the Federal
Electricity Council; and
●
administering the
Provinces
’
Special Fund
for Electricity Development created by Section 33 of Law No.
15,336.
Moreover, the
Ministry of Energy and Mining delegated to the Undersecretariat of
Electric Energy the duties of the former Secretariat of Electric
Energy pursuant to Sections 35, 36 and 37 of Law No. 24,065,
through Resolution No. 64/18. These duties include:
●
representing the
state-owned equity interest in CAMMESA;
●
defining the rules
governing CAMMESA;
●
ensuring
transparency and equity;
●
determining the
overall operating and maintenance costs that would allow fully or
partially state-owned generation and transportation companies to
maintain service quality, continuity and safety; and
●
administering the
Stabilization Fund.
WEM (Wholesale Electricity Market)
Pursuant to Section
35 of Law No. 24,065 and other regulations, the
Despacho Nacional de
Cargas
(National Dispatch Board) must be structured as a
corporation. CAMMESA was created for such purpose (Decree No.
1192/92) and to coordinate the technical and administrative supply
and demand of electric power within a real-time operation system,
centralizing and processing information produced by the WEM agents.
CAMMESA also acts as a collection entity for all WEM
agents.
The WEM consists
of:
1.
a term market,
where contractual quantities, prices and conditions are freely
agreed upon among sellers and buyers;
2.
a spot market,
where prices are established on an hourly basis based on the
economic production cost, represented by the short-term marginal
cost measured at the system
’
s load center (market node);
and
3.
a quarterly
stabilization system of spot market prices, intended for the
purchases of electric power by distributors.
80
The following chart
shows the relationships among the various actors in the
WEM:

Procedures for the Programming of Operation, Dispatch and Price
Calculation
For the purposes of
implementing the provisions set forth in the Regulatory Framework,
a set of regulatory provisions were issued, through former
Secretariat of Electric Energy Resolution No. 61 of April 29, 1992,
which are referred to as the
“
Procedures for the Programming of
Operation, Dispatch and Price Calculation
”
(the
“
Procedures
”
). The Procedures have been amended,
supplemented and extended by subsequent resolutions issued by the
former Secretariat of Electric Energy.
CAMMESA
CAMMESA is a
not-for-profit corporation. The shareholders of CAMMESA each hold
twenty percent stakes and are as follows: the Argentine government
(represented by the Ministry of Energy and Mining) and the four
associations representing the different segments of the electric
power sector (generation, transmission, distribution and Large
Users).
CAMMESA is managed
by a board of directors composed of ten regular directors and up to
ten alternate directors, which are appointed by its shareholders.
Each of the associations that represent the different segments of
the electric power sector is entitled to appoint two regular
directors and two alternate directors. The two remaining regular
directors of CAMMESA are the Secretariat of Electric Energy, who
serves as chairman of the board by virtue of the delegation made by
the Ministry of Energy and Mining, and an independent member who
acts as vice chairman, appointed at a meeting of the shareholders.
The decisions adopted by the board of directors of CAMMESA require
the affirmative vote of a majority of the directors present at the
meeting, including the affirmative vote of the chairman of the
board.
CAMMESA is in
charge of:
●
managing the SADI
in accordance with the Regulatory Framework, which
includes:
●
determining the
technical and economic dispatch of electric power (including
determining the schedule of production of all generation plants of
a power system to balance the production with the demand) at the
SADI;
●
maximizing system
security and the quality of electric power supplied;
●
minimizing
wholesale prices in the spot market;
●
planning energy
capacity requirements and optimizing energy use in accordance with
the rules set forth periodically by the Secretariat of Electric
Energy; and
●
monitoring the
operation of the term market and administering the technical
dispatch of electric power under the agreements entered into in
that market.
●
acting as agent of
the various WEM participants;
●
purchasing and
selling electric power from or to other countries by performing the
relevant import/export transactions within the framework of
existing agreements between Argentina and bordering countries
and/or among WEM agents and third parties from bordering countries;
and
●
carrying out the
commercial administration and dispatch of fuels for the WEM
generation plants.
81
In addition to the
responsibilities mentioned above, under current applicable
regulations, CAMMESA has temporarily been tasked with the role of
acquiring and supplying the fuel for the electric power sold under
the Energía Base free of cost to the generators.
CAMMESA
’
s operating costs are funded by
means of the mandatory contributions of all WEM participants.
Regulations in force as of the date of this annual report have
fixed a maximum amount for CAMMESA
’
s annual budget, equal to 0.85% of
the total WEM transactions planned for each year.
Provincial Regulatory Powers
Provinces can (and
do) regulate the electrical system within their territories, and
are enforcement authorities in charge of granting and controlling
electric power distribution concessions within their territories.
Nonetheless, if a provincial electric power market participant is
connected to the SADI, it must also comply with federal
regulations. In general terms, provinces have followed federal
regulatory guidelines and have established similar regulatory
institutions. In addition, isolated provincial electric power
systems are very rare, and most provincial market participants are
connected to the SADI and buy and sell electric power in the WEM,
which falls within the regulatory powers of the Argentine
government.
Pursuant to
Sections 6 and subsequent sections of Law No. 15,336, electric
power generation, whatever its source, transformation or
transmission, is subject to exclusive federal jurisdiction
when:
1.
it is related to
national security;
2.
it is aimed to be
used in the trade of electric power between different jurisdictions
and districts inside the country (
e.g.
, between two different provinces
or between the City of Buenos Aires and a province);
3.
it is correlated to
a place that is exclusively under jurisdiction of the Argentine
Congress;
4.
it is related to
hydroelectric or tidal energy facilities that need to be connected
between them or with others of the same or different source for a
rational and economic use of them;
5.
it is connected to
the
SADI
in any spot of the
country;
6.
it is related with
the trade of electric power with a foreign nation; or
7.
it is related to
electric power plants that use or transform nuclear or atomic
energy.
This exclusive
federal jurisdiction implies, among other things, that provinces
have limited taxing and police powers when generation,
transformation and transmission facilities of electric power are
involved.
Structure of the Industry
Generation and the WEM
According to Law
No. 24,065, electric power generation is classified as an activity
of public interest associated with the provision of the public
service of transmission and distribution of electric power, but
conducted within the framework of a competitive market. As a result
of the privatization and incorporation of new market players, the
generation sector, even after a consolidation process that took
place over the past few years, has a competitive structure with at
least five major companies of similar size: (i) Central Puerto;
(ii) Endesa Argentina S.A. (which includes Endesa Costanera S.A.,
Central Dock Sud S.A. and Hidroel
é
ctrica el Coloch
ó
n S.A.); (iii) Pampa Energía
S.A. (which includes Central T
é
rmica G
ü
emes S.A., Central T
é
rmica Loma la Lata S.A., Inversora
Piedra Buena S.A., Inversora Diamante S.A., CTG and Inversora
Nihuiles, and the plants formerly owned by Petrobras Argentina
S.A., which were merged into Pamos Energía S.A.) and (iv) AES
Argentina Generaci
ó
n S.A.
(which includes Central T
é
rmica San Nicol
á
s S.A. and Hidroel
é
ctrica Alicur
á
S.A.). In addition, a significant
portion of the generation sector is controlled by state-owned and
state-controlled companies (
e.g.
,
Yacyret
á
, Salto Grande,
Atucha and Embalse and YPF) and other private sector generators
(
e.g.
,
Orazul, Albanesi and Capex).
Thermal electric
power generators (
i.e.
, generation using
natural gas, liquid fuels derived from oil, such as gas oil and
fuel oil or coal) do not need a concession granted by the
government to operate, whereas hydroelectric power generators do
need a concession granted by the government to be able to use water
sources. Typical terms included in concession agreements include
the right to use water resources and facilities for a fixed amount
of time (
e.g.
, thirty years), in
cases where the dam is owned by the Argentine government or an
Argentine provincial government, and the option to extend or renew
the concession period for a fixed number of years. Usually, the
concessionaire must make a one-time initial payment to the
Argentine government or an Argentina provincial government in
exchange for the rights granted in the concession and periodically
must pay a fee and/or royalties to the respective provincial
government where the river is located in exchange for the use of
this water resource. Normally, these periodic fees vary according
to the amount of energy generated.
82
As of the date of
this annual report, following the enactment of Resolution SE No.
95/2013, Large Users operating in the term market purchase electric
power through agreements with CAMMESA. See
“Item 4.B. Business Overview—
The Argentine Electric Power Sector
—
Remuneration Scheme
—
The Previous Remuneration
Scheme
”
below.
Electricity Dispatch and Spot Market Pricing prior to Resolution SE
No. 95/13
According to the
Regulatory Framework, an electric power generators
’
remuneration is a function of two
components: (1) a variable component, based on quantity of energy
sold in the market, and (2) a fixed component that aims to
remunerate the generator for each MW of capacity of its units
available per hour in the WEM, regardless of the consumption of the
electric power generated by such units. The value of the fixed
component depends on, among other things, the connection node to
which the unit connects to the SADI.
In accordance with
the spot market that was in place prior to Energía Base,
electric power is traded at prices reflecting supply and demand.
CAMMESA dispatches the available power units based on the variable
costs of production determined by the generation agents, either
based on the cost of fuel or the price of water determined,
dispatching the most efficient power units first. The spot market
price is determined by CAMMESA on an hourly basis at a specific
geographic location, referred to as the
“
market node,
”
which is located in the
system
’
s load center at
Ezeiza, Province of Buenos Aires. The energy price consists of a
value referred to as the
“
marginal system price
”
or
“
market price,
”
and represents the economic cost of
generating the next MWh to satisfy an increase in demand at the
same value. The seasonal price fixing system is directly related to
the quarterly average prices of the spot market.
CAMMESA is
regulated in a manner that is intended to keep operating costs low
and to optimize prices. Pursuant to the regulations and procedures
enforced by the Ministry of Energy and Mining, CAMMESA applies
optimization models in accordance with applicable regulations,
based on weather estimates, dam levels, rain forecasts for the
following months and the availability of nuclear plants and thermal
machines. These optimization models are aimed at keeping operating
costs at the lowest possible level while satisfying the expected
daily demand for electric power.
To meet electric
power demand, CAMMESA organizes and coordinates the electric power
dispatch of generators by prioritizing power units with a lower
variable production cost, followed by those with a higher variable
production cost, until all electric power demand has been
satisfied. Generators must inform CAMMESA of the thermal generation
plants
’
variable
production costs, which depend on the availability of different
types of fuels provided by CAMMESA (
e.g.
, natural gas, fuel
oil and gas oil).
With respect to
demand, CAMMESA calculates the typical hourly consumption curves
taking into account the limitations of the transmission grid, the
needs of distributors, Large Users and self-generators that
purchase energy in the WEM, and demand from interconnected
importing countries that only receive energy if there is excess
supply in Argentina.
As a result of this
process, CAMMESA defines an optimal market price, which results
from adding the variable cost of transmission from the
generator
’
s connection
point to the market node to the accepted variable production
cost.
The procedure
described above is used to project the future needs of the SADI and
WEM. However, often projections and actual market conditions
differ, which creates differences between purchases by distributors
at seasonal prices and payments to generators for energy sales at
the spot price.
The Stabilization Fund
Energy prices are
passed on to end-users through the public utility distribution
companies. To fix prices for end-users, CAMMESA analyzes electric
power supply and demand for the period for which the price is being
calculated. The seasonal price is a fixed quarterly price. The
Regulatory Framework created the Stabilization Fund that absorbs
the differences between the seasonal price and the spot price in
the WEM. When the seasonal price is higher than the spot price,
there is an accumulated sur
plus
in the
Stabilization Fund. Any sur
plus
is used to offset
any losses resulting from periods during which the spot price have
been higher than the seasonal price.
Through the enacted
Resolution No. 7/16, the Ministry of Energy and Mining suspended
any transfer of funds from the Stabilization Fund to EDENOR and
EDESUR intended to fund these companies
’
planned works, which would have
been implemented through financing agreements with CAMMESA and
funded by the Stabilization Fund.
83
Developments since the Public Emergency Law No. 25,561
Since the approval
of the Public Emergency Law on January 6, 2002, a series of
temporary provisions amended the original mechanism for the
determination of prices in the WEM. The measures adopted pursuant
to the Public Emergency Law also distorted this mechanism: in spite
of an increase in the spot price, the seasonal price remained
frozen for all users until 2004, when a partial adjustment was
adopted that did not affect residential demand. As a result, the
amounts collected based on seasonal prices have been lower than the
amounts based on spot prices, therefore increasing the
Stabilization Fund deficit.
Resolution No. 6/16
issued by the Ministry of Energy and Mining on January 27, 2016
seeks to gradually implement a standardization program of several
macroeconomic variables, foster the efficient and rational use of
electric power and ensure that the appropriate conditions are in
place to benefit from private sector investments in the
sector
’
s activities and
segments. Pursuant to this resolution, the Ministry of Energy and
Mining acknowledged the gap between actual costs and prevailing
prices. However, on the basis of social policy, the Ministry of
Energy and Mining had fixed a new seasonal price for the WEM that
is still below actual supply costs.
The Ministry of
Energy and Mining also created incentives for residential customers
to save electric power, which consist of lower tariffs for users
who reduce their consumption over a given period compared to the
same period during the previous year. In addition, the Ministry of
Energy and Mining has fixed a social tariff to be applied to
certain sectors of demand.
Import and Export Transactions
Pursuant to Decree
No. 974/97, import and export transactions are conducted through
the IITS, a public service subject to the concession granted by the
former Secretariat of Electric Energy (currently, the Secretariat
of Electric Energy, within the scope of the Ministry of Energy and
Mining, pursuant to Resolution No. 25/16). Under such system,
through Resolution No. 348/99, the former Secretariat of Electric
Energy granted
Interandes Sociedad
Anónima
a concession for the IITS through the
G
ü
emes Transmission
System, which connects the Central de Salta Thermal Generation
plant located in G
ü
emes,
Salta, with the Sico Border Crossing, on the border with the
Republic of Chile.
All import and
export transactions conducted through the term market require the
prior authorization of the Secretariat of Electric Energy and
CAMMESA.
Transmission and Distribution
Pursuant to Law No.
24,065, transmission and distribution activities are regulated as
public services due to the fact that they are natural monopolies.
The Argentine government has granted concessions to private
entities conducting these activities, subject to certain
conditions, such as service quality standards and fixing the
tariffs they are entitled to collect for their
services.
Electricity
transmission is comprised of (i) a high-voltage transmission system
(operated by the company Transener, which is currently
co-controlled by the Eling Group, Transelec and Integración
Energética Argentina S.A. -formerly known as Energía
Argentina S.A.- or “IEASA”), which connects the main
electric power production and consumption areas allowing the
transmission of electric power between different Argentine regions
and (ii) several regional trunk systems, which transmit electric
power within a particular region and connect the generators,
distributors and Large Users that operate in such
region.
Electricity
distribution is regulated only at the federal level for the City of
Buenos Aires and the districts in the metropolitan areas of Greater
Buenos Aires. EDENOR operates in the northern area of both the City
of Buenos Aires and Greater Buenos Aires, and EDESUR operates in
the southern area of both the City of Buenos Aires and Greater
Buenos Aires. In the rest of the country, the electric power
distribution service is regulated at the provincial level and
subject to concession granted by provincial
authorities.
Transmission
services are rendered by concessionaires that operate and use high
and medium voltage transmission lines. Transmission services
consist of the transformation and transmission of electric power
from generators
’
delivery
points to distributors
’
or Large Users
’
reception
points. Law No. 24,065 provides that energy transmission companies
must be independent from other WEM participants and prohibits them
from purchasing or selling electric energy.
Distribution
companies are in charge of supplying electric power to end-users
who cannot contract with an independent electric power supply
source due to their consumption levels, such as residential
end-users.
The main
characteristics of concession contracts for the transmission and
distribution of electric power are: (i) service quality standards
with penalties that are applied in case of breach; (ii) a
concession term of 95 years for the monopoly of the supply service
in a supply area or network, divided into
“
management periods,
”
with an initial term of 15 years
and subsequent terms of ten years (at the end of each management
period, the Argentine government must call for bids to sell the
majority stake of the corresponding transmission or distribution
company); and (iii) tariffs fixed based on economic criteria with a
price cap system and predefined processes regarding their
calculation and adjustment.
84
Tariffs
The tariffs charged
by electric power transmission companies include: (i) a connection
charge, (ii) a transmission capacity charge and (iii) a charge for
actually transmitted energy. In addition, transmission companies
may receive income derived from the expansion of the system.
Transmission tariffs are passed on to final users through the
distributors.
The amounts that
distribution companies charge to end-users include: (i) the price
for the purchase of energy in the WEM (the seasonal price as
described above), (ii) transmission costs, (iii) the value-added
for distribution (
“
VAD
”
), which compensates the
distributor, and (iv) taxes. The VAD is the marginal cost of
providing services, including the network development and
investment costs, operation maintenance and commercialization
costs, as well as depreciation and a reasonable return on the
invested capital. The tariffs determined as set forth above must
enable an efficient distributor to cover its operating costs,
finance the renovation and improvement of its facilities, satisfy
increasing demand, comply with established quality standards and
obtain a reasonable return, while also enabling such distributor to
comply with certain operating efficiency standards and operate in a
manner consistent with the amounts it has invested and the national
and international risks inherent in its operations.
Pursuant to
Resolution No. 7/16, issued by the Ministry of Energy and Mining,
the ENRE must complete a full tariff review and adjust the VAD in
EDENOR
’
s and
EDESUR
’
s tariff
schedules. To such end, it must apply the social tariff scheme (the
“
Transition Tariff
Scheme
”
) set forth in the
renegotiation agreements ratified by Resolutions Nos. 1997/06 and
1954/06 and executed by EDENOR and EDESUR (the
“
Renegotiation Agreements
”
), on the one hand, and the
Unidad de
Renegociación y Análisis de Contratos de Servicios
Públicos
(Renegotiation and Analysis of Public Services
Contracts Unit,
“
UNIREN
”
), on the other hand.
Pursuant to
Resolution No. 1/16, the ENRE approved EDENOR and
EDESUR
’
s tariff schedules
in accordance with the Transition Tariff Scheme, subject to a
subsequent full tariff review, which has been applicable since
February 1, 2016. The new tariff schedules include differential
tariffs based on consumption and the social tariff. Following the
tariff increases, preliminary injunctions suspending such increases
were requested by customers, politicians and non-governmental
organizations that defend customers
’
rights, being granted by Argentine
courts. Among the different rulings in this respect, two rulings
issued by the Second Division of the Federal Courts of Appeals for
the City of La Plata and a federal judge from the San Martín
district court led to the suspension of end-users tariff increases
of electric power in the Province of Buenos Aires and in the whole
territory of Argentina, respectively. Pursuant to these
injunctions, (i) the end-user tariff increases granted as of
February 1, 2016 were suspended retroactively to that date, (ii)
end-user bills sent to customers were not to include the increase
and (iii) the amounts already collected from end-users as a
consequence of consumption recorded before these rulings had to be
reimbursed. However, on September 6, 2016, the Supreme Court denied
these injunctions that suspended end-users electric power tariff
increases, arguing formal objections and procedural defects and
therefore, as of the date of this annual report, increases of the
electric power end-user tariffs are not suspended.
Pursuant to
Resolution No. 522/16, the ENRE ordered a public hearing to be held
to evaluate the proposals for the full tariff review filed by
EDENOR and EDESUR for the period January 1, 2017
–
December 31, 2021. The hearing was
held on October 28, 2016.
Following such
hearing, on January 31, 2017, the ENRE issued Resolution No. 63/17,
by virtue of which such administrative authority approved the
tariffs to be applied by EDENOR. In the same sense, Resolution No.
64/17 approved EDESUR
’
s
tariffs.
Regarding
transmission tariffs, seven public hearings were held pursuant to
Resolutions Nos. 601/16, 602/16, 603/16, 604/16, 605/16, 606/16,
607/16 of the ENRE. In such public hearings, the tariff proposals
filed by transmission companies Transener S.A, Distrocuyo S.A.,
Transcomahue S.A., Ente Provincial de Energía de
Neuqu
é
n, Transba S.A.,
Transnea S.A., Transnoa S.A., and Transpa S.A. for the period
January 1, 2017
–
December 31, 2021 were evaluated. Pursuant to Resolutions Nos.
66/17, 68/17, 69/17, 71/17, 73/17, 75/17, 77/17 and 79/17, the ENRE
approved the new applicable tariffs of such companies.
Large Users
The WEM classifies
Large Users of energy into three categories: (i)
Grandes Usuarios
Mayores
(Major Large Users, or
“
GUMAs
”
), (ii)
Grandes Usuarios
Menores
(Minor Large Users, or
“
GUMEs
”
) and (iii)
Grandes Usuarios
Particulares
(Particular Large Users, or
“
GUPAs
”
).
85
GUMAs are users
with a maximum capacity equal to or greater than 1 MW and a minimum
annual energy consumption of 4,380 MWh. These users are required to
contract at least 50.00% of their demand and purchase the rest from
the spot market. Their transactions in the spot market are invoiced
by CAMMESA.
GUMEs are users
with a maximum capacity ranging from 0.03 to 2 MW. They are not
required to have any minimum annual demand. These users are
required to contract all of their demand and do not affect any
transactions in the spot market.
GUPAs are users
with a minimum capacity of 0.030 MW and a maximum of 0.1 MW. They
are not required to have any minimum annual demand. These users are
required to contract all of their demand and do not operate in the
spot market.
Traders
Since 1997, traders
have been authorized to participate in the WEM by intermediating
block sales of energy. Currently, there are thirty one authorized
traders in the WEM.
Vertical and Horizontal Restrictions
The WEM agents are
subject to vertical restrictions, pursuant to Law No. 24,065 and
Decree No. 1398/92, according to which:
1.
neither a
generation or distribution company nor a Large User or any of its
controlled companies or its controlling company, can be an owner or
a majority shareholder of a transmission company or the controlling
entity of a transmission company. Nevertheless, the executive
branch may authorize a generation or distribution company or a
Large User to build, at its own cost and for its own need, a
transport network for which it will establish the modality and form
of operation.
2.
the holder of a
distribution concession cannot be the owner of generation units;
however, the shareholders of the electric power distributor may own
generation units, either by themselves or through any other entity
created with the purpose of owning or controlling generation units;
and
3.
no transmission
company may purchase or sell electric energy.
Section 33 of the
Argentine Corporate Law states that
“
companies are considered as
controlled by others when the holding company, either directly or
through another company: (1) holds an interest, under any
circumstance, that grants the necessary votes to control the
corporate will in board meetings or ordinary
shareholders
’
meetings;
or (2) exercises a dominant influence as a consequence of holding
shares, quotas or equity interest or due to special linkage between
the companies.
”
However,
we cannot assure you that the electric power regulators will apply
this standard of control in implementing the restrictions described
above. According to the ENRE resolutions, a company controlled by
or controlling an electric power transmission company is a company
that owns more than 51% of the voting shares of the controlled
company and exercises a majority control.
Both electric power
transmitters and distributors are also subject to horizontal
restrictions. The horizontal restrictions applicable to
transmission companies are the following:
1.
two or more
transmission companies can merge into or be part of a same economic
group only if they obtain an express approval from the ENRE; such
approval is also necessary when a transmission company intends to
acquire shares in another electric power transmission
company;
2.
pursuant to the
terms of the concession agreement that govern the transmission of
electric power through transmission lines above 132 kv and below
140 kv, the transmission service is rendered exclusively in the
specific areas indicated in such agreement; and
3.
pursuant to the
terms of the concession agreement of the company that renders
electric power transmission services through lines with voltage
equal to or higher than 220 kv, the service must be rendered
exclusively and without territorial restrictions, throughout
Argentina.
The horizontal
restrictions applicable to electric power distribution companies
are the following:
1.
two or more
distribution companies can merge into or be part of a same economic
group only if they obtain an express approval from the ENRE; such
approval is also be necessary when a distribution company intends
to acquire shares in another electric power distribution company;
and
86
2.
the distribution
service is rendered within the areas specified in the respective
concession contracts.
The Impact of the Public Emergency Law No. 25,561 of 2001 and its
Implementation
The electric power
sector has been significantly affected by the Public Emergency Law
and the measures adopted as a consequence thereof. As a result of
the law, electric power transmission and distribution tariffs were
converted into pesos and frozen for more than six years. They were
only subject to limited and small-scale increases.
The contract
renegotiation process provided for by the Public Emergency Law for
public contracts subject to federal jurisdiction, including the
concessions granted for electric power transmission and
distribution in the City of Buenos Aires and La Plata, have
progressed very slowly. After more than five years of negotiations,
electric power transmission and distribution companies have reached
an agreement with the Argentine government with the participation
of the UNIREN, which was created within the scope of the Ministries
of Economy and Federal Planning, Public Investment and Services. As
a result of these negotiations, transmission tariffs were subject
to the abovementioned limited and small-scale
increases.
In the distribution
sector, the Renegotiation Agreements provided for limited increases
in income and to a portion of the tariffs (namely, the VAD). Such
increases were generally applied to commercial and industrial
users, while a comprehensive review of tariffs that would include
residential users has been proposed on several occasions. This
delay in updating rates caused an imbalance in the payments that
distributors made to CAMMESA and those charged by the generators to
CAMMESA, which resulted in shortages in the stabilization fund and
delays in payments to generators. See
“—
Shortages in the
Stabilization Fund and Responses from the Argentine
government.
”
The UNIREN was
dissolved through Decree No. 367/16, dated February 17, 2016, which
provided that the procedures for renegotiating works and public
service contracts should take place within the scope of the
ministries governing such contracts. Furthermore, this decree
empowers the competent ministries, jointly with the Ministry of
Economy and Public Finance, to execute partial contractual
Renegotiation Agreements and apply interim tariff and price
adjustments as necessary to ensure the continuity of the respective
ordinary services until full contractual Renegotiation Agreements
are entered into, which must take into account the outcomes of the
full tariff review.
Shortages in the Stabilization Fund and Responses from the
Argentine Government
The shortage in the
supply of natural gas has also had a significant impact on the
industry. Because Resolution SE No. 240/03 provides that the spot
price must be calculated as if there were no natural gas supply
shortage, electric power generators have not been able to pass
increases in the price of fuel on to buyers. This situation has led
to the depletion of the Stabilization Fund, which has resulted in
the inability to pay the electric power generators
’
bills.
As a result of the
deficit in funds required to pay WEM agents, the Secretariat of
Electric Energy issued Resolution No. 406/03. Section 4 of such
resolution provides that if there are insufficient resources, the
order of priority to settle debts owed to WEM creditors should be
the following: (i) the amounts due as receivables payable to the
unified fund created by Section 37 of Law No. 24,065; (ii) the
monthly income to be allocated to the WEM funds and accounts; (iii)
the amount necessary to pay for the receivables of WEM agents once
the remuneration items set forth in subsections (iv), (v) and (vi)
have been paid; (iv) the items related to the payment of
remuneration for the capacity and services rendered to the WEM; (v)
the amounts pertaining to: (a) the energy produced and delivered in
the hourly spot market valued at its operating cost based on the
variable production costs declared and approved for thermal
generation
plus
all the relevant
transmission charges, (b) the energy produced and delivered at the
hourly spot market by hydroelectric plants, valued at the
representative average operation and maintenance cost of a
hydroelectric power plant established in Annex 26 to the Procedures
plus
the
total amount of the relevant transmission charges (Ps.2 per MW per
hour), (c) the remuneration payable to electric power transmission
companies and (d) the additional providers of technical
transmission services that are not distributors and have
receivables in the WEM in connection with the transactions of Large
Users in the market; and (vi) the commitments assumed in relation
to Annexes II, III, IV of Resolution SE No. 01/03.
To overcome these
problems and take into account the forecasts of the future increase
in demand, the Argentine executive branch has launched different
programs and policies promoting the availability of new generation
capacity. For example, the Energía Plus and Energía
Distribuida programs were implemented to encourage private sector
investments in new generation facilities, allowing owners to sell
the energy produced at prices sufficient to cover the cost of the
projects
plus
a reasonable
profit. The purpose of these measures is not only to overcome the
current energy shortage situation but also to add installed
capacity to satisfy the steady growth in demand that is expected in
the short and medium term.
The FONINVEMEM and Similar Programs
In 2004, the
Argentine government, seeking to increase generation capacity,
created the FONINVEMEM (Resolution SE No. 712/2004), a fund to be
administered by CAMMESA. Its purpose is to raise funds to be
invested in energy generation projects. To provide capital for the
FONINVEMEM, the former Secretariat of Electric Energy invited all
WEM participants holding LVFVDs that originated from January 2004
to December 2006 to contribute these credits to the FONINVEMEM. In
the initial stages of the FONINVEMEM, generators were entitled to
participate in the construction of two new 800 MW combined cycle
thermal generation plants. Consequently, on December 13, 2005, the
generation companies TMB and TJSM were created.
87
The FONINVEMEM
reimburses the private sector contributors the amount of their
contributed receivables in 120 equal, consecutive monthly
installments starting from the commercial launch date of the
plants, converted into U.S. dollars at the rate effective as of the
date of the applicable agreement, with interest at the interest
rate specified in the applicable agreement for each project. For
more information, see
“Item
4.B.
Business Overview
—
FONINVEMEM and Similar
Programs.
”
In accordance with
the agreements for each project, after the first ten years of
operation, ownership of the combined cycle plants will be
transferred from the respective trusts to the operating companies,
and the operating companies will begin to receive the revenue from
the sale of energy generated by the plants. At such time, the
ownership interests of the private sector generators in each
operating company will be restructured based on the contributions
made by each party.
In the initial
stages of the FONINVEMEM, its purpose was to raise funds to finance
two 800 MW combined cycle thermal generation plants (Central
Termoel
é
ctrica Manuel
Belgrano and Central Termoel
é
ctrica Timb
ú
es). The construction, operation and
maintenance of the plants was managed by trusts. The Argentine
government must ensure the gas supply and the transmission capacity
for such plants. The funds were provided by means of the assignment
by WEM agents of a portion of their receivables from CAMMESA for
electric power sales.
Subsequently, in
2010, an agreement with WEM generators was entered into to promote
new electric power generation to satisfy the increase in the energy
and capacity demand and also to facilitate the settlement of the
generators
’
receivables
from CAMMESA for electric power sales. Within the framework of such
agreement, Central Puerto and the Endesa and Duke groups submitted
a project for the construction of a thermal combined cycle plant
named Central Vuelta de Obligado, in Timb
ú
es, Province of Santa Fe, and, in
turn, The AES Group submitted a project for the construction of
Central Guillermo Brown, located in Bahía Blanca, Province of
Buenos Aires. In connection with the former, the generation company
CVOSA was created.
Resolution SE No. 146/2002
Resolution SE No.
146 of October 23, 2002 provides that any generator that needs to
perform major or extraordinary maintenance works and needs
resources for such works may request financing, subject to the
availability of funds and the performance of the conditions set
forth by such rule.
Energía Plus
In September 2006,
the former Secretariat of Electric Energy issued Resolution No.
1281/06 which created the Energía Plus Service, in an effort
to respond to the sustained increase in energy demand and to foster
new private sector interested parties to invest fresh capital into
the energy sector in order to generate new energy
sources.
The resolution
provided that:
1.
The energy
available in the market will be used primarily to serve residential
customers, public lighting, public entities and industrial and
commercial users whose energy demand is at or below 300 kW and that
have not entered into term contracts.
2.
GUMAs, GUMEs and
large customers of distribution companies (in all cases with
consumption equal or higher than 300 kilowatts) must satisfy any
consumption in excess of their base demand (equal to their demand
in 2005) with energy from the Energía Plus service, consisting
of the supply of additional energy generation from new generators
and generation agents, co-generators or self-generators that are
not agents of the WEM or who, as of the date of publication of the
resolution, were not interconnected with the WEM. The price
required to pay for excess demand, if not previously contracted for
under the Energía Plus, was originally fixed to be equal to
the marginal cost of operation. The marginal cost is equal to the
generation cost of the last generation unit transmitted to supply
the incremental demand from electric power at any given time. With
the Energía Plus, the price has been amended to for GUMAs and
GUMEs and has been maintained for large customers of distribution
companies for their excess demand (Note No. 111/16 issued by the
Secretariat of Electric Energy).
Distributed Energy (Energía Distribuida)
Pursuant to
Resolution SE No. 220/07, the former Secretariat of Electric Energy
authorized the execution of Electricity Supply Agreements
(
“
ESAs
”
) between the WEM (represented by
CAMMESA) and companies that offer additional generation to the
system (
i.e.
, the so-called
offer of additional generation and associated energy from
generation, co-generation and self-generation agents that, as of
the date of publication of the resolution, are not WEM agents or do
not have the generation facilities to commit to such supply). ESAs
are applicable to all such projects for additional energy
generation that involve the participation of the Argentine
government or IEASA or those that may be determined by the Ministry
of Federal Planning, Public Investment and Services (currently, the
Ministry of Energy and Mining).
88
Resolution SE No.
220/07 sets forth the standard terms of ESAs,
including:
1.
Effective Term
: Maximum
of ten years.
2.
Parties
:
The company whose
offer has been approved by the former Secretariat of Electric
Energy, as seller, and the WEM as a whole, represented by CAMMESA,
as buyer.
3.
Remuneration
:
To
be determined based on the costs accepted by the former Secretariat
of Electric Energy and approved by the former Ministry of
Planning.
4.
Delivery
Point
:
The connection
node of the plant with the SADI.
5.
Remedies
:
The ESAs must
include remedies for breach based on the effect that the
unavailability of the units committed under the ESAs may have on
the proper supply of the electric power demand in the
SADI.
6.
Dispatch
:
The machines and
plants assigned to the ESAs will generate electric power to the
extent they are dispatched by CAMMESA.
Furthermore, such
resolution details the requirements that the additional generation
offers must meet for an ESA to be executed. The respective
investment projects must be submitted to the Secretariat of
Electric Energy and include the following information: (i) the
units to be approved that will assume the commitment; (ii)
guaranteed availability of the units; (iii) the offered duration of
the ESAs; (iv) the effective term of the offer; (v) the
availability of capacity committed for the period offered in MW;
the former Secretariat of Electric Energy may establish committed
capacity value limits; and (vi) a breakdown of fixed and variable
costs, in particular, those related to the funding used for the
installation of the new capacity offered and supporting documents
of such breakdown.
Based on the
information provided, the Secretariat of Electric Energy must
evaluate the submitted offers and inform CAMMESA of those that are
accepted for contracts, expressly stating the annual payment amount
for the installation costs to be considered and/or the calculation
method to be applied for such purposes, as well as the fixed or
variable costs associated with the ESAs. The Secretariat of
Electric Energy then must send CAMMESA the text of the contract to
be executed and the methodology that should be used for its
inclusion in the economic transactions of the WEM.
The capacity
assigned and the energy supplied in connection with the ESAs will
be compensated by means of a monthly payment calculated based on
the annual installation costs to be considered, and the fixed and
variable costs required for the proper operation of the committed
equipment, based on a method that must be defined in the relevant
agreement.
The generation
agents that are parties to the ESAs must meet all the requirements
set forth in the Procedures, including determining the variable
production costs and water costs of the units committed in
accordance with the methods in force and the maximum costs
acknowledged pursuant to Resolution No. 220/07.
As long as
Resolution SE No. 406/2003 is applicable, the payment obligations
under the ESAs will have the payment priority provided in
subsection (e) of Section 4 of Resolution SE No.
220/07.
To reduce the risk
arising from payment for sales under the ESAs, the costs associated
with such agreements must have payment priority over the
receivables of other agents in the market. In this context, the
order of priority to be applied for the settlement of payment
obligations derived from such contracts must be equal to or higher
than thermal generators
’
obligations in respect of operating costs. In other words, the
recovery of costs associated with the ESAs must have at least the
same priority level as the recovery, for instance, of the costs of
fuel used for the generation of electric power that is already
installed.
Pursuant to
Resolution SE No. 1836/07, the former Secretariat of Electric
Energy instructed CAMMESA to execute with IEASA the ESAs pertaining
to energy projects located in specific sites communicated in each
case by such secretariat, approving, as Annex I, the sample
contract to be executed and providing for the specific conditions
of each ESA that should be approved by the former Secretariat of
Electric Energy.
89
The National Program
In this context,
the former Secretariat of Electric Energy issued Resolution No.
724/2008, which authorized the execution of WEM committed supply
agreements associated with the repair or repowering of diesel
generation groups and related equipment with WEM generation agents.
The compensation to be received by the seller will be paid
according to the payment priority provided in subsection (e) of
Section 4 of Resolution SE No. 406/03.
On November 11,
2009, Resolution SE No. 762/2009, which created the National
Hydroelectric Works Program (the
“
National Program
”
), was published in the Official
Gazette.
The purpose of the
National Program is to promote and support the construction of
hydroelectric plants within Argentina through the creation of
funding sufficient to assure the repayment of investments made and
loans provided in such framework.
Within this
framework, the Argentine government has provided that CAMMESA and
the WEM generation agents to be determined by the Ministry of
Energy and Mining may enter into electric power supply agreements
in respect of the energy generated by the hydroelectric works that
are part of the National Program. One of the purposes of the supply
agreements for hydroelectric works is to repay the investments made
and the loans used to complete all hydroelectric works included in
the National Program.
The standard term
of such agreements may be of up to 15 years, but such agreements
may be extended by the Ministry of Energy and Mining. Upon
expiration of such term, each hydroelectric plant that is part of
the National Program may sell the energy generated by it at the
price then specified by the WEM.
The terms and
conditions of the agreements were determined by the former
Secretariat of Electric Energy taking into account principles of
economic reasonableness, equity and operating benefits for the
electric power system as a whole, according to which it will
qualify the hydroelectric works to be executed within the scope of
the National Program.
ESAs with IEASA
Resolution SE No.
712/09 approved the sample contracts to be executed between CAMMESA
and IEASA for the supply of electric power derived from renewable
sources generated under the contracts awarded in IEASA
’
s Bidding Process No.
1/09.
Resolution SE No.
712/09 also added Annex 39 and replaced Annex 40 of the Procedures.
In this regard, the new Annex 39 sets forth the guidelines for
renewable energy generation, excluding hydroelectric and wind
energy, while Annex 40 set forth the guidelines for wind power
generation.
Regarding the
contracts to be awarded, prior to their execution, IEASA must carry
out certain efforts with the former Secretariat of Electric Energy
to obtain approval for the generation availability offer pursuant
to which it intends to execute each agreement with
CAMMESA.
Based on the
assessment of the requests received, the former Secretariat of
Electric Energy will consider the merits of contracting for the
availability of generation and related energy, instruct CAMMESA to
execute a contract with those parties whose requests have been
accepted and send the text of the contract to be executed with the
specific provisions for each contract.
The main
characteristics of these sample contracts approved by Resolution SE
No. 712/09 are the following:
1.
The energy supplied
must be generated by designated machines in conformity with
CAMMESA
’
s dispatch
requirements and must be adequate for the generator
’
s capacity.
2.
The term of the
contracts must be for a maximum of 15 years, which may be extended
for a maximum term of 18 additional months.
3.
In cases of
contracts for energy generated from renewable sources other than
biofuels (such as wind and solar energy), no capacity payment is
provided. In these cases, the consideration shall consist of the
payment for the energy supplied, a management charge and the
payment of a portion of fixed costs (charges for transport,
expenses, fees and other charges specifically provided for). The
price of the energy supplied shall remain constant throughout the
term of the specific contract.
90
4.
A guarantee fund
will be established to ensure the performance of the obligations
under the ESAs, which shall be set up by CAMMESA, until reaching a
limit of 10.00% of the future obligations assumed under each of the
contracts at which point the fund ceases to accumulate
funds
Resolution SE No.
108/2011, dated April 13, 2011, authorized the execution of new
ESAs between CAMMESA, on behalf of the WEM, and certain parties
offering availability of electric power generation using the
renewable sources set forth in Law No. 26,190 that meet the
following requirements:
1.
at the time of the
publication of Resolution No. 108/2011, such parties do not have
the generation facilities to be committed under such offers or,
having completed the interconnection to the WEM, have not committed
their availability of generation and related energy under any form
of contract; and
2.
they present
projects where the Argentine government, IEASA or other generation
agents have an interest.
The remuneration is
paid on a monthly basis in U.S. dollars and is determined based on
the costs and annual income acknowledged by the former Secretariat
of Electric Energy. For such purposes, the fixed and variable
installation costs required for the proper operation of the
committed equipment shall be considered based on the method
determined in each ESA.
Both SE Resolutions
712/2009 (except Annex 39 and 40) and 108/2011 were abolished by
Ministry of Energy and Mining.
Renewable Energy Program
In recent years,
Argentina has prioritized the generation of electric power from
renewable sources. In such regard, it has not only issued
regulations intended to regulate and incorporate this type of
energy into the WEM, but it has also promoted it by granting
incentives in the form of tax benefits and preferential or
subsidized tariffs.
To promote
renewable energy, Law No. 26,190 was enacted in December 2006 and
approved the National Promotional Regime for the Use of Sources of
Renewable Energy destined to Electric Production (the
“
Promotional Regime
”
). The renewable energy sources
provided for in this system include wind, solar, geothermal, tidal,
hydraulic (hydroelectric power plants up to 30 MW), biomass,
landfill gas, sewage-treatment plant gas and biogas (except for the
uses provided for in Law No. 26,093 on biofuels). The purpose of
Law No. 26,190 is to increase the proportion of energy provided by
renewable energy sources to 8% of the national electric power
consumption within ten years from its effective date. Law No.
26,190 also established a system of investments for the
construction of new works intended to generate electric power from
renewable energy sources, which will remain in force for a term of
ten years. The system set forth by Law No. 26,190 has been excluded
from the general remuneration scheme regulated by Resolution No. 95
(as described below).
The beneficiaries
of this system are individuals and legal entities that hold
investments and concessions for new renewable energy generation
works in Argentina that have been approved by the enforcement
authority. The energy must be intended for the WEM and the project
must be related to the rendering of public services.
On September 23,
2015, Law No. 26,190 was amended by Law No. 27,191. The amendments
seek to establish a legal framework to increase investments in
renewable energies and foster the diversification of the electric
power generation mix, increasing the participation of renewable
sources. To such end, the law, among other things:
1.
sets renewable
energies consumption targets for all of Argentina
’
s electric power consumers, as
minimum percentages of renewable energies electric power that they
are required to consume as of December 31 of the following years:
8% for 2017, 12% for 2019, 16% for 2021, 18% for 2023, and 20% for
2025;
2.
amends and expands
the tax benefits for eligible projects;
3.
establishes the
Fondo para el
Desarrollo de Energías Renovables
(Fund for the
Development of Renewable Energies, or the
“
FODER
”
) as a trust fund for which the
Argentine government serves as the trustor, Banco de
Inversi
ó
n y Comercio
Exterior (BICE) serves as the trustee and the owners of the
approved investment projects are the beneficiaries. The trust fund
must allocate the trust assets to extend credit, make capital
contributions and acquire all such other financial instruments as
required for the execution and financing of eligible projects
involving electric power generation from renewable sources;
and
4.
establishes
obligations for Large Users and large demand: clients of electric
power distribution providers or distribution agents with capacity
demand equal to or higher than 300 KW must meet gradual goals
through self-generation or otherwise purchase such electric power
from generators (directly or through electric power distributors or
brokers or from the wholesale market operator CAMMESA), at a price
which may not exceed an average of US$113/MWh until March 30, 2018,
and thereafter at a price determined by Ministry of Energy and
Mining. In this respect the Ministry of Energy and Mining by means
of Resolution 281-E/2017, established the regulatory framework that
allows Large Users to purchase renewable energy from private
generating companies.
91
Pursuant to Decree
No. 531/16, the Argentine government set forth general guidelines
and principles for the development of energy projects, by
delegating the procedures for compliance with energy goals, bids or
auctions for the implementation of the FODER to the Ministry of
Energy and Mining, particularly to the Undersecretary of Renewable
Energies. The most important aspects of these regulations are as
follows:
1.
The Ministry of
Energy and Mining must be the enforcement authority of the
law.
2.
The system is
applicable to projects for the construction of new facilities or
for expanding or upgrading existing ones, the acquisition of new or
second-hand equipment, to the extent new assets, works and other
services are used for the project and are directly connected to the
project. Access to the system is allowed for projects for which,
after having been selected under Resolutions Nos. 220/2007,
712/2009 and 108/2011 set forth by the former Secretariat of
Electric Energy, construction has not yet begun and that have been
selected by the enforcement authority and the executed agreement is
terminated. Projects for which construction has begun may also be
eligible to the extent amendments to the executed contracts are
allowed, as required by the enforcement authority. The enforcement
authority must establish the merit order for projects that have
been approved and determine the granting of the promotional
benefits for each project.
3.
The goals
established by the law must be audited annually commencing on
December 31, 2018. Users are allowed a 10% margin of error per year
for achieving the goals related to energy consumption from
renewable sources established by the law.
4.
The enforcement
authority must establish the terms and conditions under which it
will allocate a portion of the funds of FODER
’
s financing account to finance the
development projects of the value chain of local production of
power generating equipment, using renewable energy sources, parts
or components.
Tax Benefits Under Law No. 26,190
The former regime
includes the following tax benefits:
●
Early refund of the
VAT on the project
’
s new
depreciable assets: the VAT as invoiced to the beneficiaries on the
purchase, production, manufacture or final import of capital goods
or the execution of infrastructure works shall be credited against
other taxes by the AFIP as soon as at least three fiscal periods
have elapsed, as counted from the fiscal period in which the
investments were made, or it shall be recoverable in the term
provided upon approving the project, under conditions and with the
guarantees set forth in that respect.
●
Accelerated asset
depreciation for purposes of income tax: the beneficiaries may
apply depreciations on the investments associated with the projects
subsequent to their approval and under the terms set forth therein.
These depreciations are subject to a differential treatment
depending on their timing, within the first, second or third
twelve-month period after project approval. This alternative is
subject to the condition that the assets are to remain as property
of the project holder for at least three years.
●
Non-calculation of
the minimum presumed income tax provided by Law No. 25,063 on the
assets allocated to the projects initiated under the system created
by the renewable energy law: this benefit applies to the three
fiscal periods preceding the completion of the relevant project.
The assets must be connected to the relevant project and must be
acquired by the company after the approval of the
project.
The regime also
provides for certain additional compensation. In that regard, the
projects will be entitled to an additional compensation equivalent
to US$0.015 per KW/h payable to the generators that produce
electric power from renewable sources, except in the case of
solar-based electric power, for which generators will collect
US$0.9 per KW/h. Such additional compensation will be paid
according to: (i) fuel substitution, (ii) the involvement of
Argentine industries and job creation opportunities and (iii) the
amount of time it takes to launch the project.
Tax benefits under Law No. 27,191
The Promotional
Regime includes the following tax benefits:
1.
Early refund of VAT
and accelerated depreciation of assets for income tax purposes,
with beneficiaries being able to apply for both benefits
simultaneously, subject to reduced benefits based on the actual
commencement date of the project
’
s execution.
92
2.
Extension to ten
years of the tax loss carry forward term. Tax loss carry forwards
arising from the promoted activity may only be set off against net
income arising from the same activity.
3.
Exclusion of assets
connected to the activity subject to the Promotional Regime from
the taxable base related to the minimum presumed income tax until
the eighth fiscal year following the project
’
s commencement (inclusive of the
first year). Excluded assets are those connected to the project
subject to the Promotional Regime and included in the
owner
’
s net worth after
the approval of such project.
4.
A 10% exemption on
tax on the dividends distributed by the companies that own the
projects subject to the Promotional Regime, which are reinvested in
new infrastructure projects within Argentina.
5.
Tax certificate
applicable to the payment of income tax, VAT, minimum presumed
income tax and excise taxes for an amount equal to 20% of the value
of components of electromechanical facilities made in Argentina,
provided that at least 60% of the components (excluding civil
works) are made in Argentina. Where there is insufficient or a lack
of production in Argentina, the percentage is reduced to 30%. The
assignment of the tax certificate is conditioned upon the fact that
the taxpayer cannot have liquidated debts due and payable to the
AFIP.
6.
Other benefits,
including the possibility of shifting increased costs arising from
tax increases to the price of the renewable energy sold; exemption
from import duties and the statistical rate for the import of new
capital assets, special equipment and related parts and components
that are necessary for, among other things, the execution of the
project; and the exemption from special taxes, fees and royalties
of any jurisdiction imposed on the access to and use of renewable
sources of energy within participating jurisdictions until December
31, 2025, excluding potential fees payable on the use of the
state-owned land where the projects are based.
7.
Those who wish to
participate in the Promotional Regime must waive the benefits
afforded by previous systems under Laws No. 25,019 and 26,360, and
the projects that benefitted from such systems may only have access
to the Promotional Regime if the works committed under the
contracts executed thereunder have not commenced as of the date of
the application.
Changes to the Electric Power Sector under the Macri
Administration
On December 15,
2015, the executive branch declared a state of emergency with
respect to the Argentine electric power sector until December 31,
2017. Pursuant to Decree No. 134/2015, the Ministry of Energy and
Mining (as well as its successors) must:
1.
prepare and put in
place a plan of action addressing the issues affecting the electric
power generation, transportation and distribution sectors within
its jurisdiction in order to adjust the quality and safety of the
electric power supply and ensure the supply of electric power under
suitable technical and economic conditions; and
2.
work in
coordination with other agencies of the Argentine government to
develop a program for the efficient use of energy.
The Ministry of
Energy and Mining set forth Resolutions No. 6 and No. 7 under this
scheme.
Additionally, on
October 31, 2017, the executive branch issued Decree No. 882/2017
ordering the restructuring of the Argentine Government’s
energy sector assets aimed at the reduction of government
participation.
Pursuant to the
Decree 882/2017, the Ministry of Energy and Mining was mandated to
execute the merger of IEASA and Emprendimientos Energéticos
Binacionales S.A (EBISA). EBISA is a company responsible for
selling the electricity generated by certain binational energy
projects in which the Argentine government is a party. In
accordance with the provisions of such decree, IEASA would absorb
EBISA and would change its name to Integración Energética
Argentina S.A. Through Resolution 11-E/2018, the Ministry of Energy
and Mining instructed the boards of directors of the aforementioned
companies to carry out all diligences necessary to perform the
merger.
According to Decree
No. 882/2017, Integración Energética Argentina S.A will
also be responsible for continuing certain energy infrastructure
public work projects previously performed by the Ministry of Energy
and Mining (acting as a contracting entity). Pursuant to such
decree, the Ministry of Energy and Mining can also assign to
Integración Energética Argentina S.A with any other
public work project to be performed by such ministry.
Through Decree No.
882/2017, the executive branch granted Integración
Energética Argentina S.A a concession to develop the Condor
Cliff and La Barrancosa hydroelectric power plants.
93
Decree No. 882/2017
also instructs the Ministry of Energy and Mining (acting as a
shareholder of Integración Energética Argentina S.A), to
implement the necessary measures so that Integración
Energética Argentina S.A sells, assigns or transfers its
assets, rights and/or shares (as the case may be) related to
Ensenada Barragan, Brigadier López and Manuel Belgrano II
thermal power plants and Compañ’a Inversora de
Transmisión Eléctrica CITELEC S.A.
Pursuant to Decree
No. 882/2017, the Ministry of Energy and Mining was also instructed
to implement the necessary measures and procedures to execute the
sale, assignment or transfer (as the case may be) of (i) the
Argentine Government’s shares in Central Puerto S.A equity
and the equity of other energy companies (Central Dique S.A,
Central Térmica Güemes S.A, Centrales Térmicas
Patagónicas S.A, TRANSPA and Dioxitek S.A), (ii) the rights
held by the Argentine Government regarding the following power
plants, companies and shares: Termoeléctrica Manuel Belgrano,
Termoeléctrica José de San Martín (Central
Timbúes), Termoeléctrica Vuelta de Obligado and
Termoeléctrica Guillermo Brown.
The subsequent
sales and transfers, must contemplate public and competitive
procedures which must protect the rights established in the
companies’ bylaws and related corporate and contractual
documentation.
The bidding terms
and conditions of the bidding contest to transfer Ensenada Barragan
and Brigadier Lopez power plants were approved by means of
Resolution No. 289/2018 of the Ministry of Energy. We submitted
offers for both power plants, and on February 27, 2019, we were
notified that we had been awarded Brigadier López Power Plant
(see “Item 4.B. Information of the Company—Recent
Developments—Brigadier López Plant - National and
International Public Bid No. CTBL 01/2018 (the “IEASA
Bid”) called by Integracion Energética Argentina S.A.
(“IEASA”)).
On February 27,
2019, Central Puerto was notified that it had been awarded the
IEASA Bid called by IEASA to acquire the Central
Termoeléctrica Brigadier López power plant (the
“Brigadier López Power Plant”) and certain assets
and liabilities relating to such plant.
Pursuant to the
terms of the IEASA Bid, Central Puerto would be subject to a US$ 10
million penalty if it failed to honor its obligations under the
terms and conditions of the IEASA Bid. Regarding this, we provided
IEASA with a US$ 10 million first demand guarantee for the
maintenance of the offer, which guarantee expires on May 31, 2019
and entitles IEASA to execute it if we fail to honor our
obligations under the terms and conditions of the IEASA Bid. If
IEASA does not execute the first demand guarantee within 7 days
after its expiration, such first demand guarantee will
terminate.
In addition, the
acquisition of the Brigadier López Power Plant was subject to
the satisfaction of certain conditions that had to occur prior to
April 1, 2019. As of the date of this annual report, the
acquisition of the Brigadier López Power Plant could not be
consummated given that certain conditions to the IEASA Bid were not
satisfied, such as the proper issuance by CNV of an unconditional
authorization to the terms of the amended financial trust agreement
relating to the Brigadier Lopez Power Plant. In addition, there is
a discrepancy between Central Puerto and IEASA regarding the
satisfaction of certain conditions upon which closing of the
acquisition of the Brigadier López Power Plant was subject to.
Also, Resolution SRRyME N° 1/2019 adversely affected our
ability to obtain financing in connection with the acquisition of
the Brigadier Lopez Power Plant. As of the original closing date,
April 1, 2019, certain of the conditions to closing of the
acquisition had not been satisfied, and an extension of such
closing date was necessary. However, Central Puerto and IEASA
failed to agree on such extension. On April 26, 2019, Central
Puerto duly notified IEASA of such failure to agree on an
extension.
Call for Bids for New Thermal Generation Capacity and Associated
Electricity Generation
Pursuant to Decree
No. 134/15 and Resolution No. 6/16 set forth by the Ministry of
Energy and Mining, the Secretariat of Electric Energy issued
Resolution No. 21/16 (
“
Resolution No. 21
”
) calling for bids for thermal
generation capacity and associated electric power generation. The
energy is to be made available in the WEM to meet essential demand
requirements beginning with the following seasons: summer
2016/2017, winter 2017 and summer 2017/2018.
Resolution No. 21
provides for the following bid specifications:
1.
Bids may only be
submitted to CAMMESA by such parties that already are, or have
simultaneously submitted an application to the Secretariat of
Electric Energy to become, generation, co-generation or
self-generation agents of the WEM under the terms of the
Procedures.
2.
Bids must be for
projects to install new generation capacity, in addition to the
expected capacity for the period in which commercial operation of
the project is committed.
3.
Bidders may not
offer pre-existing generation units that are connected to the SADI
or units in which the power capacity being offered is already
committed and partially performed under agreements approved by the
former Secretariat of Electric Energy. If, in the case of the
latter, there was no partial performance of the agreements and
bidders submitted bids under Resolution No. 21, CAMMESA must submit
the matter to the former Secretariat of Electric
Energy.
94
4.
Bids may not
commit, at each proposed connection point, a generation capacity
lower than 40 MW and the net power of each generating unit for such
location may not be lower than 10 MW.
5.
The committed
equipment must be capable of running on two types of fuel and be
able to operate on either of them as needed by the WEM economic
dispatch. If there is ongoing and unlimited availability of a given
fuel or if deemed logistically beneficial by the bidder, bidders
may submit an alternative offer with generating equipment capable
of running on a single type of fuel.
6.
There is no
pre-established ceiling for the capacity of power that can be
offered and the location of the projects can be freely chosen, but
both the capacity and the location of the projects will be limited
by the capacity of the transmission system and the supply of
fuel.
7.
For each generating
unit at the proposed interconnection spot, bidders must offer a
price for power availability (expressed in U.S. dollars per month)
and a price for the electric power generated (expressed in U.S.
dollars per hour), estimating the value of non-fuel related
variables for each type of fuel on which the power station is able
to run and the related committed maximum specific consumption
stated in kilocalories per kilowatt-hour.
8.
Bidders are
required to submit evidence of full compliance with applicable
environmental laws, including but not limited to the related
statement of Environmental Impact and Environmental Impact
Study.
9.
Bids must be
submitted in two envelopes. One envelope must include technical
information in connection with the availability of the power being
offered. The other envelope must include the bid price for the
committed power availability and the electric power generated, the
maximum specific consumption being offered, the committed due date
by which the generation capacity being offered will be commercially
available for service, the requested term for the contract, the bid
bond and the
pro
forma
guarantee of compliance with the committed due
date.
10.
Before submitting
the bids, the Secretariat of Electric Energy may specify or
supplement the contents of Resolution No. 21 and the information
and documents to be submitted.
The agent whose bid
is finally accepted must enter into a contract for the sale of
electric power generation capacity availability and the related
generated electric power in the WEM (a
“
wholesale demand
contract
”
) with the
distribution agents and Large Users of the WEM represented by
CAMMESA.
Resolution No. 21
sets forth the guidelines for wholesale demand contracts, which
include, among other things: (i) the contractual term must be
between five and ten years; (ii) the maximum specific consumption
of each generating unit by type of fuel used must be lower than
2,500 kilocalories per kilowatt-hour; (iii) a set of remedies must
be defined for failures to comply with the committed availability
of generation capacity; (iv) the supply of and recognition of the
cost of fuel used by the machines and power stations involved must
be included in accordance with applicable regulations; (v)
contracts must have first priority in payment and rank equally with
existing supply agreements with the Banco de Inversi
ó
n y Comercio Exterior (BICE) in its
role as trustee of the trusts
“
Central Termoel
é
ctrica Manuel Belgrano
”
and
“
Central Termoel
é
ctrica Timb
ú
es
”
since January and February 2010,
respectively, and priority in payment must rank equally with
payment obligations in respect of liquid fuel purchases for
electric power generation; and (vi) the contracts must include
other features stemming from the provisions of Resolution No.
21.
The bids submitted
must be reviewed by CAMMESA following the methodology established
by the Secretariat of Electric Energy. This methodology includes
following a streamlined simulation model of the expected operation
of the generation units committed in each bid, taking into account
certain requirements set forth by Resolution No. 21. The bid
assessment process must consider the risks of undelivered electric
power expected for the summer 2016/2017, winter 2017 and summer
2017/2018, estimating the value the early incorporation of the
generation capacity being offered would have for the electric power
system. Bids must be ordered and selected based on the increasing
costs each of them would have on the electric power system. CAMMESA
must assess and report to the Secretariat of Electric Energy the
costs that each of the bids deemed acceptable under the approved
methodology would represent for the system and, if applicable, the
bids that have been excluded at such stage for their failure to
meet the bid specifications.
CAMMESA must issue
the commercial documentation deemed necessary for making payments
to selling agents under such wholesale demand contracts during the
term of the emergency declared under Decree No. 134/15 or until the
enactment of regulations governing the transfer to the selling
agents of the responsibility to issue such commercial
documentation.
As long as such
duty is performed by CAMMESA, it must document and certify to the
selling agent the proportional part that Large Users and
distributors must pay for the electric power they consume to
initiate summary collection proceedings.
95
As required by
Resolution No. 21, CAMMESA prepared the terms of reference that
govern the call for bids under Resolution No. 21, with such terms
of reference having been approved by Note 161/16 set forth by the
Secretariat of Electric Energy.
In accordance to
Resolution No.21, the Secretariat of Electric Energy received bids
for 6,611 MW and awarded an aggregate amount of 2,871
MW.
Pursuant to
Resolution No. 155/16 and Resolution No. 216/16, the Secretariat of
Electric Energy authorized CAMMESA to subscribe the wholesale
demand contracts with every winning bidder, for 1,915 MW with an
average price of US$21.833/MW-month, and for 956 MW with an average
price of US$19.907/MW-month, respectively. In addition, through
Resolution No. 387/16, the Secretary of Electric Energy authorized
CAMMESA to execute additional wholesale demand contracts for two
generation projects (one for 100 MW and the other for 137
MW).
Resolution 287/2017 of the Secretary of Electricity
Through Resolution
No. 287/2017, of May 11, 2017, the Secretariat of Electricity
called for a new thermal power tender for the execution of
long-term power purchase agreements. The tender focuses on combined
cycle conversion projects and co-generation project
The main features
of the tender were as follows (further requirements and conditions
apply):
(a) Combined cycle
conversion projects shall relate to thermal power plants (i)
currently existing or near to reach commercial operation in simple
cycle mode; (ii) with low specific consumption; (iii) with the
possibility of improving its efficiency once converted into a
combined cycle; (iv) that its conversion may not affect the current
grid transmission capacity (being any required expansion to be
borne by the bidder); (v) which have the appropriate fuel
infrastructure system to guarantee permanent operation of the
combined cycle; and (vi) with, in principle, a maximum construction
term of 30 months.
(b) Co-generation
projects (i) must be efficient, (ii) shall not affect the current
grid transmission capacity, (iii) shall guarantee its own principal
and alternative permanent fuel supply, and (iv) must entail, in
principle, a maximum construction term of 30 months.
(c) The PPAs will
be for 15 years.
(d) CAMMESA- will
be the offtaker, acting on behalf of distributors and large users
of the Argentine Wholesale Electricity Market. The PPAs may be
proportionally assigned to large users and distributors at a later
stage.
(e) The generator
will receive both a fixed capacity payment (subject to power
availability) and a variable payment for actual power supplied to
the grid.
(f) Prices under
the PPAs shall be established in US dollars. However, CAMMESA shall
make payment in Argentine pesos at the prevailing exchange rate on
the business day immediately before the payment date established in
the sales liquidation document issued by CAMMESA.
(g) Payments under
the PPAs will benefit from a priority payment mechanism (equal to
the one established for the payment of fuel costs for power
generation).
(h) Within three
months after execution of the PPAs, CAMMESA must constitute a
Payment Guarantee Fund to guarantee the obligations undertaken
under each PPA. It should cover six months of the estimated
capacity payments under each PPA. The Secretariat of Electricity
shall provide the specifics with respect to the Fund’s
constitution and administration.
PPA’s were
awarded to different projects, by means of Resolutions No. 820/2017
and 926/2017 of the Secretary of Electricity.
RenovAR (Round 1, Round 1.5 and Round 2): Bidding Process for
Renewable Energy Generation Projects
After carrying out
a public consultation period to submit comments and suggestions to
the preliminary version of the bidding terms and PPAs and due to
the proximity of the period for submitting bids to the
“
Round 1
”
from the RenovAR Program, President
Mauricio Macri issued Decree No. 882/16, published on July 22, 2016
in the Official Gazette on the grounds of
“
necessity or urgency,
”
which decree has modified and
established different precisions regarding the legal framework for
the Promotional Regime.
96
Below are the main
measures introduced by the Decree No. 882/16:
|
|
1.
|
Fiscal Quota: For
the year ended December 31, 2016, a budget of US$1,700,000,000 was
approved in order to be allocated to the promotional benefits under
the Promotional Regime. In case the specified budget is not
allocated in full in 2016, it will be automatically transferred to
the following year.
|
|
|
2.
|
PPAs term: In order
to recover the investment and obtain a reasonable return, the PPAs
will have a maximum term of 30 years.
|
|
|
3.
|
Put and Call
Options: The PPAs may grant rights to: (a) the Argentine government
to purchase the power generation or their assets upon material
breaches of the contract that constitute ground for termination;
the purchase price will be lower than the unamortized investment at
the time the option is exercised; and (b) the owner of the project
to sell the power generation or their assets upon the occurrence of
any of the
“
grounds for
put option
”
for a price,
which in no case may exceed the unamortized investment at the time
the option is exercised.
|
|
|
4.
|
PPAs are subject to
Argentine private law.
|
|
|
5.
|
Choice of Forum: In
the event of any dispute concerning the interpretation or execution
of the PPAs for disputes arising out of the contracts signed
between the Argentine government or the FODER with the
beneficiaries of the Promotional Regime, alternative dispute
resolution methods from Argentina or abroad can be included in the
PPAs.
|
|
|
6.
|
FODER: As a result
of the Decree No. 13/2015 in which the Ministry of Energy and
Mining was established, the Decree No. 882/16 replaced paragraphs
2, 3, 7, 8 and 9 of Section 7 of Law 27,191 and proceeded to modify
the Argentine government
’
s role in the FODER, establishing
the Ministry of Energy and Mining as trustor and trustee of the
FODER. It also granted power to the Minister of Energy and Mining
(or his designee or replacement) to approve the trust agreement of
the FODER and sign the trust agreement with the
trustee.
|
|
|
7.
|
Guarantee of
payment for put option: The decree empowers the Ministry of
Treasury and Public Finance to issue and deliver treasury bills to
the FODER (up to a maximum nominal value of US$3,000,000,000 or its
equivalent in other currencies) for and on behalf of the Ministry
of Energy and Mining and to guarantee the payment in the event that
the owner exercises the put option and sells the generation
plant.
|
Resolution No.
136/16, issued by the Ministry of Energy and Mining and published
in the Official Gazette on July 26, 2016, launched the public
auction process for submitting bids for Round 1 of the RenovAR
Program. Resolution No. 136/16 also approved both the bidding terms
and conditions of the above-mentioned auction and the PPAs with
CAMMESA.
According to the
terms and conditions of such bid, the relevant PPAs shall include
the following features and provisions:
|
|
1.
|
Purpose: The
purpose of the agreement must be to supply the amount of electric
power associated with the new equipment for electric power
generation from renewable sources to the WEM beginning on the date
on which the power station is permitted to operate in the WEM until
the termination of the contractual term.
|
|
|
2.
|
Seller: The
generation, co-generation or self-generation agent of the WEM whose
bid is accepted pursuant to the provisions of this resolution and
supplementary regulations set forth by the Secretariat of Electric
Energy.
|
|
|
3.
|
Buyer: CAMMESA, on
behalf of the distribution agents and Large Users of the WEM (until
such role is reassigned among distribution agents or Large Users of
the WEM), in order to meet the goals of renewable energy source
contribution set since December 31, 2017 for the demand of electric
power in the WEM.
|
|
|
4.
|
Term: Up to twenty
years from the date on which operations commence.
|
|
|
5.
|
Type and technology
of the energy to be supplied.
|
|
|
6.
|
Electricity
committed to be delivered per year.
|
|
|
7.
|
Generation capacity
of each unit and total installed capacity committed.
|
|
|
8.
|
Remuneration to be
received by the seller and paid by the buyer for the electric power
to be supplied, determined on the basis of the bid price in U.S.
dollars per megawatt/hour (US$/MWh).
|
|
|
9.
|
The terms and
conditions of the seller
’
s contractual performance
guarantee.
|
|
|
10.
|
The point of
delivery of the electric power purchased shall be the connection
node to the SADI.
|
|
|
11.
|
The remedies for
contractual breach.
|
|
|
12.
|
The enforcement of
the guarantee for payment through FODER
’
s escrow account.
|
|
|
13.
|
Contracts for the
purchase of electric power shall have first priority in payment and
rank equally with payments to the WEM.
|
97
On September 5,
2016, after concluding the period for submitting bids to the first
round of the RenovAr Program, the Minister of Energy and Mining,
Juan Jos
é
Aranguren, and
the Undersecretary of Renewable Energies, Sebasti
á
n Kind, pursuant to Resolution No. E
205/16 signed by the Minister of Energy and Mining, announced that
123 bids were submitted, requesting 6,346 MW (six times more than
1,000MW originally tendered), of which 105, a total of
approximately 5,209 MW, were technically qualified. This consisted
of 42 wind projects with a total installed capacity of
approximately 2,780 MW, 50 solar projects with a total installed
capacity of approximately 2,304 MW and 13 biomass, biogas and small
hydroelectric power projects with a total installed capacity of
approximately 35 MW.
Pursuant to
Resolution No. 213-E/16 of the Minister of Energy and Mining, the
results of the tender were published on October 7, 2016. A total of
29 projects with a total installed capacity of 1,141.51 MW, located
in nine different provinces were awarded:
●
12 wind projects
for a total installed capacity of 707 MW, with a weighted average
price of US$59.39/MWh, a minimum price of US$49.10/MWh and a
maximum price of US$67.20/MWh;
●
four solar projects
for total installed capacity of approximately 400 MW, with a
weighted average price of US$59.75/MWh, a minimum price of
US$59.00/MWh and a maximum price of US$60.00/MWh;
●
five small hydro
projects for total installed capacity of 11.37 MW, all at a price
of US$105/MWh;
●
six biogas projects
with a total installed capacity of approximately 8.64 MW, with a
weighted average price of US$154 /MWh, a minimum price of
US$118/MWh and a maximum price of US$160/MWh; and
●
two biomass
projects, for a total installed capacity of 14.5 MW, both at a
price of US$110/MWh.
Round 1.5 of the RenovAr Program: Public Bid Process for New
Renewable Energy Generation Units
In October 2016,
the Ministry of Energy and Mining also issued Resolution No.
252-E/16, calling for national and international bids under round
1.5 of the RenovAr Program to auction an additional 600 MW of
renewable energy (400 MW of wind and 200 MW of solar). On November
11, 2016, CAMMESA began analyzing the technical aspects of the bids
that were filed, which included 47 projects totaling 2,486.4
MW.
Pursuant to
Resolution No. 281-E/16 of the Minister of Energy and Mining, the
results of the tender were published on November 25, 2016. A total
of 30 projects with a total installed capacity of 1,281.53 MW,
located in 12 different provinces were awarded:
●
ten wind projects
for a total installed capacity of 765.35 MW, with a weighted
average price of US$53.34/MWh, a minimum price of US$46/MWh and a
maximum price of US$59.38/MWh; and
●
20 solar projects
for total installed capacity of approximately 516.18 MW, with a
weighted average price of US$54.94/MWh, a minimum price of
US$48.00/MWh and a maximum price of US$59.20/MWh.
Round 2 of the RenovAr Program: Public Bid Process for New
Renewable Energy Generation Units
Following Rounds 1
and 1.5 of the RenovAR Program, the Ministry of Energy and Mining
pursuant to Resolution No. 275/17, launched Round 2 of the program
on August 17, 2017 and granted awards in the amount of 2,043 MW of
renewable power capacity.
We submitted bids
for Round 2 of the RenovAR Program on October 19, 2017 and, on
November 29, 2017, we were awarded a wind energy project called,
“
La Genoveva
I,
”
which will allow us
to add an additional capacity of 86.6 MW to our portfolio and to
continue to build a presence in the renewable energies sector. On
January 11, 2018 and February 21, 2018, Vientos La Genoveva,
acquired an usufruct over the land where La Genoveva I is located.
In addition, on March 23, 2018, our subsidiary CP Renovables S.A.
acquired 100% of the equity interests in Vientos La Genoveva S.A
and, on that same date, transformed it into a S.A.U.
98
Round 2.5 of the RenovAr Program: Public Bid Process for New
Renewable Energy Generation Units
After Round 2.0,
the Ministry of Energy and Mining issued Resolution No. 473/2017 of
November 30, 2017, which launched Round 2.5. The companies invited
to participate in this new round were those companies that filed
bids in Round 2.0 and were unsuccessful due to a small
margin.
As a result of
Round 2.5 by means of Resolution 488-E/2017 of the Ministry of
Energy and Mining, issued on December 19, 2017, 22 additional
projects (totaling 634.3 MW of projected power) were
awarded.
Round 3.0 of the RenovAr Program: Public Bid Process for New
Renewable Energy Generation Units
Through Resolution
No. 100/2018, dated November 14, 2018, the Government Secretary of
Energy launched Round 3.0 of the RenovAr program and issued the
bidding terms and conditions ruling such bidding
contest.
In this new round,
participants can submit bids with respect to electricity projects
of no more than 10MW of capacity each, regardless of the applicable
technology (wind, solar, etc.). The total capacity to be awarded in
this round is 400MW of renewable energy.
According to the
current schedule, offers must be filed on or before March 27, 2019,
which should be evaluated and qualified on May 7. On May 17, the
resolution awarding the PPA’s should be decided, while these
agreements should be executed between May 20, and November 8,
2019.
Pursuant to the
RenovAR regulatory framework, we were awarded with 3 wind projects:
La Castellana I in Round 1, Achiras I in Round 1.5 and La Genoveva
I in Round 2.0. The wind farm La Castellana I reached commercial
operation date (COD), in August 2019, and Achiras I reached
commercial operation date on September 2019. The following table
shows the main characteristics of each of the wind
farms:
|
|
La
Castellana I
|
Achiras
I
|
La
Genoveva I
|
|
Location
|
Province of Buenos
Aires
|
Province of
Córdoba
|
Province of Buenos
Aires
|
|
Status
|
In
operation
|
In
operation
|
Under
construction
|
|
Commercial
operation date / Expected commercial operation date
|
August
2018
|
September
2018
|
May
2020
(1)
|
|
Awarded electric
capacity
|
99 MW
|
48 MW
|
86.60MW
|
|
Regulatory
Framework
|
RenovAr
1.0
|
RenovAr
1.5
|
RenovAr
2.0
|
|
Awarded price per
MWh
|
US$61.50
|
US$59.38
|
US$40.90
|
|
Contract
length
|
20 years, starting
from commercial operation
|
20 years, starting
from commercial operation
|
20 years, starting
from commercial operation
|
|
Power purchase
agreement signing date
|
January
2017
|
May
2017
|
July
2018
|
|
Number of
units
|
32 wind
turbines
|
15 wind
turbines
|
21 wind
turbines
|
|
Wind turbine
provider
|
Acciona
Windpower—Nordex
|
Acciona
Windpower—Nordex
|
Vestas
|
_____________
(1) The commercial
operation date (COD) committed with CAMMESA of La Genoveva I is 720
days after the PPA signing date, which was on July 27,
2018.
Remuneration Scheme
The Current Remuneration Scheme
On February 28,
2019, the Secretary of Renewable Resources and Electric Market of
the National Ministry of Economy issued Resolution No. 1/2019
(published in the Official Gazette on March 1, 2019, day in which
it came into force), which abrogated Resolution No. 19/17,
modifying the remuneration scheme for Authorized Generators in the
Wholesale Electricity Market (“Resolution SRRyME No.
1/19”). Resolution SRRyME No. 1/19 establishes that
Authorized Generators are those who do not have contracts in the
term market in any of its modalities.
99
According to the
recitals of Resolution SRRyME No. 1/19, the remuneration scheme set
forth by such regulation aims at being applied transitorily, until
the gradual definition and implementation of regulatory mechanisms
oriented at achieving an autonomous, competitive and sustainable
operation that allows the free contracting between offer and
demand, and a technical, economical and operational functioning
that makes it possible to integrate the different generation
technologies to ensure a trustworthy system at a minimal
cost.
Remuneration of thermal generators
The Resolution
SRRyME No. 1/19 sets forth, regarding generation from thermal
sources, that authorized thermal generators will be remunerated for
(i) monthly available capacity and (ii) energy.
Remuneration for
available capacity is comprised of (i) a minimum price associated
to the real available capacity (DRP) and (ii) a price for
guaranteed capacity according to the fulfilment of an offered
guaranteed capacity availability (DIGO). DIGO is the capacity
availability offered by an authorized thermal generator for each
“g” generation unit for each DIGO period (which are:
(a) summer period: December-January-February, (b) winter period:
June-July-August, (c) remaining periods: (c1) March-April-May, (c2)
September-October-November). The power remuneration will be
affected according to the use factor (FU) of the generation
unit.
Remuneration for
energy will be the sum of two items: (i) Generated Energy and (ii)
Operated Energy (associated to the rotating power in each hour).
The hourly volume of Operated Energy must correspond with the
optimal dispatch for the fulfilment of energy and reservoirs
assigned. Remuneration for energy is determined at the connection
node of the generator.
Remuneration for Available Capacity
: the
base price to remunerate capacity from thermal sources will be
determined pursuant to the following values of capacity base price
(PrecBasePot), price of guaranteed capacity (PrecPotDIGO) and use
factor (FU):
|
Technology
/ Scale
|
PrecBasePot
[USD/MW-month]
|
|
CC big P > 150
MW
|
3,050
|
|
CC small P ≤
150 MW
|
3,400
|
|
ST big P > 100
MW
|
4,350
|
|
ST small P >50
MW
|
5,200
|
|
GT big P> 50
MW
|
3,550
|
|
GT small P ≤
50 MW
|
4,600
|
|
Internal Combustion
Engines
|
5,200
|
|
Period
|
PrecPotDIGO
[USD/MW-month]
|
|
Summer:
December-January-February
|
7,000
|
|
Winter: June
– July – August
|
7,000
|
|
Remaining
periods
|
5,500
|
Use Factor (FU):
In each
“n” month of economic transactions a FU will be
calculated for each generation unit (“g”), which is
defined as:
FUgn =
GenAñoMóvn / (DRPg.n.prom x hs año
móvil)
Being DRPg.n.prom:
the average real available capacity of the generation unit
“g” in the mobile year prior to the “n”
month in which the declaration of economic transaction (DTE) is
issued.
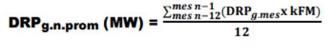
Being mes =
month.
Being kFM = hours
of the month outside the agreed maintenance, divided by the hours
of the month.
Being Hs año
móvil: the total hours of the mobile year prior to the
“n” month in which the DTE is issued.
Being
GenAñoMovn: the total generation of the generation unit
“g” in the mobile year prior to the “n2 month in
which the DTE is issued.
In addition to the
abovementioned, the remuneration for available capacity will also
depend on the real available capacity (DRP), which is the average
monthly availability corresponding to the “m” month of
each generation unit (“g”) that is not under programmed
and agreed maintenance and that will be calculated for thermal
authorized generators considering the hourly values registered
during the month. The application in the calculation for the
“m” month will be made taking into consideration the
values registered during the month.
100
Following the
abovementioned, Resolution No. 1/10 sets forth that the monthly
remunerating for available capacity shall be proportional to the
monthly availability, the use factor of the generation unit and a
price that will vary periodically.
In that sense, the
resolution under comment differences remuneration of generators
that do not declare DIGO from generators that do declare
it.
In case of
generators that do not declare DIGO, the remuneration is the DRP of
the month valued at the capacity base price mentioned above.
Availability is calculated detracting forced unavailable capacity
and unavailable power due to agreed or programmed maintenance
works.
REM BASE [$/mes] =
PrecBasePot * DRP [MW] * kFM
Being kFM: hours of
the month outside agreed maintenance/hours of the
month
In case of
generators that declare DIGO, their remuneration for offered
guaranteed capacity is a remuneration of available capacity (with
cap as physical magnitude to be computed in the DIGO) that is
valued as PrecPotDIGO [$/MW-month] according to
following:
a)
If DRP ≥
DIGO
REM DIGO [$/month]
= (DRP – DIGO) [MW] * kFM * PrecMinPot + DIGO [MW] * kFM
*
PrecPotDIGO
b)
If DRP <
DIGO
REM DIGO [$/month]
= MAX {REM BASE; DRP [MW] * kFM * PrecPotDIGO * DRP /
DIGO}
Being kFM = hours
of the month outside of agreed maintenance/hours of the
month
The total
remuneration for available capacity of generators will depend on
whether they declared DIGO or not.
Total Remuneration
for Available Capacity for Generators that do not declare
DIGO
:
Total
remuneration for available capacity will be calculated, for
generators that do not declare DIGO, exclusively pursuant to the
concepts explained above and its application will be made
considering the Use Factor (FU):
●
If FU < 30% REM
TOT ($/month) = REM BASE * 0.7
●
If 30 %<= FU
< 70% REM TOT ($/month) = REM BASE * (FU * 0.75 +
0.475)
●
If FU >= 70% REM
TOT ($/month) = REM BASE
Total Remuneration
for Available Capacity for Generators that declare
DIGO
:
The sum of the
remunerations mentioned above and its application will be made
considering the Use Factor (FU):
●
If FU < 30% REM
TOT ($/mes) = REM DIGO * 0.7
●
If 30 %<= FU
< 70% REM TOT ($/mes) = REM DIGO * (FU * 0.75 +
0.475)
●
If FU >=
70% REM TOT ($/mes) = REM DIGO
Energy Remuneration
Energy remuneration
is comprised of two items: (i) generated energy and (ii) operated
energy. This remuneration is determined at the connection node of
the generator.
101
Remuneration for Generated Energy
For conventional
thermal generation, a máximum value (depending on the kind of
fuel used by the generation unit “g”) will be
considered in concept of non-fuel variable costs [
CostoOYMxCom
b], as indicated in the
below chart, for the energy delivered in each hour:
|
Technology/Scale
|
CostoOYMxComb
|
|||
|
Natural
Gas [US$/MWh]
|
FuelOil/GasOil
[US$/MWh]
|
BioComb
[US$/MWh]
|
Mineral
Coal [US$/MWh]
|
|
|
CC big P > 150
MW
|
4
|
7
|
10
|
-
|
|
CC small P < 150
MW
|
4
|
7
|
10
|
-
|
|
TV big P > 100
MW
|
4
|
7
|
10
|
12
|
|
TV small P < 100
MW
|
4
|
7
|
10
|
12
|
|
TG big P > 50
MW
|
4
|
7
|
10
|
-
|
|
TG small P < 50
MW
|
4
|
7
|
10
|
-
|
|
Internal Combustion
Engines
|
4
|
7
|
10
|
-
|
The values
expressed in the above chart will be the maximum that shall be
recognized as non-fuel variable cost (CVNC) in the production
variable cost (CVP) declarations for generators that operate with
their own fuel. For each generation unit that is subject to its own
supply of fuel, which is being required to dispatch and does not
have the fuel pursuant to which it was requested to dispatch, such
generation unit will lose its dispatch ranking until (in case of
being necessary) CAMMESA provides the necessary fuel for its
operation. In this last case, the generator will only be
remunerated for Generated Energy,50% of the corresponding
CVNC.
Remuneration for Operated Energy
Generators receive
a monthly remuneration for Operated Energy, represented by the
integration of the hourly powers in the period, valued at 1.4
US$/MWh for each kind of fuel used by the generation unit. For each
generation unit subject to its own supply of fuel, which is being
required to dispatch and does not have the fuel pursuant to which
was requested to dispatch, such generation unit will lose its
dispatch ranking until (in case of being necessary) CAMMESA
provides the necessary fuel for its operation. In this last case,
Operated Energy will only be acknowledged up to the Generated
Energy of the generation unit and the valorization price of such
Operated Energy will be reduced in 50%.
Remuneration of hydroelectrical generators
Remuneration of
authorized hydroelectrical generators is comprised of (i) a payment
for monthly available capacity and (ii) a payment for energy (which
is comprised of two items: (a) generated energy and (b) operated
energy).
Remuneration for Available Capacity
This remuneration
will depend on the DRP and a capacity base price. The latter will
be determined pursuant to the following values considering the
technology of the generation unit and its size.
|
Technology/Scale
|
Capacity
Base Price (PrecBasePot) [USD/MW-month]
|
|
Large HI Units with
P > 300 MW
|
3,000
|
|
Medium size HI
Units with P > 120 and < 300 MW
|
4,000
|
|
Small HI Units with
P > 50 and < 120 MW
|
5,500
|
|
Renewable HI Units
with P < 50 MW
|
9,000
|
|
Large HB pumping
Units with P > 300 MW
|
1,500
|
|
Medium size HB
pumping Units with P > 120 and < 300 MW
|
2,500
|
DRP is the average
monthly available capacity corresponding to the “m”
month of each generation unit (“g”) that is not under
programed and agreed maintenance and that will be calculated for
hydroelectrical authorized generators considering the monthly
average real availability determined independently from the real
level of the dam or the inputs and expenditures. The application in
the calculations for month “m” is made taking into
consideration the values registered in the month. In the case of
hydroelectrical pumping units (HB), it must be considered, for the
evaluation of its availability, both the corresponding to its
operation as a turbine in all the hours of the period, as well as
its availability as pump in all the hours of the
period.
Following the
abovementioned, remuneration of availability capacity (REM
PBASE[$/month) is calculated pursuant to the following
formula:
REM PBASE [$/month]
= PrecBasePot * DRP [MW] * kFM
Being kFM: hours of
the month outside agreed maintenance/hours of the
month
102
Remuneration for Energy
This remuneration,
which is determined at the connection node of the generator, is
comprised of two items (i) remuneration for generated energy and
(ii) remuneration for operated energy.
With respect to the
remuneration for generated energy, in each hour, the price of the
energy generated will be 3.5 US$/MWh.
Regarding
remuneration for operated energy, generators will receive a monthly
remuneration, represented by the integration of hourly powers in
the period, equal to 1.4 US$/MWh. The hourly volume of operated
energy must correspond to the optimal dispatch for the fulfilment
of energy and reservoirs assigned.
With relation to
hydroelectrical pumping plants operating as a synchronic
compensator, they will be granted a 1.0 US$/MVAr for the MVAr
exchanged with the grid in required hours.
Generators using alternative sources
Generators using
alternative sources will be remunerated for the energy supplied
(Non-Conventional Energy Remuneration, REM ENC).
Resolution SRRyME
No. 1/19 sets forth that energy generated form non-conventional
resources (solar, eolic, biomass, biogas) will be priced at US$
28/MWh (Non-Conventional Energy Price, PENC).
Following this, the
Non-Conventional Energy Remuneration will be calculated by the
hourly integration in the month of the energy generated by
generation unit “g” in each hour “h”
[EGengh] by PENC in that hour:
REM ENC ($/month) =
∑h.month (PENC * EGengh)
Generation coming
from units that are in a stage prior to commercial authorization
will be granted 50% of the corresponding remuneration until
reaching such authorization.
Resolution SEE 70/18 - Option to purchase fuel for units under
Energía Base Regulatory Framework
On November 7,
2018, pursuant to Res. SEE 70/18, the Argentine government
authorized generators to purchase their own fuel for assets under
the Energía Base Regulatory framework. If generation companies
opt to take this option, CAMMESSA values and pays the generators
their respective fuel costs in accordance with the Variable Costs
of Production (CVP) declared by each generator to CAMMESA. The
agency in charge of dispatch (Organismo Encargado del Despacho or
“OED” using the Spanish acronym) -CAMMESA- will
continue to supply the fuel for those generation companies that do
not elect to take this option.
The Previous Remuneration Scheme
Resolution SEE No. 19/17
On January 27,
2017, the Secretariat of Electric Energy issued Resolution SEE No.
19/17 (published in the Official Gazette on February 2, 2017),
replacing Resolution SE No. 95/13, as amended. As explained above,
Resolution SEE No. 19/17 was abrogated by Resolution SRRyME No.
1/19.
Pursuant to
Resolution SEE No. 19/17, the Secretariat of Electric Energy
established that electric power generators, co-generators and
self-generators acting as agents in the WEM operating conventional
thermal power plants, may submit guaranteed availability offers
(
ofertas de
disponibilidad garantizada
) in the WEM. Pursuant to these
offers, these generation companies may commit specific capacity and
power output, provided that such capacity and energy had not been
committed under PPAs entered into in accordance with Resolutions
Nos. 1193/05, 1281/06, 220/07, 1836/07 and 200/09 of the former
Secretary of Energy, Resolution No. 21 of the Secretariat of
Electric Energy, and Resolutions Nos. 136/16 and 213/16 of the
Ministry of Energy and Mining, as well as PPAs subject to a
differential remuneration scheme established or authorized by the
Ministry of Energy and Mining. Offers must be accepted by CAMMESA
(acting on behalf of the WEM agents demanding electric power),
acting as the purchaser of the power under the guaranteed
availability agreements (
compromisos de disponibilidad
garantizada
). Resolution SEE No. 19/17 established that such
agreements may be assigned to electricity distribution companies
and Large Users of the WEM once the state of emergency of the
electric power sector in Argentina elapses (according to Decree No.
134/2015, such emergency expired on December 31, 2017). Generator
agents fully or wholly-owned by the Argentine government are
excluded from the scope of Resolution SEE No. 19/17.
103
The term of the
guaranteed availability agreements were 3 years, and their general
terms and conditions were established in Resolution SEE No.
19/17.
According to such
regulation, the remuneration in favor of the generator was
calculated in U.S. dollars pursuant to the formulas and values set
forth in the aforementioned resolution and comprised (i) a price
for the monthly capacity availability, and (ii) a price for the
power generated and operated.
Resolution SEE No.
19/17 also established that WEM agents that operate conventional
hydroelectric power plants, pumped hydroelectric power plants and
power plants using other energy resources shall be remunerated for
the energy and capacity of their generation units in accordance
with the values set forth in such resolution, and provided that
such energy and capacity has not been committed under PPAs entered
into in accordance to Resolutions Nos. 1193/05, 1281/06, 220/07,
1836/07 and 200/09 of the former Secretary of Energy, Resolution
No. 21/16 of the Secretariat of Electric Energy, and Resolutions
Nos. 136/16 and 213/16 of the Ministry of Energy and
Mining.
The abrogated
remuneration scheme established by Resolution SEE No. 19/17
included the following items:
(1) Price for
Available Capacity
The price for
capacity availability is divided into a minimum price associated
with Actual Available Capacity (
“
DispReal,
”
in Spanish), a Base Price tied to
the achievement of the Guaranteed Bid Capacity (
“
DIGO
”
, in Spanish), and an additional
maximum price tied to the achievement of an Allocated Capacity
(
“
DIGOasig,
”
in Spanish),
plus
an additional
increase in the unit price to deal with situations of maximum
thermal demand from the system. Below is a detail of the tariffs
applicable to these technologies:
|
Unit
|
Power
(MW)
|
Minimum capacity
price (US$/MW per month)
|
Base capacity
price May-Oct 2017 (US$/MW per month)
|
Base capacity
price after Nov 2017 (US$/MW per month)
|
Additional
capacity price May-Oct 2017 (US$/MW per month)
|
Additional
capacity price after Nov 2017 (US$/ MW per
month)
|
|
TG
|
P<50
|
4,600
|
6,000
|
7,000
|
1,000
|
2,000
|
|
TV
|
P<100
|
5,700
|
6,000
|
7,000
|
1,000
|
2,000
|
|
|
P>100
|
4,350
|
6,000
|
7,000
|
1,000
|
2,000
|
|
CC
|
P<150
|
3,400
|
6,000
|
7,000
|
1,000
|
2,000
|
|
|
P>150
|
3,050
|
6,000
|
7,000
|
1,000
|
2,000
|
|
HI
|
P>300
|
N/A
|
2,000
|
2,000
|
500
|
1,000
|
Thermal Generation:
For thermal units,
the price for Available Capacity is calculated as
follows:
If a generator did
not submit the DIGO or DIGOasig, the price for available capacity
will be equal to the Minimum Price (
“
REM MIN
”
in Spanish):
REM MIN (US$/month)
= Minimum Capacity Price * DispReal (MW) * kM
where:
kM = accounts for
hours of the month minus scheduled maintenance hours of the
month.
For thermal units
that report the DIGO and DIGOasig, the Price for Total Available
Capacity = Base Price + Additional Price, where:
●
Base
Price:
●
If DispReal
DIGO, then Base Price is
equal to (DispReal
–
DIGO) * kM * Minimum Capacity Price + DIGO * Base Capacity Price *
kM.
●
If DispReal <
DIGO, then Base Price is equal to the greater of (i) REM MIN or
(ii) DispReal * Base Capacity Price * kM *
DispReal/DIGO.
●
Additional Price
(REM ADC):
●
If DispReal
–
DIGO
DIGOasig, Additional Price is equal
to DIGOasig * Additional Capacity Price * kM.
●
If DispReal
–
DIGO < DIGOasig,
then Additional Price is equal to 0.
where:
104
kM = accounts for
hours of the month minus scheduled maintenance hours of the
month.
Hydroelectric Generation
For hydroelectric
units, the price for Available Capacity is calculated as
follows:
●
Base Price is equal
to Base Capacity Price * (DispReal + scheduled maintenance),
and
●
Additional Price is
equal to Additional Capacity Price * DispReal
Unlike thermal
units, hydroelectric units charge for these items, either
dispatched or not (regardless of the reservoir level), to the
extent they are not under forced unavailability.
(2) Price for
Generated and Operated Power
|
|
Generated
power
|
Operated
power
|
||||||
|
Unit
|
Natural
gas
|
Liquids
|
Biodiesel
|
Hydro
|
Natural
gas
|
Liquids
|
Biodiesel
|
Hydro
|
|
|
US$/MWh
|
US$/MWh
|
US$/MWh
|
US$/MWh
|
US$/MWh
|
US$/MWh
|
US$/MWh
|
US$/MWh
|
|
GT
|
5.0
|
8.0
|
11.0
|
|
2.0
|
2.0
|
2.0
|
|
|
ST
|
5.0
|
8.0
|
11.0
|
|
2.0
|
2.0
|
2.0
|
|
|
CC
|
5.0
|
8.0
|
11.0
|
|
2.0
|
2.0
|
2.0
|
|
|
HI
P>300MW
|
|
|
|
3.5
|
|
|
|
1.4
|
Operated Power
means the integral function of the hourly power capacity dispatched
during the period, including all power and reserves allocated to
that generator. The hourly energy of Operated Power will be
consistent with the optimal dispatch for the achievement of the
allocated power and reserves.
Efficiency Incentives
On a quarterly
basis, actual fuel consumption is compared to reference consumption
for each unit and fuel type. The percentage difference is added to
increase the value of Generated Power from the respective fuel
plus
the
fuel related to Operated Power and is recognized as an additional
amount only in the case of power generated with the fuel supplied.
The base price will not be affected by increased consumption.
Reference values for specific consumption are as
follows:
|
|
Natural
gas
|
Alternative
fuels
|
|
Unit
|
kcal/kWh
|
kcal/kWh
|
|
GT
|
2,400
|
2,600
|
|
ST
|
2,600
|
2,600
|
|
Large CC (>180
MW)
|
1,680
|
1,820
|
|
Other
CC
|
1,880
|
2,000
|
Resolutions SE Nos. 95/13 and 529/14 and Amending
Regulations
On March 26, 2013,
the Official Gazette published Resolution No. 95/2013 issued by the
former Secretariat of Electric Energy (
“
Resolution No. 95
”
), which established a contracting
and remuneration scheme for all generation, co-generation and
self-generation agents of the WEM, except for the binational
hydroelectric power plants and nuclear generators, as well as the
capacity and electric power produced by the generation,
co-generation and self-generation agents of the WEM that had been
committed within the framework of contracts regulated by the former
Secretariat of Electric Energy through Resolutions SE No. 1193 of
October 7, 2005, No. 1281 of September 4, 2006, No. 220 of January
18, 2007, No. 1836 of November 27, 2007, No. 200 of March 16, 2009,
No. 712 of October 9, 2009, No. 762 of November 5, 2009, No. 208 of
March 29, 2011 and No. 137 of April 25, 2011, Law No. 27,191, as
well as any other type of electric power supply agreements with a
differential price scheme established by the former Secretariat of
Electric Energy.
In addition, to
optimize and minimize the costs of the supply of fuels to the WEM
generation plants, the dispatch agency (CAMMESA) centralized the
commercial management and dispatch of fuels. As from the date of
publication of Resolution No. 95, and upon termination of the
contractual relationships between the WEM agents and their
providers of fuels and related supplies, such operation costs shall
no longer be recognized by CAMMESA.
This remuneration
scheme governed the economic transactions conducted between
February 2013 and January 2017, when it was replaced by Resolution
SEE No. 19/17. However, the effective application of such system to
each particular generator required that the generator waive each
court or administrative claim brought by it against the Argentine
government, the former Secretariat of Electric Energy (now the
Ministry of Energy and Mining) and CAMMESA, in connection with the
2008-2011 Agreement and/or Resolution SE No. 406/03. If such
requirements had not been met, generators would not have access to
the above referenced remuneration scheme, or to the previous
scheme, which remains in effect.
105
This remuneration
scheme is comprised of three items: (i) fixed costs remuneration,
(ii) variable costs remuneration and (iii) additional remuneration.
Additional remuneration was composed of two items: (i) additional
remuneration allocated to the generator, which was settled and paid
to the generator, and (ii) additional remuneration allocated to the
trust, which was included in a trust fund that provides financing
to new infrastructure projects in the electric power
sector.
Furthermore,
Resolution No. 95 temporarily suspended the inclusion of new
contracts in the term market and determined that once those
existing prior to the issuance of such resolution have been
terminated, the Large Users of the WEM had the obligation to
acquire their electric power demand from CAMMESA, subject to the
conditions set forth by the former Secretariat of Electric Energy
to that effect. The generators received remuneration based on the
method set forth by Resolution No. 95. On August 20, 2013, the
former Secretariat of Electric Energy implemented a payment
priority mechanism whereby CAMMESA distributed the amounts it
received directly from WEM Large Users for the supply of their
demand among the generators included in Resolution No. 95. Such
amounts were allocated primarily to pay the remuneration of the
generators according to the following scheme: first to cover fixed
costs, then variable costs and finally the direct additional
remuneration.
As it concerns the
generation of electric power from renewable sources, Law No. 27,191
excluded the enforcement of regulations that limit the execution of
contracts in the term market.
Pursuant to
Resolution SE No. 2053/13, the new remuneration scheme was
established in a particular way for each of the agents as from the
day on which the corresponding generators withdraw all of the
administrative and judicial claims against the Argentine government
and CAMMESA regarding (i) the
“
Acuerdo Para La Gestion Y
Operacion De Proyectos, Aumento De La Disponibilidad De Generacion
Termica Y Adaptacion De La Remuneracion De La Generacion 2008-2011
(Acuerdo 2008-2011)
”
issued by the former Secretariat of
Electric
Energy and
generators from the WEM, on November 25, 2010 and (ii) Resolution
No. 406/03 of the former Secretariat of Electric
Energy.
On May 31, 2013,
Central Puerto, HPDA and CTM complied with the terms of Resolution
No. 95. LPC informed the former Secretariat of Electric Energy of
its intention to comply with the scheme described above with
amendments to certain sections. However, as of the date of this
annual report, the former Secretariat of Electric Energy has not
given an answer to these amendments. Therefore, the new
remuneration scheme described above is not applicable to LPC and,
consequently, the previous regulation remains in force. As of
December 31, 2017, the La Plata plant was classified as a disposal
group held for sale and its respective results for years ended
December 31, 2018, 2017 and 2016 as discontinued operations in our
audited consolidated financial statements. Effective as of January
5, 2018, we sold the La Plata plant to YPF EE. For further
information, see “
Item 4.A.
History and development of the Company
—La Plata Plant
Sale”.
On May 23, 2014,
the Official Gazette published Resolution SE No. 529 issued by the
former Secretariat of Electric Energy, which updated the
remuneration amounts fixed in Resolution No. 95 for all generation,
co-generation and self-generation agents of the WEM included in
such resolution.
In addition,
Resolution No. 529 included a new scheme of non-recurring
maintenance remuneration, which shall become effective once major
maintenance costs are incurred related to the equipment of such
thermal power plants, and subject to approval by the Secretariat of
Electric Energy. Until such non-recurring maintenance works are
carried out and approved by the Secretariat of Electric Energy, the
non-recurring maintenance remuneration shall be documented as a
sale settlement with a maturity date to be determined.
On July 17, 2015,
the Secretariat of Electric Energy set forth Resolution SE No. 482
whereby: (i) it replaced Annexes I, II, III, IV and V to Resolution
SE No. 529 (which amended Resolution No. 95), updating the
remuneration amounts fixed therein; (ii) amended the calculation of
transmission variable charges applicable to hydroelectric and
renewable generators; (iii) incorporated an additional item
referred to as
“
Funds for
FONINVEMEM 2015- 2018
’
s
Investments
”
(
“
FONINVEMEM 2015-2018
Funds
”
); (iv) included a
remuneration item referred to as
“
FONINVEMEM 2015-2018 Direct
Remuneration
”
applicable
to units installed within the framework of FONINVEMEM 2015-2018;
(v) new specific contributions scheme for generators involved in
investment projects approved by the former Secretariat of Electric
Energy and a new incentive scheme for energy production and
operational efficiency for a certain group of generators; and (vi)
amended the payment method of the fixed costs remuneration and the
non-recurring maintenance remuneration.
The Secretariat of
Electric Energy amended the remuneration scheme established by
Resolution No. 482 through Resolution SEE No. 22/16.
106
Resolution SE No. 95/13 Remuneration Scheme
The remuneration
scheme of Resolution SE No. 95/13, as amended by Resolution SEE No.
22/16, included the following items:
(1) Fixed Costs
Remuneration
The fixed costs
remuneration was determined on a monthly basis assuming the
following prices (applicable as of
February 2016):
|
Technology
and scale
|
Pesos/MW-hrp(1)
|
|
Gas turbine units
with power (P) < 50 Mw (small)
|
152.3
|
|
Gas turbine units
with power (P) > 50 Mw (large)
|
108.8
|
|
Steam turbine units
with power (P) < 100 Mw (small)
|
180.9
|
|
Steam turbine units
with power (P) > 100 Mw (large)
|
129.2
|
|
Combined cycle
units with power (P) < 150 Mw (small)
|
101.2
|
|
Combined cycle
units with power (P) > 150 Mw (large)
|
84.3
|
|
Hydroelectric units
with power (P) < 30 Mw (renewable)
|
299.2
|
|
Hydroelectric units
with power (P) 30 to 120 Mw (small)
|
227.5
|
|
Hydroelectric units
with power (P) 120 Mw to 300 Mw (medium)
|
107.8
|
|
Hydroelectric units
with power (P) > 300 Mw (large)
|
59.8
|
|
Internal combustion
motors
|
180.9
|
|
Wind
farms
|
-
|
|
Solar photovoltaic
power plants
|
-
|
|
Biomass and
biogas—solid urban waste
|
-
|
(1)
MW-hrp means the
power available during the time of the day defined in advance by
the authorities in the seasonal programing.
The calculation
methodology to determine the fixed costs remunerations for the
relevant generation agents with conventional thermal generation
equipment (gas turbine, steam turbine and combined cycle) varied
depending on the Registered Availability (A), Target Availability
(TA) of the technology, Historical Availability (HA) and the season
of the year.
The formula defined
a base percentage to be applied to the fixed costs remuneration,
based on the following values:
|
Combined
cycle units
|
June
– July – August – December – January
– February
|
March
– April – May – September – October –
November
|
|
A >
95.00%
|
110.00%
|
100.00%
|
|
85.00% < A
95.00%
|
105.00%
|
100.00%
|
|
75.00% < A
85.00%
|
85.00%
|
85.00%
|
|
A
75.00%
|
70.00%
|
70.00%
|
|
|
|
|
|
Steam
turbine units
|
June
– July – August – December – January
– February
|
March
– April – May – September – October –
November
|
|
A >
90.00%
|
110.00%
|
100.00%
|
|
80.00% < A
90.00%
|
105.00%
|
100.00%
|
|
70.00% < A
80.00%
|
85.00%
|
85.00%
|
|
|
|
|
|
Combined
cycle units
|
June
– July – August – December – January
– February
|
March
– April – May – September – October –
November
|
|
A
70.00%
|
70.00%
|
70.00%
|
|
|
|
|
|
Internal
combustion motors
|
June
– July – August – December – January
– February
|
March
– April –May – September – October –
November
|
|
A >
90.00%
|
110.00%
|
100.00%
|
|
80.00% < A
90.00%
|
105.00%
|
100.00%
|
|
70.00% < A
80.00%
|
85.00%
|
85.00%
|
|
A
70.00%
|
70.00%
|
70.00%
|
Fifty percent of
the difference between the generator
’
s Registered Availability (A) and
Historical Availability (HA) is added to or subtracted from the
base percentage. In other words, for each percentage point of
variation in the generator
’
s A vis-a-vis its HA, the fixed
costs remuneration percentage would vary by half a percentage
point. The percentages had to be between those expected for each
period (110.00/110.00% for the highest and 70.00% for the
lowest).
Pursuant to
Resolution No. 482, the Target Availability value was determined in
relation to the available power typically available under normal
temperature conditions.
107
Historical
Availability values for each group was determined on the basis of
the registered availability in the period from 2011 to 2015. At the
end of each year, the resulting amount was added to the base until
there are five years. In the case of the units incorporated since
February 2016, the minimum value of each technology was taken as a
Target Availability value.
(2) Variable Costs
Remuneration
A new variable
costs remuneration scheme (excluding fuel costs) was established in
lieu of the variable maintenance costs and other non-fuel related
variable costs defined under Resolution SE No. 1/2003. It was
calculated on a monthly basis and was a function of the energy
generated by type of fuel:
|
|
Operates
on:
|
|||
|
|
|
Liquid fuels
|
|
|
|
Classification
|
Natural gas
|
Oil and gas FO/GO
|
Biofuel (BD)
|
Carbon (C)
|
|
|
|
Pesos/MWh
|
|
|
|
Gas turbine units
with power (P) < 50 Mw (small)
|
46.3
|
81.1
|
154.3
|
-
|
|
Gas turbine units
with power (P) > 50 Mw (large)
|
46.3
|
81.1
|
154.3
|
-
|
|
Steam turbine units
with power (P) < 100 Mw (small)
|
46.3
|
81.1
|
154.3
|
139.0
|
|
Steam turbine units
with power (P) > 100 Mw (large)
|
46.3
|
81.1
|
154.3
|
139.0
|
|
Combined cycle
units with power (P) < 150 Mw (small)
|
46.3
|
81.1
|
154.3
|
-
|
|
Combined cycle
units with power (P) > 150 Mw (large)
|
46.3
|
81.1
|
154.3
|
-
|
|
Hydroelectric units
with power (P) < 30 Mw (renewable)
|
|
36.7
|
|
|
|
Hydroelectric units
with power (P) 30 to 120 Mw (small)
|
|
36.7
|
|
|
|
Hydroelectric units
with power (P) 120 Mw to 300 Mw (medium)
|
|
36.7
|
|
|
|
Hydroelectric units
with power (P) > 300 Mw (large)
|
|
36.7
|
|
|
|
Internal combustion
motors
|
74.1
|
111.2
|
148.3
|
-
|
|
Wind
farms
|
|
112.0
|
|
|
|
Solar photovoltaic
power plants
|
|
126.0
|
|
|
|
Biomass and
biogas—solid urban waste
|
Equal to the
applicable thermal technology and scale provided above
|
|||
The calculation of
the remuneration applicable to pump hydroelectric power plants took
into account both the electric power generated and the electric
power used for pumping.
(3) Additional
Remuneration
A portion of the
remuneration was paid directly to the relevant generation agents,
while the other portion was to be set aside for a trust fund and
reinvested in new infrastructure projects in the electric power
sectors as defined by the Secretariat of Electric
Energy.
Additional
remuneration was calculated on a monthly basis and was a function
of total electric power generated.
|
|
Allocated
to:
|
|
|
Technology
and scale
|
Relevant
generation agent Pesos/MWh
|
Trust
fund Pesos/MWh
|
|
Gas turbine units
with power (P) < 50 Mw (small)
|
13.7
|
5.9
|
|
Gas turbine units
with power (P) > 50 Mw (large)
|
11.7
|
7.8
|
|
Steam turbine units
with power (P) < 100 Mw (small)
|
13.7
|
5.9
|
|
Steam turbine units
with power (P) > 100 Mw (large)
|
11.7
|
7.8
|
|
Combined cycle
units with power (P) < 150 Mw (small)
|
13.7
|
5.9
|
|
Combined cycle
units with power (P) > 150 Mw (large)
|
11.7
|
7.8
|
|
Hydroelectric units
with power (P) = 50 Mw (renewable)
|
84.2
|
14.9
|
|
Hydroelectric units
with power (P) 50 to 120 Mw (small)
|
84.2
|
14.9
|
|
Hydroelectric units
with power (P) 120 Mw to 300 Mw (medium)
|
59.4
|
39.6
|
|
Hydroelectric units
with power (P) > 300 Mw (large)
|
54.0
|
36.0
|
|
Internal combustion
motors
|
13.7
|
5.9
|
|
Wind
farms
|
-
|
-
|
|
Solar photovoltaic
power plants
|
-
|
-
|
|
Biomass and biogas
– solid urban waste
|
-
|
-
|
The remuneration
detailed above was the total remuneration receivable by the
relevant generation agents, minus the electric power and power
committed in the term market or under other similar agreements, at
market value, except for the specific contracts referred to above
and the deduction of any other fee or service to be borne by such
agents.
For the purposes of
the above paragraph, the relevant generation agents are required to
submit, for each transaction month, an affidavit with supporting
documents duly certified by an external auditor, where they shall
report all invoices issued for their commitments in the term
market, to be compared to the deductions made in the economic
transactions completed by CAMMESA. If any difference arise from
such comparison in the sums of money invoiced by any relevant
generation agent in favor of such agent, CAMMESA invoiced the
difference to such agent.
108
(4) Non-recurring
Maintenance Remuneration
In addition to the
remuneration items indicated above, Resolution SE No. 529 created a
new category named non-recurring maintenance remuneration for
relevant generation agents to be applied to economic transactions
carried out since February 2014 and calculated on a monthly basis,
based on the total electric power generated. Such remuneration
shall be documented as a sale settlement with a maturity date to be
determined and paid to a fund administered by CAMMESA and was
exclusively allocated to finance major maintenance activities
subject to approval by the Secretariat of Electric
Energy.
|
Technology
and scale
|
Maintenance
remuneration
|
|
|
(Pesos/MWh)
|
|
Gas turbine units
with power (P) < 50 Mw
|
45.1
|
|
Gas turbine units
with power (P) > 50 Mw
|
45.1
|
|
Steam turbine units
with power (P) = 100 Mw
|
45.1
|
|
Steam turbine units
with power (P) > 100 Mw
|
45.1
|
|
Combined cycle
units with power (P) = 150 Mw
|
39.5
|
|
Combined cycle
units with power (P) > 150 Mw
|
39.5
|
|
Hydroelectric units
with power (P) = 50 Mw
|
16.0
|
|
Hydroelectric units
with power (P) 50 to 120 Mw
|
16.0
|
|
Hydroelectric units
with power (P) 120 Mw to 300 Mw
|
16.0
|
|
Hydroelectric units
with power (P) > 300 Mw
|
10.0
|
|
Internal combustion
motors
|
45.1
|
|
Wind
farms
|
-
|
|
Solar photovoltaic
power plants
|
-
|
|
Biomass and
biogas—solid urban waste
|
-
|
Pursuant to
Resolution No. 482 and Resolution No. 22, the non-recurring
maintenance remuneration was calculated taking into consideration
(i) the accumulated energy generated in the preceding year and (ii)
the number of times that the applicable units starts as per the
request of CAMMESA.
(5)
“
Production
”
and
“
Operational Efficiency
”
Incentives
The incentive
scheme consisted of an increase in the variable costs remuneration,
upon compliance with certain conditions.
The
“
Production
”
incentive consisted of an increase
of 15% or 10% in the variable costs remuneration of thermal units
operating with liquid fuels or coal, respectively, when their
aggregate production in the calendar year exceeded 25% to 50%,
respectively, of their production capacity with liquid fuel or
coal, as applicable.
The
“
Operational Efficiency
”
incentive consisted of an
additional remuneration equal to the variable costs remuneration
and corresponds to the difference in percentage terms between
actual consumption and reference consumption fixed for each type of
technology unit and fuel. These values were compared on a quarterly
basis. Increased consumption does not affect the base remuneration
for variable costs.
The reference
values of specific consumption are as follows:
|
Technology
|
Natural gas
Kcal/kWh
|
Alternative
fuels (FO/GO/C) Kcal/kWh
|
|
Gas
turbine
|
2,400
|
2,600
|
|
Steam
turbine
|
2,600
|
2,600
|
|
Internal combustion
motors
|
2,150
|
2,300
|
|
Combined cycles (GT
> 180 MW)
|
1,680
|
1,820
|
|
Other combined
cycles
|
1,880
|
2,000
|
(6) FONINVEMEM
2015-2018 Funds
Pursuant to the
“
Acuerdo para la
Gesti
ó
n y
Operaci
ó
n de Proyectos,
Aumento de la Disponibilidad de Generaci
ó
n T
é
rmica y Adaptaci
ó
n de la Remuneraci
ó
n de la Generaci
ó
n 2015-2018
”
(the
“
2015-2018 Generators
Agreement
”
), Resolution
No. 482 included a specific contribution referred to as
“
Funds for FONINVEMEM
2015-2018
’
s
Investments
”
to be
allocated to the execution of works under such framework. The
FONINVEMEM 2015-2018 Funds will be allocated to generators with
projects approved by the Secretariat of Electric Energy and will
automatically and retroactively be distributed by CAMMESA upon the
execution of the related supply and construction contracts.
Pursuant to Resolution SE No. 482, the FONINVEMEM 2015-2018 Funds
do not vest rights for the generator and may be reallocated by the
Secretariat of Electric Energy in the event of failures to comply
with the supply or construction contracts, with no claim rights
whatsoever.
109
The following table
shows a detail of the FONINVEMEM 2015-2018 Funds:
|
Technology
and scale
|
Funds for
investments 2015-2018
|
|
|
(Pesos/MWh)
|
|
Gas turbine units
with power (P) = 50 Mw (small)
|
15.8
|
|
Gas turbine units
with power (P) > 50 Mw (large)
|
15.8
|
|
Steam turbine units
with power (P) = 100 Mw (small)
|
15.8
|
|
Steam turbine units
with power (P) > 100 Mw (large)
|
15.8
|
|
Combined cycle
units with power (P) = 150 Mw (small)
|
15.8
|
|
Combined cycle
units with power (P) > 150 Mw (large)
|
15.8
|
|
Hydroelectric units
with power (P) = 50 Mw (renewable)
|
6.3
|
|
Hydroelectric units
with power (P) 50 to 120 Mw (small)
|
6.3
|
|
Hydroelectric units
with power (P) 120 Mw to 300 Mw (medium)
|
6.3
|
|
Hydroelectric units
with power (P) > 300 Mw (large)
|
6.3
|
|
Internal combustion
motors
|
15.8
|
|
Wind
farms
|
-
|
|
Solar photovoltaic
power plants
|
-
|
|
Biomass and
biogas—solid urban waste
|
-
|
(7) FONINVEMEM
2015-2018 Direct Remuneration
The FONINVEMEM
2015-2018 Direct Remuneration consisted of an additional
remuneration to units being installed within the framework of
FONINVEMEM 2015-2018 and is equal to 50% of the
generators
’
direct
additional remuneration. This remuneration will start to be paid
from the commercial launch date of the unit for up to ten years
since such date.
Resolution No. 281-E/17: The Renewable Energy Term Market in
Argentina
On August 22, 2017,
the Ministry of Energy and Mining published Resolution No. 281-E/17
(
“
Resolution No.
281
”
) for the Renewable
Energy Term Market (private PPAs between generators and Large
Users, self-generation, co-generation and traders).
Resolution No. 281
seeks to promote and encourage a dynamic participation in the term
market and to foster the increase of private agreements between the
WEM
’
s agents and
participants. Its aim is to provide a feasible alternative for the
purchase of energy to tenders by CAMMESA.
Resolution No. 281
makes it possible for Large Users to comply with their renewable
energy consumption quotas through either (i) the joint purchase
system (
i.e.
, through CAMMESA),
(ii) the execution of a private PPA or (iii) the development of a
self-generation project or a co-generation project.
As a general
principle, PPAs executed in the term market (outside the joint
purchase system) may be freely negotiated between the parties with
respect to term, priorities, prices and other contractual
conditions.
Section 7 of
Resolution No. 281 provides that, in the case of curtailment, the
following power generation plants will have (i) equal dispatch
priority between them and (ii) first dispatch priority over
renewable generation projects operating in the term market without
an assigned dispatch priority:
1.
run-of-the-river
hydropower plants and renewable power plants having commenced
commercial operation prior to January 1, 2017;
2.
power plants
supplying energy pursuant to PPAs executed in connection with
Resolutions No. 712/2009 or No. 108/2011 having commenced
commercial operation prior to January 1, 2017;
3.
renewable power
plants supplying energy pursuant to PPAs executed with CAMMESA
through the RenovAr Program (
e.g.
, the La Castellana
Project and the Achiras Project);
4.
renewable power
plants supplying energy pursuant to Resolution MINEM No. 202/2016;
and
5.
renewable power
plants operating in the term market (
e.g.
, private PPAs)
which have obtained dispatch priority in accordance with the regime
established pursuant to Resolution No. 281.
Only the expansion
of the abovementioned projects need to file the request for
dispatch priority with CAMMESA, who will then evaluate submissions
on a quarterly basis and prepare a list of granted dispatch
priorities in interconnection points or transmission corridors with
restrictions to the transmission capacity.
110
Evolution of Supply and Demand in the Argentine Energy Sector
Structure
Structural Characteristics of the Energy Sector
The evolution of
the demand and the energy consumption in Argentina is correlated
with the evolution of the GDP, which implies that the higher the
economic growth, the higher the energy demand. The graphic set
forth below shows the following correlation for the period between
1994 and 2018: the historical growth of energy consumption was of
2.94% annually over the past 59 years, with an annual average of
3.2% since 2002, although between 2002 and 2018 the economic growth
rose to an average of 4.09% annually.
The growth of
energy consumption during the last decade is similar to the
historical average, since it was not driven by a large increase in
consumption of the industrial sector, but predominantly by that of
the residential and commercial sectors, as noted in the consumption
parameters of gas, gasoline and especially electric
power.
The elasticity of
energy consumption in relation to the GDP during the last two
decades is lower than in earlier decades, so restrictions on energy
demand or the need for energy imports, if domestic supply is
insufficient, could increase if the industrial sector expands in
the future.
The restrictions on
the supply of certain energy products such as natural gas in the
last cycle of high economic growth and the relatively moderate
growth in energy demand in broad terms, are based primarily on
problems related to the supply of these energy products and also on
a significant growth of the demand of the residential and
commercial segments in a context of modest industrial recovery, but
with few new expansions of greater productive capacity for large
energy consumers.
The structure of
energy consumption in Argentina is strongly dependent on
hydrocarbons, at almost approximately 63.8%. This percentage has
remained stable in the last four years.
Large amounts of
natural gas, liquefied natural gas and gas oil are imported in
order to try to satisfy demand. However, demand for natural gas is
usually unsatisfied during the winter in the industrial segment and
in the thermoelectric generation segment. In certain circumstances,
the Argentine government has imposed restrictions on consumption
because of the lack of adequate supply of gas to supply other
segments that do not have the capacity to replace natural gas with
other fuels (among others, propane, butane and fuel).
Although current
energy consumption in Argentina signals a dependence on
hydrocarbons, we believe that Argentina is currently undergoing an
important historical shift to a modern and diversified energy mix
arising from the inclusion of renewable energy into the mix, in
accordance with the requirements set forth in Law No. 27,191 of
2015.
111
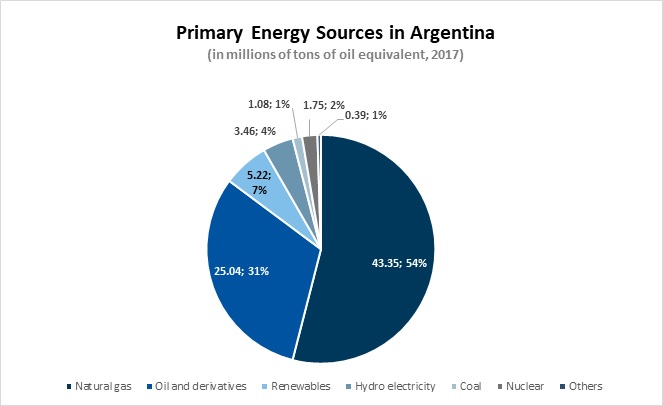
Source: Ministry of
Energy and Mining
As a summary, the
following characteristics are specific to energy demand and supply
in Argentina:
● Atypical
structure, with a bias towards oil and gas, which is a
characteristic of countries with large reserves of hydrocarbons
such as Middle Eastern countries, Russia, African oil-producing
countries and Venezuela.
● 54.00%
of the energy supply is dependent on natural gas despite
significant restrictions imposed on electric power generators and
the penetration of gas consumption in the energy market, which is
higher than in most countries that have a large sur
plus
production of
natural gas.
● Stagnation
in the local energy supply since investments in recent years in the
oil and gas sector have been insufficient to effectively increase
domestic supply enough to satisfy a nearly ever-increasing
demand.
● Enhanced
demand due to the abnormally low prices of gas and electric power
in the residential and commercial sectors during the 2012-2016
period, which caused the growth rate of residential energy
consumption to be higher than usual.
Structure of the Electric Power Supply in Argentina
The nominal
installed capacity in Argentina was reported by CAMMESA to be
38,538 MW as of December 31, 2018. However, the operational
electric power generation capacity effectively available at any
given time could be estimated at around 33,386 MW as an average of
2018. Availability estimated by CAMMESA for thermal units is
approximately 79% due to the lack of proper fuel supply,
difficulties in achieving nominal efficiency and unavailability of
several generating units under maintenance. Moreover, the
generation supply depends heavily on liquid fuel use that
diminishes capacity availability and there are certain transmission
restrictions.
Over recent
decades, the Argentine government (spanning administrations with
different ideological orientation) has favored the deployment of
thermoelectric generating units. One reason for this is that these
units require smaller capital investments and take less time to
deploy. The increased dependency on hydrocarbons for these new
power plants was not considered a disadvantage, since the required
fuels have always been produced in Argentina and the production has
always been predictable and growing. However, the constant
deployment of thermoelectric generation has increased the demand
for fossil fuels, particularly those based on natural gas, and has
led to shortages and the imposition of certain restrictions on the
provision to thermal generators of locally produced
fuels.
112
During the 1990s,
private sector investors also concentrated their investments in
thermoelectric generation, almost without exception. The economic
crisis of 2002 accelerated even more the tendency to invest in
thermoelectric plants, given their lower cost of startup. After the
crisis of 2002, investments in the electrical sector continued
mainly with state intervention, expanding the installed capacity
based on thermoelectric generation but without meeting the
increasing demand. The financial constraints of the Argentine
government in the last decades, the high amount of capital needed
and the long periods necessary to develop the projects have
negatively impacted on the decision of the Argentine government to
invest and deploy hydroelectric and nuclear power plants. In
addition, the recurrent fiscal crises of the recent past have
forced the Argentine government to delay or cancel major projects
that would have increased and diversified Argentina
’
s generation capacity.
Nominal Power Generation Capacity
Nominal power
generation capacity is dominated by thermoelectric generation. A
considerable number of thermoelectric power units experience high
levels of unavailability, especially during the winter, due to fuel
provision restrictions.
In the summer of
2017, the maximum power consumed reached 25,628 MW on February 24.
The local power availability amounted to 24,559 MW
plus
a reduced spinning
reserve (which consists of a pool of rotating machines that can
dispatch 1614 MW, if needed), so CAMMESA had to import 925 MW of
additional power.
There are three
main centers of electric power supply in Argentina:
● Buenos
Aires-Greater Buenos Aires-Coastline
● Comahue
● Northeast
Argentina
Electric power
supply and demand were linked in the past by a radial system to
Buenos Aires. This system presented risks of instability in various
regions whose demand had grown but had insufficient local
generation (
e.g.
, Cuyo, Northwest
Argentina in Salta, Central and Greater Buenos Aires). For this
reason, the Argentine government changed the system and now is
using a peripheral system. The Argentine government has made very
large investments in a substantial expansion of electric
transmission, totaling 500 kV. Such investments include laying
peripheral high voltage lines totaling 550 kV (that may not have an
immediate economic impact but will have positive effects on the
system in the long-term) in the following locations:
● Northeast
and northwest Argentina
● Comahue-Cuyo
● Southern
Patagonia
113
The following chart
shows the development of electric power generation by type of
source:

Source:
CAMMESA
Renewable Energy Generation in Argentina
Certain regions of
Argentina benefit from levels of wind or sunlight that provide a
strong potential for renewable energy generation. The maps below
show the mean wind speed at 80 meters of elevation and the average
global horizontal irradiance in Argentina,
respectively.
Average
Wind Speeds
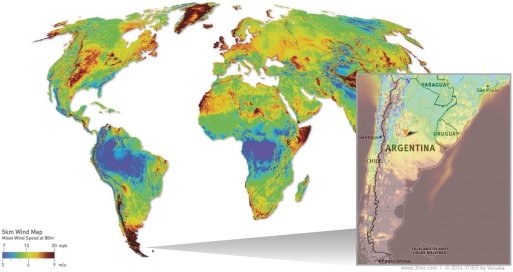
Source: Vaisala -
3Tier
114
Average
Global Horizontal Solar Irradiance (GHI)

Source: Vaisala -
3Tier
The Structure of Electric Power Demand in Argentina
Electric power
demand depends to a significant extent on economic and political
conditions prevailing from time to time in Argentina, as well as
seasonal factors. In general, the demand for electric power varies
depending on the performance of the Argentine economy, as
businesses and individuals generally consume more energy and are
better able to pay their bills during periods of economic stability
or growth. As a result, electric power demand is affected by
Argentine governmental actions concerning the economy, including
with respect to inflation, interest rates, price controls, foreign
exchange controls, taxes and energy tariffs.
The following chart
shows the demand for electric power in 2018 by customer
type:
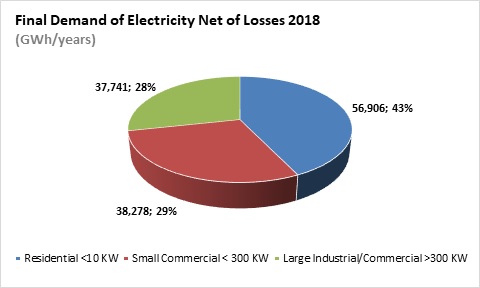
Source:
CAMMESA
115
The following chart
shows the evolution of the demand for electric power over the last
several years:
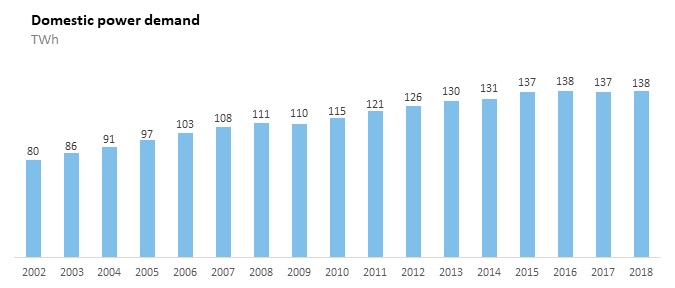
Source:
CAMMESA
The following chart
shows the power demand from November 2006 to February
2019:
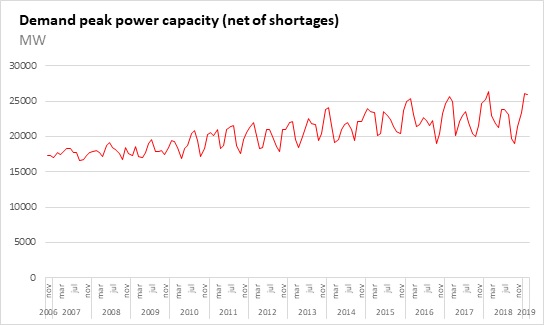
Source:
CAMMESA
116
The correlation
between the evolution of GDP and electric power demand is strong,
although when there is a strong reduction of the GDP, electric
power demand falls relatively little. It should also be noted that,
in an environment of low economic growth, electric power demand
grows at rates higher than the GDP, as shown below:

Source: CAMMESA,
INDEC
CAMMESA divides
Argentina into regions that have similar characteristics in terms
of demand, socio-economic characteristics and electric subsystems.
Such regions are: (i) the City of Buenos Aires and its suburbs,
(ii) the Province of Buenos Aires, (iii) Santa Fe and Northwest
Buenos Aires, (iv) the Center, (v) the Northwest, (vi) Cuyo, (vii)
the Northeast, (viii) Comahue and (ix) Patagonia.
Demand is
significantly concentrated in the areas of the City of Buenos
Aires, the Province of Buenos Aires, Santa Fe and Northwest Buenos
Aires, which comprises approximately 61% of the demand. While
growth rates in other regions such as the Northwest, Comahue and
Patagonia are higher compared to the rest, changes to the
concentration of the demand structure are not substantial over the
period of measurement.
117
The chart below
shows electricity demand by region for 2018:
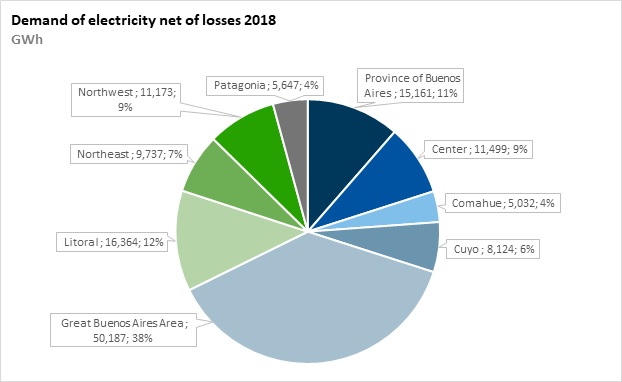
Source:
CAMMESA
Seasonality also
has a significant impact on the demand for electric power, with
electric power consumption peaks in summer and winter. The impact
of seasonal changes in demand is registered primarily among
residential and small commercial customers. The seasonal changes in
demand are attributable to the impact of various climatological
factors, including weather and the amount of daylight time, on the
usage of lights, heating systems and air conditioners.
The impact of
seasonality on industrial demand for electric power is less
pronounced than on the residential and commercial sectors for
several reasons. First, different types of industrial activity by
their nature have different seasonal peaks, such that the effect of
climate factors on them is more varied. Second, industrial activity
levels tend to be more significantly affected by the economy, and
with different intensity levels depending on the industrial
sector.
Energy demand
throughout the hours of each month grew in 2006, reflecting a sharp
increase in industrial activity and mass consumption in the
economy. Such demand declined due to restrictions on industrial
power consumption in the winter of 2007, and the international
crisis at the end of 2008 and early 2009. However, such decline in
consumption has reversed since mid-2011 due to a growth in
demand.
A direct annual
analysis
—
as opposed to a
twelve-month moving average, which is useful to show inertial trend
changes (
i.e.
, the underlying
trend that includes only a few months and therefore better shows
gradual changes to stability)
—
shows growth rates in energy demand
during 2010 and early 2011, with an abrupt slowdown (including
negative values) in 2012 and, after the winter of 2012, an increase
in energy demand during 2013. In December 2013 and January 2014,
there was exponential growth in demand by residential and
commercial consumers due to the heat wave that hit the central
region of Argentina during those periods. In December 2014, the
demand growth trend was reversed with a sharp drop in demand with
the return of normal temperatures.
The demand for
electric power in the residential sector resumed a high growth
trend in 2015. In 2015, residential consumers demand increased
4.5%, despite moderate increases in rates to a small portion of
consumers. During 2016, 2017 and 2018, demand increased 0.8%,
decreased 0.4%, and increased 0.3%, respectively, as compared to
the same period the previous year, despite a drop of 2.5% of the
GDP.
During 2016, 2017,
and 2018, total demand of electricity increased 3.0%, decreased
2.0% and increased 1.79%, respectively, as compared to the same
period the previous year, while the GDP decreased 2.1%, increased
2.7%, and dropped 2.5%.
118
In addition to the
growth of energy demand, which places pressure on the supply of
fuels to thermal plants, demand also affects the availability of
generation plants to meet peak demand for power at nighttime during
the winter or during the afternoon in the summer.
To minimize the
risks of sudden interruptions to the residential and commercial
segment in 2013, there were scheduled supply interruptions in
December 2013 and January 2014, which was similar to what occurred
in the winter of 2010 and 2011, but did not reach the extraordinary
levels of the winter of 2007. No interruptions were necessary in
2012. During the summer and winter of 2015, it was not necessary to
apply restrictions to industrial consumers to supply residential
electric power demand, although there were some forced
interruptions due to certain problems with electrical distribution.
However, during February 2016, certain restrictions to consumption
of an approximate amount of 1,000 MW were applied by CAMMESA and
the Ministry of Energy and Mining due to the above average
temperatures recorded in February 2016.
During January and
February 2016 there were successive high peaks of consumption of
electric power for a business day, after two years of not
surpassing the previous record reached in January 23, 2014. A peak
of consumption of 25,380 MW was reached on February 12, 2016, but
restrictions were implemented to the demand of the distributors of
Buenos Aires, Greater Buenos Aires and La Plata. A new peak of
consumption of 26,320 MW was reached on February 8,
2018.
In addition, on
January 29, 2019 a new electric energy consumption record was
reached with a total of 544,4 GWh consumed, but no restrictions on
demand, as the ones mentioned above, were implemented.
|
|
Power
consumption records
|
|||||
|
|
Previous
records
|
New
records
|
Variation
(%)
|
Variation
(MW)
|
||
|
|
Peak
of electric power capacity (MW)
|
|||||
|
Working
day
|
Feb 24,
2017
|
25,628
|
Feb 8,
2018
|
26,320
|
2.7
|
692
|
|
Saturday
|
Feb 25,
2017
|
22,390
|
Dec 30,
2017
|
22,543
|
0.7
|
153
|
|
Sunday
|
Dec 27,
2015
|
21,973
|
Feb 28,
2017
|
22,346
|
1.7
|
373
|
|
|
Energy
(GWh)
|
Variation
(%)
|
Variation
(GWh)
|
|||
|
Working
day
|
Feb 8,
2018
|
543.0
|
Ene 29,
2019
|
544.4
|
0.3
|
1.4
|
|
Saturday
|
Jan 18,
2014
|
477.9
|
Dec 30,
2017
|
478.4
|
0.1
|
0.5
|
|
Sunday
|
Dec 27,
2015
|
432.9
|
Feb 26,
2017
|
437.6
|
1.1
|
4.7
|
Source:
CAMMESA
The peak demand of
power of February 8, 2019 was covered with a hydroelectric supply
of 8,335 MW, nuclear supply of 912 MW, renewable energy supply of
50 MW and a thermal supply of 17,023 MW.
As with the case of
natural gas, the strong seasonality of electric power demand in
Argentina
—
both in terms
of energy and power
—
influences the needs for investment
since investments are made to meet the maximum peak winter demand,
which generates significant
sur
plus
es
at other times of the year that
cause lower costs and competition in those periods. The maximum
demand for electric power is during the evening hours in summer. In
the case of winter, such demand is due to the high use of electric
heaters that are preferred by consumers because of the differential
cost and simplicity in comparison with natural gas
heaters.
It is important to
note that the generation capacity is not actually available at
times of peak demand. Both in summer and especially in winter,
there is an effective generation capacity to meet the demand. The
effective capacity available (which means the capacity actually
available) is significantly lower than the nominal installed
capacity.
Despite all
efforts, it is unlikely for there to be complete nominal capacity
available at any given time. Instead, the power generation capacity
industry generally anticipates and takes into account a percentage
of unavailability that can range between approximately 20% and 25%,
which is likely to increase in the coming years.
This critical
variable is central to the efforts made by CAMMESA and the
generators to invest in the proper maintenance of the units.
Although the unavailability factor over the long-term in the
thermal plants in Argentina has historically been approximately
30%, it fell below 20% for a period in the early 2000s. In general,
the unavailability factor of the hydroelectric plants in Argentina
is not significant, except for the existing damage in the turbo
groups of Yacyret
á
. In the
nuclear sector, historical unavailability has been important
because of the periodic maintenance that units have to go through.
In particular, the Embalse nuclear plant commenced, starting in
January 1, 2016, a two-year period in which it was not in
operation. Additionally, the Atucha II nuclear plant, which was
generating energy on a trial basis since 2015, received its
commercial authorization during the first half of 2016, adding a
nominal capacity of 745 MW to the SADI.
Energy generation
may be influenced by the physical and economic capacity to provide
fuel to thermoelectric generators. In recent years and until 2014
fuel prices increased the generating cost, although the fall in oil
and fuel prices significantly reduced such cost in 2015 and 2016.
The lack of local production of natural gas led to an increased use
of fuel oil and gas oil in those generating plants with TS and TG
units, in addition to imports of gas and LNG. Most of the TS units
are shipped with fuel oil, and only the Central T
é
rmica San Nicolas can burn coal, in
addition to fuel oil or natural gas. TS or TG groups that operate
in combined-cycle are included in this area in previous
tables.
119
Fuel availability
is a factor that contributes to technical unavailability. The costs
and logistics for importing and supplying fuel oil, gas oil, and
coal instead of natural gas are key to the future availability of
thermal units, and will continue to be important if the current
international conditions are maintained. Since 2007 the limited
supply of natural gas in winter caused a large increase in
consumption of fuel oil and gas oil, with record prices in the
first half of 2008. Prices decreased in 2009 due to the
international crisis and then increased in 2010 (while remaining
lower than in 2008).
Fuel Consumption for Commercial Electric Power
Generation

Source: CAMMESA,
Company analysis
Due to the shortage
of gas, there was an increase in the amount of alternative fuels
used to generate electric power. After the winter of 2014, there
was a sharp drop in international oil prices that led to reduced
thermoelectric generation costs. Thermoelectric generation is
expected to continue to make up a larger portion of the energy mix
in the coming six years as a result of the 2.9 GW of new electric
generation capacity due to the energy emergency.
On November 16,
2016, the Secretariat of Electric Energy, pursuant to Resolution
SEE No. 420-E/16, called for companies interested in developing or
expanding thermal generation units to submit their preliminary
proposals for new projects. The objective of the aforementioned
resolution is to pursue projects that contribute to cost reduction
in the WEM and an increase the reliability of the Argentine
electric system.
According to the
annex of Resolution SEE No. 420-E/16, the preliminary projects
submitted must comply with certain terms and conditions. These
terms define the specific categories of projects to be submitted,
reference values regarding energy consumption efficiency and the
required minimum power capacity.
The price for
generation of CAMMESA constitutes an effective price only to
certain segments of the electric power market, especially
industrial consumers, with the exception of those that are
commercially supplied by electric power distributors.
Anti-Money Laundering
The concept of
money laundering is generally used to denote transactions intended
to introduce criminal proceeds into the institutional system and
thus to transform profits from illegal activities into assets of a
seemingly legitimate origin.
On April 13, 2000,
the Argentine Congress passed Law No. 25,246, as amended by Laws
No. 26,087, 26,119, 26,286, 26,683,
26,734,
26,831 and 26,860 (together the “Anti-Money Laundering
Law”), which defines money laundering as a type of crime. In
addition, the law, which supersedes several sections of the
Código Penal de la Nación Argentina (Argentine Criminal
Code), established severe penalties for anyone participating in any
such criminal activity and created the Unidad de Información
Financiera (UIF) (Financial Information Unit), establishing an
administrative criminal system.
Below is a summary
of certain provisions of the anti-money laundering regime set forth
by the Anti-Money Laundering Law, as amended and supplemented by
other rules and regulations, including regulations issued by the
UIF, the Central Bank, the CNV and other regulatory entities.
Investors are advised to consult their own legal counsel and to
read the Anti-Money Laundering Law and its statutory
regulations.
120
The UIF is the
agency responsible for the analysis, treatment and transmission of
information, with the aim of preventing money laundering resulting
from different crimes and the financing of terrorism.
The Argentine
Criminal Code defines money laundering as a crime committed by any
person who exchanges, transfers, manages, sells, levies, disguises
or in any other way commercializes goods obtained through a crime,
with the possible consequence that the original assets or the
substitute thereof appear to come from a lawful source, provided
that their value exceeds Ps.300,000, whether such amount results
from one or more related transactions. The penalties established
are the following:
1. imprisonment for
three (3) to ten (10) years and fines of two (2) to ten (10) times
the amount of the transaction;
2. the penalty
provided in section (i) shall be increased by one third of the
maximum and a half of the minimum, when (a) the person carries out
the act on a regular basis or as a member of an association or gang
organized with the aim of continuously committing acts of a similar
nature, and (b) the person is a governmental officer who carries
out the act in the course of his duties; and
3. if the value of
the assets does not exceed Ps.300,000, the penalty shall be
imprisonment for six (6) months to three (3) years.
The Argentine
Criminal Code also punishes any person who receives money or other
assets from a criminal source with the purpose of applying them to
a transaction, thereby making them appear to be from a lawful
source.
In line with
internationally accepted practices, the Anti-Money Laundering Law
does not merely assign responsibility for controlling these
criminal transactions to government agencies, but also assigns
certain duties to various private sector entities such as banks,
stockbrokers, brokerage houses and insurance companies, which
become legally bound reporting parties. These duties basically
consist of information-gathering functions.
According to the
Anti-Money Laundering Law, the following persons, among others,
must report to the UIF: (i) financial institutions and insurance
companies; (ii) exchange agencies and individuals or legal entities
authorized by the Argentine Central Bank to operate in the purchase
and sale of foreign currency in the form of cash or checks drawn in
foreign currency or by means of credit or debit cards or in the
transfer of funds within Argentina or abroad; (iii) broker-dealers,
companies managing investment funds, over-the-counter market
agents, and intermediaries engaged in the purchase, lease, or
borrowing of securities; (iv) armored transportation services
companies and companies or concessionaires rendering postal
services that carry out foreign currency transfers or remittance of
different types of currency or notes; (v) governmental
organizations, such as the Central Bank, the AFIP, the National
Superintendence of Insurance (Superintendencia de Seguros de la
Nación), the CNV and the IGJ; (vi) professionals in economics
sciences and notaries public; and (vii) individuals and legal
entities acting as trustees of any kind and individuals or legal
entities related directly or indirectly to trust accounts, trustees
and trustors under trust agreements.
Individuals and
entities subject to the Anti-Money Laundering Law must comply with
certain duties that include: (i) obtaining documentation from their
customers that irrefutably evidences their identity, legal status,
domicile, and other data stipulated in each case (know your
customer policy); (ii) reporting any suspicious event or
transaction (which according to the customary practices of the
field involved, as well as to the experience and competence of the
parties who have the duty to inform, are those transactions
attempted or consummated that have been previously identified as
unusual transactions by the legally bound reporting party, or have
no economic or legal justification or are unusually or
unjustifiably complex, whether performed on a single occasion or
repeatedly (regardless of amount)); and (iii) abstaining from
disclosing to customers or third parties any act performed in
compliance with the Anti-Money Laundering Law. Within the framework
of analysis of a suspicious transaction report, the aforementioned
individuals and entities cannot refrain from disclosing to the UIF
any information required from it by claiming that such information
is subject to bank, stock market or professional secrecy, or legal
or contractual confidentiality agreements. The AFIP shall only
disclose to UIF the information in its possession when the
suspicious transaction report has been made by such entity and
refers to the individuals or entities involved directly with the
reported transaction. In all other cases, the UIF shall request
that the federal judge holding authority in a criminal matter order
the AFIP to disclose the information in its
possession.
In accordance with
Resolution No. 229/2014 of the UIF, the Central Bank, the CNV, the
Superintendence of Insurance of the Nation (
Superintendencia de Seguros de la
Nación)
and the National Institute of Associativism and
Social Economy
(Instituto Nacional
de Asociativismo y Economía Social)
are considered
“
Specific Control Agencies”
(
Órganos de Contralor
Específico
). In such capacity, Specific Control
Agencies must cooperate with the UIF in the evaluation of
compliance with the anti–money laundering proceedings of the
legally bound reporting those parties subject to their control
which have infringed the prevention regime. In that respect, they
are entitled to supervise, monitor and inspect such entities, and
if necessary, take disciplinary action against
infringers.
121
Resolution No.
30/2017 and Resolution No. 21/2018 of the UIF (“Resolution
30” and “Resolution 21”, respectively), determine
the minimum compliance requirements which a system designed to
prevent the crimes of money laundering and terrorism financing
should include, as is the case of the “
know your customer
” duties, as
well as the obligations and restrictions for compliance with the
reporting duty regarding suspicious money laundering and terrorist
financing transactions. These two resolutions have been issued by
the UIF as a result of its new risk-oriented approach, pursuant to
which the UIF has shifted its formalist approach while attempting
to implement a more efficient regime to prevent money laundering
and terrorism financing, based on the revised FATF recommendations
of 2012. Under current regulations, Reporting Parties (
Sujetos Obligados
) have to first
evaluate their risks and then adopt administrative and effective
measures in order to prevent money laundering within their
organizations.
Resolution No.
21/2018 of the UIF, which replaced Resolution 229/2011 and replaced
partially Resolution 140/2012 (“Resolution 21”)
establishes certain measures to be observed by stockbrokers and
brokerage houses, managers of mutual investment funds,
over-the-counter agents, intermediaries in the purchase, lease or
borrowing of securities operating under the orbit of stock
exchanges with or without adherent markets and intermediary agents
registered in the futures and options markets (“Reporting
Parties under Resolution 21”). This Resolution incorporated
as Reporting Parties the persons included in section 22.20 of the
Anti-Money Laundering Law acting as financial trustees whenever
their securities are authorized by CNV. Resolution 21 also
complement Resolution 30, directed at the financial sector,
including the guidelines for money laundering and terrorist
financing Risk Management and minimum compliance that the legally
bound financial reporting parties of the Capital Markets sector
must adopt and apply to manage, in accordance with their policies,
procedures and controls, the risk of being used by third parties
with criminal objectives of money laundry and terrorist
financing.
Fundamentally, the
aforementioned resolution shifts the formalistic regulatory
compliance approach to a risk-based approach, in order to ensure
that the actions implemented are proportional to the identified
risks. Therefore, the legally bound financial reporting parties
must identify and evaluate their risks and, depending on this,
adopt management and mitigation measures in order to more
effectively prevent money laundry and terrorist financing. Thus,
they are enabled to implement certified technological platforms
that allow carrying out procedures at a distance, without personal
display of the documentation, while complying with the Due
Diligence duties.
Furthermore, new
categories of agents have been contemplated, that is, the
Liquidation and Compensation Agents, the Negotiation Agents (in
activities carried out in the field of Capital Markets) and the
Collective Investment Products Management Agents of the Mutual
Funds, as well as the financial trusts with public offer, their
fiduciaries, trustors and any natural or legal person directly or
indirectly related to them, are also covered by the regulation,
partially repealing the UIF Res. 140/2012 only on such parties,
continuing the provisions of it for the remaining
trusts.
On December 28,
2018, by means of Resolution 156/2018, the amended and restated
texts of Resolutions 30/2017, Resolution 21 and Resolution 28/2018,
according to the terms of Decree 891/2017 of Good Practices with
regard to Simplification. By virtue of Resolution 156/18, the
measures, procedures and controls that the reporting parties listed
in those resolutions must adopt and re-apply to manage the risk of
being used by third parties with criminal purposes of money
laundering and financing of the terrorism. It is also established
that those reporting parties must establish a chronogram of
digitization of the bundles of pre-existing clients, taking into
account the risk they present.
The Central Bank
and the CNV must also comply with anti-money laundering regulations
set forth by the UIF, including reporting suspicious transactions.
Pursuant to Resolution No. 229/2014 of the UIF, the Central Bank
and the CNV are considered “Specific Enforcement
Agencies”. As such, they must cooperate with the UIF in
assessing compliance with the anti-money laundering procedures by
the reporting parties subject to their control. To such end, they
are entitled to supervise, monitor and inspect such entities and,
if necessary, implement certain corrective actions and
measures.
The CNV rules (as
amended in September 2013) include a specific chapter regarding
“Prevention of Money Laundering and the Financing of
Terrorism” and state that the persons set forth therein
(Negotiation Agents, Clearing and Settlement Agents (which are
stockbrokers), Distribution and Placement Agents, Manager and
Custody Agents of Collective Investment Funds, Brokerage Agents,
Collective Depositary Agents, issuers with respect to capital
contributions, irrevocable capital contributions for future capital
increases or significant loans that have been made in its benefit,
specifically with respect to the identity of contributors and/or
creditors and the origin and legality of the funds so contributed
or loaned) are to be considered legally bound to report under the
Anti-Money Laundering Law, and therefore must comply with all the
laws and regulations in force in connection with anti-money
laundering and terrorism financing, including resolutions issued by
the UIF, presidential decrees referring to resolutions issued by
the United Nations Security Council in connection with the fight
against terrorism and the resolutions (and the related annexes)
issued by the Ministry of Foreign Affairs. In addition, the CNV
rules impose certain restrictions in connection with payment
arrangements (limiting, among other things, the cash amount that
the entities set forth therein could receive or pay per day and per
client, to Ps.1,000) and impose certain reporting
obligations.
122
In addition, the
CNV rules establish that the above-mentioned entities shall only be
able to carry out any transactions contemplated under the public
offering system, when such transactions are carried out or ordered
by persons organized, domiciled or resident in dominions,
jurisdictions, territories or associated States included in the
cooperating countries list contained in Executive Decree No.
589/2013, section 2(b). When such persons are not included in such
list and in their home jurisdiction qualify as registered
intermediaries in an entity under control and supervision of a body
that carries out similar functions to those carried out by the CNV,
they will only be allowed to carry out such transactions if they
provide evidence indicating that the relevant securities and
exchange commission in their home jurisdiction has signed a
memorandum of understanding for cooperation and exchange of
information with the CNV.
On February, 2016,
the “National Coordination Program for the Prevention of
Asset Laundering and the Financing of Terrorism” was created
by Executive Decree No. 360/16 as an instrument of the Ministry of
Justice and Human Rights. This Program was assigned the duty to
reorganize, coordinate and strengthen the national system for the
prevention of money laundering and the financing of terrorism,
taking in consideration the specific risks that might have an
impact on Argentine territory and the global demand for a more
effective compliance with international obligations and
recommendations established under United Nations Conventions and
the standards of the Financial Action Task Force (FATF). These
duties will be performed and implemented through a National
Coordinator appointed for this purpose. Also, applicable statutory
rules were modified, and it was established that the Ministry of
Justice and Human Rights will be the Argentine government’s
central authority in charge of the inter-institutional coordination
among all public and private agencies and entities with competent
jurisdiction on this matter, while the UIF will retain the ability
to perform operating coordination activities at the national,
provincial and municipal levels in relation to matters strictly
inherent in its jurisdiction as a financial intelligence
agency.
In the context of
the voluntary disclosure program under the Argentine tax amnesty,
Law No. 27,260 and its regulatory decree No. 895/16 clarified that
the UIF has the power to communicate information to other public
intelligence and investigations entities, based on a prior
resolution from the president of the UIF and provided there is
reliable and consistent evidence of the commission of certain
crimes under the Anti-Money Laundering Law. In addition, pursuant
to the UIF Resolution No. 92/16, reporting agents have to implement
a special risk management system. Furthermore, it implemented a
special reporting system for operations carried out under the
above-mentioned tax amnesty disclosure prior to March 31,
2017.
On January 11,
2017, the UIF published Resolution No. 4/17 (“Resolution
4/17”), which allows the legally bound reporting parties
detailed in subsections 1, 4 and 5 of section 20 of the Anti-Money
Laundering Law, as amended, (the “Legally Bound Reporting
Parties of Res. 4/17”), to apply special due diligence
identification measures to foreign and national investors (which
must comply with the requirements established by Resolution 4/17 to
qualify) to Argentina when at-distance opening special investment
accounts (the “Accounts”). The special due diligence
regime shall not exempt the Legally Bound Reporting Parties of Res.
4/17 from monitoring and supervising the transactions performed
during the course of the commercial relationship, according to a
risk-based approach.
Resolution 4/17
also regulates the due diligence measures between legally bound
financial reporting parties. It requires that when the opening of
the accounts is requested by settlement and clearing agents, or the
ALyCs, the local financial entity will have complied with current
anti-money laundering and counter terrorist financing regulations
after performing due diligence with respect to the ALyCs. The ALyCs
shall be responsible for performing due diligence with respect to
its customers. Resolution 4/17 expressly establishes that, even
though the financial entities are not responsible for performing
due diligence with respect to the ALyCs’ customers, they are
not exempt from monitoring and supervising the transactions
performed by their clients (the ALyCs) during the course of the
commercial relationship, according to a risk-based
approach.
In November 2018,
the UIF issued Resolution 134/2018, which updates the list of
persons that should be considered "politically exposed" (PEP) in
Argentina, taking into account the functions in which they perform
or have performed, as well as its relationship of closeness or
affinity with third parties who perform or have performed in such
functions.
On December 26,
2018, the UIF issued resolution 154/2018 modifying the existing
supervision procedures, for new designs that are adapted and
according to the international standards promoted by the FATF,
which must be applied on compliance with risk-based approach. As a
result, the UIF approved its "Risk Based Supervision Procedure of
the Financial Information Unit", repealing the provisions of
Annexes II, III and IV of Resolution 104/2010, article 7 and the
provisions of the Annexes V and VI of Resolution 165/2011 and of
Annex III of Resolution 229/2014.
For an extensive
analysis of the money laundering regime in effect as of the date of
this annual report, investors should consult legal counsel and read
Title XIII, Book 2 of the Argentine Criminal Code and any
regulations issued by the UIF, the CNV and the Central Bank in
their entirety. For such purposes, interested parties may visit the
websites of the Argentine Ministry of Treasury and Public Finance,
at www.infoleg.gov.ar, the UIF, at www.uif.gov.ar, the CNV, at
www.cnv.gob.ar, or the Central Bank, at www.bcra.gov.ar. The
information found on such websites is not a part of this annual
report.
123
The following
diagram illustrates our organizational structure as of the date of
this annual report. Percentages indicate the ownership interest
held.
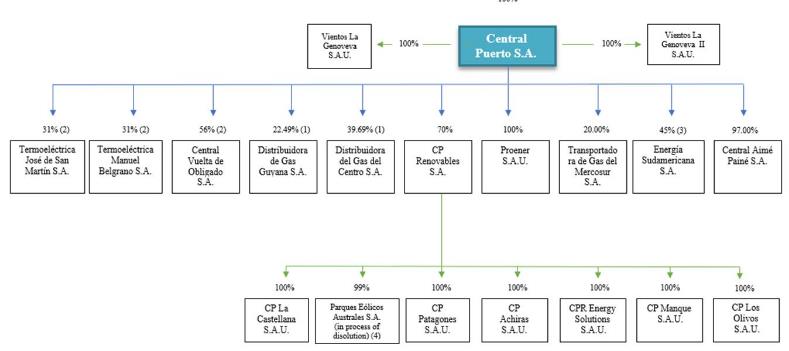
(1) Percentages
indicate direct and indirect investments of the Company in DGCU and
DGCE.
(2) Percentages
reflect our equity interests in the operating companies TJSM, TMB
and CVO. After the plants have been operational for ten years,
their ownership will be transferred to the operating companies. For
more information, see
“Item
4.B.
Business Overview
—
FONINVEMEM and Similar
Programs.
”
(3) Percentages
indicate a 2.45% direct investment of the Company in Energía
Sudamericana S.A., and the Company’s indirect interest of
42.55% in Energía Sudamericana S.A., through our equity
interest in IGCE.
(4) See
“Item 4.B. Business overview—Our Subsidiaries—
Parques Eólicos Australes
S.A.”
For more
information on our subsidiaries, see “Item 4.B. Business
overview—Our Subsidiaries.”
Property, Plant and Equipment
Most of our
property, plant and equipment is intended to be used in the
generation of electric power and 100.00% of it is located in
Argentina.
We have no
significant assets under capital lease or lease
agreements.
124
The following table
provides certain information regarding the operation of our power
plants that we owned as of December 31, 2018:
|
Site
|
Plant
|
Unit
|
Installedcapacity
|
Type
|
Fuel type(if any)
|
|
|
Puerto Complex
|
|
|
1,714
|
MW
|
|
|
|
|
Puerto Nuevo plant
|
|
589
|
MW
|
|
|
|
|
|
PN
TV07
|
145
|
MW
|
Thermal
|
NG /
FO
|
|
|
|
PN
TV08
|
194
|
MW
|
Thermal
|
NG /
FO
|
|
|
|
PN
TV09
|
250
|
MW
|
Thermal
|
NG /
FO
|
|
|
Nuevo Puerto plant
|
|
360
|
MW
|
|
|
|
|
|
NP
TV05
|
110
|
MW
|
Thermal
|
NG /
FO
|
|
|
|
NP
TV06
|
250
|
MW
|
Thermal
|
NG /
FO
|
|
|
Puerto combinedcycle plant
|
|
765
|
MW
|
|
|
|
|
|
CC GE
|
765
|
MW
|
Thermal
|
NG /
GO
|
|
Piedra del Águila
|
|
|
1,440
|
MW
|
|
|
|
|
Piedra del Águila plant
|
|
1,440
|
MW
|
|
|
|
|
|
PAGUHI
|
1,440
|
MW
|
Hydroelectric
|
|
|
Luján de Cuyo
|
|
|
509
|
MW
|
|
|
|
|
Luján de Cuyo plant
|
|
509
|
MW
|
|
|
|
|
|
Siemens combined
cycle
|
306
|
MW
|
Thermal
|
NG
|
|
|
|
ALSTOM
TG23
|
23
|
MW
|
Thermal
|
NG /
GO
|
|
|
|
ALSTOM
TG24
|
23
|
MW
|
Thermal
|
NG /
GO
|
|
|
|
MARELLI
TV11
|
60
|
MW
|
Thermal
|
NG /
FO
|
|
|
|
MARELLI
TV12
|
60
|
MW
|
Thermal
|
NG /
FO
|
|
|
|
ABB
TG22
|
36
|
MW
|
Thermal
|
NG /
GO
|
|
|
|
CTRL
HIDR
Á
ULICA
|
1
|
MW
|
Hydroelectric
|
|
|
La Castellana
|
|
|
99
|
MW
|
|
|
|
|
La Castellana wind farm
|
|
99
|
MW
|
Wind
|
|
|
Achiras
|
|
|
48
|
MW
|
|
|
|
|
Achiras wind farm
|
|
48
|
MW
|
Wind
|
|
Reference: NG:
natural gas; FO: fuel oil; GO: gas oil
We believe that all
of our production facilities are in good operating condition. We
believe that we have satisfactory title to our plants and that our
facilities are in accordance with standards generally accepted in
the electric power industry. As of December 31, 2018, the
consolidated net book value of our property, plant and equipment
was Ps. 22.57 billion.
The following table
lists the value of our property, plant and equipment as of December
31, 2018:
|
Main Item
|
As of December
31, 2018
|
|
|
(in thousands
of Ps.)
|
|
Lands and
buildings
|
2,250,690
|
|
Electric power
facilities
|
6,242,660
|
|
Wind
turbines
|
3,441,847
|
|
Gas
turbines
|
5,311,940
|
|
Construction in
progress
|
5,120,717
|
|
Others
|
199,564
|
|
Total
|
22,567,418
|
For information on
our plants under construction, see “Item 5.A Operating
Results—Proposed Expansion of Our Generating
Capacity.”
This section
contains forward-looking statements that involve risks and
uncertainties. Our actual results may differ materially from those
discussed in the forward-looking statements as a result of various
factors, including, without limitation, those set forth in
“Forward-looking Statements,” “Item 3.D Risk
Factors,” and the matters set forth in this annual report
generally.
This discussion
should be read in conjunction with our audited consolidated
financial statements which are included elsewhere in this annual
report.
125
Financial Presentation
We maintain our
financial books and records and publish our consolidated financial
statements in Argentine pesos, which is our functional currency.
Our audited consolidated financial statements are prepared in
Argentine pesos and in accordance with the IFRS as issued by the
IASB.
Factors Affecting Our Results of Operations
Argentine Economic Conditions
We are an Argentine
sociedad
anónima
(corporation). Substantially all of our assets
and operations and our customers are located in Argentina.
Accordingly, our financial condition and results of operations
depend to a significant extent on macroeconomic and political
conditions prevailing from time to time in Argentina.
As Central Puerto
is affected by the conditions of Argentina
’
s economy, which have historically
been volatile, and have negatively and materially affected the
financial condition and prospects of multiple industries, including
the electric power sector, the following discussion may not be
indicative of our future results of operations, liquidity or
capital resources.
The following table
sets forth information about certain economic indicators in
Argentina for the periods indicated. For information regarding the
reliability of this data and why we present three measurements of
inflation, see
“Item 3.D.
Risk Factors
—
Risks
Relating to Argentina
—
The
credibility of several Argentine economic indices has been called
into question, which has led to a lack of confidence in the
Argentine economy and could affect your evaluation of the market
value of the ADSs.
”
|
|
2013
|
2014
|
2015
|
2016
|
2017
|
2018
(1)
|
|
Economic activity
|
|
|
|
|
|
|
|
Nominal GDP in
current US$
(2)
(in millions of US$)
|
610,760
|
563,955
|
642,665
|
554,448
|
642,413
|
516,981
|
|
Real gross domestic
investment
(3)
(pesos of 2004) (% change) as % of GDP
|
(0.1
)%
|
(4.35
)%
|
0.71
%
|
(3.78
)%
|
9.30
%
|
(3.39
)%
|
|
Price indexes and exchange rate information
|
|
|
|
|
|
|
|
INDEC CPI (%
change)
(4)
|
10.9
%
|
24.0
%
|
11.9
%
|
16.9
%
|
24.8
%
|
47.6
%
|
|
Economic activity
|
|
|
|
|
|
|
|
Inflation (as
measured by the City of Buenos Aires CPI) (% change)
(5)
|
26.60
%
|
38.0
%
|
26.9
%
|
41.0
%
|
26.1
%
|
45.5
%
|
|
Inflation (as
measured by the Province of San Luis CPI) (% change)
(5)
|
32.0
%
|
39.4
%
|
31.6
%
|
31.5
%
|
24.3
%
|
50.0
%
|
|
Wholesale price
index (WPI) (% change)
|
14.7
%
|
28.3
%
|
10.6
%
(5)
|
34.5
%
(5)
|
18.8
%
|
73.50
%
|
|
Nominal exchange
rate
(6)
(in Ps./US$ at period end)
|
6.52
|
8.55
|
13.00
|
15.89
|
18.65
|
37.70
|
Sources: Ministry
of Public Works of Argentina, Banco de la Nación Argentina and
Instituto Nacional de Censos y Estadísticas
(INDEC).
_____________
(1) Variation
provided by INDEC as of December 2018. Real GDP data of 2011-2014
was restated by INDEC.
(2) Calculations
based on the nominal GDP in pesos as reported by INDEC in December
2018, divided by the average nominal Ps./US$ exchange rate for each
period as reported by the Banco de la Nación
Argentina.
(3) Calculations
for years 2013 through 2018 based on real gross domestic investment
(pesos of 2004) and GDP as reported by INDEC in March
2019.
(4) For 2015,
data available until October 2015 (last published data). The newly
appointed INDEC authority, which took office in December 2015,
declared an emergency with respect to Argentina’s statistics
system. In this respect, the INDEC’s website warns that the
statistical information published from January 2007 through
December 2015 should be considered with caution, except for that
information which has been revised in 2016, as expressly stated in
by the INDEC on its website. The INDEC, pursuant to the authority
conferred by Regulations 181/15 and 55/16, initiated the research
required in order to restore the regularity of procedures for data
collection, its processing, the development of economic indicators
and their dissemination. The CPI for 2016 contains the data from
April to December 2016 (the only published data).
(5) On January
8, 2016, based on its determination that the INDEC had failed to
produce reliable statistical information, including with respect to
CPI, the Macri administration declared the national statistical
system and the INDEC in a state of administrative emergency through
December 31, 2016. The INDEC implemented certain methodological
reforms and adjusted certain macroeconomic statistics on the basis
of these reforms. See “Item 3.D. Risk Factors—The
credibility of several Argentine economic indices has been called
into question, which has led to a lack of confidence in the
Argentine economy and could affect your evaluation of the market
value of the ADSs.” During the first six months of this
reorganization period, the INDEC published official CPI figures
published by the City of Buenos Aires and the Province of San Luis
for reference, which we include here.
(6) Pesos to
U.S. dollars exchange rate as quoted by the Banco de la Nación
Argentina for wire transfers (divisas).
According to the
revised data published by the INDEC on March 21, 2017, in 2012,
Argentina
’
s real GDP
dropped 1.0%. This economic contraction was attributed to local and
external factors, primarily the deceleration of growth in
developing economies, including Argentina
’
s principal trading partners, and an
extended drought affecting agricultural production. Following the
contraction in 2012, Argentina
’
s real GDP recovered in 2013,
growing 2.4% as compared to 2012, as domestic demand in 2013 helped
to offset weak demand from the rest of the world. In 2014,
Argentina
’
s real GDP
decreased 2.5%, compared to 2013, reflecting the impact of the
deceleration of growth in developing economies on
Argentina
’
s exports,
growing uncertainty in the financial sector and fluctuations in
foreign exchange rates.
126
In 2015,
Argentina
’
s real GDP
increased by 2.7%, primarily as a result of (i) a 3.5% increase in
gross investment, mainly due to a 5.9% increase in gross
investments and a 2.5% increase in construction investments; and
(ii) a 6.9% increase in public sector consumption and a 3.7%
increase in private sector consumption. These factors were
partially offset by a 4.7% increase in imports, driven by the
expansion of economic activity, which resulted in a negative trade
balance.
During 2016,
Argentina
’
s GDP decreased
2.1%, primarily as the result of (i) an increase of 5.8% in imports
of goods and services rather than consumption of internal
production and (ii) a decrease of 5.8% in gross investments. These
factors were partially offset by an increase of 5.3% in exported
goods and services.
During 2017, as
compared to 2016, Argentina
’
s GDP increased 2.7%, primarily as
the result of (i) an increase of a 12.2% in gross investments, (ii)
a 4% increase in private consumption and (iii) a 2.7% increase in
public consumption (iv) a 1.7% increase in exports. These factors
were partially offset by an increase of 15.4% in
imports.
During 2018, as
compared to 2017, Argentina
’
s GDP decreased 2.5%, primarily as
the result of (i) a decrease of a 5.8% in gross investments, (ii) a
2.4% decrease in private consumption and (iii) a 3.3% decrease in
public. These factors were partially offset by a decrease of 5.1%
in imports.
As of the date of
this annual report, the country faces significant challenges,
including the need to attract investments in capital goods that
will permit sustainable growth and reduce inflationary pressures,
as well as renegotiate utility contracts and resolve the current
energy crisis. While the Macri administration has begun
implementing reforms that we believe will improve the long-term
fundamentals of the electric power sector, making the sector more
market-driven and sustainable, the macroeconomic context and the
imbalances (including high inflation, fiscal deficit, trade
restrictions) deriving from policies adopted during recent years
represent substantial obstacles to the policy shifts announced by
the Macri administration. See
“Item 3.D.
Risk Factors
—
Risks Relating to
Argentina.
”
In light of these
uncertainties, the long-term evolution of the Argentine economy
remains uncertain. The real GDP growth rate increased in 2017, and
the inflation rate was 24.8%. In 2018, the real GDP growth rate
decreased, and the inflation rate was 47.64%. According to the IMF,
Argentina is implementing policies, efforts and strong
determination to address macro-economic imbalances and advance
their economic stabilization plan. The high fiscal and
external deficits, the two imbalances at the heart of the 2018
financial crisis, are in the midst of a significant correction.
Economic activity has been weak but there are good prospects for a
gradual recovery.
Inflation
Argentina has faced
and continues to face inflationary pressures. From 2012 to date,
Argentina experienced increases in inflation as measured by CPI and
WPI that reflected the continued growth in the levels of private
consumption and economic activity (including exports and public and
private sector investment), which applied upward pressure on the
demand for goods and services.
During periods of
high inflation, effective wages and salaries tend to fall and
consumers adjust their consumption patterns to eliminate
unnecessary expenses. The increase in inflationary risk may erode
macroeconomic growth and further limit the availability of
financing, causing a negative impact on our operations. See
“Item 3.D.
Risk
Factors
—
Risks Relating to
Argentina
—
If the current
levels of inflation do not decrease, the Argentine economy could be
adversely affected.
”
Inflation increases
also have a negative impact on our cost of sales, selling expenses
and administrative expenses, in particular our payroll and social
security charges. We cannot give any assurance that increased costs
as a result of inflation will be offset in whole or in part with
increases in prices for the energy we produce.
IAS 29,
Financial
Reporting in Hyperinflationary Economies
, requires that
financial statements of any entity whose functional currency is the
currency of a hyperinflationary economy, whether based on the
historical cost method or on the current cost method, be stated in
terms of the measuring unit current at the end of the reporting
period. Even though the standard does not establish an absolute
rate at which hyperinflation is deemed to arise, it is common
practice to consider there is hyperinflation where changes in price
levels are close to or exceed 100% on a cumulative basis over the
last three years, along with other several macroeconomic-related
qualitative factors.
Even if in the
recent years there was an important increase in the general level
of prices, the three-year cumulative inflation was below 100%.
However, due to macroeconomic factors, the triennial inflation was
above that figure in 2018. Moreover, the goals of the Argentine
government and other available projections show that this trend
will not be reverted in the short term. In order to evaluate the
aforementioned quantitative condition, and also to restate the
financial statements, the CNV has established that the series of
indexes to be used for the application of IAS 29 is determined by
the FACPCE. This series of indexes combines the National Consumer
Price Index ("CPI") as of January 2017 (base month: December 2016)
with the Domestic Wholesale Price Index ("IPIM"), both published by
the Institute National Statistics and Census ("INDEC") until that
date. For the months of November and December 2015, for which there
is no information from the INDEC on the evolution of the IPIM, the
variation in the CPI of the Autonomous City of Buenos Aires was
applied. Considering the aforementioned index, inflation was
47.64%, 24.79% and 34.59% in the years ended December 31, 2018,
2017 and 2016, respectively. See “
Risks Relating to Argentina—
As of
July 1, 2018, the Argentine Peso qualifies as a currency of a
hyperinflationary economy and we are required to restate our
historical financial statements to apply inflationary adjustments,
which could adversely affect our results of operations and
financial condition and those of our Argentine subsidiaries”
and “
—If the current
levels of inflation do not decrease, the Argentine economy could be
adversely affected.”
127
Therefore, our
financial statements as of and for the year ended December 31,
2018, including the figures for the previous periods (this fact not
affecting the decisions taken on the financial information for such
periods), and unless otherwise stated, the financial information
included elsewhere in this annual report, have been restated to
consider the changes in the general purchasing power of the
functional currency of the Company (Argentine peso) pursuant to IAS
29 and General Resolution no. 777/2018 of the Argentine Securities
Commission.
Accordingly, we have recognized a loss regarding
the effect of adjustment by inflation of Ps. 4,036 million, Ps. 152
million and Ps. 1,837 million in our financial statements for the
years ended 2018, 2017 and 2016, respectively.
See Note
2.1.2 to our financial statements.
For further
information, see Note 2.1.2 to our financial
statements.
Foreign Currency Fluctuations
We are exposed to
exchange rate risk in connection with the U.S. dollar to the
Argentine peso exchange rate, as part of our capital expenditures,
financial obligations and operating expenditures were denominated
in U.S. dollars. This exchange rate risk was greater prior to
February 2017, as before then, our main source of revenue was
denominated in Argentine pesos. See
“Item 3.D.
Risk Factors
—
Risks Relating to
Argentina
—Significant
f
luctuations in the value of the peso could adversely affect
the Argentine economy and, in turn, adversely affect our results of
operations
”
and
“Item 10.D.
Exchange
Controls.
”
The depreciation of
the peso with respect to the U.S. dollar exceeded 32.6% in 2013 and
31.2% in 2014. In 2015, the peso depreciated approximately 52% with
respect to the U.S. dollar, including an approximately 10%
devaluation from January 1, 2015 to September 30, 2015 and a 38%
devaluation during the last quarter of the year, primarily
concentrated after December 16, 2015 as a consequence of the Macri
administration
’
s
elimination of a significant portion of foreign exchange controls.
The devaluation of the peso with respect to the U.S. dollar totaled
21.86% in 2016, and 17.36% in 2017 and 102.16% in 2018. The peso
depreciated approximately 19.10% from January 1, 2019 through April
25, 2019.
As of December 31,
2018, we did not have derivatives that met the requirements
established by IFRS to be designated as an effective hedge for this
particular risk. However, as of December 31, 2018, we had accounts
receivable, financial assets available-for-sale, financial assets
at fair value through profit or loss, cash and short-term
investments denominated in foreign currency totaling US$357.8
million, while at the same time we had liabilities denominated in
foreign currency totaling US$297.7 million and, hence, as of such
date, our exposure to changes in foreign currency was substantially
mitigated. For more information, see
“—
Market Risk
Analysis.
”
Any significant
depreciation of the peso would result in an increase in the cost of
servicing our debt and in the cost of imported supplies or
equipment and, therefore, may have a material adverse effect on our
results of operations. With respect to fuels used in connection
with the energy we sell under the Energía Base (which
represented more than 95% of our energy sales in terms of output in
2016), the exposure to changes in fuel prices is not material
since, under current applicable regulation, the fuel for the
electric power sold under the Energía Base is required to be
acquired from and supplied by CAMMESA, free of any cost to us;
hence, it is not currently an integral part of the price charged by
the generator.
The Argentine
government has taken measures to normalize the macroeconomic
situation, setting an exchange rate band in effect as of October 1,
2018, as part of the terms and conditions of the 2018 IMF
Agreement. In addition, and as a result of the 2018 IMF Agreement,
Argentina started to stabilize the balance of trade near to cero
deficit, with measures that include reducing restrictions to
accessing international financing, eliminating exchange controls
and entering into agreements with hold-out creditors. For more
information, see
“Item
10.D.
Exchange Controls.
”
128
Our Revenues
The following chart
shows a breakdown of our revenues from continuing operations for
the periods indicated:
|
|
Year endedDecember 31,
|
|||||
|
|
2018
|
2017
|
2016
|
|||
|
|
(in thousandsof Ps.)
|
Percentageof revenues
|
(in thousandsof Ps.)
|
Percentageof revenues
|
(in thousandsof Ps.)
|
Percentage ofrevenues
|
|
Energía Base
(Resolution SE No. 19/2017, SGE 70 and 95/2013, as
amended)
(1)
|
12,667,903
|
88.80
%
|
9,134,802
|
94.77
%
|
6,616,864
|
93.94
%
|
|
Sales under
contracts
(2)
|
896,802
|
6.29
%
|
273,285
|
2.84
%
|
215,479
|
3.06
%
|
|
Steam sales
(3)
|
245,950
|
1.72
%
|
230,481
|
2.39
%
|
211,696
|
3.00
%
|
|
Resale of gas
transport and distribution capacity
|
193,889
|
1.36
%
|
-
|
0.00
%
|
-
|
0.00
%
|
|
Revenues from CVO
thermal plant management
|
260,826
|
1.83
%
|
-
|
0.00
%
|
-
|
0.00
%
|
|
Total revenues from ordinary activities
|
14,265,370
|
100
%
|
9,638,568
|
100
%
|
7,044,039
|
100.00
%
|
(1) Includes
(i) sales of energy and power to CAMMESA remunerated under
Resolution No. 95 and Resolution No. 19/2017 (ii) sales of energy
and power to CAMMESA not remunerated under Resolution No. 95, (iii)
remuneration under Resolution No. 724/2008 relating to agreements
with CAMMESA to improve existing Argentine power generation
capacity and (iv) income related to Res. SEE 70/18. See
“Item 4.B. Business
Overview—
The Argentine Electric Power
Sector
—
Structure of the
Industry
—
Shortages in the
Stabilization Fund and Responses from the Argentine
Government
—
The National
Program.
”
(2) Includes
(i) term market sales under contracts, (ii) energy sold
under the Energía Plus and (iii) RenovAr Program sales under
contracts (for more information regarding term market sales under
contract, see “Item 4.B. Business Overview—Our
Customers”).
(3) Includes
steam sold under steam sale contract with YPF from the Luján
de Cuyo Plant.
From February 2017
to February 28, 2019, sales under the Energía Base were
regulated by the Resolution SEE No. 19/17, which replaced
Resolution SE No. 95/13, as modified by Resolution SE No. 529/14,
Resolution SE No. 482/15 (the
“
Resolution No. 482
”
) and Resolution SEE No. 22/16, and
denominated the relevant rates in U.S. dollars. In the year ended
December 31, 2017, we sold over 98.97% of the electric power we
generated and derived 94.77% of our revenues under the Energía
Base. In the year ended December 31, 2018, we sold over 97.68% of
the electric power we generated and derived 88.80% of our revenues
under the Energía Base. We also continue to sell a portion of
electric power in the spot market under the regulatory framework
established prior to the Energía Base and receive remuneration
from CAMMESA under Resolution No. 724/2008, relating to the
repayment of maintenance expenses. As of March 1, 2019, a new
remuneration scheme for Energía Base came into force with
Resolution SRRyME No. 1/19. For more information see
“
Item 4.B. Business
Overview—
The Argentine Electric Power
Sector
—
Remuneration
Scheme
—
The Current
Remuneration Scheme.”
In addition, we
sell generation capacity and electric power under negotiated
contracts with private sector counterparties under the Energía
Plus and other outstanding contracts with private sector
counterparties that were entered into prior to the implementation
of the Energía Base (both shown under the line item
“
Sales under
contracts
”
). Sales under
contracts generally involve PPAs with customers and are contracted
in U.S. dollars. The prices in these contracts include the price of
fuel used for generation, the cost of which is assumed by the
generator. For terms longer than one year, these contracts
typically include electric power price updating mechanisms in the
case of fuel price variations or if the generator is required to
use liquid fuels in the event of a shortage of natural
gas.
Below we summarize
key aspects of our most significant sources of revenue, which
include: (i) the Energía Base, (ii) contracts with YPF for
energy and steam, and (iii) electric power sold on the spot
market.
The Energía Base
The Energía
Base accounts for our largest source of revenue. Resolution SE No.
95/13, which was enacted in February 2013, changed the manner in
which electric power was remunerated in the spot market and
established the Energía Base. From February 2017 to February
28, 2019 (included), sales under the Energía Base were
regulated by Resolution SEE No. 19/17. Since March 1, 2019, the
Energía Base sales have been regulated by Resolution SRRyME
No. 1/19.
Under Resolution SE
No. 95/13, as amended, the applicable regulatory entity (as of the
date of this annual report, the Secretariat of Electric Energy and
in prior years the former Secretariat of Electric Energy) set
electric power prices that were updated annually.
Effective February
2014 and 2015, prices were increased by the enforcement authority
through Resolution SE No. 529/14 (
“
Resolution No. 529
”
) and Resolution SE No. 482/15,
respectively. These increases were intended to allow generators to
cover, at least in part, increases in business costs resulting from
inflation and the currency devaluation. However, in light of the
fact that the resolutions failed to provide a pricing mechanism
with a pre-established frequency, the adjustments were
discretionary.
129
Within this
framework, in March 2016, the Secretariat of Electric Energy
enacted Resolution SEE No. 22/16, whereby it adjusted the electric
power prices established through Resolution SE No. 95/13. These
adjustments became effective as of February 2016. In reference to
the rationale for this resolution, the Secretariat of Electric
Energy noted that it was enacted
“
for the sole purpose of supporting
the operation and maintenance of affected equipment and power
stations on a provisional basis, until the regulatory measures
being considered by the executive branch come into force
progressively with the aim of returning the WEM to
normal.
”
On January 27,
2017, the Secretariat of Electric Energy issued Resolution SEE No.
19/17 (published in the Official Gazette on February 2, 2017),
which replaced Resolution SE No. 95/13, as amended.
Pursuant to this
resolution, which was in effect until February 28, 2019 (included),
the Secretariat of Electric Energy established that electric power
generators, co-generators and self-generators acting as agents in
the WEM and which operate conventional thermal power plants, may
make guaranteed availability offers (
ofertas de disponibilidad
garantizada
) in the WEM. Pursuant to these offers, these
generation companies may commit specific capacity and power output
of the generation, provided that such capacity and energy had not
been committed under PPAs entered into in accordance with (i)
Resolutions Nos. 1193/05, 1281/06, 220/07, 1836/07 and 200/09 of
the former Secretary of Energy, (ii) Resolution No. 21/16 of the
Secretariat of Electric Energy and (iii) Resolutions Nos. 136/16
and 213/16 of the Ministry of Energy and Mining, as well as PPAs
subject to a differential remuneration scheme established or
authorized by the Ministry of Energy and Mining. The offers must be
accepted by CAMMESA (acting on behalf of the WEM agents demanding
electric power), which entity will be the purchaser of the power
under the guaranteed availability agreements (
compromisos de disponibilidad
garantizada
). Resolution SEE No. 19/17 established that such
agreements may be assigned to electricity distribution companies
and Large Users of the WEM once the state of emergency of the
electric power sector in Argentina has ended (according to Decree
No. 134/1995, such emergency was declared until December 31, 2017).
Generator agents fully or wholly-owned by the Argentine government
were excluded from the scope of Resolution SEE No.
19/17.
The term of the
guaranteed availability agreements in Resolution SEE No. 19/17 was
3 years, and their general terms and conditions were established in
Resolution SEE No. 19/17.
The remuneration in
favor of the generator was calculated in U.S. dollars pursuant to
the formulas and values set forth in the aforementioned resolution,
and comprises of (i) a price for the monthly capacity availability
and (ii) a price for the power generated and operated. See
“Item 4.B. Business
Overview—
The Argentine Electric Power
Sector
—
Remuneration
Scheme
—
The Previous
Remuneration Scheme
—Resolution
SEE No. 19/17
.
”
Resolution SEE No.
19/17 also established that WEM agents that operate conventional
hydroelectric power plants, pumped hydroelectric power plants and
power plants using other energy resources shall be remunerated for
the energy and capacity of their generation units in accordance
with the values set forth in such resolution, and provided that
such energy and capacity has not been committed under PPAs entered
into in accordance to Resolutions Nos. 1193/05, 1281/06, 220/07,
1836/07 and 200/09 of the former Secretary of Energy, Resolution
No. 21/16 of the Secretariat of Electric Energy, and Resolutions
Nos. 136/16 and 213/16 of the Ministry of Energy and
Mining.
On November 11,
2018, the Energy Secretariat issued Resolution SGE No. 70/2018,
which substitutes Art. 8 of Res. SE 95/2013. This new resolution
allows electric energy generators, self-generators, and
cogenerators acting in the WEM to purchase their own fuel. However,
prior commitments assumed by generators with CAMMESA for energy
supply contracts are not altered by this new regulation. If
generation companies opt to take this option, CAMMESSA will value
and pay the generators their respective fuel costs in accordance
with the Variable Costs of Production (CVP) declared by each
generator to CAMMESA. According to CAMMESA’s procedure, the
machines with the lower CVPs are dispatched first, and
consequently, may produce more electric energy. The Agency in
Charge of Dispatch (Organismo Encargado del Despacho or
“OED” using the Spanish acronym) -CAMMESA- will
continue to supply the fuel for those generation companies that do
not elect to take this option.
During November and
December of 2018, Central Puerto purchased the necessary fuel
(natural gas) for the operation of some of its thermal units, as
shown below:
|
Month
(of 2018)
|
Luján
de Cuyo Plant
|
Puerto
Complex
|
Total
(m3)
|
|
(m3)
|
|||
|
November
|
2,037,631
|
0
|
155,066,079
|
|
December
|
48,696,456
|
104,331,992
|
|
Prices for sales of
energy under Resolution SE No. 95/13 framework were set and paid in
pesos, while prices under Resolution SEE No. 19/17 were set in U.S.
dollars and paid in pesos at the exchange rate as of day prior to
the due date of each monthly sale of energy under Resolution SEE
No. 19/17. In both cases, prices do not include the cost of fuel
as, under these regulations, they are provided to the applicable
generation company by CAMMESA free of charge.
130
Payments by CAMMESA
to generators related to the sale of energy under the Energía
Base during each month are due 42 days following the end of such
month. As a result of delays in payments from distributors due to
frozen tariffs, since 2012 we have seen a delay in the full payment
for the monthly transactions by CAMMESA, which completes their
monthly payment on average 68 days following the end of the
relevant month, and on occasion as many as 101 days following the
end of the month. However, from September 2016 to November 2017
CAMMESA has paid without delays, and since then, there were short
periods in which CAMMESA experienced delays in paying. (for more
information on the duration of these delays see “Item 11.
Quantitative and Qualitative Disclosures about Market
Risk
—
Credit
Risk”).
As of March 1,
2019, a new remuneration scheme for Energía Base came into
force with Resolution SRRyME No. 1/19, which decreased the
prices for power capacity and energy sold for these units. This
change was defined as a transition measure by the recitals of
Resolution SRRyME No. 1/19.
For more
information see “
Item 4.B.
Business Overview—
The Argentine Electric Power
Sector
—
Remuneration
Scheme
—
The Current
Remuneration Scheme” and “
—
The Previous Remuneration
Scheme.”
Electric Power Sold on the Spot Market
Until October 31,
2017, when our contract with YPF for the purchase of electric power
expired, in the La Plata plant we sold the energy in excess of
YPF
’
s demand on the spot
market under the regulatory framework in place prior to Resolution
SE No. 95/13. See
“Item 4.B.
Business Overview—
The Argentine Electric Power
Sector
—
Structure of the
Industry
—
Generation and
the WEM
—
Electricity
Dispatch and Spot Market Pricing prior to Resolution SE No.
95/13.
”
The remuneration
that generators receive for electric power sales in the spot market
under such prior framework is determined on an hourly basis by
CAMMESA (pursuant to Resolutions Nos. 1/2003 and 240/2003 of the
Secretary of Energy and Annex 5 of the Procedures), and it is
comprised of (i) the price for the electric power sold (which price
varies according to the technology of the generation unit and its
power capacity and the connection node in which the generator is
connected to the grid and the generation costs in which they incur)
and (ii) a price for the power capacity of the generations units
made available by the generator in order to supply the electric
power. Both prices are determined by CAMMESA. In order to determine
such electric power prices, CAMMESA takes into account certain
costs, mainly: (i) fuel costs (applying, according to Resolution
No. 240/2003, the cost of the acquisition of natural gas,
regardless of whether or not the generation units run on natural
gas or another kind of fuel, and assuming full availability of
natural gas) and (ii) maintenance and operation costs.
According to the
abovementioned Resolution No. 240/2003, if CAMMESA has to impose
restrictions on the electric power demand, the maximum applicable
spot price of the electric power would be Ps.120 per MWh. Because
most generators use other types of fuel, not just natural gas, the
spot price they receive for the electric power sold, pursuant to
the abovementioned regulations, usually does not cover the variable
costs incurred in order to generate and supply electric power. To
make up such difference, those generators are further compensated
by a stabilization fund (
“
Stabilization Fund
”
), which was created to absorb the
differences between the seasonal price and the spot price in the
WEM. However, because of shortages in the Stabilization Fund,
payments out of the fund for such compensation is subject to the
application of the payment priorities set forth in Resolution No.
406/03 by the Secretary of Energy. For more information, see
“Item 4.B. Business
Overview—
The Argentine Electric Power
Sector
—
Structure of the
Industry
—
Shortages in the
Stabilization Fund and Responses from the Argentine
government.
”
Within our
financial line item for electric power sold in the spot market, we
also include the revenues that we receive from CAMMESA under
Resolution No. 724/2008, relating to agreements with CAMMESA to
improve existing power generation capacity. Under agreements
entered into with CAMMESA under Resolution No. 724/2008, we
committed to maintain certain minimum levels of monthly
availability for each unit specified in the agreements for a period
of seven years, during which time we are entitled to receive
monthly U.S. dollar-denominated payments. In the event a particular
unit falls below the minimum level of monthly availability, the
monthly payment for that unit is reduced accordingly.
Following the La
Plata Plant Sale Effective Date, we no longer sell electric power
on the spot market in the La Plata plant.
As of December 31,
2017, the La Plata plant was classified as a disposal group held
for sale and its respective results for years ended December 31,
2018, 2017 and 2016 as discontinued operations in our audited
consolidated financial statements. Effective as of January 5, 2018,
we sold the La Plata plant to YPF EE. For further information, see
“
Item 4.A. History and
development of the Company
—La Plata Plant
Sale”.
131
Sales Under Contracts, Steam Sales and Resale of Natural Gas
Transportation Capacity
Agreement for supplying energy and steam to YPF and purchasing fuel
from YPF—La Plata plant
We had an agreement
with YPF for supplying energy and steam that expired on October 31,
2017, with respect to energy supply, and terminated on the La Plata
Plant Sale Effective Date, with respect to steam supply. Pursuant
to this agreement, YPF (i) purchased, until October 31, 2017,
electric power produced by the La Plata plant, and until La Plata
Plant Sale Effective Date, (ii) purchased all the steam produced by
the La Plata plant and (iii) supplied the La Plata plant with all
the necessary gas oil and natural gas for the operation of the
plant. YPF also supplied the water in the conditions required to be
converted into steam, which was then delivered to YPF through a
connecting steam duct. We were in charge of maintaining and
operating the co-generation plant.
The power supplied
to YPF was 73 MW (out of a total installed capacity of the La Plata
plant of 128 MW) throughout the contract term, under take-or-pay
(TOP) conditions with respect to the energy produced. This power
was delivered to three different YPF plants through the SADI: (i)
41 MW for the La Plata refinery, (ii) 22 MW for the Luj
á
n de Cuyo refinery and (iii) 10 MW
for the Ensenada petrochemical complex. This contract is
denominated and invoiced in U.S. dollars, but can be adjusted in
the event of variations in U.S. dollar-denominated fuel prices for
fuel necessary for power generation.
As of December 31,
2017, the La Plata plant was classified as a disposal group held
for sale and its respective results for years ended December 31,
2018, 2017 and 2016 as discontinued operations in our audited
consolidated financial statements. Effective as of January 5, 2018,
we sold the La Plata plant to YPF EE. For further information, see
“
Item 4.A. History and
development of the Company
—La Plata Plant
Sale”.
Steam supply to YPF—Luján de Cuyo plant
Under a 20-year
contract signed in 1999, we supply YPF the steam generated at our
Luj
á
n de Cuyo plant by the
“
Alstom
”
units with inputs provided by YPF
under a take-or-pay contract. This contract is denominated and
invoiced in U.S. dollars, but can be adjusted in the event of
variations in U.S. dollar-denominated fuel prices for fuel
necessary for power generation. On February 8, 2018, we entered
into an agreement to extend this steam supply agreement with YPF
for a period of up to 24 months from January 1, 2019 under the same
terms and conditions or until the new co-generation unit begins
operations, whatever happens first. On December 15, 2017, we also
executed a new steam supply contract with YPF for a period of 15
years that will replace our existing contract with YPF and will
begin when the new co-generation unit at our Luj
á
n de Cuyo plant begins
operations.
Steam supply to T6 Industrial S.A.—Terminal 6 San Lorenzo
plant
On December 27,
2017, we entered into a final steam supply agreement with T6
Industrial S.A. for the new co-generation unit at our Terminal 6
San Lorenzo plant.
Resale of natural gas transportation capacity
The contract
between us and TGS for the natural gas transportation capacity has
remained effective after the La Plata Plant Sale. Pursuant to the
terms of our agreement with YPF, we resell our gas transportation
capacity to YPF through the resale system established by Resolution
ENARGAS 419/97. The resale under such system is open to third
parties and consequentially does not ensure that YPF will receive
the gas transportation capacity needed to operate the La Plata
plant. Therefore, on January 25, 2018, we requested to be
registered with the Ministry of Energy and the ENARGAS as a natural
gas seller to permit the resale of our gas transportation capacity
to YPF without the risk of intervention from interested third
parties. On July 20, 2018, we were effectively registered as
natural gas sellers.
Electric Power Demand and Supply
Demand for electric
power depends, to a significant extent, on economic and political
conditions prevailing from time to time in Argentina, as well as
seasonal factors. In general, the demand for electric power varies
depending on the performance of the Argentine economy, as
businesses and individuals generally consume more energy and are
better able to pay their bills during periods of economic stability
or growth. As a result, electric power demand is affected by
Argentine governmental actions concerning the economy, including
with respect to inflation, interest rates, price controls, taxes
and energy tariffs.
Following the
2001-2002 economic crisis, demand for electric power in Argentina
grew consistently each year driven by the economic recovery and
frozen tariffs. During 2014, electric power demand grew 0.98%
compared to 2013, from 125,239 GWh to 126,467 GWh. During 2015,
electric power demand grew 4.45% compared to 2014, from 126,467 GWh
to 132,110 GWh, while during 2016, electric power demand grew 0.65%
to 132,970 GWh. A new 26,320 MW record of capacity load was
registered on February 8, 2018, which was 3.7% above the peak for
2016.
132
Electricity
generation increased by 0.75% in 2018, from 136,465 GWh in 2017 to
137,482 in 2018. Electricity generation decreased by 0.1% in 2017,
from 136,600 GWh in 2016 to 136,465 in 2017. For the year ended
December 31, 2016, electric power generation increased by 1.03% in
2016, from 135,202 GWh in 2015 to 136,600 in 2016.
The chart below
shows the supply of electric power in Argentina by source,
including generation within Argentina from hydroelectric, thermal,
nuclear, renewables, as well as electric power imported from
neighboring countries (net of exports):
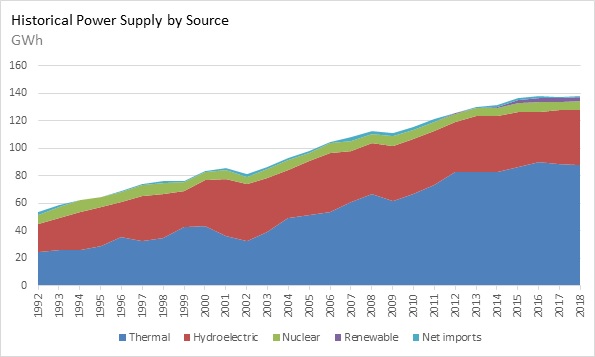
Source:
CAMMESA.
The following chart
shows the demand of energy for the year ended December 31,
2018:
|
Demand by region for year 2018
|
Totalenergydemand
(1)
|
Generation of Central Puerto
plants
(2)(3)
|
|
|
|
|
|||||
|
Puerto Complex
|
Luján deCuyo Plant
|
Piedra del AguilaPlant
|
La Castellana
|
Achiras
|
|||||||
|
MWh
|
%
|
MWh
|
%
|
MWh
|
%
|
MWh
|
%
|
MWh
|
%
|
||
|
Gran Buenos Aires
|
50,187,290
|
7,053,184
|
14.05%
|
|
|
|
|
|
|
|
|
|
Litoral
|
16,363,502
|
|
|
|
|
|
|
|
|
|
|
|
Buenos Aires
|
15,160,754
|
|
|
|
|
|
|
148,049
|
0.98%
|
|
|
|
Centro
|
11,498,713
|
|
|
|
|
|
|
|
|
|
|
|
Noroeste
|
11,173,033
|
|
|
|
|
|
|
|
|
72,606
|
0.65%
|
|
Noreste
|
9,737,364
|
|
|
|
|
|
|
|
|
|
|
|
Cuyo
|
8,124,259
|
|
|
2,996,013
|
36.88%
|
|
|
|
|
|
|
|
Comahue
|
5,032,793
|
|
|
|
|
4,208,796
|
83.63%
|
|
|
|
|
|
Patagonia
|
5,646,555
|
|
|
|
|
|
|
|
|
|
|
_____________
(1) Demand
data for 2018.
(2) Generation
data for 2018.
(3) Generation
by Central Puerto plants.
During 2018,
thermal generation continued to be the main resource used to supply
energy demand, contributing 88,725 GWh (63.65 %), followed by
hydroelectric generation net of pumping, which contributed 39,953
GWh (28,99 %), nuclear generation, which contributed 6,453 GWh
(4,68 %) and photovoltaic and wind generation, which contributed
3,350 GWh (2,43%). There were also imports to cover domestic
demand, in the amount of 344 GWh (0.25% of the total energy supply,
53.19% lower than in 2017) from Uruguay, Chile, Paraguay and
Brazil, exports to Brazil, Chile and Uruguay in the amount of 280
GWh (304.90% higher than in 2017) and transmission losses in the
amount of 4,620 GWh (0.45% higher than in 2017).
Hydroelectric
generation in 2018 registered a 0.93% increase when compared to
2017, mainly due to similar water availability, while thermal
generation registered a decrease of 0.91% mainly due to weaker
demand and nuclear generation registered a 12.89% increase when
compared to 2017, due to less maintenance time in nuclear units
during 2018, as compared to 2017. In this sense, thermal generation
continued to be the main source for the supply of electric power,
fueled both by natural gas and by liquid fuels (diesel oil and fuel
oil), as well as mineral coal, mainly during the winter
months.
133
During 2018,
generation facilities increased their installed capacity from
36,150 MW in 2017 to 38,538 MW. This increase was caused mainly by
the installation of new combined cycles, gas turbines, and wind and
solar farms.
As a result of the
aging, obsolete existing installed capacity and the absence of
investment in new capacity over recent years, electric power
generation is currently substantially below demand during peak
periods, requiring imports of electric power from neighboring
countries and programmed blackouts for certain residential areas
and industries, although this is often due to distribution
limitations rather than limitations in the generation capacity. For
example, according to data from CAMMESA, during the historical peak
demand experienced on February 24, 2017 (25.68 GW), imports of
energy totaled 0.93 GW on such date. To illustrate the considerable
narrowing of the demand/supply gap, in 2003, the average annual
available capacity was 21.07 GW, which was 46.7% higher than the
peak demand of 14.36 GW for such year. In 2016, on the other hand,
the average annual available capacity was 27.35 GW (from total
installed capacity of 33.9 GW largely as a result of aging,
obsolete and unavailable machinery), which is 7.68% higher than the
peak demand of 25.4 GW in such year, when consumption was limited
by imposed restrictions. However, according to data from CAMMESA,
during the peak demand of that year, experienced on February 12,
2016 (25.3 GW), imports of energy totaled 1.8 GW.
Installed capacity
must grow considerably in order to replace the aging, obsolete
generating units in the market. As detailed below, we aim to deepen
our market share with our own expansion projects of installed
capacity.
The State of Emergency of the Argentine Electric Power
Sector
In December 2015,
the elected administration of President Mauricio Macri enacted
Decree No. 134/2015 declaring the state of emergency of the
Argentine electric power sector until December 31, 2017. Pursuant
to such decree, the Ministry of Energy was entrusted with the
duties of developing and putting in place an action plan in
connection with the electric power generation, transportation and
distribution segments in order to improve the quality and security
of electric power supply and guarantee the provision of this public
service under suitable technical and economic conditions. These
goals require additional investments in the several sectors of the
productive chain in order to accommodate Argentina
’
s electric power supply and demand,
which represent both a challenge and an opportunity for the
sector
’
s
players.
With respect to
electric power generation, the Ministry of Energy has publicly
noted the need for new generating capacity, which it has stated
should be addressed by the expansion of thermal and renewable
energy sources by private sector companies, and, consequently, it
has taken measures to boost generation capacity in order to ensure
the supply of electric power and reduce the need for imports from
neighboring countries. In this respect, the Ministry of Energy has
stressed that the country needs to incorporate 10 GW of generating
capacity from conventional energy sources and 10 GW of generating
capacity from renewable sources in order to meet increasing demand
over the next ten years.
Public Bid Process for Thermal Energy Generation Units
Pursuant to
Resolution SEE No. 21/16, the Secretariat of Electric Energy called
for bids to install new thermal generation units to become
operational between Summer 2016/2017 (some of which are now
operational) and Summer 2017/2018. The power generation companies
awarded the bids entered into a PPA with CAMMESA, denominated in
U.S. dollars, and electric power and capacity from these units will
be remunerated at the price indicated in the bid and under the
terms established in Resolution SEE No. 21/16.
Pursuant to
Resolution SEE No. 287-E/17, the Argentine government called for
proposals for the supply of electric power to be generated through
existing units, the conversion of open combined cycle units into
closed combined cycle units or the installation of co-generation
units. The main objectives behind this process were to (i) increase
the supply of electric power generation from thermal generation
units and (ii) strengthen the reliability of the Argentine electric
power system with efficient generation units that have their own
permanent and guaranteed fuel supply thus reducing the need for
electric transportation and lowering the costs of the Argentine
government and the WEM.
Public Bid Process for New Renewable Energy Generation
Units
On March 22, 2016,
the Secretariat of Electric Energy called for bids to install 1,000
MW of new renewable energy units (the
“
RenovAR Program
”
). This bid process is governed by
Law No. 27,191 and Decree No. 531/16, which encouraged the increase
of energy generation from renewable sources by providing, among
other things, significant tax benefits. See
“Item 4.B. Business
Overview—
The Argentine Electric Power
Sector
—
Structure of the
Industry
—
RenovAR (Round
1, Round 1.5 and Round 2): Bidding Process for Renewable Energy
Generation Projects.
”
During 2015,
electric power generation from renewable sources was 0.4% of the
total supply of electric power in Argentina. As established in
Section 2 of the Law referenced above, the purpose of this law is
to have these renewable energy sources account for, at least, 8% of
Argentina
’
s electric
power consumption by December 31, 2017. During the second stage of
the
“
National System for
the Promotion of the Use of Renewable Energy Sources for
Electricity Production,
”
the goal is to have renewable energy sources account for 12% of
Argentina
’
s electric
power consumption by December 31, 2019, 16% by December 31, 2021,
18% by December 31, 2023 and 20% by December 31, 2025, pursuant to
Law No. 27,191.
134
The above framework
provides a significant growth opportunity in the field of clean and
renewable energies, especially considering that Large Users will be
required to purchase energy from renewable sources in the same
percentages mentioned above, and will be subject to penalties if
they do not comply with these requirements.
Resolution No.
136/16, issued by the Ministry of Energy and Mining and published
in the Official Gazette on July 26, 2016, launched the public
auction process for submitting bids for Round 1 of the RenovAR
Program. On October 7, 2016, the Ministry of Energy and Mining
finalized the auction process for the installation of new renewable
energy units and, under Resolution No. 136/16, granted awards in
the amount of 1,108.65 MW, with an average price of US$59.58,
including one biomass project, 12 wind energy projects and four
solar energy projects. Of these, we were awarded one wind energy
project for 99 MW of generating capacity at the price of US$61.50
per MWh, as further explained below in
“
Proposed Expansion of Our Generating
Capacity.
”
On October 31, 2016
the Ministry of Energy and Mining, pursuant to Resolution No.
252/16, launched Round 1.5 of the RenovAR Program as a continuation
of Round 1. On November 25, 2016, the Ministry of Energy and Mining
finalized the auction process for the installation of new renewable
energy units and, under Resolution No. 281/16, granted awards in
the amount of 1281.5 MW, with an average price of US$53.98 per MWh,
including 10 wind energy projects and 20 solar energy projects. Of
these, we were awarded one wind energy project for 48 MW of
generating capacity at the price of US$59.38 per MWh, as further
explained below in
“
Proposed Expansion of Our Generation
Capacity.
”
Following Rounds 1
and 1.5 of the RenovAR Program, the Ministry of Energy and Mining
pursuant to Resolution No. 275/17, launched Round 2 of the program
on August 17, 2017 and granted awards in the amount of 2,043 MW of
renewable power capacity.
We submitted bids
for Round 2 of the RenovAR Program on October 19, 2017 and, on
November 29, 2017, we were awarded a wind energy project called,
“
La Genoveva
I,
”
which will allow us
to add an additional capacity of 86.6 MW to our portfolio and to
continue to build a presence in the renewable energies sector. On
January 11, 2018 and February 21, 2018, Vientos La Genoveva S.A.
acquired an usufruct over the land where La Genoveva I is located.
On March 23, 2018, CP Renovables acquired Vientos La Genoveva S.A.
and, on the same date, transformed it into a S.A.U. On August 6,
2018, Central Puerto acquired Vientos La Genovavea I from its
subsidiary CP Renovables.
135
Proposed Expansion of Our Generating Capacity
The chart below
shows the evolution of our power generating capacity since
1990:
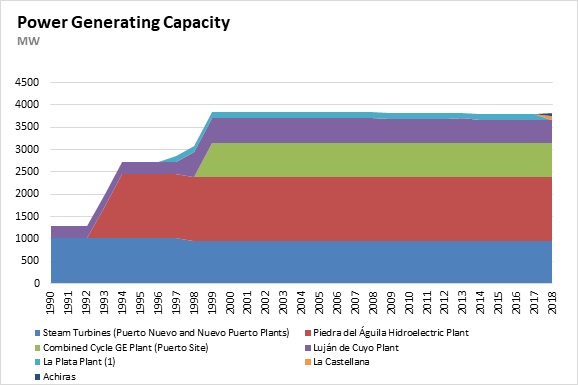
Source: Central
Puerto
_____________
(1) Effective
as of January 5, 2018, we sold the La Plata plant to YPF EE. For
further information, see “
Item
4.A. History and development of the
Company—La Plata
Plant Sale.”
As of the date of
this annual report, we have an aggregate installed generating
capacity of 3,810 MW.
Currently, there is
a need for the incorporation of new efficient capacity in
Argentina, from both conventional and renewable
sources.
In the recent years
we acquired four heavy-duty, highly efficient gas turbines (one GE
gas turbine with capacity of 373 MW, two Siemens gas turbines, each
with capacity of 298 MW, and one Siemens gas turbine with capacity
of 286 MW). Additionally, we have also acquired 130 hectares of
land in the north of the Province of Buenos Aires, in a convenient
location for fuel delivery and future potential connection to power
transmission lines. These assets will potentially allow us to
develop new power capacity.
We are currently
installing one of the Siemens gas turbine of 286 MW, for the
Terminal 6 San Lorenzo co-generation project described
below.
We are ready and
expecting for new market and industry conditions, that would allow
us to develop new generation capacity, through one or more
projects, using the remaining three mentioned units and the
aforementioned land, in which we have already invested US$134
million. We cannot predict if or when the national government will
open new auctions of new capacity and because of the competition
among generation companies in these auction processes, we cannot
predict whether we will be awarded the projects and whether we will
be able to utilize these assets as intended.
On November 16,
2016 the Secretariat of Electric Energy, pursuant to Resolution SEE
No. 420-E/16, called for companies interested in developing or
expanding thermal generation units to submit their preliminary
proposals for new projects. The objectives of the aforementioned
resolution are to pursue projects that contribute to cost reduction
in the WEM and an increase the reliability of the Argentine
electric system.
Pursuant to
Resolution SEE No. 287-E/17, the Argentine government called for
proposals for the supply of electric power to be generated through
existing units, the conversion of open combined cycle units into
closed combined cycle units or the installation of co-generation
units. The main objectives behind this process were to (i) increase
the supply of electric power generation from thermal generation
units and (ii) strengthen the reliability of the Argentine electric
power system with efficient generation units that have their own
permanent and guaranteed fuel supply thus reducing the need for
electric transportation and lowering the costs of the Argentine
government and the WEM.
136
We submitted bids
on August 9, 2017, and, on September 25, 2017, and as a result, we
were awarded two co-generation projects. The Terminal 6 San Lorenzo
and Luj
á
n de Cuyo projects
have the following two potential sources of income: (i) electric
power sales to CAMMESA through PPAs with a 15-year term which are
priced in U.S. dollars; and (ii) steam sales pursuant to separate
steam supply agreements, which are priced in U.S. dollars. We
executed the PPAs with CAMMESA on January 4, 2018. We executed the
steam supply agreements with T6 Industrial S.A. and YPF on December
27, 2017 and December 15, 2017, respectively.
|
|
Terminal 6 San Lorenzo
|
Luján de Cuyo
|
|
Location
|
San Lorenzo,
Province of Santa F
é
(within the Terminal 6 agroindustrial complex)
|
Luj
á
n de Cuyo, Province of Mendoza
(within our Luj
á
n de Cuyo
plant)
|
|
Expected commercial
operation date
(1)
|
May
2020
|
November
2019
|
|
Estimated total
capital expenditure (excluding VAT)
(2)
|
US$284
million
|
US$96
million
|
|
Awarded electric
capacity
|
330 MW (for the
winter)317 MW (for the summer)
|
93 MW (for the
winter) 89 MW (for the summer)
|
|
Technical
configuration
|
Co-generation
system with one gas turbine and one steam turbine
|
Co-generation
system with two gas turbines
|
|
Electric
energy segment:
|
|
|
|
Awarded electric
capacity price per MW of installed capacity
|
US$17,000 per
month
|
US$17,100 per
month
|
|
Awarded generated
energy price (without fuel cost recognition)
|
US$8.00 per MWh for
natural gas operation and US$10.00 per MWh for gas oil
operation
|
US$8.00 per
MWh
|
|
Contract
length
|
15
years
|
15
years
|
|
PPA signing
date
|
January 4,
2018
|
January 4,
2018
|
|
Steam
segment:
|
|
|
|
Steam production
capacity
|
350 tons per
hour
|
125 tons per
hour
|
|
Steam
buyer
|
T6 Industrial
S.A.
|
YPF
|
|
Contract
length
|
15
years
|
15
years
|
(1) The
commercial operation date (COD) committed with CAMMESA is May 22,
2020 in the case of Terminal 6 San Lorenzo, and November 22, 2019
in the case of Luján de Cuyo.
(2) As of
December 31, 2018, the executed capital expenditures for the
Terminal 6 San Lorenzo and the Luján de Cuyo projects were Ps.
1,083.63 million and Ps. 1,182.52 million, respectively, in each
case, plus the applicable value added tax.
Regarding the
financing of the thermal project Luján de Cuyo, on March 26,
2019, the Company, as borrower, entered into a loan agreement with
KfW for an amount of US $ 56,000,000 to finance the acquisition of
two SGT-800 gas turbines (with a power of 89 MW) and equipment from
Siemens Sweden and related services from Siemens Argentina. As of
the date of this annual report, we are working to satisfy all the
conditions prior to the disbursement of this loan. (for more
information see “Item 4. Information of the
Company
—Recent
Developments—
Borrowing from KFW
.”)
In addition, we are
developing five wind energy projects and one solar energy project
in Argentina with the following characteristics (the
“Renewable Projects”):
|
|
La
Genoveva I
|
La
Castellana II
|
Manque
(previously part of Achiras II)
|
Los
Olivos (previously part of Achiras II)
|
La
Genoveva II
|
El
Puesto
|
|
Location
|
Province of Buenos
Aires
|
Province of Buenos
Aires
|
Province of
Córdoba
|
Province of
Córdoba
|
Province of Buenos
Aires
|
Province of
Catamarca
|
|
Expected commercial
operation date
|
May 2020
(1)
|
July
2019
|
January
2020
|
January
2020
|
August
2019
|
August
2020
|
|
Estimated total
capital expenditure (excluding VAT) (2)
|
US$110
million
|
US$16
million
|
US$64
million
|
US$25
million
|
US$46
million
|
US$11
million
|
|
Awarded electric
capacity
|
86.60
MW
|
15.75
MW
|
57.00
MW
|
22.80
MW
|
41.80
MW
|
12 MW
|
|
Regulatory
Framework
|
RenovAr
2.0
|
MATER
|
MATER
|
MATER
|
MATER
|
MATER
|
|
Awarded price per
MWh
|
US$40.90
|
N/A
|
N/A
|
N/A
|
N/A
|
N/A
|
|
Contract
length
|
20 years, starting
from commercial operation
|
N/A
|
N/A
|
N/A
|
N/A
|
N/A
|
|
Power purchase
agreement signing date
|
July
2018
|
N/A
|
N/A
|
N/A
|
N/A
|
N/A
|
|
Number of
units
|
21 wind
turbines
|
4 wind
turbines
|
15 wind
turbines
|
6 wind
turbines
|
11 wind
turbines
|
43,000 solar
modules
(3)
|
|
Wind turbine
provider
|
Vestas
|
Vestas
|
Vestas
|
Vestas
|
Vestas
|
To be
defined
|
(1) The
commercial operation date (COD) committed with CAMMESA of La
Genoveva I is 720 days after the PPA signing date, which was on
July 27, 2018.
(2) As of
December 31, 2018, the executed capital expenditures for La
Genoveva I, La Castellana II, Achiras II (which after December 31,
2018 was separated into Manque and Los Olivos projects), La
Genoveva II and El Puesto were Ps. 604.42 million,
Ps. 410.68 million, Ps. 426.79 million, Ps. 1,110.13
million, Ps. 12.71 million, respectively, in each case, plus
the applicable value added tax.
(3) Estimated
amount of modules.
137
Other than the
Borrowing from KFW described in this annual report (see “Item
4.B. Information of the Company—Recent
Developments—Borrowing from KFW”), our expansion
projects are being developed with equity from Central Puerto and
its subsidiaries. However, we may explore alternative financing
options if the conditions are favorable.
In connection with
the Renewable Projects, we have already obtained energy production
assessments prepared by an independent expert, regulatory approvals
of the environmental impact studies, relevant municipal
qualifications and regulatory approvals of the electrical studies
in connection with access to the transmission network. In addition,
we have three usufructs over the land in the Province of Buenos
Aires to be used for our La Castellana II, La Genoveva I and La
Genoveva II projects and in the Province of Catamarca for the El
Puesto project, and we own the necessary land in the Province of
C
ó
rdoba to be used for our
Manque and Los Olivos projects, which together were previously
known as Achiras II project. We have begun construction of the
facilities and have executed contracts with suppliers to acquire
and maintain the wind turbines and solar panels of the Renewable
Projects.
We are also
currently exploring several other options to diversify our
generation assets to include sustainable power generation sources.
Relatedly, we expect to submit bids in future rounds of the RenovAr
Program and/or to develop in order to supply Large Users in the
renewable energy term market (see
“Item 4.B. Business
Overview—
The Argentine Electric Power
Sector
—
Resolution No.
281-E/17: The Renewable Energy Term Market in Argentina
”
). As of the date of this report,
CAMMESA granted the energy dispatch priority for La Castellana II
(15.75 MW), for Manque (previously a part of Achiras II) (57 MW),
Los Olivos (22.82 MW) ((previously a part of Achiras II), La
Genoveva II (41.80MW) and El Puesto (12 MW). As of the date of this
annual report, we have already signed long-term PPA contracts with
private customers for 61% of estimated energy generation capacity
of our term market projects (considering the median -Percentile
50%- of the expected energy production) developed under Resolution
No. 281-E/17 regulatory framework, and are currently negotiating
the power purchase agreements for the remaining installed capacity
of these five projects.
We believe we are
well-positioned to identify and execute new growth opportunities
that emerge as a result of the government
’
s focus on having greater and more
efficient capacity. However, we cannot assure you that the
Argentine government will open new auction processes or that our
bids will be successful or that we will be able to enter into PPAs
in the future. Moreover, we cannot assure you that we will be able
to benefit as expected from the Argentine government
’
s energy reforms. See
“Item 3.D.
Risk Factors
—
Risks Relating to our
Business
—
Factors beyond
our control may affect our ability to win public bids for new
generation capacity or affect or delay the completion of new power
plants once we have been awarded projects.
”
Furthermore, in
October 2017, the Undersecretariat of Public-Private Participation
launched an auction for the construction of 2,825 km of
transmission lines, a crucial step for the development of the
expansion of the electric energy sector.
Sale of the La Plata Plant
On December 20,
2017, YPF EE accepted our offer to sell the La Plata plant for a
total sum of US$31.5 million (without VAT), subject to certain
conditions. On February 8, 2018, after such conditions were met,
the plant was transferred to YPF EE, including generation assets,
personnel and agreements related to the operation and/or
maintenance of La Plata plant’s assets, with effective date
January 5, 2018. Consequently, as of December 31, 2017, the La
Plata plant was classified as a disposal group held for sale and
its respective results were classified for the years ended December
31, 2018, 2017 and 2016 as a discontinued operation.
Presentation of Financial Statements in Pesos.
Inflation
Critical Accounting Policies
This discussion and
analysis of our financial condition and results of operations is
based upon our audited consolidated financial statements, which
have been prepared in accordance with IFRS. The preparation of our
audited consolidated financial statements requires us to make
estimates and judgments that affect the reported amounts of assets,
liabilities, revenues and expenses and related disclosure of
contingent liabilities.
Critical accounting
policies are those that reflect significant judgments, estimates or
uncertainties and could potentially lead to materially different
results under different assumptions and conditions. We base our
estimates on historical experience and on various other assumptions
that we believe to be reasonable under the circumstances, the
results of which form the basis for making judgments about the
carrying values of assets and liabilities that are not readily
apparent from other sources. Existing circumstances and assumptions
about future developments,
however, may
change due to market changes or circumstances arising beyond our
control. Such changes are reflected in the assumptions when they
occur. Therefore, actual results may differ from these estimates
under different assumptions or conditions. These assumptions are
reviewed at the end of each reporting period.
138
We have described
below what we believe are our most critical accounting policies
that involve a high degree of judgment and/or estimates and the
methods of their application. For more information on the
accounting policies and the methods used in the preparation of the
audited consolidated financial statements, see Note 2.2 to our
audited consolidated financial statements.
Revenue Recognition
We recognize our
sales revenue in accordance with the availability of our
machines’ effective power, the power and steam supplied; and
as balancing entry, a sales receivable is recognized, which
represents our unconditional right to consideration owed by the
customer. Billing for the service is monthly made by CAMMESA in
accordance with the guidelines established by SEE; and compensation
is usually received in a maximum term of 90 days. Therefore, no
implicit financing components are recognized. The satisfaction of
the performance obligation is done throughout time since the
customer simultaneously receives and consumes the benefits given by
the performance of the entity as the entity does it.
Revenues from
energy, power and steam sales are calculated at the prices
established in the respective contracts or at the prices prevailing
in the electricity market, according to the regulations in force.
These include revenues from the sale of steam, energy and power
supplied and not billed until the closing date of the reported
period, valued at the prices defined in the contracts or in the
respective regulations.
Additionally, we
recognize the sales from contracts regarding the supplied energy
and the prices established in such contracts, and as balancing
entry we recognize a sale credit. Such credit represents the
unconditional right we have to receive the consideration owed by
the customer. Billing for the service is monthly made by CAMMESA in
the case of the contracts of the wind farms La Castellana and
Achiras and for the Energía plus contract in accordance with
the guidelines established by SEE; and compensation is received in
a maximum term of 90 days. Therefore, no implicit financing
components are recognized. For the rest of the clients, billing is
also monthly and done by us; and compensation is received in a
maximum term of 90 days. Therefore, no implicit financing
components are recognized. The satisfaction of the performance
obligation is done throughout time since the customer
simultaneously receives and consumes the benefits given by the
performance of the entity as the entity does it.
We recognize
revenues from resale and distribution of gas and revenues for the
monthly management of the thermal power plant CVO in accordance
with the monthly fees established in the respective contracts and
as balancing entry, we recognize a sale credit. Such credit
represents the unconditional right we have to receive the
consideration owed by the customer. Billing for the service is also
monthly made by us and compensation is generally received in a
maximum term of 90 days. Therefore, no implicit financing
components are recognized.
Management is
required to make assumptions about timing of collection for those
receivables without a fixed date of collection, which is subject to
change from period to period. Collection of the principal and
interest on these receivables is subject to various business risks
and uncertainties including, but not limited to, the completion and
operation of power plants which generate cash for payments of these
receivables, regulatory changes that could impact the timing and
amount of collections and economic conditions in Argentina. Our
collection estimates are based on assumptions that we believe to be
reasonable, but are inherently uncertain. We accrue interest on the
accounts receivable with CAMMESA once the recognition criteria have
been met.
In 2010, we entered
into the CVO Agreement with the Secretariat of Electric Energy. The
CVO Agreement established, among other agreements, a framework to
determine a mechanism to settle unpaid trade receivables as per
Resolution SE No. 406/03 accrued over the 2008-2011 period by the
generators (the “LVFVD 2008-2011 receivables”), and for
that purpose, enabling the construction of a thermal combined cycle
plant named CVOSA. The CVO Agreement established that the CVO LVFVD
2008-2011 receivables will be paid by CAMMESA in 120 equal and
consecutive monthly installments. For the determination of the
novation of CVO LVFVD 2008-2011 receivables, the following
mechanism was applied: the cumulative LVFVD (sale settlements with
due date to be defined) were converted to USD at the exchange rate
established in the agreement (ARS 3.97 per USD for the cumulative
LVFVD until the execution date of the CVO Agreement and the closing
exchange rate corresponding to each month for the LVFVD
subsequently accumulated), the LIBOR rate was applied plus a 5%
margin.
Effective as of
March 20, 2018, CAMMESA granted the Commercial Approval to the
thermal plant Central Vuelta de Obligado. As a consequence of the
Commercial Approval and in accordance with the CVO Agreement, we
recognized a onetime estimated income (before income tax) in
relation to the interest and the effect of the adjustment of the
CVO receivables to US dollars as of March 20, 2018 that reaches
approximately Ps. 11,017 million and such amount was recognized in
the consolidated income statement for the year ended December 31,
2018 under “CVO receivables update”.
139
Impairment of Property, Plant and Equipment and Intangible
Assets
We assess at each
reporting period-end whether there is an indication that an
individual component or a group of property, plant and equipment
and/or intangible assets with finite useful lives may be impaired.
If any indication exists, we estimate the asset’s recoverable
amount. An asset’s recoverable amount is the higher of the
fair value less costs to sell that asset, and its value-in-use.
That amount is determined for an individual asset, unless the asset
does not generate cash inflows that are largely independent of
those from other assets or groups of assets; in which case, the
cash flows of the group of assets that form part of the
cash-generating unit (“CGU”) to which they belong are
taken.
Where the carrying
amount of an individual asset or CGU exceeds its recoverable
amount, the individual asset or CGU, as the case may be, is
considered impaired and is written down to its recoverable
amount.
In assessing value
in use of an individual asset or CGU, the estimated future cash
flows are discounted to their present value using a pre-tax
discount rate that reflects current market assessments of the time
value of money and the risks specific to the individual asset or
CGU, as the case may be.
In determining fair
value less costs to sell, recent market transactions are taken into
account, if available. If no such transactions can be identified,
an appropriate valuation model is used. These calculations are
verified by valuation multiples, quoted values for similar assets
on active markets and other available fair value indicators, if
any.
We base our
impairment calculation on detailed budgets and forecast
calculations which are prepared separately for each of our CGUs to
which the individual assets are allocated. These detailed budgets
and forecast calculations generally cover a five-year period. For
longer periods, a long-term growth rate is calculated and applied
to project future cash flows after the fifth year. Budgets and
calculations related to Complejo Hidroeléctrico Piedra del
Águila are limited to the term of the concession
contract.
Impairment losses
of continuing operations are recognized in the statement of income
in those expense categories consistent with the function of the
impaired asset generally in the cost of sales or other operating
expenses.
In addition, for
the assets for which an impairment loss had been booked, as of each
reporting period-end, an assessment is made whether there is any
indication that previously recognized impairment losses may no
longer exist or may have decreased. If a triggering event of
impairment exists, we make an estimate of the recoverable amount of
the individual asset or of the cash generating unit, as the case
may be. A previously recognized impairment loss is reversed only if
there has been a change in the assumptions used to determine the
individual assets or CGU’s recoverable amount since the last
impairment loss was recognized. The reversal is limited so that the
carrying amount of the asset or CGU neither exceeds its recoverable
amount, nor exceeds the carrying amount that would have been
determined, net of the related depreciation or amortization, had no
impairment loss been recognized for the asset or CGU in prior
periods. Such reversal is recognized in the statement of income in
the same line in which the related impairment charge was previously
recognized (generally under the cost of sales or other operating
expenses), unless the asset is carried at a revalued amount, in
which case, the reversal is treated as a revaluation
increase.
During the periods
ended December 31, 2018 and 2017, we did not identify triggering
events of impairment.
Provision for Legal Claims
In the ordinary
course of business, we are exposed to claims of different natures
(
e.g.
,
commercial, labor, tax, social security, foreign exchange or
customs claims) and other contingent situations arising from the
interpretation of current legislation, which could result in a
loss, the materialization of which depends on whether one more
events occur or not. In assessing these situations, management uses
its own judgment and advice of its legal counsel, both internal and
external, as well as the evidence available as of the related
dates. If the assessment of the contingency reveals that the
likelihood of the materialization of a loss is probable and the
amount can be reliably estimated, a provision for lawsuits and
claims is recorded as of the end of the reporting
period.
The provision for
legal claims reflects a reasonable estimation that losses will be
incurred, based on information available to management at the date
of the financial statements, and taking into account our litigation
and resolution/settlement strategies. Existing circumstances and
assumptions, however, may change due to changes in circumstances
arising beyond our control.
140
Employees’ Long-Term Benefits
We provide benefits
to all of our unionized employees when they are vested with the
right to the ordinary retirement benefits granted by the Argentine
Integrated Social Security System (
Sistema Integrado
Provisional
Argentino
), based on
certain multiples of their salaries. Further, we grant
seniority-based benefits to all trade-union employees when reaching
a specific level of seniority, based on their normal
salaries.
The amount
recognized as a liability for such benefits includes the present
value of the liability at the end of the reporting period, and it
is determined through actuarial valuations using the projected unit
credit method. Actuarial valuations employ several assumptions that
might differ from the developments that will actually occur in the
future. These assumptions include the assessment of the discount
rate, future salary increases, mortality rates and the time when
each employee will adhere to the retirement benefit. Due to the
complexity of the valuation, the underlying assumptions and its
long-term nature, the benefit obligations are sensitive to changes
due to these assumptions. These assumptions are reviewed at the end
of each reporting fiscal year.
Actuarial gains and
losses are fully recognized in other comprehensive income/loss for
the period in which they occur and are immediately charged to
unappropriated retained earnings, and will not be reclassified to
income in subsequent periods.
JOBS Act of 2012
The Jumpstart Our
Business Startups Act of 2012 (the JOBS Act) permits an EGC such as
us to take advantage of an extended transition period to comply
with new or revised accounting standards applicable to public
companies. We have elected not to take advantage of the extended
transition period to comply with new or revised accounting
standards; however, we have elected to adopt certain of the reduced
disclosure requirements available to EGCs.
IFRS Standards and Interpretations Issued but not yet
Effective
The following new
and/or amended standards and interpretations have been issued but
were not effective as of the date of issuance of our audited
consolidated financial statements. In this sense, only the new
and/or amended standards and interpretations that the Company
expects to be applicable in the future are indicated. In general,
the Company intends to adopt these standards, as applicable, when
they become effective.
IFRS 16—Leases
In January 2016,
the IASB issued the final version of IFRS 16 and it replaces IAS 17
Leases, IFRIC 4 Determining whether an arrangement contains a
lease, SIC-15 Operating leases-incentives and SIC-27 Evaluating the
substance of transactions involving the legal form of a lease. IFRS
16 sets out the principles for the recognition, measurement,
presentation and disclosure of leases and requires lessees to
account for all leases under a single on-balance sheet model
similar to the accounting for finance leases under IAS 17. The
standard includes two recognition exemptions leases of
“low-value” assets (e.g., personal computers) and
short-term leases (i.e., leases with a lease term of 12 months or
less). At the commencement date of a lease, a lessee will recognize
a liability to make lease payments (i.e., the lease liability) and
an asset representing the right to use the underlying asset during
the lease term (i.e., the right to-use asset). Lessees will be
required to separately recognize the interest expense on the lease
liability and the depreciation expense on the right of-use
asset.
Lessor accounting
under IFRS 16 is substantially unchanged from today’s
accounting under IAS 17. Lessors will continue to classify all
leases using the same classification principle as in IAS 17 and
distinguish between two types of leases: operating and finance
leases. IFRS 16 also requires lessees and lessors to make more
extensive disclosures than under IAS 17. IFRS 16 is effective for
annual periods beginning on or after January 1, 2019. Early
adoption is permitted, but not before the entity applies IFRS 15. A
lessee can choose to apply the standard using either a full
retrospective or modifies retrospective approach.
We plan to adopt
IFRS 16 retroactively for each previous period filed. We will apply
this standard to contracts previously identified as Lease Contracts
which apply IAS 17 and IFRIC 4. Therefore, we will not apply this
standard to any contract that has not been previously identified as
a Lease Contract which applies IAS 17 and IFRIC 4.
We will apply the
exemption set forth in this standard for lease contracts whose term
ends within 12 months as from the standard initial application
date, and for lease contracts with an underlying asset of low
value.
We have analyzed it
and concluded that adopting IFRS 16 will not have significant
effects on our financial statements.
141
IFRIC Interpretation 23—Uncertainty over Income Tax
Treatments
In June 2017, the
IASB issued IFRIC Interpretation 23 - Uncertainty over Income Tax
Treatments. The Interpretation clarifies application of recognition
and measurement requirements in IAS 12 Income Taxes when there is
uncertainty over income tax treatments. The Interpretation
specifically addresses the following: (a) whether an entity
considers uncertain tax treatments separately, (b) the assumptions
an entity makes about the examination of tax treatments by taxation
authorities, (c) how an entity determines taxable profit (tax
loss), tax bases, unused tax losses, unused tax credits and tax
rates and (d) how an entity considers changes in facts and
circumstances. IFRIC 23 is effective for annual periods beginning
on or after January 1, 2019. Early adoption is
permitted.
The Company
concluded that this interpretation will not have significant
effects on the Company’s consolidated financial
statements.
Annual
improvements of period 2015-2017 (issued in December
2017)
These improvements
include:
IFRS 3 Business combinations
Amendments make it
clear that when an entity obtains control of a business that is a
joint operation, it applies the requirements for a business
combination reached in stages, including the new measurement of
interest previously held in the assets and liabilities of a joint
operation at fair value. When doing so, the acquirer remeasures the
previous total interest in the joint operation.
An entity will
apply those amendments to business combinations for which the
acquisition date is at or after the commencement of the first
annual report period starting on or after January 1, 2019, with the
anticipated application being permitted. These amendments will be
applied in the business combinations of the Group.
IAS 12 Income taxes
The amendments make
it clear that the income tax consequences of dividends are more
directly linked to past transactions or events that generated
distributable income to owners. Therefore, an entity recognizes the
consequences of the income tax on revenue dividends, other
comprehensive income or equity according to the place in which the
entity originally recognized those past transactions or
events.
An entity will
apply those amendments to the annual periods starting on or after
January 1, 2019, with the anticipated application being permitted.
When an entity applies those amendments for the first time, it will
apply them to the income tax of the dividends recognized in or
after the commencement of the comparative period.
Since the current
practice of the Group is aligned with these amendments, the Group
does not expect any effect on its consolidated
statements.
IAS 23 Borrowing Costs
The amendments make
it clear that any borrowing originally taken for the development of
a qualifying asset is considered by the entity as a general
borrowing, when all activities were completed in order to have such
asset ready for its intended use or sale.
An entity will
apply those amendments to any borrowing costs incurred on or after
commencement of the annual report filing period in which the entity
applies such amendments for the first time. These amendments apply
to periods beginning on or after January 1, 2019. Advanced filing
is allowed. Since the current practices of the Group are aligned
with these amendments, the Group does not expect any effect on its
consolidated statements.
Results of Operations for the Years Ended December 31, 2018, 2017
and 2016
We discuss below:
(i) our results of operations for the year ended December 31, 2018
as compared with our results of operations for the year ended
December 31, 2017; and (ii) our results of operations for the year
ended December 31, 2017 as compared with our results of operations
for the year ended December 31, 2016.
On February 8,
2018, we transferred the La Plata plant to YPF EE, with an
effective date as of January 5, 2018. Consequently, as of December
31, 2017 the La Plata plant was classified as a disposal group held
for sale and we present its respective results for the years ended
December 31, 2018, 2017 and 2016, as discontinued operations. See
Note 21 to our audited consolidated financial statements and
“
Item 4.A. History and
development of the Company
—La Plata Plant
Sale.”
142
|
|
Year
ended December 31,
|
Change
December 31,
|
|||
|
|
2018
|
2017
|
2016
|
2018/2017
|
2017/2016
|
|
|
(in thousands of
Ps.)
|
(in percentages)
|
|||
|
Revenues
|
14,265,370
|
9,638,568
|
7,044,039
|
48.00
%
|
36.83
%
|
|
Cost of
sales
|
(6,486,698
)
|
(5,199,149
)
|
(4,980,226
)
|
24.76
%
|
4.40
%
|
|
Gross
income
|
7,778,672
|
4,439,419
|
2,063,813
|
75.22
%
|
115.11
%
|
|
Administrative and
selling expenses
|
(1,389,336
)
|
(1,056,257
)
|
(892,626
)
|
31.53
%
|
18.33
%
|
|
Other operating
income
|
13,222,842
|
930,062
|
2,324,243
|
1,321.72
%
|
(59.98
%)
|
|
Other operating
expenses
|
(132,881
)
|
(140,138
)
|
(171,952
)
|
(5.18
%)
|
(18.50
%)
|
|
CVO receivables
update
|
11,017,014
|
-
|
-
|
-
|
-
|
|
Operating
income
|
30,496,311
|
4,173,086
|
3,323,478
|
630.79
%
|
25.56
%
|
|
Loss on net
monetary position
|
(4,036,196
)
|
(151,904
)
|
(1,836,626
)
|
2,557.07
%
|
(91.73
%)
|
|
Finance
income
|
2,280,193
|
1,558,816
|
873,915
|
46.28
%
|
78.37
%
|
|
Finance
expenses
|
(6,300,881
)
|
(1,200,654
)
|
(1,205,447
)
|
424.79
%
|
(0.40
%)
|
|
Share of the profit
of associates
|
1,074,185
|
1,173,004
|
422,650
|
(8.42
%)
|
177.54
%
|
|
Income
before income tax from continuing operations
|
23,513,612
|
5,552,348
|
1,577,970
|
323.49
%
|
251.87
%
|
|
Income tax for the
year
|
(6,604,351
)
|
(1,081,177
)
|
(1,006,417
)
|
510.85
%
|
7.43
%
|
|
Net income for the year from continuing operations
|
16,909,261
|
4,471,171
|
571,553
|
278.18
%
|
682.28
%
|
|
Discontinued
operations
Income after tax
for the year from discontinued operations
|
276,177
|
791,274
|
806,989
|
(65.10
%)
|
(1.95
%)
|
|
Net
income for the year
|
17,185,438
|
5,262,445
|
1,378,542
|
226.57
%
|
281.74
%
|
Revenues from continuing operations
|
|
Year
ended December 31,
|
Change
December 31,
|
|||
|
|
2018
|
2017
|
2016
|
2018/2017
|
2017/2016
|
|
|
(in thousands of
Ps.)
|
(in percentages)
|
|||
|
Energía Base
(Resolution SE No. 19/2017, SGE 70 and 95/2013, as amended)
(1)
|
12,667,903
|
9,134,802
|
6,616,864
|
38.68
%
|
38.05
%
|
|
Sales under
contracts
(2)
|
896,802
|
273,285
|
215,479
|
228.16
%
|
26.83
%
|
|
Steam
sales
(3)
|
245,950
|
230,481
|
211,696
|
6.71
%
|
8.87
%
|
|
Resale of gas
transport and distribution capacity
|
193,889
|
-
|
-
|
-
|
-
|
|
Revenues from CVO
thermal plant management
|
260,826
|
-
|
-
|
-
|
-
|
|
Total revenues from ordinary activities
|
14,265,370
|
9,638,568
|
7,044,039
|
48.00
%
|
36.83
%
|
(1) Includes
(i) sales of energy and power to CAMMESA remunerated under
Resolution No. 95 and Resolution No. 19/2017, (ii) sales of energy
and power to CAMMESA not remunerated under Resolution No. 95, (iii)
remuneration under Resolution No. 724/2008 relating to agreements
with CAMMESA to improve existing Argentine power generation
capacity and (iv) income under Res. SEE 70/18 (see
“
Item 4.B. Business
Overview—
The Argentine Electric Power
Sector
—
Remuneration
Scheme
—
The Current
Remuneration Scheme
—
Resolution SEE 70/18 - Option to
purchase fuel for units under Energía Base Regulatory
Framework.”).
(2) Includes
(i) term market sales under contracts and, (ii) energy sold under
the Energía Plus and (iii) RenovAr Program sales under
contracts (for more information regarding term market sales under
contract, see “Item 4.B. Business Overview—Our
Customers”) (for more information regarding term market sales
under contract, see “Item 4.B. Business Overview—Our
Customers”).
(3) Includes
steam sold under steam sale contract with YPF from the Luján
de Cuyo Plant.
2018 Compared to 2017
Revenues from
continuing operations in 2018 totaled Ps.14.27 billion, a 48%
increase from Ps.9.64 billion in 2017. This increase was primarily
attributable to:
|
|
1.
|
a 38.68% increase
in our revenues from electric power sold under Energía Base,
which amounted to Ps.12.67 billion during the year ended December
31, 2018, compared to Ps.9.13 billion during the year ended
December 31, 2017, primarily attributable to (i) the tariff
increase established by Res. 19/17, which set higher prices for
energy generation and machine availability and set them in US
dollars (2018 was fully-impacted by the November 2017 tariff
increase), (ii) an increase in the exchange rate for 2018 higher
than the inflation for the period, which impacted tariffs set in
U.S. dollars, in terms of Argentine pesos current at the end of the
reporting period. As a reference, during 2018, the foreign exchange
rate increased 102.2% and the inflation rate was 47.64%, while
during 2017 the foreign exchange rate increased 17.4% and the
inflation rate was 24.80%, and (iii) an increase in fuel
remuneration for units under Energía Base regulatory framework
(and other related concepts), which amounted to Ps.1,949.16 million
during the year ended December 31, 2018, mainly because of income
in accordance to Res. 70/18, during November and December 2018, in
some of the units under the Energía Base regulatory framework
(see “—Factors Affecting Our Results of
Operations—Our Revenues—The Energía Base”),
compared to Ps.396.44 million during the year ended December 31,
2017.
|
|
|
2.
|
a 228.16% increase
in our revenues from sales under contracts (including the
Energía Plus contracts, which are denominated in U.S.
dollars), which amounted to Ps.896.8 million during the year ended
December 31, 2018, compared to Ps.273.3 million during the year
ended December 31, 2017, primarily attributable to (a) the
commencement of operations of the projects Achiras I and La
Castellana I, which generated revenues totalling Ps. 599.3
million and (b) 102.16% devaluation of the peso with respect to the
U.S. dollar in 2018, which was offset by an inflation rate of 47.6%
during 2018, while during 2017 the foreign exchange rate increased
17.4% and the inflation rate was 24.80%;
|
|
|
3.
|
a 6.71% increase in
our revenues from steam sales to YPF from our Luján de Cuyo
Plant, which amounted to Ps.245.95 million during the year ended
December 31, 2018, compared to Ps.230.48 million during the year
ended December 31, 2017, primarily attributable to (a) a 102.16%
devaluation of the peso with respect to the U.S. dollar in 2018
(the price per unit in U.S. dollars for our steam sales has not
changed), offset by an inflation rate of 47.64% during 2018, while
during 2017 the foreign exchange rate increased 17.4% and the
inflation rate was 24.80%, which was partially offset by (b) a
6.38% decrease in the quantity of steam sold (1,102,515 tons
in 2018 as compared to 1,177,661 tons during the year ended
December 31, 2017).
|
143
2017 Compared to 2016
Revenues from
continuing operations in 2017 totaled Ps.9.64 billion, a 36.83%
increase from Ps.7.04 billion in 2016. This increase was primarily
attributable to:
|
|
1.
|
a 38.05% increase
in our revenues from electric power sold under Energía Base,
which amounted to Ps. 9.13 billion during the year ended December
31, 2017, compared to Ps.6.62 billion during the year ended
December 31, 2016, primarily attributable to (a) an increase in the
prices granted by Resolution SEE No. 19/17, adopted in February
2017, as compared to those granted by Resolution SEE 22/16, with
effect as of February 2016, each for capacity and electric power
sold under the Energía Base. See
“—
Factors Affecting Our Results
of Operations
—
Our
Revenues
—
The Energía
Base
”
, and, to a lesser
extent, (b) a 6.78% increase in the quantity of energy sold under
this framework (15,557 GWh during the year ended December 31, 2017,
as compared to 14,569 GWh during the year ended December 31,
2016);
|
|
|
2.
|
a 26.83% increase
in our revenues from sales under contracts (including the
Energía Plus contracts, which are denominated in U.S.
dollars), which amounted to Ps.273.29 million during the year ended
December 31, 2017, compared to Ps.215.48 million during the year
ended December 31, 2016, primarily attributable to (a) a 29.03%
increase in the amount of energy sold under contracts (the price
per unit in U.S. dollars has not changed), partially offset by (b)
a lower-than-inflation devaluation of the peso with respect to the
U.S. dollar in 2017 (in which these prices are set) of 17.37%,
compared to an inflation rate of 24.80%; and
|
|
|
3.
|
a 8.87% increase in
our revenues from steam sales to YPF from our Luján de Cuyo
Plant, which amounted to Ps.230.48 million during the year ended
December 31, 2017, compared to Ps.211.70 million during the year
ended December 31, 2016, primarily attributable to (a) a 5.63%
increase in the quantity of steam sold (1,177,661 tons in 2017 as
compared to 1,114,908 tons during the year ended December 31,
2016), partially offset by (b) a lower-than-inflation devaluation
of the peso with respect to the U.S. dollar in 2017 (in which these
prices are set) of 17.37%, compared to an inflation rate of
24.80%.
|
Cost of Sales from continuing operations
|
|
Year ended December 31,
|
Change December 31,
|
|||
|
|
2018
|
2017
|
2016
|
2018/2017
|
2017/2016
|
|
|
(in thousands of
Ps.)
|
(in percentages)
|
|||
|
Inventories at the
beginning of the year
|
265,827
|
218,028
|
198,408
|
21.92
%
|
9.89
%
|
|
Purchases
|
2,194,756
|
560,058
|
568,682
|
291.88
%
|
(1.52
%)
|
|
Operating
expenses:
|
|
|
|
|
|
|
Compensation to
employees
|
1,370,994
|
1,436,661
|
1,365,375
|
(4.57
%)
|
5.22
%
|
|
Other long-term
employee benefits
|
28,092
|
42,655
|
45,073
|
(34.14
%)
|
(5.36
%)
|
|
Depreciation of
property, plant and equipment
|
1,142,555
|
1,201,928
|
999,349
|
(4.94
%)
|
20.27
%
|
|
Amortization of
intangible assets
|
349,674
|
329,579
|
358,966
|
6.10
%
|
(8.19
%)
|
|
Purchase of energy
and power
|
44,148
|
126,458
|
46,104
|
(65.09
%)
|
174.29
%
|
|
Fees and
compensation for services
|
247,799
|
314,593
|
292,352
|
(21.23
%)
|
7.61
%
|
|
Maintenance
expenses
|
481,021
|
599,708
|
694,368
|
(19.79
%)
|
(13.63
%)
|
|
Consumption of
materials and spare parts
|
161,289
|
184,575
|
275,423
|
(12.62
%)
|
(32.98
%)
|
|
Insurance
|
241,474
|
228,411
|
244,197
|
5.72
%
|
(6.46
%)
|
|
Levies and
royalties
|
223,076
|
212,799
|
101,318
|
4.83
%
|
110.03
%
|
|
Taxes and
assessments
|
20,449
|
6,102
|
5,356
|
235.12
%
|
13.93
%
|
|
Taxes on bank
account transactions
|
2,475
|
-
|
-
|
-
|
-
|
|
Other
|
8,652
|
3,421
|
3,283
|
152.91
%
|
4.20
%
|
|
Inventories at the
end of the year
|
(295,583
)
|
(265,827
)
|
(218,028
)
|
11.19
%
|
21.92
%
|
|
Total cost of sales
|
6,486,698
|
5,199,149
|
4,980,226
|
24.76
%
|
4.40
%
|
144
2018 Compared to 2017
Cost of sales
from continuing operations
during the year ended December 31, 2018 totaled Ps.6.49 billion, a
24.76% increase from Ps.5.20 billion during the year ended December
31, 2017. This increase was primarily the result of:
|
|
1.
|
a Ps.1,634.70
million, or 291.88%, increase in purchase of gas by Central Puerto;
and
|
|
|
2.
|
a Ps. 10.28
million, or 4.83%, increase in levies and royalties associated to
the increase in revenues from the Piedra del Águila Plant due
to increases in the energy and power prices, and in the quantity of
energy generated.
|
This was partially
offset by a Ps.65.67 million, or 4.57%, decrease in compensation to
employees, primarily related to CBAs.
2017 Compared to 2016
Cost of sales
from continuing operations
during the year ended December 31, 2017 totaled Ps.5.2 billion, a
4.40% increase from Ps.4.98 billion during the year ended December
31, 2016. This increase was primarily the result of:
|
|
1.
|
a Ps.58.79 million,
or 5.97%, increase in consumption of production supplies (measured
as inventories at the beginning of the period plus purchases during
the period, minus the inventories at the end of the period), mainly
attributable to an increase in the cost of fuel for the generating
units that operate in connection with sales under contracts and
steam sales, including the YPF contract for steam and Energía
Plus contracts (which are denominated in U.S. dollars under such
contracts), due to (a) a 64.28% increase in the amount of energy
sold under the Energía Plus contracts, of 92 GWh energy sold
in 2017 compared to 56 GWh energy sold in 2016, partially offset by
(b) a lower-than-inflation devaluation of the peso with respect to
the U.S. dollar in 2017 (in which these prices are set) of 17.37%,
compared to an inflation rate of 24.80%;
|
|
|
2.
|
a Ps.71.29 million,
or 5.22%, increase in compensation to employees, primarily related
to CBAs; and
|
|
|
3.
|
a Ps.111.48
million, or 110.03%, increase in levies and royalties associated to
the increase in revenues from the Piedra del Águila Plant due
to increases in the energy and power prices, and in the quantity of
energy generated.
|
Gross Income from continuing operations
2018 Compared to 2017
Gross income
from continuing operations
during the year ended December 31, 2018 totaled Ps.7.78 billion, a
75.22% increase from Ps.4.44 billion during the year ended December
31, 2017, due to the reasons above mentioned. Gross margin for the
year ended December 31, 2018 was 54.53%, compared to a gross margin
of 46.06% during the same period in 2017.
2017 Compared to 2016
Gross income
from continuing operations
during the year ended December 31, 2017 totaled Ps.4.44 billion, a
115.11% increase from Ps.2.06 billion during the year ended
December 31, 2016, due to the reasons above mentioned. Gross margin
for the year ended December 31, 2017 was 46.06%, compared to a
gross margin of 29.30% during the same period in 2016.
Administrative and Selling Expenses from continuing
operations
2018 Compared to 2017
Administrative and
selling expenses
from continuing
operations
during the year ended December 31, 2018 totaled
Ps.1,389 million, a 31.53% increase from Ps.1,056 million during
the year ended December 31, 2017. This increase was primarily the
result of:
|
|
1.
|
a Ps.118.88
million, or 86.49%, increase in taxes on bank account transactions
as a result of the revenue increase during the year ended December
31, 2018; and
|
|
|
2.
|
a Ps.182.95
million, or 58.13%, increase in fees and compensation for services,
plus maintenance expenses, mainly due to (a) a Ps. 14.08 million
increase in employee transportation, meal expenses and security
services, among others, due to a price increase for such services,
(b) a Ps. 55.92 million increase in professional services related
to financing activities and (c) a Ps.112.96 million increase in
maintenance expenses.
|
145
2017 Compared to 2016
Administrative and
selling expenses
from continuing
operations
during the year ended December 31, 2017 totaled
Ps.1,056 million, a 18.33% increase from Ps. 892.63 million during
the year ended December 31, 2016. This increase was primarily the
result of:
|
|
1.
|
a Ps. 95.26
million, or 21.93%, increase in compensation to employees as a
result of salary adjustments primarily due to increased inflation
during the year ended December 31, 2017; and
|
|
|
2.
|
a Ps.89.30 million,
or 39.61%, increase in fees and compensation for services, plus
maintenance expenses, mainly due to a Ps. 36.07 million increase in
employee transportation, meal expenses and security services, among
others, due to a price increase for such services, and a Ps. 21.25
million increase in professional services related to financing
activities.
|
Other Operating Income from continuing operations
2018 Compared to 2017
Other operating
income
from continuing
operations
in the year ended December 31, 2018 totaled
Ps.13.22 billion, a 1,321.72% increase from Ps.930.06 million in
the year ended December 31, 2017. This increase was primarily the
result of:
|
|
1.
|
a Ps.11.29 billion
or 9,671.80% increase in foreign exchange gains from trade payables
and receivables, net denominated in U.S. dollars mainly as a result
of: (a) a 102.16% devaluation of the peso against the U.S. dollar
in the year ended December 31, 2018 (calculated at the exchange
rate as of December 31, 2018 compared to the exchange rate as of
December 31, 2017), while the inflation rate during 2018 was
47.64%, compared to a 17.36% devaluation of the peso against the
U.S. dollar in the year ended December 31, 2017 (calculated at the
exchange rate as to December 31, 2017 compared to the exchange rate
as of December 31, 2016) while the inflation rate during 2017 was
24.80%, and (b) an increase in trade payables and receivables, net
denominated in U.S. dollars (which totaled US$547.86 million as of
December 31, 2018, as compared to US$ 22.95 million of net
receivables as of December 31, 2017).
|
2017 Compared to 2016
Other operating
income
from continuing
operations
in the year ended December 31, 2017 totaled
Ps.930.06 million, a 59.98% decrease from Ps.2.32 billion in the
year ended December 31, 2016. This decrease was primarily the
result of:
|
|
1.
|
a one-time gain of
Ps.958.2 million in 2016, in connection with a revision of our
estimate of the amounts recognized on December 31, 2015 of certain
receivables from CAMMESA related to LVFVD of additional trust
remuneration for financing new projects, based on changes in the
energy sector; and
|
|
|
2.
|
a Ps.185.54 million
or 61.39% decrease in foreign exchange gains from trade payables
and receivables, net denominated in U.S. dollars mainly as a result
of: (a) a 17.36% devaluation of the peso against the U.S. dollar in
the year ended December 31, 2017 (calculated at the exchange rate
as of December 31, 2017 compared to the exchange rate as of
December 31, 2016) while the inflation rate during 2017 was 24.80%,
compared to a 21.86% devaluation of the peso against the U.S.
dollar in the year ended December 31, 2016 (calculated at the
exchange rate as to December 31, 2016 compared to the exchange rate
as of December 31, 2015) while the inflation rate during 2016 was
34.56%, and (b) a decrease in trade payables and receivables, net
denominated in U.S. dollars (which totaled US$22.95 million as of
December 31, 2017, as compared to US$57.54 million of net
receivables as of December 31, 2016).
|
Other Operating Expenses from continuing operations
2018 Compared to 2017
Other operating
expenses
from continuing
operations
in the year ended December 31, 2018 totaled
Ps.132.88 million, a 5.18% decrease from Ps.140.14 million in the
year ended December 31, 2017. This decrease was primarily the
result of a decrease of Ps. 13.17 million in provision for lawsuits
and claims, and was partially offset by an increase of the result
of Ps. 3.50 million for impairment of material and spare
parts.
146
2017 Compared to 2016
Other operating
expenses from continuing operations in the year ended December 31,
2017 totaled Ps.140.14 million, a 18.50% decrease from Ps.171.95
million in the year ended December 31, 2016. This decrease was
primarily due to a Ps.69.75 million loss from provision for
lawsuits and claims.
Operating Income from continuing operations
2018 Compared to 2017
For the reasons
explained above, operating income
from
continuing operations
in the year ended December 31, 2018
totaled Ps.30.5 billion, a 630.79% increase from Ps.4.17 billion in
the year ended December 31, 2017. This is mainly explained by net
foreign exchange difference.
2017 Compared to 2016
For the reasons
explained above, operating income from continuing operations in the
year ended December 31, 2017 totaled Ps.4.17 billion, a 25.56%
increase from Ps.3.32 billion in the year ended December 31, 2016.
This corresponds to a 43.30% operating margin in the year ended
December 31, 2017, as compared to an operating margin of 47.18% in
the year ended December 31, 2016.
Finance Income from continuing operations
2018 Compared to 2017
Finance income
from continuing operations
in
the year ended December 31, 2018 totaled Ps.2.28 billion, a 46.28%
increase from Ps.1.56 billion in the year ended December 31, 2017.
This increase was primarily the result of:
|
|
1.
|
a foreign exchange
difference totaling Ps.1.33 billion in the year ended December 31,
2018, compared to Ps.66.98 million in the year ended December 31,
2017; and
|
|
|
2.
|
an increase in net
income on financial assets at fair value through profit or loss,
totaling Ps.510.75 million in the December 31, 2018, compared to
Ps.111.51 million in the year ended December 31, 2017, due to an
increase in financial assets bearing interest;
|
|
|
3.
|
which was partially
offset by:
a Ps.755.62
million, or 66.17%, decrease in net income on disposal of financial
assets at fair value through other comprehensive income (net of
corresponding to turnover tax).
|
2017 Compared to 2016
Finance income
from continuing operations
in
the year ended December 31, 2017 totaled Ps.1.56 billion, a 78.37%
increase from Ps.873.92 million in the year ended December 31,
2016. This increase was primarily the result of:
|
|
1.
|
net income on the
disposal of available-for-sale financial assets totaling Ps.1.14
billion in the year ended December 31, 2017, compared to Ps.258.76
million in the year ended December 31, 2016, mainly due to an
increase in sales of available-for-sale financial assets during
2017; and
|
|
|
2.
|
an increase in
interest earned, totaling Ps.238.33 million in the December 31,
2017, compared to Ps.108.89 million in the year ended December 31,
2016, due to an increase in financial assets bearing
interest;
|
|
which was partially
offset by:
|
||
|
|
3.
|
a Ps.130.77
million, or 66.13%, decrease in foreign exchange gains from
financial assets denominated in U.S. dollars, mainly as a result of
a 17.36% devaluation of the peso against the U.S. dollar in 2017
(calculated as the exchange rate as of December 31, 2017 compared
to the exchange rate as of December 31, 2016) while the inflation
rate during 2017 was 24.80%, compared to a 21.86% devaluation of
the peso against the U.S. dollar in 2016 (calculated as the
exchange rate as of December 31, 2016 compared to the exchange rate
as of December 31, 2015) while the inflation rate during 2016 was
34.56%.
|
147
Finance Expenses from continuing operations
2018 Compared to 2017
Finance expenses
from continuing operations
in
the year ended December 31, 2018 totaled Ps.6.30 billion, a 424.79%
increase from Ps.1.20 billion in the year ended December 31, 2017.
This increase was primarily the result of foreign exchange
differences on loans and borrowing which amounted Ps. 4.76 billion
in 2018, a 5,806.43% increase compared to Ps. 80.65 million in
2017.
2017 Compared to 2016
Finance expenses
from continuing operations in the year ended December 31, 2017
totaled Ps.1.20 billion, a 0.40% decrease from Ps.1.21 billion in
the year ended December 31, 2016.
Share of the Profit of Associates from continuing
operations
2018 Compared to 2017
Share of the profit
of associates
from continuing
operations
in the year ended December 31, 2018 totaled
Ps.1.07 billion, a 8.42% decrease from Ps.1.17 billion in the year
ended December 31, 2017. This decrease was primarily the result of
(a) a profit of Ps.1.01 billion from our interest in Ecogas through
IGCE, DGCE and IGCU in the year ended December 31, 2018, as
compared to Ps.726.72 million in the year ended December 31, 2017,
due to an increase in these companies’ revenues from
increases in tariffs effective October 2016 and April 2017, and (b)
a loss of Ps.2.63 million from our interest in TGM in the year
ended December 31, 2018, due to weak demand for its natural gas
transportation services, as compared to a profit of Ps.378.41
million in the year ended December 31, 2017, due to the settlement
by which YPF agreed to pay TGM, without recognizing any facts or
rights, US$114 million in order to end TGM
’
s claim against YPF (for further
information, see “Item 4.B. Business Overview
—
Our Affiliates
—Transportadora de Gas del Mercosur
S.A.
(TGM)”).
2017 Compared to 2016
Share of the profit
of associates from continuing operations in the year ended December
31, 2017 totaled Ps.1.17 billion, a 177.54% increase from Ps.422.65
million in the year ended December 31, 2016. This increase was
primarily the result of (a) a profit of Ps.726.72 million from our
interest in Ecogas through IGCE, DGCE and IGCU in the year ended
December 31, 2017, as compared to Ps.349.26 million in the year
ended December 31, 2016, due to an increase in these
companies’ revenues from increases in tariffs effective
October 2016 and April 2017, and (b) a profit of Ps.378.41 million
from our interest in TGM in the year ended December 31, 2017, due
to the settlement by which YPF agreed to pay TGM, without
recognizing any facts or rights, US$114 million in order to end
TGM’s claim against YPF, as compared to Ps.0 million in the
year ended December 31, 2016, due to weak demand for its natural
gas transportation services, (for further information, see
“Item 4.B. Business Overview—Our Affiliates—
Transportadora de Gas del Mercosur S.A. (TGM)”).
Income Tax from continuing operations
2018 Compared to 2017
Income tax from
continuing operations
in the
year ended December 31, 2018 totaled Ps.6.60 billion, a 510.85%
increase from Ps.1.08 billion in the year ended December 31, 2017.
This increase was primarily the result of increased taxable income
for the period. Our effective tax rate for 2018 and 2017 was 28.09%
and 19.47%, respectively.
2017 Compared to 2016
Income tax from
continuing operations in the year ended December 31, 2017 totaled
Ps.1.08 billion, a 7.43% increase from Ps.1.01 billion in the year
ended December 31, 2016. This increase was primarily the result of
increased taxable income for the period, which was offset by a
Ps.762.83 million adjustments for the deferred tax due to the net
variation in temporary differences, as a consequence of the effect
of lower tax rate for future years set by the Tax Reform Law. Our
effective tax rate for 2017 and 2016 was 19.47% and 63.78%,
respectively.
Net Income for the Year from continuing operations
2018 Compared to 2017
For the reasons
described above, net income from continuing operations for the year
ended December 31, 2018 totaled Ps. 16.91 billion, a 278.18%
increase from Ps.4.47 billion in the year ended December 31,
2017.
148
2017 Compared to 2016
For the reasons
described above, net income from continuing operations for the year
ended December 31, 2017 totaled Ps. 4.47 billion, a 682.28%
increase from Ps.571.55 million in the year ended December 31,
2016.
Income after tax for the year from discontinued
operations
On December 20,
2017, YPF EE accepted our offer to sell the La Plata plant for a
total sum of US$31.5 million (without VAT), subject to certain
conditions. On February 8, 2018, and effective as of January 5,
2018, Central Puerto transferred to YPF EE ownership of La Plata
plant, including generation assets, personnel and agreements
related to the operation and/or maintenance of La Plata
plant’s assets. See “
Item
4.A. History and development of the Company
—La Plata
Plant Sale” and Note 21 to our audited consolidated financial
statements. Consequently, as of December 31, 2017, the La Plata
plant was classified as a disposal group held for sale and its
respective results for the years ended December 31, 2018, 2017 and
2016, as discontinued operations.
2018 Compared to 2017
Income after tax
for the year from discontinued operations in the year ended
December 31, 2018 totaled Ps.276.18 million, a 65.10% decrease from
Ps. 791.27 million in the year ended December 31, 2017. This
decrease was primarily the result of the La Plata Plant Sale to YPF
EE, effective as of January 5, 2018.
2017 Compared to 2016
Income after tax
for the year from discontinued operations in the year ended
December 31, 2017 totaled Ps.791.27 million, a 1.95% decrease from
Ps.806.99 million in the year ended December 31, 2016. This
decrease was primarily the result of (a) a 7.56% decrease in the
quantity of energy generated (837 GWh in 2017, as compared to 905
GWh in 2016), and (b) a 6.38% decrease in the quantity of steam
generated (1,599,476 tons in 2017, as compared to 1,708,465 tons in
2016) (the prices denominated in U.S. dollars remained stable) ,
which was partially offset by (c) a 17.36% devaluation of the peso
against the U.S. dollar in 2017 (calculated as the exchange rate as
of December 31, 2017 compared to the exchange rate as of December
31, 2016).
See
“
Item 4.A. History and
development of the Company
—La Plata Plant Sale”
and Note 21 to our audited consolidated financial
statements.
Net Income for the Year
2018 Compared to 2017
For the reasons
described above, net income for the year ended December 31, 2018
totaled Ps 17.19 billion, a 226.57% increase from Ps.5.26 billion
in the year ended December 31, 2017.
2017 Compared to 2016
For the reasons
described above, net income for the year ended December 31, 2017
totaled Ps 5.26 billion, a 281.74% increase from Ps.1.38 billion in
the year ended December 31, 2016.
As of December 31,
2018, we had cash and cash equivalents of Ps.229.95 million, and
other current financial assets of Ps.1.96 billion. See Note 16 and
14.8 to our audited consolidated financial statements.
Our primary sources
of liquidity have been cash flows from operating activities, cash
flows from the proceeds of the sale of our temporary investments,
cash flows from loans and other financing agreements (mainly with
CAMMESA) and financing provided by equipment suppliers or service
providers.
Our receivables
from CAMMESA also are an important source of liquidity for us. As
of December 31, 2018, our receivables from CAMMESA totaled Ps.26.98
billion.
Our primary cash
requirements have been in connection with payments under loans and
other financing agreements (mainly with CAMMESA),
employees
’
salaries,
operating and maintenance expenses and fixed assets acquisitions,
payment of dividends, taxes and other overhead expenses. In the
future, we may, as is the case as of the date of this annual
report, have to increase cash requirements as a result of projects
to expand our generating capacity. See
“—
The State of Emergency of the
Argentine Electricity Sector
—
Proposed Expansion of our Generating
Capacity.
”
149
Our loans under the
IIC
—
IFC Facilities (see
“
—
Loans from the
IIC
—
IFC
Facilities
”
) contain
customary covenants for facilities of this type, including: (i)
certain limitations on consolidations, mergers and sales of assets;
(ii) restrictions on incurring additional indebtedness; (iii)
restrictions on paying dividends; (iv) limitations on making
capital expenditures and (v) restrictions on the incurrence of
liens. Certain events of default and covenants in the
IIC
—
IFC Facilities are
subject to certain thresholds and exceptions described in the
agreements relating to the IIC
—
IFC Facilities. We do not expect
these restrictions to have a material impact on our ability to meet
our cash obligations. As of the date of this annual report, we are
in compliance with all of our debt covenants.
On March 26, 2019
the Company, as borrower, entered into a loan agreement with KfW
for an amount of US $ 56,000,000 to finance the
acquisition of two SGT-800 gas turbines (with a power of 89 MW) and
equipment from Siemens Sweden and related services from Siemens
Argentina for the Luján de Cuyo project (for more information
see “Item 4. Information of the Company
—Recent Developments—
Borrowing
from KFW
.”)
. As of the
date of this annual report, we are working to satisfy all the
conditions prior to the disbursement of this loan.
Our expansion
projects are being developed with equity from Central Puerto and
its subsidiaries. However, the Company does not discard the option
to pursue potential financing alternatives, if the conditions are
favorable.
As of the date of
this annual report, we also have uncommitted lines of credit with
commercial banks, totaling approximately Ps.5.91
billion.
We believe that our
sources of liquidity, including debt and/or equity offerings in the
international capital markets, will be sufficient to meet our
working capital, debt service and capital expenditure requirements
for the foreseeable future.
Receivables from CAMMESA
We hold receivables
in the form of LVFVD for the unpaid balances from CAMMESA relating
to the sale of electric power to CAMMESA from 2004 to 2011. For
more information, see
“Item
4.B.
Business Overview
—
FONINVEMEM and Similar
Programs.
”
Under the
FONINVEMEM and similar arrangements, we are entitled to collect our
receivables, including interest, in monthly installments over ten
years starting from, (i) in the case of receivables relating to the
sale of electric power to CAMMESA from January 2004 through
December 2007, the commercial launch date of the
FONINVEMEM
’
s Manuel
Belgrano power plant and San Martín power plant and, (ii) in
the case of receivables relating to the sale of electric power to
CAMMESA from January 2008 through December 2011, the commercial
launch date of the CVOSA combined cycle. For more information, see
“Item 4.B.
Business
Overview
—
FONINVEMEM and
Similar Programs.
”
Following the
commercial authorizations granted to the Manuel Belgrano power
plant (on January 7, 2010) and the San Martín power plant (on
February 2, 2010), we started to collect monthly payments of the
receivables relating to the sale of electric power to CAMMESA from
January 2004 through December 2007. As of December 31, 2016, the
balance owed to us under the FONINVEMEM arrangement relating to the
sale of electric power to CAMMESA from 2004 through 2007 totaled
US$64.04 million. During the year ended December 31, 2018, we
received Ps.515.26 million (considered in nominal values, or US$
19.81 million in U.S. dollar-denominated payments) in principal and
Ps.33.14 million (considered in nominal values, or US$ 1.31 million
in U.S. dollar-denominated payments) in interest for these
receivables (including VAT).
The CVO combined
cycle plant became operational on March 20, 2018. As of December
31, 2018, the CVO “LVFVD 2008-2011 receivables” totaled
Ps.20.24 billion.
After the CVOSA
power plant became operational, in the case of receivables accrued
between 2008 and September 2010, the amount due was converted into
U.S. dollars at the exchange rate effective at the date of the CVO
Agreement (i.e., November 25, 2010), which was Ps.3.97 per U.S.
dollar. Additionally, certain receivables that accrued after
September 2010 and that were also included in the CVO Agreement,
were converted into U.S. dollars at the exchange rate effective at
the due date of each monthly sale transaction. The total estimated
amount due is US$ 548 million plus accrued interests after the CVO
Commercial Approval. As a result of the conversion of the LVFVD
into U.S. dollars detailed in the previous paragraph, we had a
one-time income, before income tax, in relation to the interest and
the effect of the adjustment of the LVFVD 2008-2011 receivables to
US dollars as of March 20, 2018, of Ps. 11,017 million, measured in
current unit as of December 31, 2018 (or Ps. 7,959 million,
expressed in nominal terms), at an exchange rate of Ps. 20.17 to
US$1.00, which was the spot bid exchange rate reported by the Banco
de la Nación Argentina for wire transfers (
divisas
) as of March 20, 2018, which
was recognized by us in the consolidated income statement for the
year ended December 31, 2018. under “CVO receivables
update”. The U.S. denominated monthly payments under the CVO
Agreement are payable in pesos, converted at the applicable
exchange rate in place at the time of each monthly
payment.
As of March 20,
2018, CAMMESA granted the CVO Commercial Approval in the WEM, as a
combined cycle, of the thermal plant Central Vuelta de Obligado,
which entitled us to receive the collection of the trade
receivables under the CVO Agreement. A PPA between the CVO Trust
and CAMMESA, through which the CVO Trust makes energy sales and,
consequently, receives the cash flow to pay the trade receivables,
had to be signed in order to start the collections.
150
The PPA agreement
was signed on February 7, 2019, with retroactive effect to March
20, 2018.
As a result, the
original amortization schedule from the CVO Agreement is in full
force and effect.
The unpaid
installments corresponding to the March-December 2018 period add up
to US$ 78.15 million (including VAT, corresponding to installments
1 to 10). As of the day of this annual report, we continue in
negotiations with CAMMESA to collect such unpaid amounts as soon as
possible, plus the accrued interest between each due date and the
effective payment date.
Despite the
referred unpaid installments, as of the date of this annual report,
we received the payment related to January and February 2019
(corresponding to installments 11 and 12, respectively) pursuant to
the CVO Agreement’s original disbursement schedule, at the
exchange rate of the last date of each month, on its respective due
dates, in March and April 2019, respectively.
Additionally, we
hold receivables in the form of LVFVD for the unpaid balances from
CAMMESA relating to the sale of electric power to CAMMESA under the
additional trust remuneration concept since 2012. As of December
31, 2018, we hold Ps.1.06 billion in LVFVD credits for this
concept, which may be used to finance new projects approved by the
Argentine government. We also hold receivables in the form of LVFVD
for the unpaid balances from CAMMESA relating to the sale of
electric power to CAMMESA under the non-recurring maintenance
remuneration concept. For more information regarding sales relating
to additional trust remuneration and non-recurring maintenance, see
“—
Our
Revenues
—
The Energía
Base
”
and
“Item 4.B. Business
Overview—
The Argentine Electric Power
Sector
—
Remuneration
Scheme
—
The Previous
Remuneration Scheme.
”
For more
information regarding financings from CAMMESA, see
“—
Indebtedness
—
Borrowings and Prepayments by
CAMMESA.
”
Cash Flows
The following table
sets forth our cash flows from our operating, investing and
financing activities for the periods indicated:
|
|
Year ended December 31,
|
||
|
|
2018
|
2017
|
2016
|
|
Net cash flows
provided by operating activities
|
3,706,026
|
3,662,667
|
3,042,475
|
|
Net cash flows used
in investing activities
|
(5,070,325
)
|
(3,281,233
)
|
(2,929,970
)
|
|
Net cash (used in)
provided by financing activities
|
687,412
|
(341,788
)
|
(636,002
)
|
|
Increase (Decrease) in cash and cash equivalents, net
|
(676,887
)
|
39,646
|
(523,497
)
|
Net Cash Provided by Operating Activities
2018 Compared to 2017
Net cash provided
by operating activities increased by 1.18% to Ps.3.71 billion for
the year ended December 31, 2018 (which includes a net cash
decrease of Ps.6.7 million from the La Plata plant, which was sold
on February 8, 2018, with an effective date of January 5, 2018),
from Ps.3.66 billion for the year ended December 31, 2017 (which
includes Ps.1.21 billion from the La Plata plant, which was sold).
The increase was primarily driven by increased revenues and other
operating income, as a result of a higher average price per unit in
our sales of energy and steam, mainly due to the price increases
explained above in the section
“
Results of Operations
—
Results of Operations for the Years
Ended December 31, 2018, 2017 and 2016—Revenues—2017
Compared to 2016,
”.
This
was partially offset by (a) an increase in the income tax paid in
2018, which amounted to Ps. 4.2 billion, as compared to Ps. 1.2
billion in 2017, a non-cash increase in CVO receivables update (for
more information see Note 14.1 of our audited consolidated
financial statements) of Ps. 11.02 billion in 2018, and a non-cash
gain in foreign exchange difference for trade receivables of
Ps.11.40 billion in 2018 compared to a decrease of Ps. 116.70
million in 2017.
2017 Compared to 2016
Net cash provided
by operating activities increased by 20.38% to Ps.3.66 billion for
the year ended December 31, 2017 (which includes Ps.1.21 billion
from the La Plata plant, which was sold on February 8, 2018, with
an effective date of January 5, 2018), from Ps.3.04 billion for the
year ended December 31, 2016 (which includes Ps.1.25 billion from
the La Plata plant, which was sold). The increase was primarily
driven by increased revenues and other operating income, as a
result of a higher average price per unit in our sales of energy
and steam, mainly due to the price increases explained above in the
section “Results of Operations—Results of Operations
for the Years Ended December 31, 2017, 2016 and
2015—Revenues—2017 Compared to 2016,”. This was
partially offset by an increase in other non-financial assets and
inventories of Ps. 343.52 million in 2017, compared to a decrease
of Ps. 2.39 billion.
151
Net Cash Used in Investing Activities
2018 Compared to 2017
Net cash used in
investing activities increased by 54.52% to Ps.5.07 billion for the
year ended December 31, 2018, from Ps.3.28 billion for the year
ended December 31, 2017. The increase was primarily driven by (i)
an increase in payments for the purchases of property, plant and
equipment which amounted to Ps.6.96 billion, primarily for the
construction of the wind farms Achiras and La Castellana and for
the construction of the Luján de Cuyo and Terminal 6 San
Lorenzo cogeneration plants, as compared to payments and upfront
payments of Ps.5.73 billion in 2017, primarily for the construction
of the wind farms Achiras and La Castellana and a gas turbine for
Luján de Cuyo, which was partially offset by (ii) proceeds
from La Plata Plant Sale in the amount of Ps.625.91
million.
2017 Compared to 2016
Net cash used in
investing activities increased by 11.99% to Ps. 3.28 billion for
the year ended December 31, 2017, from Ps.2.93 billion for the year
ended December 31, 2016. The increase was primarily driven by (i)
more payments for the purchases of property, plant and equipment
which amounted to Ps.5.73 billion, primarily for the construction
of the wind farms Achiras and La Castellana and a gas turbine for
the new Luján de Cuyo cogeneration unit, as compared to
payments and upfront payments of Ps.4.28 billion in 2016, primarily
for the purchase of two new gas turbines and generators from
Siemens in May and June 2016, which was partially offset by (ii)
proceeds from the sale of available for sale financial assets in
the amount of Ps.2.39 billion, as compared to Ps.1.25 billion in
the year ended December 31, 2016.
Net Cash (Used in) provided by Financing Activities
2018 Compared to 2017
Net cash provided
by financing activities totaled Ps.687.41 million for the year
ended December 31, 2018, compared to Ps.341.79 million in net cash
used in financing activities during the year ended December 31,
2017. This variation was primarily driven by (i) Ps.309.76 million
contributions from non-controlling interests to CP Renovables in
2018, compared to Ps.497.76 million in 2017, (ii) dividends paid in
the amount of Ps.1.42 billion in 2018 compared to a dividend of
Ps.1.89 billion in 2017, (iii) Ps.1.03 billion received in 2017
from borrowings from CAMMESA for the maintenance of our units (in
2018 we have not received borrowings from CAMMESA), (iv) Ps.23.14
million short term loans paid in 2018, as compared to Ps.1,089.07
million received in 2017 and (v) long-term loans received in the
amount of Ps.4,374.98 million in 2018, as compared to Ps.2,840.83
million received in 2017.
2017 Compared to 2016
Net cash used
in financing activities totaled Ps.341.79 million for the year
ended December 31, 2017, compared to Ps. 636.00 million in
net cash used in financing activities during the year ended
December 31, 2016. This variation was primarily driven by (i) a
Ps.497.76 million contributions from non-controlling interests to
CP Renovables in 2017, compared to Ps.12.39 million in 2016, (ii)
the prepayment in full of the Class I 2007 Corporate Notes in the
amount of Ps.1.45 billion in June 2016, (iii) dividends paid in the
amount of Ps.1.89 billion in 2017 compared to a dividend of Ps.2.57
billion in 2016, (iv) Ps.1.02 billion received in 2017 from
borrowings from CAMMESA for the maintenance of our units as
compared to Ps.1.54 billion in 2016, (v) Ps.1.09 billion short term
borrowings paid in 2017, as compared to Ps.212.39 million received
in 2016 and (vi) bank loans received in the amount of Ps.2.84
billion in 2017, as compared to Ps.1.76 billion received in
2016.
Capital Expenditures
The following table
sets forth our capital expenditures for the years ended December
31, 2018, 2017 and 2016.
|
|
Year ended December 31,
|
||
|
|
(in thousands of Ps.)
|
||
|
|
2018
|
2017
|
2016
|
|
Land and
buildings
|
6,487
|
4,552
|
388,682
|
|
Electric power
facilities
|
813,810
|
354,830
|
-
|
|
Gas
turbines
|
191,953
|
1,356,837
|
2,175,645
|
|
Construction in
progress
|
5,924.697
|
3,982,113
|
1,097,130
|
|
Other
|
22,036
|
36,480
|
619,066
|
|
Total
|
6,958,983
|
5,734,812
|
4,280,523
|
152
In the year ended
December 31, 2018, we made total capital expenditures of Ps.6.96
billion, compared to Ps.5.73 billion in 2017. During these years,
the main additions to fixed assets and land were in connection with
proposed projects for the expansion of our installed capacity.
During the year ended December 31, 2018, our main capital
expenditure was for the construction of the Lujan de Cuyo and
Terminal 6 San Lorenzo cogeneration plants, while during the year
ended December 31, 2017, our main capital expenditure was for the
construction of the wind farms Achiras and La Castellana. See
“—
The State of
Emergency of the Argentine Electricity Sector
—
Proposed Expansion of our Generating
Capacity.
”
In the year ended
December 31, 2017, we made total capital expenditures of Ps. 5.73
billion, compared to Ps.4.28 billion in 2016. During these years,
the main additions to fixed assets and land were in connection with
proposed projects for the expansion of our installed capacity.
During the year ended December 31, 2017, our main capital
expenditure was for the construction of the wind farms Achiras and
La Castellana, while during the year ended December 31, 2016, we
made two partial advances for the purchase of two gas turbines for
a total of Ps.2.18 billion, which were recognized under the other
non-financial assets line item as of December 31, 2016. See
“—
The State of
Emergency of the Argentine Electricity Sector
—
Proposed Expansion of our Generating
Capacity.
”
We have funded our
capital expenditures with proceeds from debt issuances and cash
generated from our operations.
We expect to incur
substantial expenses and capital expenditures as we continue to
expand our installed capacity. We anticipate that our capital
expenditures, both estimated and committed, will be approximately
US$445 million during the next three years. Other than the
Borrowing from KFW described in this annual report (see “Item
4.B. Information of the Company—Recent
Developments—Borrowing from KFW”), our expansion
projects are being developed with equity from Central Puerto and
its subsidiaries. However, we may explore alternative financing
options if the conditions are favorable.
We acquired four
heavy-duty gas turbines, which are compatible with single-cycle or
combined cycle installations. We are currently using one of them
for the construction of the Terminal 6 San Lorenzo cogeneration
plant. Additionally, we also acquired land in the Province of
Buenos Aires, in a convenient location for fuel delivery and future
potential connection to power transmission lines.
Equity interests in DGCU and DGCE. – Public offer of
shares
In addition to the
expenditures on physical assets, on July, 23, 2014, we executed
agreements to purchase, directly and indirectly, subject to certain
conditions, equity interests in DGCU and DGCE, jointly with an
investment consortium. On January 7, 2015, all acquisition-related
conditions established in the agreement were met, and the shares
were transferred to us.
Taking into account
both direct and indirect interests involved, we acquired (i) an
interest equivalent to 24.99% of DGCU
’
s capital stock and (ii) an interest
equivalent to 44.10% of DGCE
’
s capital stock.
In addition, as
provided for by Capital Markets Law and CNV regulations, and given
our controlling interest in DGCU shared with the consortium of
buyers described above, our Board of Directors decided to
proportionally participate in a tender offer by the consortium of
buyers for all of DGCU
’
s
outstanding shares issued and not owned, directly or indirectly, by
us or by of any of the members of the consortium of buyers. On
October 30, 2015, the board of directors of the CNV approved the
tender offer. Upon termination of the tender offer in January 2016,
since no acceptances were tendered, no shares were acquired in this
tender offer.
At a meeting of our
shareholders on December 16, 2016, in accordance with the strategic
objective of focusing on assets within the energy industry, the
shareholders considered a potential sale of our equity interests in
Ecogas, but voted to postpone the decision. We are currently
assessing various strategic opportunities regarding DGCU and DGCE,
including a possible partial or total sale of our equity interest
in them. On January 26, 2018, the shareholders of DGCE approved the
admission of DGCE to the public offering regime in Argentina. On
March 14, 2018, the Company authorized the offer of up to
10,075,952 common class B shares of DGCE, in a potential public
offering authorized by the CNV, subject to market conditions. This
authorization was encompassed within the February 23, 2018
authorization of the Board of Directors for the sale of up to
27,597,032 common B shares of DGCE. As of the date of this annual
report, we continue to evaluate this strategy.
153
Indebtedness
As of December 31,
2018, our total indebtedness was Ps.8,693.91 million of which
approximately 66.22% was denominated in U.S. dollars and the
balance in pesos. The following table shows our indebtedness as of
such dates:
|
|
December 31,
|
|
|
|
2018
|
|
|
|
(in thousands of US$)
|
(in thousands of Ps.)
|
|
Current debt
|
|
|
|
Borrowings from
CAMMESA
|
48,088
|
1,812,910
|
|
IFC and IIC
loan
|
11,902
|
448,689
|
|
Other loans and
borrowings
|
5,941
|
223,979
|
|
Non-Current debt
|
|
|
|
Borrowings from
CAMMESA
|
26,639
|
1,004,304
|
|
IFC and IIC
loan
|
137,585
|
5,186,970
|
|
Other loans and
borrowings
|
-
|
17,060
|
Borrowings and prepayments by CAMMESA
Former Secretariat
of Electric Energy Resolution 146, dated October 23, 2002,
establishes that all generators that need to carry out major or
extraordinary maintenance and that require resources to complete
such maintenance may request financing from CAMMESA, subject to the
availability of funds and to compliance with the conditions set
forth in such regulation. The expenditures made with these borrowed
funds are generally included within the
“
cost of sales
”
line item in our income statement.
However, in some exceptional cases, such expenditures may be
capitalized and therefore included within the
“
property, plant and
equipment
”
line item in
our balance sheet, in accordance with the applicable accounting
rules.
Under such
resolution, we entered into a series of loans and security
assignment agreements with CAMMESA. As of December 31, 2018, we had
outstanding loans with CAMMESA under former Secretariat of Electric
Energy Resolution 146 totaling Ps.1.75 billion. This financing may
be paid through cash or net settlement with credits (LVFVD) related
to the non-recurring maintenance remuneration in 48 monthly
installments starting from the completion date of the related
maintenance works and accruing interest at interest rates
equivalent to that which CAMMESA receives on its own cash
investments. In connection with this financing, we have provided
CAMMESA a guaranty representing 100% of our LVFVD receivables
related to non-recurring maintenance remuneration to cover the
outstanding amounts under our loans with CAMMESA under former
Secretariat of Electric Energy Resolution 146. For more information
regarding non-recurring maintenance remuneration see,
“—
Our Revenues
—
The Energía Base
”
above. As of December 31, 2018, we
had credits (LVFVD) in our favor against CAMMESA relating to
non-recurring maintenance remuneration in the amount of Ps.544.27
million not including interests.
Additionally,
between March and August 2015, we received loans from CAMMESA not
related to former Secretariat of Electric Energy Resolution 146 to
pay for a GE generator and gas turbine. As of December 31, 2018,
the outstanding amount of this loan was Ps.1.07 billion. The
Secretariat of Electric Energy has not yet defined the methodology
and terms to repay this loan, such as the number of installments
for payment or when repayment should begin. However, this financing
may be paid through cash or net settlement with credits related to
the
“
additional trust
remuneration.
”
In the
latter case, the repayment of the loan may be made by offsetting
the amounts owed under such loan against the credits with CAMMESA
relating to additional trust remuneration, without the need for
cash disbursements. For more information regarding additional trust
remuneration, see
“—
Our Revenues
—
The Energía Base
”
above. As of December 31, 2018, we
had credits in our favor against CAMMESA relating to additional
trust remuneration in the amount of Ps. 1.06 billion not including
interests.
Loans from the IIC—IFC Facilities
CP La Castellana
On October 20,
2017, CP La Castellana entered into a common terms agreement with
(i) the Inter-American Investment Corporation, (ii) the
Inter-American Investment Corporation, acting as agent for the
Inter-American Development Bank, (iii) the Inter-American
Investment Corporation, as agent of the Inter-American Development
Bank, in its capacity as administrator of the Canadian Climate Fund
for the Private Sector of the Americas, and (iv) the International
Finance Corporation (collectively, the “senior
lenders”) to provide loans for a total amount of up to
US$100,050,000 (the “IIC—IFC Facility I”), from
which US$5 million will accrue interest at an annual rate equal to
LIBOR plus 3.5% and the rest at LIBOR plus 5.25%, and shall be
repaid in 52 quarterly equal installments. Several other agreements
and related documents, such as the guarantee and sponsor support
agreement, where we will fully, unconditionally and irrevocably
guarantee, as primary obligor, all payment obligations assumed
and/or to be assumed by CP La Castellana until the project reaches
the commercial operation date (the “Guarantee and Sponsor
Support Agreement I”), hedge agreements, guarantee trust
agreements, a share pledge agreement, an asset pledge agreement
over the wind turbines, direct agreements and promissory notes have
been executed. On January 9, 2018, CP La Castellana received the
first disbursement from the IIC—IFC Facility I for a total
amount of US$80,000,000.
154
Pursuant to the
Guarantee and Sponsor Support Agreement I, among other customary
covenants for this type of facilities, we committed, until the La
Castellana project completion date, to maintain (i) a leverage
ratio of (a) until (and including) December 31, 2018, not more than
4.00:1.00; and (b) thereafter, not more than 3.5:1.00; and (ii) an
interest coverage ratio of not less than 2.00:1.00. In addition,
our subsidiary, CP Renovables, and we, upon certain conditions,
agreed to make certain equity contributions to CP La
Castellana.
We also agreed to
maintain, unless otherwise consented to in writing by each senior
lender, ownership and control of the CP La Castellana as follows:
(i) until the La Castellana project completion date, (a) we shall
maintain (x) directly or indirectly, at least seventy percent (70%)
beneficial ownership of CP La Castellana; and (y) control of CP La
Castellana; and (b) CP Renovables shall maintain (x) directly,
ninety-five percent (95%) beneficial ownership of CP La Castellana;
and (y) control of CP La Castellana. In addition, (ii) after La
Castellana project completion date, (a) we shall maintain (x)
directly or indirectly, at least fifty and one tenth percent
(50.1%) beneficial ownership of each of CP La Castellana and CP
Renovables; and (y) control of each of CP La Castellana and CP
Renovables; and (b) CP Renovables shall maintain control of CP La
Castellana.
On August 18, 2018,
La Castellana I wind farm reached the commercial operation date. La
Castellana “project completion date” is defined in the
common terms agreement as the date in which the commercial
operation date has occurred and certain other conditions have been
met, which is expected to occur nine months after the commercial
operation date. For further information on La Castellana project
see “
Item 5.A. Operating
Results
—Factors Affecting Our Results of
Operations—Proposed Expansion of Our Generating
Capacity.”
On January 9, 2018
CP, La Castellana received the first disbursement from the IIC-IFC
Facility I for a total amount of US$80 million and paid in full the
three-short-term bridge - loans entered into with Banco de Galicia
y Buenos Aires for an aggregate amount of US$50.5 million with the
proceeds of the ICC - IFC Facility.
On June 4, 2018, CP
La Castellana received a second disbursement for the remaining
amount of US$ 20.050.000.
CP Achiras
On January 17,
2018, CP Achiras entered into a common terms agreement with (i) the
Inter-American Investment Corporation, (ii) the Inter-American
Investment Corporation, acting as agent for the Inter-American
Development Bank, (iii) the Inter-American Investment Corporation,
as agent of the Inter-American Development Bank, in its capacity as
administrator of the Canadian Climate Fund for the Private Sector
of the Americas, and (iv) the International Finance Corporation
(collectively, the “senior lenders”) to provide loans
for a total amount of up to US$50,700,000 (the “IIC—IFC
Facility II” and together with the IIC—IFC Facility I,
the “IIC—IFC Facilities”), from which
US$10,000,000 will accrue interest at an annual rate equal to LIBOR
plus 4.0%, US$20,000,000 will accrue interest at an annual rate
equal to LIBOR plus 5.25% and the remaining amount at a rate
reflecting the cost at which the International Finance Corporation
can provide U.S. dollar funding at a fixed interest rate plus
5.25%, and shall be repaid in 52 quarterly installments. Several
other agreements and related documents, such as the guarantee and
sponsor support agreement, where we will fully, unconditionally and
irrevocably guarantee, as primary obligor, all payment obligations
assumed and/or to be assumed by CP Achiras until the project
reaches the commercial operation date (the “Guarantee and
Sponsor Support Agreement II” and together with Guarantee and
Sponsor Support Agreement I, the “Guarantor and Sponsor
Support Agreements”), guarantee trust agreements, a share
pledge agreement, a mortgage, an asset pledge agreement over the
wind turbines, direct agreements and promissory notes have been
executed. On April 9, 2018 and April 10, 2018, CP Achiras received
two disbursements from the IIC—IFC Facility II for a total
amount of US$50,700,000.
Pursuant to the
Guarantee and Sponsor Support Agreement II, among other customary
covenants for this type of facilities, we committed, until the
Achiras project completion date, to maintain (i) a leverage ratio
of (a) until (and including) December 31, 2018, not more than
4.00:1.00; and (b) thereafter, not more than 3.5:1.00; and (ii) an
interest coverage ratio of not less than 2.00:1.00. In addition,
our subsidiary, CP Renovables, and we, upon certain conditions,
agreed to make certain equity contributions to CP
Achiras.
We also agreed to
maintain, unless otherwise consented to in writing by each senior
lender, ownership and control of the CP Achiras as follows: (i)
until the Achiras project completion date, (a) we shall maintain
(x) directly or indirectly, at least seventy percent (70%)
beneficial ownership of CP Achiras; and (y) control of CP Achiras;
and (b) CP Renovables shall maintain (x) directly, ninety-five
percent (95%) beneficial ownership of CP Achiras; and (y) control
of CP Achiras. In addition, (ii) after Achiras project completion
date, (a) we shall maintain (x) directly or indirectly, at least
fifty and one tenth percent (50.1%) beneficial ownership of each of
CP Achiras and CP Renovables; and (y) control of each of CP Achiras
and CP Renovables; and (b) CP Renovables shall maintain control of
CP Achiras.
155
On September 20,
2018, the Achiras I wind farm reached the commercial operation
date. The Achiras “project completion date” is defined
in the common terms agreement as the date in which the commercial
operation date has occurred and certain other conditions have been
met, which is expected to occur nine months after the commercial
operation date. For further information on the Achiras project see
“Item 5.A. Operating Results—Factors Affecting Our
Results of Operations—Proposed Expansion of Our Generating
Capacity.”
On April 9, 2018,
CP Achiras received a disbursement US$ 50.700.000 for the total
amount of the loan.
Castellana and Achiras Loans
On October 26, 2017
and October 30, 2017, CP La Castellana and CP Achiras S.A.U.
(“CP Achiras”) entered into loans with Banco de Galicia
y Buenos Aires S.A. in the amount of Ps.330 million (US$18.7
million, using the exchange rate as of the date of the
disbursement) and Ps.175 million (US$9.9 million, using the
exchange rate as of the date of the disbursement), respectively,
for the development of renewable energy projects that were awarded
by the Secretary of Electric Energy (the “Castellana and
Achiras Loans”). The Castellana and Achiras Loans accrue
interest at an interest rate equal to BADLAR private banks
plus
a
3.10% margin and shall mature on the dates that are two years from
the execution and disbursement. The proceeds from these loans will
be used to finance the Achiras Project and the La Castellana
Project. We have fully, unconditionally and irrevocably guaranteed,
as primary obligor, all payment obligations assumed and/or to be
assumed by CP La Castellana and CP Achiras under these loans and
any other ancillary document related to them.
On November 10,
2017, CP La Castellana and CP Achiras entered into two short-term
bridge loans with Banco de Galicia y Buenos Aires S.A. in the
amount of US$35 million and US$18 million, respectively, for the
acquisition of wind turbines. These loans accrue interest at an
annual interest rate of 3.6% and mature on January 9, 2018. On
December 21, 2017, CP La Castellana and CP Achiras entered into two
short-term bridge loans with Banco de Galicia y Buenos Aires S.A.
in the amount of US$9 million and US$5.8 million, respectively, for
the acquisition of wind turbines. These loans accrue interest at an
annual interest rate of 3.6% and mature on February 19, 2018. On
December 22, 2017, CP La Castellana and CP Achiras entered into two
short-term bridge loans with Banco de Galicia y Buenos Aires S.A.
in the amount of US$6.5 million and US$3.2 million, respectively,
for the acquisition of wind turbines. These loans accrue interest
at an annual interest rate of 3.6% and mature on February 20, 2018.
On January 17, 2018, CP Achiras entered into a short-term bridge
loan with Banco de Galicia y Buenos Aires S.A. in the amount of
US$7 million, for the acquisition of wind turbines. This loan
accrues interest at an annual interest rate of 3.1% and matured on
March 18, 2018.
On January 9, 2018,
CP La Castellana applied the funds from the IIC
—
IFC Facility I to prepay all of its
outstanding short-term bridge loans with Banco de Galicia y Buenos
Aires S.A. On April 9, 2018, CP Achiras applied the funds from the
IIC
—
IFC Facility II to
prepay US$18 million of its outstanding short-term bridge loans
with Banco de Galicia y Buenos Aires S.A. and on April 10, 2018, CP
Achiras applied the funds from the IIC
—
IFC Facility II to prepay the
remaining US$16 million of its outstanding short-term bridge loans
with Banco de Galicia y Buenos Aires S.A., effectively cancelling
all the outstanding bridge loans with such entity.
We do not have any
significant policies or projects relating to research and
development, and we own no patents or licenses.
The following
discussion includes forward-looking statements based on our
management
’
s current
beliefs, expectations and estimations. Forward-looking statements
involve inherent risks and uncertainties. Our future operating and
financial performance may differ materially from these
forward-looking statements, including due to many factors outside
of our control. We do not undertake any obligation to update
forward-looking statements in the event of changed circumstances or
otherwise. For more information, see
“
Forward-Looking
Statements
”
and
“Item 3.D.—
Risk
Factors
”
in this annual
report.
We expect that our
operating and financial performance in the future will benefit from
the increases we expect in our power generation capacity. We have
been awarded three wind farm projects under the RenovAr Program
(Achiras with 48 MW of awarded electric capacity, La Castellana
with 99 MW of awarded electric capacity and La Genoveva I with 86.6
MW of awarded electric capacity) and two co-generation projects
(Terminal 6 San Lorenzo with an awarded electric capacity of 330 MW
and 317 MW for the winter and summer, respectively, and Lujan de
Cuyo with an awarded electric capacity of 93 MW and 89 MW for the
winter and summer, respectively). Two of our wind farms, Achiras
and La Castellana, commenced their operations in September and
August 2018, respectively. We expect the Luján de Cuyo
cogeneration project to commence operations during the fourth
quarter of 2019, and the Terminal 6 San Lorenzo cogeneration
project and La Genoveva I wind farm to commence operations on the
second quarter of 2020. The development of new projects involves
risks and we cannot assure you that these projects will commence
operations on time and on budget, nor can we assure you that these
projects will perform as expected. For a description of these
awarded projects and of our expected capital expenditures in
connection with them, see
“Item
5.A. Operating Results—
Factors Affecting Our Results
of Operations
—
Proposed
Expansion of Our Generating Capacity
”
.
156
In addition, as
described in
“
Our
Competitive Strengths
—
Attractive Growth
Pipeline
”
, we are
currently developing five wind farm projects, Manque (previously a
part of Achiras II) (57 MW), Los Olivos (previously a part of
Achiras II) (22.80 MW), La Castellana II (15.75 MW) and La Genoveva
II (41.80 MW), and one solar project, El Puesto (12 MW). These
projects are being developed under the Term Market regulatory
framework which allow us to make agreements with large consumers
(see
“Item 4.B. Business
Overview—
The Argentine Electric Power
Sector
—
Resolution No.
281-E/17: The Renewable Energy Term Market in Argentina
”
).
In terms of energy
tariffs, we believe that the Argentine government will continue its
efforts to cut off subsidies to end users after 2019, and narrow
the gap between the whole price of generating electric energy and
the price paid by the demand. In March 2019, Energía Base
tariffs were reduced significantly compared to the tariffs in
effect at the beginning of the year. This change was defined as a
transition measure by the recitals of Resolution SRRyME No. 1/19 in
order to reduce the national government’s fiscal deficit,
since the price reduction may reduce the subsidies needed for the
sector. In 2020, we expect an increase in the remuneration for, at
least, the most cost-efficient and required units, such as combined
cycles. We have no control over these tariffs and cannot assure
that the Argentine government will restore term market sales under
contracts for conventional energy. See
“Item 3.D.
Risk Factors
—
Risks Relating to the Electric Power
Sector in Argentina
—
The
Argentine government has intervened in the electric power sector in
the past, and is likely to continue intervening
”
and
“Item 3.D.—
Risk
Factors
—
Risks Relating to
Our Business
—
Our results
depend largely on the compensation established by the Secretariat
of Electric Energy and received from CAMMESA
”
.
In terms of the
performance of our plants, we estimate that our existing plants
will achieve availability factors consistent with their average
historical performances over the past ten years and in the case of
our expansion co-generation and potential combined cycle projects
that the plants will achieve availability factors consistent with
the assurances provided by our vendors. We also estimate that the
capacity factor of our hydro plant will be consistent with its
historical average performance since the plant was awarded its
concession in 1994 and that the capacity factor of our wind farm
projects will be consistent with our wind studies that have been
certified by renowned international experts. However, we cannot
assure you that the expected availability factors and capacity
factor will be consistent with past performance or with the
assurances provided by vendors.
A substantial
portion of our remuneration is currently based on fixed capacity
and not generation levels. For 2019 CAMMESA expects that
electricity demand in Argentina will decrease 0.2%. We expect that
despite the awarding of new generation capacity, our main units
will maintain their approximate dispatch order because of the
efficiency and positioning of our power plants within
Argentina
’
s electricity
system. The operation of our various units involves risks and we
cannot assure you that we will achieve this performance in the
future. See
“Item 3.D.
Risk Factors
—
Risks
Related to our Business
—
Factors beyond our control may
affect our ability to win public bids for new generation capacity,
or affect or delay the completion of new power plants once we have
been awarded projects
”
and
“Item 3.D.—
Risk
Factors
—
Risks Relating to
the Electric Power Sector in Argentina
—
Our power plants are subject to the
risk of mechanical or electrical failures and any resulting
unavailability may affect our ability to fulfill our contractual
and other commitments and thus adversely affect our business and
financial performance
”
.
Additionally, we
expect that our steam production will be affected by the La Plata
Plant Sale but will recover in 2020 when our awarded co-generation
projects are expected to be online. The concession for our hydro
plant expires in 2023 and believe that we are well-positioned to
achieve the extension of this concession. However, since the HPDA
Concession Agreement does not contain a clause for an automatic
renewal, we cannot assure you that we will achieve the extension of
the concession or be awarded with a new concession, for our
operation of the Piedra del
Á
guila plant (
“Item 3.D.—
Risk
Factors
—
Risks Relating to
Our Business
—
The
non-renewal or early termination of the HPDA Concession Agreement
would adversely affect our results of operations
”
).
Regarding the
collections from CAMMESA, from September 2016 to November 2017
CAMMESA has paid without delays, and since then, there were short
periods in which CAMMESA experienced delays in paying (for more
information on the duration of these delays see “Item 11.
Quantitative and Qualitative Disclosures about Market
Risk
—
Credit Risk”).
For example, for the monthly transaction related to Energía
Base of January 2019, with due date on March 13, 2019, we collected
50% on that date, 22% on March 19, 2019, 22% on April 1, 2019, and
the rest on April 5, 2019. For the monthly transaction related to
Energía Base of February 2019, with due date on April 11,
2019, we collected 41% on that date, and 20% on April 17, 2019, and
we expect to collect the balance in the upcoming weeks. For these
delays, we are entitled to receive interests from CAMMESA. Payments
related to PPAs under the Renovar Regulatory Framework have not
suffered delays. CAMMESA may once again be unable to make payments
to generators both in respect of energy dispatched and generation
capacity availability on a timely basis or in full, which may
substantially and adversely affect our financial position and the
results of our operations.
157
As of March 20,
2018, CAMMESA granted the CVO Commercial Approval in the WEM, as a
combined cycle, of the thermal plant Central Vuelta de Obligado,
which entitled us to receive the collection of the trade
receivables under the CVO Agreement. A PPA between the CVO Trust
and CAMMESA, through which the CVO Trust makes energy sales and,
consequently, receives the cash flow to pay the trade receivables,
had to be signed in order to start the collections.
The PPA agreement
was signed on February 7, 2019, with retroactive effect to March
20, 2018.
As a result, the
original amortization schedule from the CVO Agreement is in full
force and effect.
The unpaid
installments corresponding to the March-December 2018 period add up
to US$ 78.15 million (including VAT, corresponding to installments
1 to 10). As of the day of this annual report, we continue in
negotiations with CAMMESA to collect such unpaid amounts as soon as
possible, plus the accrued interest between each due date and the
effective payment date.
Despite the
referred unpaid installments, as of the date of this annual report,
we received the payment related to January and February 2019
(corresponding to installments 11 and 12, respectively) pursuant to
the CVO Agreement’s original disbursement schedule, at the
exchange rate of the last date of each month, on its respective due
dates, in March and April 2019, respectively.
We are also
entitled to receive the foreign exchange difference accrued for the
Energía Base and FONI trade receivables, between the last date
of the month of each monthly transaction of Energía Base or
FONI installment, and the day prior to the due date of such monthly
transaction or installment. These amounts should be paid one day
after the due date of the payment of each monthly transaction of
Energía Base or FONI installment. However, for the January
2019 installment, with due date on March 14, 2019, the foreign
exchange difference was payed on April 5, 2019. The foreign
exchange difference on the February 2019 monthly transaction of
Energía Base and FONI installments has not been collected as
of the date of this annual report.
In terms of our
main costs, on November 7, 2018, pursuant to Res. SEE 70/18, the
Argentine government authorized generators to purchase their own
fuel for assets under the Energía Base Regulatory framework.
However, prior commitments assumed by generators with CAMMESA for
energy supply contracts are not altered by this new regulation. If
generation companies opt to take this option, CAMMESSA will value
and pay the generators their respective fuel costs in accordance
with the Variable Costs of Production (CVP) declared by each
generator to CAMMESA. According to CAMMESA’s procedure, the
machines with the lower CVPs are dispatched first, and
consequently, may produce more electric energy. The Agency in
Charge of Dispatch (Organismo Encargado del Despacho or
“OED” using the Spanish acronym) -CAMMESA- will
continue to supply the fuel for those generation companies that do
not elect to take this option. For reference, until 2009, we were
able to generate gains resulting from savings in the purchase of
fuel oil, which savings were equal to the difference between the
cost of fuel oil actually paid by CAMMESA and the cost of fuel oil
to us.
In accordance to
Res. SEE 70/18, in November 2018, we started purchasing fuel for
our Luján de Cuyo combined cycle, and in December 2018, for
all our thermal units. We obtained a gross margin since we were
able to benefit from better fuel prices than the reference
pass-through values provided by CAMMESA, given our scale as one of
the largest private sector power companies in Argentina, as
measured by generated power, according to data from CAMMESA, and
the diverse and strategic location of our power sector assets (see
“Item 4.A. History and
development of the Company—
Our Competitive
Strengths
”
). The
possibility to make same gross margins in the future will depend on
various factors, such us the reference prices set by CAMMESA and
the price and availability of the fuel prices in the Argentine
market, among other factors. In the future, we may conclude that
purchasing our own fuel is no longer convenient and, in turn, opt
to obtain the supplies from CAMMESA. According to CAMMESA’s
procedures, generators are allowed to make this decision every
fifteen days. During the past three months, CAMMESA has
consistently reduced the reference price for the fuel, and thus,
the margin that we can obtain has been reduced significantly. At
the date of this annual report, we are only purchasing the
necessary fuel for our combined cycles of the Puerto Complex and
Luján de Cuyo Plant.
We also assume an
increase in our number of employees related to our new projects,
but we believe that salaries will remain in line with current
levels in U.S. dollar terms. We cannot assure you that our
operating or other costs will not increase at higher rates, that
the Argentine government will continue to allow generators to
purchase the fuel needed for the operation of their thermal power
plants or that we will be able to benefit from better fuel prices
than the reference pass-through values provided by CAMMESA. See
“Item 3.D.
Risk
Factors
—
Risks Relating to
Argentina
—
Government
measures, as well as pressure from labor unions, could require
salary increases or added benefits, all of which could increase
companies
’
operating
costs
”
,
“Item 3.D.—
Risk
Factors
—
Risks Relating to
the Electric Power Sector in Argentina
—
We operate in a heavily regulated
sector that imposes significant costs on our business, and we could
be subject to fines and liabilities that could have a material
adverse effect on our results of operations
”
and
“Item 3.D.—
Risk
Factors
—
Risks Relating to
Our Business
—
Our ability
to generate electricity at our thermal generation plants partially
depends on the availability of natural gas and, to a lesser extent,
liquid fuel.
”
158
As of December 31,
2018, we did not have any off-balance sheet arrangement as defined
in Form 20-F not disclosed in our audited consolidated financial
statements.
Contractual Obligations
The table below
identifies the principal amounts of our main contractual
obligations from continuing operations, their currency of
denomination, remaining maturity and interest rate and the
breakdown of payments due, as of December 31, 2018. Peso amounts
have been translated from U.S. dollar amounts at the seller rate
for U.S. dollars quoted by the Banco de la Naci
ó
n Argentina for wire transfers
(
divisas
)
on December28, 2018 of Ps. 37.70 to US$1.00.
Payment and Purchase Obligations
|
|
|
|
Payments due by period
|
|||||
|
|
Currency
|
|
Maturity
|
Total atDecember 31,2018
|
Less than1 year
|
1 – 3years
|
3 – 5years
|
Morethan5 years
|
|
|
|
|
|
(in thousands of Ps.)
|
||||
|
Bank debt
(1)
|
Pesos
|
|
|
223,979
|
223,979
|
-
|
-
|
-
|
|
IIC-IFC La
Castellana Loan
|
Pesos
|
|
Nov-2031
|
10,439,356
|
637,773
|
1,580,941
|
1,538,296
|
6,682,346
|
|
IIC-IFC
Achiras Loan
|
Pesos
|
|
Feb-2032
|
5,455,773
|
327,660
|
810,345
|
789,053
|
3,528,715
|
|
Debt with
CAMMESA(2)
|
Pesos
|
|
|
4,985,573
|
2,062,308
|
2,923,265
|
-
|
-
|
|
Maintenance
contracts thermal plants (long-term service
agreements)(3)
|
U.S.
dollars
|
|
Varies
|
6,871,476
|
716,734
|
2,056,131
|
3,526,583
|
572,028
|
|
Wind
Farms’ Operation and Maintenance contracts
(3)
|
U.S.
dollars
|
|
Varies
|
2,038,577
|
99,669
|
324,211
|
384,612
|
1,230,084
|
|
Natural gas
contracts(4)
|
U.S.
dollars
|
|
|
30,434,657
|
83,811
|
3,081,491
|
3,759,162
|
23,510,192
|
|
Gas
transmission and distribution contracts(5)
|
Pesos andU.S.
dollars
|
|
Varies
|
11,073,167
|
906,888
|
2,614,296
|
2,825,097
|
4,726,886
|
|
Provincial
fees and royalties(6)
|
Pesos
|
|
Dic-2023
|
2,079,989
|
290,491
|
831,222
|
869,129
|
88,514
|
|
Construction
of Renewable Energy projects
|
U.S.
dollars
|
|
Varies
|
4,268,931
|
3,977,209
|
291,722
|
-
|
-
|
|
Construction
of San Lorenzo Terminal 6 and Lujan de Cuyo
plants
|
U.S.
dollars
|
|
Varies
|
8,883,330
|
8,236,742
|
646,587
|
-
|
-
|
|
Long-term
benefits to employees
|
Pesos
|
|
Varies
|
148,470
|
38,421
|
18,820
|
14,316
|
76,912
|
(1)
Mainly
overdraft
facilities and VAT
facilities related
to the acquisition of wind turbines with
an estimated maturity in April 2019.
(2) Debt
pursuant to Secretariat of Energy Resolution 146 totaling Ps.3.58
billion with an estimated maturity on March 2021 and a loan with
CAMMESA totaling Ps.1.40 billion. With respect to this last loan,
because CAMMESA did not establish a term for the loan (which was
used to purchase a GE turbine), we have included this amount as
debt with payments due in less than 1 year, the shortest possible
maturity category in the chart above. See “Item 4.B. Business
Overview—The Argentine Electric Power Sector—Structure
of the Industry—Shortages in the Stabilization Fund and
Responses from the Argentine Government.”
(3) The GE
combined cycle maintenance contract expires on December 31, 2024;
the Siemens combined cycle (Luján de Cuyo) maintenance
contract expires on September 30, 2024; the Alstom co-generation
unit (Luján de Cuyo) maintenance contract expires on March 1,
2019 the Achiras and La Castellana maintenance contract expires 10
years after the start of the commercial operation of each project.
The amounts listed above depend, in part, on the generation of the
applicable machinery and the type of fuel used, and we have made
certain assumptions with respect to these factors, among others,
utilizing models and software provided by CAMMESA, for purposes of
estimating the amounts included in the table above.
(4) We have a
contract for the purchase of natural gas for Luján de Cuyo
Alstom cogeneration unit that expires in September, 2019, and a
contract for the purchase of natural gas for the new Luján de
Cuyo cogeneration unit for 15 years after the commencement of
operations, which is expected to occur in November 2019. The
amounts listed above depend, in part, on the generation of the
applicable machinery and the type of fuel used, and we have made
certain assumptions with respect to these factors, among others,
utilizing models and software provided by CAMMESA, for purposes of
estimating the amounts included in the table above.
(5) The
amounts listed above depend, in part, on the generation of the
applicable machinery, and we have made assumptions with respect to
this factor, among others, utilizing models and software provided
by CAMMESA, for purposes of estimating the amounts included in the
table above.
(6) Based on
our internal estimates of the electric power generated by the
Piedra del Águila plant, with expected future water
flows.
(7) Estimated
maturity.
Sales Obligations
The table below
identifies the principal amounts of our main sales obligations from
continuing operations and corresponding payments due to us as of
December 31, 2018 and the breakdown of when payments are due. The
below obligations are not derived from the Energía Base. With
respect to electric power sales, we agree to supply power to
customers or purchase the energy for the customer. With respect to
steam sales, we agree to provide a certain volume of energy
production per hour (except during scheduled maintenance). In the
event we cannot offer the agreed upon volume of energy in
connection with our steam sales, we must pay penalties. Electric
power sales and steam sales are denominated in U.S. dollars and
were converted into pesos below at Ps.37.7 to US$1.00, which was
the exchange rate quoted by the Banco de la Naci
ó
n Argentina for U.S. dollars for wire
transfers (
divisas
) as of December
28, 2018.
159
|
|
Expected revenue by period
|
||||
|
|
Total at December 31, 2018
|
Less than1 year
|
1 – 3years
|
3 – 5years
|
More than5 years
|
|
|
(in thousands of Ps.)
|
||||
|
Electric power
sales
(1)
|
59,281,890
|
2,457,019
|
6,087,557
|
5,999,796
|
44,737,518
|
|
Steam
sales
(1)
|
22,777,993
|
197,234
|
3,257,761
|
3,311,658
|
16,011,341
|
|
Total
|
82,002,938
|
2,597,308
|
9,345,318
|
9,311,454
|
60,748,858
|
(1) Prices are
generally determined by agreements or formulas based on future
market prices. Estimated prices used to calculate the monetary
equivalent of these sales obligations for purposes of the table are
based on current market prices as of December 31, 2018, and
expected generation and demand estimated at that date, and may not
reflect actual future prices of these commodities, or the real
demand. Accordingly, the peso amounts provided in this table with
respect to these obligations are provided for illustrative purpose
only, and are fixed for the entire period. The amounts above are
based on internal estimates of demand from our customers, based on
prior years, and they do not include the agreements for the sale of
energy entered into after December 31, 2018.
See the discussion
at the beginning of this annual report under the heading
“Forward-Looking Statements” for forward-looking
statement safe harbor provisions.
Board of Directors
We are managed by
our Board of Directors in accordance with the Argentine Corporate
Law. Our Board of Directors makes management decisions, as well as
those expressly set forth in the Argentine Corporate Law, our
bylaws and other applicable regulations. In addition, our Board of
Directors is responsible for carrying out shareholders
’
resolutions and fulfilling
particular tasks expressly delegated by the
shareholders.
According to our
bylaws, our Board of Directors must be composed of 11 directors,
and our shareholders may also appoint an equal or lesser number of
alternate directors. As of the date of this annual report, our
Board of Directors is composed of 11 directors and 11 alternate
directors. All of our directors reside in Argentina.
Directors and their
alternates are appointed for a term of one year by our shareholders
during our annual shareholders
’
meetings. Directors may be
reelected. Shareholders are entitled to elect up to one-third of
the vacant seats by cumulative voting pursuant to Section 263 of
the Argentine Corporate Law. Pursuant to Section 257 of the
Argentine Corporate Law, the directors maintain their positions
until the following annual ordinary shareholders
’
meeting where directors are
appointed.
The latest election
relating to our Board of Directors took place at the ordinary
shareholders
’
meeting
held on April 27, 2018.
During the first
board meeting after directors have been appointed, they must
appoint a chairman and vice-chairman of the board. The
vice-chairman would automatically and temporarily replace the
chairman in the event that the chairman is absent, resigns, dies,
is incapacitated or disabled, removed or faces any other impediment
to serve as chairman. A new chairman must be elected within ten
days from the seat becoming vacant. The election of a new chairman
must take place only if the situation that gives rise to the
re-election is expected to be irreversible during the remaining
term of office.
According to
Section 26 of our bylaws, our Board of Directors has the broadest
powers and authorities in connection with our direction,
organization and administration, with no limitations other than
those set forth by the applicable laws and regulations. The
chairman is our legal representative.
160
The following table
sets forth the current composition of our Board of
Directors:
|
Name
|
Title
|
Date of first appointment to the board
|
Date of expiration of current term
|
Date of birth
|
|
Osvaldo Arturo
Reca
|
Chairman of the
Board
|
April 5,
2011
|
December 31,
2018
|
December 14,
1951
|
|
Jorge Anibal
Rauber
|
Vice-Chairman of
the Board
|
April 27,
2018
|
December 31,
2018
|
July 18,
1969
|
|
Miguel
Dodero*
|
Director
|
September 21,
2015
|
December 31,
2018
|
February 16,
1955
|
|
Oscar Luis
Gosio*
|
Director
|
July 11,
2007
|
December 31,
2018
|
August 17,
1954
|
|
Juan
Jos
é
Salas*
|
Director
|
September 21,
2015
|
December 31,
2018
|
February 23,
1960
|
|
Diego Gustavo
Petracchi*
|
Director
|
April 27,
2018
|
December 31,
2018
|
July 17,
1972
|
|
Tomas
Peres
|
Director
|
April 27,
2018
|
December 31,
2018
|
December 31,
1983
|
|
Tomás
José White*
|
Director
|
April 27,
2018
|
December 31,
2018
|
May 18,
1957
|
|
Cristi
á
n Lopez Saubidet*
|
Director
|
April 15,
2009
|
December 31,
2018
|
September 26,
1974
|
|
Jorge Eduardo
Villegas
|
Director
|
April 28,
2017
|
December 31,
2018
|
January 9,
1949
|
|
Liliana Amelia
Murisi*
|
Director
|
April 28,
2017
|
December 31,
2018
|
March 30,
1967
|
|
Marcelo Atilio
Suv
á
|
Alternate
Director
|
July 22,
2008
|
December 31,
2018
|
July 27,
1948
|
|
Justo Pedro
S
á
enz
|
Alternate
Director
|
April 10,
2008
|
December 31,
2018
|
May 2,
1958
|
|
Adrián Gustavo
Salvatore
|
Alternate
Director
|
April 27,
2018
|
December 31,
2018
|
April 26,
1967
|
|
Javier Alejandro
Torre
|
Alternate
Director
|
April 27,
2018
|
December 31,
2018
|
April 19,
1967
|
|
Rubén Omar
López
|
Alternate
Director
|
April 27,
2018
|
December 31,
2018
|
April 17,
1964
|
|
Oscar Mauricio
Guillani
|
Alternate
Director
|
April 27,
2018
|
December 31,
2018
|
March 3,
1964
|
|
Enrique Gonzalo
Ballester*
|
Alternate
Director
|
April 28,
2017
|
December 31,
2018
|
January 19,
1954
|
|
Juan Pablo Gauna
Otero*
|
Alternate
Director
|
April 28,
2017
|
December 31,
2018
|
October 10,
1976
|
|
Diego Federico
Cerdeiro
|
Alternate
Director
|
April 27,
2018
|
December 31,
2018
|
May 30,
1976
|
|
Pablo Javier
Vega*
|
Alternate
Director
|
September 21,
2015
|
December 31,
2017
|
September 29,
1972
|
* Independent
directors according to CNV rules, which differ from NYSE
requirements for U.S. issuers.
Note:
Notwithstanding expiration of current term, under the company,
bylaws, directors continue to serve in their capacity until the
next shareholders
’
meeting.
The following are
the academic and professional backgrounds of the members of our
Board of Directors. The business address of each of the members of
our Board of Directors is Avda. Thomas Edison 2701, Buenos Aires,
Argentina.
Juan José Salas
holds a degree in Engineering from the Universidad de La Plata. He
has been a member of our Board of Directors since 2015. From 1983
to 1984, he completed postgraduate studies at the Instituto de
Altos Estudios Empresariales. From 2010 to 2015, Mr. Salas has also
served as operations and information systems manager of Autopistas
del Sol S.A. Since 2016, he is a director of Transener S.A., and
since 2017 he serves as highways’ operations director of
Autopistas Urbanas S.A
Osvaldo Arturo Reca
holds a degree in Engineering from the Universidad Cat
ó
lica Argentina. He also received an
advanced degree in 1977 from North Carolina State University in the
United States. He has been a member of our Board of Directors since
2011. From 1980 to 1984, he was a shareholder and director of
Ingenier
’
a de Avanzada
S.A., a company engaged in the deployment of sanitary and gas
facilities for housing developments. From 1984 to 1989, he served
as general manager of Dufalp S.A., a leading company within the
clothing industry (
“
Dufour
”
was its principal brand). From 1989
to 2002, Mr. Reca served as commercial, operating and planning
manager of Alpargatas S.A., a leading company in the clothing and
footwear industry. He then developed an agricultural project for
cereal and oilseeds production, which he still runs as of the date
of this annual report. He also served as vice chairman of HPDA from
2012 to 2015 and as a director of Transportadora de Gas del Norte
S.A., Edesur S.A. and PB Distribuci
ó
n S.A. In addition, he currently
serves as chairman of the board of directors of DGCE, DGCU, IGCU,
IGCE and Energía Sudamericana S.A.
Jorge Anibal Rauber
holds a degree in Electrical Engineering from the Universidad
Nacional de la Plata and post-graduate degrees in Electrical Market
Management from the Instituto Tecnol
ó
gico de Buenos Aires (ITBA) and in
Business from the Universidad Di Tella. From 2006 to 2012, Mr.
Rauber worked as general manager of AES Argentina Generación
S.A. From 2016 to 2017, he served as general manager of
Subterraneos de Buenos Aires Sociedad del Estado.
Miguel Dodero
holds a
degree in Business Administration from the Universidad de Buenos
Aires. He has been a member of our Board of Directors since 2015.
He has previous work experience at Agencia Mar
’
tima Dodero S.A. and
Compa
ñ’
a Argentina
de Navegaci
ó
n
Intercontinental S.A. He served as chairman of Dodero Inmobiliaria
y Mandataria S.A. from 1990 to September 2014. Mr. Dodero has been
chairman of M. Dodero Compa
ñ’
a de Servicios S.A. since 1989
and of Full Logistics S.A. since 2008, as well as a shareholder of
both companies. In addition, he currently serves as a director of
IGCU, IGCE, DGCU and DGCE.
161
Oscar Luis Gosio
holds
a degree in Accounting from the Universidad de Buenos Aires. He is
currently the principal partner at Gosio, Medina & Asociados, a
company that provides audit, accounting and tax services. He is
also the chairman and partner of Agropecuaria Huen Loo S.A. since
2008, a company engaged in the agriculture business, as well as the
President of the Instituto de Hermanos Cristianos, which is focused
on education (Colegio Cardenal Newman) since 2014. Mr. Gosio also
serves as a director of Asociación Argentina de Criadores de
Corriedale. In addition, he is syndic in several companies of the
agriculture industry.
Diego Gustavo Petracchi
holds a degree
in Economics from the Universidad Católica Argentina and a
Master in Science of Management (Sloan Program) from Stanford
University. He is currently developing a project in the senior
living (residences for adults) business. From 2006 to 2015, he was
a director of NDM Holding (Valle de las Leñas S.A.), a Company
engaged in tourism, real state and agribusiness. He has also served
as a director of Nieves de Mendoza S.A., Santa Rosa del Monte S.A.,
Rio Lobo S.A., Valles Mendocinos S.A. In addition, from 1995 to
2006, he worked in different positions, including Vice President,
in Prefinex S.A., a company that provides financial advisory
services.
Tomas Peres
holds a degree in Business
Administration from the Universidad de San Andrés. From
2007 to 2009 que worked in the audit department of KPMG. From
2009 to 2015 he worked at Ultrapetrol American Barge Line, first as
bunker responsible, and then as chief of commercial
planning. He currently serves as an advisor of the Ministry of
Transport of the Republic of Argentina and director of Energía
Sudamericana S.A.
Tomás José White
holds
a degree in Accounting from the Universidad Católica
Argentina. From 1977 to 1984 he served as director in several
private companies in the construction industry, such as Bemba S.A.,
Sumarge S.A. and Din S.A. From 1996 to 1998 he also served as a
director of Empresa Amanco SA. Since 2000 he is the chairman of
Celestal SAIC.
Adrián Gustavo
Salvatore
holds
a degree in law from the Universidad de Buenos Aires and an MBA in
a joint degree from the Universidad del Salvador (Argentina) and
the Universidad de Deusto (Spain). From 1993 to 1997 he worked at
the legal and regulatory department of ESEBA, where he was in
charge of the process of privatizing the company. From 1997 to
2003, he worked as legal manager at COMESA, Comercializadora de
Energía, and in 2003 he joined the law firm Bruchou,
Fernández Madero, Lombardi & Mitrani, as part of their
regulatory and public services department. He works in the
regulatory department of Central Puerto since 2008, and he
currently serves as a director in several companies such as
Termoeléctrica Manuel Belgrano S.A., Inversora de Gas Cuyana
S.A., Inversora de Gas del Centro S.A. and Central Vuelta de
Obligado S.A., as well as alternate director of Distribuidora de
Gas Cuyana S.A. and Distribuidora de Gas del Centro S.A. He is also
the chairman of Proener S.A.U., and vice-chairman of
Termoeléctrica José de San Martín S.A. and Central
Aimé Painé S.A.
Javier Alejandro Torre
holds a degree in Human Resources from the University of Buenos
Aires and a Master in Business Administration from the University
of Buenos Aires.
From 2011 to 2016,
he was human resources manager of Argentine operations in
LyondellBasell.
He has been our
human resources manager since 2016. He previously worked at
ExxonMobil for almost 20 years, where he held different positions
in the commercial and human resources areas.
Rubén Omar
López
holds a degree in Electrical Engineering from the
Universidad Tecnol
ó
gica
Nacional. He also holds a postgraduate degree in Business
Management from Universidad de Buenos Aires. From 2013 to 2019, he
was our planning and regulation manager and, since 2019, he is our
Strategic Planning Director. He has more than 30 years of
experience in the utilities sector, where he has held different
positions both in technical and commercial areas. In addition, he
currently serves as alternate director of EDESUR S.A., and as a
director of Distrilec Inversora S.A. In addition, he has been a
director in CAMMESA since 2015.
Oscar Mauricio Guillani
, holds a degree
in law from the Universidad de Buenos Aires. Since graduation, he
has worked as a lawyer in the private sector, independently through
his own law firm. He also serves as syndic of Fadeasa Fabrica de
Aviones S.A., B C and L SA Belgrano Cargas y Logística SA and
ADIFSE (
Administradora de
Infraestructura Ferroviaria Sociedad del Estado
). For more
than 10 years he was adjunct professor of Corporations and Contract
Law of the Universidad de Buenos Aires, and he is currently an
International Law professor in the Escuela Superior de
Guerra.
Diego Federico Cerdeiro
holds a degree
in Business Administration from the Universidad de San Andrés,
a post-graduate degree in Finance of the same university and a MBA
from the Wharton School of the University of Pennsylvania. From
1998 to 2005, he worked as senior credit officer at the branch of
Bayerische Vereinsbank AG (now Unicredit) in Argentina. From 2007
to 2017 he worked in the United States at Morgan Stanley, McKinsey
& Co., and served as CFO and Director of ChenMed, a fast
growing healthcare company. In 2017, Federico returned to Argentina
as CFO of Biosidus and since 2018, he serves as director of a
Family Office where he manages a portfolio of companies and
investments.
162
Jorge Eduardo Villegas
holds a degree in law from the Universidad de Buenos Aires. Since
his graduation, he has worked as a lawyer in the private sector,
independently through his own law firm, Estudio Jorge Villegas
& Asociados. Mr. Villegas also currently serves as the chairman
of Agropecuaria Los Potros S.A.
Cristian López
Saubidet
holds a degree in Industrial Engineering from the
Instituto Tecnol
ó
gico de
Buenos Aires (ITBA) and a Master
’
s degree in Business Administration
from the University of California, Los Angeles. He has been a
member of our Board of Directors since 2009. From 2005 to 2008, he
worked for HSBC USA Inc. within the consumer loans and mortgages
group. From 1998 to 2005, Mr. Saubidet worked as a consultant at
Mckinsey & Co. He serves as director in many companies,
including Patagonia Gold S.A., Agropecuaria Cantomi S.A., Minera
Aquiline Argentine S.A., Minera Minamalu S.A., Huemeles S.A.,
Cheyenne S.A., Plusener S.A., MB Holding S.A., LBH Inc., Lagonda
Commercial and San Miguel S.A., in which he has been member of the
executive committee since 2014, and as an alternate director of
Delta del Plata S.A.
Liliana Amelia Murisi
holds a degree in Accounting from the Universidad Nacional de
C
ó
rdoba and a
post-graduate degree in Financial Administration of Public Sector
from the Universidad Nacional del Comahue. Since December 2015, she
serves as the Undersecretary of the Undersecretariat of Public
Revenues of the Neuquén Province. From 2007 to 2015, she
served as administrative assistant of the Neuqu
é
n Province Legislature. From 1997 to
2007, she served as auditor of the Court of Accounts of the
Province of Neuqu
é
n. From
2004 to 2005, she served as professor of public finances at Centro
de Estudios Terciarios Norpatag
ó
nicos and as a judicial expert in
labor matters.
Enrique Gonzalo
Ballester
holds a degree in Economics from the Universidad
Cat
ó
lica Argentina and a
Master of Science (MSc) of the University of London. From 1995 to
2016, he served as senior operator in the department of finance of
Banco de Galicia y Buenos Aires S.A. Since 1990, he has served as
director of various companies, including Quenuma S.A., Lanceros
Civicos S.A. y Guardia Cívica S.A. He currently serves as an
alternate director of Lanceros Civicos S.A.
Justo Pedro Sáenz
completed the
“
Advanced
Management Program
”
at
The Wharton School, University of Pennsylvania in the United
States. He has served as alternate director of our Board of
Directors since 2008. From 2007 to 2016, he served as
administration and human resources manager of Central Puerto, and
since 2016 he serves as administration manager of Central Puerto.
From 2005 to 2007, he worked at Cima Investments in the new
business area. From 2003 to 2005, he served as Chief Financial
Officer of Banco de Servicios y Transacciones S.A. In 2002, he
co-founded Idun Inversiones S.A. From 2000 to 2001, he held the
position of partner and finance manager of Softbank Latin America
Ventures, Venture Capital Fund. From 1984 to 2000, he worked at
Merchant Bankers Asociados, MBA Banco de Inversiones and MBA
Sociedad de Bolsa. He has been a partner of Merchant Bankers
Asociados since 1992, which was affiliated with Salomon Brothers
and the investment company of Nicholas Brady, former U.S. Secretary
of Treasury. In addition, he currently serves as a director of
Proener S.A.U., and as an alternate director of IGCU, IGCE, DGCU,
DGCE, Parques E
ó
licos
Australes S.A., CP Renovables, CP Patagones S.A.U., CP Achiras
S.A.U., CP La Castellana .S.A.U., CPR Energy Solutions S.A.U.,
Vientos La Genoveva S.A.U., Vientos La Genoveva II S.A.U., CP
Manque S.A.U. y CP Los Olivos S.A.U.
Marcelo Suvá
holds
a degree in Economics from the Universidad Cat
ó
lica Argentina. He has served as
alternate director of our Board of Directors since 2008. He was
shareholder of Coinvest S.A., a private equity company, as well as
of MBA Banco de Inversiones S.A. (currently known as Lazard
Argentina S.A.), a leading Argentine investment bank in financial
counseling, where he also was member of its board of directors and
took part in various M&A transactions. He also served as
director of HNQ. In addition, he serves as a manager and director
of RMPE, as an alternate director of RPE Distribuci
ó
n S.A., Hidro Distribución S.A.,
IGCU, IGCE, DGCU, DGCE, and as chairman of RPM Gas S.A. He is also
vice-chairman of ACES (
Asociación Civil de Estudios
Superiores
), a non-profit organization that owns the
Universidad Austral, where he also serves as a member of the
University’s management board and chairman of its Audit and
Finance Committee.
Pablo Javier Vega
holds
a degree in Industrial Engineering from the Universidad
Cat
ó
lica Argentina. He has
served as alternate director of our Board of Directors since 2015.
He has previous work experience at Empresa Provincial de
Energía de Neuqu
é
n
(EPEN) and the Planification and Action for Development Council
(COPADE). In addition, from January 2004 to April 2005, he served
as mining executive manager of the Mining and Electricity
Provincial Agency of Neuqu
é
n Province. From 2015 to 2017, he
served as technical coordinator in the Ministry of Energy, Natural
Resources and Public Services of the Province of Neuqu
é
n, and he is currently the
Coordinator of the Public Services department of the General and
Public Services Secretariat
of the Province of
Neuqu
é
n
.
163
Juan Pablo Gauna Otero
holds a degree in Accounting from the Universidad Argentina JF
Kennedy. In addition, he took graduate level courses in Executive
Business Administration in IAE Business School, GIP program in
strategy at Harvard Business School, GIP program in innovation
(IESE University, New York) and holds a post-graduate degree from
the University of Buenos Aires in administration and management of
SMEs (small and medium-sized enterprises). From 1997 to 2002, he
served as senior accountant of Banco Privado de Inversiones. From
2003 to 2009, he served as finance manager of Big Bloom SA (Wanama
and John L Cook). From 2010 to 2012, he served as finance manager
of BTM Argentina. He is currently a member of the boards of
directors of the following companies: Patagonia Gold S.A. (mining),
Minera Minamalu S.A. (mining), Cheyenne S.A. (air taxi services),
Plusener S.A. (energy) and MB Holding S.A., Huemeles SA (mining),
Leleque Explotación (mining), Agropecuaria Cantomi SA,
(real state), Enter Bar Sa (polo club), as well as a syndic of
Minera Aquiline Argentina S.A. and
Delta del Plata
S.
A. In addition, Mr.
Otero currently serves as accountant of Agropecuaria Cantomi
S.A.
Duties and Liabilities of Directors
Directors have the
obligation to perform their duties with the loyalty and the
diligence of a prudent business person. Under Section 274 of the
Argentine Corporate Law, directors are jointly and severally liable
to the company, the shareholders and third parties for the improper
performance of their duties, for violating any law or the bylaws or
regulations, if any, and for any damage to these parties caused by
fraud, abuse of authority or gross negligence. The following are
considered integral to a director
’
s duty of loyalty: (i) the
prohibition on using corporate assets and confidential information
for private purposes; (ii) the prohibition on taking advantage, or
allowing another to take advantage, by action or omission, of the
business opportunities of the corporation; (iii) the obligation to
exercise board powers only for the purposes for which the law, the
corporation
’
s bylaws or
the shareholders
’
or the
board of directors
’
resolutions were intended; and (iv) the obligation to take strict
care so that acts of the board do not go, directly or indirectly,
against the corporation
’
s
interests. A director must inform the board of directors and the
Supervisory Committee of any conflicting interest he or she may
have in a proposed transaction and must abstain from voting
thereon.
In general, a
director will not be held liable for a decision of the board of
directors, even if that director participated in the decision or
had knowledge of the decision, if (i) there is written evidence of
the director
’
s opposition
to the decision and (ii) the director notifies the Supervisory
Committee of that opposition. However, both conditions must be
satisfied before the liability of the director can be contested
before the board of directors, the Supervisory Committee or the
shareholders or relevant authority or the commercial
courts.
Section 271 of the
Argentine Corporate Law allows directors to enter into agreements
with the company that relate to such director
’
s activity and under
arms
’
length conditions.
Agreements that do not satisfy any of the foregoing conditions must
have prior approval of the board of directors (or the Supervisory
Committee in the absence of board quorum), and must be notified to
the shareholders at a shareholders
’
meeting. If the shareholders reject
the agreement, the directors or the members of the supervisory
committee, as the case may be, shall be jointly and severally
liable for any damages to the company that may result from such
agreement. Agreements that do not satisfy the conditions described
above and are rejected by the shareholders are null and void,
without prejudice to the liability of the directors or members of
the Supervisory Committee for any damages to the
company.
The acts or
agreements that a company enters into with a related party
involving a relevant amount shall fulfill the requirements set
forth in Section 72 and 73 of Law No. 26,831. Under Section 72, the
directors and syndics (as well as their ascendants, descendants,
spouses, brothers or sisters and the companies in which any of such
persons may have a direct or indirect ownership interest) are
deemed to be a related party. A relevant amount is considered to be
an that which exceeds 1.00% of the net worth of the company as per
the latest balance sheet. The board of directors or any of its
members shall require from the audit committee a report stating if
the terms of the transaction may be reasonably considered adequate
in relation to normal market conditions. The company may proceed
with the report of two independent evaluating firms that shall have
informed them about the same matter and about the other terms of
the transaction. The board of directors shall make available to the
shareholders the report of the audit committee or of the
independent evaluating firms, as the case may be, at the main
office on the business day after the board
’
s resolution was adopted and shall
communicate such fact to the shareholders of the company in the
respective market bulletin. The vote of each director shall be
stated in the minutes of the board of directors approving the
transaction. The transaction shall be submitted to the approval of
the shareholders of the company when the audit committee or both
evaluating firms have not considered the terms of the transaction
to be reasonably adequate in relation to normal market conditions.
In the case where a shareholder demands compensation for damages
caused by a violation of Section 73, the burden of proof shall be
placed on the defendant to prove that the act or agreement was in
accordance market conditions or that the transaction did not cause
any damage to the company. The transfer of the burden of proof
shall not be applicable when the transaction has been approved by
the board of directors with the favorable opinion of the audit
committee or the two evaluating firms.
We may initiate
causes of action against directors if so decided at a meeting of
the shareholders. If a cause of action has not been initiated
within three months of a shareholders
’
resolution approving its
initiation, any shareholder may start the action on behalf of and
on the company
’
s account.
A cause of action against the directors may be also initiated by
shareholders who object to the approval of the performance of such
directors if such shareholders represent, individually or in the
aggregate, at least 5.00% of the company
’
s capital stock.
164
Except in the event
of our mandatory liquidation or bankruptcy, shareholder approval of
a director
’
s performance,
or express waiver or settlement approved by the
shareholders
’
meeting,
terminates any liability of a director vis-
à
-vis the company, provided that
shareholders representing at least 5.00% of the company
’
s capital stock do not object and
provided further that such liability does not result from a
violation of law or the company
’
s bylaws.
Under Argentine
law, the board of directors is in charge of the company
’
s management and administration and,
therefore, makes any and all decisions in connection therewith, as
well as those decisions expressly provided for in the Argentine
Corporate Law, the company
’
s bylaws and other applicable
regulations. Furthermore, the board of directors is responsible for
the execution of the resolutions passed in shareholders
’
meetings and for the performance of
any particular task expressly delegated by the
shareholders.
Meetings, Quorum, Majorities
Pursuant to Section
23 of our bylaws, our Board of Directors
’
meetings require a quorum of an
absolute majority of its members. Our Board of Directors functions
and acts upon the majority vote of its members present at its
meetings either physically or via videoconferencing.
Our Board of
Directors
’
minutes must
be drafted and signed by directors and syndics who are present at
the meeting within five days from the date on which it was held.
Members of our Supervisory Committee must register in the minutes
the names of the directors who have participated in the meeting
remotely and that the decisions made therein were made in
accordance with the law. The minutes must include the statements
from directors participating in person and remotely and must state
their respective votes on each decision made.
The chairman, or
the individual acting in lieu of the chairman pursuant to
applicable law, may call meetings when deemed convenient, or when
so required by any director or the supervisory committee. The
meeting must be called within five days from the request;
otherwise, the meeting may be called by any of the directors. Our
Board of Directors
’
meetings must be called in writing and notice thereof must be given
to the address reported by each director. The notice must indicate
the date, time and place of the meeting and the meeting agenda.
Business that is not included in the notice may be discussed at the
meeting only to the extent all permanent directors are present and
have cast their unanimous vote.
Compensation
Our shareholders
fix our directors
’
compensation, including their salaries and any additional wages
arising from the directors
’
permanent performance of any
administrative or technical activity. Compensation of our directors
is regulated by the Argentine Corporate Law and the CNV
regulations. Any compensation paid to our directors must have been
previously approved at an ordinary shareholders
’
meeting. Article 261 of the
Argentine Corporate Law provides that the compensation paid to all
directors and syndics in a year may not exceed 5.00% of net income
for such year, if the company is not paying dividends in respect of
such net income. The Argentine Corporate Law increases the annual
limitation on director compensation to up to 25.00% of net income
based on the amount of dividends, if any, that are paid. In the
case of directors that perform duties at special commissions or
perform administrative or technical tasks, the aforementioned
limits may be exceeded if a shareholders
’
meeting so approves, such issue is
included in the agenda, and is in accordance with the regulations
of the CNV. In any case, the compensation of all directors and
members of the Supervisory Committee requires
shareholders
’
ratification at an ordinary shareholders
’
meeting.
Certain of our
directors perform managerial, technical and administrative
functions. We compensate directors who perform such functions for
their roles both as directors and as executive
officers.
During the annual
ordinary shareholders
’
meeting convened for April 30, 2019, the shareholders will consider
the approval of the directors
’
fees that amounted to a total of
Ps. 6,355,140.11 for services rendered in 2018, which were paid in
2018.
As of the date of
this annual report, neither we, nor any of our affiliates, have
entered into any agreement that provides for any benefit or
compensation to any director after expiration of his or her
term.
Independence Criteria of Directors
In accordance with
the provisions of Section 4, Chapter I, Title XII
“
Transparencia en el
Ámbito de la Oferta Pública
”
and Section 11, Chapter III, Title
II
“Órganos de
Administración y Fiscalización, Auditoría
Externa
”
of the
CNV rules, we are required to report to the
shareholders
’
meeting,
prior to vote the appointment of any director, the status of such
director as either
“
independent
”
or
“
non-independent.
”
At present Juan Jos
é
Salas, Miguel Dodero, Gonzalo
Sundblad, Jorge Eduardo Villegas, Cristian L
ó
pez Saubidet, Mario Luis Espada,
Liliana Murisi, Gonzalo Ballester, Juan Carlos Martín Casas,
Pablo Javier Verga, Juan Pablo Gauna Otero and Pablo Hourbeigt are
independent members of our Board of Directors according to the
criteria established by the CNV, which may differ from the
independence criteria of the NYSE and NASDAQ. See
“—
Audit Committee
”
for further details about
independence requirements of the members of our Audit Committee at
the time of the offering.
165
Corporate Governance
We have adopted a
corporate governance code to put into effect corporate governance
best practices, which are based on strict standards regarding
transparency, efficiency, ethics, investor protection and equal
treatment of investors. The corporate governance code follows the
guidelines established by the CNV. We have also adopted a Code of
Business Conduct designed to establish guidelines with respect to
professional conduct, morals and employee performance.
Senior Officers
The following table
sets forth the current composition of our management
team:
|
Name
|
Title
|
Date of first appointment to position
|
Date of Birth
|
|
Jorge
Rauber
|
CEO
|
2017
|
July 18,
1969
|
|
Fernando Roberto
Bonnet
|
CFO
|
2010
|
March 23,
1977
|
|
Eduardo
Nitardi
|
Engineering
Director
|
2016
|
July 18,
1955
|
|
Alberto Francisco
Minnici
|
Production and
Combined Cycle Plant Manager
|
2015
|
April 14,
1965
|
|
Jos
é
María Saldungaray
|
Planning
Manager
|
2014
|
February 18,
1967
|
|
Justo Pedro
S
á
enz
|
Administration
Manager
|
2007
(1)
|
May 2,
1958
|
|
Jos
é
Manuel Pazos
|
General Counsel,
Head of Legal Area
|
2015
|
September 14,
1971
|
|
Rub
é
n Omar L
ó
pez
|
Strategic Planning
Director
|
2019
|
April 17,
1964
|
|
Gabriel Omar
Ures
|
Commercial
Manager
|
2018
|
December 31,
1978
|
|
Leonardo
Marinaro
|
Legal Affairs
Manager
|
2007
|
April 25,
1963
|
|
Javier Alejandro
Torre
|
Human Resources
Manager
|
2016
|
April 19,
1967
|
|
Rub
é
n V
á
zquez
|
Renewable Energy
Manager
|
2015
|
March 5,
1962
|
(1) From 2007
to 2016, he served as administration and human resources manager of
Central Puerto, and since 2016 he serves as administration manager
of Central Puerto.
The following are
the academic and professional backgrounds of our senior management.
The business address of each of the members of our senior
management team is Avda. Thomas Edison 2701, Buenos Aires,
Argentina.
Fernando Roberto Bonnet
holds a degree in Accounting from the Universidad Nacional de
Buenos Aires. In addition, from 2009 to 2010, he took a graduate
level course in Executive Business Administration in IAE Business
School, Universidad Austral. He has served as CFO of our company
since 2010 and, from 2008 to 2010, he also served as tax manager.
He served as tax manager of Ernst & Young Argentina. Mr. Bonnet
currently serves as vice-chairman of Proener S.A.U. He currently
serves as an alternate director of CP Renovables S.A., Parques
Eólicos Australes S.A., CP Achiras S.A.U., CPR Energy
Solutions S.A.U., CP La Castellana S.A.U., CP Patagones S.A.U.,
Vientos La Genoveva S.A.U., Vientos La Genoveva II S.A.U., Central
Aimé Painé S.A., CP Manques S.A.U. and CP Los Olivos
S.A.U.
Eduardo Luis Nitardi
holds a degree in Mechanical-Electric Engineering from the
Universidad Nacional de C
ó
rdoba. In addition, from March 1999
to November 2000, he took a graduate level course of Master in
Administration of the WEM in Instituto Tecnol
ó
gico de Buenos Aires. From March 2002
to November 2002, Mr. Nitardi took a graduate level course in
Direction Development in IAE Business School, Universidad Austral.
Mr. Nitardi has 39 years of experience in the electric power
industry both in the transmission and electric power generation
segments. He has served as Central Puerto
’
s Engineering Director since 2016.
Previously, he served as CEO of CVOSA from 2012 to 2015, planning
and works manager of Central Puerto since 2011 to 2012, and
Technical Director in Transener S.A. since 2008 to 2011. He served
as technical manager in the same company since 1997 to
2008.
Alberto Francisco
Minnici
holds a degree in Electrical Engineering from the
Universidad Tecnol
ó
gica
Nacional. Mr. Minnici has 31 years of experience in the electric
power industry. He has served as Central Puerto
’
s Production and Combined Cycle
Plant Manager since 2015. Previously, he served as Plant Operations
Manager of the Puerto Complex from 2012 to 2015 and as Plant
Operations Manager of the combined cycle plant of the Puerto
Complex located in the City of Buenos Aires from 2008 to 2012,
among other positions within Central Puerto.
166
José María
Saldungaray
holds a degree in Electrical Engineering from
the Universidad Nacional del Sur, Bahía Blanca, Argentina. He
has been our planning manager since 2014. He currently serves as
director of Proener S.A.U. He also served as commercial manager of
HPDA and was a member of the board of directors of Centrales
Térmicas Mendoza S.A. and La Plata Cogeneración
S.A.
José Manuel Pazos
holds a degree in law from the Universidad Cat
ó
lica Argentina. He also holds a
postgraduate degree in Utilities
’
Economic Regulation from the
Universidad Austral. He served as alternate director of our Board
of Directors from September 2015 to April 2018. From 1997 to 2002,
he served as lawyer of the Argentine Energy Secretariat and
Emprendimientos Binacionales S.A. (EBISA), and, from 2003 to 2014,
he worked for the law firm, Bruchou, Fern
á
ndez Madero & Lombardi. Between
2007 and 2008, he worked for Simpson Thacher & Bartlett LLP in
New York. Currently he serves as director of Termoeléctrica
Manuel Belgrano S.A. and alternate director of Distrilec Inversora
S.A., CP Renovables S.A., Parques Eólicos Australes S.A., CP
Achiras S.A.U., CPR Energy Solutions S.A.U., CP La Castellana
S.A.U., CP Patagones S.A.U., Vientos La Genoveva S.A.U., Vientos La
Genoveva II S.A.U., CP Manque S.A.U. y CP Los Olivos
S.A.U.
Leonardo Marinaro
holds
a degree in law from the Universidad Cat
ó
lica Argentina. He has been our legal
affairs manager since 2007. Mr. Marinaro has served as director of
La Plata Cogeneraci
ó
n
S.A., CTM and Edesur S.A. He is currently a director of CP
Renovables S.A., Parques Eólicos Australes S.A., Vientos La
Genoveva S.A.U. and Vientos La Genoveva II S.A.U., and alternate
director of Proener S.A.U., Central Vuelta de Obligado S.A., TMB,
TJSM, Central Aimé Painé S.A., DGCE, IGCE, IGCU and
Energía Sudamericana S.A.
Rubén Vázquez
holds a degree in Electrical Engineering from the Universidad
Tecnol
ó
gica Nacional
Facultad Regional Buenos Aires. He has been our renewable energy
manager since 2015. He has more than 30 years of experience in
utilities where he held different positions both in technical and
commercial areas and gained international utilities experience. He
served as commercial and marketing director of Edesur from 2014 to
2015 and is a member of the board of directors of Distrilec
Inversora S.A. In addition, he currently serves as chairman of CP
Manque S.A.U., CP Los Olivos S.A.U., CPR Energy Solutions S.A.U.,
CP La Castellana S.A.U., CP Patagones S.A.U.
Gabriel Omar Ures
holds a degree in
System Engineer from the Universidad Abierta Interamericana. He
also holds a Postgraduate degree in Gas and Electricity
Administration in InstitutoTecnológico de Buenos Aires (ITBA)
and a Management Program at the Darden Business School of the
University of Virginia, United States. He started his professional
career in 1997 and has over 21 years of experience working in the
power sector of Argentina. Among other positions, he held
managerial positions in Hidroeléctrica Alicura, was commercial
director of AES Argentina Generación, General Manager of
Termoeléctrica Manuel Belgrano (from 2013 to 2018), Commercial
Manager in Central Dock Sud (YPF). Additionally, he was a director
of various companies and industry chambers, including AGEERA
(
Asociación de Generadores de
Energía Eléctrica de la República Argentina
)
where he has been elected as President for 5 consecutive terms
(2012/2017) after holding the Vice Presidency.
For the biography
of Mr. Jorge Rauber, Justo Pedro S
á
enz, Rubén Omar López and
Javier Alejandro Torre see
“—
Board of
Directors.
”
Compensation
In 2018, our
management received compensation and fees totaling Ps.
67,547,542 (in nominal values)
, of which
Ps.
14,851,966
consisted of an
annual bonus. The annual bonus to management is normally between
three and four times their salaries and is based on certain
performance thresholds related to the amount of work performed and
the importance of such work to our business. We also compensate
directors who perform managerial, technical and administrative
functions for their roles both as directors and as executive
officers.
Audit Committee
Under the SEC rules
applicable to corporate governance, we are required to maintain an
audit committee.
Pursuant to Law No.
26,831 and its implementing regulations, we are required to have an
audit committee consisting of at least three members of our Board
of Directors with experience in business, finance, accounting,
banking and audit matters. Under CNV regulations, at least a
majority of the members of the audit committee must be independent
directors under CNV standards.
On April 16, 2017,
CNV issued Resolution No. 730/2018, which modified the criteria and
requirements applicable for directors of companies admitted to the
public offering regime of its shares. The main changes introduced
by Resolution No. 730/2018 are as follows:
167
● Independent
directors will cease to be independent after 10 years of holding a
position of director, but will be eligible to return to their
independent status three years after leaving office.
● The
threshold constituting a “significant participation”
has been reduced from a 15% holding of capital stock to a 5%
holding of capital stock;
● The
following criteria preclude a person from being considered
“independent”: (i) being connected with the company or
the company´s shareholders that have (direct or indirect)
significant participations, or being connected with companies in
which the aforementioned shareholders have (direct or indirect)
significant participations; (ii) maintaining a frequent
professional relation, of relevant nature and volume, with, or
receiving remuneration or fees from, the company, its shareholders
who have a (direct or indirect) significant participation, or
companies in which the aforementioned shareholders have (direct or
indirect) significant participations; (iii) maintaining a
significant participation, through the possession of shares of the
capital stock and/or the votes, in the company and/or in another
company in which the company has a significant participation; (iv)
on a regular basis, selling and/or providing goods and/or services
of relevant nature and volume (directly or indirectly) to the
company or to shareholders that have (direct or indirect)
significant participations; (v) being the director, CEO,
administrator or principal executive for a non-profit organization
which has received funds in amounts exceeding those established by
Resolution No. 30/2011 of the UIF (currently equivalent to
Ps.300,000) from the company or its parent company; (vi) receiving
any payments from the company or companies of the same group other
than fees as a director or dividends as shareholder; and (vii)
being a member of the administrative or supervisory committee
and/or holding a significant participation (directly or indirectly)
with respect to one or more companies that are registered as Agente
de Negociación, Agente de Liquidación y Compensación
y/o Agente de Corretaje de Valores Negociables.
It is necessary to
comply with all the conditions of independence set forth above for
at least three years before the appointment. Our Audit Committee is
composed of three members designated by our Board of Directors who
are financially literate. Mr. Oscar Gosio, Mr. Miguel Dodero, Mr.
Tomas White, Mr. Juan José Salas and Mr. Diego Petracchi are
independent under Rule 10A-3 under the Exchange Act (
“
Rule 10A-3
”
) and applicable NYSE standards,
which are different from the general test for independence of board
and committee members. Our board of directors has determined that
Mr. Miguel Dodero qualifies as a financial expert within the
meaning of the rules adopted by the Comission relating to the
disclosure of financial experts on audit committees in periodic
filings pursuant to the Exchange Act.
Independence Requirements under Commission Rule 10-A3
Pursuant to NYSE
Rule 303A.06, we are required to have an audit committee that
complies with Rule 10-A3. Under rule 10-A3, we are required to
comply with certain independent standards. Each member of the audit
committee must be independent and a member of the board of
directors. Pursuant to Rule 10-A3, in order to be considered
“
independent
”
, a member of an audit committee of
a listed issuer may not, other than in his or her capacity as a
member of the audit committee, the board of directors, or any other
board committee:
● accept
directly or indirectly any consulting, advisory, or other
compensatory fee from the issuer or any subsidiary thereof.
Compensatory fees do not include the receipt of fixed amounts of
compensation under a retirement plan (including deferred
compensation) for prior service with the listed issuer (provided
that such compensation is not contingent in any way on continued
service); or
● be an
affiliated person of the issuer or any subsidiary
thereof.
Additionally, as of
the date of this annual report, all members of our Audit Committee
satisfy the independence requirements of the Commission and NYSE
applicable to the audit committees of foreign private issuers. The
members of our Audit Committee are entitled to annual compensation
in the form of a fixed salary. Our Audit Committee also has two
alternate members, and both are independent under Rule 10A-3 and
applicable NYSE standards.
A quorum for a
decision by the Audit Committee will require the presence of a
majority of its members and matters will be decided by the vote of
a majority of those present at the meeting. A chairman of the
committee must be appointed during the first meeting after members
of the committee have been appointed. The chairman of the committee
may cast two votes in the case of a tie. Pursuant to our bylaws,
the committee will pass resolutions by the affirmative vote of the
majority of members present. Decisions of the Audit Committee will
be recorded in a special corporate book and will be signed by all
members of the committee who were present at the meeting. Pursuant
to Section 17 Chapter III Title II of the CNV rules, the Audit
Committee must hold at least one regularly scheduled meeting every
three months.
Pursuant to Law No.
26,831, the Audit Committee, among other things:
168
● advises
on the Board of Directors
’
proposal for the designation of
external independent accountants and ensure their
independence;
● oversees
our internal control mechanisms and administrative and accounting
procedures and assesses the reliability of all financial and other
relevant information filed with the CNV and other entities to which
we report;
● oversees
our information policies concerning risk management;
● provides
the market with complete information on transactions in which there
may be a conflict of interest with members of our various corporate
bodies or controlling shareholders;
● advises
on the reasonableness of fees or stock option plans for our
directors and managers proposed by the Board of
Directors;
● advises
on our fulfillment of legal requirements and the reasonableness of
the terms of the issuance of shares or other instruments that are
convertible into shares in cases of capital increase in which
pre-emptive rights are excluded or limited;
● verifies
the fulfillment of any applicable rules of conduct;
and
● issues
opinions on related-party transactions under certain circumstances
and files such opinions with regulatory agencies as required by the
CNV in the case of possible conflicts of interest.
Additionally, the
Audit Committee is required to prepare an annual working plan and
present it to the Board of Directors and the Supervisory Committee.
Members of the Board of Directors, members of the Supervisory
Committee and external independent accountants are required to
attend the meetings of the Audit Committee if the Audit Committee
so requests it, and are required to grant the Audit Committee full
cooperation and information. The Audit Committee is entitled to
hire experts and counsel to assist it in its tasks and has full
access to all of our information and documentation.
The following chart
shows the members of our Audit Committee according to the
resolution passed at the Board of Directors
’
meeting held on May 14,
2018:
|
Name
|
Title
|
Date of first appointment to position
|
Date of birth
|
Status
(1)
|
|
Oscar Luis
Gosio
|
Chairman
|
July 12,
2007
|
August 17,
1954
|
Independent
|
|
Miguel
Dodero
|
Member
|
May 6,
2016
|
February 16,
1955
|
Independent
|
|
Tomás
José White
|
Member
|
May 14,
2018
|
May 18,
1957
|
Independent
|
|
Juan
Jos
é
Salas
|
Alternate
Member
|
May 6,
2016
|
February 23,
1960
|
Independent
|
|
Diego
Petracchi
|
Alternate
Member
|
May 14,
2018
|
July 17,
1972
|
Independent
|
(1) Status
based on rules of the CNV and the Commission.
For the biographies
of the members of our Audit Committee, see
“—
Board of
Directors.
”
Supervisory Committee
We have a
monitoring body called the supervisory committee (
“
Supervisory Committee
”
). Our Supervisory Committee
consists of three syndics and three alternate syndics appointed by
shareholders at our annual ordinary shareholders
’
meeting. The syndics and their
alternates are elected for a period of one year, and are vested
with the powers set forth by Law No. 19,550 and other applicable
legal provisions. Any compensation paid to our syndics must have
been previously approved at an ordinary shareholders
’
meeting. The term of office of the
members of the Supervisory Committee expires on December 31,
2018.
Members of our
Supervisory Committee are also authorized to attend Board of
Directors
’
and
shareholders
’
meetings,
call extraordinary shareholders
’
meetings and investigate claims
brought in writing by shareholders who own more than 2.00% of our
outstanding shares. Pursuant to the Argentine Corporate Law, only
lawyers and accountants admitted to practice in Argentina and
domiciled in Argentina or civil partnerships composed of such
persons may serve as syndics in an Argentine
sociedad anónima
,
or limited liability corporation. Following the registration of the
2016 Merger, members of our Supervisory Committee may call for an
ordinary shareholders
’
meeting, in the specific cases provided by law, as deemed necessary
by any of them, or otherwise when so required by shareholders
representing no less than 5.00% of our capital stock. Pursuant to
Section 294 of the Argentine Corporate Law, our Supervisory
Committee must review our books and records, when deemed convenient
and at a minimum on a quarterly basis.
169
Following the
registration of the amendment to our bylaws dated June 3, 2015, our
Supervisory Committee holds meetings and makes decisions with the
presence and affirmative vote of at least two of its members,
notwithstanding the rights granted by law to the dissenting syndic.
Before the registration of the 2016 Merger, meetings of the
Supervisory Committee could be called by any of its members, its
meetings were held with the attendance of all of its members and
decisions were adopted by a majority of votes, notwithstanding the
rights granted by law to the dissenting syndic.
Our Supervisory
Committee must hold meetings at least once a month. Meetings may
also be called at the request of any of its members within five
days from the date the request is submitted to the chairman of our
Supervisory Committee or our Board of Directors, as the case may
be. Notice of all meetings must be given in writing to the address
indicated by each syndic at the time of holding
office.
Our Supervisory
Committee must be presided over by one of its members, elected by a
majority of votes, at the first meeting held every year. At that
time, the member who will act in lieu of the chairman in his or her
absence shall also be elected. The chairman represents our
Supervisory Committee before our Board of Directors.
The following chart
shows the members of our Supervisory Committee according to the
resolution passed at the annual ordinary shareholders
’
meeting held on April 27, 2018.
According to Technical Resolution No. 15 of the Argentine
Federation of Professional Counsel of Economic Sciences and Section
III, Chapter III of Title II of the CNV rules, all of our syndics
and alternate syndics are independent.
|
Name
|
Office
|
Date of first appointment to position
|
Profession
|
Date of birth
|
|
Carlos C. Adolfo
Halladjian
|
Syndic
|
April 16,
2013
|
Public
Accountant
|
March 8,
1977
|
|
Eduardo Antonio
Erosa
|
Syndic
|
April 16,
2013
|
Public
Accountant
|
October 6,
1958
|
|
Juan Antonio
Nicholson
|
Syndic
|
April 27,
2018
|
Lawyer
|
July 21,
1947
|
|
Horacio Ricardo
Erosa
|
Alternate
Syndic
|
April 16,
2013
|
Public
Accountant
|
December 23,
1961
|
|
Carlos Adolfo
Zlotnitzky
|
Alternate
Syndic
|
September 21,
2015
|
Public
Accountant
|
April 4,
1981
|
|
Lucas
Nicholson
|
Alternate
Syndic
|
April 27,
2018
|
Lawyer
|
October 9,
1985
|
The following are
the academic and professional backgrounds of our Supervisory
Committee members:
Carlos C. Adolfo
Halladjian
holds a degree in Accounting,
magna cum laude
, from
the Universidad de Buenos Aires. He has served as a syndic of our
Supervisory Committee since 2013. He has been a partner of the
Halladjian y Asociados accounting firm since 2010. He serves as
syndic of the following companies: Proener S.A.U., CVOSA, TJSM,
Empresa Distribuidora Sur Sociedad An
ó
nima (EDESUR S.A), RPBC Gas S.A., CP
Renovables, Magna Asset Management S.A., Central Aim
é
Pain
é
S.A, CP La Castellana S.A.U., CP
Achiras S.A.U., PB Distribuci
ó
n S.A, RPE Distribución S.A., CP
Patagones S.A.U., Central Aimé Painé S.A., Vientos La
Genoveva S.A.U. and Vientos La Genoveva II S.A.U. and Parques
E
ó
licos Australes S.A., as
well as an alternate syndic of the following companies: IGCU, IGCE,
DGCU, DGCE, Energía Sudamericana S.A., COYSERV S.A., CP Manque
S.A.U. and CP Los Olivos S.A.U.
Eduardo Antonio Erosa
holds a degree in Accounting from the Universidad Cat
ó
lica Argentina in 1985. He has served
as a syndic of our Supervisory Committee since 2013. He currently
is President of the Board of Directors of Compa
ñ’
a Argentina de
Navegaci
ó
n de Ultramar
S.A. In addition, he is an alternate syndic of LE Capital S.R.L and
Central Aimé Painé S.A.
Horacio Ricardo Erosa
holds a degree in Accounting from the Universidad de Buenos Aires.
He has served as an alternate syndic of our Supervisory Committee
since 2013. He is currently Chairman of the board of directors of
Compa
ñ’
a Argentina
de Navegaci
ó
n de Ultramar
S.A. and also serves as syndic of LE Capital S.R.L. and Central
Aimé Painé S.A.
Carlos Adolfo
Zlotnitzky
holds a degree in Accounting from the Universidad
de Buenos Aires. He has served as an alternate syndic of our
Supervisory Committee since 2015. He works as an independent
accountant and tax and accounting advisor for both legal entities
and individuals. He currently serves as alternate syndic of DGCE,
DGCU, IGCU, IGCE, Central Aime Pain
é
S.A. ESSA, CP Manques S.A.U. and CP
Los Olivos S.A.U.
Juan Antonio Nicholson
holds a degree
in law from the Universidad de Buenos Aires, where he also was
adjunct professor of Commercial Law. He is partner at the law firm
Nicholson y Cano Abogados. He served as a director and syndic of
several companies. Since 2005 he has been a syndic of HSBC Bank
Argentina. He is also president of Pilará Golf Tenis Polo AC
and el Tunalito S.A. Since 2018 he serves as a member of our
Supervisory Committee.
Lucas Nicholson
holds
a degree in law from the Universidad del Salvador. In addition, he
took a graduate level course in legal framework of agribusiness in
the Universidad Austral. From 2011 to 2016, he worked at the law
firm Nicholson & Cano in their corporate and competition law
departments. In 2016, together with Santiago Williams and
Agustín Ibarzábal, he founded WIN Abogados. In addition,
he currently serves as syndic of IGCE, IGCU, Energía
Sudamericana S.A., DGCE, COyServ S.A., and, since 2018, alternate
syndic of Central Puerto S.A.
170
Compensation
During the annual
ordinary shareholders
’
meeting convened for April 30, 2019, the shareholders will consider
the approval of the Supervisory Committee
’
s fees of Ps. 637,500 for services
rendered in 2018.
Family Relationships
Mr. Eduardo Antonio
Erosa and Mr. Horacio Ricardo Erosa are brothers, and serve as
Syndic and Alternative Syndic, respectively, on our Supervisory
Committee. Mr. Juan Antonio Nicholson is the father of Lucas
Nicholson, and serve as Syndic and Alternate Syndic, respectively,
on our Supervisory Committee.
Share Ownership
The table below
sets forth information concerning the share ownership of our
directors and members of our administrative, supervisory or
management bodies as of April 25, 2019.
|
Name
|
Title
|
Shares
|
%
of shares
|
|
Marcelo
Suvá
|
Alternate
Director
|
1,500,000
|
0.10%
|
|
Diego Federico
Cerdeiro
|
Alternate
Director
|
15,000
|
0.00%
|
|
Rubén
Vázquez
|
Renewable Energy
Manager
|
7,000
|
0.00%
|
Employees
We had 803
employees as of December 31, 2018, 738 employees as of December 31,
2017, and 733 employees as of December 31, 2016.
The following table
breaks down the number of our employees and their affiliation with
unions for the periods indicated:
|
Year
|
Union
|
Puerto Complex
|
La Plata
|
Luján de Cuyo
|
Piedra del Águila
|
CP Renovables
|
CP La Castellana
|
CP Achiras
|
CVOSA
|
|
2015
|
Subtotal outside CBA
|
60
|
1
|
8
|
4
|
—
|
—
|
—
|
—
|
|
|
|
|
|
|
|
|
|
|
|
|
|
APSEE
|
104
|
4
|
—
|
—
|
—
|
—
|
—
|
—
|
|
|
LYF
|
368
|
23
|
—
|
—
|
—
|
—
|
—
|
—
|
|
|
FATLYF
|
—
|
—
|
91
|
47
|
—
|
—
|
—
|
—
|
|
|
APUAYE
|
—
|
—
|
15
|
5
|
—
|
—
|
—
|
—
|
|
|
Subtotal under CBA
|
472
|
27
|
106
|
52
|
—
|
—
|
—
|
—
|
|
|
Total
|
532
|
28
|
114
|
56
|
—
|
—
|
—
|
—
|
|
|
|
|
|
|
|
—
|
—
|
—
|
—
|
|
2016
|
Subtotal outside CBA
|
69
|
1
|
9
|
4
|
—
|
—
|
—
|
—
|
|
|
|
|
|
|
|
|
|
|
|
|
|
APSEE
|
106
|
3
|
—
|
—
|
—
|
—
|
—
|
—
|
|
|
LYF
|
359
|
23
|
—
|
—
|
—
|
—
|
—
|
—
|
|
|
FATLYF
|
—
|
—
|
91
|
47
|
—
|
—
|
—
|
—
|
|
|
APUAYE
|
—
|
—
|
16
|
5
|
—
|
—
|
—
|
—
|
|
|
Subtotal under CBA
|
465
|
26
|
107
|
52
|
—
|
—
|
—
|
—
|
|
|
Total
|
534
|
27
|
116
|
56
|
—
|
—
|
—
|
—
|
|
|
|
|
|
|
|
—
|
—
|
—
|
—
|
|
2017
|
Subtotal outside CBA
|
68
|
3
|
10
|
4
|
1
|
3
|
3
|
—
|
|
|
|
|
|
|
|
|
|
|
|
|
|
APSEE
|
104
|
2
|
—
|
—
|
—
|
—
|
—
|
—
|
|
|
LYF
|
360
|
23
|
—
|
—
|
—
|
—
|
—
|
—
|
|
|
FATLYF
|
—
|
—
|
89
|
47
|
—
|
—
|
—
|
—
|
|
|
APUAYE
|
—
|
—
|
16
|
5
|
—
|
—
|
—
|
—
|
|
|
Subtotal under CBA
|
464
|
25
|
105
|
52
|
—
|
—
|
—
|
—
|
171
|
|
Total
|
532
|
28
|
115
|
56
|
1
|
3
|
3
|
—
|
|
|
|
|
|
|
|
|
|
|
|
|
2018
|
Subtotal outside CBA
|
116
|
—
|
11
|
4
|
1
|
5
|
5
|
38
|
|
|
|
|
|
|
|
|
|
|
|
|
|
APJAE
|
—
|
—
|
—
|
—
|
—
|
—
|
—
|
6
|
|
|
APSEE
|
100
|
—
|
—
|
—
|
—
|
—
|
—
|
—
|
|
|
LYF
|
336
|
—
|
—
|
—
|
—
|
—
|
—
|
—
|
|
|
FATLYF
|
—
|
—
|
83
|
43
|
—
|
—
|
—
|
34
|
|
|
APUAYE
|
—
|
—
|
16
|
5
|
—
|
—
|
—
|
—
|
|
|
Subtotal under CBA
|
436
|
—
|
99
|
48
|
1
|
5
|
5
|
40
|
|
|
Total
|
552
|
—
|
110
|
52
|
1
|
5
|
5
|
78
|
Note: APSEE:
Asociación del Personal Superior de Empresas de
Energía
LYF:
Luz y Fuerza
FATLYF:
Federación Argentina de
Trabajadores de Luz y Fuerza
APUAYE:
Asociación de Profesionales
del Agua y la Energía Eléctrica
The collective
bargaining agreements (CBAs) entered into with the several unions
that have members working at our sites include the terms and
conditions that govern the employment contracts of the workers
affiliated with each of these unions. Some of the most relevant
terms and conditions of these agreements include the positions that
are included in and excluded from bargaining, work schedules,
salary levels and additional amounts payable on the basis of the
worker
’
s job, working
days and leaves, among other things.
Matters that are
not specifically agreed upon in collective bargaining are governed
by the applicable labor laws in Argentina.
The collective
bargaining agreements (CBAs) are entered into for a specific term
and may be renewed by the parties. If not renewed, they may remain
in place under the principle of survival of repealed laws set forth
in the CBA Law No. 14,250.
As of April 30,
2019, we had 1,514,022,256 outstanding shares of common stock with
a par value of Ps.1.00 per share. Each share of common stock is
entitled to one vote. We do not have any preferred shares
outstanding and only have one class of common shares outstanding.
8,851,848, or 0.58%, of our common shares are held by our
subsidiary, Proener S.A.U.
The following table
sets forth certain information known to us concerning the
beneficial ownership over 5% or more of our common shares as of
April 15, 2019 (except as set forth below).
|
Beneficial Owner
|
Shares
|
% of shares
|
|
Plusener
S.A.
(3)
|
158,073,984
|
10.44
%
|
|
Argentine
Government
|
124,949,112
|
8.25
%
|
|
Guillermo Pablo
Reca
(1)
(3)
|
176,225,624
|
11.64
%
|
|
Eduardo
Jos
é
Escasany
(3)
|
77,471,913
|
5.12
%
|
|
Senior
Management and Directors**
|
1,522,000
|
0.10
%
|
|
Other
Shareholders
(2)
|
975,779,623
|
64.45
%
|
|
Total
|
1,514,022,256
|
100.00
%
|
** Marcelo
Suvá, Diego Federico Cerdeiro and
Rubén
Vázquez
each own less than 1% of the outstanding common
stock.
(1) Guillermo
Pablo Reca also owns 273,418,197 ordinary class B shares in our
subsidiary, CP Renovables, which represents 29.81% of CP
Renovables
’
shares.
(2) No other
shareholder has beneficial ownership of more than 5% of our common
shares. None of our senior officers own any of our common
shares.
(3) According
to Schedules 13G filed with the Commission by each of the
beneficial owners on February 14, 2019.
On February 6,
2018, we completed our initial public offering on the
NYSE.
The table below
sets forth information regarding the changes in the percentage
ownership held by our major shareholders during the past three
years.
172
|
|
As of January
11, 2018
|
As of February
14, 2019
|
||
|
Shareholder
|
Number of shares
held
|
% of
shares
|
Number of shares
held
|
% of
shares
|
|
Guillermo Pablo
Reca(1)
|
206,325,624
|
13.63
%
|
176,225,624
|
11.64
%
|
|
Eduardo José
Escasany
|
154,201,690
|
10.18
%
|
77,471,913
|
5.12
%
|
(1)
Guillermo
Pablo Reca also owns 273,418,197 ordinary class B shares in our
subsidiary, CP Renovables, which represents 29.81% of CP
Renovables
’
shares.
As of April 12,
2019, we had approximately 30,709,183 ADSs
outstanding.
We are not able to
determine the number of record holders of our ADSs as of such date,
as we are only aware of the Depositary Trust Company and its
nominee as record holders. In addition, it is not practicable for
us to determine the number of our ADSs or common shares
beneficially owned in the United States. Likewise, we cannot
readily ascertain the domicile of the final beneficial holders
represented by ADS record holders in the United States or the
domicile of any of our foreign shareholders who hold our common
shares, either directly or indirectly.
As of the date of
this annual report, there are no agreements in place which, if
enforced on a subsequent date, may result in a change of
control.
On December 16,
2016, at a meeting of our shareholders, our shareholders decided to
reduce the voluntary reserve by Ps.1,324,769,474 and capitalize
such funds through the payment of a dividend in shares of seven new
shares of common stock with a par value of Ps.1.00 per share for
each outstanding share of common stock. Following such
capitalization and dividend of shares, and as of the date of this
annual report, we have 1,514,022,256 outstanding shares of common
stock with a par value of Ps.1.00 per share.
The table below
represents the evolution of our capital stock since January 1,
2015:
|
Date
|
Capital stock (Ps.)
|
Event
|
Controlling shareholders
|
|
March 11,
2016
|
189,252,782
|
2016 Merger (and
related capital decrease)
|
N/A
|
|
December 16,
2016
|
1,514,022,256
|
Capital Increase
and Share Dividend Distribution
|
N/A
|
Argentine corporate
law permits directors of a corporation to enter into transactions
with such corporation provided that any such transactions are
consistent with prevailing market practice. The Argentine
Securities Law provides that corporations whose shares are publicly
listed in Argentina must submit to their respective audit
committees for approval of any transaction with a related party
involving an amount that exceeds 1.00% of the
corporation
’
s net
worth.
Except as set forth
below and as otherwise permitted under applicable law, we are
currently not party to any transactions with, and have not made any
significant loans to, any of our directors, key management
personnel or other related persons, and have not provided any
guarantees for the benefit of such persons, nor are there any such
transactions contemplated with any such persons.
Management Assistance Agreement
A member of our
Board of Directors, Marcelo Suv
á
, is also a manager and director of
RMPE. In addition, Guillermo Pablo Reca holds a 70.65% interest in
RMPE and currently serves as regular director and chairman of RMPE.
RMPE (formerly known as SADESA Servicios S.A.) provides certain
administrative, financial, commercial, human resources and general
management services to us under the terms of the management
assistance proposal dated November 30, 2007, as amended and
assigned (the
“
Assistance
Proposal
”
). The
Assistance Proposal was valid for five years as of December 1,
2007, was automatically extended for another five-year period until
December 1, 2017 and has been extended recently for another
five-year period until December 1, 2022. We must pay a fee equal to
one and a half percent (1.50%) of our annual gross sales revenues
carried out as a result of our main activities. The amounts accrued
under this agreement in years ended December 31, 2018, 2017 and
2016 were Ps. 159.90 million, Ps. 142.26 million and Ps. 65.08
million, respectively. Other than the management assistance
services we receive from RMPE, a lease between us, as lessor, and
RMPE, as lessee, involving monthly payment of Ps.12,000, and the
directorship of three members of our Board of Directors, we have no
related party relationship with RMPE.
For more
information on the related party transactions, with RMPE, see Note
19 to our audited consolidated financial statements.
173
CP Renovables Shareholders Agreement
On January 18,
2017, we entered into a shareholders agreement with the minority
shareholder of CP Renovables (the
“
CPR Minority Shareholder
”
), which was amended and restated in
its entirety on November 28, 2018 (such shareholders agreement, as
amended and restated, the
“
CPR Shareholders
Agreement
”
). As of the
date of this annual report, we directly hold a 70.19% equity
interest in CP Renovables (class A shares), while the CPR Minority
Shareholder directly holds the remaining 29.81% equity interest
(class B shares). The board of directors of CP Renovables consists
of three members, two of which are appointed by us and one by the
CPR Minority Shareholder, and decisions are approved by a simple
majority of its members, with certain exceptions, as set forth
below.
The CPR
Shareholders Agreement regulates, among other things, the
governance of CP Renovables and its subsidiaries, the way that the
parties will evaluate and conduct new projects for investment in
electricity generation from renewable sources, and the transfer of
shares of CP Renovables (including a right of first offer, right of
first refusal and tag-along right). The CPR Shareholders Agreement
is also binding on future holders of CP Renovables class A and
class B shares.
The CPR
Shareholders Agreement grants protective minority rights to the
holders of class B shares, including (i) the right to designate at
least one director in CP Renovables and its subsidiaries and one
member of the Supervisory Committee of CP Renovables, and (ii) the
requirement of an affirmative vote from holders of class B shares
or the director elected by holders of class B shares, as
applicable, to take certain actions in CP Renovables and its
subsidiaries, including, to amend CP Renovables
’
bylaws, receive capital
contributions, undertake mergers or similar transactions, undertake
a public offering, distribute dividends, create liens, enter into
transactions with related parties, execute, terminate or amend the
material provisions of certain agreements, and entering into
certain debt and equity transactions.
The CPR
Shareholders Agreement also grants (i) class B holders a
registration right with respect to their shares in CP Renovables,
pursuant to which we are obliged (upon their request, at any time)
to cause the commencement of a secondary public offering of such
shares, including a penalty on us if we default on such obligation,
and (ii) the CPR Minority Shareholder purchase or sale options in
the event of (y) a “change of control” (as defined in
the CPR Shareholders Agreement) or (z) any person is required to
launch a mandatory tender offer with respect to Central
Puerto’s shares (see “Item 10.B. Memorandum and
articles of association—Mandatory Tender Offer
Regime”), including the method for the calculation of the
share price under such options, through independent valuation
firms.
On December 22,
2017, we entered into a Guarantee and Sponsor Support Agreements,
as part of the facility documents of the IIC—IFC Facilities
for CP La Castellana and CP Achiras. If the holders of class B
shares elect to exercise the call option in accordance with the CPR
Shareholders Agreement, such action could result in a breach of our
obligation to maintain certain equity stakes in CP Renovables, CP
La Castellana and CP Achiras under such agreement (for further
information see “Item 5.B. Liquidity and Capital
Resources—Indebtedness—Loans from the IIC—IFC
Facilities”).
The foregoing
description of CPR Shareholders Agreement and the rights contained
therein is qualified in its entirety by reference to the terms and
conditions of CPR Shareholders Agreement, which is filed as an
exhibit to this annual report.
CP Renovables Stock Option Agreement
On January 18,
2017, CP Renovables entered into a stock option agreement with its
chairman and general manager (or CEO), Guillermo Pablo Reca,
pursuant to a stock option plan approved by CP
Renovables
’
shareholders
on April 28, 2016. Under the stock option agreement, Guillermo
Pablo Reca has (a) the obligation, for a three-year term, to (i)
develop the CP Renovables business by, among other things,
facilitating investments, proposing acquisitions and business
opportunities for the expansion of renewable energy projects and
(ii) lead the development of the existing projects of CP
Renovables; and (b) the right to purchase up to 63,058,342 class B
shares of CP Renovables (the
“
initial option shares
”
) and an additional number of class
B shares equal to 10% of any increase in capital stock made after
the date of the stock option agreement (the
“
additional option shares
”
), in whole or in part, at any time
prior to the seventh anniversary of the date of the stock option
agreement. The total number of CP Renovables
’
shares that Mr. Reca is entitled to
purchase represents 10% of the fully diluted capital stock of CP
Renovables. The aggregate price for the initial option shares
(assuming all are purchased) is of U$$3,963,690. The price of any
additional option shares will be the U.S. dollar equivalent (based
on the exchange rate at the time of the relevant capital increase)
of the subscription price paid per share for the shares of CP
Renovables issued pursuant to such capital increase. The stock
option agreement includes adjustments and anti-dilution protections
including with respect to in-kind capital increases and dividend
distributions by CP Renovables and other transactions such as stock
splits and redenomination of par value. In addition, Mr. Reca can
assign his rights under the stock option agreement without the
consent of CP Renovables. In case the stock option agreement is
terminated by CP Renovables due to a breach by Mr. Reca of his
obligations during the three years following its execution, Mr.
Reca
’
s right to purchase
the initial option shares and the additional option shares will
vest proportionally based on the time that Mr. Reca served as
general manager (or CEO) of CP Renovables from January 18, 2017 to
January 18, 2020. As of the date of this annual report, the option
has neither been exercised nor assigned.
174
Not
applicable.
See Item 18 and our
audited consolidated financial statements as of December 31, 2018
and 2017 and for the years ended December 31, 2018, 2017 and 2016
included in this annual report.
Legal Proceedings
Income Tax for Fiscal Year 2014
In February 2015,
Central Puerto, for itself and as the successor company of
Hidroeléctrica Piedra del Águila (HPDA) (the merged
company) filed income tax returns for the nine-month period ended
September 30, 2014, applying the adjustment for inflation mechanism
established by the Argentine Income Tax Law. In addition, Central
Puerto filed its income tax return for the three-month period ended
December 31, 2014, applying the same adjustment for inflation
mechanism established by the Argentine Income Tax Law. As of the
date of this annual report, we do not expect that the Argentine tax
authorities, or ultimately, the Supreme Court will approve our
filed income tax return. Accordingly, as of December 31, 2018 and
2017, Central Puerto keeps recorded a provision for
Ps. 495,390 and Ps. 551,418, respectively, which had been
recognized during the year ended December 31, 2014.
Action for Recovery—Income Tax Refund for Fiscal Period
2010
In December 2014,
Central Puerto, as merging company and continuing company of HPDA,
raised a recourse action before fiscal authorities regarding the
income tax for the fiscal period 2010 that amounted to
Ps. 67,383 at historical values (Ps. 349,524 adjusted for
inflation), which was incorrectly entered by HPDA. This recourse
action seeks to recover the income tax entered by HPDA in
accordance with the lack of application of the inflation adjustment
mechanism established by the Law on Income Tax. In December 2015,
the three-month term stated by Law no. 11 683 elapsed, and Central
Puerto brought a contentious-administrative claim before the
National Court to ask for its right to recourse for an amount of
Ps. 67,612 at historical values (Ps. 350,712 adjusted for
inflation). In October 2018, Central Puerto was served notice of
the judgment issued by the Federal Contentious- Administrative
Court No. 5, which granted the right to recourse. The judgment
ordered tax authorities to return the amount of Ps. 67,612 (at
historical values) to Central Puerto plus the interest stated in
the BCRA Communication 14290 and ordered that legal cost must be
borne by the defendant. The tax administration appealed the
judgment passed by the court and the file is currently under
analysis by the Administrative Court of Appeals for the City of
Buenos Aires. Given the fact that, as of the fiscal year closing,
collection is not virtually certain, Central Puerto maintains the
accounting treatment not to recognize a credit for such
item.
Action for recovery - Income Tax Refund for Fiscal Years 2009, 2011
and 2012
In December 2015,
Central Puerto filed a petition with the Argentine tax authorities
for the recovery of income tax for the fiscal year 2009, in the
amount of approximately Ps. 119,117 which had been incorrectly paid
by Central Puerto in excess of our income tax liability. By filing
such action, we seek to recover the excess income tax paid by
Central Puerto due to the failure to apply the adjustment for
inflation set forth in the Argentine Income Tax Law. On April 22,
2016, after the three-month term required by Law No. 11,683
expired, Central Puerto filed an action for recovery for the amount
claimed with the Argentinean Tax Court. In December 2017, Central
Puerto filed a petition with the Argentine tax authorities for the
recovery of Ps. 242,371 paid in excess by Central Puerto for
payment of Income Tax for 2011 fiscal period, according to the
Central Puerto’s estimates. The purpose of such action is to
recover the income tax paid by Central Puerto due to the failure to
apply the adjustment for inflation set forth in the Argentine
Income Tax Law. In December 2018, Central Puerto, as merging
company and continuing company of HPDA, filed a petition with the
Argentine Tax Authorities for the recovery of Ps. 387,953 paid
in excess by Central Puerto and HPDA for payment of Income Tax for
2012 fiscal period, due to the failure to apply the adjustment for
inflation set forth in the Argentine Income Tax Law. As of the date
of this annual report, we do not expect that the Argentine Tax
Authorities, or ultimately, the Supreme Court will approve our
request for recovery of income tax we previously paid.
Consequently, no receivable was recognized in relation to this
matter.
Dividends and Dividend Policy
The holders of ADSs
are entitled to receive dividends to the same extent as the owners
of our common shares. We have not adopted a formal dividend policy.
In October 2016, our shareholders approved a distribution of
dividends in cash in the amount of Ps.2,565,065,935.06 which was
paid on November 7, 2016. In December 2016, our shareholders
decided to reduce the voluntary reserve by Ps.2,440,955,981.47 and
capitalize such funds through the payment of a dividend in shares
of seven new shares of common stock with a par value of Ps.1.00 per
share for each outstanding share of common stock, which were issued
on February 8, 2017. In August 2017, we paid Ps.1,888,970,885.12in
dividends in cash. In May 2018, we paid Ps. 1,417,639,558.08 in
dividends in cash.
175
In the future, we
could decide to pay dividends in accordance with applicable law and
based on various factors then existing, including:
● our
financial condition, operating results and current and anticipated
cash needs;
● our
strategic plans, business prospects and expansion capital
expenditures;
● general
economic and business conditions;
● our
strategic plans and business prospects;
● legal,
contractual and regulatory restrictions on our ability to pay
dividends; and
● other
factors that our Board of Directors may consider to be
relevant.
Under the Argentine
Corporate Law, the declaration and payment of annual dividends, to
the extent that the company presents retained earnings in
accordance with IFRS and CNV regulations, are determined by
shareholders at the annual ordinary shareholders
’
meeting. In addition, under the
Argentine Corporate Law, 5% of the net income for the fiscal year
calculated in accordance with IFRS and CNV regulations must be
appropriated by resolution adopted at shareholders
’
meetings to a legal reserve until
such reserve equals 20% of the capital stock. This legal reserve is
not available for distribution.
According to
argentine tax laws, any dividend distributed in cash for the net
results obtained during tax periods starting after January 1, 2018
and up to December 31, 2019 (when the applicable corporate income
tax is 30%), is subject to a withholding dividend tax of 7% when
distributed to argentine resident individuals or to non-argentine
residents, while the net result obtained for the years starting
after January 1, 2020 and onwards (when the applicable corporate
income tax is 25%) will be subject to a withholding dividend tax of
13% when distributed to Argentine resident individuals or to
non-Argentine residents. In case of dividend distributions to
non-Argentine residents, a lower dividend withholding rate could
apply in case a treaty to avoid double taxation applies and to the
extent certain conditions are met.
Amount Available for Distribution
Dividends may be
lawfully declared and paid only out of our earnings stated in our
annual financial statements approved by the annual ordinary
shareholders
’
meeting.
Under the Argentine Corporate Law, listed companies (such as
ourselves) may distribute provisional dividends or dividends in
advance resulting from interim financial statements.
Under the Argentine
Corporate Law and our bylaws, our annual net income (as adjusted to
reflect changes in prior years
’
results) is allocated in the
following order: (i) to comply with our legal reserve requirement
of 5% of our net income until such reserve equals 20% of the
capital stock; (ii) for voluntary or contingent reserves, as may be
resolved from time to time by our shareholders at the annual
ordinary shareholders
’
meeting; (iii) the remainder of the net income for the year may be
distributed as dividends on common shares; and/or (iv) as otherwise
decided by our shareholders at the annual ordinary
shareholders
’
meeting.
Our Board of
Directors submits our financial statements for the preceding fiscal
year, together with reports thereon by our Supervisory Committee
and the independent accountants, at the annual ordinary
shareholders
’
meeting for
approval. Within four months of the end of each fiscal year, an
ordinary shareholders
’
meeting must be held to approve our annual financial statements and
determine the appropriation of our net income for such
year.
Under applicable
CNV regulations, cash dividends must be paid to shareholders within
30 days of the shareholders
’
meeting approving such dividends.
In the case of stock dividends, shares are required to be delivered
within three months of our receipt of notice of the authorization
by the CNV for the public offering of the shares relating to such
dividends. The statute of limitations in respect of the right of
any shareholder to receive dividends declared by the
shareholders
’
meeting is
three years from the date on which it has been made available to
the shareholder.
The main subsequent
events occurred after the closing date of the annual financial
statements (December 31, 2018) are the following:
176
Brigadier López Plant - National and International Public Bid
No. CTBL 01/2018 (the “IEASA Bid”) called by
Integracion Energética Argentina S.A.
(“IEASA”)
On February 27,
2019, Central Puerto was notified that it had been awarded the
IEASA Bid called by IEASA to acquire the Central
Termoeléctrica Brigadier López power plant (the
“
Brigadier López
Power Plant”) and certain assets and liabilities relating to
such plant.
Pursuant to the
terms of the IEASA Bid, Central Puerto would be subject to a US$ 10
million penalty if it failed to honor its obligations under the
terms and conditions of the IEASA Bid. Regarding this, we provided
IEASA with a US$ 10 million first demand guarantee for the
maintenance of the offer, which guarantee expires on May 31, 2019
and entitles IEASA to execute it if we fail to honor our
obligations under the terms and conditions of the IEASA Bid. If
IEASA does not execute the first demand guarantee within 7 days
after its expiration, such first demand guarantee will
terminate.
In addition, the
acquisition of the
Brigadier
López
Power Plant was subject to the satisfaction of
certain conditions that had to occur prior to April 1, 2019. As of
the date of this annual report, the acquisition of the
Brigadier López
Power Plant could not
be consummated given that certain conditions to the IEASA Bid were
not satisfied, such as the proper issuance by CNV of an
unconditional authorization to the terms of the amended financial
trust agreement relating to the Brigadier Lopez Power Plant. In
addition, there is a discrepancy between Central Puerto and IEASA
regarding the satisfaction of certain conditions upon which closing
of the acquisition of the
Brigadier
López
Power Plant was subject to. Also, Resolution
SRRyME N° 1/2019 adversely affected our ability to obtain
financing in connection with the acquisition of the Brigadier Lopez
Power Plant. As of the original closing date, April 1, 2019,
certain of the conditions to closing of the acquisition had not
been satisfied, and an extension of such closing date was
necessary. However, Central Puerto and IEASA failed to agree on
such extension. On April 26, 2019, Central Puerto duly notified
IEASA of such failure to agree on an extension.
Borrowing from KFW
On March 26, 2019
the Company, as borrower, entered into a loan agreement with KfW
for an amount of US $ 56,000,000 to finance the
acquisition of two SGT-800 gas turbines (with a power of 89 MW) and
equipment from Siemens Sweden and related services from Siemens
Argentina for the Luján de Cuyo project. To secure our
obligations under the loan agreement with KfW, we have agreed to
maintain a cash reserve account pledged in favor of KfW. The loan
agreement also contains other customary covenants and events of
default for facilities of this type, and is governed by German law.
As of the date of this annual report, we are working to satisfy all
the conditions prior to the disbursement of this loan.
Collection from CVO Agreement
Effective as of
March 20, 2018, CAMMESA granted the CVO Commercial Approval in the
WEM, as a combined cycle, of the thermal plant Central Vuelta de
Obligado, which entitled us to receive the collection of the trade
receivables under the CVO Agreement. A PPA between the CVO Trust
and CAMMESA, through which the CVO Trust makes energy sales and,
consequently, receives the cash flow to pay the trade receivables,
had to be signed in order to start the collections.
The PPA agreement
was signed on February 7, 2019, with retroactive effect to March
20, 2018.
As a result, the
original amortization schedule from the CVO Agreement is in full
force and effect.
The unpaid
installments corresponding to the March-December 2018 period add up
to US$ 78.15 million (including VAT, corresponding to installments
1 to 10). As of the day of this annual report, we continue in
negotiations with CAMMESA to collect such unpaid amounts as soon as
possible, plus the accrued interest between each due date and the
effective payment date.
Despite the
referred unpaid installments, as of the date of this annual report,
we received the payment related to January and February 2019
(corresponding to installments 11 and 12, respectively) pursuant to
the CVO Agreement’s original disbursement schedule, at the
exchange rate of the last date of each month, on its respective due
dates, in March and April 2019, respectively.
We are also
entitled to receive the foreign exchange difference accrued for the
CVO trade receivables, between the last date of the month of each
CVO installment, and the day prior to the due date of such
installment. These amounts should be paid one day after the due
date of the payment of each CVO installment. However, for the
January 2019 installment, with due date on March 14, 2019, the
foreign exchange difference was payed on April 5, 2019. The foreign
exchange difference on the February 2019 CVO installment has not
been collected as of the date of this annual report.
177
Resolution SRRyME No. 1/19
By means of this
resolution, the Secretary of Renewable Resources and Electric
Market of the National Ministry of Economy modified the
remuneration scheme (for capacity and energy) applicable to
Authorized Generators (electricity generators which do not have
contracts in the term market in any of its modalities) acting in
the WEM. According to the recitals of this resolution, the
remuneration scheme set forth therein aims at being applied
transitorily, until the gradual definition and implementation of
regulatory mechanisms oriented at achieving an autonomous,
competitive and sustainable operation that allows the free
contracting between offer and demand, and a technical, economical
and operational functioning that makes it possible to integrate the
different generation technologies to ensure a trustworthy system at
a minimal cost. For further detail, please see “Item 4.B.
Business Overview—The Argentine Electric Power
Sector—Remuneration Scheme—The Current Remuneration
Scheme”.
Our shares are
listed on the Argentine stock market Bolsas y Mercados Argentinos
S.A. (the “BYMA”) and, since February 2, 2018, have
been listed on the NYSE under the symbol
“
CEPU.
”
Not
applicable.
Our common shares
are listed on the BYMA under the symbol
“
CEPU.
”
During 2018, the volume traded on
the BYMA amounted to 291,391,830 shares. The total number of shares
subscribed and integrated on December 31, 2018 was 1,514,022,256,
of which 1,514,022,256 were listed and available to trade on the
Buenos Ares Stock Exchange.
On February 1,
2018, we completed our IPO and on February 2, 2018, our ADSs
representing our common shares began to trade on the NYSE under the
symbol
“
CEPU.
” From February 2, 2018 to December 31,
2018
the volume of ADRs traded on the NYSE amounted to
69,824,800, equivalent to 698,248,000 common shares.
Consequently, the
total trading volume of our common shares during 2018 was
989,639,830.
Not
applicable.
Not
applicable.
Not
applicable.
Not
applicable.
Below we provide certain information on our capital stock and a
brief summary of certain significant provisions of our bylaws and
the applicable laws and regulations in Argentina. This summary is
not intended to be comprehensive and is qualified in its entirety
by our bylaws and the applicable laws and regulations in force in
Argentina.
Capital Stock
As of the date of
this annual report, our capital stock amounts to Ps.1,514,022,256
and is represented by 1,514,022,256 common shares with a par value
of Ps.1.00 and one voting right each, all of them having been fully
paid in and admitted to public offering.
178
On December 16,
2016, at a meeting of our shareholders, our shareholders decided to
reduce the voluntary reserve by Ps.1,324,769,474 and capitalize
such funds through the payment of a dividend in shares of seven new
shares of common stock with a par value of Ps.1.00 per share for
each outstanding share of common stock. Following such
capitalization and dividend of shares, and as of the date of this
annual report, we have 1,514,022,256 outstanding shares of common
stock with a par value of Ps.1.00 per share.
As of the date of
this annual report, one of our subsidiaries holds 8,851,848 of our
common stock.
As of the date of
this annual report, we are not aware of any individuals who hold,
or who have agreed to hold, conditionally or otherwise, stock
options, with respect to our common shares. Our subsidiary, CP
Renovables, granted a stock option to Guillermo Pablo Reca with
respect to its class B shares. For further information on the stock
option agreement entered into between CP Renovables and Guillermo
P. Reca see
“
Certain
Relationships and Related Party Transactions
—
CP Renovables Stock Option
Agreement.
”
Articles of Incorporation and Bylaws
We are a
corporation (
sociedad anónima
)
organized and existing pursuant to the laws of Argentina. Our
registered offices are domiciled in the City of Buenos Aires,
Argentina. Central Puerto was created through Executive Decree No.
1222/92 dated February 26, 1992, in connection with the
privatization process of SEGBA, and was registered with the Public
Registry of Commerce on March 13, 1992 under No. 1,855 of Book 110,
Volume A (
Sociedades
Anónimas
). Central Puerto was created for a term of
ninety-nine years as from its registration with the Public Registry
of Commerce.
Corporate Purpose
Pursuant to section
four of our bylaws, Central Puerto was created to be engaged in any
of the following activities, either on its own account, or through
or in association with third parties, in Argentina or
abroad:
(a) producing,
transforming, carrying, distributing and selling electric power in
any of its forms, including, but not limited to, thermoelectric
power from non-renewable sources (coal, oil derivatives, natural
gas, uranium) and renewable sources, or from usable waste,
hydroelectric power (including mini and micro power stations),
thermonuclear power, wind power, geothermal power, offshore energy
(tidal power, wave power, ocean currents, ocean-thermal energy,
osmosis energy), solar energy (photovoltaic and thermal power) and
bioenergy (plant and animal biomass);
(b) producing,
storing and using hydrogen technologies in any of its available
forms of energy;
(c) engaging in the
exploration, exploitation, processing, purification,
transformation, refining, industrialization, storage, sale,
transportation, distribution, import and export of liquid (such as
oil) and/or gaseous hydrocarbons (such as natural gas), minerals
(such as mineral coal) and metals (such as uranium and lithium,
among others) and their respective direct or indirect
derivatives;
(d) engaging in the
production and exploitation of raw materials for biofuel production
(biodiesel and bioethanol), including their manufacturing, storage,
sale, distribution and transportation;
(e) engaging in the
processing, storage, sale, distribution and transportation and/or
use of: (i) agricultural waste and urban solid waste as a renewable
energy source and (ii) ordinary and special waste (solid, semisolid
and liquid) as a source of energy;
(f) obtaining,
storing, selling, distributing, carrying and/or using biogas as a
renewable energy source;
(g) processing raw
materials from fossil fuels (natural gas, raw gasoline) to obtain
basic (synthesis gas, benzene, toluene, etc.), intermediate
(ammoniac, ethanol, methanol, ethyl-benzene, etc.) and final
petrochemicals (fertilizers, resins, polyurethanes, detergents,
PET, etc.;) and
(h) engaging in the
research and development of energy technologies.
With respect to the
activities described in (a), (b), (c), (d), (e), (f), (g) and h)
above, and within the limitations set forth in our corporate
purpose, we have full legal capacity to (i) acquire rights, assume
obligations, and carry out any kind of acts that are not otherwise
prohibited by the applicable laws or by our bylaws; (ii) establish,
incorporate, partner with, or hold interests in legal entities of
whatsoever nature incorporated in Argentina or abroad (we may do so
by any available means, including but not limited to, capital
contributions, purchase of shares, bonds, debentures, notes or
other debt or equity securities, whether publicly or privately
held); and (iii) render services and/or undertake representations,
commissions, consignments, services and/or agencies for our benefit
or for the benefit of third parties, always within the scope of the
permitted activities under our corporate purpose as described in
(a), (b), (c), (d), (e), (f), (g) and (h) above.
179
Statutory Provisions concerning our Board of Directors
Our board of
directors is comprised by eleven permanent directors, and an equal
or lower number of alternate directors. Directors will hold office
for one fiscal year and will be appointed at the
shareholders
’
meeting.
Shareholders are entitled to elect up to one third of vacant seats
on the board of directors by cumulative voting as set forth in
Section 263 of the Argentine Corporate Law. The outcome of such
voting will be computed per candidate, specifying the number of
votes for each of them.
At the first
meeting held following the shareholders
’
meeting at which the members of the
Board of Directors are renewed, the Board of Directors will elect a
chairman and a vice-chairman from among its members. The
vice-chairman will act in lieu of the chairman upon the
latter
’
s resignation,
death, incapacity, disability, removal or temporary or definitive
absence, with a new chairman having to be elected within ten days
from the seat becoming vacant. The election of a new chairman will
take place only if the situation that gives rise to the reelection
is expected to be irreversible during the remaining term of office.
Pursuant to Section 23 of our bylaws, Board of
Directors
’
meetings will
be held with the presence of an absolute majority of its members
and decisions will be made by majority of present votes. Board of
Directors
’
meetings may
also be held by videoconferencing, in which case directors
participating in person and remotely will be computed in the
calculation of the required quorum. Minutes of Board of
Director
’
s meetings will
be drafted and signed by directors and statutory auditors who were
present at the meeting within five days from the date in which it
was held. Members of our Supervisory Committee will register in the
minutes the names of the directors who have participated in the
meeting remotely, and that the decisions made therein were passed
in accordance with the law. The minutes will include the statements
from directors participating in person and remotely and will state
their respective votes on each decision made. If a Board of
Director
’
s meeting cannot
be validly held because of the number of vacant seats, even with
the attendance of all deputy directors of the same class, the
Supervisory Committee will designate substitutes to hold office
until the election of permanent members takes place, to which end
an ordinary or class shareholders
’
meeting will be called for, as the
case may be, within ten days from the Supervisory Committee having
made the designations.
There are no
requirements as to the minimum number of meetings to be held by the
Board of Directors.
The chairman, or
the individual acting in lieu of the chairman pursuant to the law,
may call for meetings when so deemed convenient, or when so
required by any director or the supervisory committee. The meeting
will be called for within five days from the request; otherwise,
the meeting may be called for by any of the directors. The Board of
Director
’
s meetings will
be called for in writing and notice thereof must be given to the
address reported by each director. The notice will indicate the
date, time and place of the meeting and the meeting agenda.
Business that is not included in the notice may be discussed at the
meeting only to the extent all permanent directors are present and
have cast their unanimous vote.
Our Board of
Directors may hold meetings with the attendance of its members in
person or by videoconference or other simultaneous sound, imaging
or voice broadcasting media. The Board of Directors may hold
meetings with the attendance of its chairman or its substitute. Our
Board of Directors
’
meetings will be held with the presence of an absolute majority of
its members and decisions will be made by majority of present
votes.
According to
Section 26 of our bylaws, our Board of Directors has the broadest
powers and authority in connection with the Company
’
s direction, organization and
administration, with no limitations other than those set forth in
the applicable laws and regulations. The chairman is the legal
representative of the Company.
Statutory Provisions concerning our Supervisory
Committee
The
Company
’
s oversight shall
be in charge of a Supervisory Committee to be comprised by three
(3) permanent and three (3) alternate statutory auditors. Statutory
auditors will be elected for one (1) fiscal year and will be vested
with the powers set forth by Law No. 19,550 and other applicable
legal provisions.
Our Supervisory
Committee holds meetings and adopts decisions with the presence and
favorable vote of, at least, two of its members, notwithstanding
the rights granted by law to the dissenting statutory auditor.
Meetings of our Supervisory Committee may be called for by any of
its members. Prior to the registration of the amendments to the
bylaws of June 3, 2015, meetings of our Supervisory Committee were
held with the attendance of all of its members, and decisions were
adopted by majority of votes, notwithstanding the rights granted by
law to the dissenting statutory auditor.
Members of our
Supervisory Committee are also authorized to attend Board of
Director
’
s and
shareholders
’
meetings,
call for extraordinary shareholders
’
meetings and investigate written
claims brought by shareholders who own more than two percent (2%)
of our outstanding shares. In accordance with the applicable laws,
members of the Supervisory Committee are required to be certified
public accountants or lawyers. Members of our Supervisory Committee
may call for an ordinary shareholders
’
meeting, in the specific cases
provided by law, at any time at their discretion, or otherwise when
so required by shareholders representing no less than five percent
(5%) of our capital stock.
180
Members of our
Supervisory Committee are designated at the annual ordinary
shareholders
’
meeting and
will remain in office for one (1) year. Pursuant to Section 294 of
the Argentine Corporate Law, our Supervisory Committee is required
to review our books and records, when deemed convenient and, at
least, on a quarterly basis.
Our Supervisory
Committee will hold meetings at least once a month; meetings may be
also called for at the request of any of its members, within five
(5) days from the date the request is submitted to the Chairman of
the Supervisory Committee or the Board of Directors, as the case
may be. Notice of all meetings shall be given in writing to the
address indicated by each Statutory Auditor at the time of holding
office.
Our Supervisory
Committee shall be presided over by one of its members, elected by
majority of votes, at the first meeting held every year. At that
time, the member who will act in lieu of the chairman in his/her
absence will also be elected. The chairman represents our
Supervisory Committee before the Board of Directors.
Rights, Preferences and Restrictions attached to our
Shares
According to our
bylaws, realized and liquid profits will be allocated in the
following order: (i) 5% to the legal reserve until reaching at
least 20% of our subscribed capital; (ii) Directors
’
fees, within the amounts set forth
by Section 261 of Law No. 19,550, which may not be exceeded, and
Statutory Auditors
’
fees;
(iii) payment of dividends in connection with the employee stock
ownership plan; (iv) optional reserves and provisions, at the
discretion of the shareholders
’
meeting; and (v) the remaining
balance shall be distributed as dividends among shareholders,
regardless of their class.
Shareholders’ Meetings
Shareholders
’
meetings will be called for by publishing notices in the Official
Gazette and in one of Argentina
’
s major newspapers for five (5)
days, no less than twenty (20) and no more than forty five (45)
days in advance of the scheduled date for the meeting. The notice
will include the type of meeting, as well as the date, time and
place where it will be held and the agenda. Ordinary and
extraordinary shareholders
’
meetings are subject to the quorum
and majorities required by Section 79 of the Capital Market Law and
Sections 243 and 244 of the Argentine Corporate Law.
Shareholders’ Liability
In conformity with
Argentine law, shareholders
’
liability for a company
’
s losses is limited to the payment
of their subscribed equity holdings. However, shareholders who
voted for a decision that was then rendered null by a court for its
being inconsistent with the Argentine laws or the corporate bylaws
(or operating agreement, if any) might be held personally and
jointly and severally liable for the damages that may arise from
such decision.
Conflicts of Interest
Under the Argentine
laws, if a shareholder casts a vote in connection with a matter in
which it may have, directly or indirectly, interests that are
contrary to ours, such shareholder will be liable for damages, but
only to the extent such matter had not been approved but for the
vote of such shareholder. The Argentine laws also set forth that if
a member of our Board of Directors has interests in a business
operation that are contrary to our interests, such director will
report so to the Board of Directors and the Supervisory Committee
and will refrain from engaging in the discussion of that issue. If
that director acts in a manner that is contrary to the law, it will
be held personally and jointly and severally liable for the damages
that may arise from such director
’
s acts or omissions.
Preemptive and Accretion Rights
Pursuant to Section
194 of the Argentine Corporate Law, upon a potential capital
increase, each holder of common shares will be entitled to
preemptive rights in respect of the newly issued common shares on a
proportional basis to the number of shares already held. Preemptive
rights can be exercised beginning on the last notice posted in the
Official Gazette and in a major Argentine newspaper thirty (30)
days; provided, however, that such 30-day period may be reduced to
no less than ten (10) days, if so approved at an extraordinary
shareholders
’
meeting.
Liquidation
Pursuant to our
bylaws, liquidation will be carried out by our Board of Directors
or the liquidators appointed at the shareholders
’
meeting, under the oversight of the
Supervisory Committee.
Once liabilities
have been settled, including the expenses incurred in the
liquidation, the remaining balance will be distributed among
shareholders on a proportional basis to their respective holdings,
without regard to classes or categories.
181
Neither Argentine
law, our bylaws nor other corporate documents provide limitations
as to share ownership that might apply to us.
Term
According to our
bylaws, our company was created for a term of ninety-nine (99)
years since the registration date with the Public Registry of
Commerce. Such term may be extended by a decision made at an
extraordinary shareholders
’
meeting.
Mandatory Tender Offer Regime
We are subject to
the mandatory tender offer rules set forth in Law No. 26,831, which
provide that in certain circumstances a mandatory tender offer
(
“
OPA
”
) must be launched with respect to
some or all of a company
’
s outstanding shares. Such
circumstances giving rise to an OPA include instances where a
person intends to purchase, either directly or indirectly, for
cash, either individually or collectively, either in one act or in
a series of successive acts during a period of 90 consecutive days,
a number of voting shares, subscription rights or stock options,
convertible negotiable securities or similar securities which
together with that person
’
s existing holdings could, directly
or indirectly, entitle such person to subscribe, purchase or
convert voting shares, shares entitled to or that once exercised
grant the right to a
“
significant share
”
in the voting capital stock of a
publicly traded company.
In such
circumstances, the OPA must be launched by the prospective
purchaser within 10 days of having made the decision to participate
in such purchase.
Such obligation is
not applicable in cases where the acquisition would not trigger a
change of control of the company. It also does not apply in cases
where there is a change of control as a consequence of a corporate
reorganization or as a consequence of mere redistributions of
shares among companies of the same group.
Concept of a “Significant Share”
The regulations
establish a duty to effect an offer with respect to part or all of
the outstanding shares of the company depending on the percentage
of the voting capital stock to be acquired. The regulations provide
for the following duties relating to the OPA:
● Whenever
the goal is to acquire a holding equal to or greater than 35% of
the voting capital stock or of the company votes, the offer must be
made for a number of securities that would enable the purchaser to
acquire at least 50% of the voting capital stock of the affected
company.
● Whenever
a holding equal to or greater than 50% of the voting capital stock
or the votes of the company is sought, the offer shall be made for
the number of securities that would enable the purchaser to obtain
100% of the voting capital stock of the affected company. The
application of this stipulation shall have priority over the
stipulation discussed in the preceding paragraph.
Determination of the OPA Price in the Case of a Change in
Control
The price shall be
a fair price determined by the offeror.
In order to
determine the fair price, the following criteria must be
considered, according to the CNV Rules: (i) book value of the
shares; (ii) valuation of the target company according to
discounted cash flows (DCF) or other applicable valuation criteria
applicable to comparable business; and (iii) average price of the
shares for the last six months before the
“
offer.
”
Based on certain interpretations of
Law No. 26,831 and the CNV Rules, the average price of the shares
for the last six months before the
“
offer
”
should be considered as a minimum
price. The price could be challenged by both the CNV and any
offeree shareholder.
Penalties for Breach
Without prejudice
to the penalties established by the CNV, Law No. 26,831 provides
that purchases in violation of such regime will be declared
irregular and ineffective for administrative purposes by the CNV
and cause the auction of the shares acquired in violation of the
applicable regulation, without prejudice to the penalties that may
correspond.
Tender Offer Regime in the Case of a Voluntary Withdrawal from the
Public Offering and Listing System in Argentina
Law 26,831 and CNV
regulations also established that when a company whose shares are
publicly offered and listed in Argentina agrees to withdraw
voluntarily from the public offering and listing system in
Argentina, it must follow the procedures provided for in the
CNV
’
s regulations and it
must likewise launch an OPA for its aggregate shares or
subscription rights or securities convertible into shares of stock
options under the terms provided for in such regulation. It is not
necessary to extend the public offering to those shareholders that
voted for the withdrawal at the shareholders
’
meeting.
182
The acquisition of
one
’
s own shares must be
made with liquid and realized profits or with free reserves,
whenever paid up in full, and for the amortization or disposition
thereof, within the term set forth in Section 221 of the Argentine
Corporate Law and the company must present the CNV with evidence
that it has the necessary solvency to effect such purchase and that
the payment for the shares will not affect its
solvency.
According to
Section 98 of Law No. 26,831 the price offered in the case of a
voluntary withdrawal from the public offering and listing system in
Argentina should be equitable and take into account the following
relevant criteria:
● The
equity value of the shares, taking into account a special financial
statement for the withdrawal from the public offering system or
listing;
● The
value of the company, in accordance with discounted cash flow
criteria and ratios applicable to comparable businesses or
companies;
● The
company
’
s liquidation
value;
● Average
quotation prices on the stock exchange where the shares are listed
during the six month period immediately preceding the withdrawal
application, regardless of the number of sessions necessary for
such negotiation; and
● The
consideration offered before, or the placement of the new shares,
in the event that a public offering has been made with regard to
the same shares or if new shares have been issued, if applicable,
during the last year, to be counted as of the date of the agreement
for the withdrawal application.
Under no
circumstances can the fair price offered be lower than the price
indicated in the fourth bullet above.
Mandatory or Voluntary Tender Offer in the Case of Near-total
Control
If a shareholder or
group of shareholders holds, directly or indirectly, 95% or more of
the outstanding capital stock of a publicly traded Argentine
company, any minority shareholder may request that the controlling
shareholder launch an OPA for all outstanding shares of such
company. In addition, a person that holds, directly or indirectly,
95% or more of the outstanding capital stock of a publicly traded
Argentine company may issue a unilateral declaration of its
intention to purchase all outstanding shares of such company within
six months following the date of acquisition of near-total control
and withdraw the company from public offering and its shares from
listing and trading. The price offered should be an equitable
price, following the criteria set forth in Law 26,831, but in no
case may it be lower than the average trading price of such shares
during the six-month period preceding the OPA
application.
For information
concerning our material contracts, see “Item 4. Information
of the Company,” “Item 7.B. Related Party
Transactions” and “Item 5. B. Liquidity and Capital
Resources.”
In
January 2002, with the approval of the Public Emergency Law,
Argentina declared a public emergency situation in its social,
economic, administrative, financial and foreign exchange matters
and authorized the Argentine Executive Branch to establish a system
to determine the foreign exchange rate between the Peso and foreign
currencies and to issue foreign exchange-related rules and
regulations. Within this context, on February 8, 2002, through
Decree No. 260/2002, the Argentine Executive Branch
established (i) the MULC through which all foreign exchange
transactions in foreign currency must be conducted, and
(ii) that foreign exchange transactions in foreign currency
must be conducted at the foreign exchange rate to be freely agreed
upon among contracting parties, subject to the requirements and
regulations imposed by the Central Bank (please see below for a
summary of the main regulations).
On June 9,
2005, through Decree No. 616/2005, the Argentine Executive
Branch mandated that (i) all inflows of funds into the local
foreign exchange market arising from foreign debts incurred by
residents, both individuals or legal entities in the Argentine
private sector, except for those concerning foreign trade financing
and primary issuances of debt securities admitted to public
offering and listed in authorized markets; and (ii) all
inflows of funds by non-residents channeled through the MULC and
aimed at being held in local currency, acquiring all types of
financial assets or liabilities in the financial or non-financial
private sector (except for foreign direct investments and primary
issuances of debt securities and shares admitted to public offering
and listed in authorized markets), and investments in securities
issued by the public sector and acquired in secondary markets, must
meet the following requirements: (i) such inflows of funds may
only be transferred outside the local foreign exchange market at
the expiration of a term of 365 calendar days as from the date of
settlement of such funds into Pesos; (ii) the proceeds of such
inflows of funds must be credited to an account in the local
banking system; (iii) a non-transferable and
non-interest-bearing deposit for 30% of the amount of the
transaction must be kept in Argentina for a period of 365 calendar
days, in accordance with the terms and conditions set forth in the
applicable regulations (the “Deposit”); and
(iv) the Deposit is to be denominated in U.S. dollars and be
held in Argentine financial institutions and the Deposit may not be
used to guarantee or as collateral in any type of credit
transaction. The requirements of Decree No. 616/2005 were
subsequently eased, as detailed below.
183
On
December 18, 2015, through Resolution No. 3/2015, the
Ministry of Treasury and Public Finances amended Executive Decree
No. 616/2005, reducing (i) the Deposit percentage to 0%
and (ii) the required period that the proceeds of any new
financial indebtedness incurred by residents, held by foreign
creditors and transferred through the MULC had to be kept in
Argentina from 365 calendar days to 120 calendar days from the date
of the transfer of the relevant amount. On January 5, 2017,
pursuant to Resolution 1-E/2017 of the Ministry of Treasury, the
mandatory stay period of 120 calendar days was further reduced to 0
days.
On August 8,
2016, the Central Bank established a new foreign exchange regime
through Communications “A” 6037, which substantially
modified the existing exchange regulations and easing the access to
the MULC.
On May 19,
2017, the Central Bank structurally modified the foreign exchange
regulations in force, creating a new foreign exchange regime
through Communication “A” 6244, which significantly
increased the flexibility to access the MULC. Communication
“A” 6244 (as amended by Communication “A”
6312) has replaced all previous rules governing exchange
transactions, the general exchange position and the provisions of
Decree No. 616/05, while rules governing information and
filing requirements were not replaced. Such regulation came into
force on July 1, 2017.
In addition,
Communication “A” 6244 (as amended by Communication
“A” 6312 and Communication “A” 6363) sets
forth:
1) The principle of
freedom of exchange: Argentine residents, as well as non-Argentine
residents, may freely access the MULC.
2) The obligation
of carrying out any exchange transaction through an entity
authorized by the Central Bank has been maintained.
3) Time
restrictions to trade in the MULC for carrying out foreign exchange
transactions have been eliminated.
4) The mandatory
inflow and settlement of export proceeds through the MULC within
the applicable term.
5) The obligation
of Argentine residents to comply with the “Review of Debt
Securities and External Liabilities Issued by the Financial Sector
and the Non-Financial Private Sector” (Communication
“A” 3602 and its complementary provisions) and the
“Review on direct investments” (Communication
“A” 4237 and its complementary provisions), even though
there has not been an income of funds to the MULC nor any future
access through the transactions to be declared has been
maintained.
On November 1,
2017, President Macri issued Decree No. 893/17 which partially
repealed Decree Nos. 2,581/64, 1,555/86 and No. 1,638/01, thus
eliminating the obligation of Argentine residents to transfer funds
to Argentina and then sell in the funds coming from their exports
of products in the MULC within the applicable term. Subsequently
and in accordance with Decree No. 893/17, the Central Bank
issued Communication “A” 6363 dated November 10,
2017, thus eliminating all the provisions related to the transfer
and sale of funds from exports of goods in the country in the
MULC.
Furthermore, on
December 28, 2017, by virtue of Communication “A”
6401 and “A” 6410, the Central Bank replaced the
reporting regimes set forth by Communication “A” 3602
and Communication “A” 4237 with a new unified regime
for information as of December 31, 2017. Such unified
reporting regime involves the filing of an annual statement, whose
filing is mandatory for every person whose total cash flow or asset
and liabilities balance amounts to U.S.$1 million or more
during the previous calendar year. Those subject to the
aforementioned reporting obligation shall declare the following
liabilities: (i) shares and equity interests;
(ii) non-negotiable debt instruments; (iii) negotiable
debt instruments; (iv) financial derivatives; and
(v) real estate and structures.
On January 11,
2018, with the aim of providing more flexibility to the foreign
exchange system and promoting competition, allowing the entrance of
new players to the system, the MELI was created by virtue of Decree
N° 27/2018, as amended by Law No. 27.444, replacing the
concept of the MULC for a free floating exchange market. Within the
MELI, the exchange operations will be carried out by the financial
entities and any other persons authorized to such effect by the
Central Bank pursuing permanent or customary trade in the purchase
and sale of foreign coins and banknotes, gold coins or bars and
traveler’s checks, money orders, transfers or similar
operations in foreign currency.
184
Within the new
foreign exchange market, exchange operations are carried out by
financial entities and any other person authorized to by the
Central Bank to engage in permanent or customary trade in the
purchase and sale of foreign coins and banknotes, gold coins or
bars and traveler’s checks, money orders, transfers or
similar operations in foreign currency.
By virtue of
Communication “A” 6443 of the Central Bank, which
entered into force on March 1, 2018, companies from any sector that
operate in the foreign exchange market may operate as an exchange
agency solely by registering via an electronic form entitled the
“Registry of Exchange Operators” (
Registro de Operadores de
Cambio
).
As of October 1, 2018, the BCRA introduced an
exchange rate band. The peso’s exchange rate with the U.S.
Dollar was allowed to fluctuate between Ps.34.00 and Ps.44.00 per
US$1.00 (range that was adjusted daily at an annual rate of 3%
until December 2018, and for the first quarter of 2019, is adjusted
daily at an annual rate of 2%) without the BCRA’s
intervention. On April 29, 2019, the Monetary Policy Counsel
(Comité de Política Monetaria) of the Central Bank (the
“COPOM”) decided to introduce changes to the monetary
policy, with an aim to reducing volatility in the foreign exchange
market. According to the new scheme: (i) if the exchange rate is
between Ps. 39.755 and Ps. 51.488, the Central Bank may intervene,
subject to market conditions, in the foreign exchange market and
sell U.S. dollars in the market, and (ii) if
the
exchange
rate is above Ps. 51.488, the Central Bank will sell foreign
currency for up to 250 million U.S. dollars daily. Also, the
Central Bank could decide to perform additional interventions. The
Argentine pesos resulting from such sales will be discounted from
the monetary base. The COPOM also confirmed that the Central Bank
will not intervene until June 2019 in the foreign exchange market
if the exchange rate decreases below Ps. 39.755.
Certain United States Federal Income Tax
Considerations
The following is a
summary of certain U.S. federal income tax considerations that may
be relevant to the purchase, ownership and disposition of common
shares or ADSs by a U.S. Holder (as defined below).
This summary is
based on provisions of the Internal Revenue Code of 1986, as
amended (the
“
Code
”
),
and regulations, rulings and judicial interpretations thereof, in
force as of the date hereof. Those authorities may be changed at
any time, perhaps retroactively, so as to result in U.S. federal
income tax consequences different from those summarized below. In
addition, this summary assumes that the deposit agreement, and all
other related agreements, will be performed in accordance with
their terms.
This summary is not
a comprehensive discussion of all of the tax considerations that
may be relevant to a particular investor
’
s decision to purchase, hold, or
dispose of common shares or ADSs. In particular, this summary is
directed only to U.S. Holders that hold common shares or ADSs as
capital assets and does not address tax consequences to U.S.
Holders who may be subject to special tax rules, such as banks,
brokers or dealers in securities or currencies, traders in
securities electing to mark to market, financial institutions,
insurance companies, tax exempt entities, entities and arrangements
treated as partnerships and the partners therein, holders that own
or are treated as owning 10% or more of our shares by vote or
value, persons holding common shares or ADSs as part of a hedging
or conversion transaction or a straddle, nonresident alien
individuals present in the United States for more than
182 days in a taxable year, or persons whose functional
currency is not the U.S. dollar. Moreover, this summary does not
address state, local or foreign taxes, the U.S. federal estate and
gift taxes, or the Medicare contribution tax applicable to net
investment income of certain non-corporate U.S. Holders, or
alternative minimum tax consequences of acquiring, holding or
disposing of common shares or ADSs.
For purposes of
this summary, a
“
U.S. Holder
”
is a beneficial owner of common
shares or ADSs that is an individual citizen or resident of the
United States or a U.S. domestic corporation or that otherwise is
subject to U.S. federal income taxation on a net income basis in
respect of such common shares or ADSs.
You
should consult your own tax advisors about the consequences of the
acquisition, ownership, and disposition of the common shares or
ADSs, including the relevance to your particular situation of the
considerations discussed below and any consequences arising under
foreign, state, local or other tax laws.
ADSs
In general, if you
are a U.S. Holder of ADSs, you will be treated, for U.S. federal
income tax purposes, as the beneficial owner of the underlying
common shares that are represented by those ADSs. Accordingly,
deposits or withdrawals of common shares for ADSs will not be
subject to U.S. federal income tax.
Taxation of Dividends
Subject to the
discussion below under
“
—Passive Foreign
Investment Company
,
”
the gross amount of any
distribution of cash or property with respect to common shares or
ADSs (including any amount withheld in respect of Argentine
withholding taxes) that is paid out of our current or accumulated
earnings and profits (as determined for U.S. federal income tax
purposes) will generally be includible in a U.S Holder
’
s taxable income as ordinary
dividend income on the day on which the holder receives the
dividend, in the case of common shares, or the date the ADS
Depositary receives the dividends, in the case of ADSs, and will
not be eligible for the dividends-received deduction allowed to
corporations under the Code. To the extent that the amount of any
distribution exceeds our current and accumulated earnings and
profits for a taxable year, the distribution will first be treated
as a tax-free return of capital, causing a reduction in the tax
basis of the common shares or ADSs, and to the extent the amount of
the distribution exceeds your tax basis, the excess will generally
be taxed as capital gain recognized on a sale or
exchange.
185
We do not expect to
maintain calculations of our earnings and profits in accordance
with U.S. federal income tax principles. U.S. Holders therefore
should expect that distributions generally will be treated as
dividends for U.S. federal income tax purposes.
Dividends paid in a
currency other than U.S. dollars generally will be includible in a
U.S. Holder
’
s income in a
U.S. dollar amount calculated by reference to the exchange rate in
effect on the day the holder receives the dividends, in the case of
common shares, or the date the ADS Depositary receives the
dividends, in the case of ADSs. U.S. Holders should consult their
own tax advisors regarding the treatment of foreign currency gain
or loss, if any, on any foreign currency received that is converted
into U.S. dollars after it is received.
Subject to certain
exceptions for short-term and hedged positions, the U.S. dollar
amount of dividends received by a non-corporate U.S. Holder with
respect to the common shares or ADSs will be subject to taxation at
a preferential rate if the dividends are
“
qualified dividends
”
and certain other requirements are
met. Dividends paid on the common shares or ADSs will be treated as
qualified dividends if:
● the
common shares or ADSs are readily tradable on an established
securities market in the United States and
● we
were not, for the year prior to the year in which the dividend was
paid, and are not, for the year in which the dividend is paid, a
passive foreign investment company (a
“
PFIC
”
).
Our ADSs are listed
on the NYSE, and our ADSs will qualify as readily tradable on an
established securities market in the United States so long as they
are so listed and remain so listed. Based on our audited financial
statements and relevant market and shareholder data, we believe
that we were not treated as a PFIC for U.S. federal income tax
purposes with respect to our 2018 taxable year. In addition, based
on our audited financial statements and our current expectations
regarding the value and nature of our assets, the sources and
nature of our income, and relevant market and shareholder data, we
do not anticipate becoming a PFIC for our current taxable year or
in the foreseeable future. U.S. Holders should consult their own
tax advisors regarding the availability of the reduced dividend tax
rate in light of their own particular circumstances.
Because the common
shares are not themselves listed on a U.S. exchange, dividends
received with respect to common shares that are not represented by
ADSs may not be treated as qualified dividends. U.S. Holders should
consult their own tax advisors regarding the potential availability
of the reduced dividend tax rate in respect of common
shares.
U.S. Holders that
receive distributions of additional common shares or ADSs or rights
to subscribe for common shares or ADSs as part of a pro rata
distribution to all of our shareholders generally will not be
subject to U.S. federal income tax in respect of the
distributions.
Taxation of Dispositions of Common Shares or ADSs
Subject to the
discussion below under
“
—Passive Foreign
Investment Company,
”
if a U.S. Holder realizes gain or
loss on the sale, exchange or other disposition of common shares or
ADSs, that gain or loss will be capital gain or loss and generally
will be long-term capital gain or loss if the common shares or ADSs
have been held for more than one year. Long-term capital gain
realized by a non-corporate U.S. Holder generally is subject to
taxation at a preferential rate. The deductibility of capital
losses is subject to limitations.
Foreign Tax Credit Considerations
Dividend
distributions with respect to the common shares or ADSs generally
will be treated as
“
passive category
”
income from sources outside the
United States for purposes of determining a U.S. Holder
’
s U.S. foreign tax credit
limitation. Subject to the limitations and conditions provided in
the Code and the applicable U.S. Treasury regulations, a U.S.
Holder may be able to claim a U.S. foreign tax credit against its
U.S. federal income tax liability in respect of any Argentine taxes
withheld (to the extent not exceeding the withholding rate
applicable to the U.S. Holder) from a dividend paid to such U.S.
Holder if the tax is treated for U.S. federal income tax purposes
as imposed on the U.S. Holder. Alternatively, the U.S. Holder may
deduct such Argentine taxes from its U.S. federal taxable income,
provided that the U.S. Holder elects to deduct rather than credit
all foreign income taxes for the relevant taxable
year.
186
Any gain realized
on the sale or other disposition of common shares or ADSs will be
treated as income from U.S. sources for purposes of determining a
U.S. Holder
’
s U.S.
foreign tax credit limitation. Therefore, an investor generally
would not be able to use the foreign tax credit arising from any
Argentine tax imposed on such disposition unless such credit can be
applied (subject to applicable limitations) against tax due on
other income treated as derived from foreign sources. Taxes are
only eligible for the foreign tax credit if they are income taxes
(or a tax paid in lieu of an income tax). The Argentine capital
gains tax will generally be treated as an income tax (or a tax paid
in lieu of an income tax) and thus potentially eligible for the
foreign tax credit, provided the U.S. Holder has other income
derived from foreign sources against which the credit can be used
(as discussed above). Asset taxes, such as the Argentine personal
assets tax (as described in
“—
Material Argentine Tax
Considerations
—
Personal
Assets Tax
”
), generally
will not be treated as income taxes for U.S. federal income tax
purposes. If the Argentine personal assets tax is not treated as an
income tax for U.S. federal income tax purposes, a U.S. Holder
generally would be unable to claim a foreign tax credit for any
Argentine personal assets tax paid. A U.S. Holder may be able to
deduct the Argentine taxes discussed in this paragraph in computing
its U.S. federal income tax liability, subject to applicable
limitations (including, in the case of income taxes, that the U.S.
Holder elects to deduct rather than credit all foreign income taxes
for the relevant taxable year).
The rules with
respect to U.S. foreign tax credits are complex and involve the
application of rules that depend on a U.S. Holder
’
s particular circumstances.
Accordingly, U.S. Holders are urged to consult their tax advisors
regarding the availability of the U.S. foreign tax credit under
their particular circumstances.
Passive Foreign Investment Company
Special tax rules
apply to U.S. Holders if we are a PFIC. In general, we will be a
PFIC in a particular taxable year if, after applying certain
look-through rules, either 75 percent or more of our gross income
for the taxable year is passive income, or the average percentage
(determined based on a quarterly average) of the value of our
assets that produce or are held for the production of passive
income is at least 50 percent. As discussed above, we believe that
we were not treated as a PFIC for U.S. federal income tax purposes
with respect to our 2018 taxable year, and we do not anticipate
becoming a PFIC for our current taxable year or in the foreseeable
future. The determination of whether we are a PFIC for any taxable
year depends on the classification of our income and assets, our
cash position and the nature of the activities performed by our
officers and employees. Because this determination is made
annually, it is possible that we may become a PFIC for the current
taxable year or for any future taxable year due to changes in the
composition of our income or assets.
If we are a PFIC
for the current taxable year or for a future taxable year during
which a U.S. Holder owns common shares or ADSs, the U.S. Holder
will be subject to a special tax at ordinary income rates on
certain
“
excess
distributions
”
and on
gain recognized on the sale or other disposition of such
holder
’
s common shares or
ADSs. For these purposes, distributions received in a taxable year
will be treated as excess distributions to the extent that they are
greater than 125% of the average annual distributions received
during the shorter of the three preceding taxable years or the U.S.
Holder
’
s holding period
for the common shares or ADSs. In addition, the amount of income
tax on any excess distributions or gains will be increased by an
interest charge to compensate for tax deferral, calculated as if
the excess distributions or gains were earned ratably over the
period the U.S. Holder held the common shares or ADSs.
Classification as a PFIC may also have other adverse tax
consequences and subject a U.S. Holder to certain reporting
requirements. If we are a PFIC for our current taxable year or in
future taxable years, U.S. Holders may be able to make certain
elections that would mitigate the consequences of our status as a
PFIC, including by electing to mark common shares or ADSs to market
annually. U.S. Holders should consult their own tax advisor
regarding the U.S. federal income tax considerations discussed
above.
Specified Foreign Financial Assets
Certain individual
U.S. Holders that own
“
specified foreign financial
assets
”
with an aggregate
value in excess of US$50,000 are generally required to file an
information statement along with their tax returns, currently on
Form 8938, with respect to such assets.
“
Specified foreign financial
assets
”
include any
financial accounts held at a non-U.S. financial institution, as
well as securities issued by a non-U.S. issuer (which would include
the common shares or ADSs) that are not held in accounts maintained
by financial institutions. Higher reporting thresholds apply to
certain individuals living abroad and to certain married
individuals. Regulations extend this reporting requirement to
certain entities that are treated as formed or availed of to hold
direct or indirect interests in specified foreign financial assets
based on certain objective criteria. U.S. Holders who fail to
report the required information could be subject to substantial
penalties. In addition, the statute of limitations for assessment
of tax would be suspended, in whole or part. Prospective investors
should consult their own tax advisors concerning the application of
these rules to their investment in the common shares or ADSs,
including the application of the rules to their particular
circumstances.
Backup Withholding and Information Reporting
Dividends paid on,
and proceeds from the sale, exchange or other disposition of, the
common shares or ADSs to a U.S. Holder generally will be subject to
the information reporting requirements of the Code and may be
subject to backup withholding unless the U.S. Holder provides an
accurate taxpayer identification number and makes any other
required certification or otherwise establishes an exemption.
Backup withholding is not an additional tax. The amount of any
backup withholding from a payment to a U.S. Holder will be allowed
as a refund or credit against the U.S. Holder
’
s U.S. federal income tax liability,
provided the required information is furnished to the U.S. Internal
Revenue Service in a timely manner.
187
Material Argentine Tax Considerations
The following
discussion is a summary of the material Argentine tax
considerations relating to the purchase, ownership and disposition
of our ADSs or common shares. It is based upon the tax laws of
Argentina and regulations thereunder as of the date of this annual
report, and is subject to any subsequent changes in Argentine laws
and regulations which may come into effect after such date. This
summary does not purport to be a comprehensive description of all
the tax considerations that may be relevant to a holder of such
securities. No assurance can be given that the courts or tax
authorities responsible for the administration of the laws and
regulations described in this annual report will agree with this
interpretation. Holders are encouraged to consult their tax
advisors regarding the tax treatment of our ADSs or common shares
as it relates to their particular situation.
Taxation on Dividends
In view of the
recent amendments introduced to the Income Tax Law by virtue of Law
No. 27,430, as of fiscal years beginning on or after January 1,
2018, the taxation applicable to dividends distributed from
Argentine companies would be as follows:
|
|
i.
|
Dividends
originated from profits obtained before January 1, 2018: are not
subject to any income tax withholding except for the Equalization
Tax (as defined below).
|
|
|
ii.
|
Dividends
originated from profits obtained during fiscal years initiated
after January 1, 2018 and up to December 31, 2019: dividends on
Argentine shares paid to Argentine Individuals and/or non-residents
(
“
Foreign
Beneficiaries
”
) are
subject to a 7% income tax withholding on the amount of such
dividends (
“
Dividend
Tax
”
).
|
|
|
iii.
|
Dividends
originated from profits obtained during fiscal years initiated
after January 1, 2020 onward: the Dividend Tax rate is raised to
13%.
In the case of
foreign beneficiaries, the Dividend Tax rate could be reduced
pursuant to applicable treaties to avoid double taxation if certain
conditions are met, as the case may be.
|
For Argentine
individuals and undivided estates not registered before the AFIP as
payers of income tax and foreign beneficiaries, the Dividend Tax
withholding will be considered as a unique and final payment. In
addition, under Law No. 27,430, rules are created that regulate and
limit the possibility to offset gains derived from the distribution
of dividends with losses generated in other
operations.
If dividends are
distributed to Argentine Entities as defined below, no Dividend Tax
should apply.
With regards to
income obtained during fiscal years beginning on or after January
1, 2018, the Equalization Tax is not applicable. With regards to
income obtained in prior fiscal years, the Equalization Tax is
applicable.
The equalization
tax (the
“
Equalization
Tax
”
) is applicable when
the dividends distributed are higher than the
“
net accumulated taxable
income
”
of the immediate
previous fiscal period from when the distribution is made. In order
to assess the
“
net
accumulated taxable income
”
from the income calculated by the
Income Tax Law, the income tax paid in the same fiscal period
should be subtracted and the local dividends received in the
previous fiscal period should be added to such income. The
Equalization Tax will be imposed as a 35% withholding tax on the
shareholder receiving the dividend. Dividend distributions made in
property (other than cash) will be subject to the same tax rules as
cash dividends. Stock dividends on fully paid shares (
“
acciones
liberadas
”
) are
not subject to Equalization Tax.
The income tax law
provides a first in-first out rule pursuant to which distributed
dividends correspond to the former accumulated profits of the
distributing company.
Holders are
encouraged to consult a tax advisor as to the particular Argentine
income tax consequences derived from profit distributions made on
ADSs or common shares.
Capital Gains Tax
According to
current regulations, the results derived from the transfer of
shares, quotas and other equity interests, titles, bonds and other
securities, are subject to Argentine income tax, regardless of the
type of beneficiary who realizes the gain.
188
Capital gains
obtained by Argentine corporate entities (in general, entities
organized or incorporated under Argentine law, certain traders and
intermediaries, local branches of foreign entities, sole
proprietorships and individuals carrying on certain commercial
activities in Argentina) (the “Argentine Entities”)
derived from the sale, exchange or other disposition of shares in
Argentine entities are subject to income tax on the net income at
the rate of 30% for fiscal years initiated after January 1, 2018
and up to December 31, 2019 and at the rate of 25% for tax periods
initiated after January 1, 2020 and onwards. Losses arising from
the sale of shares can only be offset against income derived from
the same type of operations, for a five-year carryover
period.
Beginning in 2018,
it is clear that income obtained by Argentine Individuals and
undivided estates from the sale of shares and other securities are
exempt from capital gains tax in the following cases: (i) when the
shares are placed through a public offering authorized by the CNV,
(ii) when the shares were traded in stock markets authorized by the
CNV, under segments that ensure priority of price-time and
interference of offers, or (iii) when the sale, exchange or other
disposition of shares is made through a tender offer regime and/or
exchange of shares authorized by the CNV. ADSs do not qualify for
the exemption applicable to Argentine resident individuals since
the referred conditions would not apply. If the exemption does not
apply, the income derived by Argentine resident individuals from
the sale, exchange or other disposition of shares are is subject to
income capital gains tax at a 15% rate on net income. Losses
arising from the sale of non-exempt Argentine shares can only be
offset by Argentine individuals and undivided estates against
income derived from the same type of operations, for a five-year
carryover period.
If Argentine
resident individuals and undivided estates perform a conversion
procedure of securities representing shares, that do not meet the
exemption requirements stated in the paragraph above, to hold
instead the underlying shares that do comply with said
requirements, such conversion would be considered a taxable
transfer of the securities representing shares for which the fair
market value by the time the conversion takes place should be
considered. The same tax treatment will apply if the conversion
process involves shares that do not meet the exemption requirements
stated above that are converted into securities representing shares
to which the exemption is applicable. Once the underlying shares or
securities representing shares are converted, the results obtained
from the sale, exchange, swap or any other disposition thereof
would be exempt from income tax provided that the conditions
mentioned in points (i), (ii) and (iii) of the paragraph above are
met.
It should be noted
that for periods prior to 2018, it is currently under discussion if
the exemption (introduced by Law 26,893 and its implementing decree
2334/2013) applicable on the sale of shares and other securities,
only
included the sale of
securities made through a stock exchange market duly authorized by
the CNV or if the implementing decree’s added provisions were
just by way of example.
Due to the
amendments introduced to the Income Tax Law by Law No. 27,430, as
from 2018, Foreign Beneficiaries are also exempt from income tax on
income derived from the sale of Argentine shares in the following
cases: (i) when the shares are placed through a public offering
authorized by the CNV, (ii) when the shares were traded in stock
markets authorized by the CNV, under segments that ensure priority
of price-time and interference of offers, or (iii) when the sale,
exchange or other disposition of shares is made through a tender
offer regime and/or exchange of shares authorized by the CNV. The
exemption applies to the extent the Foreign Beneficiaries reside in
a cooperative jurisdiction and, in accordance with the amendments
introduced by Decree N°1170/2018, if their funds come from
cooperative jurisdictions.
In addition, it was
finally clarified that, from 2018 onward, the income derived from
the sale of ADSs will be treated as coming from an Argentine
source. However, capital gains obtained from the sale, exchange or
other disposition of ADSs by Foreign Beneficiaries that reside in a
cooperative jurisdiction and, in accordance with the amendments
introduced by Decree N°1170/2018, their funds come from
cooperative jurisdictions, from the sale, exchange or other
disposition of ADSs are exempt from income tax on capital gains to
the extent the underlying shares are issued by an Argentine company
and they are authorized for public offering by the
CNV.
In case Foreign
Beneficiaries conduct a conversion process of shares that do not
meet the exemption requirements, into securities representing
shares that are exempt from income tax pursuant to the conditions
stated above, such conversion would be considered a taxable
transfer of the securities representing shares for which the fair
market value by the time the conversion takes place should be
considered.
If the exemption is
not applicable, the gain derived from the disposition of shares
would be subject to Argentine income tax at a 15% rate on the net
capital gain or at a 13.5% effective rate on the gross price
provided that the Foreign Beneficiary is not domiciled in a
non-cooperative jurisdiction. In such scenario, the income tax
should be paid to the AFIP under the following procedures: (i) in
case the securities were sold by a Foreign Beneficiary, but not
through an Argentine stock exchange market and there is an
Argentine buyer involved, the Argentine buyer should withhold the
income tax; and (ii) when both the seller and the buyer are Foreign
Beneficiaries and the sale is not performed through an Argentine
stock exchange market, the person liable for the tax shall be the
legal representative of the seller of the shares or securities
being transferred or the foreign seller.
189
For Foreign
Beneficiaries domiciled in non-cooperative jurisdictions or when
the funds come from non-cooperative jurisdictions, the tax rate
applicable to the sales of shares and/or ADSs is assessed at 35%.
Pursuant to General Resolution AFIP 4227, the presumed net basis on
which the 35% rate should apply in the case of sale or disposition
of securities is assessed at 90%. The list of non-cooperative
jurisdictions shall be published by the Executive Branch. However,
Decree 279/2018 provides that until the Executive Branch issues the
non-cooperative list, taxpayers should consider the list of
“cooperative jurisdictions” published by the Argentine
tax authorities to determine whether a jurisdiction is deemed
cooperative or not. The U.S. is currently not a non-cooperating
jurisdiction.
Holders are
encouraged to consult a tax advisor as to the particular Argentine
income tax consequences derived from the holding and disposing of
ADSs or common shares.
Personal Assets Tax
Argentine entities,
like us, are subject to the personal assets tax corresponding to
Argentine Individuals and Foreign Beneficiaries (be they legal
entities or individuals) for the holding of company shares at
December 31 of each year. The applicable tax rate is 0.25% and is
levied on the proportional net worth value (
“
valor patrimonial
proporcional
”
) by
December 31
st
of each year of the
shares. Pursuant to the Personal Assets Tax Law, Argentine
companies are entitled to seek reimbursement of said paid tax from
the Argentine Individuals and/or Foreign Beneficiaries. Argentine
companies may seek this personal assets tax reimbursement by
setting off the applicable tax against any amount due to its
shareholders or withholding on assets that originated the payment
(i.e., the common shares) or in any other way or, under certain
circumstances, waive its right under Argentine law to seek
reimbursement from the shareholders.
It is unclear if
the ADSs are subject to the personal assets tax applicable to
Foreign Beneficiaries, although the underlying assets (the common
shares) are subject to the personal assets tax as it was previously
described. Holders are encouraged to consult a tax advisor as to
the particular consequences of the personal assets tax derived from
the holding of ADSs.
Value Added Tax (VAT)
The sale, exchange
or other disposition of our ADSs or common shares and the
distribution of dividends are exempted from VAT.
Tax on Debits and Credits on Argentine Bank Accounts
All credits to and
debits from bank accounts held at Argentine financial institutions,
as well as certain cash payments, are subject to this tax, which is
assessed at a general rate of 0.6%. There are also increased rates
of 1.2% and reduced rates of 0.075%. Owners of bank accounts
subject to the general 0.6% rate may consider 33% of the tax paid
as a tax credit against specific taxes. The taxpayers that are
subject to the 1.2% rate may consider 33% of all tax paid as a tax
credit against specific taxes. Such amounts can be used as credit
for income tax or tax on presumed minimum income. Such amounts can
be utilized as a credit for income tax, tax on presumed minimum
income or special contributions on cooperatives capital. If lower
rates were applied, the available credit would be reduced to
20%.
The TDC has certain
exemptions. Debits and credits in special checking accounts
(created under Communication “A” 3250 of the Argentine
Central Bank) are exempted from this tax if the accounts are held
by foreign legal entities and if they are exclusively used for
financial investments in Argentina.
According to Law
No. 27.432, the Executive may increase up to 20% per year the
percentage of the TDC payments that can be accounted for as payment
on account of the income tax. Additionally, the Tax Reform Law
enables the Executive to establish that starting in 2022 the
amounts paid as TDC may be totally accounted for as payment on
account of the Income Tax. Whenever financial institutions governed
by Law No. 21.526 make payments acting in their own name and
behalf, the application of this tax is restricted to certain
specific transactions. Such specific transactions include, among
others, dividends or profits distributions.
Tax on Minimum Presumed Income
Argentine entities
are subject to this tax at the rate of 1% applicable over the total
value of their taxable assets, above an aggregate amount of Ps.200,
000. Specifically, the law establishes that banks, other financial
institutions and insurance companies will consider a taxable base
equal to 20% of the value of taxable assets. This tax is only
payable if the income tax determined for any fiscal year does not
equal or exceed the amount owed under the tax on minimum presumed
income. In such case, only the difference between the tax on
minimum presumed income determined for such fiscal year and the
income tax determined for that fiscal year shall be paid. Any tax
on minimum presumed income paid will be applied as credit toward
income tax owed in the ten next following fiscal years. Please note
that shares and other equity participations in entities subject to
tax on minimum presumed income are exempt from this
tax.
190
Holders are
encouraged to consult a tax advisor as to the particular
consequences of the Argentine tax on minimum presumed income
related to the holding of ADSs or common shares.
Pursuant to Law No.
27,260, passed by the Argentine Congress on June 29, 2016, the tax
on minimum presumed income is eliminated beginning on January 1,
2019.
Gross Turnover Tax
In addition, the
transfer of ADSs or common shares and the collection of dividends
could be subject to gross turnover tax if such activity is
conducted on a regular basis within an Argentine province or within
the City of Buenos Aires, unless an exemption applies. For example,
under the Tax Code of the City of Buenos Aires, any transactions of
shares, as well as the collection of dividends, are exempt from
gross turnover tax. Holders of ADSs or common shares are encouraged
to consult a tax advisor regarding the specific consequences that
come with the possession and disposal of ADSs or ordinary shares in
the jurisdictions involved.
Regimes for the Collection of Provincial Tax Revenues on the
Amounts Credited to Bank Accounts
Different tax
authorities (i.e., City of Buenos Aires, Corrientes, C
ó
rdoba, Tucum
á
n, Province of Buenos Aires and
Salta, among others) have established collection regimes for gross
turnover tax purposes applicable to those credits verified in
accounts opened at financial entities, of any type and/or nature
and including all branch offices, irrespective of territorial
location. These regimes apply to those taxpayers included in the
payroll provided monthly by the tax authorities of each
jurisdiction. The applicable rates may vary depending on the
jurisdiction involved. Collections made under these regimes shall
be considered as a payment on account of the turnover tax. As
certain jurisdictions have excluded the application of these
regimes on certain financial transactions, holders shall
corroborate the existence of any exclusion to these regimes in
accordance with the jurisdiction involved.
Stamp Tax
Stamp tax is a
local tax that is levied based on the formal execution of public or
private onerous instruments within Argentine provinces or in the
City of Buenos Aires or that have effects in said jurisdictions,
even if executed abroad. Documents subject to stamp tax include,
among others, various types of contracts, notarial deeds and
promissory notes. Each province and the City of Buenos Aires has
its own stamp tax legislation. Stamp tax rates vary according to
the jurisdiction and type of agreement involved. In certain
jurisdictions, acts or instruments related to the negotiation of
shares and other securities duly authorized for public offering by
the CNV are exempt from stamp tax. Holders of ADSs or ordinary
shares are encouraged to consult a tax advisor as to the particular
stamp tax consequences arising in the involved
jurisdictions.
Other Taxes
There are no
Argentine federal inheritance or succession taxes applicable to the
ownership, transfer or disposition of our ADSs or common shares,
except for the province of Buenos Aires. In such jurisdiction, the
free transmission of assets, including inheritance, legacies,
donations, etc., is subject to tax. The amount to be taxed, which
includes a fixed component and a variable component that is based
on differential rates (which range from 1.6026% to 8.7840%), varies
according to the property value to be transferred and the degree of
kinship of the parties involved. Free transmission of ADSs or
common shares could be subject to this tax in the province of
Buenos Aires to the extent that the transmission is equal to or
higher than Ps. 269.000 or Ps.1.120.000 in the case parents,
children and spouse were involved.
Holders of ADSs or
common shares are encouraged to consult a tax advisor as to the
particular tax consequences arising in the involved
jurisdictions.
Court Tax
In the case of
litigation regarding our ADSs or common shares before a federal
court in Argentina or the courts sitting in the City of Buenos
Aires, a 3% court tax calculated on the basis of the claim shall be
charged. Certain court and other taxes could be imposed on the
amount of any claim brought before the courts of the relevant
province.
Tax Treaties
Argentina has
signed tax treaties for the avoidance of double taxation with
Australia, Belgium, Bolivia, Brazil, Canada, Chile, Denmark,
Finland, France, Germany, Italy, Mexico, the Netherlands, Norway,
Russia, Spain, Sweden, Switzerland, United Arab Emirates and the
UK. Likewise, Argentina has signed treaties with China, Qatar and
Turkey, but are still undergoing the respective ratification
procedure. There is currently no tax treaty or convention for the
avoidance of double taxation in effect between Argentina and the
United States. Holders are encouraged to consult a tax advisor as
to the potential application of the provisions of a treaty in their
specific circumstances.
191
Incoming Funds Arising from Non-Cooperative
Jurisdictions
Non-cooperative
jurisdictions are those countries or jurisdictions that do not have
in force with the Argentine government an agreement for the
exchange of information on tax matters or a treaty to avoid
international double taxation with a broad clause for the exchange
of information. Likewise, those countries that, having an agreement
of this type in force, do not effectively comply with the exchange
of information will be considered non-cooperative. The
aforementioned treaties and agreements must comply with
international standards of transparency and exchange of information
on fiscal matters to which the Argentine Republic has committed
itself. The executive power will list the non-cooperative
jurisdictions based on the criteria above. According to the Decree
No. 279/2018 non-cooperative jurisdictions would be those not
included in the list currently published in the AFIP’s
website created in accordance with the Decree No 589/2013 until the
list of non-cooperative jurisdictions to be issued by the executive
power is published.
In turn, low or nil
tax jurisdictions are defined as those countries, territories,
associated states or special tax regimes that foresee a maximum
corporate tax rate below 15%. Pursuant to Decree 1170/2018, the 15%
threshold rate should be assessed considering the aggregate
corporate tax rate in each jurisdiction, regardless of the
governmental level in which the taxes were levied. In turn,
“special tax regime” is understood as any regulation or
specific scheme that departs from the general corporate tax regime
applicable in said country and results in an effective rate below
that stated under the general regime.
According to the
legal presumption under Section 18.1 of Law No. 11,683, as amended,
incoming funds from non-cooperative jurisdictions will be deemed as
unjustified net worth increases for the Argentine party, no matter
the nature of the operation involved. Unjustified net worth
increases are subject to the following taxes:
● income
tax at would be assessed on 110% of the amount of funds
transferred.
● VAT at
a 21% rate would be assessed on 110% of the amount of funds
transferred.
Although the
concept of “incoming funds” is not clear, it should be
construed as any transfer of funds:
(i) from an
account in a non-cooperative/ low or nil tax jurisdiction or from a
bank account opened outside of a non-cooperative or low or nil tax
jurisdiction but owned by an entity located in a non-cooperative or
low or nil tax jurisdiction; or
(ii) to a bank
account located in Argentina or to a bank account opened outside of
Argentina but owned by an Argentine Individual.
The Argentine
Individual may rebut such legal presumption by duly evidencing
before the AFIP that the funds arise from activities effectively
performed by the Argentine Individual or by a third party in such
jurisdiction, or that such funds have been previously
declared.
Not
applicable.
Not
applicable.
We are subject to
the information requirements of the Securities Exchange Act of
1934, as amended, or the Exchange Act. In accordance with these
requirements, we file reports and other information with the SEC.
These materials, including this annual report and the accompanying
exhibits, may be inspected and copied at the SEC’s Public
Reference Room at 100 F Street, N.E., Room 1580, Washington, D,C,
20549. Copies of the materials may be obtained from the SEC’s
Public Reference Room at prescribed rates. The public may obtain
information on the operation of the SEC’s Public Reference
Room by calling the SEC in the United States at 1-800-SEC-0330. In
addition, the SEC maintains an internet website that contains
filings, reports and other information regarding issuers who, like
us, file electronically with the SEC. The address of that website
is http://www.sec.gov.
We remind investors
that we are required to file financial statements and other
periodic reports with the CNV because we are a public company in
Argentina. Investors can access our historical financial statements
published in Spanish on the CNV’s website at www.cnv.gob.ar.
The information found on the CNV’s website is not a part of
this annual report. Investors are cautioned not to place undue
reliance on our financial statements or other information not
included in this annual report.
192
Not
applicable
Financial Risk Management Goals and Policies
Our principal
financial liabilities comprise of bank loans and borrowings from
CAMMESA and trade and other payables. The main purpose of these
financial liabilities is to finance our operations. We have trade
and other receivables, and cash and cash equivalents that result
directly from our operations. We also have financial assets at fair
value through profit and loss.
Due to our business
activity, we are exposed to the following financial risks: market
risk, credit risk and liquidity risk. We continuously monitor these
risks to minimize the potential negative impact they could have on
our finances.
Market Risk
Market risk is the
risk of changes in the fair value or the future cash flows of
financial instruments due to fluctuations in market prices. The
market risks affecting our business include interest rate risk,
foreign currency risk and price risk.
Interest Rate Risk
Interest rate
variations affect the value of assets and liabilities accruing a
fixed interest rate, as well as the flow of financial assets and
liabilities with floating interest rates. As mentioned in note 14.3
to our audited consolidated financial statements, short-term bank
loans accrue interest at a fixed interest rate. We use no derivate
financial instruments to cover this risk.
Under IAS 29,
keeping monetary assets causes loss of purchasing power, as long as
there is no adjustment mechanism that compensates for such loss of
purchasing power. This loss is included in the fiscal year income
(loss) under item Income (loss) on net monetary position. On the
contrary, keeping monetary liabilities causes gain of purchasing
power, also included under item Income (loss) on net monetary
position.
Ours risk
management policy was designed for the purposes of reducing the
effect the loss of purchasing power may have. Net monetary
positions during most of fiscal years 2018, 2017 and 2016 appeared
as assets; hence, we seek to mitigate the risk by implementing
adjustment mechanisms through interest and exchange differences. In
consequence, during 2018, 2017 and 2016, item Income (loss) on net
monetary position showed net loss caused by monetary accounts
inflation.
The following table
shows the sensitivity of income before income tax as of December
31, 2018 to a reasonably likely change to the interest rates over
the portion of loans and CAMMESA borrowings bearing interest at a
variable interest rate, all other variables being
equal:
|
Increase in percentage
|
Effect on income before income tax in thousands of Ps.
(Loss)
|
|
5%
|
(141,280)
|
Foreign Currency Risk
Foreign Currency
risk is the risk that the fair value or future cash flows of a
financial instrument will fluctuate due to changes in foreign
exchange rates.
We are exposed to
the foreign currency risk in connection with the U.S. dollar to
Argentine peso exchange rate, mainly as a result of our operating
activities, investment projects and the debt related to the bank
loan mentioned in note 14.3 to our audited consolidated financial
statements. We do not use derivative financial instruments to hedge
such risk, since almost all our of income is denominated in foreign
currency, which protect us from a devaluation of the Argentine
peso.
Moreover, as of
December 31, 2018, we had receivables and cash and cash equivalents
in foreign currency in the amount of approximately US$570.73
million, and we had liabilities for US$167.90 million. See Note
14.9 to our audited consolidated financial statements as of
December 31, 2018.
The cash flow
from these receivables also helps us to mitigate the effects of a
potential devaluation.
193
The following table
shows the sensitivity of income before income tax as of December
31, 2018 to a reasonable possible change to the U.S. dollar to peso
exchange rate, all other variables being equal (due to changes in
the fair value of monetary assets and liabilities):
|
Change in the U.S. dollar exchange rate
|
Effect on income before income tax in thousands of Ps.
(Gain)
|
|
10%
|
973,442
|
Price Risk
Our revenues
primarily depend on the price of electric power under the
Energía Base and on the production cost paid by CAMMESA. We
are not able to fix prices in the market in which we operate. See
“Item 4.B. Business
Overview—
The Argentine Electric Power
Sector
”
and
“Item 3.D.—
Risk
Factors
—
Electricity
demand may be affected by tariff increases, which could lead
generation companies like us to record lower revenues.
”
Credit Risk
Credit risk is the
risk of a counterparty failing to comply with the obligations
undertaken under a financial instrument or costumer contract,
resulting in a financial loss. We are exposed to credit risk in
connection with our operating activities (in particular, in
connection with our trade receivables) and with our financial
activities, including holdings of government securities. In
particular, we have risks relating to receivables from CAMMESA. See
“Item 3.D.—
Risk
Factors
—
Risks Relating to
Our Business
—
Our results
depend largely on the compensation established by the Secretariat
of Electric Energy and received from CAMMESA
”
and
“Item 3.D.—
Risk
Factors
—
Risks Relating to
the Electric Power Sector in Argentina
—
We have, in the recent past, been
unable to collect payments, or to collect them in a timely manner,
from CAMMESA and other customers in the electric power
sector.
”
We are entitled to
receive payments from CAMMESA under the Energía Base within 42
days after the date of billing. In recent years, due to regulatory
conditions in Argentina
’
s
electric power sector that affected the profitability and economic
viability of power utilities, certain WEM agents defaulted on their
payments to CAMMESA, which adversely affected CAMMESA
’
s ability to meet its payment
obligations to electric power generators, including us. As a
consequence, in the past, we have seen CAMMESA pay within 92 days
of month-end, rather than the required 42 days after the date of
billing. Such payment delays would result in higher working capital
requirements than we would typically have to finance with our own
financing sources. However, this delay has been decreasing since
April 2016. From September 2016 to November 2017, CAMMESA has paid
without delays, and since then, there were short periods in which
CAMMESA experienced delays in paying.
For example, for
the monthly transaction related to Energía Base of January
2019, with due date on March 13, 2019, collected 50% on that date,
22% on March 19, 2019, 22% on April 1, 2019, and the rest on April
5, 2019. For the monthly transaction related to Energía Base
of February 2019, with due date on April 11, 2019, we collected 41%
on that date, and 20% on April 17, 2019, and we expect to collect
the balance in the upcoming weeks. For these delays, we are
entitled to receive interests from CAMMESA. Payments related to
PPAs under the Renovar Regulatory Framework have not suffered
delays. CAMMESA may once again be unable to make payments to
generators both in respect of energy dispatched and generation
capacity availability on a timely basis or in full, which may
substantially and adversely affect our financial position and the
results of our operations.
The chart below
shows the payment cycle of CAMMESA (for sales under the
Energía Base) in terms of number of days after the due date
that CAMMESA took to pay the balances each month from September
2015 to January 2019:
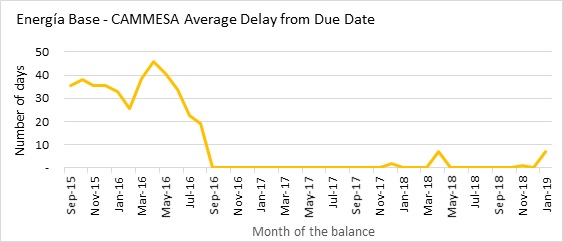
Source: Central
Puerto
194
We are also
entitled to receive the foreign exchange difference accrued for the
Energía Base and FONI trade receivables, between the last date
of the month of each monthly transaction of Energía Base or
FONI installment, and the day prior to the due date of such monthly
transaction or installment. These amounts should be paid one day
after the due date of the payment of each monthly transaction of
Energía Base or FONI installment. However, for the January
2019 installment, with due date on March 14, 2019, the foreign
exchange difference was payed on April 5, 2019. The foreign
exchange difference on the February 2019 monthly transaction of
Energía Base and FONI installments has not been collected as
of the date of this annual report.
Under the Macri
administration, we expect an improvement in CAMMESA from an
operational and a creditworthiness perspective, which we believe
should, in turn, improve CAMMESA
’
s payment cycle to generation
companies, including us.
Under our contracts
with YPF, we typically issue monthly invoices and YPF pays them
within 35 to 45 days after they are issued. Our invoices are issued
in U.S. dollars) and payments are made in pesos at the exchange
rate as of the date of the payment.
Under our PPAs
pursuant to Energía Plus, we typically issue monthly invoices
and the off-taker pays them within 20 to 30 days after they are
issued. The tariff for the energy sold is set in U.S. dollars. Our
invoices can be issued in U.S. dollars or pesos converted into U.S.
dollars, and are payable in pesos at the exchange rate as of the
date of the payment, with the off-taker in this second case
typically covering any exchange rate fluctuations as a result of
any payment delay through credit or debit payments.
With respect to the
FONINVEMEM program, after commercial authorization was granted to
the Manuel Belgrano power plant (on January 7, 2010) and the San
Martín power plant (on February 2, 2010), we started to
collect monthly partial payments of our outstanding receivables
from electric power sales from January 2004 through December 2007.
These receivables are denominated in U.S. dollars bearing interest
at LIBOR
plus
1% (for
receivables paid from the proceeds of the Manuel Belgrano plant)
and 2% (for receivables paid from the proceeds of the
“
San Mart
’
n
”
power plant), and payments are made
in pesos at the exchange rate as of the date of the
payment.
Regarding the CVO
Agreement, effective as of March 20, 2018, CAMMESA granted the CVO
Commercial Approval in the WEM, as a combined cycle, of the thermal
plant Central Vuelta de Obligado, which entitled us to receive the
collection of the trade receivables under the CVO Agreement. A PPA
between the CVO Trust and CAMMESA, through which the CVO Trust
makes energy sales and, consequently, receives the cash flow to pay
the trade receivables, had to be signed in order to start the
collections.
The PPA agreement
was signed on February 7, 2019, with retroactive effect to March
20, 2018.
As a result, the
original amortization schedule from the CVO Agreement is in full
force and effect.
The unpaid
installments corresponding to the March-December 2018 period add up
to US$ 78.15 million (including VAT, corresponding to installments
1 to 10). As of the day of this annual report, we continue in
negotiations with CAMMESA to collect such unpaid amounts as soon as
possible, plus the accrued interest between each due date and the
effective payment date.
Despite the
referred unpaid installments, as of the date of this annual report,
we received the payment related to January and February 2019
(corresponding to installments 11 and 12, respectively) pursuant to
the CVO Agreement’s original disbursement schedule, at the
exchange rate of the last date of each month, on its respective due
dates, in March and April 2019, respectively.
Trade Receivables and Other Receivables
Our finance
department is in charge of managing customer credit risk subject to
policies, procedures and controls relating to ours credit risk
management. Accounts receivable are regularly monitored. Even
though we have not received guarantees, we have the authority to
cause the power supply to be interrupted if clients fail to meet
their credit obligations. For information on credit concentration,
see Note 14.1 to our audited consolidated financial statements. The
need to book impairment is analyzed at the end of each reporting
period on an individual basis for major clients. The allowance
recorded as of December 31, 2018 is deemed sufficient to cover the
potential impairment in the value of our receivables.
195
Cash and Short-Term Investments
Our treasury
department manages the credit risk inherent to balances held in
banks and financial institutions, pursuant to our corporate policy.
Excess funds are invested with approved counterparts only, which
are limited to banks with high credit ratings, thereby mitigating
risk.
Public and Corporate Securities
Our finance
department manages this risk based on our corporate policies,
pursuant to which we are only allowed to invest in first-class
companies and in instruments issued by the federal or provincial
governments.
Liquidity Risk
We manage liquidity
with the aim of guaranteeing that the necessary funds are available
to support our business strategy. Short-term financing needs
related to seasonal increases in working capital are covered
through short- and medium-term bank credit lines. The following
tables show the maturity profile of our financial
liabilities.
As of December 31,
2018:
|
|
Less than 3 months
|
3 to 12 months
|
1 to 5 years
|
Total
|
|
|
(in thousands of Ps.)
|
|||
|
CAMMESA borrowings
and other borrowings
|
8,395
|
1,822,759
|
6,862,758
|
8,693,912
|
|
Trade and other
payables
|
1,729,909
|
-
|
-
|
1,729,909
|
|
Total
|
1,738,304
|
1,822,759
|
6,862,758
|
10,423,821
|
As of December 31,
2017:
|
|
Less
than 3 months
|
3 to 12
months
|
1 to 5
years
|
Total
|
|
|
(in thousands of Ps.)
|
|||
|
CAMMESA borrowings
and other borrowings
|
345
|
3,948,515
|
3,127,689
|
7,076,549
|
|
Trade and other
payables
|
1,499,027
|
2,858
|
-
|
1,501,885
|
|
Total
|
1,499,372
|
3,951,373
|
3,127,689
|
8,578,434
|
Not
applicable.
Not
applicable.
Not
applicable.
Fees and Charges
As an ADS holder,
you will be required to pay the following fees under the terms of
the deposit agreement:
|
Service
|
Fees
|
|
Issuance of ADSs
(e.g., an issuance of ADS upon a deposit of common shares, upon a
change in the ADS(s)-to-common share(s) ratio, or for any other
reason), excluding ADS issuances as a result of distributions of
common shares)
|
Up to U.S.
5
¢
per ADS
issued
|
|
Cancellation of
ADSs (e.g., a cancellation of ADSs for delivery of deposited
property, upon a change in the ADS(s)-to-common share(s) ratio, or
for any other reason)
|
Up to U.S.
5
¢
per ADS
cancelled
|
196
|
Service
|
Fees
|
|
Distribution of
cash dividends or other cash distributions (e.g., upon a sale of
rights and other entitlements)
|
Up to U.S.
5
¢
per ADS
held
|
|
Distribution of
ADSs pursuant to (i) stock dividends or other free stock
distributions, or (ii) exercise of rights to purchase additional
ADSs
|
Up to U.S.
5
¢
per ADS
held
|
|
Distribution of
securities other than ADSs or rights to purchase additional ADSs
(e.g., upon a spin-off)
|
Up to U.S.
5
¢
per ADS
held
|
|
ADS
Services
|
Up to U.S.
5
¢
per ADS held on the
applicable record date(s) established by the depositary
bank
|
As an ADS holder
you will also be responsible to pay certain charges such
as:
● taxes
(including applicable interest and penalties) and other
governmental charges;
● the
registration fees as may from time to time be in effect for the
registration of common shares on the share register and applicable
to transfers of common shares to or from the name of the custodian,
the depositary bank or any nominees upon the making of deposits and
withdrawals, respectively;
● certain
cable, telex and facsimile transmission and delivery
expenses;
● the
expenses and charges incurred by the depositary bank in the
conversion of foreign currency;
● the
fees and expenses incurred by the depositary bank in connection
with compliance with exchange control regulations and other
regulatory requirements applicable to common shares, ADSs and ADRs;
and
● the
fees and expenses incurred by the depositary bank, the custodian,
or any nominee in connection with the servicing or delivery of
deposited property.
ADS fees and
charges for (i) the issuance of ADSs, and (ii) the cancellation of
ADSs are charged to the person for whom the ADSs are issued (in the
case of ADS issuances) and to the person for whom ADSs are
cancelled (in the case of ADS cancellations). In the case of ADSs
issued by the depositary bank into DTC, the ADS issuance and
cancellation fees and charges may be deducted from distributions
made through DTC, and may be charged to the DTC participant(s)
receiving the ADSs being issued or the DTC participant(s) holding
the ADSs being cancelled, as the case may be, on behalf of the
beneficial owner(s) and will be charged by the DTC participant(s)
to the account of the applicable beneficial owner(s) in accordance
with the procedures and practices of the DTC participants as in
effect at the time. ADS fees and charges in respect of
distributions and the ADS service fee are charged to the holders as
of the applicable ADS record date. In the case of distributions of
cash, the amount of the applicable ADS fees and charges is deducted
from the funds being distributed. In the case of (i) distributions
other than cash and (ii) the ADS service fee, holders as of the ADS
record date will be invoiced for the amount of the ADS fees and
charges and such ADS fees and charges may be deducted from
distributions made to holders of ADSs. For ADSs held through DTC,
the ADS fees and charges for distributions other than cash and the
ADS service fee may be deducted from distributions made through
DTC, and may be charged to the DTC participants in accordance with
the procedures and practices prescribed by DTC and the DTC
participants in turn charge the amount of such ADS fees and charges
to the beneficial owners for whom they hold ADSs.
In the event of
refusal to pay the depositary bank fees, the depositary bank may,
under the terms of the deposit agreement, refuse the requested
service until payment is received or may set off the amount of the
depositary bank fees from any distribution to be made to the ADS
holder. Certain of the depositary fees and charges (such as the ADS
services fee) may become payable shortly after the closing of the
ADS offering. Note that the fees and charges you may be required to
pay may vary over time and may be changed by us and by the
depositary bank. You will receive prior notice of such changes. The
depositary bank may reimburse us for certain expenses incurred by
us in respect of the ADR program, by making available a portion of
the ADS fees charged in respect of the ADR program or otherwise,
upon such terms and conditions as we and the depositary bank agree
from time to time. Accordingly, on January 18, 2019, we received
US$ 1,066,706.10 from the depositary bank.
None.
None.
197
Evaluation of Disclosure Controls and Procedures
(a) Evaluation of
Disclosure Controls and Procedures
Our company, under
the supervision and with the participation of our chief executive
officer and chief financial officer, has evaluated the
effectiveness of the design and operation of the Company’s
disclosure controls and procedures pursuant to 13a-15(e) of the
Exchange Act, as of December 31, 2018.
There are inherent
limitations to the effectiveness of any system of disclosure
controls and procedures, including the possibility of human error
and the circumvention or overriding of the controls and procedures.
Accordingly, even effective disclosure controls and procedures can
only provide reasonable assurance of achieving their control
objectives. Based upon their evaluation,
our
company
’
s Chief Executive
Officer and Chief Financial Officer concluded that
as of
December 31, 2018, our
disclosure controls
and procedures were effective
to provide reasonable
assurance of achieving their control objectives
.
(b)
Management’s
Report on
Internal Control over Financial Reporting
Our management is
responsible for establishing and maintaining adequate internal
control over financial reporting as defined in Rules 13a-15(f) and
15d-15(f) under the Securities Exchange Act of 1934. The
company’s internal control over financial reporting was
designed to provide reasonable assurance regarding the reliability
of financial reporting and the preparation of financial statements
for external purposes in accordance with International Financial
Reporting Standards (“IFRS”) as issued by the
International Accounting Standards Board. The company’s
internal control over financial reporting includes those policies
and procedures that:
(i) pertain to
the maintenance of records that, in reasonable detail, accurately
and fairly reflect the transactions and dispositions of the assets
of the company;
(ii) provide
reasonable assurance that transactions are recorded as necessary to
permit preparation of financial statements in accordance with IFRS,
and that receipts and expenditures of the company are being made
only in accordance with authorizations of management and directors
of the company; and
(iii) provide
reasonable assurance regarding prevention or timely detection of
unauthorized acquisition, use or disposition of the company’s
assets that could have a material effect on the financial
statements.
Because of its
inherent limitations, internal control over financial reporting may
not prevent or detect misstatements. Also, projections of any
evaluation of effectiveness to future periods are subject to the
risk that controls may become inadequate because of changes in
conditions, or that the degree of compliance with the policies or
procedures may deteriorate.
Management assessed
the effectiveness of the company’s internal control over
financial reporting as of December 31, 2018. In making this
assessment, management used the criteria set forth by the Committee
of Sponsoring Organizations of the Treadway Commission (COSO) in
Internal Control-Integrated Framework (2013). Based on our
assessment and those criteria, management believes that the company
maintained effective internal control over financial reporting as
of December 31, 2018
(c) Attestation
report of the registered public
accounting firm
Not applicable, in
light of the Company’s status as an EGC.
(d) Changes
in internal controls over
financial reporting
There was no change
in our internal control over financial reporting that occurred
during the period covered by this annual report that has materially
affected, or is reasonably likely to materially affect, our
internal control over financial reporting.
Mr. Miguel Dodero
is our audit committee’s financial expert. He is an
independent member of the audit committee under Rule 10A-3 and
applicable NYSE standards.
We have adopted a
“Code of Business Conduct” (the “code”)
designed to establish guidelines with respect to professional
conduct, morals and employee performance. This code applies to all
directors, managers, heads and employees of the Company. The code
is posted on our website at
http://investors.centralpuerto.com/govdocs
.
In 2018
, the code was amended to comply with the
requirements set forth in Argentine Law No. 27.401 (the
“Corporate Criminal Liability Law”), which include that
the Company’s employees while dealing with public sector
officers or agencies on behalf of the Company shall act with due
care and shall avoid, at all times, circumstances that may be
considered contrary to the public duties of such public sector
officers, illicit enrichment of such public sector officers,
bribery and influence-peddling, extortion and preparation of false
balance sheets and reports. On March 9, 2018, our Audit Committee
approved the amendment. In addition, we did not grant any waivers
to the code during the year ended December 31, 2018.
198
Pistrelli, Henry
Martin y Asociados S.R.L. (a member firm of Ernst & Young
Global) acted as our independent registered public accounting firm
for the fiscal years ended December 31, 2018 and 2017. The
following tables sets forth the total amount billed to us and our
subsidiaries for the indicated fiscal years (stated in the current
measurement unit as of December 31, 2018):
|
|
2018
|
2017
|
|
|
(
in thousands of Ps.
)
|
|
|
Audit
Fees
|
10,670
|
19,140
|
|
Tax
Fees
|
1,158
|
565
|
|
All other
fees
|
2,540
|
-
|
|
Total
|
14,368
|
19,705
|
Audit fees
are fees billed for
professional services rendered by the principal accountant for the
audit of the registrant’s annual consolidated financial
statements or services that are normally provided by the accountant
in connection with statutory and regulatory filings or engagements
for those fiscal years. It includes the audit of our annual
consolidated financial statements, the reviews of our quarterly
consolidated financial statements submitted to CNV and other
services that generally only the independent accountant reasonably
can provide, such as comfort letters, statutory audits, attestation
services, consents and assistance with and review of documents
filed with the SEC.
Tax fees
are billed for professional
services related to tax compliance and tax advice for fiscal years
2018 and 2017, respectively.
All other fees are
billed for professional services related to assistance and training
on the implementation of certain internal control
procedures.
Not
applicable.
None.
Not
applicable.
NYSE Corporate Governance Rules
Under NYSE rules,
foreign private issuers are subject to more limited corporate
governance requirements than U.S. domestic issuers. As a foreign
private issuer, we must comply with Sections 303A.06, 303A.11 and
303A.12(b) and (c) of the NYSE Listed Company Manual which set
forth the following corporate governance rules: (i) we must satisfy
the requirements of Rule 10A-3 of the Exchange Act relating to
audit committees; (ii) our CEO must promptly notify the NYSE in
writing after any executive officer becomes aware of any
non-compliance with the applicable NYSE corporate governance rules;
(iii) we must provide a brief description of any significant
differences between our corporate governance practices and those
followed by U.S. companies under NYSE listing standards; and (iv)
we must provide the NYSE with annual and interim written
affirmations as required under the NYSE corporate governance
rules.
199
The table below
briefly describes the significant differences between our Argentine
corporate governance rules and the NYSE corporate governance
rules:
|
Section
|
NYSE corporate governance rule for U.S. domestic
issuers
|
|
Argentine corporate governance rules
|
|
303A.01
|
A listed company
must have a majority of independent directors.
“
Controlled companies
”
are not required to comply with
this requirement.
|
|
A listed company
must have at least two independent directors who form a majority of
the Audit Committee.
|
200
|
303A.
02
|
No director
qualifies as “independent” unless the board of
directors affirmatively determines that the director has no
material relationship with the listed company (whether directly or
as a partner, shareholder, or officer of an organization that has a
relationship with the company), and emphasizes that the concern is
independence from management. The board is also required, on a case
by case basis, to express an opinion with regard to the
independence or lack of independence, of each individual
director.
|
|
Pursuant to CNV
Rules, a director is not independent if such director
is:
(a) a
member of management or an employee of shareholders who hold
material holdings in the listed company or of other entities in
which these shareholders have material holdings or over which these
shareholders exercise a material influence;
(b)
is currently an
employee or has, in the last three years, been an employee of the
listed company;
(c)
a person who has a
professional relationship or is part of a company or professional
association that maintains professional relations with, or that
receives remunerations or fees (other than directors
’
fees) from, the listed company or
from shareholders that have material holdings in the listed
company, or with a company in which such shareholders have material
holdings or exercise a material influence;
(d)
a person who has
material holdings in the listed company or in an entity that has
material holdings in, or exercises a material influence over, the
listed company;
(e)
a person who directly
or indirectly provides goods or services to the listed company or
to shareholders that have material holdings in or exercise a
material influence over the listed company and receives
compensation for such services that is substantially higher than
that received as director of the listed company;
(f)
the member is married
or is a family member to an individual who would not qualify as
independent.
(g) the member is
the director, CEO, administrator or principal executive from a
non-profit organization which had received funds for amounts
exceeding those established by Resolution No. 30/2011
of the UIF
(currently equivalent to Ps.300,000), coming from the company, or a
parent company;
(h) a person who
receive any payments from the company or group companies other than
fees as a director or dividends as shareholder; or
(i) a member of the
administrative or supervisory committee and/or hold a significant
participation (directly or indirectly) with respect to one or more
companies that are registered as Agente de Negociación, Agente
de Liquidación y Compensación y/o Agente de Corretaje de
Valores Negociables.
It is necessary to
comply with the conditions of independence for at least three years
before the designation as a director.
The independent
directors will cease to be independent after 10 years of holding
its position of directors, and will be restored with its status of
independent three years after leaving office.
“Material
holdings” are shareholdings, either directly or indirectly,
that represent at least 5% of the capital stock of the relevant
entity, or a smaller percentage when the person has the right to
elect one or more directors per class of shares or by having
entered into agreements with other shareholders relating to the
governance and the management of the relevant entity or of its
controlling shareholders.
|
|
303A.03
|
The non-management
directors of a listed company must meet at regularly scheduled
executive sessions without management.
|
|
Neither Argentine
law nor our bylaws require the holding of such meetings and we do
not hold non-management directors meetings.
The Argentine
Corporate Law provides, however, that the board shall meet at least
once every three months, and according to our bylaws, whenever the
chairman considers necessary to convene for a meeting.
|
|
303A.04
|
A listed company
must have a nominating/corporate governance committee composed
entirely of independent directors, with a written charter that
covers certain minimum specified duties.
“
Controlled companies
”
are not required to comply with
this requirement.
|
|
Neither Argentine
law nor our bylaws require the establishment of a
nominating/corporate governance committee. We do not have a
nominating/corporate governance committee.
Directors are
nominated and appointed by the shareholders.
|
|
303A.05
|
A listed company
must have a compensation committee composed entirely of independent
directors, with a written charter that covers certain minimum
specified duties.
“
Controlled companies
”
are not required to comply with
this requirement.
|
|
Neither Argentine
law nor our bylaws require the establishment of a compensation
committee. We do not have a compensation committee.
The compensation of
our directors is determined at the annual ordinary
shareholders
’
meeting.
Additionally, the audit committee must issue an opinion regarding
the reasonableness and adequacy of such compensation.
|
201
|
303A.06*
|
A listed company
must have an audit committee with a minimum of three independent
directors who satisfy the independence requirements of Rule 10A-3,
with a written charter that covers certain minimum specified
duties.
|
|
Argentine law
requires the audit committee be composed of three or more members
from the board of directors (with a majority of independent
directors), all of whom must be well-versed in business, financial
or accounting matters. In addition, we are required to satisfy the
audit committee requirements of Rule 10A-3.
The
responsibilities of an audit committee, as provided in Law No.
26,831 and the CNV standards, are essentially the same as those
provided for under Rule 10A-3, including, but not limited to, the
following:
(a)
advise on the board of
directors
’
proposal for
the designation of external independent accountants and to ensure
their independence;
(b)
oversee our internal
control mechanisms and administrative and accounting procedures and
assess the reliability of all financial and other relevant
information filed with the CNV and other entities to which we
report;
(c)
oversee our
information policies concerning risk management;
(d)
provide the market
with complete information on transactions in which there may be a
conflict of interest with members of our various corporate bodies
or controlling shareholders;
(e)
advise on the
reasonableness of fees or stock option plans for our directors and
managers proposed by the board of directors;
(f) advise
on our fulfillment of legal requirements and the reasonableness of
the terms of the issuance of shares or other instruments that are
convertible into shares in cases of capital increase in which
pre-emptive rights are excluded or limited;
(g) verify
the fulfillment of any applicable rules of conduct;
and
(h) issue
grounded opinions on related-party transactions under certain
circumstances and file such opinions with regulatory agencies as
required by the CNV in the case of possible conflicts of
interest.
|
|
303A.08
|
Shareholders must
be given the opportunity to vote on all equity-compensation plans
and material revisions thereto, with limited exemptions set forth
in the NYSE rules.
|
|
The basic terms for
any equity-based compensation plan should be considered by the
general shareholders
’
meeting, notwithstanding its power to delegate any decision to the
board of directors. We do not currently offer equity-based
compensation to our directors, executive officers or employees, and
have no policy on this matter.
|
|
303A.09
|
A listed company
must adopt and disclose corporate governance guidelines that cover
certain minimum specified subjects.
|
|
Neither Argentine
law nor our bylaws require the adoption or disclosure of corporate
governance guidelines. The CNV Rules contain a recommended Code of
Corporate Governance for listed companies and the board of
directors must include on its annual report, the degree of
compliance of such code. We have adopted, as of May 26, 2011, a
corporate governance manual.
|
|
303A.10
|
A listed company
must adopt and disclose a code of business conduct and ethics for
directors, officers and employees, and promptly disclose any
waivers of the code for directors or executive
officers.
|
|
Neither Argentine
law nor our bylaws require the adoption or disclosure of a code of
business conduct. We, however, have adopted a code of business
conduct and ethics that applies to all of our
employees.
|
202
|
303A.12
|
a) Each listed
company CEO must certify to the NYSE each year that he or she is
not aware of any violation by the company of NYSE corporate
governance listing standards.
b)* Each listed
company CEO must promptly notify the NYSE in writing after any
executive officer of the listed company becomes aware of any
non-compliance with any applicable provisions of this Section
303A.
c)* Each listed
company must submit an executed Written Affirmation annually to the
NYSE. In addition, each listed company must submit an interim
Written Affirmation as and when required by the interim Written
Affirmation form specified by the NYSE.
|
|
The CNV Rules
provide that each year the board of directors shall include in the
annual report included in the financial statement, a report on the
degree of compliance with the code of corporate governance for
listed companies included in the CNV Rules. In such report, which
shall be submitted to the CNV and published for the general public,
the board of directors must: (i) inform if it fully complies with
the guidelines and recommendations of the aforementioned code of
corporate governance; or (ii) explain the reasons for which it
complies only partially or it does not comply with such principles
and recommendations, and indicate if the company intends to
incorporate the principles and guidelines it failed to adopt. To
such end, the company must (a) adopt the principles as general
corporate governance guidelines and the recommendations as a
framework to adopt the principles within the company; (b) notify
compliance with each of the recommendations included in the
Corporate Governance Manual; (c) in case of compliance include the
required information in accordance with CNV Rules; and (d) in case
of partial or non-compliance, justify such event and indicate the
action plan for future years, or an indication of the reasons for
which the board of directors does not consider appropriate or
applicable to follow the recommendations and guidelines provided in
the CNV Rules.
|
* We are
required to comply with these rules under the NYSE Listed Company
Manual
* We are
required to conform the structure of the Board of Directors to the
independence criteria established in article 11, Chapter III, Title
II of the CNV Rules by the first shareholders meeting held after
December 31, 2018.
Not
applicable.
The Company has
responded to Item 18 in lieu of responding to this Item
17.
Our audited
consolidated financial statements are included in this annual
report beginning at Page F-1.
EXHIBIT INDEX
|
Exhibit
Number
|
Description
|
|
|
English translation of bylaws of Central Puerto
S.A. (incorporated by reference to Exhibit 3.1 of our registration
statement on Form F-1 (File No. 333-222402), as amended, filed with
the Commission on January 3, 2018).
|
|
|
Form of deposit agreement among Central Puerto
S.A., Citibank, N.A. and the holders and beneficial owners of ADSs
issued thereunder (incorporated by reference to our registration
statement on Form F-6 (File No. 333-222584) filed with the
Commission on January 17, 2018).
|
|
|
English translation of the Shareholders Agreement
of CP Renovables S.A., dated as of January 18, 2017, among Central
Puerto S.A. and Guillermo Pablo Reca (incorporated by reference to
Exhibit 10.1 of our registration statement on Form F-1 (File No.
333-222402), as amended, filed with the Commission on January 3,
2018).
|
203
|
|
Guarantee and Sponsor Support Agreement, dated as
of December 22, 2017, among CP La Castellana S.A.U., as Borrower,
CP Renovables S.A., as Sponsor and Shareholder, Central Puerto
S.A., as Sponsor Guarantor and Shareholder, the Inter-American
Investment Corporation, the Inter-American Investment Corporation,
acting as agent for the Inter-American Development Bank, the
Inter-American Investment Corporation, in its capacity as
administrator of the Canadian Climate Fund for the Private Sector
of the Americas, the International Finance Corporation, as Senior
Lenders, The Eligible Hedge Providers Listed Therein, and Citibank,
N.A., as Offshore Collateral Agent (incorporated by reference to
Exhibit 10.2 of our registration statement on Form F-1 (File No.
333-222402), as amended, filed with the Commission on January 3,
2018).
|
|
|
Common Terms Agreement (the “Common Terms
Agreement”), dated as of October 20, 2017, among CP La
Castellana S.A.U., the Inter-American Investment Corporation, the
Inter-American Investment Corporation, acting as agent for the
Inter-American Development Bank, the Inter-American Investment
Corporation, as agent of the Inter-American Development Bank, in
its capacity as administrator of the Canadian Climate Fund for the
Private Sector of the Americas, and the International Finance
Corporation (incorporated by reference to Exhibit 10.3 of our
registration statement on Form F-1 (File No. 333-222402), as
amended, filed with the Commission on January 3,
2018).
|
|
|
Amendment and Waiver to the Common Terms
Agreement, dated as of December 22, 2017 (incorporated by reference
to Exhibit 10.4 of our registration statement on Form F-1 (File No.
333-222402), as amended, filed with the Commission on January 3,
2018).
|
|
|
Loan Agreement, dated as of October 20, 2017,
among CP La Castellana S.A.U., the Inter-American Investment
Corporation, the Inter-American Investment Corporation, acting as
agent for the Inter-American Development Bank, and the
Inter-American Investment Corporation, as agent of the
Inter-American Development Bank, in its capacity as administrator
of the Canadian Climate Fund for the Private Sector of the Americas
(incorporated by reference to Exhibit 10.5 of our registration
statement on Form F-1 (File No. 333-222402), as amended, filed with
the Commission on January 3, 2018).
|
|
|
Loan Agreement, dated as of October 20, 2017,
among CP La Castellana S.A.U. and the International Finance
Corporation (incorporated by reference to Exhibit 10.6 of our
registration statement on Form F-1 (File No. 333-222402), as
amended, filed with the Commission on January 3,
2018).
|
|
|
English translation of Agreement for Project
Management and Operation, Increase of Thermal Generation
Availability and Adaptation of Remuneration for Generation
2008-2011, dated as of November 25, 2010, among the Secretary of
Energy of the Ministry of Federal Planification, Public Investment
and Services, and the generators named therein (the
“FONINVEMEM Arrangement for CVOSA”) (incorporated by
reference to Exhibit 10.7 of our registration statement on Form F-1
(File No. 333-222402), as amended, filed with the Commission on
January 3, 2018).
|
|
|
English translation of Addendum No. 1 to the
Agreement for Project Management and Operation, Increase of Thermal
Generation Availability and Adaptation of Remuneration for
Generation 2008-2011, dated as of April 12, 2011, among the
Secretary of Energy of the Ministry of Federal Planification,
Public Investment and Services, and the generators named therein
(incorporated by reference to Exhibit 10.8 of our registration
statement on Form F-1 (File No. 333-222402), as amended, filed with
the Commission on January 3, 2018).
|
|
|
English translation of Addendum No. 2 to the
Agreement for Project Management and Operation, Increase of Thermal
Generation Availability and Adaptation of Remuneration for
Generation 2008-2011, dated as of June 25, 2012, among the
Secretary of Energy of the Ministry of Federal Planification,
Public Investment and Services, and the generators named therein
(incorporated by reference to Exhibit 10.9 of our registration
statement on Form F-1 (File No. 333-222402), as amended, filed with
the Commission on January 3, 2018).
|
|
|
English translation of Final Agreement for the
Management and Operation of Projects for the Reconversion of the
MEM Under the Scope of Resolution 1427/2004 Issued by the
Secretariat of Energy, as dated October 17, 2005, among the
Argentine Secretary of Energy and the generators named therein (the
“FONINVEMEM Arrangement for TJSM and TMB”)
(incorporated by reference to Exhibit 10.10 of our registration
statement on Form F-1 (File No. 333-222402), as amended, filed with
the Commission on January 3, 2018).
|
|
|
English
translation of the Offer to Transfer the La Plata Steam and
Electric Power Cogeneration Plant, dated as of December 15, 2017,
from Central Puerto S.A. to YPF Energía Eléctrica S.A.
(incorporated by reference to Exhibit 10.11 of our registration
statement on Form F-1 (File No. 333-222402), as amended, filed with
the Commission on January 3, 2018).
|
204
|
|
Common Terms Agreement, dated as of January 17,
2018, among CP Achiras S.A.U., the Inter-American Investment
Corporation, the Inter-American Investment Corporation, acting as
agent for the Inter-American Development Bank, the Inter-American
Investment Corporation, as agent of the Inter-American Development
Bank, in its capacity as administrator of the Canadian Climate Fund
for the Private Sector of the Americas, and the International
Finance Corporation (incorporated by reference to Exhibit 10.12 of
our registration statement on Form F-1 (File No. 333-222402), as
amended, filed with the Commission on January 3,
2018).
|
|
|
Loan Agreement, dated as of January 17, 2018,
among CP Achiras S.A.U., the Inter-American Investment Corporation,
the Inter-American Investment Corporation, acting as agent for the
Inter-American Development Bank, and the Inter-American Investment
Corporation, as agent of the Inter-American Development Bank, in
its capacity as administrator of the Canadian Climate Fund for the
Private Sector of the Americas (incorporated by reference to
Exhibit 10.13 of our registration statement on Form F-1 (File No.
333-222402), as amended, filed with the Commission on January 3,
2018).
|
|
|
Loan Agreement, dated as of January 17, 2018,
among CP Achiras S.A.U. and the International Finance Corporation
(incorporated by reference to Exhibit 10.14 of our registration
statement on Form F-1 (File No. 333-222402), as amended, filed with
the Commission on January 3, 2018).
|
|
|
Guarantee and
Sponsor Support Agreement, dated as of February 22, 2018, among CP
Achiras S.A.U., as Borrower, CP Renovables S.A., as Sponsor and
Shareholder, Central Puerto S.A., as Sponsor Guarantor and
Shareholder, the Inter-American Investment Corporation, the
Inter-American Investment Corporation, acting as agent for the
Inter-American Development Bank, the Inter-American Investment
Corporation, in its capacity as administrator of the Canadian
Climate Fund for the Private Sector of the Americas, the
International Finance Corporation, as Senior Lenders, and Citibank,
N.A., as Offshore Collateral Agent (incorporated by reference to
Exhibit 4.15 of our annual report on Form 20-F (File No.
001-38376), filed with the Commission on April 27,
2018).
|
|
|
Wind Farm Omnibus
Amendment and Agreement, dated March 16, 2018, among CP Achiras
S.A.U., the Inter-American Investment Corporation, the
Inter-American Investment Corporation, acting as agent for the
Inter-American Development Bank, the Inter-American Investment
Corporation, as agent of the Inter-American Development Bank, in
its capacity as administrator of the Canadian Climate Fund for the
Private Sector of the Americas, and the International Finance
Corporation (incorporated by reference to Exhibit 4.16 of our
annual report on Form 20-F (File No. 001-38376), filed with the
Commission on April 27, 2018).
|
|
|
English translation
of the terms and conditions of the amended and restated
Shareholders Agreement of CP Renovables S.A., dated as of November
28, 2018, among Central Puerto S.A. and Guillermo Pablo Reca
(incorporated by reference to Exhibit 2 of our current report on
Form 6-K furnished with the Commission on November 28,
2018).
|
|
List of
subsidiaries of Central Puerto S.A. as of the date of this annual
report.
|
|
|
Code of Ethics of
Central Puerto S.A., as amended (incorporated by reference to
Exhibit 11.1 of our annual report on Form 20-F (File No.
001-38376), filed with the Commission on April 27,
2018)
|
|
|
Certification of
Chief Executive Officer pursuant to Section 302 of the
Sarbanes-Oxley Act of 2002.
|
|
|
Certification of
Chief Financial Officer pursuant to Section 302 of the
Sarbanes-Oxley Act of 2002.
|
|
|
Certification of
Chief Executive Officer and Chief Financial Officer pursuant to
Section 906 of the Sarbanes-Oxley Act of 2002.
|
|
|
Consent of Vaisala, Inc. (incorporated by
reference to Exhibit 23.5 of our registration statement on Form F-1
(File No. 333-222402), as amended, filed with the Commission on
January 3, 2018).
|
|
|
101
|
XBRL Instance
Document and related items.
|
205
SIGNATURES
The registrant
hereby certifies that it meets all of the requirements for filing
on Form 20-F and that it has duly caused and authorized the
undersigned to sign this annual report on its behalf.
|
|
CENTRAL PUERTO
S.A.
|
|
|
|
|
|
|
|
|
Date: April 30,
2019.
|
By:
|
/s/
Fernando Roberto
Bonnet
|
|
|
|
|
Fernando Roberto
Bonnet
|
|
|
|
|
Chief Financial
Officer
|
|
206
INDEX TO THE FINANCIAL STATEMENTS
|
|
Page
|
|
Audited
Consolidated Financial Statements of Central Puerto
S.A.
|
|
|
Report of the
Independent Registered Public Accounting Firm
|
F- 1
|
|
Consolidated
Statement of Income for the years ended December 31, 2018, 2017 and
2016
|
F- 2
|
|
Consolidated
Statement of Comprehensive Income for the years ended December 31,
2018, 2017 and 2016
|
F- 3
|
|
Consolidated
Statement of Financial Position as of December 31, 2018 and
2017
|
F- 4
|
|
Consolidated
Statement of Changes in Equity for the years ended December 31,
2018, 2017 and 2016
|
F- 5
|
|
Consolidated
Statement of Cash Flows for the years ended December 31, 2018, 2017
and 2016
|
F- 6
|
|
Notes to the
Consolidated Financial Statements
|
F- 7
|
REPORT OF INDEPENDENT REGISTERED PUBLIC ACCOUNTING
FIRM
To the
Shareholders and Board of Directors of Central Puerto
S.A.:
Opinion on the Financial Statements
We have
audited the accompanying consolidated statements of financial
position of Central Puerto S.A. (the “Company”) as of
December 31, 2018 and 2017, the related consolidated statements of
income, comprehensive income, changes in equity and cash flows for
each of the three years in the period ended December 31, 2018, and
the related notes (collectively referred to as the
“consolidated financial statements”). In our opinion,
the consolidated financial statements present fairly, in all
material respects, the financial position of the Company at
December 31, 2018 and 2017, and the results of its operations and
its cash flows for each of the three years in the period ended
December 31, 2018, in conformity with International Financial
Reporting Standards as issued by the International Accounting
Standards Board.
Basis for Opinion
These
financial statements are the responsibility of the Company's
management. Our responsibility is to express an opinion on the
Company’s financial statements based on our audits. We are a
public accounting firm registered with the Public Company
Accounting Oversight Board (United States) (PCAOB) and are required
to be independent with respect to the Company in accordance with
the U.S. federal securities laws and the applicable rules and
regulations of the Securities and Exchange Commission and the
PCAOB.
We
conducted our audits in accordance with the standards of the PCAOB.
Those standards require that we plan and perform the audit to
obtain reasonable assurance about whether the financial statements
are free of material misstatement, whether due to error or fraud.
The Company is not required to have, nor were we engaged to
perform, an audit of its internal control over financial reporting.
As part of our audits we are required to obtain an understanding of
internal control over financial reporting but not for the purpose
of expressing an opinion on the effectiveness of the Company's
internal control over financial reporting. Accordingly, we express
no such opinion.
Our
audits included performing procedures to assess the risks of
material misstatement of the financial statements, whether due to
error or fraud, and performing procedures that respond to those
risks. Such procedures included examining, on a test basis,
evidence regarding the amounts and disclosures in the financial
statements. Our audits also included evaluating the accounting
principles used and significant estimates made by management, as
well as evaluating the overall presentation of the financial
statements. We believe that our audits provide a reasonable basis
for our opinion.
/s/
PISTRELLI, HENRY MARTIN Y ASOCIADOS S.R.L.
Member
of Ernst & Young Global
We have
served as the Company’s auditor since 2002.
Buenos
Aires, Argentina
April
24, 2019
F-1
CENTRAL
PUERTO S.A.
CONSOLIDATED
STATEMENT OF INCOME
|
|
|
For the years ended
December 31,
|
||
|
|
Notes
|
2018
|
2017
|
2016
|
|
|
|
ARS
000
|
ARS
000
|
ARS
000
|
|
|
|
|
|
|
|
Continuing
operations
|
|
|
|
|
|
Revenues
|
5
|
14,265,370
|
9,638,568
|
7,044,039
|
|
Cost of
sales
|
6.1
|
(6,486,698
)
|
(5,199,149
)
|
(4,980,226
)
|
|
Gross
income
|
|
7,778,672
|
4,439,419
|
2,063,813
|
|
|
|
|
|
|
|
Administrative and
selling expenses
|
6.2
|
(1,389,336
)
|
(1,056,257
)
|
(892,626
)
|
|
Other operating
income
|
7.1
|
13,222,842
|
930,062
|
2,324,243
|
|
Other operating
expenses
|
7.2
|
(132,881
)
|
(140,138
)
|
(171,952
)
|
|
CVO receivables
update
|
14.1
|
11,017,014
|
-
|
-
|
|
Operating
income
|
|
30,496,311
|
4,173,086
|
3,323,478
|
|
|
|
|
|
|
|
Loss
on net monetary position
|
2.1.2
|
(4,036,196
)
|
(151,904
)
|
(1,836,626
)
|
|
Finance
income
|
7.3
|
2,280,193
|
1,558,816
|
873,915
|
|
Finance
expenses
|
7.4
|
(6,300,881
)
|
(1,200,654
)
|
(1,205,447
)
|
|
Share of the profit
of associates
|
3
|
1,074,185
|
1,173,004
|
422,650
|
|
Income
before income tax from continuing operations
|
|
23,513,612
|
5,552,348
|
1,577,970
|
|
|
|
|
|
|
|
Income tax for the
year
|
9
|
(6,604,351
)
|
(1,081,177
)
|
(1,006,417
)
|
|
Net
income for the year from continuing operations
|
|
16,909,261
|
4,471,171
|
571,553
|
|
|
|
|
|
|
|
Discontinued
operations
|
|
|
|
|
|
Income after tax
for the year from discontinued operations
|
21
|
276,177
|
791,274
|
806,989
|
|
Net
income for the year
|
|
17,185,438
|
5,262,445
|
1,378,542
|
|
|
|
|
|
|
|
Attributable
to:
|
|
|
|
|
|
-
Equity holders of
the parent
|
|
17,519,598
|
5,291,355
|
1,378,555
|
|
-
Non-controlling
interests
|
|
(334,160
)
|
(28,910
)
|
(13
)
|
|
|
|
17,185,438
|
5,262,445
|
1,378,542
|
|
|
|
|
|
|
|
Basic and diluted
earnings per share (ARS)
|
10
|
11.64
|
3.52
|
0.92
|
|
|
|
|
|
|
|
Basic and diluted
earnings per share from continuing operations (ARS)
|
10
|
11.46
|
2.99
|
0.38
|
F-2
CENTRAL
PUERTO S.A.
CONSOLIDATED
STATEMENT OF COMPREHENSIVE INCOME
|
|
|
For the years ended
December 31,
|
||
|
|
Notes
|
2018
|
2017
|
2016
|
|
|
|
ARS
000
|
ARS
000
|
ARS
000
|
|
|
|
|
|
|
|
Net
income for the year
|
|
17,185,438
|
5,262,445
|
1,378,542
|
|
|
|
|
|
|
|
Other
comprehensive income for the year
|
|
|
|
|
|
|
|
|
|
|
|
Other
comprehensive income to be reclassified to income in subsequent
periods
|
|
|
|
|
|
|
|
|
|
|
|
Loss on financial
assets at fair value through other comprehensive
income
|
8
|
(346,628
)
|
(768,395
)
|
588,579
|
|
Income tax related
to loss on financial assets at fair value through other
comprehensive income
|
9
|
138,629
|
268,938
|
(206,003
)
|
|
Other
comprehensive income (loss) to be reclassified to income in
subsequent periods
|
|
(207,999
)
|
(499,457
)
|
382,576
|
|
|
|
|
|
|
|
Other
comprehensive income (loss) not to be reclassified to income in
subsequent periods
|
|
|
|
|
|
|
|
|
|
|
|
Remeasurement of
losses from long-term employee benefits
|
15.3
|
20,551
|
(25,661
)
|
(37,946
)
|
|
Income tax related
to remeasurement of losses from long-term employee
benefits
|
9
|
(6,165
)
|
4,233
|
13,281
|
|
Other
comprehensive income (loss) not to be reclassified to income in
subsequent periods
|
|
14,386
|
(21,428
)
|
(24,665
)
|
|
Other
comprehensive income for the year
|
|
(193,613
)
|
(520,885
)
|
357,911
|
|
Total
comprehensive income for the year
|
|
16,991,825
|
4,741,560
|
1,736,453
|
|
|
|
|
|
|
|
Attributable
to:
|
|
|
|
|
|
-
Equity holders of
the parent
|
|
17,325,985
|
4,770,470
|
1,736,466
|
|
-
Non-controlling
interests
|
|
(334,160
)
|
(28,910
)
|
(13
)
|
|
|
|
16,991,825
|
4,741,560
|
1,736,453
|
F-3
CENTRAL
PUERTO S.A.
CONSOLIDATED
STATEMENT OF FINANCIAL POSITION
|
|
|
12-31-2018
|
12-31-2017
|
|
|
Notes
|
ARS
000
|
ARS
000
|
|
|
|
|
|
|
Assets
|
|
|
|
|
Non-current
assets
|
|
|
|
|
Property, plant and
equipment
|
12
|
22,567,418
|
17,451,669
|
|
Intangible
assets
|
13
|
2,235,230
|
1,988,603
|
|
Investment in
associates
|
3
|
1,998,336
|
1,830,138
|
|
Trade and other
receivables
|
14.1
|
16,671,608
|
3,842,054
|
|
Other non-financial
assets
|
15.1
|
222,955
|
18,782
|
|
Deferred tax
asset
|
|
-
|
2,996
|
|
Inventories
|
11
|
74,687
|
71,187
|
|
|
|
43,770,234
|
25,205,429
|
|
Current
assets
|
|
|
|
|
Inventories
|
11
|
220,896
|
194,640
|
|
Other non-financial
assets
|
15.1
|
495,130
|
695,313
|
|
Trade and other
receivables
|
14.1
|
10,579,028
|
5,733,942
|
|
Other financial
assets
|
14.8
|
1,964,630
|
1,639,941
|
|
Cash and cash
equivalents
|
16
|
229,948
|
130,863
|
|
|
|
13,489,632
|
8,394,699
|
|
Assets held for
sale
|
21
|
-
|
748,866
|
|
|
|
|
|
|
Total
assets
|
|
57,259,866
|
34,348,994
|
|
|
|
|
|
|
Equity
and liabilities
|
|
|
|
|
Equity
|
|
|
|
|
Capital
stock
|
|
1,514,022
|
1,514,022
|
|
Adjustment to
capital stock
|
|
11,442,144
|
11,442,144
|
|
Legal
reserve
|
|
383,393
|
162,480
|
|
Voluntary
reserve
|
|
4,406,281
|
1,019,873
|
|
Retained
earnings
|
|
14,715,337
|
2,206,313
|
|
Accumulated other
comprehensive income
|
|
-
|
207,999
|
|
Equity
attributable to holders of the parent
|
|
32,461,177
|
16,552,831
|
|
Non-controlling
interests
|
|
467,677
|
478,704
|
|
Total
equity
|
|
32,928,854
|
17,031,535
|
|
|
|
|
|
|
Non-current
liabilities
|
|
|
|
|
Other non-financial
liabilities
|
15.2
|
1,958,883
|
692,009
|
|
Other loans and
borrowings
|
14.3
|
5,204,030
|
2,183,278
|
|
Borrowings from
CAMMESA
|
14.4
|
1,004,304
|
1,558,485
|
|
Compensation and
employee benefits liabilities
|
15.3
|
148,470
|
166,983
|
|
Deferred income tax
liabilities
|
9
|
4,793,384
|
3,847,033
|
|
|
|
13,109,071
|
8,447,788
|
|
Current
liabilities
|
|
|
|
|
Trade and other
payables
|
14.2
|
1,729,909
|
1,501,885
|
|
Other non-financial
liabilities
|
15.2
|
1,660,944
|
973,971
|
|
Borrowings from
CAMMESA
|
14.4
|
1,812,910
|
2,588,283
|
|
Other loans and
borrowings
|
14.3
|
672,668
|
746,503
|
|
Compensation and
employee benefits liabilities
|
15.3
|
391,168
|
477,136
|
|
Income tax
payable
|
|
4,416,843
|
1,619,402
|
|
Provisions
|
18
|
537,499
|
610,476
|
|
|
|
11,221,941
|
8,517,656
|
|
Liabilities
directly associated with the assets held for sale
|
21
|
-
|
352,015
|
|
|
|
11,221,941
|
8,869,671
|
|
Total
liabilities
|
|
24,331,012
|
17,317,459
|
|
Total
equity and liabilities
|
|
57,259,866
|
34,348,994
|
F-4
CENTRAL
PUERTO S.A.
CONSOLIDATED
STATEMENT OF CHANGES IN EQUITY
|
|
Attributable to
holders of the parent
|
|
|
||||||
|
|
Capital
stock
|
Noncapitalized
contribution
|
Retained
earnings
|
|
|
|
|
||
|
|
Face
value
|
Adjustment to
capital stock
|
Merger
premium
|
Legal and other
reserves
|
Voluntary
reserve
|
Unappropriated
retained earnings
|
Other accumulated
comprehensive income (loss)
|
Non-controlling
interests
|
Total
|
|
|
ARS
000
|
ARS
000
|
ARS
000
|
ARS
000
|
ARS
000
|
ARS
000
|
ARS
000
|
ARS
000
|
ARS
000
|
|
|
|
|
|
|
|
|
|
|
|
|
As of January 1,
2018
|
1,514,022
|
11,442,144
|
-
|
162,480
|
1,019,873
|
2,206,313
|
207,999
|
478,704
|
17,031,535
|
|
|
|
|
|
|
|
|
|
|
|
|
Contributions from non-controlling
interests
|
-
|
-
|
-
|
-
|
-
|
-
|
-
|
309,764
|
309,764
|
|
Share-based
payments
|
-
|
-
|
-
|
-
|
-
|
-
|
-
|
13,369
|
13,369
|
|
|
|
|
|
|
|
|
|
|
|
|
Net income for the
year
|
-
|
-
|
-
|
-
|
-
|
17,519,598
|
-
|
(334,160
)
|
17,185,438
|
|
Other comprehensive income for the
year
|
-
|
-
|
-
|
-
|
-
|
14,386
|
(207,999
)
|
-
|
(193,613
)
|
|
Total comprehensive income for the
year
|
-
|
-
|
-
|
-
|
-
|
17,533,984
|
(207,999
)
|
(334,160
)
|
16,991,825
|
|
|
|
|
|
|
|
|
|
|
|
|
Increase in legal
reserve
|
-
|
-
|
-
|
220,913
|
-
|
(220,913
)
|
-
|
-
|
-
|
|
Increase in voluntary
reserve
|
-
|
-
|
-
|
-
|
3,386,408
|
(3,386,408
)
|
-
|
-
|
-
|
|
Dividends in
cash
|
-
|
-
|
-
|
-
|
-
|
(1,417,639
)
|
-
|
-
|
(1,417,639
)
|
|
As of December
31, 2018 (1)
|
1,514,022
|
11,442,144
|
-
|
383,393
|
4,406,281
|
14,715,337
|
-
|
467,677
|
32,928,854
|
|
|
|
|
|
|
|
|
|
|
|
|
As of January 1,
2017
|
1,514,022
|
11,954,365
|
1,240,608
|
980,579
|
1,286,285
|
(4,019,693
)
|
707,456
|
12,407
|
13,676,029
|
|
|
|
|
|
|
|
|
|
|
|
|
Loss absorption according to CNV GR
n° 777/2018, subject to Annual General Meeting’s
approval
|
-
|
(512,221
)
|
(1,240,608
)
|
(980,579
)
|
(1,286,285
)
|
4,019,693
|
-
|
-
|
-
|
|
Modified
balances as of January 1, 2017
|
1,514,022
|
11,442,144
|
-
|
-
|
-
|
-
|
707,456
|
12,407
|
13,676,029
|
|
|
|
|
|
|
|
|
|
|
|
|
Contributions from non-controlling
interests
|
-
|
-
|
-
|
-
|
-
|
7,710
|
-
|
490,052
|
497,762
|
|
Share-based
payments
|
-
|
-
|
-
|
-
|
-
|
-
|
-
|
5,155
|
5,155
|
|
|
|
|
|
|
|
|
|
|
|
|
Net income for the
year
|
-
|
-
|
-
|
-
|
-
|
5,291,355
|
-
|
(28,910
)
|
5,262,445
|
|
Other comprehensive income for the
year
|
-
|
-
|
-
|
-
|
-
|
(21,428
)
|
(499,457
)
|
-
|
(520,885
)
|
|
Total comprehensive income for the
year
|
-
|
-
|
-
|
-
|
-
|
5,269,927
|
(499,457
)
|
(28,910
)
|
4,741,560
|
|
|
|
|
|
|
|
|
|
|
|
|
Increase in legal
reserve
|
-
|
-
|
-
|
162,480
|
-
|
(162,480
)
|
-
|
-
|
-
|
|
Increase in voluntary
reserve
|
-
|
-
|
-
|
-
|
3,074,975
|
(3,074,975
)
|
-
|
-
|
-
|
|
Dividends in
cash
|
-
|
-
|
-
|
-
|
(2,055,102
)
|
166,131
|
-
|
-
|
(1,888,971
)
|
|
As of December
31, 2017 (1)
|
1,514,022
|
11,442,144
|
-
|
162,480
|
1,019,873
|
2,206,313
|
207,999
|
478,704
|
17,031,535
|
|
|
|
|
|
|
|
|
|
|
|
|
As of
January 1, 2016
|
199,742
|
10,849,883
|
1,218,414
|
826,514
|
3,429,719
|
(2,356,929
)
|
324,880
|
-
|
14,492,223
|
|
|
|
|
|
|
|
|
|
|
|
|
Contributions from non-controlling
interests
|
-
|
-
|
-
|
-
|
-
|
-
|
-
|
12,420
|
12,420
|
|
|
|
|
|
|
|
|
|
|
|
|
Net income for the
year
|
-
|
-
|
-
|
-
|
-
|
1,378,555
|
-
|
(13
)
|
1,378,542
|
|
Other comprehensive (loss) income
for the year
|
-
|
-
|
-
|
-
|
-
|
(24,665
)
|
382,576
|
-
|
357,911
|
|
Total comprehensive income for the
year, net
|
-
|
-
|
-
|
-
|
-
|
1,353,890
|
382,576
|
(13
)
|
1,736,453
|
|
|
|
|
|
|
|
|
|
|
|
|
Decrease in capital
stock
|
(10,489
)
|
(11,705
)
|
22,194
|
-
|
-
|
-
|
-
|
-
|
-
|
|
Increase in legal
reserve
|
-
|
-
|
-
|
154,065
|
-
|
(154,065
)
|
-
|
-
|
-
|
|
Increase in voluntary
reserve
|
-
|
-
|
-
|
-
|
2,927,218
|
(2,927,218
)
|
-
|
-
|
-
|
|
Dividends in
cash
|
-
|
-
|
-
|
-
|
(2,629,696
)
|
64,629
|
-
|
-
|
(2,565,067
)
|
|
Dividends in
shares
|
1,324,769
|
1,116,187
|
-
|
-
|
(2,440,956
)
|
-
|
-
|
-
|
-
|
|
As of
December 31, 2016 (1)
|
1,514,022
|
11,954,365
|
1,240,608
|
980,579
|
1,286,285
|
(4,019,693
)
|
707,456
|
12,407
|
13,676,029
|
(1)
Common stock, ARS
1.00 par value; 1,514,022,256 authorized, outstanding and issued
shares. A subsidiary holds 8,851,848 common shares.
F-5
CENTRAL
PUERTO S.A.
|
|
For the years
ended December 31,
|
||
|
|
2018
|
2017
|
2016
|
|
|
ARS
000
|
ARS
000
|
ARS
000
|
|
|
|
|
|
|
Operating
activities
|
|
|
|
|
Income for the year
before income tax from continuing operations
|
23,513,612
|
5,552,348
|
1,577,970
|
|
Income for the year
before income tax from discontinued operations
|
328,814
|
1,181,290
|
1,270,612
|
|
Income for the year
before income tax
|
23,842,426
|
6,733,638
|
2,848,582
|
|
|
|
|
|
|
Adjustments
to reconcile income for the year before income tax to net cash
flows:
|
|
|
|
|
Depreciation of
property, plant and equipment
|
1,142,555
|
1,202,107
|
999,349
|
|
Loss (gain) on
replacement/disposal of property, plant and equipment
|
104,378
|
1,351
|
4,138
|
|
Amortization of
intangible assets
|
349,674
|
413,037
|
375,909
|
|
Effect on the
discount of trade and other receivables and payables,
net
|
-
|
-
|
(1,473,236
)
|
|
CVO receivables
update
|
(11,017,014
)
|
-
|
-
|
|
Interest earned
from customers
|
(1,623,309
)
|
(437,583
)
|
(211,800
)
|
|
Finance
income
|
(2,280,193
)
|
(1,558,816
)
|
(873,915
)
|
|
Finance
expenses
|
6,300,881
|
1,200,654
|
1,205,447
|
|
Share of the profit
of associates
|
(1,074,185
)
|
(1,173,004
)
|
(422,650
)
|
|
Share-based
payments
|
13,369
|
5,155
|
-
|
|
Movements in
provisions, impairment of material and spare parts and long-term
employee benefit plan expense
|
(2,457
)
|
155,781
|
(22,695
)
|
|
Foreign exchange
difference for trade receivables
|
(11,403,596
)
|
(116,699
)
|
(302,243
)
|
|
Income from the
sale of La Plata plant
|
(468,500
)
|
-
|
-
|
|
Loss on net
monetary position
|
(2,946,943
)
|
(766,906
)
|
(1,464,073
)
|
|
|
|
|
|
|
Working
capital adjustments:
|
|
|
|
|
Decrease (Increase)
in trade and other receivables
|
5,187,097
|
(555,571
)
|
1,248,113
|
|
(Increase) Decrease
in other non-financial assets and inventories
|
(30,750
)
|
(343,515
)
|
2,389,335
|
|
Increase (Decrease)
in trade and other payables, other non-financial liabilities and
liabilities from employee benefits
|
1,808,271
|
(54,486
)
|
200,590
|
|
|
7,901,704
|
4,705,143
|
4,500,851
|
|
Interest received
from customers
|
44,358
|
119,293
|
44,219
|
|
Income tax and
minimum presumed income tax paid
|
(4,240,036
)
|
(1,161,769
)
|
(1,502,595
)
|
|
Net
cash flows provided by operating activities
|
3,706,026
|
3,662,667
|
3,042,475
|
|
|
|
|
|
|
Investing
activities
|
|
|
|
|
Purchase of
property, plant and equipment
|
(6,958,953
)
|
(5,734,812
)
|
(4,280,523
)
|
|
Cash flows
generated from the sale of the La Plata plant
|
625,905
|
-
|
-
|
|
Dividends
received
|
970,084
|
59,470
|
50,250
|
|
Sale of financial
assets, net
|
292,639
|
2,394,118
|
1,252,977
|
|
(Purchase) Sale of
investments in associates
|
-
|
(9
)
|
47,326
|
|
Net
cash flows used in investing activities
|
(5,070,325
)
|
(3,281,233
)
|
(2,929,970
)
|
|
|
|
|
|
|
Financing
activities
|
|
|
|
|
Short-term loans
received (paid), net
|
(23,139
)
|
(1,089,069
)
|
212,388
|
|
Long-term loans
received
|
4,374,978
|
2,840,834
|
1,756,246
|
|
Long-term loans
paid
|
(2,095,109
)
|
(1,654,794
)
|
-
|
|
Borrowings received
from CAMMESA
|
-
|
1,023,563
|
1,536,544
|
|
Repayment of 9%
Corporate bonds - Class I 2007
|
-
|
-
|
(1,449,341
)
|
|
Interest
paid
|
(461,443
)
|
(71,113
)
|
(139,161
)
|
|
Dividends
paid
|
(1,417,639
)
|
(1,888,971
)
|
(2,565,067
)
|
|
Contributions from
non-controlling interests
|
309,764
|
497,762
|
12,389
|
|
Net
cash flows provided by (used in) financing activities
|
687,412
|
(341,788
)
|
(636,002
)
|
|
|
|
|
|
|
(Decrease)
Increase in cash and cash equivalents
|
(676,887
)
|
39,646
|
(523,497
)
|
|
Exchange difference
and other financial results
|
1,331,368
|
66,978
|
(88,120
)
|
|
Monetary results
effect on cash and cash equivalents
|
(555,396
)
|
(31,056
)
|
(58,415
)
|
|
Cash and cash
equivalents as of January 1
|
130,863
|
55,295
|
725,327
|
|
Cash
and cash equivalents as of December 31
|
229,948
|
130,863
|
55,295
|
F-6
CENTRAL
PUERTO S.A.
1.
Corporate
information and main business
Central
Puerto S.A. (hereinafter the “Company”,
”we”, “us”, “CPSA” or
“CEPU”) and the companies that make up the business
group (hereinafter the “Group”) form an integrated
group of companies pertaining to the energy sector. The Group is
mainly engaged in electric power generation and
commercialization.
CEPU
was incorporated pursuant to Executive Order No. 122/92. We were
formed in connection with privatization process involving Servicios
Eléctricos del Gran Buenos Aires S.A. (“SEGBA”) in
which SEGBA’s electricity generation, transportation,
distribution and sales activities were privatized.
On
April 1, 1992, Central Puerto S.A., the consortium-awardee, took
possession over SEGBA’s Nuevo Puerto and Puerto Nuevo plants,
and we began operations.
Our
shares are listed on the BCBA (“Buenos Aires Stock
Exchange”), and, since February 2, 2018, they are listed on
the NYSE (“New York Stock Exchange”), both under the
symbol “CEPU”.
In
order to carry out its electric energy generation activity the
Group owns the following assets:
–
Our Puerto complex
is composed of two facilities, Central Nuevo Puerto (“Nuevo
Puerto”) and Central Puerto Nuevo (“Puerto
Nuevo”), located in the port of the City of Buenos Aires. Our
Puerto complex’s facilities include steam turbines plants and
a Combined Cycle plant and has a current installed capacity of
1,714 MW.
–
Our Luján de
Cuyo plant is located in Luján de Cuyo, Province of Mendoza
and has an installed capacity of 509 MW and a steam generating
capacity of 150 tons per hour. (See Note 22.7).
–
The Group also owns
the concession right of the Piedra del Águila hydroelectric
power plant located at the edge of Limay river in Neuquén
province. Piedra del Águila has four 360 MW generating
units.
–
The Group is
engaged in the management and operations of the thermal plants
José de San Martín and Manuel Belgrano through its equity
investees Termoeléctrica José de San Martín S.A.
(“TJSM”) and Termoeléctrica General Belgrano S.A.
(“TMB”). Those entities operate the two thermal
generation plants with an installed capacity of 865 MW and 873 MW,
respectively. Additionally, through its subsidiary Central Vuelta
de Obligado S.A. (“CVO”) the Group is engaged in the
operation of the thermal plant Central Vuelta de Obligado, with an
installed capacity of 816 MW.
The
Group is also engaged in the natural gas distribution public sector
service in the Cuyo and Centro regions in Argentina, through its
equity investees belonging to ECOGAS Group (See Note
3.2).
Through
its subsidiary Proener S.A., the Group sells and transports any
type of fuels both in the country and abroad. Moreover, on July 19,
2018, the National Gas Regulation Entity (“Enargas”)
filed the Company with the Registry of Traders and Trade Agreements
of Enargas.
Moreover, as of the
incorporation of CP Renovables S.A. (“CPR”) and its
subsidiaries, Vientos La Genoveva S.A.U. and Vientos La
Genoveva II S.A.U. the Group takes part on the development and
performance of energy projects based on the use of renewable energy
sources.
During
August and September 2018, the wind farms belonging to CP La
Castellana S.A.U. and CP Achiras S.A.U. (CPR
subsidiaries) were commissioned, respectively, with a capacity of
99 MW and 48 MW, respectively.
F-7
CENTRAL
PUERTO S.A.
Overview
of Argentine Electricity Market
Transactions among
different participants in the electricity industry take place
through the wholesale electricity market (“WEM”) which
is a market in which generators, distributors and certain large
users of electricity buy and sell electricity at prices determined
by supply and demand (“Term market”) and also, where
prices are established on an hourly basis based on the economic
production cost, represented by the short term marginal cost
measured at the system’s load center (“Spot
market”). CAMMESA (Compañía Administradora del
Mercado Mayorista Eléctrico Sociedad Anónima) is a
quasi-government organization that was established to administer
the WEM and functions as a clearing house for the different market
participants operating in the WEM. Its main functions include the
operation of the WEM and dispatch of generation and price
calculation in the Spot market, the real-time operation of the
electricity system and the administration of the commercial
transactions in the electricity market.
Following
Argentina’s economic crisis in 2001 and 2002 the costs of
generators were increasing as a result of the devaluation of the
Argentine peso and increasing fuel prices. As a result of the
freeze in end user tariffs combined with the higher generation
costs, CAMMESA began experiencing deficits as it was not able to
collect from the end users (via distributors) the full price of
electricity it owed to the generators. Given this structural
deficit, CAMMESA passed a series of regulations to keep the
electrical system operating despite the structural
deficit.
Amendments
to WEM regulations
a)
Resolution
SE No. 406/03 and other regulations related to WEM
generators’ receivables
Resolution 406/03
issued in September 2003 enforced priority payments of
generator’s balances. Under the priority payment plan,
generators only collected the variable generation costs declared
and the payments for power capacity and the remaining payments on
these plants were delayed as there were not sufficient funds as a
result of the structural deficit. Resolution 406/03 established
that the resulting monthly obligations to generators for the unpaid
balance were to be considered payments without a fixed due date, or
“LVFVD receivables” using the Spanish acronym. Although
these obligations did not have a specified due date, the Resolution
provided that they would earn interest at an equivalent rate to the
one received by CAMMESA on its own cash investments, hereafter
“the CAMMESA rate”.
As a
result of this regulation, a portion of the invoices issued by
Company’s plants were not paid in full beginning in
2004.
Between
2004 and 2007, the Argentine government issued a series of
resolutions aimed at increasing thermal generation capacity while
at the same time providing a mechanism for generators to collect
their LVFVD receivables. These resolutions created funds called the
“FONINVEMEM” which were administered by trusts
(“the FONINVEMEM trust”) and made investments in two
thermal generation plants within Argentina. All WEM creditor agents
with LVFVD (including the Company) were invited to state formally
their decision to participate in forming the FONINVEMEM. The
Company, as most LVFVD generators, stated its decision to
participate in the creation of the FONINVEMEM with the
abovementioned receivables.
Under
these Resolutions, the FONINVEMEM trusts are the owner of the
plants during the first ten years of operations.
The
FONINVEMEM agreements established that the receivables mentioned
above will be paid by CAMMESA in 120 equal, consecutive monthly
installments commencing on the commercial operation date of the
plants. The LVFVD receivables were converted to US dollar to
protect the generators from deterioration in the
F-8
CENTRAL
PUERTO S.A.
Argentine peso and
began earning interest at LIBOR plus a spread as stipulated in the
agreement (as opposed to the CAMMESA rate). After the initial ten
years of the plants’ operations, ownership of the plants will
be allocated to the generators and the government in accordance
with a ratio between the total cost of the plants and the amount of
each generator LVFVD. However, the allocation of ownership
interests in the plants between and among the generators and the
government was not stated in the agreements and has not been
communicated to the Company.
The
Company participated with LVFVD accrued over the 2004 - 2007 period
in the FONINVEMEM trusts to construct the thermal generation plants
named Thermal Jose de San Martin and Thermal Manuel Belgrano, which
became operational in early 2010. At that time, CAMMESA informed
the Company of the payment plan, including the amount of accrued
interest at the CAMMESA rate which was added to the principal to be
repaid in monthly installments over a ten-year period. Upon receipt
of the payment schedule, the Company recognized accrued interest
(related to the CAMMESA rate). The Company also began recognizing
LIBOR interest income based on the contractual rate provided in the
Resolution and the conversion of the receivables into US dollar.
Since achieving commercial operations in 2010, CAMMESA have made
all scheduled contractual principal and interest payments in
accordance with the installment plan.
Additionally, in
2010 the Company approved a new agreement with the former
Secretariat of Energy (Central Vuelta Obligado, the “CVO
agreement”). This agreement established, among other
agreements, a framework to determine a mechanism to settle unpaid
trade receivables as per Resolution 406/03 accrued over the 2008-
2011 period by the generators (“CVO receivables”) and
for that purpose, enabling the construction of a thermal combined
cycle plant named Central Vuelta de Obligado. The CVO agreement
established that the CVO receivables will be paid by CAMMESA in 120
equal and consecutive monthly installments. For the determination
of the novation of CVO credits, the following mechanism was
applied: the cumulative LVFVD (sale settlements with due date to be
defined) were converted to USD at the exchange rate established in
the agreement (ARS 3.97 per USD for the cumulative LVFVD until the
execution date of the CVO Agreement and the closing exchange rate
corresponding to each month for the LVFVD subsequently
accumulated), and then the LIBOR rate was applied plus a 5%
margin.
As from
March 20, 2018, CAMMESA granted the commercial operations as a
combined cycle of Central Vuelta de Obligado thermal power plant
(the “Commercial Approval”). The financial impact of
the Comercial Approval is described in Note 14.1.
As of
the date of these financial statements, we have collected 609,030
related to January 2019 and February 2019 installments, pursuant to
the CVO agreement’s original disbursement schedule, while the
issuance of the documents related to March 2018 - December 2018
installments is still remaining.
Under
the agreements mentioned in the previous paragraphs, generators
created three companies, Termoeléctrica José de San
Martín S.A., Termoeléctrica Manuel Belgrano S.A. and
Central Vuelta de Obligado S.A., each of which is in charge of
managing the purchase of equipment, construction, operation and
maintenance of each of the new thermal power plants.
b)
Resolution
No. 95/2013, Resolution No. 529/2014, Resolution No. 482/2015 and
Resolution No. 22/2016
On
March 26, 2013, the former Secretariat of Energy released
Resolution No. 95/2013 (“Resolution 95”), which affects
the remuneration of generators whose sales prices had been frozen
since 2003. This new regulation, which modified the current
regulatory framework for the electricity industry, is applicable to
generators with certain exceptions. It defined a new compensation
system based on compensating for fixed costs, non-fuel variable
costs and an additional remuneration. Resolution 95 converted the
Argentine electric market towards an “average cost”
compensation scheme. Resolution 95 applied to all Company’s
plants, excluding La Plata plant, which also sells energy in excess
of YPF’s demand on the Spot market pursuant to the framework
in place prior to Resolution 95.
F-9
CENTRAL
PUERTO S.A.
In
addition, Resolution 95 addressed LVFVD receivables not already
included in any one of the FONINVEMEM trusts.
Thermal
units must achieve an availability target which varies by
technology in order to receive full fixed cost revenues. The
availability of all Company’s plants exceeds this market
average. As a result of Resolution 95, revenues to Company’s
thermal units increased, but the impact on hydroelectric plant
Piedra del Águila is dependent on hydrology. The new
Resolution also established that all fuels, except coal, are to be
provided by CAMMESA.
The
resolution also established that part of the additional
remuneration shall be not collected in cash rather it is
implemented through LVFVD and will be directed to a “New
Infrastructure Projects in the Energy Sector” which need to
be approved by the former Secretariat of the Energy.
Finally, Resolution
95 suspended the inclusion of new contracts in the Term market as
well as their extension or renewal. Notwithstanding the foregoing,
contracts in force as at the effective date of Resolution 95 will
continue being managed by CAMMESA upon their termination. As from
such termination, large users should acquire their supplies
directly from CAMMESA.
On May
23, 2014, the Official Gazzette published Resolution No. 529/2014
issued by the former Secretariat of Energy (“Resolution
529”) which retroactively updated the prices of Resolution 95
to February 1, 2014, changed target availability and added a
remuneration for non-recurrence maintenance. This remuneration is
implemented through LVFVD and is aimed to cover the expenses that
the generator incurs when performing major maintenances in its
units.
On July
17, 2015, the Secretariat of Electric Energy set forth Resolution
No. 482/2015 (“Resolution 482”) which retroactively
updated the prices of Resolution 529 to February 1, 2015, and
created a new trust called “Recursos para las inversiones del
FONINVEMEM 2015-2018” in order to invest in new generation
plants. Company’s plants would receive compensation under
this program.
Finally, on March
30, 2016, through Resolution No. 22/2016 (“Resolution
22”), the values set by Resolution 482 were updated to
become effective as from the transactions of February
2016.
c)
Resolution
No. 19/2017
On
January 27, 2017, the Secretariat of Electric Energy
(“SEE”) issued Resolution SEE No. 19/17 (published in
the Official Gazette on February 2, 2017) (“Resolution
19”), which replaced Resolution 95, as amended. This
resolution changes electric energy generators remuneration
methodology for transactions operated since February 1,
2017.
Resolution 19
substantially amended the tariff scheme applicable, which was
previously governed by Resolution 22. Among its most significant
provisions, such resolution established: (a) that generation
companies would receive a remuneration of electric power generated
and available capacity, (b) gradual increases in tariffs effective
as of February, May and November 2017, (c) that the new tariffs
would be denominated in U.S. dollars, instead of Argentine pesos,
thus protecting generation companies from potential fluctuations in
the value of the Argentine peso and (d) 100% of the energy sales
are collected in cash by generators, eliminating the creation of
additional LVFVD receivables.
Pursuant to this
resolution, the Secretariat of Electric Energy established that
electricity generators, co- generators and self-generators acting
as agents in the WEM and which operate conventional thermal power
plants, may make guaranteed availability offers (ofertas de
disponibilidad garantizada) in the WEM. Pursuant to these offers,
these generation companies may commit specific capacity and power
output of the generation,
F-10
CENTRAL
PUERTO S.A.
provided that such
capacity and energy had not been committed under other power
purchase agreements. The offers must be accepted by CAMMESA (acting
on behalf of the electricity demanding agents of the WEM), who will
be the purchaser of the power under the guaranteed availability
agreements (compromisos de disponibilidad garantizada). The term of
the guaranteed availability agreements is 3 years, and their
general terms and conditions are established in Resolution
19.
Resolution 19 also
establishes that WEM agents that operate hydroelectric power plants
shall be remunerated for the energy and capacity of their
generation units in accordance with the values set forth in such
resolution.
On
November 6, 2018, Resolution no. 70/2018 of the SGE was published,
replacing Article 8 of Resolution issued by former SE no. 95/2013.
The new article allows MEM Generators, Autogenerators and
Cogenerators to obtain their own fuel. This does not alter the
commitments assumed by Generation Agents within the context of MEM
supply agreements with CAMMESA. It is established that generation
costs with their own fuel will be valued according to the
recognition mechanism of Average Variable Costs (“CVP”)
recognized by CAMMESA. The Resolution also establishes that
regarding those Generators not purchasing their own fuel, CAMMESA
will continue the commercial management and the fuel
supply.
e)
Subsequent
Event: Resolution of the Secretariat of Renewable Resources and
Electricity Market no. 1/2019
On
March 1, 2019 Resolution no. 1/2019 (“Resolution 1”) of
the Secretariat of Renewable Resources and Electricity Market was
published in the Official Gazette by virtue of which Resolution 19
was abolished. It establishes the new remuneration values of
energy, power and associated services for the affected generators,
as well as their application methodology. Its validity commences on
the date of its publication in the Official Gazette.
According to
Resolution 1, the approved remuneration system will be of
transitional application and until the following are defined and
gradually implemented: regulatory mechanisms aimed at reaching an
autonomous, competitive and sustainable operation that allows for
freedom of contract between supply and demand; and a technical,
economical and operative functioning for the integration of
different generation technologies so as to guarantee a reliable and
cost effective system.
The
following are the main changes introduced by Resolution 1 in
connection with Resolution 19:
Energy
Sale:
–
The price of energy
generated by thermal power stations is reduced. Therefore, the
price for energy generated with natural gas is of 4 USD/MWh and 7
USD/MWh for energy generated with liquid fuel.
–
The price for
energy generated from non-conventional energy sources (renewable
energies) is fixed at 28 USD/MWh.
Power
Sale:
–
DIGO price
(established by Resolution 19) goes from 7,000 USD/MW-month during
the twelve months of the year to 7,000 USD/MW-month the six months
of higher seasonal demand for electrical energy (December, January,
February, June, July and August) and to 5,500 USD/MW-month the
remaining months of the year (March, April, May, September, October
and November).
F-11
CENTRAL
PUERTO S.A.
–
Some minimum values
of offered availability are changed. Its compliance is subject to
the foregoing prices, in accordance with the following
chart:
|
|
|
ARS
|
||
|
Technology
|
|
Resolution
19
|
|
Resolution
1
|
|
|
|
|
|
|
|
Big CC
P > 150 MW
|
|
3050
|
|
3050
|
|
Small
CC P ≤ 150 MW
|
|
3400
|
|
3400
|
|
Big ST
P > 100 MW
|
|
4350
|
|
4350
|
|
Small
ST P ≤ 100 MW
|
|
5700
|
|
5200
|
|
Big GT
P > 50 MW
|
|
3550
|
|
3550
|
|
Small
GT P ≤ 50 MW
|
|
4600
|
|
4600
|
|
Internal Combustion
Engines
|
|
5700
|
|
5200
|
–
A weighting factor
is fixed for the foregoing prices, between 1 and 0.7, depending on
the use factor of the twelve months previous to each month of the
transaction.
The
Company is making a detailed analysis of the scope, application and
impact of Resolution 1 on our operations. The power purchase
agreements entered into by the Group with CAMMESA are not affected
by the provisions of Resolution 1.
2.
Basis
of preparation of the consolidated financial
statements
2.1.
Basis
of preparation
The
consolidated financial statements of the Group have been prepared
in accordance with International Financial Reporting Standards
(IFRS) as issued by the International Accounting Standards Board
(IASB).
The
attached financial statements have been prepared in order to be
included in a Securities and Exchange Commission
(“SEC”) filing and have been approved by the
Company’s Board of Directors on April 24, 2019.
These
consolidated financial statements provide comparative information
in respect of the previous years.
In
preparing these consolidated financial statements, the Group
applied the significant accounting policies, estimates and
assumptions described in Notes 2.2 and 2.3, respectively. Moreover,
the Group has adopted the changes in accounting policies described
in Note 2.4.
The
Group’s consolidated financial statements are presented in
Argentine pesos, which is the Group’s functional currency,
and all values have been rounded to the nearest thousand (ARS 000),
except when otherwise indicated.
2.1.1.
Basis
of consolidation
The
consolidated financial statements as of December 31, 2018 and 2017
and for each of the years ended December 31, 2018, 2017 and 2016,
include the financial statements of the Group formed by the parent
company and its subsidiaries: Central Vuelta de Obligado S.A.,
Proener S.A.U., CP Renovables S.A. and its subsidiaries Vientos La
Genoveva S.A.U. and Vientos La Genoveva II S.A.U.
F-12
CENTRAL
PUERTO S.A.
Control
is achieved when the investor is exposed or entitled to variable
returns arising from its ownership interest in the investee, and
has the ability to affect such returns through its power over the
investee. Specifically, the investor controls an investee, if and
only if it has:
–
Power over the
investee (i.e. the investor has rights that entitle it to direct
the relevant activities of the investee).
–
Exposure or right
to variable returns arising from its ownership interest in the
investee.
–
Ability to exercise
its power over the investee to significantly affect its
returns.
Consolidation of a
subsidiary begins when the parent company obtains control over the
subsidiary and ends when the parent company loses control over the
subsidiary. The assets, liabilities, income and expenses of a
subsidiary acquired or sold during the fiscal year are included in
the consolidated financial statements from the date on which the
parent company acquired control of the subsidiary to the date on
which the parent company ceased to control the
subsidiary.
The
result for the fiscal year and each component of the other
comprehensive income (loss) are assigned to the owners of the
parent company and non-controlling interests, even if the results
of the non-controlling interests give rise to a debit balance. If
necessary, appropriate adjustments are made to the
subsidiaries’ financial statements so that their accounting
policies are in accordance with the Group’s accounting
policies. All assets and liabilities, equity, income, expenses and
cash flows within the Group that relate to transactions among the
members of the Group are completely eliminated in the consolidation
process.
A
change in ownership interest in a subsidiary, without loss of
control, is accounted for as an equity transaction. If the Group
loses control of a subsidiary, it cancels the carrying amount of
the assets (including goodwill) and related liabilities,
non-controlling interests and other equity components, while
recognizing the profit or loss resulting from the transaction in
the relevant income statement. Any retained residual interest is
recognized at its fair value.
2.1.2.
Measuring
unit
The
financial statements as at December 31, 2018, including the figures
for the previous periods (this fact not affecting the decisions
taken on the financial information for such periods) were restated
to consider the changes in the general purchasing power of the
functional currency of the Company (Argentine peso) pursuant to IAS
29. Consequently, the financial statements are stated in the
current measurement unit at the end of the reported
period.
In
accordance with IAS 29, the restatement of the financial statements
is necessary when the functional currency of an entity is the
currency of a hyperinflationary economy. To define a
hyperinflationary state, the IAS 29 provides a series of
non-exclusive guidelines that consist on (i) analyzing the behavior
of the population, prices, interest rates and wages before the
evolution of price indexes and the loss of the currency’s
purchasing power, and (ii) as a quantitative characteristic, which
is the most considered condition in practice, verifying if the
three-year cumulative inflation rate approaches or exceeds
100%.
Even if
in the recent years there was an important increase in the general
level of prices, the three-year cumulative inflation was below
100%. However, due to macroeconomic factors, the triennial
inflation was above that figure in 2018. Moreover, the goals of the
Argentine government and other available projections show that this
trend will not be reverted in the short term.
F-13
CENTRAL
PUERTO S.A.
So as
to evaluate the mentioned quantitative condition and to restate the
financial statements, the Argentine Securities Commission
established that the series of indexes to be used in the IAS 29
application is the one established by the Argentine Federation of
Professional Councils in Economic Sciences.
Regard
being had to the mentioned index, the inflation was of 47.64%,
24.79% and 34,59% in the years ended December 31, 2018, 2017 and
2016, respectively.
As at
January 1, 2017, the Board of Directors of the Company adopted,
subject to the Annual General Meeting’s approval, the option
stated in RG no. 777/18 of the CNV and absorbed the accumulated
negative unappropriated retained earnings resulting from the
inflation-adjustment, following the absorption order established in
Section 11, Chapter III, Title IV “REGULAR INFORMATION
PROCEDURE” of the CNV Regulations (N.T. 2013), affecting to
that purpose the balances of the accounts Voluntary reserve, Legal
and other reserves, Merger premium and the balance of the account
Adjustment to Capital Stock in the amount necessary for such
purpose. The effect of such change is stated in the statement of
changes in equity.
As
mentioned in the previous paragraph, the Board of Directors of the
Company decided, subject to the Annual General Meeting’s
approval, to reduce the total Legal Reserve. According to Section
70 of the Business Entities Act no. 19550 (“LGS”)
profits will not be distributed until it is restored. Therefore,
the Shareholders’ Meeting approving the annual statutory
financial statements will have to solve the restoration of the
mentioned reserve, notwithstanding the creation of the Legal
Reserve under its responsibility according to the mentioned
paragraph of the LGS.
The
following is a summary of the effects of the IAS 29
application:
(i)
The monetary items
(those with a fixed face value in local currency) are not restated
since they are stated in the current measurement unit at the
closing date of the reported period. In an inflationary period,
keeping monetary assets causes the loss of purchasing power, and
keeping monetary liabilities causes gain in purchasing power as
long as those items are not tied to an adjustment mechanism
compensating those effects. The monetary loss or gain is included
in the income (loss) for the reported period.
(ii)
The assets and
liabilities subject to changes established in specific agreements
are adjusted in accordance with those agreements.
(iii)
Non-monetary items
measured at their current values at the end of the reported period
are not restated to be included in the balance sheet; however, the
adjustment process must be completed to determine the income (loss)
produced for having those non-monetary items in the terms of a
uniform measurement unit.
As at
December 31, 2018, 2017 and 2016, the Company counted with the
following items measured with the current value method: the share
kept in foreign currency of the items Trade and other receivables,
Cash and cash equivalents, Loans and borrowings that accrue
interest, and Trade and other payables.
(iv)
Non-monetary items
at historical cost or at current value of a date previous to the
closing of the reported period are restated at rates reflecting the
variation occurred at the general level of prices from the
acquisition or revaluation date until the closing date; then the
amounts restated for those assets are compared with the
corresponding recoverable values. Charges to the income (loss) for
the period due to property, plant and equipment depreciation and
intangible assets amortization, as well as other non- monetary
assets consumption are determined in accordance with the new
restated amounts.
F-14
CENTRAL
PUERTO S.A.
As at
December 31, 2018, 2017 and 2016, the items subject to this
restatement process were the following:
-
Monetary items at
current values for a date previous to the closing of the period:
certain machines, equipment, turbogroups and auxiliary equipment of
the Property, Plant and Equipment item, which were measured at
their fair value as at January 1, 2011.
-
Non-monetary items
at historical cost: the remaining items of Property, Plant and
Equipment, Intangible assets, Investment in associates,
Inventories, Assets held for sale, and Deferred income tax
liabilities.
(v)
When borrowing costs in non-monetary assets are
capitalized in accordance with IAS 23, the share of those cost
compensating the creditor for the effects of inflation is not
capitalized
as stated in Note
2.2.6
.
(vi)
The restatement of
the non-monetary assets in the terms of a current measurement unit
at the end of the reported period without an equivalent adjustment
for tax purposes leads to a temporary taxable difference and to the
recognition of a deferred-tax liability whose balancing entry is
recognized in the income (loss) for the period. For the next
closing of the period, the deferred-tax items are restated for
inflation to determine the item on income (loss) for such period.
In Note 9 the effects of this process are detailed.
Restatement
of the statement of income (loss) and other comprehensive
income
(i)
The expenses and
income are restated as from the date of accountable entry,
including interest and currency exchange differences, except for
those items not reflecting or including in their determination the
consumption of assets measured in currency of purchasing power
previous to the consumption entry, which are restated taking into
account the origin date of the asset related to the item (for
example, depreciation, devaluation and other consumptions of assets
valued at historical cost); and except for income (loss) emerging
from comparing two measurements expressed in currency of purchasing
power of different dates. For such purpose, it is necessary to
identify the compared amounts, separately restate them and compare
them again, but with amounts already restated.
(ii)
The income (loss)
for exposure to change in purchasing power of currency (income
(loss) on net monetary position), originated by the keeping of
monetary assets and liabilities, is shown in a separate item of the
income (loss) for the period.
Restatement
of the Statement of Changes in Equity
(i)
At the transition
date (January 1, 2016), the Company applied the following
standards:
(a)
The components of
capital stock and other owners contributions were restated as from
the dates in which they were contributed or as from the moment they
arose from any other means
.
(b)
The retained
earnings, the Special reserve Resolution 7/05 and the Special
Reserve RG CNV 609 were kept at their face value (non-restated
legal amount) at the transition date.
(c)
The restated
unappropriated retained earnings were determined by the difference
between the net assets restated at the transition date and the
remaining components of initial equity expressed as stated in
previous sections.
F-15
CENTRAL
PUERTO S.A.
(ii)
After restatement
at the transition date stated in (i) precedent, all equity
components are restated applying the general price index from the
commencement of the period, and each variation of those components
is restated from the contribution date or as from the moment they
arose from other means.
Restatement
of the Statement of Cash Flows
IAS 29
sets forth that all the items of this section shall be restated in
terms of the current measurement unit at the closing date of the
reported period.
The
monetary result generated by cash and equivalents to cash are
stated in the Statement of Cash Flows separately from the cash
flows resulting from operation, investment and financing activities
as a specific item of the conciliation between the existence of
cash and cash equivalents at the beginning and at the end of the
period.
Effects
of the adoption of IAS 29 on comparative balances
The
effects of adopting IAS 29 on Equity at January 1, 2016 and
December 31, 2017 and 2016 and on the results for the 2017 and 2016
periods are the following:
|
|
01-01-2016
|
12-31-2016
|
12-31-2017
|
|
|
ARS
000
|
ARS
000
|
ARS
000
|
|
|
|
|
|
|
Equity according to
consolidated financial statements approved on April 24,
2018
|
4,571,663
|
5,154,016
|
7,361,000
|
|
Increase due to
capital stock and premiums adjustment
|
11,037,227
|
12,153,414
|
10,400,585
|
|
Retained earnings
decrease
|
(1,116,668
)
|
(3,637,091
)
|
(919,719
)
|
|
Non-controlling
interests increase
|
-
|
5,690
|
189,669
|
|
Equity
after the adoption of IAS 29
|
14,492,222
|
13,676,029
|
17,031,535
|
|
|
12-31-2016
|
12-31-2017
|
|
|
ARS
000
|
ARS
000
|
|
|
|
|
|
Net income for the
year according to consolidated financial statements approved on
April 24, 2018
|
1,768,836
|
3,493,999
|
|
Loss
on net monetary position
|
(1,836,626
)
|
(151,904
)
|
|
Restatement of
income statement items (including income tax)
|
1,446,332
|
1,920,350
|
|
Net
income after the adoption of IAS 29
|
1,378,542
|
5,262,445
|
2.2.
Summary
of significant accounting policies
The
following are the significant accounting policies applied by the
Group in preparing its consolidated financial
statements.
2.2.1.
Classification
of items as current and non-current
The
Group classifies assets and liabilities in the consolidated
statement of financial position as current and non-current. An
entity shall classify an asset as current when:
–
it expects to
realize the asset, or intends to sell or consume it, in its normal
operating cycle;
–
it holds the asset
primarily for the purpose of trading;
F-16
CENTRAL
PUERTO S.A.
–
it expects to
realize the asset within twelve months after the reporting period;
or
–
the asset is cash
or a cash equivalent unless the asset is restricted from being
exchanged or used to settle a liability for at least twelve months
after the reporting period.
All
other assets are classified as non-current.
An
entity shall classify a liability as current when:
–
it is expected to
be settled in normal operating cycle;
–
It is held
primarily for the purpose of trading;
–
it is due to be
settled within twelve months after the reporting period;
or
–
there
is no unconditional right to defer the settlement of the liability
for at least twelve months after the reporting period.
All
other liabilities are classified as non-current.
Deferred tax assets
and liabilities are classified as non-current assets and
liabilities, in all cases.
2.2.2.
Fair
value measurement
The
Group measures certain financial instruments at their fair value at
each reporting date. In addition, the fair value of financial
instruments measured at amortized cost is disclosed in Note
14.6.
Fair
value is the price that would be received to sell an asset or paid
to transfer a liability in an orderly transaction between market
participants at the measurement date. The fair value measurement is
based on the presumption that the transaction to sell the asset or
transfer the liability takes place either:
–
in the principal
market for the asset or liability, or
–
in the absence of a
principal market, in the most advantageous market for the asset or
liability.
The
principal or the most advantageous market must be accessible to the
Group. The fair value of an asset or a liability is measured using
the assumptions that market participants would use when pricing the
asset or liability, assuming that market participants act in their
economic best interest.
A fair
value measurement of a non-financial asset takes into account a
market participant’s ability to generate economic benefits by
using the asset in its highest and best use or by selling it to
another market participant that would use the asset in its highest
and best use.
The
Group uses valuation techniques that are appropriate in the
circumstances and for which sufficient data are available to
measure fair value, maximizing the use of relevant observable
inputs and minimizing the use of unobservable inputs.
F-17
CENTRAL
PUERTO S.A.
All
assets and liabilities for which fair value is measured or
disclosed in the consolidated financial statements are categorized
within the fair value hierarchy, described as follows, based on the
lowest level input that is significant to the fair value
measurement as a whole:
–
Level 1 input data:
quoted (unadjusted) prices in active markets for identical assets
or liabilities.
–
Level 2 input data:
valuation techniques with input data other than the quoted prices
included in Level 1, but which are observable for assets or
liabilities, either directly or indirectly.
–
Level 3 input data:
valuation techniques for which input data are not observable for
assets or liabilities.
2.2.3.
Transactions
and balances in foreign currency
Transactions in
foreign currencies are recorded by the Group at the related
functional currency rates prevailing at the date of the
transaction.
Monetary assets and
liabilities denominated in foreign currencies are translated at the
functional currency spot rate of exchange ruling at the reporting
period-end.
All
differences are taken to consolidated statement of income under
other operating income or expenses, or under finance income or
expenses, depending on the nature of assets or liabilities
generating those differences.
Non-monetary items
that are measured in terms of historical cost in a foreign currency
are translated using the exchange rates as at the dates of the
initial transactions. Non-monetary items measured by their fair
value in foreign currency are converted using exchange rates at the
date in which such fair value is determined.
2.2.4.
Revenue
recognition
2.2.4.1.
Revenue
from ordinary activities
IFRS 15
presents a five-step detailed model to explain revenue from
contracts with customers. Its fundamental principal lies on the
fact that an entity has to recognize revenue to represent the
transference of goods or services promised to the customers, in an
amount reflecting the consideration the entity expects to receive
in exchange for those goods or services at the moment of executing
the performance obligation. An asset is transferred when (or while)
the client gets control over such asset, defined as the ability to
direct the use and substantially obtain all the remaining benefits
of the asset. IFRS 15 requires the analysis of the
following:
–
If the contract (or
the combination of contracts) contains more than one promised good
or service, when and how such goods or services should be
granted.
–
If the price of the
transaction distributed to each performance obligation should be
recognized as revenue throughout time or at a specific moment.
According to IFRS 15, an entity recognizes revenue when the
performance obligation is satisfied, i.e. every time control over
those goods and services is transferred to the customer. The new
model does not include separate guidelines for the “sale of
goods” and the “rendering of services”; instead,
it requires that entities should evaluate whether revenue should be
recognized throughout time or at a specific moment, regardless of
the fact that it includes “the sale of goods” or
“the rendering of services”.
–
When the price
includes an estimation element of variable payments, how that will
affect the amount and the time to recognize such revenue. The
concept of variable payment estimation is broad. A transaction
price is considered as variable due to discounts, reimbursement,
credits, price concessions, incentives,
F-18
CENTRAL
PUERTO S.A.
performance bonus,
penalties and contingency agreements. The new model introduces a
big condition for a variable consideration to be considered as
revenue: only as long as it is very unlikely for a significant
change to occur in the cumulative revenue amount, when the
uncertainties inherent to the variable payment estimation are
solved.
–
When the incurred
cost to close an agreement and the costs to comply with it can be
recognized as an asset.
The
Company has a main revenue source, which consists on the
commercialization of energy produced in the spot market under the
scheme established by Resolution 19/2017 of the Secretariat of
Electric Power (“SEE”, for its Spanish acronym),
CAMMESA being its main customer.
The
Company recognizes its sales revenue in accordance with the
availability of its machines’ effective power, the energy and
steam supplied; and as balancing entry, a sales receivable is
recognized, which represents the Company’s unconditional
right to consideration owed by the customer. Billing for the
service is monthly made by CAMMESA in accordance with the
guidelines established by SEE; and compensation is usually received
in a maximum term of 90 days. Therefore, no implicit financing
components are recognized. The satisfaction of the performance
obligation is done throughout time since the customer
simultaneously receives and consumes the benefits given by the
performance of the entity as the entity does it.
Revenues from
energy, power and steam sales are calculated at the prices
established in the respective contracts or at the prices prevailing
in the electricity market, according to the regulations in force.
These include revenues from the sale of steam, energy and power
supplied and not billed until the closing date of the reported
period, valued at the prices defined in the contracts or in the
respective regulations.
Additionally, the
Group recognizes the sales from contracts regarding the supplied
energy and the prices established in such contracts, and as
balancing entry it recognizes a sale credit. Such credit represents
the unconditional right the Company has to receive the
consideration owed by the customer. Billing for the service is
monthly made by CAMMESA in the case of the contracts of the wind
farms La Castellana and Achiras and for the Energía plus
contract in accordance with the guidelines established by SEE; and
compensation is received in a maximum term of 90 days. Therefore,
no implicit financing components are recognized. For the rest of
the clients, billing is also monthly and done by the Company; and
compensation is received in a maximum term of 90 days. Therefore,
no implicit financing components are recognized. The satisfaction
of the performance obligation is done throughout time since the
customer simultaneously receives and consumes the benefits given by
the performance of the entity as the entity does it.
The
Group recognizes revenues from resale and distribution of gas and
revenues for the monthly management of the thermal power plant CVO
in accordance with the monthly fees established in the respective
contracts and as balancing entry, it recognizes a sale credit. Such
credit represents the unconditional right the Company has to
receive the consideration owed by the customer. Billing for the
service is also monthly made by the Company and compensation is
generally received in a maximum term of 90 days. Therefore, no
implicit financing components are recognized.
The
detail of revenues from ordinary activities of the Group is
included in Note 5 to these consolidated financial
statements.
F-19
CENTRAL
PUERTO S.A.
2.2.4.2.
Other
income Interest
For all
financial assets and liabilities measured at amortized cost and
interest bearing financial assets classified as available for sale,
interest income or expense is recorded using the effective interest
rate method, which is
the rate that exactly discounts the
estimated future cash payments or receipts through the expected
life of the financial instrument or a shorter period, where
appropriate, to the net carrying amount of the financial asset or
liability. In general, interest income and expense are included in
finance income and expenses in the consolidated statement of
income, respectively, unless they derive from operating items (such
as trade and other receivables or trade and other payables); in
that case, they are booked under other operating income and
expenses, as the case may be.
2.2.5.
Taxes
Current
income tax and minimum presumed income tax
Current
income tax assets and liabilities for the year are measured at the
amount expected to be recovered from or paid to the taxation
authorities. The tax rates and tax laws used to compute those
amounts are those that are enacted or substantively enacted, at the
end of the reporting period. The statutory tax rate for the Group
for the fiscal year 2018 is 30% (See Note 23.a).
Current
income tax relating to items recognized directly in equity is
recognized in equity and not in the consolidated statement of
income.
Management
periodically evaluates positions taken in the tax returns with
respect to situations in which applicable tax regulations are
subject to interpretation and establishes provisions where
appropriate.
Minimum
presumed income tax is supplementary to income tax since while the
latter is levied on taxable income for the reporting period,
minimum presumed income tax is a minimum levy determined by
applying the current 1% rate to the potential income of certain
productive assets. Therefore, the Group’s tax obligation
shall be the higher of these two taxes. However, should minimum
presumed income tax exceed current income tax owed in a given tax
year, such excess may be carried forward as payment on account of
any income tax in excess of the minimum presumed income tax that
could occur in any of the ten subsequent tax years.
Minimum
presumed income tax credit is measured at non-discounted nominal
value, as it is similar to a deferred income tax
asset.
The
carrying amount of minimum presumed income tax is reviewed at each
reporting period date and reduced against income or loss for the
period under income tax charge to the extent that its use as
payment on account of income tax in future fiscal years is no
longer probable. Minimum presumed income tax credit not recognized
as credit or previously derecognized is reviewed as of each
reporting period-end and it is recognized as an asset against
income or loss for the period under income tax expenses to the
extent that it is likely to be used as payment on account of income
tax payable in future years.
On July
22, 2016, Law No. 27,260 was published, which, among other aspects,
repealed the minimum presumed income tax for fiscal years beginning
on or after January 1, 2019.
Deferred
income tax
Deferred income tax
is provided using the liability method on temporary differences at
the end of the reporting period between the tax bases of assets and
liabilities and their related carrying amounts.
Deferred income tax
liabilities are recognized for all taxable temporary differences,
except:
–
where the deferred
income tax liability arises from the initial recognition of
goodwill or of an asset or liability in a transaction that is not a
business combination and, at the time of the transaction, affects
neither the accounting profit nor taxable profit or
loss;
F-20
CENTRAL
PUERTO S.A.
–
in respect of
taxable temporary differences associated with investments in
subsidiaries and associates, where the timing of the reversal of
the temporary differences can be controlled and it is probable that
the temporary differences will not reverse in the foreseeable
future.
Deferred income tax
assets are recognized for all deductible temporary differences and
tax carry forwards losses, to the extent that it is probable that
taxable profit will be available against which the deductible
temporary differences, and/or the tax losses carry forward can be
utilized, except:
–
where the deferred
income tax asset arises from the initial recognition of an asset or
liability in a transaction that is not a business combination and,
at the time of the transaction, affects neither the accounting
profit nor taxable profit or loss;
–
in respect of
deductible temporary differences associated with investments in
subsidiaries, associates and interests in joint ventures, deferred
income tax assets are recognized only to the extent that it is
probable that the deductible temporary differences will reverse in
the foreseeable future and taxable profit will be available against
which those differences can be utilized.
The
carrying amount of deferred income tax assets is reviewed at each
reporting period date and reduced against income or loss for the
period or other comprehensive income, as the case may be, to the
extent that it is no longer probable that sufficient taxable profit
will be available to allow all or part of the deferred income tax
asset to be utilized (recovered). Unrecognized deferred income tax
assets are reassessed at each reporting period date and are
recognized with a charge to income or other comprehensive income
for the period, as the case may be, to the extent that it has
become probable that future taxable profits will allow the deferred
income tax asset not previously recognized to be
recovered.
Deferred income tax
assets and liabilities are measured at undiscounted nominal value
at the tax rates that are expected to apply in the year when the
asset is realized or the liability is settled, based on tax rates
and tax laws that have been enacted or substantively enacted at the
reporting period date.
Deferred income tax
relating to items recognized outside profit or loss is recognized
outside profit or loss. Deferred income tax items are recognized in
correlation to the underlying transactions either in other
comprehensive income or directly in equity.
Deferred income tax
assets and deferred income tax liabilities are offset if a legally
enforceable right exists to set off current income tax assets and
liabilities and the deferred income taxes relate to the same
taxable entity and the same taxation authority.
Other
taxes related to sales and to bank account
transactions
Revenues from
recurring activities, expenses incurred and assets are recognized
excluding the amount of sales tax, as in the case of value-added
tax or turnover tax, or the tax on bank account transactions,
except:
–
where the tax
incurred on a sale or on a purchase of assets or services is not
recoverable from the taxation authority, in which case the sales
tax is recognized as part of the cost of acquisition of the asset
or as part of the expense item as the case may be;
–
receivables and
payables are stated including value-added tax.
The
charge for the tax on bank account transactions is presented in the
administrative and selling expenses line within the consolidated
statement of income.
F-21
CENTRAL
PUERTO S.A.
The net
amount of the tax related to sales and to bank account transactions
recoverable from, or payable to, the taxation authority is included
as a non-financial asset or liability, as the case may
be.
2.2.6.
Property,
plant and equipment
Property, plant and
equipment are measured at the acquisition cost restated according
to Note 2.1.2, net of the cumulative depreciation and/or the
cumulative losses due to impairment, if any. This cost includes the
cost of replacing components of property, plant and equipment and
the cost for borrowings related to long-term construction projects,
as long as the requirements for their recognition as assets are
fulfilled.
When
significant parts of property, plant and equipment are required to
be replaced at intervals, the Group derecognizes the replaced part
at its restated cost according to Note 2.1.2 and recognizes the new
part with its own associated useful life and depreciation.
Likewise, when a major maintenance is performed, its cost is
recognized as a replacement if the conditions for the recognition
thereof as an asset are met. All other regular repair and
maintenance costs are recognized in the consolidated statement of
income as incurred.
Electric power
facilities and materials and spare parts related to the Puerto
Combined Cycle plant are depreciated on a unit-of-production
basis.
Electric power
facilities related to the Luján de Cuyo plant are depreciated
on a straight-line basis over the total useful lives
estimated.
Electric power
facilities and auxiliary equipment of Piedra del Águila
hydroelectric power plant are depreciated on a straight-line basis
over the remaining life of the concession agreement of the
mentioned power plant.
The
depreciation of the remaining property, plant and equipment is
calculated on a straight-line basis over the total estimated useful
lives of the assets as follows:
–
Buildings: 5 to 50
years.
–
Lands are not
depreciated.
–
Material and spare
parts: based on the useful life of related machinery and equipment
to be replaced.
–
Furniture, fixtures
and equipment: 5 to 10 years.
–
Others:3 to 5
years.
–
Turbines and
Construction in progress: they are not depreciated until they are
not in conditions of being used.
An item
of property, plant and equipment and any significant part initially
recognized is derecognized upon disposal or when no future economic
benefits are expected from its use or disposal. Any gain or loss
arising on derecognition of the asset (calculated as the difference
between the net disposal proceeds and the carrying amount of the
asset) is included in the consolidated statement of income when the
asset is derecognized.
The
residual values, useful lives and methods of depreciation are
reviewed at each reporting period end and adjusted prospectively,
if appropriate.
F-22
CENTRAL
PUERTO S.A.
During
periods ended December 31, 2018 and 2017, the Group capitalized
interest in their wind farm projects La Castellana and Achiras for
an amount of 138,064 and 10.739, respectively. The rate used to
capitalize interest corresponds to the effective rate of specific
loans used to finance the projects, net of the share compensating
the creditor for the effects of inflation.
2.2.7.
Intangible
assets
Intangible assets
acquired separately are measured on initial recognition at
acquisition cost restated according to Note 2.1.2. Following
initial recognition, intangible assets are carried at cost less
accumulated amortization (if they are considered as having finite
useful lives) and accumulated impairment losses, if
any.
The
useful lives of intangible assets are assessed as either finite or
indefinite. The useful lives of the intangible assets recognized by
the Group are finite.
Intangible assets
with finite useful lives are amortized over their useful economic
lives. The amortization period and the amortization method for an
intangible asset with a finite useful life are reviewed at least at
the end of each reporting period. Changes in the expected useful
life or the expected pattern of consumption of the asset is
accounted for by changing the amortization period or method, as
appropriate, and are treated prospectively as changes in accounting
estimates. The amortization expense on intangible assets with
finite lives is recognized in the consolidated statement of income
in the expense category consistent with the function of the
intangible assets.
During
this period, the Group finished the construction of wind farms La
Castellana and Achiras, whereby it was agreed to construct high and
medium tension lines and the electrical substation to connect the
wind farms to the Argentine Interconnection System
(“SADI”), a part of which were given to the companies
transporting the energy in accordance with the respective
contracts; therefore, such companies are in charge of the
maintenance of such transferred installations. Consequently, the
Group transferred 596,301 from property, plant and equipment to
intangible assets.
The
Group’s intangible assets are described in Note
13.
2.2.8.
Impairment
of property, plant and equipment and intangible asset
The
Group assesses at each reporting period-end whether there is an
indication that an individual component or a group of property,
plant and equipment and/or intangible assets with finite useful
lives may be impaired. If any indication exists, the Group
estimates the asset’s recoverable amount. An asset’s
recoverable amount is the higher of the fair value less costs to
sell that asset, and its value-in-use. That amount is determined
for an individual asset, unless the asset does not generate cash
inflows that are largely independent of those from other assets or
groups of assets; in which case, the cash flows of the group of
assets that form part of the cash-generating unit
(“CGU”) to which they belong are taken.
Where
the carrying amount of an individual asset or CGU exceeds its
recoverable amount, the individual asset or CGU, as the case may
be, is considered impaired and is written down to its recoverable
amount.
In
assessing value in use of an individual asset or CGU, the estimated
future cash flows are discounted to their present value using a
pre-tax discount rate that reflects current market assessments of
the time value of money and the risks specific to the individual
asset or CGU, as the case may be.
In
determining fair value less costs to sell, recent market
transactions are taken into account, if available. If no such
transactions can be identified, an appropriate valuation model is
used. These calculations are verified by valuation multiples,
quoted values for similar assets on active markets and other
available fair value indicators, if any.
F-23
CENTRAL
PUERTO S.A.
The
Group bases its impairment calculation on detailed budgets and
forecast calculations which are prepared separately for each of the
Group’s CGU to which the individual assets are allocated.
These detailed budgets and forecast calculations generally cover a
five-year period. For longer periods, a long-term growth rate is
calculated and applied to project future cash flows after the fifth
year. Budgets and calculations related to Complejo
Hidroeléctrico Piedra del Águila are limited to the term
of the concession contract.
Impairment losses
of continuing operations are recognized in the consolidated
statement of income in those expense categories consistent with the
function of the impaired asset generally in the cost of sales or
other operating expenses.
In
addition, for the assets for which an impairment loss had been
booked, as of each reporting period-end, an assessment is made
whether there is any indication that previously recognized
impairment losses may no longer exist or may have
decreased.
During
the periods ended December 31, 2018 and 2017, the Group did not
identify triggering events of impairment.
Should
there be such triggering event, the Group makes an estimate of the
recoverable amount of the individual asset or of the cash
generating unit, as the case may be.
A
previously recognized impairment loss is reversed only if there has
been a change in the assumptions used to determine the individual
assets or CGU’s recoverable amount since the last impairment
loss was recognized. The reversal is limited so that the carrying
amount of the asset or CGU does not exceed its recoverable amount,
nor exceed the carrying amount that would have been determined, net
of the related depreciation or amortization, had no impairment loss
been recognized for the asset or CGU in prior periods. Such
reversal is recognized in the statement of income in the same line
in which the related impairment charge was previously recognized
(generally under the cost of sales or other operating expenses),
unless the asset is carried at a revalued amount, in which case,
the reversal is treated as a revaluation increase.
2.2.9.
Financial
instruments. Presentation, recognition and measurement
A
financial instrument is any contract that gives rise to a financial
asset of one entity and a financial liability or equity instrument
of another entity.
2.2.9.1.
Financial
assets
Classification
According to IFRS 9
“Financial instruments”, the Group classifies its
financial assets in three categories:
–
Financial assets at
amortized cost
A
financial asset is measured at amortized cost if both of the
following conditions are met: (i) the asset is held within a
business model whose objective is to hold assets in order to
collect contractual cash flows; and (ii) the contractual terms of
the financial asset give rise on specified dates to solely payments
of principal and interest.
Additionally, and
for those assets complying with the above-mentioned conditions,
IFRS 9 provides for the option of determining, at initial
recognition, an asset measured at fair value if doing so would
eliminate or significantly reduce a measurement or recognition
inconsistency, which would appear if the assets or liabilities
valuation or the recognition of their profits or losses are made on
different grounds. The Group has not classified a financial asset
at fair value using this option.
F-24
CENTRAL
PUERTO S.A.
At the
closing of these consolidated financial statements, the financial
assets at amortized cost of the Group include certain cash elements
and cash equivalents and trade and other receivables.
–
Financial assets at
fair value through other comprehensive income
Financial assets
are measured at fair value through other comprehensive income if
they are held in a business model whose objective is achieved by
both collecting contractual cash flows and selling financial
assets.
At the
closing of these consolidated financial statements, the Group has
not financial assets at fair value through other comprehensive
income.
–
Financial assets at
fair value through profit or loss
Any
financial assets at fair value through profit or loss belong to a
residual category that includes the financial assets that are not
held in one of the two business models mentioned, including those
kept to negotiate and those classified at fair value at initial
recognition.
At the
closing of these consolidated financial statements, the financial
assets of the Group at fair value through profit or loss include
mutual funds accounted under other financial assets.
Recognition
and measurement
The
purchase and sale of financial assets are recognized at the date on
which the Group commits to purchase or sale the asset.
Financial assets
valued at amortized cost are initially recognized at their fair
value plus cost of transaction. These assets accrue interest
according to the effective interest rate method.
Financial assets
valued at fair value through profit or loss and other comprehensive
income are initially recognized at fair value, and transaction
costs are recognized as expenses in the comprehensive income
statement. Subsequently, they are valued at fair value. Changes in
fair value and income from the sale of financial assets at fair
value through profit or loss and other comprehensive income are
recorded in Finance Income or Finance Expenses and Other
comprehensive income, respectively, in the consolidated statement
of income and comprehensive income, respectively.
In
general, the Group uses the transaction price to determine the fair
value of a financial instrument at the initial recognition. In the
rest of the cases, the Group only records revenue or loss at
initial recognition if the fair value of the instrument is
evidenced with other comparable and visible transactions of the
market for the same instrument or if it is based on a valuation
technique that only includes visible market data. Revenue or loss
not recognized at the initial recognition of a financial asset is
later recognized as long as they derive from a change in factors
(including time) in which the market participants consider
establishing the price.
The
profit or loss of debt instruments are measured at amortized cost
and are not determined in a hedge relationship. They are recognized
in profit or loss when the financial assets are removed or when
impairment is recognized; and during the amortization process using
the effective interest rate method. The Group only reclassifies all
investments in debt instruments when it changes the business model
used to manage those assets.
Derecognition
of financial assets
A
financial asset (or, where applicable, a part of a financial asset
or part of a group of similar financial assets) is derecognized;
that is to say, it is deleted from the statement of financial
position, when:
–
the contractual
rights to receive cash flows from the asset have
expired;
F-25
CENTRAL
PUERTO S.A.
–
the contractual
rights to receive cash flows from the asset have been transferred
or an obligation has been assumed to pay the received cash flows in
full without material delay to a third party under a
‘pass-through’ arrangement; and either (a) all the
risks and rewards of the asset have been transferred substantially,
or (b) all the risks and rewards of the asset have neither been
transferred nor retained substantially, but control of the asset
has been transferred.
When
the contractual rights to receive cash flows from an asset have
been transferred or a pass-through arrangement has been entered
into, but all of the risks and rewards of the asset have neither
transferred nor retained substantially and no control of it has
been transferred, such asset shall continue to be recognized to the
extent of the Group’s continuing involvement in it. In this
case, the Group shall also recognize the associated liability. The
transferred asset and the associated liability are measured on a
basis that reflects the rights and obligations that the Group has
retained.
Impairment
of financial assets
IFRS 9
establishes an “expected credit loss” model
(“ECL”). This requires the application of considerable
judgment with regard to how changes in economic factors affect ECL,
which is determined over a weighted average base. ECL results from
the difference between contractual cash flows and cash flows at
current value that the Group expects to receive.
The
impairment model set forth by IFRS 9 is applicable to the financial
assets measured at amortized value or at fair value through changes
in other comprehensive income, except for the investment in equity
securities and assets from the contracts recognized under IFRS
15.
Pursuant to IFRS 9,
loss allowances are measured using one of the following
bases:
–
The 12-month ECL:
these are expected credit losses that result from those default
events on the financial instrument that are possible within 12
months after the reporting date; and
–
Full lifetime
expected credit losses: these are expected credit losses that
result from all possible default events over the life of the
financial instrument.
Given
the nature of the clients with which the Group operates and its
history of uncollectibility, the Group did not identify expected
credit losses.
With
regard to financial placements and according to the placement
policies in force, the Group monitors the credit rate and the
credit risk of these instruments. Pursuant to the analysis, the
Group did not identify the need to record impairment of these types
of instruments.
2.2.9.2.
Financial
liabilities
Initial
recognition and subsequent measurement
Financial
liabilities are classified, at initial recognition, as financial
liabilities at fair value through profit or loss, loans and
borrowings, or as derivatives designated as hedging instruments in
an effective hedge ratio, as appropriate.
Financial
liabilities are initially recognized at their fair value, net of
the incurred transaction costs. Since the Group has no financial
assets whose characteristics require the fair value accounting
according to IFRS, after the initial recognition, the financial
assets are valued at amortized cost. Any difference between the
amount received as financing (net of transaction costs) and the
reimbursement value is recognized in comprehensive income
throughout the life of the debt financial instrument using the
method of effective interest rate.
F-26
CENTRAL
PUERTO S.A.
At the
closing of these consolidated financial statements, the financial
liabilities classified as loans and borrowings of the Group include
Trade and other payables, overdrafts in bank accounts, Borrowings
from CAMMESA and Loans and borrowings that accrue
interest.
Derecognition
of financial liabilities
A
financial liability is derecognized when the obligation under the
liability is discharged or cancelled or expires.
When an
existing financial liability is replaced by another from the same
lender on substantially different terms, or the terms of an
existing liability are substantially modified, such an exchange or
modification is treated as a derecognition of the original
liability and the recognition of a new liability, and the
difference in the respective carrying amounts is recognized as
finance income or costs in the statement of income, as the case may
be.
2.2.9.3.
Offsetting
financial assets and financial liabilities
Financial assets
and financial liabilities are offset, and the net amount presented
in the statement of financial position if, and only if, there is a
currently enforceable legal right to offset the recognized amounts
and there is an intention to settle on a net basis, or to realize
the assets and settle the liabilities simultaneously.
2.2.9.4.
Financial
assets and liabilities with related parties
Assets
and liabilities with related parties are recognized initially at
fair value plus directly attributable transaction costs. As long as
credits and debts with related parties do not derive from
arms-length transactions, any difference arising at the initial
recognition between such fair value and the consideration given or
received in return shall be considered as an equity transaction
(capital contribution or payment of dividends, which will depend on
whether it is positive or negative).
Following initial
recognition, these receivables and payables are measured at their
amortized cost through the EIR method. The EIR amortization is
included in finance income or costs or other operating income or
expenses in the statement of income, depending on the nature of the
liability giving rise to it.
2.2.9.5.
Derivative
financial instruments and hedge accounting Initial recognition and
subsequent measurement
The
derivative financial instruments used by the Group are initially
recognized through their fair values at the date on which the
contract is entered into, and they are subsequently measured again
at their fair value. The derivative financial instruments are
accounted as financial assets when their fair value is positive and
as financial liabilities when their fair value is
negative.
The
method to recognize the loss or income from the change in fair
value depends on whether the derivative was determined as a hedge
instrument; in such case, on the nature of the item it is covering.
The Company can determine certain derivative as:
–
Fair value
hedge;
–
Cash flow
hedge;
At the
beginning of the transaction, the Group records the relationship
between the hedge instruments and items covered, as well as its
objectives for risk management and the strategy to make different
hedge
F-27
CENTRAL
PUERTO S.A.
operations. It also
records its assessment, both at the beginning and on a continuous
base, on whether the derivatives used in the hedge transactions are
highly effective to compensate changes in fair value or in the cash
flows of the items covered.
Fair
value hedge
Changes
in fair value of derivatives determined and classified as fair
value hedge are recorded in the statement of comprehensive income
together with any change in the fair value of the covered asset or
liability attributable to the covered risk.
Cash
flow hedge
The
effective part of changes in fair value of the derivatives
determined and classified as cash flow hedge are recognized in
Other comprehensive income. The loss or income related to the
non-effective part is immediately recognized in the statement of
comprehensive income within the Finance Expenses or Finance Income,
respectively.
The
cumulative amounts in Other comprehensive income are recorded in
the statement of comprehensive income in the periods in which the
item covered affects the comprehensive income. In the case of
interest rates hedge, this means the amounts recognized in equity
are reclassified as net finance income as interest is accrued on
associated debts.
Swap
contracts of interest rate are measured at their current value at
the closing of each period or fiscal year and are stated as assets
or liabilities depending on the rights and obligations emerging
from the respective contracts. Swap contracts were classified as
efficient hedge of cash flows risk. Changes in the accounting
measure of swap contracts are recognized in equity in the account
Other comprehensive income. These changes recognized in equity are
reclassified at the loss or income for the period or fiscal year in
which the interest of variable rate loans object of the hedge, are
recognized in the statement of comprehensive income.
If the
hedge instrument expires or is sold, it is expired or executed
without a replacement or successive renewal (as part of the hedging
strategy), or if its appointment as hedge is revoked, or if the
hedge no longer complies with the requirements to apply hedge
accountability, any cumulative revenue or loss previously
recognized in the other comprehensive income will stay separate in
equity until the expected transaction takes place. If in the future
transaction it is not expected to have the amount included in the
cash flow hedge reserve, it must be immediately reclassified to the
consolidated comprehensive income.
As at
December 31, 2018, the Group has no hedging derivative
instruments.
2.2.10.
Inventories
Inventories are
valued at the lower of acquisition cost restated according to Note
2.1.2 and net realizable value. In the estimation of recoverable
values, the purpose of the asset to be measured and the movements
of items of slow or scarce rotation are taken into account.
Inventories balance is not higher than its net realizable value at
the corresponding dates.
2.2.11.
Cash
and cash equivalents
Cash is
deemed to include both cash fund and freely-available bank deposits
on demand. Short-term deposits are deemed to include short-term
investments with significant liquidity and free availability that,
subject to no previous notice or material cost, may be easily
converted into a specific cash amount that is known with a high
degree of certainty upon the acquisition, are subject to an
insignificant risk of changes in value, maturing up to three months
after the date of the related acquisitions, and whose main purpose
is not investment or any other similar purpose, but settling
short-term commitments.
F-28
CENTRAL
PUERTO S.A.
For the
purpose of the consolidated statement of financial position and the
consolidated statement of cash flows, cash and cash equivalents
comprise cash at banks and on hand and short-term investments
meeting the abovementioned conditions.
2.2.12.
Provisions
Provisions are
recognized when the Group has a present obligation (legal or
constructive) as a result of a past event, it is probable that an
outflow of resources embodying economic benefits will be required
to settle the obligation and a reliable estimate can be made of the
amount of the obligation. Where the Group expects some or all of a
provision to be reimbursed, for example under an insurance
contract, the reimbursement is recognized as a separate asset but
only when the reimbursement is virtually certain. The expense
relating to any provision is presented in the statement of income
under the item that better reflects the nature of the provision net
of any reimbursement to the extent that the latter is virtually
certain.
If the
effect of the time value of money is material, provisions are
discounted using a current pre-tax market rate that reflects, where
appropriate, the risks specific to the liability. Where discounting
is used, the increase in the provision due to the passage of time
is recognized as a finance cost in the statement of
income.
–
Provision for
lawsuits and claims
In the
ordinary course of business, the Group is exposed to claims of
different natures (e.g., commercial, labor, tax, social security,
foreign exchange or customs claims) and other contingent situations
derived from the interpretation of current legislation, which
result in a loss, the materialization of which depends on whether
one more events occur or not. In assessing these situations,
Management uses its own judgment and advice of its legal counsel,
both internal and external, as well as the evidence available as of
the related dates. If the assessment of the contingency reveals the
likelihood of the materialization of a loss and the amount can be
reliably estimated, a provision for lawsuits and claims is recorded
as of the end of the reporting period.
2.2.13.
Contingent
liabilities
A
contingent liability is: (i) a possible obligation that arises from
past events and whose existence will be confirmed only by the
occurrence or non-occurrence of one or more uncertain future events
not wholly within the control of the entity; or (ii) a present
obligation that arises from past events but is not recognized
because: (a) it is not probable that an outflow of resources
embodying economic benefits will be required to settle the
obligation; or (2) the amount of the obligation cannot be measured
with sufficient reliability.
A
contingent liability is not recognized in financial statements; it
is reported in notes, unless the possibility of an outflow of
resources to settle such liability is remote. For each type of
contingent liability as of the relevant reporting period-end dates,
the Group shall disclose (i) a brief description of the nature of
the obligation and, if possible, (ii) an estimate of its financial
impact; (iii) an indication of the uncertainties about the amount
or timing of those outflows; and (iv) the possibility of obtaining
potential reimbursements.
2.2.14.
Contingent
assets
A
contingent asset is a possible asset that arises from past events
and whose existence will be confirmed only by the occurrence or
non-occurrence of one or more uncertain future events not wholly
within the control of the Group.
A
contingent asset is not recognized in financial statements; it is
reported in notes only where an inflow of economic benefits is
probable. For each type of contingent asset as of the relevant
reporting period-end dates, the Group shall disclose (i) a brief
description of the nature thereof and, if possible, (ii) an
estimate of its financial impact.
F-29
CENTRAL
PUERTO S.A.
2.2.15.
Employee
benefits
Employee short-term
benefits:
The
Group recognizes short-term benefits to employees, such as salary,
vacation pay, bonuses, among others, on an accrued basis and
includes the benefits arising from collective bargaining
agreements.
Post-employment
employee long-term benefits:
The
Group grants benefits to all trade-union employees when obtaining
the ordinary retirement benefit under the Argentine Integrated
Pension Fund System, based on multiples of the relevant
employees’ salaries.
The
amount recognized as a liability for such benefits includes the
present value of the liability at the end of the reporting period,
and it is determined through actuarial valuations using the
projected unit credit method.
Actuarial gains and
losses are fully recognized in other comprehensive income in the
period when they occur and immediately allocated to unappropriated
retained earnings (accumulated losses), and not reclassified to
income in subsequent periods.
The
Group recognizes the net amount of the following amounts as expense
or income in the statement of income for the reporting year: (a)
the cost of service for the current period; (b) the cost of
interest; (c) the past service cost, and (d) the effect of any
curtailment or settlement.
Other
long-term employee benefits:
The
Group grants seniority-based benefits to all trade-union employees
when reaching a specific seniority, based on their normal
salaries.
The
amount recognized as liabilities for other long-term benefits to
employees is the present value of the liability at the end of the
reporting period. The Group recognizes the net amount of the
following amounts as expense or income: (a) the cost of service for
the current period; (b) the cost of interest; (c) actuarial income
and loss, which shall be recognized immediately and in full; (d)
the past service cost, which shall be recognized immediately and in
full; and (e) the effect of any curtailment or
settlement.
2.2.16.
Share-based
payments
The
cost of share-based payments transactions that are settled with
equity instruments of one of our subsidiaries is determined by the
fair value at the date when the grant is made using an appropriate
valuation model.
This
cost is recognized in the consolidated financial statements under
employee benefits expense, together with a corresponding total
increase in non-controlling interest.
During
the years ended December 31, 2018 and 2017 the expense booked in
the consolidated financial statements under employee benefits
expense amounts to 13,369 and 5,155, respectively.
2.2.17.
Investment
in associates
The
Group’s investments in associates are accounted for using the
equity method. An associate is an entity over which the Group has
significant influence. Significant influence is the power to
participate in the financial and operating policy decisions of the
investee, but is neither control nor joint control.
F-30
CENTRAL
PUERTO S.A.
According to the
equity method, investments in associates are originally booked in
the statement of financial position at cost, plus (less) the
changes in the Group’s ownership interests in the
associates’ net assets subsequent to the acquisition date. If
any, goodwill relating to the associate is included in the carrying
amount of the investment and is neither amortized nor individually
tested for impairment. If the cost of the investments is lower than
the proportional share as of the date of acquisition on the fair
value of the associate’s assets and liabilities, a gain is
recognized in the period in which the investment was
acquired.
The
statement of income reflects the share of the results of operations
of the associates adjusted on the basis of the fair values
estimated as of the date on which the investment was incorporated.
When there has been a change recognized directly in the equity of
the associates, the Group recognizes its share of any changes and
includes them, when applicable, in the statement of changes in
equity.
The
Group’s share of profit of an associate is shown in a single
line on the main body of the consolidated statement of income. This
share of profit includes income or loss after taxes of the
associates.
The
financial information of the associates is prepared for the same
reporting period as the Group. When necessary, adjustments are made
to bring the accounting policies of the associates in line with
those of the Group.
After
application of the equity method, the Group determines whether it
is necessary to recognize impairment losses on its investment in
its associates. At each reporting date, the Group determines
whether there is objective evidence that the value of investment in
the associates has been impaired. If such was the case, the Group
calculates the amount of impairment as the difference between the
recoverable amount of the investment in the associates and its
carrying value, and recognizes the loss as “Share of losses
of an associate” in the statement of income.
Upon
loss of significant influence over the associate, the Group
measures and recognizes any retained investment at its fair value.
If such was the case, any difference between the carrying amounts
of the investment in the associate and the fair value on any
retained investment, as well as the disposal proceeds, are
recognized in the statement of income.
The
information related to associates is included in Note
3.
2.2.18.
Information
on operating segments
For
management purposes, the Group is organized in three different
business units to carry out its activities, as
follows:
–
Electric power
generation: through its own assets the Group is engaged in the
production of electric power and its sale. This business unit does
not include La Plata plant operations due to the sale of such
facility (See Note 22.8).
–
Natural gas
transport and distribution: through its equity investees companies
Distribuidora de Gas del Centro S.A. and Distribuidora de Gas
Cuyana S.A. the Group is engaged in the natural gas distribution
public sector service in the Cuyo and Centro regions of Argentina
and it is also engaged in the natural gas transport sector service
through its equity investee Company Transportadora de Gas del
Mecrosur S.A.
–
Management and
operations of thermal plants: through its equity investees
Termoeléctrica José de San Martín S.A. and
Termoeléctrica Manuel Belgrano S.A. and its subsidiary Central
Vuelta de Obligado S.A. the Group is engaged in the management and
operations of these thermal plants.
The
Group has two reporting segments: production of electric power and
natural gas transport and distribution. Management and operations
activities are included in others, because the information is not
material.
F-31
CENTRAL
PUERTO S.A.
The
financial performance of segments is evaluated based on net income
and measured consistently with the net income disclosed in the
financial statements (Note 4).
2.2.19.
Non-current
assets held for sale and discontinued operations
The
Group classifies non-current assets and disposal groups as held for
sale if their carrying amounts will be recovered principally
through a sale transaction or its distribution to the shareholders
rather than through continuing use. Such assets are measured at the
lower of their carrying amount and fair value less costs to sell.
Costs to sell are the incremental costs directly attributable to
the disposal of an asset (disposal group), excluding finance costs
and income tax expense.
The
criteria for held for sale classification is regarded as met only
when the sale is highly probable and the asset or disposal group is
available for immediate sale in its present condition. Actions
required to complete the sale should indicate that it is unlikely
that significant changes to the sale will be made or that the
decision to sale will be withdrawn. Management must be committed to
the plan to sell the asset and the sale expected to be completed
within one year from the date of the classification.
Property, plant and
equipment and intangible assets are not depreciated or amortized
once classified as held for sale.
Assets
and liabilities classified as held for sale are presented
separately as current items in the consolidated statement of
financial position.
A
disposal group qualifies as discontinued operation if:
–
It is a component
of the Group that represents a cash generating unit or a group of
cash generating units,
–
it is classified as
held for sale or as for distribution to equity holders, or it has
already been disposed for distribution to the shareholders,
and;
–
it represents a
separate major line of business or geographical area of operations
or it is a subsidiary acquired exclusively with a view to
resale.
Discontinued
operations are excluded from the results of continuing operations
and are presented as a single amount as income or loss after tax
from discontinued operations in the consolidated statement of
income.
Additional
disclosures are provided in Note 21. All other notes to the
consolidated financial statements include amounts for continuing
operations, unless indicated otherwise.
2.2.20.
Business
combinations
Business
combinations are accounted using the acquisition method when the
Group takes effective control of the acquired company.
The
Group will recognize in its financial statements the acquired
identifiable assets, the assumed liabilities, any non-controlling
interest and, if any, goodwill according to IFRS 3.
The
acquisition cost is measured as the addition of the transferred
consideration, measured at fair value on that date, and the amount
of any non-controlling interest in the acquiree. The Group will
measure the non- controlling interest in the acquiree at fair value
or at the proportional interest in the identifiable net assets of
the acquiree.
If the
business combination is made in stages, the Group will measure
again its previous holding at fair value at the acquisition date
and will recognize income or loss in the consolidated statement of
comprehensive income.
F-32
CENTRAL
PUERTO S.A.
Goodwill is
measured at cost, as excess of the transferred consideration
regarding the acquired identifiable assets and the net assumed
liabilities of the Group. If this consideration is lower than the
fair value of the identifiable assets and of the assumed
liabilities, the difference is recognized in the consolidated
statement of comprehensive income.
2.3.
Significant
accounting estimates and assumptions
The
preparation of the Group’s financial statements requires
management to make significant estimates and assumptions that
affect the recorded amounts of revenues, expenses, assets and
liabilities, and the disclosure of contingent liabilities, at the
end of the reporting period. In this sense, the uncertainties
related to the estimates and assumptions adopted could give rise in
the future to final results that could differ from those estimates
and require significant adjustments to the amounts of the assets
and liabilities affected.
The key
assumptions concerning the future and other key sources of
estimation uncertainty at the end of the reporting period, that
have a significant risk of causing a material adjustment to the
carrying amounts of assets and liabilities within the next
financial year, are described below. The Group based its accounting
assumptions and significant estimates on parameters available when
the financial statements were prepared. Existing circumstances and
assumptions about future developments, however, may change due to
market changes or circumstances arising beyond the control of the
Group. Such changes are reflected in the assumptions when they
occur.
The terms for collection and the valuation of accumulated amounts
related to receivables under Resolution 95 and receivables under
Resolution 406 (from 2008 and thereafter).
Collection of the
principal and interest on these receivables is subject to various
business risks and uncertainties including, but not limited to,
regulatory changes that could impact the timing and amount of
collections, and economic conditions in Argentina. These
assumptions are reviewed at the end of each reporting period.
Actual future cash flows could differ from these
estimates.
Recoverability of property, plant and equipment and intangible
assets:
At each
closing date of the reported period, the Group evaluates if there
is any sign that the property, plant and equipment and/or
intangible assets with finite useful lives may have their value
impaired. Impairment exists when the book value of assets related
to the Cash Generating Unit (CGU) exceeds its recoverable value,
which is the higher between its fair value loss costs of sale of
such asset and value in use. The value in use is calculated through
the estimation of future cash flows discounted at their present
value through a discount rate that reflects the current assessments
of the market over the temporal value of money and the specific
risks of each CGU. Projection calculations cover a five-year
period. The recoverable value is sensitive to the used discount
rate, as well as the estimated inflows and the growth
rate.
The probability of occurrence and the amount of liabilities related
to lawsuits and claims:
The
Group based its estimates on the opinions of its legal counsel
available when the consolidated financial statements were prepared.
Existing circumstances and assumptions, however, may change due to
changes in circumstances arising beyond the control of the
Group.
Long-term employee benefit plan
The
plan costs are determined by actuarial valuations. Actuarial
valuations involve several assumptions that might differ from the
results that will actually occur in the future.
These
assumptions include the assessment of the discount rate, future
salary increases, mortality rates and the time when each employee
will adhere to the retirement benefit. Due to the complexity of the
valuation, the underlying assumptions and its long-term nature, the
benefit obligations are sensitive to changes in these assumptions.
These assumptions are reviewed at the end of each reporting
period.
F-33
CENTRAL
PUERTO S.A.
2.4.
New
standards and interpretations adopted
As from
the fiscal year beginning January 1, 2018, the Group has applied
for the first time certain new and/or amended standards and
interpretations as issued by the IASB.
A brief
description of the new and/or amended standards and interpretations
adopted by the Group and their impact on these consolidated
financial statements, are presented below.
IFRS
15 - Revenue from contracts with customers
In May
2014, IASB issued IFRS 15 “Revenue from contracts with
customers”, which establishes the new model for recognizing
revenue from contracts with customers, except for those contracts
that are under the scope of other standards. Such standard revokes
the current guidelines for revenue recognition included in IAS 18
“Revenue”, IAS 11 “Construction Contracts”
and related interpretations when this standard becomes
effective.
IFRS 15
structures a five steps model to measure revenues from contracts
with customers, as follows:
Step 1:
Identify the contract with a customer.
Step 2:
Identify the performance obligations in the contract. Step 3:
Determine the transaction price.
Step 4:
Allocate the transaction price to each performance
obligation.
Step 5:
Recognize revenue when (or while) a performance obligation is
satisfied.
Under
IFRS 15, revenue is recognized when it reflects the consideration
to which the company expects to be entitled in exchange for goods
or services to a customer.
The
standard requires the entity to judge taking into account the
relevant factors and circumstances applied to contracts with
customers. The standard also specifies the measurement of cost
increase due to a contract and the cost directly related to the
performance of a contract.
Pursuant to IFRS
15, among others, a system on the allocation of the transaction
price to each performance obligation is established. According to
such standard, the Company shall recognize revenue when a
performance obligation is satisfied, i.e. every time
“control” over those goods and services is transferred
to the customer.
The
Company has a sole significant revenue source, which consists on
the commercialization of energy produced in the spot market under
the schedule established in Resolution 19/2017 of the Secretariat
of Electric Power, CAMMESA being its main customer.
At the
closing of each month, the Company recognizes its sales revenue in
accordance with the availability of its machines’ effective
power and the energy supplied; as balancing entry, a sales credit
is recognized, which represents the Company’s unconditional
right to consideration owed by the customer.
Billing
for the service is monthly made by CAMMESA in accordance with the
guidelines established by SEE; and compensation is usually received
in a maximum term of 90 days. Therefore, no implicit financing
components are recognized. The satisfaction of the performance
obligation is done throughout time.
After
the analysis, the management of the Company adopted the modified
retrospective method of paragraph C3 (b) of the mentioned
regulation. Moreover, it concluded that the previous revenue
recognition practices are consistent with the requirements of IFRS
15.
F-34
CENTRAL
PUERTO S.A.
IFRS
9 - Financial Instruments
IFRS 9
replaces IAS 39 “Financial Instruments: Recognition and
Measurement” for the annual periods beginning January 1,
2018, and it includes the three aspects of financial statements
measurement: classification and measurement; impairment and
hedging.
Pursuant to the
analysis made, the Company did not register any adjustment on
unappropriated retained earnings as at January 1, 2018. Therefore,
the application of IFRS 9 did not mean that the Company had to make
amendments to the disclosures made on December 31, 2017 regarding
the statements of financial position, changes in equity,
comprehensive income and cash flow.
The
Company used the exception that allows it not to restate the
comparative information for previous periods regarding
classification and measurement changes (impairment included). As a
result, the Company did not apply IFRS 9 requirements to the
comparative period presented. For this reason, the comparative
information for the periods ended December 31, 2017 and 2016 was
not modified.
a)
Classification
and measurement of financial assets and liabilities
IFRS 9
maintains, to great extent, the existing requirement of IAS 39 for
the classification of financial liabilities. However, it has a new
classification approach for financial assets based in two concepts:
the contractual cash flow characteristics of the financial asset
and the new business model of the company.
The
following table shows a comparison between the applied measurement
criteria for financial assets according to IAS 39 and the criteria
applied as from the IFRS adoption.
|
Financial
instrument
|
|
Classification
under IAS 39
|
|
New
classification under IFRS 9
|
|
|
|
|
|
|
|
Cash
and cash equivalents
|
|
Loans
and receivables
|
|
Financial assets at
amortized cost
|
|
|
|
|
|
|
|
Mutual
funds
|
|
Financial assets at
fair value through profit a loss
|
|
Financial assets at
fair value through profit a loss
|
|
|
|
|
|
|
|
Trade
and other receivables
|
|
Loans
and receivables
|
|
Financial assets at
amortized cost
|
The
Group describes its accounting policy regarding financial
instrument in Note 2.2.9.
This
change did not have an impact on the Company.
IAS 39
requirements for implicit derivatives in main contracts that are
financial liabilities or that are outside the scope of IFRS 9 (for
example, leasing contracts) are kept, i.e. they must be bifurcated
if they are not “closely related”.
b)
Impairment
of financial assets and liabilities
IFRS 9
replaces IAS 39 “incurred loss” model by the
“expected credit losses” (“ECL”) model.
This shall require considerable judgment regarding how economic
factors affect ECL, which shall be determined on a weighted average
basis. ECL derives from the difference between the contractual cash
flows and the cash flows at current value that the Group expects to
receive.
The new
impairment model shall be applied to financial assets measured at
amortized cost or at fair value through other comprehensive income,
except for investments on equity instruments and contracts under
the scope of IFRS 15.
F-35
CENTRAL
PUERTO S.A.
Under
IFFRS 9, loss allowances shall be measured using the following
bases:
-
12-month ECL: these
are expected credit losses that result from default events on a
financial instrument that are possible within the 12 month after
the reporting date; and
-
Lifetime ECL: these
are expected credit losses that result from all possible default
events over the expected life of a financial
instrument.
Due to
the nature of the Group’s customers and their bad debt
history, the Company did not identify that the change of approach
in the impairment method under IFRS 9 results in the recognition of
an adjustment to balances as at January 1, 2018.
In the
case of financial placement and in accordance with placement
policies in force, the Company monitors credit rating and credit
risk of these instruments. Pursuant to the analysis made, the
Company did not identify that it is necessary to make an adjustment
to the balances of such instruments as at January 1,
2018.
IFRIC
22 - Foreign Currency Transactions and Advance
Consideration
This
interpretation clarifies the “transaction date” for the
purpose of determining the exchange rate to use on initial
recognition of a related asset, expense or income, when an entity
has received or paid in advance in foreign currency. It applies to
transactions in foreign currency when an entity recognizes a
non-monetary assets or liability derived from the reception or
payment in advance before initial recognition of a related asset,
expense or income.
So as
to determine the exchange rate to use on initial recognition of an
asset, expense or income, the transaction date is the date on which
a non-monetary asset or liability derived from reception or payment
in advance is recognized.
It is
effective for periods beginning on January 1, 2018.
This
standard had no impact on the consolidated financial statements of
the Group because the Company already applied the criteria
established by this interpretation.
F-36
CENTRAL
PUERTO S.A.
2.5.
IFRS
issued but not yet effective
The
following new and/or amended standards and interpretations have
been issued but were not effective as of the date of issuance of
these consolidated financial statements of the Group. In this
sense, only the new and/or amended standards and interpretations
that the Group expects to be applicable in the future are
indicated. In general, the Group intends to adopt these standards,
as applicable, when they become effective.
IFRS
16 Leases
In
January 2016, the IASB issued the final version of IFRS 16 and it
replaces IAS 17 Leases, IFRIC 4 Determining whether an arrangement
contains a lease, SIC-15 Operating leases-incentives and SIC-27
Evaluating the substance of transactions involving the legal form
of a lease. IFRS 16 sets out the principles for the recognition,
measurement, presentation and disclosure of leases and requires
lessees to account for all leases under a single on-balance sheet
model similar to the accounting for finance leases under IAS 17.
The standard includes two recognition exemptions leases of
“low-value” assets (e.g., personal computers) and
short-term leases (i.e., leases with a lease term of 12 months or
less). At the commencement date of a lease, a lessee will recognize
a liability to make lease payments (i.e., the lease liability) and
an asset representing the right to use the underlying asset during
the lease term (i.e., the right to-use asset). Lessees will be
required to separately recognize the interest expense on the lease
liability and the depreciation expense on the right- of-use
asset.
Lessor
accounting under IFRS 16 is substantially unchanged from
today’s accounting under IAS 17. Lessors will continue to
classify all leases using the same classification principle as in
IAS 17 and distinguish between two types of leases: operating and
finance leases. IFRS 16 also requires lessees and lessors to make
more extensive disclosures than under IAS 17. IFRS 16 is effective
for annual periods beginning on or after January 1, 2019. Early
adoption is permitted, but not before the entity applies IFRS 15. A
lessee can choose to apply the standard using either a full
retrospective or modifies retrospective approach.
Transition
to IFRS 16
The
Group plans to adopt IFRS 16 retroactively for each previous period
filed. The Group will apply this standard to contracts previously
identified as Lease Contracts which apply IAS 17 and IFRIC 4.
Therefore, the Group will not apply this standard to any contract
that has not been previously identified as a Lease Contract which
applies IAS 17 and IFRIC 4.
The
Group will apply the exemption set forth in this standard for lease
contracts whose term ends within 12 months as from the standard
initial application date, and for lease contracts with an
underlying asset of low value.
Having
analyzed it, the management of the Group concluded that adopting
IFRS 16 will not have significant effects on the Company’s
financial statements.
IFRIC
Interpretation 23 - Uncertainty over Income Tax
Treatments
In June
2017, the IASB issued IFRIC Interpretation 23 - Uncertainty over
Income Tax Treatments. The Interpretation clarifies application of
recognition and measurement requirements in IAS 12 Income Taxes
when there is uncertainty over income tax treatments. The
Interpretation specifically addresses the following: (a) whether an
entity considers uncertain tax treatments separately, (b) the
assumptions an entity makes about the examination of tax treatments
by taxation authorities, (c) how an entity determines taxable
profit (tax loss), tax bases, unused tax losses, unused tax credits
and tax rates and (d) how an entity considers changes in facts and
circumstances. IFRIC 23 is effective for annual periods beginning
on or after January 1, 2019. Early adoption is
permitted.
The
Group concluded that this interpretation will not have significant
effects on the Company’s consolidated financial
statements.
Annual
improvements of period 2015-2017 (issued in December
2017)
These
improvements include:
-
IFRS 3 Business
combinations
Amendments make it
clear that when an entity obtains control of a business that is a
joint operation, it applies the requirements for a business
combination reached in stages, including the new measurement of
interest previously held in the assets and liabilities of a joint
operation at fair value. When doing so, the acquirer remeasures the
previous total interest in the joint operation.
An
entity will apply those amendments to business combinations for
which the acquisition date is at or after the commencement of the
first annual report period starting on or after January 1, 2019,
with the anticipated application being permitted. These amendments
will be applied in the business combinations of the
Group.
F-37
CENTRAL
PUERTO S.A.
-
IAS 12 Income
taxes
The
amendments make it clear that the income tax consequences of
dividends are more directly linked to past transactions or events
that generated distributable income to owners. Therefore, an entity
recognizes the consequences of the income tax on revenue dividends,
other comprehensive income or equity according to the place in
which the entity originally recognized those past transactions or
events.
An
entity will apply those amendments to the annual periods starting
on or after January 1, 2019, with the anticipated application being
permitted. When an entity applies those amendments for the first
time, it will apply them to the income tax of the dividends
recognized in or after the commencement of the comparative period.
Since the current practice of the Group is aligned with these
amendments, the Group does not expect any effect on its
consolidated statements.
-
IAS 23 Borrowing
Costs
The
amendments make it clear that any borrowing originally taken for
the development of a qualifying asset is considered by the entity
as a general borrowing, when all activities were completed in order
to have such asset ready for its intended use or sale.
An
entity will apply those amendments to any borrowing costs incurred
on or after commencement of the annual report filing period in
which the entity applies such amendments for the first time. These
amendments apply to periods beginning on or after January 1, 2019.
Early adoption is permitted
.
Since the current practices
of the Group are aligned with these amendments, the Group does not
expect any effect on its consolidated statements.
3.
Investment
in associates
The
book value of investment in associates as of December 31, 2018 and
2017 amounts to:
|
|
12-31-2018
|
12-31-2017
|
|
|
ARS
000
|
ARS
000
|
|
|
|
|
|
Termoeléctrica
José de San Martin S.A.
|
55,492
|
37,903
|
|
Termoeléctrica
Manuel Belgrano S.A.
|
49,138
|
42,439
|
|
ECOGAS Group (Note
3.2)
|
1,826,888
|
1,361,025
|
|
Transportadora de
Gas del Mercosur S.A.
|
66,679
|
388,575
|
|
Others
|
139
|
196
|
|
|
1,998,336
|
1,830,138
|
The
share of the profit of associates for the years ended December 31,
2018, 2017 and 2016 amounts to:
|
|
2018
|
2017
|
2016
|
|
|
ARS
000
|
ARS
000
|
ARS
000
|
|
|
|
|
|
|
Termoeléctrica
José de San Martin S.A.
|
35,912
|
32,804
|
29,291
|
|
Termoeléctrica
Manuel Belgrano S.A.
|
29,225
|
34,782
|
38,606
|
|
ECOGAS Group (Note
3.2)
|
1,011,224
|
726,719
|
349,257
|
|
Transportadora de
Gas del Mercosur S.A.
|
(2,626
)
|
378,411
|
-
|
|
Others
|
450
|
288
|
5,496
|
|
|
1,074,185
|
1,173,004
|
422,650
|
3.1.
TJSM
and TMB
As of
December 31, 2018, 2017 and 2016, the Group has a 30.8752% interest
in TJSM and 30.9464% interest in TMB, which are engaged in managing
the purchase of equipment, and building, operating and maintaining
the power plants. TJSM and TMB are private, unlisted
companies.
F-38
CENTRAL
PUERTO S.A.
During
the years ended December 31, 2018, 2017 and 2016, the Company
received cash dividends from TMB and TJSM for 54,824, 59,143 and
50,247, respectively.
3.2.
Investments
in gas distribution
The
Group holds ownership interests of 44.10% in Inversora de Gas
Cuyana S.A. (“IGCU”, the controlling company of
Distribuidora de Gas Cuyana S.A. “DGCU”), of 44.10% in
Inversora de Gas del Centro S.A. (“IGCE”, the
controlling company of Distribuidora de Gas del Centro S.A.
“DGCE”) and 17.20% in DGCE (all together “the
ECOGAS Group”). Consequently, the Group holds, both directly
and indirectly, a 22.49% interest in DGCU and 39.69% of the capital
stock of DGCE, which are engaged in the distribution of natural
gas. The Group does not control such companies.
IGCE is
a private, unlisted company. Its only significant asset is a 51%
equity interest in DGCE, a company engaged in the distribution of
natural gas in the provinces of Cordoba, La Rioja and Catamarca,
Argentine.
IGCU is
a private unlisted company. Its only significant asset is a 51%
equity interest in DGCU, a company engaged in the distribution of
natural gas in the provinces of Mendoza, San Juan and San
Luis.
On
March 2, 2018 and on February 23, 2018 the Group received dividends
of 198,121 (equivalent to USD 7,099,316) and 183,115
(equivalent to USD 6,482,009), respectively, from IGCE and DGCE. On
April 16, 2018 the Group received dividends of 164,122 (equivalent
to USD 6,042,152) from IGCU.
On
February 23, 2018, our Board of Directors approved the sale process
of up to 27,597,032 DGCE shares, which represent 17,20% of its
capital stock, through a potential initial public offering of DGCE
in the Argentine Republic. On March 14, 2018, the Company
authorized the offer of up to 10,075,952 shares of DGCE, subject to
market conditions. As of the date of these consolidated financial
statements, the Company, and certain potential selling
shareholders, continue to evaluate this strategy.
3.3.
Transportadora
de Gas del Mercosur S.A.
The
Group has a 20% interest in Transportadora de Gas del Mercosur S.A.
(“TGM”). This Company has a gas pipeline that covers
the area from Aldea Brasilera (in the Province of Entre Ríos)
to Paso de los Libres (in the Province of Corrientes). In 2009, TGM
terminated its contract with YPF, which was its only client to
date, on the grounds of consecutive non-compliances. On December
22, 2017, YPF agreed to pay TGM USD 114,000,000 as full and
final settlement to cover all the complaints TGM claims against
YPF. TGM is a private unlisted company.
On April 16, 2018
the Group received dividends of 310,759 (equivalent to USD
11,406,528) from TGM.
F-39
CENTRAL
PUERTO S.A.
4.
Operating
segments
The
following provides summarized information of the operating segments
for the years ended December 31, 2018, 2017 and 2016:
|
2018
|
Electric Power
Generation
|
Natural Gas
Transport and Distribution (1) (2)
|
Others
(1)
|
Adjustments and
Eliminations
|
Total
|
|
|
ARS
000
|
ARS
000
|
ARS
000
|
ARS
000
|
ARS
000
|
|
|
|
|
|
|
|
|
Revenues
|
13,810,655
|
17,100,845
|
1,103,248
|
(17,749,378
)
|
14,265,370
|
|
Cost of sales
|
(6,162,940
)
|
(11,352,227
)
|
(663,141
)
|
11,691,610
|
(6,486,698
)
|
|
Administrative and selling
expenses
|
(1,389,336
)
|
(2,024,080
)
|
-
|
2,024,080
|
(1,389,336
)
|
|
Other operating
income
|
13,207,713
|
230,284
|
15,129
|
(230,284
)
|
13,222,842
|
|
Other operating
expenses
|
(131,462
)
|
(56,002
)
|
(1,419
)
|
56,002
|
(132,881
)
|
|
CVO receivables
update
|
11,017,014
|
-
|
-
|
-
|
11,017,014
|
|
|
|
|
|
|
|
|
Operating
income
|
30,351,644
|
3,898,820
|
453,817
|
(4,207,970
)
|
30,496,311
|
|
|
|
|
|
|
|
|
Other (expenses)
income
|
(13,827,779
)
|
(1,148,373
)
|
(145,543
)
|
1,534,645
|
(13,587,050
)
|
|
|
|
|
|
|
|
|
Net income for the
segment
|
16,523,865
|
2,750,447
|
308,274
|
(2,673,325
)
|
16,909,261
|
|
Share in the net
income for the segment
|
16,523,865
|
255,135
|
130,261
|
-
|
16,909,261
|
|
2017
|
Electric Power
Generation
|
Natural Gas
Transport and Distribution (1)
|
Others
(1)
|
Adjustments and
Eliminations
|
Total
|
|
|
ARS
000
|
ARS
000
|
ARS
000
|
ARS
000
|
ARS
000
|
|
|
|
|
|
|
|
|
Revenues
|
9,638,568
|
10,580,854
|
741,233
|
(11,322,087
)
|
9,638,568
|
|
Cost of sales
|
(5,199,149
)
|
(7,461,082
)
|
(475,503
)
|
7,936,585
|
(5,199,149
)
|
|
Administrative and selling
expenses
|
(1,056,257
)
|
(1,712,522
)
|
-
|
1,712,522
|
(1,056,257
)
|
|
Other operating
income
|
1,014,615
|
3,438,303
|
-
|
(3,438,303
)
|
1,014,615
|
|
Other operating
expenses
|
(140,138
)
|
(47,418
)
|
-
|
47,418
|
(140,138
)
|
|
|
|
|
|
|
|
|
Operating
income
|
4,257,639
|
4,798,135
|
265,730
|
(5,063,865
)
|
4,257,639
|
|
|
|
|
|
|
|
|
Other (expenses)
income
|
(959,184
)
|
(571,733
)
|
(52,204
)
|
1,796,653
|
213,532
|
|
|
|
|
|
|
|
|
Net income for the
segment
|
3,298,455
|
4,226,402
|
213,526
|
(3,267,212
)
|
4,471,171
|
|
Share in the net
income for the segment
|
3,298,455
|
1,105,130
|
67,586
|
-
|
4,471,171
|
|
2016
|
Electric Power
Generation
|
Natural Gas
Transport and Distribution (1)
|
Others
(1)
|
Adjustments and
Eliminations
|
Total
|
|
|
ARS
000
|
ARS
000
|
ARS
000
|
ARS
000
|
ARS
000
|
|
|
|
|
|
|
|
|
Revenues
|
7,044,039
|
4,034,473
|
388,014
|
(4,422,487
)
|
7,044,039
|
|
Cost of sales
|
(4,980,226
)
|
(3,342,800
)
|
(243,796
)
|
3,586,596
|
(4,980,226
)
|
|
Administrative and selling
expenses
|
(892,626
)
|
(624,979
)
|
-
|
624,979
|
(892,626
)
|
|
Other operating
income
|
2,324,243
|
65,543
|
-
|
(65,543
)
|
2,324,243
|
|
Other operating
expenses
|
(171,952
)
|
(10,433
)
|
-
|
10,433
|
(171,952
)
|
|
|
|
|
|
|
|
|
Operating
income
|
3,323,478
|
121,804
|
144,218
|
(266,022
)
|
3,323,478
|
|
|
|
|
|
|
|
|
Other (expenses)
income
|
(2,968,782
)
|
46,530
|
(24,249
)
|
194,576
|
(2,751,925
)
|
|
|
|
|
|
|
|
|
Net income for the
segment
|
354,696
|
168,334
|
119,969
|
(71,446
)
|
571,553
|
|
Share in the net
income for the segment
|
354,696
|
180,008
|
36,849
|
-
|
571,553
|
(1)
Includes
information from associates.
(2)
Includes income
(expenses) related to resale of gas transport and distribution
capacity.
F-40
CENTRAL
PUERTO S.A.
Major
customers
During
the years ended December 31, 2018, 2017 and 2016 revenues from
CAMMESA amounted to 13,267,217, 9,134,802 and 6,616,864 or 93%, 95%
and 94%, respectively, arising from sales in the electric power
generation segment.
5.
Revenues
|
|
2018
|
2017
|
2016
|
|
|
ARS
000
|
ARS
000
|
ARS
000
|
|
|
|
|
|
|
Revenues from
Resolution 19, SGE Resolution 70/2018,Resolution 95/2013 and
amendments
|
12,667,903
|
9,134,802
|
6,616,864
|
|
Sales under
contracts
|
896,802
|
273,285
|
215,479
|
|
Steam
sales
|
245,950
|
230,481
|
211,696
|
|
Resale of gas
transport and distribution capacity
|
193,889
|
-
|
-
|
|
Revenues from CVO
thermal plant management
|
260,826
|
-
|
-
|
|
|
14,265,370
|
9,638,568
|
7,044,039
|
6.
Operating
expenses
6.1.
Cost
of sales
|
|
2018
|
2017
|
2016
|
|
|
ARS
000
|
ARS
000
|
ARS
000
|
|
|
|
|
|
|
Inventories at
beginning of each year
|
265,827
|
218,028
|
198,408
|
|
|
|
|
|
|
Purchases and
operating expenses for each year:
|
|
|
|
|
Purchases
|
2,194,756
|
560,058
|
568,682
|
|
Operating expenses
(Note 6.2)
|
4,321,698
|
4,686,890
|
4,431,164
|
|
|
6,516,454
|
5,246,948
|
4,999,846
|
|
|
|
|
|
|
Inventories at the
end of each year
|
(295,583
)
|
(265,827
)
|
(218,028
)
|
|
|
6,486,698
|
5,199,149
|
4,980,226
|
6.2.
Operating,
administrative and selling expenses
|
|
2018
|
2017
|
2016
|
|||
|
Accounts
|
Operating
expenses
|
Administrative
and selling expenses
|
Operating
expenses
|
Administrative
and selling expenses
|
Operating
expenses
|
Administrative
and selling expenses
|
|
|
ARS
000
|
ARS
000
|
ARS
000
|
ARS
000
|
ARS
000
|
ARS
000
|
|
|
|
|
|
|
|
|
|
Compensation to
employees
|
1,370,994
|
550,542
|
1,436,661
|
529,718
|
1,365,375
|
434,459
|
|
Other long-term
employee benefits
|
28,092
|
4,534
|
42,655
|
6,839
|
45,073
|
7,964
|
|
Depreciation of
property, plant and equipment
|
1,142,555
|
-
|
1,201,928
|
179
|
999,349
|
-
|
|
Amortization of
intangible assets
|
349,674
|
-
|
329,579
|
-
|
358,966
|
-
|
|
Purchase of energy
and power
|
44,148
|
1,392
|
126,458
|
-
|
46,104
|
-
|
|
Fees and
compensation for services
|
247,799
|
342,908
|
314,593
|
272,915
|
292,352
|
215,599
|
|
Maintenance
expenses
|
481,021
|
154,788
|
599,708
|
41,831
|
694,368
|
9,845
|
|
Consumption of
materials and spare parts
|
161,289
|
245
|
184,575
|
-
|
275,423
|
-
|
|
Insurance
|
241,474
|
3,511
|
228,411
|
3,092
|
244,197
|
1,067
|
|
Levies and
royalties
|
223,076
|
-
|
212,799
|
-
|
101,318
|
-
|
|
Taxes and
assessments
|
20,449
|
48,452
|
6,102
|
48,719
|
5,356
|
41,295
|
|
Tax on bank account
transactions
|
2,475
|
256,327
|
-
|
137,445
|
-
|
168,805
|
|
Others
|
8,652
|
26,637
|
3,421
|
15,519
|
3,283
|
13,592
|
|
Total
|
4,321,698
|
1,389,336
|
4,686,890
|
1,056,257
|
4,431,164
|
892,626
|
F-41
CENTRAL
PUERTO S.A.
7.
Other
income and expenses
7.1.
Other
operating income
|
|
2018
|
2017
|
2016
|
|
|
ARS
000
|
ARS
000
|
ARS
000
|
|
|
|
|
|
|
Interest earned
from customers
|
1,623,309
(1)
|
437,583
(1)
|
211,800
(1)
|
|
Foreign exchange
difference, net
|
11,403,596
(2)
|
116,699
(2)
|
302,243
(2)
|
|
Effect on the
discount of trade and other receivables and payables,
net
|
-
|
-
|
1,473,236
|
|
Recovery of
insurance
|
181,475
|
369,273
|
298,175
|
|
Others
|
14,462
|
6,507
|
38,789
|
|
|
13,222,842
|
930,062
|
2,324,243
|
(1)
Includes 34,393,
34,771 and 44,219 related to receivables under FONINVEMEM I and II
Agreements for the years ended December 31, 2018, 2017 and 2016,
respectively. It also includes 1,110,232 related to CVO receivables
for the year ended December 31, 2018.
(2)
Includes 662,469,
170,048 and 377,012 related to receivables under FONINVEMEM I and
II Agreements for the years ended December 31, 2018, 2017 and 2016,
respectively. It also includes 10,119,628 related to CVO
receivables for the year ended December 31, 2018.
7.2.
Other
operating expenses
|
|
2018
|
2017
|
2016
|
|
|
ARS
000
|
ARS
000
|
ARS
000
|
|
|
|
|
|
|
Charge related to
the provision for lawsuits and claims
|
(89,031
)
|
(102,204
)
|
(171,952
)
|
|
Impairment of
material and spare parts
|
(37,895
)
|
(34,401
)
|
-
|
|
Others
|
(5,955
)
|
(3,533
)
|
-
|
|
|
(132,881
)
|
(140,138
)
|
(171,952
)
|
7.3.
Finance
income
|
|
2018
|
2017
|
2016
|
|
|
ARS
000
|
ARS
000
|
ARS
000
|
|
|
|
|
|
|
Interest
earned
|
51,702
|
238,331
|
108,893
|
|
Net income on
financial assets at fair value through profit or loss
|
510,748
|
111,514
|
308,515
|
|
Foreign exchange
differences
|
1,331,368
|
66,978
|
197,748
|
|
Net income on
disposal of financial assets at fair value through other
comprehensive income
(1)
|
386,375
|
1,141,993
|
258,759
|
|
|
2,280,193
|
1,558,816
|
873,915
|
(1)
Net of 36,094 and
90,359 corresponding to turnover tax for the years ended December
31, 2018 and 2017.
7.4.
Finance
expenses
|
|
2018
|
2017
|
2016
|
|
|
ARS
000
|
ARS
000
|
ARS
000
|
|
|
|
|
|
|
Interest on loans
and borrowings from CAMMESA
|
(1,478,601
)
|
(1,110,955
)
|
(1,046,242
)
|
|
Foreign exchange
differences
|
(4,763,772
)
|
(80,654
)
|
(128,708
)
|
|
Bank commissions
for loans and others
|
(58,508
)
|
(9,045
)
|
(30,497
)
|
|
|
(6,300,881
)
|
(1,200,654
)
|
(1,205,447
)
|
F-42
CENTRAL
PUERTO S.A.
8.
Movements
from financial assets at fair value through other comprehensive
income
|
|
2018
|
2017
|
2016
|
|
|
ARS
000
|
ARS
000
|
ARS
000
|
|
|
|
|
|
|
Financial
assets at fair value through other comprehensive
income
|
|
|
|
|
Gain for the
year
|
64,178
|
450,989
|
993,675
|
|
Reclassification
adjustments to income
|
(410,806
)
|
(1,219,384
)
|
(405,096
)
|
|
Loss
for financial assets at fair value through other comprehensive
income
|
(346,628
)
|
(768,395
)
|
588,579
|
9.
Income
tax
The
major components of income tax during the years ended December 31,
2018, 2017 and 2016, are the following:
Consolidated
statements of income and comprehensive income
Consolidated
statement of income
|
|
2018
|
2017
|
2016
|
|
|
ARS
000
|
ARS
000
|
ARS
000
|
|
|
|
|
|
|
Current
income tax
|
|
|
|
|
Income tax charge
for the year
|
(5,516,802
)
|
(1,892,778
)
|
(987,857
)
|
|
Adjustment related
to current income tax for the prior year
|
(5,285
)
|
48,767
|
1,729
|
|
|
|
|
|
|
Deferred
income tax
|
|
|
|
|
Related to the net
variation in temporary differences
|
(1,082,264
)
|
762,834
|
(20,289
)
|
|
Income
tax
|
(6,604,351
)
|
(1,081,177
)
|
(1,006,417
)
|
Consolidated
statement of comprehensive income
|
|
2018
|
2017
|
2016
|
|
|
ARS
000
|
ARS
000
|
ARS
000
|
|
|
|
|
|
|
Income
tax for the year related to items charged or credited directly to
equity
|
|
|
|
|
Deferred income tax
income (expense)
|
132,464
|
273,171
|
(192,722
)
|
|
Income
tax credited charged to other comprehensive income
|
132,464
|
273,171
|
(192,722
)
|
F-43
CENTRAL
PUERTO S.A.
The
reconciliation between income tax in the consolidated statement of
income and the accounting income multiplied by the statutory income
tax rate for the years ended December 31, 2018, 2017 and 2016, is
as follows:
|
|
2018
|
2017
|
2016
|
|
|
ARS
000
|
ARS
000
|
ARS
000
|
|
|
|
|
|
|
Income before
income tax from continuing operations
|
23,513,612
|
5,552,348
|
1,577,970
|
|
Income before
income tax from discontinued operations
|
328,814
|
1,181,290
|
1,270,612
|
|
Income
before income tax
|
23,842,426
|
6,733,638
|
2,848,582
|
|
|
|
|
|
|
At statutory income
tax rate of 30%
|
(7,152,727
)
|
-
|
-
|
|
At statutory income
tax rate of 35%
|
-
|
(2,356,773
)
|
(997,004
)
|
|
Share of the profit
of associates
|
(15,155
)
|
156,099
|
24,604
|
|
Adjustment related
to current income tax for the prior year
|
(5,285
)
|
48,067
|
1,729
|
|
Effect related to
statutory income tax rate change
(1)
|
183,572
|
1,367,572
|
-
|
|
Effect related to
the discount of income tax payable
|
729,679
|
84,553
|
-
|
|
Income (loss) on
net monetary position
|
(393,693
)
|
(804,111
)
|
(483,978
)
|
|
Others
|
(3,379
)
|
33,400
|
(15,391
)
|
|
|
(6,656,988
)
|
(1,471,193
)
|
(1,470,040
)
|
|
Income tax
attributable to continuing operations
|
(6,604,351
)
|
(1,081,177
)
|
(1,006,417
)
|
|
Income tax
attributable to discontinued operations
|
(52,637
)
|
(390,016
)
|
(463,623
)
|
|
|
(6,656,988
)
|
(1,471,193
)
|
(1,470,040
)
|
(1)
Effect of applying
the changes in the enacted tax rate established by Law 27,430 as
described in Note 23.a) to the deferred assets and liabilities,
according to its expected term of realization and settlement,
respectively.
Deferred
income tax
Deferred income tax
relates to the following:
|
|
Consolidated
statement of financial position
|
Consolidated
statement of income from continuing operations and statement of
other comprehensive income
|
|||
|
|
12-31-2018
|
12-31-2017
|
2018
|
2017
|
2016
|
|
|
ARS
000
|
ARS
000
|
ARS
000
|
ARS
000
|
ARS
000
|
|
|
|
|
|
|
|
|
Provisions and
others
|
68,468
|
66,184
|
2,284
|
9,194
|
38,847
|
|
Provision for plant
dismantling
|
-
|
58,039
|
(58,039
)
|
(22,702
)
|
(34,944
)
|
|
Trade
receivables
|
647
|
(9,164
)
|
9,812
|
(438
)
|
(1,758
)
|
|
Other financial
assets
|
(146,022
)
|
(54,963
)
|
(91,059
)
|
295,296
|
300,732
|
|
Employee benefit
liability
|
43,461
|
47,579
|
(4,118
)
|
(10,270
)
|
7,858
|
|
Receivables and
other non-financial liabilities
|
-
|
9,164
|
-
|
1,509
|
(644,397
)
|
|
Investments in
associates
|
(417,578
)
|
(294,665
)
|
(122,913
)
|
(207,993
)
|
(86,672
)
|
|
Property, plant and
equipment - Material & spare parts
|
(3,053,013
)
|
(2,615,851
)
|
(449,722
)
|
(65,528
)
|
200,600
|
|
Intangible
assets
|
(401,970
)
|
(472,714
)
|
70,744
|
445,342
|
(102,531
)
|
|
Deferred
income
|
(1,821,242
)
|
(628,207
)
|
(1,193,035
)
|
591,595
|
78,483
|
|
Tax loss
carry-forward
|
933,865
|
47,565
|
886,246
|
-
|
30,771
|
|
Deferred
income tax (expense) income
|
|
|
(949,800
)
|
1,036,005
|
(213,011
)
|
|
Deferred
income tax liabilities, net
|
(4,793,384
)
|
(3,847,033
)
|
|
|
|
F-44
CENTRAL
PUERTO S.A.
As of
December 31, 2018, the Group holds tax loss carry-forward in its
subsidiaries for 3,822,923 that can be utilized against future
taxable profit from such entities as described below:
|
|
Expiration
year
|
|
|
|
|
2022
|
2023
|
Total
|
|
|
ARS000
|
ARS000
|
ARS000
|
|
CP
Achiras
|
39,092
|
1,092,909
|
1,132,001
|
|
CP La
Castellana
|
89,727
|
2,389,449
|
2,479,176
|
|
Vientos La Genoveva
II S.A.U.
|
-
|
199,553
|
199,553
|
|
Vientos La Genoveva
I S.A.U.
|
-
|
6,935
|
6,935
|
|
CPR Energy
Solutions S.A.U.
|
-
|
5,258
|
5,258
|
|
|
128,819
|
3,694,104
|
3,822,923
|
Deferred
income tax liability, net, disclosed in the consolidated statement
of financial position
|
|
Consolidated
statement of financial position
|
|
|
|
2018
|
2017
|
|
|
ARS
000
|
ARS
000
|
|
Deferred
income tax assets
|
|
|
|
|
|
|
|
Continuing
operations
|
1,046,387
|
228,531
|
|
Discontinued
operations
|
-
|
60,568
|
|
|
|
|
|
Deferred
income tax liabilities
|
|
|
|
|
|
|
|
Continuing
operations
|
(5,839,771
)
|
(4,075,564
)
|
|
Discontinued
operations
|
-
|
(212,607
)
|
|
|
(4,793,384
)
|
(3,999,072
)
|
Reconciliation
of deferred income tax liabilities net
|
|
Consolidated
statement of financial position
|
|
|
|
2018
|
2017
|
|
|
ARS
000
|
ARS
000
|
|
|
|
|
|
Amount
at beginning of year
|
(3,847,033
)
|
(4,869,114
)
|
|
Deferred income tax
recognized in profit or loss and in other comprehensive income
during the year - continuing operations
|
(949,800
)
|
1,036,005
|
|
Discontinued
operations
|
-
|
(13,924
)
|
|
Reclassification
related to current income tax for the prior year
|
3,449
|
-
|
|
Amount
at end of year
|
(4,793,384
)
|
(3,847,033
)
|
10.
Earnings
per share
Earnings per share
amounts are calculated by dividing net income for the year
attributable to equity holders of the parent by the weighted
average number of ordinary shares during the year, net number of
treasury shares.
There
are no transactions or items generating an effect of
dilution.
F-45
CENTRAL
PUERTO S.A.
The
following reflects information on income and the number of shares
used in the earnings per share computations:
|
|
2018
|
2017
|
2016
|
|
|
ARS
000
|
ARS
000
|
ARS
000
|
|
|
|
|
|
|
Income
attributable to equity holders of the parent
|
|
|
|
|
Continuing
operations
|
17,243,421
|
4,500,081
|
571,566
|
|
Discontinued
operations
|
276,177
|
791,274
|
806,989
|
|
|
17,519,598
|
5,291,355
|
1,378,555
|
|
|
|
|
|
|
Weighted average
number of ordinary shares
|
1,505,170,408
|
1,505,170,408
|
1,505,170,408
|
There
have been no transactions involving ordinary shares or potential
ordinary shares between the reporting date and the date of issuance
of these consolidated financial statements that may produce a
dilution effect.
To
calculate the earnings per share for discontinued operations (Note
21), the weighted average number of shares for both the basic and
diluted earnings per share is as per the table above. The following
provides the income amount used:
|
|
2018
|
2017
|
2016
|
|
|
ARS
000
|
ARS
000
|
ARS
000
|
|
|
|
|
|
|
Income attributable
to equity holders of the parent from discontinued
operations
|
276,177
|
791,274
|
806,989
|
11.
Inventories
|
|
2018
|
2017
|
|
|
ARS
000
|
ARS
000
|
|
|
|
|
|
Non-current:
|
|
|
|
Materials and spare
parts
|
166,763
|
151,182
|
|
Provision for
impairment in value
|
(92,076
)
|
(79,995
)
|
|
|
74,687
|
71,187
|
|
Current:
|
|
|
|
Materials and spare
parts
|
211,645
|
180,947
|
|
Fuel
oil
|
7,461
|
11,016
|
|
Diesel
oil
|
1,790
|
2,677
|
|
|
220,896
|
194,640
|
F-46
CENTRAL
PUERTO S.A.
12.
Property,
plant and equipment
|
|
Lands and
buildings
|
Electric power
facilities
|
Wind
turbines
|
Gas turbines
(1)
|
Construction in
progress (2)
|
Other
|
Total
|
|
Cost
|
ARS
000
|
ARS
000
|
ARS
000
|
ARS
000
|
ARS
000
|
ARS
000
|
ARS
000
|
|
|
|
|
|
|
|
|
|
|
01-01-2017
|
1,918,978
|
23,310,921
|
-
|
1,817,315
|
289,497
|
1,581,618
|
28,918,329
|
|
Additions
|
4,552
|
354,830
|
-
|
1,356,837
|
3,982,113
|
36,480
|
5,734,812
|
|
Transfers
|
(16,236
)
|
(2,269,931
)
|
-
|
2,513,852
(4)
|
(19,368
)(4)
|
(77,309
)
|
131,008
|
|
Disposals
|
-
|
-
|
-
|
-
|
-
|
(3,256
)
|
(3,256
)
|
|
2-31-2017
|
1,907,294
|
21,395,820
|
-
|
5,688,004
|
4,252,242
|
1,537,533
|
34,780,893
|
|
Additions
|
6,487
|
813,810
|
-
|
191,953
|
5,924,697
|
22,036
|
6,958,983
|
|
Transfers
|
827,701
|
630,401
|
3,519,848
|
(568,017
)
|
(5,006,234
)(3)
|
-
|
(596,301
)
|
|
Disposals
|
-
|
(155,202
)
|
-
|
-
|
(49,988
)
|
(9,923
)
|
(215,113
)
|
|
12-31-2018
|
2,741,482
|
22,684,829
|
3,519,848
|
5,311,940
|
5,120,717
|
1,549,646
|
40,928,462
|
|
|
Lands and
buildings
|
Electric power
facilities
|
Wind
turbines
|
Gas
turbines
|
Construction in
progress
|
Other
|
Total
|
|
Depreciation
|
ARS
000
|
ARS
000
|
ARS
000
|
ARS
000
|
ARS
000
|
ARS
000
|
ARS
000
|
|
|
|
|
|
|
|
|
|
|
01-01-2017
|
442,201
|
16,091,252
|
-
|
-
|
-
|
1,285,559
|
17,819,012
|
|
Depreciation for the
year
|
20,486
|
1,128,691
|
-
|
-
|
-
|
52,930
|
1,202,107
|
|
Transfers
|
(11,535
)
|
(1,650,337
)
|
-
|
-
|
-
|
(28,117
)
|
(1,689,989
)
|
|
Disposals
|
-
|
-
|
-
|
-
|
-
|
(1,906
)
|
(1,906
)
|
|
12-31-2017
|
451,152
|
15,569,606
|
-
|
-
|
-
|
1,308,466
|
17,329,224
|
|
|
|
|
|
|
|
|
|
|
Depreciation for the
year
|
39,640
|
975,169
|
78,001
|
-
|
-
|
49,745
|
1,142,555
|
|
Disposals
|
-
|
(102,606
)
|
-
|
-
|
-
|
(8,129
)
|
(110,735
)
|
|
12-31-2018
|
490,792
|
16,442,169
|
78,001
|
-
|
-
|
1,350,082
|
18,361,044
|
|
|
|
|
|
|
|
|
|
|
Net book
value:
|
|
|
|
|
|
|
|
|
12-31-2018
|
2,250,690
|
6,242,660
|
3,441,847
|
5,311,940
|
5,120,717
|
199,564
|
22,567,418
|
|
12-31-2017
|
1,456,142
|
5,826,214
|
-
|
5,688,004
|
4,252,242
|
229,067
|
17,451,669
|
(1)
As of December 31,
2018 and 2017, the Company held gas turbines, one of which was
transferred to construction in progress because it will be used for
new generation capacity in the project called “Terminal 6 San
Lorenzo” while the other turbines can be used for other
projects, in future bidding processes that may be called by the
Argentine government.
(2)
The Group has
capitalized borrowing costs for a total amount of 138,064 and
10,739 during the years ended December 31, 2018 and
2017.
(3)
Includes 596,301
transferred to intangible assets related to transmission lines that
were transferred to electric energy transportation companies See
Note 2.2.7.
(4)
Transferred from
Other non-financial assets.
F-47
CENTRAL
PUERTO S.A.
13.
Intangible
assets
|
|
Concession
right
|
Transmission
lines for Achiras and La Castellana wind farms
|
Other
|
Total
|
|
Cost
|
ARS
000
|
ARS
000
|
ARS
000
|
ARS
000
|
|
|
|
|
|
|
|
12-31-2017
|
7,904,747
|
-
|
712,025
|
8,616,772
|
|
Transfers
|
-
|
596,301
(1)
|
-
|
596,301
|
|
12-31-2018
|
7,904,747
|
596,301
|
712,025
|
9,213,073
|
|
|
|
|
|
|
|
Amortization
|
|
|
|
|
|
|
|
|
|
|
|
01-01-2017
|
5,514,245
|
-
|
700,887
|
6,215,132
|
|
Amortization for
the year
|
413,037
|
-
|
-
|
413,037
|
|
12-31-2017
|
5,927,282
|
-
|
700,887
|
6,628,169
|
|
Amortization for
the year
|
329,578
|
20,096
|
-
|
349,674
|
|
12-31-2018
|
6,256,860
|
20,096
|
700,887
|
6,977,843
|
|
|
|
|
|
|
|
Net
book value
|
|
|
|
|
|
|
|
|
|
|
|
12-31-2018
|
1,647,887
|
576,205
|
11,138
|
2,235,230
|
|
12-31-2017
|
1,977,465
|
-
|
11,138
|
1,988,603
|
(1)
Transferred from property, plant and equipment. See Note
2.2.7.
Concession
right of Piedra del Águila hydroelectric power
plant
Includes the
amounts paid as consideration for rights relating to the concession
of Piedra del Águila hydroelectric power plant awarded by the
Argentine government for a 30-year term, until December 29, 2023.
The Group amortizes such intangible asset based on straight-line
basis over the remaining life of the concession
agreement.
For a
concession arrangement to fall within the scope of IFRIC 12, usage
of the infrastructure must be controlled by the concession grantor.
This requirement is met when the following two conditions are
met:
-
the grantor
controls or regulates what services the operator must provide with
the infrastructure, to whom it must provide them, and at what
price; and
-
the grantor
controls the infrastructure, i.e., retains the right to take back
the infrastructure at the end of the concession.
Upon
Resolution 95 passed by Argentine government our concession right
of Piedra del Águila hydroelectric power plant met both
conditions above.
The
main features of the concession contract are as
follows:
Control and regulation of prices by concession
grantor:
Pricing schedule approved by grantor;
Remuneration paid by:
CAMMESA;
Grant or guarantee from concession
grantor:
None;
Residual value:
Infrastructure returned
to grantor for no consideration at end of concession;
Concession end date:
December 29,
2023;
F-48
CENTRAL
PUERTO S.A.
IFRIC 12 accounting model:
Intangible
asset.
Fees and royalties:
the
Intergovernmental Basin Authority is entitled to a fee of 2.5% of
the plant’s revenues, and the provinces of Rio Negro and
Neuquén are entitled to royalties of 12% of such revenues. For
the years ended December 31, 2018, 2017 and 2016, the fees and
royalties amounted 214,333, 203,007 and 101,318,
respectively
and they were shown in operating expenses in the consolidated
statement of income.
Contractual capital
investment obligations and obligations relating to maintenance
expenditure on infrastructure under concession are not
significant.
Transmission
lines of wind farms Achiras and La Castellana
As
mentioned in Note 2.2.7, the Group finished the construction of
wind farms La Castellana and Achiras, whereby it was agreed to
construct high and medium tension lines and the electrical
substation to connect the wind farms to SADI, a part of which were
given to the companies transporting the energy in accordance with
the respective contracts; therefore, such companies are in charge
of the maintenance of such transferred installations. Consequently,
the Group recognized intangible assets for an amount of 596,301,
which were transferred from property, plant and equipment to
intangible assets.
14.
Financial
assets and liabilities
14.1.
Trade
and other receivables
|
|
12-31-2018
|
12-31-2017
|
|
|
ARS
000
|
ARS
000
|
|
Non-current:
|
|
|
|
Trade receivables -
CAMMESA
|
16,671,565
|
3,826,847
|
|
Guarantee
deposits
|
43
|
63
|
|
Receivables from
associates
|
-
|
15,144
|
|
|
16,671,608
|
3,842,054
|
|
|
|
|
|
Current:
|
|
|
|
Trade receivables -
CAMMESA
|
10,304,925
|
5,353,427
|
|
Trade receivables -
YPF SA and YPF Energía Eléctrica SA
|
75,857
|
201,826
|
|
Recovery of
insurance
|
-
|
31,437
|
|
Trade receivables -
Large users
|
87,997
|
61,146
|
|
Receivables from
associates and other related parties
|
861
|
10,729
|
|
Other
receivables
|
113,091
|
77,962
|
|
|
10,582,731
|
5,736,527
|
|
Allowance for
doubtful accounts - Note 14.1.1.
|
(3,703
)
|
(2,585
)
|
|
|
10,579,028
|
5,733,942
|
For the
terms and conditions of receivables from related parties, refer to
Note 19.
Trade
receivables from CAMMESA accrue interest, once they become due. The
Group accrues interest on receivables from CAMMESA according to the
nature of the receivables, as follows:
FONINVEMEN I and II:
The Company accrues
interests according to the explicit rate agreed in the
corresponding agreements for the passage of time.
CVO receivables:
The Company accrues
interests since the Commercial Approval date and according to the
rate agreed in the CVO agreement, as described in Note
1.a).
LVFVD (Sales Liquidations with Maturity Dates
to be Defined):
The Company recognizes interest on the
LVFVDs when CAMMESA determines the amount of interest and notifies
the Company through a billing document.
F-49
CENTRAL
PUERTO S.A.
Trade
receivables related to YPF and large users accrue interest as
stipulated in each individual agreement. The average collection
term is generally from 30 to 90 days.
FONINVEMEM I and II:
The receivables
under FONINVEMEM I and II Agreements are included under
“Trade receivables - CAMMESA”. Such receivables are
being collected in 120 equal, consecutive monthly installments
beginning in February and January 2010, when Thermal Jose de San
Martin and Thermal Manuel Belgrano plants, commenced operations,
respectively. Since those dates, CAMMESA has made all payments of
principal and interest in accordance with the above-mentioned
contractual agreements.
During
the years ended December 31, 2018, 2017 and 2016 collections of
these receivables amounted to 654,070, 573,107 and 607,885,
respectively.
The
FONINVEMEM I and II receivables are denominated in US dollars and
accrue interest at LIBOR plus 1% and 2%, respectively.
As of
December 31, 2018 and 2017 the FONINVEMEN I and II receivables
amounted 758,455 and 1,205,752, respectively, which corresponds to
USD 20 million and USD 44 million, respectively.
CVO
receivables
Receivables under
CVO agreement are disclosed under “Trade receivables -
CAMMESA”.
As
described in Note 1.a), in 2010 the Company approved the “CVO
agreement” and as from March 20, 2018, CAMMESA granted the
“Commercial Approval”.
As a
consequence of the Commercial Approval and in accordance with the
CVO agreement, the Company shall collect the CVO receivables
converted in US dollars in 120 equal and consecutive installments.
The onetime estimated income (before income tax) in relation to the
interest and the effect of the adjustment of the CVO receivables to
US dollars as of March 20, 2018 reaches approximately
ARS 11,017 million and such amount was recognized in the
consolidated income statement for the year ended December 31, 2018
under “CVO receivables update”. The exchange difference
and interests accrued since the Commercial Approval until December
31, 2018 amounted to approximately ARS 10,120 million and
ARS 1,110 million, respectively, and they are disclosed under
“Other operating income” in the consolidated income
statement for the year ended December 31, 2018.
CVO
Credits are nominated in USD and they accrue LIBOR interest at a 5%
rate.
After
recognizing the update described in the previous paragraph, as at
December 31, 2018, CVO Credits amount to 20,235,400, approximately
USD 535 million.
The
information on the Group’s objectives and credit risk
management policies is included in Note 20.
The
breakdown by due date of trade and other receivables due as of the
related dates is as follows:
|
|
|
|
Past
due
|
||||
|
|
Total
|
To
due
|
<90
days
|
90-180
days
|
180-270
days
|
270-360
days
|
>360
days
|
|
|
ARS
000
|
ARS
000
|
ARS
000
|
ARS
000
|
ARS
000
|
ARS
000
|
ARS
000
|
|
|
|
|
|
|
|
|
|
|
12-31-2018
|
27,250,636
|
25,703,650
|
507,938
|
527,390
|
506,988
|
101
|
4,569
|
|
12-31-2017
|
9,575,996
|
9,516,318
|
51,742
|
-
|
2,771
|
-
|
5,165
|
F-50
CENTRAL
PUERTO S.A.
14.1.1.
Allowance for doubtful accounts
|
|
12-31-2018
|
12-31-2017
|
|||
|
Item
|
At
beginning
|
Increases
|
Decreases
|
At
end
|
At
end
|
|
|
|
|
|
|
|
|
Allowance for doubtful accounts -
Trade and other receivables
|
2,585
|
2,204
|
(1,086
)(1)
|
3,703
|
2,585
|
|
Total
12-31-2018
|
2,585
|
2,204
|
(1,086
)
|
3,703
|
|
|
Total
12-31-2017
|
3,226
|
-
|
(641
)(1)
|
|
2,585
|
(1)
Income (loss) on net monetary position.
14.2.
Trade
and other payables
|
|
12-31-2018
|
12-31-2017
|
|
|
ARS
000
|
ARS
000
|
|
Current:
|
|
|
|
Trade
payables
|
1,702,295
|
1,485,474
|
|
Insurance
payable
|
3,031
|
2,858
|
|
Payables to
associates
|
24,583
|
13,553
|
|
|
1,729,909
|
1,501,885
|
Trade
payables are non-interest bearing and are normally settled on
60-day terms.
The
information on the Group’s objectives and financial risk
management policies is included in Note 20.
For the
terms and conditions of payables to related parties, refer to Note
19.
14.3.
Other
loans and borrowings
|
|
12-31-2018
|
12-31-2017
|
|
|
ARS
000
|
ARS
000
|
|
Non-current
|
|
|
|
|
|
|
|
IFC and IIC
loan
|
5,186,970
|
-
|
|
Derivative
financial liabilities not designated as hedging instrument -
Interest rate swap
|
17,060
|
-
|
|
Borrowings from
Banco de Galicia y Buenos Aires S.A.
|
-
|
2,183,278
|
|
|
5,204,030
|
2,183,278
|
|
|
12-31-2018
|
12-31-2017
|
|
|
ARS
000
|
ARS
000
|
|
Current
|
|
|
|
|
|
|
|
IFC and IIC
loan
|
448,689
|
-
|
|
Borrowings from
Banco de Galicia y Buenos Aires S.A.
|
215,584
|
746,158
|
|
Bank
overdrafts
|
8,395
|
345
|
|
|
672,668
|
746,503
|
F-51
CENTRAL
PUERTO S.A.
14.3.1.
Loans from the IIC-IFC Facility
On October 20, 2017
and January 17, 2018, CP La Castellana S.A.U. and CP Achiras S.A.U.
(both of which are subsidiaries of CPR), respectively, agreed on
the structuring of a series of loan agreements in favor of CP La
Castellana S.A.U. and CP Achiras S.A.U., for a total amount of USD
100,050,000 and USD 50,700,000,
respectively, with:
(i) International Finance Corporation (IFC) on its own behalf, as
Eligible Hedge Provider and as an implementation entity of the
Intercreditor Agreement Managed Program; (ii) Inter-American
Investment Corporation (“IIC”), as lender on its
behalf, acting as agent for the Inter-American Development Bank
(“IDB”) and on behalf of IDB as administrator of the
Canadian Climate Fund for the Private Sector in the Americas
(“C2F”, and together with IIC and IDB, “Group
IDB”, and together with IFC, “Senior
Creditors”).
As of
the date of these financial statements, the loans disbursements
have been fully received by the Group.
In
accordance with the terms of the agreement subscribed by CP La
Castellana, USD 5 million accrue an interest rate equal to LIBOR
plus 3.5%, and the rest at LIBOR plus 5.25% and the loan is
amortizable quarterly in 52 equal and consecutive installments as
from February 15, 2019.
In
accordance with the terms of the agreement subscribed by CP
Achiras, USD 40.7 million accrue an interest rate equal to LIBOR
plus 5.25%, and the rest at LIBOR plus 4% and the loan is
amortizable quarterly in 52 equal and consecutive installments as
from May 15, 2019.
Other
related agreements and documents, such as the Guarantee and Sponsor
Support Agreement (the “Guarantee Agreement” by which
CPSA completely, unconditionally and irrevocably guarantees, as the
main debtor, all payment obligations undertaken by CP La Castellana
and CP Achiras until the projects reach the commercial operations
date) hedging agreements, guarantee trusts, a mortgage, guarantee
agreements on shares, guarantee agreements on wind turbines, direct
agreements and promissory notes have been signed.
Pursuant to the
Guarantee and Sponsor Support Agreement, among other customary
covenants for this type of facilities, we committed, until each
project completion date, to maintain (i) a leverage ratio of (a)
until (and including) December 31, 2018, not more than 4.00:1.00;
and (b) thereafter, not more than 3.5:1.00; and (ii) an interest
coverage ratio of not less than 2.00:1.00. In addition, our
subsidiary, CPR, and we, upon certain conditions, agreed to make
certain equity contributions to CP La Castellana and CP
Achiras.
As of
December 31, 2018, the Group has met the requirements described in
(i) and (ii) above.
We also
agreed to maintain, unless otherwise consented to in writing by
each senior lender, ownership and control of the CP La Castellana
and CP Achiras as follows: (i) until each project completion date,
(a) we shall maintain (x) directly or indirectly, at least seventy
percent (70%) beneficial ownership of CP La Castellana and CP
Achiras; and (y) control of the CP La Castellana and CP Achiras;
and (b) CP Renovables shall maintain (x) directly, ninety-five
percent (95%) beneficial ownership of CP La Castellana and CP
Achiras; and (y) control of CP La Castellana and CP Achiras. In
addition, (ii) after each project completion date, (a) we shall
maintain (x) directly or indirectly, at least fifty and one tenth
percent (50.1%) beneficial ownership of each of CP La Castellana,
CP Achiras and CP Renovables; and (y) control of each of CP La
Castellana, CP Achiras and CP Renovables; and (b) CP Renovables
shall maintain control of CP La Castellana and CP Achiras. As of
December 31, 2018, the Group has met such obligations.
Under
the subscribed trust guarantee agreement, as at December 31, 2018,
there are trade receivables with specific assignment for the amount
of 404,424.
14.3.2.
Loans
from Banco de Galicia y Buenos Aires S.A. to CP La Castellana and
CP Achiras S.A.U.
On
October 26, 2017 and October 30, 2017, CP La Castellana and CP
Achiras S.A.U. (“CP Achiras”) entered into loans with
Banco de Galicia y Buenos Aires S.A. in the amount of 330,000 and
175,000, respectively (the “Castellana and Achiras
Loans”). The Castellana and Achiras Loans accrue interest at
an interest rate equal to BADLAR private banks plus a 3.10% margin
and shall mature on the dates that are two years from the execution
and disbursement. The proceeds from these loans were used to
finance the Achiras Project and the La Castellana Project. We have
fully, unconditionally and irrevocably guaranteed, as primary
obligor, all payment obligations assumed and/or to be assumed by CP
La Castellana and CP Achiras under these loans and any other
ancillary document related to them.
During
2018 CP La Castellana and CP Achiras have partially prepaid the
outstanding principal of these loans in the amount of 248,196 and
120,026, respectively.
F-52
CENTRAL
PUERTO S.A.
Loans
for wind turbines acquisition
In
November and December 2017, CP La Castellana and CP Achiras entered
into short-term bridge loans from Banco Galicia y Buenos Aires S.A.
for a total amount of USD 50.5 million and USD 27 million,
respectively, for the acquisition of wind turbines. These loans
accrued interest at a 3.6% annual rate.
As of
December 31, 2017, CP La Castellana had entered into the loan
described in Note 14.3.1, which in their Framework Agreement
established the long-term refinancing of the loans taken by this
Company from Banco Galicia y Buenos Aires S.A for the acquisition
of wind turbines. As a consequence, as at December 31, 2017, the
aforementioned loans were classified as non-current liabilities as
the Group had the possibility to refinance them in a period longer
than one-year as from such date.
In
addition, on January 15, 2018, CP Achiras entered into a short-term
loan from Banco Galicia y Buenos Aires S.A. for a total amount of
USD 7.0 million for the acquisition of wind turbines. This loan
accrued interest at a 3.1% annual rate.
On
January 9, 2018 and April 9 and 10, 2018, CP La Castellana and CP
Achiras, respectively, completely cancelled the loans obtained with
the funds received from the loans described in the Note
14.3.1.
14.3.3.
Borrowing
from Kreditanstalt für Wiederaufbau
(“KfW”)
On
March 26, 2019 the Company entered into a loan agreement with KfW
for an amount of USD 56 million in relation to the acquisition of
two gas turbines (with a power of 89 MW), equipment and related
services relating to the Luján de Cuyo project described in
Note 22.7.
In
accordance with the terms of the agreement, the loan accrues an
interest equal to LIBOR plus 1.15% and it is amortizable quarterly
in 47 equal and consecutive installments as from the day falling
six months after the commissioning of the gas turbines and
equipment.
14.3.4.
Others
On
December 31, 2016, the Company prepaid in cash all of its
outstanding 9% Corporate bonds - Class I 2007 for USD 51.6 million
at a redemption value equivalent to the nominal value of
outstanding securities plus accrued and unpaid interest. The
original due date of such corporate bonds was in July
2017.
On May
31 and June 30, 2016, the Company entered into two financial loans
with Banco de Galicia y Buenos Aires S.A. for USD 50.3 million and
USD 11 million, respectively. The loans accrued interest at a
nominal annual interest rate of 4.3% and should be repaid one year
from the date of disbursement. Consequently, both loans were paid
in full in 2017.
14.3.5.
Medium
Term Note Program
The
Regular General Shareholders’ Meeting held on November 20,
2014, approved a Medium Term Note Program for a maximum amount
outstanding at any time of up to USD 1,000,000,000 (or its
equivalent in other currencies) to be issued in short, medium,
long-term negotiable obligations convertible into shares, in the
terms of the Law No. 23.576 (negotiable obligations law)
(“The program”). In addition, the Board of Directors
was empowered to determine and establish the conditions of the
Program and of the notes to be issued under such Program which were
not expressly determined by the Shareholders’ Meeting. The
CNV authorized the Program on September 9, 2015.
The
information on the Group’s objectives and financial risk
management policies is included in Note 20.
14.4.
Borrowings
from CAMMESA
|
|
12-31-2018
|
12-31-2017
|
|
|
ARS
000
|
ARS
000
|
|
Non-current:
|
|
|
|
CAMMESA
loans
|
1,004,304
|
1,558,485
|
|
Current:
|
|
|
|
CAMMESA
loans
|
742,575
|
1,403,269
|
|
CAMMESA
prepayments
|
1,070,335
|
1,185,014
|
|
|
1,812,910
|
2,588,283
|
F-53
CENTRAL
PUERTO S.A.
On
October 23, 2002, former Secretariat of Energy issued Resolution
No. 146/2002 (“Resolution 146”), which specifies a
funding mechanism for the generators based upon the performance of
major maintenance to their existing facilities.
Under
Resolution 146, the Group entered into several loan agreements with
CAMMESA.
Such
loans accrue interest at a rate equivalent to the one received by
CAMMESA on its own cash investments and shall be repaid in 48
monthly installments beginning on the completion date of the
relevant major maintenance. The Group has the option to repay the
loans, through cash or net settlement of receivables from CAMMESA
related with remuneration for non-recurring maintenance created by
Resolution 529, Article 2.
The
table below summarizes the maturity of the Group’s borrowings
from CAMMESA:
|
|
To
due
|
|||
|
Total
|
2019
|
2020
|
2021
|
2022
|
|
ARS
000
|
ARS
000
|
ARS
000
|
ARS
000
|
ARS
000
|
|
|
|
|
|
|
|
2,817,214
|
1,812,910
|
405,904
|
303,544
|
294,856
|
During
the years ended December 31, 2017 and 2016, the Group received
loans from CAMMESA amounting to 693,257 and 1,536,543,
respectively.
During
the year ended December 31, 2015, the Group received prepayments
from CAMMESA amounting to 1,185,014 for purchasing a gas turbine
with capacity of 373MW. The mentioned acquisition was previously
approved by CAMMESA. These prepayments accrue interest at an
equivalent rate to the one received by CAMMESA on its own cash
investments and the repayment schedule has not yet been established
as of the date of these consolidated financial
statements.
The
information on the Group’s objectives and financial risk
management policies is included in Note 20.
14.5.
Changes
in liabilities arising from financing activities
|
|
01-01-2018
|
Payments
|
Non-cash
transactions
|
Disbursements
|
Other
|
12-31-2018
|
|
|
ARS
000
|
ARS
000
|
ARS
000
|
ARS
000
|
ARS
000
|
ARS
000
|
|
|
|
|
|
|
|
|
|
Non-current
liabilities
|
|
|
|
|
|
|
|
Other loans and
borrowings
|
2,183,278
|
(965,441
)
|
(1,549,281
)
|
3,939,500
|
1,595,974
|
5,204,030
|
|
Borrowings from
CAMMESA
|
1,558,485
|
-
|
(502,927
)
|
-
|
(51,254
)
|
1,004,304
|
|
|
|
|
|
|
|
|
|
Current
liabilities
|
|
|
|
|
|
|
|
Other loans and
borrowings
|
746,503
|
(1,129,668
)
|
(568,593
)
|
435,478
|
1,188,948
|
672,668
|
|
Borrowings from
CAMMESA
|
2,588,283
|
-
|
(1,292,223
)
|
-
|
516,850
|
1,812,910
|
|
|
01-01-2017
|
Payments
|
Non-cash
transactions
|
Disbursements
|
Other
|
12-31-2017
|
|
|
ARS
000
|
ARS
000
|
ARS
000
|
ARS
000
|
ARS
000
|
ARS
000
|
|
|
|
|
|
|
|
|
|
Non-current
liabilities
|
|
|
|
|
|
|
|
Other loans and
borrowings
|
-
|
-
|
(62,440
)
|
2,122,845
|
122,873
|
2,183,278
|
|
Borrowings from
CAMMESA
|
2,367,279
|
-
|
(898,276
)
|
1,023,563
|
(934,081
)
|
1,558,485
|
|
|
|
|
|
|
|
|
|
Current
liabilities
|
|
|
|
|
|
|
|
Other loans and
borrowings
|
2,382,748
|
(2,319,705
)
|
(161,466
)
|
717,989
|
126,937
|
746,503
|
|
Borrowings from
CAMMESA
|
1,930,482
|
-
|
(1,154,596
)
|
-
|
1,812,397
|
2,588,283
|
F-54
CENTRAL
PUERTO S.A.
The
“Non-cash transactions” column includes: i) the effect
to cancel borrowings from CAMMESA under Resolution 146 with trade
receivables from CAMMESA related with remuneration from
non-recurring maintenance and ii) the income (loss) for exposure to
change in purchasing power of currency (Income (loss) on net
monetary position), which amounted to 2,861,799 and 1,444,422 as of
December 31, 2018 and 2017, respectively. The “Other”
column includes the effect of reclassification of non-current
portion to current due to the passage of time, the foreign exchange
movement and the effect of accrued but not yet paid interest. The
Group classifies interest paid as cash flows from financing
activities.
14.6.
Quantitative
and qualitative information on fair values
Information
on the fair value of financial assets and liabilities by
category
The
following tables is a comparison by category of the carrying
amounts and the relevant fair values of financial assets and
liabilities.
|
|
Carrying
amount
|
Fair
value
|
||
|
|
12-31-2018
|
12-31-2017
|
12-31-2018
|
12-31-2017
|
|
|
ARS
000
|
ARS
000
|
ARS
000
|
ARS
000
|
|
Financial
assets
|
|
|
|
|
|
Trade and other
receivables
|
27,250,636
|
9,575,996
|
27,250,636
|
9,575,996
|
|
Other financial
assets
|
1,964,630
|
1,639,941
|
1,964,630
|
1,639,941
|
|
Cash and cash
equivalents
|
229,948
|
130,863
|
229,948
|
130,863
|
|
Total
|
29,445,214
|
11,346,800
|
29,445,214
|
11,346,800
|
|
|
Carrying
amount
|
Fair
value
|
||
|
|
12-31-2018
|
12-31-2017
|
12-31-2018
|
12-31-2017
|
|
|
ARS
000
|
ARS
000
|
ARS
000
|
ARS
000
|
|
Financial
liabilities
|
|
|
|
|
|
Borrowings from
CAMMESA
|
2,817,214
|
4,146,768
|
2,817,214
|
4,146,768
|
|
Other loans and
borrowings
|
5,876,698
|
2,929,781
|
5,876,698
|
2,929,781
|
|
Total
|
8,693,912
|
7,076,549
|
8,693,912
|
7,076,549
|
Valuation
techniques
The
fair value reported in connection with the abovementioned financial
assets and liabilities is the amount at which the instrument could
be exchanged in a current transaction between willing parties,
other than in a forced or liquidation sale. The following methods
and assumptions were used to estimate the fair values:
Management assessed
that the fair values of current trade receivables and current loans
and borrowings approximate their carrying amounts largely due to
the short-term maturities of these instruments.
The
Group measures long-terms receivables at fixed and variable rates
based on discounted cash flows. The valuation requires that the
Group adopt certain assumptions such as interest rates, specific
risk factors of each transaction and the creditworthiness of the
customer.
Fair
value of quoted debt securities, mutual funds and corporate bonds
is based on price quotations at the end of each reporting
period.
The
fair value of the foreign currency forward contracts is calculated
based on appropriate valuation techniques that use market
observable data.
F-55
CENTRAL
PUERTO S.A.
Fair
value hierarchy
The
following tables provides, by level within the fair value
measurement hierarchy, as described in Note 2.2.2, the
Company’s financial assets, that were measured at fair value
on recurring basis as of December 31, 2018 and 2017:
|
|
Fair value
measurement using:
|
|||
|
12-31-2018
|
Total
|
Level
1
|
Level
2
|
Level
3
|
|
|
ARS
000
|
ARS
000
|
ARS
000
|
ARS
000
|
|
Assets
measured at fair value
|
|
|
|
|
|
|
|
|
|
|
|
Financial assets at
fair value through profit or loss:
|
|
|
|
|
|
Mutual
funds
|
1,964,630
|
1,964,630
|
-
|
-
|
|
Total
financial assets measured at fair value
|
1,964,630
|
1,964,630
|
-
|
-
|
|
|
Fair value
measurement using:
|
|||
|
12-31-2017
|
Total
|
Level
1
|
Level
2
|
Level
3
|
|
|
ARS
000
|
ARS
000
|
ARS
000
|
ARS
000
|
|
Assets
measured at fair value
|
|
|
|
|
|
|
|
|
|
|
|
Financial assets at
fair value through profit or loss:
|
|
|
|
|
|
Mutual
funds
|
821,113
|
821,113
|
-
|
-
|
|
Argentine Central
Bank bills
|
597,330
|
597,330
|
-
|
-
|
|
|
|
|
|
|
|
Financial assets at
fair value through other comprehensive income:
|
|
|
|
|
|
Mutual
funds
|
221,498
|
221,498
|
-
|
-
|
|
Total
financial assets measured at fair value
|
1,639,941
|
1,639,941
|
-
|
-
|
There were no
transfers between Levels.
14.7.
Derivative
financial instruments
The
gain on foreign currency forward contracts for the year ended
December 31, 2016 amounts to 348,690 and is disclosed net in
financial expenses as net foreign exchange differences. Moreover,
the amount of 818,250 have been received as cash settlement of
these contracts during the year ended December 31,
2016.
The
information on the Group’s objectives and financial risk
management policies is included in Note 20.
14.8.
Other financial assets
|
|
12-31-2018
|
12-31-2017
|
|
|
Book
value
|
Book
value
|
|
|
ARS
000
|
ARS
000
|
|
Financial
assets at fair value through other comprehensive
income
|
|
|
|
|
|
|
|
Mutual
funds
|
-
|
221,498
|
|
|
-
|
221,498
|
|
Financial
assets at fair value through profit or loss
|
|
|
|
|
|
|
|
Argentina Central
Bank bills
|
-
|
597,330
|
|
Mutual
funds
|
1,964,630
|
821,113
|
|
|
1,964,630
|
1,418,443
|
|
|
1,964,630
|
1,639,941
|
The
information on the objectives and financial risk management
policies is included in Note 20.
F-56
CENTRAL
PUERTO S.A.
14.9.
Financial assets and liabilities in foreign currency
|
|
12-31-2018
|
12-31-2017
|
|||||
|
Account
|
Currency and
amount (in thousands)
|
Effective
exchange rate (1)
|
Bookvalue
|
Currency and
amount (in thousands)
|
Bookvalue
|
||
|
|
|
|
|
ARS
000
|
|
|
ARS
000
|
|
NON-CURRENT
ASSETS
|
|
|
|
|
|
|
|
|
|
|
|
|
|
|
|
|
|
Trade and other
receivables
|
USD
|
421,112
|
37.8080
(2)
|
15,921,517
|
USD
|
24,648
|
675,025
|
|
|
|
|
15,921,517
|
|
|
675,025
|
|
|
CURRENT
ASSETS
|
|
|
|
|
|
|
|
|
|
|
|
|
|
|
|
|
|
Cash and cash
equivalents
|
USD
|
4,720
|
37.5000
|
177,000
|
USD
|
4,313
|
118,119
|
|
|
EUR
|
1
|
42.8400
|
43
|
EUR
|
1
|
32
|
|
|
|
|
|
|
|
|
|
|
Trade and other
receivables
|
USD
|
138,051
|
37.8080
|
5,219,427
|
USD
|
9,609
|
263,159
|
|
|
USD
|
3,381
|
37.5000
(2)
|
126,788
|
USD
|
19,932
|
545,871
|
|
|
|
|
5,523,258
|
|
|
927,181
|
|
|
|
|
|
21,444,775
|
|
|
1,602,206
|
|
|
NON-CURRENT
LIABILITIES
|
|
|
|
|
|
|
|
|
|
|
|
|
|
|
|
|
|
Other loans and
borrowings
|
USD
|
140,581
|
37.7000
|
5,299,904
|
USD
|
50,690
|
1,395,720
|
|
|
|
|
5,299,904
|
|
|
1,395,720
|
|
|
CURRENT
LIABILITIES
|
|
|
|
|
|
|
|
|
|
|
|
|
|
|
|
|
|
Other loans and
borrowings
|
USD
|
12,124
|
37.7000
|
457,075
|
USD
|
27,099
|
746,155
|
|
Trade and other
payables
|
USD
|
14,686
|
37.7000
|
553,662
|
USD
|
31,243
|
860,258
|
|
|
EUR
|
465
|
43.1627
|
20,071
|
EUR
|
136
|
4,508
|
|
|
|
|
1,030,808
|
|
|
1,610,921
|
|
|
|
|
|
6,330,712
|
|
|
3,006,641
|
|
USD: US
dollar.
EUR:
Euro.
(1)
At the exchange
rate prevailing as of December 31, 2018 as per Banco de la
Nación Argentina.
(2)
At the exchange
rate according to Communication “A” 3500 (wholesale)
prevailing as of December 31, 2018 as per the Argentine Central
Bank.
15.
Non-financial assets and liabilities
15.1.
Other non-financial assets
|
|
12-31-2018
|
12-31-2017
|
|
|
ARS
000
|
ARS
000
|
|
|
|
|
|
Non-current:
|
|
|
|
Tax
credits
|
218,636
|
12,126
|
|
Prepayments to
vendors
|
4,319
|
6,656
|
|
|
222,955
|
18,782
|
|
|
|
|
|
Current:
|
|
|
|
Upfront payments of
inventories purchases
|
56,745
|
61,415
|
|
Prepayment
insurance
|
188,823
|
128,855
|
|
Tax
credits
|
234,609
|
495,389
|
|
Other
|
14,953
|
9,654
|
|
|
495,130
|
695,313
|
F-57
CENTRAL
PUERTO S.A.
15.2.
Other non-financial liabilities
|
|
12-31-2018
|
12-31-2017
|
|
|
ARS
000
|
ARS
000
|
|
|
|
|
|
Non-current:
|
|
|
|
VAT
payable
|
1,879,420
|
662,505
|
|
Tax on bank account
transactions payable
|
79,463
|
29,504
|
|
|
1,958,883
|
692,009
|
|
|
|
|
|
Current:
|
|
|
|
VAT
payable
|
1,324,577
|
840,110
|
|
Turnover tax
payable
|
6,380
|
9,353
|
|
Income tax
withholdings payable
|
36,028
|
38,849
|
|
Concession fees and
royalties
|
27,410
|
25,250
|
|
Tax on bank account
transactions payable
|
72,996
|
58,404
|
|
Other
|
193,553
|
2,005
|
|
|
1,660,944
|
973,971
|
15.3.
Compensation and employee benefits liabilities
|
|
12-31-2018
|
12-31-2017
|
|
|
ARS
000
|
ARS
000
|
|
|
|
|
|
Non-current:
|
|
|
|
Employee long-term
benefits
|
148,470
|
166,983
|
The
following tables summarize the components of net benefit expense
recognized in the consolidated statement of income as long-term
employee benefit plans and the changes in the long-term employee
benefit liabilities recognized in the consolidated statement of
financial position.
|
|
12-31-2018
|
12-31-2017
|
|
|
ARS
000
|
ARS
000
|
|
Benefit
plan expenses
|
|
|
|
Cost of
interest
|
22,258
|
33,883
|
|
Cost of service for
the current year
|
9,565
|
10,275
|
|
Past service
cost
|
(3,624
)
|
5,336
|
|
Expense
recognized during the year
|
28,199
|
49,494
|
|
|
|
|
|
Defined
benefit obligation at beginning of year
|
166,983
|
129,493
|
|
Cost of
interest
|
22,258
|
30,793
|
|
Cost of service for
the current year
|
9,564
|
9,358
|
|
Past service
cost
|
(3,624
)
|
4,852
|
|
Actuarial (gains)
losses
|
(20,551
)
|
25,661
|
|
Benefits
paid
|
(26,160
)
|
(25,755
)
|
|
Discontinued
operations
|
-
|
(7,419
)
|
|
Defined
benefit obligation at end of year
|
148,470
|
166,983
|
F-58
CENTRAL
PUERTO S.A.
The
main key assumptions used to determine the obligations as of
year-end are as follows:
|
Main key
assumptions used
|
2018
|
2017
|
|
|
|
|
|
Discount
rate
|
5.50
%
|
5.50
%
|
|
|
|
|
|
Increase in the
real annual salary
|
2.00
%
|
2.00
%
|
|
|
|
|
|
Turn over of
participants
|
0.73
%
|
0.73
%
|
A one
percentage point change in the discount rate applied would have the
following effect:
|
|
Increase
|
Decrease
|
|
|
ARS
000
|
ARS
000
|
|
|
|
|
|
Effect on the
benefit obligation as of the 2018 year-end
|
(10,563
)
|
13,193
|
|
Effect on the
benefit obligation as of the 2017 year-end
|
(13,016
)
|
14,928
|
A one
percentage point change in the annual salary assumed would have the
following effect:
|
|
Increase
|
Decrease
|
|
|
ARS
000
|
ARS
000
|
|
|
|
|
|
Effect on the
benefit obligation as of the 2018 year-end
|
12,170
|
(11,205
)
|
|
Effect on the
benefit obligation as of the 2017 year-end
|
13,635
|
(12,120
)
|
As of
December 31, 2018 and 2017, the Group had no assets in connection
with employee benefit plans.
|
|
12-31-2018
|
12-31-2017
|
|
|
ARS
000
|
ARS
000
|
|
Current:
|
|
|
|
Vacation and
statutory bonus
|
150,947
|
175,988
|
|
Contributions
payable
|
63,825
|
73,990
|
|
Bonus
accrual
|
173,278
|
213,227
|
|
Other
|
3,118
|
13,931
|
|
|
391,168
|
477,136
|
16.
Cash and cash equivalents
For the
purpose of the consolidated statement of financial position and the
consolidated statement of cash flow, cash and short-term deposits
comprise the following items:
|
|
12-31-2018
|
12-31-2017
|
|
|
ARS
000
|
ARS
000
|
|
|
|
|
|
Cash at banks and
on hand
|
229,948
|
130,863
|
Bank
balances accrue interest at variable rates based on the bank
deposits daily rates. Short-term deposits are made for terms that
vary between one day and three months, depending on the
Group’s immediate needs and they accrue interest at the
respective fixed short-term deposit rates.
F-59
CENTRAL
PUERTO S.A.
17.
Equity
reserves and dividends paid
Pursuant to the
Argentine Companies Act (Ley General de Sociedades) and the bylaws,
5% of the income for the year must be allocated to the legal
reserve until such reserve reaches 20% of the capital
stock.
On
April 29, 2016, the Shareholders’ Meeting of the Company
approved the increase of the legal reserve in the amount of 154,065
and the allocation of the remaining unallocated results as of
December 31, 2015 to increase the voluntary reserve by 2,927,218 in
order to improve the solvency of the Company.
On
October 21, 2016, the Shareholders’ Meeting of the Company
approved the distribution of dividends in cash amounting to ARS 7.4
per share which were paid on November 7, 2016.
On
December 16, 2016, the Shareholders’ Meeting of the Company
approved the reversal of the voluntary reserve for 2,440,956, the
capitalization of the reversed funds through the payment of a
dividend in shares, the increase of the Company’s capital
stock and the issue and distribution of 2,440,956 non-endorsable
registered shares (fully paid-in). On February 8, 2017, the new
shares of the Company were issued.
On
April 28, 2017, the Shareholders’ Meeting of the Company
approved the increase of the legal reserve in the amount of 162,480
and the allocation of the remaining unallocated results as of
December 31, 2016 to increase the voluntary reserve by 3,074,975 in
order to improve the solvency of the Company.
On
August 15, 2017, the Shareholders’ Meeting of the Company
approved the distribution of dividends in cash amounting to ARS
0.85 per share which were paid on August 30, 2017.
On
April 27, 2018, the Shareholders’ Meeting of the Company
approved the increase of the legal reserve in the amount of 220,913
and approved the distribution of dividends in cash amounting to ARS
0.70 per share, which were paid on May 11, 2018, allocating the
remaining unallocated results as of December 31, 2017 to increase
the voluntary reserve by 3,386,408 in order to improve the solvency
of the Company.
As
described in Note 2.1.2, the Company, subject to the Annual General
Meeting’s approval, absorbed all cumulative negative
unappropriated retaining earnings existing as at January 1, 2017
which were a consequence of the inflation adjustment. Such negative
results were absorbed with the balances of the accounts Voluntary
Reserve, Special Reserve RG CNV 609, Special Reserve Resolution IGJ
7/05, Legal Reserve, Premiums, and with part of the balance of the
account Adjustment to Capital Stock.
18.
Provisions
and contingent liabilities
|
|
2018
|
2017
|
||||
|
Item
|
At
beginning
|
Increases
|
Transfers
|
Decreases
|
At
end
|
At
end
|
|
|
ARS
000
|
ARS
000
|
ARS
000
|
ARS
000
|
ARS
000
|
ARS
000
|
|
Provisions
|
|
|
|
|
|
|
|
|
|
|
|
|
|
|
|
Current
|
|
|
|
|
|
|
|
Provision for lawsuits and
claims
|
610,476
|
106,263
|
-
|
(179,240
)(2)
|
537,499
|
610,476
|
|
12-31-2018
|
610,476
|
106,263
|
-
|
(179,240
)
|
537,499
|
|
|
12-31-2017
|
859,893
|
102,204
|
(193,463
)(1)
|
(158,158
)(2)
|
|
610,476
|
(1)
Transferred to
liabilities associated with the assets held for sale (Note
21).
(2)
Income (loss) for
exposure to change in purchasing power of currency for the
year.
F-60
CENTRAL
PUERTO S.A.
19.
Information
on related parties
The
following table provides the transactions performed for the years
ended December 31, 2018, 2017 and 2016, and the accounts payable
to/receivable from related parties as of December 31, 2018 and
2017:
|
|
|
Income
|
Expenses
|
Receivables
|
Payables
|
|
|
|
ARS
000
|
ARS
000
|
ARS
000
|
ARS
000
|
|
|
|
|
|
|
|
|
Associates:
|
|
|
|
|
|
|
Termoeléctrica
José de San Martín S.A.
|
12-31-2018
|
222
|
-
|
837
|
-
|
|
|
12-31-2017
|
266
|
-
|
28
|
-
|
|
|
12-31-2016
|
180
|
-
|
19
|
-
|
|
|
|
|
|
|
|
|
Distribuidora de
Gas Cuyana S.A.
|
12-31-2018
|
-
|
235,319
|
-
|
24,583
|
|
|
12-31-2017
|
-
|
69,088
|
-
|
10,706
|
|
|
12-31-2016
|
-
|
23,019
|
|
2,564
|
|
|
|
|
|
|
|
|
Distribuidora de
Gas del Centro S.A.
|
12-31-2018
|
-
|
-
|
-
|
-
|
|
|
12-31-2017
|
-
|
-
|
-
|
-
|
|
|
12-31-2016
|
-
|
92
|
-
|
-
|
|
|
|
|
|
|
|
|
Energía
Sudamericana S.A.
|
12-31-2018
|
-
|
-
|
-
|
-
|
|
|
12-31-2017
|
-
|
-
|
384
|
2,847
|
|
|
12-31-2016
|
-
|
-
|
-
|
-
|
|
|
|
|
|
|
|
|
Transportadora de
Gas del Mercosur S.A.
|
12-31-2018
|
7,647
|
-
|
24
|
-
|
|
|
12-31-2017
|
4,828
|
-
|
25,461
|
-
|
|
|
12-31-2016
|
3,105
|
-
|
13,940
|
-
|
|
|
|
|
|
|
|
|
Related
companies:
|
|
|
|
|
|
|
RMPE
Asociados S.A.
|
12-31-2018
|
178
|
159,895
|
-
|
-
|
|
|
12-31-2017
|
202
|
142,259
|
-
|
-
|
|
|
12-31-2016
|
145
|
65,076
|
11
|
-
|
|
Total
|
12-31-2018
|
8,047
|
395,214
|
861
|
24,583
|
|
|
12-31-2017
|
5,296
|
211,347
|
25,873
|
13,553
|
|
|
12-31-2016
|
3,430
|
88,187
|
13,970
|
2,564
|
Terms
and conditions of transactions with related parties
Balances at the
related reporting period-ends are unsecured and interest free.
There have been no guarantees provided or received for any related
party receivables or payables.
For the
years ended December 31, 2018, 2017 and 2016, the Group has not
recorded any impairment of receivables relating to amounts owed by
related parties. This assessment is undertaken at the end of each
reporting period by examining the financial position of the related
party and the market in which the related party
operates.
20.
Financial
risk management objectives and policies
-
Interest rate
risk
Interest rate
variations affect the value of assets and liabilities accruing a
fixed interest rate, as well as the flow of financial assets and
liabilities with floating interest rates.
As
mentioned in Note 14.3, short-term bank loans accrue interest at a
fixed interest rate. The Group uses no derivate financial
instruments to cover this risk.
F-61
CENTRAL
PUERTO S.A.
Under
IAS 29, keeping monetary assets causes loss of purchasing power, as
long as there is no adjustment mechanism that compensates for such
loss of purchasing power. This loss is included in the fiscal year
income (loss) under item loss on net monetary position. On the
contrary, keeping monetary liabilities causes gain of purchasing
power, also included under item loss on net monetary
position.
The company’s risk management policy was
designed for the purposes of reducing the effect the loss of
purchasing power may have. Net monetary positions during most of
fiscal years 2018, 2017 and 2016 appeared as assets; hence, the
Company seeks to mitigate the risk by implementing adjustment
mechanisms through interest and exchange differences. In
consequence, during 2018, 2017 and 2016, item loss on net monetary
position showed net loss caused by monetary accounts
inflation.
Interest rate sensitivity
The
following table shows the sensitivity of income before income tax
for the year ended December 31, 2018, to a reasonably possible
change in interest rates over the portion of loans and CAMMESA
borrowings bearing interest at a variable interest rate, with all
other variables held constant:
|
Increase in
percentage
|
Effect on income
before income tax (Loss)
|
|
|
ARS
000
|
|
|
|
|
5
%
|
(141,280
)
|
-
Foreign currency
risk
Foreign
currency risk is the risk that the fair value or future cash flows
of a financial instrument will fluctuate because of changes in
foreign exchange rates.
The
Group is exposed to the foreign currency risk at an ARS/USD ratio,
mainly due to its operating activities, the investment projects
defined by the Company and the debt related to the bank loan
mentioned in Note 14.3. The Company does not use derivative
financial instruments to hedge such risk since almost all our
income is denominated in foreign currency, which protects us from a
devaluation of the peso.
Moreover, as of
December 31, 2018, the Company carries receivables, cash and cash
equivalents in foreign currency for USD 570,726 thousands, which
exceed the liabilities carried in foreign currency for
approximately USD 167,902 thousands.
The cashflow from
such receivables also helps us to mitigate the effects of a
potential devaluation of the peso.
Foreign currency sensitivity
The
following table shows the sensitivity to a reasonably possible
change in the US dollar exchange rate, with all other variables
held constant, of income before income tax as of December 31, 2018
(due to changes in the fair value of monetary assets and
liabilities).
|
Change
in
USD rate
|
Effect on income
before income tax (Gain)
|
|
|
ARS
000
|
|
|
|
|
10
%
|
973,442
|
-
Price
risk
The
Group’s revenues depend on the electric power price in the
spot market and the production cost paid by CAMMESA. The Company
has no power to set prices in the market where it operates (See
Note 1).
F-62
CENTRAL
PUERTO S.A.
Credit
risk
Credit
risk is the risk that a counterparty will not meet its obligations
under a financial instrument or customer contract, leading to a
financial loss. The Company is exposed to credit risk from its
operating activities (primarily for trade receivables) and from its
financing activities, including holdings of government
securities.
-
Trade and other
receivables
The
Finance Department is in charge of managing customer credit risk
subject to policies, procedures and controls relating to the
Group’s credit risk management. Customer receivables are
regularly monitored. Although the Group has received no guarantees,
it is entitled to request interruption of electric power flow if
customers fail to comply with their credit obligations. In regard
to credit concentration, see Note 14.1. The need to book impairment
is analyzed at the end of each reporting period on an individual
basis for major clients. The allowance recorded as of December 31,
2018, is deemed sufficient to cover the potential impairment in the
value of trade receivables.
-
Cash and cash
equivalents
Credit
risk from balances with banks and financial institutions is managed
by the Group’s treasury department in accordance with
corporate policy. Investments of surplus funds are made only with
approved counterparties; in this case, the risk is limited because
high-credit-rating banks are involved.
-
Public and
corporate securities
This
risk is managed by the Company’s finance management according
to corporate policies, whereby these types of investments may only
be made in first-class companies and in instruments issued by the
federal or provincial governments.
Liquidity
risk
The
Group manages its liquidity to guarantee the funds required to
support its business strategy. Short-term financing needs related
to seasonal increases in working capital are covered through
short-and medium-term bank credit lines.
The
table below summarizes the maturity profile of the Company’s
financial liabilities.
|
|
Less than 3
months
|
3 to 12
months
|
1 to
5
years
|
Total
|
|
|
ARS
000
|
ARS
000
|
ARS
000
|
ARS
000
|
|
12-31-2018
|
|
|
|
|
|
CAMMESA borrowings
and other loans and borrowings
|
8,395
|
1,822,759
|
6,862,758
|
8,693,912
|
|
Trade and other
payables
|
1,729,909
|
-
|
-
|
1,729,909
|
|
|
1,738,304
|
1,822,759
|
6,862,758
|
10,423,821
|
|
12-31-2017
|
|
|
|
|
|
CAMMESA borrowings
and other loans and borrowings
|
345
|
3,948,515
|
3,127,689
|
7,076,549
|
|
Trade and other
payables
|
1,499,027
|
2,858
|
-
|
1,501,885
|
|
|
1,499,372
|
3,951,373
|
3,127,689
|
8,578,434
|
Guarantees
In
connection with the concession right agreement described in Note
13, the Group granted a bank security to provide performance
assurance of its obligations in the amount of 4,366.
On
October 16, 2006, the Group entered into two pledge agreements with
the Secretariat of Energy to guarantee our performance obligations
in favor of the FONINVEMEM trusts under certain construction
management and operation management agreements and provided as
collateral: (a) 100% of our shares in TJSM and TMB, and (b) 50% of
the rights conferred by our LVFVD receivables for the duration of
the construction management agreement and the operation management
agreement.
F-63
CENTRAL
PUERTO S.A.
Likewise, the Group
entered into various guarantee agreements to provide performance
assurance of its obligations arising from the agreements described
in Notes 1.a), 14.3.1, 14.3.5, 14.4 and 22.6.
21.
Discontinued
operations
As
mentioned in Note 22.8, on December 20, 2017 YPF Energía
Eléctrica S.A. (“YPF EE”) accepted our offer to
sell the La Plata plant. On February 8, 2018, the plant was
transferred to YPF EE effective as of January 5, 2018.
Consequently, as of December 31, 2017 the La Plata plant was
classified as a disposal group held for sale and its respective
results as a discontinued operation. The results of La Plata plant
for the years ended December 31, 2018, 2017 and 2016 are presented
below:
|
|
2018
|
2017
|
2016
|
|
|
ARS
000
|
ARS
000
|
ARS
000
|
|
|
|
|
|
|
Revenues
|
17,151
|
3,596,450
|
3,452,755
|
|
Cost of
sales
|
(23,874
)
|
(2,324,579
)
|
(2,134,832
)
|
|
Gross
(loss) income
|
(6,723
)
|
1,271,871
|
1,317,923
|
|
|
|
|
|
|
Administrative and
selling expenses
|
-
|
(13,948
)
|
(14,022
)
|
|
Other operating
income
|
469,600
|
-
|
-
|
|
Other operating
expenses
|
-
|
(18,146
)
|
59,030
|
|
Operating
income
|
462,877
|
1,239,777
|
1,362,931
|
|
|
|
|
|
|
Income (loss) on
net monetary position
|
(134,063
)
|
(57,942
)
|
(63,695
)
|
|
Finance
expense
|
-
|
(545
)
|
(28,624
)
|
|
Income
before tax from discontinued operations
|
328,814
|
1,181,290
|
1,270,612
|
|
Income tax for the
year
|
(52,637
)
|
(390,016
)
|
(463,623
)
|
|
Income
for the year from discontinued operations
|
276,177
|
791,274
|
806,989
|
|
|
|
|
|
|
The
assets and liabilities of La Plata plant classified as held for
sale as of December 31, 2017 are, as follows:
|
|
2017
|
|
|
|
|
ARS 000
|
|
|
Assets
|
|
|
|
|
Property, plant
and equipment
|
|
710,343
|
|
|
Inventories
|
|
38,523
|
|
|
Assets
held for sale
|
|
748,866
|
|
|
|
|
|
|
|
Liabilities
|
|
|
|
|
Deferred
income tax liabilities
|
|
(152,039
)
|
|
|
Compensation
and employee benefits liabilities
|
|
(6,513
)
|
|
|
Provisions
|
|
(193,463
)
|
|
|
Labilities
associated with assets held for sale
|
|
(352,015
)
|
|
|
Net
assets held for sale
|
|
396,851
|
|
The net cash flows
of La Plata plant operation are, as follows:
|
|
2018
|
2017
|
2016
|
|
|
ARS
000
|
ARS
000
|
ARS
000
|
|
|
|
|
|
|
Operating
activities
|
(6,723
)
|
1,212,104
|
1,250,057
|
F-64
CENTRAL
PUERTO S.A.
Earnings per
share:
|
|
2018
|
|
2017
|
|
2016
|
|
|
|
|
|
|
|
|
-
Basic and diluted
income per share from discontinued operations
|
ARS
0.18
|
|
ARS
0.53
|
|
ARS
0.53
|
22.
Contracts
and contingent liabilities
22.1.
Maintenance
and service contracts
The
Group entered into long-term service agreements executed with
leading global companies in the construction and maintenance of
thermal generation plants, such as (i) General Electric, which is
in charge of the maintenance of the Puerto Combined Cycle plant,
and part of the Mendoza based units, and (ii) Siemens, which is in
charge of the maintenance of the combined cycle unit based in
Luján de Cuyo plant.
Under
long-term service agreements, suppliers provide materials, spare
parts, labor and on-site engineering guidance in connection with
scheduled maintenance activities, in accordance with the applicable
technical recommendations.
22.2.
Agreement
for supplying electricity and steam to YPF
As from
January 1999 and for a 20-year term, our Luján de Cuyo plant
supplies 150 tons per hour of steam to YPF’s refinery in
Luján de Cuyo under a steam supply agreement. Under this
agreement YPF supplies the Luján de Cuyo plant with the fuel
and water needed for operation of the plant.
On
February 8, 2018, we signed an agreement to extend our steam supply
agreement with YPF at our Luján de Cuyo plant for a period of
up to 24 months from January 1, 2019 under the same terms as our
existing steam supply agreement.
22.3.
Acquisition
of Siemens gas turbine
On
December 18, 2014, the Company acquired from Siemens a gas turbine
for electric power generation composed by a turbine and a generator
with 286 MW output power, and the proper ancillary equipment and
maintenance and assistance services.
22.4.
Acquisition
of General Electric gas turbine
On
March 13, 2015, the Company acquired a gas turbine from General
Electric and hired their specialized technical support services.
The unit is a gas turbine with 373 MW output power.
As of
December 31, 2018, the Company received cash advances from CAMMESA
amounting to 1,185,014 for partially funding the mentioned
acquisition.
22.5.
Acquisition
of two Siemens gas turbines
On May
27, 2016, the Company acquired from Siemens two gas turbines for
electric power generation composed by a turbine and a generator
with 298MW output power, and the proper ancillary equipment and
maintenance and assistance services. This equipment will be used in
the cogeneration project called “Terminal 6 San
Lorenzo”, which is described in Note 22.7.
F-65
CENTRAL
PUERTO S.A.
22.6.
Awarding
of Renewable Energy Projects
In
October 2016, the Company and its subsidiary CPR were awarded of a
wind project called “La Castellana” with a capacity of
99 MW.
In
January 2017, CP La Castellana S.A.U. entered into a power purchase
agreement with CAMMESA for La Castellana project for a 20-year
term as from the launch of the commercial operations.
In
November 2016, the Company and its subsidiary CPR were awarded of a
wind project called “Achiras” with a capacity of 48
MW.
In May
2017, CP Achiras S.A.U. entered into a power purchase agreement
with CAMMESA for Achiras project for a 20-year term as from the
launch of the commercial operations.
In
November 2017, the Company was awarded a project of wind power
generation called “La Genoveva I” with an installed
capacity of 86.6 MW. The Company participated on the tender by
virtue of its call option on 100% of the shares of Vientos La
Genoveva S.A., a special purpose vehicle, through which the
aforementioned project will be developed. In this context, the
Company assigned the exercise of the call option to its subsidiary
CPR and on March 23, 2018, CPR acquired 100% of the shares of
Vientos La Genoveva S.A. (currently, Vientos La Genoveva
S.A.U.).
In
addition, on January 2018 and May 2018, CAMMESA assigned to the
Group the priority on power dispatch for the projects “La
Castellana II”, “Achiras II” and “La
Genoveva II”, with an installed capacity of 15.75 MW, 79.80
MW and 41.8 MW, respectively.
Consequently, CPR
exercised the call option on the special purpose vehicle through
which La Genoveva II project will be developed, and on June 28,
2018 acquired 100% of the shares of Vientos La Genoveva II S.A.
(currently, Vientos La Genoveva II S.A.U.).
On
August 6, 2018, CPR transferred to the Company its total
shareholding at Vientos La Genoveva S.A.U. (3,740,500
non-endorsable registered common shares at ARS 1 each) and at
Vientos La Genoveva II S.A.U. (5,578,543 non-endorsable registered
common shares at ARS 1 each), including all the political and
economical rights inherent in them.
On
December 28, 2018, a decision was made at the Special
Shareholders’ Meeting of CPR Energy Solutions S.A.U.
(”CPRES”), an special purpose vehicle, subsidiary of
CPR, which developed projects La Castellana II and Achiras II;
the decision made implied a spin off, by means of which
CPRES’s equity would be divided and wind farm project La
Castellana II was part of its equity, while 79.8-MW wind farm
Project Achiras II was divided from it into two parts: (i) a part
consisting on 57-MW wind farm Manque; therefore, a new company
named CP MANQUE S.A.U. (“CPM”) was incorporated for
this wind farm, and (ii) another part consisting on 22.8-MW wind
farm called Los Olivos; therefore, a new company named CP LOS
OLIVOS S.A.U. (“CPLO”) was incorporated for this wind
farm (hereinafter, the “spinning-off companies”.) As
resolved at the Shareholders’ Meeting, the spin off was
effective in legal and tax terms as at February 1, 2019, on which
date, the spinning-off companies were incorporated with the equity
that was divided from CPRES. As from such date, the spinning-off
companies commenced their independent activities and all operating,
accounting, and tax effects were triggered.
On
August 17, 2018, CPSA acquired from Ledesma Renovables S.A., a
12-MW photovoltaic power generation project (extensible in
additional 6 MW), located at Santa María, Province of
Catamarca.
Acquisition
and operation of wind turbines
The
Group has entered into agreements with Nordex Windpower S.A. for
the operation and maintenance of Achiras and La Castellana wind
farms for a 10-year term.
F-66
CENTRAL
PUERTO S.A.
Moreover, the Group
has entered into agreements with Vestas Argentina S.A. for the
supply, transport, setup, assembly, commissioning and tests of wind
turbines for La Genoveva I, La Genoveva II, La Castellana II,
Manque and Los Olivos wind farms. The Group also entered into
contracts with Vestas Argentina S.A. for the operation and
maintenance of the wind farms for a 5-year term.
Additionally, the
Group has also entered into agreements with Constructora
Sudamericana S.A. for the execution of the civil works and the
medium voltage grid in such wind farms. Also, the Group has entered
into agreements with Ventus Energía Renovables S.A. for
supervision and inspection tasks on the works in such wind
farms.
22.7.
Awarding
of co-generation projects
On
September 25, 2017, the Company was awarded through Resolution SEE
820/2017 with two co-generation projects called “Terminal 6
San Lorenzo” with a capacity of 330 MW and Luján de Cuyo
(within our Luján de Cuyo plant) with a capacity of 93
MW.
On
December 15, 2017, we executed a new steam supply contract with YPF
for a 15-year term that will begin when the new co-generation unit
at our Luján de Cuyo plant begins operations.
Also,
on December 27, 2017, we entered into a final steam supply
agreement with T6 Industrial S.A. for the new co-generation unit at
our Terminal 6 San Lorenzo plant for a 15 year-term.
On
January 4, 2018, the Company entered into power purchase agreements
with CAMMESA for each of the mentioned projects for a 15-year term
as from the launch of commercial operations.
22.8.
Sale
of the La Plata plant
On
December 20, 2017, YPF EE, an YPF S.A. subsidiary, accepted our
offer to sell the La Plata plant, for a total sum of USD 31.5
million, subject to closing customary conditions. On February 8,
2018, after the conditions were met, the plant was transferred to
YPF EE effective as of January 5, 2018. Consequently, the Company
has booked an income, before income tax, from discontinued
operations for 469,600, due to the sale of the mentioned
plant.
22.9.
Purchase
of natural gas for generation
As
accepted under Regulation SGE No. 70/2018 described in Note 1.d),
the Company reinstated its activities towards purchasing natural
gas as from late November 2018, in order to supply its generation
stations. As from December 2018, all natural gas used by the
Company was purchased to producers and distributors directly, as
well as the transported associated to those consumptions. The
Company’s main natural gas providers are YPF, Tecpetrol,
Total, Metroenergía and Pluspetrol, among others.
22.10.
Contingent
liabilities
Income
tax return for fiscal year 2014
In
February 2015 CPSA, for itself and as the successor company of
Hidroeléctrica Piedra del Águila (HPDA) (the merged
company) filed income tax returns for the nine-month period ended
September 30, 2014, applying the adjustment for inflation mechanism
established by the Argentine Income Tax Law.
In
addition, the Company filed its income tax return for the
three-month period ended December 31, 2014, applying the same
adjustment for inflation mechanism established by the Argentine
Income Tax Law.
As of
the date of issue of these consolidated financial statements, we do
not expect that the Argentine Tax Authorities, or ultimately, the
Supreme Court will approve our filed income tax return.
Accordingly, as of December 31, 2018 and 2017, the Company keeps
recorded a provision for 495,390 and 551,418, respectively, which
had been recognized during the year ended December 31,
2014.
F-67
CENTRAL
PUERTO S.A.
Action
for recovery - Income tax refund for fiscal period
2010
In
December 2014, the Company, as merging company and continuing
company of HPDA, raised a recourse action before fiscal authorities
regarding the income tax for the fiscal period 2010 that amounted
to 67,383 at historical values (349,524 adjusted for inflation),
which was incorrectly entered by HPDA. This recourse action seeks
to recover the income tax entered by HPDA in accordance with the
lack of application of the inflation- adjustment mechanism
established by the Law on Income Tax.
In
December 2015, the three-month term stated by Law no. 11,683
elapsed, the Company brought a contentious-administrative claim
before the National Court to ask for its right to recourse for an
amount of 67,612 at historical values (350,712 adjusted for
inflation).
In
October 2018, the Company was served notice of the judgment issued
by the Federal Contentious- Administrative Court No. 5, which
granted the right to recourse. The judgment ordered tax authorities
to return the amount of 67,612 (at historical values) to the
Company plus the interest stated in the BCRA Communication 14290
and ordered that legal cost must be borne by the defendant. The tax
administration appealed the judgment passed by the court and the
file is currently under analysis by the Administrative Court of
Appeals for the City of Buenos Aires. Given the fact that, as of
the fiscal year closing, collection is not virtually certain, the
Company maintains the accounting treatment and did not recognize a
receivable for such item.
Action
for recovery - income tax refund for fiscal years 2009, 2011 and
2012
In
December 2015, the Company filed a petition with the Argentine Tax
Authorities for the recovery of income tax for the fiscal year
2009, in the amount of approximately 20,395 at historical values
(119,117 adjusted for inflation) which had been incorrectly paid by
the Company in excess of our income tax liability. By filling such
action, we seek to recover the excess income tax paid by CPSA due
to the failure to apply the adjustment for inflation set forth in
the Argentine Income Tax Law.
On
April 22, 2016, after the three-month term required by Law No.
11,683 expired, the Company filed an action for recovery for the
amount claimed with the Argentinean Tax Court.
In
December 2017, the Company filed a petition with the Argentine Tax
Authorities for the recovery of 52,783 at historical values
(242,371 adjusted for inflation) paid in excess by the Company for
payment of Income Tax for 2011 fiscal period, according to the
Company’s estimates. The purpose of such action is to recover
the income tax paid by CPSA due to the failure to apply the
adjustment for inflation set forth in the Argentine Income Tax
Law.
In
December 2018, the Company, as merging company and continuing
company of HPDA, filed a petition with the Argentine Tax
Authorities for the recovery of 95,595 at historical values
(387,953 adjusted for inflation) paid in excess by the Company and
HPDA for payment of Income Tax for 2012 fiscal period, due to the
failure to apply the adjustment for inflation set forth in the
Argentine Income Tax Law.
As of
the date of issuance of these consolidated financial statements, we
do not expect that the Argentine Tax Authorities, or ultimately,
the Supreme Court will approve our request for recovery of income
tax we previously paid. Consequently, no receivable was recognized
in relation to this matter.
22.11.
Subsequent
event: Thermal Station Brigadier López award
In the
context of a local and foreign public tender called by
Integración Energética Argentina S.A.
(“IEASA”), on February 27, 2019, IEASA informed the
Company that it was awarded with the transfer composed of the
production unit that is part of Central Termoeléctrica
Brigadier López (the “Station”) and of the
premises on which the Station is located, including: a) production
unit for the Station, which includes, personal property, recordable
personal property, facilities, machines, tools, spare parts, and
other assets used for the Station operation and use; b)
IEASA’s contractual position in executed contracts (described
hereinbelow); c) permits and authorizations in effect related to
the Station operation; and d) CPSA’s responsibility of being
in charge of the transferred employees.
F-68
CENTRAL
PUERTO S.A.
The
Station’s current installed power is 280 MW (open-cycle
operation.). Closing cycle works are at an advanced stage and will
make the Station power rise to 420 MW.
Contractual
position of the executed contracts will be transferred to CPSA upon
the effective date of the acquisition, which was originally
expected to be on April 1, 2019 pursuant to the tender terms (the
“Effective Date”.) The following contracts are
included: a) turbogas supplying contract with CAMMESA for the
supply of electric power (mixed-cycle operation), whose expected
termination date is August 30, 2022; b) turbosteam supplying
contract with CAMMESA for the supply of electric power, whose term
is of ten years as from commencement of commercial operations,
which took place in April 2012; c) financial trust agreement signed
by IEASA as trustor for the purpose of financing the
Station’s open-cycle work, d) gas distribution contracts, e)
Station’s maintenance contract, f) spare parts sale contract,
g) insurance contract, and h) other contracts.
As
regards the trust contract, CPSA will act as trustor as from the
Effective Date. Based on the residual value projection informed by
IEASA, the estimated balance of the financial debt at the Effective
Date will be of USD 161 million (estimated technical
value).
In
addition, on the Effective Date, CPSA will have to acquire the
trust debt securities whose value is equivalent to the difference
between: (i) the debt securities residual value as of the Effective
Date, and (ii) the cash offer made by CPSA.
The
total amount offered by CPSA at the public tender was USD
165,432,500; this amount included USD 155,332,500 in cash, and
USD 10,100,000 to be paid as LVFVD.
Pursuant to the
terms of the tender, CPSA would be subject to a USD 10 million
penalty if it fails to honor its obligations under the terms and
conditions of the tender. In this sense, a guarantee for the
maintenance of the offer has been provided by CPSA and it expires
on May 31, 2019.
As of the date of these financial statements, the
acquisition of the Station
could not be performed due to the
failure to satisfy
certain
conditions of the IEASA tender, such as proper issuance by CNV of
an unconditioned authorization to the terms of the amended version
of the financial trust agreement. Also, there is a discrepancy
between CPSA and IEASA regarding the fulfillment of certain
conditions upon which closing of the acquisition of the Station was
subject. Finally, Resolution 1 adversely affected the
project´s future cash flows.
Considering that as of the original
closing date, April 1, 2019, the aforementioned conditions were not
fulfilled, an extension of such closing date is necessary. As of
the date of these financial statements, CPSA and IEASA failed to
agree on such extension.
23.
Tax
reform
On
December 29, 2017, decree No.1112/2017 was issued, by which the Tax
Reform Law No. 27,430 (“Tax Reform Law”) enacted by the
Argentine Congress on December 27, 2017, was passed. The Tax Reform
Law was published in the Official Gazette the same date it was
enacted. The most relevant aspects of this reform are the
following:
a)
Reduction
of the corporate income tax rate and additional tax on the
distribution of dividends
Through
the fiscal year ended December 31, 2017, the corporate income tax
rate remains at 35% and will be reduced to 30% during the two
following fiscal years beginning on or after January 1st, 2018, and
to 25% for the fiscal years beginning on January 1st, 2020. This
reduction affected the measurement of deferred tax assets and
liabilities as at December 31, 2017, as indicated in Note
9.
The
reduction of the corporate income tax rate is supplemented by the
application of a tax on the dividend distributions made to local
natural persons and foreign beneficiaries, which the Company should
withhold and pay over the tax authorities as a single and final
payment when dividends are distributed. This additional tax will be
of 7% or 13% rate, depending on whether dividends were distributed
for a period when the Company was subject to 30% or 25% rate,
respectively. For this purpose, it is considered, without admitting
evidence to the contrary, that the dividends which are distributed
are related, in the first place, to older accumulated
earnings.
b)
Equalization
tax
Pursuant to Law No.
25,053, when dividends are paid exceeding accumulated taxable
income as of the year- end immediately preceding the payment date,
there is an obligation to withhold, as a single and final payment,
35% on such excess for income tax purpose. This withholding will no
longer be applicable for dividends attributable to income accrued
during the fiscal years beginning on or after January 1st,
2018.
F-69
CENTRAL
PUERTO S.A.
c)
Tax
losses (NOLs)
Section
19 of the Income Tax Law incorporates in the treatment of NOL
deduction the possibility of them being used considering the
changes in the domestic wholesale price index published by INDEC
(Argentine Statistics and Census Institute), for the period between
the closing month of the fiscal year when the payment is
made.
d)
Adjustment
for inflation
To
determine the amount of taxable net profits for fiscal years
commencing as from January 1, 2018, the inflation adjustment
calculated on the basis of the provisions set forth in Sections 95
to 98 of the income tax law will have to be added to or deducted
from the fiscal year’s tax result. This adjustment will only
be applicable if the variance percentage of the consumers price
index (“IPC”) given by the Argentine Statistics Bureau
(“INDEC”), based on the charts prepared by AFIP for
that purposes falls into one of the following scenarios (a) the
percentage totaled during the 36 months prior to fiscal year
closing is higher than 100%, or (b) for the first, second, and
third fiscal year as from January 1, 2018, the index variance
estimated from the commencement to the closing of the fiscal year
is higher than 55% (fifty-five per cent), 30% (thirty per cent,)
and 15% (fifteen per cent) for the first, second, and third fiscal
year respectively.
If the
condition for the adjustment for inflation does not take place, an
adjustment is allowed for certain assets as it is mentioned in the
following paragraph.
e)
Update
of the acquisitions and investments made during the fiscal periods
beginning on January 1st, 2018
For the
acquisitions or investments made during the fiscal periods
beginning on January 1st, 2018, the following updates shall apply,
based on the change percentage in the domestic wholesale price
index provided by INDEC, according to the tables prepared by the
AFIP for such purpose:
(1)
When transferring
depreciable personal property, buildings which cannot be used as an
inventory, intangible assets, shares, contributions or equity
interests in companies (including contributions to mutual funds),
the tax cost basis considered for determining the gross profit will
be updated by the aforementioned index, as from the date of the
acquisition or investment until the date of the transfer, and will
be decreased, if appropriate, by the applicable depreciations
calculated from the updated value.
(2)
The depreciations
deductible related to buildings and other constructions on real
estate property assigned to activities or as investments, different
from inventories, and the depreciations related to assets assigned
to the generation of taxable income, will be calculated applying
the aforementioned index to the ordinary depreciation charge,
referred to the date of the acquisition or construction indicated
in the tables prepared by the AFIP.
F-70
CENTRAL
PUERTO S.A.
f)
Advanced
reimbursement of the technical credit balance of the value added
tax
Law No.
27,430 establishes in the Value Added Tax Law a mechanism by which
it is possible to require the reimbursement of the tax credits
originated in the definite purchase, building, manufacturing,
preparation or import of fixed assets (with the exception of
vehicles) subject to depreciation in the income tax, which after
six consecutive fiscal years, as from the year in which its
consideration as tax credit was applicable, constitute the
technical credit balance. If after 60 fiscal years as from the
fiscal year immediately following the one where the reimbursement
was made, the tax-payer had not generated an excess of tax debit
over tax credits for a similar amount, the tax-payer must reimburse
the not-applied excess plus the respective interest. These
dispositions will apply to the accumulated balance originated in
the charges whose right to consideration as tax credit is
originated as from January 1st, 2018.
g)
Employers’
contributions
A
progressive increase of the employers’ contributions rate of
17% effective for those employers’ contributions accrued as
from February 1st, 2018 is established. The increase schedule
establishes that the rate will reach 17.50% in 2018, 18% in 2019,
18.50% in 2020 and 19% in 2021. As from January 1st, 2022, the
employers’ contributions accrued will be finally settle at
19.50%.
In
addition, from the tax basis on which it is proper to apply the
rates indicated before, a non-taxable minimum will be deducted
which will also be progressive and which will begin in 2018 with
ARS 2,400 to finally reach ARS 12,000 as from January 1st, 2022.
This non-taxable minimum will be updated as from January 2019 based
on the domestic wholesale price index provided by
INDEC.
F-71
TABLE OF CONTENTS
Part IItem 1. Identity Of Directors, Senior Management and AdvisorsItem 2. Offer Statistics and Expected TimetableItem 3. Key InformationItem 3. A. Selected Financial DataItem 3. B Capitalization and IndebtednessItem 3. C Reasons For The Offer and Use Of ProceedsItem 3. D Risk FactorsItem 4. Information Of The CompanyItem 4. A History and Development Of The CompanyItem 4. A. History and Development Of The CompanyItem 4. B Business OverviewItem 4. B. Business OverviewItem 4. C Organizational StructureItem 4. D Property, Plants and EquipmentItem 5. Operating and Financial Review and ProspectsItem 5. A Operating ResultsItem 4. A. History and Development Of TheItem 5. B Liquidity and Capital ResourcesItem 5. A. Operating ResultsItem 5. C Research and Development, Patents and Licenses, EtcItem 5. D Trend InformationItem 5. E Off-balance Sheet ArrangementsItem 5. F Contractual ObligationsItem 5. G Safe HarborItem 6. Directors, Senior Management and EmployeesItem 7. Shareholders and Related Party TransactionsItem 7. A. Major ShareholdersItem 7. B Related Party TransactionsItem 7. C Interests Of Experts and CounselItem 8. Financial InformationItem 8. A. Consolidated Statements and Other Financial InformationItem 8. B Significant ChangesItem 9. The Offer and ListingItem 9. A. Offer and Listing DetailsItem 9. B. Plan Of DistributionItem 9. C. MarketsItem 9. D. Selling ShareholdersItem 9. E. DilutionItem 9. F. Expenses Of The IssueItem 10. Additional InformationItem 10. A. Share CapitalItem 10. B. Memorandum and Articles Of AssociationItem 10. C Material ContractsItem 10. D Exchange ControlsItem 10. E TaxationItem 10. F Dividends and Paying AgentsItem 10. G Statement By ExpertsItem 10. H Documents on DisplayItem 10. I. Subsidiary InformationItem 11. Quantitative and Qualitative Disclosures About Market RiskItem 12. Description Of Securities Other Than Equity SecuritiesItem 12. A Debt SecuritiesItem 12. B Warrants and RightsItem 12. C Other SecuritiesItem 12. D American Depositary SharesItem 13. Defaults, Dividend Arrearages and DelinquenciesItem 14. Material Modifications To The Rights Of Security Holders and Use Of ProceedsItem 15. Controls and ProceduresItem 16. A Audit Committee Financial ExpertItem 16. B Code Of EthicsItem 16. C Principal Accountant Fees and ServicesItem 16. D Exemptions From The Listing Standards For Audit CommitteesItem 16. E Purchases Of Equity Securities By The Issuer and Affiliated PurchasersItem 16. F Change in Registrant S Certifying AccountantItem 16. G Corporate GovernanceItem 16. H. Mine Safety DisclosureItem 17. Financial StatementsItem 18. Financial StatementsItem 19. ExhibitsItem At Beginning Increases Decreases At End At EndItem At Beginning Increases Transfers Decreases At End At End