CITIZENS FINANCIAL GROUP INC/RI
10-Ks and 10-Qs
|
|
|
|
|
|
|
|
|
|
|
|
|
|
|
|
|
|
|
|
|
|
|
|
|
|
|
|
|
|
|
|
|
|
|
|
|
|
|
|
|
UNITED STATES
SECURITIES AND EXCHANGE COMMISSION
Washington, D.C. 20549
FORM 10-Q
[X]
QUARTERLY REPORT PURSUANT TO SECTION 13 OR 15(d)
OF THE SECURITIES EXCHANGE ACT OF 1934
For the Quarterly Period Ended
September 30, 2017
[ ]
TRANSITION REPORT PURSUANT TO SECTION 13 OR 15(d)
OF THE SECURITIES EXCHANGE ACT OF 1934
For the Transition Period From
(Not Applicable)
Commission File Number 001-36636

(Exact name of the registrant as specified in its charter)
|
Delaware
|
05-0412693
|
|
|
(State or Other Jurisdiction of
Incorporation or Organization)
|
(I.R.S. Employer
Identification Number)
|
|
One Citizens Plaza, Providence, RI 02903
(
Address of principal executive offices, including zip code
)
(401) 456-7000
(
Registrant’s telephone number, including area code
)
Indicate by check mark whether the Registrant (1) has filed all reports required to be filed by Section 13 or 15(d) of the Securities Exchange Act of 1934 during the preceding 12 months and (2) has been subject to such filing requirements for the past 90 days.
[
ü
] Yes [ ] No
Indicate by check mark whether the registrant has submitted electronically and posted on its corporate Web site, if any, every Interactive Data File required to be submitted and posted pursuant to Rule 405 of Regulation S-T (§232.405 of this chapter) during the preceding 12 months (or for such shorter period that the registrant was required to submit and post such files).
[
ü
] Yes [ ] No
Indicate by check mark whether the registrant is a large accelerated filer, an accelerated filer, a non-accelerated filer, a smaller reporting company or an emerging growth company. See the definitions of “large accelerated filer,” “accelerated filer” and “smaller reporting company” in Rule 12b-2 of the Exchange Act:
|
Large accelerated filer
|
[
ü
]
|
Accelerated filer
|
[ ]
|
|
Non-accelerated filer (Do not check if a smaller reporting company)
|
[ ]
|
Smaller reporting company
|
[ ]
|
|
Emerging growth company
|
[ ]
|
||
If an emerging growth company, indicate by check mark if the registrant has elected not to use the extended transition period for complying with any new or revised financial accounting standards provided pursuant to Section 13(a) of the Exchange Act. [ ]
Indicate by check mark whether the registrant is a shell company (as defined in Rule 12b-2 of the Exchange Act). [ ] Yes [
ü
] No
There were 491,991,403 shares of Registrant’s common stock ($0.01 par value) outstanding on November 1, 2017.
|
|
||||
|
Table of Contents
|
||||
2
CITIZENS FINANCIAL GROUP, INC.
GLOSSARY OF ACRONYMS AND TERMS
The following listing provides a comprehensive reference of common acronyms and terms we regularly use in our financial reporting:
|
AFS
|
Available for Sale
|
|
|
ALLL
|
Allowance for Loan and Lease Losses
|
|
|
AOCI
|
Accumulated Other Comprehensive Income (Loss)
|
|
|
ATM
|
Automated Teller Machine
|
|
|
Board of Directors
|
The Board of Directors of Citizens Financial Group, Inc.
|
|
|
bps
|
Basis Points
|
|
|
C&I
|
Commercial and Industrial
|
|
|
Capital Plan Rule
|
Federal Reserve’s Regulation Y Capital Plan Rule
|
|
|
CBNA
|
Citizens Bank, National Association
|
|
|
CBPA
|
Citizens Bank of Pennsylvania
|
|
|
CCAR
|
Comprehensive Capital Analysis and Review
|
|
|
CCB
|
Capital Conservation Buffer
|
|
|
CET1
|
Common Equity Tier 1
|
|
|
Citizens or CFG or the Company
|
Citizens Financial Group, Inc. and its Subsidiaries
|
|
|
CLTV
|
Combined Loan to Value
|
|
|
CMO
|
Collateralized Mortgage Obligation
|
|
|
CRE
|
Commercial Real Estate
|
|
|
DFAST
|
Dodd-Frank Act Stress Test
|
|
|
Dodd-Frank Act
|
The Dodd-Frank Wall Street Reform and Consumer Protection Act of 2010
|
|
|
EPS
|
Earnings Per Share
|
|
|
Exchange Act
|
The Securities Exchange Act of 1934
|
|
|
Fannie Mae (FNMA)
|
Federal National Mortgage Association
|
|
|
FASB
|
Financial Accounting Standards Board
|
|
|
FDIA
|
Federal Deposit Insurance Act
|
|
|
FDIC
|
Federal Deposit Insurance Corporation
|
|
|
FHLB
|
Federal Home Loan Bank
|
|
|
FICO
|
Fair Isaac Corporation (credit rating)
|
|
|
FRB
|
Federal Reserve Board of Governors and, as applicable, Federal Reserve Bank(s)
|
|
|
FTP
|
Funds Transfer Pricing
|
|
|
GAAP
|
Accounting Principles Generally Accepted in the United States of America
|
|
|
Ginnie Mae (GNMA)
|
Government National Mortgage Association
|
|
|
HELOC
|
Home Equity Line of Credit
|
|
|
HTM
|
Held To Maturity
|
|
|
LCR
|
Liquidity Coverage Ratio
|
|
|
LGD
|
Loss Given Default
|
|
|
LIBOR
|
London Interbank Offered Rate
|
|
|
LIHTC
|
Low Income Housing Tax Credit
|
|
|
LTV
|
Loan to Value
|
|
|
MBS
|
Mortgage-Backed Securities
|
|
|
Mid-Atlantic
|
District of Columbia, Delaware, Maryland, New Jersey, New York, Pennsylvania, Virginia, and West Virginia
|
|
|
Midwest
|
Illinois, Indiana, Michigan, and Ohio
|
|
|
MD&A
|
Management’s Discussion and Analysis of Financial Condition and Results of Operations
|
|
|
MSR
|
Mortgage Servicing Right
|
|
|
New England
|
Connecticut, Maine, Massachusetts, New Hampshire, Rhode Island, and Vermont
|
|
3
CITIZENS FINANCIAL GROUP, INC.
|
NM
|
Not meaningful
|
|
|
NSFR
|
Net Stable Funding Ratio
|
|
|
OCC
|
Office of the Comptroller of the Currency
|
|
|
OCI
|
Other Comprehensive Income (Loss)
|
|
|
Parent Company
|
Citizens Financial Group, Inc. (the Parent Company of Citizens Bank of Pennsylvania, Citizens Bank, National Association and other subsidiaries)
|
|
|
PD
|
Probability of Default
|
|
|
ROTCE
|
Return on Average Tangible Common Equity
|
|
|
RPA
|
Risk Participation Agreement
|
|
|
SBO
|
Serviced by Others loan portfolio
|
|
|
SEC
|
United States Securities and Exchange Commission
|
|
|
SVaR
|
Stressed Value at Risk
|
|
|
TDR
|
Troubled Debt Restructuring
|
|
|
TOP
|
Tapping Our Potential
|
|
|
VaR
|
Value at Risk
|
|
|
VIE
|
Variable Interest Entities
|
|
4
CITIZENS FINANCIAL GROUP, INC.
|
Page
|
||
|
Forward-Looking Statements
|
||
|
Selected Consolidated Financial Data
|
||
|
Results of Operations
|
||
|
Analysis of Financial Condition
|
||
5
CITIZENS FINANCIAL GROUP, INC.
FORWARD-LOOKING STATEMENTS
FORWARD-LOOKING STATEMENTS
This document contains forward-looking statements within the Private Securities Litigation Reform Act of 1995. Statements regarding potential future share repurchases and future dividends are forward-looking statements. Also, any statement that does not describe historical or current facts is a forward-looking statement. These statements often include the words “believes,” “expects,” “anticipates,” “estimates,” “intends,” “plans,” “goals,” “targets,” “initiatives,” “potentially,” “probably,” “projects,” “outlook” or similar expressions or future conditional verbs such as “may,” “will,” “should,” “would,” and “could.”
Forward-looking statements are based upon the current beliefs and expectations of management, and on information currently available to management. Our statements speak as of the date hereof, and we do not assume any obligation to update these statements or to update the reasons why actual results could differ from those contained in such statements in light of new information or future events. We caution you, therefore, against relying on any of these forward-looking statements. They are neither statements of historical fact nor guarantees or assurances of future performance. While there is no assurance that any list of risks and uncertainties or risk factors is complete, important factors that could cause actual results to differ materially from those in the forward-looking statements include the following, without limitation:
|
•
|
Negative economic conditions that adversely affect the general economy, housing prices, the job market, consumer confidence and spending habits which may affect, among other things, the level of nonperforming assets, charge-offs and provision expense;
|
|
•
|
The rate of growth in the economy and employment levels, as well as general business and economic conditions;
|
|
•
|
Our ability to implement our strategic plan, including the cost savings and efficiency components, and achieve our indicative performance targets;
|
|
•
|
Our ability to remedy regulatory deficiencies and meet supervisory requirements and expectations;
|
|
•
|
Liabilities and business restrictions resulting from litigation and regulatory investigations;
|
|
•
|
Our capital and liquidity requirements (including under regulatory capital standards, such as the U.S. Basel III capital rules) and our ability to generate capital internally or raise capital on favorable terms;
|
|
•
|
The effect of changes in interest rates on our net interest income, net interest margin and our mortgage originations, mortgage servicing rights and mortgages held for sale;
|
|
•
|
Changes in interest rates and market liquidity, as well as the magnitude of such changes, which may reduce interest margins, impact funding sources and affect the ability to originate and distribute financial products in the primary and secondary markets;
|
|
•
|
The effect of changes in the level of checking or savings account deposits on our funding costs and net interest margin;
|
|
•
|
Financial services reform and other current, pending or future legislation or regulation that could have a negative effect on our revenue and businesses, including the Dodd-Frank Act and other legislation and regulation relating to bank products and services;
|
|
•
|
A failure in or breach of our operational or security systems or infrastructure, or those of our third party vendors or other service providers, including as a result of cyber-attacks; and
|
|
•
|
Management’s ability to identify and manage these and other risks.
|
In addition to the above factors, we also caution that the amount and timing of any future common stock dividends or share repurchases will depend on our financial condition, earnings, cash needs, regulatory constraints, capital requirements (including requirements of our subsidiaries), and any other factors that our Board of Directors deems relevant in making such a determination. Therefore, there can be no assurance that we will pay any dividends to holders of our common stock, or as to the amount of any such dividends.
More information about factors that could cause actual results to differ materially from those described in the forward-looking statements can be found under “Risk Factors” in our Annual Report on Form 10-K for the year ended December 31, 2016.
6
CITIZENS FINANCIAL GROUP, INC.
MANAGEMENT’S DISCUSSION AND ANALYSIS
INTRODUCTION
Citizens Financial Group, Inc. is one of the nation’s oldest and largest financial institutions with
$151.4 billion
in assets as of
September 30, 2017
.
Our mission is to help our customers, colleagues and communities reach their potential. Headquartered in Providence, Rhode Island, we offer a broad range of retail and commercial banking products and services to individuals, small businesses, middle-market companies, large corporations and institutions. We help our customers reach their potential by listening to them and by understanding their needs in order to offer tailored advice, ideas and solutions. In Consumer Banking, we provide an integrated experience that includes mobile and online banking, a 24/7 customer contact center and the convenience of approximately 3,200 ATMs and approximately 1,200 branches in 11 states in the New England, Mid-Atlantic and Midwest regions. Consumer Banking products and services include a full range of banking, lending, savings, wealth management and small business offerings. In Commercial Banking, we offer corporate, institutional and not-for-profit clients a full range of wholesale banking products and services including lending and deposits, capital markets, treasury services, foreign exchange and interest rate products, and asset finance. More information is available at www.citizensbank.com.
The following MD&A is intended to assist readers in their analysis of the accompanying interim Consolidated Financial Statements and supplemental financial information. It should be read in conjunction with the interim Consolidated Financial Statements and Notes to the Consolidated Financial Statements in Item 1 of this Form 10-Q, as well as other information contained in this document and our 2016 Annual Report on Form 10-K.
7
CITIZENS FINANCIAL GROUP, INC.
MANAGEMENT’S DISCUSSION AND ANALYSIS
FINANCIAL PERFORMANCE
Third Quarter 2017 compared with Third Quarter 2016 - Key Highlights
|
•
|
Third quarter 2017 net income of
$348 million
increased
17%
from
$297 million
in third quarter 2016, with earnings per diluted common share of
$0.68
, up
21%
from
$0.56
per diluted common share. Third quarter 2017 ROTCE of
10.1%
improved from
8.6%
.*
|
|
◦
|
On an Adjusted basis,* third quarter 2017 net income increased 25% and earnings per diluted common share increased 31% compared to third quarter 2016. Adjusted results exclude the impact of a third quarter 2016 net $19 million after-tax benefit from the sale of a troubled debt restructuring portfolio (“TDR Transaction”), partially offset by other notable items largely associated with our efficiency and balance sheet optimization initiatives.
|
|
•
|
Third quarter 2017 results reflect an
18%
increase in net income available to common stockholders, led by revenue growth of
5%
, with a
12%
increase in net interest income given
5%
average loan growth and a 21 basis point increase in net interest margin.
|
|
◦
|
On an Adjusted basis,* net income available to common stockholders increased 26%.
|
|
•
|
Continued strong focus on top-line growth and expense management helped dri
ve positive operating leverage of
6%
, a 3.5% improvement in the efficiency ratio and a 1.6% improvement in ROTCE.*
|
|
◦
|
On an Adjusted basis,* operating leverage was
7%
with an efficiency ratio improvement of 3.9% and a ROTCE improvement of 2.1%.
|
|
•
|
Fully diluted average common shares outstanding decreased by
19 million
shares.
|
Nine Months Ended 2017 compared with Nine Months Ended 2016 - Key Highlights
|
•
|
For the first nine months of 2017, net income of
$986 million
, increased
29%
from
$763 million
in the first nine months of 2016, with earnings per diluted common share of
$1.92
, up
35%
from
$1.42
per diluted common share in the first nine months of 2016. Our first nine months of 2017 results include a $23 million benefit, or $0.05 per diluted common share, related to the settlement of certain state tax matters. For the first nine months of 2017, ROTCE of
9.8%
improved from
7.5%
in the first nine months of 2016.*
|
|
◦
|
On an Underlying basis,* excluding a $23 million benefit related to the settlement of certain state tax matters, net income of
$963 million
was up 26%, earnings per diluted common share of
$1.87
was up 32%, and
ROTCE of
9.6%
improved by
206
basis points.
|
|
◦
|
On an Adjusted basis,* excluding the third quarter 2016 net $19 million after-tax benefit related to the TDR Transaction, partially offset by other notable items, net income of
$986 million
was up 33%, earnings per diluted common share of
$1.92
was up 38%, and ROTCE of
9.8%
improved by 248 basis points.
|
|
•
|
Results for the first nine months of 2017 reflected a
30%
increase in net income available to common stockholders, led by revenue growth of
9%
, as net interest income increased
12%
, given a
6%
average loan growth and a 15 basis point increase in net interest margin, as well as noninterest income growth of
1%
.
|
|
•
|
Results for the first nine months of 2017
included a $26 million pre-tax impact related to impairments on aircraft lease assets, which largely related to a non-core runoff portfolio, and reduced noninterest income by $11 million and increased noninterest expense by $15 million. The lease impairments, in addition to provision expense of $238 million, resulted in total credit-related costs of $264 million.*
|
|
•
|
Continued strong focus on top-line growth and expense management helped drive positive operating leverage of
6%
, a 3.4% improvement in the efficiency ratio from
64.4%
to
61.0%
, and a 2.3% improvement in ROTCE.*
|
|
◦
|
Before the impact of the lease impairments, Underlying* operating leverage was 7% and the efficiency ratio improved 3.9% from
64.4%
to
60.5%
.
|
|
◦
|
On an Adjusted basis,* the efficiency ratio improved from 64.5% to 61.0%.
|
|
•
|
For the first nine months of 2017, the tax rate reflected a 1.8% ben
efit driven by the settlement of certain state tax matters and investments in historic tax credits.
|
|
◦
|
On an Underlying basis,* the effective income tax rate decreased from 31.9% to 31.7%.
|
|
•
|
Fully diluted average common shares outstanding decreased by
20 million
shares.
|
8
CITIZENS FINANCIAL GROUP, INC.
MANAGEMENT’S DISCUSSION AND ANALYSIS
Summary of Notable and Underlying Items
(1)
|
Three Months Ended September 30, 2016
|
|||||||||||||||||||
|
(in millions)
|
Noninterest income
|
Noninterest expense
|
Credit-related costs
|
Income tax expense
|
Net Income
|
||||||||||||||
|
Reported results (GAAP)
|
|
$435
|
|
|
$867
|
|
|
$86
|
|
|
$130
|
|
|
$297
|
|
||||
|
Less: notable items
|
|||||||||||||||||||
|
Gain on mortgage/home equity TDR transaction
|
72
|
|
—
|
|
—
|
|
27
|
|
45
|
|
|||||||||
|
Home equity operational items
|
—
|
|
8
|
|
—
|
|
(3
|
)
|
(5
|
)
|
|||||||||
|
Asset Finance repositioning
|
(5
|
)
|
11
|
|
—
|
|
(6
|
)
|
(10
|
)
|
|||||||||
|
TOP III efficiency initiatives
|
—
|
|
17
|
|
—
|
|
(6
|
)
|
(11
|
)
|
|||||||||
|
Total notable items
|
|
$67
|
|
|
$36
|
|
|
$—
|
|
|
$12
|
|
|
$19
|
|
||||
|
Adjusted results (Non-GAAP)
|
|
$368
|
|
|
$831
|
|
|
$86
|
|
|
$118
|
|
|
$278
|
|
||||
|
Nine Months Ended September 30, 2017
|
|||||||||||||||||||
|
(in millions)
|
Noninterest income
|
Noninterest expense
|
Credit-related costs
|
Income tax expense
|
Net Income
|
||||||||||||||
|
Reported results (GAAP)
|
|
$1,130
|
|
|
$2,576
|
|
|
$238
|
|
|
$423
|
|
|
$986
|
|
||||
|
Less: Underlying items
|
|||||||||||||||||||
|
Lease impairment credit-related costs
|
(11
|
)
|
15
|
|
(26
|
)
|
—
|
|
—
|
|
|||||||||
|
Settlement of certain tax matters
|
—
|
|
—
|
|
—
|
|
(23
|
)
|
23
|
|
|||||||||
|
Total Underlying items
|
|
($11
|
)
|
|
$15
|
|
|
($26
|
)
|
|
($23
|
)
|
|
$23
|
|
||||
|
Underlying results (Non-GAAP)
|
|
$1,141
|
|
|
$2,561
|
|
|
$264
|
|
|
$446
|
|
|
$963
|
|
||||
|
Nine Months Ended September 30, 2016
|
|||||||||||||||||||
|
(in millions)
|
Noninterest income
|
Noninterest expense
|
Credit-related costs
|
Income tax expense
|
Net Income
|
||||||||||||||
|
Reported results (GAAP)
|
|
$1,120
|
|
|
$2,505
|
|
|
$267
|
|
|
$357
|
|
|
$763
|
|
||||
|
Less: notable items
|
|||||||||||||||||||
|
Gain on mortgage/home equity TDR transaction
|
72
|
|
—
|
|
—
|
|
27
|
|
45
|
|
|||||||||
|
Home equity operational items
|
—
|
|
8
|
|
—
|
|
(3
|
)
|
(5
|
)
|
|||||||||
|
Asset Finance repositioning
|
(5
|
)
|
11
|
|
—
|
|
(6
|
)
|
(10
|
)
|
|||||||||
|
TOP III efficiency initiatives
|
—
|
|
17
|
|
—
|
|
(6
|
)
|
(11
|
)
|
|||||||||
|
Total notable items
|
|
$67
|
|
|
$36
|
|
|
$—
|
|
|
$12
|
|
|
$19
|
|
||||
|
Adjusted results (Non-GAAP)
|
|
$1,053
|
|
|
$2,469
|
|
|
$267
|
|
|
$345
|
|
|
$744
|
|
||||
(1)
There were no notable or Underlying items for the three months ended September 2017.
|
*
|
“Adjusted” results exclude restructuring charges, special items and/or notable items; “Underlying” results, as applicable, exclude a first quarter 2017 $23 million benefit related to the settlement of certain state tax matters and reclassify second quarter 2017 results for the pre-tax impact of $26 million of lease asset impairments to reflect their credit-related impact. Where there is a reference to “Adjusted” and/or “Underlying” results in a paragraph, all measures that follow these references are on the same basis when applicable. For more information on the computation of key performance metrics and non-GAAP financial measures, see “—Principal Components of Operations and Key Performance Metrics Used by Management — Key Performance Metrics and Non-GAAP Financial Measures.”
|
9
CITIZENS FINANCIAL GROUP, INC.
MANAGEMENT’S DISCUSSION AND ANALYSIS
SELECTED CONSOLIDATED FINANCIAL DATA
The summary Consolidated Operating Data for the three and nine months ended
September 30, 2017
and 2016 and the summary Consolidated Balance Sheet data as of
September 30, 2017
and December 31, 2016 are derived from our unaudited interim Consolidated Financial Statements included in Part I, Item 1 — Financial Statements of this report. Our historical results are not necessarily indicative of the results expected for any future period.
Our unaudited interim Consolidated Financial Statements have been prepared on the same basis as the audited Consolidated Financial Statements and include all adjustments, consisting of normal recurring adjustments, necessary for a fair presentation of the information set forth herein. Our operating results for the three and nine months ended
September 30, 2017
are not necessarily indicative of those to be expected for the year ending December 31, 2017 or for any future period. The following selected consolidated financial data should be read in conjunction with our unaudited interim Consolidated Financial Statements and the Notes thereto.
|
Three Months Ended September 30,
|
Nine Months Ended September 30,
|
||||||||||||||
|
(dollars in millions, except per-share amounts)
|
2017
|
|
2016
|
|
2017
|
2016
|
|||||||||
|
OPERATING DATA:
|
|||||||||||||||
|
Net interest income
|
|
$1,062
|
|
|
$945
|
|
|
$3,093
|
|
|
$2,772
|
|
|||
|
Noninterest income
|
381
|
|
435
|
|
1,130
|
|
1,120
|
|
|||||||
|
Total revenue
|
1,443
|
|
1,380
|
|
4,223
|
|
3,892
|
|
|||||||
|
Provision for credit losses
|
72
|
|
86
|
|
238
|
|
267
|
|
|||||||
|
Noninterest expense
|
858
|
|
867
|
|
2,576
|
|
2,505
|
|
|||||||
|
Income before income tax expense
|
513
|
|
427
|
|
1,409
|
|
1,120
|
|
|||||||
|
Income tax expense
|
165
|
|
130
|
|
423
|
|
357
|
|
|||||||
|
Net income
|
|
$348
|
|
|
$297
|
|
|
$986
|
|
|
$763
|
|
|||
|
Net income available to common stockholders
|
|
$341
|
|
|
$290
|
|
|
$972
|
|
|
$749
|
|
|||
|
Net income per common share - basic
|
|
$0.68
|
|
|
$0.56
|
|
|
$1.92
|
|
|
$1.43
|
|
|||
|
Net income per common share - diluted
|
|
$0.68
|
|
|
$0.56
|
|
|
$1.92
|
|
|
$1.42
|
|
|||
|
OTHER OPERATING DATA:
|
|||||||||||||||
|
Return on average common equity
(1)
|
6.87
|
%
|
5.82
|
%
|
6.63
|
%
|
5.08
|
%
|
|||||||
|
Return on average tangible common equity
(1)
|
10.13
|
|
8.58
|
|
9.80
|
|
7.51
|
|
|||||||
|
Return on average total assets
(1)
|
0.92
|
|
0.82
|
|
0.88
|
|
0.72
|
|
|||||||
|
Return on average total tangible assets
(1)
|
0.96
|
|
0.86
|
|
0.92
|
|
0.75
|
|
|||||||
|
Efficiency ratio
(1)
|
59.41
|
|
62.88
|
|
60.99
|
|
64.36
|
|
|||||||
|
Operating leverage
(1) (2)
|
5.61
|
|
5.49
|
|
5.67
|
|
6.06
|
|
|||||||
|
Net interest margin
(1)
|
3.05
|
|
2.84
|
|
3.00
|
|
2.85
|
|
|||||||
|
Effective income tax rate
|
32.18
|
|
30.46
|
|
30.04
|
|
31.87
|
|
|||||||
(1)
See “—Principal Components of Operations and Key Performance Metrics Used By Management” for definitions of our key performance metrics.
(2)
“Operating leverage” represents the period-over-period percent change in total revenue, less the period-over-period percent change in noninterest expense. For the purpose of the 2016 calculation, total revenue was $1.2 billion and $3.6 billion for the three and nine months ended September 30, 2015, respectively, and noninterest expense was $798 million and $2.4 billion for the three and nine months ended September 30, 2015, respectively.
10
CITIZENS FINANCIAL GROUP, INC.
MANAGEMENT’S DISCUSSION AND ANALYSIS
|
(dollars in millions)
|
September 30,
2017 |
December 31,
2016 |
|||||
|
BALANCE SHEET DATA:
|
|||||||
|
Total assets
|
|
$151,356
|
|
|
$149,520
|
|
|
|
Loans held for sale, at fair value
|
500
|
|
583
|
|
|||
|
Other loans held for sale
|
724
|
|
42
|
|
|||
|
Loans and leases
|
110,151
|
|
107,669
|
|
|||
|
Allowance for loan and lease losses
|
(1,224
|
)
|
(1,236
|
)
|
|||
|
Total securities
|
25,742
|
|
25,610
|
|
|||
|
Goodwill
|
6,887
|
|
6,876
|
|
|||
|
Total liabilities
|
131,247
|
|
129,773
|
|
|||
|
Total deposits
|
113,235
|
|
109,804
|
|
|||
|
Federal funds purchased and securities sold under agreements to repurchase
|
453
|
|
1,148
|
|
|||
|
Other short-term borrowed funds
|
1,505
|
|
3,211
|
|
|||
|
Long-term borrowed funds
|
13,400
|
|
12,790
|
|
|||
|
Total stockholders’ equity
|
20,109
|
|
19,747
|
|
|||
|
OTHER BALANCE SHEET DATA:
|
|||||||
|
Asset Quality Ratios:
|
|||||||
|
Allowance for loan and lease losses as a percentage of total loans and leases
|
1.11
|
%
|
1.15
|
%
|
|||
|
Allowance for loan and lease losses as a percentage of nonperforming loans and leases
|
131.35
|
|
118.32
|
|
|||
|
Nonperforming loans and leases as a percentage of total loans and leases
|
0.85
|
|
0.97
|
|
|||
|
Capital Ratios:
(3)
|
|||||||
|
CET1 capital ratio
(4)
|
11.1
|
%
|
11.2
|
%
|
|||
|
Tier 1 capital ratio
(5)
|
11.3
|
|
11.4
|
|
|||
|
Total capital ratio
(6)
|
13.8
|
|
14.0
|
|
|||
|
Tier 1 leverage ratio
(7)
|
9.9
|
|
9.9
|
|
|||
(3)
U.S. Basel III transitional rules for institutions applying the Standardized approach to calculating risk-weighted assets became effective January 1, 2015. The capital ratios and associated components as of
September 30, 2017
and
December 31, 2016
are prepared using the U.S. Basel III Standardized transitional approach.
(4)
“Common equity tier 1 capital ratio” represents CET1 capital divided by total risk-weighted assets as defined under U.S. Basel III Standardized approach.
(5)
“Tier 1 capital ratio” is tier 1 capital, which includes CET1 capital plus non-cumulative perpetual preferred equity that qualifies as additional tier 1 capital,
divided by total risk-weighted assets as defined under U.S. Basel III Standardized approach.
(6)
“Total capital ratio” is total capital divided by total risk-weighted assets as defined under U.S. Basel III Standardized approach.
(7)
“Tier 1 leverage ratio” is tier 1 capital divided by quarterly average total assets as defined under U.S. Basel III Standardized approach.
11
CITIZENS FINANCIAL GROUP, INC.
MANAGEMENT’S DISCUSSION AND ANALYSIS
PRINCIPAL COMPONENTS OF OPERATIONS AND KEY PERFORMANCE METRICS USED BY MANAGEMENT
As a banking institution, we manage and evaluate various aspects of our results of operations and our financial condition. We evaluate the levels and trends of the line items included in our balance sheet and statement of operations, as well as various financial ratios that are commonly used in our industry. We analyze these ratios and financial trends against our own historical performance, our budgeted performance and the financial condition and performance of comparable banking institutions in our region and nationally.
The primary line items we use in our key performance metrics to manage and evaluate our statement of operations include net interest income, noninterest income, total revenue, provision for credit losses, noninterest expense, net income and net income available to common stockholders. The primary line items we use in our key performance metrics to manage and evaluate our balance sheet data include loans and leases, securities, allowance for credit losses, deposits, borrowed funds and derivatives.
In first quarter 2017, certain prior period noninterest income amounts reported in the Consolidated Statement of Operations were reclassified to enhance transparency and provide additional granularity, particularly with regard to fee income related to customer activity. Additionally, student loans were renamed “education” loans to more closely align with the full range of services offered to borrowers, from loan origination to refinancing. These changes had no effect on net income, total comprehensive income, total assets or total stockholders’ equity as previously reported.
Key performance metrics and non-GAAP financial measures
We consider various measures when evaluating our performance and making day-to-day operating decisions, as well as evaluating capital utilization and adequacy, including:
|
•
|
Return on average common equity, which we define as annualized net income available to common stockholders divided by average common equity;
|
|
•
|
Return on average tangible common equity, which we define as annualized net income available to common stockholders divided by average common equity excluding average goodwill (net of related deferred tax liability) and average other intangibles;
|
|
•
|
Return on average total assets, which we define as annualized net income divided by average total assets;
|
|
•
|
Return on average total tangible assets, which we define as annualized net income divided by average total assets excluding average goodwill (net of related deferred tax liability) and average other intangibles;
|
|
•
|
Efficiency ratio, which we define as the ratio of our total noninterest expense to the sum of net interest income and total noninterest income. We measure our efficiency ratio to evaluate the efficiency of our operations as it helps us monitor how costs are changing compared to our income. A decrease in our efficiency ratio represents improvement;
|
|
•
|
Operating leverage, which we define as the percent change in total revenue, less the percent change in noninterest expense;
|
|
•
|
Net interest margin, which we calculate by dividing annualized net interest income for the period by average total interest-earning assets, is a key measure that we use to evaluate our net interest income; and
|
|
•
|
Common equity tier 1 capital ratio (U.S. Basel III Standardized fully phased-in basis), represents CET1 capital divided by total risk-weighted assets as defined under U.S Basel III Standardized approach.
|
“Adjusted” or “Underlying” results, which are non-GAAP measures, exclude certain items, as applicable, that may occur in a reporting period which management does not consider indicative of on-going financial performance.
We believe these non-GAAP measures provide useful information to investors because these are among the measures used by our management team to evaluate our operating performance and make day-to-day operating decisions. In addition, we believe our “Adjusted” or “Underlying” results in any period reflect our operational performance in that period and, accordingly, it is useful to consider our GAAP results and our “Adjusted” or “Underlying” results together. We believe this presentation also increases comparability of period-to-period results.
Other companies may use similarly titled non-GAAP financial measures that are calculated differently from the way we calculate such measures. Accordingly, our non-GAAP financial measures may not be comparable to similar measures used by other companies. We caution investors not to place undue reliance on such non-GAAP measures, but instead to consider them with the most directly comparable GAAP measure. Non-GAAP financial measures have
12
CITIZENS FINANCIAL GROUP, INC.
MANAGEMENT’S DISCUSSION AND ANALYSIS
limitations as analytical tools, and should not be considered in isolation, or as a substitute for our results as reported under GAAP.
Non-GAAP measures are denoted throughout “Management's Discussion and Analysis of Financial Condition and Results of Operations” by the use of the term “Adjusted” or “Underlying” and/or are followed by an asterisk (*).
The following table presents computations of key performance metrics used throughout “Management's Discussion and Analysis of Financial Condition and Results of Operations”:
|
|
|
As of and for the Three Months Ended September 30,
|
As of and for the Nine Months Ended September 30,
|
|||||||||||||
|
(in millions, except ratio data)
|
Ref.
|
2017
|
|
2016
|
|
2017
|
|
2016
|
|
|||||||
|
Total revenue (GAAP)
|
A
|
|
$1,443
|
|
|
$1,380
|
|
|
$4,223
|
|
|
$3,892
|
|
|||
|
Noninterest expense (GAAP)
|
B
|
858
|
|
867
|
|
2,576
|
|
2,505
|
|
|||||||
|
Net income (GAAP)
|
C
|
348
|
|
297
|
|
986
|
|
763
|
|
|||||||
|
Net income available to common stockholders (GAAP)
|
D
|
341
|
|
290
|
|
972
|
|
749
|
|
|||||||
|
Return on average common equity:
|
||||||||||||||||
|
Average common equity (GAAP)
|
E
|
|
$19,728
|
|
|
$19,810
|
|
|
$19,617
|
|
|
$19,715
|
|
|||
|
Return on average common equity
|
D/E
|
6.87
|
%
|
5.82
|
%
|
6.63
|
%
|
5.08
|
%
|
|||||||
|
Return on average tangible common equity:
|
||||||||||||||||
|
Average common equity (GAAP)
|
E
|
|
$19,728
|
|
|
$19,810
|
|
|
$19,617
|
|
|
$19,715
|
|
|||
|
Less: Average goodwill (GAAP)
|
6,887
|
|
6,876
|
|
6,882
|
|
6,876
|
|
||||||||
|
Less: Average other intangibles (GAAP)
|
2
|
|
1
|
|
2
|
|
2
|
|
||||||||
|
Add: Average deferred tax liabilities related to goodwill (GAAP)
|
537
|
|
509
|
|
535
|
|
495
|
|
||||||||
|
Average tangible common equity
|
F
|
|
$13,376
|
|
|
$13,442
|
|
|
$13,268
|
|
|
$13,332
|
|
|||
|
Return on average tangible common equity
|
D/F
|
10.13
|
%
|
8.58
|
%
|
9.80
|
%
|
7.51
|
%
|
|||||||
|
Return on average total assets:
|
||||||||||||||||
|
Average total assets (GAAP)
|
G
|
|
$150,012
|
|
|
$144,399
|
|
|
$149,563
|
|
|
$141,795
|
|
|||
|
Return on average total assets
|
C/G
|
0.92
|
%
|
0.82
|
%
|
0.88
|
%
|
0.72
|
%
|
|||||||
|
Return on average total tangible assets:
|
||||||||||||||||
|
Average total assets (GAAP)
|
G
|
|
$150,012
|
|
|
$144,399
|
|
|
$149,563
|
|
|
$141,795
|
|
|||
|
Less: Average goodwill (GAAP)
|
6,887
|
|
6,876
|
|
6,882
|
|
6,876
|
|
||||||||
|
Less: Average other intangibles (GAAP)
|
2
|
|
1
|
|
2
|
|
2
|
|
||||||||
|
Add: Average deferred tax liabilities related to goodwill (GAAP)
|
537
|
|
509
|
|
535
|
|
495
|
|
||||||||
|
Average tangible assets
|
H
|
|
$143,660
|
|
|
$138,031
|
|
|
$143,214
|
|
|
$135,412
|
|
|||
|
Return on average total tangible assets
|
C/H
|
0.96
|
%
|
0.86
|
%
|
0.92
|
%
|
0.75
|
%
|
|||||||
|
Efficiency ratio:
|
||||||||||||||||
|
Efficiency ratio
|
B/A
|
59.41
|
%
|
62.88
|
%
|
60.99
|
%
|
64.36
|
%
|
|||||||
|
Operating leverage:
|
||||||||||||||||
|
Increase in total revenue
|
4.57
|
%
|
14.14
|
%
|
8.50
|
%
|
8.35
|
%
|
||||||||
|
(Decrease) increase in noninterest expense
|
(1.04
|
)
|
8.65
|
|
2.83
|
|
2.29
|
|
||||||||
|
Operating leverage
|
5.61
|
%
|
5.49
|
%
|
5.67
|
%
|
6.06
|
%
|
||||||||
13
CITIZENS FINANCIAL GROUP, INC.
MANAGEMENT’S DISCUSSION AND ANALYSIS
|
|
|
As of and for the Three Months Ended September 30,
|
||||||||||||||||||||||||
|
|
|
2017
|
2016
|
|||||||||||||||||||||||
|
(in millions, except ratio data)
|
Ref.
|
Consumer
Banking |
Commercial
Banking |
Other
|
Consolidated
|
Consumer
Banking |
Commercial
Banking |
Other
|
Consolidated
|
|||||||||||||||||
|
Net income available to common stockholders:
|
||||||||||||||||||||||||||
|
Net income (GAAP)
|
I
|
|
$122
|
|
|
$201
|
|
|
$25
|
|
|
$348
|
|
|
$92
|
|
|
$162
|
|
|
$43
|
|
|
$297
|
|
|
|
Less: Preferred stock dividends
|
—
|
|
—
|
|
7
|
|
7
|
|
—
|
|
—
|
|
7
|
|
7
|
|
||||||||||
|
Net income available to common stockholders
|
J
|
|
$122
|
|
|
$201
|
|
|
$18
|
|
|
$341
|
|
|
$92
|
|
|
$162
|
|
|
$36
|
|
|
$290
|
|
|
|
Efficiency ratio:
|
|
|
|
|
|
|
|
|
|
|
||||||||||||||||
|
Total revenue (GAAP)
|
K
|
|
$901
|
|
|
$490
|
|
|
$52
|
|
|
$1,443
|
|
|
$850
|
|
|
$450
|
|
|
$80
|
|
|
$1,380
|
|
|
|
Noninterest expense (GAAP)
|
L
|
648
|
|
195
|
|
15
|
|
858
|
|
650
|
|
181
|
|
36
|
|
867
|
|
|||||||||
|
Efficiency ratio
|
L/K
|
71.88
|
%
|
39.39
|
%
|
NM
|
|
59.41
|
%
|
76.46
|
%
|
40.21
|
%
|
NM
|
|
62.88
|
%
|
|||||||||
|
Return on average total tangible assets:
|
|
|
|
|
|
|
||||||||||||||||||||
|
Average total assets (GAAP)
|
|
$60,012
|
|
|
$49,833
|
|
|
$40,167
|
|
|
$150,012
|
|
|
$56,689
|
|
|
$47,902
|
|
|
$39,808
|
|
|
$144,399
|
|
||
|
Less: Average goodwill (GAAP)
|
|
—
|
|
—
|
|
6,887
|
|
6,887
|
|
—
|
|
—
|
|
6,876
|
|
6,876
|
|
|||||||||
|
Less: Average other intangibles (GAAP)
|
|
—
|
|
—
|
|
2
|
|
2
|
|
—
|
|
—
|
|
1
|
|
1
|
|
|||||||||
|
Add: Average deferred tax liabilities related to goodwill (GAAP)
|
|
—
|
|
—
|
|
537
|
|
537
|
|
—
|
|
—
|
|
509
|
|
509
|
|
|||||||||
|
Average total tangible assets
|
M
|
|
$60,012
|
|
|
$49,833
|
|
|
$33,815
|
|
|
$143,660
|
|
|
$56,689
|
|
|
$47,902
|
|
|
$33,440
|
|
|
$138,031
|
|
|
|
Return on average total tangible assets
|
I/M
|
0.81
|
%
|
1.60
|
%
|
NM
|
|
0.96
|
%
|
0.64
|
%
|
1.35
|
%
|
NM
|
|
0.86
|
%
|
|||||||||
|
Return on average tangible common equity:
|
|
|
|
|
|
|
|
|
|
|
|
|
||||||||||||||
|
Average common equity (GAAP)
(1)
|
|
$5,565
|
|
|
$5,685
|
|
|
$8,478
|
|
|
$19,728
|
|
|
$5,190
|
|
|
$5,172
|
|
|
$9,448
|
|
|
$19,810
|
|
||
|
Less: Average goodwill (GAAP)
|
—
|
|
—
|
|
6,887
|
|
6,887
|
|
—
|
|
—
|
|
6,876
|
|
6,876
|
|
||||||||||
|
Less: Average other intangibles (GAAP)
|
|
—
|
|
—
|
|
2
|
|
2
|
|
—
|
|
—
|
|
1
|
|
1
|
|
|||||||||
|
Add: Average deferred tax liabilities related to goodwill (GAAP)
|
|
—
|
|
—
|
|
537
|
|
537
|
|
—
|
|
—
|
|
509
|
|
509
|
|
|||||||||
|
Average tangible common equity
(1)
|
N
|
|
$5,565
|
|
|
$5,685
|
|
|
$2,126
|
|
|
$13,376
|
|
|
$5,190
|
|
|
$5,172
|
|
|
$3,080
|
|
|
$13,442
|
|
|
|
Return on average tangible common equity
(1)
|
J/N
|
8.72
|
%
|
14.06
|
%
|
NM
|
|
10.13
|
%
|
7.04
|
%
|
12.50
|
%
|
NM
|
|
8.58
|
%
|
|||||||||
(1)
Operating segments are allocated capital on a risk-adjusted basis considering economic and regulatory capital requirements. We approximate that regulatory
capital is equivalent to a sustainable target level for common equity tier 1 and then allocate that approximation to the segments based on economic capital.
14
CITIZENS FINANCIAL GROUP, INC.
MANAGEMENT’S DISCUSSION AND ANALYSIS
|
|
|
As of and for the Nine Months Ended September 30,
|
||||||||||||||||||||||||
|
|
|
2017
|
2016
|
|||||||||||||||||||||||
|
(in millions, except ratio data)
|
Ref.
|
Consumer
Banking |
Commercial
Banking |
Other
|
Consolidated
|
Consumer
Banking |
Commercial
Banking |
Other
|
Consolidated
|
|||||||||||||||||
|
Net income available to common stockholders:
|
||||||||||||||||||||||||||
|
Net income (GAAP)
|
I
|
|
$335
|
|
|
$568
|
|
|
$83
|
|
|
$986
|
|
|
$253
|
|
|
$459
|
|
|
$51
|
|
|
$763
|
|
|
|
Less: Preferred stock dividends
|
—
|
|
—
|
|
14
|
|
14
|
|
—
|
|
—
|
|
14
|
|
14
|
|
||||||||||
|
Net income available to common stockholders
|
J
|
|
$335
|
|
|
$568
|
|
|
$69
|
|
|
$972
|
|
|
$253
|
|
|
$459
|
|
|
$37
|
|
|
$749
|
|
|
|
Efficiency ratio:
|
|
|
|
|
|
|
|
|
|
|
||||||||||||||||
|
Total revenue (GAAP)
|
K
|
|
$2,645
|
|
|
$1,444
|
|
|
$134
|
|
|
$4,223
|
|
|
$2,460
|
|
|
$1,285
|
|
|
$147
|
|
|
$3,892
|
|
|
|
Noninterest expense (GAAP)
|
L
|
1,939
|
|
577
|
|
60
|
|
2,576
|
|
1,898
|
|
554
|
|
53
|
|
2,505
|
|
|||||||||
|
Efficiency ratio
|
L/K
|
73.28
|
%
|
39.89
|
%
|
NM
|
|
60.99
|
%
|
77.15
|
%
|
43.15
|
%
|
NM
|
|
64.36
|
%
|
|||||||||
|
Return on average total tangible assets:
|
|
|
|
|
|
|
|
|
|
|||||||||||||||||
|
Average total assets (GAAP)
|
|
$59,310
|
|
|
$49,604
|
|
|
$40,649
|
|
|
$149,563
|
|
|
$55,825
|
|
|
$46,869
|
|
|
$39,101
|
|
|
$141,795
|
|
||
|
Less: Average goodwill (GAAP)
|
|
—
|
|
—
|
|
6,882
|
|
6,882
|
|
—
|
|
—
|
|
6,876
|
|
6,876
|
|
|||||||||
|
Less: Average other intangibles (GAAP)
|
|
—
|
|
—
|
|
2
|
|
2
|
|
—
|
|
—
|
|
2
|
|
2
|
|
|||||||||
|
Add: Average deferred tax liabilities related to goodwill (GAAP)
|
|
—
|
|
—
|
|
535
|
|
535
|
|
—
|
|
—
|
|
495
|
|
495
|
|
|||||||||
|
Average total tangible assets
|
M
|
|
$59,310
|
|
|
$49,604
|
|
|
$34,300
|
|
|
$143,214
|
|
|
$55,825
|
|
|
$46,869
|
|
|
$32,718
|
|
|
$135,412
|
|
|
|
Return on average total tangible assets
|
I/M
|
0.76
|
%
|
1.53
|
%
|
NM
|
|
0.92
|
%
|
0.60
|
%
|
1.31
|
%
|
NM
|
|
0.75
|
%
|
|||||||||
|
Return on average tangible common equity:
|
|
|
|
|
|
|
|
|
|
|
|
|
|
|
|
|||||||||||
|
Average common equity (GAAP)
(1)
|
|
$5,515
|
|
|
$5,611
|
|
|
$8,491
|
|
|
$19,617
|
|
|
$5,130
|
|
|
$5,001
|
|
|
$9,584
|
|
|
$19,715
|
|
||
|
Less: Average goodwill (GAAP)
|
—
|
|
—
|
|
6,882
|
|
6,882
|
|
—
|
|
—
|
|
6,876
|
|
6,876
|
|
||||||||||
|
Less: Average other intangibles (GAAP)
|
|
—
|
|
—
|
|
2
|
|
2
|
|
—
|
|
—
|
|
2
|
|
2
|
|
|||||||||
|
Add: Average deferred tax liabilities related to goodwill (GAAP)
|
|
—
|
|
—
|
|
535
|
|
535
|
|
—
|
|
—
|
|
495
|
|
495
|
|
|||||||||
|
Average tangible common equity
(1)
|
N
|
|
$5,515
|
|
|
$5,611
|
|
|
$2,142
|
|
|
$13,268
|
|
|
$5,130
|
|
|
$5,001
|
|
|
$3,201
|
|
|
$13,332
|
|
|
|
Return on average tangible common equity
(1)
|
J/N
|
8.13
|
%
|
13.54
|
%
|
NM
|
|
9.80
|
%
|
6.58
|
%
|
12.27
|
%
|
NM
|
|
7.51
|
%
|
|||||||||
(1)
Operating segments are allocated capital on a risk-adjusted basis considering economic and regulatory capital requirements. We approximate that regulatory
capital is equivalent to a sustainable target level for common equity tier 1 and then allocate that approximation to the segments based on economic capital.
15
CITIZENS FINANCIAL GROUP, INC.
MANAGEMENT’S DISCUSSION AND ANALYSIS
The following table presents computations of non-GAAP financial measures representing our “Adjusted” results used throughout “Management's Discussion and Analysis of Financial Condition and Results of Operations”:
|
|
|
As of and for the Three Months Ended September 30,
|
As of and for the Nine Months Ended September 30,
|
|||||||||||||
|
(in millions, except share, per-share and ratio data)
|
Ref.
|
2017
|
|
2016
|
|
2017
|
|
2016
|
|
|||||||
|
Noninterest income, Adjusted:
|
||||||||||||||||
|
Noninterest income (GAAP)
|
|
$381
|
|
|
$435
|
|
|
$1,130
|
|
|
$1,120
|
|
||||
|
Less: notable items
|
||||||||||||||||
|
Gain on mortgage/home equity TDR transaction
|
—
|
|
72
|
|
—
|
|
72
|
|
||||||||
|
Home equity operational items
|
—
|
|
—
|
|
—
|
|
—
|
|
||||||||
|
Asset Finance repositioning
|
—
|
|
(5
|
)
|
—
|
|
(5
|
)
|
||||||||
|
TOP III efficiency initiatives
|
—
|
|
—
|
|
—
|
|
—
|
|
||||||||
|
Noninterest income, Adjusted (non-GAAP)
|
|
$381
|
|
|
$368
|
|
|
$1,130
|
|
|
$1,053
|
|
||||
|
Total revenue, Adjusted:
|
||||||||||||||||
|
Total revenue (GAAP)
|
A
|
|
$1,443
|
|
|
$1,380
|
|
|
$4,223
|
|
|
$3,892
|
|
|||
|
Less: notable items
|
||||||||||||||||
|
Gain on mortgage/home equity TDR transaction
|
—
|
|
72
|
|
—
|
|
72
|
|
||||||||
|
Home equity operational items
|
—
|
|
—
|
|
—
|
|
—
|
|
||||||||
|
Asset Finance repositioning
|
—
|
|
(5
|
)
|
—
|
|
(5
|
)
|
||||||||
|
TOP III efficiency initiatives
|
—
|
|
—
|
|
—
|
|
—
|
|
||||||||
|
Total revenue, Adjusted (non-GAAP)
|
O
|
|
$1,443
|
|
|
$1,313
|
|
|
$4,223
|
|
|
$3,825
|
|
|||
|
Noninterest expense, Adjusted:
|
||||||||||||||||
|
Noninterest expense (GAAP)
|
B
|
|
$858
|
|
|
$867
|
|
|
$2,576
|
|
|
$2,505
|
|
|||
|
Less: notable items
|
||||||||||||||||
|
Gain on mortgage/home equity TDR transaction
|
—
|
|
—
|
|
—
|
|
—
|
|
||||||||
|
Home equity operational items
|
—
|
|
8
|
|
—
|
|
8
|
|
||||||||
|
Asset Finance repositioning
|
—
|
|
11
|
|
—
|
|
11
|
|
||||||||
|
TOP III efficiency initiatives
|
—
|
|
17
|
|
—
|
|
17
|
|
||||||||
|
Noninterest expense, Adjusted (non-GAAP)
|
P
|
|
$858
|
|
|
$831
|
|
|
$2,576
|
|
|
$2,469
|
|
|||
|
Pre-provision profit, Adjusted
|
||||||||||||||||
|
Total revenue, Adjusted (non-GAAP)
|
O
|
|
$1,443
|
|
|
$1,313
|
|
|
$4,223
|
|
|
$3,825
|
|
|||
|
Noninterest expense, Adjusted (non-GAAP)
|
P
|
858
|
|
831
|
|
2,576
|
|
2,469
|
|
|||||||
|
Pre-provision profit, Adjusted (non-GAAP)
|
|
$585
|
|
|
$482
|
|
|
$1,647
|
|
|
$1,356
|
|
||||
|
Income before income tax expense, Adjusted:
|
||||||||||||||||
|
Income before income tax expense (GAAP)
|
Q
|
|
$513
|
|
|
$427
|
|
|
$1,409
|
|
|
$1,120
|
|
|||
|
Less: notable items
|
||||||||||||||||
|
Gain on mortgage/home equity TDR transaction
|
—
|
|
72
|
|
—
|
|
72
|
|
||||||||
|
Home equity operational items
|
—
|
|
(8
|
)
|
—
|
|
(8
|
)
|
||||||||
|
Asset Finance repositioning
|
—
|
|
(16
|
)
|
—
|
|
(16
|
)
|
||||||||
|
TOP III efficiency initiatives
|
—
|
|
(17
|
)
|
—
|
|
(17
|
)
|
||||||||
|
Income before income tax expense, Adjusted (non-GAAP)
|
R
|
|
$513
|
|
|
$396
|
|
|
$1,409
|
|
|
$1,089
|
|
|||
16
CITIZENS FINANCIAL GROUP, INC.
MANAGEMENT’S DISCUSSION AND ANALYSIS
|
|
|
As of and for the Three Months Ended September 30,
|
As of and for the Nine Months Ended September 30,
|
|||||||||||||
|
(in millions, except share, per-share and ratio data)
|
Ref.
|
2017
|
|
2016
|
|
2017
|
|
2016
|
|
|||||||
|
Income tax expense and effective income tax rate, Adjusted:
|
||||||||||||||||
|
Income tax expense (GAAP)
|
S
|
|
$165
|
|
|
$130
|
|
|
$423
|
|
|
$357
|
|
|||
|
Less: Notable items
|
||||||||||||||||
|
Gain on mortgage/home equity TDR transaction
|
—
|
|
27
|
|
—
|
|
27
|
|
||||||||
|
Home equity operational items
|
—
|
|
(3
|
)
|
—
|
|
(3
|
)
|
||||||||
|
Asset Finance repositioning
|
—
|
|
(6
|
)
|
—
|
|
(6
|
)
|
||||||||
|
TOP III efficiency initiatives
|
—
|
|
(6
|
)
|
—
|
|
(6
|
)
|
||||||||
|
Income tax expense, Adjusted (non-GAAP)
|
T
|
|
$165
|
|
|
$118
|
|
|
$423
|
|
|
$345
|
|
|||
|
Effective income tax rate (GAAP)
|
S/Q
|
32.18
|
%
|
30.46
|
%
|
30.04
|
%
|
31.87
|
%
|
|||||||
|
Effective income tax rate, Adjusted (non-GAAP)
|
T/R
|
32.18
|
|
29.83
|
|
30.04
|
|
31.68
|
|
|||||||
|
Net income, Adjusted:
|
||||||||||||||||
|
Net income (GAAP)
|
C
|
|
$348
|
|
|
$297
|
|
|
$986
|
|
|
$763
|
|
|||
|
Add: Notable items, net of tax expense
|
||||||||||||||||
|
Gain on mortgage/home equity TDR transaction
|
—
|
|
(45
|
)
|
—
|
|
(45
|
)
|
||||||||
|
Home equity operational items
|
—
|
|
5
|
|
—
|
|
5
|
|
||||||||
|
Asset Finance repositioning
|
—
|
|
10
|
|
—
|
|
10
|
|
||||||||
|
TOP III efficiency initiatives
|
—
|
|
11
|
|
—
|
|
11
|
|
||||||||
|
Net income, Adjusted (non-GAAP)
|
U
|
|
$348
|
|
|
$278
|
|
|
$986
|
|
|
$744
|
|
|||
|
Net income available to common stockholders, Adjusted:
|
||||||||||||||||
|
Net income available to common stockholders (GAAP)
|
D
|
|
$341
|
|
|
$290
|
|
|
$972
|
|
|
$749
|
|
|||
|
Add: Notable items, net of tax expense
|
||||||||||||||||
|
Gain on mortgage/home equity TDR transaction
|
—
|
|
(45
|
)
|
—
|
|
(45
|
)
|
||||||||
|
Home equity operational items
|
—
|
|
5
|
|
—
|
|
5
|
|
||||||||
|
Asset Finance repositioning
|
—
|
|
10
|
|
—
|
|
10
|
|
||||||||
|
TOP III efficiency initiatives
|
—
|
|
11
|
|
—
|
|
11
|
|
||||||||
|
Net income available to common stockholders, Adjusted (non-GAAP)
|
V
|
|
$341
|
|
|
$271
|
|
|
$972
|
|
|
$730
|
|
|||
|
Return on average common equity and return on average common equity, Adjusted:
|
||||||||||||||||
|
Average common equity (GAAP)
|
E
|
|
$19,728
|
|
|
$19,810
|
|
|
$19,617
|
|
|
$19,715
|
|
|||
|
Return on average common equity
|
D/E
|
6.87
|
%
|
5.82
|
%
|
6.63
|
%
|
5.08
|
%
|
|||||||
|
Return on average common equity, Adjusted (non-GAAP)
|
V/E
|
6.87
|
|
5.44
|
|
6.63
|
|
4.95
|
|
|||||||
|
Return on average tangible common equity and return on average common equity, Adjusted:
|
|
|||||||||||||||
|
Average common equity (GAAP)
|
E
|
|
$19,728
|
|
|
$19,810
|
|
|
$19,617
|
|
|
$19,715
|
|
|||
|
Less: Average goodwill (GAAP)
|
6,887
|
|
6,876
|
|
6,882
|
|
6,876
|
|
||||||||
|
Less: Average other intangibles (GAAP)
|
2
|
|
1
|
|
2
|
|
2
|
|
||||||||
|
Add: Average deferred tax liabilities related to goodwill (GAAP)
|
537
|
|
509
|
|
535
|
|
495
|
|
||||||||
|
Average tangible common equity
|
F
|
|
$13,376
|
|
|
$13,442
|
|
|
$13,268
|
|
|
$13,332
|
|
|||
|
Return on average tangible common equity
|
D/F
|
10.13
|
%
|
8.58
|
%
|
9.80
|
%
|
7.51
|
%
|
|||||||
|
Return on average tangible common equity, Adjusted (non-GAAP)
|
V/F
|
10.13
|
|
8.02
|
|
9.80
|
|
7.32
|
|
|||||||
|
Return on average total assets and return on average total assets, Adjusted:
|
||||||||||||||||
|
Average total assets (GAAP)
|
G
|
|
$150,012
|
|
|
$144,399
|
|
|
$149,563
|
|
|
$141,795
|
|
|||
|
Return on average total assets
|
C/G
|
0.92
|
%
|
0.82
|
%
|
0.88
|
%
|
0.72
|
%
|
|||||||
|
Return on average total assets, Adjusted (non-GAAP)
|
U/G
|
0.92
|
|
0.77
|
|
0.88
|
|
0.70
|
|
|||||||
17
CITIZENS FINANCIAL GROUP, INC.
MANAGEMENT’S DISCUSSION AND ANALYSIS
|
|
|
As of and for the Three Months Ended September 30,
|
As of and for the Nine Months Ended September 30,
|
|||||||||||||
|
(in millions, except share, per-share and ratio data)
|
Ref.
|
2017
|
|
2016
|
|
2017
|
|
2016
|
|
|||||||
|
Return on average total tangible assets and return on average total tangible assets, Adjusted:
|
|
|||||||||||||||
|
Average total assets (GAAP)
|
G
|
|
$150,012
|
|
|
$144,399
|
|
|
$149,563
|
|
|
$141,795
|
|
|||
|
Less: Average goodwill (GAAP)
|
|
6,887
|
|
6,876
|
|
6,882
|
|
6,876
|
|
|||||||
|
Less: Average other intangibles (GAAP)
|
|
2
|
|
1
|
|
2
|
|
2
|
|
|||||||
|
Add: Average deferred tax liabilities related to goodwill (GAAP)
|
|
537
|
|
509
|
|
535
|
|
495
|
|
|||||||
|
Average tangible assets
|
H
|
|
$143,660
|
|
|
$138,031
|
|
|
$143,214
|
|
|
$135,412
|
|
|||
|
Return on average total tangible assets
|
C/H
|
0.96
|
%
|
0.86
|
%
|
0.92
|
%
|
0.75
|
%
|
|||||||
|
Return on average total tangible assets, Adjusted (non-GAAP)
|
U/H
|
0.96
|
|
0.80
|
|
0.92
|
|
0.73
|
|
|||||||
|
Efficiency ratio and efficiency ratio, Adjusted:
|
|
|||||||||||||||
|
Efficiency ratio
|
B/A
|
59.41
|
%
|
62.88
|
%
|
60.99
|
%
|
64.36
|
%
|
|||||||
|
Efficiency ratio, Adjusted (non-GAAP)
|
P/O
|
59.41
|
|
63.31
|
|
60.99
|
|
64.54
|
|
|||||||
|
Operating leverage and operating leverage, Adjusted:
|
||||||||||||||||
|
Increase in total revenue
|
4.57
|
%
|
14.14
|
%
|
8.50
|
%
|
8.35
|
%
|
||||||||
|
(Decrease) increase in noninterest expense
|
(1.04
|
)
|
8.65
|
|
2.83
|
|
2.29
|
|
||||||||
|
Operating leverage
|
5.61
|
%
|
5.49
|
%
|
5.67
|
%
|
6.06
|
%
|
||||||||
|
Increase in total revenue, Adjusted (non-GAAP)
|
9.90
|
%
|
8.60
|
%
|
10.41
|
%
|
6.49
|
%
|
||||||||
|
Increase in noninterest expense, Adjusted (non-GAAP)
|
3.25
|
|
4.14
|
|
4.33
|
|
2.92
|
|
||||||||
|
Operating leverage, Adjusted (non-GAAP)
|
6.65
|
%
|
4.46
|
%
|
6.08
|
%
|
3.57
|
%
|
||||||||
|
Net income per average common share - basic and diluted, Adjusted:
|
||||||||||||||||
|
Average common shares outstanding - basic (GAAP)
|
W
|
500,861,076
|
|
519,458,976
|
|
505,529,991
|
|
525,477,273
|
|
|||||||
|
Average common shares outstanding - diluted (GAAP)
|
X
|
502,157,384
|
|
521,122,466
|
|
507,062,805
|
|
527,261,384
|
|
|||||||
|
Net income available to common stockholders (GAAP)
|
D
|
|
$341
|
|
|
$290
|
|
|
$972
|
|
|
$749
|
|
|||
|
Net income per average common share - basic (GAAP)
|
D/W
|
0.68
|
|
0.56
|
|
1.92
|
|
1.43
|
|
|||||||
|
Net income per average common share - diluted (GAAP)
|
D/X
|
0.68
|
|
0.56
|
|
1.92
|
|
1.42
|
|
|||||||
|
Net income available to common stockholders, Adjusted (non-GAAP)
|
V
|
341
|
|
271
|
|
972
|
|
730
|
|
|||||||
|
Net income per average common share - basic, Adjusted (non-GAAP)
|
V/W
|
0.68
|
|
0.52
|
|
1.92
|
|
1.39
|
|
|||||||
|
Net income per average common share - diluted, Adjusted (non-GAAP)
|
V/X
|
0.68
|
|
0.52
|
|
1.92
|
|
1.39
|
|
|||||||
18
CITIZENS FINANCIAL GROUP, INC.
MANAGEMENT’S DISCUSSION AND ANALYSIS
The following table presents computations of non-GAAP financial measures representing our “Underlying” results used throughout “Management's Discussion and Analysis of Financial Condition and Results of Operations”:
|
|
As of and for the Three Months Ended September 30,
|
As of and for the Nine Months Ended September 30,
|
||||||||||||||
|
(in millions, except share, per-share and ratio data)
|
Ref.
|
2017
|
|
2016
|
|
2017
|
|
2016
|
|
|||||||
|
Noninterest income, Underlying:
|
||||||||||||||||
|
Noninterest income (GAAP)
|
|
$381
|
|
|
$435
|
|
|
$1,130
|
|
|
$1,120
|
|
||||
|
Less: Lease impairment credit-related costs
|
—
|
|
—
|
|
(11
|
)
|
—
|
|
||||||||
|
Noninterest income, Underlying (non-GAAP)
|
|
$381
|
|
|
$435
|
|
|
$1,141
|
|
|
$1,120
|
|
||||
|
Total revenue, Underlying:
|
||||||||||||||||
|
Total revenue (GAAP)
|
A
|
|
$1,443
|
|
|
$1,380
|
|
|
$4,223
|
|
|
$3,892
|
|
|||
|
Less: Lease impairment credit-related costs
|
—
|
|
—
|
|
(11
|
)
|
—
|
|
||||||||
|
Total revenue, Underlying (non-GAAP)
|
Y
|
|
$1,443
|
|
|
$1,380
|
|
|
$4,234
|
|
|
$3,892
|
|
|||
|
Noninterest expense, Underlying:
|
||||||||||||||||
|
Noninterest expense (GAAP)
|
B
|
|
$858
|
|
|
$867
|
|
|
$2,576
|
|
|
$2,505
|
|
|||
|
Less: Lease impairment credit-related costs
|
—
|
|
—
|
|
15
|
|
—
|
|
||||||||
|
Noninterest expense, Underlying (non-GAAP)
|
Z
|
|
$858
|
|
|
$867
|
|
|
$2,561
|
|
|
$2,505
|
|
|||
|
Pre-provision profit, Underlying:
|
||||||||||||||||
|
Pre-provision profit (GAAP)
|
|
$585
|
|
|
$513
|
|
|
$1,647
|
|
|
$1,387
|
|
||||
|
Less: Lease impairment credit-related costs
|
—
|
|
—
|
|
(26
|
)
|
—
|
|
||||||||
|
Pre-provision profit, Underlying (non-GAAP)
|
|
$585
|
|
|
$513
|
|
|
$1,673
|
|
|
$1,387
|
|
||||
|
Total credit-related costs, Underlying:
|
||||||||||||||||
|
Provision for credit losses (GAAP)
|
|
$72
|
|
|
$86
|
|
|
$238
|
|
|
$267
|
|
||||
|
Add: Lease impairment credit-related costs
|
—
|
|
—
|
|
26
|
|
—
|
|
||||||||
|
Total credit-related costs, Underlying (non-GAAP)
|
|
$72
|
|
|
$86
|
|
|
$264
|
|
|
$267
|
|
||||
|
Income before income tax expense (GAAP)
|
Q
|
|
$513
|
|
|
$427
|
|
|
$1,409
|
|
|
$1,120
|
|
|||
|
Income tax expense and effective income tax rate, Underlying:
|
||||||||||||||||
|
Income tax expense (GAAP)
|
S
|
|
$165
|
|
|
$130
|
|
|
$423
|
|
|
$357
|
|
|||
|
Less: Settlement of certain state tax matters
|
—
|
|
—
|
|
(23
|
)
|
—
|
|
||||||||
|
Income tax expense, Underlying (non-GAAP)
|
AA
|
|
$165
|
|
|
$130
|
|
|
$446
|
|
|
$357
|
|
|||
|
Effective income tax rate (GAAP)
|
S/Q
|
32.18
|
%
|
30.46
|
%
|
30.04
|
%
|
31.87
|
%
|
|||||||
|
Effective income tax rate, Underlying (non-GAAP)
|
AA/Q
|
32.18
|
|
30.46
|
|
31.65
|
%
|
31.87
|
|
|||||||
|
Net income, Underlying:
|
||||||||||||||||
|
Net income (GAAP)
|
C
|
|
$348
|
|
|
$297
|
|
|
$986
|
|
|
$763
|
|
|||
|
Less: Settlement of certain state tax matters
|
—
|
|
—
|
|
23
|
|
—
|
|
||||||||
|
Net income, Underlying (non-GAAP)
|
BB
|
|
$348
|
|
|
$297
|
|
|
$963
|
|
|
$763
|
|
|||
|
Net income available to common stockholders, Underlying:
|
||||||||||||||||
|
Net income available to common stockholders (GAAP)
|
D
|
|
$341
|
|
|
$290
|
|
|
$972
|
|
|
$749
|
|
|||
|
Less: Settlement of certain state tax matters
|
—
|
|
—
|
|
23
|
|
—
|
|
||||||||
|
Net income available to common stockholders, Underlying (non-GAAP)
|
CC
|
|
$341
|
|
|
$290
|
|
|
$949
|
|
|
$749
|
|
|||
19
CITIZENS FINANCIAL GROUP, INC.
MANAGEMENT’S DISCUSSION AND ANALYSIS
|
|
As of and for the Three Months Ended September 30,
|
As of and for the Nine Months Ended September 30,
|
||||||||||||||
|
(in millions, except share, per-share and ratio data)
|
Ref.
|
2017
|
|
2016
|
|
2017
|
|
2016
|
|
|||||||
|
Efficiency ratio and efficiency ratio, Underlying:
|
||||||||||||||||
|
Efficiency ratio
|
B/A
|
59.41
|
%
|
62.88
|
%
|
60.99
|
%
|
64.36
|
%
|
|||||||
|
Efficiency ratio, Underlying (non-GAAP)
|
Z/Y
|
59.41
|
|
62.88
|
|
60.47
|
|
64.36
|
|
|||||||
|
Operating leverage and operating leverage, Underlying
|
||||||||||||||||
|
Increase in total revenue (GAAP)
|
4.57
|
%
|
14.14
|
%
|
8.50
|
%
|
8.35
|
%
|
||||||||
|
(Decrease) increase in noninterest expense (GAAP)
|
(1.04
|
)
|
8.65
|
|
2.83
|
|
2.29
|
|
||||||||
|
Operating leverage
|
5.61
|
%
|
5.49
|
%
|
5.67
|
%
|
6.06
|
%
|
||||||||
|
Increase in total revenue, Underlying (non-GAAP)
|
4.57
|
%
|
14.14
|
%
|
8.79
|
%
|
8.35
|
%
|
||||||||
|
(Decrease) increase in noninterest expense, Underlying (non-GAAP)
|
(1.04
|
)
|
8.65
|
|
2.24
|
|
2.29
|
|
||||||||
|
Operating leverage, Underlying (non-GAAP)
|
5.61
|
%
|
5.49
|
%
|
6.55
|
%
|
6.06
|
%
|
||||||||
|
Return on average common equity and return on average common equity, Underlying:
|
||||||||||||||||
|
Average common equity (GAAP)
|
E
|
|
$19,728
|
|
|
$19,810
|
|
|
$19,617
|
|
|
$19,715
|
|
|||
|
Return on average common equity
|
D/E
|
6.87
|
%
|
5.82
|
%
|
6.63
|
%
|
5.08
|
%
|
|||||||
|
Return on average common equity, Underlying (non-GAAP)
|
CC/E
|
6.87
|
|
5.82
|
|
6.47
|
|
5.08
|
|
|||||||
|
Return on average tangible common equity and return on average tangible common equity, Underlying:
|
||||||||||||||||
|
Average common equity (GAAP)
|
E
|
|
$19,728
|
|
|
$19,810
|
|
|
$19,617
|
|
|
$19,715
|
|
|||
|
Less: Average goodwill (GAAP)
|
6,887
|
|
6,876
|
|
6,882
|
|
6,876
|
|
||||||||
|
Less: Average other intangibles (GAAP)
|
2
|
|
1
|
|
2
|
|
2
|
|
||||||||
|
Add: Average deferred tax liabilities related to goodwill (GAAP)
|
537
|
|
509
|
|
535
|
|
495
|
|
||||||||
|
Average tangible common equity
|
F
|
|
$13,376
|
|
|
$13,442
|
|
|
$13,268
|
|
|
$13,332
|
|
|||
|
Return on average tangible common equity
|
D/F
|
10.13
|
%
|
8.58
|
%
|
9.80
|
%
|
7.51
|
%
|
|||||||
|
Return on average tangible common equity, Underlying (non-GAAP)
|
CC/F
|
10.13
|
|
8.58
|
|
9.57
|
|
7.51
|
|
|||||||
|
Return on average total assets and return on average total assets, Underlying:
|
||||||||||||||||
|
Average total assets (GAAP)
|
G
|
|
$150,012
|
|
|
$144,399
|
|
|
$149,563
|
|
|
$141,795
|
|
|||
|
Return on average total assets
|
C/G
|
0.92
|
%
|
0.82
|
%
|
0.88
|
%
|
0.72
|
%
|
|||||||
|
Return on average total assets, Underlying (non-GAAP)
|
BB/G
|
0.92
|
|
0.82
|
|
0.86
|
|
0.72
|
|
|||||||
|
Return on average total tangible assets and return on average total tangible assets, Underlying:
|
||||||||||||||||
|
Average total assets (GAAP)
|
G
|
|
$150,012
|
|
|
$144,399
|
|
|
$149,563
|
|
|
$141,795
|
|
|||
|
Less: Average goodwill (GAAP)
|
6,887
|
|
6,876
|
|
6,882
|
|
6,876
|
|
||||||||
|
Less: Average other intangibles (GAAP)
|
2
|
|
1
|
|
2
|
|
2
|
|
||||||||
|
Add: Average deferred tax liabilities related to goodwill (GAAP)
|
537
|
|
509
|
|
535
|
|
495
|
|
||||||||
|
Average tangible assets
|
H
|
|
$143,660
|
|
|
$138,031
|
|
|
$143,214
|
|
|
$135,412
|
|
|||
|
Return on average total tangible assets
|
C/H
|
0.96
|
%
|
0.86
|
%
|
0.92
|
%
|
0.75
|
%
|
|||||||
|
Return on average total tangible assets, Underlying (non-GAAP)
|
BB/H
|
0.96
|
|
0.86
|
|
0.90
|
|
0.75
|
|
|||||||
|
Net income per average common share - basic and diluted, Underlying:
|
||||||||||||||||
|
Average common shares outstanding - basic (GAAP)
|
W
|
500,861,076
|
|
519,458,976
|
|
505,529,991
|
|
525,477,273
|
|
|||||||
|
Average common shares outstanding - diluted (GAAP)
|
X
|
502,157,384
|
|
521,122,466
|
|
507,062,805
|
|
527,261,384
|
|
|||||||
|
Net income available to common stockholders (GAAP)
|
D
|
|
$341
|
|
|
$290
|
|
|
$972
|
|
|
$749
|
|
|||
|
Net income per average common share - basic (GAAP)
|
D/W
|
0.68
|
|
0.56
|
|
1.92
|
|
1.43
|
|
|||||||
|
Net income per average common share - diluted (GAAP)
|
D/X
|
0.68
|
|
0.56
|
|
1.92
|
|
1.42
|
|
|||||||
|
Net income available to common stockholders, Underlying (non-GAAP)
|
CC
|
341
|
|
290
|
|
949
|
|
749
|
|
|||||||
|
Net income per average common share - basic, Underlying (non-GAAP)
|
CC/W
|
0.68
|
|
0.56
|
|
1.88
|
|
1.43
|
|
|||||||
|
Net income per average common share - diluted, Underlying (non-GAAP)
|
CC/X
|
0.68
|
|
0.56
|
|
1.87
|
|
1.42
|
|
|||||||
20
CITIZENS FINANCIAL GROUP, INC.
MANAGEMENT’S DISCUSSION AND ANALYSIS
RESULTS OF OPERATIONS
Third Quarter 2017 vs. Third Quarter 2016
|
•
|
Net income of
$348 million
increase
d
$51 million
, or 17%, from
$297 million
in third quarter 2016. Net income available to common stockholders of
$341 million
increased
$
51 million
, or
18%
, from
$290 million
in third quarter 2016;
|
|
•
|
Net income per average common share, diluted, of
$0.68
, compared to
$0.56
in third quarter 2016;
|
|
•
|
Third quarter 2017 results reflected an 18% increase in net income available to common stockholders, led by revenue growth of 5% with a 12% increase in net interest income given 5% average loan growth and a 21 basis point increase in net interest margin. Prior year results reflected a net $19 million after-tax benefit tied to the impact of the third quarter 2016 TDR Transaction gain and other notable items. On an Adjusted basis,* which excludes the impact of the TDR Transaction gain and other third quarter 2016 notable items, net income available to common stockholders increased 26%;
|
|
•
|
Total revenue of
$1.4 billion
increase
d
$63 million
, or
5%
, reflecting strong net interest income growth. On an Adjusted basis,* total revenue increased $130 million, or 10%, driven by strength in net interest income and noninterest income:
|
|
◦
|
Net interest income
increase
d
12%
, to
$1.1 billion
from
$945 million
in third quarter 2016, given
5%
average loan growth and improvement in net interest margin;
|
|
◦
|
Net interest margin
increase
d
21
basis points to
3.05%
, which reflected improved loan yields, driven by balance sheet optimization initiatives and higher rates, and a two basis point benefit tied to higher-than-expected commercial loan interest recoveries, partially offset by an increase in funding costs; and
|
|
◦
|
Noninterest income
decrease
d
12%
from
higher third quarter 2016 levels that included a net $67 million TDR Transaction gain. On an Adjusted basis,* which excludes the TDR Transaction gain and other third quarter 2016 notable items, noninterest income increased 4%, as strength in capital markets fees, card fees and letter of credit and loan fees were partially offset by lower mortgage banking fees, foreign exchange and interest rate products and service charges and fees.
|
|
•
|
Noninterest expense of
$858 million
decrease
d
$9 million
, or
1%
,
from higher third quarter 2016 levels that included $36 million of notable items. On an Adjusted basis,* which excludes notable items, noninterest expense increased 3%, largely reflecting higher salaries and employee benefits expense and outside services expense, driven by the impact of strategic growth initiatives;
|
|
•
|
The provision for credit losses of
$72 million
in third quarter 2017
decrease
d
$14 million
from
$86 million
in third quarter 2016, reflecting strong overall credit quality and lower net charge-offs;
|
|
•
|
Net charge-offs of
$65 million
decreased
$18 million
, or
22%
, from
$83 million
in third quarter 2016. The ALLL of
$1.2 billion
remained stable compared to December 31, 2016. ALLL to total loans and leases ratio of
1.11%
as of
September 30, 2017
, compared with
1.15%
as of December 31, 2016. ALLL to nonperforming loans and leases ratio of
131%
as of
September 30, 2017
, compared with
118%
as of December 31, 2016;
|
|
•
|
The effective tax rate for third quarter 2017 was 32.2%, compared with 30.5% in third quarter 2016;
|
|
•
|
Return on average common equity of
6.9%
compared to
5.8%
in third quarter 2016;
|
|
•
|
Return on average tangible common equity of
10.1%
improved
155
basis points, from
8.6%
in third quarter 2016;*
|
|
•
|
Average interest-earning assets
increase
d $
5.8 billion
, or
4%
, reflecting
5%
loan growth and a
3%
increase
in the investment portfolio; and
|
|
•
|
Average deposits of
$112.9 billion
increase
d
$6.3 billion
, or
6%
, from
$106.6 billion
in third quarter 2016, reflecting strength in term, checking with interest, savings and demand deposits.
|
21
Nine Months Ended 2017 vs. Nine Months Ended 2016
|
•
|
Net income of
$986 million
increase
d
$223 million
compared to
$763 million
in the first nine months of 2016. Net income available to common stockholders of
$972 million
increased
$223 million
, compared to
$749 million
in the first nine months of 2016 as the benefit of a
9%
increase
in revenue and a reduction in the effective income tax rate from the settlement of certain state tax matters was partially offset by a
3%
increase
in noninterest expense:
|
|
◦
|
On an Underlying basis,* excluding the $23 million impact from the settlement of certain tax matters, net income increased 26% from $763 million in the first nine months of 2016; and
|
|
◦
|
On an Adjusted basis,* excluding the $19 million after-tax benefit related to the TDR Transaction, partially offset by other notable items, net income increased 33% from $744 million in the first nine months of 2016.
|
|
•
|
Net income per average common share was
$1.92
, diluted, compared to
$1.42
in the first nine months of 2016:
|
|
◦
|
On an Underlying basis,* excluding the $23 million impact from the settlement of certain state tax matters, net income per average common share increased 32% to $1.87, diluted, compared to $1.42 in the first nine months of 2016; and
|
|
◦
|
On an Adjusted basis,* excluding the $19 million after-tax benefit related to notable items, net income per average common share increased 38% to $1.92, diluted, compared to $1.39 in the first nine months of 2016.
|
|
•
|
Total revenue of
$4.2 billion
increase
d
$331 million
, or
9%
, reflecting solid net interest income and noninterest income growth:
|
|
◦
|
Net interest income of
$3.1 billion
increase
d
$321 million
, or
12%
, compared to
$2.8 billion
in the first nine months of 2016, reflecting
6%
average loan growth and a
15
basis point improvement in net interest margin;
|
|
◦
|
Net interest margin of
3.00%
increase
d
15
basis points, compared to
2.85%
in the first nine months of 2016 reflecting improved loan growth, driven by higher rates and balance sheet optimization initiatives, partially offset by investment portfolio growth and higher funding costs; and
|
|
◦
|
Noninterest income of
$1.1 billion
increase
d
$10 million
, or
1%
, from the first nine months of 2016, largely driven by strength in capital markets fees, card fees, letter of credit and loan fees, foreign exchange and interest rate products and mortgage banking fees. These increases were offset by the second quarter 2017 impact of $11 million of finance lease impairments and the $67 million net impact of third quarter 2016 notable items:
|
|
▪
|
On an Underlying basis,* excluding the $11 million impact related to finance lease
impairments,
noninterest income increased $21 million, or 2%, from the first nine months of 2016; and
|
|
▪
|
On an Adjusted basis,* excluding the $67 million net
impact related to notable items,
noninterest income increased $77 million, or 7%, from the first nine months of 2016.
|
|
•
|
Noninterest expense
of
$2.6 billion
, which included the $15 million impact of second quarter 2017 operating lease impairments,
increase
d
$71 million
, or
3%
, compared to
$2.5 billion
in the first nine months of 2016. Results also reflected higher salaries and employee benefits expense, largely tied to higher revenue-based
incentives and merit increases and increases in other categories given continued investments in the franchise as well as higher FDIC expense and fraud and regulatory costs:
|
|
◦
|
On an Underlying basis,* excluding the $15 million
impact related to operating lease impairments,
noninterest expense increased $56 million, or 2%, from the first nine months of 2016; and
|
|
◦
|
On an Adjusted basis,* excluding the $36 million
impact related to notable items,
noninterest expense increased $107 million, or 4%, from the first nine months of 2016.
|
|
•
|
Provision for credit losses of
$238 million
decrease
d
$29 million
, or
11%
, from
$267 million
in the first nine months of 2016.
|
|
◦
|
On an Underlying basis,* total credit-related costs of $264 million, including the $26 million impact of lease impairments, were down slightly from the first nine months of 2016.
|
22
|
•
|
Net charge-offs of
$227 million
decreased
$4 million
, or
2%
, from
$231 million
in the first nine months of 2016. The ALLL of
$1.2 billion
decreased $12 million compared to December 31, 2016. ALLL to total loans and leases was
1.11%
as of
September 30, 2017
, compared with
1.15%
as of December 31, 2016. ALLL to nonperforming loans and leases ratio was
131%
as of
September 30, 2017
, compared with
118%
as of December 31, 2016.
|
|
•
|
Return on average common equity was
6.6%
compared to
5.1%
for the first nine months of 2016.
|
|
◦
|
On an Underlying basis,* return on average common equity of 6.5% improved 139 bps from 5.1% for the first nine months of 2016.
|
|
◦
|
On an Adjusted basis,* return on average common equity of 6.6% improved 168 bps from 5.0% for the first nine months of 2016.
|
|
•
|
Return on average tangible common equity was
9.8%
compared to
7.5%
for the first nine months of 2016.*
|
|
◦
|
On an Underlying basis,* return on average tangible common equity of 9.6% improved 206 bps from 7.5% for the first nine months of 2016.
|
|
◦
|
On an Adjusted basis,* return on average tangible common equity of 9.8% improved 248 bps from 7.3% for the first nine months of 2016.
|
|
•
|
Average loans and leases of
$108.9 billion
increase
d
$6.6 billion
, or
6%
, from
$102.3 billion
in the first nine months of 2016, driven by a
$3.6 billion
increase
in commercial loans and leases and a
$3.0 billion
increase
in retail loans.
|
|
•
|
Average deposits of
$111.2 billion
increase
d
$7.0 billion
, or
7%
, from
$104.2 billion
in the first nine months of 2016, driven by strength in checking with interest, term, money market and savings.
|
|
•
|
The effective tax rate in the first nine months of 2017 of
30.0%
compared with
31.9
% in the first nine months of 2016.
|
|
◦
|
On an Underlying basis,* the effective income tax rate improved 22 bps to 31.7% from 31.9% for the first nine months of 2016.
|
|
◦
|
On an Adjusted basis,* the effective income tax rate improved 164 bps to 30.0% from 31.7% for the first nine months of 2016.
|
23
CITIZENS FINANCIAL GROUP, INC.
MANAGEMENT’S DISCUSSION AND ANALYSIS
Net Income
Net income of
$348 million
,
increase
d
$51 million
, or
17%
, from
$297 million
in third quarter 2016. Net income totaled
$986 million
, up
$223 million
, or
29%
, from
$763 million
in the first nine months of 2016.
The following table presents the significant components of our net income:
|
Three Months Ended September 30,
|
Nine Months Ended September 30,
|
||||||||||||||||||||||||||||
|
(dollars in millions)
|
2017
|
|
2016
|
|
Change
|
|
Percent
|
|
2017
|
|
2016
|
|
Change
|
Percent
|
|
||||||||||||||
|
Operating Data:
|
|||||||||||||||||||||||||||||
|
Net interest income
|
|
$1,062
|
|
|
$945
|
|
|
$117
|
|
12
|
%
|
|
$3,093
|
|
|
$2,772
|
|
|
$321
|
|
12
|
%
|
|||||||
|
Noninterest income
|
381
|
|
435
|
|
(54
|
)
|
(12
|
)
|
1,130
|
|
1,120
|
|
10
|
|
1
|
|
|||||||||||||
|
Total revenue
|
1,443
|
|
1,380
|
|
63
|
|
5
|
|
4,223
|
|
3,892
|
|
331
|
|
9
|
|
|||||||||||||
|
Provision for credit losses
|
72
|
|
86
|
|
(14
|
)
|
(16
|
)
|
238
|
|
267
|
|
(29
|
)
|
(11
|
)
|
|||||||||||||
|
Noninterest expense
|
858
|
|
867
|
|
(9
|
)
|
(1
|
)
|
2,576
|
|
2,505
|
|
71
|
|
3
|
|
|||||||||||||
|
Income before income tax expense
|
513
|
|
427
|
|
86
|
|
20
|
|
1,409
|
|
1,120
|
|
289
|
|
26
|
|
|||||||||||||
|
Income tax expense
|
165
|
|
130
|
|
35
|
|
27
|
|
423
|
|
357
|
|
66
|
|
18
|
|
|||||||||||||
|
Net income
|
|
$348
|
|
|
$297
|
|
|
$51
|
|
17
|
|
|
$986
|
|
|
$763
|
|
|
$223
|
|
29
|
|
|||||||
|
Net income available to common stockholders
|
|
$341
|
|
|
$290
|
|
|
$51
|
|
18
|
%
|
|
$972
|
|
|
$749
|
|
|
$223
|
|
30
|
%
|
|||||||
|
Return on average common equity
|
6.87
|
%
|
5.82
|
%
|
105
|
bps
|
6.63
|
%
|
5.08
|
%
|
155
|
bps
|
|||||||||||||||||
|
Return on average tangible common equity
|
10.13
|
%
|
8.58
|
%
|
155
|
bps
|
9.80
|
%
|
7.51
|
%
|
229
|
bps
|
|||||||||||||||||
Net Interest Income
Net interest income is our largest source of revenue and is the difference between the interest earned on interest-earning assets (usually loans and investment securities) and the interest expense incurred in connection with interest-bearing liabilities (usually deposits and borrowings). The level of net interest income is primarily a function of the average balance of interest-earning assets, the average balance of interest-bearing liabilities and the spread between the effective yield on such assets and the effective cost of such liabilities. These factors are influenced by the pricing and mix of interest-earning assets and interest-bearing liabilities which, in turn, are impacted by external factors such as local economic conditions, competition for loans and deposits, the monetary policy of the FRB and market interest rates. For further discussion, refer to “—Risk Governance” and “—Market Risk — Non-Trading Risk,” included in this report.
The yields generated by our loans and securities are typically driven by both short-term and long-term interest rates, which are set by the market or, at times, by the FRB’s actions. However, the cost of our deposits and short-term wholesale borrowings is largely based on short-term interest rates, which are primarily driven by the FRB’s actions. The level of net interest income is therefore influenced by movements in such interest rates and the pace at which such movements occur. In the first nine months of 2017, short-term interest rates have risen from very low levels by historical standards, with many benchmark rates, such as the federal funds rate and one- and three-month LIBOR, near 1.25%. Concurrently, longer-term rates have declined, with the ten-year U.S. Treasury note yield declining 30 basis points from the December 2016 average of 2.50% to 2.20% for September 2017. Any declines in the yield curve or a decline in longer-term yields relative to short-term yields (a flatter yield curve) would have an adverse impact on our net interest margin and net interest income.
The FRB continued to follow its stated monetary policy during the first nine months of 2017 and increased the Fed Funds rate by 0.25% in both March and June 2017.
The FRB targeted a 1.00% to 1.25% Fed Funds rate at September 2017 and interest rates are expected to gradually increase to more normal levels. Also in September 2017, the FRB announced plans to initiate a balance sheet normalization program by reducing its holdings of U.S. Treasury and agency securities. The balance sheet normalization process is expected to be gradual and predictable, with long-term impacts on interest rates and mortgage rates.
24
CITIZENS FINANCIAL GROUP, INC.
MANAGEMENT’S DISCUSSION AND ANALYSIS
The following table presents the major components of net interest income and net interest margin:
|
Three Months Ended September 30,
|
|||||||||||||||||||||||
|
2017
|
2016
|
Change
|
|||||||||||||||||||||
|
(dollars in millions)
|
Average
Balances
|
Income/
Expense
|
Yields/
Rates
|
Average
Balances
|
Income/
Expense
|
Yields/
Rates
|
Average
Balances
|
Yields/
Rates
|
|||||||||||||||
|
Assets
|
|||||||||||||||||||||||
|
Interest-bearing cash and due from banks and deposits in banks
|
|
$1,663
|
|
|
$5
|
|
1.14
|
%
|
|
$2,121
|
|
|
$2
|
|
0.41
|
%
|
|
($458
|
)
|
73 bps
|
|||
|
Taxable investment securities
|
25,588
|
|
155
|
|
2.42
|
|
24,961
|
|
146
|
|
2.34
|
|
627
|
|
8
|
|
|||||||
|
Non-taxable investment securities
|
7
|
|
—
|
|
2.60
|
|
8
|
|
—
|
|
2.60
|
|
(1
|
)
|
—
|
|
|||||||
|
Total investment securities
|
25,595
|
|
155
|
|
2.42
|
|
24,969
|
|
146
|
|
2.34
|
|
626
|
|
8
|
|
|||||||
|
Commercial
|
37,448
|
|
344
|
|
3.61
|
|
35,986
|
|
290
|
|
3.14
|
|
1,462
|
|
47
|
|
|||||||
|
Commercial real estate
|
11,401
|
|
108
|
|
3.69
|
|
9,905
|
|
71
|
|
2.82
|
|
1,496
|
|
87
|
|
|||||||
|
Leases
|
3,302
|
|
21
|
|
2.54
|
|
3,813
|
|
23
|
|
2.43
|
|
(511
|
)
|
11
|
|
|||||||
|
Total commercial
|
52,151
|
|
473
|
|
3.56
|
|
49,704
|
|
384
|
|
3.02
|
|
2,447
|
|
54
|
|
|||||||
|
Residential mortgages
|
16,323
|
|
146
|
|
3.57
|
|
14,155
|
|
127
|
|
3.59
|
|
2,168
|
|
(2
|
)
|
|||||||
|
Home equity loans
|
1,547
|
|
22
|
|
5.72
|
|
2,088
|
|
30
|
|
5.75
|
|
(541
|
)
|
(3
|
)
|
|||||||
|
Home equity lines of credit
|
13,608
|
|
135
|
|
3.93
|
|
14,314
|
|
115
|
|
3.20
|
|
(706
|
)
|
73
|
|
|||||||
|
Home equity loans serviced by others
|
618
|
|
11
|
|
7.04
|
|
837
|
|
16
|
|
7.24
|
|
(219
|
)
|
(20
|
)
|
|||||||
|
Home equity lines of credit serviced by others
|
173
|
|
2
|
|
4.05
|
|
256
|
|
2
|
|
2.47
|
|
(83
|
)
|
158
|
|
|||||||
|
Automobile
|
13,349
|
|
111
|
|
3.31
|
|
14,053
|
|
104
|
|
2.96
|
|
(704
|
)
|
35
|
|
|||||||
|
Education
(1)
|
7,814
|
|
106
|
|
5.36
|
|
5,750
|
|
73
|
|
5.10
|
|
2,064
|
|
26
|
|
|||||||
|
Credit cards
|
1,738
|
|
47
|
|
10.69
|
|
1,623
|
|
46
|
|
11.24
|
|
115
|
|
(55
|
)
|
|||||||
|
Other retail
|
2,163
|
|
43
|
|
7.88
|
|
1,256
|
|
29
|
|
9.39
|
|
907
|
|
(151
|
)
|
|||||||
|
Total retail
|
57,333
|
|
623
|
|
4.32
|
|
54,332
|
|
542
|
|
3.98
|
|
3,001
|
|
34
|
|
|||||||
|
Total loans and leases
|
109,484
|
|
1,096
|
|
3.96
|
|
104,036
|
|
926
|
|
3.52
|
|
5,448
|
|
44
|
|
|||||||
|
Loans held for sale, at fair value
|
503
|
|
5
|
|
3.69
|
|
474
|
|
4
|
|
3.35
|
|
29
|
|
34
|
|
|||||||
|
Other loans held for sale
|
234
|
|
3
|
|
4.72
|
|
69
|
|
1
|
|
6.41
|
|
165
|
|
(169
|
)
|
|||||||
|
Interest-earning assets
|
137,479
|
|
1,264
|
|
3.64
|
|
131,669
|
|
1,079
|
|
3.25
|
|
5,810
|
|
39
|
|
|||||||
|
Allowance for loan and lease losses
|
(1,220
|
)
|
(1,243
|
)
|
23
|
|
|||||||||||||||||
|
Goodwill
|
6,887
|
|
6,876
|
|
11
|
|
|||||||||||||||||
|
Other noninterest-earning assets
|
6,866
|
|
7,097
|
|
(231
|
)
|
|||||||||||||||||
|
Total assets
|
|
$150,012
|
|
|
$144,399
|
|
|
$5,613
|
|
||||||||||||||
|
Liabilities and Stockholders’ Equity
|
|||||||||||||||||||||||
|
Checking with interest
|
|
$21,909
|
|
|
$23
|
|
0.43
|
%
|
|
$19,997
|
|
|
$9
|
|
0.20
|
%
|
|
$1,912
|
|
23 bps
|
|||
|
Money market accounts
|
37,535
|
|
54
|
|
0.57
|
|
37,596
|
|
35
|
|
0.38
|
|
(62
|
)
|
19
|
|
|||||||
|
Regular savings
|
9,491
|
|
1
|
|
0.04
|
|
8,780
|
|
2
|
|
0.05
|
|
712
|
|
(1)
|
|
|||||||
|
Term deposits
|
15,971
|
|
45
|
|
1.09
|
|
12,806
|
|
25
|
|
0.76
|
|
3,165
|
|
33
|
|
|||||||
|
Total interest-bearing deposits
|
84,906
|
|
123
|
|
0.58
|
|
79,179
|
|
71
|
|
0.36
|
|
5,727
|
|
22
|
|
|||||||
|
Federal funds purchased and securities sold under agreements to repurchase
(2)
|
733
|
|
1
|
|
0.50
|
|
910
|
|
1
|
|
0.24
|
|
(177
|
)
|
26
|
|
|||||||
|
Other short-term borrowed funds
|
1,624
|
|
7
|
|
1.55
|
|
2,564
|
|
10
|
|
1.54
|
|
(940
|
)
|
1
|
|
|||||||
|
Long-term borrowed funds
|
12,210
|
|
71
|
|
2.31
|
|
10,905
|
|
52
|
|
1.89
|
|
1,305
|
|
42
|
|
|||||||
|
Total borrowed funds
|
14,567
|
|
79
|
|
2.14
|
|
14,379
|
|
63
|
|
1.72
|
|
188
|
|
42
|
|
|||||||
|
Total interest-bearing liabilities
|
99,473
|
|
202
|
|
0.80
|
|
93,558
|
|
134
|
|
0.57
|
|
5,915
|
|
23
|
|
|||||||
|
Demand deposits
|
28,041
|
|
27,467
|
|
574
|
|
|||||||||||||||||
|
Other liabilities
|
2,523
|
|
3,317
|
|
(794
|
)
|
|||||||||||||||||
|
Total liabilities
|
130,037
|
|
124,342
|
|
5,695
|
|
|||||||||||||||||
|
Stockholders’ equity
|
19,975
|
|
20,057
|
|
(82
|
)
|
|||||||||||||||||
|
Total liabilities and stockholders’ equity
|
|
$150,012
|
|
|
$144,399
|
|
|
$5,613
|
|
||||||||||||||
|
Interest rate spread
|
2.84
|
%
|
2.68
|
%
|
16
|
|
|||||||||||||||||
|
Net interest income
|
|
$1,062
|
|
|
$945
|
|
|||||||||||||||||
|
Net interest margin
|
3.05
|
%
|
2.84
|
%
|
21 bps
|
||||||||||||||||||
|
Memo: Total deposits (interest-bearing and demand)
|
|
$112,947
|
|
|
$123
|
|
0.43
|
%
|
|
$106,646
|
|
|
$71
|
|
0.27
|
%
|
|
$6,301
|
|
16 bps
|
|||
(1)
During first quarter 2017, student loans were renamed “education” loans. For further information see Note 1 “Basis of Presentation” to our unaudited interim Consolidated Financial Statements in Part I, Item 1 — Financial Statements, included in this report.
(2)
Balances are net of certain short-term receivables associated with reverse repurchase agreements, as applicable. Interest expense includes the full cost of the repurchase agreements and certain hedging costs. See “—Analysis of Financial Condition — Derivatives” for further information.
25
CITIZENS FINANCIAL GROUP, INC.
MANAGEMENT’S DISCUSSION AND ANALYSIS
Net interest income of
$1.1 billion
increase
d
$117 million
, or
12%
, compared to
$945 million
in third quarter 2016, driven by
5%
average loan growth and a
21
basis point improvement in net interest margin.
Average interest-earning assets of
$137.5 billion
increase
d
$5.8 billion
, or
4%
, from third quarter 2016, driven by a
$2.4 billion
increase
in average commercial loans and leases, a
$3.0 billion
increase
in average retail loans, and a
$626 million
increase in total investment securitie
s. Commercial loans and leases
increase
d
5%
from the prior year quarter reflecting strength in commercial and commercial real estate loans, partially offset by lower leases.
Retail loans
increase
d
6%
from prior year quarter, reflecting strong growth in education, mortgage and other unsecured retail, partially offset by lower home equity and auto balances.
Average deposits of
$112.9 billion
increase
d
$6.3 billion
from third quarter 2016, reflecting growth in term deposits, checking with interest and savings, as well as modest growth in demand deposits. Total interest-bearing deposit costs
increase
d
22
basis points compared to third quarter 2016, reflecting the impact of higher short-term rates and the need to keep pace with loan growth.
Average borrowed funds of
$14.6 billion
increase
d
$188 million
, or
1%
, from third quarter 2016 due to a
$1.3 billion
increase
in long-term borrowed funds, which reflected growth in long-term senior debt and long-term FHLB borrowed funds, as the term funding profile continues to be strengthened, partially offset by a
$940 million
decrease
in other short-term borrowed funds, largely FHLB advances and a $177 million reduction in federal funds purchased and securities sold under agreements to repurchase. Total borrowed funds costs of
$79 million
increase
d
$16 million
from third quarter 2016, primarily due to the increase in short-term interest rates and the change in mix to long-term senior debt.
Net interest margin of
3.05%
increase
d
21
basis points compared to
2.84%
in third quarter 2016, driven by higher commercial and retail loan yields given balance sheet optimization initiatives and higher rates, and a two basis point benefit tied to higher-than-expected commercial loan interest recoveries, partially offset by higher deposit and funding costs.
The average interest-earning asset yield of
3.64%
increase
d
39
basis points from
3.25%
in third quarter 2016, driven by the benefit of a
44
basis point improvement in loan yields tied to increases in short-term rates. The investment portfolio yield
increase
d
eight
basis points compared to the prior year quarter, reflecting a change in mix as lower-yielding short-term investments were managed lower. Total interest-bearing liabilities rate of 0.80% increased 23 basis points compared to 0.57% in third quarter 2016 due to a 22 basis point increase in interest-bearing deposit costs, driven mainly by term deposits, checking with interest and money market accounts. The issuance of additional long-term borrowed funds also contributed to the increase in our interest-bearing liability rate.
26
CITIZENS FINANCIAL GROUP, INC.
MANAGEMENT’S DISCUSSION AND ANALYSIS
|
Nine Months Ended September 30,
|
|||||||||||||||||||||||
|
2017
|
2016
|
Change
|
|||||||||||||||||||||
|
(dollars in millions)
|
Average
Balances |
Income/
Expense |
Yields/
Rates |
Average
Balances |
Income/
Expense |
Yields/
Rates |
Average
Balances |
Yields/
Rates |
|||||||||||||||
|
Assets
|
|||||||||||||||||||||||
|
Interest-bearing cash and due from banks and deposits in banks
|
|
$1,902
|
|
|
$13
|
|
0.87
|
%
|
|
$1,915
|
|
|
$6
|
|
0.40
|
%
|
|
($13
|
)
|
47 bps
|
|||
|
Taxable investment securities
|
25,702
|
|
469
|
|
2.43
|
|
24,294
|
|
432
|
|
2.37
|
|
1,408
|
|
6
|
|
|||||||
|
Non-taxable investment securities
|
7
|
|
—
|
|
2.60
|
|
9
|
|
—
|
|
2.60
|
|
(2
|
)
|
—
|
|
|||||||
|
Total investment securities
|
25,709
|
|
469
|
|
2.43
|
|
24,303
|
|
432
|
|
2.37
|
|
1,406
|
|
6
|
|
|||||||
|
Commercial
|
37,603
|
|
982
|
|
3.45
|
|
35,212
|
|
832
|
|
3.10
|
|
2,391
|
|
35
|
|
|||||||
|
Commercial real estate
|
11,105
|
|
292
|
|
3.46
|
|
9,555
|
|
200
|
|
2.75
|
|
1,550
|
|
71
|
|
|||||||
|
Leases
|
3,517
|
|
66
|
|
2.50
|
|
3,864
|
|
71
|
|
2.44
|
|
(347
|
)
|
6
|
|
|||||||
|
Total commercial
|
52,225
|
|
1,340
|
|
3.39
|
|
48,631
|
|
1,103
|
|
2.98
|
|
3,594
|
|
41
|
|
|||||||
|
Residential mortgages
|
15,755
|
|
422
|
|
3.57
|
|
13,705
|
|
375
|
|
3.65
|
|
2,050
|
|
(8
|
)
|
|||||||
|
Home equity loans
|
1,668
|
|
71
|
|
5.71
|
|
2,263
|
|
95
|
|
5.63
|
|
(595
|
)
|
8
|
|
|||||||
|
Home equity lines of credit
|
13,775
|
|
379
|
|
3.68
|
|
14,474
|
|
343
|
|
3.16
|
|
(699
|
)
|
52
|
|
|||||||
|
Home equity loans serviced by others
|
668
|
|
35
|
|
7.06
|
|
898
|
|
49
|
|
7.09
|
|
(230
|
)
|
(3
|
)
|
|||||||
|
Home equity lines of credit serviced by others
|
189
|
|
6
|
|
4.00
|
|
298
|
|
5
|
|
2.21
|
|
(109
|
)
|
179
|
|
|||||||
|
Automobile
|
13,563
|
|
328
|
|
3.23
|
|
13,940
|
|
304
|
|
2.91
|
|
(377
|
)
|
32
|
|
|||||||
|
Education
|
7,384
|
|
292
|
|
5.29
|
|
5,338
|
|
202
|
|
5.06
|
|
2,046
|
|
23
|
|
|||||||
|
Credit cards
|
1,699
|
|
138
|
|
10.85
|
|
1,608
|
|
135
|
|
11.24
|
|
91
|
|
(39
|
)
|
|||||||
|
Other retail
|
1,976
|
|
117
|
|
7.94
|
|
1,177
|
|
79
|
|
9.01
|
|
799
|
|
(107
|
)
|
|||||||
|
Total retail
|
56,677
|
|
1,788
|
|
4.21
|
|
53,701
|
|
1,587
|
|
3.95
|
|
2,976
|
|
26
|
|
|||||||
|
Total loans and leases
|
108,902
|
|
3,128
|
|
3.82
|
|
102,332
|
|
2,690
|
|
3.49
|
|
6,570
|
|
33
|
|
|||||||
|
Loans held for sale, at fair value
|
492
|
|
13
|
|
3.53
|
|
383
|
|
10
|
|
3.46
|
|
109
|
|
7
|
|
|||||||
|
Other loans held for sale
|
158
|
|
6
|
|
5.29
|
|
185
|
|
6
|
|
4.53
|
|
(27
|
)
|
76
|
|
|||||||
|
Interest-earning assets
|
137,163
|
|
3,629
|
|
3.52
|
|
129,118
|
|
3,144
|
|
3.23
|
|
8,045
|
|
29
|
|
|||||||
|
Allowance for loan and lease losses
|
(1,226
|
)
|
(1,225
|
)
|
(1
|
)
|
|||||||||||||||||
|
Goodwill
|
6,882
|
|
6,876
|
|
6
|
|
|||||||||||||||||
|
Other noninterest-earning assets
|
6,744
|
|
7,026
|
|
(282
|
)
|
|||||||||||||||||
|
Total noninterest-earning assets
|
12,400
|
|
12,677
|
|
(277
|
)
|
|||||||||||||||||
|
Total assets
|
|
$149,563
|
|
|
$141,795
|
|
|
|
|
$7,768
|
|
||||||||||||
|
Liabilities and Stockholders’ Equity
|
|||||||||||||||||||||||
|
Checking with interest
|
|
$21,457
|
|
|
$56
|
|
0.35
|
%
|
|
$19,001
|
|
|
$24
|
|
0.17
|
%
|
|
$2,456
|
|
18 bps
|
|||
|
Money market accounts
|
37,439
|
|
140
|
|
0.50
|
|
36,673
|
|
95
|
|
0.35
|
|
766
|
|
15
|
||||||||
|
Regular savings
|
9,355
|
|
3
|
|
0.04
|
|
8,646
|
|
3
|
|
0.04
|
|
709
|
|
—
|
||||||||
|
Term deposits
|
15,104
|
|
112
|
|
0.99
|
|
12,530
|
|
72
|
|
0.77
|
|
2,574
|
|
22
|
||||||||
|
Total interest-bearing deposits
|
83,355
|
|
311
|
|
0.50
|
|
76,850
|
|
194
|
|
0.34
|
|
6,505
|
|
16
|
||||||||
|
Federal funds purchased and securities sold under agreements to repurchase
(1)
|
807
|
|
2
|
|
0.36
|
|
922
|
|
2
|
|
0.22
|
|
(115
|
)
|
14
|
||||||||
|
Other short-term borrowed funds
|
2,283
|
|
22
|
|
1.23
|
|
3,133
|
|
33
|
|
1.38
|
|
(850
|
)
|
(15)
|
||||||||
|
Long-term borrowed funds
|
12,755
|
|
201
|
|
2.10
|
|
10,375
|
|
143
|
|
1.84
|
|
2,380
|
|
26
|
||||||||
|
Total borrowed funds
|
15,845
|
|
225
|
|
1.88
|
|
14,430
|
|
178
|
|
1.63
|
|
1,415
|
|
25
|
||||||||
|
Total interest-bearing liabilities
|
99,200
|
|
536
|
|
0.72
|
|
91,280
|
|
372
|
|
0.54
|
|
7,920
|
|
18
|
||||||||
|
Demand deposits
|
27,886
|
|
27,362
|
|
524
|
|
|
||||||||||||||||
|
Other liabilities
|
2,613
|
|
3,191
|
|
(578
|
)
|
|
||||||||||||||||
|
Total liabilities
|
129,699
|
|
121,833
|
|
7,866
|
|
|
||||||||||||||||
|
Stockholders’ equity
|
19,864
|
|
19,962
|
|
(98
|
)
|
|
||||||||||||||||
|
Total liabilities and stockholders’ equity
|
|
$149,563
|
|
|
$141,795
|
|
|
$7,768
|
|
|
|||||||||||||
|
Interest rate spread
|
2.80
|
%
|
2.69
|
%
|
11
|
||||||||||||||||||
|
Net interest income
|
|
$3,093
|
|
|
$2,772
|
|
|
||||||||||||||||
|
Net interest margin
|
3.00
|
%
|
2.85
|
%
|
15 bps
|
||||||||||||||||||
|
Memo: Total deposits (interest-bearing and demand)
|
|
$111,241
|
|
|
$311
|
|
0.37
|
%
|
|
$104,212
|
|
|
$194
|
|
0.25
|
%
|
|
$7,029
|
|
12 bps
|
|||
(1)
Balances are net of certain short-term receivables associated with reverse repurchase agreements, as applicable. Interest expense includes the full cost of the repurchase agreements and certain hedging costs. See “—Analysis of Financial Condition — Derivatives” for further information.
27
CITIZENS FINANCIAL GROUP, INC.
MANAGEMENT’S DISCUSSION AND ANALYSIS
Net interest income of
$3.1 billion
in the first nine months of
2017
increase
d
$321 million
, or
12%
, compared to
$2.8 billion
in the first nine months of 2016, reflecting
6%
average loan growth and a
15
basis point improvement in net interest margin.
Average interest-earning assets of
$137.2 billion
increase
d $
8.0 billion
, or
6%
, from the first nine months of 2016, driven by a
$3.6 billion
increase
in average commercial loans and leases, a
$3.0 billion
increase
in average retail loans, and a
$1.4 billion
increase
in average investments and interest-bearing cash and due from banks and deposits in banks. Commercial loan growth was driven by strength in commercial and commercial real estate. Retail loan growth was driven by strength in education, residential mortgage and other retail balances.
Average deposits of
$111.2 billion
increase
d
$7.0 billion
from the first nine months of 2016, reflecting growth in all categories with particular strength in checking with interest and term deposits. Total interest-bearing deposit costs of
$311 million
increase
d
$117 million
, or
60%
, from
$194 million
in 2016, primarily due to the impact of rising rates and a shift in mix toward commercial deposits.
Average total borrowed funds of
$15.8 billion
increase
d
$1.4 billion
from the first nine months of 2016, reflecting an
increase
in average long-term borrowed funds driven by issuances of senior notes. Total borrowed funds costs of
$225 million
increase
d
$47 million
from the first nine months of 2016. The total borrowed funds yield of
1.88%
in the first nine months of 2017
increase
d
25
basis points from 1.63% in the first nine months of 2016 due to an increase in long-term rates and a mix shift to long-term senior debt.
Net interest margin of
3.00%
increase
d
15
basis points compared to
2.85%
in the first nine months of 2016, driven by improved loan yields reflecting both higher interest rates and balance sheet optimization initiatives. These results were partially offset by the impact of investment portfolio growth and higher deposit and funding costs.
Average interest-earning asset yields of
3.52%
increase
d
29
basis points from 3.23% in the first nine months of 2016, while average interest-bearing liability costs of
0.72%
increase
d
18
basis points from 0.54% in the first nine months of 2016.
Noninterest Income
The following table presents the significant components of our noninterest income:
|
Three Months Ended September 30,
|
Nine Months Ended September 30,
|
||||||||||||||||||||||||||||
|
(in millions)
|
2017
|
|
2016
|
|
Change
|
|
Percent
|
|
2017
|
|
2016
|
|
Change
|
|
Percent
|
|
|||||||||||||
|
Service charges and fees
(1)
|
|
$131
|
|
|
$134
|
|
|
($3
|
)
|
(2
|
%)
|
|
$385
|
|
|
$390
|
|
|
($5
|
)
|
(1
|
%)
|
|||||||
|
Card fees
|
58
|
|
52
|
|
6
|
|
12
|
|
177
|
|
153
|
|
24
|
|
16
|
|
|||||||||||||
|
Capital markets fees
(1)
|
53
|
|
36
|
|
17
|
|
47
|
|
152
|
|
99
|
|
53
|
|
54
|
|
|||||||||||||
|
Trust and investment services fees
|
38
|
|
37
|
|
1
|
|
3
|
|
116
|
|
112
|
|
4
|
|
4
|
|
|||||||||||||
|
Letter of credit and loan fees
(1)
|
30
|
|
28
|
|
2
|
|
7
|
|
90
|
|
83
|
|
7
|
|
8
|
|
|||||||||||||
|
Foreign exchange and interest rate products
(1)
|
24
|
|
28
|
|
(4
|
)
|
(14
|
)
|
77
|
|
72
|
|
5
|
|
7
|
|
|||||||||||||
|
Mortgage banking fees
|
27
|
|
33
|
|
(6
|
)
|
(18
|
)
|
80
|
|
76
|
|
4
|
|
5
|
|
|||||||||||||
|
Securities gains, net
|
2
|
|
—
|
|
2
|
|
100
|
|
9
|
|
13
|
|
(4
|
)
|
(31
|
)
|
|||||||||||||
|
Other income
(1)(2)
|
18
|
|
87
|
|
(69
|
)
|
(79
|
)
|
44
|
|
122
|
|
(78
|
)
|
(64
|
)
|
|||||||||||||
|
Noninterest income
|
|
$381
|
|
|
$435
|
|
|
($54
|
)
|
(12
|
%)
|
|
$1,130
|
|
|
$1,120
|
|
|
$10
|
|
1
|
%
|
|||||||
(1)
In first quarter 2017, certain prior period noninterest income amounts reported in the Consolidated Statement of Operations were reclassified to enhance transparency and provide additional granularity, particularly with regard to fee income related to customer activity. These changes had no effect on net income as previously reported.
(2)
Includes net securities impairment losses on securities available for sale recognized in earnings, bank-owned life insurance income and other income.
Noninterest income of
$381 million
decrease
d
$54 million
, or
12%
, from
$435 million
in third quarter 2016. Third quarter 2017 results reflect strength in capital market fees and card fees, offset by a $69 million decrease in other income. C
ard fees
increase
d
$6 million
, reflecting the benefit of revised contract terms for processing fees and an increase in purchase volume. Capital markets fees
increase
d
$17 million
, reflecting strength in loan syndications, bond and equity underwriting fees and advisory fees given stronger market volumes and the investments made to broaden our capabilities. On an Adjusted basis,* excluding the $67 million net impact of 2016 notable items, noninterest income increased $13 million, or 4%.
Noninterest income of
$1.1 billion
increase
d
$10 million
, or
1%
, compared to the first nine months of 2016 driven by capital market fees, card fees, letter of credit and loan fees, foreign exchange and interest rate products, mortgage banking fees and trust and investment service fees, partially offset by a reduc
tion in other income. Capital markets
fees
increase
d
$53 million
, reflecting underlying business momentum and the impact of building capabilities.
28
CITIZENS FINANCIAL GROUP, INC.
MANAGEMENT’S DISCUSSION AND ANALYSIS
Card fees and mortgage banking fees
increase
d
$24 million
and
$4 million
, respectively, from the first nine months of 2016.
Underlying* noninterest income of $1.1 billion increased $21 million, or 2%, excluding the $11 million impact of finance lease impairments.
On an Adjusted basis,* excluding the $67 million net impact of notable items, noninterest income increased $77 million, or 7%.
Provision for Credit Losses
The provision for credit losses of
$72 million
in third quarter 2017
decrease
d
$14 million
from
$86 million
in third quarter 2016, largely reflecting strong overall portfolio credit quality and lower net charge-offs. Third quarter 2017 net charge-offs of $65 million were $18 million lower than third quarter 2016 reflecting a $19 million decrease in total commercial net charge-offs.
The third quarter 2017 results reflected a $7 million increase in the allowance for credit losses compared to a $3 million increase in the third quarter 2016. The third quarter 2017 increase included reserves associated with estimated hurricane exposure. Overall credit quality remained strong reflecting growth in high quality, lower risk retail loans and a broadly stable commercial risk profile.
The provision for credit losses of
$238 million
decrease
d
$29 million
for the first nine months of 2017 from
$267 million
for the first nine months of
2016
, primarily due to continued asset improvement and a decline in net charge-offs. The first nine months of 2017 results reflected an $11 million reserve build, compared to a $36 million reserve build in the first nine months of 2016, largely due to loan growth as well as the shift in asset mix toward lower risk retail loans. Net charge-offs for the first nine months of 2017 of $227 million were $4 million lower than the first nine months of 2016 reflecting a $7 million decrease in total retail net charge-offs.
Total Underlying credit-related costs of $264 million,* including lease impairments, were relatively stable with the first nine months of 2016.
The provision for loan and lease losses is the result of a detailed analysis performed to estimate an appropriate and adequate ALLL. The total provision for credit losses includes the provision for loan and lease losses as well as the provision for unfunded commitments. Refer to “—Analysis of Financial Condition — Allowance for Credit Losses and Nonperforming Assets” for more information.
Noninterest Expense
The following table presents the significant components of our noninterest expense:
|
Three Months Ended September 30,
|
Nine Months Ended September 30,
|
||||||||||||||||||||||||||||
|
(in millions)
|
2017
|
|
2016
|
|
Change
|
|
Percent
|
|
2017
|
|
2016
|
|
Change
|
|
Percent
|
|
|||||||||||||
|
Salaries and employee benefits
|
|
$436
|
|
|
$432
|
|
|
$4
|
|
1
|
%
|
|
$1,312
|
|
|
$1,289
|
|
|
$23
|
|
2
|
%
|
|||||||
|
Outside services
|
99
|
|
102
|
|
(3
|
)
|
(3
|
)
|
286
|
|
279
|
|
7
|
|
3
|
|
|||||||||||||
|
Occupancy
|
78
|
|
78
|
|
—
|
|
—
|
|
239
|
|
230
|
|
9
|
|
4
|
|
|||||||||||||
|
Equipment expense
|
65
|
|
65
|
|
—
|
|
—
|
|
196
|
|
194
|
|
2
|
|
1
|
|
|||||||||||||
|
Amortization of software
|
45
|
|
46
|
|
(1
|
)
|
(2
|
)
|
134
|
|
126
|
|
8
|
|
6
|
|
|||||||||||||
|
Other operating expense
|
135
|
|
144
|
|
(9
|
)
|
(6
|
)
|
409
|
|
387
|
|
22
|
|
6
|
|
|||||||||||||
|
Noninterest expense
|
|
$858
|
|
|
$867
|
|
|
($9
|
)
|
(1
|
%)
|
|
$2,576
|
|
|
$2,505
|
|
|
$71
|
|
3
|
%
|
|||||||
Noninterest expense of
$858 million
decrease
d
$9 million
, or
1%
, from
$867 million
in third quarter 2016, driven by a $36 million reduction tied to third quarter 2016 notable items. On an Adjusted basis,* excluding the $36 million impact of 2016 notable items, noninterest expense increased $27 million, or 3%, largely reflecting higher salaries and employee benefits and outside services driven by the impact of strategic growth initiatives. Adjusted results* also reflect stable occupancy and equipment expense, and an increase in other expense, largely due to higher advertising expense and legacy home equity operational items, partially offset by lower credit collection costs.
Noninterest expense of
$2.6 billion
in the first nine months of 2017
increase
d
$71 million
, or
3%
, compared to the first nine months of 2016, reflecting the
$15 million impact of operating lease impairments and an increase in salaries and employee benefits driven by higher revenue-based incentives and merit increase.
The first nine months of 2017 compared to the first nine months of 2016 also reflected an increase in occupancy, amortization of software, outside services and equipment expense given continued investments in the franchise as well as higher FDIC expense and fraud and regulatory costs
. On an Underlying basis,* noninterest expense increased $56 million,
29
CITIZENS FINANCIAL GROUP, INC.
MANAGEMENT’S DISCUSSION AND ANALYSIS
or 2%, excluding the $15 million impact of operating lease impairments. On an Adjusted basis,* excluding the $36 million impact of 2016 notable items, noninterest expense increased $107 million, or 4%.
Income Tax Expense
Income tax expense was
$165 million
and
$130 million
in third quarter 2017 and 2016, respectively. This resulted in an effective tax rate of
32.2%
and
30.5%
in third quarter 2017 and 2016, respectively. The increase in the effective tax rate was primarily attributable to the impact of federal and state tax credit recoveries recorded in third quarter 2016, partially offset by the impact of investments in historic tax credits in third quarter 2017.
Income tax expense was
$423 million
and
$357 million
for the first nine months of
2017
and
2016
, respectively. This resulted in an effective tax rate of
30.0%
and
31.9%
for the first nine months of
2017
and
2016
, respectively. The decrease in the effective income tax rate was driven by the impact of the settlement of certain state tax matters, investments in historic tax credits, and the accounting method change for share-based compensation (FASB Accounting Standards Update 2016-09) which we adopted in January 2017 on a prospective basis, partially offset by the prior year federal and state tax credit recoveries.
At
September 30, 2017
, our net deferred tax liability was
$744 million
, compared with
$714 million
at
December 31, 2016
. The increase in the net deferred tax liability was primarily attributable to the tax effect of net unrealized gains on securities and derivatives, partially offset by the tax effect of differences in the timing of deductions and income items for financial statement purposes versus taxable income purposes. For further discussion, see Note 9 “Income Taxes” to our unaudited interim Consolidated Financial Statements in Part I, Item 1 — Financial Statements, included in this report.
The Trump administration has announced plans to introduce tax reform intended to lower corporate income tax rates. Any legislation affecting income tax rates could have an impact on our future effective tax rate, the significance of which would depend on the timing, nature and scope of any such legislation, as well as the level and composition of our earnings. If tax legislation is passed, a reduction in the corporate income tax rate could lower our annual effective income tax rate and result in a one-time tax benefit associated with a revaluation of our net deferred tax liability.
30
CITIZENS FINANCIAL GROUP, INC.
MANAGEMENT’S DISCUSSION AND ANALYSIS
Business Segments
The following tables present certain financial data of our operating segments, Other and consolidated:
|
As of and for the Three Months Ended September 30, 2017
|
|||||||||||||||
|
(dollars in millions)
|
Consumer Banking
|
Commercial Banking
|
Other
(4)
|
|
Consolidated
|
|
|||||||||
|
Net interest income
|
|
$674
|
|
|
$354
|
|
|
$34
|
|
|
$1,062
|
|
|||
|
Noninterest income
|
227
|
|
136
|
|
18
|
|
381
|
|
|||||||
|
Total revenue
|
901
|
|
490
|
|
52
|
|
1,443
|
|
|||||||
|
Noninterest expense
|
648
|
|
195
|
|
15
|
|
858
|
|
|||||||
|
Profit before provision for credit losses
|
253
|
|
295
|
|
37
|
|
585
|
|
|||||||
|
Provision for credit losses
|
65
|
|
—
|
|
7
|
|
72
|
|
|||||||
|
Income before income tax expense
|
188
|
|
295
|
|
30
|
|
513
|
|
|||||||
|
Income tax expense
|
66
|
|
94
|
|
5
|
|
165
|
|
|||||||
|
Net income
|
|
$122
|
|
|
$201
|
|
|
$25
|
|
|
$348
|
|
|||
|
Loans and leases (period-end)
(1)
|
|
$59,211
|
|
|
$49,313
|
|
|
$2,851
|
|
|
$111,375
|
|
|||
|
Average Balances:
|
|||||||||||||||
|
Total assets
|
|
$60,012
|
|
|
$49,833
|
|
|
$40,167
|
|
|
$150,012
|
|
|||
|
Total loans and leases
(1)
|
58,679
|
|
48,746
|
|
2,796
|
|
110,221
|
|
|||||||
|
Deposits
|
75,085
|
|
30,751
|
|
7,111
|
|
112,947
|
|
|||||||
|
Interest-earning assets
|
58,729
|
|
48,875
|
|
29,875
|
|
137,479
|
|
|||||||
|
Key Performance Metrics:
|
|||||||||||||||
|
Net interest margin
(2)
|
4.55
|
%
|
2.88
|
%
|
NM
|
|
3.05
|
%
|
|||||||
|
Efficiency ratio
|
71.88
|
|
39.39
|
|
NM
|
|
59.41
|
|
|||||||
|
Average loans to average deposits ratio
(1)
|
78.15
|
|
158.52
|
|
NM
|
|
97.59
|
|
|||||||
|
Return on average total tangible assets
(2)
|
0.81
|
|
1.60
|
|
NM
|
|
0.96
|
|
|||||||
|
Return on average tangible common equity
(2) (3)
|
8.72
|
|
14.06
|
|
NM
|
|
10.13
|
|
|||||||
(1)
Includes loans held for sale.
(2)
Ratios for the period ended
September 30, 2017
are presented on an annualized basis.
(3)
Operating segments are allocated capital on a risk-adjusted basis considering economic and regulatory capital requirements. We approximate that regulatory capital is equivalent to a sustainable target level for CET1 and then allocate that approximation to the segments based on economic capital.
(4)
Includes the financial impact of non-core, liquidating loan portfolios and other non-core assets, our treasury activities, wholesale funding activities, securities portfolio, community development assets and other unallocated assets, liabilities, capital, revenues, provision for credit losses and expenses not attributed to our Consumer Banking or Commercial Banking segments. For a description of non-core assets, see “—Analysis of Financial Condition — Non-Core Assets.”
31
CITIZENS FINANCIAL GROUP, INC.
MANAGEMENT’S DISCUSSION AND ANALYSIS
|
As of and for the Three Months Ended September 30, 2016
|
|||||||||||||||
|
(dollars in millions)
|
Consumer Banking
|
Commercial Banking
|
Other
(4)
|
|
Consolidated
|
|
|||||||||
|
Net interest income
|
|
$621
|
|
|
$327
|
|
|
($3
|
)
|
|
$945
|
|
|||
|
Noninterest income
|
229
|
|
123
|
|
83
|
|
435
|
|
|||||||
|
Total revenue
|
850
|
|
450
|
|
80
|
|
1,380
|
|
|||||||
|
Noninterest expense
|
650
|
|
181
|
|
36
|
|
867
|
|
|||||||
|
Profit before provision for credit losses
|
200
|
|
269
|
|
44
|
|
513
|
|
|||||||
|
Provision for credit losses
|
57
|
|
19
|
|
10
|
|
86
|
|
|||||||
|
Income before income tax expense (benefit)
|
143
|
|
250
|
|
34
|
|
427
|
|
|||||||
|
Income tax expense (benefit)
|
51
|
|
88
|
|
(9
|
)
|
130
|
|
|||||||
|
Net income
|
|
$92
|
|
|
$162
|
|
|
$43
|
|
|
$297
|
|
|||
|
Loans and leases (period-end)
(1)
|
|
$56,230
|
|
|
$46,292
|
|
|
$3,471
|
|
|
$105,993
|
|
|||
|
Average Balances:
|
|||||||||||||||
|
Total assets
|
|
$56,689
|
|
|
$47,902
|
|
|
$39,808
|
|
|
$144,399
|
|
|||
|
Total loans and leases
(1)
|
55,376
|
|
46,611
|
|
2,592
|
|
104,579
|
|
|||||||
|
Deposits
|
72,141
|
|
27,847
|
|
6,658
|
|
106,646
|
|
|||||||
|
Interest-earning assets
|
55,423
|
|
46,666
|
|
29,580
|
|
131,669
|
|
|||||||
|
Key Performance Metrics:
|
|||||||||||||||
|
Net interest margin
(2)
|
4.46
|
%
|
2.79
|
%
|
NM
|
|
2.84
|
%
|
|||||||
|
Efficiency ratio
|
76.46
|
|
40.21
|
|
NM
|
|
62.88
|
|
|||||||
|
Average loans to average deposits ratio
(1)
|
76.76
|
|
167.38
|
|
NM
|
|
98.06
|
|
|||||||
|
Return on average total tangible assets
(2)
|
0.64
|
|
1.35
|
|
NM
|
|
0.86
|
|
|||||||
|
Return on average tangible common equity
(2) (3)
|
7.04
|
|
12.50
|
|
NM
|
|
8.58
|
|
|||||||
(1)
Includes loans held for sale.
(2)
Ratios for the period ended
September 30, 2016
are presented on an annualized basis.
(3)
Operating segments are allocated capital on a risk-adjusted basis considering economic and regulatory capital requirements. We approximate that regulatory capital is equivalent to a sustainable target level for CET1 and then allocate that approximation to the segments based on economic capital.
(4)
Includes the financial impact of non-core, liquidating loan portfolios and other non-core assets, our treasury activities, wholesale funding activities, securities portfolio, community development assets and other unallocated assets, liabilities, capital, revenues, provision for credit losses and expenses not attributed to our Consumer Banking or Commercial Banking segments. For a description of non-core assets, see “—Analysis of Financial Condition — Non-Core Assets.”
32
CITIZENS FINANCIAL GROUP, INC.
MANAGEMENT’S DISCUSSION AND ANALYSIS
|
As of and for the Nine Months Ended September 30, 2017
|
|||||||||||||||
|
(dollars in millions)
|
Consumer Banking
|
Commercial Banking
|
Other
(4)
|
|
Consolidated
|
|
|||||||||
|
Net interest income
|
|
$1,969
|
|
|
$1,044
|
|
|
$80
|
|
|
$3,093
|
|
|||
|
Noninterest income
|
676
|
|
400
|
|
54
|
|
1,130
|
|
|||||||
|
Total revenue
|
2,645
|
|
1,444
|
|
134
|
|
4,223
|
|
|||||||
|
Noninterest expense
|
1,939
|
|
577
|
|
60
|
|
2,576
|
|
|||||||
|
Profit before provision for credit losses
|
706
|
|
867
|
|
74
|
|
1,647
|
|
|||||||
|
Provision for credit losses
|
189
|
|
20
|
|
29
|
|
238
|
|
|||||||
|
Income before income tax expense (benefit)
|
517
|
|
847
|
|
45
|
|
1,409
|
|
|||||||
|
Income tax expense (benefit)
|
182
|
|
279
|
|
(38
|
)
|
423
|
|
|||||||
|
Net income
|
|
$335
|
|
|
$568
|
|
|
$83
|
|
|
$986
|
|
|||
|
Loans and leases (period-end)
(1)
|
|
$59,211
|
|
|
$49,313
|
|
|
$2,851
|
|
|
$111,375
|
|
|||
|
Average Balances:
|
|||||||||||||||
|
Total assets
|
|
$59,310
|
|
|
$49,604
|
|
|
$40,649
|
|
|
$149,563
|
|
|||
|
Total loans and leases
(1)
|
57,975
|
|
48,560
|
|
3,017
|
|
109,552
|
|
|||||||
|
Deposits
|
74,778
|
|
29,496
|
|
6,967
|
|
111,241
|
|
|||||||
|
Interest-earning assets
|
58,026
|
|
48,696
|
|
30,441
|
|
137,163
|
|
|||||||
|
Key Performance Metrics:
|
|||||||||||||||
|
Net interest margin
(2)
|
4.54
|
%
|
2.87
|
%
|
NM
|
|
3.00
|
%
|
|||||||
|
Efficiency ratio
|
73.28
|
|
39.89
|
|
NM
|
|
60.99
|
|
|||||||
|
Average loans to average deposits ratio
(1)
|
77.53
|
|
164.63
|
|
NM
|
|
98.48
|
|
|||||||
|
Return on average total tangible assets
(2)
|
0.76
|
|
1.53
|
|
NM
|
|
0.92
|
|
|||||||
|
Return on average tangible common equity
(2) (3)
|
8.13
|
|
13.54
|
|
NM
|
|
9.80
|
|
|||||||
(1)
Includes loans held for sale.
(2)
Ratios for the period ended
September 30, 2017
are presented on an annualized basis.
(3)
Operating segments are allocated capital on a risk-adjusted basis considering economic and regulatory capital requirements. We approximate that regulatory capital is equivalent to a sustainable target level for CET1 and then allocate that approximation to the segments based on economic capital.
(4)
Includes the financial impact of non-core, liquidating loan portfolios and other non-core assets, our treasury activities, wholesale funding activities, securities portfolio, community development assets and other unallocated assets, liabilities, capital, revenues, provision for credit losses and expenses not attributed to our Consumer Banking or Commercial Banking segments. For a description of non-core assets, see “—Analysis of Financial Condition — Non-Core Assets.”
33
CITIZENS FINANCIAL GROUP, INC.
MANAGEMENT’S DISCUSSION AND ANALYSIS
|
As of and for the Nine Months Ended September 30, 2016
|
||||||||||||||||
|
(dollars in millions)
|
Consumer Banking
|
Commercial Banking
|
Other
(4)
|
|
Consolidated
|
|||||||||||
|
Net interest income
|
|
$1,804
|
|
|
$941
|
|
|
$27
|
|
|
$2,772
|
|
||||
|
Noninterest income
|
656
|
|
344
|
|
120
|
|
1,120
|
|
||||||||
|
Total revenue
|
2,460
|
|
1,285
|
|
147
|
|
3,892
|
|
||||||||
|
Noninterest expense
|
1,898
|
|
554
|
|
53
|
|
2,505
|
|
||||||||
|
Profit before provision for credit losses
|
562
|
|
731
|
|
94
|
|
1,387
|
|
||||||||
|
Provision for credit losses
|
169
|
|
27
|
|
71
|
|
267
|
|
||||||||
|
Income before income tax expense (benefit)
|
393
|
|
704
|
|
23
|
|
1,120
|
|
||||||||
|
Income tax expense (benefit)
|
140
|
|
245
|
|
(28
|
)
|
357
|
|
||||||||
|
Net income
|
|
$253
|
|
|
$459
|
|
|
$51
|
|
|
$763
|
|
||||
|
Loans and leases (period-end)
(1)
|
|
$56,230
|
|
|
$46,292
|
|
|
$3,471
|
|
|
$105,993
|
|
||||
|
Average Balances:
|
||||||||||||||||
|
Total assets
|
|
$55,825
|
|
|
$46,869
|
|
|
$39,101
|
|
|
$141,795
|
|
||||
|
Total loans and leases
(1)
|
54,494
|
|
—
|
|
45,532
|
|
2,874
|
|
102,900
|
|
||||||
|
Deposits
|
71,627
|
|
25,938
|
|
6,647
|
|
104,212
|
|
||||||||
|
Interest-earning assets
|
54,542
|
|
45,611
|
|
28,965
|
|
129,118
|
|
||||||||
|
Key Metrics
|
||||||||||||||||
|
Net interest margin
(2)
|
4.42
|
%
|
2.76
|
%
|
NM
|
|
2.85
|
%
|
||||||||
|
Efficiency ratio
|
77.15
|
|
43.15
|
|
NM
|
|
64.36
|
|
||||||||
|
Average loans to average deposits ratio
(1)
|
76.08
|
|
175.54
|
|
NM
|
|
98.74
|
|
||||||||
|
Return on average total tangible assets
(2)
|
0.60
|
|
1.31
|
|
NM
|
|
0.75
|
|
||||||||
|
Return on average tangible common equity
(2) (3)
|
6.58
|
|
12.27
|
|
NM
|
|
7.51
|
|
||||||||
(1)
Includes loans held for sale.
(2)
Ratios for the period ended September 30, 2016 are presented on an annualized basis.
(3)
Operating segments are allocated capital on a risk-adjusted basis considering economic and regulatory capital requirements. We approximate that regulatory capital is equivalent to a sustainable target level for CET1 and then allocate that approximation to the segments based on economic capital.
(4)
Includes the financial impact of non-core, liquidating loan portfolios and other non-core assets, our treasury activities, wholesale funding activities, securities portfolio, community development assets and other unallocated assets, liabilities, capital, revenues, provision for credit losses and expenses not attributed to our Consumer Banking or Commercial Banking segments. For a description of non-core assets, see “—Analysis of Financial Condition — Non-Core Assets.”
We operate our business through two operating segments: Consumer Banking and Commercial Banking. Segment results are derived by specifically attributing managed assets, liabilities, capital and their related revenues, provision for credit losses and expenses. Non-segment operations are classified as Other, which includes corporate functions, the Treasury function, the securities portfolio, wholesale funding activities, intangible assets, community development, non-core assets (including legacy Royal Bank of Scotland Group plc aircraft loan and leasing), and other unallocated assets, liabilities, capital, revenues, provision for credit losses and expenses. For a description of non-core assets, see “—Analysis of Financial Condition — Non-Core Assets.” In addition, Other includes goodwill and any associated goodwill impairment charges. For impairment testing purposes, we allocate goodwill to Consumer Banking and Commercial Banking reporting units. For management reporting purposes, we present the goodwill balance (and any related impairment charges) in Other.
Our capital levels are evaluated and managed centrally, however, capital is allocated to the operating segments to support evaluation of business performance. Operating segments are allocated capital on a risk-adjusted basis considering economic and regulatory capital requirements. We approximate that regulatory capital is equivalent to a sustainable target level for common equity tier 1 and then allocate that approximation to the segments based on economic capital. Interest income and expense is determined based on the assets and liabilities managed by the business segment. Because funding and asset liability management is a central function, funds transfer-pricing methodologies are utilized to allocate a cost of funds used, or credit for the funds provided, to all business segment assets, liabilities and capital, respectively, using a matched-funding concept. The residual effect on net interest income of asset/liability management, including the residual net interest income related to the funds transfer pricing process, is included in Other.
34
CITIZENS FINANCIAL GROUP, INC.
MANAGEMENT’S DISCUSSION AND ANALYSIS
Provision for credit losses is allocated to each business segment based on actual net charge-offs that have been recognized by the business segment. The difference between the consolidated provision for credit losses and the business segments’ net charge-offs is reflected in Other.
Noninterest income and expense directly managed by each business segment, including fees, service charges, salaries and benefits, and other direct revenues and costs are accounted for within each segment’s financial results in a manner similar to our unaudited interim Consolidated Financial Statements. Occupancy costs are allocated based on utilization of facilities by the business segment. Noninterest expenses incurred by centrally managed operations or business segments that directly support another business segment’s operations are charged to the applicable business segment based on its utilization of those services.
Income taxes are assessed to each business segment at a standard tax rate with the residual tax expense or benefit to arrive at the consolidated effective tax rate included in Other.
Developing and applying methodologies used to allocate items among the business segments is a dynamic process. Accordingly, financial results may be revised periodically as management systems are enhanced, methods of evaluating performance or product lines change, or our organizational structure changes.
Consumer Banking
|
As of and for the Three Months Ended September 30,
|
As of and for the Nine Months Ended September 30,
|
||||||||||||||||||||||||||||
|
(dollars in millions)
|
2017
|
|
2016
|
|
Change
|
Percent
|
|
2017
|
|
|
2016
|
|
|
Change
|
|
Percent
|
|
||||||||||||
|
Net interest income
|
|
$674
|
|
|
$621
|
|
|
$53
|
|
9
|
%
|
|
$1,969
|
|
|
|
$1,804
|
|
|
|
$165
|
|
|
9
|
%
|
||||
|
Noninterest income
|
227
|
|
229
|
|
(2
|
)
|
(1
|
)
|
676
|
|
|
656
|
|
|
20
|
|
|
3
|
|
||||||||||
|
Total revenue
|
901
|
|
850
|
|
51
|
|
6
|
|
2,645
|
|
|
2,460
|
|
|
185
|
|
|
8
|
|
||||||||||
|
Noninterest expense
|
648
|
|
650
|
|
(2
|
)
|
-
|
|
1,939
|
|
|
1,898
|
|
|
41
|
|
|
2
|
|
||||||||||
|
Profit before provision for credit losses
|
253
|
|
200
|
|
53
|
|
27
|
|
706
|
|
|
562
|
|
|
144
|
|
|
26
|
|
||||||||||
|
Provision for credit losses
|
65
|
|
57
|
|
8
|
|
14
|
|
189
|
|
|
169
|
|
|
20
|
|
|
12
|
|
||||||||||
|
Income before income tax expense
|
188
|
|
143
|
|
45
|
|
31
|
|
517
|
|
|
393
|
|
|
124
|
|
|
32
|
|
||||||||||
|
Income tax expense
|
66
|
|
51
|
|
15
|
|
29
|
|
182
|
|
|
140
|
|
|
42
|
|
|
30
|
|
||||||||||
|
Net income
|
|
$122
|
|
|
$92
|
|
|
$30
|
|
33
|
|
|
$335
|
|
|
|
$253
|
|
|
|
$82
|
|
|
32
|
|
||||
|
Loans and leases (period-end)
(1)
|
|
$59,211
|
|
|
$56,230
|
|
|
$2,981
|
|
5
|
|
|
$59,211
|
|
|
|
$56,230
|
|
|
|
$2,981
|
|
|
5
|
|
||||
|
Average Balances:
|
|
|
|
|
|
|
|||||||||||||||||||||||
|
Total assets
|
|
$60,012
|
|
|
$56,689
|
|
|
$3,323
|
|
6
|
%
|
|
$59,310
|
|
|
|
$55,825
|
|
|
|
$3,485
|
|
|
6
|
%
|
||||
|
Total loans and leases
(1)
|
58,679
|
|
55,376
|
|
3,303
|
|
6
|
|
57,975
|
|
|
54,494
|
|
|
3,481
|
|
|
6
|
|
||||||||||
|
Deposits
|
75,085
|
|
72,141
|
|
2,944
|
|
4
|
|
74,778
|
|
|
71,627
|
|
|
3,151
|
|
|
4
|
|
||||||||||
|
Interest-earning assets
|
58,729
|
|
55,423
|
|
3,306
|
|
6
|
|
58,026
|
|
|
54,542
|
|
|
3,484
|
|
|
6
|
|
||||||||||
|
Key Performance Metrics:
|
|
|
|
|
|
||||||||||||||||||||||||
|
Net interest margin
(2)
|
4.55
|
%
|
4.46
|
%
|
9
|
bps
|
4.54
|
%
|
|
4.42
|
%
|
|
12
|
bps
|
|
||||||||||||||
|
Efficiency ratio
|
71.88
|
|
76.46
|
|
(458
|
) bps
|
73.28
|
|
|
77.15
|
|
|
(387
|
) bps
|
|
||||||||||||||
|
Average loans to average deposits ratio
(1)
|
78.15
|
|
76.76
|
|
139
|
bps
|
77.53
|
|
|
76.08
|
|
|
145
|
bps
|
|
||||||||||||||
|
Return on average total tangible assets
(2)
|
0.81
|
|
0.64
|
|
17
|
bps
|
0.76
|
|
|
0.60
|
|
|
16
|
bps
|
|
||||||||||||||
|
Return on average tangible common equity
(2) (3)
|
8.72
|
|
7.04
|
|
168
|
bps
|
8.13
|
|
|
6.58
|
|
|
155
|
bps
|
|
||||||||||||||
(1)
Includes loans held for sale.
(2)
Ratios for the periods ended
September 30, 2017
and 2016 are presented on an annualized basis.
(3)
Operating segments are allocated capital on a risk-adjusted basis considering economic and regulatory capital requirements. We approximate that regulatory capital is equivalent to a sustainable target level for CET1 and then allocate that approximation to the segments based on economic capital.
Consumer Banking net income of
$122 million
increased
$30 million
, or
33%
, from
$92 million
in third quarter 2016, reflecting a
$51 million
increase
in total revenue relative to a
$2 million
decrease
in noninterest expense. Net interest income of
$674 million
increased
$53 million
, or
9%
, from third quarter 2016, driven by a
$3.3 billion
increase
in average loans, driven by growth in mortgage, education and unsecured retail loan balances, and higher rates and mix shift were partially offset by an increase in deposit costs.
Noninterest income of
$227 million
was
relatively stable
with third quarter 2016, largely reflecting growth in card fees and a reduction in mortgage banking fees and service charges and fees. Noninterest expense of
$648 million
remained relatively stable as lower software amortization and lower other operating expenses, largely home equity systems and operational costs, were partially offset by higher FDIC expense, salaries and benefits and
35
CITIZENS FINANCIAL GROUP, INC.
MANAGEMENT’S DISCUSSION AND ANALYSIS
advertising expense. Provision for credit losses of
$65 million
increased
$8 million
, or
14%
, from
$57 million
in third quarter 2016, primarily driven by higher net charge-offs in auto, retail unsecured, home equity and education.
Consumer Banking net income of
$335 million
increased
$82 million
, or
32%
, from
$253 million
in the first nine months of 2016, as the benefit of a
$185 million
increase
in total revenue more than offset a
$41 million
increase
in noninterest expense. Net interest income of
$2.0 billion
increased
$165 million
, or
9%
, from the first nine months of 2016, driven by the benefit of a
$3.5 billion
increase in average loans led by residential mortgage, education and retail unsecured categories, partially offset by an increase in deposit costs.
Noninterest income
increased
$20 million
, or
3%
, from the first nine months of 2016, driven by an increase in card fees and mortgage banking fees, partially offset by lower service charges and fees. Noninterest expense of
$1.9 billion
increased
$41 million
, or
2%
, from the first nine months of 2016, driven by higher outside services, FDIC expense, salaries and benefits, occupancy costs, software amortization and advertising expense. These results were partially offset by lower credit collection costs. Provision for credit losses of
$189 million
increased
$20 million
, or
12%
, from
$169 million
in the first nine months of 2016, largely driven by higher net charge-offs in auto.
Commercial Banking
|
As of and for the Three Months Ended September 30,
|
As of and for the Nine Months Ended September 30,
|
||||||||||||||||||||||||||||
|
(dollars in millions)
|
2017
|
|
2016
|
|
Change
|
Percent
|
|
2017
|
|
2016
|
|
Change
|
Percent
|
|
|||||||||||||||
|
Net interest income
|
|
$354
|
|
|
$327
|
|
|
$27
|
|
8
|
%
|
|
$1,044
|
|
|
$941
|
|
|
$103
|
|
11
|
%
|
|||||||
|
Noninterest income
|
136
|
|
123
|
|
13
|
|
11
|
|
400
|
|
344
|
|
56
|
|
16
|
|
|||||||||||||
|
Total revenue
|
490
|
|
450
|
|
40
|
|
9
|
|
1,444
|
|
1,285
|
|
159
|
|
12
|
|
|||||||||||||
|
Noninterest expense
|
195
|
|
181
|
|
14
|
|
8
|
|
577
|
|
554
|
|
23
|
|
4
|
|
|||||||||||||
|
Profit before provision for credit losses
|
295
|
|
269
|
|
26
|
|
10
|
|
867
|
|
731
|
|
136
|
|
19
|
|
|||||||||||||
|
Provision for credit losses
|
—
|
|
19
|
|
(19
|
)
|
(100
|
)
|
20
|
|
27
|
|
(7
|
)
|
(26
|
)
|
|||||||||||||
|
Income before income tax expense
|
295
|
|
250
|
|
45
|
|
18
|
|
847
|
|
704
|
|
143
|
|
20
|
|
|||||||||||||
|
Income tax expense
|
94
|
|
88
|
|
6
|
|
7
|
|
279
|
|
245
|
|
34
|
|
14
|
|
|||||||||||||
|
Net income
|
|
$201
|
|
|
$162
|
|
|
$39
|
|
24
|
|
|
$568
|
|
|
$459
|
|
|
$109
|
|
24
|
|
|||||||
|
Loans and leases (period-end)
(1)
|
|
$49,313
|
|
|
$46,292
|
|
|
$3,021
|
|
7
|
|
|
$49,313
|
|
|
$46,292
|
|
|
$3,021
|
|
7
|
|
|||||||
|
Average Balances:
|
|
|
|
|
|
|
|||||||||||||||||||||||
|
Total assets
|
|
$49,833
|
|
|
$47,902
|
|
|
$1,931
|
|
4
|
%
|
|
$49,604
|
|
|
$46,869
|
|
|
$2,735
|
|
6
|
%
|
|||||||
|
Total loans and leases
(1)
|
48,746
|
|
46,611
|
|
2,135
|
|
5
|
|
48,560
|
|
45,532
|
|
3,028
|
|
7
|
|
|||||||||||||
|
Deposits
|
30,751
|
|
27,847
|
|
2,904
|
|
10
|
|
29,496
|
|
25,938
|
|
3,558
|
|
14
|
|
|||||||||||||
|
Interest-earning assets
|
48,875
|
|
46,666
|
|
2,209
|
|
5
|
|
48,696
|
|
45,611
|
|
3,085
|
|
7
|
|
|||||||||||||
|
Key Performance Metrics:
|
|
|
|||||||||||||||||||||||||||
|
Net interest margin
(2)
|
2.88
|
%
|
2.79
|
%
|
9
|
bps
|
2.87
|
%
|
2.76
|
%
|
11
|
bps
|
|||||||||||||||||
|
Efficiency ratio
|
39.39
|
|
40.21
|
|
(82
|
) bps
|
39.89
|
|
43.15
|
|
(326
|
) bps
|
|||||||||||||||||
|
Average loans to average deposits ratio
(1)
|
158.52
|
|
167.38
|
|
(886
|
) bps
|
164.63
|
|
175.54
|
|
(1,091
|
) bps
|
|||||||||||||||||
|
Return on average total tangible assets
(2)
|
1.60
|
|
1.35
|
|
25
|
bps
|
1.53
|
|
1.31
|
|
22
|
bps
|
|||||||||||||||||
|
Return on average tangible common equity
(2) (3)
|
14.06
|
|
12.50
|
|
156
|
bps
|
13.54
|
|
12.27
|
|
127
|
bps
|
|||||||||||||||||
(1)
Includes loans held for sale.
(2)
Ratios for the periods ended
September 30, 2017
and 2016 are presented on an annualized basis.
(3)
Operating segments are allocated capital on a risk-adjusted basis considering economic and regulatory capital requirements. We approximate that regulatory capital is equivalent to a sustainable target level for CET1 and then allocate that approximation to the segments based on economic capital.
Commercial Banking net income of
$201 million
increased
$39 million
, or
24%
, from
$162 million
in third quarter 2016, driven by a
$40 million
increase
in total revenue and a
$19 million
decrease
in provision for credit losses, partially offset by a
$14 million
increase
in noninterest expense. Net interest income of
$354 million
increased
$27 million
, or
8%
, from
$327 million
in third quarter 2016, driven by
5%
average loan growth and improved loan yields, partially offset by higher deposit costs.
Average loans and leases
increase
d
$2.1 billion
from third quarter 2016, driven by growth in Middle Market, Commercial Real Estate, Corporate Finance, Franchise and Mid-corporate with good momentum from geographic expansion initiatives, partially offset by the impact of the third quarter 2016 transfer of $1.2 billion of loans and leases to non-core.
36
CITIZENS FINANCIAL GROUP, INC.
MANAGEMENT’S DISCUSSION AND ANALYSIS
Noninterest income of
$136 million
increased
$13 million
, or
11%
, from
$123 million
in third quarter 2016 that included a $4 million reduction tied to lease impairments, reflecting strength in capital markets, letter of credit and loan fees and card fees.
Noninterest expense of
$195 million
increased
$14 million
, or
8%
, from
$181 million
in third quarter 2016, reflecting higher salaries and benefits, amortization of software, credit costs and outside services expense, partially offset by lower depreciation expense tied to the third quarter transfer of the aircraft portfolio to non-core. Provision for credit losses decreased $19 million from higher third quarter 2016 levels that reflected higher net charge-offs in the energy portfolio.
Commercial Banking net income of
$568 million
increased
$109 million
, or
24%
, from
$459 million
in the first nine months of 2016, as the benefit of a
$159 million
increase
in total revenue and a
$7 million
decrease
in provision for credit losses was partially offset by a
$23 million
increase
in noninterest expense. Net interest income of
$1.0 billion
increased
$103 million
, or
11%
, from
$941 million
in the first nine months of 2016, reflecting a
$3.0 billion
increase
in average loans and leases, improved loan and deposit spreads, and a
$3.6 billion
increase in average deposits.
Noninterest income of
$400 million
increased
$56 million
, or
16%
, from
$344 million
in the first nine months of 2016, reflecting strength in capital markets, letter of credit and loan fees and foreign exchange and interest rate products, partially offset by a
$4 million impact related to finance lease impairments. Noninterest expense of
$577 million
increased
$23 million
, or
4%
, from
$554 million
in the first nine months of 2016, largely d
riven by higher salaries and employee benefits, FDIC expense, software amortization and equipment expense, partially offset by a reduction in outside services. Provision for credit losses of
$20 million
decreased
$7 million
from the first nine months of 2016, driven by higher net charge-offs in 2016.
Other
|
As of and for the Three Months Ended September 30,
|
As of and for the Nine Months Ended September 30,
|
||||||||||||||||||||||||||||
|
(in millions)
|
2017
|
|
2016
|
|
Change
|
|
Percent
|
|
2017
|
|
2016
|
|
Change
|
|
Percent
|
|
|||||||||||||
|
Net interest income
|
|
$34
|
|
|
($3
|
)
|
|
$37
|
|
NM
|
|
|
$80
|
|
|
$27
|
|
|
$53
|
|
196
|
%
|
|||||||
|
Noninterest income
|
18
|
|
83
|
|
(65
|
)
|
(78
|
)
|
54
|
|
120
|
|
(66
|
)
|
(55
|
)
|
|||||||||||||
|
Total revenue
|
52
|
|
80
|
|
(28
|
)
|
(35
|
)
|
134
|
|
147
|
|
(13
|
)
|
(9
|
)
|
|||||||||||||
|
Noninterest expense
|
15
|
|
36
|
|
(21
|
)
|
(58
|
)
|
60
|
|
53
|
|
7
|
|
13
|
|
|||||||||||||
|
Profit before provision for credit losses
|
37
|
|
44
|
|
(7
|
)
|
(16
|
)
|
74
|
|
94
|
|
(20
|
)
|
(21
|
)
|
|||||||||||||
|
Provision for credit losses
|
7
|
|
10
|
|
(3
|
)
|
(30
|
)
|
29
|
|
71
|
|
(42
|
)
|
(59
|
)
|
|||||||||||||
|
Income before income tax expense (benefit)
|
30
|
|
34
|
|
(4
|
)
|
(12
|
)
|
45
|
|
23
|
|
22
|
|
96
|
|
|||||||||||||
|
Income tax expense (benefit)
|
5
|
|
(9
|
)
|
14
|
|
156
|
|
(38
|
)
|
(28
|
)
|
(10
|
)
|
(36
|
)
|
|||||||||||||
|
Net income
|
|
$25
|
|
|
$43
|
|
|
($18
|
)
|
(42
|
)
|
|
$83
|
|
|
$51
|
|
|
$32
|
|
63
|
|
|||||||
|
Loans and leases (period-end)
(1)
|
|
$2,851
|
|
|
$3,471
|
|
|
($620
|
)
|
(18
|
)
|
|
$2,851
|
|
|
$3,471
|
|
|
($620
|
)
|
(18
|
)
|
|||||||
|
Average Balances:
|
|
|
|
|
|
|
|||||||||||||||||||||||
|
Total assets
|
|
$40,167
|
|
|
$39,808
|
|
|
$359
|
|
1
|
%
|
|
$40,649
|
|
|
$39,101
|
|
|
$1,548
|
|
4
|
%
|
|||||||
|
Total loans and leases
(1)
|
2,796
|
|
2,592
|
|
204
|
|
8
|
|
3,017
|
|
2,874
|
|
143
|
|
5
|
|
|||||||||||||
|
Deposits
|
7,111
|
|
6,658
|
|
453
|
|
7
|
|
6,967
|
|
6,647
|
|
320
|
|
5
|
|
|||||||||||||
|
Interest-earning assets
|
29,875
|
|
29,580
|
|
295
|
|
1
|
|
30,441
|
|
28,965
|
|
1,476
|
|
5
|
|
|||||||||||||
(1)
Includes loans held for sale.
Other net income of
$25 million
decreased
$18 million
from third quarter 2016. Net interest income
increased
$37 million
, driven by higher residual funds transfer pricing and higher investment portfolio income, partially offset by higher funding costs.
Noninterest income
decreased
$65 million
, reflecting the $67 million net impact of notable items recorded in third quarter 2016. Noninterest expense
decreased
$21 million
from third quarter 2016, which reflected the impact of other notable items, partially offset by higher legacy home equity operational expense. Pr
ovision for credit losses
decreased
$3 million
, reflecting lower non-core net charge-offs that were partially offset by a higher reserve build in third quarter 2017 versus third quarter 2016.
Other net income of
$83 million
increased
from
$51 million
in the first nine months of 2016, driven by a $23 million benefit related to settlement of state tax matters in first quarter 2017 as well as a $19 million after-tax impact related to third quarter 2016 notable items.
Results also reflect an increase of $53 million in net interest income and lower net charge-offs and a reserve build of $11 million in the first nine months of 2017, compared to a reserve build of $36 million in the first nine months of 2016.
37
CITIZENS FINANCIAL GROUP, INC.
MANAGEMENT’S DISCUSSION AND ANALYSIS
ANALYSIS OF FINANCIAL CONDITION
Securities
Our securities portfolio is managed to maintain prudent levels of liquidity, credit quality and market risk while achieving appropriate returns. The following table presents our securities AFS and HTM:
|
September 30, 2017
|
December 31, 2016
|
|||||||||||||||||||||
|
(in millions)
|
Amortized
Cost
|
Fair Value
|
Amortized
Cost
|
Fair Value
|
Change in Fair Value
|
|||||||||||||||||
|
Securities Available for Sale:
|
||||||||||||||||||||||
|
U.S. Treasury and other
|
|
$12
|
|
|
$12
|
|
|
$30
|
|
|
$30
|
|
|
($18
|
)
|
(60
|
%)
|
|||||
|
State and political subdivisions
|
7
|
|
7
|
|
8
|
|
8
|
|
(1
|
)
|
(13
|
)
|
||||||||||
|
Mortgage-backed securities:
|
||||||||||||||||||||||
|
Federal agencies and U.S. government sponsored entities
|
19,735
|
|
19,628
|
|
19,231
|
|
19,045
|
|
583
|
|
3
|
|
||||||||||
|
Other/non-agency
|
337
|
|
335
|
|
427
|
|
401
|
|
(66
|
)
|
(16
|
)
|
||||||||||
|
Total mortgage-backed securities
|
20,072
|
|
19,963
|
|
19,658
|
|
19,446
|
|
517
|
|
3
|
|
||||||||||
|
Total debt securities
|
20,091
|
|
19,982
|
|
19,696
|
|
19,484
|
|
498
|
|
3
|
|
||||||||||
|
Marketable equity securities
|
—
|
|
—
|
|
5
|
|
5
|
|
(5
|
)
|
(100
|
)
|
||||||||||
|
Other equity securities
|
—
|
|
—
|
|
12
|
|
12
|
|
(12
|
)
|
(100
|
)
|
||||||||||
|
Total equity securities
|
—
|
|
—
|
|
17
|
|
17
|
|
(17
|
)
|
(100
|
)
|
||||||||||
|
Total securities available for sale
|
|
$20,091
|
|
|
$19,982
|
|
|
$19,713
|
|
|
$19,501
|
|
|
$481
|
|
2
|
%
|
|||||
|
Securities Held to Maturity:
|
||||||||||||||||||||||
|
Mortgage-backed securities:
|
||||||||||||||||||||||
|
Federal agencies and U.S. government sponsored entities
|
|
$3,966
|
|
|
$3,956
|
|
|
$4,126
|
|
|
$4,094
|
|
|
($138
|
)
|
(3
|
%)
|
|||||
|
Other/non-agency
|
857
|
|
883
|
|
945
|
|
964
|
|
(81
|
)
|
(8
|
)
|
||||||||||
|
Total securities held to maturity
|
|
$4,823
|
|
|
$4,839
|
|
|
$5,071
|
|
|
$5,058
|
|
|
($219
|
)
|
(4
|
)
|
|||||
|
Total securities available for sale and held to maturity
|
|
$24,914
|
|
|
$24,821
|
|
|
$24,784
|
|
|
$24,559
|
|
|
$262
|
|
1
|
%
|
|||||
As of
September 30, 2017
, the fair value of the AFS and HTM securities portfolio
increased
$262 million
to
$24.8 billion
, compared with
$24.6 billion
as of
December 31, 2016
, primarily due to net purchases of $130 million on an amortized cost basis and a decline in interest rates over the period.
As of
September 30, 2017
, our securities portfolio’s average effective duration was 3.8 years compared with 4.3 years as of December 31, 2016, given lower long-term rates that drove an increase in securities’ prepayment speeds. W
e manage the securities portfolio duration and convexity risk through asset selection and securities structure, and maintain duration levels within our risk appetite in the context of the broader Interest Rate Risk in the Banking Book framework and limits.
The securities portfolio includes high-quality, highly-liquid investments reflecting our ongoing commitment to maintaining appropriate contingent liquidity levels and pledging capacity. U.S. government-guaranteed notes and government-sponsored entity-issued mortgage-backed securities represent the vast majority of the securities portfolio holdings. The portfolio composition is also dominated by holdings backed by mortgages to facilitate our ability to pledge them to the FHLBs. This has become increasingly important due to the enhanced liquidity requirements of the liquidity coverage ratio and the liquidity stress test. For further discussion of the liquidity coverage ratios, see “Regulation and Supervision — Liquidity Standards” in Part I — Business, included in our Annual Report on Form 10-K for the year ended December 31, 2016.
38
CITIZENS FINANCIAL GROUP, INC.
MANAGEMENT’S DISCUSSION AND ANALYSIS
Loans and Leases
Our loans and leases are disclosed in portfolio segments and classes. Our loan and lease portfolio segments are commercial and retail. The classes of loans and leases are: commercial, commercial real estate, leases, residential mortgages, home equity loans, home equity lines of credit, home equity loans serviced by others, home equity lines of credit serviced by others, automobile, education, credit cards and other retail. Our SBO portfolio consists of purchased home equity loans and lines that were originally serviced by others, which we now service a portion of internally. The following table shows the composition of loans and leases, including non-core loans, as of:
|
(in millions)
|
September 30, 2017
|
December 31, 2016
|
Change
|
|
Percent
|
|
||||||||
|
Commercial
|
|
$37,706
|
|
|
$37,274
|
|
|
$432
|
|
1
|
%
|
|||
|
Commercial real estate
|
11,426
|
|
10,624
|
|
802
|
|
8
|
|
||||||
|
Leases
|
3,249
|
|
3,753
|
|
(504
|
)
|
(13
|
)
|
||||||
|
Total commercial
|
52,381
|
|
51,651
|
|
730
|
|
1
|
|
||||||
|
Residential mortgages
|
16,619
|
|
15,115
|
|
1,504
|
|
10
|
|
||||||
|
Home equity loans
|
1,483
|
|
1,858
|
|
(375
|
)
|
(20
|
)
|
||||||
|
Home equity lines of credit
|
13,555
|
|
14,100
|
|
(545
|
)
|
(4
|
)
|
||||||
|
Home equity loans serviced by others
|
599
|
|
750
|
|
(151
|
)
|
(20
|
)
|
||||||
|
Home equity lines of credit serviced by others
|
166
|
|
219
|
|
(53
|
)
|
(24
|
)
|
||||||
|
Automobile
|
13,311
|
|
13,938
|
|
(627
|
)
|
(4
|
)
|
||||||
|
Education
(1)
|
8,014
|
|
6,610
|
|
1,404
|
|
21
|
|
||||||
|
Credit cards
|
1,754
|
|
1,691
|
|
63
|
|
4
|
|
||||||
|
Other retail
|
2,269
|
|
1,737
|
|
532
|
|
31
|
|
||||||
|
Total retail
|
57,770
|
|
56,018
|
|
1,752
|
|
3
|
|
||||||
|
Total loans and leases
(2) (3)
|
|
$110,151
|
|
|
$107,669
|
|
|
$2,482
|
|
2
|
%
|
|||
(1)
During first quarter 2017, student loans were renamed “education” loans. For further information see Note 1 “Basis of Presentation” to our unaudited interim Consolidated Financial Statements in Part I, Item 1 — Financial Statements, included in this report.
(2)
Excluded from the table above are loans held for sale totaling
$1.2 billion
and
$625 million
as of
September 30, 2017
and
December 31, 2016
, respectively.
(3)
Mortgage loans serviced for others by our subsidiaries are not included above, and amounted to
$17.7 billion
and
$17.3 billion
at
September 30, 2017
and
December 31, 2016
, respectively.
Total loans and leases of
$110.2 billion
as of
September 30, 2017
increased
$2.5 billion
from
$107.7 billion
as of
December 31, 2016
, reflecting growth in both commercial and retail products. Total commercial loans and leases of
$52.4 billion
increased
$730 million
from
$51.7 billion
as of
December 31, 2016
, reflecting commercial real e
state loan growth of
$802 million
and commercial loan growth of
$432 million
, partially offset by a decline in leases. The change in commercial loans also reflects the impact of the second quarter 2017 sale of $596 million of lower-return, non-strategic commercial loans and leases associated with balance sheet optimization initiatives. Total retail loa
ns of
$57.8 billion
increased
by
$1.8 billion
from
$56.0 billion
as of
December 31, 2016
, largely driven by a
$1.5 billion
increase
in residential mortgage loans and a
$1.4 billion
increase
in education loans, partially offset by lower home equity balances and auto loans.
39
CITIZENS FINANCIAL GROUP, INC.
MANAGEMENT’S DISCUSSION AND ANALYSIS
Non-Core Assets
The table below presents the composition of our non-core assets:
|
(in millions)
|
September 30, 2017
|
December 31, 2016
|
Change
|
|
Percent
|
|||||||||
|
Commercial
|
|
$74
|
|
|
$144
|
|
|
($70
|
)
|
(49
|
%)
|
|||
|
Commercial real estate
|
25
|
|
59
|
|
(34
|
)
|
(58
|
)
|
||||||
|
Leases
|
771
|
|
874
|
|
(103
|
)
|
(12
|
)
|
||||||
|
Total commercial
|
870
|
|
1,077
|
|
(207
|
)
|
(19
|
)
|
||||||
|
Residential mortgages
|
149
|
|
173
|
|
(24
|
)
|
(14
|
)
|
||||||
|
Home equity loans
|
29
|
|
45
|
|
(16
|
)
|
(36
|
)
|
||||||
|
Home equity lines of credit
|
32
|
|
50
|
|
(18
|
)
|
(36
|
)
|
||||||
|
Home equity loans serviced by others
|
599
|
|
750
|
|
(151
|
)
|
(20
|
)
|
||||||
|
Home equity lines of credit serviced by others
|
166
|
|
219
|
|
(53
|
)
|
(24
|
)
|
||||||
|
Education
|
264
|
|
291
|
|
(27
|
)
|
(9
|
)
|
||||||
|
Total retail
|
1,239
|
|
1,528
|
|
(289
|
)
|
(19
|
)
|
||||||
|
Total non-core loans
|
2,109
|
|
2,605
|
|
(496
|
)
|
(19
|
)
|
||||||
|
Other assets
|
129
|
|
155
|
|
(26
|
)
|
(17
|
)
|
||||||
|
Total non-core assets
|
|
$2,238
|
|
|
$2,760
|
|
|
($522
|
)
|
(19
|
%)
|
|||
Non-core assets are primarily liquidating loan and lease portfolios inconsistent with our strategic priorities, generally as a result of geographic location, industry, product type or risk level and are included in Other. Non-core assets of
$2.2 billion
as of
September 30, 2017
decrease
d
$522 million
, or
19%
, from
December 31, 2016
.
Retail non-core loan balances of
$1.2 billion
decreased
$289 million
, or
19%
, compared to
December 31, 2016
. The largest component of our retail non-core portfolio is the home equity SBO portfolio, which totaled
$765 million
as of
September 30, 2017
, compared to
$969 million
as of
December 31, 2016
. The SBO portfolio represented 2% of the retail real estate secured portfolio and approximately 1% of the overall retail loan portfolio as of
September 30, 2017
. The SBO portfolio consists of pools of home equity loans and lines of credit purchased between 2003 and 2007. Although our SBO portfolio consists of loans that were initially serviced by others, we now service a portion of this portfolio internally. SBO balances serviced externally totaled $400 million and
$505 million
as of
September 30, 2017
and
December 31, 2016
, respectively.
The credit profile of the SBO portfolio reflected a weighted-average refreshed FICO score of
710
and CLTV of
85%
as of
September 30, 2017
. The proportion of the portfolio in a second lien position was
97%
, with
70%
of the portfolio in out-of-footprint geographies. SBO net charge-offs were in a net recovery position of
$3 million
for the
three months ended
September 30, 2017
, which was an improvement of $8 million from a $5 million net charge-off position for the
three months ended
September 30, 2016
, driven by continued portfolio seasoning, recoveries of previously charged off loans and balance liquidation. SBO net charge-offs were in a net recovery position of
$3 million
for the nine months ended
September 30, 2017
, which was an improvement of $22 million from a $19 million net charge-off position for the
nine months ended
September 30, 2016
, driven by continued portfolio seasoning, recoveries from aged charge-offs and balance liquidation.
Commercial non-core loan and lease balances of
$870 million
decreased
$207 million
, or
19%
, from $1.1 billion as of
December 31, 2016
. The largest component of our commercial non-core portfolio is an aircraft-related loan and lease portfolio tied to legacy-Royal Bank of Scotland Group aircraft leasing borrowers, which totaled $771 million as of
September 30, 2017
and $917 million as of
December 31, 2016
.
Allowance for Credit Losses and Nonperforming Assets
The allowance for credit losses, which consists of an ALLL and a reserve for unfunded lending commitments, is created through charges to the provision for credit losses in order to provide appropriate reserves to absorb future estimated credit losses in accordance with GAAP. For further information on our processes to determine our allowance for credit losses, see “—Critical Accounting Estimates — Allowance for Credit Losses” and Note 1 “Significant Accounting Policies” to the audited Consolidated Financial Statements in our Annual Report on Form 10-K for the year ended December 31, 2016 and Note 4 “Allowance for Credit Losses, Nonperforming Assets, and Concentrations of Credit Risk” to our unaudited interim Consolidated Financial Statements in Part I, Item 1 — Financial Statements, included in this report.
40
CITIZENS FINANCIAL GROUP, INC.
MANAGEMENT’S DISCUSSION AND ANALYSIS
The allowance for credit losses totaled
$1.3 billion
at
September 30, 2017
and
December 31, 2016
. The ALLL represented
1.11%
of total loans and leases and
131%
of nonperforming loans and leases as of
September 30, 2017
compared with
1.15%
and
118%
, respectively, as of
December 31, 2016
. There were no material changes in assumptions or estimation techniques compared with prior periods that impacted the determination of the current period’s reserves. However, the allowance for credit losses increased slightly during third quarter 2017 and included the estimated impact of Hurricanes Harvey and Irma on retail and commercial loans.
Overall credit quality remained strong, reflecting growth in higher-quality, lower-risk retail loans and broadly stable risk appetite in commercial portfolios. Nonperforming loans and leases of
$932 million
as of
September 30, 2017
decreased $113 million from
December 31, 2016
driven by a $62 million decrease in commercial nonperforming loans, mainly due to a reduction in commodities-related credits, and a $51 million decrease in retail nonperforming loans which was comprised of a $67 million decrease in real estate secured categories, partially offset by a $16 million increase in auto. Net charge-offs of
$227 million
for the nine months ended
September 30, 2017
decreased
$4 million
, or
2%
, from
$231 million
for the nine months ended
September 30, 2016
. Annualized net charge-offs as a percentage of total average loans of
0.28%
for the nine months ended
September 30, 2017
was down slightly by two basis points compared to the nine months ended
September 30, 2016
.
Commercial Loan Asset Quality
Our commercial loan and lease portfolio consists of traditional commercial loans and commercial real estate loans and leases. The portfolio is predominantly focused on customers in our footprint and adjacent states in which we have a physical presence where our local delivery model provides for strong client connectivity. Additionally, we also do business in certain specialized industry sectors on a national basis.
For commercial loans and leases, we use regulatory classification ratings to monitor credit quality. Loans with a “pass” rating are those that we believe will be fully repaid in accordance with the contractual loan terms. Commercial loans and leases that are “criticized” are those that have some weakness that indicates an increased probability of future loss. See Note 4 “Allowance for Credit Losses, Nonperforming Assets, and Concentrations of Credit Risk” to our unaudited interim Consolidated Financial Statements in Part I, Item 1 — Financial Statements, included in this report.
As of
September 30, 2017
, nonperforming commercial loans and leases of
$325 million
decreased
$62 million
from
$387 million
as of
December 31, 2016
, largely driven by decreases in commodities-related credits and commercial real estate. As of
September 30, 2017
, total commercial nonperforming loans were
0.6%
of the commercial loan portfolio, compared to
0.7%
as of
December 31, 2016
. There were no commercial loan and lease portfolio net charge-offs for the three months ended September 30, 2017 and $33 million for the nine months ended
September 30, 2017
, compared to net charge-offs of $19 million and $30 million for the three and nine months ended
September 30, 2016
, respectively. The commercial loan and lease portfolio’s annualized net charge-off rate of one and nine basis points for the three and nine months ended
September 30, 2017
, respectively, compared to 15 and eight basis points for the three and nine months ended
September 30, 2016
, respectively.
Total commercial criticized loans and leases portfolio of
$3.2 billion
, or
6.1%
of the portfolio, compared to
$2.9 billion
, or
5.6%
, at
December 31, 2016
. Commercial criticized balances were
$2.4 billion
, or
6.4%
of commercial loans as of
September 30, 2017
, compared to
$2.3 billion
, or
6.1%
, as of
December 31, 2016
. Commercial real estate criticized balances of
$689 million
, or
6.0%
of the commercial real estate portfolio, compared to
$478 million
, or
4.5%
, as of
December 31, 2016
. The increase in commercial real estate criticized balances was primarily driven by multi-family, with additional increases in retail and office property types. Commercial criticized loans to total criticized loans was
75%
as of
September 30, 2017
down slightly compared to
78%
as of
December 31, 2016
. Commercial real estate accounted for
22%
of total criticized loans as of
September 30, 2017
, compared to
16%
as of
December 31, 2016
.
Retail Loan Asset Quality
For retail loans, we primarily utilize payment and delinquency status to regularly review and monitor credit quality trends. Historical experience indicates that the longer a loan is past due, the greater the likelihood of future credit loss. The largest portion of the retail portfolio is represented by borrowers located in the New England, Mid-Atlantic and Midwest regions, although we have continued to grow selectively in areas outside the footprint primarily in the auto finance, education lending and unsecured portfolios.
The credit composition of our retail loan portfolio at
September 30, 2017
reflected an average refreshed FICO score of
761
, which was slightly improved compared to
759
as of
December 31, 2016
. The real estate secured portfolio CLTV ratio is calculated as the mortgage and second lien loan balance divided by the most recently available
41
CITIZENS FINANCIAL GROUP, INC.
MANAGEMENT’S DISCUSSION AND ANALYSIS
value of the property and was
60%
as of
September 30, 2017
and
62%
as of
December 31, 2016
. Retail asset quality continued to improve with an annualized net charge-off rate of
0.44%
and
0.46%
for the three and nine months ended
September 30, 2017
, respectively, compared to
0.47%
and
0.50%
for the three and nine months ended
September 30, 2016
, respectively, driven by improving asset quality and a shift in the portfolio mix. Nonperforming retail loans as a percentage of total retail loans were
1.05%
as of
September 30, 2017
, a decrease of
12
basis points from
December 31, 2016
.
HELOC Payment Shock
We monitor the potential for increased exposure to credit losses associated with HELOCs that were originated during the period of rapid home price appreciation between 2003 and 2007. Industry wide, many of the HELOCs originated during this timeframe were structured with an extended interest-only payment period followed by a requirement to convert to a higher payment amount that would begin fully amortizing both principal and interest beginning at a certain date in the future. To help manage this potential exposure, in September 2013, we launched a comprehensive program designed to provide heightened customer outreach to inform, educate and assist customers through the reset process as well as to offer alternative financing and forbearance options. Results of this program indicate that our efforts to assist customers at risk of default have successfully reduced delinquency and charge-off rates compared to our original expectations.
As of
September 30, 2017
, for the
$1.7 billion
of our HELOC portfolio that reached the end of the interest-only draw period and entered repayment of principal and interest during 2014 and 2015,
94%
of the balances had been refinanced, paid off or were current on payments,
3%
were past due and
3%
had been charged off. As of
September 30, 2017
, for the
$738 million
of our HELOC portfolio that reached the end of the interest-only draw period and entered repayment of principal and interest in 2016,
95%
of the balances had been refinanced, paid off or were current on payments,
3%
were past due and
2%
had been charged off.
As of
September 30, 2017
, a total of
$241 million
of HELOC balances are scheduled to reach the end of the interest-only draw period and enter repayment of principal and interest for the remainder of 2017. For the $3.7 billion HELOC portfolio scheduled to reach the end of the interest-only draw period and enter repayment of principal and interest between October 1, 2017 and December 31, 2021, 48% was secured by a first lien, with a weighted average FICO score of the borrowers of 763 and a LTV ratio of 57%. Those results compare to the total HELOC portfolio of $13.7 billion that was 51% secured by a first lien, with a weighted average FICO score of the borrowers of 768 and a LTV ratio of 59%. Factors that affect our future expectations for continued relatively low charge-off risk in the face of rising interest rates for the portion of our HELOC portfolio subject to reset in future periods include a relatively high level of first lien collateral positions, improved loan-to-value ratios resulting from continued home price appreciation, relatively stable portfolio credit score profiles and continued robust loss mitigation efforts.
Troubled Debt Restructurings
TDR is the classification given to a loan that has been restructured in a manner that grants a concession to a borrower experiencing financial hardship that we would not otherwise make. TDRs typically result from our loss mitigation efforts and are undertaken in order to improve the likelihood of recovery and continuity of the relationship. Our loan modifications are handled on a case by case basis and are negotiated to achieve mutually agreeable terms that maximize loan collectability and meet our borrower’s financial needs. The types of concessions include interest rate reductions, term extensions, principal forgiveness and other modifications to the structure of the loan that fall outside our lending policy. Depending on the specific facts and circumstances of the customer, restructuring can involve loans moving to nonaccrual, remaining on nonaccrual, or remaining on accrual status.
As of
September 30, 2017
,
$759 million
of retail loans were classified as TDRs, compared with
$799 million
as of
December 31, 2016
. The decrease was, in part, attributable to $78 million of TDRs classified as held for sale as of September 30, 2017. As of
September 30, 2017
, $221 million of retail TDRs were in nonaccrual status with 58% current with payments, an improvement compared to $233 million in nonaccrual status with 55% current on payments at
December 31, 2016
. TDRs generally return to accrual status once repayment capacity and appropriate payment history can be established. TDRs are individually evaluated for impairment and loans, once classified as TDRs, remain classified as TDRs until paid off, sold or refinanced at market terms.
42
CITIZENS FINANCIAL GROUP, INC.
MANAGEMENT’S DISCUSSION AND ANALYSIS
For additional information regarding TDRs, see “—Critical Accounting Estimates — Allowance for Credit Losses,” and Note 1 “Significant Accounting Policies” to the audited Consolidated Financial Statements in our Annual Report on Form 10-K for the year ended December 31, 2016 and Note 4 “Allowance for Credit Losses, Nonperforming Assets, and Concentrations of Credit Risk” to our unaudited interim Consolidated Financial Statements in Part I, Item 1 — Financial Statements, included in this report.
The following tables present an aging of our retail TDRs:
|
September 30, 2017
|
|||||||||||||||||||
|
(in millions)
|
Current
|
|
30-59 Days
Past Due |
60-89 Days
Past Due |
90+ Days
Past Due
|
Total
|
|
||||||||||||
|
Recorded Investment:
|
|||||||||||||||||||
|
Residential mortgages
|
|
$92
|
|
|
$2
|
|
|
$5
|
|
|
$41
|
|
|
$140
|
|
||||
|
Home equity loans
|
102
|
|
2
|
|
3
|
|
18
|
|
125
|
|
|||||||||
|
Home equity lines of credit
|
167
|
|
4
|
|
3
|
|
23
|
|
197
|
|
|||||||||
|
Home equity loans serviced by others
|
45
|
|
2
|
|
—
|
|
3
|
|
50
|
|
|||||||||
|
Home equity lines of credit serviced by others
|
7
|
|
—
|
|
—
|
|
2
|
|
9
|
|
|||||||||
|
Automobile
|
20
|
|
1
|
|
1
|
|
1
|
|
23
|
|
|||||||||
|
Education
|
168
|
|
5
|
|
3
|
|
3
|
|
179
|
|
|||||||||
|
Credit cards
|
23
|
|
1
|
|
1
|
|
1
|
|
26
|
|
|||||||||
|
Other retail
|
8
|
|
1
|
|
1
|
|
—
|
|
10
|
|
|||||||||
|
Total
|
|
$632
|
|
|
$18
|
|
|
$17
|
|
|
$92
|
|
|
$759
|
|
||||
|
December 31, 2016
|
|||||||||||||||||||
|
(in millions)
|
Current
|
|
30-59 Days
Past Due |
60-89 Days
Past Due |
90+ Days
Past Due
|
Total
|
|
||||||||||||
|
Recorded Investment:
|
|||||||||||||||||||
|
Residential mortgages
|
|
$115
|
|
|
$12
|
|
|
$5
|
|
|
$46
|
|
|
$178
|
|
||||
|
Home equity loans
|
116
|
|
8
|
|
3
|
|
18
|
|
145
|
|
|||||||||
|
Home equity lines of credit
|
164
|
|
7
|
|
4
|
|
21
|
|
196
|
|
|||||||||
|
Home equity loans serviced by others
|
53
|
|
3
|
|
1
|
|
3
|
|
60
|
|
|||||||||
|
Home equity lines of credit serviced by others
|
6
|
|
—
|
|
—
|
|
3
|
|
9
|
|
|||||||||
|
Automobile
|
17
|
|
1
|
|
1
|
|
—
|
|
19
|
|
|||||||||
|
Education
|
148
|
|
3
|
|
2
|
|
2
|
|
155
|
|
|||||||||
|
Credit cards
|
23
|
|
1
|
|
1
|
|
1
|
|
26
|
|
|||||||||
|
Other retail
|
11
|
|
—
|
|
—
|
|
—
|
|
11
|
|
|||||||||
|
Total
|
|
$653
|
|
|
$35
|
|
|
$17
|
|
|
$94
|
|
|
$799
|
|
||||
The following tables present the accrual status of our retail TDRs:
|
September 30, 2017
|
|||||||||||
|
(in millions)
|
Accruing
|
|
Nonaccruing
|
|
Total
|
|
|||||
|
Recorded Investment:
|
|||||||||||
|
Residential mortgages
|
|
$84
|
|
|
$56
|
|
|
$140
|
|
||
|
Home equity loans
|
88
|
|
37
|
|
125
|
|
|||||
|
Home equity lines of credit
|
123
|
|
74
|
|
197
|
|
|||||
|
Home equity loans serviced by others
|
37
|
|
13
|
|
50
|
|
|||||
|
Home equity lines of credit serviced by others
|
4
|
|
5
|
|
9
|
|
|||||
|
Automobile
|
13
|
|
10
|
|
23
|
|
|||||
|
Education
|
155
|
|
24
|
|
179
|
|
|||||
|
Credit cards
|
25
|
|
1
|
|
26
|
|
|||||
|
Other retail
|
9
|
|
1
|
|
10
|
|
|||||
|
Total
|
|
$538
|
|
|
$221
|
|
|
$759
|
|
||
43
CITIZENS FINANCIAL GROUP, INC.
MANAGEMENT’S DISCUSSION AND ANALYSIS
|
December 31, 2016
|
|||||||||||
|
(in millions)
|
Accruing
|
|
Nonaccruing
|
|
Total
|
|
|||||
|
Recorded Investment:
|
|||||||||||
|
Residential mortgages
|
|
$117
|
|
|
$61
|
|
|
$178
|
|
||
|
Home equity loans
|
102
|
|
43
|
|
145
|
|
|||||
|
Home equity lines of credit
|
126
|
|
70
|
|
196
|
|
|||||
|
Home equity loans serviced by others
|
43
|
|
17
|
|
60
|
|
|||||
|
Home equity lines of credit serviced by others
|
4
|
|
5
|
|
9
|
|
|||||
|
Automobile
|
10
|
|
9
|
|
19
|
|
|||||
|
Education
|
128
|
|
27
|
|
155
|
|
|||||
|
Credit cards
|
25
|
|
1
|
|
26
|
|
|||||
|
Other retail
|
11
|
|
—
|
|
11
|
|
|||||
|
Total
|
|
$566
|
|
|
$233
|
|
|
$799
|
|
||
Derivatives
We use pay-fixed swaps to hedge floating rate wholesale funding and to offset duration in fixed-rate assets. Notional balances on wholesale funding hedges totaled
$4.0 billion
as of
September 30, 2017
and
$3.0 billion
as of December 31, 2016, respectively. Pay-fixed rates on the swaps ranged from
0.91%
to
1.98%
as of
September 30, 2017
and
December 31, 2016
, respectively. As of
September 30, 2017
,
$1.0
billion were forward starting positions which begin accruing interest in January 2018.
We use receive-fixed swaps to minimize the exposure to variability in the interest cash flows on our floating-rate assets, and to hedge market risk on fixed-rate capital markets debt issuances. At
September 30, 2017
and December 31,
2016
, the notional amount of receive-fixed swap hedges totaled
$13.3 billion
and
$10.4 billion
, respectively. As of
September 30, 2017
and December 31, 2016, the fixed-rate ranges were
0.92%
to
1.87%
and
0.88%
to
1.84%
, respectively. We paid one-month and three-month LIBOR on these swaps.
In third quarter 2017, CBPA added $1.0 billion of interest rate swaps to hedge its exposure to declining interest rates. This was accomplished through the establishment of $500 million of 1.5-year receive-fixed swaps and $500 million 2-year receive-fixed swaps on floating-rate commercial loans. CBNA also terminated $500 million of 3.9-year receive-fixed swaps hedging floating-rate commercial loans. This activity in the quarter resulted in our net additional hedge position of $500 million related to floating-rate commercial loans.
We also sell interest rate swaps and foreign exchange forwards to commercial customers. Interest rate and foreign exchange derivative contracts are transacted to effectively minimize our market risk associated with the customer derivative contracts.
44
CITIZENS FINANCIAL GROUP, INC.
MANAGEMENT’S DISCUSSION AND ANALYSIS
The table below presents our derivative assets and liabilities. The assets and liabilities recorded for derivatives on our Consolidated Balance Sheets reflect the market value of these transactions. For additional information regarding our derivative instruments, see Note 10 “Derivatives” in our unaudited interim Consolidated Financial Statements in Part I, Item 1 — Financial Statements, included in this report.
|
September 30, 2017
|
December 31, 2016
|
||||||||||||||||||
|
(in millions)
|
Notional Amount
(1)
|
Derivative Assets
(2)
|
Derivative Liabilities
(2)
|
Notional Amount
(1)
|
Derivative Assets
|
Derivative Liabilities
|
|||||||||||||
|
Derivatives designated as hedging instruments:
|
|||||||||||||||||||
|
Interest rate contracts
|
|
$17,300
|
|
|
$6
|
|
|
$—
|
|
|
$13,350
|
|
|
$52
|
|
|
$193
|
|
|
|
Derivatives not designated as hedging instruments:
|
|||||||||||||||||||
|
Interest rate contracts
|
69,436
|
|
502
|
|
338
|
|
54,656
|
|
557
|
|
452
|
|
|||||||
|
Foreign exchange contracts
|
10,147
|
|
146
|
|
142
|
|
8,039
|
|
134
|
|
126
|
|
|||||||
|
Other contracts
|
1,256
|
|
10
|
|
5
|
|
1,498
|
|
16
|
|
7
|
|
|||||||
|
Total derivatives not designated as hedging instruments
|
658
|
|
485
|
|
707
|
|
585
|
|
|||||||||||
|
Gross derivative fair values
|
664
|
|
485
|
|
759
|
|
778
|
|
|||||||||||
|
Less: Gross amounts offset in the Consolidated Balance Sheets
(3)
|
(65
|
)
|
(65
|
)
|
(106
|
)
|
(106
|
)
|
|||||||||||
|
Less: Cash collateral applied
(3)
|
(3
|
)
|
(178
|
)
|
(26
|
)
|
(13
|
)
|
|||||||||||
|
Total net derivative fair values presented in the Consolidated Balance Sheets
|
|
$596
|
|
|
$242
|
|
|
$627
|
|
|
$659
|
|
|||||||
(1)
The notional or contractual amount of interest rate derivatives and foreign exchange contracts is the amount upon which interest and other payments under the contract are based. For interest rate derivatives, the notional amount is typically not exchanged. Therefore, notional amounts should not be taken as the measure of credit or market risk as they do not measure the true economic risk of these contracts.
(2)
Amounts reflect changes in the treatment of variation margin on certain centrally cleared derivatives.
(3)
Amounts represent the impact of legally enforceable master netting agreements that allow us to settle positive and negative positions.
At
September 30, 2017
, the overall derivative asset value
decreased
$31 million
and the liability balance
decreased
by
$417 million
from
December 31, 2016
. These decreases were primarily due to a change in the presentation of variation margin payments in the Consolidated Balance Sheets in 2017. Effective January 3, 2017, variation margin payments made on certain centrally cleared derivative contracts are legally classified as settlement of those derivatives (rather than the posting of collateral). As a result of this change, we modified our balance sheet presentation of certain interest rate swaps in 2017, such that the fair value of the swaps and the associated variation margin balances are reported as a single unit of account in derivative assets and/or derivative liabilities. At
December 31, 2016
, these variation margin balances were characterized as collateral. Variation margin balances legally characterized as collateral are reported in interest-bearing cash and due from banks on the Consolidated Balance Sheets.
Deposits
The table below presents the major components of our deposits:
|
(in millions)
|
September 30, 2017
|
December 31, 2016
|
Change
|
|
Percent
|
|
||||||||
|
Demand
|
|
$28,643
|
|
|
$28,472
|
|
|
$171
|
|
1
|
%
|
|||
|
Checking with interest
|
21,756
|
|
20,714
|
|
1,042
|
|
5
|
|
||||||
|
Regular savings
|
9,470
|
|
8,964
|
|
506
|
|
6
|
|
||||||
|
Money market accounts
|
37,070
|
|
38,176
|
|
(1,106
|
)
|
(3
|
)
|
||||||
|
Term deposits
|
16,296
|
|
13,478
|
|
2,818
|
|
21
|
|
||||||
|
Total deposits
|
|
$113,235
|
|
|
$109,804
|
|
|
$3,431
|
|
3
|
%
|
|||
Total deposits as of
September 30, 2017
increased
$3.4 billion
, or
3%
, to
$113.2 billion
, compared to
$109.8 billion
as of December 31, 2016, as growth across term deposits, checking with interest, regular savings and demand deposits was partially offset by a decrease in money market products.
45
CITIZENS FINANCIAL GROUP, INC.
MANAGEMENT’S DISCUSSION AND ANALYSIS
Borrowed Funds
Short-term borrowed funds
A summary of our short-term borrowed funds is presented below:
|
(in millions)
|
September 30, 2017
|
December 31, 2016
|
Change
|
|
Percent
|
|
||||||||
|
Federal funds purchased
|
|
$—
|
|
|
$533
|
|
|
($533
|
)
|
(100
|
%)
|
|||
|
Securities sold under agreements to repurchase
|
453
|
|
615
|
|
(162
|
)
|
(26
|
)
|
||||||
|
Other short-term borrowed funds
|
1,505
|
|
3,211
|
|
(1,706
|
)
|
(53
|
)
|
||||||
|
Total short-term borrowed funds
|
|
$1,958
|
|
|
$4,359
|
|
|
($2,401
|
)
|
(55
|
%)
|
|||
Short-term borrowed funds of
$2.0 billion
decrease
d
$2.4 billion
from
December 31, 2016
, reflecting a
$1.7 billion
decline in other short-term borrowed funds (primarily short-term FHLB advances), a
$533 million
decrease in Fed funds purchased, and a
$162 million
decrease
in securities sold under agreements to repurchase.
As of
September 30, 2017
, our total contingent liquidity was
$27.7 billion
, consisting of
$20.3 billion
in unencumbered high-quality and liquid securities,
$6.1 billion
in unused FHLB borrowing capacity, and
$1.3 billion
in cash at the FRB. Asset liquidity, a component of contingent liquidity, was
$21.6 billion
, consisting of cash at the FRB and unencumbered high-quality liquid securities assets. Additionally,
$12.7 billion
in secured discount window capacity from the FRBs created total available liquidity of approximately
$40.4 billion
.
Key data related to short-term borrowed funds is presented in the following table:
|
As of and for the
Three Months Ended September 30,
|
As of and for the
Nine Months Ended September 30,
|
As of and for the
Year Ended December 31,
|
|||||||||||||||||
|
(dollars in millions)
|
2017
|
|
2016
|
|
2017
|
|
2016
|
|
2016
|
||||||||||
|
Weighted-average interest rate at period-end:
(1)
|
|||||||||||||||||||
|
Federal funds purchased and securities sold under agreements to repurchase
|
—
|
%
|
0.03
|
%
|
—
|
%
|
0.03
|
%
|
0.26
|
%
|
|||||||||
|
Other short-term borrowed funds (primarily short-term FHLB advances)
|
1.47
|
|
0.63
|
|
1.47
|
|
0.63
|
|
0.94
|
|
|||||||||
|
Maximum amount outstanding at month-end during the period:
|
|||||||||||||||||||
|
Federal funds purchased and securities sold under agreements to repurchase
(2)
|
|
$724
|
|
|
$1,032
|
|
|
$1,174
|
|
|
$1,274
|
|
|
$1,522
|
|
||||
|
Other short-term borrowed funds (primarily short-term FHLB advances)
|
1,755
|
|
2,515
|
|
3,508
|
|
4,764
|
|
5,461
|
|
|||||||||
|
Average amount outstanding during the period:
|
|||||||||||||||||||
|
Federal funds purchased and securities sold under agreements to repurchase
(2)
|
|
$733
|
|
|
$910
|
|
|
$807
|
|
|
$922
|
|
|
$947
|
|
||||
|
Other short-term borrowed funds (primarily short-term FHLB advances)
|
1,624
|
|
2,564
|
|
2,283
|
|
3,133
|
|
3,207
|
|
|||||||||
|
Weighted-average interest rate during the period:
(1)
|
|||||||||||||||||||
|
Federal funds purchased and securities sold under agreements to repurchase
|
0.47
|
%
|
0.10
|
%
|
0.34
|
%
|
0.09
|
%
|
0.09
|
%
|
|||||||||
|
Other short-term borrowed funds (primarily short-term FHLB advances)
|
1.48
|
|
0.63
|
|
1.22
|
|
0.62
|
|
0.64
|
|
|||||||||
(1)
Rates exclude certain hedging costs.
(2)
Balances are net of certain short-term receivables associated with reverse repurchase agreements, as applicable.
46
CITIZENS FINANCIAL GROUP, INC.
MANAGEMENT’S DISCUSSION AND ANALYSIS
Long-term borrowed funds
A summary of our long-term borrowed funds is presented below:
|
(in millions)
|
September 30, 2017
|
December 31, 2016
|
|||||
|
Parent Company:
|
|||||||
|
4.150% fixed-rate subordinated debt, due 2022
|
|
$348
|
|
|
$347
|
|
|
|
5.158% fixed-to-floating rate subordinated debt, due 2023, converting to floating at
3-month LIBOR + 3.56% and callable beginning June 2018
|
333
|
|
333
|
|
|||
|
3.750% fixed-rate subordinated debt, due 2024
|
250
|
|
250
|
|
|||
|
4.023% fixed-rate subordinated debt, due 2024
|
42
|
|
42
|
|
|||
|
4.350% fixed-rate subordinated debt, due 2025
|
249
|
|
249
|
|
|||
|
4.300% fixed-rate subordinated debt, due 2025
|
749
|
|
749
|
|
|||
|
2.375% fixed-rate senior unsecured debt, due 2021
|
348
|
|
348
|
|
|||
|
Banking Subsidiaries:
|
|||||||
|
2.300% senior unsecured notes, due 2018
(1)
|
746
|
|
745
|
|
|||
|
2.450% senior unsecured notes, due 2019
(1)
|
747
|
|
747
|
|
|||
|
2.500% senior unsecured notes, due 2019
(1)
|
743
|
|
741
|
|
|||
|
2.250% senior unsecured notes, due 2020
(1)
|
697
|
|
—
|
|
|||
|
Floating-rate senior unsecured notes, due 2020
(1)
|
299
|
|
—
|
|
|||
|
Floating-rate senior unsecured notes, due 2020
(1)
|
249
|
|
—
|
|
|||
|
2.200% senior unsecured notes, due 2020
(1)
|
498
|
|
—
|
|
|||
|
2.550% senior unsecured notes, due 2021
(1)
|
973
|
|
965
|
|
|||
|
Floating-rate senior unsecured notes, due 2022
(1)
|
249
|
|
—
|
|
|||
|
2.650% senior unsecured notes, due 2022
(1)
|
496
|
|
—
|
|
|||
|
Federal Home Loan advances due through 2033
|
5,361
|
|
7,264
|
|
|||
|
Other
|
23
|
|
10
|
|
|||
|
Total long-term borrowed funds
|
|
$13,400
|
|
|
$12,790
|
|
|
(1)
Issued under CBNA’s Global Bank Note Program.
The Parent Company’s long-term borrowed funds as of
September 30, 2017
and
December 31, 2016
included principal balances of
$2.3 billion
and unamortized deferred issuance costs and/or discounts of
($6) million
and
($7) million
, respectively. The banking subsidiaries’ long-term borrowed funds as of
September 30, 2017
and
December 31, 2016
include principal balances of
$11.1 billion
and
$10.5 billion
, respectively, with unamortized deferred issuance costs and/or discounts of
($17) million
and
($12) million
, respectively, and hedging basis adjustments of
($36) million
and
($40) million
, respectively. See Note 10 “Derivatives” for further information about our hedging of certain long-term borrowed funds.
From an external issuance perspective, on February 24, 2017, we increased the size of CBNA’s Global Note Program from $5.0 billion to $8.0 billion. On March 2, 2017, CBNA issued
$1.0 billion
in three-year, senior bank debt, composed of
$700 million
in fixed-rate notes and
$300 million
in floating-rate notes indexed to 3-month LIBOR
.
On May 26, 2017, CBNA issued $1.5 billion in senior notes, consisting of $500 million of three-year fixed-rate notes, $250 million of three-year floating-rate notes, $500 million in five-year fixed-rate notes, and $250 million in five-year floating-rate notes. We also established a $500 million fair value hedge using a receive-fixed interest rate swap against the $500 million five-year fixed-rate senior debt, related to CBNA’s $1.5 billion senior note issuance in May 2017.
Long-term borrowed funds of
$13.4 billion
as of
September 30, 2017
increased
$610 million
from
December 31, 2016
, reflecting a
$2.5 billion
increase in senior bank debt, offset by a decrease of
$1.9 billion
in long-term FHLB borrowings. Access to additional funding through repurchase agreements, collateralized borrowed funds or asset sales continues to be available. Additionally, capacity remains to grow deposits or issue senior or subordinated notes.
47
CITIZENS FINANCIAL GROUP, INC.
MANAGEMENT’S DISCUSSION AND ANALYSIS
CAPITAL AND REGULATORY MATTERS
As a bank holding company and a financial holding company, we are subject to regulation and supervision by the FRB. Our primary subsidiaries are our two insured depository institutions, CBNA, a national banking association whose primary federal regulator is the OCC, and CBPA, a Pennsylvania-charted savings bank regulated by the Department of Banking of the Commonwealth of Pennsylvania and supervised by the FDIC, its primary federal regulator. Our regulation and supervision continues to evolve as the legal and regulatory framework governing our operations continue to change. The current operating environment reflects heightened regulatory expectations around many regulations including consumer compliance, the Bank Secrecy Act, anti-money laundering compliance, and increased internal audit activities. For more information, see “Regulation and Supervision” in Part I, Item 1 — Business included in our Annual Report on Form 10-K for the year ended December 31, 2016.
Dodd-Frank regulation
Under the Dodd-Frank requirements, we must submit our annual capital plan and the results of our annual company-run stress tests to the FRB by April 5
th
of each year and disclose certain results within 15 days after the FRB discloses the results of its supervisory-run tests. On June 28, 2017, the FRB informed us that it did not object to our 2017 Capital Plan or to our proposed capital actions for the period beginning July 1, 2017 and ending June 30, 2018. Our 2017 Capital Plan includes quarterly common dividends of $0.18 per share through the end of 2017, the potential to raise the quarterly common dividend to $0.22 per share in 2018, and a share repurchase plan through the second quarter of 2018. The timing and exact am
ount
of future dividends and share repurchases will depend on various factors, including capital position, financial performance and market conditions. On June 22, 2017, we published estimated DFAST results under the supervisory severely adverse scenario on our regulatory filings and disclosures page on our Investor Relations website at http://investor.citizensbank.com.
The Dodd-Frank Act also requires each of our bank subsidiaries to conduct stress tests on an annual basis and to disclose the stress test results. CBNA submitted its 2017 annual stress tests to the OCC on April 5, 2017 and published a summary of those results along with the stress test results of the Parent Company on June 22, 2017 on our Investor Relations website referenced above. CBPA submitted the results of its 2017 annual stress tests to the FDIC on July 31, 2017 and published its summary results as an update to the Parent Company/CBNA Dodd-Frank Act Company-Run Stress Test Disclosure on October 16, 2017 on our Investor Relations website referenced above.
Similarly, we are required to submit the results of our mid-cycle company-run DFAST stress tests by October 5
th
of each year and disclose the summary results of our internally developed stress tests under the severely adverse scenario between October 5
th
and November 4
th
. We submitted the results of our 2017 mid-cycle stress test to the FRB on October 3, 2017 and disclosed a summary of the results on October 5, 2017. We publish these company-run estimated impacts of stress on our regulatory filings and disclosures page on our Investor Relations website referenced above.
Capital Framework
Under the U.S. Basel III capital framework, we and our banking subsidiaries must meet specific minimum requirements for the following ratios: common equity tier 1 capital, tier 1 capital, total capital, and tier 1 leverage.
The U.S. adoption of the Basel III Standardized approach by the Federal bank regulators became effective for CFG, CBNA and CBPA, on January 1, 2015 subject to a phase-in period extending through January 2019 (the “U.S. Basel III Standardized Transitional rules”). Among other changes, these regulations introduced a new capital conservation buffer (“CCB”) on top of the following three minimum risk-based capital ratios: CET1 capital of 4.5%, tier 1 capital of 6.0%, and total capital of 8.0%. The implementation of the CCB began on January 1, 2016 at the 0.625% level and increases by 0.625% on each subsequent January 1, until the buffer reaches its fully phased-in level of 2.5% on January 1, 2019. As such, the CCB for 2017 increased to 1.250% on January 1, 2017. Banking institutions for which any risk-based capital ratio falls below its effective minimum (required minimum plus the applicable CCB) will be subject to constraints on capital distributions, including dividends, repurchases and certain executive compensation based on the amount of the shortfall.
48
CITIZENS FINANCIAL GROUP, INC.
MANAGEMENT’S DISCUSSION AND ANALYSIS
The table below presents our actual regulatory capital ratios under the U.S. Basel III Standardized Transitional rules as well as pro forma U.S. Basel III Standardized ratios after full phase-in of all requirements by
January 1, 2019
:
|
Transitional Basel III
|
Pro Forma Basel III Assuming Full Phase-in
|
|||||||||||||||
|
(in millions, except ratio data)
|
Actual Amount
|
Actual Ratio
|
Required Minimum plus Required CCB for Non-Leverage Ratios
(6)(7)
|
FDIA Required Well-Capitalized Minimum for Purposes of Prompt Corrective Action
(9)
|
Actual Ratio
(1)
|
Required Minimum plus Required CCB for Non-Leverage Ratios
(6)(8)
|
FDIA Required Well-Capitalized Minimum for Purposes of Prompt Corrective Action
(9)
|
|||||||||
|
September 30, 2017
|
||||||||||||||||
|
Common equity tier 1 capital
(2)
|
|
$14,093
|
|
11.1
|
%
|
5.8
|
%
|
6.5
|
%
|
11.1
|
%
|
7.0
|
%
|
6.5
|
%
|
|
|
Tier 1 capital
(3)
|
14,340
|
|
11.3
|
|
7.3
|
|
8.0
|
|
11.3
|
|
8.5
|
|
8.0
|
|
||
|
Total capital
(4)
|
17,560
|
|
13.8
|
|
9.3
|
|
10.0
|
|
13.8
|
|
10.5
|
|
10.0
|
|
||
|
Tier 1 leverage
(5)
|
14,340
|
|
9.9
|
|
4.0
|
|
5.0
|
|
9.9
|
|
4.0
|
|
5.0
|
|
||
|
Risk-weighted assets
|
127,203
|
|
||||||||||||||
|
Quarterly adjusted average assets
|
144,500
|
|
||||||||||||||
|
December 31, 2016
|
||||||||||||||||
|
Common equity tier 1 capital
(2)
|
|
$13,822
|
|
11.2
|
%
|
5.1
|
%
|
6.5
|
%
|
11.1
|
%
|
7.0
|
%
|
6.5
|
%
|
|
|
Tier 1 capital
(3)
|
14,069
|
|
11.4
|
|
6.6
|
|
8.0
|
|
11.3
|
|
8.5
|
|
8.0
|
|
||
|
Total capital
(4)
|
17,347
|
|
14.0
|
|
8.6
|
|
10.0
|
|
14.0
|
|
10.5
|
|
10.0
|
|
||
|
Tier 1 leverage
(5)
|
14,069
|
|
9.9
|
|
4.0
|
|
5.0
|
|
9.9
|
|
4.0
|
|
5.0
|
|
||
|
Risk-weighted assets
|
123,857
|
|
||||||||||||||
|
Quarterly adjusted average assets
|
141,677
|
|
||||||||||||||
(1)
Fully phased-in regulatory capital ratios are Key Performance Metrics. For more information on Key Performance Metrics, see “
—
Principal Components of Operations and Key Performance Metrics Used By Management.”
(2)
“Common equity tier 1 capital ratio” is CET1 capital divided by total risk-weighted assets as defined under U.S. Basel III Standardized approach.
(3)
“Tier 1 capital ratio” is tier 1 capital, which includes CET1 capital plus non-cumulative perpetual preferred equity that qualifies as additional tier 1 capital, divided by total risk-weighted assets as defined under U.S. Basel III Standardized approach.
(4)
“Total capital ratio” is total capital divided by total risk-weighted assets as defined under U.S. Basel III Standardized approach.
(5)
“Tier 1 leverage ratio” is tier 1 capital divided by quarterly average total assets as defined under U.S. Basel III Standardized approach.
(6)
Required “Minimum Capital ratio” for 2016 and 2017 are: Common equity tier 1 capital of 4.5%; Tier 1 capital of 6.0%; Total capital of 8.0%; and Tier 1 leverage of 4.0%.
(7)
“
Minimum Capital ratio” includes capital conservation buffer for Transitional Basel III of 1.250% for 2017 and 0.625% for 2016; N/A to Tier 1 leverage.
(8)
“Minimum Capital ratio” for 2016 and 2017 includes capital conservation buffer for Pro Forma Basel III of 2.5%; N/A to Tier 1 leverage.
(9)
Presented for informational purposes. Prompt corrective action provisions apply only to insured depository institutions - CBNA and CBPA.
At
September 30, 2017
, our CET1 capital, tier 1 capital and total capital ratios were
11.1%
,
11.3
% and
13.8
%, respectively, as compared with
11.2%
,
11.4
% and
14.0
%, respectively, as of December 31, 2016. These capital ratios decreased due to risk-weighted asset growth and our Capital Plan actions over the period, which included common dividends of $233 million, preferred dividends of $14 million and the repurchase of $485 million of our outstanding common stock, partially offset by net income for the nine months ended
September 30, 2017
. At
September 30, 2017
, our CET1 capital, tier 1 capital and total capital ratios were 4.1%, 2.8% and 3.3%, respectively, above their regulatory minimums plus the fully phased-in capital conservation buffer. Based on both current and fully phased-in Basel III requirements, all ratios remained well above the U.S. Basel III minima.
Standardized Approach
CFG, CBNA and CBPA calculate regulatory ratios using the U.S. Basel III Standardized approach, as defined by U.S. Federal bank regulators, for determining risk-weighted assets. The U.S. Basel III Standardized approach for risk weighting assets expands the risk-weighting categories from the four Basel I derived categories (0%, 20%, 50% and 100%) to a much larger and more risk-sensitive number of categories, depending on the nature of the assets, generally ranging from 0% for U.S. government and agency securities, to 600% for certain equity exposures, and resulting in higher risk weights for a variety of asset classes. Under this approach, no distinction is made for variations in credit quality for corporate exposures. Additionally, the economic benefit of collateral is restricted to a limited list of eligible securities and cash. At
September 30, 2017
, we estimate our CET1 capital, CET1 capital ratio and total risk-weighted assets using the U.S. Basel III Standardized approach, on a fully phased-in basis, to be
$14.1 billion
,
11.1%
and
$127.5 billion
, respectively. Our estimates may be refined over time because of further rulemaking or clarification by U.S. banking regulators or as our understanding and interpretation of these rules evolve.
49
CITIZENS FINANCIAL GROUP, INC.
MANAGEMENT’S DISCUSSION AND ANALYSIS
The following table provides a reconciliation of regulatory ratios and ratio components using the U.S. Basel III Standardized Transitional rules and U.S. Basel III Standardized estimates on a fully phased-in basis for common equity tier 1 capital, total capital and risk-weighted assets:
|
(in millions, except ratio data)
|
September 30, 2017
|
December 31, 2016
|
|||||
|
Common equity tier 1 capital
|
|
$14,093
|
|
|
$13,822
|
|
|
|
Impact of intangibles at 100%
|
—
|
|
—
|
|
|||
|
Fully phased-in common equity tier 1 capital
(1)
|
|
$14,093
|
|
|
$13,822
|
|
|
|
Total capital
|
|
$17,560
|
|
|
$17,347
|
|
|
|
Impact of intangibles at 100%
|
—
|
|
—
|
|
|||
|
Fully phased-in total capital
(1)
|
|
$17,560
|
|
|
$17,347
|
|
|
|
Risk-weighted assets
|
|
$127,203
|
|
|
$123,857
|
|
|
|
Impact of intangibles - 100% capital deduction
|
—
|
|
—
|
|
|||
|
Impact of mortgage servicing assets at 250% risk weight
|
251
|
|
244
|
|
|||
|
Fully phased-in risk-weighted assets
(1)
|
|
$127,454
|
|
|
$124,101
|
|
|
|
Transitional common equity tier 1 capital ratio
(2)
|
11.1
|
%
|
11.2
|
%
|
|||
|
Fully phased-in common equity tier 1 capital ratio
(1)(2)
|
11.1
|
|
11.1
|
|
|||
|
Transitional total capital ratio
(3)
|
13.8
|
|
14.0
|
|
|||
|
Fully phased-in total capital ratio
(1)(3)
|
13.8
|
|
14.0
|
|
|||
(1)
Fully phased-in regulatory capital ratios are Key Performance Metrics. For more information on Key Performance Metrics, see “
—
Principal Components of Operations and Key Performance Metrics Used By Management.”
(2)
“Common equity tier 1 capital ratio” is CET1 capital divided by total risk-weighted assets as defined under U.S. Basel III Standardized approach.
(3)
“Total capital ratio” is total capital divided by total risk-weighted assets as defined under U.S. Basel III Standardized approach.
Regulatory Capital Ratios and Capital Composition
CET1 capital under U.S. Basel III Standardized Transitional rules totaled
$14.1 billion
at
September 30, 2017
, and increased
$271 million
from
$13.8 billion
at
December 31, 2016
, as net income for the nine months ended
September 30, 2017
was partially offset by the impact of common share repurchases and dividend payments. Tier 1 capital at
September 30, 2017
totaled
$14.3 billion
, reflecting a
$271 million
increase from
$14.1 billion
at December 31, 2016, driven by the changes in CET1 capital noted above. At
September 30, 2017
, we had $247 million of 5.500% Fixed-to-Floating Non-Cumulative Perpetual Preferred Stock outstanding which qualified as additional tier 1 capital. Total capital of
$17.6 billion
at
September 30, 2017
, increased
$213 million
from December 31, 2016, as net income for the nine months ended
September 30, 2017
was partially offset by the impact of common share repurchases, dividend payments over the period and a decrease of $70 million for non-qualifying tier 2 subordinated debt. Under U.S. Basel III Standardized rules, tier 2 capital instrument eligibility is phased out by 20% per year, beginning five years from the applicable maturity date.
Risk-weighted assets (“RWA”) totaled
$127.2 billion
at
September 30, 2017
, based on U.S. Basel III Standardized Transitional rules, up
$3.3 billion
from
December 31, 2016
. This increase was driven by growth in retail loans, including education, residential mortgage and unsecured personal loans as well as commercial and commercial real estate loans and unfunded commercial commitment RWA. Included within the commercial real estate loan RWA increase was approximately $700 million tied to a change in the RWA designation for certain commercial real estate loans in first quarter 2017. These increases were partially offset by the RWA impact of run-off in the auto and home equity portfolios and a reduction in market risk, as we did not meet the reporting threshold prescribed by Market Risk Capital Guidelines for the third quarter 2017. The tier 1 leverage ratio remained stable from
December 31, 2016
to
September 30, 2017
.
50
CITIZENS FINANCIAL GROUP, INC.
MANAGEMENT’S DISCUSSION AND ANALYSIS
The following table presents our capital composition under the U.S. Basel III capital framework:
|
Transitional Basel III
|
|||||||
|
(in millions)
|
September 30, 2017
|
December 31, 2016
|
|||||
|
Total common stockholders’ equity
|
|
$19,862
|
|
|
$19,499
|
|
|
|
Exclusions
(1)
:
|
|||||||
|
Net unrealized losses recorded in accumulated other comprehensive income, net of tax:
|
|||||||
|
Debt and marketable equity securities available for sale
|
116
|
|
186
|
|
|||
|
Derivatives
|
79
|
|
88
|
|
|||
|
Unamortized net periodic benefit costs
|
386
|
|
394
|
|
|||
|
Deductions:
|
|||||||
|
Goodwill
|
(6,887
|
)
|
(6,876
|
)
|
|||
|
Deferred tax liability associated with goodwill
|
539
|
|
532
|
|
|||
|
Other intangible assets
|
(2
|
)
|
(1
|
)
|
|||
|
Total common equity tier 1
|
14,093
|
|
13,822
|
|
|||
|
Qualifying preferred stock
|
247
|
|
247
|
|
|||
|
Total tier 1 capital
|
14,340
|
|
14,069
|
|
|||
|
Qualifying subordinated debt
(2)
|
1,901
|
|
1,970
|
|
|||
|
Allowance for loan and lease losses
|
1,224
|
|
1,236
|
|
|||
|
Allowance for credit losses for off-balance sheet exposure
|
95
|
|
72
|
|
|||
|
Total capital
|
|
$17,560
|
|
|
$17,347
|
|
|
(1)
As a U.S. Basel III Standardized approach institution, we selected the one-time election to opt-out of the requirements to include all the components of AOCI.
(2)
As of September 30, 2017, the amount of non-qualifying subordinated debt excluded from regulatory capital was $70 million.
Capital Adequacy Process
Our assessment of capital adequacy begins with our risk appetite and risk management framework. This framework provides for the identification, measurement and management of material risks. Capital requirements are determined for actual and forecasted risk portfolios using applicable regulatory capital methodologies. The assessment also considers the possible impacts of approved and proposed regulatory changes to future periods. Key analytical frameworks, which enable the assessment of capital adequacy versus unexpected loss, supplement our base case forecast. These supplemental frameworks include stress testing, as well as an internal capital adequacy requirement that builds on internally assessed economic capital requirements. A robust governance framework supports our capital planning process. This process includes capital management policies and procedures that document capital adequacy metrics and limits, as well as our comprehensive capital contingency plan and the active engagement of both the legal-entity boards and senior management in oversight and decision-making.
Forward-looking assessments of capital adequacy for us and for our banking subsidiaries feed development of capital plans that are submitted to the FRB and to the bank regulators. We prepare these plans in full compliance with the FRB’s Capital Plan Rule and we participate annually in the FRB’s CCAR review process. In addition to the stress test requirements under CCAR, we also perform semi-annual company-run stress tests required by the Dodd-Frank Act.
All distributions proposed under our Capital Plan are subject to consideration and approval by our Board of Directors prior to execution. The timing and exact amount of future dividends and share repurchases will depend on various factors, including our capital position, financial performance and market conditions.
Capital Transactions
During the nine months ended
September 30, 2017
, we completed the following capital actions:
|
•
|
Declared and paid quarterly common stock dividends of $0.14 per share for first and second quarter 2017, and $0.18 per share for third quarter 2017, aggregating to dividend payments of $233 million;
|
|
•
|
Declared semi-annual dividends of $27.50 per share on the 5.500% fixed-to-floating rate non-cumulative perpetual Series A Preferred Stock, aggregating to dividend payments of $7 million on April 6, 2017 and October 6, 2017; and
|
|
•
|
Repurchased $485 million of our outstanding common stock.
|
51
CITIZENS FINANCIAL GROUP, INC.
MANAGEMENT’S DISCUSSION AND ANALYSIS
On October 20, 2017, we announced that our Board of Directors declared a fourth quarter cash dividend of $0.18 per common share. The dividend is payable on November 15, 2017 to shareholders of record at the close of business on November 1, 2017.
Banking Subsidiaries’ Capital
The following table presents our banking subsidiaries’ capital ratios under U.S. Basel III Standardized Transitional rules:
|
Transitional Basel III
|
|||||||||||
|
September 30, 2017
|
December 31, 2016
|
||||||||||
|
(dollars in millions, except ratio data)
|
Amount
|
|
Ratio
|
|
Amount
|
|
Ratio
|
|
|||
|
Citizens Bank, N.A.
|
|||||||||||
|
Common equity tier 1 capital
(1)
|
|
$11,539
|
|
11.1
|
%
|
|
$11,248
|
|
11.2
|
%
|
|
|
Tier 1 capital
(2)
|
11,539
|
|
11.1
|
|
11,248
|
|
11.2
|
|
|||
|
Total capital
(3)
|
13,745
|
|
13.2
|
|
13,443
|
|
13.4
|
|
|||
|
Tier 1 leverage
(4)
|
11,539
|
|
10.2
|
|
11,248
|
|
10.3
|
|
|||
|
Risk-weighted assets
|
104,165
|
|
100,491
|
|
|||||||
|
Quarterly adjusted average assets
|
113,670
|
|
109,530
|
|
|||||||
|
Citizens Bank of Pennsylvania
|
|||||||||||
|
Common equity tier 1 capital
(1)
|
|
$3,059
|
|
12.9
|
%
|
|
$3,094
|
|
12.7
|
%
|
|
|
Tier 1 capital
(2)
|
3,059
|
|
12.9
|
|
3,094
|
|
12.7
|
|
|||
|
Total capital
(3)
|
3,297
|
|
13.9
|
|
3,333
|
|
13.6
|
|
|||
|
Tier 1 leverage
(4)
|
3,059
|
|
8.8
|
|
3,094
|
|
8.8
|
|
|||
|
Risk-weighted assets
|
23,711
|
|
24,426
|
|
|||||||
|
Quarterly adjusted average assets
|
34,712
|
|
35,057
|
|
|||||||
(1)
“Common equity tier 1 capital ratio” is CET1 capital divided by total risk-weighted assets as defined under U.S. Basel III Standardized approach.
(2)
“Tier 1 capital ratio” is tier 1 capital, which includes CET1 capital plus non-cumulative perpetual preferred equity that qualifies as additional tier 1 capital, divided by total risk-weighted assets as defined under U.S. Basel III Standardized approach.
(3)
“Total capital ratio” is total capital divided by total risk-weighted assets as defined under U.S. Basel III Standardized approach.
(4)
“Tier 1 leverage ratio” is tier 1 capital divided by quarterly average total assets as defined under U.S. Basel III Standardized approach.
CBNA CET1 capital totaled
$11.5 billion
at
September 30, 2017
, up
$291 million
from
$11.2 billion
at
December 31, 2016
, reflecting the impact of net income, partially offset by dividend payments. At
September 30, 2017
, CBNA held minimal additional tier 1 capital. Total capital was
$13.7 billion
at
September 30, 2017
, an increase of
$302 million
from
$13.4 billion
at
December 31, 2016
, primarily driven by the increases in CET1 capital.
CBNA risk-weighted assets of
$104.2 billion
at
September 30, 2017
increased
$3.7 billion
from
December 31, 2016
, driven by growth in retail loans, including residential mortgage, education and unsecured personal loans, as well as commercial and commercial real estate loans and unfunded commercial commitment RWA.
Included within the commercial real estate loan RWA increase was approximately $400 million tied to a change in the RWA designation for certain commercial real estate loans in first quarter 2017. These increases were partially offset by the RWA impact of run-off in the home equity portfolio and a reduction in market risk, as CBNA did not meet the reporting threshold prescribed by Market Risk Capital Guidelines for third
quarter 2017.
As of
September 30, 2017
, the CBNA tier 1 leverage ratio decreased approximately
12
basis points to
10.2
% from
10.3
% as of
December 31, 2016
, driven by a
$4.1 billion
increase in adjusted quarterly average total assets that drove a
38
basis point decline in the ratio, partially offset by a
26
basis point increase from higher CET1 capital described above.
CBPA CET1 capital totaled
$3.1 billion
at
September 30, 2017
, and decreased
$35 million
from
$3.1 billion
at
December 31, 2016
, as dividend payments exceeded net income and amortization of deferred tax related to goodwill. At
September 30, 2017
, there was no additional tier 1 capital. Total capital was
$3.3 billion
at
September 30, 2017
, a decrease of
$36 million
from December 31, 2016, primarily driven by the decrease in CET1 capital.
CBPA risk-weighted assets of
$23.7 billion
at
September 30, 2017
decreased
$715 million
from
December 31, 2016
, driven by decreases in commercial, auto, and residential mortgage loan RWA.
These decreases were offset by an increase of approximately $300 million tied to a change of the RWA designation for certain commercial real estate loans in first quarter 2017, in addition to growth in education loan RWA.
52
CITIZENS FINANCIAL GROUP, INC.
MANAGEMENT’S DISCUSSION AND ANALYSIS
As of
September 30, 2017
, the CBPA tier 1 leverage ratio was consistent with
December 31, 2016
at
8.8%
.
LIQUIDITY
Liquidity is defined as our ability to meet our cash-flow and collateral obligations in a timely manner, at a reasonable cost. An institution must maintain operating liquidity to meet its expected daily and forecasted cash-flow requirements, as well as contingent liquidity to meet unexpected (stress scenario) funding requirements. As noted earlier, reflecting the importance of meeting all unexpected and stress-scenario funding requirements, we identify and manage contingent liquidity (consisting of cash balances at the FRB, unencumbered high-quality and liquid securities, and unused FHLB borrowing capacity). Separately, we also identify and manage asset liquidity as a subset of contingent liquidity (consisting of cash balances at the FRB and unencumbered high-quality securities). We consider the effective and prudent management of liquidity to be fundamental to our health and strength.
We manage liquidity at the consolidated enterprise level and at each material legal entity, including at the Parent Company, CBNA and CBPA.
Parent Company Liquidity
Our Parent Company’s primary sources of cash are (i) dividends and interest received from our banking subsidiaries as a result of investing in bank equity and subordinated debt; and (ii) externally issued senior and subordinated debt. Uses of liquidity include the following: (i) routine cash flow requirements as a bank holding company, including periodic share repurchases and payments of dividends, interest and expenses; (ii) needs of subsidiaries, including banking subsidiaries, for additional equity and, as required, their needs for debt financing; and (iii) support for extraordinary funding requirements when necessary.
During the three month periods ended
September 30, 2017
and 2016, the Parent Company paid dividends on common stock of $90 million and $62 million, respectively, and declared dividends on preferred stock of $7 million for both periods.
During the nine month periods ended
September 30, 2017
and 2016, the Parent Company paid dividends on common stock of $233 million and $179 million, respectively, and declared dividends on preferred stock of $14 million for both periods.
During the three month periods ended
September 30, 2017
and 2016, the Parent Company repurchased $225 million and $250 million of its outstanding common stock, respectively. During the nine month period ended
September 30, 2017
and 2016, the Parent Company repurchased $485 million and $250 million of its outstanding common stock, respectively
.
Our Parent Company’s cash and cash equivalents represent a source of liquidity that can be used to meet various needs and totaled
$551 million
as of
September 30, 2017
and December 31, 2016, respectively.
Our Parent Company’s liquidity risk is low for the following reasons: (i) the Parent Company has no material non-banking subsidiaries, and its banking subsidiaries are self-funding; (ii) the capital structures of the Parent Company’s banking subsidiaries are similar to the Parent Company’s capital structure; and, (iii) other cash flow requirements, such as operating expenses, are relatively small. The Parent Company’s double-leverage ratio (the combined equity of Parent Company subsidiaries divided by Parent Company equity) is a measure of reliance on equity cash flows from subsidiaries. At
September 30, 2017
, the Parent Company’s double-leverage ratio was
102%
.
Banking Subsidiaries’ Liquidity
In the ordinary course of business, the liquidity of CBNA and CBPA is managed by matching sources and uses of cash. The primary sources of bank liquidity include (i) deposits from our consumer and commercial franchise customers; (ii) payments of principal and interest on loans and debt securities; and (iii) wholesale borrowings, as needed, and as described under “—Liquidity Risk Management and Governance.” The primary uses of bank liquidity include (i) withdrawals and maturities of deposits; (ii) payment of interest on deposits; (iii) funding of loans and related commitments; and (iv) funding of securities purchases. To the extent that the banks have relied on wholesale borrowings, uses also include payments of related principal and interest.
Our banking subsidiaries’ major businesses involve taking deposits and making loans. Hence, a key role of liquidity management is to ensure that customers have timely access to funds from deposits and loans. Liquidity management also involves maintaining sufficient liquidity to repay wholesale borrowings, pay operating expenses and support extraordinary funding requirements when necessary.
From an external issuance perspective, on February 24, 2017, we increased the size of CBNA’s Global Note Program from $5.0 billion to $8.0 billion. On March 2, 2017, CBNA issued $1.0 billion in three-year senior notes, consisting of $700 million in fixed-rate notes and $300 million in floating-rate notes
. On May 26, 2017, CBNA issued
53
CITIZENS FINANCIAL GROUP, INC.
MANAGEMENT’S DISCUSSION AND ANALYSIS
$1.5 billion in senior notes, consisting of $500 million of three-year fixed-rate notes, $250 million of three-year floating-rate notes, $500 million in five-year fixed-rate notes, and $250 million in five-year floating-rate notes.
Liquidity Risk
We define liquidity risk as the risk that an entity will be unable to meet its payment obligations in a timely manner, at a reasonable cost. We manage liquidity risk at the consolidated enterprise level, and at the legal entity level, including at the Parent Company, CBNA and CBPA. Liquidity risk can arise due to contingent liquidity risk and/or funding liquidity risk.
Contingent liquidity risk is the risk that market conditions may reduce an entity’s ability to liquidate, pledge and/or finance certain assets and thereby substantially reduce the liquidity value of such assets. Drivers of contingent liquidity risk include general market disruptions as well as specific issues regarding the credit quality and/or valuation of a security or loan, issuer or borrower and/or asset class.
Funding liquidity risk is the risk that market conditions and/or entity-specific events may reduce an entity’s ability to raise funds from depositors and/or wholesale market counterparties. Drivers of funding liquidity risk may be idiosyncratic or systemic, reflecting impediments to operations and/or damaged market confidence.
Factors Affecting Liquidity
Given the composition of their assets and borrowing sources, contingent liquidity risk at both CBNA and CBPA would be materially affected by such events as deterioration of financing markets for high-quality securities (e.g., mortgage-backed securities and other instruments issued by the GNMA, FNMA and the FHLMC), by any inability of the FHLBs to provide collateralized advances, and/or by a refusal of the FRB to act as lender of last resort in systemic stress.
Similarly, given the structure of their balance sheets, the funding liquidity risk of CBNA and CBPA would be materially affected by an adverse idiosyncratic event (e.g., a major loss, causing a perceived or actual deterioration in its financial condition), an adverse systemic event (e.g., default or bankruptcy of a significant capital markets participant), or a combination of both (e.g., the financial crisis of 2008-2010). However, during the financial crisis, our banking subsidiaries reduced their dependence on unsecured wholesale funding to virtually zero. Consequently, and despite ongoing exposure to a variety of idiosyncratic and systemic events, we view our contingent liquidity risk and our funding liquidity risk to be relatively modest.
An additional variable affecting our access, and the access of our banking subsidiaries, to unsecured wholesale market funds and to large denomination (i.e., uninsured) customer deposits is the credit ratings assigned by such agencies as Moody’s, Standard & Poor’s and Fitch. The following table presents our credit ratings:
|
|
September 30, 2017
|
|||||
|
|
Moody’s
|
Standard and
Poor’s
|
Fitch
|
|||
|
Citizens Financial Group, Inc.:
|
|
|
|
|||
|
Long-term issuer
|
NR
|
BBB+
|
BBB+
|
|||
|
Short-term issuer
|
NR
|
A-2
|
F2
|
|||
|
Subordinated debt
|
NR
|
BBB
|
BBB
|
|||
|
Preferred Stock
|
NR
|
BB+
|
BB-
|
|||
|
Citizens Bank, N.A.:
|
|
|
|
|||
|
Long-term issuer
|
Baa1
|
A-
|
BBB+
|
|||
|
Short-term issuer
|
P-2
|
A-2
|
F2
|
|||
|
Long-term deposits
|
A1
|
NR
|
A-
|
|||
|
Short-term deposits
|
P-1
|
NR
|
F2
|
|||
|
Citizens Bank of Pennsylvania:
|
|
|
|
|||
|
Long-term issuer
|
Baa1
|
A-
|
BBB+
|
|||
|
Short-term issuer
|
NR
|
A-2
|
F2
|
|||
|
Long-term deposits
|
A1
|
NR
|
A-
|
|||
|
Short-term deposits
|
P-1
|
NR
|
F2
|
|||
|
NR = Not rated
|
||||||
Changes in our public credit ratings could affect both the cost and availability of our wholesale funding. As a result and in order to maintain a conservative funding profile, our banking subsidiaries continue to minimize
54
CITIZENS FINANCIAL GROUP, INC.
MANAGEMENT’S DISCUSSION AND ANALYSIS
reliance on unsecured wholesale funding. At
September 30, 2017
, our wholesale funding consisted primarily of secured borrowings from the FHLBs collateralized by high-quality residential mortgages, and term debt issued by the Parent Company and CBNA.
Existing and evolving regulatory liquidity requirements, such as the LCR and NSFR, represent another key driver of systemic liquidity conditions and liquidity management practices. The FRB, the OCC, and the FDIC regularly evaluate our liquidity as part of the overall supervisory process.
The LCR was developed to ensure banks have sufficient high-quality liquid assets to cover expected net cash outflows over a 30-day liquidity stress period. In September 2014, the U.S. federal banking regulators published the final rule to implement the LCR. This rule also introduced a modified version of the LCR in the United States, which generally applies to bank holding companies not active internationally (institutions with less than $10 billion of on-balance sheet foreign exposure), with total assets of greater than $50 billion but less than $250 billion. Under this definition we are designated as a modified LCR financial institution and were 100% compliant beginning in January 2017. Achieving sustainable LCR compliance may require changes in the size and/or composition of our investment portfolio, the configuration of our discretionary wholesale funding portfolio, and our average cash position. We remain fully compliant with the LCR as of
September 30, 2017
.
The U.S. federal bank regulatory agencies have issued a notice of proposed rulemaking to implement the NSFR, along with a modified version with similar parameters as the LCR, that would designate us as a modified NSFR financial institution. The NSFR is one of the two Basel III-based liquidity measures, distinctly separate from the LCR, and is designed to promote medium- and long-term stable funding of the assets and off-balance sheet activities of banks and bank holding companies over a one-year time horizon. Generally consistent with the Basel Committee’s framework, under the proposed rule banking organizations would be required to hold an amount of available stable funding (“ASF”) over a one-year time horizon that equals or exceeds the institution’s amount of required stable funding (“RSF”), with the ASF representing the numerator and the RSF representing the denominator of the NSFR. The banking organizations subject to the modified NSFR would multiply the RSF amount by 70%, such that the RSF amount required for these companies would be required to maintain ASF of at least 70% of its RSF. Generally, these modified NSFR companies are defined as institutions with total assets of greater than $50 billion but less than $250 billion and less than $10 billion of on-balance sheet foreign exposure. The proposed rule includes detailed descriptions of the items that would comprise ASF and RSF and standardized factors that would apply to ASF and RSF items, and would require any institution whose applicable modified NSFR falls under 100% to notify the appropriate federal regulator and develop a remediation plan. We are currently evaluating the impact of the U.S. federal bank regulatory agencies’ NSFR framework. If ultimately adopted as currently proposed, the implementation of the NSFR could impact our liquidity and funding requirements and practices in the future.
We continue to review and monitor these liquidity requirements to develop appropriate implementation plans and liquidity strategies. We expect to be fully compliant with the final rules on or prior to their applicable effective date.
Liquidity Risk Management and Governance
Liquidity risk is measured and managed by the Funding and Liquidity Unit within our Treasury unit in accordance with policy guidelines promulgated by our Board and the Asset and Liability Management Committee. In managing liquidity risk, the Funding and Liquidity Unit delivers regular and comprehensive reporting, including current levels versus threshold limits for a broad set of liquidity metrics and early warning indicators, explanatory commentary relating to emerging risk trends and, as appropriate, recommended remedial strategies.
The mission of our Funding and Liquidity Unit is to deliver and otherwise maintain prudent levels of operating liquidity (to support expected and projected funding requirements), and contingent liquidity (to support unexpected funding requirements resulting from idiosyncratic, systemic, and combination stress events, and regulatory liquidity requirements). Additionally, we will deliver this liquidity from stable funding sources, in a timely manner and at a reasonable cost, without significant adverse consequences.
We seek to accomplish this mission by funding loans with stable deposits; by prudently controlling dependence on wholesale funding, particularly short-term unsecured funding; and by maintaining ample available liquidity, including a contingent liquidity buffer of unencumbered high-quality loans and securities. As of
September 30, 2017
:
|
•
|
Core deposits continued to be our primary source of funding and our consolidated period end loan-to-deposit ratio was
98.4%
;
|
|
•
|
Our cash position (which is defined as cash balance held at the FRB) totaled
$1.3 billion
;
|
55
CITIZENS FINANCIAL GROUP, INC.
MANAGEMENT’S DISCUSSION AND ANALYSIS
|
•
|
Contingent liquidity was
$27.7 billion
, consisting of unencumbered high-quality liquid assets of
$20.3 billion
, unused FHLB capacity of
$6.1 billion
, and our cash position (defined above) of
$1.3 billion
. Asset liquidity (a component of contingent liquidity) was
$21.6 billion
consisting of unencumbered high-quality and liquid securities of
$20.3 billion
and our cash position of
$1.3 billion
; and
|
|
•
|
Available discount window capacity, defined as available total borrowing capacity from the FRB based on identified collateral, is secured by non-mortgage commercial and retail loans and totaled
$12.7 billion
. Use of this borrowing capacity would likely be considered only during exigent circumstances.
|
The Funding and Liquidity Unit monitors a variety of liquidity and funding metrics and early warning indicators and metrics, including specific risk thresholds limits. These monitoring tools are broadly classified as follows:
|
•
|
Current liquidity sources and capacities, including cash at the FRBs, free and liquid securities and available and secured FHLB borrowing capacity;
|
|
•
|
Liquidity stress sources, including idiosyncratic, systemic and combined stresses, in addition to evolving regulatory requirements such as the LCR and the NSFR; and
|
|
•
|
Current and prospective exposures, including secured and unsecured wholesale funding and spot and cumulative cash-flow gaps across a variety of horizons.
|
Further, certain of these metrics are monitored individually for our banking subsidiaries and for our consolidated enterprise on a daily basis, including net overnight position, unencumbered securities, asset liquidity, and available FHLB borrowing capacity. In order to identify emerging trends and risks and inform funding decisions, specific metrics are also forecasted over a one-year horizon.
Cash flows from operating activities contributed
$1.5 billion
in the first nine months of 2017, driven by net income of
$986 million
and a net decrease in loans held for sale activity of
$141 million
. Net cash used by investing activities was
$3.9 billion
, primarily reflecting purchases of securities available for sale of
$4.1 billion
and a net increase in loans and leases of
$3.5 billion
, partially offset by proceeds from maturities, paydowns and sales of securities available for sale of
$3.5 billion
. Cash provided by financing activities was
$890 million
, driven by proceeds from issuance of long-term borrowed funds of
$12.1 billion
and a net increase in deposits of
$3.4 billion
, partially offset by a net decrease in other short-term borrowed funds of
$1.7 billion
, and repayments of long-term FHLB advances of
$11.5 billion
. The $12.1 billion proceeds from issuances of long-term borrowed funds included $2.5 billion from issuances of medium-term debt and $9.6 billion in FHLB advances. These activities resulted in a cumulative decrease in cash and cash equivalents of
$1.6 billion
, which when subtracted from the cash and cash equivalents balance of
$3.7 billion
at the beginning of the year, resulted in an ending balance of cash and cash equivalents of
$2.1 billion
as of
September 30, 2017
.
Cash flows from operating activities contributed $1.2 billion in the first nine months of 2016. Net cash used by investing activities was $8.7 billion, primarily reflecting a net increase in loans and leases of $6.7 billion and securities available for sale portfolio purchases of $4.8 billion, partially offset by proceeds from maturities, paydowns and sales of securities available for sale of $3.4 billion. Cash provided by financing activities was $7.3 billion, driven by net increase in deposits of $5.8 billion, and proceeds from issuance of long-term borrowed funds of $9.6 billion, partially offset by a net decrease in other short-term borrowed funds of $1.6 billion, and repayments of long-term borrowed funds of $6.1 billion. The $9.6 billion proceeds included $2.1 billion from issuances of medium term debt and $7.5 billion in FHLB advances. The $6.1 billion of repayments includes $5.5 billion in repayments of FHLB advances and $625 million paid to repurchase subordinated debt. These activities represented a cumulative decrease in cash and cash equivalents of $170 million, which, when added to the cash and cash equivalents balance of $3.1 billion at the beginning of the year, resulted in an ending balance of cash and cash equivalents of $2.9 billion as of September 30, 2016.
56
CITIZENS FINANCIAL GROUP, INC.
MANAGEMENT’S DISCUSSION AND ANALYSIS
OFF-BALANCE SHEET ARRANGEMENTS
The following table presents our outstanding off-balance sheet arrangements. See Note 11 “Commitments and Contingencies” to our unaudited interim Consolidated Financial Statements in Part I, Item 1 — Financial Statements, included in this report.
|
(in millions)
|
September 30, 2017
|
December 31, 2016
|
Change
|
|
Percent
|
|
||||||||
|
Undrawn commitments to extend credit
|
|
$61,934
|
|
|
$60,872
|
|
|
$1,062
|
|
2
|
%
|
|||
|
Financial standby letters of credit
|
2,080
|
|
1,892
|
|
188
|
|
10
|
|
||||||
|
Performance letters of credit
|
42
|
|
40
|
|
2
|
|
5
|
|
||||||
|
Commercial letters of credit
|
68
|
|
43
|
|
25
|
|
58
|
|
||||||
|
Marketing rights
|
41
|
|
44
|
|
(3
|
)
|
(7
|
)
|
||||||
|
Risk participation agreements
|
20
|
|
19
|
|
1
|
|
5
|
|
||||||
|
Residential mortgage loans sold with recourse
|
7
|
|
8
|
|
(1
|
)
|
(13
|
)
|
||||||
|
Total
|
|
$64,192
|
|
|
$62,918
|
|
|
$1,274
|
|
2
|
%
|
|||
In first quarter 2017, we entered into an agreement to purchase education loans on a quarterly basis beginning with the first quarter 2017 and ending with the fourth quarter 2017. The total minimum and maximum amount for 2017 of the aggregate purchase principal balance of loans under the terms of the agreement are
$750 million
and
$1.5 billion
, respectively, and we have a remaining maximum purchase commitment of $375 million. The agreement may be extended by written agreement of the parties for an additional four quarters. The agreement will terminate immediately if at any time during its term the aggregate purchase principal balance of loans equals the maximum amount. We may also terminate the agreement at will with payment of a termination fee equal to the product of
$1 million
times the number of quarters remaining under the agreement.
CRITICAL ACCOUNTING ESTIMATES
Our unaudited interim Consolidated Financial Statements, which are included in this report, are prepared in accordance with GAAP. The preparation of financial statements in conformity with GAAP requires us to establish accounting policies and make estimates that affect amounts reported in our audited Consolidated Financial Statements.
An accounting estimate requires assumptions and judgments about uncertain matters that could have a material effect on our unaudited interim Consolidated Financial Statements. Estimates are made using facts and circumstances known at a point in time. Changes in those facts and circumstances could produce results substantially different from those estimates. Our most significant accounting policies and estimates are related to ALLL, fair value, goodwill, and income taxes. For additional information regarding these accounting policies and estimates and their related application, see “—Critical Accounting Estimates” to the audited Consolidated Financial Statements in our Annual Report on Form 10-K for the year ended December 31, 2016. No material changes were made to these valuation techniques or models during the nine months ended
September 30, 2017
.
RISK GOVERNANCE
We are committed to maintaining a strong, integrated and proactive approach to the management of all risks to which we are exposed in pursuit of our business objectives. A key aspect of our Board’s responsibility as the main decision making body is setting our risk appetite to ensure that the levels of risk that we are willing to accept in the attainment of our strategic business and financial objectives are clearly understood.
To enable our Board to carry out its objectives, it has delegated authority for risk management activities, as well as governance and oversight of those activities, to a number of Board and executive management level risk committees. The Executive Risk Committee (“ERC”), chaired by the Chief Risk Officer, is responsible for oversight of risk across the enterprise and actively considers our inherent material risks, analyzes our overall risk profile and seeks confirmation that the risks are being appropriately identified, assessed and mitigated. Reporting to the ERC are the following additional committees, covering specific areas of risk: Compliance and Operational Risk Committee, Model Risk Committee, Credit Policy Committee, Asset/Liability Committee, Business Initiatives Review Committee, and the Ethics Oversight Committee.
Risk Framework
Our risk management framework is embedded in our business through a “Three Lines of Defense” model which defines responsibilities and accountabilities for risk management activities.
57
CITIZENS FINANCIAL GROUP, INC.
MANAGEMENT’S DISCUSSION AND ANALYSIS
First Line of Defense
The business lines (including their associated support functions) are the first line of defense and are accountable for identifying, assessing, managing, and controlling the risks associated with the products and services they provide. The business lines are responsible for performing regular risk assessments to identify and assess the material risks that arise in their area of responsibility, complying with relevant risk policies, testing and certifying the adequacy and effectiveness of their operational and financial reporting controls on a regular basis, establishing and documenting operating procedures and establishing and owning a governance structure for identifying and managing risk.
Second Line of Defense
The second line of defense includes independent monitoring and control functions accountable for developing and ensuring implementation of risk and control frameworks and related policies. This centralized risk function is appropriately independent from the business and is accountable for overseeing and challenging our business lines on the effective management of their risks, including credit, market, operational, regulatory, reputational, interest rate, liquidity and strategic risks.
Third Line of Defense
Our Internal Audit function is the third line of defense providing independent assurance with a view of the effectiveness of Citizens’ internal controls, governance practices, and culture so that risk is managed appropriately for the size, complexity, and risk profile of the organization. Internal Audit has complete and unrestricted access to any and all Bank records, physical properties, and personnel. Internal Audit issues a report following each internal review and provides an audit opinion to Citizens’ Audit Committee on a quarterly basis.
Credit Quality Assurance also reports to the Chief Audit Executive and also provides the legal-entity boards, senior management and other stakeholders with independent assurance on the quality of credit portfolios and adherence to agreed Credit Risk Appetite and Credit Policies and processes. In line with its procedures and regulatory expectations, the Credit Quality Assurance function undertakes a program of portfolio testing, assessing and reporting through four Risk Pillars of Asset Quality, Rating and Data Integrity, Risk Management and Credit Risk Appetite.
Risk Appetite
Risk appetite is a strategic business and risk management tool. We define our risk appetite as the maximum limit of acceptable risk beyond which we could be unable to achieve our strategic objectives and capital adequacy obligations.
Our principal non-market risks include: credit, operational, regulatory, reputational, liquidity, and strategic risks. We are also subject to certain market risks which include potential losses arising from changes in interest rates, foreign exchange rates, equity prices, commodity prices and/or other relevant market rates or prices. Market risk in our business arises from trading activities that serve customer needs, including hedging of interest rates, foreign exchange risk and non-trading activities within capital markets. We have established enterprise-wide policies and methodologies to identify, measure, monitor and report on market risk. We actively manage both trading and non-trading market risks.
See “—Market Risk” for further information.
Our risk appetite is reviewed and approved annually by the Board Risk Committee.
Credit Risk
Overview
Credit risk represents the potential for loss arising from a customer, counterparty, or issuer failing to perform in accordance with the contractual terms of the obligation. While the majority of our credit risk is associated with lending activities, we do engage with other financial counterparties for a variety of purposes including investing, asset and liability management, and trading activities. Given the financial impact of credit risk on our earnings and balance sheet, the assessment, approval, and management of credit risk represents a major part of our overall risk-management responsibility.
Objective
The independent Credit Risk Function is responsible for reviewing and approving credit risk appetite across all lines of business and credit products, approving larger and higher risk credit transactions, monitoring portfolio performance, identifying problem credit exposures, and ensuring remedial management.
58
CITIZENS FINANCIAL GROUP, INC.
MANAGEMENT’S DISCUSSION AND ANALYSIS
Organizational Structure
Management and oversight of credit risk is the responsibility of both the line of business and the second line of defense. The second line of defense, the independent Credit Risk Function, is led by the Chief Credit Officer who oversees all of our credit risk. The Chief Credit Officer reports to the Chief Risk Officer. The Chief Credit Officer, acting in a manner consistent with Board policies, has responsibility for, among other things, the governance process around policies, procedures, risk acceptance criteria, credit risk appetite, limits, and authority delegation. The Chief Credit Officer and team also have responsibility for credit approvals for larger and higher risk transactions and oversight of line of business credit risk activities. Reporting to the Chief Credit Officer are the heads of the second line of defense credit functions specializing in: Consumer Banking; Commercial Banking; Citizens Restructuring Management; Portfolio and Corporate Reporting; ALLL Analytics; and Credit Policy and Administration. Each team under these leaders is composed of highly experienced credit professionals.
Governance
The primary mechanisms used to govern our credit risk function are our consumer and commercial credit policies. These policies outline the minimum acceptable lending standards that align with our desired risk appetite. Material changes in our business model and strategies that identify a need to change our risk appetite or highlight a risk not previously contemplated are identified by the individual committees and presented to the Credit Policy Committee, Executive Risk Committee and the Board Risk Committee for approval, as appropriate.
Key Management Processes
We employ a comprehensive and integrated risk control program to proactively (1) identify, (2) measure, (3) monitor, and (4) mitigate existing and emerging credit risks across the credit lifecycle (origination, account management/portfolio management, and loss mitigation and recovery).
Consumer
On the consumer banking side of credit risk, our teams use models to evaluate consumer loans across the lifecycle of the loan. Starting at origination, credit scoring models are used to forecast the probability of default of an applicant. When approving customers for a new loan or extension of an existing credit line, credit scores are used in conjunction with other credit risk variables such as affordability, length of term, collateral value, collateral type, and lien subordination.
To ensure proper oversight of the underwriting teams, lending authority is granted by the second line of defense credit risk function to each underwriter. The amount of delegated authority depends on the experience of the individual. We periodically evaluate the performance of each underwriter and annually reauthorize their delegated authority. Only senior members of the second line of defense credit risk team are authorized to approve significant exceptions to credit policies. It is not uncommon to make exceptions to established policies when compensating factors are present. There are exception limits which, when reached, trigger a comprehensive analysis.
Once an account is established, credit scores and collateral values are refreshed at regular intervals to allow for proactive identification of increasing or decreasing levels of credit risk. Our approach to managing credit risk is highly analytical and, where appropriate, is automated, to ensure consistency and efficiency.
Commercial
On the commercial banking side of credit risk, the structure is broken into C&I loans and leases and CRE. Within C&I loans and leases there are separate verticals established for certain specialty products (e.g., asset-based lending, leasing, franchise finance, health care and technology, mid-corporate). A “specialty vertical” is a stand-alone team of industry or product specialists. Substantially all activity that falls under the ambit of the defined industry or product is managed through a specialty vertical when one exists. CRE also operates as a specialty vertical.
Commercial credit risk management begins with defined credit products and policies.
Commercial transactions are subject to individual analysis and approval at origination and, with few exceptions, are subject to a formal annual review requirement. The underwriting process includes the establishment and approval of credit grades that confirm the PD and LGD. Approval then requires both a business line approver and an independent credit approver with the requisite level of delegated authority. The approval level of a particular credit facility is determined by the size of the credit relationship as well as the PD. The checks and balances in the credit process and the independence of the credit approver function are designed to appropriately assess and sanction the level of credit risk being accepted, facilitate the early recognition of credit problems when they occur,
59
CITIZENS FINANCIAL GROUP, INC.
MANAGEMENT’S DISCUSSION AND ANALYSIS
and to provide for effective problem asset management and resolution. All authority to grant credit is delegated through the independent Credit Risk function and is closely monitored and regularly updated.
The primary factors considered in commercial credit approvals are the financial strength of the borrower, assessment of the borrower’s management capabilities, cash flows from operations, industry sector trends, type and sufficiency of collateral, type of exposure, transaction structure, and the general economic outlook. While these are the primary factors considered, there are a number of other factors that may be considered in the decision process. In addition to the credit analysis conducted during the approval process at origination and annual review, our Credit Quality Assurance group performs testing to provide an independent review and assessment of the quality of the portfolio and new originations. This group conducts portfolio reviews on a risk-based cycle to evaluate individual loans and validate risk ratings, as well as test the consistency of the credit processes and the effectiveness of credit risk management.
The maximum level of credit exposure to individual credit borrowers is limited by policy guidelines based on the perceived risk of each borrower or related group of borrowers. Concentration risk is managed through limits on industry asset class and loan quality factors. We focus predominantly on extending credit to commercial customers with existing or expandable relationships within our primary markets (for this purpose defined as our 11 state footprint plus contiguous states), although we do engage in lending opportunities outside our primary markets if we believe that the associated risks are acceptable and aligned with strategic initiatives.
Substantially all loans categorized as Classified are managed by a specialized group of credit professionals.
MARKET RISK
Market risk refers to potential losses arising from changes in interest rates, foreign exchange rates, equity prices, commodity prices and/or other relevant market rates or prices. Modest market risk arises from trading activities that serve customer needs, including hedging of interest rate and foreign exchange risk. As described below, more material market risk arises from our non-trading banking activities, such as loan origination and deposit-gathering. We have established enterprise-wide policies and methodologies to identify, measure, monitor and report market risk. We actively manage both trading and non-trading market risks.
Non-Trading Risk
We are exposed to market risk as a result of non-trading banking activities. This market risk is substantially composed of interest rate risk, as we have no direct currency or commodity risk and de minimis equity risk. We also have market risk related to capital markets loan originations, as well as the valuation of our mortgage servicing rights.
Interest Rate Risk
Interest rate risk emerges from the balance sheet after the aggregation of our assets, liabilities and equity. We refer to this non-trading risk embedded in the balance sheet as “structural interest rate risk” or “interest rate risk in the banking book.” Our mortgage servicing rights assets also contain interest rate risk as the value of the fee stream is impacted by the level of long-term interest rates.
A major source of structural interest rate risk is a difference in the repricing of assets, on the one hand, and liabilities and equity, on the other. First, there are differences in the timing and drivers of rate changes reflecting the maturity and/or repricing of assets and liabilities. For example, the rate earned on a commercial loan may reprice monthly with changes in LIBOR while the rate paid on debt or certificates of deposit may be fixed for a longer period. There are differences in the drivers of rate changes as well. Loans may be tied to a specific index rate such as LIBOR or Prime, while deposits may be only loosely correlated with LIBOR and depend on competitive demand. Due to these basis differences, net interest income is sensitive to changes in spreads between certain indices or repricing rates.
Another important source of structural interest rate risk relates to the potential exercise of explicit or embedded options. For example, most consumer loans can be prepaid without penalty; and most consumer deposits can be withdrawn without penalty. The exercise of such options by customers can exacerbate the timing differences discussed above.
A primary source of our structural interest rate risk relates to faster repricing of floating rate loans relative to the retail deposit funding. This source of asset sensitivity is now fairly evenly split between the short and long ends of the yield curve. For the past eight years with the Federal Funds rate near zero, this risk had been asymmetrical with significantly more upside benefit than potential exposure. As interest rates have begun to rise, the risk position has become more symmetrical as rates can decline further before becoming floored at zero.
60
CITIZENS FINANCIAL GROUP, INC.
MANAGEMENT’S DISCUSSION AND ANALYSIS
The secondary source of our interest rate risk is driven by longer term rates comprising the rollover or reinvestment risk on fixed rate loans as well as the prepayment risk on mortgage related loans and securities funded by non-rate sensitive deposits and equity.
The primary goal of interest rate risk management is to control exposure to interest rate risk within policy limits approved by the Board. These limits and guidelines reflect our tolerance for interest rate risk over both short-term and long-term horizons. To ensure that exposure to interest rate risk is managed within this risk appetite, we must both measure the exposure and, as necessary, hedge it. The Treasury Asset and Liability Management team is responsible for measuring, monitoring and reporting on the structural interest rate risk position. These exposures are reported on a monthly basis to the Asset and Liability Committee (“ALCO”) and at Board meetings.
We measure structural interest rate risk through a variety of metrics intended to quantify both short-term and long-term exposures. The primary method that we use to quantify interest rate risk is simulation analysis in which we model net interest income from assets, liabilities and hedge derivative positions under various interest rate scenarios over a three-year horizon. Exposure to interest rate risk is reflected in the variation of forecasted net interest income across scenarios.
Key assumptions in this simulation analysis relate to the behavior of interest rates and spreads, the changes in product balances and the behavior of loan and deposit clients in different rate environments. The most material of these behavioral assumptions relate to the repricing characteristics and balance fluctuations of deposits with indeterminate (i.e., non-contractual) maturities as well as the pace of mortgage prepayments. Assessments are periodically made by running sensitivity analysis of the impact of key assumptions. The results of these analyses are reported to ALCO.
As the future path of interest rates cannot be known in advance, we use simulation analysis to project net interest income under various interest rate scenarios including a “most likely” (implied forward) scenario as well as a variety of deliberately extreme and perhaps unlikely scenarios. These scenarios may assume gradual ramping of the overall level of interest rates, immediate shocks to the level of rates and various yield curve twists in which movements in short- or long-term rates predominate. Generally, projected net interest income in any interest rate scenario is compared to net interest income in a base case where market forward rates are realized.
The table below reports net interest income exposures against a variety of interest rate scenarios. Exposures are measured as a percentage change in net interest income over the next year due to either instantaneous or gradual parallel +/- 200 basis point moves in the market implied forward yield curve. The net interest income simulation analyses do not include possible future actions that management might undertake to mitigate this risk. The current limit is a decrease in net interest income of 13% related to an instantaneous +/- 200 basis point move. This limit was increased from a 10.0% decline in net interest income related to an instantaneous +/-200 basis point move in March 2017. With rates rising from historically low levels due to FRB rate increases in December 2016, March 2017, and June 2017 exposure to falling rates has increased. As the following table illustrates, our balance sheet is asset-sensitive: net interest income would benefit from an increase in interest rates. Exposure to a decline in interest rates is within limit. While an instantaneous and severe shift in interest rates was used in this analysis, we believe that any actual shift in interest rates would likely be more gradual and would therefore have a more modest impact as demonstrated in the following table.
61
CITIZENS FINANCIAL GROUP, INC.
MANAGEMENT’S DISCUSSION AND ANALYSIS
The table below presents the sensitivity of net interest income to various parallel yield curve shifts from the market implied forward yield curve:
|
Estimated % Change in Net Interest Income over 12 Months
|
|||||
|
Basis points
|
September 30, 2017
|
December 31, 2016
|
|||
|
Instantaneous Change in Interest Rates
|
|
|
|||
|
+200
|
10.2
|
%
|
11.3
|
%
|
|
|
+100
|
5.2
|
|
5.6
|
|
|
|
-100
|
(7.8
|
)
|
(6.9
|
)
|
|
|
-200
|
(12.0
|
)
|
(9.8
|
)
|
|
|
Gradual Change in Interest Rates
|
|
|
|||
|
+200
|
5.4
|
|
5.9
|
|
|
|
+100
|
2.8
|
|
3.1
|
|
|
|
-100
|
(2.8
|
)
|
(3.0
|
)
|
|
|
-200
|
(7.2
|
)
|
(6.2
|
)
|
|
Asset sensitivity against a 200 basis point gradual increase in rates was
5.4%
at
September 30, 2017
, a decline from 5.9% at December 31, 2016 and little changed from 5.5% at June 30, 2017. The core asset sensitivity is the result of faster repricing of the loan book relative to the deposit and equity funding. As
the Fed has slowly begun to normalize rates given improved economic growth and data, this upward trend in rates has benefited our net interest income and net interest margin as a result of the asset sensitivity. Th
e risk position can be affected by changes in interest rates which impact the repricing sensitivity or beta of the deposit base as well as the cash flows on prepayable assets. The risk position is managed within our risk limits through occasional adjustments to securities investments, interest rate swaps and mix of funding.
We use a valuation measure of exposure to structural interest rate risk, Economic Value of Equity (“EVE”), as a supplement to net interest income simulations. EVE complements net interest income simulation analysis as it estimates risk exposure over a long-term horizon. EVE measures the extent to which the economic value of assets, liabilities and off-balance sheet instruments may change in response to fluctuation in interest rates. This analysis is highly dependent upon assumptions applied to assets and liabilities with non-contractual maturities. The change in value is expressed as a percentage of regulatory capital. The current risk limit is set at a decrease of 20% of regulatory capital given an instantaneous +/- 200 basis point change in interest rates. We are operating within that limit as of
September 30, 2017
.
Capital Markets
A key component of our capital markets activities is the underwriting and distribution of corporate credit facilities to partially finance mergers and acquisitions transactions for our clients. We have a rigorous risk management process around these activities, including a limit structure capping our underwriting risk, our potential loss, and sub limits for specific asset classes. Further, the ability to approve underwriting exposure is delegated only to senior level individuals in the credit risk management and capital markets organizations with each transaction adjudicated in a formal committee meeting.
Mortgage Servicing Rights
We have market risk associated with the value of the mortgage servicing right assets, which are impacted by the level of interest rates. As of
September 30, 2017
and
December 31, 2016
, our mortgage servicing rights had a book value of
$167 million
and
$162 million
, respectively, and were carried at the lower of cost or fair value. As of
September 30, 2017
and
December 31, 2016
, the fair value of the mortgage servicing rights was
$183 million
and
$182 million
, respectively, which exceeded the carrying value at those dates. Depending on the interest rate environment, hedges may be used to stabilize the market value of the mortgage servicing right asset.
Trading Risk
We are exposed to market risk primarily through client facilitation activities including derivatives and foreign exchange products as well as underwriting and market making activities. Exposure is created as a result of changes in interest rates and related basis spreads and volatility, foreign exchange rates, and credit spreads on a select range of interest rates, foreign exchange and secondary loan instruments. These trading activities are conducted through our two banking subsidiaries, CBNA and CBPA.
62
CITIZENS FINANCIAL GROUP, INC.
MANAGEMENT’S DISCUSSION AND ANALYSIS
Client facilitation activities consist primarily of interest rate derivatives and foreign exchange contracts where we enter into offsetting trades with a separate counterparty or exchange to manage our market risk exposure. In addition to the aforementioned activities, we operate a secondary loan trading desk with the objective to meet secondary liquidity needs of our issuing clients’ transactions and investor clients. We do not engage in any trading activities with the intent to benefit from short term price differences.
We record interest rate derivatives and foreign exchange contracts as derivative assets and liabilities on our Consolidated Balance Sheets. Trading assets and liabilities are carried at fair value with income earned related to these activities included in net interest income. Changes in fair value of trading assets and liabilities are reflected in other income, a component of noninterest income on the unaudited interim Consolidated Statements of Operations.
Market Risk Governance
The market risk limit setting process is established in line with the formal enterprise risk appetite process and policy. This appetite reflects the strategic and enterprise level articulation of opportunities for creating franchise value set to the boundaries of how much market risk to take. Dealing authorities represent the key control tool in the management of market risk that allows the cascading of the risk appetite throughout the enterprise. A dealing authority sets the operational scope and tolerances within which a business and/or trading desk is permitted to operate and this is reviewed at least annually. Dealing authorities are structured to accommodate the client facing trades and hedges needed to manage the risk profile. Primary responsibility for keeping within established tolerances resides with the business. Key risk indicators, including VaR, open foreign currency positions, and single name risk, are monitored on a daily basis and reported against tolerances consistent with our risk appetite and business strategy to relevant business line management and risk counterparts.
Market Risk Measurement
We use VaR as a statistical measure for estimating potential exposure of our traded market risk in normal market conditions. Our VaR framework for risk management and regulatory reporting is the same. Risk management VaR is based on a one day holding period to a 99% confidence level, whereas regulatory VaR is based on a ten day holding period to the same confidence level. Additional to VaR, non-statistical measurements for measuring risk are employed, such as sensitivity analysis, market value and stress testing.
Our market risk platform and associated market risk and valuation models for our foreign exchange, interest rate products, and traded loans capture correlation effects and allow for aggregation of market risk across risk types, business lines and legal entities. We measure, monitor and report market risk for both management and regulatory capital purposes.
VaR Overview
The market risk measurement model is based on historical simulation. The VaR measure estimates the extent of any fair value losses on trading positions that may occur due to broad market movements (General VaR) such as changes in the level of interest rates, foreign exchange rates, equity prices and commodity prices. It is calculated on the basis that current positions remain broadly unaltered over the course of a given holding period. It is assumed that markets are sufficiently liquid to allow the business to close its positions, if required, within this holding period. VaR’s benefit is that it captures the historic correlations of a portfolio. Based on the composition of our “covered positions,” we also use a standardized add-on approach for the loan trading desk’s Specific Risk capital which estimates the extent of any losses that may occur from factors other than broad market movements. During the quarter ending March 31, 2017, we integrated our secondary traded loans into our enterprise wide market risk platform for the calculation of VaR on the general interest rate risk embedded within the traded loans. And thus retired the associated standalone model that replicated the general VaR methodology on the traded loans (the related capital was historically reflected on the “de minimis” line in the following section in prior quarters). The measured VaR on the trading portfolio is now comprised of three covered position sub-portfolios (interest rate derivatives, foreign exchange, and traded loans). The General VaR approach is expressed in terms of a confidence level over the past 500 trading days. The internal VaR measure (used as the basis of the main VaR trading limits) is a 99% confidence level with a one day holding period, meaning that a loss greater than the VaR is expected to occur, on average, on only one day in 100 trading days (i.e., 1% of the time). Theoretically, there should be a loss event greater than VaR two to three times per year. The regulatory measure of VaR is done at a 99% confidence level with a ten-day holding period. The historical market data applied to calculate the VaR is updated on a ten business day lag. Refer to “Market Risk Regulatory Capital” below for details of our ten-day VaR metrics for the quarters ended
September 30, 2017
and 2016, including high, low, average and period end VaR for interest rate and foreign exchange rate risks, as well as total VaR.
63
CITIZENS FINANCIAL GROUP, INC.
MANAGEMENT’S DISCUSSION AND ANALYSIS
Market Risk Regulatory Capital
The U.S. banking regulators’ “Market Risk Rule” covers the calculation of market risk capital. The Market Risk Rule, commonly known as Basel 2.5, substantially modified the determination of market risk-weighted assets and implemented a more risk sensitive methodology for the risk inherent in certain trading positions categorized as “covered positions.” For the purposes of the Market Risk Rule, all of our client facing trades and associated hedges need to maintain a low risk profile to qualify, and do qualify, as “covered positions
.” For the three months ended
September 30, 2017
, we were not subject to the reporting threshold under the Market Risk Rule, as we did not meet the applicability threshold, and as such, our covered trading activities were risk-weighted under U.S. Basel III Standardized credit risk rules. W
hile not subject to the determination requirements of market risk-weighted assets, we nevertheless comply with the Market Risk Rule’s other requirements. The internal management VaR measure is calculated based on the same population of trades that is utilized for regulatory VaR. The following table presents, for information and comparison purposes, the results of our modeled and non-modeled measures for regulatory capital calculations as if we had met the threshold under the Market Risk Rule for both periods presented:
|
(in millions)
|
For the Three Months Ended September 30, 2017
|
For the Three Months Ended September 30, 2016
|
||||||||||||||||||||||||||||||
|
Market Risk Category
|
Period End
|
Average
|
High
|
Low
|
Period End
|
Average
|
High
|
Low
|
||||||||||||||||||||||||
|
Interest Rate
|
|
$2
|
|
|
$1
|
|
|
$2
|
|
|
$—
|
|
|
$—
|
|
|
$—
|
|
|
$—
|
|
|
$—
|
|
||||||||
|
Foreign Exchange Currency Rate
|
—
|
|
—
|
|
—
|
|
—
|
|
—
|
|
—
|
|
2
|
|
—
|
|
||||||||||||||||
|
Credit Spread
|
1
|
|
2
|
|
4
|
|
1
|
|
—
|
|
—
|
|
—
|
|
—
|
|
||||||||||||||||
|
General VaR
|
2
|
|
2
|
|
5
|
|
1
|
|
—
|
|
—
|
|
2
|
|
—
|
|
||||||||||||||||
|
Specific Risk VaR
|
—
|
|
—
|
|
—
|
|
—
|
|
—
|
|
—
|
|
—
|
|
—
|
|
||||||||||||||||
|
Total VaR
|
|
$2
|
|
|
$2
|
|
|
$5
|
|
|
$1
|
|
|
$—
|
|
|
$—
|
|
|
$—
|
|
|
$—
|
|
||||||||
|
Stressed General VaR
|
|
$7
|
|
|
$8
|
|
|
$11
|
|
|
$5
|
|
|
$2
|
|
|
$2
|
|
|
$5
|
|
|
$1
|
|
||||||||
|
Stressed Specific Risk VaR
|
—
|
|
—
|
|
—
|
|
—
|
|
—
|
|
—
|
|
—
|
|
—
|
|
||||||||||||||||
|
Total Stressed VaR
|
|
$7
|
|
|
$8
|
|
|
$11
|
|
|
$5
|
|
|
$2
|
|
|
$2
|
|
|
$5
|
|
|
$1
|
|
||||||||
|
Market Risk Regulatory Capital
|
|
$28
|
|
|
|
|
|
|
|
|
$7
|
|
||||||||||||||||||||
|
Specific Risk Not Modeled Add-on
|
8
|
|
7
|
|
||||||||||||||||||||||||||||
|
de Minimis Exposure Add-on
|
11
|
|
17
|
|
||||||||||||||||||||||||||||
|
Total Market Risk Regulatory Capital
|
|
$47
|
|
|
$31
|
|
||||||||||||||||||||||||||
|
Market Risk-Weighted Assets (calculated)
|
|
$594
|
|
|
|
|
|
|
|
|
$385
|
|
||||||||||||||||||||
|
Market Risk-Weighted Assets (included in regulatory filing)
(1)
|
|
$—
|
|
|
$385
|
|
||||||||||||||||||||||||||
(1)
For the three months ended
September 30, 2017
, we did not meet the reporting threshold prescribed by Market Risk Capital Guidelines.
Stressed VaR
SVaR is an extension of VaR, but uses a longer historical look-back horizon that is fixed from January 3, 2005. This is done not only to identify headline risks from more volatile periods, but also to provide a counter-balance to VaR which may be low during periods of low volatility. The holding period for profit and loss determination is ten days. In addition to risk management purposes, SVaR is also a component of market risk regulatory capital. We calculate SVaR daily under its own dynamic window regime. In a dynamic window regime, values of the ten-day, 99% VaR are calculated over all possible 260-day periods that can be obtained from the complete historical data set. Refer to “Market Risk Regulatory Capital” above for details of SVaR metrics, including high, low, average and period end SVaR for the combined portfolio.
Sensitivity Analysis
Sensitivity analysis is the measure of exposure to a single risk factor, such as a one basis point change in rates or credit spread. We conduct and monitor sensitivity on interest rates, basis spreads, foreign exchange exposures, option prices, and credit spreads. Whereas VaR is based on previous moves in market risk factors over recent periods, it may not be an accurate predictor of future market moves. Sensitivity analysis complements VaR, as it provides an indication of risk relative to each factor irrespective of historical market moves, and is an effective tool in evaluating the appropriateness of hedging strategies and concentrations.
Stress Testing
Conducting a stress test of a portfolio consists of running risk models with the inclusion of key variables that simulate various historical or hypothetical scenarios. For historical stress tests, profit and loss results are simulated
64
CITIZENS FINANCIAL GROUP, INC.
MANAGEMENT’S DISCUSSION AND ANALYSIS
for selected time periods corresponding to the most volatile underlying returns while hypothetical stress tests aim to consider concentration risk, illiquidity under stressed market conditions and risk arising from our trading activities that may not be fully captured by our other models. Hypothetical scenarios also assume that market moves happen simultaneously and no repositioning or hedging activity takes place to mitigate losses as events unfold. We generate stress tests of our trading positions on a daily basis. For example, we currently include a stress test that simulates a “Lehman-type” crisis scenario by taking the worst 20-trading day peak to trough moves for the various risk factors that go into VaR from that period, and assumes they occurred simultaneously.
VaR Model Review and Validation
Market risk measurement models used are independently reviewed and subject to ongoing performance analysis by the model owner. The independent review and validation focuses on the model methodology, market data, and performance. Independent review of market risk measurement models is the responsibility of Citizens’ Model Risk Management and Validation team. Aspects covered include challenging the assumptions used, the quantitative techniques employed and the theoretical justification underpinning them, and an assessment of the soundness of the required data over time. Where possible, the quantitative impact of the major underlying modeling assumptions will be estimated (e.g., through developing alternative models). Results of such reviews are shared with the U.S. banking regulators. The market risk models may be periodically enhanced due to changes in market price levels and price action regime behavior. The Market Risk Management and Validation team will conduct internal validation before a new or changed model element is implemented and before a change is made to a market data mapping.
VaR Backtesting
Backtesting is one form of validation of the VaR model and is run daily. The Market Risk Rule requires a comparison of our internal VaR measure to the actual net trading revenue (excluding fees, commissions, reserves, intra-day trading and net interest income) for each day over the preceding year (the most recent 250 business days). Any observed loss in excess of the VaR number is taken as an exception. The level of exceptions determines the multiplication factor used to derive the VaR and SVaR-based capital requirement for regulatory reporting purposes, when applicable. We perform sub-portfolio backtesting as required under the Market Risk Rule, and as approved by our banking regulators, for interest rate, credit spread, and foreign exchange positions. The following graph shows our daily net trading revenue and total internal, modeled VaR for the quarters ended
September 30, 2017
, June 30, 2017, March 31, 2017, December 31, 2016, and September 30, 2016.
Daily VaR Backtesting
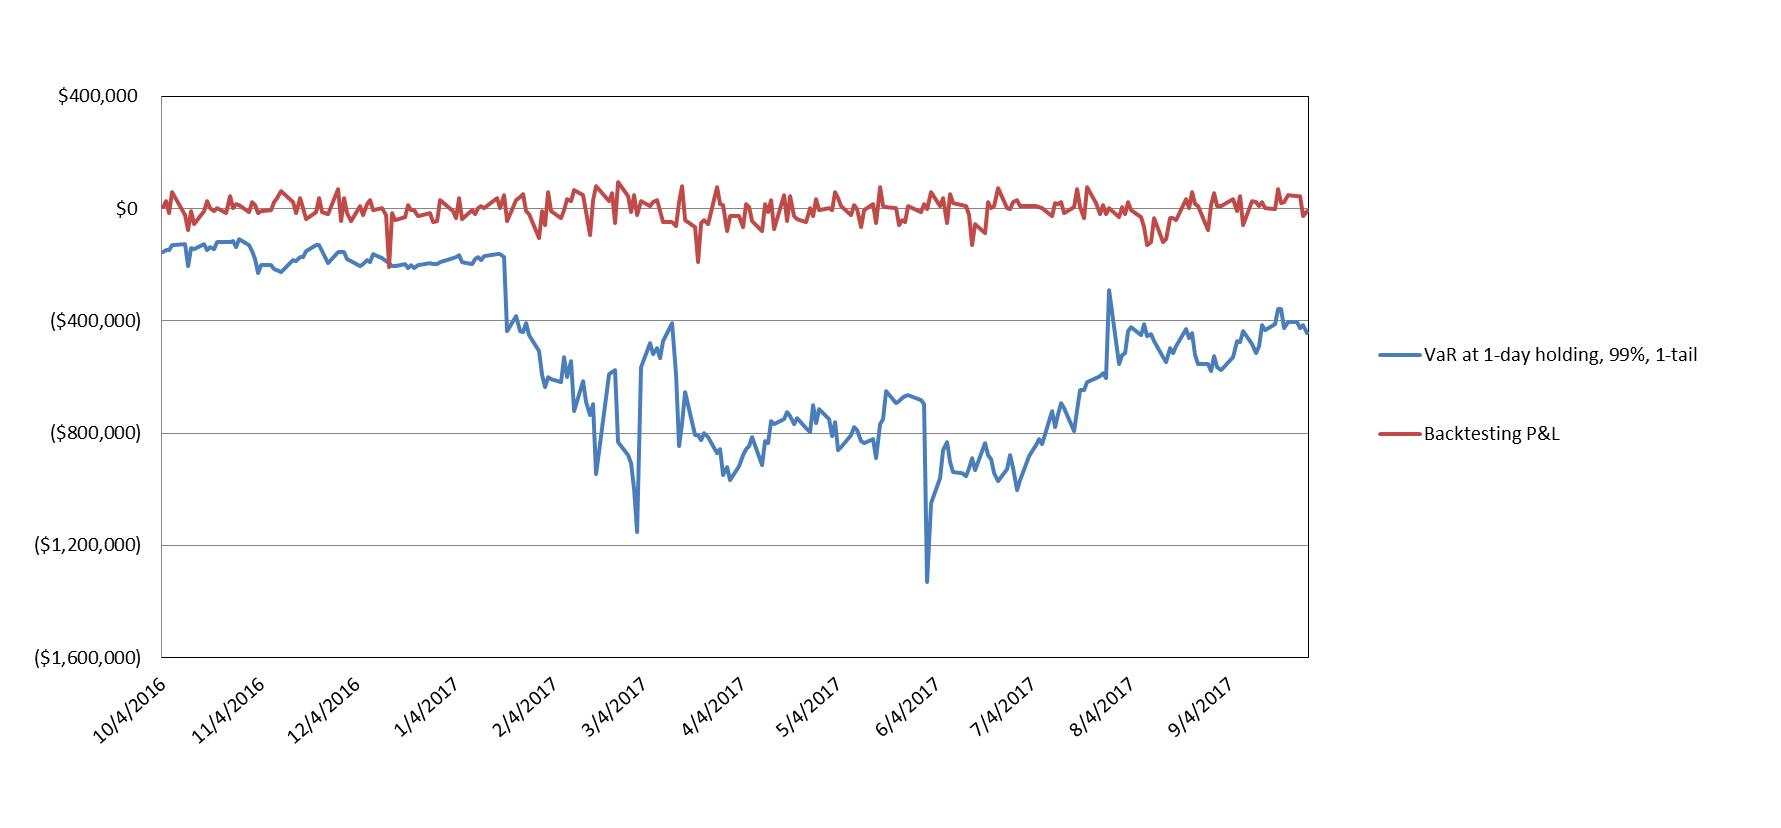
Note: As mentioned in the above “VaR Overview” section, we migrated our secondary loan trading activities from our stand alone model to our enterprise market risk platform in first quarter 2017. The above back-testing graph reflects the impact of said inclusion and daily oscillations of the market making traded loan inventory.
65
CITIZENS FINANCIAL GROUP, INC.
FINANCIAL STATEMENTS AND SUPPLEMENTARY DATA
|
Page
|
||
66
CITIZENS FINANCIAL GROUP, INC.
|
(in millions, except share data)
|
September 30, 2017
|
December 31, 2016
|
|||||
|
ASSETS:
|
|||||||
|
Cash and due from banks
|
|
$781
|
|
|
$955
|
|
|
|
Interest-bearing cash and due from banks
|
1,339
|
|
2,749
|
|
|||
|
Interest-bearing deposits in banks
|
287
|
|
439
|
|
|||
|
Securities available for sale, at fair value (including $96 and $256 pledged to creditors, respectively) (a)
|
19,982
|
|
19,501
|
|
|||
|
Securities held to maturity (including fair value of $4,839 and $5,058, respectively)
|
4,823
|
|
5,071
|
|
|||
|
Other investment securities, at fair value
|
165
|
|
96
|
|
|||
|
Other investment securities, at cost
|
772
|
|
942
|
|
|||
|
Loans held for sale, at fair value
|
500
|
|
583
|
|
|||
|
Other loans held for sale
|
724
|
|
42
|
|
|||
|
Loans and leases
|
110,151
|
|
107,669
|
|
|||
|
Less: Allowance for loan and lease losses
|
(1,224
|
)
|
(1,236
|
)
|
|||
|
Net loans and leases
|
108,927
|
|
106,433
|
|
|||
|
Derivative assets
|
596
|
|
627
|
|
|||
|
Premises and equipment, net
|
618
|
|
601
|
|
|||
|
Bank-owned life insurance
|
1,646
|
|
1,612
|
|
|||
|
Goodwill
|
6,887
|
|
6,876
|
|
|||
|
Due from broker
|
226
|
|
—
|
|
|||
|
Other assets
|
3,083
|
|
2,993
|
|
|||
|
TOTAL ASSETS
|
|
$151,356
|
|
|
$149,520
|
|
|
|
LIABILITIES AND STOCKHOLDERS’ EQUITY:
|
|||||||
|
LIABILITIES:
|
|||||||
|
Deposits:
|
|||||||
|
Noninterest-bearing
|
|
$28,643
|
|
|
$28,472
|
|
|
|
Interest-bearing
|
84,592
|
|
81,332
|
|
|||
|
Total deposits
|
113,235
|
|
109,804
|
|
|||
|
Federal funds purchased and securities sold under agreements to repurchase
|
453
|
|
1,148
|
|
|||
|
Other short-term borrowed funds
|
1,505
|
|
3,211
|
|
|||
|
Derivative liabilities
|
242
|
|
659
|
|
|||
|
Deferred taxes, net
|
744
|
|
714
|
|
|||
|
Long-term borrowed funds
|
13,400
|
|
12,790
|
|
|||
|
Other liabilities
|
1,668
|
|
1,447
|
|
|||
|
TOTAL LIABILITIES
|
|
$131,247
|
|
|
$129,773
|
|
|
|
Contingencies (refer to Note 11)
|
|
|
|
|
|||
|
STOCKHOLDERS’ EQUITY:
|
|||||||
|
Preferred stock, $25.00 par value, authorized 100,000,000 shares:
|
|||||||
|
Series A, non-cumulative perpetual, $25 par value,(liquidation preference $1,000), 250,000 shares authorized and issued net of issuance costs and related premium at September 30, 2017 and December 31, 2016
|
|
$247
|
|
|
$247
|
|
|
|
Common stock:
|
|||||||
|
$0.01 par value, 1,000,000,000 shares authorized, 565,769,260 shares issued and 499,505,285 shares outstanding at September 30, 2017 and 1,000,000,000 shares authorized, 564,630,542 shares issued and 511,954,871 shares outstanding at December 31, 2016
|
6
|
|
6
|
|
|||
|
Additional paid-in capital
|
18,768
|
|
18,722
|
|
|||
|
Retained earnings
|
3,442
|
|
2,703
|
|
|||
|
Treasury stock, at cost, 66,263,975 and 52,675,671 shares at September 30, 2017 and December 31, 2016, respectively
|
(1,773
|
)
|
(1,263
|
)
|
|||
|
Accumulated other comprehensive loss
|
(581
|
)
|
(668
|
)
|
|||
|
TOTAL STOCKHOLDERS’ EQUITY
|
|
$20,109
|
|
|
$19,747
|
|
|
|
TOTAL LIABILITIES AND STOCKHOLDERS’ EQUITY
|
|
$151,356
|
|
|
$149,520
|
|
|
(a)
Includes only collateral pledged by the Company where counterparties have the right to sell or pledge the collateral.
The accompanying Notes to unaudited interim Consolidated Financial Statements are an integral part of these statements.
67
CITIZENS FINANCIAL GROUP, INC.
|
Three Months Ended September 30,
|
Nine Months Ended September 30,
|
|||||||||||
|
(in millions, except share and per-share data)
|
2017
|
|
2016
|
|
2017
|
|
2016
|
|
||||
|
INTEREST INCOME:
|
||||||||||||
|
Interest and fees on loans and leases
|
|
$1,096
|
|
|
$926
|
|
|
$3,128
|
|
|
$2,690
|
|
|
Interest and fees on loans held for sale, at fair value
|
5
|
|
4
|
|
13
|
|
10
|
|
||||
|
Interest and fees on other loans held for sale
|
3
|
|
1
|
|
6
|
|
6
|
|
||||
|
Investment securities
|
155
|
|
146
|
|
469
|
|
432
|
|
||||
|
Interest-bearing deposits in banks
|
5
|
|
2
|
|
13
|
|
6
|
|
||||
|
Total interest income
|
1,264
|
|
1,079
|
|
3,629
|
|
3,144
|
|
||||
|
INTEREST EXPENSE:
|
||||||||||||
|
Deposits
|
123
|
|
71
|
|
311
|
|
194
|
|
||||
|
Federal funds purchased and securities sold under agreements to repurchase
|
1
|
|
1
|
|
2
|
|
2
|
|
||||
|
Other short-term borrowed funds
|
7
|
|
10
|
|
22
|
|
33
|
|
||||
|
Long-term borrowed funds
|
71
|
|
52
|
|
201
|
|
143
|
|
||||
|
Total interest expense
|
202
|
|
134
|
|
536
|
|
372
|
|
||||
|
Net interest income
|
1,062
|
|
945
|
|
3,093
|
|
2,772
|
|
||||
|
Provision for credit losses
|
72
|
|
86
|
|
238
|
|
267
|
|
||||
|
Net interest income after provision for credit losses
|
990
|
|
859
|
|
2,855
|
|
2,505
|
|
||||
|
NONINTEREST INCOME:
|
||||||||||||
|
Service charges and fees
|
131
|
|
134
|
|
385
|
|
390
|
|
||||
|
Card fees
|
58
|
|
52
|
|
177
|
|
153
|
|
||||
|
Capital markets fees
|
53
|
|
36
|
|
152
|
|
99
|
|
||||
|
Trust and investment services fees
|
38
|
|
37
|
|
116
|
|
112
|
|
||||
|
Letter of credit and loan fees
|
30
|
|
28
|
|
90
|
|
83
|
|
||||
|
Foreign exchange and interest rate products
|
24
|
|
28
|
|
77
|
|
72
|
|
||||
|
Mortgage banking fees
|
27
|
|
33
|
|
80
|
|
76
|
|
||||
|
Securities gains, net
|
2
|
|
—
|
|
9
|
|
13
|
|
||||
|
Net securities impairment losses recognized in earnings
|
(1
|
)
|
(3
|
)
|
(6
|
)
|
(11
|
)
|
||||
|
Other income
|
19
|
|
90
|
|
50
|
|
133
|
|
||||
|
Total noninterest income
|
381
|
|
435
|
|
1,130
|
|
1,120
|
|
||||
|
NONINTEREST EXPENSE:
|
||||||||||||
|
Salaries and employee benefits
|
436
|
|
432
|
|
1,312
|
|
1,289
|
|
||||
|
Outside services
|
99
|
|
102
|
|
286
|
|
279
|
|
||||
|
Occupancy
|
78
|
|
78
|
|
239
|
|
230
|
|
||||
|
Equipment expense
|
65
|
|
65
|
|
196
|
|
194
|
|
||||
|
Amortization of software
|
45
|
|
46
|
|
134
|
|
126
|
|
||||
|
Other operating expense
|
135
|
|
144
|
|
409
|
|
387
|
|
||||
|
Total noninterest expense
|
858
|
|
867
|
|
2,576
|
|
2,505
|
|
||||
|
Income before income tax expense
|
513
|
|
427
|
|
1,409
|
|
1,120
|
|
||||
|
Income tax expense
|
165
|
|
130
|
|
423
|
|
357
|
|
||||
|
NET INCOME
|
|
$348
|
|
|
$297
|
|
|
$986
|
|
|
$763
|
|
|
Net income available to common stockholders
|
$341
|
$290
|
$972
|
|
$749
|
|
||||||
|
Weighted-average common shares outstanding:
|
||||||||||||
|
Basic
|
500,861,076
|
|
519,458,976
|
|
505,529,991
|
|
525,477,273
|
|
||||
|
Diluted
|
502,157,384
|
|
521,122,466
|
|
507,062,805
|
|
527,261,384
|
|
||||
|
Per common share information:
|
||||||||||||
|
Basic earnings
|
|
$0.68
|
|
|
$0.56
|
|
|
$1.92
|
|
|
$1.43
|
|
|
Diluted earnings
|
0.68
|
|
0.56
|
|
1.92
|
|
1.42
|
|
||||
|
Dividends declared and paid
|
0.18
|
|
0.12
|
|
0.46
|
|
0.34
|
|
||||
The accompanying Notes to unaudited interim Consolidated Financial Statements are an integral part of these statements.
68
CITIZENS FINANCIAL GROUP, INC.
CONSOLIDATED STATEMENTS OF COMPREHENSIVE INCOME (UNAUDITED)
|
Three Months Ended September 30,
|
Nine Months Ended September 30,
|
|||||||||||
|
(in millions)
|
2017
|
|
2016
|
|
2017
|
|
2016
|
|
||||
|
Net income
|
|
$348
|
|
|
$297
|
|
|
$986
|
|
|
$763
|
|
|
Other comprehensive income:
|
||||||||||||
|
Net unrealized derivative instrument (losses) gains arising during the periods, net of income taxes of ($1), $0, $13 and $29, respectively
|
(1
|
)
|
(1
|
)
|
22
|
|
45
|
|
||||
|
Reclassification adjustment for net derivative gains included in net income, net of income taxes of ($2), ($4), ($8) and ($14), respectively
|
(2
|
)
|
(6
|
)
|
(13
|
)
|
(23
|
)
|
||||
|
Net unrealized securities gains (losses) arising during the periods, net of income taxes of $8, ($17), $44 and $114, respectively
|
13
|
|
(28
|
)
|
74
|
|
190
|
|
||||
|
Other-than-temporary impairment not recognized in earnings on securities, net of income taxes of $0, $2, ($1) and ($11), respectively
|
—
|
|
3
|
|
(2
|
)
|
(18
|
)
|
||||
|
Reclassification of net securities (gains) losses to net income, net of income taxes of $0, $1, ($1) and ($1), respectively
|
(1
|
)
|
2
|
|
(2
|
)
|
(1
|
)
|
||||
|
Employee Benefit Plans: Amortization of actuarial loss, net of income taxes of $2, $2, $6 and $5, respectively
|
3
|
|
2
|
|
8
|
|
7
|
|
||||
|
Total other comprehensive income (loss), net of income taxes
|
12
|
|
(28
|
)
|
87
|
|
200
|
|
||||
|
Total comprehensive income
|
|
$360
|
|
|
$269
|
|
|
$1,073
|
|
|
$963
|
|
The accompanying Notes to unaudited interim Consolidated Financial Statements are an integral part of these statements.
69
CITIZENS FINANCIAL GROUP, INC.
CONSOLIDATED STATEMENTS OF CHANGES IN STOCKHOLDERS’ EQUITY (UNAUDITED)
|
Preferred
Stock
|
Common
Stock
|
Additional Paid-in Capital
|
Retained Earnings
|
Treasury Stock, at Cost
|
Accumulated Other Comprehensive Income (Loss)
|
Total
|
|||||||||||||||||||||
|
(in millions)
|
Shares
|
Amount
|
Shares
|
Amount
|
|||||||||||||||||||||||
|
Balance at January 1, 2016
|
—
|
|
|
$247
|
|
528
|
|
|
$6
|
|
|
$18,725
|
|
|
$1,913
|
|
|
($858
|
)
|
|
($387
|
)
|
|
$19,646
|
|
||
|
Dividends to common stockholders
|
—
|
|
—
|
|
—
|
|
—
|
|
—
|
|
(179
|
)
|
—
|
|
—
|
|
(179
|
)
|
|||||||||
|
Dividends to preferred stockholders
|
—
|
|
—
|
|
—
|
|
—
|
|
—
|
|
—
|
|
(14
|
)
|
—
|
|
—
|
|
(14
|
)
|
|||||||
|
Treasury stock purchased
|
—
|
|
—
|
|
(11
|
)
|
—
|
|
—
|
|
—
|
|
(250
|
)
|
—
|
|
(250
|
)
|
|||||||||
|
Share-based compensation plans
|
—
|
|
—
|
|
1
|
|
—
|
|
8
|
|
—
|
|
—
|
|
—
|
|
8
|
|
|||||||||
|
Employee stock purchase plan shares purchased
|
—
|
|
—
|
|
—
|
|
—
|
|
7
|
|
—
|
|
—
|
|
—
|
|
7
|
|
|||||||||
|
Total comprehensive income:
|
|||||||||||||||||||||||||||
|
Net income
|
—
|
|
—
|
|
—
|
|
—
|
|
—
|
|
763
|
|
—
|
|
—
|
|
763
|
|
|||||||||
|
Other comprehensive income
|
—
|
|
—
|
|
—
|
|
—
|
|
—
|
|
—
|
|
—
|
|
200
|
|
200
|
|
|||||||||
|
Total comprehensive income
|
—
|
|
—
|
|
—
|
|
—
|
|
—
|
|
763
|
|
—
|
|
200
|
|
963
|
|
|||||||||
|
Balance at September 30, 2016
|
—
|
|
|
$247
|
|
518
|
|
|
$6
|
|
|
$18,740
|
|
|
$2,483
|
|
|
($1,108
|
)
|
|
($187
|
)
|
|
$20,181
|
|
||
|
Balance at January 1, 2017
|
—
|
|
|
$247
|
|
512
|
|
|
$6
|
|
|
$18,722
|
|
|
$2,703
|
|
|
($1,263
|
)
|
|
($668
|
)
|
|
$19,747
|
|
||
|
Dividends to common stockholders
|
—
|
|
—
|
|
—
|
|
—
|
|
—
|
|
(233
|
)
|
—
|
|
—
|
|
(233
|
)
|
|||||||||
|
Dividends to preferred stockholders
|
—
|
|
—
|
|
—
|
|
—
|
|
—
|
|
(14
|
)
|
—
|
|
—
|
|
(14
|
)
|
|||||||||
|
Treasury stock purchased
|
—
|
|
—
|
|
(13
|
)
|
—
|
|
25
|
|
—
|
|
(510
|
)
|
—
|
|
(485
|
)
|
|||||||||
|
Share-based compensation plans
|
—
|
|
—
|
|
1
|
|
—
|
|
12
|
|
—
|
|
—
|
|
—
|
|
12
|
|
|||||||||
|
Employee stock purchase plan shares purchased
|
—
|
|
—
|
|
—
|
|
—
|
|
9
|
|
—
|
|
—
|
|
—
|
|
9
|
|
|||||||||
|
Total comprehensive income:
|
|||||||||||||||||||||||||||
|
Net income
|
—
|
|
—
|
|
—
|
|
—
|
|
—
|
|
986
|
|
—
|
|
—
|
|
986
|
|
|||||||||
|
Other comprehensive income
|
—
|
|
—
|
|
—
|
|
—
|
|
—
|
|
—
|
|
—
|
|
87
|
|
87
|
|
|||||||||
|
Total comprehensive income
|
—
|
|
—
|
|
—
|
|
—
|
|
—
|
|
986
|
|
—
|
|
87
|
|
1,073
|
|
|||||||||
|
Balance at September 30, 2017
|
—
|
|
|
$247
|
|
500
|
|
|
$6
|
|
|
$18,768
|
|
|
$3,442
|
|
|
($1,773
|
)
|
|
($581
|
)
|
|
$20,109
|
|
||
The accompanying Notes to unaudited interim Consolidated Financial Statements are an integral part of these statements.
70
CITIZENS FINANCIAL GROUP, INC.
|
Nine Months Ended September 30,
|
||||||
|
(in millions)
|
2017
|
|
2016
|
|
||
|
OPERATING ACTIVITIES
|
||||||
|
Net income
|
|
$986
|
|
|
$763
|
|
|
Adjustments to reconcile net income to net cash provided by operating activities:
|
||||||
|
Provision for credit losses
|
238
|
|
267
|
|
||
|
Originations of mortgage loans held for sale
|
(2,159
|
)
|
(1,904
|
)
|
||
|
Proceeds from sales of mortgage loans held for sale
|
2,372
|
|
1,775
|
|
||
|
Purchases of commercial loans held for sale
|
(1,513
|
)
|
(1,053
|
)
|
||
|
Proceeds from sales of commercial loans held for sale
|
1,441
|
|
1,040
|
|
||
|
Amortization of terminated cash flow hedges, net
|
(17
|
)
|
6
|
|
||
|
Depreciation, amortization and accretion
|
388
|
|
387
|
|
||
|
Mortgage servicing rights valuation (recovery) charge-off
|
(1
|
)
|
6
|
|
||
|
Securities impairment
|
6
|
|
11
|
|
||
|
Deferred income taxes
|
(23
|
)
|
143
|
|
||
|
Share-based compensation
|
35
|
|
15
|
|
||
|
Net gain on sales of:
|
||||||
|
Debt securities
|
(9
|
)
|
(13
|
)
|
||
|
Other investment securities
|
(1
|
)
|
—
|
|
||
|
Premises and equipment
|
—
|
|
(2
|
)
|
||
|
Increase in other assets
|
(155
|
)
|
(305
|
)
|
||
|
(Decrease) increase in other liabilities
|
(138
|
)
|
62
|
|
||
|
Net cash provided by operating activities
|
1,450
|
|
1,198
|
|
||
|
INVESTING ACTIVITIES
|
||||||
|
Investment securities:
|
||||||
|
Purchases of securities available for sale
|
(4,088
|
)
|
(4,774
|
)
|
||
|
Proceeds from maturities and paydowns of securities available for sale
|
2,564
|
|
2,658
|
|
||
|
Proceeds from sales of securities available for sale
|
914
|
|
785
|
|
||
|
Purchases of securities held to maturity
|
(171
|
)
|
(523
|
)
|
||
|
Proceeds from maturities and paydowns of securities held to maturity
|
422
|
|
503
|
|
||
|
Purchases of other investment securities, at fair value
|
(286
|
)
|
(204
|
)
|
||
|
Proceeds from sales of other investment securities, at fair value
|
217
|
|
161
|
|
||
|
Purchases of other investment securities, at cost
|
(307
|
)
|
(84
|
)
|
||
|
Proceeds from sales of other investment securities, at cost
|
495
|
|
70
|
|
||
|
Net decrease (increase) in interest-bearing deposits in banks
|
152
|
|
(364
|
)
|
||
|
Net increase in loans and leases
|
(3,549
|
)
|
(6,724
|
)
|
||
|
Net increase in bank-owned life insurance
|
(34
|
)
|
(36
|
)
|
||
|
Premises and equipment:
|
||||||
|
Purchases
|
(115
|
)
|
(44
|
)
|
||
|
Proceeds from sales
|
—
|
|
3
|
|
||
|
Capitalization of software
|
(138
|
)
|
(126
|
)
|
||
|
Net cash used in investing activities
|
(3,924
|
)
|
(8,699
|
)
|
||
|
FINANCING ACTIVITIES
|
||||||
|
Net increase in deposits
|
3,431
|
|
5,788
|
|
||
|
Net (decrease) increase in federal funds purchased and securities sold under agreements to repurchase
|
(695
|
)
|
98
|
|
||
|
Net decrease in other short-term borrowed funds
|
(1,708
|
)
|
(1,635
|
)
|
||
|
Proceeds from issuance of long-term borrowed funds
|
12,108
|
|
9,644
|
|
||
|
Repayments of long-term borrowed funds
|
(11,501
|
)
|
(6,128
|
)
|
||
|
Treasury stock purchased
|
(485
|
)
|
(250
|
)
|
||
|
Dividends declared and paid to common stockholders
|
(233
|
)
|
(179
|
)
|
||
|
Dividends declared and paid to preferred stockholders
|
(7
|
)
|
(7
|
)
|
||
|
Payments of employee tax withholding for share-based compensation
|
(20
|
)
|
—
|
|
||
|
Net cash provided by financing activities
|
890
|
|
7,331
|
|
||
|
Decrease in cash and cash equivalents
(a)
|
(1,584
|
)
|
(170
|
)
|
||
|
Cash and cash equivalents at beginning of period
(a)
|
3,704
|
|
3,085
|
|
||
|
Cash and cash equivalents at end of period
(a)
|
|
$2,120
|
|
|
$2,915
|
|
(a)
Cash and cash equivalents includes cash and due from banks and interest-bearing cash and due from banks as reflected on the Consolidated Balance Sheets.
The accompanying Notes to unaudited interim Consolidated Financial Statements are an integral part of these statements.
71
CITIZENS FINANCIAL GROUP, INC.
NOTES TO CONSOLIDATED FINANCIAL STATEMENTS (UNAUDITED)
Basis of Presentation
The unaudited interim Consolidated Financial Statements, including the Notes thereto of Citizens Financial Group, Inc., have been prepared in accordance with GAAP interim reporting requirements, and therefore do not include all information and Notes included in the audited Consolidated Financial Statements in conformity with GAAP. These unaudited interim Consolidated Financial Statements and Notes thereto should be read in conjunction with the Company’s audited Consolidated Financial Statements and accompanying Notes included in the Company’s Annual Report on Form 10-K for the year ended December 31, 2016. The Company’s principal business activity is banking, conducted through its subsidiaries, Citizens Bank, N.A. and Citizens Bank of Pennsylvania.
The unaudited interim Consolidated Financial Statements include the accounts of the Company and subsidiaries in which the Company has a controlling financial interest. All intercompany transactions and balances have been eliminated. The Company has evaluated its unconsolidated entities and does not believe that any entity in which it has an interest, but does not currently consolidate, meets the requirements to be consolidated as a variable interest entity.
The unaudited interim Consolidated Financial Statements include all adjustments, consisting of normal recurring adjustments, necessary for a fair presentation of the results for the interim periods. The results for interim periods are not necessarily indicative of results for a full year.
The preparation of financial statements in conformity with GAAP requires management to make estimates and assumptions that affect the reported amounts of assets and liabilities at the date of the financial statements and the reported amounts of revenues and expenses during the reporting period. Actual results could differ from those estimates. Material estimates that are particularly susceptible to significant change in the near-term relate to the determination of the allowance for credit losses, evaluation and measurement of impairment of goodwill, evaluation of unrealized losses on securities for other-than-temporary impairment, accounting for income taxes, the valuation of AFS and HTM securities, and derivatives.
Certain prior period noninterest income amounts reported in the Consolidated Statement of Operations have been reclassified to conform to the current period presentation and student loans were renamed “education” loans to more closely align with the full range of services offered to borrowers, from loan origination to refinancing. These changes had no effect on net income, total comprehensive income, total assets or total stockholders’ equity as previously reported.
Accounting Pronouncements Adopted in 2017
|
Pronouncement
|
Summary of Guidance
|
Effects on Financial Statements
|
|
Stock Compensation
Issued March 2016
|
•
Requires that all excess tax benefits and tax deficiencies that pertain to employee stock-based incentive payments are recognized within income tax expense in the Consolidated Statement of Operations, rather than within additional paid in capital.
•
This standard also allows entities to make a one-time policy election to account for forfeitures when they occur, which the Company elected to do.
|
•
Adopted January 1, 2017
•
Adoption of this guidance did not have a material impact on the Company’s unaudited interim Consolidated Financial Statements
|
72
CITIZENS FINANCIAL GROUP, INC.
NOTES TO CONSOLIDATED FINANCIAL STATEMENTS (UNAUDITED)
Accounting Pronouncements Pending Adoption
|
Pronouncement
|
Summary of Guidance
|
Effects on Financial Statements
|
|
Derivatives and Hedging
Issued August 2017
|
•
Reduces the complexity and operational burdens of the current hedge accounting model and portrays more clearly the effects of hedge accounting in the financial statements.
•
Modifies current requirements to facilitate the application of hedge accounting to partial-term hedges, hedges of prepayable financial instruments, and other strategies.
•
Eliminates the requirement to separately recognize and report hedge ineffectiveness.
•
Requires the effects of fair value hedges to be classified in the same income statement line as the earnings effect of the hedged item. For example, changes in the fair values of a derivative and a hedged item designated in a fair value hedge of interest rate risk will require classification within Interest income or Interest expense.
•
Requires the effects of cash flow hedges to be deferred in other comprehensive income until the hedged cash flows affect earnings. Periodic hedge ineffectiveness will no longer be separately recognized in earnings.
|
•
Required effective date: January 1, 2019. Early adoption is permitted.
•
The Company is still assessing the impacts upon adoption on the Consolidated Financial Statements.
|
|
Stock Compensation
Issued May 2017
|
•
Requires modification accounting unless the fair value, vesting conditions, and classification of the modified award are the same as the original award immediately before the modification.
•
Applied prospectively to all modifications of share-based awards after the adoption date.
|
•
Required effective date: January 1, 2018. Early adoption is permitted. The Company will adopt the new standard in the first quarter of 2018.
•
Adoption is not expected to have a material impact on the Company’s Consolidated Financial Statements.
|
|
Premium Amortization on Purchased Callable Debt Securities
Issued March 2017
|
•
Requires amortization of premiums to the earliest call date on debt securities with call features that are explicit, noncontingent and callable at fixed prices and on preset dates.
•
Requires adoption on a modified retrospective basis through a cumulative-effect adjustment directly to retained earnings as of the beginning of the period of adoption.
|
•
Required effective date: January 1, 2019.
•
Adoption is not expected to have a material impact on the Company’s Consolidated Financial Statements.
|
|
Presentation of Net Periodic Pension Cost and Net Periodic Postretirement Benefit Cost
Issued March 2017
|
•
Requires the service cost component of net periodic pension and postretirement benefit cost to be reported separately in the Consolidated Statements of Operations from the other components (e.g., expected return on assets, interest costs, amortization of gains/losses and prior service costs).
•
Requires presentation in the Consolidated Statements of Operations of the service cost component in the same line item as other employee compensation costs and presentation of the other components in a different line item from the service cost component.
|
•
Required effective date: January 1, 2018. Early adoption is permitted. The Company will adopt the new standard in the first quarter of 2018.
•
Adoption will have no impact on the Company’s net income, but based on recent experience that the expected return on assets exceeds the sum of the other components, the Company expects that the guidance will result in an increase in salaries and employee benefits expense and a reduction in other operating expense.
|
|
Goodwill
Issued January 2017 |
•
Requires an impairment loss to be recognized when the estimated fair value of a reporting unit falls below its carrying value.
•
Eliminates the second condition in the current guidance that requires an impairment loss to be recognized only if the estimated implied fair value of the goodwill is below its carrying value.
•
Applied prospectively to all goodwill impairment tests performed after the adoption date.
|
•
Required effective date: January 1, 2020. Early adoption is permitted. The Company does not currently intend to early adopt the new standard.
•
Adoption is not expected to have a material impact on the Company’s Consolidated Financial Statements.
|
73
CITIZENS FINANCIAL GROUP, INC.
NOTES TO CONSOLIDATED FINANCIAL STATEMENTS (UNAUDITED)
|
Pronouncement
|
Summary of Guidance
|
Effects on Financial Statements
|
|
Financial Instruments - Credit Losses
Issued June 2016
|
•
Replaces existing incurred loss impairment guidance and establishes a single allowance framework for financial assets carried at amortized cost (including securities HTM), which will reflect management’s estimate of credit losses over the full remaining expected life of the financial assets.
•
Amends existing impairment guidance for securities AFS to incorporate an allowance, which will allow for reversals of impairment losses in the event that the credit of an issuer improves.
•
Requires a cumulative-effect adjustment to retained earnings as of the beginning of the reporting period of adoption.
|
•
Required effective date: January 1, 2020. Early adoption permitted on January 1, 2019.
•
The Company established a company-wide, cross-discipline governance structure to implement the new standard. The Company is currently identifying key interpretive issues and is comparing existing credit loss forecasting models and processes with the new guidance to determine what modifications may be required.
•
While the Company is currently evaluating the impact the standard will have on its Consolidated Financial Statements, the Company expects the standard will result in an earlier recognition of credit losses and an increase in the allowance for credit losses. The magnitude of the increase in the Company’s allowance for loan losses at the adoption date will be dependent upon the nature of the characteristics of the portfolio at the adoption date, as well as macroeconomic conditions and forecasts at that date.
|
|
Leases
Issued February 2016
|
•
Requires lessees to recognize a right-of-use asset and corresponding lease liability for all leases with a lease term of greater than one year.
•
Requires lessees and lessors to classify most leases using principles similar to existing lease accounting, but eliminates the “bright line” classification tests.
•
Requires that for finance leases, a lessee recognize interest expense on the lease liability separately from the amortization of the right-of-use asset in the Consolidated Statements of Operations, while for operating leases, such amounts should be recognized as a combined expense.
•
Requires expanded disclosures about the nature and terms of lease agreements.
•
Requires adoption using a modified cumulative effect approach wherein the guidance is applied to all periods presented.
|
•
Required effective date: January 1, 2019. Early adoption is permitted.
•
The Company does not expect early adoption of the new leasing standard.
•
The Company occupies certain banking offices and equipment under non-cancelable operating lease agreements, which currently are not reflected in its Consolidated Balance Sheets.
•
The Company expects to report increased assets and liabilities as a result of recognizing right-of-use assets and lease liabilities in its Consolidated Balance Sheets. As of December 31, 2016, the Company was committed to $809 million of minimum lease payments under non-cancelable operating lease agreements.
•
The evaluation of the impact of the leasing pronouncement will be adjusted based on execution of new leases, termination of existing leases prior to the effective date, and any changes to key lease assumptions such as renewals, extensions and discount rates.
•
The Company does not expect a material change to the timing of expense recognition in the Consolidated Statements of Operations.
|
74
CITIZENS FINANCIAL GROUP, INC.
NOTES TO CONSOLIDATED FINANCIAL STATEMENTS (UNAUDITED)
|
Pronouncement
|
Summary of Guidance
|
Effects on Financial Statements
|
|
Revenue Recognition: Revenue from Contracts with Customers
Issued May 2014
|
•
Requires that revenue from contracts with customers be recognized upon transfer of control of a good or service in the amount of consideration expected to be received.
•
Changes the accounting for certain contract costs including whether they may be offset against revenues in the Consolidated Statements of Operations.
•
Requires new qualitative and quantitative disclosures, including information about disaggregation of revenue and performance obligations.
•
May be adopted using a full retrospective approach or a modified cumulative effect approach wherein the guidance is applied only to existing contracts as of the date of initial adoption and to new contracts transacted after that date.
|
•
Required effective date: January 1, 2018. Early adoption is permitted.
•
The Company plans to adopt the revenue guidance in the first quarter of 2018 using the modified retrospective method. Net interest income on financial assets and liabilities is explicitly excluded from the scope of the pronouncement.
•
The Company’s implementation efforts include the identification of revenue within the scope of the guidance, as well as the evaluation of revenue contracts and related accounting policies. Based on these efforts, the Company has not identified material changes to the timing or amount of revenue recognition.
•
The Company has substantially completed its evaluation of the expanded disclosure requirements and expects the most significant item will be the disaggregation of revenue.
|
75
CITIZENS FINANCIAL GROUP, INC.
NOTES TO CONSOLIDATED FINANCIAL STATEMENTS (UNAUDITED)
The following table presents the major components of securities at amortized cost and fair value:
|
September 30, 2017
|
December 31, 2016
|
||||||||||||||||||||||||
|
(in millions)
|
Amortized Cost
|
Gross Unrealized Gains
|
Gross Unrealized Losses
|
Fair Value
|
Amortized Cost
|
Gross Unrealized Gains
|
Gross Unrealized Losses
|
Fair Value
|
|||||||||||||||||
|
Securities Available for Sale
|
|||||||||||||||||||||||||
|
U.S. Treasury and other
|
|
$12
|
|
|
$—
|
|
|
$—
|
|
|
$12
|
|
|
$30
|
|
|
$—
|
|
|
$—
|
|
|
$30
|
|
|
|
State and political subdivisions
|
7
|
|
—
|
|
—
|
|
7
|
|
8
|
|
—
|
|
—
|
|
8
|
|
|||||||||
|
Mortgage-backed securities:
|
|||||||||||||||||||||||||
|
Federal agencies and U.S. government sponsored entities
|
19,735
|
|
76
|
|
(183
|
)
|
19,628
|
|
19,231
|
|
78
|
|
(264
|
)
|
19,045
|
|
|||||||||
|
Other/non-agency
|
337
|
|
6
|
|
(8
|
)
|
335
|
|
427
|
|
2
|
|
(28
|
)
|
401
|
|
|||||||||
|
Total mortgage-backed securities
|
20,072
|
|
82
|
|
(191
|
)
|
19,963
|
|
19,658
|
|
80
|
|
(292
|
)
|
19,446
|
|
|||||||||
|
Total debt securities available for sale
|
20,091
|
|
82
|
|
(191
|
)
|
19,982
|
|
19,696
|
|
80
|
|
(292
|
)
|
19,484
|
|
|||||||||
|
Marketable equity securities
|
—
|
|
—
|
|
—
|
|
—
|
|
5
|
|
—
|
|
—
|
|
5
|
|
|||||||||
|
Other equity securities
|
—
|
|
—
|
|
—
|
|
—
|
|
12
|
|
—
|
|
—
|
|
12
|
|
|||||||||
|
Total equity securities available for sale
|
—
|
|
—
|
|
—
|
|
—
|
|
17
|
|
—
|
|
—
|
|
17
|
|
|||||||||
|
Total securities available for sale
|
|
$20,091
|
|
|
$82
|
|
|
($191
|
)
|
|
$19,982
|
|
|
$19,713
|
|
|
$80
|
|
|
($292
|
)
|
|
$19,501
|
|
|
|
Securities Held to Maturity
|
|||||||||||||||||||||||||
|
Mortgage-backed securities:
|
|||||||||||||||||||||||||
|
Federal agencies and U.S. government sponsored entities
|
|
$3,966
|
|
|
$18
|
|
|
($28
|
)
|
|
$3,956
|
|
|
$4,126
|
|
|
$12
|
|
|
($44
|
)
|
|
$4,094
|
|
|
|
Other/non-agency
|
857
|
|
26
|
|
—
|
|
883
|
|
945
|
|
19
|
|
—
|
|
964
|
|
|||||||||
|
Total securities held to maturity
|
|
$4,823
|
|
|
$44
|
|
|
($28
|
)
|
|
$4,839
|
|
|
$5,071
|
|
|
$31
|
|
|
($44
|
)
|
|
$5,058
|
|
|
|
Other Investment Securities, at Fair Value
|
|||||||||||||||||||||||||
|
Money market mutual fund
|
|
$160
|
|
|
$—
|
|
|
$—
|
|
|
$160
|
|
|
$91
|
|
|
$—
|
|
|
$—
|
|
|
$91
|
|
|
|
Other investments
|
5
|
|
—
|
|
—
|
|
5
|
|
5
|
|
—
|
|
—
|
|
5
|
|
|||||||||
|
Total other investment securities, at fair value
|
|
$165
|
|
|
$—
|
|
|
$—
|
|
|
$165
|
|
|
$96
|
|
|
$—
|
|
|
$—
|
|
|
$96
|
|
|
|
Other Investment Securities, at Cost
|
|||||||||||||||||||||||||
|
Federal Reserve Bank stock
|
|
$463
|
|
|
$—
|
|
|
$—
|
|
|
$463
|
|
|
$463
|
|
|
$—
|
|
|
$—
|
|
|
$463
|
|
|
|
Federal Home Loan Bank stock
|
302
|
|
—
|
|
—
|
|
302
|
|
479
|
|
—
|
|
—
|
|
479
|
|
|||||||||
|
Other equity securities
|
7
|
|
—
|
|
—
|
|
7
|
|
—
|
|
—
|
|
—
|
|
—
|
|
|||||||||
|
Total other investment securities, at cost
|
|
$772
|
|
|
$—
|
|
|
$—
|
|
|
$772
|
|
|
$942
|
|
|
$—
|
|
|
$—
|
|
|
$942
|
|
|
76
CITIZENS FINANCIAL GROUP, INC.
NOTES TO CONSOLIDATED FINANCIAL STATEMENTS (UNAUDITED)
The following tables present securities whose fair values are below carrying values, segregated by those that have been in a continuous unrealized loss position for less than twelve months and those that have been in a continuous unrealized loss position for twelve months or longer:
|
September 30, 2017
|
||||||||||||||||||||||||||
|
Less than 12 Months
|
12 Months or Longer
|
Total
|
||||||||||||||||||||||||
|
(dollars in millions)
|
Number of Issues
|
Fair Value
|
Gross Unrealized Losses
|
Number of Issues
|
Fair Value
|
Gross Unrealized Losses
|
Number of Issues
|
Fair Value
|
Gross Unrealized Losses
|
|||||||||||||||||
|
State and political subdivisions
|
—
|
|
|
$—
|
|
|
$—
|
|
—
|
|
|
$—
|
|
|
$—
|
|
—
|
|
|
$—
|
|
|
$—
|
|
||
|
Mortgage-backed securities:
|
||||||||||||||||||||||||||
|
Federal agencies and U.S. government sponsored entities
|
298
|
|
13,113
|
|
(193
|
)
|
30
|
|
545
|
|
(18
|
)
|
328
|
|
13,658
|
|
(211
|
)
|
||||||||
|
Other/non-agency
|
—
|
|
—
|
|
—
|
|
11
|
|
121
|
|
(8
|
)
|
11
|
|
121
|
|
(8
|
)
|
||||||||
|
Total mortgage-backed securities
|
298
|
|
13,113
|
|
(193
|
)
|
41
|
|
666
|
|
(26
|
)
|
339
|
|
13,779
|
|
(219
|
)
|
||||||||
|
Total
|
298
|
|
|
$13,113
|
|
|
($193
|
)
|
41
|
|
|
$666
|
|
|
($26
|
)
|
339
|
|
|
$13,779
|
|
|
($219
|
)
|
||
|
December 31, 2016
|
||||||||||||||||||||||||||
|
Less than 12 Months
|
12 Months or Longer
|
Total
|
||||||||||||||||||||||||
|
(dollars in millions)
|
Number of Issues
|
Fair Value
|
Gross Unrealized Losses
|
Number of Issues
|
Fair Value
|
Gross Unrealized Losses
|
Number of Issues
|
Fair Value
|
Gross Unrealized Losses
|
|||||||||||||||||
|
State and political subdivisions
|
1
|
|
|
$8
|
|
|
$—
|
|
—
|
|
|
$—
|
|
|
$—
|
|
1
|
|
|
$8
|
|
|
$—
|
|
||
|
Mortgage-backed securities:
|
||||||||||||||||||||||||||
|
Federal agencies and U.S. government sponsored entities
|
323
|
|
15,387
|
|
(292
|
)
|
25
|
|
461
|
|
(16
|
)
|
348
|
|
15,848
|
|
(308
|
)
|
||||||||
|
Other/non-agency
|
4
|
|
8
|
|
—
|
|
20
|
|
302
|
|
(28
|
)
|
24
|
|
310
|
|
(28
|
)
|
||||||||
|
Total mortgage-backed securities
|
327
|
|
15,395
|
|
(292
|
)
|
45
|
|
763
|
|
(44
|
)
|
372
|
|
16,158
|
|
(336
|
)
|
||||||||
|
Total
|
328
|
|
|
$15,403
|
|
|
($292
|
)
|
45
|
|
|
$763
|
|
|
($44
|
)
|
373
|
|
|
$16,166
|
|
|
($336
|
)
|
||
For each debt security identified with an unrealized loss, the Company reviews the expected cash flows to determine if the impairment in value is temporary or other-than-temporary. If the Company has determined that the present value of the debt security’s expected cash flows is less than its amortized cost basis, an other-than-temporary impairment is deemed to have occurred. The amount of impairment loss that is recognized in current period earnings is dependent on the Company’s intent to sell (or not sell) the debt security.
If the Company intends to sell the impaired debt security, or if it is more likely than not it will be required to sell the security before recovery, the impairment loss recognized in current period earnings equals the difference between the amortized cost basis and the fair value of the security. If the Company does not intend to sell the impaired debt security, and it is not more likely than not that the Company will be required to sell the impaired security, the other-than-temporary impairment write-down is separated into an amount representing the credit loss which is recognized in current period earnings and the amount related to all other factors, which is recognized in OCI.
In addition to these cash flow projections, several other characteristics of each debt security are reviewed when determining whether a credit loss exists and the period over which the debt security is expected to recover. These characteristics include the type of investment, various market factors affecting the fair value of the security (e.g., interest rates, spread levels, liquidity in the sector, etc.), the length and severity of impairment, and the public credit rating of the instrument.
77
CITIZENS FINANCIAL GROUP, INC.
NOTES TO CONSOLIDATED FINANCIAL STATEMENTS (UNAUDITED)
The Company estimates the portion of loss attributable to credit using a collateral loss model and an integrated cash flow engine. The model calculates prepayment, default, and loss severity assumptions using collateral performance data. These assumptions are used to produce cash flows that generate loss projections. These loss projections are reviewed on a quarterly basis by a cross-functional governance committee to determine whether security impairments are other-than-temporary.
The following table presents the cumulative credit-related losses recognized in earnings on debt securities held by the Company:
|
Three Months Ended September 30,
|
Nine Months Ended September 30,
|
||||||||||||||
|
(in millions)
|
2017
|
|
2016
|
|
2017
|
|
2016
|
|
|||||||
|
Cumulative balance at beginning of period
|
|
$79
|
|
|
$73
|
|
|
$75
|
|
|
$66
|
|
|||
|
Credit impairments recognized in earnings on securities that have been previously impaired
|
1
|
|
3
|
|
6
|
|
11
|
|
|||||||
|
Reductions due to increases in cash flow expectations on impaired securities
(1)
|
—
|
|
(1
|
)
|
(1
|
)
|
(2
|
)
|
|||||||
|
Cumulative balance at end of period
|
|
$80
|
|
|
$75
|
|
|
$80
|
|
|
$75
|
|
|||
(1)
Reported in interest income from investment securities on the Consolidated Statements of Operations.
Cumulative credit losses recognized in earnings for impaired AFS debt securities held as of
September 30, 2017
and
2016
were
$80 million
and
$75 million
, respectively. There were
no
credit losses recognized in earnings for the Company’s HTM portfolio as of
September 30, 2017
and
2016
.
For the
three months ended
September 30, 2017
and
2016
, the Company incurred non-agency MBS credit-related other-than-temporary impairment losses in earnings of
$1 million
and
$3 million
, respectively.
For the
nine months ended
September 30, 2017
and
2016
, the Company incurred non-agency MBS credit-related other-than-temporary impairment losses in earnings of
$6 million
and
$11 million
, respectively. Other-than-temporary impairment losses for the nine months ended September 30, 2016 included the
$5 million
impact of a one-time adjustment from a new model implementation. This adjustment is the result of the Company migrating in June 2016 from a proprietary internal process to a vendor-based model to estimate other-than-temporary impairment.
There were
no
credit impaired debt securities sold during the
three and nine
months ended
September 30, 2017
and
2016
. The Company does not currently have the intent to sell these impaired debt securities, and it is not more likely than not that the Company will be required to sell these debt securities prior to the recovery of their amortized cost bases.
The Company has determined that credit losses are not expected to be incurred on the remaining agency and non-agency MBS identified with unrealized losses as of
September 30, 2017
. The unrealized losses on these debt securities reflect non-credit-related factors such as changing interest rates and market liquidity. Therefore, the Company has determined that these debt securities are not other-than-temporarily impaired because the Company does not currently have the intent to sell these debt securities, and it is not more likely than not that the Company will be required to sell these debt securities prior to the recovery of their amortized cost bases. Any subsequent increases in the valuation of impaired debt securities do not impact their recorded cost bases.
78
CITIZENS FINANCIAL GROUP, INC.
NOTES TO CONSOLIDATED FINANCIAL STATEMENTS (UNAUDITED)
The amortized cost and fair value of debt securities by contractual maturity as of September 30, 2017 are presented below. Expected maturities may differ from contractual maturities because issuers may have the right to call or prepay obligations with or without incurring penalties.
|
September 30, 2017
|
|||||||||||||||
|
Distribution of Maturities
|
|||||||||||||||
|
(in millions)
|
1 Year or Less
|
1-5 Years
|
5-10 Years
|
After 10 Years
|
Total
|
|
|||||||||
|
Amortized Cost:
|
|||||||||||||||
|
Debt securities available for sale
|
|||||||||||||||
|
U.S. Treasury and other
|
|
$12
|
|
|
$—
|
|
|
$—
|
|
|
$—
|
|
|
$12
|
|
|
State and political subdivisions
|
—
|
|
—
|
|
—
|
|
7
|
|
7
|
|
|||||
|
Mortgage-backed securities:
|
|||||||||||||||
|
Federal agencies and U.S. government sponsored entities
|
1
|
|
169
|
|
1,149
|
|
18,416
|
|
19,735
|
|
|||||
|
Other/non-agency
|
—
|
|
25
|
|
—
|
|
312
|
|
337
|
|
|||||
|
Total debt securities available for sale
|
13
|
|
194
|
|
1,149
|
|
18,735
|
|
20,091
|
|
|||||
|
Debt securities held to maturity
|
|||||||||||||||
|
Mortgage-backed securities:
|
|||||||||||||||
|
Federal agencies and U.S. government sponsored entities
|
—
|
|
—
|
|
—
|
|
3,966
|
|
3,966
|
|
|||||
|
Other/non-agency
|
—
|
|
—
|
|
—
|
|
857
|
|
857
|
|
|||||
|
Total debt securities held to maturity
|
—
|
|
—
|
|
—
|
|
4,823
|
|
4,823
|
|
|||||
|
Total amortized cost of debt securities
|
|
$13
|
|
|
$194
|
|
|
$1,149
|
|
|
$23,558
|
|
|
$24,914
|
|
|
Fair Value:
|
|||||||||||||||
|
Debt securities available for sale
|
|||||||||||||||
|
U.S. Treasury and other
|
|
$12
|
|
|
$—
|
|
|
$—
|
|
|
$—
|
|
|
$12
|
|
|
State and political subdivisions
|
—
|
|
—
|
|
—
|
|
7
|
|
7
|
|
|||||
|
Mortgage-backed securities:
|
|||||||||||||||
|
Federal agencies and U.S. government sponsored entities
|
1
|
|
169
|
|
1,166
|
|
18,292
|
|
19,628
|
|
|||||
|
Other/non-agency
|
—
|
|
25
|
|
—
|
|
310
|
|
335
|
|
|||||
|
Total debt securities available for sale
|
13
|
|
194
|
|
1,166
|
|
18,609
|
|
19,982
|
|
|||||
|
Debt securities held to maturity
|
|||||||||||||||
|
Mortgage-backed securities:
|
|||||||||||||||
|
Federal agencies and U.S. government sponsored entities
|
—
|
|
—
|
|
—
|
|
3,956
|
|
3,956
|
|
|||||
|
Other/non-agency
|
—
|
|
—
|
|
—
|
|
883
|
|
883
|
|
|||||
|
Total debt securities held to maturity
|
—
|
|
—
|
|
—
|
|
4,839
|
|
4,839
|
|
|||||
|
Total fair value of debt securities
|
|
$13
|
|
|
$194
|
|
|
$1,166
|
|
|
$23,448
|
|
|
$24,821
|
|
Taxable interest income from investment securities as presented on the Consolidated Statements of Operations was
$155 million
and
$146 million
for the
three months ended
September 30, 2017
and
2016
, respectively, and was
$469 million
and
$432 million
for the
nine months ended
September 30, 2017
and
2016
, respectively.
Realized gains and losses on securities are presented below:
|
Three Months Ended September 30,
|
Nine Months Ended September 30,
|
||||||||||||||
|
(in millions)
|
2017
|
|
2016
|
|
2017
|
|
2016
|
|
|||||||
|
Gains on sale of debt securities
|
|
$2
|
|
|
$—
|
|
|
$9
|
|
|
$13
|
|
|||
|
Losses on sale of debt securities
|
—
|
|
—
|
|
—
|
|
—
|
|
|||||||
|
Debt securities gains, net
|
|
$2
|
|
|
$—
|
|
|
$9
|
|
|
$13
|
|
|||
|
Equity securities gains
|
|
$—
|
|
|
$—
|
|
|
$1
|
|
|
$—
|
|
|||
79
CITIZENS FINANCIAL GROUP, INC.
NOTES TO CONSOLIDATED FINANCIAL STATEMENTS (UNAUDITED)
The amortized cost and fair value of securities pledged are presented below:
|
September 30, 2017
|
December 31, 2016
|
||||||||||||
|
(in millions)
|
Amortized Cost
|
Fair Value
|
|
Amortized Cost
|
Fair Value
|
|
|||||||
|
Pledged against repurchase agreements
|
|
$459
|
|
|
$454
|
|
|
$631
|
|
|
$620
|
|
|
|
Pledged against FHLB borrowed funds
|
864
|
|
890
|
|
953
|
|
972
|
|
|||||
|
Pledged against derivatives, to qualify for fiduciary powers, and to secure public and other deposits as required by law
|
2,866
|
|
2,858
|
|
3,575
|
|
3,563
|
|
|||||
The Company regularly enters into security repurchase agreements with unrelated counterparties. Repurchase agreements are financial transactions that involve the transfer of a security from one party to another and a subsequent transfer of substantially the same security back to the original party. The Company’s repurchase agreements are typically short-term transactions, but they may be extended to longer terms to maturity. Such transactions are accounted for as secured borrowed funds on the Company’s Consolidated Balance Sheets. When permitted by GAAP, the Company offsets short-term receivables associated with its reverse repurchase agreements against short-term payables associated with its repurchase agreements. The Company recognized
no
offsetting of short-term receivables or payables as of
September 30, 2017
or December 31, 2016. The Company offsets certain derivative assets and derivative liabilities on the Consolidated Balance Sheets. For further information see Note 10 “Derivatives.”
There were
$38 million
and
$82 million
in securitizations of mortgage loans retained in the investment portfolio for the three and nine months ended
September 30, 2017
, respectively, and
$16 million
and
$21 million
for the three and nine months ended September 30, 2016, respectively. These securitizations include a substantive guarantee by a third party. In 2017 the guarantors were Fannie Mae, Freddie Mac, and Ginnie Mae. In 2016, the guarantors were Fannie Mae and Ginnie Mae. These securitizations were accounted for as a sale of the transferred loans and as a purchase of securities. The securities received from the guarantors are classified as AFS.
The Company’s loans and leases are disclosed in portfolio segments and classes. The Company’s loan and lease portfolio segments are commercial and retail. The classes of loans and leases are: commercial, commercial real estate, leases, residential mortgages, home equity loans, home equity lines of credit, home equity loans serviced by others, home equity lines of credit serviced by others, automobile, education, credit cards and other retail. The Company’s SBO portfolio consists of purchased home equity loans and lines that were originally serviced by others, which the Company now services a portion of internally. A summary of the loans and leases portfolio is presented below:
|
(in millions)
|
September 30, 2017
|
December 31, 2016
|
|||||
|
Commercial
|
|
$37,706
|
|
|
$37,274
|
|
|
|
Commercial real estate
|
11,426
|
|
10,624
|
|
|||
|
Leases
|
3,249
|
|
3,753
|
|
|||
|
Total commercial
|
52,381
|
|
51,651
|
|
|||
|
Residential mortgages
|
16,619
|
|
15,115
|
|
|||
|
Home equity loans
|
1,483
|
|
1,858
|
|
|||
|
Home equity lines of credit
|
13,555
|
|
14,100
|
|
|||
|
Home equity loans serviced by others
|
599
|
|
750
|
|
|||
|
Home equity lines of credit serviced by others
|
166
|
|
219
|
|
|||
|
Automobile
|
13,311
|
|
13,938
|
|
|||
|
Education
(1)
|
8,014
|
|
6,610
|
|
|||
|
Credit cards
|
1,754
|
|
1,691
|
|
|||
|
Other retail
|
2,269
|
|
1,737
|
|
|||
|
Total retail
|
57,770
|
|
56,018
|
|
|||
|
Total loans and leases
(2) (3)
|
|
$110,151
|
|
|
$107,669
|
|
|
(1)
During first quarter 2017, student loans were renamed “education” loans. Refer to Note 1 “Basis of Presentation” for more information.
(2)
Excluded from the table above are loans held for sale totaling
$1.2 billion
and
$625 million
as of
September 30, 2017
and
December 31, 2016
, respectively.
(3)
Mortgage loans serviced for others by the Company’s subsidiaries are not included above, and amounted to
$17.7 billion
and
$17.3 billion
at
September 30, 2017
and
December 31, 2016
, respectively.
80
CITIZENS FINANCIAL GROUP, INC.
NOTES TO CONSOLIDATED FINANCIAL STATEMENTS (UNAUDITED)
During the
three months ended
September 30, 2017
, the Company purchased approximately
$63 million
of education loans. During the
three months ended
September 30, 2016
, the Company purchased
$222 million
of residential mortgages,
$200 million
of automobile loans and
$126 million
of education loans.
During the
nine months ended
September 30, 2017
, the Company purchased approximately
$795 million
of education loans and
$153 million
of automobile loans. During the
nine months ended
September 30, 2016
, the Company purchased
$843 million
of education loans,
$534 million
of automobile loans and
$405 million
of residential mortgages.
During the
three months ended
September 30, 2017
, there were
no
loan portfolio sales.
During the
three months ended
September 30, 2016
, the Company sold
$163 million
of residential mortgage loans and
$14 million
of commercial loans.
During the
nine months ended
September 30, 2017
, the Company sold
$596 million
of commercial loans and
$206 million
of residential mortgage loans. During the
nine months ended
September 30, 2016
, the Company sold
$444 million
of residential mortgage loans and
$132 million
of commercial loans.
Additionally, during the three and
nine months ended
September 30, 2016
, the Company sold
$310 million
of TDRs, including
$255 million
of residential mortgages and
$55 million
of home equity loans, which resulted in a pre-tax gain of
$72 million
reported in other income on the Consolidated Statements of Operations.
Loans held for sale at fair value as of
September 30, 2017
totaled
$500 million
and consisted of residential mortgages originated for sale of
$349 million
and loans in the commercial trading portfolio of
$151 million
. Loans held for sale at fair value as of
December 31, 2016
totaled
$583 million
and consisted of residential mortgages originated for sale of
$504 million
and loans in the commercial trading portfolio of
$79 million
.
Other loans held for sale totaled
$724 million
and
$42 million
as of
September 30, 2017
and
December 31, 2016
, respectively. In September 2017
, the Company transferred
$78 million
of retail TDRs, including
$49 million
of residential mortgages and
$29 million
of home equity loans, and
$6 million
of commercial TDRs to other loans held for sale. Additionally, other loans held for sale included commercial loans associated with the Company’s syndications business of
$640 million
as of
September 30, 2017
compared with
$42 million
as of
December 31, 2016
.
Loans pledged as collateral for FHLB borrowed funds, primarily residential mortgages loans, totaled
$24.2 billion
and
$24.0 billion
at
September 30, 2017
and
December 31, 2016
, respectively. Loans pledged as collateral to support the contingent ability to borrow at the FRB discount window, if necessary, totaled
$17.5 billion
and
$16.8 billion
at
September 30, 2017
and
December 31, 2016
, respectively.
The allowance for credit losses consists of the ALLL and the reserve for unfunded commitments. It is increased through a provision for credit losses that is charged to earnings, based on the Company’s quarterly evaluation of the loan portfolio, and is reduced by net charge-offs and the ALLL associated with sold loans. See Note 1 “Significant Accounting Policies” to the Company’s audited Consolidated Financial Statements in the Annual Report on Form 10-K for the year ended
December 31, 2016
, for a detailed discussion of the ALLL reserve methodology and estimation techniques.
On a quarterly basis, the Company reviews and refines its estimate of the allowance for credit losses, taking into consideration changes in portfolio size and composition, historical loss experience, internal risk ratings, current economic conditions, industry performance trends and other pertinent information. There were no material changes in assumptions or estimation techniques compared with prior periods that impacted the determination of the current period’s ALLL and the reserve for unfunded lending commitments.
81
CITIZENS FINANCIAL GROUP, INC.
NOTES TO CONSOLIDATED FINANCIAL STATEMENTS (UNAUDITED)
A summary of changes in the allowance for credit losses is presented below:
|
Three Months Ended September 30, 2017
|
Nine Months Ended September 30, 2017
|
||||||||||||||||||
|
(in millions)
|
Commercial
|
|
Retail
|
|
Total
|
|
Commercial
|
|
Retail
|
|
Total
|
|
|||||||
|
Allowance for loan and lease losses, beginning of period
|
|
$614
|
|
|
$605
|
|
|
$1,219
|
|
|
$663
|
|
|
$573
|
|
|
$1,236
|
|
|
|
Charge-offs
|
(12
|
)
|
(108
|
)
|
(120
|
)
|
(60
|
)
|
(321
|
)
|
(381
|
)
|
|||||||
|
Recoveries
|
12
|
|
43
|
|
55
|
|
27
|
|
127
|
|
154
|
|
|||||||
|
Net charge-offs
|
—
|
|
(65
|
)
|
(65
|
)
|
(33
|
)
|
(194
|
)
|
(227
|
)
|
|||||||
|
Provision charged to income
|
24
|
|
46
|
|
70
|
|
8
|
|
207
|
|
215
|
|
|||||||
|
Allowance for loan and lease losses, end of period
|
638
|
|
586
|
|
1,224
|
|
638
|
|
586
|
|
1,224
|
|
|||||||
|
Reserve for unfunded lending commitments, beginning of period
|
93
|
|
—
|
|
93
|
|
72
|
|
—
|
|
72
|
|
|||||||
|
Provision for unfunded lending commitments
|
2
|
|
—
|
|
2
|
|
23
|
|
—
|
|
23
|
|
|||||||
|
Reserve for unfunded lending commitments, end of period
|
95
|
|
—
|
|
95
|
|
95
|
|
—
|
|
95
|
|
|||||||
|
Total allowance for credit losses, end of period
|
|
$733
|
|
|
$586
|
|
|
$1,319
|
|
|
$733
|
|
|
$586
|
|
|
$1,319
|
|
|
|
Three Months Ended September 30, 2016
|
Nine Months Ended September 30, 2016
|
||||||||||||||||||
|
(in millions)
|
Commercial
|
|
Retail
|
|
Total
|
|
Commercial
|
|
Retail
|
|
Total
|
|
|||||||
|
Allowance for loan and lease losses, beginning of period
|
|
$676
|
|
|
$570
|
|
|
$1,246
|
|
|
$596
|
|
|
$620
|
|
|
$1,216
|
|
|
|
Charge-offs
|
(33
|
)
|
(112
|
)
|
(145
|
)
|
(53
|
)
|
(331
|
)
|
(384
|
)
|
|||||||
|
Recoveries
|
14
|
|
48
|
|
62
|
|
23
|
|
130
|
|
153
|
|
|||||||
|
Net charge-offs
|
(19
|
)
|
(64
|
)
|
(83
|
)
|
(30
|
)
|
(201
|
)
|
(231
|
)
|
|||||||
|
Provision (credited) charged to income
|
(2
|
)
|
79
|
|
77
|
|
89
|
|
166
|
|
255
|
|
|||||||
|
Allowance for loan and lease losses, end of period
|
655
|
|
585
|
|
1,240
|
|
655
|
|
585
|
|
1,240
|
|
|||||||
|
Reserve for unfunded lending commitments, beginning of period
|
61
|
|
—
|
|
61
|
|
58
|
|
—
|
|
58
|
|
|||||||
|
Provision for unfunded lending commitments
|
9
|
|
—
|
|
9
|
|
12
|
|
—
|
|
12
|
|
|||||||
|
Reserve for unfunded lending commitments, end of period
|
70
|
|
—
|
|
70
|
|
70
|
|
—
|
|
70
|
|
|||||||
|
Total allowance for credit losses, end of period
|
|
$725
|
|
|
$585
|
|
|
$1,310
|
|
|
$725
|
|
|
$585
|
|
|
$1,310
|
|
|
The recorded investment in loans and leases based on the Company’s evaluation methodology is presented below:
|
September 30, 2017
|
December 31, 2016
|
||||||||||||||||||
|
(in millions)
|
Commercial
|
|
Retail
|
|
Total
|
|
Commercial
|
|
Retail
|
|
Total
|
|
|||||||
|
Individually evaluated
|
|
$444
|
|
|
$759
|
|
|
$1,203
|
|
|
$424
|
|
|
$799
|
|
|
$1,223
|
|
|
|
Formula-based evaluation
|
51,937
|
|
57,011
|
|
108,948
|
|
51,227
|
|
55,219
|
|
106,446
|
|
|||||||
|
Total
|
|
$52,381
|
|
|
$57,770
|
|
|
$110,151
|
|
|
$51,651
|
|
|
$56,018
|
|
|
$107,669
|
|
|
A summary of the allowance for credit losses by evaluation method is presented below:
|
September 30, 2017
|
December 31, 2016
|
||||||||||||||||||
|
(in millions)
|
Commercial
|
|
Retail
|
|
Total
|
|
Commercial
|
|
Retail
|
|
Total
|
|
|||||||
|
Individually evaluated
|
|
$46
|
|
|
$35
|
|
|
$81
|
|
|
$63
|
|
|
$43
|
|
|
$106
|
|
|
|
Formula-based evaluation
|
687
|
|
551
|
|
1,238
|
|
672
|
|
530
|
|
1,202
|
|
|||||||
|
Allowance for credit losses
|
|
$733
|
|
|
$586
|
|
|
$1,319
|
|
|
$735
|
|
|
$573
|
|
|
$1,308
|
|
|
For commercial loans and leases, the Company utilizes regulatory classification ratings to monitor credit quality. Loans with a “pass” rating are those that the Company believes will be fully repaid in accordance with the contractual loan terms. Commercial loans and leases that are “criticized” are those that have some weakness or potential weakness that indicate an increased probability of future loss. “Criticized” loans are grouped into three categories, “special mention,” “substandard” and “doubtful.” Special mention loans have potential weaknesses that, if left uncorrected, may result in deterioration of the Company’s credit position at some future date.
82
CITIZENS FINANCIAL GROUP, INC.
NOTES TO CONSOLIDATED FINANCIAL STATEMENTS (UNAUDITED)
Substandard loans are inadequately protected loans; these loans have well-defined weaknesses that could hinder normal repayment or collection of the debt. Doubtful loans have the same weaknesses as substandard, with the added characteristics that the possibility of loss is high and collection of the full amount of the loan is improbable. For retail loans, the Company primarily uses the loan’s payment and delinquency status to monitor credit quality. The further a loan is past due, the greater the likelihood of future credit loss. These credit quality indicators for both commercial and retail loans are continually updated and monitored.
The recorded investment in commercial loans and leases based on regulatory classification ratings is presented below:
|
September 30, 2017
|
|||||||||||||||
|
Criticized
|
|||||||||||||||
|
(in millions)
|
Pass
|
|
Special Mention
|
Substandard
|
|
Doubtful
|
|
Total
|
|
||||||
|
Commercial
|
|
$35,309
|
|
|
$1,368
|
|
|
$770
|
|
|
$259
|
|
|
$37,706
|
|
|
Commercial real estate
|
10,737
|
|
514
|
|
146
|
|
29
|
|
11,426
|
|
|||||
|
Leases
|
3,155
|
|
73
|
|
21
|
|
—
|
|
3,249
|
|
|||||
|
Total
|
|
$49,201
|
|
|
$1,955
|
|
|
$937
|
|
|
$288
|
|
|
$52,381
|
|
|
December 31, 2016
|
|||||||||||||||
|
Criticized
|
|||||||||||||||
|
(in millions)
|
Pass
|
|
Special Mention
|
Substandard
|
|
Doubtful
|
|
Total
|
|
||||||
|
Commercial
|
|
$35,010
|
|
|
$1,015
|
|
|
$1,027
|
|
|
$222
|
|
|
$37,274
|
|
|
Commercial real estate
|
10,146
|
|
370
|
|
58
|
|
50
|
|
10,624
|
|
|||||
|
Leases
|
3,583
|
|
52
|
|
103
|
|
15
|
|
3,753
|
|
|||||
|
Total
|
|
$48,739
|
|
|
$1,437
|
|
|
$1,188
|
|
|
$287
|
|
|
$51,651
|
|
The recorded investment in classes of retail loans, categorized by delinquency status is presented below:
|
September 30, 2017
|
||||||||||||||||||
|
Days Past Due
|
||||||||||||||||||
|
(in millions)
|
Current
|
|
1-29
|
30-59
|
60-89
|
90 or More
|
Total
|
|
||||||||||
|
Residential mortgages
|
|
$16,323
|
|
|
$141
|
|
|
$31
|
|
|
$10
|
|
|
$114
|
|
|
$16,619
|
|
|
Home equity loans
|
1,306
|
|
101
|
|
14
|
|
6
|
|
56
|
|
1,483
|
|
||||||
|
Home equity lines of credit
|
12,874
|
|
419
|
|
54
|
|
23
|
|
185
|
|
13,555
|
|
||||||
|
Home equity loans serviced by others
|
538
|
|
32
|
|
9
|
|
4
|
|
16
|
|
599
|
|
||||||
|
Home equity lines of credit serviced by others
|
125
|
|
20
|
|
3
|
|
1
|
|
17
|
|
166
|
|
||||||
|
Automobile
|
11,917
|
|
1,087
|
|
197
|
|
54
|
|
56
|
|
13,311
|
|
||||||
|
Education
|
7,803
|
|
135
|
|
23
|
|
12
|
|
41
|
|
8,014
|
|
||||||
|
Credit cards
|
1,673
|
|
47
|
|
11
|
|
8
|
|
15
|
|
1,754
|
|
||||||
|
Other retail
|
2,170
|
|
60
|
|
17
|
|
12
|
|
10
|
|
2,269
|
|
||||||
|
Total
|
|
$54,729
|
|
|
$2,042
|
|
|
$359
|
|
|
$130
|
|
|
$510
|
|
|
$57,770
|
|
83
CITIZENS FINANCIAL GROUP, INC.
NOTES TO CONSOLIDATED FINANCIAL STATEMENTS (UNAUDITED)
|
December 31, 2016
|
||||||||||||||||||
|
Days Past Due
|
||||||||||||||||||
|
(in millions)
|
Current
|
|
1-29
|
30-59
|
60-89
|
90 or More
|
Total
|
|
||||||||||
|
Residential mortgages
|
|
$14,807
|
|
|
$108
|
|
|
$53
|
|
|
$12
|
|
|
$135
|
|
|
$15,115
|
|
|
Home equity loans
|
1,628
|
|
127
|
|
23
|
|
7
|
|
73
|
|
1,858
|
|
||||||
|
Home equity lines of credit
|
13,432
|
|
396
|
|
57
|
|
20
|
|
195
|
|
14,100
|
|
||||||
|
Home equity loans serviced by others
|
673
|
|
41
|
|
14
|
|
5
|
|
17
|
|
750
|
|
||||||
|
Home equity lines of credit serviced by others
|
158
|
|
25
|
|
3
|
|
2
|
|
31
|
|
219
|
|
||||||
|
Automobile
|
12,509
|
|
1,177
|
|
172
|
|
38
|
|
42
|
|
13,938
|
|
||||||
|
Education
|
6,379
|
|
151
|
|
24
|
|
13
|
|
43
|
|
6,610
|
|
||||||
|
Credit cards
|
1,611
|
|
43
|
|
12
|
|
9
|
|
16
|
|
1,691
|
|
||||||
|
Other retail
|
1,676
|
|
45
|
|
8
|
|
4
|
|
4
|
|
1,737
|
|
||||||
|
Total
|
|
$52,873
|
|
|
$2,113
|
|
|
$366
|
|
|
$110
|
|
|
$556
|
|
|
$56,018
|
|
Nonperforming Assets
The following table presents nonperforming loans and leases and loans accruing and 90 days or more past due:
|
Nonperforming
|
Accruing and 90 days or more past due
|
||||||||||||||
|
(in millions)
|
September 30, 2017
|
December 31, 2016
|
September 30, 2017
|
December 31, 2016
|
|||||||||||
|
Commercial
|
|
$297
|
|
|
$322
|
|
|
$5
|
|
|
$2
|
|
|||
|
Commercial real estate
|
28
|
|
50
|
|
2
|
|
—
|
|
|||||||
|
Leases
|
—
|
|
15
|
|
—
|
|
—
|
|
|||||||
|
Total commercial
|
325
|
|
387
|
|
7
|
|
2
|
|
|||||||
|
Residential mortgages
(1)
|
124
|
|
144
|
|
15
|
|
18
|
|
|||||||
|
Home equity loans
|
76
|
|
98
|
|
—
|
|
—
|
|
|||||||
|
Home equity lines of credit
|
236
|
|
243
|
|
—
|
|
—
|
|
|||||||
|
Home equity loans serviced by others
|
26
|
|
32
|
|
—
|
|
—
|
|
|||||||
|
Home equity lines of credit serviced by others
|
21
|
|
33
|
|
—
|
|
—
|
|
|||||||
|
Automobile
|
66
|
|
50
|
|
—
|
|
—
|
|
|||||||
|
Education
|
38
|
|
38
|
|
3
|
|
5
|
|
|||||||
|
Credit card
|
15
|
|
16
|
|
—
|
|
—
|
|
|||||||
|
Other retail
|
5
|
|
4
|
|
5
|
|
1
|
|
|||||||
|
Total retail
|
607
|
|
658
|
|
23
|
|
24
|
|
|||||||
|
Total
|
|
$932
|
|
|
$1,045
|
|
|
$30
|
|
|
$26
|
|
|||
(1)
Nonperforming balances exclude first lien residential mortgage loans that are 100% guaranteed by the Federal Housing Administration. These loans, which are accruing and 90 days or more past due, totaled
$15 million
and
$18 million
as of
September 30, 2017
and
December 31, 2016
, respectively. Nonperforming balances also exclude guaranteed residential mortgage loans sold to GNMA for which the Company has the right, but not the obligation, to repurchase. These loans totaled
$28 million
and
$32 million
as of
September 30, 2017
and
December 31, 2016
, respectively. These loans are consolidated on the Company’s Consolidated Balance Sheets.
Other nonperforming assets consist primarily of other real estate owned and are presented in other assets on the Consolidated Balance Sheets. A summary of other nonperforming assets is presented below:
|
(in millions)
|
September 30, 2017
|
December 31, 2016
|
|||||
|
Nonperforming assets, net of valuation allowance:
|
|||||||
|
Commercial
|
|
$—
|
|
|
$—
|
|
|
|
Retail
|
37
|
|
49
|
|
|||
|
Nonperforming assets, net of valuation allowance
|
|
$37
|
|
|
$49
|
|
|
84
CITIZENS FINANCIAL GROUP, INC.
NOTES TO CONSOLIDATED FINANCIAL STATEMENTS (UNAUDITED)
A summary of key performance indicators is presented below:
|
September 30, 2017
|
December 31, 2016
|
||||
|
Nonperforming commercial loans and leases as a percentage of total loans and leases
|
0.30
|
%
|
0.36
|
%
|
|
|
Nonperforming retail loans as a percentage of total loans and leases
|
0.55
|
|
0.61
|
|
|
|
Total nonperforming loans and leases as a percentage of total loans and leases
|
0.85
|
%
|
0.97
|
%
|
|
|
Nonperforming commercial assets as a percentage of total assets
|
0.21
|
%
|
0.26
|
%
|
|
|
Nonperforming retail assets as a percentage of total assets
|
0.43
|
|
0.47
|
|
|
|
Total nonperforming assets as a percentage of total assets
|
0.64
|
%
|
0.73
|
%
|
|
The recorded investment in mortgage loans collateralized by residential real estate property for which formal foreclosure proceedings are in process was
$179 million
and
$177 million
as of
September 30, 2017
and
December 31, 2016
, respectively.
An analysis of the age of both accruing and nonaccruing loan and lease past due amounts is presented below:
|
September 30, 2017
|
December 31, 2016
|
||||||||||||||||||||||||
|
Days Past Due
|
Days Past Due
|
||||||||||||||||||||||||
|
(in millions)
|
30-59
|
60-89
|
90 or More
|
Total
|
|
30-59
|
60-89
|
90 or More
|
Total
|
|
|||||||||||||||
|
Commercial
|
|
$39
|
|
|
$5
|
|
|
$302
|
|
|
$346
|
|
|
$36
|
|
|
$4
|
|
|
$324
|
|
|
$364
|
|
|
|
Commercial real estate
|
4
|
|
2
|
|
30
|
|
36
|
|
1
|
|
2
|
|
50
|
|
53
|
|
|||||||||
|
Leases
|
5
|
|
—
|
|
—
|
|
5
|
|
1
|
|
—
|
|
15
|
|
16
|
|
|||||||||
|
Total commercial
|
48
|
|
7
|
|
332
|
|
387
|
|
38
|
|
6
|
|
389
|
|
433
|
|
|||||||||
|
Residential mortgages
|
31
|
|
10
|
|
114
|
|
155
|
|
53
|
|
12
|
|
135
|
|
200
|
|
|||||||||
|
Home equity loans
|
14
|
|
6
|
|
56
|
|
76
|
|
23
|
|
7
|
|
73
|
|
103
|
|
|||||||||
|
Home equity lines of credit
|
54
|
|
23
|
|
185
|
|
262
|
|
57
|
|
20
|
|
195
|
|
272
|
|
|||||||||
|
Home equity loans serviced by others
|
9
|
|
4
|
|
16
|
|
29
|
|
14
|
|
5
|
|
17
|
|
36
|
|
|||||||||
|
Home equity lines of credit serviced by others
|
3
|
|
1
|
|
17
|
|
21
|
|
3
|
|
2
|
|
31
|
|
36
|
|
|||||||||
|
Automobile
|
197
|
|
54
|
|
56
|
|
307
|
|
172
|
|
38
|
|
42
|
|
252
|
|
|||||||||
|
Education
|
23
|
|
12
|
|
41
|
|
76
|
|
24
|
|
13
|
|
43
|
|
80
|
|
|||||||||
|
Credit cards
|
11
|
|
8
|
|
15
|
|
34
|
|
12
|
|
9
|
|
16
|
|
37
|
|
|||||||||
|
Other retail
|
17
|
|
12
|
|
10
|
|
39
|
|
8
|
|
4
|
|
4
|
|
16
|
|
|||||||||
|
Total retail
|
359
|
|
130
|
|
510
|
|
999
|
|
366
|
|
110
|
|
556
|
|
1,032
|
|
|||||||||
|
Total
|
|
$407
|
|
|
$137
|
|
|
$842
|
|
|
$1,386
|
|
|
$404
|
|
|
$116
|
|
|
$945
|
|
|
$1,465
|
|
|
85
CITIZENS FINANCIAL GROUP, INC.
NOTES TO CONSOLIDATED FINANCIAL STATEMENTS (UNAUDITED)
Impaired loans include nonaccruing larger balance commercial loans (greater than
$3 million
carrying value) and commercial and retail TDRs (excluding loans held for sale). A summary of impaired loans by class is presented below:
|
|
September 30, 2017
|
||||||||||||||
|
(in millions)
|
Impaired Loans With a Related Allowance
|
Allowance on Impaired Loans
|
Impaired Loans Without a Related Allowance
|
Unpaid Contractual Balance
|
Total Recorded Investment in Impaired Loans
|
||||||||||
|
Commercial
|
|
$231
|
|
|
$45
|
|
|
$185
|
|
|
$491
|
|
|
$416
|
|
|
Commercial real estate
|
24
|
|
1
|
|
4
|
|
39
|
|
28
|
|
|||||
|
Total commercial
|
255
|
|
46
|
|
189
|
|
530
|
|
444
|
|
|||||
|
Residential mortgages
|
23
|
|
2
|
|
117
|
|
185
|
|
140
|
|
|||||
|
Home equity loans
|
42
|
|
4
|
|
83
|
|
167
|
|
125
|
|
|||||
|
Home equity lines of credit
|
16
|
|
1
|
|
181
|
|
242
|
|
197
|
|
|||||
|
Home equity loans serviced by others
|
31
|
|
2
|
|
19
|
|
60
|
|
50
|
|
|||||
|
Home equity lines of credit serviced by others
|
3
|
|
—
|
|
6
|
|
13
|
|
9
|
|
|||||
|
Automobile
|
4
|
|
—
|
|
19
|
|
30
|
|
23
|
|
|||||
|
Education
|
159
|
|
18
|
|
20
|
|
179
|
|
179
|
|
|||||
|
Credit cards
|
25
|
|
7
|
|
1
|
|
26
|
|
26
|
|
|||||
|
Other retail
|
5
|
|
1
|
|
5
|
|
11
|
|
10
|
|
|||||
|
Total retail
|
308
|
|
35
|
|
451
|
|
913
|
|
759
|
|
|||||
|
Total
|
|
$563
|
|
|
$81
|
|
|
$640
|
|
|
$1,443
|
|
|
$1,203
|
|
|
December 31, 2016
|
|||||||||||||||
|
(in millions)
|
Impaired Loans With a Related Allowance
|
Allowance on Impaired Loans
|
Impaired Loans Without a Related Allowance
|
Unpaid Contractual Balance
|
Total Recorded Investment in Impaired Loans
|
||||||||||
|
Commercial
|
|
$247
|
|
|
$55
|
|
|
$134
|
|
|
$431
|
|
|
$381
|
|
|
Commercial real estate
|
39
|
|
8
|
|
4
|
|
44
|
|
43
|
|
|||||
|
Total commercial
|
286
|
|
63
|
|
138
|
|
475
|
|
424
|
|
|||||
|
Residential mortgages
|
37
|
|
2
|
|
141
|
|
235
|
|
178
|
|
|||||
|
Home equity loans
|
51
|
|
3
|
|
94
|
|
191
|
|
145
|
|
|||||
|
Home equity lines of credit
|
23
|
|
1
|
|
173
|
|
240
|
|
196
|
|
|||||
|
Home equity loans serviced by others
|
41
|
|
4
|
|
19
|
|
70
|
|
60
|
|
|||||
|
Home equity lines of credit serviced by others
|
2
|
|
—
|
|
7
|
|
13
|
|
9
|
|
|||||
|
Automobile
|
4
|
|
—
|
|
15
|
|
25
|
|
19
|
|
|||||
|
Education
|
154
|
|
25
|
|
1
|
|
155
|
|
155
|
|
|||||
|
Credit cards
|
26
|
|
6
|
|
—
|
|
26
|
|
26
|
|
|||||
|
Other retail
|
10
|
|
2
|
|
1
|
|
13
|
|
11
|
|
|||||
|
Total retail
|
348
|
|
43
|
|
451
|
|
968
|
|
799
|
|
|||||
|
Total
|
|
$634
|
|
|
$106
|
|
|
$589
|
|
|
$1,443
|
|
|
$1,223
|
|
86
CITIZENS FINANCIAL GROUP, INC.
NOTES TO CONSOLIDATED FINANCIAL STATEMENTS (UNAUDITED)
Additional information on impaired loans is presented below:
|
Three Months Ended September 30,
|
|||||||||||||
|
2017
|
2016
|
||||||||||||
|
(in millions)
|
Interest Income Recognized
|
Average Recorded Investment
|
Interest Income Recognized
|
Average Recorded Investment
|
|||||||||
|
Commercial
|
|
$1
|
|
|
$391
|
|
|
$1
|
|
|
$340
|
|
|
|
Commercial real estate
|
—
|
|
33
|
|
—
|
|
40
|
|
|||||
|
Total commercial
|
1
|
|
424
|
|
1
|
|
380
|
|
|||||
|
Residential mortgages
|
—
|
|
137
|
|
1
|
|
169
|
|
|||||
|
Home equity loans
|
1
|
|
125
|
|
2
|
|
153
|
|
|||||
|
Home equity lines of credit
|
2
|
|
192
|
|
2
|
|
192
|
|
|||||
|
Home equity loans serviced by others
|
—
|
|
51
|
|
1
|
|
64
|
|
|||||
|
Home equity lines of credit serviced by others
|
—
|
|
9
|
|
—
|
|
9
|
|
|||||
|
Automobile
|
—
|
|
21
|
|
—
|
|
17
|
|
|||||
|
Education
|
3
|
|
178
|
|
1
|
|
159
|
|
|||||
|
Credit cards
|
—
|
|
25
|
|
—
|
|
25
|
|
|||||
|
Other retail
|
—
|
|
10
|
|
1
|
|
12
|
|
|||||
|
Total retail
|
6
|
|
748
|
|
8
|
|
800
|
|
|||||
|
Total
|
|
$7
|
|
|
$1,172
|
|
|
$9
|
|
|
$1,180
|
|
|
|
Nine Months Ended September 30,
|
|||||||||||||
|
2017
|
2016
|
||||||||||||
|
(in millions)
|
Interest Income Recognized
|
Average Recorded Investment
|
Interest Income Recognized
|
Average Recorded Investment
|
|||||||||
|
Commercial
|
|
$3
|
|
|
$402
|
|
|
$4
|
|
|
$277
|
|
|
|
Commercial real estate
|
—
|
|
39
|
|
—
|
|
53
|
|
|||||
|
Total commercial
|
3
|
|
441
|
|
4
|
|
330
|
|
|||||
|
Residential mortgages
|
3
|
|
128
|
|
3
|
|
161
|
|
|||||
|
Home equity loans
|
4
|
|
124
|
|
5
|
|
151
|
|
|||||
|
Home equity lines of credit
|
5
|
|
178
|
|
5
|
|
182
|
|
|||||
|
Home equity loans serviced by others
|
2
|
|
51
|
|
3
|
|
64
|
|
|||||
|
Home equity lines of credit serviced by others
|
—
|
|
9
|
|
—
|
|
9
|
|
|||||
|
Automobile
|
—
|
|
18
|
|
—
|
|
14
|
|
|||||
|
Education
|
7
|
|
178
|
|
5
|
|
157
|
|
|||||
|
Credit cards
|
1
|
|
23
|
|
1
|
|
25
|
|
|||||
|
Other retail
|
—
|
|
10
|
|
1
|
|
13
|
|
|||||
|
Total retail
|
22
|
|
719
|
|
23
|
|
776
|
|
|||||
|
Total
|
|
$25
|
|
|
$1,160
|
|
|
$27
|
|
|
$1,106
|
|
|
In situations where, for economic or legal reasons related to the borrower’s financial difficulties, the Company grants a concession for other than an insignificant time period to the borrower that it would not otherwise consider, the related loan is classified as a TDR. TDRs typically result from the Company’s loss mitigation efforts and are undertaken in order to improve the likelihood of recovery and continuity of the relationship. The Company’s loan modifications are handled on a case-by-case basis and are negotiated to achieve mutually agreeable terms that maximize loan collectability and meet the borrower’s financial needs. Concessions granted in TDRs for all classes of loans may include lowering the interest rate, forgiving a portion of principal, extending the loan term, lowering scheduled payments for a specified period of time, or capitalizing past due amounts. A rate increase can be a concession if the increased rate is lower than a market rate for debt with risk similar to that of the restructured loan. TDRs for commercial loans and leases may also involve creating a multiple note structure, accepting non-cash assets, accepting an equity interest, or receiving a performance-based fee. In some cases, a TDR may involve multiple
87
CITIZENS FINANCIAL GROUP, INC.
NOTES TO CONSOLIDATED FINANCIAL STATEMENTS (UNAUDITED)
concessions. The financial effects of TDRs for all loan classes may include lower income (either due to a lower interest rate or a delay in the timing of cash flows), larger loan loss provisions, and accelerated charge-offs if the modification renders the loan collateral-dependent. In some cases, interest income throughout the term of the loan may increase if, for example, the loan is extended or the interest rate is increased as a result of the restructuring.
Because TDRs are impaired loans, the Company measures impairment by comparing the present value of expected future cash flows, or when appropriate, the fair value of collateral less costs to sell, to the loan’s recorded investment. Any excess of recorded investment over the present value of expected future cash flows or collateral value is included in the ALLL. Any portion of the loan’s recorded investment the Company does not expect to collect as a result of the modification is charged off at the time of modification. For Retail TDR accounts where the expected value of cash flows is utilized, any recorded investment in excess of the present value of expected cash flows is recognized by creating or increasing the ALLL. For Retail TDR accounts assessed based on the fair value of collateral, any portion of the loan’s recorded investment in excess of the collateral value less costs to sell is charged off at the time of modification or at the time of subsequent and regularly recurring valuations.
Commercial TDRs were
$153 million
and
$120 million
at
September 30, 2017
and
December 31, 2016
, respectively. Retail TDRs totaled
$759 million
and
$799 million
at
September 30, 2017
and
December 31, 2016
, respectively. Unfunded commitments tied to TDRs were
$52 million
and
$42 million
at
September 30, 2017
and
December 31, 2016
, respectively.
88
CITIZENS FINANCIAL GROUP, INC.
NOTES TO CONSOLIDATED FINANCIAL STATEMENTS (UNAUDITED)
The table below summarizes how loans were modified during the
three months ended
September 30, 2017
, the charge-offs related to the modifications, and the impact on the ALLL. The reported balances can include loans that became TDRs during the
three months ended
September 30, 2017
and were paid off in full, charged off, or sold prior to
September 30, 2017
.
|
Primary Modification Types
|
|||||||||||||||||
|
Interest Rate Reduction
(1)
|
Maturity Extension
(2)
|
||||||||||||||||
|
(dollars in millions)
|
Number of Contracts
|
Pre-Modification Outstanding Recorded Investment
|
Post-Modification Outstanding Recorded Investment
|
Number of Contracts
|
Pre-Modification Outstanding Recorded Investment
|
Post-Modification Outstanding Recorded Investment
|
|||||||||||
|
Commercial
|
3
|
|
|
$1
|
|
|
$1
|
|
17
|
|
|
$8
|
|
|
$7
|
|
|
|
Commercial real estate
|
—
|
|
—
|
|
—
|
|
1
|
|
—
|
|
—
|
|
|||||
|
Leases
|
—
|
|
—
|
|
—
|
|
—
|
|
—
|
|
—
|
|
|||||
|
Total commercial
|
3
|
|
1
|
|
1
|
|
18
|
|
8
|
|
7
|
|
|||||
|
Residential mortgages
|
13
|
|
1
|
|
2
|
|
15
|
|
1
|
|
2
|
|
|||||
|
Home equity loans
|
25
|
|
2
|
|
1
|
|
—
|
|
—
|
|
—
|
|
|||||
|
Home equity lines of credit
|
11
|
|
1
|
|
1
|
|
86
|
|
11
|
|
11
|
|
|||||
|
Home equity loans serviced by others
|
3
|
|
—
|
|
—
|
|
—
|
|
—
|
|
—
|
|
|||||
|
Home equity lines of credit serviced by others
|
—
|
|
—
|
|
—
|
|
—
|
|
—
|
|
—
|
|
|||||
|
Automobile
|
28
|
|
1
|
|
1
|
|
8
|
|
—
|
|
—
|
|
|||||
|
Education
|
—
|
|
—
|
|
—
|
|
—
|
|
—
|
|
—
|
|
|||||
|
Credit cards
|
661
|
|
3
|
|
3
|
|
—
|
|
—
|
|
—
|
|
|||||
|
Other retail
|
—
|
|
—
|
|
—
|
|
—
|
|
—
|
|
—
|
|
|||||
|
Total retail
|
741
|
|
8
|
|
8
|
|
109
|
|
12
|
|
13
|
|
|||||
|
Total
|
744
|
|
|
$9
|
|
|
$9
|
|
127
|
|
|
$20
|
|
|
$20
|
|
|
|
Primary Modification Types
|
|||||||||||||||
|
Other
(3)
|
|||||||||||||||
|
(dollars in millions)
|
Number of Contracts
|
Pre-Modification Outstanding Recorded Investment
|
Post-Modification Outstanding Recorded Investment
|
Net Change to ALLL Resulting from Modification
|
Charge-offs Resulting from Modification
|
||||||||||
|
Commercial
|
7
|
|
|
$28
|
|
|
$30
|
|
|
$—
|
|
|
$—
|
|
|
|
Commercial real estate
|
1
|
|
—
|
|
—
|
|
—
|
|
—
|
|
|||||
|
Leases
|
—
|
|
—
|
|
—
|
|
—
|
|
—
|
|
|||||
|
Total commercial
|
8
|
|
28
|
|
30
|
|
—
|
|
—
|
|
|||||
|
Residential mortgages
|
38
|
|
3
|
|
3
|
|
(1
|
)
|
—
|
|
|||||
|
Home equity loans
|
49
|
|
3
|
|
3
|
|
—
|
|
—
|
|
|||||
|
Home equity lines of credit
|
110
|
|
6
|
|
7
|
|
—
|
|
1
|
|
|||||
|
Home equity loans serviced by others
|
11
|
|
1
|
|
—
|
|
—
|
|
—
|
|
|||||
|
Home equity lines of credit serviced by others
|
8
|
|
1
|
|
—
|
|
—
|
|
—
|
|
|||||
|
Automobile
|
392
|
|
7
|
|
6
|
|
—
|
|
1
|
|
|||||
|
Education
|
67
|
|
2
|
|
2
|
|
—
|
|
—
|
|
|||||
|
Credit cards
|
—
|
|
—
|
|
—
|
|
1
|
|
—
|
|
|||||
|
Other retail
|
2
|
|
—
|
|
—
|
|
—
|
|
—
|
|
|||||
|
Total retail
|
677
|
|
23
|
|
21
|
|
—
|
|
2
|
|
|||||
|
Total
|
685
|
|
|
$51
|
|
|
$51
|
|
|
$—
|
|
|
$2
|
|
|
(1)
Includes modifications that consist of multiple concessions, one of which is an interest rate reduction.
(2)
Includes modifications that consist of multiple concessions, one of which is a maturity extension (unless one of the other concessions was an interest rate reduction).
(3)
Includes modifications other than interest rate reductions or maturity extensions, such as lowering scheduled payments for a specified period of time, principal forgiveness, and capitalizing arrearages. Also included are the following: deferrals, trial modifications, certain bankruptcies, loans in forbearance and prepayment plans. Modifications can include the deferral of accrued interest resulting in post modification balances being higher than pre-modification.
89
CITIZENS FINANCIAL GROUP, INC.
NOTES TO CONSOLIDATED FINANCIAL STATEMENTS (UNAUDITED)
The table below summarizes how loans were modified during the
three months ended
September 30, 2016
, the charge-offs related to the modifications, and the impact on the ALLL. The reported balances can include loans that became TDRs during the
three months ended
September 30, 2016
and were paid off in full, charged off, or sold prior to
September 30, 2016
.
|
Primary Modification Types
|
|||||||||||||||||
|
Interest Rate Reduction
(1)
|
Maturity Extension
(2)
|
||||||||||||||||
|
(dollars in millions)
|
Number of Contracts
|
Pre-Modification Outstanding Recorded Investment
|
Post-Modification Outstanding Recorded Investment
|
Number of Contracts
|
Pre-Modification Outstanding Recorded Investment
|
Post-Modification Outstanding Recorded Investment
|
|||||||||||
|
Commercial
|
3
|
|
|
$—
|
|
|
$—
|
|
8
|
|
|
$1
|
|
|
$1
|
|
|
|
Commercial real estate
|
—
|
|
—
|
|
—
|
|
—
|
|
—
|
|
—
|
|
|||||
|
Leases
|
—
|
|
—
|
|
—
|
|
—
|
|
—
|
|
—
|
|
|||||
|
Total commercial
|
3
|
|
—
|
|
—
|
|
8
|
|
1
|
|
1
|
|
|||||
|
Residential mortgages
|
28
|
|
3
|
|
3
|
|
33
|
|
6
|
|
5
|
|
|||||
|
Home equity loans
|
36
|
|
2
|
|
2
|
|
2
|
|
—
|
|
1
|
|
|||||
|
Home equity lines of credit
|
20
|
|
1
|
|
2
|
|
56
|
|
6
|
|
6
|
|
|||||
|
Home equity loans serviced by others
|
7
|
|
1
|
|
1
|
|
—
|
|
—
|
|
—
|
|
|||||
|
Home equity lines of credit serviced by others
|
2
|
|
—
|
|
—
|
|
1
|
|
—
|
|
—
|
|
|||||
|
Automobile
|
26
|
|
1
|
|
1
|
|
6
|
|
—
|
|
—
|
|
|||||
|
Education
|
—
|
|
—
|
|
—
|
|
—
|
|
—
|
|
—
|
|
|||||
|
Credit cards
|
544
|
|
3
|
|
3
|
|
—
|
|
—
|
|
—
|
|
|||||
|
Other retail
|
2
|
|
—
|
|
—
|
|
—
|
|
—
|
|
—
|
|
|||||
|
Total retail
|
665
|
|
11
|
|
12
|
|
98
|
|
12
|
|
12
|
|
|||||
|
Total
|
668
|
|
|
$11
|
|
|
$12
|
|
106
|
|
|
$13
|
|
|
$13
|
|
|
|
Primary Modification Types
|
|||||||||||||||
|
Other
(3)
|
|||||||||||||||
|
(dollars in millions)
|
Number of Contracts
|
Pre-Modification Outstanding Recorded Investment
|
Post-Modification Outstanding Recorded Investment
|
Net Change to ALLL Resulting from Modification
|
Charge-offs Resulting from Modification
|
||||||||||
|
Commercial
|
4
|
|
|
$6
|
|
|
$5
|
|
|
$4
|
|
|
$—
|
|
|
|
Commercial real estate
|
—
|
|
—
|
|
—
|
|
—
|
|
—
|
|
|||||
|
Leases
|
—
|
|
—
|
|
—
|
|
—
|
|
—
|
|
|||||
|
Total commercial
|
4
|
|
6
|
|
5
|
|
4
|
|
—
|
|
|||||
|
Residential mortgages
|
55
|
|
5
|
|
5
|
|
—
|
|
—
|
|
|||||
|
Home equity loans
|
52
|
|
3
|
|
3
|
|
—
|
|
—
|
|
|||||
|
Home equity lines of credit
|
94
|
|
8
|
|
7
|
|
—
|
|
1
|
|
|||||
|
Home equity loans serviced by others
|
17
|
|
1
|
|
1
|
|
—
|
|
—
|
|
|||||
|
Home equity lines of credit serviced by others
|
6
|
|
—
|
|
1
|
|
—
|
|
—
|
|
|||||
|
Automobile
|
264
|
|
5
|
|
5
|
|
—
|
|
—
|
|
|||||
|
Education
|
108
|
|
2
|
|
2
|
|
1
|
|
—
|
|
|||||
|
Credit cards
|
—
|
|
—
|
|
—
|
|
1
|
|
—
|
|
|||||
|
Other retail
|
3
|
|
—
|
|
—
|
|
—
|
|
—
|
|
|||||
|
Total retail
|
599
|
|
24
|
|
24
|
|
2
|
|
1
|
|
|||||
|
Total
|
603
|
|
|
$30
|
|
|
$29
|
|
|
$6
|
|
|
$1
|
|
|
(1)
Includes modifications that consist of multiple concessions, one of which is an interest rate reduction.
(2)
Includes modifications that consist of multiple concessions, one of which is a maturity extension (unless one of the other concessions was an interest rate reduction).
(3)
Includes modifications other than interest rate reductions or maturity extensions, such as lowering scheduled payments for a specified period of time, principal forgiveness, and capitalizing arrearages. Also included are the following: deferrals, trial modifications, certain bankruptcies, loans in forbearance and prepayment plans. Modifications can include the deferral of accrued interest resulting in post modification balances being higher than pre-modification.
90
CITIZENS FINANCIAL GROUP, INC.
NOTES TO CONSOLIDATED FINANCIAL STATEMENTS (UNAUDITED)
The table below summarizes how loans were modified during the
nine months ended
September 30, 2017
, the charge-offs related to the modifications, and the impact on the ALLL. The reported balances can include loans that became TDRs during the
nine months ended
September 30, 2017
and were paid off in full, charged off, or sold prior to
September 30, 2017
.
|
Primary Modification Types
|
|||||||||||||||||
|
Interest Rate Reduction
(1)
|
Maturity Extension
(2)
|
||||||||||||||||
|
(dollars in millions)
|
Number of Contracts
|
Pre-Modification Outstanding Recorded Investment
|
Post-Modification Outstanding Recorded Investment
|
Number of Contracts
|
Pre-Modification Outstanding Recorded Investment
|
Post-Modification Outstanding Recorded Investment
|
|||||||||||
|
Commercial
|
7
|
|
|
$2
|
|
|
$2
|
|
35
|
|
|
$22
|
|
|
$21
|
|
|
|
Commercial real estate
|
—
|
|
—
|
|
—
|
|
1
|
|
—
|
|
—
|
|
|||||
|
Leases
|
—
|
|
—
|
|
—
|
|
—
|
|
—
|
|
—
|
|
|||||
|
Total commercial
|
7
|
|
2
|
|
2
|
|
36
|
|
22
|
|
21
|
|
|||||
|
Residential mortgages
|
56
|
|
6
|
|
7
|
|
50
|
|
9
|
|
10
|
|
|||||
|
Home equity loans
|
68
|
|
4
|
|
4
|
|
1
|
|
—
|
|
—
|
|
|||||
|
Home equity lines of credit
|
41
|
|
2
|
|
2
|
|
204
|
|
26
|
|
26
|
|
|||||
|
Home equity loans serviced by others
|
14
|
|
1
|
|
1
|
|
—
|
|
—
|
|
—
|
|
|||||
|
Home equity lines of credit serviced by others
|
3
|
|
—
|
|
—
|
|
2
|
|
—
|
|
—
|
|
|||||
|
Automobile
|
93
|
|
2
|
|
2
|
|
23
|
|
—
|
|
—
|
|
|||||
|
Education
|
—
|
|
—
|
|
—
|
|
—
|
|
—
|
|
—
|
|
|||||
|
Credit cards
|
1,850
|
|
10
|
|
10
|
|
—
|
|
—
|
|
—
|
|
|||||
|
Other retail
|
1
|
|
—
|
|
—
|
|
—
|
|
—
|
|
—
|
|
|||||
|
Total retail
|
2,126
|
|
25
|
|
26
|
|
280
|
|
35
|
|
36
|
|
|||||
|
Total
|
2,133
|
|
|
$27
|
|
|
$28
|
|
316
|
|
|
$57
|
|
|
$57
|
|
|
|
Primary Modification Types
|
|||||||||||||||
|
Other
(3)
|
|||||||||||||||
|
(dollars in millions)
|
Number of Contracts
|
Pre-Modification Outstanding Recorded Investment
|
Post-Modification Outstanding Recorded Investment
|
Net Change to ALLL Resulting from Modification
|
Charge-offs Resulting from Modification
|
||||||||||
|
Commercial
|
12
|
|
|
$64
|
|
|
$65
|
|
|
$1
|
|
|
$—
|
|
|
|
Commercial real estate
|
1
|
|
—
|
|
—
|
|
—
|
|
—
|
|
|||||
|
Leases
|
—
|
|
—
|
|
—
|
|
—
|
|
—
|
|
|||||
|
Total commercial
|
13
|
|
64
|
|
65
|
|
1
|
|
—
|
|
|||||
|
Residential mortgages
|
122
|
|
13
|
|
13
|
|
(1
|
)
|
—
|
|
|||||
|
Home equity loans
|
192
|
|
11
|
|
11
|
|
—
|
|
—
|
|
|||||
|
Home equity lines of credit
|
295
|
|
20
|
|
20
|
|
—
|
|
1
|
|
|||||
|
Home equity loans serviced by others
|
41
|
|
2
|
|
1
|
|
—
|
|
—
|
|
|||||
|
Home equity lines of credit serviced by others
|
21
|
|
2
|
|
1
|
|
—
|
|
—
|
|
|||||
|
Automobile
|
1,017
|
|
18
|
|
16
|
|
—
|
|
3
|
|
|||||
|
Education
|
235
|
|
4
|
|
4
|
|
1
|
|
—
|
|
|||||
|
Credit cards
|
—
|
|
—
|
|
—
|
|
3
|
|
—
|
|
|||||
|
Other retail
|
5
|
|
—
|
|
—
|
|
(1
|
)
|
—
|
|
|||||
|
Total retail
|
1,928
|
|
70
|
|
66
|
|
2
|
|
4
|
|
|||||
|
Total
|
1,941
|
|
|
$134
|
|
|
$131
|
|
|
$3
|
|
|
$4
|
|
|
(1)
Includes modifications that consist of multiple concessions, one of which is an interest rate reduction.
(2)
Includes modifications that consist of multiple concessions, one of which is a maturity extension (unless one of the other concessions was an interest rate reduction).
(3)
Includes modifications other than interest rate reductions or maturity extensions, such as lowering scheduled payments for a specified period of time, principal forgiveness, and capitalizing arrearages. Also included are the following: deferrals, trial modifications, certain bankruptcies, loans in forbearance and prepayment plans. Modifications can include the deferral of accrued interest resulting in post modification balances being higher than pre-modification.
91
CITIZENS FINANCIAL GROUP, INC.
NOTES TO CONSOLIDATED FINANCIAL STATEMENTS (UNAUDITED)
The table below summarizes how loans were modified during the
nine months ended
September 30, 2016
, the charge-offs related to the modifications, and the impact on the ALLL. The reported balances can include loans that became TDRs during the
nine months ended
September 30, 2016
and were paid off in full, charged off, or sold prior to
September 30, 2016
.
|
Primary Modification Types
|
|||||||||||||||||
|
Interest Rate Reduction
(1)
|
Maturity Extension
(2)
|
||||||||||||||||
|
(dollars in millions)
|
Number of Contracts
|
Pre-Modification Outstanding Recorded Investment
|
Post-Modification Outstanding Recorded Investment
|
Number of Contracts
|
Pre-Modification Outstanding Recorded Investment
|
Post-Modification Outstanding Recorded Investment
|
|||||||||||
|
Commercial
|
11
|
|
|
$1
|
|
|
$1
|
|
62
|
|
|
$9
|
|
|
$9
|
|
|
|
Commercial real estate
|
—
|
|
—
|
|
—
|
|
—
|
|
—
|
|
—
|
|
|||||
|
Leases
|
—
|
|
—
|
|
—
|
|
—
|
|
—
|
|
—
|
|
|||||
|
Total commercial
|
11
|
|
1
|
|
1
|
|
62
|
|
9
|
|
9
|
|
|||||
|
Residential mortgages
|
53
|
|
7
|
|
7
|
|
49
|
|
9
|
|
8
|
|
|||||
|
Home equity loans
|
65
|
|
4
|
|
4
|
|
39
|
|
4
|
|
5
|
|
|||||
|
Home equity lines of credit
|
33
|
|
2
|
|
3
|
|
83
|
|
9
|
|
9
|
|
|||||
|
Home equity loans serviced by others
|
13
|
|
1
|
|
1
|
|
—
|
|
—
|
|
—
|
|
|||||
|
Home equity lines of credit serviced by others
|
4
|
|
—
|
|
—
|
|
5
|
|
1
|
|
1
|
|
|||||
|
Automobile
|
77
|
|
2
|
|
2
|
|
14
|
|
—
|
|
—
|
|
|||||
|
Education
|
—
|
|
—
|
|
—
|
|
—
|
|
—
|
|
—
|
|
|||||
|
Credit cards
|
1,625
|
|
9
|
|
9
|
|
—
|
|
—
|
|
—
|
|
|||||
|
Other retail
|
3
|
|
—
|
|
—
|
|
—
|
|
—
|
|
—
|
|
|||||
|
Total retail
|
1,873
|
|
25
|
|
26
|
|
190
|
|
23
|
|
23
|
|
|||||
|
Total
|
1,884
|
|
|
$26
|
|
|
$27
|
|
252
|
|
|
$32
|
|
|
$32
|
|
|
|
Primary Modification Types
|
|||||||||||||||
|
Other
(3)
|
|||||||||||||||
|
(dollars in millions)
|
Number of Contracts
|
Pre-Modification Outstanding Recorded Investment
|
Post-Modification Outstanding Recorded Investment
|
Net Change to ALLL Resulting from Modification
|
Charge-offs Resulting from Modification
|
||||||||||
|
Commercial
|
13
|
|
|
$47
|
|
|
$46
|
|
|
$3
|
|
|
$—
|
|
|
|
Commercial real estate
|
—
|
|
—
|
|
—
|
|
—
|
|
—
|
|
|||||
|
Leases
|
—
|
|
—
|
|
—
|
|
—
|
|
—
|
|
|||||
|
Total commercial
|
13
|
|
47
|
|
46
|
|
3
|
|
—
|
|
|||||
|
Residential mortgages
|
186
|
|
20
|
|
20
|
|
—
|
|
—
|
|
|||||
|
Home equity loans
|
233
|
|
14
|
|
14
|
|
(1
|
)
|
—
|
|
|||||
|
Home equity lines of credit
|
218
|
|
16
|
|
15
|
|
—
|
|
1
|
|
|||||
|
Home equity loans serviced by others
|
51
|
|
2
|
|
2
|
|
—
|
|
—
|
|
|||||
|
Home equity lines of credit serviced by others
|
19
|
|
1
|
|
1
|
|
—
|
|
—
|
|
|||||
|
Automobile
|
803
|
|
15
|
|
14
|
|
—
|
|
1
|
|
|||||
|
Education
|
405
|
|
8
|
|
8
|
|
3
|
|
—
|
|
|||||
|
Credit cards
|
—
|
|
—
|
|
—
|
|
2
|
|
—
|
|
|||||
|
Other retail
|
11
|
|
—
|
|
—
|
|
—
|
|
—
|
|
|||||
|
Total retail
|
1,926
|
|
76
|
|
74
|
|
4
|
|
2
|
|
|||||
|
Total
|
1,939
|
|
|
$123
|
|
|
$120
|
|
|
$7
|
|
|
$2
|
|
|
(1)
Includes modifications that consist of multiple concessions, one of which is an interest rate reduction.
(2)
Includes modifications that consist of multiple concessions, one of which is a maturity extension (unless one of the other concessions was an interest rate reduction).
(3)
Includes modifications other than interest rate reductions or maturity extensions, such as lowering scheduled payments for a specified period of time, principal forgiveness, and capitalizing arrearages. Also included are the following: deferrals, trial modifications, certain bankruptcies, loans in forbearance and prepayment plans. Modifications can include the deferral of accrued interest resulting in post modification balances being higher than pre-modification.
92
CITIZENS FINANCIAL GROUP, INC.
NOTES TO CONSOLIDATED FINANCIAL STATEMENTS (UNAUDITED)
The table below summarizes TDRs that defaulted within 12 months of their modification date during the three and nine months ended
September 30, 2017
and
2016
, respectively. For purposes of this table, a payment default refers to a loan that becomes 90 days or more past due under the modified terms. Amounts represent the loan’s recorded investment at the time of payment default. Loan data includes loans meeting the criteria that were paid off in full, charged off, or sold prior to
September 30, 2017
and
2016
, respectively. If a TDR of any loan type becomes 90 days past due after being modified, the loan is written down to the fair value of collateral less cost to sell. The amount written off is charged to the ALLL.
|
Three Months Ended September 30,
|
Nine Months Ended September 30,
|
||||||||||||||||||||||
|
2017
|
2016
|
2017
|
2016
|
||||||||||||||||||||
|
(dollars in millions)
|
Number of Contracts
|
Balance Defaulted
|
Number of Contracts
|
Balance Defaulted
|
Number of Contracts
|
Balance Defaulted
|
Number of Contracts
|
Balance Defaulted
|
|||||||||||||||
|
Commercial
|
2
|
|
|
$4
|
|
5
|
|
|
$1
|
|
7
|
|
|
$5
|
|
16
|
|
|
$4
|
|
|||
|
Commercial real estate
|
—
|
|
—
|
|
—
|
|
—
|
|
1
|
|
4
|
|
1
|
|
—
|
|
|||||||
|
Total commercial
|
2
|
|
4
|
|
5
|
|
1
|
|
8
|
|
9
|
|
17
|
|
4
|
|
|||||||
|
Residential mortgages
|
35
|
|
5
|
|
57
|
|
7
|
|
121
|
|
15
|
|
146
|
|
19
|
|
|||||||
|
Home equity loans
|
12
|
|
—
|
|
14
|
|
—
|
|
35
|
|
1
|
|
39
|
|
3
|
|
|||||||
|
Home equity lines of credit
|
55
|
|
4
|
|
48
|
|
4
|
|
152
|
|
11
|
|
93
|
|
8
|
|
|||||||
|
Home equity loans serviced by others
|
6
|
|
—
|
|
7
|
|
—
|
|
16
|
|
—
|
|
28
|
|
1
|
|
|||||||
|
Home equity lines of credit serviced by others
|
4
|
|
—
|
|
3
|
|
—
|
|
8
|
|
—
|
|
14
|
|
—
|
|
|||||||
|
Automobile
|
42
|
|
—
|
|
43
|
|
—
|
|
103
|
|
1
|
|
80
|
|
1
|
|
|||||||
|
Education
|
5
|
|
1
|
|
15
|
|
—
|
|
41
|
|
1
|
|
46
|
|
1
|
|
|||||||
|
Credit cards
|
116
|
|
—
|
|
117
|
|
1
|
|
344
|
|
2
|
|
323
|
|
2
|
|
|||||||
|
Other retail
|
2
|
|
—
|
|
2
|
|
—
|
|
4
|
|
—
|
|
2
|
|
—
|
|
|||||||
|
Total retail
|
277
|
|
10
|
|
306
|
|
12
|
|
824
|
|
31
|
|
771
|
|
35
|
|
|||||||
|
Total
|
279
|
|
|
$14
|
|
311
|
|
|
$13
|
|
832
|
|
|
$40
|
|
788
|
|
|
$39
|
|
|||
Concentrations of Credit Risk
Most of the Company’s lending activity is with customers located in the New England, Mid-Atlantic and Midwest regions. Generally, loans are collateralized by assets including real estate, inventory, accounts receivable, other personal property and investment securities. As of
September 30, 2017
and December 31,
2016
, the Company had a significant amount of loans collateralized by residential and commercial real estate. There were no significant concentration risks within the commercial loan or retail loan portfolios. Exposure to credit losses arising from lending transactions may fluctuate with fair values of collateral supporting loans, which may not perform according to contractual agreements. The Company’s policy is to collateralize loans to the extent necessary; however, unsecured loans are also granted on the basis of the financial strength of the applicant and the facts surrounding the transaction.
Certain loan products, including residential mortgages, home equity loans and lines of credit, and credit cards, have contractual features that may increase credit exposure to the Company in the event of an increase in interest rates or a decline in housing values. These products include loans that exceed
90%
of the value of the underlying collateral (high LTV loans), interest-only and negative amortization residential mortgages, and loans with low introductory rates. Certain loans have more than one of these characteristics.
The following tables present balances of loans with these characteristics:
|
September 30, 2017
|
||||||||||||||||||
|
(in millions)
|
Residential Mortgages
|
Home Equity Loans and Lines of Credit
|
Home Equity Products Serviced by Others
|
Credit Cards
|
|
Education
|
|
Total
|
|
|||||||||
|
High loan-to-value
|
|
$436
|
|
|
$260
|
|
|
$319
|
|
|
$—
|
|
|
$—
|
|
|
$1,015
|
|
|
Interest only/negative amortization
|
1,738
|
|
—
|
|
—
|
|
—
|
|
1
|
|
1,739
|
|
||||||
|
Low introductory rate
|
—
|
|
—
|
|
—
|
|
165
|
|
—
|
|
165
|
|
||||||
|
Multiple characteristics and other
|
2
|
|
—
|
|
—
|
|
—
|
|
—
|
|
2
|
|
||||||
|
Total
|
|
$2,176
|
|
|
$260
|
|
|
$319
|
|
|
$165
|
|
|
$1
|
|
|
$2,921
|
|
93
CITIZENS FINANCIAL GROUP, INC.
NOTES TO CONSOLIDATED FINANCIAL STATEMENTS (UNAUDITED)
|
December 31, 2016
|
||||||||||||||||||
|
(in millions)
|
Residential Mortgages
|
Home Equity Loans and Lines of Credit
|
Home Equity Products Serviced by Others
|
Credit Cards
|
|
Education
|
|
Total
|
|
|||||||||
|
High loan-to-value
|
|
$566
|
|
|
$550
|
|
|
$476
|
|
|
$—
|
|
|
$—
|
|
|
$1,592
|
|
|
Interest only/negative amortization
|
1,582
|
|
—
|
|
—
|
|
—
|
|
1
|
|
1,583
|
|
||||||
|
Low introductory rate
|
—
|
|
—
|
|
—
|
|
112
|
|
—
|
|
112
|
|
||||||
|
Multiple characteristics and other
|
3
|
|
—
|
|
—
|
|
—
|
|
—
|
|
3
|
|
||||||
|
Total
|
|
$2,151
|
|
|
$550
|
|
|
$476
|
|
|
$112
|
|
|
$1
|
|
|
$3,290
|
|
The Company makes equity investments in various entities that are considered VIEs. These investments primarily include ownership interests in limited partnerships that sponsor affordable housing projects and ownership interests in limited liability companies that sponsor renewable energy projects. The Company’s maximum exposure to loss as a result of its involvement with these entities is limited to the balance sheet carrying amounts of its equity investments. A summary of these investments is presented below:
|
(in millions)
|
September 30, 2017
|
December 31, 2016
|
|||||
|
LIHTC investment included in other assets
|
|
$898
|
|
|
$793
|
|
|
|
LIHTC unfunded commitments included in other liabilities
|
494
|
|
428
|
|
|||
|
Renewable energy investments included in other assets
|
264
|
|
220
|
|
|||
Low Income Housing Tax Credit Partnerships
The purpose of the Company’s equity investments is to assist in achieving goals of the Community Reinvestment Act and to earn an adequate return of capital. LIHTC partnerships are managed by unrelated general partners that have the power to direct the activities which most significantly affect the performance of the partnerships. The Company is therefore not the primary beneficiary of any LIHTC partnerships. Accordingly, the Company does not consolidate these VIEs and accounts for these investments in other assets on the Consolidated Balance Sheets.
The Company applies the proportional amortization method to account for its LIHTC investments. Under the proportional amortization method, the Company applies a practical expedient and amortizes the initial cost of the investment in proportion to the tax credits received in the current period as compared to the total tax credits expected to be received over the life of the investment. The amortization and tax benefits are included as a component of income tax expense. The tax credits received are reported as a reduction of income tax expense (or increase to income tax benefit) related to these transactions.
The following table presents other information related to the Company’s affordable housing tax credit investments:
|
Three Months Ended September 30,
|
Nine Months Ended September 30,
|
||||||||||||||
|
(in millions)
|
2017
|
|
2016
|
|
2017
|
|
2016
|
|
|||||||
|
Tax credits included in income tax expense
|
|
$20
|
|
|
$17
|
|
|
$63
|
|
|
$46
|
|
|||
|
Amortization expense included in income tax expense
|
22
|
|
14
|
|
67
|
|
45
|
|
|||||||
|
Other tax benefits included in income tax expense
|
7
|
|
2
|
|
22
|
|
15
|
|
|||||||
No
LIHTC investment impairment losses were recognized during the
three and nine
months ended
September 30, 2017
and
2016
, respectively.
Renewable Energy Entities
The Company’s investments in renewable energy entities provide benefits from a return generated by government incentives plus other tax attributes that are associated with tax ownership (e.g., tax depreciation). As a tax equity investor, the Company does not have the power to direct the activities which most significantly affect
94
CITIZENS FINANCIAL GROUP, INC.
NOTES TO CONSOLIDATED FINANCIAL STATEMENTS (UNAUDITED)
the performance of these entities and therefore is not the primary beneficiary of any renewable energy entities. Accordingly, the Company does not consolidate these VIEs.
In its mortgage banking business, the Company sells residential mortgages to government-sponsored entities and other parties, who may issue securities backed by pools of such loans. The Company retains no beneficial interests in these sales, but may retain the servicing rights for the loans sold. The Company is obligated to subsequently repurchase a loan if the purchaser discovers a standard representation or warranty violation such as noncompliance with eligibility requirements, customer fraud, or servicing violations. This primarily occurs during a loan file review.
The Company received proceeds from the sale of residential mortgages held for sale of
$828 million
and
$753 million
for the
three months ended
September 30, 2017
and
2016
, respectively, and
$2.4 billion
and
$1.8 billion
for the
nine months ended
September 30, 2017
and
2016
, respectively.
The Company recognized gains on sales of residential mortgages held for sale of
$25 million
and
$26 million
for the
three months ended
September 30, 2017
and
2016
, respectively, and
$54 million
and
$56 million
for the
nine months ended
September 30, 2017
and
2016
, respectively.
Pursuant to the standard representations and warranties obligations discussed above, the Company repurchased residential mortgages totaling
$1 million
and
$2 million
for the
three months ended
September 30, 2017
and
2016
, respectively. The Company repurchased
$2 million
and
$6 million
of residential mortgages for the
nine months ended
September 30, 2017
and
2016
, respectively.
Mortgage servicing fees, a component of mortgage banking fees, were
$13 million
and
$12 million
for the
three months ended
September 30, 2017
and
2016
, respectively, and
$40 million
and
$38 million
for the
nine months ended
September 30, 2017
and
2016
, respectively.
The Company recorded valuation charge-offs for its MSRs of
zero
and
$2 million
for the
three months ended
September 30, 2017
and
2016
, respectively, and valuation recoveries of
$1 million
and charge-offs of
$6 million
for the
nine months ended
September 30, 2017
and
2016
, respectively.
MSRs are presented in other assets on the Consolidated Balance Sheets. Changes related to MSRs are presented below:
|
As of and for the Three Months Ended
September 30,
|
As of and for the Nine Months Ended
September 30,
|
||||||||||||||
|
(in millions)
|
2017
|
|
2016
|
|
2017
|
|
2016
|
|
|||||||
|
MSRs:
|
|||||||||||||||
|
Balance as of beginning of period
|
|
$170
|
|
|
$166
|
|
|
$167
|
|
|
$173
|
|
|||
|
Amount capitalized
|
9
|
|
10
|
|
28
|
|
20
|
|
|||||||
|
Amortization
|
(8
|
)
|
(9
|
)
|
(24
|
)
|
(26
|
)
|
|||||||
|
Carrying amount before valuation allowance
|
171
|
|
167
|
|
171
|
|
167
|
|
|||||||
|
Valuation allowance for servicing assets:
|
|||||||||||||||
|
Balance as of beginning of period
|
4
|
|
13
|
|
5
|
|
9
|
|
|||||||
|
Valuation charge-offs (recoveries)
|
—
|
|
2
|
|
(1
|
)
|
6
|
|
|||||||
|
Balance at end of period
|
4
|
|
15
|
|
4
|
|
15
|
|
|||||||
|
Net carrying value of MSRs
|
|
$167
|
|
|
$152
|
|
|
$167
|
|
|
$152
|
|
|||
The fair value of MSRs is estimated using a valuation model that calculates the present value of estimated future net servicing cash flows, taking into consideration actual and expected mortgage loan prepayment rates, discount rates, contractual servicing fee income, servicing costs, default rates, ancillary income, and other economic factors, which are determined based on current market conditions. The valuation model uses a static discounted cash flow methodology incorporating current market interest rates. A static model does not attempt to forecast or predict the future direction of interest rates; rather it estimates the amount and timing of future servicing cash flows using current market interest rates. The current mortgage interest rate influences the expected prepayment rate and therefore, the length of the cash flows associated with the servicing asset, while the discount rate determines the present value of those cash flows. Expected mortgage loan prepayment assumptions are obtained using the QRM
95
CITIZENS FINANCIAL GROUP, INC.
NOTES TO CONSOLIDATED FINANCIAL STATEMENTS (UNAUDITED)
Multi Component prepayment model. The Company periodically obtains third-party valuations of its MSRs to assess the reasonableness of the fair value calculated by the valuation model.
The key economic assumptions used to estimate the value of MSRs are presented in the following table:
|
September 30, 2017
|
December 31, 2016
|
||||||
|
Weighted Average
|
Weighted Average
|
||||||
|
(dollars in millions)
|
Range
|
Range
|
|||||
|
Fair value
|
$183
|
Min
|
Max
|
$182
|
Min
|
Max
|
|
|
Weighted average life (in years)
|
5.7
|
2.4
|
7.0
|
5.7
|
2.6
|
7.3
|
|
|
Weighted average constant prepayment rate
|
10.8%
|
9.2%
|
21.2%
|
10.8%
|
8.8%
|
22.3%
|
|
|
Weighted average discount rate
|
9.9%
|
9.1%
|
12.1%
|
9.7%
|
9.1%
|
12.1%
|
|
The key economic assumptions used in estimating the fair value of MSRs capitalized during the period are presented below:
|
Three Months Ended September 30,
|
Nine Months Ended September 30,
|
||||||
|
2017
|
2016
|
2017
|
2016
|
||||
|
Weighted average life (in years)
|
6.5
|
5.7
|
6.6
|
5.9
|
|||
|
Weighted average constant prepayment rate
|
10.8%
|
12.3%
|
10.2%
|
11.7%
|
|||
|
Weighted average discount rate
|
9.9%
|
9.8%
|
9.9%
|
9.8%
|
|||
The sensitivity analysis below presents the impact to current fair value of an immediate 50 basis point and 100 basis point adverse change in the key economic assumptions and presents the decline in fair value that would occur if the adverse change were realized. These sensitivities are hypothetical, with the effect of a variation in a particular assumption on the fair value of the mortgage servicing rights calculated independently without changing any other assumption. In reality, changes in one factor may result in changes in another (e.g., changes in interest rates, which drive changes in prepayment rates, could result in changes in the discount rates), which may amplify or counteract the sensitivities. The primary risk inherent in the Company’s MSRs is an increase in prepayments of the underlying mortgage loans serviced, which is dependent upon market movements of interest rates.
|
(in millions)
|
September 30, 2017
|
December 31, 2016
|
|||||
|
Prepayment rate:
|
|||||||
|
Decline in fair value from a 50 basis point decrease in interest rates
|
|
$9
|
|
|
$9
|
|
|
|
Decline in fair value from a 100 basis point decrease in interest rates
|
18
|
|
25
|
|
|||
|
Weighted average discount rate:
|
|||||||
|
Decline in fair value from a 50 basis point increase in weighted average discount rate
|
|
$3
|
|
|
$3
|
|
|
|
Decline in fair value from a 100 basis point increase in weighted average discount rate
|
6
|
|
6
|
|
|||
A summary of the Company’s short-term borrowed funds is presented below:
|
(in millions)
|
September 30, 2017
|
December 31, 2016
|
|||||
|
Federal funds purchased
|
|
$—
|
|
|
$533
|
|
|
|
Securities sold under agreements to repurchase
|
453
|
|
615
|
|
|||
|
Other short-term borrowed funds
|
1,505
|
|
3,211
|
|
|||
|
Total short-term borrowed funds
|
|
$1,958
|
|
|
$4,359
|
|
|
96
CITIZENS FINANCIAL GROUP, INC.
NOTES TO CONSOLIDATED FINANCIAL STATEMENTS (UNAUDITED)
Key data related to short-term borrowed funds is presented in the following table:
|
As of and for the
Three Months Ended September 30,
|
As of and for the
Nine Months Ended September 30,
|
As of and for the
Year Ended December 31,
|
|||||||||||||||||
|
(dollars in millions)
|
2017
|
|
2016
|
|
2017
|
|
2016
|
|
2016
|
||||||||||
|
Weighted-average interest rate at period-end:
(1)
|
|||||||||||||||||||
|
Federal funds purchased and securities sold under agreements to repurchase
|
—
|
%
|
0.03
|
%
|
—
|
%
|
0.03
|
%
|
0.26
|
%
|
|||||||||
|
Other short-term borrowed funds (primarily short-term FHLB advances)
|
1.47
|
|
0.63
|
|
1.47
|
|
0.63
|
|
0.94
|
|
|||||||||
|
Maximum amount outstanding at month-end during the period:
|
|||||||||||||||||||
|
Federal funds purchased and securities sold under agreements to repurchase
(2)
|
|
$724
|
|
|
$1,032
|
|
|
$1,174
|
|
|
$1,274
|
|
|
$1,522
|
|
||||
|
Other short-term borrowed funds (primarily short-term FHLB advances)
|
1,755
|
|
2,515
|
|
3,508
|
|
4,764
|
|
5,461
|
|
|||||||||
|
Average amount outstanding during the period:
|
|||||||||||||||||||
|
Federal funds purchased and securities sold under agreements to repurchase
(2)
|
|
$733
|
|
|
$910
|
|
|
$807
|
|
|
$922
|
|
|
$947
|
|
||||
|
Other short-term borrowed funds (primarily short-term FHLB advances)
|
1,624
|
|
2,564
|
|
2,283
|
|
3,133
|
|
3,207
|
|
|||||||||
|
Weighted-average interest rate during the period:
(1)
|
|||||||||||||||||||
|
Federal funds purchased and securities sold under agreements to repurchase
|
0.47
|
%
|
0.10
|
%
|
0.34
|
%
|
0.09
|
%
|
0.09
|
%
|
|||||||||
|
Other short-term borrowed funds (primarily short-term FHLB advances)
|
1.48
|
|
0.63
|
|
1.22
|
|
0.62
|
|
0.64
|
|
|||||||||
(1)
Rates exclude certain hedging costs.
(2)
Balances are net of certain short-term receivables associated with reverse repurchase agreements, as applicable.
97
CITIZENS FINANCIAL GROUP, INC.
NOTES TO CONSOLIDATED FINANCIAL STATEMENTS (UNAUDITED)
A summary of the Company’s long-term borrowed funds is presented below:
|
(in millions)
|
September 30, 2017
|
December 31, 2016
|
|||||
|
Parent Company:
|
|||||||
|
4.150% fixed-rate subordinated debt, due 2022
|
|
$348
|
|
|
$347
|
|
|
|
5.158% fixed-to-floating rate subordinated debt, due 2023, converting to floating at
3-month LIBOR + 3.56% and callable beginning June 2018 |
333
|
|
333
|
|
|||
|
3.750% fixed-rate subordinated debt, due 2024
|
250
|
|
250
|
|
|||
|
4.023% fixed-rate subordinated debt, due 2024
|
42
|
|
42
|
|
|||
|
4.350% fixed-rate subordinated debt, due 2025
|
249
|
|
249
|
|
|||
|
4.300% fixed-rate subordinated debt, due 2025
|
749
|
|
749
|
|
|||
|
2.375% fixed-rate senior unsecured debt, due 2021
|
348
|
|
348
|
|
|||
|
Banking Subsidiaries:
|
|||||||
|
2.300% senior unsecured notes, due 2018
(1)
|
746
|
|
745
|
|
|||
|
2.450% senior unsecured notes, due 2019
(1)
|
747
|
|
747
|
|
|||
|
2.500% senior unsecured notes, due 2019
(1)
|
743
|
|
741
|
|
|||
|
2.250% senior unsecured notes, due 2020
(1)
|
697
|
|
—
|
|
|||
|
Floating-rate senior unsecured notes, due 2020
(1)
|
299
|
|
—
|
|
|||
|
Floating-rate senior unsecured notes, due 2020
(1)
|
249
|
|
—
|
|
|||
|
2.200% senior unsecured notes, due 2020
(1)
|
498
|
|
—
|
|
|||
|
2.550% senior unsecured notes, due 2021
(1)
|
973
|
|
965
|
|
|||
|
Floating-rate senior unsecured notes, due 2022
(1)
|
249
|
|
—
|
|
|||
|
2.650% senior unsecured notes, due 2022
(1)
|
496
|
|
—
|
|
|||
|
Federal Home Loan advances due through 2033
|
5,361
|
|
7,264
|
|
|||
|
Other
|
23
|
|
10
|
|
|||
|
Total long-term borrowed funds
|
|
$13,400
|
|
|
$12,790
|
|
|
(1)
Issued under CBNA’s Global Bank Note Program.
The Parent Company’s long-term borrowed funds as of
September 30, 2017
and
December 31, 2016
included principal balances of
$2.3 billion
and unamortized deferred issuance costs and/or discounts of
($6) million
and
($7) million
, respectively. The banking subsidiaries’ long-term borrowed funds as of
September 30, 2017
and
December 31, 2016
include principal balances of
$11.1 billion
and
$10.5 billion
, respectively, with unamortized deferred issuance costs and/or discounts of
($17) million
and
($12) million
, respectively, and hedging basis adjustments of
($36) million
and
($40) million
, respectively. See Note 10 “Derivatives” for further information on the Company’s hedging of certain long-term borrowed funds.
Advances, lines of credit, and letters of credit from the FHLB are collateralized by pledged mortgages and pledged securities at least sufficient to satisfy the collateral maintenance level established by the FHLB. The utilized borrowing capacity for FHLB advances and letters of credit was
$10.4 billion
and
$13.4 billion
at
September 30, 2017
and
December 31, 2016
, respectively. The Company’s available FHLB borrowing capacity was
$6.1 billion
and
$2.8 billion
at
September 30, 2017
and
December 31, 2016
, respectively. The Company can also borrow from the FRB discount window to meet short-term liquidity requirements. Collateral, such as investment securities and loans, is pledged to provide borrowing capacity at the FRB. At
September 30, 2017
, the Company’s unused secured borrowing capacity was approximately
$39.1 billion
, which includes unencumbered securities, FHLB borrowing capacity, and FRB discount window capacity.
98
CITIZENS FINANCIAL GROUP, INC.
NOTES TO CONSOLIDATED FINANCIAL STATEMENTS (UNAUDITED)
A summary of maturities for the Company’s long-term borrowed funds at
September 30, 2017
is presented below:
|
(in millions)
|
Parent Company
|
Banking Subsidiaries
|
Consolidated
|
|
|||||
|
Year
|
|||||||||
|
2018
|
|
$—
|
|
|
$4,097
|
|
|
$4,097
|
|
|
2019
|
—
|
|
3,491
|
|
3,491
|
|
|||
|
2020
|
—
|
|
1,760
|
|
1,760
|
|
|||
|
2021
|
348
|
|
976
|
|
1,324
|
|
|||
|
2022
|
348
|
|
750
|
|
1,098
|
|
|||
|
2023 and thereafter
|
1,623
|
|
7
|
|
1,630
|
|
|||
|
Total
|
|
$2,319
|
|
|
$11,081
|
|
|
$13,400
|
|
Preferred Stock
The Company had
100,000,000
shares authorized and
250,000
shares outstanding of
$25.00
par value undesignated preferred stock as of
September 30, 2017
and
December 31, 2016
, respectively. For further detail regarding the terms and conditions of the Company’s preferred stock see Note 13 “Stockholders’ Equity” to the Company’s audited Financial Statements in the Annual Report on Form 10-K for the year ended December 31, 2016.
Treasury Stock
During the nine months ended
September 30, 2017
, the Company repurchased
$485 million
, or
13,588,304
shares, of its outstanding common stock. Th
e repurchased shares are held in treasury stock.
Income Tax Expense
Income tax expense was
$165 million
and
$130 million
for the
three months ended
September 30, 2017
and
2016
, respectively, resulting in effective tax rates of
32.2%
and
30.5%
, respectively. Income tax expense was
$423 million
and
$357 million
for the
nine months ended
September 30, 2017
and
2016
, respectively, resulting in effective tax rates of
30.0%
and
31.9%
, respectively.
For the
nine months ended
September 30, 2017
, the effective tax rate compared favorably to the statutory rate of
35%
primarily as a result of the impact of the settlement of certain state tax matters and permanent benefits from tax credits and tax-exempt income. For the
nine months ended
September 30, 2016
, the effective tax rate compared favorably to the statutory rate of
35%
primarily as a result of permanent benefits from tax credits and tax-exempt income.
Deferred Tax Liability
At
September 30, 2017
, the Company reported a net deferred tax liability of
$744 million
, compared to
$714 million
as of
December 31, 2016
. The increase in the net deferred tax liability is primarily attributable to the tax effect of net unrealized gains on securities and derivatives arising during the period, partially offset by the tax effect of differences in the timing of deductions and income items for financial statement purposes versus taxable income purposes.
Unrecognized Tax Benefits
As a result of the settlement of certain state tax matters, the total amount of unrecognized tax benefits was reduced from
$42 million
as of December 31, 2016, to
$7 million
as of
September 30, 2017
.
99
CITIZENS FINANCIAL GROUP, INC.
NOTES TO CONSOLIDATED FINANCIAL STATEMENTS (UNAUDITED)
In the normal course of business, the Company enters into a variety of derivative transactions in order to meet the financing needs of its customers and to reduce its own exposure to fluctuations in interest rates and foreign currency exchange rates. The Company does not use derivatives for speculative purposes.
The Company’s derivative instruments are recognized on the Consolidated Balance Sheets at fair value. Information regarding the valuation methodology and inputs used to estimate the fair value of the Company’s derivative instruments is described in Note 12 “Fair Value Measurements.”
At
September 30, 2017
, the overall derivative asset value
decreased
$31 million
and the liability balance
decreased
by
$417 million
from December 31, 2016. These decreases were primarily due to a change in the presentation of variation margin payments in the Consolidated Balance Sheet in 2017. Effective January 3, 2017, variation margin payments made on certain centrally cleared derivative contracts are legally classified as settlement of those derivatives (rather than the posting of collateral). As a result of this change, the Company modified its balance sheet presentation of certain interest rate swaps in 2017, such that the fair value of the swaps and the associated variation margin balances are reported as a single unit of account in derivative assets and/or derivative liabilities. At December 31, 2016, these variation margin balances were characterized as collateral. Variation margin balances legally characterized as collateral are reported in interest-bearing cash and due from banks on the Consolidated Balance Sheets.
The following table presents derivative instruments included on the Consolidated Balance Sheets in derivative assets and derivative liabilities:
|
September 30, 2017
|
December 31, 2016
|
||||||||||||||||||
|
(in millions)
|
Notional Amount
(1)
|
Derivative Assets
(2)
|
Derivative Liabilities
(2)
|
Notional Amount
(1)
|
Derivative Assets
|
Derivative Liabilities
|
|||||||||||||
|
Derivatives designated as hedging instruments:
|
|||||||||||||||||||
|
Interest rate contracts
|
|
$17,300
|
|
|
$6
|
|
|
$—
|
|
|
$13,350
|
|
|
$52
|
|
|
$193
|
|
|
|
Derivatives not designated as hedging instruments:
|
|||||||||||||||||||
|
Interest rate contracts
|
69,436
|
|
502
|
|
338
|
|
54,656
|
|
557
|
|
452
|
|
|||||||
|
Foreign exchange contracts
|
10,147
|
|
146
|
|
142
|
|
8,039
|
|
134
|
|
126
|
|
|||||||
|
Other contracts
|
1,256
|
|
10
|
|
5
|
|
1,498
|
|
16
|
|
7
|
|
|||||||
|
Total derivatives not designated as hedging instruments
|
658
|
|
485
|
|
707
|
|
585
|
|
|||||||||||
|
Gross derivative fair values
|
664
|
|
485
|
|
759
|
|
778
|
|
|||||||||||
|
Less: Gross amounts offset in the Consolidated Balance Sheets
(3)
|
(65
|
)
|
(65
|
)
|
(106
|
)
|
(106
|
)
|
|||||||||||
|
Less: Cash collateral applied
(3)
|
(3
|
)
|
(178
|
)
|
(26
|
)
|
(13
|
)
|
|||||||||||
|
Total net derivative fair values presented in the Consolidated Balance Sheets
|
|
$596
|
|
|
$242
|
|
|
$627
|
|
|
$659
|
|
|||||||
(1)
The notional or contractual amount of interest rate derivatives and foreign exchange contracts is the amount upon which interest and other payments under the contract are based. For interest rate contracts, the notional amount is typically not exchanged. Therefore, notional amounts should not be taken as the measure of credit or market risk, as they do not measure the true economic risk of these contracts.
(2)
Amounts reflect changes in the treatment of variation margin on certain centrally cleared derivatives.
(3)
Amounts represent the impact of legally enforceable master netting agreements that allow the Company to settle positive and negative positions.
The Company’s derivative transactions are internally divided into three sub-groups: institutional, customer and residential loan.
Institutional derivatives
The institutional derivatives portfolio primarily consists of interest rate swap agreements that are used to hedge the interest rate risk associated with the Company’s loans and financing liabilities (i.e., borrowed funds, deposits, etc.). The goal of the Company’s interest rate hedging activity is to manage interest rate sensitivity so that movements in interest rates do not significantly adversely affect net interest income.
The Company enters into certain interest rate swap agreements to hedge the risk associated with floating rate loans. By entering into pay-floating/receive-fixed interest rate swaps, the Company is able to minimize the variability in the cash flows of these assets due to changes in interest rates. The Company has outstanding interest rate swap agreements designed to hedge a portion of the Company’s borrowed funds and deposit liabilities. By
100
CITIZENS FINANCIAL GROUP, INC.
NOTES TO CONSOLIDATED FINANCIAL STATEMENTS (UNAUDITED)
entering into a pay-fixed/receive-floating interest rate swap, a portion of these liabilities has been effectively converted to a fixed-rate liability for the term of the interest rate swap agreement.
The Company also uses receive-fixed/pay-floating interest rate swaps to manage the interest rate exposure on its medium-term borrowings.
Customer derivatives
The customer derivatives portfolio consists of interest rate swap agreements and option contracts that are transacted to meet the financing needs of the Company’s customers. Swap agreements and interest rate option agreements are transacted to effectively minimize the Company’s market risk associated with the customer derivative products. The customer derivatives portfolio also includes foreign exchange contracts that are entered into on behalf of customers for the purpose of hedging exposure related to cash orders and loans and deposits denominated in foreign currencies. The primary risks associated with these transactions arise from exposure to changes in foreign currency exchange rates and the ability of the counterparties to meet the terms of the contract. To manage this market risk, the Company enters into offsetting foreign exchange contracts.
Residential loan derivatives
The Company enters into residential loan commitments that allow residential mortgage customers to lock in the interest rate on a residential mortgage while the loan undergoes the underwriting process. The Company also uses forward sales contracts to protect the value of residential mortgage loans and loan commitments that are being underwritten for future sale to investors in the secondary market.
Derivatives designated as hedging instruments
The Company’s institutional derivatives portfolio qualifies for hedge accounting treatment. This includes interest rate swaps that are designated in highly effective fair value and cash flow hedging relationships. The Company formally documents at inception all hedging relationships, as well as risk management objectives and strategies for undertaking various accounting hedges. Additionally, the Company uses dollar offset or regression analysis at the hedge’s inception, and monthly thereafter, to assess whether the derivatives are expected to be, or have been, highly effective in offsetting changes in the hedged item’s expected cash flows. The Company discontinues hedge accounting treatment when it is determined that a derivative is not expected to be, or has ceased to be, effective as a hedge and then reflects changes in fair value in earnings after termination of the hedge relationship.
The Company has certain derivative transactions which are designated as fair value or cash flow hedges, described as follows:
Fair value hedges
The Company has entered into interest rate swap agreements to manage the interest rate exposure on its medium-term borrowings. The change in value of fair value hedges, to the extent that the hedging relationship is effective, is recorded through earnings and offset against the change in the fair value of the hedged item.
101
CITIZENS FINANCIAL GROUP, INC.
NOTES TO CONSOLIDATED FINANCIAL STATEMENTS (UNAUDITED)
The following table presents the effect of fair value hedges on other income:
|
Amounts Recognized in Other Income for the
|
|||||||||||||||||||
|
Three Months Ended September 30, 2017
|
Three Months Ended September 30, 2016
|
||||||||||||||||||
|
(in millions)
|
Derivative
|
Hedged Item
|
Hedge Ineffectiveness
|
Derivative
|
Hedged Item
|
Hedge Ineffectiveness
|
|||||||||||||
|
Hedges of interest rate risk on borrowings using interest rate swaps
|
|
($5
|
)
|
|
$4
|
|
|
($1
|
)
|
|
($27
|
)
|
|
$25
|
|
|
($2
|
)
|
|
|
Amounts Recognized in Other Income for the
|
|||||||||||||||||||
|
Nine Months Ended September 30, 2017
|
Nine Months Ended September 30, 2016
|
||||||||||||||||||
|
(in millions)
|
Derivative
|
Hedged Item
|
Hedge Ineffectiveness
|
Derivative
|
Hedged Item
|
Hedge Ineffectiveness
|
|||||||||||||
|
Hedges of interest rate risk on borrowings using interest rate swaps
|
|
$5
|
|
|
($5
|
)
|
|
$—
|
|
|
$57
|
|
|
($58
|
)
|
|
($1
|
)
|
|
Cash flow hedges
The Company has outstanding interest rate swap agreements designed to hedge a portion of the Company’s floating rate assets, and financing liabilities (including its borrowed funds). All of these swaps have been deemed as highly effective cash flow hedges. The effective portion of the hedging gains and losses associated with these hedges are recorded in OCI; the ineffective portion of the hedging gains and losses is recorded in earnings (other income). Hedging gains and losses on derivative contracts reclassified from OCI to current period earnings are included in the line item in the accompanying Consolidated Statements of Operations in which the hedged item is recorded and in the same period that the hedged item affects earnings. During the next 12 months, there are
$7 million
in pre-tax net losses on derivative instruments included in OCI expected to be reclassified to net interest income in the Consolidated Statements of Operations.
Hedging gains and losses associated with the Company’s cash flow hedges are immediately reclassified from OCI to current period earnings (other income) if it becomes probable that the hedged forecasted transactions will not occur during the originally specified time period.
The following table presents the effect of cash flow hedges on net income and stockholders' equity:
|
Amounts Recognized for the
|
|||||||||||||||
|
Three Months Ended September 30,
|
Nine Months Ended September 30,
|
||||||||||||||
|
(in millions)
|
2017
|
|
2016
|
|
2017
|
|
2016
|
|
|||||||
|
Effective portion of (loss) gain recognized in OCI
(1)
|
|
($2
|
)
|
|
($1
|
)
|
|
$35
|
|
|
$74
|
|
|||
|
Amounts reclassified from OCI to interest income
(2)
|
3
|
|
23
|
|
23
|
|
66
|
|
|||||||
|
Amounts reclassified from OCI to interest expense
(2)
|
1
|
|
(8
|
)
|
(2
|
)
|
(24
|
)
|
|||||||
|
Amounts reclassified from OCI to other income
(3)
|
—
|
|
(5
|
)
|
—
|
|
(5
|
)
|
|||||||
(1)
The cumulative effective gains and losses on the Company’s cash flow hedging activities are included on the accumulated other comprehensive loss line item on the Consolidated Balance Sheets.
(2)
This amount includes both (a) the amortization of effective gains and losses associated with the Company’s terminated cash flow hedges and (b) the current reporting period’s interest settlements realized on the Company’s active cash flow hedges. Both (a) and (b) were previously included on the accumulated other comprehensive loss line item on the Consolidated Balance Sheets and were subsequently recorded as adjustments to the interest income or expense of the underlying hedged item.
(3)
This includes gains and losses attributable to previously hedged cash flows where the likelihood of occurrence of those cash flows is no longer probable.
Derivatives not designated as hedging instruments
Economic hedges
The Company’s customer derivatives are recorded on the Consolidated Balance Sheets at fair value. These include interest rate and foreign exchange derivative contracts that are designed to meet the hedging and financing needs of the Company’s customers. Mark-to-market adjustments to the fair value of these contracts are included in foreign exchange and interest rate products on the Consolidated Statement of Operations. The mark-to-market gains and losses associated with the customer derivatives are mitigated by the mark-to-market gains and losses on the offsetting interest rate and foreign exchange derivative contracts transacted.
102
CITIZENS FINANCIAL GROUP, INC.
NOTES TO CONSOLIDATED FINANCIAL STATEMENTS (UNAUDITED)
The Company’s residential loan derivatives (including residential loan commitments and forward sales contracts) are recorded on the Consolidated Balance Sheets at fair value. Mark-to-market adjustments to the fair value of residential loan commitments and forward sale contracts are included in noninterest income under mortgage banking fees.
The following table presents the effect of customer derivatives and economic hedges on noninterest income:
|
Amounts Recognized in Noninterest Income for the
|
|||||||||||||||
|
Three Months Ended September 30,
|
Nine Months Ended September 30,
|
||||||||||||||
|
(in millions)
|
2017
|
|
2016
|
|
2017
|
|
2016
|
|
|||||||
|
Customer derivative contracts
|
|||||||||||||||
|
Customer interest rate contracts
(1)
|
|
$12
|
|
|
($32
|
)
|
|
$92
|
|
|
$63
|
|
|||
|
Customer foreign exchange contracts
(1)
|
61
|
|
17
|
|
157
|
|
45
|
|
|||||||
|
Residential loan commitments
(2)
|
—
|
|
1
|
|
3
|
|
8
|
|
|||||||
|
Economic hedges
|
|||||||||||||||
|
Offsetting derivatives transactions to hedge interest rate risk on customer interest rate contracts
(1)
|
(2
|
)
|
45
|
|
(58
|
)
|
(31
|
)
|
|||||||
|
Offsetting derivatives transactions to hedge foreign exchange risk on customer foreign exchange contracts
(1)
|
(55
|
)
|
(19
|
)
|
(140
|
)
|
(46
|
)
|
|||||||
|
Forward sale contracts
(2)
|
(1
|
)
|
4
|
|
(7
|
)
|
(6
|
)
|
|||||||
|
Total
|
|
$15
|
|
|
$16
|
|
|
$47
|
|
|
$33
|
|
|||
(1)
Reported in foreign exchange and interest rate products on the Consolidated Statements of Operations.
(2)
Reported in mortgage banking fees on the Consolidated Statements of Operations.
A summary of outstanding off-balance sheet arrangements is presented below:
|
(in millions)
|
September 30, 2017
|
December 31, 2016
|
|||||
|
Undrawn commitments to extend credit
|
|
$61,934
|
|
|
$60,872
|
|
|
|
Financial standby letters of credit
|
2,080
|
|
1,892
|
|
|||
|
Performance letters of credit
|
42
|
|
40
|
|
|||
|
Commercial letters of credit
|
68
|
|
43
|
|
|||
|
Marketing rights
|
41
|
|
44
|
|
|||
|
Risk participation agreements
|
20
|
|
19
|
|
|||
|
Residential mortgage loans sold with recourse
|
7
|
|
8
|
|
|||
|
Total
|
|
$64,192
|
|
|
$62,918
|
|
|
Commitments to Extend Credit
Commitments to extend credit are agreements to lend to customers in accordance with conditions contractually agreed upon in advance. Generally, the commitments have fixed expiration dates or termination clauses and may require payment of a fee. Since many of these commitments are expected to expire without being drawn upon, the contract amounts are not necessarily indicative of future cash requirements.
Letters of Credit
Standby letters of credit, both financial and performance, are issued by the Company for its customers. They are used as conditional guarantees of payment to a third party in the event the customer either fails to make specific payments (financial) or fails to complete a specific project (performance). Commercial letters of credit are used to facilitate the import of goods. The commercial letter of credit is used as the method of payment to the Company’s customers’ suppliers. The Company’s exposure to credit loss in the event of counterparty nonperformance in connection with the above instruments is represented by the contractual amount of those instruments, net of the value of collateral held. Standby letters of credit and commercial letters of credit are issued for terms of up to
ten years
and
one year
, respectively.
103
CITIZENS FINANCIAL GROUP, INC.
NOTES TO CONSOLIDATED FINANCIAL STATEMENTS (UNAUDITED)
Generally, letters of credit are collateralized by cash, accounts receivable, inventory or investment securities. Credit risk associated with letters of credit is considered in determining the appropriate amounts of reserves for unfunded commitments.
The Company recognizes a liability on the Consolidated Balance Sheets representing its obligation to stand ready to perform over the term of the standby letters of credit in the event that the specified triggering events occur. The liability for these guarantees was
$3 million
at both
September 30, 2017
and
December 31, 2016
.
Marketing Rights
During 2003, the Company entered into a
25
-year agreement to acquire the naming and marketing rights of a baseball stadium in Pennsylvania. The Company paid
$3 million
for both the
nine months ended
September 30, 2017
and for the year ended
December 31, 2016
; and as of September 30, 2017 is obligated to pay
$41 million
over the remainder of the contract.
Risk Participation Agreements
RPAs are guarantees issued by the Company to other parties for a fee, whereby the Company agrees to participate in the credit risk of a derivative customer of the other party. Under the terms of these agreements, the “participating bank” receives a fee from the “lead bank” in exchange for the guarantee of reimbursement if the customer defaults on an interest rate swap. The interest rate swap is transacted such that any and all exchanges of interest payments (favorable and unfavorable) are made between the lead bank and the customer. In the event that an early termination of the swap occurs and the customer is unable to make a required close out payment, the participating bank assumes that obligation and is required to make this payment.
RPAs where the Company acts as the lead bank are referred to as “participations-out,” in reference to the credit risk associated with the customer derivatives being transferred out of the Company. Participations-out generally occur concurrently with the sale of new customer derivatives. RPAs where the Company acts as the participating bank are referred to as “participations-in,” in reference to the credit risk associated with the counterparty’s derivatives being assumed by the Company. The Company’s maximum credit exposure is based on its proportionate share of the settlement amount of the referenced interest rate swap. Settlement amounts are generally calculated based on the fair value of the swap plus outstanding accrued interest receivables from the customer. The Company’s estimate of the credit exposure associated with its risk participations-in was
$20 million
and
$19 million
at
September 30, 2017
and
December 31, 2016
, respectively. The current amount of credit exposure is spread out over
96
counterparties. RPAs generally have terms ranging from
one
to
five
years; however, certain outstanding agreements have terms as long as
nine years
.
Residential Loans Sold with Recourse
The Company is an originator and servicer of residential mortgages and routinely sells such mortgage loans in the secondary market and to government-sponsored entities. In the context of such sales, the Company makes certain representations and warranties regarding the characteristics of the underlying loans and, as a result, may be contractually required to repurchase such loans or indemnify certain parties against losses for certain breaches of those representations and warranties.
Other Commitments
In first quarter 2017, the Company entered into an agreement to purchase education loans on a quarterly basis beginning with the first quarter 2017 and ending with the fourth quarter 2017. The total minimum and maximum amount of the aggregate purchase principal balance of loans under the terms of the agreement are
$750 million
and
$1.5 billion
, respectively, and the remaining maximum purchase commitment is
$375 million
. The agreement may be extended by written agreement of the parties for an additional four quarters. The agreement will terminate immediately if at any time during its term the aggregate purchase principal balance of loans equals the maximum amount. The Company may also terminate the agreement at will with payment of a termination fee equal to the product of
$1 million
times the number of quarters remaining under the agreement.
The Company’s commercial loan trading desk provides ongoing secondary market support and liquidity to its clients. Unsettled loan trades (i.e., loan purchase contracts) represent firm commitments to purchase loans from a third party at an agreed-upon price. Principal amounts associated with unsettled commercial loan trades are off-balance sheet commitments until delivery of the loans has taken place. Fair value adjustments associated with each unsettled loan trade are recognized on the Consolidated Balance Sheets and classified within other assets or other liabilities, depending on whether the fair value of the unsettled trade represents an unrealized gain or unrealized loss. The principal balances of unsettled commercial loan trade purchases and sales were
$241 million
and
$299
104
CITIZENS FINANCIAL GROUP, INC.
NOTES TO CONSOLIDATED FINANCIAL STATEMENTS (UNAUDITED)
million
, respectively, at
September 30, 2017
and $
127 million
and
$177 million
, respectively, at
December 31, 2016
. Settled loans purchased by the trading desk are classified as loans held for sale, at fair value on the Consolidated Balance Sheets. Refer to Note 12 “Fair Value Measurements” for further information.
Contingencies
The Company operates in a legal and regulatory environment that exposes it to potentially significant risks. A certain amount of litigation ordinarily results from the nature of the Company’s banking and other businesses. The Company is a party to legal proceedings, including class actions. The Company is also the subject of investigations, reviews, subpoenas, and regulatory matters arising out of its normal business operations, which, in some instances, relate to concerns about fair lending, unfair and/or deceptive practices, mortgage-related issues, and mis-selling of certain products. In addition, the Company engages in discussions with relevant governmental and regulatory authorities on a regular and ongoing basis regarding various issues, and any issues discussed or identified may result in investigatory or other action being taken. Litigation and regulatory matters may result in settlements, damages, fines, penalties, public or private censure, increased costs, required remediation, restrictions on business activities, or other impacts on the Company.
In these disputes and proceedings, the Company contests liability and the amount of damages as appropriate. Given their complex nature, and based on the Company's experience, it may be years before some of these matters are finally resolved. Moreover, before liability can be reasonably estimated for a claim, numerous legal and factual issues may need to be examined, including through potentially lengthy discovery and determination of important factual matters, and by addressing novel or unsettled legal issues relevant to the proceedings in question.
The Company cannot predict with certainty if, how, or when such claims will be resolved or what the eventual settlement, fine, penalty or other relief, if any, may be, particularly for claims that are at an early stage in their development or where claimants seek substantial or indeterminate damages. The Company recognizes a provision for a claim when, in the opinion of management after seeking legal advice, it is probable that a liability exists and the amount of loss can be reasonably estimated. In many proceedings, however, it is not possible to determine whether any loss is probable or to estimate the amount of any loss. In each of the matters described below, the Company is unable to estimate the liability in excess of any provision accrued, if any, that might arise or its effects on the Company’s Consolidated Statements of Operations or Consolidated Statements of Cash Flows in any particular period.
Set out below is a description of significant legal matters involving the Company and its banking subsidiaries. Based on information currently available, the advice of legal counsel and other advisers, and established reserves, management believes that the aggregate liabilities, if any, potentially arising from these proceedings will not have a materially adverse effect on the Company’s unaudited interim Consolidated Financial Statements.
Consumer Products Matters
The activities of the Company’s banking subsidiaries are subject to extensive laws and regulations concerning unfair or deceptive acts or practices in connection with customer products. Certain of the banking subsidiaries’ past practices have not met applicable standards, and they have implemented and are continuing to implement changes to improve and bring their practices in accordance with regulatory guidance. The Company and its banking subsidiaries have made substantial progress towards full resolution of the legacy regulatory enforcement matters set forth below.
As previously reported, the Company and its banking subsidiaries had entered into consent orders in 2015 with certain of their regulators in connection with past deposit reconciliation and billing practices, under which the applicable regulators have provided non-objections to, among other things, restitution plans for affected customers. All financial penalties associated with these regulatory enforcement matters have been paid, and substantially all remediation related to such legacy matters was resolved as of December 31, 2016.
Since the Company’s last quarterly report, the regulators notified the Company and its banking subsidiaries that they had terminated the consent orders related to past deposit reconciliation practices after determining that the Company and its banking subsidiaries had satisfied the required actions under the consent orders.
As discussed in Note 1 “Significant Accounting Policies,” to the Company’s audited Financial Statements in the Annual Report on Form 10-K for the year ended December 31, 2016, the Company measures or monitors many of its assets and liabilities on a fair value basis. Fair value is used on a recurring basis for assets and liabilities for which fair value is the required or elected measurement basis of accounting. Additionally, fair value is used on a nonrecurring basis to evaluate assets for impairment or for disclosure purposes. Nonrecurring fair value adjustments
105
CITIZENS FINANCIAL GROUP, INC.
NOTES TO CONSOLIDATED FINANCIAL STATEMENTS (UNAUDITED)
typically involve the application of lower of cost or market accounting or write-downs of individual assets. The Company also applies the fair value measurement guidance to determine amounts reported for certain disclosures in this Note for assets and liabilities not required to be reported at fair value in the financial statements.
The Company elected to account for residential mortgage loans held for sale and certain commercial and commercial real estate loans held for sale at fair value. Applying fair value accounting to the residential mortgage loans held for sale better aligns the reported results of the economic changes in the value of these loans and their related hedge instruments. Certain commercial and commercial real estate held for sale loans are managed by a commercial secondary loan desk that provides liquidity to banks, finance companies and institutional investors. Applying fair value accounting to this portfolio is appropriate because the Company holds these loans with the intent to sell within short term periods.
Fair Value Option
Residential Mortgage Loans Held for Sale
The fair value of residential mortgage loans held for sale is derived from observable mortgage security prices and includes adjustments for loan servicing value, agency guarantee fees, and other loan level attributes which are mostly observable in the marketplace. Credit risk does not significantly impact the valuation since these loans are sold shortly after origination. Therefore, the Company classifies the residential mortgage loans held for sale in Level 2 of the fair value hierarchy.
The election of the fair value option for financial assets and financial liabilities is optional and irrevocable. The loans accounted for under the fair value option are initially measured at fair value (i.e., acquisition cost) when the financial asset is acquired. Subsequent changes in fair value are recognized in mortgage banking fees on the Consolidated Statements of Operations. The Company recognized changes in fair value in mortgage banking income of
($1) million
and
$1 million
for the three months ended
September 30, 2017
and 2016, respectively. The Company recognized changes in fair value in mortgage banking income of
$9 million
and
$13 million
for the nine months ended
September 30, 2017
and 2016, respectively.
Interest income on residential mortgage loans held for sale is calculated based on the contractual interest rate of the loan and is recorded in interest income.
Commercial and Commercial Real Estate Loans Held for Sale
The fair value of commercial and commercial real estate loans held for sale is estimated using observable prices of similar loans that transact in the marketplace. In addition, the Company uses external pricing services that provide estimates of fair values based on quotes from various dealers transacting in the market, sector curves or benchmarking techniques. Therefore, the Company classifies the commercial and commercial real estate loans managed by the commercial secondary loan desk in Level 2 of the fair value hierarchy given the observable market inputs.
There were
no
loans in this portfolio that were 90 days or more past due or nonaccruing as of
September 30, 2017
and
December 31, 2016
. The loans accounted for under the fair value option are initially measured at fair value when the financial asset is recognized. Subsequent changes in fair value are recognized in other noninterest income on the Consolidated Statements of Operations. Since all loans in the Company’s commercial trading portfolio consist of floating rate obligations, all changes in fair value are due to changes in credit risk. Such credit-related fair value changes may include observed changes in overall credit spreads and/or changes to the creditworthiness of an individual borrower. Unsettled trades within the commercial trading portfolio are not recognized on the Consolidated Balance Sheets and represent off-balance sheet commitments. Refer to Note 11 “Commitments and Contingencies” for further information.
Interest income on commercial and commercial real estate loans held for sale is calculated based on the contractual interest rate of the loan and is recorded in interest income. The Company recognized
$1 million
in other noninterest income related to its commercial trading portfolio for the three months ended
September 30, 2017
and 2016. The Company recognized
$4 million
in other noninterest income related to its commercial trading portfolio for the nine months ended
September 30, 2017
and
$3 million
for the nine months ended September 30, 2016.
106
CITIZENS FINANCIAL GROUP, INC.
NOTES TO CONSOLIDATED FINANCIAL STATEMENTS (UNAUDITED)
The following table presents the difference between the aggregate fair value and the aggregate unpaid principal balance of loans held for sale measured at fair value:
|
September 30, 2017
|
December 31, 2016
|
||||||||||||||||||
|
(in millions)
|
Aggregate Fair Value
|
Aggregate Unpaid Principal
|
Aggregate Fair Value Less Aggregate Unpaid Principal
|
Aggregate Fair Value
|
Aggregate Unpaid Principal
|
Aggregate Fair Value Less Aggregate Unpaid Principal
|
|||||||||||||
|
Residential mortgage loans held for sale, at fair value
|
|
$349
|
|
|
$349
|
|
|
$—
|
|
|
$504
|
|
|
$505
|
|
|
($1
|
)
|
|
|
Commercial and commercial real estate loans held for sale, at fair value
|
151
|
|
151
|
|
—
|
|
79
|
|
79
|
|
—
|
|
|||||||
Recurring Fair Value Measurements
The Company utilizes a variety of valuation techniques to measure its assets and liabilities at fair value. The valuation methodologies used for significant assets and liabilities carried on the balance sheet at fair value on a recurring basis are presented below:
Securities available for sale
The fair value of securities classified as AFS is based upon quoted prices, if available. Where observable quoted prices are available in an active market, securities are classified as Level 1 in the fair value hierarchy. Classes of instruments that are valued using this market approach include debt securities issued by the U.S. Treasury. If quoted market prices are not available, the fair value for the security is estimated under the market or income approach using pricing models. These instruments are classified as Level 2 because they currently trade in active markets and the inputs to the valuations are observable. The pricing models used to value securities generally begin with market prices (or rates) for similar instruments and make adjustments based on the characteristics of the instrument being valued. These adjustments reflect assumptions made regarding the sensitivity of each security’s value to changes in interest rates and prepayment speeds. Classes of instruments that are valued using this market approach include specified pool mortgage “pass-through” securities and other debt securities issued by U.S. government-sponsored entities and state and political subdivisions. The pricing models used to value securities under the income approach generally begin with the contractual cash flows of each security and make adjustments based on forecasted prepayment speeds, default rates, and other market-observable information. The adjusted cash flows are then discounted at a rate derived from observed rates of return for comparable assets or liabilities that are traded in the market. Classes of instruments that are valued using this market approach include residential and commercial CMOs.
A significant majority of the Company’s Level 1 and 2 securities are priced using an external pricing service. The Company verifies the accuracy of the pricing provided by its primary outside pricing service on a quarterly basis. This process involves using a secondary external vendor to provide valuations for the Company’s securities portfolio for comparison purposes. Any securities with discrepancies beyond a certain threshold are researched and, if necessary, valued by an independent outside broker.
In certain cases where there is limited activity or less transparency around inputs to the valuation model, securities are classified as Level 3.
Residential loans held for sale
See the “Fair Value Option, Residential Mortgage Loans Held for Sale” discussion above.
Commercial loans held for sale
See the “Fair Value Option, Commercial and Commercial Real Estate Loans Held for Sale” discussion above.
Derivatives
The vast majority of the Company’s derivatives portfolio is composed of “plain vanilla” interest rate swaps, which are traded in over-the-counter markets where quoted market prices are not readily available. For these interest rate derivatives, fair value is determined utilizing models that primarily use market observable inputs, such as swap rates and yield curves. The pricing models used to value interest rate swaps calculate the sum of each
107
CITIZENS FINANCIAL GROUP, INC.
NOTES TO CONSOLIDATED FINANCIAL STATEMENTS (UNAUDITED)
instrument’s fixed and variable cash flows, which are then discounted using an appropriate yield curve (i.e., LIBOR or Overnight Index Swap curve) to arrive at the fair value of each swap. The pricing models do not contain a high level of subjectivity as the methodologies used do not require significant judgment. The Company also considers certain adjustments to the modeled price that market participants would make when pricing each instrument, including a credit valuation adjustment that reflects the credit quality of the swap counterparty. The Company incorporates the effect of exposure to a particular counterparty’s credit by netting its derivative contracts with the collateral available and calculating a credit valuation adjustment on the basis of the net position with the counterparty where permitted. The determination of this adjustment requires judgment on behalf of Company management; however, the total amount of this portfolio-level adjustment is not material to the total fair value of the interest rate swaps in their entirety
.
Therefore, interest rate swaps are classified as Level 2 in the valuation hierarchy.
The Company’s other derivatives include foreign exchange contracts. The fair value of foreign exchange derivatives uses the mid-point of daily quoted currency spot prices. A valuation model estimates fair value based on the quoted spot rates together with interest rate yield curves and forward currency rates. Since all of these inputs are observable in the market, foreign exchange derivatives are classified as Level 2 in the fair value hierarchy.
Money Market Mutual Fund
Fair value is determined based upon unadjusted quoted market prices and is considered a Level 1 fair value measurement.
Other investments
The fair values of the Company’s other investments are based on security prices in markets that are not active; therefore, these investments are classified as Level 2 in the fair value hierarchy.
The following table presents assets and liabilities measured at fair value, including gross derivative assets and liabilities on a recurring basis at
September 30, 2017
:
|
(in millions)
|
Total
|
|
Level 1
|
|
Level 2
|
|
Level 3
|
|
||||
|
Securities available for sale:
|
||||||||||||
|
Mortgage-backed securities
|
|
$19,963
|
|
|
$—
|
|
|
$19,963
|
|
|
$—
|
|
|
State and political subdivisions
|
7
|
|
—
|
|
7
|
|
—
|
|
||||
|
U.S. Treasury and other
|
12
|
|
12
|
|
—
|
|
—
|
|
||||
|
Total securities available for sale
|
19,982
|
|
12
|
|
19,970
|
|
—
|
|
||||
|
Loans held for sale, at fair value:
|
||||||||||||
|
Residential loans held for sale
|
349
|
|
—
|
|
349
|
|
—
|
|
||||
|
Commercial loans held for sale
|
151
|
|
—
|
|
151
|
|
—
|
|
||||
|
Total loans held for sale, at fair value
|
500
|
|
—
|
|
500
|
|
—
|
|
||||
|
Derivative assets
(1)
:
|
||||||||||||
|
Interest rate swaps
|
508
|
|
—
|
|
508
|
|
—
|
|
||||
|
Foreign exchange contracts
|
146
|
|
—
|
|
146
|
|
—
|
|
||||
|
Other contracts
|
10
|
|
—
|
|
10
|
|
—
|
|
||||
|
Total derivative assets
|
664
|
|
—
|
|
664
|
|
—
|
|
||||
|
Other investment securities, at fair value:
|
||||||||||||
|
Money market mutual fund
|
160
|
|
160
|
|
—
|
|
—
|
|
||||
|
Other investments
|
5
|
|
—
|
|
5
|
|
—
|
|
||||
|
Total other investment securities, at fair value
|
165
|
|
160
|
|
5
|
|
—
|
|
||||
|
Total assets
|
|
$21,311
|
|
|
$172
|
|
|
$21,139
|
|
|
$—
|
|
|
Derivative liabilities
(1)
:
|
||||||||||||
|
Interest rate swaps
|
|
$338
|
|
|
$—
|
|
|
$338
|
|
|
$—
|
|
|
Foreign exchange contracts
|
142
|
|
—
|
|
142
|
|
—
|
|
||||
|
Other contracts
|
5
|
|
—
|
|
5
|
|
—
|
|
||||
|
Total derivative liabilities
|
485
|
|
—
|
|
485
|
|
—
|
|
||||
|
Total liabilities
|
|
$485
|
|
|
$—
|
|
|
$485
|
|
|
$—
|
|
(1)
Amounts reflect changes in the treatment of variation margin on certain centrally cleared derivatives.
108
CITIZENS FINANCIAL GROUP, INC.
NOTES TO CONSOLIDATED FINANCIAL STATEMENTS (UNAUDITED)
The following table presents assets and liabilities measured at fair value including gross derivative assets and liabilities on a recurring basis at
December 31, 2016
:
|
(in millions)
|
Total
|
|
Level 1
|
|
Level 2
|
|
Level 3
|
|
||||
|
Securities available for sale:
|
||||||||||||
|
Mortgage-backed securities
|
|
$19,446
|
|
|
$—
|
|
|
$19,446
|
|
|
$—
|
|
|
State and political subdivisions
|
8
|
|
—
|
|
8
|
|
—
|
|
||||
|
Equity securities
|
17
|
|
—
|
|
17
|
|
—
|
|
||||
|
U.S. Treasury
|
30
|
|
30
|
|
—
|
|
—
|
|
||||
|
Total securities available for sale
|
19,501
|
|
30
|
|
19,471
|
|
—
|
|
||||
|
Loans held for sale, at fair value:
|
||||||||||||
|
Residential loans held for sale
|
504
|
|
—
|
|
504
|
|
—
|
|
||||
|
Commercial loans held for sale
|
79
|
|
—
|
|
79
|
|
—
|
|
||||
|
Total loans held for sale, at fair value
|
583
|
|
—
|
|
583
|
|
—
|
|
||||
|
Derivative assets:
|
|
|
|
|
||||||||
|
Interest rate swaps
|
609
|
|
—
|
|
609
|
|
—
|
|
||||
|
Foreign exchange contracts
|
134
|
|
—
|
|
134
|
|
—
|
|
||||
|
Other contracts
|
16
|
|
—
|
|
16
|
|
—
|
|
||||
|
Total derivative assets
|
759
|
|
—
|
|
759
|
|
—
|
|
||||
|
Other investment securities, at fair value:
|
||||||||||||
|
Money market mutual fund
|
91
|
|
91
|
|
—
|
|
—
|
|
||||
|
Other investments
|
5
|
|
—
|
|
5
|
|
—
|
|
||||
|
Total other investment securities, at fair value
|
96
|
|
91
|
|
5
|
|
—
|
|
||||
|
Total assets
|
|
$20,939
|
|
|
$121
|
|
|
$20,818
|
|
|
$—
|
|
|
Derivative liabilities:
|
|
|
|
|
||||||||
|
Interest rate swaps
|
|
$645
|
|
|
$—
|
|
|
$645
|
|
|
$—
|
|
|
Foreign exchange contracts
|
126
|
|
—
|
|
126
|
|
—
|
|
||||
|
Other contracts
|
7
|
|
—
|
|
7
|
|
—
|
|
||||
|
Total derivative liabilities
|
778
|
|
—
|
|
778
|
|
—
|
|
||||
|
Total liabilities
|
|
$778
|
|
|
$—
|
|
|
$778
|
|
|
$—
|
|
There were no Level 3 assets measured at fair value on a recurring basis as of
September 30, 2017
and December 31, 2016.
Nonrecurring Fair Value Measurements
The following valuation techniques are utilized to measure significant assets for which the Company utilizes fair value on a nonrecurring basis:
Impaired Loans
The carrying amount of collateral-dependent impaired loans is compared to the appraised value of the collateral less costs to dispose and is classified as Level 2. Any excess of carrying amount over the appraised value is charged to the ALLL.
Mortgage Servicing Rights
MSRs do not trade in an active market with readily observable prices. MSRs are classified as Level 3 since the valuation methodology utilizes significant unobservable inputs. The fair value was calculated using a discounted cash flow model which used assumptions, including weighted-average life, weighted-average constant prepayment rate and weighted-average discount rate. Refer to Note 1 “Significant Accounting Policies” to the Company’s audited Consolidated Financial Statements in the Annual Report on Form 10-K for the year ended December 31, 2016 and Note 6 “Mortgage Banking” for more information.
109
CITIZENS FINANCIAL GROUP, INC.
NOTES TO CONSOLIDATED FINANCIAL STATEMENTS (UNAUDITED)
Foreclosed assets
Foreclosed assets consist primarily of residential properties. Foreclosed assets are carried at the lower of cost or fair value less costs to sell. Fair value is based upon independent market prices or appraised values of the collateral and is classified as Level 2.
Leased assets
The fair value of assets under operating leases is determined using collateral specific pricing digests, external appraisals, broker opinions, recent sales data from industry equipment dealers, and discounted cash flows derived from the underlying lease agreement. As market data for similar assets and lease agreements is available and used in the valuation, these assets are classified as Level 2 fair value measurement.
The following table presents gains (losses) on assets and liabilities measured at fair value on a nonrecurring basis and recorded in earnings:
|
Three Months Ended September 30,
|
Nine Months Ended September 30,
|
|||||||||||||||
|
(in millions)
|
2017
|
|
2016
|
|
2017
|
|
2016
|
|
||||||||
|
Impaired collateral-dependent loans
|
|
($4
|
)
|
|
($18
|
)
|
|
($31
|
)
|
|
($29
|
)
|
||||
|
MSRs
|
—
|
|
(2
|
)
|
1
|
|
(6
|
)
|
||||||||
|
Foreclosed assets
|
(1
|
)
|
—
|
|
(3
|
)
|
(2
|
)
|
||||||||
|
Leased assets
|
—
|
|
—
|
|
(15
|
)
|
—
|
|
—
|
|
||||||
The following table presents assets and liabilities measured at fair value on a nonrecurring basis:
|
September 30, 2017
|
December 31, 2016
|
||||||||||||||||||||||||
|
(in millions)
|
Total
|
|
Level 1
|
|
Level 2
|
|
Level 3
|
|
Total
|
|
Level 1
|
|
Level 2
|
|
Level 3
|
|
|||||||||
|
Impaired collateral-dependent loans
|
|
$300
|
|
|
$—
|
|
|
$300
|
|
|
$—
|
|
|
$355
|
|
|
$—
|
|
|
$355
|
|
|
$—
|
|
|
|
MSRs
|
183
|
|
—
|
|
—
|
|
183
|
|
182
|
|
—
|
|
—
|
|
182
|
|
|||||||||
|
Foreclosed assets
|
32
|
|
—
|
|
32
|
|
—
|
|
44
|
|
—
|
|
44
|
|
—
|
|
|||||||||
|
Leased assets
|
131
|
|
—
|
|
131
|
|
—
|
|
158
|
|
—
|
|
158
|
|
—
|
|
|||||||||
Disclosures about Fair Value of Financial Instruments
Following is a description of valuation methodologies used to estimate the fair value of financial instruments for disclosure purposes (these instruments are not recorded in the financial statements at fair value):
Securities held to maturity
The fair values of securities classified as HTM are estimated under the market or income approach using the same pricing models as those used to measure the fair value of the Company’s AFS securities. For more information, see “Recurring Fair Value Measurements - Securities Available for Sale,” within this Note.
Other investment securities, at cost
The cost basis of other investment securities, at cost, such as FHLB stock and FRB stock, is assumed to approximate the fair value of these securities. As a member of the FHLB and FRB, the Company is required to hold FHLB and FRB stock. The stock can be sold only to the FHLB and FRB upon termination of membership, or redeemed at the FHLB’s or FRB’s sole discretion. The stock may only be sold or redeemed at par, and therefore the cost basis represents the best estimate of fair value.
Loans and leases
For loans and leases not recorded at fair value on a recurring basis that are not accounted for as collateral-dependent impaired loans, fair value is estimated by using one of two methods: a discounted cash flow method or a securitization method. The discounted cash flow method involves discounting the expected future cash flows using current rates which a market participant would likely use to value similar pools of loans. Inputs used in this method include observable information such as contractual cash flows (net of servicing cost) and unobservable information such as estimated prepayment speeds, credit loss exposures, and discount rates. The securitization method involves utilizing market securitization data to value the assets as if a securitization transaction had been executed. Inputs
110
CITIZENS FINANCIAL GROUP, INC.
NOTES TO CONSOLIDATED FINANCIAL STATEMENTS (UNAUDITED)
used include observable market-based MBS data and pricing adjustments based on unobservable data reflecting the liquidity risk, credit loss exposure and other characteristics of the underlying loans. The internal risk-weighted balances of loans are grouped by product type for purposes of these estimated valuations. For nonaccruing loans, fair value is estimated by discounting management’s estimate of future cash flows with a discount rate commensurate with the risk associated with such assets. Fair value of collateral-dependent loans is primarily based on the appraised value of the collateral.
Other loans held for sale
Balances represent loans that were transferred to other loans held for sale and are reported at the lower of cost or fair value. When applicable, the fair value of other loans held for sale is estimated using one of two methods: a discounted cash flow method or a securitization method (as described above).
Deposits
The fair value of demand deposits, checking with interest accounts, regular savings, money market accounts and other deposits is the amount payable on demand at the balance sheet date. The fair value of term deposits is estimated by discounting the expected future cash flows using rates currently offered for deposits of similar remaining maturities.
Federal funds purchased and securities sold under agreements to repurchase, other short-term borrowed funds, and long-term borrowed funds
Rates currently available to the Company for debt of similar terms and remaining maturities are used to discount the expected cash flows of existing debt.
The following table presents the estimated fair value for financial instruments not recorded at fair value in the unaudited interim Consolidated Financial Statements. The carrying amounts are recorded in the Consolidated Balance Sheets under the indicated captions:
|
September 30, 2017
|
|||||||||||||||||||||||||||
|
Total
|
Level 1
|
Level 2
|
Level 3
|
||||||||||||||||||||||||
|
(in millions)
|
Carrying Value
|
Estimated Fair Value
|
Carrying Value
|
Estimated Fair Value
|
Carrying Value
|
Estimated Fair Value
|
Carrying Value
|
Estimated Fair Value
|
|||||||||||||||||||
|
Financial Assets:
|
|||||||||||||||||||||||||||
|
Securities held to maturity
|
|
$4,823
|
|
|
$4,839
|
|
|
$—
|
|
|
$—
|
|
|
$4,823
|
|
|
$4,839
|
|
|
$—
|
|
|
$—
|
|
|||
|
Other investment securities, at cost
|
772
|
|
772
|
|
—
|
|
—
|
|
772
|
|
772
|
|
—
|
|
—
|
|
|||||||||||
|
Other loans held for sale
|
724
|
|
724
|
|
—
|
|
—
|
|
—
|
|
—
|
|
724
|
|
724
|
|
|||||||||||
|
Loans and leases
|
110,151
|
|
110,710
|
|
—
|
|
—
|
|
300
|
|
300
|
|
109,851
|
|
110,410
|
|
|||||||||||
|
Financial Liabilities:
|
|||||||||||||||||||||||||||
|
Deposits
|
113,235
|
|
113,205
|
|
—
|
|
—
|
|
113,235
|
|
113,205
|
|
—
|
|
—
|
|
|||||||||||
|
Federal funds purchased and securities sold under agreements to repurchase
|
453
|
|
453
|
|
—
|
|
—
|
|
453
|
|
453
|
|
—
|
|
—
|
|
|||||||||||
|
Other short-term borrowed funds
|
1,505
|
|
1,505
|
|
—
|
|
—
|
|
1,505
|
|
1,505
|
|
—
|
|
—
|
|
|||||||||||
|
Long-term borrowed funds
|
13,400
|
|
13,543
|
|
—
|
|
—
|
|
13,400
|
|
13,543
|
|
—
|
|
—
|
|
|||||||||||
111
CITIZENS FINANCIAL GROUP, INC.
NOTES TO CONSOLIDATED FINANCIAL STATEMENTS (UNAUDITED)
|
December 31, 2016
|
|||||||||||||||||||||||||||
|
Total
|
Level 1
|
Level 2
|
Level 3
|
||||||||||||||||||||||||
|
(in millions)
|
Carrying Value
|
Estimated Fair Value
|
Carrying Value
|
Estimated Fair Value
|
Carrying Value
|
Estimated Fair Value
|
Carrying Value
|
Estimated Fair Value
|
|||||||||||||||||||
|
Financial Assets:
|
|||||||||||||||||||||||||||
|
Securities held to maturity
|
|
$5,071
|
|
|
$5,058
|
|
|
$—
|
|
|
$—
|
|
|
$5,071
|
|
|
$5,058
|
|
|
$—
|
|
|
$—
|
|
|||
|
Other investment securities, at cost
|
942
|
|
942
|
|
—
|
|
—
|
|
942
|
|
942
|
|
—
|
|
—
|
|
|||||||||||
|
Other loans held for sale
|
42
|
|
42
|
|
—
|
|
—
|
|
—
|
|
—
|
|
42
|
|
42
|
|
|||||||||||
|
Loans and leases
|
107,669
|
|
107,537
|
|
—
|
|
—
|
|
355
|
|
355
|
|
107,314
|
|
107,182
|
|
|||||||||||
|
Financial Liabilities:
|
|||||||||||||||||||||||||||
|
Deposits
|
109,804
|
|
109,796
|
|
—
|
|
—
|
|
109,804
|
|
109,796
|
|
—
|
|
—
|
|
|||||||||||
|
Federal funds purchased and securities sold under agreements to repurchase
|
1,148
|
|
1,148
|
|
—
|
|
—
|
|
1,148
|
|
1,148
|
|
—
|
|
—
|
|
|||||||||||
|
Other short-term borrowed funds
|
3,211
|
|
3,211
|
|
—
|
|
—
|
|
3,211
|
|
3,211
|
|
—
|
|
—
|
|
|||||||||||
|
Long-term borrowed funds
|
12,790
|
|
12,849
|
|
—
|
|
—
|
|
12,790
|
|
12,849
|
|
—
|
|
—
|
|
|||||||||||
112
CITIZENS FINANCIAL GROUP, INC.
NOTES TO CONSOLIDATED FINANCIAL STATEMENTS (UNAUDITED)
As a bank holding company, the Company is subject to regulation and supervision by the FRB. The primary subsidiaries of the Company are its
two
insured depository institutions CBNA, a national banking association whose primary federal regulator is the OCC, and CBPA, a Pennsylvania-chartered savings bank regulated by the Department of Banking of the Commonwealth of Pennsylvania and supervised by the FDIC, its primary federal regulator. Under the U.S. Basel III capital framework, the Company and its banking subsidiaries must meet specific minimum requirements for the following ratios: common equity tier 1 capital, tier 1 capital, total capital, and tier 1 leverage. In addition, the Company must not be subject to a written agreement, order or capital directive with any of its regulators. Failure to meet minimum capital requirements can result in the initiation of certain actions that, if undertaken, could have a material effect on the Company’s Consolidated Financial Statements.
The following table presents the Company’s capital and capital ratios under U.S. Basel III Standardized Transitional rules. Certain Basel III requirements are subject to phase-in through 2019, and were applied to this report of actual regulatory ratios. In addition, the Company has declared itself as an “AOCI opt-out” institution, which means the Company is not required to recognize within regulatory capital the impacts of net unrealized gains and losses included within AOCI for available for sale securities, accumulated net gains and losses on cash-flow hedges, net gains and losses on certain defined benefit pension plan assets, and net unrealized gains and losses on securities held to maturity.
|
Transitional Basel III
|
|||||||||||||||||
|
FDIA Requirements
|
|||||||||||||||||
|
Actual
|
Minimum Capital Adequacy
|
Classification as Well-capitalized
(6)
|
|||||||||||||||
|
(in millions, except ratio data)
|
Amount
|
|
Ratio
|
|
Amount
|
|
Ratio
(5)
|
|
Amount
|
|
Ratio
|
|
|||||
|
As of September 30, 2017
|
|||||||||||||||||
|
Common equity tier 1 capital
(1)
|
|
$14,093
|
|
11.1
|
%
|
|
$7,314
|
|
5.750
|
%
|
|
$8,268
|
|
6.5
|
%
|
||
|
Tier 1 capital
(2)
|
14,340
|
|
11.3
|
|
9,222
|
|
7.250
|
|
10,176
|
|
8.0
|
|
|||||
|
Total capital
(3)
|
17,560
|
|
13.8
|
|
11,766
|
|
9.250
|
|
12,720
|
|
10.0
|
|
|||||
|
Tier 1 leverage
(4)
|
14,340
|
|
9.9
|
|
5,780
|
|
4.000
|
|
7,225
|
|
5.0
|
|
|||||
|
As of December 31, 2016
|
|||||||||||||||||
|
Common equity tier 1 capital
(1)
|
|
$13,822
|
|
11.2
|
%
|
|
$6,348
|
|
5.125
|
%
|
|
$8,051
|
|
6.5
|
%
|
||
|
Tier 1 capital
(2)
|
14,069
|
|
11.4
|
|
8,206
|
|
6.625
|
|
9,909
|
|
8.0
|
|
|||||
|
Total capital
(3)
|
17,347
|
|
14.0
|
|
10,683
|
|
8.625
|
|
12,386
|
|
10.0
|
|
|||||
|
Tier 1 leverage
(4)
|
14,069
|
|
9.9
|
|
5,667
|
|
4.000
|
|
7,084
|
|
5.0
|
|
|||||
(1)
“Common equity tier 1 capital ratio” represents CET1 capital divided by total risk-weighted assets as defined under U.S. Basel III Standardized approach.
(2)
“Tier 1 capital ratio” is tier 1 capital, which includes CET1 capital plus non-cumulative perpetual preferred equity that qualifies as additional tier 1 capital, divided by total risk-weighted assets as defined under U.S. Basel III Standardized approach.
(3)
“Total capital ratio” is total capital divided by total risk-weighted assets as defined under U.S. Basel III Standardized approach.
(4)
“Tier 1 leverage ratio” is tier 1 capital divided by quarterly average total assets as defined under U.S. Basel III Standardized approach.
(5)
“Minimum Capital ratio” includes capital conservation buffer of
1.250%
for 2017 and
0.625%
for 2016; N/A to Tier 1 leverage.
(6)
Presented for informational purposes. Prompt corrective action provisions apply only to the Company’s insured depository institutions - CBNA and CBPA.
Under the FRB’s Capital Plan Rule, the Company may only make capital distributions, including payment of dividends, in accordance with a capital plan that has been reviewed by the FRB with no objection.
On April 5, 2017, the Company submitted its 2017 Capital Plan to the Federal Reserve under the annual CCAR process. On June 28, 2017, the FRB informed the Company that it did not object to the Company’s 2017 Capital Plan or to its proposed capital actions for the period beginning July 1, 2017 and ending June 30, 2018. The Company’s 2017 Capital Plan includes quarterly common dividends of
$0.18
per share through the end of 2017, the potential to raise the quarterly common dividend to
$0.22
per share in 2018, and a share repurchase plan through the second quarter of 2018. The timing and exact amount of future dividends and share repurchases will depend on various factors, including capital position, financial performance and market conditions.
During the three month periods ended
September 30, 2017
and 2016, the Company recorded common dividends of
$90 million
and
$62 million
, respectively, and recorded semi-annual preferred dividends of
$7 million
for both periods. During the nine month periods ended
September 30, 2017
and 2016, the Company recorded common dividends of
$233 million
and
$179 million
, respectively, and recorded semi-annual preferred dividends of
$14 million
for both periods.
113
CITIZENS FINANCIAL GROUP, INC.
NOTES TO CONSOLIDATED FINANCIAL STATEMENTS (UNAUDITED)
During the three months ended
September 30, 2017
and 2016, the Parent Company repurchased outstanding common shares for
$225 million
and
$250 million
, respectively. During the nine months ended
September 30, 2017
and 2016, the Parent Company repurchased outstanding common shares for
$485 million
and
$250 million
, respectively.
In accordance with federal and state banking regulations, dividends paid by the Company’s banking subsidiaries to the Parent Company are generally limited to the retained earnings of the respective banking subsidiaries unless specifically approved by the appropriate bank regulator.
A financial subsidiary of a national bank is permitted to engage in a broader range of activities, similar to those of a financial holding company. CBNA has
two
financial subsidiaries, Citizens Securities, Inc., a registered broker-dealer, and RBS Citizens Insurance Agency, Inc., a dormant entity. On March 13, 2014, the OCC determined that CBNA no longer met the conditions to own a financial subsidiary — namely that CBNA must be both well capitalized and well managed. As a result, CBNA entered into an agreement with the OCC pursuant to which it developed and submitted to the OCC a remediation plan setting forth the specific actions it would take to bring itself back into compliance with the conditions to own a financial subsidiary. Since the Company’s last quarterly report, the OCC notified CBNA that it had terminated the agreement after considering the actions taken under the remediation plan and determining that CBNA had satisfied the conditions to own a financial subsidiary.
114
CITIZENS FINANCIAL GROUP, INC.
NOTES TO CONSOLIDATED FINANCIAL STATEMENTS (UNAUDITED)
The following table presents the changes in the balances, net of income taxes, of each component of AOCI:
|
As of and for the three months ended September 30,
|
||||||||||||||||
|
(in millions)
|
Net Unrealized (Losses) Gains on Derivatives
|
Net Unrealized (Losses) Gains on Securities
|
Employee Benefit Plans
|
Total AOCI
|
|
|||||||||||
|
Balance at July 1, 2016
|
|
$39
|
|
|
$166
|
|
|
($364
|
)
|
|
($159
|
)
|
||||
|
Other comprehensive income before reclassifications
|
(1
|
)
|
(28
|
)
|
—
|
|
(29
|
)
|
||||||||
|
Other-than-temporary impairment not recognized in earnings on securities
|
—
|
|
3
|
|
—
|
|
3
|
|
||||||||
|
Amounts reclassified from other comprehensive (loss) income
|
(6
|
)
|
2
|
|
2
|
|
(2
|
)
|
||||||||
|
Net other comprehensive income
|
(7
|
)
|
(23
|
)
|
2
|
|
(28
|
)
|
||||||||
|
Balance at September 30, 2016
|
|
$32
|
|
|
$143
|
|
|
($362
|
)
|
|
($187
|
)
|
||||
|
Balance at July 1, 2017
|
|
($76
|
)
|
|
($128
|
)
|
|
($389
|
)
|
|
($593
|
)
|
||||
|
Other comprehensive income before reclassifications
|
(1
|
)
|
13
|
|
—
|
|
12
|
|
||||||||
|
Other-than-temporary impairment not recognized in earnings on securities
|
—
|
|
—
|
|
—
|
|
—
|
|
||||||||
|
Amounts reclassified from other comprehensive (loss) income
|
(2
|
)
|
(1
|
)
|
3
|
|
—
|
|
||||||||
|
Net other comprehensive income
|
(3
|
)
|
12
|
|
3
|
|
12
|
|
||||||||
|
Balance at September 30, 2017
|
|
($79
|
)
|
|
($116
|
)
|
|
($386
|
)
|
|
($581
|
)
|
||||
|
As of and for the nine months ended September 30,
|
||||||||||||||||
|
(in millions)
|
Net Unrealized (Losses) Gains on Derivatives
|
Net Unrealized (Losses) Gains on Securities
|
Employee Benefit Plans
|
Total AOCI
|
|
|||||||||||
|
Balance at January 1, 2016
|
|
$10
|
|
|
($28
|
)
|
|
($369
|
)
|
|
($387
|
)
|
||||
|
Other comprehensive income before reclassifications
|
45
|
|
190
|
|
—
|
|
235
|
|
||||||||
|
Other-than-temporary impairment not recognized in earnings on securities
|
—
|
|
(18
|
)
|
—
|
|
(18
|
)
|
||||||||
|
Amounts reclassified from other comprehensive (loss) income
|
(23
|
)
|
(1
|
)
|
7
|
|
(17
|
)
|
||||||||
|
Net other comprehensive income
|
22
|
|
171
|
|
7
|
|
200
|
|
||||||||
|
Balance at September 30, 2016
|
|
$32
|
|
|
$143
|
|
|
($362
|
)
|
|
($187
|
)
|
||||
|
Balance at January 1, 2017
|
|
($88
|
)
|
|
($186
|
)
|
|
($394
|
)
|
|
($668
|
)
|
||||
|
Other comprehensive income before reclassifications
|
22
|
|
74
|
|
—
|
|
96
|
|
||||||||
|
Other-than-temporary impairment not recognized in earnings on securities
|
—
|
|
(2
|
)
|
—
|
|
(2
|
)
|
||||||||
|
Amounts reclassified from other comprehensive (loss) income
|
(13
|
)
|
(2
|
)
|
8
|
|
(7
|
)
|
||||||||
|
Net other comprehensive income
|
9
|
|
70
|
|
8
|
|
87
|
|
||||||||
|
Balance at September 30, 2017
|
|
($79
|
)
|
|
($116
|
)
|
|
($386
|
)
|
|
($581
|
)
|
||||
115
CITIZENS FINANCIAL GROUP, INC.
NOTES TO CONSOLIDATED FINANCIAL STATEMENTS (UNAUDITED)
The following table presents the amounts reclassified out of each component of AOCI and into the Consolidated Statements of Operations:
|
Three Months Ended September 30,
|
Nine Months Ended September 30,
|
|||||||||||||||
|
(in millions)
|
2017
|
|
2016
|
|
2017
|
|
2016
|
|
||||||||
|
Details about AOCI Components
|
Affected Line Item in the Consolidated Statements of Operations
|
|||||||||||||||
|
Reclassification adjustment for net derivative gains (losses) included in net income:
|
|
$3
|
|
|
$23
|
|
|
$23
|
|
|
$66
|
|
Interest income
|
|||
|
1
|
|
(8
|
)
|
(2
|
)
|
(24
|
)
|
Interest expense
|
||||||||
|
—
|
|
(5
|
)
|
—
|
|
(5
|
)
|
Other income
|
||||||||
|
4
|
|
10
|
|
21
|
|
37
|
|
Income before income tax expense
|
||||||||
|
2
|
|
4
|
|
8
|
|
14
|
|
Income tax expense
|
||||||||
|
|
$2
|
|
|
$6
|
|
|
$13
|
|
|
$23
|
|
Net income
|
||||
|
Reclassification of net securities gains (losses) to net income:
|
|
$2
|
|
|
$—
|
|
|
$9
|
|
|
$13
|
|
Securities gains, net
|
|||
|
(1
|
)
|
(3
|
)
|
(6
|
)
|
(11
|
)
|
Net securities impairment losses recognized in earnings
|
||||||||
|
1
|
|
(3
|
)
|
3
|
|
2
|
|
Income before income tax expense
|
||||||||
|
—
|
|
(1
|
)
|
1
|
|
1
|
|
Income tax expense
|
||||||||
|
|
$1
|
|
|
($2
|
)
|
|
$2
|
|
|
$1
|
|
Net income
|
||||
|
Reclassification of changes related to the employee benefit plan:
|
|
($5
|
)
|
|
($4
|
)
|
|
($14
|
)
|
|
($12
|
)
|
Salaries and employee benefits
|
|||
|
(5
|
)
|
(4
|
)
|
(14
|
)
|
(12
|
)
|
Income before income tax expense
|
||||||||
|
(2
|
)
|
(2
|
)
|
(6
|
)
|
(5
|
)
|
Income tax expense
|
||||||||
|
|
($3
|
)
|
|
($2
|
)
|
|
($8
|
)
|
|
($7
|
)
|
Net income
|
||||
|
Total reclassification gains
|
|
$—
|
|
|
$2
|
|
|
$7
|
|
|
$17
|
|
Net income
|
|||
The following table presents the effects on net income of the amounts reclassified out of AOCI:
|
Three Months Ended September 30,
|
Nine Months Ended September 30,
|
||||||||||||||
|
(in millions)
|
2017
|
|
2016
|
|
2017
|
|
2016
|
|
|||||||
|
Net interest income (includes $4, $15, $21 and $42 of AOCI reclassifications, respectively)
|
|
$1,062
|
|
|
$945
|
|
|
$3,093
|
|
|
$2,772
|
|
|||
|
Provision for credit losses
|
72
|
|
86
|
|
238
|
|
267
|
|
|||||||
|
Noninterest income (includes $1, ($8), $3 and ($3) of AOCI reclassifications, respectively)
|
381
|
|
435
|
|
1,130
|
|
1,120
|
|
|||||||
|
Noninterest expense (includes $5, $4, $14 and $12 of AOCI reclassifications, respectively)
|
858
|
|
867
|
|
2,576
|
|
2,505
|
|
|||||||
|
Income before income tax expense
|
513
|
|
427
|
|
1,409
|
|
1,120
|
|
|||||||
|
Income tax expense (includes $0, $1, $3 and $10 income tax net expense from reclassification items, respectively)
|
165
|
|
130
|
|
423
|
|
357
|
|
|||||||
|
Net income
|
|
$348
|
|
|
$297
|
|
|
$986
|
|
|
$763
|
|
|||
The Company is managed by its Chief Executive Officer on a segment basis. The Company’s
two
business segments are Consumer Banking and Commercial Banking. The business segments are determined based on the products and services provided, or the type of customer served. Each segment has one or more segment heads who report directly to the Chief Executive Officer. The Chief Executive Officer has final authority over resource allocation decisions and performance assessment. The business segments reflect this management structure and the manner in which financial information is currently evaluated by the Chief Executive Officer.
Reportable Segments
Segment results are determined based upon the Company’s management reporting system, which assigns balance sheet and statement of operations items to each of the business segments. The process is designed around the Company’s organizational and management structure and accordingly, the results derived are not necessarily comparable with similar information published by other financial institutions. A description of each reportable segment and table of financial results is presented below:
116
CITIZENS FINANCIAL GROUP, INC.
NOTES TO CONSOLIDATED FINANCIAL STATEMENTS (UNAUDITED)
Consumer Banking
The Consumer Banking segment focuses on retail customers and small businesses with annual revenues of up to
$25 million
. It offers traditional banking products and services, including checking, savings, home loans, education loans, credit cards, business loans, and unsecured product finance and personal loans in addition to financial management services. It also operates an indirect auto financing business, providing financing for both new and used vehicles through auto dealerships. The segment’s distribution channels include a branch network, ATMs and a work force of experienced specialists ranging from financial consultants, mortgage loan officers and business banking officers to private bankers. The Company’s Consumer Banking value proposition is based on providing simple, easy to understand product offerings and a convenient banking experience with a more personalized approach.
Commercial Banking
The Commercial Banking segment primarily targets companies with annual revenues from
$25 million
to
$2.5 billion
and provides a full complement of financial products and solutions, including loans, leases, trade financing, deposits, cash management, commercial cards, foreign exchange, interest rate risk management, corporate finance and capital markets advisory capabilities. It focuses on middle-market companies, large corporations and institutions and has dedicated teams with industry expertise in government banking, not-for-profit, healthcare, technology, professionals, oil and gas, asset finance, franchise finance, asset-based lending, commercial real estate, private equity and sponsor finance. While the segment’s business development efforts are predominantly focused in the Company’s footprint, some of its specialized industry businesses also operate selectively on a national basis (such as healthcare, asset finance and franchise finance). A key component of Commercial Banking’s growth strategy is to bring ideas to clients that help their businesses thrive, and in doing so, expand the loan portfolio and ancillary product sales.
Non-segment Operations
Other
Non-segment operations are classified as Other, which includes corporate functions, the Treasury function, the securities portfolio, wholesale funding activities, intangible assets, community development, non-core assets (including legacy Royal Bank of Scotland Group plc aircraft loans and leases placed in runoff in the third quarter of 2016), and other unallocated assets, liabilities, capital, revenues, provision for credit losses and expenses. In addition to non-segment operations, Other includes goodwill and any associated goodwill impairment charges. For impairment testing purposes, the Company allocates goodwill to its Consumer Banking and Commercial Banking reporting units. For management reporting purposes, the Company presents the goodwill balance (and any related impairment charges) in Other.
|
As of and for the Three Months Ended September 30, 2017
|
|||||||||||||||
|
(in millions)
|
Consumer Banking
|
Commercial Banking
|
Other
|
|
Consolidated
|
|
|||||||||
|
Net interest income
|
|
$674
|
|
|
$354
|
|
|
$34
|
|
|
$1,062
|
|
|||
|
Noninterest income
|
227
|
|
136
|
|
18
|
|
381
|
|
|||||||
|
Total revenue
|
901
|
|
490
|
|
52
|
|
1,443
|
|
|||||||
|
Noninterest expense
|
648
|
|
195
|
|
15
|
|
858
|
|
|||||||
|
Profit before provision for credit losses
|
253
|
|
295
|
|
37
|
|
585
|
|
|||||||
|
Provision for credit losses
|
65
|
|
—
|
|
7
|
|
72
|
|
|||||||
|
Income before income tax expense
|
188
|
|
295
|
|
30
|
|
513
|
|
|||||||
|
Income tax expense
|
66
|
|
94
|
|
5
|
|
165
|
|
|||||||
|
Net income
|
|
$122
|
|
|
$201
|
|
|
$25
|
|
|
$348
|
|
|||
|
Total average assets
|
|
$60,012
|
|
|
$49,833
|
|
|
$40,167
|
|
|
$150,012
|
|
|||
117
CITIZENS FINANCIAL GROUP, INC.
NOTES TO CONSOLIDATED FINANCIAL STATEMENTS (UNAUDITED)
|
As of and for the Three Months Ended September 30, 2016
|
|||||||||||||||
|
(in millions)
|
Consumer Banking
|
Commercial Banking
|
Other
|
|
Consolidated
|
|
|||||||||
|
Net interest income
|
|
$621
|
|
|
$327
|
|
|
($3
|
)
|
|
$945
|
|
|||
|
Noninterest income
|
229
|
|
123
|
|
83
|
|
435
|
|
|||||||
|
Total revenue
|
850
|
|
450
|
|
80
|
|
1,380
|
|
|||||||
|
Noninterest expense
|
650
|
|
181
|
|
36
|
|
867
|
|
|||||||
|
Profit before provision for credit losses
|
200
|
|
269
|
|
44
|
|
513
|
|
|||||||
|
Provision for credit losses
|
57
|
|
19
|
|
10
|
|
86
|
|
|||||||
|
Income before income tax expense (benefit)
|
143
|
|
250
|
|
34
|
|
427
|
|
|||||||
|
Income tax expense (benefit)
|
51
|
|
88
|
|
(9
|
)
|
130
|
|
|||||||
|
Net income
|
|
$92
|
|
|
$162
|
|
|
$43
|
|
|
$297
|
|
|||
|
Total average assets
|
|
$56,689
|
|
|
$47,902
|
|
|
$39,808
|
|
|
$144,399
|
|
|||
|
As of and for the Nine Months Ended September 30, 2017
|
|||||||||||||||
|
(in millions)
|
Consumer Banking
|
Commercial Banking
|
Other
|
|
Consolidated
|
|
|||||||||
|
Net interest income
|
|
$1,969
|
|
|
$1,044
|
|
|
$80
|
|
|
$3,093
|
|
|||
|
Noninterest income
|
676
|
|
400
|
|
54
|
|
1,130
|
|
|||||||
|
Total revenue
|
2,645
|
|
1,444
|
|
134
|
|
4,223
|
|
|||||||
|
Noninterest expense
|
1,939
|
|
577
|
|
60
|
|
2,576
|
|
|||||||
|
Profit before provision for credit losses
|
706
|
|
867
|
|
74
|
|
1,647
|
|
|||||||
|
Provision for credit losses
|
189
|
|
20
|
|
29
|
|
238
|
|
|||||||
|
Income before income tax expense (benefit)
|
517
|
|
847
|
|
45
|
|
1,409
|
|
|||||||
|
Income tax expense (benefit)
|
182
|
|
279
|
|
(38
|
)
|
423
|
|
|||||||
|
Net income
|
|
$335
|
|
|
$568
|
|
|
$83
|
|
|
$986
|
|
|||
|
Total average assets
|
|
$59,310
|
|
|
$49,604
|
|
|
$40,649
|
|
|
$149,563
|
|
|||
|
As of and for the Nine Months Ended September 30, 2016
|
|||||||||||||||
|
(in millions)
|
Consumer Banking
|
Commercial Banking
|
Other
|
|
Consolidated
|
|
|||||||||
|
Net interest income
|
|
$1,804
|
|
|
$941
|
|
|
$27
|
|
|
$2,772
|
|
|||
|
Noninterest income
|
656
|
|
344
|
|
120
|
|
1,120
|
|
|||||||
|
Total revenue
|
2,460
|
|
1,285
|
|
147
|
|
3,892
|
|
|||||||
|
Noninterest expense
|
1,898
|
|
554
|
|
53
|
|
2,505
|
|
|||||||
|
Profit before provision for credit losses
|
562
|
|
731
|
|
94
|
|
1,387
|
|
|||||||
|
Provision for credit losses
|
169
|
|
27
|
|
71
|
|
267
|
|
|||||||
|
Income before income tax expense (benefit)
|
393
|
|
704
|
|
23
|
|
1,120
|
|
|||||||
|
Income tax expense (benefit)
|
140
|
|
245
|
|
(28
|
)
|
357
|
|
|||||||
|
Net income
|
|
$253
|
|
|
$459
|
|
|
$51
|
|
|
$763
|
|
|||
|
Total average assets
|
|
$55,825
|
|
|
$46,869
|
|
|
$39,101
|
|
|
$141,795
|
|
|||
Management accounting practices utilized by the Company as the basis of presentation for segment results include the following:
FTP adjustments
The Company utilizes an FTP system to eliminate the effect of interest rate risk from the segments’ net interest income because such risk is centrally managed within the Treasury function. The FTP system credits (or charges) the segments with the economic value of the funds created (or used) by the segments. The FTP system provides a funds credit for sources of funds and a funds charge for the use of funds by each segment. The sum of the interest income/expense and FTP charges/credits for each segment is its designated net interest income. The variance between the Company’s cumulative FTP charges and cumulative FTP credits is offset in Other.
118
CITIZENS FINANCIAL GROUP, INC.
NOTES TO CONSOLIDATED FINANCIAL STATEMENTS (UNAUDITED)
Provision for credit losses allocations
Provision for credit losses is allocated to each business segment based on actual net charge-offs recognized by the business segment. The difference between the consolidated provision for credit losses and the business segments’ net charge-offs is reflected in Other.
Income tax allocations
Income taxes are assessed to each line of business at a standard tax rate with the residual tax expense or benefit to arrive at the consolidated effective tax rate included in Other.
Expense allocations
Noninterest expenses incurred by centrally managed operations or business lines that directly support another business line’s operations are charged to the applicable business line based on its utilization of those services.
Substantially all revenues generated and long-lived assets held by the Company’s business segments are derived from clients that reside in the United States. Neither business segment earns revenue from a single external customer that represents ten percent or more of the Company’s total revenues.
|
Three Months Ended September 30,
|
Nine Months Ended September 30,
|
||||||||||||||
|
(in millions, except share and per-share data)
|
2017
|
|
2016
|
|
2017
|
|
2016
|
|
|||||||
|
Numerator (basic and diluted):
|
|||||||||||||||
|
Net income
|
|
$348
|
|
|
$297
|
|
|
$986
|
|
|
$763
|
|
|||
|
Less: Preferred stock dividends
|
7
|
|
7
|
|
14
|
|
14
|
|
|||||||
|
Net income available to common stockholders
|
|
$341
|
|
|
$290
|
|
|
$972
|
|
|
$749
|
|
|||
|
Denominator:
|
|||||||||||||||
|
Weighted-average common shares outstanding - basic
|
500,861,076
|
|
519,458,976
|
|
505,529,991
|
|
525,477,273
|
|
|||||||
|
Dilutive common shares: share-based awards
|
1,296,308
|
|
1,663,490
|
|
1,532,814
|
|
1,784,111
|
|
|||||||
|
Weighted-average common shares outstanding - diluted
|
502,157,384
|
|
521,122,466
|
|
507,062,805
|
|
527,261,384
|
|
|||||||
|
Earnings per common share:
|
|||||||||||||||
|
Basic
|
|
$0.68
|
|
|
$0.56
|
|
|
$1.92
|
|
|
$1.43
|
|
|||
|
Diluted
|
0.68
|
|
0.56
|
|
1.92
|
|
1.42
|
|
|||||||
Potential dilutive common shares are excluded from the computation of diluted EPS in the periods where the effect would be antidilutive. The diluted EPS computation for the three and
nine months ended
September 30, 2017
excluded
4,181
and
378,378
average share-based awards, respectively, because their inclusion would have been antidilutive. The Company did
no
t have any antidilutive shares for the three and
nine months ended
September 30, 2016
.
The following table presents the details of other income:
|
Three Months Ended September 30,
|
Nine Months Ended September 30,
|
||||||||||||||
|
(in millions)
|
2017
|
|
2016
|
|
2017
|
|
2016
|
|
|||||||
|
Bank-owned life insurance income
|
|
$14
|
|
|
$14
|
|
|
$40
|
|
|
$40
|
|
|||
|
Other
|
5
|
|
76
|
|
10
|
|
93
|
|
|||||||
|
Other income
|
|
$19
|
|
|
$90
|
|
|
$50
|
|
|
$133
|
|
|||
119
CITIZENS FINANCIAL GROUP, INC.
NOTES TO CONSOLIDATED FINANCIAL STATEMENTS (UNAUDITED)
The following table presents the details of other operating expense:
|
Three Months Ended September 30,
|
Nine Months Ended September 30,
|
||||||||||||||
|
(in millions)
|
2017
|
|
2016
|
|
2017
|
|
2016
|
|
|||||||
|
Deposit insurance
|
|
$34
|
|
|
$32
|
|
|
$102
|
|
|
$87
|
|
|||
|
Promotional expense
|
27
|
|
24
|
|
82
|
|
73
|
|
|||||||
|
Settlements and operating losses
|
18
|
|
18
|
|
43
|
|
40
|
|
|||||||
|
Other
|
56
|
|
70
|
|
182
|
|
187
|
|
|||||||
|
Other operating expense
|
|
$135
|
|
|
$144
|
|
|
$409
|
|
|
$387
|
|
|||
The Company has evaluated the impacts of events that have occurred subsequent to
September 30, 2017
through the filing date of the Consolidated Financial Statements with the SEC. Based on this evaluation, the Company has determined none of these events were required to be recognized or disclosed in the Consolidated Financial Statements and related Notes.
120
CITIZENS FINANCIAL GROUP, INC.
The information presented in the “Market Risk” section of Part I, Item 2 — Management’s Discussion and Analysis of Financial Condition and Results of Operations is incorporated herein by reference.
The Company maintains a set of disclosure controls and procedures designed to ensure that information required to be disclosed by the Company in reports that it files or submits under the Exchange Act, is recorded, processed, summarized and reported within the time periods specified in SEC rules and forms. The design of any disclosure controls and procedures is based in part upon certain assumptions about the likelihood of future events, and there can be no assurance that any design will succeed in achieving its stated goals under all potential future conditions. Any controls and procedures, no matter how well designed and operated, can provide only reasonable, not absolute, assurance of achieving the desired control objectives. In accordance with Rule 13a-15(b) of the Exchange Act, as of the end of the period covered by this quarterly report, an evaluation was carried out under the supervision and with the participation of the Company’s management, including its Chief Executive Officer and Chief Financial Officer, of the effectiveness of its disclosure controls and procedures. Based on that evaluation, the Company’s Chief Executive Officer and Chief Financial Officer concluded that the Company’s disclosure controls and procedures, as of the end of the period covered by this quarterly report, were effective to provide reasonable assurance that information required to be disclosed by the Company in reports that it files or submits under the Exchange Act is recorded, processed, summarized and reported within the time periods specified in SEC rules and forms and is accumulated and communicated to the Company’s management, including the Chief Executive Officer and Chief Financial Officer, as appropriate to allow timely decisions regarding required disclosure.
There were no changes in our internal control over financial reporting identified in management's evaluation pursuant to Rules13a-15(d) or 15d-15(d) of the Exchange Act during the period covered by this quarterly report on Form 10-Q that materially affected, or are reasonably likely to materially affect, the Company’s internal control over financial reporting.
121
CITIZENS FINANCIAL GROUP, INC.
In addition to the matters described in the Company's Annual Report on Form 10-K for the year ended December 31, 2016, information required by this item is set forth in Note 11 “Commitments and Contingencies” in the Notes to the unaudited interim Consolidated Financial Statements in Part I, Item 1 — Financial Statements of this report, which is incorporated herein by reference.
In addition to the other information set forth in this report, you should consider the risks described under the caption “Risk Factors” in the Company’s Annual Report on Form 10-K for the year ended December 31, 2016.
Details of the repurchases of the Company’s common stock during the three months ended
September 30, 2017
are included in the following table:
|
Period
|
Total Number of Shares Repurchased
|
Average Price Paid Per Share
|
Total Number of Shares Purchased as Part of Publicly Announced Plans or Programs
(1)
|
Maximum Dollar Amount of Shares That May Yet Be Purchased As Part of Publicly Announced Plans or Programs
(1)
|
|
July 1, 2017 - July 31, 2017
|
5,209,752
|
$34.83
|
5,209,752
|
$668,544,338
|
|
August 1, 2017 - August 31, 2017
|
—
|
$—
|
—
|
$668,544,338
|
|
September 1, 2017 - September 30, 2017
|
1,250,743
|
$34.83
|
1,250,743
|
$625,000,000
|
(1)
On June 29, 2017, the Company announced that its 2017 Capital Plan, submitted as part of the CCAR process and not objected to by the FRB, included share repurchases of CFG common stock for the four-quarter period ending with the second quarter of 2018. This share repurchase plan, which was approved by the Company’s Board of Directors at the time of the announcement, allows for share repurchases that may be executed in the open market or in privately negotiated transactions, including under Rule 10b5-1 plans. Shares repurchased by the Company during third quarter 2017 were executed pursuant to an accelerated share repurchase transaction, which was completed by September 30, 2017. The timing and exact amount of future share repurchases will be subject to various factors, including the Company’s capital position, financial performance and market conditions.
122
CITIZENS FINANCIAL GROUP, INC.
|
101
|
The following materials from the Registrant's Quarterly Report on Form 10-Q for the fiscal quarter ended September 30, 2017, formatted in XBRL: (i) the Consolidated Balance Sheets, (ii) the Consolidated Statements of Operations, (iii) the Consolidated Statements of Comprehensive Income, (iv) the Consolidated Statements of Changes in Stockholders’ Equity, (v) the Consolidated Statements of Cash Flows and (vi) the Notes to Consolidated Financial Statements*
|
* Filed herewith.
123
CITIZENS FINANCIAL GROUP, INC.
SIGNATURE
Pursuant to the requirements of the Securities Exchange Act of 1934, the Registrant has duly caused this report to be signed on its behalf by the undersigned, thereunto duly authorized on November 3, 2017.
|
CITIZENS FINANCIAL GROUP, INC.
|
|
|
(Registrant)
|
|
|
By:
|
/s/ Randall J. Black
|
|
Name: Randall J. Black
|
|
|
Title: Executive Vice President and Controller
|
|
|
(Principal Accounting Officer and Authorized Officer)
|
|
124
TABLE OF CONTENTS
Part I. Financial InformationItem 2. Management S Discussion and Analysis Of Financial Condition and Results Of OperationsItem 1. Financial StatementsNote 1 - Basis Of PresentationNote 2 - SecuritiesNote 3 - Loans and LeasesNote 4 - Allowance For Credit Losses, Nonperforming Assets, and Concentrations Of Credit RiskNote 5 - Variable Interest EntitiesNote 6 - Mortgage BankingNote 7 - Borrowed FundsNote 8 - Stockholders EquityNote 9 - Income TaxesNote 10 - DerivativesNote 11 - Commitments and ContingenciesNote 12 - Fair Value MeasurementsNote 13 - Regulatory MattersNote 14 - Reclassifications Out Of Accumulated Other Comprehensive Income (loss)Note 15 - Business SegmentsNote 16 - Earnings Per ShareNote 17 - Other IncomeNote 18 - Other Operating ExpenseNote 19 - Subsequent EventsItem 3. Quantitative and Qualitative Disclosures About Market RiskItem 4. Controls and ProceduresPart II. Other InformationItem 1. Legal ProceedingsItem 1A. Risk FactorsItem 2. Unregistered Sales Of Equity Securities and Use Of ProceedsItem 6. Exhibits