CITIZENS FINANCIAL GROUP INC/RI
10-Ks and 10-Qs
|
|
|
|
|
|
|
|
|
|
|
|
|
|
|
|
|
|
|
|
|
|
|
|
|
|
|
|
|
|
|
|
|
|
|
|
|
|
|
|
|
UNITED STATES
SECURITIES AND EXCHANGE COMMISSION
Washington, D.C. 20549
FORM 10-Q
[X]
QUARTERLY REPORT PURSUANT TO SECTION 13 OR 15(d)
OF THE SECURITIES EXCHANGE ACT OF 1934
For the Quarterly Period Ended
March 31, 2019
[ ]
TRANSITION REPORT PURSUANT TO SECTION 13 OR 15(d)
OF THE SECURITIES EXCHANGE ACT OF 1934
For the Transition Period From
(Not Applicable)
Commission File Number 001-36636
(Exact name of the registrant as specified in its charter)
|
Delaware
|
05-0412693
|
|
|
(State or Other Jurisdiction of
Incorporation or Organization)
|
(I.R.S. Employer
Identification Number)
|
|
One Citizens Plaza, Providence, RI 02903
(
Address of principal executive offices, including zip code
)
(401) 456-7000
(
Registrant’s telephone number, including area code
)
Indicate by check mark whether the Registrant (1) has filed all reports required to be filed by Section 13 or 15(d) of the Securities Exchange Act of 1934 during the preceding 12 months and (2) has been subject to such filing requirements for the past 90 days.
[
ü
] Yes [ ] No
Indicate by check mark whether the registrant has submitted electronically every Interactive Data File required to be submitted pursuant to Rule 405 of Regulation S-T (§232.405 of this chapter) during the preceding 12 months (or for such shorter period that the registrant was required to submit such files).
[
ü
] Yes [ ] No
Indicate by check mark whether the registrant is a large accelerated filer, an accelerated filer, a non-accelerated filer, a smaller reporting company or an emerging growth company. See the definitions of “large accelerated filer,” “accelerated filer” and “smaller reporting company” in Rule 12b-2 of the Exchange Act:
|
Large accelerated filer
|
[
ü
]
|
Accelerated filer
|
[ ]
|
|
Non-accelerated filer
|
[ ]
|
Smaller reporting company
|
[ ]
|
|
Emerging growth company
|
[ ]
|
||
If an emerging growth company, indicate by check mark if the registrant has elected not to use the extended transition period for complying with any new or revised financial accounting standards provided pursuant to Section 13(a) of the Exchange Act. [ ]
Indicate by check mark whether the registrant is a shell company (as defined in Rule 12b-2 of the Exchange Act). [ ] Yes [
ü
] No
Securities registered pursuant to Section 12(b) of the Act:
|
Title of each class
|
Trading symbol
|
Name of each exchange on which registered
|
|
Common stock, $0.01 par value per share
|
CFG
|
New York Stock Exchange
|
|
Depositary Shares, each representing a 1/40
th
interest in a share of 6.350% Fixed-to-Floating Rate Non-Cumulative Perpetual Preferred Stock, Series D
|
CFG PrD
|
New York Stock Exchange
|
There were
458,355,574
shares of Registrant’s common stock ($0.01 par value) outstanding on May 1, 2019.
|
|
||||
|
Table of Contents
|
||||
2
CITIZENS FINANCIAL GROUP, INC.
GLOSSARY OF ACRONYMS AND TERMS
The following listing provides a comprehensive reference of common acronyms and terms we regularly use in our financial reporting:
|
ACL
|
Allowance for Credit Losses
|
|
|
Acquisitions
|
Refers to acquisitions after second quarter 2018, including Franklin American Mortgage Company, Clarfeld Financial Advisors, LLC and Bowstring Advisors LLC
|
|
|
AFS
|
Available for Sale
|
|
|
ALLL
|
Allowance for Loan and Lease Losses
|
|
|
ALM
|
Asset and Liability Management
|
|
|
AOCI
|
Accumulated Other Comprehensive Income (Loss)
|
|
|
ATM
|
Automated Teller Machine
|
|
|
Board of Directors
|
The Board of Directors of Citizens Financial Group, Inc.
|
|
|
bps
|
Basis Points
|
|
|
Capital Plan Rule
|
Federal Reserve’s Regulation Y Capital Plan Rule
|
|
|
CBNA
|
Citizens Bank, National Association
|
|
|
CCAR
|
Comprehensive Capital Analysis and Review
|
|
|
CCB
|
Capital Conservation Buffer
|
|
|
CET1
|
Common Equity Tier 1
|
|
|
CET1 capital ratio
|
Common Equity Tier 1 capital divided by total risk-weighted assets as defined under the U.S. Basel III Standardized approach
|
|
|
Citizens, CFG, the Company, we, us, or our
|
Citizens Financial Group, Inc. and its Subsidiaries
|
|
|
CLTV
|
Combined Loan to Value
|
|
|
CMO
|
Collateralized Mortgage Obligation
|
|
|
DFAST
|
Dodd-Frank Act Stress Test
|
|
|
Dodd-Frank Act
|
The Dodd-Frank Wall Street Reform and Consumer Protection Act of 2010
|
|
|
EGRRCPA
|
Economic Growth, Regulatory Relief and Consumer Protection Act
|
|
|
EPS
|
Earnings Per Share
|
|
|
Exchange Act
|
The Securities Exchange Act of 1934
|
|
|
FAMC
|
Franklin American Mortgage Company
|
|
|
FAMC acquisition
|
The August 1, 2018 acquisition of Franklin American Mortgage Company
|
|
|
Fannie Mae (FNMA)
|
Federal National Mortgage Association
|
|
|
FDIC
|
Federal Deposit Insurance Corporation
|
|
|
FHLB
|
Federal Home Loan Bank
|
|
|
FICO
|
Fair Isaac Corporation (credit rating)
|
|
|
FRB
|
Board of Governors of the Federal Reserve System and, as applicable, Federal Reserve Bank(s)
|
|
|
Freddie Mac (FHLMC)
|
Federal Home Loan Mortgage Corporation
|
|
|
FTP
|
Funds Transfer Pricing
|
|
|
GAAP
|
Accounting Principles Generally Accepted in the United States of America
|
|
|
Ginnie Mae (GNMA)
|
Government National Mortgage Association
|
|
|
GSE
|
Government Sponsored Entity
|
|
|
HELOC
|
Home Equity Line of Credit
|
|
|
HTM
|
Held To Maturity
|
|
|
LCR
|
Liquidity Coverage Ratio
|
|
|
LHFS
|
Loans Held for Sale
|
|
|
LIBOR
|
London Interbank Offered Rate
|
|
|
LIHTC
|
Low Income Housing Tax Credit
|
|
|
LTV
|
Loan to Value
|
|
|
MBS
|
Mortgage-Backed Securities
|
|
3
CITIZENS FINANCIAL GROUP, INC.
|
Mid-Atlantic
|
District of Columbia, Delaware, Maryland, New Jersey, New York, Pennsylvania, Virginia, and West Virginia
|
|
|
Midwest
|
Illinois, Indiana, Michigan, and Ohio
|
|
|
MD&A
|
Management’s Discussion and Analysis of Financial Condition and Results of Operations
|
|
|
MSRs
|
Mortgage Servicing Rights
|
|
|
New England
|
Connecticut, Maine, Massachusetts, New Hampshire, Rhode Island, and Vermont
|
|
|
NM
|
Not meaningful
|
|
|
NSFR
|
Net Stable Funding Ratio
|
|
|
OCC
|
Office of the Comptroller of the Currency
|
|
|
OCI
|
Other Comprehensive Income (Loss)
|
|
|
Parent Company
|
Citizens Financial Group, Inc. (the Parent Company of Citizens Bank, National Association and other subsidiaries)
|
|
|
ROTCE
|
Return on Average Tangible Common Equity
|
|
|
RPA
|
Risk Participation Agreement
|
|
|
SBA
|
Small Business Administration
|
|
|
SBO
|
Serviced by Others portfolio
|
|
|
SEC
|
United States Securities and Exchange Commission
|
|
|
SVaR
|
Stressed Value at Risk
|
|
|
TDR
|
Troubled Debt Restructuring
|
|
|
Tier 1 capital ratio
|
Tier 1 capital, which includes Common Equity Tier 1 capital plus non-cumulative perpetual preferred equity that qualifies as additional tier 1 capital, divided by total risk-weighted assets as defined under the U.S. Basel III Standardized approach
|
|
|
Tier 1 leverage ratio
|
Tier 1 capital, which includes Common Equity Tier 1 capital plus non-cumulative perpetual preferred equity that qualifies as additional tier 1 capital, divided by quarterly adjusted average assets as defined under the U.S. Basel III Standardized approach
|
|
|
Total capital ratio
|
Total capital, which includes Common Equity Tier 1 capital, tier 1 capital and allowance for credit losses and qualifying subordinated debt that qualifies as tier 2 capital, divided by total risk-weighted assets as defined under the U.S. Basel III Standardized approach
|
|
|
VaR
|
Value at Risk
|
|
|
VIE
|
Variable Interest Entities
|
|
4
CITIZENS FINANCIAL GROUP, INC.
PART I. FINANCIAL INFORMATION
ITEM 2. MANAGEMENT’S DISCUSSION AND ANALYSIS OF FINANCIAL CONDITION AND RESULTS OF OPERATIONS
|
Page
|
||
|
Forward-Looking Statements
|
||
|
Selected Consolidated Financial Data
|
||
|
Results of Operations
|
||
|
Analysis of Financial Condition
|
||
5
CITIZENS FINANCIAL GROUP, INC.
FORWARD-LOOKING STATEMENTS
FORWARD-LOOKING STATEMENTS
This document contains forward-looking statements within the meaning of the Private Securities Litigation Reform Act of 1995. Statements regarding potential future share repurchases and future dividends are forward-looking statements. Also, any statement that does not describe historical or current facts is a forward-looking statement. These statements often include the words “believes,” “expects,” “anticipates,” “estimates,” “intends,” “plans,” “goals,” “targets,” “initiatives,” “potentially,” “probably,” “projects,” “outlook” or similar expressions or future conditional verbs such as “may,” “will,” “should,” “would,” and “could.”
Forward-looking statements are based upon the current beliefs and expectations of management, and on information currently available to management. Our statements speak as of the date hereof, and we do not assume any obligation to update these statements or to update the reasons why actual results could differ from those contained in such statements in light of new information or future events. We caution you, therefore, against relying on any of these forward-looking statements. They are neither statements of historical fact nor guarantees or assurances of future performance. While there is no assurance that any list of risks and uncertainties or risk factors is complete, important factors that could cause actual results to differ materially from those in the forward-looking statements include the following, without limitation:
|
•
|
Negative economic and political conditions that adversely affect the general economy, housing prices, the job market, consumer confidence and spending habits which may affect, among other things, the level of nonperforming assets, charge-offs and provision expense;
|
|
•
|
The rate of growth in the economy and employment levels, as well as general business and economic conditions, and changes in the competitive environment;
|
|
•
|
Our ability to implement our business strategy, including the cost savings and efficiency components, and achieve our financial performance goals;
|
|
•
|
Our ability to meet heightened supervisory requirements and expectations;
|
|
•
|
Liabilities and business restrictions resulting from litigation and regulatory investigations;
|
|
•
|
Our capital and liquidity requirements (including under regulatory capital standards, such as the U.S. Basel III capital rules) and our ability to generate capital internally or raise capital on favorable terms;
|
|
•
|
The effect of changes in interest rates on our net interest income, net interest margin and our mortgage originations, mortgage servicing rights and mortgages held for sale;
|
|
•
|
Changes in interest rates and market liquidity, as well as the magnitude of such changes, which may reduce interest margins, impact funding sources and affect the ability to originate and distribute financial products in the primary and secondary markets;
|
|
•
|
The effect of changes in the level of checking or savings account deposits on our funding costs and net interest margin;
|
|
•
|
Financial services reform and other current, pending or future legislation or regulation that could have a negative effect on our revenue and businesses, including the Dodd-Frank Act and other legislation and regulation relating to bank products and services;
|
|
•
|
A failure in or breach of our operational or security systems or infrastructure, or those of our third party vendors or other service providers, including as a result of cyber-attacks; and
|
|
•
|
Management’s ability to identify and manage these and other risks.
|
In addition to the above factors, we also caution that the actual amounts and timing of any future common stock dividends or share repurchases will be subject to various factors, including our capital position, financial performance, capital impacts of strategic initiatives, market conditions and regulatory and accounting considerations, as well as any other factors that our Board of Directors deems relevant in making such a determination. Therefore, there can be no assurance that we will repurchase shares or pay any dividends to holders of our common stock, or as to the amount of any such repurchases or dividends.
More information about factors that could cause actual results to differ materially from those described in the forward-looking statements can be found in the “Risk Factors” section in Part I, Item 1A. of our Annual Report on Form 10-K for the year ended December 31, 2018.
6
CITIZENS FINANCIAL GROUP, INC.
MANAGEMENT’S DISCUSSION AND ANALYSIS
INTRODUCTION
Citizens Financial Group, Inc. is one of the nation’s oldest and largest financial institutions with
$161.3 billion
in assets as of
March 31, 2019
.
Our mission is to help our customers, colleagues and communities reach their potential. Headquartered in Providence, Rhode Island, we offer a broad range of retail and commercial banking products and services to individuals, small businesses, middle-market companies, large corporations and institutions. We help our customers reach their potential by listening to them and by understanding their needs in order to offer tailored advice, ideas and solutions. In Consumer Banking, we provide an integrated experience that includes mobile and online banking, a 24/7 customer contact center and the convenience of approximately 2,900 ATMs and approximately 1,100 branches in 11 states in the New England, Mid-Atlantic, and Midwest regions. Consumer Banking products and services include a full range of banking, lending, savings, wealth management and small business offerings. In Commercial Banking, we offer corporate, institutional and not-for-profit clients a full range of wholesale banking products and services including lending and deposits, capital markets, treasury services, foreign exchange and interest rate products, and asset finance. More information is available at www.citizensbank.com.
The following MD&A is intended to assist readers in their analysis of the accompanying unaudited interim Consolidated Financial Statements and supplemental financial information. It should be read in conjunction with the unaudited interim Consolidated Financial Statements and Notes to the unaudited interim Consolidated Financial Statements in Item 1 of this Form 10-Q, as well as other information contained in this document and our Annual Report on Form 10-K for the year ended December 31, 2018.
Key Performance Metrics Used by Management and Non-GAAP Financial Measures
As a banking institution, we manage and evaluate various aspects of our results of operations and our financial condition. We evaluate the levels and trends of the line items included in our balance sheet and statement of operations, as well as various financial ratios that are commonly used in our industry. We analyze these ratios and financial trends against our own historical performance, our budgeted performance and the financial condition and performance of comparable banking institutions in our region and nationally.
The primary line items we use in our key performance metrics to manage and evaluate our statement of operations include net interest income, noninterest income, total revenue, provision for credit losses, noninterest expense, net income and net income available to common stockholders. The primary line items we use in our key performance metrics to manage and evaluate our balance sheet data include loans and leases, securities, allowance for credit losses, deposits, borrowed funds and derivatives.
We consider various measures when evaluating our performance and making day-to-day operating decisions, as well as evaluating capital utilization and adequacy, including:
|
•
|
Return on average common equity, which we define as annualized net income available to common stockholders divided by average common equity;
|
|
•
|
Return on average tangible common equity, which we define as annualized net income available to common stockholders divided by average common equity excluding average goodwill (net of related deferred tax liability) and average other intangibles;
|
|
•
|
Return on average total assets, which we define as annualized net income divided by average total assets;
|
|
•
|
Return on average total tangible assets, which we define as annualized net income divided by average total assets excluding average goodwill (net of related deferred tax liability) and average other intangibles;
|
|
•
|
Efficiency ratio, which we define as the ratio of our total noninterest expense to the sum of net interest income and total noninterest income. We measure our efficiency ratio to evaluate the efficiency of our operations as it helps us monitor how costs are changing compared to our income. A decrease in our efficiency ratio represents improvement;
|
|
•
|
Operating leverage, which we define as the percent change in total revenue, less the percent change in noninterest expense;
|
|
•
|
Net interest margin, which we calculate by dividing annualized net interest income for the period by average total interest-earning assets, is a key measure that we use to evaluate our net interest income; and
|
|
•
|
Common equity tier 1 capital ratio, which represents CET1 capital divided by total risk-weighted assets as defined under the U.S. Basel III Standardized approach.
|
7
CITIZENS FINANCIAL GROUP, INC.
MANAGEMENT’S DISCUSSION AND ANALYSIS
This document contains non-GAAP financial measures denoted as “Underlying” results. “Underlying” results for any given reporting period exclude certain items that may occur in that period which Management does not consider indicative of the Company’s on-going financial performance. We believe these non-GAAP financial measures provide useful information to investors because they are used by our Management to evaluate our operating performance and make day-to-day operating decisions. In addition, we believe our “Underlying” results in any given reporting period reflect our on-going financial performance and increase comparability of period-to-period results, and accordingly, are useful to consider in addition to our GAAP financial results.
Other companies may use similarly titled non-GAAP financial measures that are calculated differently from the way we calculate such measures. Accordingly, our non-GAAP financial measures may not be comparable to similar measures used by such companies. We caution investors not to place undue reliance on such non-GAAP financial measures, but to consider them with the most directly comparable GAAP measures. Non-GAAP financial measures have limitations as analytical tools and should not be considered in isolation or as a substitute for our results reported under GAAP.
Non-GAAP measures are denoted throughout the MD&A by the use of the term “Underlying” and/or are followed by an asterisk (*). For additional information regarding our non-GAAP financial measures and reconciliations, see “—Key Performance Metrics, Non-GAAP Financial Measures and Reconciliations” included in this Report.
8
CITIZENS FINANCIAL GROUP, INC.
MANAGEMENT’S DISCUSSION AND ANALYSIS
FINANCIAL PERFORMANCE
First Quarter 2019 compared with First Quarter 2018 - Key Highlights
First quarter
2019
net income of
$439 million
increase
d
13%
from
$388 million
in first quarter
2018
, with earnings per diluted common share of
$0.92
, up
18%
from
$0.78
per diluted common share in first quarter
2018
. First quarter
2019
ROTCE of
13.0%
improved from
11.7%
in first quarter
2018
.
There were
$4 million
after-tax, or
$0.01
per diluted common share, of notable items recorded in first quarter
2019
tied to integration costs associated with Acquisitions. There were no notable items recorded in first quarter
2018
.
|
Three Months Ended March 31,
|
|||||||||||||||||||||||
|
2019
|
2018
|
||||||||||||||||||||||
|
(in millions)
|
Noninterest expense
|
Income tax expense
|
Net Income
|
Noninterest expense
|
Income tax expense
|
Net Income
|
|||||||||||||||||
|
Reported results (GAAP):
|
|
$937
|
|
|
$127
|
|
|
$439
|
|
|
$883
|
|
|
$113
|
|
|
$388
|
|
|||||
|
Less notable items:
|
|||||||||||||||||||||||
|
Total integration costs
|
5
|
|
(1
|
)
|
(4
|
)
|
—
|
|
—
|
|
—
|
|
|||||||||||
|
Underlying results* (non-GAAP)
|
|
$932
|
|
|
$128
|
|
|
$443
|
|
|
$883
|
|
|
$113
|
|
|
$388
|
|
|||||
* Where there is a reference to “Underlying” results in a paragraph, all measures that follow these references are on the same basis when applicable. For more information on the computation of key performance metrics and non-GAAP financial measures, see “—Introduction — Key Performance Metrics Used By Management and Non-GAAP Financial Measures” and “—Key Performance Metrics, Non-GAAP Financial Measures and Reconciliations.”
|
•
|
Net income available to common stockholders of
$424 million
increase
d
$43 million
, or
11%
, compared to
$381 million
in first quarter
2018
, driven by
9%
revenue growth, with
6%
growth in net interest income and
15%
growth in noninterest income.
|
|
◦
|
On an Underlying basis,* net income available to common stockholders increased
$47 million
, or
12%
, to
$428 million
from first quarter
2018
.
|
|
•
|
Total revenue of
$1.6 billion
increase
d
$126 million
, or
9%
, from first quarter 2018, driven by strength in net interest income and noninterest income.
|
|
◦
|
Net interest income of
$1.2 billion
increase
d
$69 million
, or
6%
, compared to
$1.1 billion
in first quarter
2018
, driven by improvement in net interest margin and
6%
average loan growth.
|
|
◦
|
Net interest margin of
3.23%
increase
d by
four
basis points, compared to
3.19%
in first quarter
2018
, reflecting the benefit of higher short-term interest rates and continued mix shift towards higher-yielding assets, partially offset by an increase in funding costs and the impact of lower long-term rates on securities premium amortization.
|
|
–
|
Net interest margin on a fully taxable-equivalent basis of
3.25%
increase
d by
four
basis points, compared to
3.21%
in first quarter
2018
.
|
|
–
|
Average loans and leases of
$117.6 billion
increase
d
$6.5 billion
, or
6%
, from
$111.1 billion
in first quarter
2018
, reflecting a
$5.1 billion
increase
in commercial loans and leases and a
$1.5 billion
increase
in retail loans.
|
|
–
|
Average deposits of
$120.4 billion
increase
d
$7.0 billion
, or
6%
, from
$113.4 billion
in first quarter
2018
, reflecting strength in term, savings and checking with interest.
|
|
◦
|
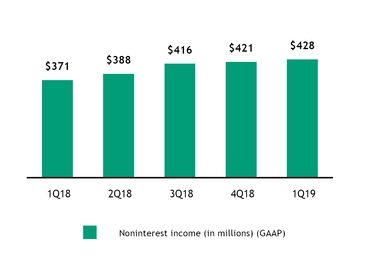
Noninterest income of
$428 million
increase
d
$57 million
, or
15%
, from first quarter
2018
, driven by increased capital markets and foreign exchange and interest rate products revenues, reflecting the benefit of investments to broaden and enhance our capabilities. Results also reflected increased mortgage banking, trust and investment services fees, and letter of credit and loan fees. Higher other income reflected asset dispositions tied to balance sheet optimization and efficiency initiatives.
|
|
•
|
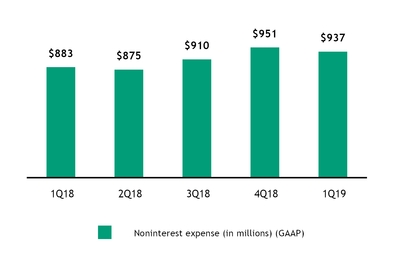
Noninterest expense of
$937 million
increase
d
$54 million
, or
6%
, compared to
$883 million
in first quarter
2018
, reflecting increased salaries and employee benefits, which included the impact of annual merit increases, revenue driven incentives and strategic growth initiatives. First quarter 2019 results also included an increase in equipment and software expense reflecting the impact of growth initiatives. These increases were partially offset by lower other operating expense, largely tied to a reduction in FDIC insurance premiums.
|
|
◦
|
On an Underlying basis,* noninterest expense increased
$49 million
, or
6%
, from first quarter
2018
.
|
9
CITIZENS FINANCIAL GROUP, INC.
MANAGEMENT’S DISCUSSION AND ANALYSIS
|
•
|
Continued focus on top-line growth and expense management helped deliver positive operating leverage of
2.6%
from first quarter
2018
, and a 143 basis point improvement in the efficiency ratio to
59.0%
.
|
|
◦
|
On an Underlying basis,* operating leverage was
3.2%
(which included a 179 basis point reduction related to Acquisitions) and the efficiency ratio improved
176
basis points to
58.7%
from first quarter
2018
.
|
|
•
|
ROTCE of
13.0%
improved 129 basis points from
11.7%
in first quarter
2018
.
|
|
◦
|
On an Underlying basis,* ROTCE improved 141 basis points in first quarter
2019
to
13.1%
.
|
|
•
|
Tangible book value per common share improved to
$29.60
, up
9%
, from first quarter
2018
. Fully diluted average common shares outstanding
decrease
d
5%
, or
26.7 million
shares over the same period.
|
|
•
|
Provision for credit losses of
$85 million
increase
d
$7 million
, or
9%
, from
$78 million
in first quarter
2018
, reflecting expected increases in commercial from a net recovery position in first quarter 2018, expected seasoning in retail unsecured and the impact of loan growth.
|
|
•
|
Net charge-offs of
$89 million
increased
$19 million
, or
27%
, from
$70 million
in first quarter
2018
. The ALLL of
$1.2 billion
remained stable compared to December 31,
2018
.
|
|
◦
|
ALLL to loans and leases ratio of
1.06%
as of
March 31, 2019
compared with
1.06%
as of December 31,
2018
.
|
|
◦
|
ALLL to nonperforming loans and leases ratio of
160%
as of
March 31, 2019
, compared with
156%
as of December 31,
2018
.
|
|
•
|
The effective income tax rate decreased to
22.4%
from
22.5%
in first quarter
2018
, primarily driven by a reduction in non-deductible FDIC premiums, partially offset by a reduction in excess tax benefits for equity-based compensation.
|
10
CITIZENS FINANCIAL GROUP, INC.
MANAGEMENT’S DISCUSSION AND ANALYSIS
SELECTED CONSOLIDATED FINANCIAL DATA
The summary Consolidated Operating Data for the three months ended
March 31, 2019
and
2018
and the summary Consolidated Balance Sheet data as of
March 31, 2019
and
December 31, 2018
are derived from our unaudited interim Consolidated Financial Statements, included in Part I, Item 1 — Financial Statements of this Report. Our historical results are not necessarily indicative of the results expected for any future period.
|
Three Months Ended March 31,
|
|||||||
|
(dollars in millions, except per share amounts)
|
2019
|
2018
|
|||||
|
OPERATING DATA:
|
|||||||
|
Net interest income
|
|
$1,160
|
|
|
$1,091
|
|
|
|
Noninterest income
|
428
|
|
371
|
|
|||
|
Total revenue
|
1,588
|
|
1,462
|
|
|||
|
Provision for credit losses
|
85
|
|
78
|
|
|||
|
Noninterest expense
|
937
|
|
883
|
|
|||
|
Income before income tax expense
|
566
|
|
501
|
|
|||
|
Income tax expense
|
127
|
|
113
|
|
|||
|
Net income
|
|
$439
|
|
|
$388
|
|
|
|
Net income available to common stockholders
|
|
$424
|
|
|
$381
|
|
|
|
Net income per common share - basic
|
|
$0.92
|
|
|
$0.78
|
|
|
|
Net income per common share - diluted
|
|
$0.92
|
|
|
$0.78
|
|
|
|
OTHER OPERATING DATA
(1)
:
|
|||||||
|
Return on average common equity
|
8.62
|
%
|
7.83
|
%
|
|||
|
Return on average tangible common equity
|
13.00
|
|
11.71
|
|
|||
|
Return on average total assets
|
1.11
|
|
1.04
|
|
|||
|
Return on average total tangible assets
|
1.16
|
|
1.08
|
|
|||
|
Efficiency ratio
|
59.00
|
|
60.43
|
|
|||
|
Operating leverage
(2)
|
2.57
|
|
2.14
|
|
|||
|
Net interest margin
(3)
|
3.23
|
|
3.19
|
|
|||
|
Effective income tax rate
|
22.42
|
|
22.52
|
|
|||
(1)
See “—Key Performance Metrics, Non-GAAP Financial Measures and Reconciliations” for definitions of our key performance metrics.
(2)
“Operating leverage” represents the period-over-period percent change in total revenue, less the period-over-period percent change in noninterest expense.
(3)
In the first quarter of 2019, we changed the method of calculating our net interest margin to equal net interest income, annualized based on the number of
days in the period, divided by average total interest-earning assets. Prior periods have been adjusted to conform with the current period presentation.
11
CITIZENS FINANCIAL GROUP, INC.
MANAGEMENT’S DISCUSSION AND ANALYSIS
|
(dollars in millions)
|
March 31,
2019 |
December 31,
2018 |
|||||
|
BALANCE SHEET DATA:
|
|||||||
|
Total assets
|
|
$161,342
|
|
|
$160,518
|
|
|
|
Loans held for sale, at fair value
|
1,186
|
|
1,219
|
|
|||
|
Other loans held for sale
|
66
|
|
101
|
|
|||
|
Loans and leases
|
117,615
|
|
116,660
|
|
|||
|
Allowance for loan and lease losses
|
(1,245
|
)
|
(1,242
|
)
|
|||
|
Total securities
|
25,651
|
|
25,075
|
|
|||
|
Goodwill
|
7,040
|
|
6,923
|
|
|||
|
Total liabilities
|
139,811
|
|
139,701
|
|
|||
|
Total deposits
|
123,916
|
|
119,575
|
|
|||
|
Federal funds purchased and securities sold under agreements to repurchase
|
668
|
|
1,156
|
|
|||
|
Other short-term borrowed funds
(1)
|
11
|
|
161
|
|
|||
|
Long-term borrowed funds
(1)
|
11,725
|
|
15,925
|
|
|||
|
Total stockholders’ equity
|
21,531
|
|
20,817
|
|
|||
|
OTHER BALANCE SHEET DATA:
|
|||||||
|
Asset Quality Ratios:
|
|||||||
|
Allowance for loan and lease losses as a percentage of loans and leases
|
1.06
|
%
|
1.06
|
%
|
|||
|
Allowance for loan and lease losses as a percentage of nonperforming loans and leases
|
159.68
|
|
155.99
|
|
|||
|
Nonperforming loans and leases as a percentage of loans and leases
|
0.66
|
|
0.68
|
|
|||
|
Capital Ratios:
|
|||||||
|
CET1 capital ratio
(2)
|
10.5
|
%
|
10.6
|
%
|
|||
|
Tier 1 capital ratio
|
11.3
|
|
11.3
|
|
|||
|
Total capital ratio
|
13.4
|
|
13.3
|
|
|||
|
Tier 1 leverage ratio
|
10.0
|
|
10.0
|
|
|||
(1)
Beginning in the first quarter of 2019, borrowed funds balances and the associated interest expense are classified based on original maturity. Prior periods have been adjusted to conform with the current period presentation.
(2)
See “—Key Performance Metrics, Non-GAAP Financial Measures and Reconciliations” for definitions of our key performance metrics.
12
CITIZENS FINANCIAL GROUP, INC.
MANAGEMENT’S DISCUSSION AND ANALYSIS
RESULTS OF OPERATIONS
Net Income
The following table presents the significant components of our net income:
|
Three Months Ended March 31,
|
||||||||||||||
|
(dollars in millions)
|
2019
|
|
2018
|
|
Change
|
Percent
|
|
|||||||
|
Net interest income
|
|
$1,160
|
|
|
$1,091
|
|
|
$69
|
|
6
|
%
|
|||
|
Noninterest income
|
428
|
|
371
|
|
57
|
|
15
|
|
||||||
|
Total revenue
|
1,588
|
|
1,462
|
|
126
|
|
9
|
|
||||||
|
Provision for credit losses
|
85
|
|
78
|
|
7
|
|
9
|
|
||||||
|
Noninterest expense
|
937
|
|
883
|
|
54
|
|
6
|
|
||||||
|
Income before income tax expense
|
566
|
|
501
|
|
65
|
|
13
|
|
||||||
|
Income tax expense
|
127
|
|
113
|
|
14
|
|
12
|
|
||||||
|
Net income
|
|
$439
|
|
|
$388
|
|
|
$51
|
|
13
|
|
|||
|
Net income available to common stockholders
|
|
$424
|
|
|
$381
|
|
|
$43
|
|
11
|
%
|
|||
|
Return on average common equity
|
8.62
|
%
|
7.83
|
%
|
79
|
bps
|
||||||||
|
Return on average tangible common equity
(1)
|
13.00
|
%
|
11.71
|
%
|
129
|
bps
|
||||||||
(1)
See “—Key Performance Metrics, Non-GAAP Financial Measures and Reconciliations” for definitions of our key performance metrics.
Net Interest Income
Net interest income is our largest source of revenue and is the difference between the interest earned on interest-earning assets (generally loans, leases and investment securities) and the interest expense incurred in connection with interest-bearing liabilities (generally deposits and borrowed funds). The level of net interest income is primarily a function of the difference between the effective yield on our average interest-earning assets and the effective cost of our interest-bearing liabilities. These factors are influenced by the pricing and mix of interest-earning assets and interest-bearing liabilities which, in turn, are impacted by external factors such as local economic conditions, competition for loans and deposits, the monetary policy of the FRB and market interest rates. For further discussion, refer to “—Market Risk — Non-Trading Risk,” included in this Report and “—Risk Governance” as described in our Annual Report on Form 10-K for the year ended December 31, 2018.

13
CITIZENS FINANCIAL GROUP, INC.
MANAGEMENT’S DISCUSSION AND ANALYSIS
The following table presents the major components of net interest income and net interest margin:
|
Three Months Ended March 31,
|
|||||||||||||||||||||||
|
2019
|
2018
|
Change
|
|||||||||||||||||||||
|
(dollars in millions)
|
Average
Balances |
Income/
Expense |
Yields/
Rates |
Average
Balances |
Income/
Expense |
Yields/
Rates |
Average
Balances |
Yields/
Rates |
|||||||||||||||
|
Assets:
|
|||||||||||||||||||||||
|
Interest-bearing cash and due from banks and deposits in banks
|
|
$1,497
|
|
|
$8
|
|
2.19
|
%
|
|
$1,442
|
|
|
$6
|
|
1.61
|
%
|
|
$55
|
|
58 bps
|
|||
|
Taxable investment securities
|
25,136
|
|
166
|
|
2.64
|
|
25,433
|
|
168
|
|
2.64
|
|
(297
|
)
|
—
|
|
|||||||
|
Non-taxable investment securities
|
5
|
|
—
|
|
2.60
|
|
6
|
|
—
|
|
2.60
|
|
(1
|
)
|
—
|
|
|||||||
|
Total investment securities
|
25,141
|
|
166
|
|
2.64
|
|
25,439
|
|
168
|
|
2.64
|
|
(298
|
)
|
—
|
|
|||||||
|
Commercial
|
41,562
|
|
460
|
|
4.43
|
|
37,960
|
|
357
|
|
3.77
|
|
3,602
|
|
66
|
|
|||||||
|
Commercial real estate
|
13,272
|
|
165
|
|
4.98
|
|
11,549
|
|
119
|
|
4.11
|
|
1,723
|
|
87
|
|
|||||||
|
Leases
|
2,873
|
|
21
|
|
2.85
|
|
3,114
|
|
20
|
|
2.61
|
|
(241
|
)
|
24
|
|
|||||||
|
Total commercial loans and leases
|
57,707
|
|
646
|
|
4.48
|
|
52,623
|
|
496
|
|
3.77
|
|
5,084
|
|
71
|
|
|||||||
|
Residential mortgages
|
19,094
|
|
175
|
|
3.67
|
|
17,162
|
|
153
|
|
3.56
|
|
1,932
|
|
11
|
|
|||||||
|
Home equity loans
|
1,039
|
|
16
|
|
6.05
|
|
1,342
|
|
19
|
|
5.76
|
|
(303
|
)
|
29
|
|
|||||||
|
Home equity lines of credit
|
12,552
|
|
159
|
|
5.13
|
|
13,353
|
|
138
|
|
4.20
|
|
(801
|
)
|
93
|
|
|||||||
|
Home equity loans serviced by others
|
385
|
|
7
|
|
7.75
|
|
520
|
|
9
|
|
7.31
|
|
(135
|
)
|
44
|
|
|||||||
|
Home equity lines of credit serviced by others
|
99
|
|
1
|
|
4.97
|
|
142
|
|
1
|
|
3.98
|
|
(43
|
)
|
99
|
|
|||||||
|
Automobile
|
12,070
|
|
120
|
|
4.04
|
|
13,015
|
|
112
|
|
3.47
|
|
(945
|
)
|
57
|
|
|||||||
|
Education
|
9,069
|
|
134
|
|
5.99
|
|
8,283
|
|
114
|
|
5.58
|
|
786
|
|
41
|
|
|||||||
|
Credit cards
|
1,998
|
|
53
|
|
10.76
|
|
1,828
|
|
48
|
|
10.70
|
|
170
|
|
6
|
|
|||||||
|
Other retail
|
3,636
|
|
70
|
|
7.83
|
|
2,847
|
|
56
|
|
7.97
|
|
789
|
|
(14
|
)
|
|||||||
|
Total retail loans
|
59,942
|
|
735
|
|
4.96
|
|
58,492
|
|
650
|
|
4.49
|
|
1,450
|
|
47
|
|
|||||||
|
Total loans and leases
|
117,649
|
|
1,381
|
|
4.72
|
|
111,115
|
|
1,146
|
|
4.15
|
|
6,534
|
|
57
|
|
|||||||
|
Loans held for sale, at fair value
|
1,035
|
|
11
|
|
4.35
|
|
420
|
|
4
|
|
3.84
|
|
615
|
|
51
|
|
|||||||
|
Other loans held for sale
|
191
|
|
4
|
|
7.03
|
|
255
|
|
4
|
|
6.21
|
|
(64
|
)
|
82
|
|
|||||||
|
Interest-earning assets
|
145,513
|
|
1,570
|
|
4.34
|
|
138,671
|
|
1,328
|
|
3.85
|
|
6,842
|
|
49
|
|
|||||||
|
Allowance for loan and lease losses
|
(1,243
|
)
|
(1,236
|
)
|
(7
|
)
|
|||||||||||||||||
|
Goodwill
|
7,018
|
|
6,887
|
|
131
|
|
|||||||||||||||||
|
Other noninterest-earning assets
|
9,127
|
|
7,201
|
|
1,926
|
|
|||||||||||||||||
|
Total assets
|
|
$160,415
|
|
|
$151,523
|
|
|
|
|
$8,892
|
|
||||||||||||
|
Liabilities and Stockholders’ Equity:
|
|||||||||||||||||||||||
|
Checking with interest
|
|
$22,987
|
|
|
$52
|
|
0.91
|
%
|
|
$21,665
|
|
|
$26
|
|
0.48
|
%
|
|
$1,322
|
|
43 bps
|
|||
|
Money market accounts
|
35,209
|
|
110
|
|
1.26
|
|
37,084
|
|
65
|
|
0.71
|
|
(1,875
|
)
|
55
|
||||||||
|
Regular savings
|
12,626
|
|
17
|
|
0.56
|
|
9,627
|
|
1
|
|
0.05
|
|
2,999
|
|
51
|
||||||||
|
Term deposits
|
21,127
|
|
108
|
|
2.08
|
|
16,503
|
|
53
|
|
1.30
|
|
4,624
|
|
78
|
||||||||
|
Total interest-bearing deposits
|
91,949
|
|
287
|
|
1.27
|
|
84,879
|
|
145
|
|
0.69
|
|
7,070
|
|
58
|
||||||||
|
Federal funds purchased and securities sold under agreements to repurchase
(1)
|
640
|
|
2
|
|
1.24
|
|
645
|
|
1
|
|
0.68
|
|
(5
|
)
|
56
|
||||||||
|
Other short-term borrowed funds
(2)
|
58
|
|
—
|
|
2.75
|
|
588
|
|
2
|
|
1.67
|
|
(530
|
)
|
108
|
||||||||
|
Long-term borrowed funds
(2)
|
14,736
|
|
121
|
|
3.27
|
|
14,442
|
|
89
|
|
2.46
|
|
294
|
|
81
|
||||||||
|
Total borrowed funds
|
15,434
|
|
123
|
|
3.18
|
|
15,675
|
|
92
|
|
2.36
|
|
(241
|
)
|
82
|
||||||||
|
Total interest-bearing liabilities
|
107,383
|
|
410
|
|
1.54
|
|
100,554
|
|
237
|
|
0.95
|
|
6,829
|
|
59
|
||||||||
|
Demand deposits
|
28,465
|
|
28,544
|
|
(79
|
)
|
|
||||||||||||||||
|
Other liabilities
|
3,584
|
|
2,446
|
|
1,138
|
|
|
||||||||||||||||
|
Total liabilities
|
139,432
|
|
131,544
|
|
7,888
|
|
|
||||||||||||||||
|
Stockholders’ equity
|
20,983
|
|
19,979
|
|
1,004
|
|
|
||||||||||||||||
|
Total liabilities and stockholders’ equity
|
|
$160,415
|
|
|
$151,523
|
|
|
$8,892
|
|
|
|||||||||||||
|
Interest rate spread
|
2.80
|
%
|
2.90
|
%
|
(10)
|
||||||||||||||||||
|
Net interest income and net interest margin
(3)
|
|
$1,160
|
|
3.23
|
%
|
|
$1,091
|
|
3.19
|
%
|
4 bps
|
||||||||||||
|
Net interest income and net interest margin, FTE
(4)
|
|
$1,166
|
|
3.25
|
%
|
|
$1,096
|
|
3.21
|
%
|
4 bps
|
||||||||||||
|
Memo: Total deposits (interest-bearing and demand)
|
|
$120,414
|
|
|
$287
|
|
0.97
|
%
|
|
$113,423
|
|
|
$145
|
|
0.52
|
%
|
|
$6,991
|
|
45 bps
|
|||
(1)
Balances are net of certain short-term receivables associated with reverse repurchase agreements, as applicable. Interest expense includes the full cost of the repurchase agreements and certain hedging costs. See “—Analysis of Financial Condition — Derivatives” for further information.
(2)
Beginning in the first quarter of 2019, borrowed funds balances and the associated interest expense are classified based on original maturity. Prior periods have been adjusted to conform with the current period presentation.
(3)
In the first quarter of 2019, we changed the method of calculating our net interest margin to equal net interest income, annualized based on the number of
days in the period, divided by average total interest-earning assets. Prior periods have been adjusted to conform with the current period presentation.
(4)
Net interest income and net interest margin is presented on a fully taxable-equivalent ("FTE") basis using the federal statutory tax rate of 21%. In the fully taxable-equivalent presentation of net interest income and net interest margin, interest income on tax-exempt assets is increased to make it fully equivalent to interest income earned on taxable assets. The FTE impact is predominantly attributable to commercial loans for the periods presented.
14
CITIZENS FINANCIAL GROUP, INC.
MANAGEMENT’S DISCUSSION AND ANALYSIS
Net interest margin of
3.23%
increase
d
four
basis points compared to
3.19%
in
first quarter
2018
, driven by higher interest-earning asset yields given higher interest rates and continued mix shift toward more attractive risk-adjusted return portfolios. These results were partially offset by higher funding costs and the impact of lower long-term rates on securities premium amortization. Net interest margin on an FTE basis of
3.25%
also increased
four
basis points compared to
3.21%
in
first quarter
2018
. Average interest-earning asset yields of
4.34%
increase
d
49
basis points from
3.85%
in
first quarter
2018
, while average interest-bearing liability costs of
1.54%
increase
d
59
basis points from
0.95%
in
first quarter
2018
.
Average interest-earning assets of
$145.5 billion
increase
d $
6.8 billion
, or
5%
, from
first quarter
2018
, driven by a
$5.1 billion
increase
in average commercial loans and leases and a
$1.5 billion
increase
in average retail loans, partially offset by a
$243 million
decrease
in average investments and interest-bearing cash and due from banks and deposits in banks. Commercial loan growth was driven by commercial and commercial real estate. Retail loan growth was driven by residential mortgage, education, credit cards and other retail.
Average deposits of
$120.4 billion
increase
d
$7.0 billion
from
first quarter
2018
, reflecting growth in term deposits, checking with interest, and savings. Total interest-bearing deposit costs of
$287 million
increase
d
$142 million
, or
98%
, from
$145 million
in
first quarter
2018, primarily due to rising rates.
Average total borrowed funds of
$15.4 billion
decrease
d
$241 million
from
first quarter
2018
, reflecting a decrease in other short-term borrowed funds and a decrease in federal funds purchased and repurchase agreements, partially offset by an increase in long-term borrowed funds, primarily senior debt. Total borrowed funds costs of
$123 million
increase
d
$31 million
from
first quarter
2018
. The total borrowed funds cost of
3.18%
increase
d
82
basis points from
2.36%
in
first quarter
2018
due to an increase in long-term rates and a mix shift to long-term senior debt.
Noninterest Income
The following table presents the significant components of our noninterest income:
|
Three Months Ended March 31,
|
||||||||||||||
|
(in millions)
|
2019
|
|
2018
|
|
Change
|
|
Percent
|
|
||||||
|
Service charges and fees
|
|
$123
|
|
|
$124
|
|
|
($1
|
)
|
(1
|
%)
|
|||
|
Card fees
|
59
|
|
61
|
|
(2
|
)
|
(3
|
)
|
||||||
|
Capital markets fees
|
54
|
|
39
|
|
15
|
|
38
|
|
||||||
|
Trust and investment services fees
|
47
|
|
40
|
|
7
|
|
18
|
|
||||||
|
Mortgage banking fees
|
43
|
|
25
|
|
18
|
|
72
|
|
||||||
|
Letter of credit and loan fees
|
33
|
|
30
|
|
3
|
|
10
|
|
||||||
|
Foreign exchange and interest rate products
|
36
|
|
27
|
|
9
|
|
33
|
|
||||||
|
Securities gains, net
|
8
|
|
8
|
|
—
|
|
—
|
|
||||||
|
Other income
(1)
|
25
|
|
17
|
|
8
|
|
47
|
|
||||||
|
Noninterest income
|
|
$428
|
|
|
$371
|
|
|
$57
|
|
15
|
%
|
|||
(1)
Includes net impairment losses recognized in earnings on available for sale debt securities, bank-owned life insurance income and other income.
15
CITIZENS FINANCIAL GROUP, INC.
MANAGEMENT’S DISCUSSION AND ANALYSIS
Noninterest income
increase
d
$57 million
from first quarter
2018
driven by increased capital markets and foreign exchange and interest rate products revenues, reflecting the benefit of investments to broaden and enhance our capabilities. Results also reflected increased mortgage banking, trust and investment services fees, and letter of credit and loan fees. Higher other income reflected asset dispositions tied to balance sheet optimization and efficiency initiatives.
Provision for Credit Losses
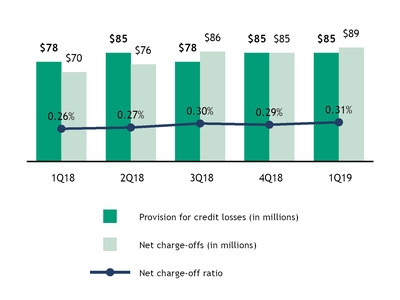
The provision for credit losses of
$85 million
increase
d
$7 million
compared to
$78 million
in first quarter 2018, reflecting moderately higher losses. First quarter 2019 results reflected a
$4 million
ACL release
, compared to an
$8 million
ACL build
in first quarter 2018. Net charge-offs for first quarter 2019 of
$89 million
were
$19 million
higher than first quarter 2018 due to an increase in commercial losses, which reflected the impact of a commercial real estate credit and a reduction in commercial recoveries.
The provision for loan and lease losses is the result of a detailed analysis performed to estimate an appropriate and adequate ACL. The total provision for credit losses includes the provision for loan and lease losses as well as the provision for unfunded commitments. Refer to “—Analysis of Financial Condition — Allowance for Credit Losses and Nonperforming Assets” for more information.
16
CITIZENS FINANCIAL GROUP, INC.
MANAGEMENT’S DISCUSSION AND ANALYSIS
Noninterest Expense
The following table presents the significant components of our noninterest expense:
|
Three Months Ended March 31,
|
||||||||||||||
|
(in millions)
|
2019
|
|
2018
|
|
Change
|
|
Percent
|
|
||||||
|
Salaries and employee benefits
|
|
$509
|
|
|
$470
|
|
|
$39
|
|
8
|
%
|
|||
|
Equipment and software expense
(1)
|
125
|
|
113
|
|
12
|
|
11
|
|
||||||
|
Outside services
|
110
|
|
99
|
|
11
|
|
11
|
|
||||||
|
Occupancy
|
83
|
|
81
|
|
2
|
|
2
|
|
||||||
|
Other operating expense
|
110
|
|
120
|
|
(10
|
)
|
(8
|
)
|
||||||
|
Noninterest expense
|
|
$937
|
|
|
$883
|
|
|
$54
|
|
6
|
%
|
|||
(1)
In the first quarter of 2019, we combined our presentation of equipment expense and amortization of software into equipment and software expense. Prior periods have been adjusted to conform with the current period presentation.
Noninterest expense
increase
d
$54 million
from first quarter
2018
, driven by an increase in salaries and employee benefits, which included the impact of annual merit increases, revenue driven incentives and strategic growth initiatives. First quarter 2019 results included an increase in equipment and software expense, which also reflected the impact of growth initiatives. These increases were partially offset by lower other operating expense, largely tied to a reduction in FDIC insurance premiums. Underlying noninterest expense* increased $49 million, or 6%.
17
CITIZENS FINANCIAL GROUP, INC.
MANAGEMENT’S DISCUSSION AND ANALYSIS
Income Tax Expense
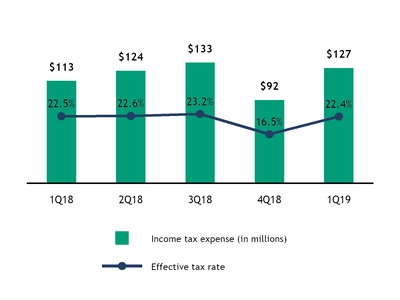
Income tax expense was
$127 million
and
$113 million
in first quarter
2019
and
2018
, respectively. Our effective income tax rates in first quarter
2019
and
2018
were
22.4%
and
22.5%
, respectively. The decrease in the effective income tax rate was driven by a reduction in non-deductible FDIC insurance premiums, partially offset by a reduction in excess tax benefits for equity-based compensation.
18
CITIZENS FINANCIAL GROUP, INC.
MANAGEMENT’S DISCUSSION AND ANALYSIS
Business Operating Segments
The following tables present certain financial data of our business operating segments, Other and consolidated:
|
As of and for the Three Months Ended March 31, 2019
|
|||||||||||||||
|
(dollars in millions)
|
Consumer Banking
|
Commercial Banking
|
Other
(4)
|
|
Consolidated
|
|
|||||||||
|
Net interest income
|
|
$788
|
|
|
$372
|
|
|
$—
|
|
|
$1,160
|
|
|||
|
Noninterest income
|
247
|
|
150
|
|
31
|
|
428
|
|
|||||||
|
Total revenue
|
1,035
|
|
522
|
|
31
|
|
1,588
|
|
|||||||
|
Noninterest expense
|
700
|
|
209
|
|
28
|
|
937
|
|
|||||||
|
Profit before provision for credit losses
|
335
|
|
313
|
|
3
|
|
651
|
|
|||||||
|
Provision for credit losses
|
67
|
|
21
|
|
(3
|
)
|
85
|
|
|||||||
|
Income before income tax expense (benefit)
|
268
|
|
292
|
|
6
|
|
566
|
|
|||||||
|
Income tax expense (benefit)
|
66
|
|
65
|
|
(4
|
)
|
127
|
|
|||||||
|
Net income
|
|
$202
|
|
|
$227
|
|
|
$10
|
|
|
$439
|
|
|||
|
Loans and leases (period-end)
(1)
|
|
$62,339
|
|
|
$54,267
|
|
|
$2,261
|
|
|
$118,867
|
|
|||
|
Average Balances:
|
|||||||||||||||
|
Total assets
|
|
$65,007
|
|
|
$55,630
|
|
|
$39,778
|
|
|
$160,415
|
|
|||
|
Total loans and leases
(1)
|
62,163
|
|
54,436
|
|
2,276
|
|
118,875
|
|
|||||||
|
Deposits
|
82,569
|
|
29,823
|
|
8,022
|
|
120,414
|
|
|||||||
|
Interest-earning assets
|
62,216
|
|
54,724
|
|
28,573
|
|
145,513
|
|
|||||||
|
Key Performance Metrics:
|
|||||||||||||||
|
Net interest margin
(2)(3)
|
5.14
|
%
|
2.76
|
%
|
NM
|
|
3.23
|
%
|
|||||||
|
Efficiency ratio
|
67.62
|
|
40.11
|
|
NM
|
|
59.00
|
|
|||||||
|
Loans-to-deposits ratio (average balances)
|
74.27
|
|
181.23
|
|
NM
|
|
97.70
|
|
|||||||
|
Return on average total tangible assets
(2)
|
1.26
|
|
1.66
|
|
NM
|
|
1.16
|
|
|||||||
(1)
Includes LHFS.
(2)
Ratios for the period ended March 31, 2019 are presented on an annualized basis.
(3)
In the first quarter of 2019, we changed the method of calculating our net interest margin to equal net interest income, annualized based on the number of days in the period, divided by average total interest-earning assets. Prior period have been adjusted to conform with the current period presentation.
(4)
Includes the financial impact of non-core, liquidating loan portfolios and other non-core assets, our treasury activities, wholesale funding activities, securities portfolio, community development assets and other unallocated assets, liabilities, capital, revenues, provision for credit losses, expenses and income tax expense, not attributed to our Consumer Banking or Commercial Banking segments. For a description of non-core assets, see “—Analysis of Financial Condition — Allowance for Credit Losses and Nonperforming Assets — Non-Core Assets.”
19
CITIZENS FINANCIAL GROUP, INC.
MANAGEMENT’S DISCUSSION AND ANALYSIS
|
As of and for the Three Months Ended March 31, 2018
|
||||||||||||||||
|
(dollars in millions)
|
Consumer Banking
|
Commercial Banking
|
Other
(5)
|
|
Consolidated
|
|||||||||||
|
Net interest income
|
|
$733
|
|
|
$357
|
|
|
$1
|
|
|
$1,091
|
|
||||
|
Noninterest income
|
222
|
|
125
|
|
24
|
|
371
|
|
||||||||
|
Total revenue
|
955
|
|
482
|
|
25
|
|
1,462
|
|
||||||||
|
Noninterest expense
|
656
|
|
208
|
|
19
|
|
883
|
|
||||||||
|
Profit before provision for credit losses
|
299
|
|
274
|
|
6
|
|
579
|
|
||||||||
|
Provision for credit losses
|
72
|
|
(4
|
)
|
10
|
|
78
|
|
||||||||
|
Income (loss) before income tax expense (benefit)
|
227
|
|
278
|
|
(4
|
)
|
501
|
|
||||||||
|
Income tax expense (benefit)
|
57
|
|
63
|
|
(7
|
)
|
113
|
|
||||||||
|
Net income
|
|
$170
|
|
|
$215
|
|
|
$3
|
|
|
$388
|
|
||||
|
Loans and leases (period-end)
(1)
|
|
$59,795
|
|
|
$49,868
|
|
|
$2,562
|
|
|
$112,225
|
|
||||
|
Average Balances:
|
||||||||||||||||
|
Total assets
|
|
$61,348
|
|
|
$50,393
|
|
|
$39,782
|
|
|
$151,523
|
|
||||
|
Total loans and leases
(1)
|
59,942
|
|
—
|
|
49,285
|
|
2,563
|
|
111,790
|
|
||||||
|
Deposits
|
75,416
|
|
30,766
|
|
7,241
|
|
113,423
|
|
||||||||
|
Interest-earning assets
|
59,994
|
|
49,479
|
|
29,198
|
|
138,671
|
|
||||||||
|
Key Performance Metrics
|
||||||||||||||||
|
Net interest margin
(2)(3)
|
4.96
|
%
|
2.93
|
%
|
NM
|
|
3.19
|
%
|
||||||||
|
Efficiency ratio
|
68.72
|
|
43.07
|
|
NM
|
|
60.43
|
|
||||||||
|
Loans-to-deposits ratio (average balances)
(4)
|
79.14
|
|
158.84
|
|
NM
|
|
97.96
|
|
||||||||
|
Return on average total tangible assets
(2)
|
1.12
|
|
1.73
|
|
NM
|
|
1.08
|
|
||||||||
(1)
Includes LHFS.
(2)
Ratios for the period ended March 31, 2018 are presented on an annualized basis.
(3)
In the first quarter of 2019, we changed the method of calculating our net interest margin to equal net interest income, annualized based on the number of days in the period, divided by average total interest-earning assets. Prior period have been adjusted to conform with the current period presentation.
(4)
We revised our method of calculating the loans-to-deposits ratio in the third quarter of 2018 to exclude LHFS. Prior periods have been adjusted to conform with the current period presentation.
(5)
Includes the financial impact of non-core, liquidating loan portfolios and other non-core assets, our treasury activities, wholesale funding activities, securities portfolio, community development assets and other unallocated assets, liabilities, capital, revenues, provision for credit losses, expenses and income tax expense, not attributed to our Consumer Banking or Commercial Banking segments. For a description of non-core assets, see “—Analysis of Financial Condition — Allowance for Credit Losses and Nonperforming Assets — Non-Core Assets.”
We have two business operating segments: Consumer Banking and Commercial Banking. Segment results are derived by specifically attributing managed assets, liabilities, capital and related revenues, provision for credit losses and expenses. Non-segment operations are classified as Other, which includes corporate functions, the Treasury function, the securities portfolio, wholesale funding activities, intangible assets not directly allocated to a business operating segment, community development, non-core assets (including legacy Royal Bank of Scotland Group plc aircraft loan and leasing), and other unallocated assets, liabilities, capital, revenues, provision for credit losses, expenses and income tax expense. For a description of non-core assets, see “—Analysis of Financial Condition — Allowance for Credit Losses and Nonperforming Assets — Non-Core Assets.” In addition, Other includes goodwill not directly allocated to a business operating segment and any associated goodwill impairment charges. For impairment testing purposes, we allocate all goodwill to our Consumer Banking and/or Commercial Banking reporting units. There have been no significant changes in our methodologies used to allocate items to our business operating segments as described in “—Results of Operations — Business Operating Segments” to the audited Consolidated Financial Statements in our Annual Report on Form 10-K for the year ended December 31, 2018.
20
CITIZENS FINANCIAL GROUP, INC.
MANAGEMENT’S DISCUSSION AND ANALYSIS
Consumer Banking
|
As of and for the Three Months Ended March 31,
|
||||||||||||||
|
(dollars in millions)
|
2019
|
|
|
2018
|
|
|
Change
|
|
Percent
|
|
||||
|
Net interest income
|
|
$788
|
|
|
|
$733
|
|
|
|
$55
|
|
|
8
|
%
|
|
Noninterest income
|
247
|
|
|
222
|
|
|
25
|
|
|
11
|
|
|||
|
Total revenue
|
1,035
|
|
|
955
|
|
|
80
|
|
|
8
|
|
|||
|
Noninterest expense
|
700
|
|
|
656
|
|
|
44
|
|
|
7
|
|
|||
|
Profit before provision for credit losses
|
335
|
|
|
299
|
|
|
36
|
|
|
12
|
|
|||
|
Provision for credit losses
|
67
|
|
|
72
|
|
|
(5
|
)
|
|
(7
|
)
|
|||
|
Income before income tax expense
|
268
|
|
|
227
|
|
|
41
|
|
|
18
|
|
|||
|
Income tax expense
|
66
|
|
|
57
|
|
|
9
|
|
|
16
|
|
|||
|
Net income
|
|
$202
|
|
|
|
$170
|
|
|
|
$32
|
|
|
19
|
|
|
Loans (period-end)
(1)
|
|
$62,339
|
|
|
|
$59,795
|
|
|
|
$2,544
|
|
|
4
|
%
|
|
Average Balances:
|
|
|
|
|
||||||||||
|
Total assets
|
|
$65,007
|
|
|
|
$61,348
|
|
|
|
$3,659
|
|
|
6
|
%
|
|
Total loans and leases
(1)
|
62,163
|
|
|
59,942
|
|
|
2,221
|
|
|
4
|
|
|||
|
Deposits
|
82,569
|
|
|
75,416
|
|
|
7,153
|
|
|
9
|
|
|||
|
Interest-earning assets
|
62,216
|
|
|
59,994
|
|
|
2,222
|
|
|
4
|
|
|||
|
Key Performance Metrics:
|
|
|
|
|
|
|||||||||
|
Net interest margin
(2)
|
5.14
|
%
|
|
4.96
|
%
|
|
18
|
bps
|
|
|||||
|
Efficiency ratio
|
67.62
|
|
|
68.72
|
|
|
(110
|
) bps
|
|
|||||
|
Loans-to-deposits ratio (average balances)
(3)
|
74.27
|
|
|
79.14
|
|
|
(487
|
) bps
|
|
|||||
|
Return on average total tangible assets
(2)
|
1.26
|
|
|
1.12
|
|
|
14
|
bps
|
|
|||||
(1)
Includes LHFS.
(2)
Ratios for the periods ended March 31, 2019 and 2018 are presented on an annualized basis.
(3)
We revised our method of calculating the loans-to-deposits ratio in the third quarter of 2018 to exclude LHFS. Prior periods have been adjusted to conform with the current period presentation.
Consumer Banking net interest income of
$788 million
increased
$55 million
, or
8%
, from first quarter
2018
, driven by the benefit of a
$2.2 billion
increase in average loans led by residential mortgage, student and unsecured retail with higher loan yields that included the benefit of higher rates and continued mix shift towards higher yielding assets, partially offset by an increase in deposit costs. Noninterest income
increased
$25 million
from first quarter
2018
, driven by higher mortgage banking fees related to FAMC, and higher trust and investment fees related to our acquisition of Clarfeld. Noninterest expense of
$700 million
increased
$44 million
, or
7%
, from first quarter
2018
, reflecting higher salaries and benefits, outside services and equipment costs. Provision for credit losses of
$67 million
decreased
$5 million
, or
7%
, reflecting lower charge-offs net of recoveries.
21
CITIZENS FINANCIAL GROUP, INC.
MANAGEMENT’S DISCUSSION AND ANALYSIS
Commercial Banking
|
As of and for the Three Months Ended March 31,
|
||||||||||||||
|
(dollars in millions)
|
2019
|
|
2018
|
|
Change
|
Percent
|
|
|||||||
|
Net interest income
|
|
$372
|
|
|
$357
|
|
|
$15
|
|
4
|
%
|
|||
|
Noninterest income
|
150
|
|
125
|
|
25
|
|
20
|
|
||||||
|
Total revenue
|
522
|
|
482
|
|
40
|
|
8
|
|
||||||
|
Noninterest expense
|
209
|
|
208
|
|
1
|
|
0
|
|
||||||
|
Profit before provision for credit losses
|
313
|
|
274
|
|
39
|
|
14
|
|
||||||
|
Provision for credit losses
|
21
|
|
(4
|
)
|
25
|
|
NM
|
|
||||||
|
Income before income tax expense
|
292
|
|
278
|
|
14
|
|
5
|
|
||||||
|
Income tax expense
|
65
|
|
63
|
|
2
|
|
3
|
|
||||||
|
Net income
|
|
$227
|
|
|
$215
|
|
|
$12
|
|
6
|
|
|||
|
Loans and leases (period-end)
(1)
|
|
$54,267
|
|
|
$49,868
|
|
|
$4,399
|
|
9
|
%
|
|||
|
Average Balances:
|
|
|
||||||||||||
|
Total assets
|
|
$55,630
|
|
|
$50,393
|
|
|
$5,237
|
|
10
|
%
|
|||
|
Total loans and leases
(1)
|
54,436
|
|
49,285
|
|
5,151
|
|
10
|
|
||||||
|
Deposits
|
29,823
|
|
30,766
|
|
(943
|
)
|
(3
|
)
|
||||||
|
Interest-earning assets
|
54,724
|
|
49,479
|
|
5,245
|
|
11
|
|
||||||
|
Key Performance Metrics:
|
||||||||||||||
|
Net interest margin
(2)
|
2.76
|
%
|
2.93
|
%
|
(17
|
) bps
|
||||||||
|
Efficiency ratio
|
40.11
|
|
43.07
|
|
(296
|
) bps
|
||||||||
|
Loans-to-deposits ratio (average balances)
(3)
|
181.23
|
|
158.84
|
|
2,239
|
bps
|
||||||||
|
Return on average total tangible assets
(2)
|
1.66
|
|
1.73
|
|
(7
|
) bps
|
||||||||
(1)
Includes LHFS.
(2)
Ratios for the periods ended March 31, 2019 and 2018 are presented on an annualized basis.
(3)
We revised our method of calculating the loans-to-deposits ratio in the third quarter of 2018 to exclude LHFS. Prior periods have been adjusted to conform with the current period presentation.
Commercial Banking net interest income of
$372 million
increased
$15 million
, or
4%
, from
$357 million
in first quarter
2018
, reflecting a
$5.2 billion
increase in average loans and leases. Noninterest income of
$150 million
increased
$25 million
, or
20%
, from
$125 million
in first quarter
2018
, reflecting higher foreign exchange and interest rate products fees and capital markets fees.
Noninterest expense of
$209 million
increased
$1 million
, from
$208 million
in first quarter
2018
, driven by higher salaries and employee benefits expense.
Provision for credit losses
of
$21 million
increased
$25 million
from first quarter
2018
, driven by higher net charge-offs in 2019, which reflected the impact of a commercial real estate credit and a reduction in recoveries.
22
CITIZENS FINANCIAL GROUP, INC.
MANAGEMENT’S DISCUSSION AND ANALYSIS
Other
|
As of and for the Three Months Ended March 31,
|
||||||||||||||
|
(in millions)
|
2019
|
|
2018
|
|
Change
|
|
Percent
|
|
||||||
|
Net interest income
|
|
$—
|
|
|
$1
|
|
|
($1
|
)
|
(100
|
%)
|
|||
|
Noninterest income
|
31
|
|
24
|
|
7
|
|
29
|
|
||||||
|
Total revenue
|
31
|
|
25
|
|
6
|
|
24
|
|
||||||
|
Noninterest expense
|
28
|
|
19
|
|
9
|
|
47
|
|
||||||
|
Profit before provision for credit losses
|
3
|
|
6
|
|
(3
|
)
|
(50
|
)
|
||||||
|
Provision for credit losses
|
(3
|
)
|
10
|
|
(13
|
)
|
NM
|
|
||||||
|
Income (loss) before income tax benefit
|
6
|
|
(4
|
)
|
10
|
|
NM
|
|
||||||
|
Income tax benefit
|
(4
|
)
|
(7
|
)
|
3
|
|
43
|
|
||||||
|
Net income
|
|
$10
|
|
|
$3
|
|
|
$7
|
|
233
|
|
|||
|
Loans and leases (period-end)
(1)
|
|
$2,261
|
|
|
$2,562
|
|
|
($301
|
)
|
(12
|
%)
|
|||
|
Average Balances:
|
|
|
|
|
||||||||||
|
Total assets
|
|
$39,778
|
|
|
$39,782
|
|
|
($4
|
)
|
0
|
%
|
|||
|
Total loans and leases
(1)
|
2,276
|
|
2,563
|
|
(287
|
)
|
(11
|
)
|
||||||
|
Deposits
|
8,022
|
|
7,241
|
|
781
|
|
11
|
|
||||||
|
Interest-earning assets
|
28,573
|
|
29,198
|
|
(625
|
)
|
(2
|
)
|
||||||
(1)
Includes LHFS.
Other n
et interest income decreased
$1 million
due to higher funding costs, declining benefit of swaps, and non-core portfolio runoff, largely offset by residual FTP. Results also reflected an ACL release of $4 million in first quarter
2019
, compared to an ACL build of $8 million in first quarter
2018
.
23
CITIZENS FINANCIAL GROUP, INC.
MANAGEMENT’S DISCUSSION AND ANALYSIS
ANALYSIS OF FINANCIAL CONDITION
Securities
Our securities portfolio is managed to maintain prudent levels of liquidity, credit quality and market risk while achieving appropriate returns. The following table presents our securities AFS and HTM:
|
March 31, 2019
|
December 31, 2018
|
|||||||||||||||||||||
|
(in millions)
|
Amortized
Cost
|
Fair Value
|
Amortized
Cost
|
Fair Value
|
Change in Fair Value
|
|||||||||||||||||
|
U.S. Treasury and other
|
|
$72
|
|
|
$72
|
|
|
$24
|
|
|
$24
|
|
|
$48
|
|
200
|
%
|
|||||
|
State and political subdivisions
|
5
|
|
5
|
|
5
|
|
5
|
|
—
|
|
—
|
|
||||||||||
|
Mortgage-backed securities, at fair value:
|
||||||||||||||||||||||
|
Federal agencies and U.S. government sponsored entities
|
20,768
|
|
20,497
|
|
20,211
|
|
19,634
|
|
863
|
|
4
|
|
||||||||||
|
Other/non-agency
|
916
|
|
930
|
|
236
|
|
232
|
|
698
|
|
301
|
|
||||||||||
|
Total mortgage-backed securities
|
21,684
|
|
21,427
|
|
20,447
|
|
19,866
|
|
1,561
|
|
8
|
|
||||||||||
|
Total debt securities available for sale, at fair value
|
|
$21,761
|
|
|
$21,504
|
|
|
$20,476
|
|
|
$19,895
|
|
|
$1,609
|
|
8
|
%
|
|||||
|
Mortgage-backed securities, at cost:
|
||||||||||||||||||||||
|
Federal agencies and U.S. government sponsored entities
|
|
$3,345
|
|
|
$3,267
|
|
|
$3,425
|
|
|
$3,293
|
|
|
($26
|
)
|
(1
|
%)
|
|||||
|
Other/non-agency
|
—
|
|
—
|
|
740
|
|
748
|
|
(748
|
)
|
(100
|
)
|
||||||||||
|
Total mortgage-backed securities
|
3,345
|
|
3,267
|
|
4,165
|
|
4,041
|
|
(774
|
)
|
(19
|
)
|
||||||||||
|
Total debt securities held to maturity
|
|
$3,345
|
|
|
$3,267
|
|
|
$4,165
|
|
|
$4,041
|
|
|
($774
|
)
|
(19
|
)%
|
|||||
|
Total debt securities available for sale and held to maturity
|
|
$25,106
|
|
|
$24,771
|
|
|
$24,641
|
|
|
$23,936
|
|
|
$835
|
|
3
|
%
|
|||||
|
Equity securities, at fair value
|
|
$198
|
|
|
$198
|
|
|
$181
|
|
|
$181
|
|
|
$17
|
|
9
|
%
|
|||||
|
Equity securities, at cost
|
604
|
|
604
|
|
834
|
|
834
|
|
(230
|
)
|
(28
|
)
|
||||||||||
|
Total equity securities
|
|
$802
|
|
|
$802
|
|
|
$1,015
|
|
|
$1,015
|
|
|
($213
|
)
|
(21
|
%)
|
|||||
The fair value of the AFS debt portfolio of
$21.5 billion
at
March 31, 2019
increased
$1.6 billion
from
$19.9 billion
at
December 31, 2018
. The decrease in net unrealized losses on mortgage-backed securities of $324 million was due to lower interest rates, net portfolio additions, and securities transferred from HTM to AFS upon the adoption of ASU 2017–12,
Targeted Improvements to Accounting for Hedging Activities
. The decline in the fair value of the HTM debt portfolio of
$774 million
was primarily attributable to securities transferred from HTM to AFS upon the adoption of ASU 2017–12. For further detail see Note 1 "Basis of Presentation" to our unaudited interim Consolidated Financial Statements in Part I, Item 1 — Financial Statements, included in this Report.
As of
March 31, 2019
, the portfolio’s average effective duration was
3.8
years compared with
4.4
years as of
December 31, 2018
, as lower long-term rates drove an increase in securities prepayment speeds. We manage our securities portfolio duration and convexity risk through asset selection and securities structure, and maintain duration levels within risk a
ppetite in the context of the broader interest rate risk in the banking book framework and limits.
The securities portfolio includes high-quality, highly-liquid investments reflecting our ongoing commitment to maintaining appropriate contingent liquidity levels and pledging capacity. U.S. government-guaranteed notes and GSE-issued mortgage-backed securities represent 96% of the fair value of the debt securities portfolio holdings. Holdings backed by mortgages dominate our portfolio and facilitate our ability to pledge them to the FHLB for collateral purposes. For further discussion of the liquidity coverage ratios, see “Regulation and Supervision — Liquidity Standards” in Part I — Business, included in our Annual Report on Form 10-K for the year ended December 31, 2018.
24
CITIZENS FINANCIAL GROUP, INC.
MANAGEMENT’S DISCUSSION AND ANALYSIS
Loans and Leases
Our loans and leases are disclosed in portfolio segments and classes. Our loan and lease portfolio segments are commercial and retail. The classes of loans and leases are: commercial, commercial real estate, leases, residential mortgages, home equity loans, home equity lines of credit, home equity loans serviced by others, home equity lines of credit serviced by others, automobile, education, credit cards and other retail. Our SBO portfolio consists of purchased home equity loans and lines that were originally serviced by others, which we service a portion of internally. The following table shows the composition of loans and leases, including non-core loans.
|
(in millions)
|
March 31, 2019
|
December 31, 2018
|
Change
|
Percent
|
||||||||||
|
Commercial
(1)
|
|
$41,497
|
|
|
$40,857
|
|
|
$640
|
|
2
|
%
|
|||
|
Commercial real estate
|
13,372
|
|
13,023
|
|
349
|
|
3
|
|
||||||
|
Leases
|
2,820
|
|
2,903
|
|
(83
|
)
|
(3
|
)
|
||||||
|
Total commercial loans and leases
|
57,689
|
|
56,783
|
|
906
|
|
2
|
|
||||||
|
Residential mortgages
|
19,174
|
|
18,978
|
|
196
|
|
1
|
|
||||||
|
Home equity loans
|
1,006
|
|
1,073
|
|
(67
|
)
|
(6
|
)
|
||||||
|
Home equity lines of credit
|
12,394
|
|
12,710
|
|
(316
|
)
|
(2
|
)
|
||||||
|
Home equity loans serviced by others
|
375
|
|
399
|
|
(24
|
)
|
(6
|
)
|
||||||
|
Home equity lines of credit serviced by others
|
95
|
|
104
|
|
(9
|
)
|
(9
|
)
|
||||||
|
Automobile
|
11,992
|
|
12,106
|
|
(114
|
)
|
(1
|
)
|
||||||
|
Education
|
9,274
|
|
8,900
|
|
374
|
|
4
|
|
||||||
|
Credit cards
|
1,982
|
|
1,991
|
|
(9
|
)
|
—
|
|
||||||
|
Other retail
|
3,634
|
|
3,616
|
|
18
|
|
—
|
|
||||||
|
Total retail loans
(2)
|
59,926
|
|
59,877
|
|
49
|
|
—
|
|
||||||
|
Total loans and leases
(3)
|
|
$117,615
|
|
|
$116,660
|
|
|
$955
|
|
1
|
%
|
|||
(1)
SBA loans serviced for others by our subsidiaries are not included above and amounted to
$17 million
representing the government guaranteed portion of SBA loans sold to outside investors as of
March 31, 2019
. There were
no
SBA loans serviced for others as of
December 31, 2018
.
(2)
Mortgage loans serviced for others by our subsidiaries are not included above and amounted to
$70.8 billion
and
$69.6 billion
at
March 31, 2019
and
December 31, 2018
, respectively.
(3)
Excluded from the table above are LHFS totaling
$1.3 billion
as of
March 31, 2019
and
December 31, 2018
.
Total commercial loans and leases of
$57.7 billion
increased
$906 million
from
$56.8 billion
as of
December 31, 2018
, reflecting
commercial loan and commercial real estate loan growth, offset by a decrease in leases. Total
retail
loa
ns of
$59.9 billion
were stable with
December 31, 2018
, reflecting increases in education, residential mortgages and other retail loans, offset by decreases in home equity lines of credit, automobile loans, home equity loans, home equity loans serviced by others, home equity lines of credit serviced by others and credit cards.
Allowance for Credit Losses and Nonperforming Assets
The ACL, which consists of an ALLL and a reserve for unfunded lending commitments, is created through charges to the provision for credit losses in order to provide appropriate reserves to absorb future estimated credit losses in accordance with GAAP. For further information on our processes to determine our ACL, see “—Critical Accounting Estimates — Allowance for Credit Losses” and Note 5 “Allowance for Credit Losses, Nonperforming Assets, and Concentrations of Credit Risk” to the audited Consolidated Financial Statements in our Annual Report on Form 10-K for the year ended December 31, 2018 and
Note 4 "Allowance for Credit Losses, Nonperforming Assets, and Concentrations of Credit Risk"
to our unaudited interim Consolidated Financial Statements in Part I, Item 1 — Financial Statements, included in this Report.
The ACL totaled
$1.3 billion
at
March 31, 2019
and
December 31, 2018
. The ALLL represented
1.06%
of loans and leases and
160%
of nonperforming loans and leases as of
March 31, 2019
, compared with
1.06%
and
156%
, as of
December 31, 2018
, respectively. As of
March 31, 2019
, there were no material changes in assumptions or estimation techniques compared with prior periods that impacted the determination of the current period’s reserves.
Overall credit quality remained strong, reflecting consistently balanced growth in retail loans and a broadly stable risk profile in the commercial loans and leases portfolios. Nonperforming loans and leases of
$780 million
as of
March 31, 2019
decreased $17 million from
December 31, 2018
, reflecting a $28 million decrease in retail nonperforming loans driven by home equity and auto, partially offset by an $11 million increase in commercial nonperforming loans. First quarter 2019 net charge-offs of
$89 million
increased $19 million, or 27%, from $70 million first quarter 2018. First quarter 2019 annualized net charge-offs of 31 basis points of average loans and leases was up five basis points compared with 26 basis points in first quarter 2018.
25
CITIZENS FINANCIAL GROUP, INC.
MANAGEMENT’S DISCUSSION AND ANALYSIS
Commercial Loan Asset Quality
Our commercial loan and lease portfolio consists of traditional commercial loans, commercial leases and commercial real estate loans. The portfolio is predominantly focused on customers in our footprint and adjacent states in which we have a physical presence where our local delivery model provides for strong client connectivity. Additionally, we also do business in certain specialized industry sectors on a national basis.
For commercial loans and leases, we utilize regulatory classification ratings to monitor credit quality. Loans with a “pass” rating are those that we believe will be fully repaid in accordance with the contractual loan terms. Commercial loans and leases that are “criticized” are those that have some weakness or potential weakness that indicate an increased probability of future loss. “Criticized” loans are grouped into three categories, “special mention,” “substandard” and “doubtful.” Special mention loans have potential weaknesses that, if left uncorrected, may result in deterioration of our credit position at some future date. Substandard loans are inadequately protected loans; these loans have well-defined weaknesses that could hinder normal repayment or collection of the debt. Doubtful loans have the same weaknesses as substandard, with the added characteristics that the possibility of loss is high and collection of the full amount of the loan is improbable. These credit quality indicators for commercial loans are continually updated and monitored. See
Note 4 "Allowance for Credit Losses, Nonperforming Assets, and Concentrations of Credit Risk"
to our unaudited interim Consolidated Financial Statements in Part I, Item 1 — Financial Statements, included in this Report.
As of
March 31, 2019
, nonperforming commercial loans and leases of
$212 million
increased
$11 million
from
$201 million
as of
December 31, 2018
. Total commercial nonperforming loans were
0.4%
of the commercial loan portfolio as of
March 31, 2019
and
December 31, 2018
. Total commercial loan and lease net charge-offs of $24 million compared to net recoveries of $3 million for first quarter 2018. The commercial loan and lease portfolio’s annualized net charge-off rate of 17 basis points compared to a net recovery rate of two basis points in first quarter 2018.
The recorded investment in commercial loans and leases based on regulatory classification ratings is presented below:
|
March 31, 2019
|
|||||||||||||||
|
Criticized
|
|||||||||||||||
|
(in millions)
|
Pass
|
|
Special Mention
|
Substandard
|
|
Doubtful
|
|
Total
|
|
||||||
|
Commercial
|
|
$39,296
|
|
|
$1,096
|
|
|
$892
|
|
|
$213
|
|
|
$41,497
|
|
|
Commercial real estate
|
12,953
|
|
381
|
|
36
|
|
2
|
|
13,372
|
|
|||||
|
Leases
|
2,670
|
|
111
|
|
39
|
|
—
|
|
2,820
|
|
|||||
|
Total commercial loans and leases
|
|
$54,919
|
|
|
$1,588
|
|
|
$967
|
|
|
$215
|
|
|
$57,689
|
|
|
December 31, 2018
|
|||||||||||||||
|
Criticized
|
|||||||||||||||
|
(in millions)
|
Pass
|
|
Special Mention
|
Substandard
|
|
Doubtful
|
|
Total
|
|
||||||
|
Commercial
|
|
$38,600
|
|
|
$1,231
|
|
|
$828
|
|
|
$198
|
|
|
$40,857
|
|
|
Commercial real estate
|
12,523
|
|
412
|
|
82
|
|
6
|
|
13,023
|
|
|||||
|
Leases
|
2,823
|
|
39
|
|
41
|
|
—
|
|
2,903
|
|
|||||
|
Total commercial loans and leases
|
|
$53,946
|
|
|
$1,682
|
|
|
$951
|
|
|
$204
|
|
|
$56,783
|
|
Total commercial criticized loans and leases of $2.8 billion at
March 31, 2019
were stable compared to
December 31, 2018
due to continued credit discipline and the overall economic environment. Commercial real estate criticized balances of $419 million, or 3.1% of the commercial real estate portfolio, decreased from $500 million, or 3.8%, as of December 31, 2018. Commercial criticized loans to total criticized loans was 79% as of March 31, 2019 compared to 80% as of December 31, 2018. Commercial real estate accounted for 15% of total criticized loans as of March 31, 2019, compared to 18% as of December 31, 2018.
Retail Loan Asset Quality
For retail loans, we primarily utilize payment and delinquency status to regularly review and monitor credit quality trends. Historical experience indicates that the longer a loan is past due, the greater the likelihood of future credit loss. The largest portion of the retail portfolio is represented by borrowers located in the New England, Mid-
26
CITIZENS FINANCIAL GROUP, INC.
MANAGEMENT’S DISCUSSION AND ANALYSIS
Atlantic and Midwest regions, although we have continued to lend selectively in areas outside the footprint primarily in the auto finance, education lending and unsecured portfolios.
The following tables present asset quality metrics for the retail loan portfolio:
|
March 31, 2019
|
December 31, 2018
|
||||
|
Average refreshed FICO for total portfolio
|
764
|
|
763
|
|
|
|
CLTV ratio for secured real estate
(1)
|
58
|
|
58
|
|
|
|
Nonperforming retail loans as a percentage of total retail
|
0.95
|
%
|
1.00
|
%
|
|
(1)
The real estate secured portfolio CLTV is calculated as the mortgage and second lien loan balance divided by the most recently available value of the property.
|
Three Months Ended March 31,
|
||||||||||||||
|
(dollars in millions)
|
2019
|
|
2018
|
|
Change
|
Percent
|
|
|||||||
|
Net charge-offs
|
|
$65
|
|
|
$73
|
|
|
($8
|
)
|
(11
|
%)
|
|||
|
Annualized net charge-off rate
|
0.44
|
%
|
0.50
|
%
|
(6
|
) bps
|
||||||||
Retail asset quality improved with a net charge-off rate of
0.44%
for first quarter 2019, a decrease of
six basis points
from first quarter 2018, driven by improved asset quality across property secured and automobile portfolios which more than offset increases in losses from unsecured personal loans and credit card portfolios.
HELOC Payment Shock
Payment shock in the HELOC portfolio occurs when the 10-year interest-only draw period ends, and the payment converts to a fully amortizing principal and interest payment. We monitor the risk associated with the payment increase and have a comprehensive program designed to provide heightened customer outreach to inform, educate and assist customers through the reset process as well as to offer alternative financing and forbearance options. Results of this program indicate that our efforts to assist customers at risk of default have successfully reduced delinquency and charge-off rates compared to our original expectations.
The table below outlines the population expected to mature between April 1, 2019 and December 31, 2021, compared to the overall HELOC population, reflecting a similar credit profile for each population:
|
(dollars in millions)
|
Balance
|
% Secured by First Lien
|
FICO
|
LTV
|
||||||||
|
Total HELOCs as of March 31, 2019
(1)
|
|
$12,489
|
|
51
|
%
|
766
|
|
57
|
%
|
|||
|
HELOCs scheduled to reset 4/1/19 - 12/31/21
|
1,390
|
|
54
|
|
758
|
|
51
|
|
||||
(1)
Includes $151 million scheduled to reach the end of the interest-only draw period and enter repayment of principal and interest for the remainder of 2019.
The performance of our historical vintages that have entered repayment remains stable. The following table presents the asset quality metrics as of
March 31, 2019
, for the HELOCs reset at each year ending:
|
(dollars in millions)
|
2014/2015
|
|
2016
|
|
2017
|
|
|||||
|
Balance reset
|
|
$1,688
|
|
|
$738
|
|
|
$730
|
|
||
|
Percent refinanced, paid off, or current
|
94
|
%
|
95
|
%
|
95
|
%
|
|||||
|
Percent past due
|
2
|
|
3
|
|
4
|
|
|||||
|
Percent charged-off
|
4
|
|
2
|
|
1
|
|
|||||
Factors that affect our future expectations for continued relatively low charge-off risk in the face of rising interest rates for the portion of our HELOC portfolio subject to reset in future periods include a relatively high level of first lien collateral positions, improved loan-to-value ratios resulting from continued home price appreciation, relatively stable portfolio credit score profiles and continued robust loss mitigation efforts.
Troubled Debt Restructurings
TDR is the classification given to a loan that has been restructured in a manner that grants a concession to a borrower experiencing financial hardship that we would not otherwise make. TDRs typically result from our loss mitigation efforts and are undertaken in order to improve the likelihood of recovery and continuity of the relationship.
27
CITIZENS FINANCIAL GROUP, INC.
MANAGEMENT’S DISCUSSION AND ANALYSIS
Our loan modifications are handled on a case by case basis and are negotiated to achieve mutually agreeable terms that maximize loan collectability and meet our borrower’s financial needs. The types of concessions include interest rate reductions, term extensions, principal forgiveness and other modifications to the structure of the loan that fall outside our lending policy. Depending on the specific facts and circumstances of the customer, restructuring can involve loans moving to nonaccrual, remaining on nonaccrual, or remaining on accrual status.
As of
March 31, 2019
,
$696 million
of retail loans were classified as TDRs, compared with
$723 million
as of
December 31, 2018
. As of
March 31, 2019
, $172 million of retail TDRs were in nonaccrual status with 46% current with payments, an improvement compared to $181 million in nonaccrual status with 49% current on payments at
December 31, 2018
. TDRs generally return to accrual status once repayment capacity and appropriate payment history can be established. TDRs are individually evaluated for impairment and loans, once classified as TDRs, remain classified as TDRs until paid off, sold or refinanced at market terms.
For additional information regarding TDRs, see “—Critical Accounting Estimates — Allowance for Credit Losses,” and Note 5 “Allowance for Credit Losses, Nonperforming Assets, and Concentrations of Credit Risk” to the audited Consolidated Financial Statements in our Annual Report on Form 10-K for the year ended December 31, 2018 and
Note 4 "Allowance for Credit Losses, Nonperforming Assets, and Concentrations of Credit Risk"
to our unaudited interim Consolidated Financial Statements in Part I, Item 1 — Financial Statements, included in this Report.
The following tables present retail TDRs by loan class, including delinquency status for accruing TDRs and TDRs in nonaccrual:
|
March 31, 2019
|
|||||||||||||||||
|
As a % of Accruing Retail TDRs
|
|||||||||||||||||
|
(dollars in millions)
|
Accruing
|
30-89 Days
Past Due |
90+ Days Past Due
|
Nonaccruing
|
Total
|
||||||||||||
|
Residential mortgages
|
|
$103
|
|
3.2
|
%
|
1.5
|
%
|
|
$43
|
|
|
$146
|
|
||||
|
Home equity loans
|
78
|
|
0.7
|
|
—
|
|
22
|
|
100
|
|
|||||||
|
Home equity lines of credit
|
139
|
|
1.1
|
|
—
|
|
63
|
|
202
|
|
|||||||
|
Home equity loans serviced by others
|
30
|
|
0.4
|
|
—
|
|
9
|
|
39
|
|
|||||||
|
Home equity lines of credit serviced by others
|
3
|
|
—
|
|
—
|
|
4
|
|
7
|
|
|||||||
|
Automobile
|
13
|
|
0.2
|
|
—
|
|
9
|
|
22
|
|
|||||||
|
Education
|
128
|
|
0.8
|
|
0.3
|
|
21
|
|
149
|
|
|||||||
|
Credit cards
|
24
|
|
0.4
|
|
—
|
|
1
|
|
25
|
|
|||||||
|
Other retail
|
6
|
|
—
|
|
—
|
|
—
|
|
6
|
|
|||||||
|
Total
|
|
$524
|
|
6.8
|
%
|
1.8
|
%
|
|
$172
|
|
|
$696
|
|
||||
|
December 31, 2018
|
|||||||||||||||||
|
As a % of Accruing Retail TDRs
|
|||||||||||||||||
|
(dollars in millions)
|
Accruing
|
30-89 Days
Past Due |
90+ Days Past Due
|
Nonaccruing
|
Total
|
||||||||||||
|
Residential mortgages
|
|
$111
|
|
3.0
|
%
|
1.6
|
%
|
|
$44
|
|
|
$155
|
|
||||
|
Home equity loans
|
85
|
|
0.7
|
|
—
|
|
25
|
|
110
|
|
|||||||
|
Home equity lines of credit
|
138
|
|
0.9
|
|
—
|
|
64
|
|
202
|
|
|||||||
|
Home equity loans serviced by others
|
31
|
|
0.3
|
|
—
|
|
10
|
|
41
|
|
|||||||
|
Home equity lines of credit serviced by others
|
3
|
|
—
|
|
—
|
|
5
|
|
8
|
|
|||||||
|
Automobile
|
13
|
|
0.2
|
|
—
|
|
10
|
|
23
|
|
|||||||
|
Education
|
131
|
|
0.9
|
|
0.3
|
|
22
|
|
153
|
|
|||||||
|
Credit cards
|
24
|
|
0.4
|
|
—
|
|
1
|
|
25
|
|
|||||||
|
Other retail
|
6
|
|
—
|
|
—
|
|
—
|
|
6
|
|
|||||||
|
Total
|
|
$542
|
|
6.4
|
%
|
1.9
|
%
|
|
$181
|
|
|
$723
|
|
||||
28
CITIZENS FINANCIAL GROUP, INC.
MANAGEMENT’S DISCUSSION AND ANALYSIS
Non-Core Assets
|
(in millions)
|
March 31, 2019
|
December 31, 2018
|
Change
|
Percent
|
||||||||||
|
Commercial
|
|
$100
|
|
|
$72
|
|
|
$28
|
|
39
|
%
|
|||
|
Commercial real estate
|
13
|
|
14
|
|
(1
|
)
|
(7
|
)
|
||||||
|
Leases
|
658
|
|
670
|
|
(12
|
)
|
(2
|
)
|
||||||
|
Total commercial loans and leases
|
771
|
|
756
|
|
15
|
|
2
|
|
||||||
|
Residential mortgages
|
107
|
|
110
|
|
(3
|
)
|
(3
|
)
|
||||||
|
Home equity loans
|
28
|
|
31
|
|
(3
|
)
|
(10
|
)
|
||||||
|
Home equity lines of credit
|
19
|
|
21
|
|
(2
|
)
|
(10
|
)
|
||||||
|
Home equity loans serviced by others
|
375
|
|
399
|
|
(24
|
)
|
(6
|
)
|
||||||
|
Home equity lines of credit serviced by others
|
95
|
|
104
|
|
(9
|
)
|
(9
|
)
|
||||||
|
Education
|
203
|
|
210
|
|
(7
|
)
|
(3
|
)
|
||||||
|
Total retail loans
|
827
|
|
875
|
|
(48
|
)
|
(5
|
)
|
||||||
|
Total non-core loans and leases
|
1,598
|
|
1,631
|
|
(33
|
)
|
(2
|
)
|
||||||
|
Other assets
|
96
|
|
96
|
|
—
|
|
—
|
|
||||||
|
Total non-core assets
|
|
$1,694
|
|
|
$1,727
|
|
|
($33
|
)
|
(2
|
%)
|
|||
Non-core assets are primarily liquidating loan and lease portfolios inconsistent with our strategic priorities, generally as a result of geographic location, industry, product type or risk level and are included in Other. Non-core assets of $1.7 billion as of March 31, 2019 decreased $33 million, or 2%, from December 31, 2018.
Retail non-core loan balances of $827 million decreased $48 million, or 5%, compared to December 31, 2018. The largest component of our retail non-core portfolio is the home equity serviced by others portfolio (“SBO”), which totaled
$470 million
as of
March 31, 2019
, compared to
$503 million
as of
December 31, 2018
. The SBO portfolio consists of home equity loans and lines of credit purchased between 2003 and 2007 that were initially serviced by others. Although our SBO portfolio consists of loans that were initially serviced by others, we now service about 45% of this portfolio internally.
Commercial non-core loan balances of $771 million increased $15 million, or 2%, from $756 million as of December 31, 2018.
The largest component of our commercial non-core portfolio is an aircraft-related lease portfolio tied to legacy Royal Bank of Scotland Group aircraft leasing borrowers, which totaled $658 million and
$670 million
as of
March 31, 2019
and
December 31, 2018
, respectively.
Deposits
The table below presents the major components of our deposits:
|
(in millions)
|
March 31, 2019
|
December 31, 2018
|
Change
|
|
Percent
|
|
||||||||
|
Demand
|
|
$28,383
|
|
|
$29,458
|
|
|
($1,075
|
)
|
(4
|
%)
|
|||
|
Checking with interest
|
23,482
|
|
23,067
|
|
415
|
|
2
|
|
||||||
|
Regular savings
|
13,239
|
|
12,007
|
|
1,232
|
|
10
|
|
||||||
|
Money market accounts
|
35,972
|
|
35,701
|
|
271
|
|
1
|
|
||||||
|
Term deposits
|
22,840
|
|
19,342
|
|
3,498
|
|
18
|
|
||||||
|
Total deposits
|
|
$123,916
|
|
|
$119,575
|
|
|
$4,341
|
|
4
|
%
|
|||
Total deposits as of
March 31, 2019
increase
d
$4.3 billion
, or
4%
, to
$123.9 billion
, from
$119.6 billion
as of December 31,
2018
, reflecting growth in term, regular savings, checking with interest, and money market accounts, partially offset by lower demand deposit accounts.
29
CITIZENS FINANCIAL GROUP, INC.
MANAGEMENT’S DISCUSSION AND ANALYSIS
Borrowed Funds
Total borrowed funds of $12.4 billion at March 31, 2019 decreased $4.8 billion from December 31, 2018, reflecting a $5.0 billion decrease in long-term FHLB advances and a $488 million reduction in federal funds purchased and repurchase agreements, given improved funding mix, partially offset by a net $789 million increase in senior debt.
Short-term borrowed funds
A summary of our short-term borrowed funds is presented below:
|
(in millions)
|
March 31, 2019
|
December 31, 2018
|
Change
|
|
Percent
|
|
||||||||
|
Federal funds purchased
|
|
$375
|
|
|
$820
|
|
|
($445
|
)
|
(54
|
%)
|
|||
|
Securities sold under agreements to repurchase
|
293
|
|
336
|
|
(43
|
)
|
(13
|
)
|
||||||
|
Other short-term borrowed funds
(1)
|
11
|
|
161
|
|
(150
|
)
|
(93
|
)
|
||||||
|
Total short-term borrowed funds
|
|
$679
|
|
|
$1,317
|
|
|
($638
|
)
|
(48
|
%)
|
|||
(1)
Beginning in the first quarter of 2019, borrowed funds balances and the associated interest expense are classified based on original maturity. Prior periods have been adjusted to conform with the current period presentation.
The net
decrease
in other short-term borrowed funds of
$150 million
resulted from a decrease in short-term FHLB advances.
Our advances, lines of credit, and letters of credit from the FHLB are collateralized by pledged mortgages and securities at least sufficient to satisfy the collateral maintenance level established by the FHLB. The utilized borrowing capacity for FHLB advances and letters of credit was
$7.7 billion
and
$13.0 billion
at
March 31, 2019
and
December 31, 2018
, respectively. Our remaining available FHLB borrowing capacity was
$8.4 billion
and
$4.8 billion
at
March 31, 2019
and
December 31, 2018
, respectively. We can also borrow from the FRB discount window to meet short-term liquidity requirements. Collateral, including certain loans, is pledged to support this borrowing capacity. At
March 31, 2019
, our unused secured borrowing capacity was approximately
$42.5 billion
, which included unencumbered securities, FHLB borrowing capacity, and FRB discount window capacity.
Key data related to short-term borrowed funds is presented in the following table:
|
As of and for the Three Months Ended March 31,
|
As of and for the Year Ended December 31,
|
||||||||||
|
(dollars in millions)
|
2019
|
|
2018
|
|
2018
|
||||||
|
Weighted-average interest rate at period-end:
(1)
|
|||||||||||
|
Federal funds purchased and securities sold under agreements to repurchase
|
1.39
|
%
|
—
|
%
|
1.72
|
%
|
|||||
|
Other short-term borrowed funds
|
3.03
|
|
3.40
|
|
2.73
|
|
|||||
|
Maximum amount outstanding at any month-end during the period:
|
|||||||||||
|
Federal funds purchased and securities sold under agreements to repurchase
(2)
|
|
$1,134
|
|
|
$625
|
|
|
$1,282
|
|
||
|
Other short-term borrowed funds
|
511
|
|
1,110
|
|
1,110
|
|
|||||
|
Average amount outstanding during the period:
|
|||||||||||
|
Federal funds purchased and securities sold under agreements to repurchase
(2)
|
|
$640
|
|
|
$645
|
|
|
$654
|
|
||
|
Other short-term borrowed funds
|
58
|
|
588
|
|
467
|
|
|||||
|
Weighted-average interest rate during the period:
(1)
|
|||||||||||
|
Federal funds purchased and securities sold under agreements to repurchase
|
1.24
|
%
|
0.66
|
%
|
0.92
|
%
|
|||||
|
Other short-term borrowed funds
|
2.75
|
|
1.67
|
|
2.10
|
|
|||||
(1)
Rates exclude certain hedging costs.
(2)
Balances are net of certain short-term receivables associated with reverse repurchase agreements, as applicable.
30
CITIZENS FINANCIAL GROUP, INC.
MANAGEMENT’S DISCUSSION AND ANALYSIS
Long-term borrowed funds
A summary of our long-term borrowed funds is presented below:
|
(in millions)
|
March 31, 2019
|
December 31, 2018
|
|||||
|
Parent Company:
|
|||||||
|
2.375% fixed-rate senior unsecured debt, due July 2021
|
|
$349
|
|
|
$349
|
|
|
|
4.150% fixed-rate subordinated debt, due September 2022
|
348
|
|
348
|
|
|||
|
3.750% fixed-rate subordinated debt, due July 2024
|
250
|
|
250
|
|
|||
|
4.023% fixed-rate subordinated debt, due October 2024
|
42
|
|
42
|
|
|||
|
4.350% fixed-rate subordinated debt, due August 2025
|
249
|
|
249
|
|
|||
|
4.300% fixed-rate subordinated debt, due December 2025
|
750
|
|
749
|
|
|||
|
Banking and Other Subsidiaries:
|
|||||||
|
2.500% senior unsecured notes, due March 2019
(1)
|
—
|
|
748
|
|
|||
|
2.450% senior unsecured notes, due December 2019
(1)
|
745
|
|
744
|
|
|||
|
2.250% senior unsecured notes, due March 2020
(1)
|
694
|
|
691
|
|
|||
|
3.155% floating-rate senior unsecured notes, due March 2020
(1) (2)
|
300
|
|
300
|
|
|||
|
3.216% floating-rate senior unsecured notes, due May 2020
(1) (2)
|
250
|
|
250
|
|
|||
|
2.200% senior unsecured notes, due May 2020
(1)
|
499
|
|
499
|
|
|||
|
2.250% senior unsecured notes, due October 2020
(1)
|
742
|
|
738
|
|
|||
|
2.550% senior unsecured notes, due May 2021
(1)
|
973
|
|
964
|
|
|||
|
3.250% senior unsecured notes, due February 2022
(1)
|
702
|
|
—
|
|
|||
|
3.413% floating-rate senior unsecured notes, due February 2022
(1) (2)
|
299
|
|
—
|
|
|||
|
3.456% floating-rate senior unsecured notes, due May 2022
(1) (2)
|
249
|
|
249
|
|
|||
|
2.650% senior unsecured notes, due May 2022
(1)
|
492
|
|
487
|
|
|||
|
3.700% senior unsecured notes, due March 2023
(1)
|
508
|
|
502
|
|
|||
|
3.551% floating-rate senior unsecured notes, due March 2023
(1) (2)
|
249
|
|
249
|
|
|||
|
3.750% senior unsecured notes, due February 2026
(1)
|
506
|
|
—
|
|
|||
|
Federal Home Loan Bank advances, 2.787% weighted average rate, due through 2038
|
2,508
|
|
7,508
|
|
|||
|
Other
|
21
|
|
9
|
|
|||
|
Total long-term borrowed funds
(3)
|
|
$11,725
|
|
|
$15,925
|
|
|
(1)
Issued under CBNA’s Global Bank Note Program.
(2)
Rate disclosed reflects the floating rate as of
March 31, 2019
.
(3)
Beginning in the first quarter of 2019, borrowed funds balances and the associated interest expense are classified based on original maturity. Prior periods have been adjusted to conform with the current period presentation.
Long-term borrowed funds of
$11.7 billion
as of
March 31, 2019
decrease
d
$4.2 billion
f
rom
December 31, 2018
, reflecting a
decrease
of
$5.0 billion
in long-term FHLB borrowings, partially offset by senior unsecured notes issued by CBNA during the quarter.
The Parent Company’s long-term borrowed funds as of
March 31, 2019
and
December 31, 2018
included principal balances of
$2.0 billion
for each period, respectively, and unamortized deferred issuance costs and/or discounts of
($4) million
and
($5) million
, respectively. The banking and other subsidiaries’ long-term borrowed funds as of
March 31, 2019
and
December 31, 2018
included principal balances of
$9.8 billion
and
$14.0 billion
, respectively, with unamortized deferred issuance costs and/or discounts of
($18) million
and
($14) million
, respectively, and hedging basis adjustments of
($23) million
and
($66) million
, respectively. See
Note 9 "Derivatives"
to our unaudited interim Consolidated Financial Statements in Part I, Item 1 — Financial Statements, included in this Report for further information about our hedging of certain long-term borrowed funds.
31
CITIZENS FINANCIAL GROUP, INC.
MANAGEMENT’S DISCUSSION AND ANALYSIS
CAPITAL AND REGULATORY MATTERS
As a bank holding company and a financial holding company, we are subject to regulation and supervision by the FRB. Our banking subsidiary, CBNA, is a national banking association whose primary federal regulator is the OCC. Our regulation and supervision continues to evolve as the legal and regulatory frameworks governing our operations continue to change. The current operating environment reflects heightened regulatory expectations around many regulations including consumer compliance, the Bank Secrecy Act, anti-money laundering compliance, and increased internal audit activities. For more information, see “Regulation and Supervision” in Part I, Item 1 — Business included in our Annual Report on Form 10-K for the year ended December 31, 2018.
Dodd-Frank Act
The Dodd-Frank Act regulates many aspects of the financial services industry and addresses among other things, systemic risk, capital adequacy, deposit insurance assessments, consumer financial protection, derivatives and securities markets, restrictions on an insured bank’s transactions with its affiliates, lending limits and mortgage lending practices.
In light of the Economic Growth, Regulatory Relief and Consumer Protection Act (“EGRRCPA”) amendments to the Dodd Frank Act and subsequent tailoring NPRs, the FRB provided us relief in a February 5, 2019 letter from all regulatory requirements, including disclosure requirements, related to supervisory stress testing and company-run stress testing for the 2019 stress test cycle and provided related relief from certain capital planning and regulatory reporting requirements that would otherwise apply in the 2019 stress test cycle. In addition, we were not required to submit a capital plan to the FRB for 2019 or participate in the 2019 CCAR. We remain subject to the requirement to develop and maintain an annual capital plan that is reviewed and approved by our Board of Directors (or one of its committees) and the FRB has approved our maximum planned capital actions for the period beginning July 1, 2019 and ending June 30, 2020. During this four-quarter period ending June 30, 2020, the FRB has approved us to make capital distributions up to the amount that would have allowed us to remain above all minimum capital requirements in 2018 CCAR, adjusted for any changes in our regulatory capital ratios since the FRB acted on our 2018 capital plan.
For additional discussion of the Dodd-Frank Act and EGRRCPA requirements and their related application, see “Regulation and Supervision” in Part 1, Item 1 - Business and “—Capital and Regulatory Matters” to the audited Consolidated Financial Statements in our Annual Report on Form 10-K for the year ended December 31, 2018.
Capital Framework
Under the current U.S. Basel III capital framework, we and our banking subsidiary must meet the following specific minimum requirements: CET1 capital ratio of 4.5%, tier 1 capital ratio of 6.0%, total capital ratio of 8.0%, and tier 1 leverage ratio of 4.0%.
A capital conservation buffer (“CCB”) is imposed on top of the following three minimum risk-based capital ratios: CET1 capital, tier 1 capital and total capital. As of January 1, 2019, the CCB reached its fully phased-in level of 2.5%. On April 10, 2018, the FRB issued a proposal designed to create a single, integrated capital requirement by combining the quantitative assessment of firms’ capital plans with the CCB requirement. If adopted, the proposal would change the way in which the minimum risk capital ratios are calculated by replacing the current static 2.5% CCB with a stress capital buffer (“SCB”) requirement.
32
CITIZENS FINANCIAL GROUP, INC.
MANAGEMENT’S DISCUSSION AND ANALYSIS
For additional discussion of the U.S. Basel III capital framework and its related application, see “Regulation and Supervision” in Part 1, Item 1 - Business included in our Annual Report on Form 10-K for the year ended December 31, 2018. The table below presents our actual regulatory capital ratios under the U.S. Basel III Standardized rules:
|
Actual
|
Required Minimum plus Required CCB for Non-Leverage Ratios
(1)(2)
|
||||||
|
(in millions, except ratio data)
|
Amount
|
Ratio
|
|||||
|
March 31, 2019
|
|||||||
|
CET1 capital
|
|
$14,442
|
|
10.5
|
%
|
7.0
|
%
|
|
Tier 1 capital
|
15,574
|
|
11.3
|
|
8.5
|
|
|
|
Total capital
|
18,403
|
|
13.4
|
|
10.5
|
|
|
|
Tier 1 leverage
|
15,574
|
|
10.0
|
|
4.0
|
|
|
|
Risk-weighted assets
|
137,246
|
|
|||||
|
Quarterly adjusted average assets
|
155,171
|
|
|||||
|
December 31, 2018
|
|||||||
|
CET1 capital
|
|
$14,485
|
|
10.6
|
%
|
6.4
|
%
|
|
Tier 1 capital
|
15,325
|
|
11.3
|
|
7.9
|
|
|
|
Total capital
|
18,157
|
|
13.3
|
|
9.9
|
|
|
|
Tier 1 leverage
|
15,325
|
|
10.0
|
|
4.0
|
|
|
|
Risk-weighted assets
|
136,202
|
|
|||||
|
Quarterly adjusted average assets
|
153,026
|
|
|||||
(1)
Required “Minimum Capital ratio” for 2019 and 2018 are: Common equity tier 1 capital of 4.5%; Tier 1 capital of 6.0%; Total capital of 8.0%; and Tier 1 leverage of 4.0%.
(2)
“
Minimum Capital ratio” includes capital conservation buffer of 2.500% for 2019 and 1.875% for 2018; N/A to Tier 1 leverage.
At
March 31, 2019
, our CET1 capital, tier 1 capital and total capital ratios were
10.5%
,
11.3
% and
13.4
%, respectively, as compared with
10.6%
,
11.3%
,
and
13.3%
, respectively, as of
December 31, 2018
. The CET1 capital ratio
decreased
as
$1.0 billion
of risk-weighted asset (“RWA”) growth, the impact of the capital actions described in “—Capital Transactions” below, and an increase in goodwill and intangibles related to acquisitions, were partially offset by net income for the three months ended March 31, 2019. The tier 1 capital ratio increased as the changes in the CET1 capital ratio were more than offset by the issuance of preferred stock as described further in “—Capital Transactions” below. The total capital ratio increased due to the changes in CET1 and tier 1 capital ratios. At
March 31, 2019
, our CET1 capital, tier 1 capital and total capital ratios were
352
basis points,
285
basis points and
291
basis points, respectively, above their regulatory minimums plus the capital conservation buffer. All ratios remained well above the U.S. Basel III minima.
Regulatory Capital Ratios and Capital Composition
CET1 capital under U.S. Basel III Standardized rules totaled
$14.4 billion
at
March 31, 2019
, and
decreased
$43 million
from
$14.5 billion
at
December 31, 2018
, as the impact of common share repurchases, dividends and an increase in goodwill and intangibles largely related to acquisitions, was partially offset by net income for the three months ended March 31, 2019. Tier 1 capital at
March 31, 2019
totaled
$15.6 billion
, reflecting a
$249 million
increase
from
$15.3 billion
at
December 31, 2018
, driven by the changes in CET1 capital and the issuance of preferred stock. At
March 31, 2019
, we had
$1.1 billion
of fixed-to-floating non-cumulative perpetual preferred stock issued and outstanding, an increase of
$292 million
from
$840 million
at
December 31, 2018
, given the first quarter 2019 issuance of 300,000 shares of Series D Preferred Stock that qualified as additional tier 1 capital. Total capital of
$18.4 billion
at
March 31, 2019
,
increased
$246 million
from
December 31, 2018
, driven by the changes in CET1 and tier 1 capital.
RWA totaled
$137.2 billion
at
March 31, 2019
, based on U.S. Basel III Standardized rules, up
$1.0 billion
from
December 31, 2018
. This increase was driven by the creation of a right-of-use asset in conjunction with the adoption of ASU 2016-02,
Leases (Topic 842)
, and growth in commercial, education and multi-family loans.
These increases were partially offset by decreases in commercial commitments and run-off in the home equity portfolio
.
As of
March 31, 2019
, the tier 1 leverage ratio was
10.0%
and was stable with
December 31, 2018
as the
$2.1 billion
increase in quarterly adjusted average assets was offset by the increase in tier 1 capital.
33
CITIZENS FINANCIAL GROUP, INC.
MANAGEMENT’S DISCUSSION AND ANALYSIS
The following table presents our capital composition under the U.S. Basel III capital framework:
|
(in millions)
|
March 31, 2019
|
December 31, 2018
|
|||||
|
Total common stockholders’ equity
|
|
$20,399
|
|
|
$19,977
|
|
|
|
Exclusions:
(1)
|
|||||||
|
Net unrealized losses recorded in accumulated other comprehensive income, net of tax:
|
|||||||
|
Debt and equity securities
|
244
|
|
490
|
|
|||
|
Derivatives
|
89
|
|
143
|
|
|||
|
Unamortized net periodic benefit costs
|
460
|
|
463
|
|
|||
|
Deductions:
|
|||||||
|
Goodwill
|
(7,040
|
)
|
(6,923
|
)
|
|||
|
Deferred tax liability associated with goodwill
|
370
|
|
366
|
|
|||
|
Other intangible assets
|
(80
|
)
|
(31
|
)
|
|||
|
Total common equity tier 1
|
14,442
|
|
14,485
|
|
|||
|
Qualifying preferred stock
|
1,132
|
|
840
|
|
|||
|
Total tier 1 capital
|
15,574
|
|
15,325
|
|
|||
|
Qualifying subordinated debt
(2)
|
1,500
|
|
1,499
|
|
|||
|
Allowance for loan and lease losses
|
1,245
|
|
1,242
|
|
|||
|
Allowance for credit losses for off-balance sheet exposure
|
84
|
|
91
|
|
|||
|
Total capital
|
|
$18,403
|
|
|
$18,157
|
|
|
(1)
As a U.S. Basel III Standardized approach institution, we selected the one-time election to opt-out of the requirements to include all the components of AOCI.
(2)
As of
March 31, 2019
and
December 31, 2018
, the amount of non-qualifying subordinated debt excluded from regulatory capital was $139 million.
Capital Adequacy Process
Our assessment of capital adequacy begins with our risk appetite and risk management framework. This framework provides for the identification, measurement and management of material risks. There have been no significant changes to our capital adequacy risk appetite and risk management framework as described in
“—Capital and Regulatory Matters” to the audited Consolidated Financial Statements in our Annual Report on Form 10-K for the year ended December 31, 2018.
Capital Transactions
The following capital actions were completed by the Company during the three months ended March 31, 2019:
|
•
|
Declared and paid quarterly common stock dividends of
$0.32
per share for first quarter 2019, aggregating to $149 million;
|
|
•
|
Declared semi-annual dividends of $27.50 per share on the 5.500% fixed-to-floating rate non-cumulative perpetual Series A Preferred Stock, aggregating to $7 million;
|
|
•
|
Declared quarterly dividends of $15.94 per share on the 6.375% fixed-to-floating rate non-cumulative perpetual Series C Preferred Stock, aggregating to $5 million;
|
|
•
|
Declared quarterly dividends of $11.82 per share on the 6.350% fixed-to-floating rate non-cumulative perpetual Series D Preferred Stock, aggregating to $3 million;
|
|
•
|
Issued $300 million, or 300,000 shares, of 6.350% fixed-to-floating rate non-cumulative perpetual Series D Preferred Stock (the “Series D Preferred Stock”), par value of $25.00 per share with a liquidation preference of $1,000 per share, with net proceeds of $292 million; and
|
|
•
|
Repurchased $200 million of our outstanding common stock.
|
34
CITIZENS FINANCIAL GROUP, INC.
MANAGEMENT’S DISCUSSION AND ANALYSIS
Banking Subsidiary Capital
The following table presents our banking subsidiary’s capital ratios under U.S. Basel III Standardized rules:
|
March 31, 2019
|
December 31, 2018
|
||||||||||
|
(dollars in millions, except ratio data)
|
Amount
|
|
Ratio
|
|
Amount
|
|
Ratio
|
|
|||
|
Citizens Bank, National Association
|
|||||||||||
|
CET1 capital
|
|
$15,004
|
|
10.9
|
%
|
|
$11,994
|
|
10.6
|
%
|
|
|
Tier 1 capital
|
15,004
|
|
10.9
|
|
11,994
|
|
10.6
|
|
|||
|
Total capital
|
17,458
|
|
12.7
|
|
14,252
|
|
12.5
|
|
|||
|
Tier 1 leverage
|
15,004
|
|
9.7
|
|
11,994
|
|
9.9
|
|
|||
|
Risk-weighted assets
|
137,050
|
|
113,610
|
|
|||||||
|
Quarterly adjusted average assets
|
154,846
|
|
121,686
|
|
|||||||
CBNA CET1 capital totaled
$15.0 billion
at
March 31, 2019
,
up
$3.0 billion
from
$12.0 billion
at
December 31, 2018
. The increase was primarily driven by the net impact of the merger of Citizens Bank of Pennsylvania (“CBPA”) into CBNA effective January 2, 2019, and net income for the three months ended March 31, 2019. The increase was partially offset by a $350 million special dividend paid to the Parent Company. At
March 31, 2019
, CBNA held minimal additional tier 1 capital. Total capital was
$17.5 billion
at
March 31, 2019
, an
increase
of
$3.2 billion
from
$14.3 billion
at
December 31, 2018
, driven by the increases in CET1 capital and an increase in ACL, primarily attributable to the merger.
CBNA had RWA of
$137.1 billion
at
March 31, 2019
, an
increase
of
$23.4 billion
from
December 31, 2018
, driven by an increase of approximately $22 billion as a result of the merger of CBPA into CBNA. In addition, the increase in RWA was driven by the creation of a right-of-use asset in conjunction with the adoption of ASU 2016-02,
Leases (Topic 842)
, and growth in commercial, education and multi-family loans.
These increases were partially offset by decreases in commercial commitments and runoff in the home equity portfolio
.
As of
March 31, 2019
, the CBNA tier 1 leverage ratio
decreased
17 basis points to
9.7%
from
9.9%
at
December 31, 2018
, primarily driven by a
$33.2 billion
increase
in quarterly adjusted average assets that drove a 234 basis point decline in the ratio, partially offset by a $3.0 billion increase in tier 1 capital that drove a 217 basis point increase in the ratio. These movements were primarily attributable to the merger of CBPA into CBNA.
LIQUIDITY
Liquidity is defined as our ability to meet our cash-flow and collateral obligations in a timely manner, at a reasonable cost. An institution must maintain operating liquidity to meet its expected daily and forecasted cash-flow requirements, as well as contingent liquidity to meet unexpected (stress scenario) funding requirements. As noted earlier, reflecting the importance of meeting all unexpected and stress-scenario funding requirements, we identify and manage contingent liquidity (consisting of cash balances at the FRB, unencumbered high-quality and liquid securities, and unused FHLB borrowing capacity). Separately, we also identify and manage asset liquidity as a subset of contingent liquidity (consisting of cash balances at the FRB and unencumbered high-quality securities). We consider the effective and prudent management of liquidity to be fundamental to our health and strength. We manage liquidity at the consolidated enterprise level and at each material legal entity, including at the Parent Company and CBNA level.
Parent Company Liquidity
Our Parent Company’s primary sources of cash are (i) dividends and interest received from CBNA as a result of investing in bank equity and subordinated debt and (ii) externally issued preferred stock and senior and subordinated debt. Uses of cash include the following: (i) routine cash flow requirements as a bank holding company, including periodic share repurchases and payments of dividends, interest and expenses; (ii) needs of subsidiaries, including CBNA, for additional equity and, as required, its need for debt financing; and (iii) support for extraordinary funding requirements when necessary. To the extent that the Parent Company has relied on wholesale borrowings, uses also include payments of related principal and interest.
On January 29, 2019, the Parent Company issued
$300 million
, or
12,000,000
depositary shares, each representing a 1/40th interest in a share of its
6.350%
fixed-to-floating rate non-cumulative perpetual Series D Preferred Stock, par value of $25.00 per share with a liquidation preference of $1,000 per share (equivalent to
$25
35
CITIZENS FINANCIAL GROUP, INC.
MANAGEMENT’S DISCUSSION AND ANALYSIS
per depositary share). For further discussion, see
Note 11 "Stockholders’ Equity"
to our unaudited interim Consolidated Financial Statements in Part I, Item 1 — Financial Statements, included in this Report.
During the
three months ended March 31, 2019
and
2018
, the Parent Company declared and paid dividends on common stock of
$149 million
and
$108 million
, respectively, and declared dividends on preferred stock of
$15 million
and
$7 million
, respectively.
During
three months ended March 31, 2019
and
2018
, the Parent Company repurchased
$200 million
and
$175 million
of its outstanding common stock, respectively.
Our Parent Company’s cash and cash equivalents represent a source of liquidity that can be used to meet various needs and totaled
$1.1 billion
as of
March 31, 2019
compared with
$911 million
as of
December 31, 2018
. The Parent Company’s double-leverage ratio (the combined equity investment in Parent Company subsidiaries divided by Parent Company equity) is a measure of reliance on equity cash flows from subsidiaries to fund Parent Company obligations. At
March 31, 2019
, the Parent Company’s double-leverage ratio was
97.9%
.
CBNA Liquidity
In the ordinary course of business, the liquidity of CBNA is managed by matching sources and uses of cash. The primary sources of bank liquidity include (i) deposits from our consumer and commercial customers; (ii) payments of principal and interest on loans and debt securities; and (iii) wholesale borrowings, as needed, and as described under “—Liquidity Risk Management and Governance.” The primary uses of bank liquidity include (i) withdrawals and maturities of deposits; (ii) payment of interest on deposits; (iii) funding of loans and related commitments; and (iv) funding of securities purchases. To the extent that CBNA has relied on wholesale borrowings, uses also include payments of related principal and interest. For further information on CBNA’s outstanding debt, see
Note 8 "Borrowed Funds"
to our Consolidated Financial Statements in Part I, Item 1—
Financial Statements and Supplementary Data, of this Report.
CBNA’s major businesses involve taking deposits and making loans. Hence, a key role of liquidity management is to ensure that customers have timely access to funds from deposits and loans. Liquidity management also involves maintaining sufficient liquidity to repay wholesale borrowings, pay operating expenses and support extraordinary funding requirements when necessary.
On February 14, 2019, CBNA issued $1.5 billion in senior notes, consisting of $700 million in three-year fixed-rate notes, $300 million in three-year floating-rate notes, and $500 million in seven-year fixed-rate notes.
Liquidity Risk
We define liquidity risk as the risk that an entity will be unable to meet its payment obligations in a timely manner, at a reasonable cost. Liquidity risk can arise due to contingent liquidity risk and/or funding liquidity risk.
Contingent liquidity risk is the risk that market conditions may reduce an entity’s ability to liquidate, pledge and/or finance certain assets and thereby substantially reduce the liquidity value of such assets. Drivers of contingent liquidity risk include general market disruptions as well as specific issues regarding the credit quality and/or valuation of a security or loan, issuer or borrower and/or asset class.
Funding liquidity risk is the risk that market conditions and/or entity-specific events may reduce an entity’s ability to raise funds from depositors and/or wholesale market counterparties. Drivers of funding liquidity risk may be idiosyncratic or systemic, reflecting impediments to operations and/or damaged market confidence.
Factors Affecting Liquidity
Given the composition of their assets and borrowing sources, contingent liquidity risk at CBNA would be materially affected by such events as deterioration of financing markets for high-quality securities (e.g., mortgage-backed securities and other instruments issued by the GNMA, FNMA and the FHLMC), by any inability of the FHLBs to provide collateralized advances and/or by a refusal of the FRB to act as lender of last resort in systemic stress.
Similarly, given the structure of its balance sheet, the funding liquidity risk of CBNA would be materially affected by an adverse idiosyncratic event (e.g., a major loss, causing a perceived or actual deterioration in its financial condition), an adverse systemic event (e.g., default or bankruptcy of a significant capital markets participant), or a combination of both (e.g., the financial crisis of 2008-2010). However, during the financial crisis, CBNA reduced its dependence on unsecured wholesale funding. Consequently, and despite ongoing exposure to a variety of idiosyncratic and systemic events, we view our contingent liquidity risk and our funding liquidity risk to be relatively modest.
36
CITIZENS FINANCIAL GROUP, INC.
MANAGEMENT’S DISCUSSION AND ANALYSIS
An additional variable affecting our access to unsecured wholesale market funds and to large denomination (i.e., uninsured) customer deposits is the credit ratings assigned by such agencies as Moody’s, Standard & Poor’s and Fitch. The following table presents our credit ratings:
|
|
March 31, 2019
|
|||||
|
|
Moody’s
|
Standard and
Poor’s
|
Fitch
|
|||
|
Citizens Financial Group, Inc.:
|
|
|
|
|||
|
Long-term issuer
|
NR
|
BBB+
|
BBB+
|
|||
|
Short-term issuer
|
NR
|
A-2
|
F2
|
|||
|
Subordinated debt
|
NR
|
BBB
|
BBB
|
|||
|
Preferred Stock
|
NR
|
BB+
|
BB-
|
|||
|
Citizens Bank, National Association:
|
||||||
|
Long-term issuer
|
Baa1
|
A-
|
BBB+
|
|||
|
Short-term issuer
|
NR
|
A-2
|
F2
|
|||
|
Long-term deposits
|
A1
|
NR
|
A-
|
|||
|
Short-term deposits
|
P-1
|
NR
|
F2
|
|||
|
NR = Not rated
|
||||||
Changes in our public credit ratings could affect both the cost and availability of our wholesale funding. As a result, and in order to maintain a conservative funding profile, our banking subsidiary continues to minimize reliance on unsecured wholesale funding. At
March 31, 2019
, our wholesale funding consisted primarily of secured borrowings from the FHLBs collateralized by high-quality residential mortgages, and term debt issued by the Parent Company and CBNA.
Existing and evolving regulatory liquidity requirements, such as the LCR and NSFR, represent another key driver of systemic liquidity conditions and liquidity management practices. The FRB, the OCC, and the FDIC regularly evaluate our liquidity as part of the overall supervisory process. In addition we are subject to existing and evolving regulatory liquidity requirements, some of which are subject to further rulemaking, guidance and interpretation by the applicable federal regulators. For further discussion, see “Regulation and Supervision — Financial Regulatory Reform” and “—Liquidity Requirements” in Part I, Item 1 — Business, of our Annual Report on Form 10-K for the year ended December 31, 2018.
The LCR was developed to ensure banks have sufficient high-quality liquid assets to cover expected net cash outflows over a 30-day liquidity stress period. In September 2014, the U.S. federal banking regulators published the final rule to implement the LCR. This rule also introduced a modified version of the LCR in the U.S., which generally applies to bank holding companies not active internationally (institutions with less than $10 billion of on-balance sheet foreign exposure), with total assets of greater than $50 billion but less than $250 billion. Under this definition we are designated as a modified LCR financial institution and were compliant beginning in January 2017. Achieving sustainable LCR compliance may require changes in the size and/or composition of our investment portfolio, the configuration of our discretionary wholesale funding portfolio, and our average cash position. We remain fully compliant with the LCR as of
March 31, 2019
.
Liquidity Risk Management and Governance
Liquidity risk is measured and managed by the Funding and Liquidity unit within our Treasury unit in accordance with policy guidelines promulgated by our Board and the Asset Liability Committee. In managing liquidity risk, the Funding and Liquidity unit delivers regular and comprehensive reporting, including current levels versus threshold limits for a broad set of liquidity metrics and early warning indicators, explanatory commentary relating to emerging risk trends and, as appropriate, recommended remedial strategies.
The mission of our Funding and Liquidity unit is to deliver and otherwise maintain prudent levels of operating liquidity (to support expected and projected funding requirements), and contingent liquidity (to support unexpected funding requirements resulting from idiosyncratic, systemic, and combination stress events, and regulatory liquidity requirements). Additionally, we will deliver this liquidity from stable funding sources, in a timely manner and at a reasonable cost, without significant adverse consequences.
37
CITIZENS FINANCIAL GROUP, INC.
MANAGEMENT’S DISCUSSION AND ANALYSIS
We seek to accomplish this mission by funding loans with stable deposits; by prudently controlling dependence on wholesale funding, particularly short-term unsecured funding; and by maintaining ample available liquidity, including a contingent liquidity buffer of unencumbered high-quality loans and securities. As of
March 31, 2019
:
|
•
|
Core deposits continued to be our primary source of funding and our consolidated period end loan-to-deposit ratio was
94.9%
;
|
|
•
|
Our cash position (which is defined as cash balance held at the FRB) totaled
$1.5 billion
;
|
|
•
|
Contingent liquidity was
$30.2 billion
, consisting of unencumbered high-quality liquid assets of
$20.3 billion
, unused FHLB capacity of
$8.4 billion
, and our cash position (defined above) of
$1.5 billion
. Asset liquidity (a component of contingent liquidity) was
$21.8 billion
consisting of our cash position of
$1.5 billion
and unencumbered high-quality and liquid securities of
$20.3 billion
; and
|
|
•
|
Available discount window capacity, defined as available total borrowing capacity from the FRB based on identified collateral, is secured by non-mortgage commercial and retail loans and totaled
$13.8 billion
. Use of this borrowing capacity would be considered only during exigent circumstances.
|
The Funding and Liquidity unit monitors a variety of liquidity and funding metrics and early warning indicators and metrics, including specific risk thresholds limits. These monitoring tools are broadly classified as follows:
|
•
|
Current liquidity sources and capacities, including cash at the FRBs, free and liquid securities and available and secured FHLB borrowing capacity;
|
|
•
|
Liquidity stress sources, including idiosyncratic, systemic and combined stresses, in addition to evolving regulatory requirements such as the LCR and the NSFR; and
|
|
•
|
Current and prospective exposures, including secured and unsecured wholesale funding and spot and cumulative cash-flow gaps across a variety of horizons.
|
Further, certain of these metrics are monitored individually for CBNA and for our consolidated enterprise on a daily basis, including cash position, unencumbered securities, asset liquidity, and available FHLB borrowing capacity. In order to identify emerging trends and risks and inform funding decisions, specific metrics are also forecasted over a one-year horizon.
Cash flows from operating activities contributed
$472 million
in the first quarter of 2019, primarily driven by net income of
$439 million
. Net cash used by investing activities was
$1.5 billion
, primarily reflecting purchases of debt securities available for sale of
$2.0 billion
and a net increase in loans and leases of
$1.0 billion
, partially offset by proceeds from the sale of debt securities available for sale of
$821 million
. Cash used by financing activities was
$639 million
, driven by higher repayments of long term borrowed funds of
$7.0 billion
and a net increase in deposits of
$4.3 billion
, partially offset by proceeds from issuance of long-term borrowed funds of
$2.8 billion
. The
$7.0 billion
repayments of long term borrowed funds included $6.3 billion of FHLB borrowings and $750 million of term debt. The
$2.8 billion
proceeds from issuances of long-term borrowed funds included $1.3 billion of FHLB borrowings and $1.5 billion of term debt. These activities resulted in a cumulative decrease in cash and cash equivalents of
$1.6 billion
, which when added to the cash and cash equivalents balance of
$4.1 billion
, resulted in an ending balance of cash and cash equivalents of
$2.4 billion
as of
March 31, 2019
.
Cash flows from operating activities contributed $704 million in the first quarter 2018, driven by net income of $388 million and proceeds from sales of mortgage LHFS of $655 million, partially offset by originations of mortgage LHFS of $614 million. Net cash used by investing activities was $1.1 billion, primarily reflecting a net increase in loans and leases of $1.0 billion. Cash provided by financing activities was $1.2 billion, driven by proceeds from issuance of long-term borrowed funds of $6.3 billion and a net increase in deposits of $641 million, partially offset by a net decrease in other short-term borrowed funds of $1.6 billion, and repayments of long-term FHLB advances of $3.3 billion. The $6.3 billion proceeds from issuances of long-term borrowed funds included $750 million from issuances of medium-term debt and $5.5 billion in FHLB advances. These activities resulted in a cumulative increase in cash and cash equivalents of $827 million, which when added to the cash and cash equivalents balance of $3.0 billion at the beginning of the year, resulted in an ending balance of cash and cash equivalents of $3.9 billion as of March 31, 2018.
38
CITIZENS FINANCIAL GROUP, INC.
MANAGEMENT’S DISCUSSION AND ANALYSIS
OFF-BALANCE SHEET ARRANGEMENTS
The following table presents our outstanding off-balance sheet arrangements. See
Note 12 "Commitments and Contingencies"
to our unaudited interim Consolidated Financial Statements in Part I, Item 1 — Financial Statements, included in this Report.
|
(in millions)
|
March 31, 2019
|
December 31, 2018
|
Change
|
|
Percent
|
|
||||||||
|
Commitments to extend credit
|
|
$68,564
|
|
|
$69,553
|
|
|
($989
|
)
|
(1
|
%)
|
|||
|
Letters of credit
|
2,089
|
|
2,125
|
|
(36
|
)
|
(2
|
)
|
||||||
|
Marketing rights
|
37
|
|
37
|
|
—
|
|
—
|
|
||||||
|
Risk participation agreements
|
27
|
|
19
|
|
8
|
|
42
|
|
||||||
|
Loans sold with recourse
|
22
|
|
5
|
|
17
|
|
NM
|
|
||||||
|
Total
|
|
$70,739
|
|
|
$71,739
|
|
|
($1,000
|
)
|
(1
|
%)
|
|||
CRITICAL ACCOUNTING ESTIMATES
Our unaudited interim Consolidated Financial Statements, which are included in this Report, are prepared in accordance with GAAP. The preparation of financial statements in conformity with GAAP requires us to establish accounting policies and make estimates that affect amounts reported in our audited Consolidated Financial Statements.
An accounting estimate requires assumptions and judgments about uncertain matters that could have a material effect on our unaudited interim Consolidated Financial Statements. Estimates are made using facts and circumstances known at a point in time. Changes in those facts and circumstances could produce results substantially different from those estimates. Our most significant accounting policies and estimates in the near-term relate to the determination of the ACL and the fair value of MSRs. For additional information regarding these accounting policies and estimates and their related application, see “—Critical Accounting Estimates” to the audited Consolidated Financial Statements in our Annual Report on Form 10-K for the year ended December 31, 2018. No material changes were made to these critical accounting policies or estimates during the three months ended
March 31, 2019
.
RISK GOVERNANCE
We are committed to maintaining a strong, integrated, and proactive approach to the management of all risks to which we are exposed in pursuit of our business objectives. A key aspect of our Board’s responsibility as the main decision making body is setting our risk appetite to ensure that the levels of risk that we are willing to accept in the attainment of our strategic business and financial objectives are clearly understood.
To enable our Board to carry out its objectives, it has delegated authority for risk management activities, as well as governance and oversight of those activities, to a number of Board and executive management level risk committees. The Executive Risk Committee (“ERC”), chaired by the Chief Risk Officer, is responsible for oversight of risk across the enterprise and actively considers our inherent material risks, analyzes our overall risk profile and seeks confirmation that the risks are being appropriately identified, assessed and mitigated. Reporting to the ERC are the following additional committees covering specific areas of risk: Compliance and Operational Risk Committee, Model Risk Committee, Credit Policy Committee, Asset Liability Committee, Business Initiatives Review Committee, and the Ethics Oversight Committee.
There have been no significant changes in our risk governance practices, risk framework, risk appetite, or credit risk as described in “—Risk Governance” to the audited Consolidated Financial Statements in our Annual Report on Form 10-K for the year ended December 31, 2018.
MARKET RISK
Market risk refers to potential losses arising from changes in interest rates, foreign exchange rates, equity prices, commodity prices and/or other relevant market rates or prices. Modest market risk arises from trading activities that serve customer needs, including hedging of interest rate and foreign exchange risk. As described below, more material market risk arises from our non-trading banking activities, such as loan origination and deposit-gathering. We have established enterprise-wide policies and methodologies to identify, measure, monitor and report market risk. We actively manage both trading and non-trading market risks.
39
CITIZENS FINANCIAL GROUP, INC.
MANAGEMENT’S DISCUSSION AND ANALYSIS
Non-Trading Risk
We are exposed to market risk as a result of non-trading banking activities. This market risk is substantially composed of interest rate risk, as we have no direct currency or commodity risk and de minimis equity risk. We also have market risk related to capital markets loan originations, as well as the valuation of our mortgage servicing rights. There have been no significant changes in our sources of interest rate risk, interest rate risk practices, risk framework, metrics or assumptions as described in “—Market Risk — Non-Trading Risk” to the audited Consolidated Financial Statements in our Annual Report on Form 10-K for the year ended December 31, 2018.
The table below reports net interest income exposures against a variety of interest rate scenarios. Our policies involve measuring exposures as a percentage change in net interest income over the next year due to either instantaneous or gradual parallel changes in rates relative to the market implied forward yield curve. With rates rising from historically low levels due to Federal Open Market Committee rate increases, exposure to falling rates has increased. As the following table illustrates, our balance sheet is asset-sensitive: net interest income would benefit from an increase in interest rates. Exposure to a decline in interest rates is within limit. While an instantaneous and severe shift in interest rates was used in this analysis, we believe that any actual shift in interest rates would likely be more gradual and would therefore have a more modest impact as demonstrated in the following table.
The table below presents the sensitivity of net interest income to various parallel yield curve shifts from the market implied forward yield curve:
|
Estimated % Change in Net Interest Income over 12 Months
|
|||||
|
Basis points
|
March 31, 2019
|
December 31, 2018
|
|||
|
Instantaneous Change in Interest Rates
|
|
|
|||
|
+200
|
8.7
|
%
|
9.5
|
%
|
|
|
+100
|
4.4
|
|
4.8
|
|
|
|
-100
|
(4.8
|
)
|
(4.5
|
)
|
|
|
Gradual Change in Interest Rates
|
|||||
|
+200
|
4.2
|
|
4.9
|
|
|
|
+100
|
2.1
|
|
2.5
|
|
|
|
-100
|
(1.0
|
)
|
(1.1
|
)
|
|
Asset sensitivity against a 200 basis point gradual increase in rates was
4.2%
at
March 31, 2019
, a decrease from
4.9%
at
December 31, 2018
. As the FRB remains on hold, dependent on economic growth and data, asset sensitivity is being opportunistically reduced as the risk of falling rates has increased over the quarter. T
h
e risk position can be affected by changes in interest rates which impact the repricing sensitivity or beta of the deposit base as well as the cash flows on prepayable assets. The risk position is managed within our risk limits, and long term view of interest rates through occasional adjustments to securities investments, interest rate swaps and mix of funding.
We use a valuation measure of exposure to structural interest rate risk, Economic Value of Equity (“EVE”), as a supplement to net interest income simulations. EVE complements net interest income simulation analysis as it estimates risk exposure over a long-term horizon. EVE measures the extent to which the economic value of assets, liabilities and off-balance sheet instruments may change in response to fluctuations in interest rates. This analysis is highly dependent upon assumptions applied to assets and liabilities with non-contractual maturities. The change in value is expressed as a percentage of regulatory capital.
40
CITIZENS FINANCIAL GROUP, INC.
MANAGEMENT’S DISCUSSION AND ANALYSIS
We use interest rate swap contracts to manage the interest rate exposure to variability in the interest cash flows on our floating-rate assets and floating-rate wholesale funding, and to hedge market risk on fixed-rate capital markets debt issuances. The table below summarizes the related hedging activities.
|
March 31, 2019
|
December 31, 2018
|
||||||||||||||||||||||||
|
Weighted Average
|
Weighted Average
|
||||||||||||||||||||||||
|
(dollars in millions)
|
Notional Amount
|
Fair Value
|
Maturity (Years)
|
Receive Rate
|
Pay Rate
|
Notional Amount
|
Fair Value
|
Maturity (Years)
|
Receive Rate
|
Pay Rate
|
|||||||||||||||
|
Cash flow - receive fixed/pay variable - conventional ALM
|
|
$9,850
|
|
|
($10
|
)
|
2.3
|
1.9
|
%
|
2.5
|
%
|
|
$8,100
|
|
|
$3
|
|
2.2
|
|
1.7
|
%
|
2.5
|
%
|
||
|
Fair value - receive fixed/pay variable - conventional debt
|
4,650
|
|
(5
|
)
|
2.8
|
2.0
|
|
2.7
|
|
3,450
|
|
2
|
|
2.4
|
|
1.8
|
|
2.7
|
|
||||||
|
Cash flow - pay fixed/receive variable - conventional ALM
|
—
|
|
—
|
|
—
|
|
—
|
|
—
|
|
500
|
|
—
|
|
—
|
|
2.4
|
|
1.3
|
|
|||||
|
Total portfolio swaps
|
|
$14,500
|
|
|
($15
|
)
|
2.4
|
1.9
|
%
|
2.5
|
%
|
|
$12,050
|
|
|
$5
|
|
2.2
|
|
1.8
|
%
|
2.5
|
%
|
||
|
Floors - conventional ALM
(1)
|
|
$7,000
|
|
|
$—
|
|
0.3
|
|
—
|
|
—
|
|
|
$7,000
|
|
|
$—
|
|
0.5
|
|
|||||
(1)
Conventional ALM floors do not have a receive rate or pay rate, but rather a strike price on the option.
Capital Markets
A key component of our capital markets activities is the underwriting and distribution of corporate credit facilities to partially finance mergers and acquisitions transactions for our clients. We have a rigorous risk management process around these activities, including a limit structure capping our underwriting risk, our potential loss, and sub limits for specific asset classes. Further, the ability to approve underwriting exposure is delegated only to senior level individuals in the credit risk management and capital markets organizations with each transaction adjudicated in a formal committee meeting.
Mortgage Servicing Rights
We have market risk associated with the value of residential mortgage servicing right assets (“MSRs”), which are impacted by various types of inherent risks, including risks related to duration, basis, convexity, volatility and yield curve. We have elected to account for the MSRs acquired from FAMC or originated after December 31,2018 at fair value while maintaining a lower of cost or market approach on our non-FAMC MSRs originated before December 31, 2018.
As part of our overall risk management strategy relative to the fair market value of the MSRs acquired from FAMC or originated after December 31, 2018, we enter into various free-standing derivatives, such as interest rate swaps, interest rate swaptions, interest rate futures, and forward contracts to purchase mortgage-backed securities to economically hedge the changes in fair value. As of
March 31, 2019
, the fair value of these MSRs was
$563 million
and the total notional amount of related derivative contracts was
$7.8 billion
. Gains and losses on MSRs and the related derivatives used for hedging are included in mortgage banking fees on the Consolidated Statements of Operations.
As of
March 31, 2019
and
December 31, 2018
, our non-FAMC MSRs originated on or before December 31, 2018 had a book value of
$212 million
and $221 million, respectively, and were carried at the lower of cost or market. As of
March 31, 2019
and
December 31, 2018
, these MSRs had a fair value of
$224 million
and
$243 million
, respectively, which exceeded the carrying value at those dates. Depending on the interest rate environment, hedges may be used to protect the market value of these MSRs.
As with our traded market risk based activities, earnings at risk excludes the impact of MSRs. MSRs are captured under our single price risk management framework that is used for calculating a management value at risk that is consistent with the definition used by banking regulators, as defined below.
Trading Risk
We are exposed to market risk primarily through client facilitation activities including derivatives and foreign exchange products as well as underwriting and market making activities. Exposure is created as a result of changes in interest rates and related basis spreads and volatility, foreign exchange rates, and credit spreads on a select range of interest rates, foreign exchange, commodities and secondary loan instruments. These trading activities are conducted through CBNA.
There have been no significant changes in our market risk governance, market risk measurement, or market risk practices including VaR, stressed VaR, sensitivity analysis, stress testing, or VaR model review and validation as described in “—Market Risk — Trading Risk” to the audited Consolidated Financial Statements in our Annual Report on Form 10-K for the year ended December 31, 2018.
41
CITIZENS FINANCIAL GROUP, INC.
MANAGEMENT’S DISCUSSION AND ANALYSIS
Market Risk Regulatory Capital
The U.S. banking regulators’ “Market Risk Rule” covers the calculation of market risk capital and substantially modified the determination of market risk-weighted assets and implemented a more risk sensitive methodology for the risk inherent in certain trading positions categorized as “covered positions.” For the purposes of the Market Risk Rule, all of our client facing trades and associated hedges need to maintain a low risk profile to qualify, and do qualify, as “covered positions.” For the three months ended
March 31, 2019
, we were not subject to the reporting threshold under the Market Risk Rule. As a result, the
$685 million
of calculated market risk-weighted assets as of
March 31, 2019
were not included in our risk-weighted assets. As such, our covered trading activities were risk-weighted under U.S. Basel III Standardized credit risk rules. While not subject to the determination requirements of market risk-weighted assets, we nevertheless comply with the Market Risk Rule’s other requirements. The internal management VaR measure is calculated based on the same population of trades that is utilized for regulatory VaR. For the three months ended March 31, 2018, we were subject to the reporting threshold under the Market Risk Rule. As a result, the
$707 million
of calculated market risk-weighted assets as of March 31, 2018 were included in our risk-weighted assets.
The following table presents the results of our modeled and non-modeled measures for regulatory capital calculations:
|
(in millions)
|
For the Three Months Ended March 31, 2019
|
For the Three Months Ended March 31, 2018
|
||||||||||||||||||||||||||||||
|
Market Risk Category
|
Period End
|
Average
|
High
|
Low
|
Period End
|
Average
|
High
|
Low
|
||||||||||||||||||||||||
|
Interest Rate
|
|
$—
|
|
|
$—
|
|
|
$—
|
|
|
$—
|
|
|
$2
|
|
|
$2
|
|
|
$2
|
|
|
$1
|
|
||||||||
|
Foreign Exchange Currency Rate
|
—
|
|
—
|
|
—
|
|
—
|
|
—
|
|
—
|
|
1
|
|
—
|
|
||||||||||||||||
|
Credit Spread
|
4
|
|
4
|
|
6
|
|
4
|
|
2
|
|
2
|
|
3
|
|
2
|
|
||||||||||||||||
|
Commodity
|
—
|
|
—
|
|
—
|
|
—
|
|
—
|
|
—
|
|
—
|
|
—
|
|
||||||||||||||||
|
General VaR
|
4
|
|
4
|
|
5
|
|
3
|
|
3
|
|
3
|
|
4
|
|
2
|
|
||||||||||||||||
|
Specific Risk VaR
|
—
|
|
—
|
|
—
|
|
—
|
|
—
|
|
—
|
|
—
|
|
—
|
|
||||||||||||||||
|
Total VaR
|
|
$4
|
|
|
$4
|
|
|
$5
|
|
|
$3
|
|
|
$3
|
|
|
$3
|
|
|
$4
|
|
|
$2
|
|
||||||||
|
Stressed General VaR
|
|
$9
|
|
|
$10
|
|
|
$13
|
|
|
$8
|
|
|
$13
|
|
|
$12
|
|
|
$15
|
|
|
$9
|
|
||||||||
|
Stressed Specific Risk VaR
|
—
|
|
—
|
|
—
|
|
—
|
|
—
|
|
—
|
|
—
|
|
—
|
|
||||||||||||||||
|
Total Stressed VaR
|
|
$9
|
|
|
$10
|
|
|
$13
|
|
|
$8
|
|
|
$13
|
|
|
$12
|
|
|
$15
|
|
|
$9
|
|
||||||||
|
Market Risk Regulatory Capital
|
|
$43
|
|
|
$44
|
|
||||||||||||||||||||||||||
|
Specific Risk Not Modeled Add-on
|
12
|
|
13
|
|
||||||||||||||||||||||||||||
|
de Minimis Exposure Add-on
|
—
|
|
—
|
|
||||||||||||||||||||||||||||
|
Total Market Risk Regulatory Capital
|
|
$55
|
|
|
$57
|
|
||||||||||||||||||||||||||
|
Market Risk-Weighted Assets
|
|
$685
|
|
|
$707
|
|
||||||||||||||||||||||||||
|
Market Risk-Weighted Assets (included in our FR Y-9C regulatory filing)
|
|
$—
|
|
|
$707
|
|
||||||||||||||||||||||||||
42
CITIZENS FINANCIAL GROUP, INC.
MANAGEMENT’S DISCUSSION AND ANALYSIS
VaR Backtesting
Backtesting is one form of validation of the VaR model and is run daily. The Market Risk Rule requires a comparison of our internal VaR measure to the actual net trading revenue (excluding fees, commissions, reserves, intra-day trading and net interest income) for each day over the preceding year (the most recent 250 business days). Any observed loss in excess of the VaR number is taken as an exception. The level of exceptions determines the multiplication factor used to derive the VaR and SVaR-based capital requirement for regulatory reporting purposes, when applicable. We perform sub-portfolio backtesting as required under the Market Risk Rule, and as approved by our banking regulators, for interest rate, credit spread, and foreign exchange positions. The following graph shows our daily net trading revenue and total internal, modeled VaR for the twelve months ended
March 31, 2019
.
Daily VaR Backtesting
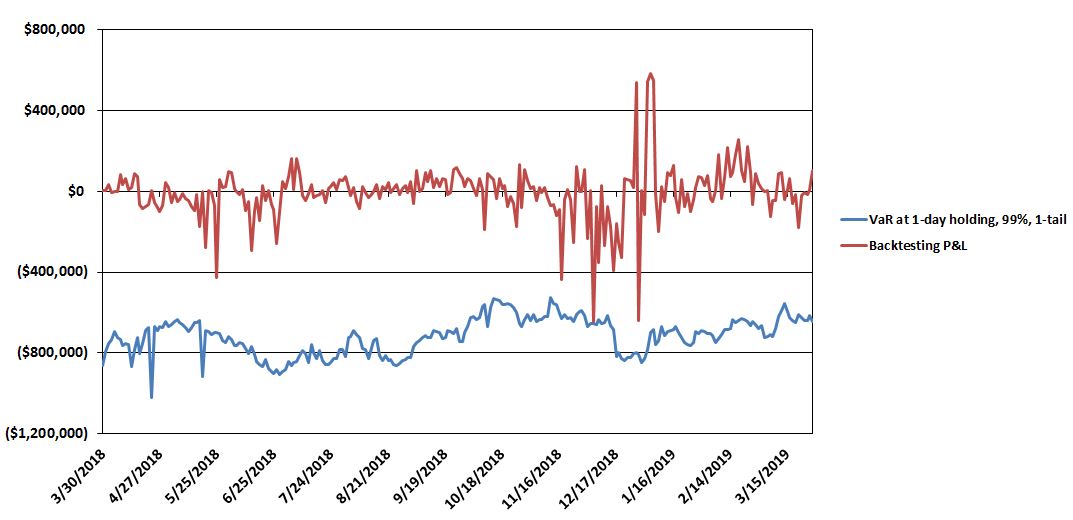
43
CITIZENS FINANCIAL GROUP, INC.
MANAGEMENT’S DISCUSSION AND ANALYSIS
KEY PERFORMANCE METRICS, NON-GAAP FINANCIAL MEASURES AND RECONCILIATIONS
For more information on the computation of key performance metrics and non-GAAP financial measures, see “—Introduction — Key Performance Metrics Used by Management and Non-GAAP Financial Measures,” included in this Report. The following table presents computations of key performance metrics used throughout “Management’s Discussion and Analysis of Financial Condition and Results of Operations”:
|
|
|
As of and for the Three Months Ended March 31,
|
||||||
|
(in millions, except share, per share and ratio data)
|
Ref.
|
2019
|
|
2018
|
|
|||
|
Total revenue (GAAP)
|
A
|
|
$1,588
|
|
|
$1,462
|
|
|
|
Noninterest expense (GAAP)
|
B
|
937
|
|
883
|
|
|||
|
Net income (GAAP)
|
C
|
439
|
|
388
|
|
|||
|
Net income available to common stockholders (GAAP)
|
D
|
424
|
|
381
|
|
|||
|
Return on average common equity:
|
||||||||
|
Average common equity (GAAP)
|
E
|
|
$19,942
|
|
|
$19,732
|
|
|
|
Return on average common equity
|
D/E
|
8.62
|
%
|
7.83
|
%
|
|||
|
Return on average tangible common equity:
|
||||||||
|
Average common equity (GAAP)
|
E
|
|
$19,942
|
|
|
$19,732
|
|
|
|
Less: Average goodwill (GAAP)
|
7,018
|
|
6,887
|
|
||||
|
Less: Average other intangibles (GAAP)
|
59
|
|
2
|
|
||||
|
Add: Average deferred tax liabilities related to goodwill (GAAP)
|
368
|
|
355
|
|
||||
|
Average tangible common equity
|
F
|
|
$13,233
|
|
|
$13,198
|
|
|
|
Return on average tangible common equity
|
D/F
|
13.00
|
%
|
11.71
|
%
|
|||
|
Return on average total assets:
|
||||||||
|
Average total assets (GAAP)
|
G
|
|
$160,415
|
|
|
$151,523
|
|
|
|
Return on average total assets
|
C/G
|
1.11
|
%
|
1.04
|
%
|
|||
|
Return on average total tangible assets:
|
||||||||
|
Average total assets (GAAP)
|
G
|
|
$160,415
|
|
|
$151,523
|
|
|
|
Less: Average goodwill (GAAP)
|
7,018
|
|
6,887
|
|
||||
|
Less: Average other intangibles (GAAP)
|
59
|
|
2
|
|
||||
|
Add: Average deferred tax liabilities related to goodwill (GAAP)
|
368
|
|
355
|
|
||||
|
Average tangible assets
|
H
|
|
$153,706
|
|
|
$144,989
|
|
|
|
Return on average total tangible assets
|
C/H
|
1.16
|
%
|
1.08
|
%
|
|||
|
Efficiency ratio:
|
||||||||
|
Efficiency ratio
|
B/A
|
59.00
|
%
|
60.43
|
%
|
|||
|
Operating leverage:
|
||||||||
|
Increase in total revenue
|
8.72
|
%
|
5.57
|
%
|
||||
|
Increase in noninterest expense
|
6.15
|
|
3.43
|
|
||||
|
Operating leverage
|
2.57
|
%
|
2.14
|
%
|
||||
|
Effective income tax rate:
|
||||||||
|
Income before income tax expense
|
I
|
|
$566
|
|
|
$501
|
|
|
|
Income tax expense
|
J
|
127
|
|
113
|
|
|||
|
Effective income tax rate
|
J/I
|
22.42
|
%
|
22.52
|
%
|
|||
|
Net income per average common share - basic and diluted:
|
||||||||
|
Average common shares outstanding - basic (GAAP)
|
K
|
460,713,172
|
|
487,500,618
|
|
|||
|
Average common shares outstanding - diluted (GAAP)
|
L
|
462,520,680
|
|
489,266,826
|
|
|||
|
Net income per average common share - basic (GAAP)
|
D/K
|
|
$0.92
|
|
|
$0.78
|
|
|
|
Net income per average common share - diluted (GAAP)
|
D/L
|
0.92
|
|
0.78
|
|
|||
|
Dividend payout ratio:
|
||||||||
|
Cash dividends declared and paid per common share
|
M
|
|
$0.32
|
|
|
$0.22
|
|
|
|
Dividend payout ratio
|
M/(D/K)
|
35
|
%
|
28
|
%
|
|||
44
CITIZENS FINANCIAL GROUP, INC.
MANAGEMENT’S DISCUSSION AND ANALYSIS
|
|
|
As of and for the Three Months Ended March 31,
|
||||||||||||||||||||||||
|
|
|
2019
|
2018
|
|||||||||||||||||||||||
|
(in millions, except ratio data)
|
Ref.
|
Consumer
Banking |
Commercial
Banking |
Other
|
Consolidated
|
Consumer
Banking |
Commercial
Banking |
Other
|
Consolidated
|
|||||||||||||||||
|
Net income available to common stockholders:
|
||||||||||||||||||||||||||
|
Net income (GAAP)
|
N
|
|
$202
|
|
|
$227
|
|
|
$10
|
|
|
$439
|
|
|
$170
|
|
|
$215
|
|
|
$3
|
|
|
$388
|
|
|
|
Less: Preferred stock dividends
|
—
|
|
—
|
|
15
|
|
15
|
|
—
|
|
—
|
|
7
|
|
7
|
|
||||||||||
|
Net income (loss) available to common stockholders
|
O
|
|
$202
|
|
|
$227
|
|
|
($5
|
)
|
|
$424
|
|
|
$170
|
|
|
$215
|
|
|
($4
|
)
|
|
$381
|
|
|
|
Efficiency ratio:
|
|
|
|
|
|
|
|
|
|
|
||||||||||||||||
|
Total revenue (GAAP)
|
P
|
|
$1,035
|
|
|
$522
|
|
|
$31
|
|
|
$1,588
|
|
|
$955
|
|
|
$482
|
|
|
$25
|
|
|
$1,462
|
|
|
|
Noninterest expense (GAAP)
|
Q
|
700
|
|
209
|
|
28
|
|
937
|
|
656
|
|
208
|
|
19
|
|
883
|
|
|||||||||
|
Efficiency ratio
|
Q/P
|
67.62
|
%
|
40.11
|
%
|
NM
|
|
59.00
|
%
|
68.72
|
%
|
43.07
|
%
|
NM
|
|
60.43
|
%
|
|||||||||
|
Return on average total tangible assets:
|
|
|
|
|
|
|
|
|
|
|||||||||||||||||
|
Average total assets (GAAP)
|
|
$65,007
|
|
|
$55,630
|
|
|
$39,778
|
|
|
$160,415
|
|
|
$61,348
|
|
|
$50,393
|
|
|
$39,782
|
|
|
$151,523
|
|
||
|
Less: Average goodwill (GAAP)
|
|
119
|
|
23
|
|
6,876
|
|
7,018
|
|
—
|
|
11
|
|
6,876
|
|
6,887
|
|
|||||||||
|
Less: Average other intangibles (GAAP)
|
|
55
|
|
4
|
|
—
|
|
59
|
|
—
|
|
2
|
|
—
|
|
2
|
|
|||||||||
|
Add: Average deferred tax liabilities related to goodwill (GAAP)
|
|
—
|
|
—
|
|
368
|
|
368
|
|
—
|
|
—
|
|
355
|
|
355
|
|
|||||||||
|
Average total tangible assets
|
R
|
|
$64,833
|
|
|
$55,603
|
|
|
$33,270
|
|
|
$153,706
|
|
|
$61,348
|
|
|
$50,380
|
|
|
$33,261
|
|
|
$144,989
|
|
|
|
Return on average total tangible assets
|
N/R
|
1.26
|
%
|
1.66
|
%
|
NM
|
|
1.16
|
%
|
1.12
|
%
|
1.73
|
%
|
NM
|
|
1.08
|
%
|
|||||||||
45
CITIZENS FINANCIAL GROUP, INC.
MANAGEMENT’S DISCUSSION AND ANALYSIS
The following table presents computations of non-GAAP financial measures representing our “Underlying” results used throughout “Management's Discussion and Analysis of Financial Condition and Results of Operations”:
|
|
|
As of and for the Three Months Ended March 31,
|
||||||
|
(in millions, except share, per share and ratio data)
|
Ref.
|
2019
|
|
2018
|
|
|||
|
Noninterest income, Underlying:
|
||||||||
|
Noninterest income (GAAP)
|
|
$428
|
|
|
$371
|
|
||
|
Less: Notable items
|
—
|
|
—
|
|
||||
|
Noninterest income, Underlying (non-GAAP)
|
|
$428
|
|
|
$371
|
|
||
|
Total revenue, Underlying:
|
||||||||
|
Total revenue (GAAP)
|
A
|
|
$1,588
|
|
|
$1,462
|
|
|
|
Less: Notable items
|
—
|
|
—
|
|
||||
|
Total revenue, Underlying (non-GAAP)
|
S
|
|
$1,588
|
|
|
$1,462
|
|
|
|
Noninterest expense, Underlying:
|
||||||||
|
Noninterest expense (GAAP)
|
B
|
|
$937
|
|
|
$883
|
|
|
|
Less: Notable items
|
5
|
|
—
|
|
||||
|
Noninterest expense, Underlying (non-GAAP)
|
T
|
|
$932
|
|
|
$883
|
|
|
|
Pre-provision profit:
|
||||||||
|
Total revenue (GAAP)
|
A
|
|
$1,588
|
|
|
$1,462
|
|
|
|
Less: Noninterest expense (GAAP)
|
B
|
937
|
|
883
|
|
|||
|
Pre-provision profit (GAAP)
|
|
$651
|
|
|
$579
|
|
||
|
Pre-provision profit, Underlying
|
||||||||
|
Total revenue, Underlying (non-GAAP)
|
S
|
|
$1,588
|
|
|
$1,462
|
|
|
|
Less: Noninterest expense, Underlying (non-GAAP)
|
T
|
932
|
|
883
|
|
|||
|
Pre-provision profit, Underlying (non-GAAP)
|
|
$656
|
|
|
$579
|
|
||
|
Income before income tax expense, Underlying:
|
||||||||
|
Income before tax expense (GAAP)
|
I
|
|
$566
|
|
|
$501
|
|
|
|
Less: Notable items
|
(5
|
)
|
—
|
|
||||
|
Income before income tax expense, Underlying (non-GAAP)
|
U
|
|
$571
|
|
|
$501
|
|
|
|
Income tax expense and effective income tax rate, Underlying:
|
||||||||
|
Income tax expense (GAAP)
|
J
|
|
$127
|
|
|
$113
|
|
|
|
Less: Notable items
|
(1
|
)
|
—
|
|
||||
|
Income tax expense, Underlying (non-GAAP)
|
V
|
|
$128
|
|
|
$113
|
|
|
|
Effective income tax rate (GAAP)
|
J/I
|
22.42
|
%
|
22.52
|
%
|
|||
|
Effective income tax rate, Underlying (non-GAAP)
|
V/U
|
22.44
|
|
22.52
|
|
|||
|
Net income, Underlying:
|
||||||||
|
Net income (GAAP)
|
C
|
|
$439
|
|
|
$388
|
|
|
|
Add: Notable items, net of tax expense
|
4
|
|
—
|
|
||||
|
Net income, Underlying
(non-GAAP)
|
W
|
|
$443
|
|
|
$388
|
|
|
46
CITIZENS FINANCIAL GROUP, INC.
MANAGEMENT’S DISCUSSION AND ANALYSIS
|
|
|
As of and for the Three Months Ended March 31,
|
||||||
|
(in millions, except share, per share and ratio data)
|
Ref.
|
2019
|
|
2018
|
|
|||
|
Net income available to common stockholders, Underlying:
|
||||||||
|
Net income available to common stockholders (GAAP)
|
D
|
|
$424
|
|
|
$381
|
|
|
|
Add: Notable items, net of tax expense
|
4
|
|
—
|
|
||||
|
Net income available to common stockholders, Underlying (non-GAAP)
|
X
|
|
$428
|
|
|
$381
|
|
|
|
Return on average common equity and return on average common equity, Underlying:
|
||||||||
|
Average common equity (GAAP)
|
E
|
|
$19,942
|
|
|
$19,732
|
|
|
|
Return on average common equity
|
D/E
|
8.62
|
%
|
7.83
|
%
|
|||
|
Return on average common equity, Underlying
(non-GAAP)
|
X/E
|
8.71
|
|
7.83
|
|
|||
|
Return on average tangible common equity and return on average tangible common equity, Underlying:
|
|
|||||||
|
Average common equity (GAAP)
|
E
|
|
$19,942
|
|
|
$19,732
|
|
|
|
Less: Average goodwill (GAAP)
|
7,018
|
|
6,887
|
|
||||
|
Less: Average other intangibles (GAAP)
|
59
|
|
2
|
|
||||
|
Add: Average deferred tax liabilities related to goodwill (GAAP)
|
368
|
|
355
|
|
||||
|
Average tangible common equity
|
F
|
|
$13,233
|
|
|
$13,198
|
|
|
|
Return on average tangible common equity
|
D/F
|
13.00
|
%
|
11.71
|
%
|
|||
|
Return on average tangible common equity, Underlying (non-GAAP)
|
X/F
|
13.12
|
|
11.71
|
|
|||
|
Return on average total assets and return on average total assets, Underlying:
|
||||||||
|
Average total assets (GAAP)
|
G
|
|
$160,415
|
|
|
$151,523
|
|
|
|
Return on average total assets
|
C/G
|
1.11
|
%
|
1.04
|
%
|
|||
|
Return on average total assets, Underlying (non-GAAP)
|
W/G
|
1.12
|
|
1.04
|
|
|||
|
Return on average total tangible assets and return on average total tangible assets, Underlying:
|
|
|||||||
|
Average total assets (GAAP)
|
G
|
|
$160,415
|
|
|
$151,523
|
|
|
|
Less: Average goodwill (GAAP)
|
|
7,018
|
|
6,887
|
|
|||
|
Less: Average other intangibles (GAAP)
|
|
59
|
|
2
|
|
|||
|
Add: Average deferred tax liabilities related to goodwill (GAAP)
|
|
368
|
|
355
|
|
|||
|
Average tangible assets
|
H
|
|
$153,706
|
|
|
$144,989
|
|
|
|
Return on average total tangible assets
|
C/H
|
1.16
|
%
|
1.08
|
%
|
|||
|
Return on average total tangible assets, Underlying (non-GAAP)
|
W/H
|
1.17
|
|
1.08
|
|
|||
|
Efficiency ratio and efficiency ratio, Underlying:
|
|
|||||||
|
Efficiency ratio
|
B/A
|
59.00
|
%
|
60.43
|
%
|
|||
|
Efficiency ratio, Underlying (non-GAAP)
|
T/S
|
58.67
|
|
60.43
|
|
|||
|
Operating leverage and operating leverage, Underlying:
|
||||||||
|
Increase in total revenue
|
8.72
|
%
|
5.57
|
%
|
||||
|
Increase in noninterest expense
|
6.15
|
|
3.43
|
|
||||
|
Operating leverage
|
2.57
|
%
|
2.14
|
%
|
||||
|
Increase in total revenue, Underlying (non-GAAP)
|
8.72
|
%
|
5.57
|
%
|
||||
|
Increase in noninterest expense, Underlying (non-GAAP)
|
5.54
|
|
3.43
|
|
||||
|
Operating leverage, Underlying (non-GAAP)
|
3.18
|
%
|
2.14
|
%
|
||||
|
Net income per average common share - basic and diluted and net income per average common share - basic and diluted, Underlying:
|
||||||||
|
Average common shares outstanding - basic (GAAP)
|
K
|
460,713,172
|
|
487,500,618
|
|
|||
|
Average common shares outstanding - diluted (GAAP)
|
L
|
462,520,680
|
|
489,266,826
|
|
|||
|
Net income per average common share - basic (GAAP)
|
D/K
|
|
$0.92
|
|
|
$0.78
|
|
|
|
Net income per average common share - diluted (GAAP)
|
D/L
|
0.92
|
|
0.78
|
|
|||
|
Net income per average common share - basic, Underlying (non-GAAP)
|
X/K
|
0.93
|
|
0.78
|
|
|||
|
Net income per average common share - diluted, Underlying (non-GAAP)
|
X/L
|
0.93
|
|
0.78
|
|
|||
47
CITIZENS FINANCIAL GROUP, INC.
FINANCIAL STATEMENTS
ITEM 1. FINANCIAL STATEMENTS
|
Page
|
||
48
CITIZENS FINANCIAL GROUP, INC.
CONSOLIDATED BALANCE SHEETS (UNAUDITED)
|
(in millions, except share data)
|
March 31, 2019
|
December 31, 2018
|
|||||
|
ASSETS:
|
|||||||
|
Cash and due from banks
|
|
$923
|
|
|
$1,081
|
|
|
|
Interest-bearing cash and due from banks
|
1,513
|
|
2,993
|
|
|||
|
Interest-bearing deposits in banks
|
167
|
|
148
|
|
|||
|
Debt securities available for sale, at fair value (including $423 and $363 pledged to creditors, respectively)
(1)
|
21,504
|
|
19,895
|
|
|||
|
Debt securities held to maturity (fair value of $3,267 and $4,041, respectively)
|
3,345
|
|
4,165
|
|
|||
|
Equity securities, at fair value
|
198
|
|
181
|
|
|||
|
Equity securities, at cost
|
604
|
|
834
|
|
|||
|
Loans held for sale, at fair value
|
1,186
|
|
1,219
|
|
|||
|
Other loans held for sale
|
66
|
|
101
|
|
|||
|
Loans and leases
|
117,615
|
|
116,660
|
|
|||
|
Less: Allowance for loan and lease losses
|
(1,245
|
)
|
(1,242
|
)
|
|||
|
Net loans and leases
|
116,370
|
|
115,418
|
|
|||
|
Derivative assets
|
465
|
|
317
|
|
|||
|
Premises and equipment, net
|
746
|
|
791
|
|
|||
|
Bank-owned life insurance
|
1,705
|
|
1,698
|
|
|||
|
Goodwill
|
7,040
|
|
6,923
|
|
|||
|
Due from broker
|
92
|
|
—
|
|
|||
|
Other assets
|
5,418
|
|
4,754
|
|
|||
|
TOTAL ASSETS
|
|
$161,342
|
|
|
$160,518
|
|
|
|
LIABILITIES AND STOCKHOLDERS’ EQUITY:
|
|||||||
|
LIABILITIES:
|
|||||||
|
Deposits:
|
|||||||
|
Noninterest-bearing
|
|
$28,383
|
|
|
$29,458
|
|
|
|
Interest-bearing
|
95,533
|
|
90,117
|
|
|||
|
Total deposits
|
123,916
|
|
119,575
|
|
|||
|
Federal funds purchased and securities sold under agreements to repurchase
|
668
|
|
1,156
|
|
|||
|
Other short-term borrowed funds
|
11
|
|
161
|
|
|||
|
Derivative liabilities
|
173
|
|
292
|
|
|||
|
Deferred taxes, net
|
676
|
|
573
|
|
|||
|
Long-term borrowed funds
|
11,725
|
|
15,925
|
|
|||
|
Due to broker
|
93
|
|
—
|
|
|||
|
Other liabilities
|
2,549
|
|
2,019
|
|
|||
|
TOTAL LIABILITIES
|
139,811
|
|
139,701
|
|
|||
|
Contingencies (refer to Note 12)
|
|
|
|
|
|||
|
STOCKHOLDERS’ EQUITY:
|
|||||||
|
Preferred stock, $25.00 par value, 100,000,000 shares authorized
|
1,132
|
|
840
|
|
|||
|
Common stock:
|
|||||||
|
$0.01 par value, 1,000,000,000 shares authorized; 567,752,493 shares issued and 461,116,723 shares outstanding at March 31, 2019 and 566,819,863 shares issued and 466,007,984 shares outstanding at December 31, 2018
|
6
|
|
6
|
|
|||
|
Additional paid-in capital
|
18,847
|
|
18,815
|
|
|||
|
Retained earnings
|
5,672
|
|
5,385
|
|
|||
|
Treasury stock, at cost, 106,635,770 and 100,811,879 shares at March 31, 2019 and December 31, 2018, respectively
|
(3,333
|
)
|
(3,133
|
)
|
|||
|
Accumulated other comprehensive loss
|
(793
|
)
|
(1,096
|
)
|
|||
|
TOTAL STOCKHOLDERS’ EQUITY
|
|
$21,531
|
|
|
$20,817
|
|
|
|
TOTAL LIABILITIES AND STOCKHOLDERS’ EQUITY
|
|
$161,342
|
|
|
$160,518
|
|
|
(1)
Includes only collateral pledged by the Company where counterparties have the right to sell or pledge the collateral.
The accompanying Notes to unaudited interim Consolidated Financial Statements are an integral part of these statements.
49
CITIZENS FINANCIAL GROUP, INC.
CONSOLIDATED STATEMENTS OF OPERATIONS (UNAUDITED)
|
Three Months Ended March 31,
|
|||||||
|
(in millions, except share and per share data)
|
2019
|
|
2018
|
|
|||
|
INTEREST INCOME:
|
|||||||
|
Interest and fees on loans and leases
|
|
$1,381
|
|
|
$1,146
|
|
|
|
Interest and fees on loans held for sale, at fair value
|
11
|
|
4
|
|
|||
|
Interest and fees on other loans held for sale
|
4
|
|
4
|
|
|||
|
Investment securities
|
166
|
|
168
|
|
|||
|
Interest-bearing deposits in banks
|
8
|
|
6
|
|
|||
|
Total interest income
|
1,570
|
|
1,328
|
|
|||
|
INTEREST EXPENSE:
|
|||||||
|
Deposits
|
287
|
|
145
|
|
|||
|
Federal funds purchased and securities sold under agreements to repurchase
|
2
|
|
1
|
|
|||
|
Other short-term borrowed funds
|
—
|
|
2
|
|
|||
|
Long-term borrowed funds
|
121
|
|
89
|
|
|||
|
Total interest expense
|
410
|
|
237
|
|
|||
|
Net interest income
|
1,160
|
|
1,091
|
|
|||
|
Provision for credit losses
|
85
|
|
78
|
|
|||
|
Net interest income after provision for credit losses
|
1,075
|
|
1,013
|
|
|||
|
NONINTEREST INCOME:
|
|||||||
|
Service charges and fees
|
123
|
|
124
|
|
|||
|
Card fees
|
59
|
|
61
|
|
|||
|
Capital markets fees
|
54
|
|
39
|
|
|||
|
Trust and investment services fees
|
47
|
|
40
|
|
|||
|
Mortgage banking fees
|
43
|
|
25
|
|
|||
|
Letter of credit and loan fees
|
33
|
|
30
|
|
|||
|
Foreign exchange and interest rate products
|
36
|
|
27
|
|
|||
|
Securities gains, net
|
8
|
|
8
|
|
|||
|
Net impairment losses recognized in earnings on debt securities
|
(1
|
)
|
(1
|
)
|
|||
|
Other income
|
26
|
|
18
|
|
|||
|
Total noninterest income
|
428
|
|
371
|
|
|||
|
NONINTEREST EXPENSE:
|
|||||||
|
Salaries and employee benefits
|
509
|
|
470
|
|
|||
|
Equipment and software expense
|
125
|
|
113
|
|
|||
|
Outside services
|
110
|
|
99
|
|
|||
|
Occupancy
|
83
|
|
81
|
|
|||
|
Other operating expense
|
110
|
|
120
|
|
|||
|
Total noninterest expense
|
937
|
|
883
|
|
|||
|
Income before income tax expense
|
566
|
|
501
|
|
|||
|
Income tax expense
|
127
|
|
113
|
|
|||
|
NET INCOME
|
|
$439
|
|
|
$388
|
|
|
|
Net income available to common stockholders
|
|
$424
|
|
|
$381
|
|
|
|
Weighted-average common shares outstanding:
|
|||||||
|
Basic
|
460,713,172
|
|
487,500,618
|
|
|||
|
Diluted
|
462,520,680
|
|
489,266,826
|
|
|||
|
Per common share information:
|
|||||||
|
Basic earnings
|
|
$0.92
|
|
|
$0.78
|
|
|
|
Diluted earnings
|
0.92
|
|
0.78
|
|
|||
The accompanying Notes to unaudited interim Consolidated Financial Statements are an integral part of these statements.
50
CITIZENS FINANCIAL GROUP, INC.
CONSOLIDATED STATEMENTS OF COMPREHENSIVE INCOME (UNAUDITED)
|
Three Months Ended March 31,
|
|||||||
|
(in millions)
|
2019
|
|
2018
|
|
|||
|
Net income
|
|
$439
|
|
|
$388
|
|
|
|
Other comprehensive income (loss):
|
|||||||
|
Net unrealized derivative instrument gains (losses) arising during the periods, net of income taxes of $13 and ($18), respectively
|
39
|
|
(52
|
)
|
|||
|
Reclassification adjustment for net derivative losses included in net income, net of income taxes of $5 and $0, respectively
|
15
|
|
2
|
|
|||
|
Net unrealized debt securities gains (losses) arising during the periods, net of income taxes of $80 and ($86), respectively
|
246
|
|
(272
|
)
|
|||
|
Other-than-temporary impairment not recognized in earnings on debt securities, net of income taxes of $0 and ($1), respectively
|
—
|
|
(1
|
)
|
|||
|
Reclassification of net debt securities gains to net income, net of income taxes of ($2) and ($2), respectively
|
(5
|
)
|
(5
|
)
|
|||
|
Amortization of actuarial loss, net of income taxes of $2 and $1, respectively
|
3
|
|
3
|
|
|||
|
Total other comprehensive income (loss), net of income taxes
|
298
|
|
(325
|
)
|
|||
|
Total comprehensive income
|
|
$737
|
|
|
$63
|
|
|
The accompanying Notes to unaudited interim Consolidated Financial Statements are an integral part of these statements.
51
CITIZENS FINANCIAL GROUP, INC.
CONSOLIDATED STATEMENTS OF CHANGES IN STOCKHOLDERS’ EQUITY (UNAUDITED)
|
Preferred
Stock
|
Common
Stock
|
Additional Paid-in Capital
|
Retained Earnings
|
Treasury Stock, at Cost
|
Accumulated Other Comprehensive Loss
|
Total
|
|||||||||||||||||||||
|
(in millions)
|
Shares
|
Amount
|
Shares
|
Amount
|
|||||||||||||||||||||||
|
Balance at January 1, 2018
|
—
|
|
|
$247
|
|
491
|
|
|
$6
|
|
|
$18,781
|
|
|
$4,164
|
|
|
($2,108
|
)
|
|
($820
|
)
|
|
$20,270
|
|
||
|
Dividends to common stockholders
|
—
|
|
—
|
|
—
|
|
—
|
|
—
|
|
(108
|
)
|
—
|
|
—
|
|
(108
|
)
|
|||||||||
|
Dividends to preferred stockholders
|
—
|
|
—
|
|
—
|
|
—
|
|
—
|
|
—
|
|
(7
|
)
|
—
|
|
—
|
|
(7
|
)
|
|||||||
|
Treasury stock purchased
|
—
|
|
—
|
|
(4
|
)
|
—
|
|
—
|
|
—
|
|
(175
|
)
|
—
|
|
(175
|
)
|
|||||||||
|
Share-based compensation plans
|
—
|
|
—
|
|
1
|
|
—
|
|
13
|
|
—
|
|
—
|
|
—
|
|
13
|
|
|||||||||
|
Employee stock purchase plan shares purchased
|
—
|
|
—
|
|
—
|
|
—
|
|
3
|
|
—
|
|
—
|
|
—
|
|
3
|
|
|||||||||
|
Total comprehensive income:
|
|||||||||||||||||||||||||||
|
Net income
|
—
|
|
—
|
|
—
|
|
—
|
|
—
|
|
388
|
|
—
|
|
—
|
|
388
|
|
|||||||||
|
Other comprehensive loss
|
—
|
|
—
|
|
—
|
|
—
|
|
—
|
|
—
|
|
—
|
|
(325
|
)
|
(325
|
)
|
|||||||||
|
Total comprehensive income
|
—
|
|
—
|
|
—
|
|
—
|
|
—
|
|
388
|
|
—
|
|
(325
|
)
|
63
|
|
|||||||||
|
Balance at March 31, 2018
|
—
|
|
|
$247
|
|
488
|
|
|
$6
|
|
|
$18,797
|
|
|
$4,437
|
|
|
($2,283
|
)
|
|
($1,145
|
)
|
|
$20,059
|
|
||
|
Balance at January 1, 2019
|
1
|
|
|
$840
|
|
466
|
|
|
$6
|
|
|
$18,815
|
|
|
$5,385
|
|
|
($3,133
|
)
|
|
($1,096
|
)
|
|
$20,817
|
|
||
|
Dividends to common stockholders
|
—
|
|
—
|
|
—
|
|
—
|
|
—
|
|
(149
|
)
|
—
|
|
—
|
|
(149
|
)
|
|||||||||
|
Dividends to preferred stockholders
|
—
|
|
—
|
|
—
|
|
—
|
|
—
|
|
(15
|
)
|
—
|
|
—
|
|
(15
|
)
|
|||||||||
|
Preferred stock issued
|
—
|
|
292
|
|
—
|
|
—
|
|
—
|
|
—
|
|
—
|
|
—
|
|
292
|
|
|||||||||
|
Treasury stock purchased
|
—
|
|
—
|
|
(6
|
)
|
—
|
|
—
|
|
—
|
|
(200
|
)
|
—
|
|
(200
|
)
|
|||||||||
|
Share-based compensation plans
|
—
|
|
—
|
|
1
|
|
—
|
|
28
|
|
—
|
|
|
|
—
|
|
28
|
|
|||||||||
|
Employee stock purchase plan shares purchased
|
—
|
|
—
|
|
—
|
|
—
|
|
4
|
|
—
|
|
—
|
|
—
|
|
4
|
|
|||||||||
|
Cumulative effect of change in accounting standards
|
—
|
|
—
|
|
—
|
|
—
|
|
—
|
|
12
|
|
—
|
|
5
|
|
17
|
|
|||||||||
|
Total comprehensive income:
|
|||||||||||||||||||||||||||
|
Net income
|
—
|
|
—
|
|
—
|
|
—
|
|
—
|
|
439
|
|
—
|
|
—
|
|
439
|
|
|||||||||
|
Other comprehensive income
|
—
|
|
—
|
|
—
|
|
—
|
|
—
|
|
—
|
|
—
|
|
298
|
|
298
|
|
|||||||||
|
Total comprehensive income
|
—
|
|
—
|
|
—
|
|
—
|
|
—
|
|
439
|
|
—
|
|
298
|
|
737
|
|
|||||||||
|
Balance at March 31, 2019
|
1
|
|
|
$1,132
|
|
461
|
|
|
$6
|
|
|
$18,847
|
|
|
$5,672
|
|
|
($3,333
|
)
|
|
($793
|
)
|
|
$21,531
|
|
||
The accompanying Notes to unaudited interim Consolidated Financial Statements are an integral part of these statements.
52
CITIZENS FINANCIAL GROUP, INC.
CONSOLIDATED STATEMENTS OF CASH FLOWS (UNAUDITED)
|
Three Months Ended March 31,
|
|||||||
|
(in millions)
|
2019
|
|
2018
|
|
|||
|
OPERATING ACTIVITIES
|
|||||||
|
Net income
|
|
$439
|
|
|
$388
|
|
|
|
Adjustments to reconcile net income to net cash provided by operating activities:
|
|||||||
|
Provision for credit losses
|
85
|
|
78
|
|
|||
|
Originations of mortgage loans held for sale
|
(2,881
|
)
|
(614
|
)
|
|||
|
Proceeds from sales of mortgage loans held for sale
|
2,918
|
|
655
|
|
|||
|
Purchases of commercial loans held for sale
|
(543
|
)
|
(468
|
)
|
|||
|
Proceeds from sales of commercial loans held for sale
|
622
|
|
451
|
|
|||
|
Depreciation, amortization and accretion
|
134
|
|
122
|
|
|||
|
Mortgage servicing rights valuation recovery
|
—
|
|
(3
|
)
|
|||
|
Debt securities impairment
|
1
|
|
1
|
|
|||
|
Deferred income taxes
|
(1
|
)
|
8
|
|
|||
|
Share-based compensation
|
20
|
|
18
|
|
|||
|
Net gain on sales of:
|
|||||||
|
Debt securities
|
(8
|
)
|
(8
|
)
|
|||
|
Premises and equipment
|
(6
|
)
|
—
|
|
|||
|
(Increase) decrease in other assets
|
(97
|
)
|
331
|
|
|||
|
Decrease in other liabilities
|
(211
|
)
|
(255
|
)
|
|||
|
Net cash provided by operating activities
|
472
|
|
704
|
|
|||
|
INVESTING ACTIVITIES
|
|||||||
|
Investment securities:
|
|||||||
|
Purchases of debt securities available for sale
|
(2,047
|
)
|
(1,099
|
)
|
|||
|
Proceeds from maturities and paydowns of debt securities available for sale
|
695
|
|
806
|
|
|||
|
Proceeds from sales of debt securities available for sale
|
821
|
|
145
|
|
|||
|
Proceeds from maturities and paydowns of debt securities held to maturity
|
80
|
|
131
|
|
|||
|
Purchases of equity securities, at fair value
|
(56
|
)
|
(39
|
)
|
|||
|
Proceeds from sales of equity securities, at fair value
|
39
|
|
36
|
|
|||
|
Purchases of equity securities, at cost
|
(76
|
)
|
(157
|
)
|
|||
|
Proceeds from sales of equity securities, at cost
|
306
|
|
131
|
|
|||
|
Net (increase) decrease in interest-bearing deposits in banks
|
(19
|
)
|
50
|
|
|||
|
Acquisitions, net of cash acquired
|
(129
|
)
|
—
|
|
|||
|
Net increase in loans and leases
|
(1,047
|
)
|
(1,020
|
)
|
|||
|
Net increase in bank-owned life insurance
|
(7
|
)
|
(13
|
)
|
|||
|
Premises and equipment:
|
|||||||
|
Purchases
|
(16
|
)
|
(32
|
)
|
|||
|
Proceeds from sales
|
31
|
|
—
|
|
|||
|
Capitalization of software
|
(46
|
)
|
(57
|
)
|
|||
|
Net cash used in investing activities
|
(1,471
|
)
|
(1,118
|
)
|
|||
|
FINANCING ACTIVITIES
|
|||||||
|
Net increase in deposits
|
4,341
|
|
641
|
|
|||
|
Net decrease in federal funds purchased and securities sold under agreements to repurchase
|
(488
|
)
|
(500
|
)
|
|||
|
Net decrease in other short-term borrowed funds
|
(150
|
)
|
(1,604
|
)
|
|||
|
Proceeds from issuance of long-term borrowed funds
|
2,750
|
|
6,250
|
|
|||
|
Repayments of long-term borrowed funds
|
(7,002
|
)
|
(3,250
|
)
|
|||
|
Treasury stock purchased
|
(200
|
)
|
(175
|
)
|
|||
|
Net proceeds from issuance of preferred stock
|
292
|
|
—
|
|
|||
|
Dividends declared and paid to common stockholders
|
(149
|
)
|
(108
|
)
|
|||
|
Dividends declared and paid to preferred stockholders
|
(15
|
)
|
—
|
|
|||
|
Payments of employee tax withholding for share-based compensation
|
(18
|
)
|
(13
|
)
|
|||
|
Net cash (used in) provided by financing activities
|
(639
|
)
|
1,241
|
|
|||
|
(Decrease) increase in cash and cash equivalents
(1)
|
(1,638
|
)
|
827
|
|
|||
|
Cash and cash equivalents at beginning of period
(1)
|
4,074
|
|
3,032
|
|
|||
|
Cash and cash equivalents at end of period
(1)
|
|
$2,436
|
|
|
$3,859
|
|
|
(1)
Cash and cash equivalents includes cash and due from banks and interest-bearing cash and due from banks as reflected on the Consolidated Balance Sheets.
The accompanying Notes to unaudited interim Consolidated Financial Statements are an integral part of these statements.
53
CITIZENS FINANCIAL GROUP, INC.
NOTES TO CONSOLIDATED FINANCIAL STATEMENTS (UNAUDITED)
NOTE 1 - BASIS OF PRESENTATION
Basis of Presentation
The unaudited interim Consolidated Financial Statements, including the Notes thereto of Citizens Financial Group, Inc., have been prepared in accordance with GAAP interim reporting requirements, and therefore do not include all information and Notes included in the audited Consolidated Financial Statements in conformity with GAAP. These unaudited interim Consolidated Financial Statements and Notes thereto should be read in conjunction with the Company’s audited Consolidated Financial Statements and accompanying Notes included in the Company’s Annual Report on Form 10-K for the year ended December 31, 2018. The Company’s principal business activity is banking, conducted through its sole banking subsidiary, Citizens Bank, National Association.
The unaudited interim Consolidated Financial Statements include the accounts of the Company and subsidiaries in which the Company has a controlling financial interest. All intercompany transactions and balances have been eliminated. The Company has evaluated its unconsolidated entities and does not believe that any entity in which it has an interest, but does not currently consolidate, meets the requirements to be consolidated as a variable interest entity. The unaudited interim Consolidated Financial Statements include all adjustments, consisting of normal recurring adjustments, necessary for a fair presentation of the results for the interim periods. The results for interim periods are not necessarily indicative of results for a full year.
The preparation of financial statements in conformity with GAAP requires management to make estimates and assumptions that affect the reported amounts of assets and liabilities at the date of the financial statements and the reported amounts of revenues and expenses during the reporting period. Actual results could differ from those estimates. Material estimates that are particularly susceptible to significant change in the near-term relate to the determination of the ACL and the fair value of MSRs.
Certain prior period noninterest expense amounts reported in the Consolidated Statements of Operations have been reclassified to conform to the current period presentation. Beginning in the first quarter of 2019, borrowed funds balances and the associated interest expense are classified based on original maturity. Prior periods have been adjusted to conform with the current period presentation. These changes had no effect on total interest expense, total noninterest expense, income before income tax expense, net income, total comprehensive income, total assets, total borrowed funds, total liabilities or total stockholders’ equity as previously reported.
Significant Accounting Policies
For further information regarding the Company’s significant accounting policies, see Note 1 “Basis of Presentation” to the Company’s audited Consolidated Financial Statements in the Annual Report on Form 10-K for the year ended December 31, 2018.
Acquisitions
On March 1, 2019, the Company expanded its mergers and acquisition advisory capabilities through the acquisition of Bowstring Advisors, LLC (“Bowstring”), an Atlanta, Georgia-based mergers and acquisition advisory and capital raising firm.
On January 1, 2019, the Company expanded its wealth management position through the acquisition of Clarfeld Financial Advisors, LLC (“Clarfeld”), a Tarrytown, New York-based boutique wealth management and financial advisory firm.
These acquisitions resulted in an estimated aggregate increase to goodwill of
$118 million
as of March 31, 2019. The Company expects that some adjustments of the fair values assigned to the assets acquired and liabilities assumed may subsequently be recorded, although any adjustments are not expected to be material.
54
CITIZENS FINANCIAL GROUP, INC.
NOTES TO CONSOLIDATED FINANCIAL STATEMENTS (UNAUDITED)
Accounting Pronouncements Adopted in 2019
|
Pronouncement
|
Summary of Guidance
|
Effects on Financial Statements
|
|
Derivatives and Hedging
Issued August 2017
|
•
Reduces the complexity and operational burdens of the current hedge accounting model and portrays more clearly the effects of hedge accounting in the financial statements.
•
Modifies current requirements to facilitate the application of hedge accounting to partial-term hedges, hedges of prepayable financial instruments, and other strategies. Adoption of these optional changes would occur on a prospective basis.
•
Requires the effects of fair value hedges to be classified in the same income statement line as the earnings effect of the hedged item. Adoption of this change will occur on a prospective basis.
•
Requires all effects of cash flow hedges to be deferred in other comprehensive income until the hedged cash flows affect earnings. Periodic hedge ineffectiveness will no longer be recognized in earnings. Adoption of this change will occur on a modified retrospective basis through a cumulative-effect adjustment directly to retained earnings as of the beginning of the period of adoption.
|
•
The Company adopted the new standard on January 1, 2019 under the modified retrospective method.
•
Adoption did not have a material impact on the Company’s Consolidated Financial Statements.
•
Required disclosures are included in Note 9 “Derivatives”.
|
|
Leases
Issued February 2016
|
•
Requires lessees to recognize a right-of-use asset and corresponding lease liability for all leases with a lease term of greater than one year.
•
Requires lessees and lessors to classify most leases using principles similar to existing lease accounting, but eliminates the “bright line” classification tests.
•
Requires that for finance leases, a lessee recognize interest expense on the lease liability separately from the amortization of the right-of-use asset in the Consolidated Statements of Operations, while for operating leases, such amounts should be recognized as a combined expense.
•
Requires expanded disclosures about the nature and terms of lease agreements.
•
Provides the option to adopt using either a modified cumulative-effect approach wherein the guidance is applied to all periods presented, or through a cumulative-effect adjustment beginning in the period of adoption.
•
Requires companies with land easements to assess whether the easement meets the definition of a lease before applying other accounting guidance.
|
•
The Company adopted the new standard under the modified retrospective approach on January 1, 2019, which is applicable to both its leasing finance business as well as property and equipment leases in which Citizens is lessee.
•
Adoption resulted in a cumulative-effect adjustment of $12 million, net of taxes, to retained earnings related to leases in which Citizens is lessee.
•
Adoption resulted in the recognition of a right-of-use asset and corresponding lease liability of $734 million and $749 million, respectively in its Consolidated Balance Sheet as of March 31, 2019 for non-cancelable operating lease agreements.
•
Required lessor disclosures are included in Note 3 “Loans and Leases” and required lessee disclosures are included in Note 6 “Leases”.
|
|
Implementation Costs Incurred in a Cloud Computing Arrangement
Issued August 2018
|
•
Requires implementation costs incurred in a cloud computing arrangement that is a service contract be deferred and recognized over the term of the arrangement if those costs would be capitalized in a software licensing arrangement.
•
Requires amortization expense be presented in the same income statement line item as the related hosting service arrangement expense.
•
Permits adoption prospectively for all implementation costs incurred after adoption or retrospectively through a cumulative-effect adjustment as of the beginning of the first period presented.
|
•
The Company prospectively adopted the new standard on January 1, 2019.
•
Adoption did not have a material impact on the Company’s Consolidated Financial Statements.
|
55
CITIZENS FINANCIAL GROUP, INC.
NOTES TO CONSOLIDATED FINANCIAL STATEMENTS (UNAUDITED)
Accounting Pronouncements Pending Adoption
|
Pronouncement
|
Summary of Guidance
|
Effects on Financial Statements
|
|
Financial Instruments - Credit Losses
Issued June 2016
|
•
Replaces existing incurred loss impairment guidance and establishes a single allowance framework for financial assets carried at amortized cost (including securities HTM), which will reflect management’s estimate of credit losses over the full remaining expected life of the financial assets.
•
Amends existing impairment guidance for securities AFS to incorporate an allowance, which will allow for reversals of impairment losses in the event that the credit of an issuer improves.
•
Requires a cumulative-effect adjustment to retained earnings as of the beginning of the reporting period of adoption.
|
•
Required effective date: January 1, 2020.
•
A company-wide, cross-discipline governance structure is in place to implement the new standard. The Company is currently identifying and researching key interpretive issues, revising policies and procedures, and completing the development, configuration and validation of loss forecasting models to meet the requirements of the new guidance. The implementation team is also in the process of assessing forecast accuracy, qualitative factors, how the reasonable and supportable forecast period will be determined and documented, as well as the impacts of that decision in different parts of the credit cycle.
•
Analytical testing of the models started in the first quarter of 2019, and parallel testing is expected to begin early in the second half of 2019.
•
The Company expects the standard will result in earlier recognition of credit losses and an overall increase in the ACL, as it will cover estimated credit losses over the full remaining expected life of loans and commitments and will consider future reasonable and supportable changes in macroeconomic conditions. Since the magnitude of the increase in the Company’s ACL will be impacted by economic conditions, forecasted economic conditions, credit quality and trends in the Company’s portfolio at the time of adoption, the quantitative impact cannot yet be reasonably estimated.
|
|
Disclosure Requirements - Fair Value Measurements
Issued August 2018
|
•
Amends disclosure requirements on fair value measurements.
•
The guidance eliminates requirements for certain disclosures that are no longer considered relevant or cost beneficial, requires new disclosures and modifies existing disclosures that are expected to enhance the usefulness of the financial statements.
•
Prospective application is required for new disclosure requirements.
•
Retrospective application is required for all other amendments for all periods presented.
|
•
Required effective date: January 1, 2020. Early adoption is permitted. The Company does not intend to adopt this guidance prior to the required effective date.
•
Adoption is not expected to have a material impact on the Company’s Consolidated Financial Statements.
|
56
CITIZENS FINANCIAL GROUP, INC.
NOTES TO CONSOLIDATED FINANCIAL STATEMENTS (UNAUDITED)
NOTE 2 - SECURITIES
The following table presents the major components of securities at amortized cost and fair value:
|
March 31, 2019
|
December 31, 2018
|
||||||||||||||||||||||||
|
(in millions)
|
Amortized Cost
|
Gross Unrealized Gains
|
Gross Unrealized Losses
|
Fair Value
|
Amortized Cost
|
Gross Unrealized Gains
|
Gross Unrealized Losses
|
Fair Value
|
|||||||||||||||||
|
U.S. Treasury and other
|
|
$72
|
|
|
$—
|
|
|
$—
|
|
|
$72
|
|
|
$24
|
|
|
$—
|
|
|
$—
|
|
|
$24
|
|
|
|
State and political subdivisions
|
5
|
|
—
|
|
—
|
|
5
|
|
5
|
|
—
|
|
—
|
|
5
|
|
|||||||||
|
Mortgage-backed securities:
|
|||||||||||||||||||||||||
|
Federal agencies and U.S. government sponsored entities
|
20,768
|
|
66
|
|
(337
|
)
|
20,497
|
|
20,211
|
|
28
|
|
(605
|
)
|
19,634
|
|
|||||||||
|
Other/non-agency
|
916
|
|
18
|
|
(4
|
)
|
930
|
|
236
|
|
3
|
|
(7
|
)
|
232
|
|
|||||||||
|
Total mortgage-backed securities, at fair value
|
21,684
|
|
84
|
|
(341
|
)
|
21,427
|
|
20,447
|
|
31
|
|
(612
|
)
|
19,866
|
|
|||||||||
|
Total debt securities available for sale, at fair value
|
|
$21,761
|
|
|
$84
|
|
|
($341
|
)
|
|
$21,504
|
|
|
$20,476
|
|
|
$31
|
|
|
($612
|
)
|
|
$19,895
|
|
|
|
Federal agencies and U.S. government sponsored entities
|
|
$3,345
|
|
|
$1
|
|
|
($79
|
)
|
|
$3,267
|
|
|
$3,425
|
|
|
$—
|
|
|
($132
|
)
|
|
$3,293
|
|
|
|
Other/non-agency
|
—
|
|
—
|
|
—
|
|
—
|
|
740
|
|
8
|
|
—
|
|
748
|
|
|||||||||
|
Total mortgage-backed securities, at cost
|
3,345
|
|
1
|
|
(79
|
)
|
3,267
|
|
4,165
|
|
8
|
|
(132
|
)
|
4,041
|
|
|||||||||
|
Total debt securities held to maturity
|
|
$3,345
|
|
|
$1
|
|
|
($79
|
)
|
|
$3,267
|
|
|
$4,165
|
|
|
$8
|
|
|
($132
|
)
|
|
$4,041
|
|
|
|
Money market mutual fund investments
|
|
$198
|
|
|
$—
|
|
|
$—
|
|
|
$198
|
|
|
$181
|
|
|
$—
|
|
|
$—
|
|
|
$181
|
|
|
|
Total equity securities, at fair value
|
|
$198
|
|
|
$—
|
|
|
$—
|
|
|
$198
|
|
|
$181
|
|
|
$—
|
|
|
$—
|
|
|
$181
|
|
|
|
Federal Reserve Bank stock
|
|
$463
|
|
|
$—
|
|
|
$—
|
|
|
$463
|
|
|
$463
|
|
|
$—
|
|
|
$—
|
|
|
$463
|
|
|
|
Federal Home Loan Bank stock
|
133
|
|
—
|
|
—
|
|
133
|
|
364
|
|
—
|
|
—
|
|
364
|
|
|||||||||
|
Other equity securities
|
8
|
|
—
|
|
—
|
|
8
|
|
7
|
|
—
|
|
—
|
|
7
|
|
|||||||||
|
Total equity securities, at cost
|
|
$604
|
|
|
$—
|
|
|
$—
|
|
|
$604
|
|
|
$834
|
|
|
$—
|
|
|
$—
|
|
|
$834
|
|
|
57
CITIZENS FINANCIAL GROUP, INC.
NOTES TO CONSOLIDATED FINANCIAL STATEMENTS (UNAUDITED)
The amortized cost and fair value of debt securities by contractual maturity as of
March 31, 2019
are presented below. Expected maturities may differ from contractual maturities because issuers may have the right to call or prepay obligations with or without incurring penalties.
|
March 31, 2019
|
|||||||||||||||
|
Distribution of Maturities
|
|||||||||||||||
|
(in millions)
|
1 Year or Less
|
1-5 Years
|
5-10 Years
|
After 10 Years
|
Total
|
|
|||||||||
|
Amortized cost:
|
|||||||||||||||
|
U.S. Treasury and other
|
|
$72
|
|
|
$—
|
|
|
$—
|
|
|
$—
|
|
|
$72
|
|
|
State and political subdivisions
|
—
|
|
—
|
|
—
|
|
5
|
|
5
|
|
|||||
|
Mortgage-backed securities:
|
|||||||||||||||
|
Federal agencies and U.S. government sponsored entities
|
—
|
|
251
|
|
1,641
|
|
18,876
|
|
20,768
|
|
|||||
|
Other/non-agency
|
2
|
|
8
|
|
—
|
|
906
|
|
916
|
|
|||||
|
Total debt securities available for sale
|
74
|
|
259
|
|
1,641
|
|
19,787
|
|
21,761
|
|
|||||
|
Mortgage-backed securities:
|
|||||||||||||||
|
Federal agencies and U.S. government sponsored entities
|
—
|
|
—
|
|
—
|
|
3,345
|
|
3,345
|
|
|||||
|
Total debt securities held to maturity
|
—
|
|
—
|
|
—
|
|
3,345
|
|
3,345
|
|
|||||
|
Total amortized cost of debt securities
|
|
$74
|
|
|
$259
|
|
|
$1,641
|
|
|
$23,132
|
|
|
$25,106
|
|
|
Fair value:
|
|||||||||||||||
|
U.S. Treasury and other
|
|
$72
|
|
|
$—
|
|
|
$—
|
|
|
$—
|
|
|
$72
|
|
|
State and political subdivisions
|
—
|
|
—
|
|
—
|
|
5
|
|
5
|
|
|||||
|
Mortgage-backed securities:
|
|||||||||||||||
|
Federal agencies and U.S. government sponsored entities
|
—
|
|
247
|
|
1,634
|
|
18,616
|
|
20,497
|
|
|||||
|
Other/non-agency
|
2
|
|
8
|
|
—
|
|
920
|
|
930
|
|
|||||
|
Total debt securities available for sale
|
74
|
|
255
|
|
1,634
|
|
19,541
|
|
21,504
|
|
|||||
|
Mortgage-backed securities:
|
|||||||||||||||
|
Federal agencies and U.S. government sponsored entities
|
—
|
|
—
|
|
—
|
|
3,267
|
|
3,267
|
|
|||||
|
Total debt securities held to maturity
|
—
|
|
—
|
|
—
|
|
3,267
|
|
3,267
|
|
|||||
|
Total fair value of debt securities
|
|
$74
|
|
|
$255
|
|
|
$1,634
|
|
|
$22,808
|
|
|
$24,771
|
|
Taxable interest income from investment securities as presented on the Consolidated Statements of Operations was
$166 million
and
$168 million
for the
three months ended
March 31, 2019
and
2018
, respectively.
Realized gains and losses on securities are presented below:
|
Three Months Ended March 31,
|
|||||||
|
(in millions)
|
2019
|
|
2018
|
|
|||
|
Gains on sale of debt securities
|
|
$8
|
|
|
$8
|
|
|
|
Losses on sale of debt securities
|
—
|
|
—
|
|
|||
|
Debt securities gains, net
|
|
$8
|
|
|
$8
|
|
|
The amortized cost and fair value of debt securities pledged are presented below:
|
March 31, 2019
|
December 31, 2018
|
||||||||||||
|
(in millions)
|
Amortized Cost
|
Fair Value
|
|
Amortized Cost
|
Fair Value
|
|
|||||||
|
Pledged against repurchase agreements
|
|
$294
|
|
|
$294
|
|
|
$344
|
|
|
$338
|
|
|
|
Pledged against FHLB borrowed funds
|
—
|
|
—
|
|
745
|
|
752
|
|
|||||
|
Pledged against derivatives, to qualify for fiduciary powers, and to secure public and other deposits as required by law
|
3,306
|
|
3,248
|
|
3,592
|
|
3,460
|
|
|||||
58
CITIZENS FINANCIAL GROUP, INC.
NOTES TO CONSOLIDATED FINANCIAL STATEMENTS (UNAUDITED)
Citizens regularly enters into security repurchase agreements with unrelated counterparties. Repurchase agreements are financial transactions that involve the transfer of a security from one party to another and a subsequent transfer of substantially the same security back to the original party. The Company’s repurchase agreements are typically short-term transactions and accounted for as secured borrowed funds on the Company’s Consolidated Balance Sheets. When permitted by GAAP, the Company offsets short-term receivables associated with its reverse repurchase agreements against short-term payables associated with its repurchase agreements. Citizens recognized
no
offsetting of short-term receivables or payables as of
March 31, 2019
or
December 31, 2018
. Citizens offsets certain derivative assets and derivative liabilities on the Consolidated Balance Sheets. For further information see
Note 9 "Derivatives."
Securitizations of mortgage loans retained in the investment portfolio was
$31 million
and
$26 million
for the
three months ended March 31, 2019
and
2018
, respectively. These securitizations include a substantive guarantee by a third party. In 2019 the guarantors were FNMA and GNMA and in 2018 the guarantors were FNMA, FHLMC, and GNMA. The debt securities received from the guarantors are classified as AFS.
The following tables present mortgage-backed debt securities whose fair values are below carrying values, segregated by those that have been in a continuous unrealized loss position for less than twelve months and those that have been in a continuous unrealized loss position for twelve months or longer:
|
March 31, 2019
|
||||||||||||||||||||||||||
|
Less than 12 Months
|
12 Months or Longer
|
Total
|
||||||||||||||||||||||||
|
(dollars in millions)
|
Number of Issues
|
Fair Value
|
Gross Unrealized Losses
|
Number of Issues
|
Fair Value
|
Gross Unrealized Losses
|
Number of Issues
|
Fair Value
|
Gross Unrealized Losses
|
|||||||||||||||||
|
Federal agencies and U.S. government sponsored entities
|
13
|
|
|
$569
|
|
|
($1
|
)
|
519
|
|
|
$17,548
|
|
|
($415
|
)
|
532
|
|
|
$18,117
|
|
|
($416
|
)
|
||
|
Other/non-agency
|
—
|
|
—
|
|
—
|
|
7
|
|
48
|
|
(4
|
)
|
7
|
|
48
|
|
(4
|
)
|
||||||||
|
Total
|
13
|
|
|
$569
|
|
|
($1
|
)
|
526
|
|
|
$17,596
|
|
|
($419
|
)
|
539
|
|
|
$18,165
|
|
|
($420
|
)
|
||
|
December 31, 2018
|
||||||||||||||||||||||||||
|
Less than 12 Months
|
12 Months or Longer
|
Total
|
||||||||||||||||||||||||
|
(dollars in millions)
|
Number of Issues
|
Fair Value
|
Gross Unrealized Losses
|
Number of Issues
|
Fair Value
|
Gross Unrealized Losses
|
Number of Issues
|
Fair Value
|
Gross Unrealized Losses
|
|||||||||||||||||
|
Federal agencies and U.S. government sponsored entities
|
166
|
|
|
$4,881
|
|
|
($89
|
)
|
429
|
|
|
$15,124
|
|
|
($648
|
)
|
595
|
|
|
$20,005
|
|
|
($737
|
)
|
||
|
Other/non-agency
|
10
|
|
139
|
|
(1
|
)
|
11
|
|
72
|
|
(6
|
)
|
21
|
|
211
|
|
(7
|
)
|
||||||||
|
Total
|
176
|
|
|
$5,020
|
|
|
($90
|
)
|
440
|
|
|
$15,196
|
|
|
($654
|
)
|
616
|
|
|
$20,216
|
|
|
($744
|
)
|
||
Citizens does not currently have the intent to sell these impaired debt securities, and it is not more likely than not that the Company will be required to sell these debt securities prior to the recovery of their amortized cost bases. Citizens has determined that credit losses are not expected to be incurred on the remaining agency and non-agency MBS identified with unrealized losses as of
March 31, 2019
. The unrealized losses on these debt securities reflect non-credit-related factors such as changing interest rates and market liquidity. Therefore, Citizens has determined that these debt securities are not other-than-temporarily impaired. Any subsequent increases in the valuation of impaired debt securities do not impact their recorded cost bases.
59
CITIZENS FINANCIAL GROUP, INC.
NOTES TO CONSOLIDATED FINANCIAL STATEMENTS (UNAUDITED)
The following table presents the cumulative credit-related losses recognized in earnings on debt securities held by the Company:
|
Three Months Ended March 31,
|
|||||||
|
(in millions)
|
2019
|
|
2018
|
|
|||
|
Cumulative balance at beginning of period
|
|
$81
|
|
|
$80
|
|
|
|
Credit impairments recognized in earnings on debt securities that have been previously impaired
|
1
|
|
1
|
|
|||
|
Reductions due to increases in cash flow expectations on impaired debt securities
(1)
|
—
|
|
(1
|
)
|
|||
|
Reductions for securities sold during the period
(2)
|
(4
|
)
|
—
|
|
|||
|
Cumulative balance at end of period
|
|
$78
|
|
|
$80
|
|
|
(1)
Reported in interest income from investment securities on the Consolidated Statements of Operations.
(2)
Reported in securities gains, net on the Consolidated Statements of Operations.
Cumulative credit losses recognized in earnings for impaired AFS debt securities held as of
March 31, 2019
and March 31,
2018
were
$78 million
and
$80 million
respectively. There were
no
credit losses recognized in earnings for the Company’s HTM portfolio for the
three months ended
March 31, 2019
and
2018
. For the
three months ended March 31, 2019
and
2018
, the Company incurred non-agency MBS credit-related other-than-temporary impairment losses in earnings of
$1 million
.
NOTE 3 - LOANS AND LEASES
The Company’s loans and leases are disclosed in portfolio segments and classes. The Company’s loan and lease portfolio segments are commercial and retail. The classes of loans and leases are: commercial, commercial real estate, leases, residential mortgages, home equity loans, home equity lines of credit, home equity loans serviced by others, home equity lines of credit serviced by others, automobile, education, credit cards and other retail. The Company’s SBO portfolio consists of purchased home equity loans and lines that were originally serviced by others, which the Company services a portion of internally. A summary of the loans and leases portfolio is presented below:
|
(in millions)
|
March 31, 2019
|
December 31, 2018
|
|||||
|
Commercial
(1)
|
|
$41,497
|
|
|
$40,857
|
|
|
|
Commercial real estate
|
13,372
|
|
13,023
|
|
|||
|
Leases
|
2,820
|
|
2,903
|
|
|||
|
Total commercial loans and leases
|
57,689
|
|
56,783
|
|
|||
|
Residential mortgages
|
19,174
|
|
18,978
|
|
|||
|
Home equity loans
|
1,006
|
|
1,073
|
|
|||
|
Home equity lines of credit
|
12,394
|
|
12,710
|
|
|||
|
Home equity loans serviced by others
|
375
|
|
399
|
|
|||
|
Home equity lines of credit serviced by others
|
95
|
|
104
|
|
|||
|
Automobile
|
11,992
|
|
12,106
|
|
|||
|
Education
|
9,274
|
|
8,900
|
|
|||
|
Credit cards
|
1,982
|
|
1,991
|
|
|||
|
Other retail
|
3,634
|
|
3,616
|
|
|||
|
Total retail loans
(2)
|
59,926
|
|
59,877
|
|
|||
|
Total loans and leases
(3)
|
|
$117,615
|
|
|
$116,660
|
|
|
(1)
SBA loans serviced for others by our subsidiaries are not included above and amounted to
$17 million
representing the government guaranteed portion of SBA loans sold to outside investors as of
March 31, 2019
. There were
no
SBA loans serviced for others as of
December 31, 2018
.
(2)
Mortgage loans serviced for others by the Company’s subsidiaries are not included above and amounted to
$70.8 billion
and
$69.6 billion
at
March 31, 2019
and
December 31, 2018
, respectively.
(3)
Excluded from the table above are LHFS totaling
$1.3 billion
as of
March 31, 2019
and
December 31, 2018
.
LHFS at fair value as of
March 31, 2019
totaled
$1.2 billion
and consisted of residential mortgages originated for sale of
$1.0 billion
and loans in the commercial trading portfolio of
$177 million
. LHFS at fair value as of
December 31, 2018
totaled
$1.2 billion
and consisted of residential mortgages originated for sale of
$967 million
and loans in the commercial trading portfolio of
$252 million
. Other LHFS totaled
$66 million
and
$101 million
as of
March 31, 2019
and
December 31, 2018
, respectively, and consisted of commercial loans associated with the Company’s syndication business.
60
CITIZENS FINANCIAL GROUP, INC.
NOTES TO CONSOLIDATED FINANCIAL STATEMENTS (UNAUDITED)
Loans pledged as collateral for FHLB borrowed funds, primarily residential mortgages and home equity loans, totaled
$23.7 billion
and
$25.6 billion
at
March 31, 2019
and
December 31, 2018
, respectively. Loans pledged as collateral to support the contingent ability to borrow at the FRB discount window, if necessary, was primarily comprised of auto, commercial and commercial real estate loans, and totaled
$18.7 billion
and
$16.8 billion
at
March 31, 2019
and
December 31, 2018
, respectively.
During the three months ended
March 31, 2019
, the Company purchased
$201 million
of education loans. During the three months ended
March 31, 2018
, the Company purchased
$200 million
of commercial loans.
During the three months ended
March 31, 2019
, the Company sold
$182 million
of commercial loans and
$22 million
of retail TDRs, including
$12 million
of home equity loans and
$10 million
of residential mortgages. During the three months ended
March 31, 2018
the company had
no
loan sales.
Citizens is engaged in the leasing of equipment for commercial use, primarily focused on Fortune 1000 companies for large capital equipment acquisitions including aircraft and railcars, among other equipment. The Company determines if an arrangement is a lease and the related lease classification at inception. Lease terms predominantly range from
three
to
seven
years and may include options to terminate the lease early or purchase the leased property prior to the end of the lease term. Certain lease agreements include rental payments based on an index or are adjusted periodically for inflation. The Company does not have lease agreements which contain lease and nonlease components.
A lessee is evaluated from a credit perspective using the same underwriting standards and procedures as for a loan borrower. A lessee is expected to make rental payments based on its cash flows and the viability of its operations. Leases are usually not evaluated as collateral-based transactions, and therefore the lessee’s overall financial strength is the most important credit evaluation factor.
The components of the net investment in direct finance leases, before ALLL, are presented below:
|
(in millions)
|
March 31, 2019
|
||
|
Total future minimum lease rentals
|
|
$1,955
|
|
|
Estimated residual value of leased equipment (non-guaranteed)
|
1,082
|
|
|
|
Initial direct costs
|
13
|
|
|
|
Unearned income
|
(259
|
)
|
|
|
Total leases
|
|
$2,791
|
|
Interest income on direct financing leases was
$20 million
for the
three months ended March 31, 2019
and is reported within interest and fees on loans and leases in the Consolidated Statement of Operations.
A maturity analysis of direct financing lease receivables at
March 31, 2019
is presented below:
|
(in millions)
|
|||
|
2019
|
|
$439
|
|
|
2020
|
463
|
|
|
|
2021
|
344
|
|
|
|
2022
|
263
|
|
|
|
2023
|
188
|
|
|
|
Thereafter
|
258
|
|
|
|
Total undiscounted future minimum lease rentals
|
|
$1,955
|
|
61
CITIZENS FINANCIAL GROUP, INC.
NOTES TO CONSOLIDATED FINANCIAL STATEMENTS (UNAUDITED)
NOTE 4 - ALLOWANCE FOR CREDIT LOSSES, NONPERFORMING ASSETS, AND CONCENTRATIONS OF CREDIT RISK
The ACL consists of the ALLL and the reserve for unfunded commitments. It is increased through a provision for credit losses that is charged to earnings, based on the Company’s quarterly evaluation of the loan and lease portfolio and related commitments, and is reduced by net charge-offs and the ALLL associated with sold loans. See Note 5 “Allowance for Credit Losses, Nonperforming Assets, and Concentrations of Credit Risk” to the Company’s audited Consolidated Financial Statements in the Annual Report on Form 10-K for the year ended
December 31, 2018
, for a detailed discussion of the ALLL reserve methodology and estimation techniques.
On a quarterly basis, the Company reviews and refines its estimate of the ACL, taking into consideration changes in portfolio size and composition, historical loss experience, internal risk ratings, current economic conditions, industry performance trends and other pertinent information. As of
March 31, 2019
, there were no material changes in assumptions or estimation techniques compared with prior periods that impacted the determination of the current period’s ALLL and the reserve for unfunded lending commitments.
A summary of changes in the ACL is presented below:
|
Three Months Ended March 31, 2019
|
|||||||||
|
(in millions)
|
Commercial
|
|
Retail
|
|
Total
|
|
|||
|
Allowance for loan and lease losses, beginning of period
|
|
$690
|
|
|
$552
|
|
|
$1,242
|
|
|
Charge-offs
|
(26
|
)
|
(112
|
)
|
(138
|
)
|
|||
|
Recoveries
|
2
|
|
47
|
|
49
|
|
|||
|
Net charge-offs
|
(24
|
)
|
(65
|
)
|
(89
|
)
|
|||
|
Provision charged to income
|
25
|
|
67
|
|
92
|
|
|||
|
Allowance for loan and lease losses, end of period
|
691
|
|
554
|
|
1,245
|
|
|||
|
Reserve for unfunded lending commitments, beginning of period
|
91
|
|
—
|
|
91
|
|
|||
|
Provision for unfunded lending commitments
|
(7
|
)
|
—
|
|
(7
|
)
|
|||
|
Reserve for unfunded lending commitments, end of period
|
84
|
|
—
|
|
84
|
|
|||
|
Total allowance for credit losses, end of period
|
|
$775
|
|
|
$554
|
|
|
$1,329
|
|
|
Three Months Ended March 31, 2018
|
|||||||||
|
(in millions)
|
Commercial
|
|
Retail
|
|
Total
|
|
|||
|
Allowance for loan and lease losses, beginning of period
|
|
$685
|
|
|
$551
|
|
|
$1,236
|
|
|
Charge-offs
|
(3
|
)
|
(113
|
)
|
(116
|
)
|
|||
|
Recoveries
|
6
|
|
40
|
|
46
|
|
|||
|
Net charge-offs
|
3
|
|
(73
|
)
|
(70
|
)
|
|||
|
Provision charged to income
|
23
|
|
57
|
|
80
|
|
|||
|
Allowance for loan and lease losses, end of period
|
711
|
|
535
|
|
1,246
|
|
|||
|
Reserve for unfunded lending commitments, beginning of period
|
88
|
|
—
|
|
88
|
|
|||
|
Provision for unfunded lending commitments
|
(2
|
)
|
—
|
|
(2
|
)
|
|||
|
Reserve for unfunded lending commitments, end of period
|
86
|
|
—
|
|
86
|
|
|||
|
Total allowance for credit losses, end of period
|
|
$797
|
|
|
$535
|
|
|
$1,332
|
|
The recorded investment in loans and leases based on the Company’s evaluation methodology is presented below:
|
March 31, 2019
|
December 31, 2018
|
||||||||||||||||||
|
(in millions)
|
Commercial
|
|
Retail
|
|
Total
|
|
Commercial
|
|
Retail
|
|
Total
|
|
|||||||
|
Individually evaluated
|
|
$386
|
|
|
$696
|
|
|
$1,082
|
|
|
$391
|
|
|
$723
|
|
|
$1,114
|
|
|
|
Formula-based evaluation
|
57,303
|
|
59,230
|
|
116,533
|
|
56,392
|
|
59,154
|
|
115,546
|
|
|||||||
|
Total loans and leases
|
|
$57,689
|
|
|
$59,926
|
|
|
$117,615
|
|
|
$56,783
|
|
|
$59,877
|
|
|
$116,660
|
|
|
62
CITIZENS FINANCIAL GROUP, INC.
NOTES TO CONSOLIDATED FINANCIAL STATEMENTS (UNAUDITED)
A summary of the ACL by evaluation method is presented below:
|
March 31, 2019
|
December 31, 2018
|
||||||||||||||||||
|
(in millions)
|
Commercial
|
|
Retail
|
|
Total
|
|
Commercial
|
|
Retail
|
|
Total
|
|
|||||||
|
Individually evaluated
|
|
$42
|
|
|
$25
|
|
|
$67
|
|
|
$38
|
|
|
$26
|
|
|
$64
|
|
|
|
Formula-based evaluation
|
733
|
|
529
|
|
1,262
|
|
743
|
|
526
|
|
1,269
|
|
|||||||
|
Allowance for credit losses
|
|
$775
|
|
|
$554
|
|
|
$1,329
|
|
|
$781
|
|
|
$552
|
|
|
$1,333
|
|
|
For commercial loans and leases, Citizens utilizes regulatory classification ratings to monitor credit quality. Loans with a “pass” rating are those that the Company believes will be fully repaid in accordance with the contractual loan terms. Commercial loans and leases that are “criticized” are those that have some weakness or potential weakness that indicate an increased probability of future loss. “Criticized” loans are grouped into three categories, “special mention,” “substandard” and “doubtful.” Special mention loans have potential weaknesses that, if left uncorrected, may result in deterioration of the Company’s credit position at some future date. Substandard loans are inadequately protected loans; these loans have well-defined weaknesses that could hinder normal repayment or collection of the debt. Doubtful loans have the same weaknesses as substandard, with the added characteristics that the possibility of loss is high and collection of the full amount of the loan is improbable. For retail loans, the Company primarily uses the loan’s payment and delinquency status to monitor credit quality. The further a loan is past due, the greater the likelihood of future credit loss. These credit quality indicators for both commercial and retail loans are continually updated and monitored.
The recorded investment in commercial loans and leases based on regulatory classification ratings is presented below:
|
March 31, 2019
|
|||||||||||||||
|
Criticized
|
|||||||||||||||
|
(in millions)
|
Pass
|
|
Special Mention
|
Substandard
|
|
Doubtful
|
|
Total
|
|
||||||
|
Commercial
|
|
$39,296
|
|
|
$1,096
|
|
|
$892
|
|
|
$213
|
|
|
$41,497
|
|
|
Commercial real estate
|
12,953
|
|
381
|
|
36
|
|
2
|
|
13,372
|
|
|||||
|
Leases
|
2,670
|
|
111
|
|
39
|
|
—
|
|
2,820
|
|
|||||
|
Total commercial loans and leases
|
|
$54,919
|
|
|
$1,588
|
|
|
$967
|
|
|
$215
|
|
|
$57,689
|
|
|
December 31, 2018
|
|||||||||||||||
|
Criticized
|
|||||||||||||||
|
(in millions)
|
Pass
|
|
Special Mention
|
Substandard
|
|
Doubtful
|
|
Total
|
|
||||||
|
Commercial
|
|
$38,600
|
|
|
$1,231
|
|
|
$828
|
|
|
$198
|
|
|
$40,857
|
|
|
Commercial real estate
|
12,523
|
|
412
|
|
82
|
|
6
|
|
13,023
|
|
|||||
|
Leases
|
2,823
|
|
39
|
|
41
|
|
—
|
|
2,903
|
|
|||||
|
Total commercial loans and leases
|
|
$53,946
|
|
|
$1,682
|
|
|
$951
|
|
|
$204
|
|
|
$56,783
|
|
63
CITIZENS FINANCIAL GROUP, INC.
NOTES TO CONSOLIDATED FINANCIAL STATEMENTS (UNAUDITED)
The recorded investment in classes of retail loans, categorized by delinquency status is presented below:
|
March 31, 2019
|
||||||||||||||||||
|
Days Past Due
|
||||||||||||||||||
|
(in millions)
|
Current
|
|
1-29
|
30-59
|
60-89
|
90 or More
|
Total
|
|
||||||||||
|
Residential mortgages
|
|
$18,876
|
|
|
$119
|
|
|
$38
|
|
|
$10
|
|
|
$131
|
|
|
$19,174
|
|
|
Home equity loans
|
883
|
|
80
|
|
12
|
|
4
|
|
27
|
|
1,006
|
|
||||||
|
Home equity lines of credit
|
11,769
|
|
366
|
|
76
|
|
28
|
|
155
|
|
12,394
|
|
||||||
|
Home equity loans serviced by others
|
332
|
|
22
|
|
8
|
|
2
|
|
11
|
|
375
|
|
||||||
|
Home equity lines of credit serviced by others
|
67
|
|
14
|
|
2
|
|
1
|
|
11
|
|
95
|
|
||||||
|
Automobile
|
10,654
|
|
1,067
|
|
196
|
|
58
|
|
17
|
|
11,992
|
|
||||||
|
Education
|
9,084
|
|
142
|
|
22
|
|
12
|
|
14
|
|
9,274
|
|
||||||
|
Credit cards
|
1,879
|
|
59
|
|
14
|
|
9
|
|
21
|
|
1,982
|
|
||||||
|
Other retail
|
3,502
|
|
75
|
|
27
|
|
17
|
|
13
|
|
3,634
|
|
||||||
|
Total retail loans
|
|
$57,046
|
|
|
$1,944
|
|
|
$395
|
|
|
$141
|
|
|
$400
|
|
|
$59,926
|
|
|
December 31, 2018
|
||||||||||||||||||
|
Days Past Due
|
||||||||||||||||||
|
(in millions)
|
Current
|
|
1-29
|
30-59
|
60-89
|
90 or More
|
Total
|
|
||||||||||
|
Residential mortgages
|
|
$18,664
|
|
|
$131
|
|
|
$37
|
|
|
$13
|
|
|
$133
|
|
|
$18,978
|
|
|
Home equity loans
|
945
|
|
75
|
|
12
|
|
3
|
|
38
|
|
1,073
|
|
||||||
|
Home equity lines of credit
|
12,042
|
|
386
|
|
65
|
|
22
|
|
195
|
|
12,710
|
|
||||||
|
Home equity loans serviced by others
|
355
|
|
21
|
|
7
|
|
3
|
|
13
|
|
399
|
|
||||||
|
Home equity lines of credit serviced by others
|
79
|
|
15
|
|
2
|
|
1
|
|
7
|
|
104
|
|
||||||
|
Automobile
|
10,729
|
|
1,039
|
|
207
|
|
59
|
|
72
|
|
12,106
|
|
||||||
|
Education
|
8,694
|
|
159
|
|
23
|
|
13
|
|
11
|
|
8,900
|
|
||||||
|
Credit cards
|
1,894
|
|
53
|
|
14
|
|
10
|
|
20
|
|
1,991
|
|
||||||
|
Other retail
|
3,481
|
|
76
|
|
26
|
|
18
|
|
15
|
|
3,616
|
|
||||||
|
Total retail loans
|
|
$56,883
|
|
|
$1,955
|
|
|
$393
|
|
|
$142
|
|
|
$504
|
|
|
$59,877
|
|
64
CITIZENS FINANCIAL GROUP, INC.
NOTES TO CONSOLIDATED FINANCIAL STATEMENTS (UNAUDITED)
Nonperforming Assets
The following table presents nonperforming loans and leases and loans accruing and 90 days or more past due:
|
Nonperforming
|
Accruing and 90 days or more past due
|
||||||||||||||
|
(in millions)
|
March 31, 2019
|
December 31, 2018
|
March 31, 2019
|
December 31, 2018
|
|||||||||||
|
Commercial
|
|
$208
|
|
|
$194
|
|
|
$1
|
|
|
$1
|
|
|||
|
Commercial real estate
|
4
|
|
7
|
|
—
|
|
—
|
|
|||||||
|
Leases
|
—
|
|
—
|
|
—
|
|
—
|
|
|||||||
|
Total commercial loans and leases
|
212
|
|
201
|
|
1
|
|
1
|
|
|||||||
|
Residential mortgages
(1)
|
138
|
|
136
|
|
20
|
|
15
|
|
|||||||
|
Home equity loans
|
42
|
|
50
|
|
—
|
|
—
|
|
|||||||
|
Home equity lines of credit
|
217
|
|
231
|
|
—
|
|
—
|
|
|||||||
|
Home equity loans serviced by others
|
15
|
|
17
|
|
—
|
|
—
|
|
|||||||
|
Home equity lines of credit serviced by others
|
14
|
|
15
|
|
—
|
|
—
|
|
|||||||
|
Automobile
|
70
|
|
81
|
|
—
|
|
—
|
|
|||||||
|
Education
|
43
|
|
38
|
|
2
|
|
2
|
|
|||||||
|
Credit card
|
22
|
|
20
|
|
—
|
|
—
|
|
|||||||
|
Other retail
|
7
|
|
8
|
|
9
|
|
7
|
|
|||||||
|
Total retail loans
|
568
|
|
596
|
|
31
|
|
24
|
|
|||||||
|
Total
|
|
$780
|
|
|
$797
|
|
|
$32
|
|
|
$25
|
|
|||
(1)
Nonperforming balances exclude first lien residential mortgage loans that are 100% guaranteed by the Federal Housing Administration. These loans, which are accruing and 90 days or more past due, totaled
$13 million
and
$12 million
as of
March 31, 2019
and
December 31, 2018
, respectively. Nonperforming balances also exclude guaranteed residential mortgage loans sold to GNMA for which the Company has the right, but not the obligation, to repurchase. These loans totaled
$144 million
and
$133 million
as of
March 31, 2019
and
December 31, 2018
, respectively. These loans are included in the Company’s Consolidated Balance Sheets.
Other nonperforming assets consisted primarily of other real estate owned and was presented in other assets on the Consolidated Balance Sheets. Other real estate owned, net of valuation allowance, was
$34 million
as of both
March 31, 2019
and
December 31, 2018
.
A summary of nonperforming loan and lease key performance indicators is presented below:
|
March 31, 2019
|
December 31, 2018
|
||||
|
Nonperforming commercial loans and leases as a percentage of total loans and leases
|
0.18
|
%
|
0.17
|
%
|
|
|
Nonperforming retail loans as a percentage of total loans and leases
|
0.48
|
|
0.51
|
|
|
|
Nonperforming loans and leases as a percentage of total loans and leases
|
0.66
|
%
|
0.68
|
%
|
|
|
Nonperforming commercial assets as a percentage of total assets
|
0.13
|
%
|
0.13
|
%
|
|
|
Nonperforming retail assets as a percentage of total assets
|
0.37
|
|
0.39
|
|
|
|
Nonperforming assets as a percentage of total assets
|
0.50
|
%
|
0.52
|
%
|
|
The recorded investment in mortgage loans collateralized by residential real estate property for which formal foreclosure proceedings are in process was
$170 million
and
$172 million
as of
March 31, 2019
and
December 31, 2018
, respectively.
65
CITIZENS FINANCIAL GROUP, INC.
NOTES TO CONSOLIDATED FINANCIAL STATEMENTS (UNAUDITED)
An analysis of the age of both accruing and nonaccruing loan and lease past due amounts is presented below:
|
March 31, 2019
|
December 31, 2018
|
||||||||||||||||||||||||
|
Days Past Due
|
Days Past Due
|
||||||||||||||||||||||||
|
(in millions)
|
30-59
|
60-89
|
90 or More
|
Total
|
|
30-59
|
60-89
|
90 or More
|
Total
|
|
|||||||||||||||
|
Commercial
|
|
$70
|
|
|
$9
|
|
|
$71
|
|
|
$150
|
|
|
$85
|
|
|
$3
|
|
|
$78
|
|
|
$166
|
|
|
|
Commercial real estate
|
56
|
|
65
|
|
2
|
|
123
|
|
8
|
|
32
|
|
5
|
|
45
|
|
|||||||||
|
Leases
|
8
|
|
—
|
|
—
|
|
8
|
|
7
|
|
—
|
|
—
|
|
7
|
|
|||||||||
|
Total commercial loans and leases
|
134
|
|
74
|
|
73
|
|
281
|
|
100
|
|
35
|
|
83
|
|
218
|
|
|||||||||
|
Residential mortgages
|
38
|
|
10
|
|
131
|
|
179
|
|
37
|
|
13
|
|
133
|
|
183
|
|
|||||||||
|
Home equity loans
|
12
|
|
4
|
|
27
|
|
43
|
|
12
|
|
3
|
|
38
|
|
53
|
|
|||||||||
|
Home equity lines of credit
|
76
|
|
28
|
|
155
|
|
259
|
|
65
|
|
22
|
|
195
|
|
282
|
|
|||||||||
|
Home equity loans serviced by others
|
8
|
|
2
|
|
11
|
|
21
|
|
7
|
|
3
|
|
13
|
|
23
|
|
|||||||||
|
Home equity lines of credit serviced by others
|
2
|
|
1
|
|
11
|
|
14
|
|
2
|
|
1
|
|
7
|
|
10
|
|
|||||||||
|
Automobile
|
196
|
|
58
|
|
17
|
|
271
|
|
207
|
|
59
|
|
72
|
|
338
|
|
|||||||||
|
Education
|
22
|
|
12
|
|
14
|
|
48
|
|
23
|
|
13
|
|
11
|
|
47
|
|
|||||||||
|
Credit cards
|
14
|
|
9
|
|
21
|
|
44
|
|
14
|
|
10
|
|
20
|
|
44
|
|
|||||||||
|
Other retail
|
27
|
|
17
|
|
13
|
|
57
|
|
26
|
|
18
|
|
15
|
|
59
|
|
|||||||||
|
Total retail loans
|
395
|
|
141
|
|
400
|
|
936
|
|
393
|
|
142
|
|
504
|
|
1,039
|
|
|||||||||
|
Total
|
|
$529
|
|
|
$215
|
|
|
$473
|
|
|
$1,217
|
|
|
$493
|
|
|
$177
|
|
|
$587
|
|
|
$1,257
|
|
|
Impaired Loans
Impaired loans include nonaccruing larger balance (greater than
$3 million
carrying value), non-homogeneous commercial and commercial real estate loans, and restructured loans that are deemed TDRs. A summary of impaired loans by class is presented below:
|
March 31, 2019
|
|||||||||||||||
|
(in millions)
|
Impaired Loans With a Related Allowance
|
Allowance on Impaired Loans
|
Impaired Loans Without a Related Allowance
|
Unpaid Contractual Balance
|
Total Recorded Investment in Impaired Loans
|
||||||||||
|
Commercial
|
|
$195
|
|
|
$42
|
|
|
$165
|
|
|
$415
|
|
|
$360
|
|
|
Commercial real estate
|
—
|
|
—
|
|
26
|
|
46
|
|
26
|
|
|||||
|
Leases
|
—
|
|
—
|
|
—
|
|
—
|
|
—
|
|
|||||
|
Total commercial loans and leases
|
195
|
|
42
|
|
191
|
|
461
|
|
386
|
|
|||||
|
Residential mortgages
|
28
|
|
2
|
|
118
|
|
188
|
|
146
|
|
|||||
|
Home equity loans
|
30
|
|
2
|
|
70
|
|
135
|
|
100
|
|
|||||
|
Home equity lines of credit
|
23
|
|
1
|
|
179
|
|
243
|
|
202
|
|
|||||
|
Home equity loans serviced by others
|
20
|
|
1
|
|
19
|
|
51
|
|
39
|
|
|||||
|
Home equity lines of credit serviced by others
|
1
|
|
—
|
|
6
|
|
10
|
|
7
|
|
|||||
|
Automobile
|
1
|
|
—
|
|
21
|
|
30
|
|
22
|
|
|||||
|
Education
|
126
|
|
10
|
|
23
|
|
149
|
|
149
|
|
|||||
|
Credit cards
|
25
|
|
8
|
|
—
|
|
25
|
|
25
|
|
|||||
|
Other retail
|
3
|
|
1
|
|
3
|
|
7
|
|
6
|
|
|||||
|
Total retail loans
|
257
|
|
25
|
|
439
|
|
838
|
|
696
|
|
|||||
|
Total
|
|
$452
|
|
|
$67
|
|
|
$630
|
|
|
$1,299
|
|
|
$1,082
|
|
66
CITIZENS FINANCIAL GROUP, INC.
NOTES TO CONSOLIDATED FINANCIAL STATEMENTS (UNAUDITED)
|
December 31, 2018
|
|||||||||||||||
|
(in millions)
|
Impaired Loans With a Related Allowance
|
Allowance on Impaired Loans
|
Impaired Loans Without a Related Allowance
|
Unpaid Contractual Balance
|
Total Recorded Investment in Impaired Loans
|
||||||||||
|
Commercial
|
|
$186
|
|
|
$31
|
|
|
$167
|
|
|
$450
|
|
|
$353
|
|
|
Commercial real estate
|
32
|
|
7
|
|
6
|
|
38
|
|
38
|
|
|||||
|
Leases
|
—
|
|
—
|
|
—
|
|
—
|
|
—
|
|
|||||
|
Total commercial loans and leases
|
218
|
|
38
|
|
173
|
|
488
|
|
391
|
|
|||||
|
Residential mortgages
|
28
|
|
2
|
|
127
|
|
201
|
|
155
|
|
|||||
|
Home equity loans
|
34
|
|
3
|
|
76
|
|
148
|
|
110
|
|
|||||
|
Home equity lines of credit
|
21
|
|
1
|
|
181
|
|
244
|
|
202
|
|
|||||
|
Home equity loans serviced by others
|
22
|
|
1
|
|
19
|
|
54
|
|
41
|
|
|||||
|
Home equity lines of credit serviced by others
|
1
|
|
—
|
|
7
|
|
11
|
|
8
|
|
|||||
|
Automobile
|
1
|
|
—
|
|
22
|
|
31
|
|
23
|
|
|||||
|
Education
|
130
|
|
11
|
|
23
|
|
153
|
|
153
|
|
|||||
|
Credit cards
|
24
|
|
7
|
|
1
|
|
25
|
|
25
|
|
|||||
|
Other retail
|
4
|
|
1
|
|
2
|
|
8
|
|
6
|
|
|||||
|
Total retail loans
|
265
|
|
26
|
|
458
|
|
875
|
|
723
|
|
|||||
|
Total
|
|
$483
|
|
|
$64
|
|
|
$631
|
|
|
$1,363
|
|
|
$1,114
|
|
Additional information on impaired loans is presented below:
|
Three Months Ended March 31,
|
|||||||||||||
|
2019
|
2018
|
||||||||||||
|
(in millions)
|
Interest Income Recognized
|
Average Recorded Investment
|
Interest Income Recognized
|
Average Recorded Investment
|
|||||||||
|
Commercial
|
|
$3
|
|
|
$301
|
|
|
$2
|
|
|
$293
|
|
|
|
Commercial real estate
|
—
|
|
26
|
|
—
|
|
27
|
|
|||||
|
Leases
|
—
|
|
—
|
|
—
|
|
—
|
|
|||||
|
Total commercial loans and leases
|
3
|
|
327
|
|
2
|
|
320
|
|
|||||
|
Residential mortgages
|
1
|
|
143
|
|
1
|
|
149
|
|
|||||
|
Home equity loans
|
2
|
|
101
|
|
2
|
|
118
|
|
|||||
|
Home equity lines of credit
|
2
|
|
196
|
|
2
|
|
194
|
|
|||||
|
Home equity loans serviced by others
|
1
|
|
39
|
|
1
|
|
50
|
|
|||||
|
Home equity lines of credit serviced by others
|
—
|
|
7
|
|
—
|
|
9
|
|
|||||
|
Automobile
|
—
|
|
21
|
|
—
|
|
22
|
|
|||||
|
Education
|
2
|
|
150
|
|
2
|
|
171
|
|
|||||
|
Credit cards
|
—
|
|
24
|
|
—
|
|
24
|
|
|||||
|
Other retail
|
—
|
|
6
|
|
—
|
|
8
|
|
|||||
|
Total retail loans
|
8
|
|
687
|
|
8
|
|
745
|
|
|||||
|
Total
|
|
$11
|
|
|
$1,014
|
|
|
$10
|
|
|
$1,065
|
|
|
Troubled Debt Restructurings
In situations where, for economic or legal reasons related to the borrower’s financial difficulties, the Company grants a concession to the borrower that it would not otherwise consider, the related loan is classified as a TDR. TDRs typically result from the Company’s loss mitigation efforts and are undertaken in order to improve the likelihood of recovery and continuity of the relationship with the borrower. The Company’s loan modifications are handled on a case-by-case basis and are negotiated to achieve mutually agreeable terms that maximize loan collectability and meet the borrower’s financial needs. Concessions granted in TDRs for all classes of loans may include lowering the interest rate, forgiving a portion of principal, extending the loan term, lowering scheduled payments for a specified period of time, waiving or delaying a scheduled payment of principal or interest for other than an insignificant time period, or capitalizing past due amounts. A rate increase can be a concession if the increased rate is lower than a market rate for debt with risk similar to that of the restructured loan. TDRs for commercial loans and leases may
67
CITIZENS FINANCIAL GROUP, INC.
NOTES TO CONSOLIDATED FINANCIAL STATEMENTS (UNAUDITED)
also involve creating a multiple note structure, accepting non-cash assets, accepting an equity interest, or receiving a performance-based fee. In some cases, a TDR may involve multiple concessions. The financial effects of TDRs for all loan classes may include lower income (either due to a lower interest rate or a delay in the timing of cash flows), larger loan loss provisions, and accelerated charge-offs if the modification renders the loan collateral-dependent. In some cases, interest income throughout the term of the loan may increase if, for example, the loan is extended or the interest rate is increased as a result of the restructuring.
Because TDRs are impaired loans, Citizens measures impairment by comparing the present value of expected future cash flows, or when appropriate, the fair value of collateral less costs to sell, to the loan’s recorded investment. Any excess of recorded investment over the present value of expected future cash flows or collateral value is included in the ALLL. Any portion of the loan’s recorded investment the Company does not expect to collect as a result of the modification is charged off at the time of modification. For retail TDR accounts where the expected value of cash flows is utilized, any recorded investment in excess of the present value of expected cash flows is recognized by increasing the ALLL. For retail TDR accounts assessed based on the fair value of collateral, any portion of the loan’s recorded investment in excess of the collateral value less costs to sell is charged off at the time of modification or at the time of subsequent and regularly recurring valuations.
The table below summarizes TDRs by class and total unfunded commitments:
|
(in millions)
|
March 31, 2019
|
December 31, 2018
|
|||||
|
Commercial
|
|
$296
|
|
|
$304
|
|
|
|
Retail
|
696
|
|
723
|
|
|||
|
Unfunded commitments related to TDRs
|
25
|
|
30
|
|
|||
The table below summarizes how loans were modified during the three months ended
March 31, 2019
and
2018
. The reported balances represent the post-modification outstanding recorded investment and can include loans that became TDRs during the period and were paid off in full, charged off, or sold prior to period end. Pre-modification balances for modified loans approximate the post-modification balances shown.
|
Three Months Ended March 31, 2019
|
|||||||||||||||||
|
Primary Modification Types
|
|||||||||||||||||
|
Interest Rate Reduction
1
|
Maturity Extension
2
|
Other
3
|
|||||||||||||||
|
(dollars in millions)
|
Number of Contracts
|
Recorded Investment
|
Number of Contracts
|
Recorded Investment
|
Number of Contracts
|
Recorded Investment
|
|||||||||||
|
Commercial
|
—
|
|
|
$—
|
|
5
|
|
|
$1
|
|
12
|
|
|
$40
|
|
||
|
Commercial real estate
|
—
|
|
—
|
|
—
|
|
—
|
|
—
|
|
—
|
|
|||||
|
Total commercial loans
|
—
|
|
—
|
|
5
|
|
1
|
|
12
|
|
40
|
|
|||||
|
Residential mortgages
|
4
|
|
2
|
|
11
|
|
2
|
|
30
|
|
4
|
|
|||||
|
Home equity loans
|
7
|
|
—
|
|
—
|
|
—
|
|
27
|
|
1
|
|
|||||
|
Home equity lines of credit
|
29
|
|
4
|
|
35
|
|
6
|
|
105
|
|
8
|
|
|||||
|
Home equity loans serviced by others
|
—
|
|
—
|
|
—
|
|
—
|
|
4
|
|
—
|
|
|||||
|
Home equity lines of credit serviced by others
|
—
|
|
—
|
|
—
|
|
—
|
|
2
|
|
—
|
|
|||||
|
Automobile
|
25
|
|
—
|
|
5
|
|
—
|
|
289
|
|
4
|
|
|||||
|
Education
|
—
|
|
—
|
|
—
|
|
—
|
|
67
|
|
2
|
|
|||||
|
Credit cards
|
616
|
|
4
|
|
—
|
|
—
|
|
—
|
|
—
|
|
|||||
|
Other retail
|
—
|
|
—
|
|
—
|
|
—
|
|
1
|
|
—
|
|
|||||
|
Total retail loans
|
681
|
|
10
|
|
51
|
|
8
|
|
525
|
|
19
|
|
|||||
|
Total
|
681
|
|
|
$10
|
|
56
|
|
|
$9
|
|
537
|
|
|
$59
|
|
||
68
CITIZENS FINANCIAL GROUP, INC.
NOTES TO CONSOLIDATED FINANCIAL STATEMENTS (UNAUDITED)
|
Three Months Ended March 31, 2018
|
|||||||||||||||||
|
Primary Modification Types
|
|||||||||||||||||
|
Interest Rate Reduction
1
|
Maturity Extension
2
|
Other
3
|
|||||||||||||||
|
(dollars in millions)
|
Number of Contracts
|
Recorded Investment
|
Number of Contracts
|
Recorded Investment
|
Number of Contracts
|
Recorded Investment
|
|||||||||||
|
Commercial
|
1
|
|
|
$—
|
|
6
|
|
|
$1
|
|
18
|
|
|
$75
|
|
||
|
Commercial real estate
|
—
|
|
—
|
|
1
|
|
—
|
|
—
|
|
—
|
|
|||||
|
Total commercial loans
|
1
|
|
—
|
|
7
|
|
1
|
|
18
|
|
75
|
|
|||||
|
Residential mortgages
|
7
|
|
1
|
|
7
|
|
1
|
|
53
|
|
6
|
|
|||||
|
Home equity loans
|
11
|
|
1
|
|
—
|
|
—
|
|
32
|
|
2
|
|
|||||
|
Home equity lines of credit
|
15
|
|
1
|
|
42
|
|
5
|
|
93
|
|
7
|
|
|||||
|
Home equity loans serviced by others
|
1
|
|
—
|
|
—
|
|
—
|
|
7
|
|
—
|
|
|||||
|
Home equity lines of credit serviced by others
|
2
|
|
—
|
|
—
|
|
—
|
|
3
|
|
—
|
|
|||||
|
Automobile
|
36
|
|
1
|
|
17
|
|
1
|
|
269
|
|
4
|
|
|||||
|
Education
|
—
|
|
—
|
|
—
|
|
—
|
|
112
|
|
1
|
|
|||||
|
Credit cards
|
594
|
|
3
|
|
—
|
|
—
|
|
—
|
|
—
|
|
|||||
|
Other retail
|
1
|
|
—
|
|
—
|
|
—
|
|
4
|
|
—
|
|
|||||
|
Total retail loans
|
667
|
|
7
|
|
66
|
|
7
|
|
573
|
|
20
|
|
|||||
|
Total
|
668
|
|
|
$7
|
|
73
|
|
|
$8
|
|
591
|
|
|
$95
|
|
||
(1)
Includes modifications that consist of multiple concessions, one of which is an interest rate reduction.
(2)
Includes modifications that consist of multiple concessions, one of which is a maturity extension (unless one of the other concessions was an interest rate reduction).
(3)
Includes modifications other than interest rate reductions or maturity extensions, such as lowering scheduled payments for a specified period of time, principal forgiveness, and capitalizing arrearages. Also included are the following: deferrals, trial modifications, certain bankruptcies, loans in forbearance and prepayment plans. Modifications can include the deferral of accrued interest resulting in post modification balances being higher than pre-modification.
The net change to ALLL resulting from modification for the
three months ended
March 31, 2019
and
2018
was
$2 million
and
$1 million
, respectively. Charge-offs may also be recorded on TDRs. Citizens recorded
$1 million
of charge-offs resulting from the modification of loans in the
three months ended
March 31, 2019
and
2018
.
A payment default refers to a loan that becomes 90 days or more past due under the modified terms. Loan data includes loans meeting the criteria that were paid off in full, charged off, or sold prior to
March 31, 2019
and
2018
. If a TDR of any loan type becomes 90 days past due after being modified, the loan is written down to the fair value of collateral less cost to sell. The amount written off is charged to the ALLL. For commercial loans, recorded investment in TDRs that defaulted within 12 months of their modification date for the
three months ended
March 31, 2018
were
$3 million
. There were
none
for the
three months ended
March 31, 2019
. For retail loans, there were
$9 million
and
$10 million
of loans which defaulted within 12 months of their restructuring date for the
three months ended
March 31, 2019
and
2018
, respectively.
Concentrations of Credit Risk
Most of the Company’s lending activity is with customers located in the New England, Mid-Atlantic and Midwest regions. Generally, loans are collateralized by assets including real estate, inventory, accounts receivable, other personal property and investment securities. As of
March 31, 2019
and December 31,
2018
, Citizens had a significant amount of loans collateralized by residential and commercial real estate. There were no significant concentration risks within the commercial loan or retail loan portfolios. Exposure to credit losses arising from lending transactions may fluctuate with fair values of collateral supporting loans, which may not perform according to contractual agreements. The Company’s policy is to collateralize loans to the extent necessary; however, unsecured loans are also granted on the basis of the financial strength of the applicant and the facts surrounding the transaction.
69
CITIZENS FINANCIAL GROUP, INC.
NOTES TO CONSOLIDATED FINANCIAL STATEMENTS (UNAUDITED)
Certain loan products, including residential mortgages, home equity loans and lines of credit, and credit cards, have contractual features that may increase credit exposure to the Company in the event of an increase in interest rates or a decline in housing values. These products include loans that exceed
90%
of the value of the underlying collateral (high LTV loans), interest-only and negative amortization residential mortgages, and loans with low introductory rates. Certain loans have more than one of these characteristics. The following tables present balances of loans with these characteristics:
|
March 31, 2019
|
|||||||||||||||
|
(in millions)
|
Residential Mortgages
|
Home Equity Loans and Lines of Credit
|
Home Equity Products Serviced by Others
|
Credit Cards
|
|
Total
|
|
||||||||
|
High loan-to-value
|
|
$342
|
|
|
$79
|
|
|
$134
|
|
|
$—
|
|
|
$555
|
|
|
Interest-only/negative amortization
|
1,724
|
|
—
|
|
—
|
|
—
|
|
1,724
|
|
|||||
|
Low introductory rate
|
—
|
|
—
|
|
—
|
|
219
|
|
219
|
|
|||||
|
Multiple characteristics and other
|
2
|
|
—
|
|
—
|
|
—
|
|
2
|
|
|||||
|
Total
|
|
$2,068
|
|
|
$79
|
|
|
$134
|
|
|
$219
|
|
|
$2,500
|
|
|
December 31, 2018
|
||||||||||||||||||
|
(in millions)
|
Residential Mortgages
|
Home Equity Loans and Lines of Credit
|
Home Equity Products Serviced by Others
|
Credit Cards
|
|
Education
|
|
Total
|
|
|||||||||
|
High loan-to-value
|
|
$318
|
|
|
$87
|
|
|
$148
|
|
|
$—
|
|
|
$—
|
|
|
$553
|
|
|
Interest-only/negative amortization
|
1,794
|
|
—
|
|
—
|
|
—
|
|
1
|
|
1,795
|
|
||||||
|
Low introductory rate
|
—
|
|
—
|
|
—
|
|
217
|
|
—
|
|
217
|
|
||||||
|
Multiple characteristics and other
|
1
|
|
—
|
|
—
|
|
—
|
|
—
|
|
1
|
|
||||||
|
Total
|
|
$2,113
|
|
|
$87
|
|
|
$148
|
|
|
$217
|
|
|
$1
|
|
|
$2,566
|
|
NOTE 5 - MORTGAGE BANKING
In its mortgage banking business, the Company sells residential mortgages to GSEs and other parties, who may issue securities backed by pools of such loans. The Company retains no beneficial interests in these sales, but may retain the servicing rights for the loans sold. The Company is obligated to subsequently repurchase a loan if the purchaser discovers a representation or warranty violation such as noncompliance with eligibility or servicing requirements, or customer fraud that should have been identified in a loan file review.
The Company recognizes the right to service residential mortgage loans for others, or MSRs, as separate assets, which are presented in other assets on the Consolidated Balance Sheets, when purchased, or when servicing is contractually separated from the underlying mortgage loans by sale with servicing rights retained. The following table summarizes activity related to residential mortgage loans sold with servicing rights retained for the three months ended
March 31,
2019
and
2018
.
|
Three Months Ended March 31,
|
|||||||
|
(in millions)
|
2019
|
|
2018
|
|
|||
|
Residential mortgage loans sold with servicing retained
|
|
$2,919
|
|
|
$655
|
|
|
|
Gain on sales
(1)
|
37
|
|
13
|
|
|||
|
Contractually specified servicing, late and other ancillary fees
(1)
|
48
|
|
15
|
|
|||
(1)
Reported in mortgage banking fees on the Consolidated Statements of Operations.
As of August 1, 2018, the Company maintains two separate classes of MSRs which at the time of initial capitalization, are differentiated by how the risk associated with valuation changes of the MSRs is managed. The acquired FAMC portfolio is accounted for under the fair value method while the Company’s MSR portfolio held before the FAMC acquisition is accounted for under the amortization method. Beginning January 1, 2019, all of the Company’s newly originated MSRs are accounted for under the fair value method. The Company implemented an active hedging strategy to manage the risk associated with changes in the value of the MSR portfolio accounted for under the fair
70
CITIZENS FINANCIAL GROUP, INC.
NOTES TO CONSOLIDATED FINANCIAL STATEMENTS (UNAUDITED)
value method, which includes the purchase of freestanding derivatives. Any change in fair value during the period for MSRs carried under the fair value method, as well as amortization and impairment of MSRs under the amortization method, is recorded in mortgage banking fees in the Consolidated Statements of Operations.
The following table summarizes changes in MSRs recorded using the amortization method for the three months ended
March 31,
2019
and
2018
.
|
As of and for the Three Months Ended March 31,
|
|||||||
|
(in millions)
|
2019
|
|
2018
|
|
|||
|
Mortgage servicing rights:
|
|||||||
|
Balance as of beginning of period
|
|
$221
|
|
|
$201
|
|
|
|
Amount capitalized
|
—
|
|
8
|
|
|||
|
Amortization
|
(9
|
)
|
(8
|
)
|
|||
|
Carrying amount before valuation allowance
|
212
|
|
201
|
|
|||
|
Valuation allowance for servicing assets:
|
|||||||
|
Balance as of beginning of period
|
—
|
|
3
|
|
|||
|
Valuation recoveries
|
—
|
|
(3
|
)
|
|||
|
Balance at end of period
|
—
|
|
—
|
|
|||
|
Net carrying value of MSRs
|
|
$212
|
|
|
$201
|
|
|
The following table summarizes changes in MSRs recorded using the fair value method for the three months ended
March 31,
2019
. There were
no
MSRs recorded using the fair value method for the three months ended
March 31, 2018
.
|
Three Months Ended March 31, 2019
|
|||
|
(in millions)
|
|||
|
Fair value as of beginning of the period
|
|
$600
|
|
|
Amounts capitalized
|
35
|
|
|
|
Changes in unpaid principal balance during the period
(1)
|
(26
|
)
|
|
|
Changes in fair value during the period
(2)
|
(46
|
)
|
|
|
Fair value at end of the period
|
|
$563
|
|
(1)
Represents changes in value due to i) passage of time including the impact from both regularly scheduled loan principal payments and partial paydowns, and ii)
loans that paid off during the period.
(2)
Represents changes in value primarily due to market driven changes in interest rates and prepayment speeds.
The fair value of MSRs is estimated by using the present value of estimated future net servicing cash flows, taking into consideration actual and expected mortgage loan prepayment rates, discount rates, contractual servicing fee income, servicing costs, default rates, ancillary income, and other economic factors, which are determined based on current market interest rates. The valuation does not attempt to forecast or predict the future direction of interest rates.
The sensitivity analysis below presents the impact to current fair value of an immediate 50 basis point and 100 basis point adverse change in the key economic assumptions and presents the decline in fair value that would occur if the adverse change were realized. These sensitivities are hypothetical, with the effect of a variation in a particular assumption on the fair value of the mortgage servicing rights calculated independently without changing any other assumption. In reality, changes in one factor may result in changes in another (e.g., changes in interest rates, which drive changes in prepayment rates, could result in changes in the discount rates), which may amplify or counteract the sensitivities. The primary risk inherent in the Company’s MSRs is an increase in prepayments of the underlying mortgage loans serviced, which is dependent upon movements in market interest rates.
71
CITIZENS FINANCIAL GROUP, INC.
NOTES TO CONSOLIDATED FINANCIAL STATEMENTS (UNAUDITED)
For MSRs under the amortization method, the key economic assumptions used to estimate the fair value are presented below:
|
March 31, 2019
|
December 31, 2018
|
||||||
|
Actual
|
Decline in fair value due to
|
Actual
|
Decline in fair value due to
|
||||
|
(dollars in millions)
|
|||||||
|
Fair value
|
$224
|
50 bps adverse change
|
100 bps adverse change
|
$243
|
50 bps adverse change
|
100 bps adverse change
|
|
|
Weighted average life (in years)
|
6.1
|
6.5
|
|||||
|
Weighted average constant prepayment rate
|
9.6%
|
$27
|
$58
|
8.5%
|
$24
|
$56
|
|
|
Weighted average discount rate
|
9.3%
|
4
|
8
|
9.3%
|
5
|
9
|
|
For MSRs under the fair value method, the key economic assumptions used to estimate the fair value are presented below:
|
March 31, 2019
|
December 31, 2018
|
||||||
|
Actual
|
Decline in fair value due to
|
Actual
|
Decline in fair value due to
|
||||
|
(dollars in millions)
|
|||||||
|
Fair value
|
$563
|
50 bps adverse change
|
100 bps adverse change
|
$600
|
50 bps adverse change
|
100 bps adverse change
|
|
|
Weighted average life (in years)
|
6.7
|
8.0
|
|||||
|
Weighted average constant prepayment rate
|
10.7%
|
$81
|
$177
|
8.2%
|
$68
|
$148
|
|
|
Weighted average option adjusted spread
|
568 bps
|
11
|
22
|
609 bps
|
13
|
26
|
|
Citizens accounts for derivatives in its mortgage banking operations at fair value on the balance sheet as derivative assets or derivative liabilities, depending on whether the derivative had a positive (asset) or negative (liability) fair value as of the balance sheet date. The Company’s mortgage banking derivatives include commitments to originate mortgages held for sale, certain loan sale agreements, and other financial instruments that meet the definition of a derivative. Refer to
Note 9 "Derivatives"
for additional information.
NOTE 6 - LEASES
The Company determines if an arrangement is a lease at inception and records a right-of-use asset and a corresponding lease liability. A right-of-use asset represents the value of the Company’s contractual right to use an underlying leased asset and a lease liability represents the Company’s contractual obligation to make payments on the same underlying leased asset. Operating and finance lease right-of-use assets and liabilities are recognized at commencement date based on the present value of the lease payments over the non-cancelable lease term. As most of the Company’s leases do not specify an implicit rate, the Company uses an incremental borrowing rate based on information available at the lease commencement date to determine the present value of the lease payments. The Company evaluates right-of-use assets for impairment when events or changes in circumstances indicate that the carrying value of the asset may not be recoverable.
In its normal course of business, the Company leases both equipment and real estate, including office and branch space. Lease terms predominantly range from
one
to
ten
years and may include options to extend the lease, terminate the lease, or purchase the underlying asset at the end of the lease. Certain lease agreements include rental payments based on an index or are adjusted periodically for inflation. The Company has lease agreements that contain lease and non-lease components and for certain real estate leases, these components are accounted for as a single lease component.
Leases with an initial term of 12 months or less are not recorded on the Company’s Consolidated Balance Sheets and are recognized in occupancy expense in the Company’s Consolidated Statements of Operations on a straight-line basis over the remaining lease term. The Company may also enter into subleases with third parties for certain leased real estate properties that are no longer occupied.
72
CITIZENS FINANCIAL GROUP, INC.
NOTES TO CONSOLIDATED FINANCIAL STATEMENTS (UNAUDITED)
The components of operating lease cost are presented below:
|
(in millions)
|
Three Months Ended March 31, 2019
|
||
|
Operating lease cost
|
|
$40
|
|
|
Short-term lease cost
|
3
|
|
|
|
Variable lease cost
|
2
|
|
|
|
Sublease income
|
(1
|
)
|
|
|
Total
|
|
$44
|
|
Operating lease cost is recognized on a straight line basis over the lease term and recorded in occupancy expense on the Consolidated Statements of Operations.
Supplemental Consolidated Balance Sheet information related to the Company’s operating lease arrangements is presented below:
|
(in millions)
|
March 31, 2019
|
Affected Line Item in Consolidated Balance Sheets
|
||
|
Operating lease right-of-use assets
|
|
$746
|
|
Other assets
|
|
Operating lease liabilities
|
762
|
|
Other liabilities
|
|
Supplemental information related to the Company’s operating lease arrangements is presented below:
|
(in millions)
|
Three Months Ended March 31, 2019
|
||
|
Cash paid for amounts included in measurement of liabilities:
|
|||
|
Operating cash flows from operating leases
|
|
$39
|
|
|
Right-of-use assets in exchange for new operating lease liabilities
|
47
|
|
|
The weighted average remaining lease term and weighted average discount rate for operating leases is
seven
years and
3.23%
, respectively.
At
March 31, 2019
, lease liabilities maturing under non-cancelable operating leases are presented below for the years ended December 31:
|
(in millions
|
Operating Leases
|
||
|
2019
|
|
$108
|
|
|
2020
|
157
|
|
|
|
2021
|
140
|
|
|
|
2022
|
115
|
|
|
|
2023
|
90
|
|
|
|
Thereafter
|
249
|
|
|
|
Total lease payments
|
859
|
|
|
|
Less interest
|
97
|
|
|
|
Present value of lease liabilities
|
|
$762
|
|
73
CITIZENS FINANCIAL GROUP, INC.
NOTES TO CONSOLIDATED FINANCIAL STATEMENTS (UNAUDITED)
NOTE 7 - VARIABLE INTEREST ENTITIES
Citizens is involved in various entities that are considered VIEs, including investments in limited partnerships that sponsor affordable housing projects, limited liability companies that sponsor renewable energy projects and lending to special purpose entities. Citizens’ maximum exposure to loss as a result of its involvement with these entities is limited to the balance sheet carrying amount of its equity investment and outstanding loans to special purpose entities. A summary of these investments is presented below:
|
(in millions)
|
March 31, 2019
|
December 31, 2018
|
|||||
|
LIHTC investment included in other assets
|
|
$1,263
|
|
|
$1,236
|
|
|
|
LIHTC unfunded commitments included in other liabilities
|
676
|
|
673
|
|
|||
|
Renewable energy investments included in other assets
|
315
|
|
319
|
|
|||
|
Lending to special purpose entities included in loans and leases
|
728
|
|
613
|
|
|||
Low Income Housing Tax Credit Partnerships
The purpose of the Company’s equity investments is to assist in achieving the goals of the Community Reinvestment Act and to earn an adequate return of capital. LIHTC partnerships are managed by unrelated general partners that have the power to direct the activities which most significantly affect the performance of the partnerships. Citizens is therefore not the primary beneficiary of any LIHTC partnerships. Accordingly, Citizens does not consolidate these VIEs and accounts for these investments in other assets on the Consolidated Balance Sheets.
Citizens applies the proportional amortization method to account for its LIHTC investments. Under the proportional amortization method, the Company applies a practical expedient and amortizes the initial cost of the investment in proportion to the tax credits received in the current period as compared to the total tax credits expected to be received over the life of the investment. The amortization and tax benefits are included as a component of income tax expense. The tax credits received are reported as a reduction of income tax expense (or an increase to income tax benefit) related to these transactions.
The following table presents other information related to the Company’s affordable housing tax credit investments:
|
Three Months Ended March 31,
|
|||||||
|
(in millions)
|
2019
|
|
2018
|
|
|||
|
Tax credits included in income tax expense
|
|
$35
|
|
|
$25
|
|
|
|
Amortization expense included in income tax expense
|
37
|
|
27
|
|
|||
|
Other tax benefits included in income tax expense
|
8
|
|
6
|
|
|||
No
LIHTC investment impairment losses were recognized during the three months ended
March 31, 2019
and
2018
, respectively.
Renewable Energy Entities
The Company’s investments in renewable energy entities provide benefits from a return generated by government incentives plus other tax attributes that are associated with tax ownership (e.g., tax depreciation). As a tax equity investor, Citizens does not have the power to direct the activities which most significantly affect the performance of these entities and therefore is not the primary beneficiary of any renewable energy entities. Accordingly, Citizens does not consolidate these VIEs and accounts for these investments in other assets on the Consolidated Balance Sheets.
Lending to Special Purpose Entities
Citizens provides lending facilities to third-party sponsored special purpose entities. Because the sponsor for each respective entity has the power to direct how proceeds from the Company are utilized, as well as maintains responsibility for any associated servicing commitments, Citizens is not the primary beneficiary of these entities. Accordingly, Citizens does not consolidate these VIEs on the Consolidated Balance Sheets. As of
March 31, 2019
and
December 31, 2018
, the lending facilities had aggregate unpaid principal balances of
$728 million
and
$613 million
, respectively, and undrawn commitments to extend credit of
$677 million
and
$584 million
, respectively.
74
CITIZENS FINANCIAL GROUP, INC.
NOTES TO CONSOLIDATED FINANCIAL STATEMENTS (UNAUDITED)
NOTE 8 - BORROWED FUNDS
A summary of the Company’s short-term borrowed funds is presented below:
|
(in millions)
|
March 31, 2019
|
December 31, 2018
|
|||||
|
Federal funds purchased
|
|
$375
|
|
|
$820
|
|
|
|
Securities sold under agreements to repurchase
|
293
|
|
336
|
|
|||
|
Other short-term borrowed funds
|
11
|
|
161
|
|
|||
|
Total short-term borrowed funds
|
|
$679
|
|
|
$1,317
|
|
|
Key data related to short-term borrowed funds is presented in the following table:
|
As of and for the Three Months Ended March 31,
|
As of and for the Year Ended December 31,
|
||||||||||
|
(dollars in millions)
|
2019
|
|
2018
|
|
2018
|
||||||
|
Weighted-average interest rate at period-end:
(1)
|
|||||||||||
|
Federal funds purchased and securities sold under agreements to repurchase
|
1.39
|
%
|
—
|
%
|
1.72
|
%
|
|||||
|
Other short-term borrowed funds
|
3.03
|
|
3.40
|
|
2.73
|
|
|||||
|
Maximum amount outstanding at any month-end during the period:
|
|||||||||||
|
Federal funds purchased and securities sold under agreements to repurchase
(2)
|
|
$1,134
|
|
|
$625
|
|
|
$1,282
|
|
||
|
Other short-term borrowed funds
|
511
|
|
1,110
|
|
1,110
|
|
|||||
|
Average amount outstanding during the period:
|
|||||||||||
|
Federal funds purchased and securities sold under agreements to repurchase
(2)
|
|
$640
|
|
|
$645
|
|
|
$654
|
|
||
|
Other short-term borrowed funds
|
58
|
|
588
|
|
467
|
|
|||||
|
Weighted-average interest rate during the period:
(1)
|
|||||||||||
|
Federal funds purchased and securities sold under agreements to repurchase
|
1.24
|
%
|
0.66
|
%
|
0.92
|
%
|
|||||
|
Other short-term borrowed funds
|
2.75
|
|
1.67
|
|
2.10
|
|
|||||
(1)
Rates exclude certain hedging costs.
(2)
Balances are net of certain short-term receivables associated with reverse repurchase agreements, as applicable.
75
CITIZENS FINANCIAL GROUP, INC.
NOTES TO CONSOLIDATED FINANCIAL STATEMENTS (UNAUDITED)
A summary of the Company’s long-term borrowed funds is presented below:
|
(in millions)
|
March 31, 2019
|
December 31, 2018
|
|||||
|
Parent Company:
|
|||||||
|
2.375% fixed-rate senior unsecured debt, due July 2021
|
|
$349
|
|
|
$349
|
|
|
|
4.150% fixed-rate subordinated debt, due September 2022
|
348
|
|
348
|
|
|||
|
3.750% fixed-rate subordinated debt, due July 2024
|
250
|
|
250
|
|
|||
|
4.023% fixed-rate subordinated debt, due October 2024
|
42
|
|
42
|
|
|||
|
4.350% fixed-rate subordinated debt, due August 2025
|
249
|
|
249
|
|
|||
|
4.300% fixed-rate subordinated debt, due December 2025
|
750
|
|
749
|
|
|||
|
Banking and Other Subsidiaries:
|
|||||||
|
2.500% senior unsecured notes, due March 2019
(1)
|
—
|
|
748
|
|
|||
|
2.450% senior unsecured notes, due December 2019
(1)
|
745
|
|
744
|
|
|||
|
2.250% senior unsecured notes, due March 2020
(1)
|
694
|
|
691
|
|
|||
|
3.155% floating-rate senior unsecured notes, due March 2020
(1) (2)
|
300
|
|
300
|
|
|||
|
3.216% floating-rate senior unsecured notes, due May 2020
(1) (2)
|
250
|
|
250
|
|
|||
|
2.200% senior unsecured notes, due May 2020
(1)
|
499
|
|
499
|
|
|||
|
2.250% senior unsecured notes, due October 2020
(1)
|
742
|
|
738
|
|
|||
|
2.550% senior unsecured notes, due May 2021
(1)
|
973
|
|
964
|
|
|||
|
3.250% senior unsecured notes, due February 2022
(1)
|
702
|
|
—
|
|
|||
|
3.413% floating-rate senior unsecured notes, due February 2022
(1) (2)
|
299
|
|
—
|
|
|||
|
3.456% floating-rate senior unsecured notes, due May 2022
(1) (2)
|
249
|
|
249
|
|
|||
|
2.650% senior unsecured notes, due May 2022
(1)
|
492
|
|
487
|
|
|||
|
3.700% senior unsecured notes, due March 2023
(1)
|
508
|
|
502
|
|
|||
|
3.551% floating-rate senior unsecured notes, due March 2023
(1) (2)
|
249
|
|
249
|
|
|||
|
3.750% senior unsecured notes, due February 2026
(1)
|
506
|
|
—
|
|
|||
|
Federal Home Loan Bank advances, 2.787% weighted average rate, due through 2038
|
2,508
|
|
7,508
|
|
|||
|
Other
|
21
|
|
9
|
|
|||
|
Total long-term borrowed funds
|
|
$11,725
|
|
|
$15,925
|
|
|
(1)
Issued under CBNA’s Global Bank Note Program.
(2)
Rate disclosed reflects the floating rate as of
March 31, 2019
.
The Parent Company’s long-term borrowed funds as of
March 31, 2019
and
December 31, 2018
included principal balances of
$2.0 billion
for each period, respectively, and unamortized deferred issuance costs and/or discounts of
($4) million
and
($5) million
, respectively. The banking and other subsidiaries’ long-term borrowed funds as of
March 31, 2019
and
December 31, 2018
included principal balances of
$9.8 billion
and
$14.0 billion
, respectively, with unamortized deferred issuance costs and/or discounts of
($18) million
and
($14) million
, respectively, and hedging basis adjustments of
($23) million
and
($66) million
, respectively. See
Note 9 "Derivatives"
for further information about the Company’s hedging of certain long-term borrowed funds.
Advances, lines of credit, and letters of credit from the FHLB are collateralized by pledged mortgages and pledged securities at least sufficient to satisfy the collateral maintenance level established by the FHLB. The utilized borrowing capacity for FHLB advances and letters of credit was
$7.7 billion
and
$13.0 billion
at
March 31, 2019
and
December 31, 2018
, respectively. The Company’s available FHLB borrowing capacity was
$8.4 billion
and
$4.8 billion
at
March 31, 2019
and
December 31, 2018
, respectively. Citizens can also borrow from the FRB discount window to meet short-term liquidity requirements. Collateral, including certain loans, is pledged to support this borrowing capacity. At
March 31, 2019
, the Company’s unused secured borrowing capacity was approximately
$42.5 billion
, which includes unencumbered securities, FHLB borrowing capacity, and FRB discount window capacity.
76
CITIZENS FINANCIAL GROUP, INC.
NOTES TO CONSOLIDATED FINANCIAL STATEMENTS (UNAUDITED)
A summary of maturities for the Company’s long-term borrowed funds at
March 31, 2019
is presented below:
|
(in millions)
|
Parent Company
|
Banking and Other Subsidiaries
|
Consolidated
|
|
|||||
|
Year
|
|||||||||
|
2019
|
|
$—
|
|
|
$748
|
|
|
$748
|
|
|
2020
|
—
|
|
4,989
|
|
4,989
|
|
|||
|
2021
|
349
|
|
978
|
|
1,327
|
|
|||
|
2022
|
348
|
|
1,749
|
|
2,097
|
|
|||
|
2023
|
—
|
|
759
|
|
759
|
|
|||
|
2024 and thereafter
|
1,291
|
|
514
|
|
1,805
|
|
|||
|
Total
|
|
$1,988
|
|
|
$9,737
|
|
|
$11,725
|
|
NOTE 9 - DERIVATIVES
In the normal course of business, Citizens enters into a variety of derivative transactions in order to meet the financing needs of its customers and to reduce its own exposure to fluctuations in interest rates and foreign currency exchange rates. These transactions include interest rate swap contracts, interest rate options, foreign exchange contracts, residential loan commitment rate locks, interest rate future contracts, swaptions, forward commitments to sell to-be-announced mortgage securities (“TBAs”), forward sale contracts and purchase options. The Company monitors the results of each transaction to ensure that management’s intent is satisfied. The Company does not use derivatives for speculative purposes.
The Company’s derivative instruments are recognized on the Consolidated Balance Sheets at fair value. Information regarding the valuation methodology and inputs used to estimate the fair value of the Company’s derivative instruments is described in
Note 13 "Fair Value Measurements."
The following table presents derivative instruments included on the Consolidated Balance Sheets in derivative assets and derivative liabilities:
|
March 31, 2019
|
December 31, 2018
|
||||||||||||||||||
|
(in millions)
|
Notional Amount
(1)
|
Derivative Assets
|
Derivative Liabilities
|
Notional Amount
(1)
|
Derivative Assets
|
Derivative Liabilities
|
|||||||||||||
|
Derivatives designated as hedging instruments:
|
|||||||||||||||||||
|
Interest rate contracts
|
|
$14,500
|
|
|
$—
|
|
|
$15
|
|
|
$12,050
|
|
|
$5
|
|
|
$—
|
|
|
|
Derivatives not designated as hedging instruments:
|
|||||||||||||||||||
|
Interest rate contracts
|
126,525
|
|
443
|
|
145
|
|
117,076
|
|
301
|
|
277
|
|
|||||||
|
Foreign exchange contracts
|
11,858
|
|
135
|
|
113
|
|
9,866
|
|
129
|
|
113
|
|
|||||||
|
Other contracts
|
5,221
|
|
19
|
|
21
|
|
3,555
|
|
14
|
|
25
|
|
|||||||
|
Total derivatives not designated as hedging instruments
|
597
|
|
279
|
|
444
|
|
415
|
|
|||||||||||
|
Gross derivative fair values
|
597
|
|
294
|
|
449
|
|
415
|
|
|||||||||||
|
Less: Gross amounts offset in the Consolidated Balance Sheets
(2)
|
(78
|
)
|
(78
|
)
|
(87
|
)
|
(87
|
)
|
|||||||||||
|
Less: Cash collateral applied
(2)
|
(54
|
)
|
(43
|
)
|
(45
|
)
|
(36
|
)
|
|||||||||||
|
Total net derivative fair values presented in the Consolidated Balance Sheets
|
|
$465
|
|
|
$173
|
|
|
$317
|
|
|
$292
|
|
|||||||
(1)
The notional or contractual amount of interest rate derivatives and foreign exchange contracts is the amount upon which interest and other payments under the contract are based. For interest rate contracts, the notional amount is typically not exchanged. Therefore, notional amounts should not be taken as the measure of credit or market risk, as they do not measure the true economic risk of these contracts.
(2)
Amounts represent the impact of enforceable master netting agreements that allow the Company to net settle positive and negative positions.
The Company’s derivative transactions are internally divided into three sub-groups: institutional, customer and residential loan. Citizens has certain derivative transactions which are designated as fair value or cash flow hedges, described as follows:
Derivatives Designated As Hedging Instruments
The Company’s institutional derivatives portfolio qualifies for hedge accounting treatment. This includes interest rate swaps that are designated as highly effective fair value and cash flow hedging relationships. The Company formally documents at inception all hedging relationships, as well as risk management objectives and
77
CITIZENS FINANCIAL GROUP, INC.
NOTES TO CONSOLIDATED FINANCIAL STATEMENTS (UNAUDITED)
strategies for undertaking various accounting hedges. Additionally, Citizens monitors the effectiveness of its hedge relationships during the duration of the hedge relationship. The methods utilized to assess hedge effectiveness vary based on the type of item being hedged. The Company discontinues hedge accounting treatment when it is determined that a derivative is not expected to be, or has ceased to be, effective as a hedge and then reflects changes in fair value in earnings after termination of the hedge relationship.
Fair Value Hedges
Citizens has outstanding interest rate swap agreements to manage the interest rate exposure on its medium-term borrowings. The changes in the fair value of the derivative instrument and changes in the fair value of the hedged asset or liability attributable to the hedged risk are recorded in the same income statement line in the Consolidated Statements of Operations.
The following table reflects the change in fair value of interest rate contracts, designated as fair value hedges, as well as the change in fair value of the related hedged items attributable to the risk being hedged, included in the Consolidated Statements of Operations:
|
Three Months Ended March 31,
|
||||||||
|
(in millions)
|
2019
|
|
2018
|
|
Affected Line Item in the Consolidated Statements of Operations
|
|||
|
Change in fair value of interest rate swaps hedging borrowed funds
|
|
$39
|
|
|
($39
|
)
|
Interest expense - borrowed funds
|
|
|
Change in fair value of hedged long-term debt attributable to the risk being hedged
|
(39
|
)
|
37
|
|
Interest expense - borrowed funds
|
|||
The following table reflects amounts recorded on the Consolidated Balance Sheets related to cumulative basis adjustments for fair value hedges:
|
March 31, 2019
|
|||
|
(in millions)
|
Long-term borrowed funds
|
||
|
Carrying amount of the hedged liabilities
|
|
$5,362
|
|
|
Cumulative amount of fair value hedging adjustments included in the carrying amount of the hedged items
(1)
|
(23
|
)
|
|
(1)
The balance reported includes
($4) million
of cumulative hedging adjustments recorded on discontinued fair value hedging relationships.
Cash Flow Hedges
Citizens has outstanding interest rate swap agreements designed to hedge a portion of the Company’s floating rate assets. All of these swaps have been deemed as highly effective cash flow hedges. The entire change in the fair value of the interest rate swap included in the assessment of hedge effectiveness is recorded in OCI and reclassified from OCI to current period earnings (interest income or interest expense) in the same period that the hedged item affects earnings. During the next 12 months, there are
$12 million
in pre-tax net losses on derivative instruments included in OCI expected to be reclassified to net interest income in the Consolidated Statements of Operations. This amount could differ from amounts actually recognized due to changes in interest rates, hedge de-designations, and the addition of other hedges subsequent to
March 31, 2019
.
During the
three months ended March 31, 2019
and
2018
, there were no gains or losses reclassified from OCI to current period earnings (other income) associated with the discontinuance of the Company’s cash flow hedges because it was probable that the original forecasted transaction would no longer occur by the end of the originally specified time period.
78
CITIZENS FINANCIAL GROUP, INC.
NOTES TO CONSOLIDATED FINANCIAL STATEMENTS (UNAUDITED)
The following table presents the pretax net gains (losses) recorded in the Consolidated Statements of Operations and in the Consolidated Statements of Comprehensive Income relating to derivative instruments designated as cash flow hedges:
|
Three Months Ended March 31,
|
|||||||
|
(in millions)
|
2019
|
2018
(1)
|
|||||
|
Amount of pretax net gains (losses) recognized in OCI
|
|
$51
|
|
|
($70
|
)
|
|
|
Amount of pretax net losses reclassified from OCI into interest income
|
(20
|
)
|
(6
|
)
|
|||
|
Amount of pretax net gains reclassified from OCI into interest expense
|
—
|
|
4
|
|
|||
(1)
For the three months ended
March 31, 2018
, the amount of pretax net losses recognized in OCI represented the effective portion of the cumulative gains or losses on cash flow hedges and ineffectiveness was reported within noninterest income.
Derivatives Not Designated As Hedging Instruments
Economic Hedges
The Company’s customer derivatives are recorded on the Consolidated Balance Sheets at fair value. These include interest rate and foreign exchange derivative contracts that are designed to meet the hedging and financing needs of the Company’s customers. The mark-to-market gains and losses associated with the customer derivatives are mitigated by mark-to-market gains and losses on interest rate and foreign exchange derivative contracts transacted. Citizens also purchases interest rate floors primarily to hedge the exposure related to customer deposit products that have embedded minimum interest rate guarantees. Citizens utilizes interest rate floors in non-qualifying hedging relationships.
The Company’s residential loan derivatives (including residential loan commitments and forward sales contracts) are recorded on the Consolidated Balance Sheets at fair value. Citizens also uses derivatives to hedge the risk of changes in the fair value of its residential MSR portfolio measured at fair value. Certain residential MSRs are accounted for at fair value with changes in the fair value influenced primarily by changes in interest rates. Derivatives used to hedge the fair value of residential MSRs include TBAs, interest rate swaptions, interest rate futures and interest rate swaps.
The following table presents the effect of economic hedges on noninterest income:
|
Amounts Recognized in
Noninterest Income for the
|
||||||||
|
Three Months Ended March 31,
|
Affected Line Item in the Consolidated Statements of Operations
|
|||||||
|
(in millions)
|
2019
|
|
2018
|
|
||||
|
Economic hedge type:
|
||||||||
|
Customer interest rate contracts
|
|
$229
|
|
|
($204
|
)
|
Foreign exchange and interest rate products
|
|
|
Customer foreign exchange contracts
|
(34
|
)
|
11
|
|
Foreign exchange and interest rate products
|
|||
|
Derivatives transactions to hedge interest rate risk
|
(217
|
)
|
216
|
|
Foreign exchange and interest rate products
|
|||
|
Derivatives transactions to hedge foreign exchange risk
|
40
|
|
(17
|
)
|
Foreign exchange and interest rate products
|
|||
|
Residential loan commitments
|
5
|
|
(1
|
)
|
Mortgage banking fees
|
|||
|
Forward sale contracts
|
4
|
|
—
|
|
Mortgage banking fees
|
|||
|
Interest rate derivative contracts used to hedge residential MSRs
|
45
|
|
—
|
|
Mortgage banking fees
|
|||
|
Total
|
|
$72
|
|
|
$5
|
|
||
79
CITIZENS FINANCIAL GROUP, INC.
NOTES TO CONSOLIDATED FINANCIAL STATEMENTS (UNAUDITED)
NOTE 10 - RECLASSIFICATIONS OUT OF ACCUMULATED OTHER COMPREHENSIVE INCOME (LOSS)
The following tables present the changes in the balances, net of income taxes, of each component of AOCI:
|
As of and for the Three Months Ended March 31,
|
||||||||||||||||
|
(in millions)
|
Net Unrealized (Losses) Gains on Derivatives
|
Net Unrealized (Losses) Gains on Debt Securities
|
Employee Benefit Plans
|
Total AOCI
|
|
|||||||||||
|
Balance at January 1, 2018
|
|
($143
|
)
|
|
($236
|
)
|
|
($441
|
)
|
|
($820
|
)
|
||||
|
Other comprehensive loss before reclassifications
|
(52
|
)
|
(272
|
)
|
—
|
|
(324
|
)
|
||||||||
|
Other-than-temporary impairment not recognized in earnings on debt securities
|
—
|
|
(1
|
)
|
—
|
|
(1
|
)
|
||||||||
|
Amounts reclassified to the Consolidated Statements of Operations
|
2
|
|
(5
|
)
|
3
|
|
—
|
|
||||||||
|
Net other comprehensive (loss) income
|
(50
|
)
|
(278
|
)
|
3
|
|
(325
|
)
|
||||||||
|
Balance at March 31, 2018
|
|
($193
|
)
|
|
($514
|
)
|
|
($438
|
)
|
|
($1,145
|
)
|
||||
|
Balance at January 1, 2019
|
|
($143
|
)
|
|
($490
|
)
|
|
($463
|
)
|
|
($1,096
|
)
|
||||
|
Other comprehensive income before reclassifications
|
39
|
|
246
|
|
—
|
|
285
|
|
||||||||
|
Other-than-temporary impairment not recognized in earnings on debt securities
|
—
|
|
—
|
|
—
|
|
—
|
|
||||||||
|
Amounts reclassified to the Consolidated Statements of Operations
|
15
|
|
(5
|
)
|
3
|
|
13
|
|
||||||||
|
Cumulative effect of change in accounting standards
|
—
|
|
5
|
|
—
|
|
5
|
|
||||||||
|
Net other comprehensive income
|
54
|
|
246
|
|
3
|
|
303
|
|
||||||||
|
Balance at March 31, 2019
|
|
($89
|
)
|
|
($244
|
)
|
|
($460
|
)
|
|
($793
|
)
|
||||
The following table presents the amounts reclassified out of each component of AOCI and into the Consolidated Statements of Operations:
|
Three Months Ended March 31,
|
||||||||
|
(in millions)
|
2019
|
|
2018
|
|
||||
|
Details about AOCI Components
|
Affected Line Item in the Consolidated Statements of Operations
|
|||||||
|
Reclassification adjustment for net derivative losses included in net income:
|
|
($20
|
)
|
|
($6
|
)
|
Interest income
|
|
|
—
|
|
4
|
|
Interest expense
|
||||
|
(20
|
)
|
(2
|
)
|
Income before income tax expense
|
||||
|
(5
|
)
|
—
|
|
Income tax expense
|
||||
|
|
($15
|
)
|
|
($2
|
)
|
Net income
|
||
|
Reclassification of net debt securities gains to net income:
|
|
$8
|
|
|
$8
|
|
Securities gains, net
|
|
|
(1
|
)
|
(1
|
)
|
Net debt securities impairment losses recognized in earnings
|
||||
|
7
|
|
7
|
|
Income before income tax expense
|
||||
|
2
|
|
2
|
|
Income tax expense
|
||||
|
|
$5
|
|
|
$5
|
|
Net income
|
||
|
Reclassification of changes related to the employee benefit plan:
|
|
($5
|
)
|
|
($4
|
)
|
Other operating expense
|
|
|
(5
|
)
|
(4
|
)
|
Income before income tax expense
|
||||
|
(2
|
)
|
(1
|
)
|
Income tax expense
|
||||
|
|
($3
|
)
|
|
($3
|
)
|
Net income
|
||
|
Total reclassification (losses) gains
|
|
($13
|
)
|
|
$—
|
|
Net income
|
|
80
CITIZENS FINANCIAL GROUP, INC.
NOTES TO CONSOLIDATED FINANCIAL STATEMENTS (UNAUDITED)
The following table presents the effects on net income of the amounts reclassified out of AOCI:
|
Three Months Ended March 31,
|
|||||||
|
(in millions)
|
2019
|
|
2018
|
|
|||
|
Net interest income (includes ($20) and ($2) of AOCI reclassifications, respectively)
|
|
$1,160
|
|
|
$1,091
|
|
|
|
Provision for credit losses
|
85
|
|
78
|
|
|||
|
Noninterest income (includes $7 and $7 of AOCI reclassifications, respectively)
|
428
|
|
371
|
|
|||
|
Noninterest expense (includes $5 and $4 of AOCI reclassifications, respectively)
|
937
|
|
883
|
|
|||
|
Income before income tax expense
|
566
|
|
501
|
|
|||
|
Income tax expense (includes ($5) and $1 income tax net expense from reclassification items, respectively)
|
127
|
|
113
|
|
|||
|
Net income
|
|
$439
|
|
|
$388
|
|
|
NOTE 11 - STOCKHOLDERS’ EQUITY
Preferred Stock
The following table provides the number of authorized preferred shares, the number of issued and outstanding, the liquidation value per share and the carrying amount:
|
March 31, 2019
|
December 31, 2018
|
|||||||||||||
|
(in millions, except per share and share data)
|
Liquidation value per share
|
Preferred Shares
|
Carrying Amount
|
Preferred Shares
|
Carrying Amount
|
|||||||||
|
Authorized ($25 par value)
|
100,000,000
|
|
100,000,000
|
|
||||||||||
|
Issued and outstanding:
|
||||||||||||||
|
Series A
|
$1,000
|
250,000
|
|
$247
|
250,000
|
|
$247
|
|||||||
|
Series B
|
1,000
|
|
300,000
|
296
|
|
300,000
|
|
296
|
|
|||||
|
Series C
|
1,000
|
|
300,000
|
|
297
|
|
300,000
|
|
297
|
|
||||
|
Series D
|
1,000
|
|
(1)
|
300,000
|
|
(2)
|
292
|
|
—
|
|
—
|
|
||
|
Total
|
1,150,000
|
|
$1,132
|
850,000
|
|
$840
|
||||||||
(1)
Equivalent to
$25
per depositary share.
(2)
Represented by
12,000,000
depositary shares each representing a 1/40th interest in the Series D Preferred Stock.
The following table provides information related to the Company’s preferred stock outstanding as of
March 31, 2019
:
|
(in millions, except share data)
|
|||||
|
Preferred Stock
(1)
|
Issue Date
|
Number of Shares Outstanding
|
Dividend Dates
(2)
|
Annual Per Share Dividend Rate
|
Optional Redemption Date
(3)
|
|
Series A
|
April 6, 2015
|
250,000
|
Semi-annually beginning October 6, 2015 until April 6, 2020
|
5.500% until April 6, 2020
|
April 6, 2020
|
|
Quarterly beginning July 6, 2020
|
3 Mo. LIBOR plus 3.960% beginning April 6, 2020
|
||||
|
Series B
|
May 24, 2018
|
300,000
|
Semi-annually beginning January 6, 2019 until July 6, 2023
|
6.000% until July 6, 2023
|
July 6, 2023
|
|
Quarterly beginning October 6, 2023
|
3 Mo. LIBOR plus 3.003% beginning July 6, 2023
|
||||
|
Series C
|
October 25, 2018
|
300,000
|
Quarterly beginning January 6, 2019 until April 6, 2024
|
6.375% until April 6, 2024
|
April 6, 2024
|
|
Quarterly beginning July 6, 2024
|
3 Mo. LIBOR plus 3.157% beginning April 6, 2024
|
||||
|
Series D
|
January 29, 2019
|
300,000
(4)
|
Quarterly beginning April 6, 2019 until April 6, 2024
|
6.350% until April 6, 2024
|
April 6, 2024
|
|
Quarterly beginning July 6, 2024
|
3 Mo. LIBOR plus 3.642% beginning April 6, 2024
|
||||
(1)
All outstanding series are non-cumulative fixed-to-floating rate perpetual preferred stock. Except in limited circumstances, the preferred stock does not have voting rights.
(2)
Dividends are payable when, and if, declared by the Company’s Board of Directors or an authorized committee thereof.
(3)
Redeemable at the Company’s option, in whole or in part, on any dividend payment date on or after the date stated, or in whole but not in part, at any time within
90
days following a regulatory capital treatment event a as defined in the applicable certificate of designations, in each case at a redemption price equal to
$1,000
per share (equivalent to
$25
per depositary share for the Series D Preferred Stock), plus any declared and unpaid dividends, without accumulation of any undeclared dividends. Under current rules, any redemption is subject to approval by the FRB.
(4)
Represented by
12,000,000
depositary shares each representing a 1/40th interest in the Series D Preferred Stock.
81
CITIZENS FINANCIAL GROUP, INC.
NOTES TO CONSOLIDATED FINANCIAL STATEMENTS (UNAUDITED)
Dividends
The following table provides information related to dividends per share and in the aggregate, declared and paid, for each type of stock issued and outstanding:
|
Three Months Ended March 31, 2019
|
Three Months Ended March 31, 2018
|
|||||||||||||||||||
|
(in millions, except per share data)
|
Dividends Declared per Share
|
Dividends Declared
|
Dividends Paid
|
Dividends Declared per Share
|
Dividends Declared
|
Dividends Paid
|
||||||||||||||
|
Common stock
|
|
$0.32
|
|
|
$149
|
|
|
$149
|
|
|
$0.22
|
|
|
$108
|
|
|
$108
|
|
||
|
Preferred stock
|
||||||||||||||||||||
|
Series A
|
|
$27.50
|
|
|
$7
|
|
|
$—
|
|
|
$27.50
|
|
|
$7
|
|
|
$—
|
|
||
|
Series B
|
—
|
|
—
|
|
11
|
|
—
|
|
—
|
|
—
|
|
||||||||
|
Series C
|
15.94
|
|
5
|
|
4
|
|
—
|
|
—
|
|
—
|
|
||||||||
|
Series D
|
11.82
|
|
3
|
|
—
|
|
—
|
|
—
|
|
—
|
|
||||||||
|
Total preferred stock
|
|
$15
|
|
|
$15
|
|
|
$7
|
|
|
$—
|
|
||||||||
Treasury Stock
During the three months ended
March 31, 2019
, the Company repurchased
$200 million
, or
5,823,891
shares, of its outstanding common stock. The repurchased shares are held in treasury stock.
NOTE 12 - COMMITMENTS AND CONTINGENCIES
A summary of outstanding off-balance sheet arrangements is presented below. For more information on these arrangements, see Note 18 “Commitments and Contingencies” to the Company’s audited Consolidated Financial Statements in the Annual Report on Form 10-K for the year ended December 31, 2018.
|
(in millions)
|
March 31, 2019
|
December 31, 2018
|
|||||
|
Commitments to extend credit
|
|
$68,564
|
|
|
$69,553
|
|
|
|
Letters of credit
|
2,089
|
|
2,125
|
|
|||
|
Marketing rights
|
37
|
|
37
|
|
|||
|
Risk participation agreements
|
27
|
|
19
|
|
|||
|
Loans sold with recourse
|
22
|
|
5
|
|
|||
|
Total
|
|
$70,739
|
|
|
$71,739
|
|
|
Commitments to Extend Credit
Commitments to extend credit are agreements to lend to customers in accordance with conditions contractually agreed upon in advance. Generally, the commitments have fixed expiration dates or termination clauses and may require payment of a fee. Since many of these commitments are expected to expire without being drawn upon, the contract amounts are not necessarily indicative of future cash requirements.
In first quarter 2019, the Company entered into an agreement to purchase education loans on a quarterly basis beginning with first quarter 2019 and ending with fourth quarter 2019. The total minimum and maximum amount of the aggregate purchase principal balance of loans under the terms of the agreement are
$600 million
and
$1.0 billion
, respectively, and the remaining maximum purchase commitment is
$799 million
as of
March 31, 2019
.
The Company’s commercial loan trading desk provides ongoing secondary market support and liquidity to its clients. Unsettled loan trades (i.e., loan purchase contracts) represent firm commitments to purchase loans from a third party at an agreed-upon price. Principal amounts associated with unsettled commercial loan trades are off-balance sheet commitments until delivery of the loans has taken place. The principal balances of unsettled commercial loan trade purchases and sales were
$166 million
and
$234 million
, respectively, at
March 31, 2019
and $
68 million
and
$161 million
, respectively, at
December 31, 2018
.
Letters of Credit
Letters of credit in the table above reflect commercial, standby financial and standby performance letters of credit. Standby letters of credit, both financial and performance, are issued by the Company for its customers. They are used as conditional guarantees of payment to a third party in the event the customer either fails to make
82
CITIZENS FINANCIAL GROUP, INC.
NOTES TO CONSOLIDATED FINANCIAL STATEMENTS (UNAUDITED)
specific payments (financial) or fails to complete a specific project (performance). The Company’s exposure to credit loss in the event of counterparty nonperformance in connection with the above instruments is represented by the contractual amount of those instruments, net of the value of collateral held. Generally, letters of credit are collateralized by cash, accounts receivable, inventory or investment securities. Credit risk associated with letters of credit is considered in determining the appropriate amounts of reserves for unfunded commitments. Standby letters of credit and commercial letters of credit are issued for terms of up to
ten years
and
one year
, respectively.
Other Commitments
Citizens has additional off-balance sheet arrangements that are summarized below.
|
•
|
Marketing Rights - During 2003, Citizens entered into a
25
-year agreement to acquire the naming and marketing rights of a baseball stadium in Pennsylvania.
|
|
•
|
Loans sold with recourse - Citizens is an originator and servicer of residential mortgages and routinely sells such mortgage loans in the secondary market and to GSEs. In the context of such sales, the Company makes certain representations and warranties regarding the characteristics of the underlying loans and, as a result, may be contractually required to repurchase such loans or indemnify certain parties against losses for certain breaches of those representations and warranties. The Company also sells the government guaranteed portion of certain SBA loans to outside investors, for which it retains the servicing rights.
|
|
•
|
Risk Participation Agreements - RPAs are guarantees issued by the Company to other parties for a fee, whereby the Company agrees to participate in the credit risk of a derivative customer of the other party. The current amount of credit exposure is spread out over
86
counterparties. RPAs generally have terms ranging from
one
to
five
years; however, certain outstanding agreements have terms as long as
nine
years.
|
Contingencies
The Company operates in a legal and regulatory environment that exposes it to potentially significant risks. A certain amount of litigation ordinarily results from the nature of the Company’s banking and other businesses. The Company is a party to legal proceedings, including class actions. The Company is also the subject of investigations, reviews, subpoenas, and regulatory matters arising out of its normal business operations, which, in some instances, relate to concerns about fair lending, unfair and/or deceptive practices, mortgage-related issues, and mis-selling of certain products. In addition, the Company engages in discussions with relevant governmental and regulatory authorities on a regular and ongoing basis regarding various issues, and any issues discussed or identified may result in investigatory or other action being taken. Litigation and regulatory matters may result in settlements, damages, fines, penalties, public or private censure, increased costs, required remediation, restrictions on business activities, or other impacts on the Company.
In these disputes and proceedings, the Company contests liability and the amount of damages as appropriate. Given their complex nature, and based on the Company's experience, it may be years before some of these matters are finally resolved. Moreover, before liability can be reasonably estimated for a claim, numerous legal and factual issues may need to be examined, including through potentially lengthy discovery and determination of important factual matters, and by addressing novel or unsettled legal issues relevant to the proceedings in question.
The Company cannot predict with certainty if, how, or when such claims will be resolved or what the eventual settlement, fine, penalty or other relief, if any, may be, particularly for claims that are at an early stage in their development or where claimants seek substantial or indeterminate damages. The Company recognizes a provision for a claim when, in the opinion of management after seeking legal advice, it is probable that a liability exists and the amount of loss can be reasonably estimated. In many proceedings, however, it is not possible to determine whether any loss is probable or to estimate the amount of any loss.
Based on information currently available, the advice of legal counsel and other advisers, and established reserves, management believes that the aggregate liabilities, if any, potentially arising from these proceedings will not have a materially adverse effect on the Company’s unaudited interim Consolidated Financial Statements.
NOTE 13 - FAIR VALUE MEASUREMENTS
As discussed in Note 19 “Fair Value Measurements,” to the Company’s audited Consolidated Financial Statements in the Annual Report on Form 10-K for the year ended December 31, 2018, Citizens measures or monitors many of its assets and liabilities on a fair value basis. Fair value is used on a recurring basis for assets and liabilities for which fair value is the required or elected measurement basis of accounting. Additionally, fair value is used on a nonrecurring basis to evaluate assets for impairment or for disclosure purposes. Nonrecurring fair value adjustments typically involve the application of lower of cost or market accounting or write-downs of individual assets. Citizens
83
CITIZENS FINANCIAL GROUP, INC.
NOTES TO CONSOLIDATED FINANCIAL STATEMENTS (UNAUDITED)
also applies the fair value measurement guidance to determine amounts reported for certain disclosures in this Note for assets and liabilities that are not required to be reported at fair value in the financial statements.
Citizens elected to account for residential mortgage LHFS and certain commercial and commercial real estate LHFS at fair value. Applying fair value accounting to the residential mortgage LHFS better aligns the reported results of the economic changes in the value of these loans and their related economic hedge instruments. Certain commercial and commercial real estate held for sale loans are managed by a commercial secondary loan desk that provides liquidity to banks, finance companies and institutional investors. Applying fair value accounting to this portfolio is appropriate because the Company holds these loans with the intent to sell within the near-term.
Fair Value Option
Residential Mortgage Loans Held for Sale
The fair value of residential mortgage LHFS is derived from observable mortgage security prices and includes adjustments for loan servicing value, agency guarantee fees, and other loan level attributes which are mostly observable in the marketplace. Credit risk does not significantly impact the valuation since these loans are sold shortly after origination. Therefore, the Company classifies the residential mortgage LHFS in Level 2 of the fair value hierarchy.
The election of the fair value option for financial assets and financial liabilities is optional and irrevocable. The residential mortgage loans accounted for under the fair value option are initially measured at fair value (i.e., acquisition cost) when the financial asset is acquired. Subsequent changes in fair value are recognized in mortgage banking fees on the Consolidated Statements of Operations. The Company recognized changes in fair value in mortgage banking income of
($1) million
and
($3) million
for the three months ended
March 31, 2019
and
2018
, respectively.
Interest income on residential mortgage LHFS is calculated based on the contractual interest rate of the loan and is recorded in interest income.
Commercial and Commercial Real Estate Loans Held for Sale
The fair value of commercial and commercial real estate LHFS is estimated using observable prices of similar loans that transact in the marketplace. In addition, Citizens uses external pricing services that provide estimates of fair values based on quotes from various dealers transacting in the market, sector curves or benchmarking techniques. Therefore, the Company classifies the commercial and commercial real estate loans managed by the commercial secondary loan desk in Level 2 of the fair value hierarchy given the observable market inputs.
There were
no
loans in this portfolio that were 90 days or more past due or nonaccruing as of
March 31, 2019
and
December 31, 2018
. The loans accounted for under the fair value option are initially measured at fair value when the financial asset is recognized. Subsequent changes in fair value are recognized in other noninterest income on the Consolidated Statements of Operations. Since all loans in the Company’s commercial trading portfolio consist of floating rate obligations, all changes in fair value are due to changes in credit risk. Such credit-related fair value changes may include observed changes in overall credit spreads and/or changes to the creditworthiness of an individual borrower. Unsettled trades within the commercial trading portfolio are not recognized on the Consolidated Balance Sheets and represent off-balance sheet commitments. Refer to
Note 12 "Commitments and Contingencies"
for further information.
Interest income on commercial and commercial real estate LHFS is calculated based on the contractual interest rate of the loan and is recorded in interest income. Citizens recognized
$3 million
in other noninterest income related to its commercial trading portfolio for the three months ended
March 31, 2019
and
$1 million
for the three months ended
March 31, 2018
.
84
CITIZENS FINANCIAL GROUP, INC.
NOTES TO CONSOLIDATED FINANCIAL STATEMENTS (UNAUDITED)
The following table presents the difference between the aggregate fair value and the aggregate unpaid principal balance of LHFS measured at fair value:
|
March 31, 2019
|
December 31, 2018
|
||||||||||||||||||
|
(in millions)
|
Aggregate Fair Value
|
Aggregate Unpaid Principal
|
Aggregate Fair Value Less Aggregate Unpaid Principal
|
Aggregate Fair Value
|
Aggregate Unpaid Principal
|
Aggregate Fair Value Less Aggregate Unpaid Principal
|
|||||||||||||
|
Residential mortgage loans held for sale, at fair value
|
|
$1,009
|
|
|
$1,009
|
|
|
$—
|
|
|
$967
|
|
|
$967
|
|
|
$—
|
|
|
|
Commercial and commercial real estate loans held for sale, at fair value
|
177
|
|
177
|
|
—
|
|
252
|
|
252
|
|
—
|
|
|||||||
Recurring Fair Value Measurements
Citizens utilizes a variety of valuation techniques to measure its assets and liabilities at fair value. The valuation methodologies used for significant assets and liabilities carried on the balance sheet at fair value on a recurring basis are presented below:
Debt Securities Available for Sale
The fair value of debt securities classified as AFS is based upon quoted prices, if available. Where observable quoted prices are available in an active market, the security is classified as Level 1 in the fair value hierarchy. Classes of instruments that are valued using this market approach include debt securities issued by the U.S. Treasury. If quoted market prices are not available, the fair value for the security is estimated under the market or income approach using pricing models. These instruments are classified as Level 2 because the inputs to the valuations are observable. The pricing models used to value securities generally begin with observable market prices (or rates) for similar instruments and make adjustments based on the characteristics of the instrument being valued. These adjustments reflect assumptions made regarding the sensitivity of each security’s value to changes in interest rates and prepayment speeds. Classes of instruments that are valued using this market approach include specified pool mortgage “pass-through” securities and other debt securities issued by U.S. GSEs and state and political subdivisions. The pricing models used to value securities under the income approach generally begin with the contractual cash flows of each security and make adjustments based on forecasted prepayment speeds, default rates, and other market-observable information. The adjusted cash flows are then discounted at a rate derived from observed rates of return for comparable assets or liabilities that are traded in the market. Classes of instruments that are valued using this market approach include residential and commercial CMOs.
A significant majority of the Company’s Level 1 and 2 debt securities are priced using an external pricing service. Citizens verifies the accuracy of the pricing provided by its primary outside pricing service on a quarterly basis. This process involves using a secondary external vendor to provide valuations for the Company’s securities portfolio for comparison purposes. Any valuation discrepancies beyond established thresholds are researched and, if necessary, corroborated by an independent outside broker.
In certain cases where there is limited activity or less transparency around inputs to the valuation model, securities are classified as Level 3. There are no AFS securities valued using significant Level 3 inputs at
March 31, 2019
.
Residential Loans Held for Sale
See the “Fair Value Option, Residential Mortgage Loans Held for Sale” discussion above.
Commercial Loans Held for Sale
See the “Fair Value Option, Commercial and Commercial Real Estate Loans Held for Sale” discussion above.
Mortgage Servicing Rights - Fair Value Method
MSRs do not trade in an active market with readily observable prices. MSRs are classified as Level 3 since the valuation methodology utilizes significant unobservable inputs. The fair value was calculated using a discounted cash flow model which used assumptions, including weighted-average life, prepayment assumptions and weighted-average option adjusted spread. The underlying assumptions and estimated values are corroborated by values received from independent third parties based on their review of the servicing portfolio, and comparisons to market
85
CITIZENS FINANCIAL GROUP, INC.
NOTES TO CONSOLIDATED FINANCIAL STATEMENTS (UNAUDITED)
transactions. In addition, the MSR Policy is approved by the Asset Liability Committee. Refer to
Note 5 "Mortgage Banking"
for more information.
Derivatives
The vast majority of the Company’s derivatives portfolio is composed of “plain vanilla” interest rate swaps, which are traded in over-the-counter markets where quoted market prices are not readily available. For these interest rate derivatives, fair value is determined utilizing models that primarily use market observable inputs, such as swap rates and yield curves. The pricing models used to value interest rate swaps calculate the sum of each instrument’s fixed and variable cash flows, which are then discounted using an appropriate yield curve (i.e., LIBOR or Overnight Index Swap curve) to arrive at the fair value of each swap. The pricing models do not contain a high level of subjectivity as the methodologies used do not require significant judgment. Citizens also considers certain adjustments to the modeled price that market participants would make when pricing each instrument, including a credit valuation adjustment that reflects the credit quality of the swap counterparty, as well as factors in the Company’s own credit quality. Citizens incorporates the effect of this exposure by netting its derivative contracts with the available collateral and calculating a valuation adjustment on the overall basis of the net position with the counterparty where permitted. The determination of this adjustment requires judgment on behalf of Company management; however, the total amount of this portfolio-level adjustment is not material to the total fair value of the interest rate swaps in their entirety
.
Therefore, interest rate swaps are classified as Level 2 in the valuation hierarchy.
The fair value of foreign exchange derivatives uses the mid-point of daily quoted currency spot prices as an input to the model. A valuation model estimates fair value based on the quoted spot rates together with interest rate yield curves and forward currency rates. Since all of these inputs are observable in the market, foreign exchange derivatives are classified as Level 2 in the fair value hierarchy.
Other contracts primarily consist of interest rate lock commitments, and forward sales commitments of residential MBS used to economically hedge existing mortgage commitments that are pending closure. Forward sales commitments are valued based on the value of similarly situated pools of mortgages trading in the market, adjusted for the unique characteristics of the TBA pool. Since these inputs are observable in the market, these derivatives are classified as Level 2 in the fair value hierarchy. Interest rate lock commitments are valued utilizing internally generated loan closing rate assumptions, which are a significant unobservable input, and therefore are classified as Level 3 in the fair value hierarchy.
86
CITIZENS FINANCIAL GROUP, INC.
NOTES TO CONSOLIDATED FINANCIAL STATEMENTS (UNAUDITED)
Money Market Mutual Fund Investments
Fair value is determined based upon unadjusted quoted market prices and is considered a Level 1 fair value measurement.
The following table presents assets and liabilities measured at fair value, including gross derivative assets and liabilities on a recurring basis at
March 31, 2019
:
|
(in millions)
|
Total
|
|
Level 1
|
|
Level 2
|
|
Level 3
|
|
||||
|
Debt securities available for sale:
|
||||||||||||
|
Mortgage-backed securities
|
|
$21,427
|
|
|
$—
|
|
|
$21,427
|
|
|
$—
|
|
|
State and political subdivisions
|
5
|
|
—
|
|
5
|
|
—
|
|
||||
|
U.S. Treasury and other
|
72
|
|
72
|
|
—
|
|
—
|
|
||||
|
Total
debt securities
available for sale
|
21,504
|
|
72
|
|
21,432
|
|
—
|
|
||||
|
Loans held for sale, at fair value:
|
||||||||||||
|
Residential loans held for sale
|
1,009
|
|
—
|
|
1,009
|
|
—
|
|
||||
|
Commercial loans held for sale
|
177
|
|
—
|
|
177
|
|
—
|
|
||||
|
Total loans held for sale, at fair value
|
1,186
|
|
—
|
|
1,186
|
|
—
|
|
||||
|
Mortgage servicing rights
|
563
|
|
—
|
|
—
|
|
563
|
|
||||
|
Derivative assets:
|
||||||||||||
|
Interest rate contracts
|
443
|
|
—
|
|
443
|
|
—
|
|
||||
|
Foreign exchange contracts
|
135
|
|
—
|
|
135
|
|
—
|
|
||||
|
Other contracts
|
19
|
|
—
|
|
1
|
|
18
|
|
||||
|
Total derivative assets
|
597
|
|
—
|
|
579
|
|
18
|
|
||||
|
Equity securities, at fair value:
|
||||||||||||
|
Money market mutual fund investments
|
198
|
|
198
|
|
—
|
|
—
|
|
||||
|
Total equity securities, at fair value
|
198
|
|
198
|
|
—
|
|
—
|
|
||||
|
Total assets
|
|
$24,048
|
|
|
$270
|
|
|
$23,197
|
|
|
$581
|
|
|
Derivative liabilities:
|
||||||||||||
|
Interest rate contracts
|
|
$160
|
|
|
$—
|
|
|
$160
|
|
|
$—
|
|
|
Foreign exchange contracts
|
113
|
|
—
|
|
113
|
|
—
|
|
||||
|
Other contracts
|
21
|
|
—
|
|
21
|
|
—
|
|
||||
|
Total derivative liabilities
|
294
|
|
—
|
|
294
|
|
—
|
|
||||
|
Total liabilities
|
|
$294
|
|
|
$—
|
|
|
$294
|
|
|
$—
|
|
87
CITIZENS FINANCIAL GROUP, INC.
NOTES TO CONSOLIDATED FINANCIAL STATEMENTS (UNAUDITED)
The following table presents assets and liabilities measured at fair value, including gross derivative assets and liabilities on a recurring basis at
December 31, 2018
:
|
(in millions)
|
Total
|
|
Level 1
|
|
Level 2
|
|
Level 3
|
|
||||
|
Debt securities available for sale:
|
||||||||||||
|
Mortgage-backed securities
|
|
$19,866
|
|
|
$—
|
|
|
$19,866
|
|
|
$—
|
|
|
State and political subdivisions
|
5
|
|
—
|
|
5
|
|
—
|
|
||||
|
U.S. Treasury and other
|
24
|
|
24
|
|
—
|
|
—
|
|
||||
|
Total debt securities available for sale
|
19,895
|
|
24
|
|
19,871
|
|
—
|
|
||||
|
Loans held for sale, at fair value:
|
||||||||||||
|
Residential loans held for sale
|
967
|
|
—
|
|
967
|
|
—
|
|
||||
|
Commercial loans held for sale
|
252
|
|
—
|
|
252
|
|
—
|
|
||||
|
Total loans held for sale, at fair value
|
1,219
|
|
—
|
|
1,219
|
|
—
|
|
||||
|
Mortgage servicing rights
|
600
|
|
—
|
|
—
|
|
600
|
|
||||
|
Derivative assets:
|
||||||||||||
|
Interest rate contracts
|
306
|
|
—
|
|
306
|
|
—
|
|
||||
|
Foreign exchange contracts
|
129
|
|
—
|
|
129
|
|
—
|
|
||||
|
Other contracts
|
14
|
|
—
|
|
14
|
|
—
|
|
||||
|
Total derivative assets
|
449
|
|
—
|
|
449
|
|
—
|
|
||||
|
Equity securities, at fair value:
|
||||||||||||
|
Money market mutual fund investments
|
181
|
|
181
|
|
—
|
|
—
|
|
||||
|
Total equity securities, at fair value
|
181
|
|
181
|
|
—
|
|
—
|
|
||||
|
Total assets
|
|
$22,344
|
|
|
$205
|
|
|
$21,539
|
|
|
$600
|
|
|
Derivative liabilities:
|
||||||||||||
|
Interest rate contracts
|
|
$277
|
|
|
$—
|
|
|
$277
|
|
|
$—
|
|
|
Foreign exchange contracts
|
113
|
|
—
|
|
113
|
|
—
|
|
||||
|
Other contracts
|
25
|
|
—
|
|
25
|
|
—
|
|
||||
|
Total derivative liabilities
|
415
|
|
—
|
|
415
|
|
—
|
|
||||
|
Total liabilities
|
|
$415
|
|
|
$—
|
|
|
$415
|
|
|
$—
|
|
The following tables present a rollforward of the balance sheet amounts for assets measured at fair value on a recurring basis and classified as Level 3 for the three months ended March 31, 2019. There were no assets measured at fair value on a recurring basis and classified as Level 3 for the three months ended March 31, 2018.
|
For the Three Months Ended March 31,
|
|||||||
|
(in millions)
|
Mortgage Servicing Rights
|
Other Derivative Contracts
|
|||||
|
Balance at January 1, 2019
|
|
$600
|
|
|
$—
|
|
|
|
Amount capitalized
|
35
|
|
—
|
|
|||
|
Change in unpaid principal balance during the period
(1)
|
(26
|
)
|
—
|
|
|||
|
Change in fair value during the period
(2)
|
(46
|
)
|
—
|
|
|||
|
Transfers from Level 2 to Level 3
(3)
|
—
|
|
18
|
|
|||
|
Balance at March 31, 2019
|
|
$563
|
|
|
$18
|
|
|
(1)
Represents changes in value of the MSRs due to i) passage of time including the impact from both regularly scheduled loan principal payments and partial
paydowns, and ii) loans that paid off during the period.
(2)
Represents changes in value primarily due to market driven changes in interest rates and prepayment speeds.
(3)
Reflects changes in the significance of unobservable inputs on derivative contracts associated with mortgage origination activities.
Nonrecurring Fair Value Measurements
Fair value is also used on a nonrecurring basis to evaluate certain assets for impairment or for disclosure purposes. Examples of nonrecurring uses of fair value include MSRs accounted for by the amortization method and loan impairments for certain loans and leases.
88
CITIZENS FINANCIAL GROUP, INC.
NOTES TO CONSOLIDATED FINANCIAL STATEMENTS (UNAUDITED)
The following valuation techniques are utilized to measure significant assets for which the Company utilizes fair value on a nonrecurring basis:
Impaired Loans
The carrying amount of collateral-dependent impaired loans is compared to the appraised value of the collateral less costs to dispose and is classified as Level 2. Any excess of carrying amount over the appraised value is charged to the ALLL.
Mortgage Servicing Rights - Amortization Method
MSRs do not trade in an active market with readily observable prices. MSRs are classified as Level 3 since the valuation methodology utilizes significant unobservable inputs. The fair value was calculated using a discounted cash flow model which used assumptions, including weighted-average life, weighted-average constant prepayment rate and weighted-average discount rate. Refer to
Note 5 "Mortgage Banking"
for more information. See also Note 8 “Mortgage Banking” to the Company’s audited Consolidated Financial Statements in the Annual Report on Form 10-K for the year ended December 31, 2018.
Foreclosed Assets
Foreclosed assets consist primarily of residential properties. Foreclosed assets are carried at the lower of cost or fair value less costs to sell. Fair value is based upon independent market prices or appraised values of the collateral and is classified as Level 2.
Leased Assets
The fair value of assets under operating leases is determined using collateral specific pricing digests, external appraisals, broker opinions, recent sales data from industry equipment dealers, and discounted cash flows derived from the underlying lease agreement. As market data for similar assets and lease agreements is available and used in the valuation, these assets are classified as Level 2 fair value measurement.
The following table presents gains (losses) on assets and liabilities measured at fair value on a nonrecurring basis and recorded in earnings:
|
Three Months Ended March 31,
|
|||||||
|
(in millions)
|
2019
|
|
2018
|
|
|||
|
Impaired collateral-dependent loans
|
|
($4
|
)
|
|
($2
|
)
|
|
|
MSRs
|
—
|
|
3
|
|
|||
|
Foreclosed assets
|
—
|
|
(1
|
)
|
|||
|
Leased assets
|
(3
|
)
|
—
|
|
|||
The following table presents assets and liabilities measured at fair value on a nonrecurring basis:
|
March 31, 2019
|
December 31, 2018
|
||||||||||||||||||||||||
|
(in millions)
|
Total
|
|
Level 1
|
|
Level 2
|
|
Level 3
|
|
Total
|
|
Level 1
|
|
Level 2
|
|
Level 3
|
|
|||||||||
|
Impaired collateral-dependent loans
|
|
$371
|
|
|
$—
|
|
|
$371
|
|
|
$—
|
|
|
$338
|
|
|
$—
|
|
|
$338
|
|
|
$—
|
|
|
|
MSRs
|
224
|
|
—
|
|
—
|
|
224
|
|
243
|
|
—
|
|
—
|
|
243
|
|
|||||||||
|
Foreclosed assets
|
29
|
|
—
|
|
29
|
|
—
|
|
29
|
|
—
|
|
29
|
|
—
|
|
|||||||||
|
Leased assets
|
91
|
|
—
|
|
91
|
|
—
|
|
92
|
|
—
|
|
92
|
|
—
|
|
|||||||||
89
CITIZENS FINANCIAL GROUP, INC.
NOTES TO CONSOLIDATED FINANCIAL STATEMENTS (UNAUDITED)
The following table presents the estimated fair value for financial instruments not recorded at fair value in the unaudited interim Consolidated Financial Statements. The carrying amounts are recorded in the Consolidated Balance Sheets under the indicated captions:
|
March 31, 2019
|
|||||||||||||||||||||||||||
|
Total
|
Level 1
|
Level 2
|
Level 3
|
||||||||||||||||||||||||
|
(in millions)
|
Carrying Value
|
Estimated Fair Value
|
Carrying Value
|
Estimated Fair Value
|
Carrying Value
|
Estimated Fair Value
|
Carrying Value
|
Estimated Fair Value
|
|||||||||||||||||||
|
Financial assets:
|
|||||||||||||||||||||||||||
|
Securities held to maturity
|
|
$3,345
|
|
|
$3,267
|
|
|
$—
|
|
|
$—
|
|
|
$3,345
|
|
|
$3,267
|
|
|
$—
|
|
|
$—
|
|
|||
|
Equity securities, at cost
|
604
|
|
604
|
|
—
|
|
—
|
|
604
|
|
604
|
|
—
|
|
—
|
|
|||||||||||
|
Other loans held for sale
|
66
|
|
66
|
|
—
|
|
—
|
|
—
|
|
—
|
|
66
|
|
66
|
|
|||||||||||
|
Loans and leases
|
117,615
|
|
117,862
|
|
—
|
|
—
|
|
371
|
|
371
|
|
117,244
|
|
117,491
|
|
|||||||||||
|
Financial liabilities:
|
|||||||||||||||||||||||||||
|
Deposits
|
123,916
|
|
123,875
|
|
—
|
|
—
|
|
123,916
|
|
123,875
|
|
—
|
|
—
|
|
|||||||||||
|
Federal funds purchased and securities sold under agreements to repurchase
|
668
|
|
668
|
|
—
|
|
—
|
|
668
|
|
668
|
|
—
|
|
—
|
|
|||||||||||
|
Other short-term borrowed funds
|
11
|
|
11
|
|
—
|
|
—
|
|
11
|
|
11
|
|
—
|
|
—
|
|
|||||||||||
|
Long-term borrowed funds
|
11,725
|
|
11,767
|
|
—
|
|
—
|
|
11,725
|
|
11,767
|
|
—
|
|
—
|
|
|||||||||||
|
December 31, 2018
|
|||||||||||||||||||||||||||
|
Total
|
Level 1
|
Level 2
|
Level 3
|
||||||||||||||||||||||||
|
(in millions)
|
Carrying Value
|
Estimated Fair Value
|
Carrying Value
|
Estimated Fair Value
|
Carrying Value
|
Estimated Fair Value
|
Carrying Value
|
Estimated Fair Value
|
|||||||||||||||||||
|
Financial assets:
|
|||||||||||||||||||||||||||
|
Securities held to maturity
|
|
$4,165
|
|
|
$4,041
|
|
|
$—
|
|
|
$—
|
|
|
$4,165
|
|
|
$4,041
|
|
|
$—
|
|
|
$—
|
|
|||
|
Equity securities, at cost
|
834
|
|
834
|
|
—
|
|
—
|
|
834
|
|
834
|
|
—
|
|
—
|
|
|||||||||||
|
Other loans held for sale
|
101
|
|
101
|
|
—
|
|
—
|
|
—
|
|
—
|
|
101
|
|
101
|
|
|||||||||||
|
Loans and leases
|
116,660
|
|
116,627
|
|
—
|
|
—
|
|
338
|
|
338
|
|
116,322
|
|
116,289
|
|
|||||||||||
|
Financial liabilities:
|
|||||||||||||||||||||||||||
|
Deposits
|
119,575
|
|
119,503
|
|
—
|
|
—
|
|
119,575
|
|
119,503
|
|
—
|
|
—
|
|
|||||||||||
|
Federal funds purchased and securities sold under agreements to repurchase
|
1,156
|
|
1,156
|
|
—
|
|
—
|
|
1,156
|
|
1,156
|
|
—
|
|
—
|
|
|||||||||||
|
Other short-term borrowed funds
|
161
|
|
161
|
|
—
|
|
—
|
|
161
|
|
161
|
|
—
|
|
—
|
|
|||||||||||
|
Long-term borrowed funds
|
15,925
|
|
15,877
|
|
—
|
|
—
|
|
15,925
|
|
15,877
|
|
—
|
|
—
|
|
|||||||||||
NOTE 14 - NONINTEREST INCOME
Revenues from Contracts with Customers
The following table presents the components of revenue from contracts with customers disaggregated by revenue stream and business operating segment:
|
Three Months Ended March 31, 2019
|
Three Months Ended March 31, 2018
|
||||||||||||||||||
|
(in millions)
|
Consumer Banking
|
Commercial Banking
|
Consolidated
(1)
|
Consumer Banking
|
Commercial Banking
|
Consolidated
(1)
|
|||||||||||||
|
Service charges and fees
|
|
$97
|
|
|
$26
|
|
|
$123
|
|
|
$98
|
|
|
$26
|
|
|
$124
|
|
|
|
Card fees
|
50
|
|
9
|
|
59
|
|
52
|
|
9
|
|
61
|
|
|||||||
|
Capital markets fees
|
—
|
|
49
|
|
49
|
|
—
|
|
37
|
|
37
|
|
|||||||
|
Trust and investment services fees
|
47
|
|
—
|
|
47
|
|
40
|
|
—
|
|
40
|
|
|||||||
|
Other banking fees
|
—
|
|
2
|
|
2
|
|
—
|
|
3
|
|
3
|
|
|||||||
|
Total revenue from contracts with customers
|
|
$194
|
|
|
$86
|
|
|
$280
|
|
|
$190
|
|
|
$75
|
|
|
$265
|
|
|
(1)
There is no revenue from contracts with customers included in Other non-segment operations.
90
CITIZENS FINANCIAL GROUP, INC.
NOTES TO CONSOLIDATED FINANCIAL STATEMENTS (UNAUDITED)
For the three months ended
March 31, 2019
and
2018
, the Company recognized trailing commissions of
$4 million
related to services provided in previous reporting periods. Fees from other investment services are recognized at a point in time upon completion of the service.
Revenue from Other Sources
|
Three Months Ended March 31,
|
|||||||
|
(in millions)
|
2019
|
|
2018
|
|
|||
|
Bank-owned life insurance
|
|
$14
|
|
|
$14
|
|
|
NOTE 15 - OTHER OPERATING EXPENSE
The following table presents the details of other operating expense:
|
Three Months Ended March 31,
|
|||||||
|
(in millions)
|
2019
|
|
2018
|
|
|||
|
Deposit insurance
|
|
$16
|
|
|
$31
|
|
|
|
Promotional expense
|
27
|
|
25
|
|
|||
|
Settlements and operating losses
|
11
|
|
12
|
|
|||
|
Other
|
56
|
|
52
|
|
|||
|
Other operating expense
|
|
$110
|
|
|
$120
|
|
|
NOTE 16 - EARNINGS PER SHARE
|
Three Months Ended March 31,
|
|||||||
|
(in millions, except share and per share data)
|
2019
|
|
2018
|
|
|||
|
Numerator (basic and diluted):
|
|||||||
|
Net income
|
|
$439
|
|
|
$388
|
|
|
|
Less: Preferred stock dividends
|
15
|
|
7
|
|
|||
|
Net income available to common stockholders
|
|
$424
|
|
|
$381
|
|
|
|
Denominator:
|
|||||||
|
Weighted-average common shares outstanding - basic
|
460,713,172
|
|
487,500,618
|
|
|||
|
Dilutive common shares: share-based awards
|
1,807,508
|
|
1,766,208
|
|
|||
|
Weighted-average common shares outstanding - diluted
|
462,520,680
|
|
489,266,826
|
|
|||
|
Earnings per common share:
|
|||||||
|
Basic
|
|
$0.92
|
|
|
$0.78
|
|
|
|
Diluted
(1)
|
0.92
|
|
0.78
|
|
|||
(1)
Potential dilutive common shares are excluded from the computation of diluted EPS in the periods where the effect would be antidilutive. Excluded from the computation of diluted EPS were antidilutive shares totaling
1 million
for the
three months ended
March 31, 2019
. There were
no
antidilutive shares for the
three months ended
March 31, 2018
.
NOTE 17 - BUSINESS OPERATING SEGMENTS
Citizens is managed by its Chief Executive Officer on a segment basis. The Company’s
two
business operating segments are Consumer Banking and Commercial Banking. The business segments are determined based on the products and services provided, or the type of customer served. Each segment has one or more segment heads who report directly to the Chief Executive Officer. The Chief Executive Officer has final authority over resource allocation decisions and performance assessment. The business segments reflect this management structure and the manner in which financial information is currently evaluated by the Chief Executive Officer.
Reportable Segments
Segment results are determined based upon the Company’s management reporting system, which assigns balance sheet and statement of operations items to each of the business segments. The process is designed around the Company’s organizational and management structure and accordingly, the results derived are not necessarily
91
CITIZENS FINANCIAL GROUP, INC.
NOTES TO CONSOLIDATED FINANCIAL STATEMENTS (UNAUDITED)
comparable with similar information published by other financial institutions. A description of each reportable segment and table of financial results is presented below:
Consumer Banking
The Consumer Banking segment focuses on retail customers and small businesses with annual revenues of up to
$25 million
. It offers traditional banking products and services, including checking, savings, home loans, education loans, credit cards, business loans, and unsecured product finance and personal loans in addition to financial management services. It also operates an indirect auto financing business, providing financing for both new and used vehicles through auto dealerships. The segment’s distribution channels include a branch network, ATMs and a work force of experienced specialists ranging from financial consultants, mortgage loan officers and business banking officers to private bankers. The Company’s Consumer Banking value proposition is based on providing simple, easy to understand product offerings and a convenient banking experience with a more personalized approach.
Commercial Banking
The Commercial Banking segment primarily targets companies with annual revenues from
$25 million
to
$3.0 billion
and provides a full complement of financial products and solutions, including loans, leases, trade financing, deposits, cash management, commercial cards, foreign exchange, interest rate risk management, corporate finance and capital markets advisory capabilities. It focuses on middle-market companies, large corporations and institutions and has dedicated teams with industry expertise in government banking, not-for-profit, healthcare, technology, professionals, oil and gas, asset finance, franchise finance, asset-based lending, commercial real estate, private equity and sponsor finance. While the segment’s business development efforts are predominantly focused in the Company’s footprint, some of its specialized industry businesses also operate selectively on a national basis (such as healthcare, asset finance and franchise finance). A key component of Commercial Banking’s growth strategy is to bring ideas to clients that help their businesses thrive, and in doing so, expand the loan portfolio and ancillary product sales.
Non-segment Operations
Other
Non-segment operations are classified as Other, which includes corporate functions, the Treasury function, the securities portfolio, wholesale funding activities, intangible assets not directly allocated to a business operating segment, community development, non-core assets (including legacy Royal Bank of Scotland Group plc aircraft loans and leases placed in runoff in the third quarter of 2016), and other unallocated assets, liabilities, capital, revenues, provision for credit losses, and expenses including income tax expense. In addition to non-segment operations, Other includes goodwill not directly allocated to a business operating segment and any associated goodwill impairment charges. For impairment testing purposes, the Company allocates all goodwill to its Consumer Banking and/or Commercial Banking reporting units.
|
As of and for the Three Months Ended March 31, 2019
|
|||||||||||||||
|
(in millions)
|
Consumer Banking
|
Commercial Banking
|
Other
|
Consolidated
|
|||||||||||
|
Net interest income
|
|
$788
|
|
|
$372
|
|
|
$—
|
|
|
$1,160
|
|
|||
|
Noninterest income
|
247
|
|
150
|
|
31
|
|
428
|
|
|||||||
|
Total revenue
|
1,035
|
|
522
|
|
31
|
|
1,588
|
|
|||||||
|
Noninterest expense
|
700
|
|
209
|
|
28
|
|
937
|
|
|||||||
|
Profit before provision for credit losses
|
335
|
|
313
|
|
3
|
|
651
|
|
|||||||
|
Provision for credit losses
|
67
|
|
21
|
|
(3
|
)
|
85
|
|
|||||||
|
Income before income tax expense (benefit)
|
268
|
|
292
|
|
6
|
|
566
|
|
|||||||
|
Income tax expense (benefit)
|
66
|
|
65
|
|
(4
|
)
|
127
|
|
|||||||
|
Net income
|
|
$202
|
|
|
$227
|
|
|
$10
|
|
|
$439
|
|
|||
|
Total average assets
|
|
$65,007
|
|
|
$55,630
|
|
|
$39,778
|
|
|
$160,415
|
|
|||
92
CITIZENS FINANCIAL GROUP, INC.
NOTES TO CONSOLIDATED FINANCIAL STATEMENTS (UNAUDITED)
|
As of and for the Three Months Ended March 31, 2018
|
|||||||||||||||
|
(in millions)
|
Consumer Banking
|
Commercial Banking
|
Other
|
Consolidated
|
|||||||||||
|
Net interest income
|
|
$733
|
|
|
$357
|
|
|
$1
|
|
|
$1,091
|
|
|||
|
Noninterest income
|
222
|
|
125
|
|
24
|
|
371
|
|
|||||||
|
Total revenue
|
955
|
|
482
|
|
25
|
|
1,462
|
|
|||||||
|
Noninterest expense
|
656
|
|
208
|
|
19
|
|
883
|
|
|||||||
|
Profit before provision for credit losses
|
299
|
|
274
|
|
6
|
|
579
|
|
|||||||
|
Provision for credit losses
|
72
|
|
(4
|
)
|
10
|
|
78
|
|
|||||||
|
Income (loss) before income tax expense (benefit)
|
227
|
|
278
|
|
(4
|
)
|
501
|
|
|||||||
|
Income tax expense (benefit)
|
57
|
|
63
|
|
(7
|
)
|
113
|
|
|||||||
|
Net income
|
|
$170
|
|
|
$215
|
|
|
$3
|
|
|
$388
|
|
|||
|
Total average assets
|
|
$61,348
|
|
|
$50,393
|
|
|
$39,782
|
|
|
$151,523
|
|
|||
There have been no significant changes in the management accounting practices utilized by the Company regarding the basis of presentation for segment results as discussed in Note 25 “Business Operating Segments,” to the Company’s audited Consolidated Financial Statements in the Annual Report on Form 10-K for the year ended December 31, 2018.
93
CITIZENS FINANCIAL GROUP, INC.
ITEM 3. QUANTITATIVE AND QUALITATIVE DISCLOSURES ABOUT MARKET RISK
The information presented in the “Market Risk” section of Part I, Item 2 — Management’s Discussion and Analysis of Financial Condition and Results of Operations is incorporated herein by reference.
ITEM 4. CONTROLS AND PROCEDURES
The Company maintains a set of disclosure controls and procedures designed to ensure that information required to be disclosed by the Company in reports that it files or submits under the Exchange Act, is recorded, processed, summarized and reported within the time periods specified in SEC rules and forms. The design of any disclosure controls and procedures is based in part upon certain assumptions about the likelihood of future events, and there can be no assurance that any design will succeed in achieving its stated goals under all potential future conditions. Any controls and procedures, no matter how well designed and operated, can provide only reasonable, not absolute, assurance of achieving the desired control objectives. In accordance with Rule 13a-15(b) of the Exchange Act, as of the end of the period covered by this quarterly report, an evaluation was carried out under the supervision and with the participation of the Company’s management, including its Chief Executive Officer and Chief Financial Officer, of the effectiveness of its disclosure controls and procedures. Based on that evaluation, the Company’s Chief Executive Officer and Chief Financial Officer concluded that the Company’s disclosure controls and procedures, as of the end of the period covered by this quarterly report, were effective to provide reasonable assurance that information required to be disclosed by the Company in reports that it files or submits under the Exchange Act is recorded, processed, summarized and reported within the time periods specified in SEC rules and forms and is accumulated and communicated to the Company’s management, including the Chief Executive Officer and Chief Financial Officer, as appropriate to allow timely decisions regarding required disclosure.
There were no changes in our internal control over financial reporting identified in management's evaluation pursuant to Rules13a-15(d) or 15d-15(d) of the Exchange Act during the period covered by this quarterly report on Form 10-Q that materially affected, or are reasonably likely to materially affect, the Company’s internal control over financial reporting.
94
CITIZENS FINANCIAL GROUP, INC.
PART II. OTHER INFORMATION
ITEM 1. LEGAL PROCEEDINGS
The information required by this item is set forth in
Note 12 "Commitments and Contingencies"
in the Notes to the unaudited interim Consolidated Financial Statements in Part I, Item 1 — Financial Statements of this Report, which is incorporated herein by reference.
ITEM 1A. RISK FACTORS
In addition to the other information set forth in this Report, you should consider the risks described under the caption “Risk Factors” in Part I, Item 1A. of the Company’s Annual Report on Form 10-K for the year ended
December 31, 2018
.
ITEM 2. UNREGISTERED SALES OF EQUITY SECURITIES AND USE OF PROCEEDS
Details of the repurchases of the Company’s common stock during the three months ended
March 31, 2019
are included in the following table:
|
Period
|
Total Number of Shares Repurchased
|
Weighted Average Price Paid Per Share
|
Total Number of Shares Purchased as Part of Publicly Announced Plans or Programs
(1)
|
Maximum Dollar Amount of Shares That May Yet Be Purchased As Part of Publicly Announced Plans or Programs
(1)
|
|
January 1, 2019 - January 31, 2019
|
5,617,978
|
$34.34
|
5,617,978
|
$127,071,332
|
|
February 1, 2019 - February 28, 2019
|
—
|
—
|
—
|
$127,071,332
|
|
March 1, 2019 - March 31, 2019
|
205,913
|
$34.34
|
205,913
|
$120,000,000
|
(1)
On June 28, 2018, the Company announced that its 2018 Capital Plan, submitted as part of the CCAR process and not objected to by the FRB, included share repurchases of CFG common stock of up to $1.02 billion for the four-quarter period ending with the second quarter of 2019. This share repurchase plan, which was approved by the Company’s Board of Directors at the time of the announcement, allowed for share repurchases that may be executed in the open market or in privately negotiated transactions, including under Rule 10b5-1 plans. All shares repurchased by the Company during the first quarter were executed pursuant to an accelerated share repurchase transaction, which was completed by
March 31, 2019
. The timing and exact amount of future share repurchases will be subject to various factors, including the Company’s capital position, financial performance and market conditions.
ITEM 6. EXHIBITS
95
CITIZENS FINANCIAL GROUP, INC.
|
101
|
The following materials from the Registrant's Quarterly Report on Form 10-Q for the fiscal quarter ended
March 31, 2019
, formatted in XBRL: (i) the Consolidated Balance Sheets, (ii) the Consolidated Statements of Operations, (iii) the Consolidated Statements of Comprehensive Income, (iv) the Consolidated Statements of Changes in Stockholders’ Equity, (v) the Consolidated Statements of Cash Flows and (vi) the Notes to Consolidated Financial Statements*
|
* Filed herewith.
SIGNATURE
Pursuant to the requirements of the Securities Exchange Act of 1934, the Registrant has duly caused this Report to be signed on its behalf by the undersigned, thereunto duly authorized on
May 8, 2019
.
|
CITIZENS FINANCIAL GROUP, INC.
|
|
|
(Registrant)
|
|
|
By:
|
/s/ C. Jack Read
|
|
Name: C. Jack Read
|
|
|
Title: Executive Vice President, Chief Accounting Officer and Controller
|
|
|
(Principal Accounting Officer and Authorized Officer)
|
|
96
TABLE OF CONTENTS
Part I. Financial InformationItem 2. Management S Discussion and Analysis Of Financial Condition and Results Of OperationsNote 4 "allowance For Credit Losses, Nonperforming Assets, and Concentrations Of Credit Risk"Note 9 "derivatives"Note 11 "stockholders Equity"Note 8 "borrowed Funds"Note 12 "commitments and Contingencies"Item 1. Financial StatementsNote 1 - Basis Of PresentationNote 2 - SecuritiesNote 9 "derivatives."Note 3 - Loans and LeasesNote 4 - Allowance For Credit Losses, Nonperforming Assets, and Concentrations Of Credit RiskNote 5 - Mortgage BankingNote 6 - LeasesNote 7 - Variable Interest EntitiesNote 8 - Borrowed FundsNote 9 - DerivativesNote 13 "fair Value Measurements."Note 10 - Reclassifications Out Of Accumulated Other Comprehensive Income (loss)Note 11 - Stockholders EquityNote 12 - Commitments and ContingenciesNote 13 - Fair Value MeasurementsNote 5 "mortgage Banking"Note 14 - Noninterest IncomeNote 15 - Other Operating ExpenseNote 16 - Earnings Per ShareNote 17 - Business Operating SegmentsItem 3. Quantitative and Qualitative Disclosures About Market RiskItem 4. Controls and ProceduresPart II. Other InformationItem 1. Legal ProceedingsItem 1A. Risk FactorsItem 2. Unregistered Sales Of Equity Securities and Use Of ProceedsItem 6. Exhibits