CARLYLE GROUP INC.
10-Ks and 10-Qs
|
|
|
|
|
|
|
|
|
|
|
|
|
|
|
|
|
UNITED STATES
SECURITIES AND EXCHANGE COMMISSION
WASHINGTON, D.C. 20549
FORM 10-K
(Mark One)
|
ý
|
ANNUAL REPORT PURSUANT TO SECTION 13 OR 15(d) OF THE SECURITIES EXCHANGE ACT OF 1934
|
FOR THE FISCAL YEAR ENDED
DECEMBER 31, 2017
OR
|
¨
|
TRANSITION REPORT PURSUANT TO SECTION 13 OR 15(d) OF THE SECURITIES EXCHANGE ACT OF 1934
|
FOR THE TRANSITION PERIOD FROM
TO
Commission File Number: 001-35538
The Carlyle Group L.P.
(Exact name of registrant as specified in its charter)
|
Delaware
|
|
45-2832612
|
|
(State or other jurisdiction of
incorporation or organization)
|
|
(I.R.S. Employer
Identification No.)
|
|
1001 Pennsylvania Avenue, NW
Washington, D.C.
|
|
20004-2505
|
|
(Address of principal executive offices)
|
|
(Zip Code)
|
(202) 729-5626
(Registrant’s telephone number, including area code)
Securities registered pursuant to Section 12(b) of the Act:
|
Title of each class
|
|
Name of each exchange on which registered
|
|
Common Units representing limited partner interests
|
|
The NASDAQ Global Select Market
|
|
5.875% Series A Preferred Units
|
The NASDAQ Global Select Market
|
|
Securities registered pursuant to Section 12(g) of the Act: None
Indicate by check mark if the Registrant is a well-known seasoned issuer, as defined in Rule 405 of the Securities Act. Yes
ý
No
¨
Indicate by check mark if the Registrant is not required to file reports pursuant to Section 13 or Section 15(d) of the Act. Yes
¨
No
ý
Indicate by check mark whether the Registrant (1) has filed all reports required to be filed by Section 13 or 15(d) of the Securities Exchange Act of 1934 during the preceding 12 months (or for such shorter period that the Registrant was required to file such reports), and (2) has been subject to such filing requirements for the past 90 days. Yes
ý
No
¨
Indicate by check mark whether the registrant has submitted electronically and posted on its corporate Web site, if any, every Interactive Data File required to be submitted and posted pursuant to Rule 405 of Regulation S-T (§232.405 of this chapter) during the preceding 12 months (or for such shorter period that the registrant was required to submit and post such files). Yes
ý
No
¨
Indicate by check mark if disclosure of delinquent filers pursuant to Item 405 of Regulation S-K (§229.405 of this chapter) is not contained herein and will not be contained, to the best of the Registrant’s knowledge, in definitive proxy or information statements incorporated by reference in Part III of this Form 10-K or any amendment to this Form 10-K.
ý
Indicate by check mark whether the Registrant is a large accelerated filer, an accelerated filer, a non-accelerated filer or a smaller reporting company. See the definitions of “large accelerated filer,” “accelerated filer” and “smaller reporting company” in Rule 12b-2 of the Exchange Act
|
Large accelerated filer
|
|
ý
|
|
Accelerated filer
|
|
¨
|
|
Non-accelerated filer
|
|
¨
(do not check if a smaller reporting company)
|
|
Smaller reporting company
|
|
¨
|
|
Emerging growth company
|
¨
|
|||||
If an emerging growth company, indicate by check mark if the registrant has elected not to use the extended transition period for complying with any new or revised financial accounting standards provided pursuant to Section 13(a) of the Exchange Act.
¨
Indicate by check mark whether the Registrant is a shell company (as defined in Rule 12b-2 of the Act). Yes
¨
No
ý
The aggregate market value of the common units of the Registrant held by non-affiliates as of June 30, 2017 was $1,788,459,848.
The number of the Registrant’s common units representing limited partner interests outstanding as of February 9, 2018 was 100,473,514.
DOCUMENTS INCORPORATED BY REFERENCE
None
1
TABLE OF CONTENTS
|
|
|
Page
|
|
ITEM 1.
|
||
|
ITEM 1A.
|
||
|
ITEM 1B.
|
||
|
ITEM 2.
|
||
|
ITEM 3.
|
||
|
ITEM 4.
|
||
|
ITEM 5.
|
||
|
ITEM 6.
|
||
|
ITEM 7.
|
||
|
ITEM 7A.
|
||
|
ITEM 8.
|
||
|
ITEM 9.
|
||
|
ITEM 9A.
|
||
|
ITEM 9B.
|
||
|
ITEM 10.
|
||
|
ITEM 11.
|
||
|
ITEM 12.
|
||
|
ITEM 13.
|
||
|
ITEM 14.
|
||
|
PART IV.
|
||
|
ITEM 15.
|
||
1
Forward-Looking Statements
This report may contain forward-looking statements within the meaning of Section 27A of the Securities Act of 1933 and Section 21E of the Securities Exchange Act of 1934. These statements include, but are not limited to, statements related to our expectations regarding the performance of our business, our financial results, our liquidity and capital resources, contingencies, our distribution policy, and other non-historical statements. You can identify these forward-looking statements by the use of words such as “outlook,” “believes,” “expects,” “potential,” “continues,” “may,” “will,” “should,” “seeks,” “approximately,” “predicts,” “intends,” “plans,” “estimates,” “anticipates” or the negative version of these words or other comparable words. Such forward-looking statements are subject to various risks, uncertainties and assumptions. Accordingly, there are or will be important factors that could cause actual outcomes or results to differ materially from those indicated in these statements including, but not limited to, those described under the section entitled “Risk Factors” in this report, as such factors may be updated from time to time in our periodic filings with the United States Securities and Exchange Commission (the “SEC”), which are accessible on the SEC’s website at www.sec.gov. These factors should not be construed as exhaustive and should be read in conjunction with the other cautionary statements that are included in this report and in our other periodic filings with the SEC. We undertake no obligation to publicly update or review any forward-looking statements, whether as a result of new information, future developments or otherwise, except as required by applicable law.
Unless the context suggests otherwise, references in this report to “Carlyle,” the “Company,” “we,” “us” and “our” refer to The Carlyle Group L.P. and its consolidated subsidiaries. When we refer to the “partners of The Carlyle Group L.P.,” we are referring specifically to the common unitholders and our general partner and any others who may from time to time be partners of that specific Delaware limited partnership. When we refer to our “senior Carlyle professionals,” we are referring to the partner-level personnel of our firm. References in this report to the ownership of the senior Carlyle professionals include the ownership of personal planning vehicles of these individuals. When we refer to the “Carlyle Holdings partnerships” or “Carlyle Holdings”, we are referring to Carlyle Holdings I L.P., Carlyle Holdings II L.P., and Carlyle Holdings III L.P.
“Carlyle funds,” “our funds” and “our investment funds” refer to the investment funds and vehicles advised by Carlyle.
“Carry funds” generally refers to closed-end investment vehicles, in which commitments are drawn down over a specified investment period, and in which the general partner receives a special residual allocation of income from limited partners, which we refer to as carried interest, in the event that specified investment returns are achieved by the fund. Disclosures referring to carry funds will also include the impact of certain commitments which do not earn carried interest, but are either part of, or associated with our carry funds. The rate of carried interest, as well as the share of carried interest allocated to Carlyle, may vary across the carry fund platform. Carry funds generally include the following investment vehicles across our four business segments:
|
•
|
Corporate Private Equity (all): buyout & growth funds advised by Carlyle
|
|
•
|
Real Assets: Real estate, power, infrastructure and energy funds advised by Carlyle, as well as those energy funds advised by NGP Capital Management in which Carlyle is entitled to receive a share of carried interest
|
|
•
|
Global Credit (formerly known as Global Market Strategies): Distressed credit, energy credit, opportunistic credit and corporate mezzanine funds, and other closed-end credit funds advised by Carlyle
|
|
•
|
Investment Solutions: Funds and vehicles advised by AlpInvest Partners B.V. (“AlpInvest”) and Metropolitan Real Estate Equity Management, LLC (“Metropolitan), which include primary fund, secondary and co-investment strategies
|
Carry funds specifically exclude those funds advised by NGP Energy Capital Management in which Carlyle is not entitled to receive a share of carried interest (or “NGP management fee funds”), collateralized loan obligation vehicles (“CLOs”), business development companies, and our former hedge fund platform.
For an explanation of the fund acronyms used throughout this Annual Report, refer to “Item 1. Business-Our Family of Funds.”
“Fee-earning assets under management” or “Fee-earning AUM” refers to the assets we manage or advise from which we derive recurring fund management fees. Our Fee-earning AUM is generally based on one of the following, once fees have been activated:
|
(a)
|
the amount of limited partner capital commitments, generally for carry funds where the original investment period has not expired, for AlpInvest carry funds during the commitment fee period and for Metropolitan carry funds during the weighted-average investment period of the underlying funds;
|
|
(b)
|
the remaining amount of limited partner invested capital at cost, generally for carry funds and certain co-investment vehicles where the original investment period has expired, Metropolitan carry funds after the expiration of the weighted-average investment period of the underlying funds, and one of our business development companies;
|
|
(c)
|
the amount of aggregate fee-earning collateral balance at par of our CLOs, as defined in the fund indentures (typically exclusive of equities and defaulted positions) as of the quarterly cut-off date for each CLO;
|
|
(d)
|
the external investor portion of the net asset value of our hedge fund and fund of hedge funds vehicles (pre redemptions and subscriptions), as well as certain carry funds;
|
|
(e)
|
the gross assets (including assets acquired with leverage), excluding cash and cash equivalents, of one of our business development companies and certain carry funds; or
|
|
(f)
|
the lower of cost or fair value of invested capital, generally for AlpInvest carry funds where the commitment fee period has expired and certain carry funds where the investment period has expired.
|
“Assets under management” or “AUM” refers to the assets we manage or advise. Our AUM equals the sum of the following:
(a) the aggregate fair value of our carry funds and related co-investment vehicles, NGP management fee funds and separately managed accounts, plus the capital that Carlyle is entitled to call from investors in those funds and vehicles (including Carlyle commitments to those funds and vehicles and those of senior Carlyle professionals and employees) pursuant to the terms of their capital commitments to those funds and vehicles;
|
(b)
|
the amount of aggregate collateral balance and principal cash at par or aggregate principal amount of the notes of our CLOs and other structured products (inclusive of all positions);
|
|
(c)
|
the net asset value (pre-redemptions and subscriptions) of our long/short credit, emerging markets, multi-product macroeconomic, fund of hedge funds vehicles, mutual fund and other hedge funds; and
|
|
(d)
|
the gross assets (including assets acquired with leverage) of our business development companies, plus the capital that Carlyle is entitled to call from investors in those vehicles pursuant to the terms of their capital commitments to those vehicles.
|
We include in our calculation of AUM and Fee-earning AUM certain energy and renewable resources funds that we jointly advise with Riverstone Holdings L.L.C. (“Riverstone”) and certain NGP management fee funds and carry funds that are advised by NGP.
For most of our carry funds, total AUM includes the fair value of the capital invested, whereas Fee-earning AUM includes the amount of capital commitments or the remaining amount of invested capital, depending on whether the original investment period for the fund has expired. As such, Fee-earning AUM may be greater than total AUM when the aggregate fair value of the remaining investments is less than the cost of those investments.
Our calculations of AUM and Fee-earning AUM may differ from the calculations of other alternative asset managers. As a result, these measures may not be comparable to similar measures presented by other alternative asset managers. In addition, our calculation of AUM (but not Fee-earning AUM) includes uncalled commitments to, and the fair value of invested capital in, our investment funds from Carlyle and our personnel, regardless of whether such commitments or invested capital are subject to management or performance fees. Our calculations of AUM or Fee-earning AUM are not based on any definition of AUM or Fee-earning AUM that is set forth in the agreements governing the investment funds that we manage or advise.
“Vermillion” refers to our commodities advisor and business advised by Carlyle Commodity Management L.L.C., which was formerly known as Vermillion Asset Management until August 2015.
2
Overview
We are one of the world’s largest and most diversified multi-product global alternative asset management firms. We advise an array of specialized investment funds and other investment vehicles that invest across a range of industries, geographies, asset classes and investment strategies and seek to deliver attractive returns for our fund investors. Since our firm was founded in Washington, D.C. in 1987, we have grown to become a leading global alternative asset manager with more than
$195 billion
in AUM across
317
investment vehicles as of
December 31, 2017
. We have more than
1,600
employees, including
654
investment professionals in
31
offices across six continents, and we serve more than
1,750
active carry fund investors from
83
countries. Across our Corporate Private Equity (“CPE”) and Real Assets segments, as of
December 31, 2017
, we had investments in
279
active portfolio companies that employ more than 650,000 people. In general, we have more investment professionals, offices, investment funds and investments across our platform than many of our peers. We have structured our firm in this manner to provide our fund investors with a more diverse product set tailored to individual investing decisions, and a broader global reach, but such structure increases our costs of doing business.
For the past thirty years, our firm has been guided by several fundamental tenets:
|
•
|
Excellence in Investing.
Our primary goal is to invest wisely and create value for our fund investors. We strive to generate superior investment returns by combining deep industry expertise, a global network of local investment teams who can leverage extensive firm-wide resources and a consistent and disciplined investment process.
|
|
•
|
Commitment to our Fund Investors.
Our fund investors come first. This commitment is a core component of our firm culture and informs every aspect of our business. We believe this philosophy is in the long-term best interests of Carlyle and its owners, including our common unitholders.
|
|
•
|
Expansion of our Platform.
We innovate continuously to expand our investment capabilities through the creation or acquisition of new asset-, sector- and regional-focused strategies in order to provide our fund investors a variety of investment options.
|
|
•
|
Investment in the Firm.
We have invested, and intend to continue to invest, significant resources in hiring and retaining a deep talent pool of investment professionals and in creating an efficient global infrastructure to ensure that we are providing our investors with world-class investment expertise and the customized service they require.
|
|
•
|
Unified Culture.
We seek to leverage the local market insights and operational capabilities that we have developed across our global platform through a unified culture we call “One Carlyle.” Our culture emphasizes collaboration and sharing of knowledge and expertise across the firm to create value. We believe our collaborative approach enhances our ability to analyze investments, deploy capital and improve the performance of our portfolio companies.
|
During 2017, we continued to work in furtherance of our fundamental tenets by focusing on investing wisely and driving asset appreciation to create value for our investors, making significant progress toward our goal of raising $100 billion in new capital commitments during our four-year fundraising plan that will end in 2019 and building a premier global credit platform.
Operational and strategic highlights for our firm for 2017 include:
|
•
|
During 2017, we raised approximately $
43 billion
in new commitments across our platform, bringing the total gross commitments raised since 2016 to $57 billion.
|
|
•
|
During 2017, we made investments through our carry funds of approximately
$22 billion
, a record level, and we realized proceeds of approximately
$26 billion
.
|
|
•
|
During 2017, the value of our carry fund portfolio increased by approximately
20%
.
|
3
|
•
|
In October 2017, we appointed Kewsong Lee and Glenn Youngkin as Co-Chief Executive Officers of the firm, effective January 1, 2018. Carlyle’s three founders, William E. Conway, Jr., Daniel A. D’Aniello and David M. Rubenstein, will continue to remain actively involved in our business. Messrs. Conway and Rubenstein are now serving as Co-Executive Chairmen of the Board of Directors of our general partner and Mr. Conway is also serving as our Co-Chief Investment Officer. Mr. D’Aniello is serving as Chairman Emeritus of the Board of Directors of our general partner and all three of our founders continue to serve as members of our Executive Group. Peter Clare was also named as Co-Chief Investment Officer and is serving in such role alongside Mr. Conway. Mr. Clare also continues to serve as Co-head of our U.S. buyout team. Messrs. Clare, Lee and Youngkin also have joined the Board of Directors of our general partner and all three serve on our Executive Group.
|
|
•
|
On September 13, 2017, we issued 16 million 5.875% Series A Preferred Units at $25.00 a unit for total gross proceeds of $400 million that we will use for general corporate purposes.
|
|
•
|
We further aligned our interests with those of our fund investors as Carlyle, our senior Carlyle professionals, advisors and other professionals increased commitments to our investment funds by over $2.2 billion during the year for a total cumulative commitment of $11.9 billion as of December 31, 2017.
|
|
•
|
Each of our segments continued to leverage the One Carlyle platform to take advantage of economies of scale and we continue to work across the firm to develop different products for our fund investors.
|
Operational and strategic highlights for our four business segments for 2017 include:
|
•
|
CPE
:
|
|
◦
|
CPE has many of its large buyout funds currently in the market, including our latest generation U.S. Buyout fund, European buyout fund and Asia buyout fund. During 2017, we raised $
21 billion
in new capital commitments for our CPE funds.
|
|
◦
|
Despite a challenging environment for investing due to high asset prices and significant competition, CPE invested a record $
11 billion
in 2017 in, among others, ADB Safegate (a CEP IV portfolio company), Albany Molecular (a CP VI portfolio company), Arctic Glacier (a CGP portfolio company), Atotech (a CP VI, CEP IV and CAP IV portfolio company), Golden Goose Deluxe Brand (a CEP IV and CAGP V portfolio company), MedRisk (a CP VI portfolio company), Pharmaceutical Product Development (a CP VI portfolio company), The TCW Group, (a CGP portfolio company), WellDyneRx (a CP VI portfolio company), Wildhorse Resource Development Corporation (a CP VI and NGP portfolio company) and ZeroChaos (a CP VI portfolio company).
|
|
◦
|
CPE realized proceeds of
$11.2 billion
for our CPE carry fund investors in 2017. We sold stakes or otherwise generated proceeds in, among others, Coates Hire Limited (a CAP II portfolio company), Dealogic (a CP VI portfolio company), ECi Software Solutions (a CEOF I portfolio company), Edgewood Partners Holdings (a CGFSP I and CGFSP II portfolio company), Focus Media (a CAP III portfolio company), Multi Packaging Solutions (a CEP III portfolio company), The Nature's Bounty Co. (a CP V and CEP III portfolio company), Pharmaceutical Product Development (a CP V portfolio company), The TCW Group (a CP V and CGFSP I portfolio company) and Tsubaki Nakashima Co. (a CJP II portfolio company).
|
|
•
|
Real Assets
:
|
|
◦
|
Our strategic partner, NGP Energy Capital Management ("NGP"), launched fundraising for its twelfth fund and we continued fundraising for our open-ended core-plus real estate fund, our new global infrastructure opportunities fund and our eighth opportunistic U.S. real estate fund. In total, we closed on approximately
$10.2 billion
in new commitments to our Real Assets segment during 2017.
|
|
◦
|
During 2017, we invested $
4.4 billion
in our Real Assets segment. Of this amount, we invested approximately $2 billion to acquire or develop real estate properties, primarily in the U.S. across multiple sectors, including multifamily, commercial, senior living and for-sale residential properties. Our international energy team was particularly active during the year investing approximately $700
|
4
million. We also invested in oil and gas transactions and power generating facilities in the United States. In total, our natural resources platform invested
$2.3 billion
in 2017. We or NGP made investments in, among others, Assala Energy (a CIEP I portfolio company), Camino Natural Resources (an NGP XI and NGP XII portfolio company), Castell Oil Company (an NGP XI portfolio company), COG Energy (a CIEP I portfolio company), Lincoln Power, LLC (a CPP II portfolio company), NGP Vantage Energy (a NGP XI portfolio company), Titus Oil and Gas (an NGP XI portfolio company) and Mallard Exploration (a NGP XII portfolio company). Our European real estate team was also active in 2017 and focused on investments through four platforms: a co-working platform in London, a residential platform in Berlin, a French logistics platform and an Italian logistics platform.
|
◦
|
We realized proceeds of approximately
$4.6 billion
for our Real Assets carry fund investors in 2017 and exited (fully or partially) a number of assets, including, among others, 71 Smith Street (a CRP IV portfolio company), ITS Technologies and Logistics (a CIP portfolio company), Pattern Energy Group (a Renew II portfolio company), Red Oak Power Holdings (a CIP and CPP portfolio company), Riverside (a CRP VI portfolio company), Talen Energy Corporation (an Energy III and Renew II portfolio company), Terraform Power (a Renew II portfolio company) and Varo Energy (a CIEP I portfolio company).
|
|
◦
|
Our international energy team formed Regalwood Global Energy, a special purpose acquisition company (SPAC) that will be investing in oil and gas assets. In December 2017, the SPAC closed its initial public offering of 30 million units at $10 per unit and is actively seeking investments.
|
|
•
|
Global Credit
(formerly known as Global Market Strategies):
|
|
◦
|
We closed our fourth-generation distressed credit fund at
$2.5 billion
, closed our structured credit fund at more than $800 million, and raised approximately $750 million for our inaugural credit opportunities fund. We also continued fundraising for our direct lending platform across multiple vehicles, including two business development companies (BDCs). We closed four new collateralized loan obligations (“CLOs”) in the U.S. and three new CLOs in Europe in 2017, with
$20.2 billion
of AUM across all of our CLOs at
December 31, 2017
. In total, we raised more than
$6.6 billion
in new capital commitments for our Global Credit funds during 2017.
|
|
◦
|
TCG BDC Inc., the largest vehicle in our direct lending platform, was successfully listed on the NASDAQ Global Select Market in June 2017, in what was the largest initial public offering ever in its sector.
|
|
•
|
Investment Solutions
:
|
|
◦
|
During 2017, we deployed
$4.4 billion
in investments across our platform. We finalized our fundraising for our sixth AlpInvest secondaries program and our seventh AlpInvest co-investment program and successfully raised over $9 billion for these two strategies including amounts reserved for managed accounts. We also began to deploy capital out of both of these strategies during the year.
|
|
◦
|
We signed 11 new managed accounts, finished investing our first real estate secondaries fund and launched our second Metropolitan Real Estate secondaries fund. We also launched a new platform through AlpInvest focused on investments in general partners. This platform seeks to invest directly in middle market general partners globally.
|
|
◦
|
Our exit activity in our Investment Solutions segment was robust this year, realizing proceeds of $
9.6 billion
for our Investment Solutions investors.
|
Business Segments
We operate our business across four segments: (1) CPE, (2) Real Assets, (3) Global Credit and (4) Investment Solutions. Information about our segments should be read together with “Part II. Item 7. Management’s Discussion and Analysis of Financial Condition and Results of Operations.”
Although our corporate headquarters is based in the United States and a significant amount of our revenues are generated domestically, we have established investment vehicles whose primary focus is making investments in specified
5
geographical locations. Refer to “Information by Geographic Location” in Note 16 to the consolidated financial statements included in this Annual Report on Form 10-K for more information on consolidated revenues and assets based on the geographical focus of the associated investment vehicle.
Corporate Private Equity
Our CPE segment, established in 1990 with our first U.S. buyout fund, advises our buyout and growth capital funds that pursue a wide variety of corporate investments of different sizes and growth potentials. Our
33
active CPE funds are each carry funds. They are organized and operated by geography or industry and are advised by separate teams of local professionals who live and work in the markets where they invest. In our CPE segment we also have
57
active external co-investment entities. We believe this diversity of funds and entities allows us to deploy more targeted and specialized investment expertise and strategies and offers our fund investors the ability to tailor their investment choices.
Our CPE teams have two primary areas of focus:
|
•
|
Buyout Funds.
Our buyout teams advise a diverse group of
23
active funds that invest in transactions that focus either on a particular geography (e.g., United States, Europe, Asia, Japan, MENA, Sub-Saharan Africa or South America) or a particular industry, (e.g., financial services). In general, we expect the next generation of our large buyout funds to be meaningfully larger than their predecessor funds. In 2017, we held first closings for our seventh U.S. buyout fund, our fifth Asia buyout fund and our third global financial services fund. We invested
$10.3 billion
in new and follow-on investments through our buyout funds. As of
December 31, 2017
, our buyout funds had, in the aggregate, approximately
$66.5 billion
in AUM.
|
|
•
|
Growth Capital Funds.
Our
10
active growth capital funds are advised by four regionally-focused teams in the United States, Europe and Asia, with each team generally focused on middle-market and growth companies consistent with specific regional investment considerations. The investment mandate for our growth capital funds is to seek out companies with the potential for growth, strategic redirection and operational improvements. These funds typically do not invest in early stage or venture-type investments. We invested
$0.8 billion
in new and follow-on investments through our growth capital funds. As of
December 31, 2017
, our growth capital funds had, in the aggregate, approximately
$6.0 billion
in AUM.
|
From inception through
December 31, 2017
, our CPE segment has invested approximately
$87 billion
in
601
investments. Of that total, we have invested
59%
in
293
investments in North and South America,
23%
in
144
investments in Europe, the Middle East and Africa and
18%
in
164
investments in the Asia-Pacific region. We have fully realized
423
of these investments, meaning that our funds have completely exited, and no longer own an interest in, those investments.
The following table presents certain data about our CPE segment as of
December 31, 2017
(dollar amounts in billions; amounts invested include co-investments).
|
AUM
|
% of Total
AUM
|
Fee-earning
AUM
|
Active
Investments
|
Active
Funds
|
Available
Capital
|
Investment
Professionals
|
Amount Invested
Since Inception
|
Investments Since
Inception
|
||||||||
|
$73
|
37%
|
$36
|
178
|
33
|
$30
|
308
|
$87
|
601
|
||||||||
Real Assets
Our Real Assets segment, established in 1997 with our first U.S. real estate fund, advises our
29
active carry funds focused on real estate, infrastructure and energy and natural resources (including power) and also includes the
five
NGP management fee funds and
four
carry funds that are advised by NGP. This segment pursues investment opportunities across a diverse array of tangible assets, such as office buildings, hotels, retail and residential properties, industrial properties and senior living facilities, as well as oil and gas exploration and production, midstream, refining and marketing, power generation, pipelines, wind farms, refineries, airports, toll roads, transportation, water utility and agriculture, as well as the companies providing services or otherwise related to them.
6
Our Real Assets teams have two primary areas of focus:
|
•
|
Real Estate.
Our
eleven
active real estate funds pursue real estate investment opportunities in Asia, Europe and the United States and generally focus on acquiring single-property assets rather than large-cap companies with real estate portfolios. Our team of 115 real estate investment professionals has made more than 850 investments in
397
cities/metropolitan statistical areas around the world as of
December 31, 2017
, including office buildings, hotels, retail and residential properties, industrial properties, warehouse and logistic assets and senior living facilities. In 2017, we held a first close on our eighth opportunistic U.S. real estate fund and closed a series of coinvestment transactions in our European real estate business. As of
December 31, 2017
, our real estate funds had, in the aggregate, approximately
$18.3 billion
in AUM.
|
|
•
|
Energy and Natural Resources.
Our energy and natural resources activities focus on buyouts, growth capital investments and strategic joint ventures in the midstream, upstream, energy and oilfield services sectors, the renewable and alternative sectors and the power and infrastructure industries around the world. Historically, we conducted our energy investing activities jointly with Riverstone, co-advising
four
funds with approximately
$5.2 billion
in AUM as of
December 31, 2017
(we refer to these energy funds as our “Legacy Energy funds”). Currently, we conduct our North American energy investing through our partnership with NGP, an Irving, Texas-based energy investor. NGP advises
nine
funds with more than
$13.0 billion
in AUM as of
December 31, 2017
. Through our strategic partnership with NGP, we are entitled to 55% of the management fee-related revenue of the NGP entities that serve as advisors to the NGP management fee funds, and an allocation of income related to the carried interest received by such fund general partners. Our power team focuses on investment opportunities in the North American power generation sector. As of
December 31, 2017
, the power team managed approximately
$2.0 billion
in AUM through
two
funds. Our international energy investment team focuses on investments across the energy value chain outside of North America. As of
December 31, 2017
, the international energy team managed approximately
$3.6 billion
in AUM through
one
fund. In 2017, we held our first closing for our global infrastructure fund focused on infrastructure assets, business and investments in global developed markets. As of December 31, 2017, the global infrastructure team managed more than
$0.8 billion
in AUM through
two
funds. We have also invested previously in North American infrastructure companies and assets.
|
Our Real Assets carry funds, including Carlyle-advised co-investment vehicles, have, from inception through
December 31, 2017
, invested on a global basis more than
$49 billion
in
1,039
investments, including nearly 200 portfolio companies. Of that total, we have invested
79%
in
869
investments in North and South America,
16%
in
120
investments in Europe, the Middle East and Africa and
5%
in
50
investments in the Asia-Pacific region. We have fully realized
636
of these investments, meaning that our funds have completely exited, and no longer own an interest in, those investments.
The following table presents certain data about our Real Assets segment as of
December 31, 2017
(dollar amounts in billions; amounts invested include co-investments).
|
AUM
|
% of Total
AUM
|
Fee-earning
AUM
|
Active
Investments (2)
|
Active
Funds (3)
|
Available
Capital
|
Investment
Professionals (1)
|
Amount Invested
Since Inception(2)
|
Investments Since
Inception(2)
|
||||||||
|
$43
|
22%
|
$32
|
403
|
29
|
$17
|
144
|
$49
|
1,039
|
||||||||
|
(1)
|
Excludes NGP and Riverstone employees.
|
|
(2)
|
Excludes investment activity of the NGP management fee funds.
|
|
(3)
|
Includes the
five
NGP management fee funds and
four
carry funds advised by NGP.
|
Global Credit
Our Global Credit segment, established in 1999 with our first high yield fund, advises a group of
58
active funds that pursue investment strategies including loans & structured credit, direct lending, opportunistic credit, energy credit and distressed credit. In 2017, we hired several new senior investment professionals to expand Global Credit's investment breadth and geographical presence, including a new head of the opportunistic credit strategy. In early 2018, we rebranded our Global Market Strategies business to "Global Credit" to better align the name of the business segment with its investment focus. We plan to pursue new initiatives from our Global Credit platform that will continue to expand our capabilities in credit.
7
Primary areas of focus for our Global Credit platform include:
|
•
|
Loans and Structured Credit.
Our structured credit funds invest primarily in performing senior secured bank loans through structured vehicles and other investment vehicles. In 2017, we closed four new U.S. CLOs and three CLOs in Europe with a total of
$2.4 billion
and
$1.5 billion
, respectively, of AUM at
December 31, 2017
. As of
December 31, 2017
, our loans and structured credit team advised
46
structured credit funds and
two
carry funds in the United States, Europe and Asia totaling, in the aggregate, approximately
$21.6 billion
in AUM.
|
|
•
|
Direct Lending.
Our direct lending business includes our business development companies (“BDCs”) that invest primarily in middle market first-lien loans (which include unitranche, "first out" and "last out" loans) and second-lien loans of middle-market companies, typically defined as companies with annual EBITDA ranging from $10 million to $100 million, that lack access to the broadly syndicated loan and bond markets. As of
December 31, 2017
, our direct lending investment team advised
four
funds consisting of two BDCs, a CLO and one corporate mezzanine fund, totaling, in the aggregate, more than
$2.9 billion
in AUM.
|
|
•
|
Opportunistic Credit.
Our opportunistic credit team invests primarily in highly-structured and privately-negotiated capital solutions supporting corporate borrowers through secured loans, senior subordinated debt, mezzanine debt, convertible notes, and other debt like instruments, as well as preferred and common equity in such borrowers. The team will also look to invest in special situations (i.e., event-driven opportunities that exhibit hybrid credit and equity features) as well as market dislocations (i.e., primary and secondary market investments in liquid debt instruments that arise as a result of temporary market volatility). As of December 31, 2017, our opportunistic credit team advised
one
fund totaling, in the aggregate, approximately
$0.8 billion
in AUM.
|
|
•
|
Energy Credit
. Our Energy credit team invests primarily in privately-negotiated mezzanine debt investments in North American energy and power projects and companies. As of December 31, 2017, our energy credit team advised
two
funds with approximately
$4.7 billion
in AUM.
|
|
•
|
Distressed Credit.
Our distressed credit funds generally invest in liquid and illiquid securities and obligations, including secured debt, senior and subordinated unsecured debt, convertible debt obligations, preferred stock and public and private equity of financially distressed companies in defensive and asset-rich industries. In certain investments, our funds may seek to restructure pre-reorganization debt claims into controlling positions in the equity of the reorganized companies. As of
December 31, 2017
, our distressed credit team advised
three
funds totaling, in the aggregate, more than
$3.4 billion
in AUM.
|
The following table presents certain data about our Global Credit segment as of
December 31, 2017
(dollar amounts in billions).
|
AUM
|
% of Total
AUM
|
Fee-earning
AUM
|
Active
Funds
|
Investment
Professionals
|
||||
|
$33
|
17%
|
$27
|
58
|
109
|
||||
Investment Solutions
Our Investment Solutions segment, established in 2011, provides comprehensive investment opportunities and resources for our investors and clients to build private equity and real estate portfolios through fund of funds, secondary purchases of existing portfolios and managed co-investment programs. Investment Solutions executes these activities through AlpInvest, one of the world’s largest investors in private equity, and Metropolitan, one of the largest managers of indirect investments in global real estate.
The primary areas of focus for our Investment Solutions teams include:
|
•
|
Private Equity Fund Investments.
Our fund of funds vehicles advised by AlpInvest make investment commitments directly to buyout, growth capital, venture and other alternative asset funds advised by other general partners (“portfolio funds”). As of
December 31, 2017
, AlpInvest advised
67
vehicles totaling, in the aggregate, approximately
$24.9 billion
in AUM.
|
|
•
|
Private Equity Co-investments.
AlpInvest invests alongside other private equity and mezzanine funds in which it typically has a primary fund investment throughout Europe, North America and Asia. These investments are generally made when an investment opportunity is too large for a particular fund and the sponsor of the fund
|
8
therefore seeks to raise additional “co-investment” capital from sources such as AlpInvest. As of
December 31, 2017
, our co-investment programs were conducted through
49
vehicles totaling, in the aggregate, approximately
$8.4 billion
in AUM.
|
•
|
Private Equity Secondary Investments.
Funds managed by AlpInvest acquire limited partnership interests in the secondary market. Private equity investors who desire to sell or restructure their pre-existing investment commitments to a fund may negotiate to sell the fund interests to AlpInvest. In this manner, AlpInvest’s secondary investments team provides liquidity and restructuring alternatives for third-party private equity investors. As of
December 31, 2017
, our secondary investments program was conducted through
50
vehicles totaling, in the aggregate, more than
$11.2 billion
in AUM.
|
|
•
|
Real Estate Funds of Funds and Co-Secondary Investments.
The principal strategic focus in our real estate funds is on value add/opportunistic real estate investments through direct commitments to 90 highly-focused, specialist real estate managers across the globe. As of
December 31, 2017
, we advised
31
real estate vehicles with approximately
$1.8 billion
in AUM. We also focus on real estate secondaries and co-investments.
|
The following table presents certain data about our Investment Solutions segment as of
December 31, 2017
(dollar amounts in billions). See “— Structure and Operation of Our Investment Funds — Incentive Arrangements/Fee Structure” in this Item 1 for a discussion of the arrangements with the historical owners and management of AlpInvest regarding the allocation of carried interest in respect of the historical investments of and the historical and certain future commitments to our AlpInvest carry fund vehicles.
|
AUM(1)
|
% of Total
AUM
|
Fee-earning
AUM
|
Fund
Vehicles
|
Available
Capital
|
Investment
Professionals
|
Amount Invested
Since Inception
|
||||||
|
$46
|
24%
|
$30
|
197
|
$16
|
86
|
$67
|
||||||
|
(1)
|
Under our arrangements with the historical owners and management team of AlpInvest, we generally do not retain any carried interest in respect of the historical investments and commitments to our AlpInvest carry fund vehicles that existed as of July 1, 2011 (including any options to increase any such commitments exercised after such date). We are entitled to 15% of the carried interest in respect of commitments from the historical owners of AlpInvest for the period between 2011 and 2020 and 40% of the carried interest in respect of all other commitments (including all future commitments from third parties).
|
Investment Approach
Corporate Private Equity
The investment approach of our CPE teams is generally characterized as follows:
|
•
|
Consistent and Disciplined Investment Process.
We believe our successful investment track record is the result, in part, of a consistent and disciplined application of our investment process. Investment opportunities for our CPE funds are initially sourced and evaluated by one or more of our deal teams. Deal teams consistently strive to be creative and look for deals in which we can leverage Carlyle's competitive advantages, sector experience and the global One Carlyle platform. The due diligence and transaction review process places a special emphasis on, among other considerations, the reputation of a target company’s shareholders and management, the company’s size and sensitivity of cash flow generation, the business sector and competitive risks, the portfolio fit, exit risks and other key factors specific to a particular investment. In evaluating each deal, we consider what expertise or experience (i.e., the “Carlyle Edge”) we can bring to the transaction to enhance value for our investors. Each investment opportunity must secure approval from the investment committee of the applicable investment fund to move forward. To help ensure consistency, we utilize a standard investment committee process across our corporate private equity funds. The investment committee approval process involves a detailed review of the transaction and investment thesis, business, risk factors and diligence issues, as well as financial models.
|
|
•
|
Geographic- and Industry-Focused.
We have developed a global network of local investment teams with deep local insight into the areas in which they invest and have adopted an industry-focused approach to investing. Our extensive network of global investment professionals has the knowledge, experience and relationships on a local level that allow them to identify and take advantage of opportunities that may be unavailable to firms that do not have our global reach and resources. We believe that our global platform helps enhance all stages of the investment process, including by facilitating faster and more effective diligence, a deeper understanding of global
|
9
industry trends and priority access to the capital markets. We have particular industry expertise in aerospace, defense and government services, consumer and retail, financial services, healthcare, industrial, telecom, media and technology and transportation. As a result, we believe that our in-depth knowledge of specific industries improves our ability to source and create transactions, conduct effective and more informed due diligence, develop strong relationships with management teams and use contacts and relationships within these industries to drive value creation.
|
•
|
Variable Deal Sizes and Creative Structures.
We believe that having the resources to complete investments of varying sizes provides us with the ability to enhance investment returns while providing for prudent industry, geographic and size diversification. Our teams are staffed not only to effectively pursue large transactions, but also other transactions of varying sizes. We often invest in smaller companies and this has allowed us to obtain greater diversity across our entire portfolio. Additionally, we may undertake large, strategic minority investments with certain control elements or private investment in public equity (PIPE) transactions in large companies with a clear exit strategy. In certain jurisdictions around the world, we may make investments with little or no debt financing and seek alternative structures to opportunistically pursue transactions. We generally seek to obtain board representation and typically appoint our investment professionals and advisors to represent us on the boards of the companies in which we invest. Where our funds, either alone or as part of a consortium, are not the controlling investor, we typically, subject to applicable regulatory requirements, acquire significant voting and other control rights with a view to securing influence over the conduct of the business.
|
|
•
|
Driving Value Creation.
Our CPE teams seek to make investments in portfolio companies in which our particular strengths and resources may be employed to their best advantage. Typically, as part of a CPE investment, our investment teams will prepare and execute a value creation plan that is developed during a thorough due diligence effort and draws on the deep resources available across our global platform, specifically relying on:
|
|
◦
|
Reach:
Our global team and global presence enables us to support international expansion efforts and global supply chain initiatives.
|
|
◦
|
Expertise:
Our deep bench of investment professionals and industry specialists provide extensive sector-specific knowledge and local market expertise.
|
|
◦
|
Insight:
We engage approximately 30 operating executives as independent consultants to work with our investment teams during due diligence, provide board-level governance and support and advise our portfolio company CEOs. These operating executives are former CEOs and other high-level executives of some of the world’s most successful corporations and currently sit on the boards of directors of a diverse mix of companies. We use this collective group of operating executives to provide special expertise to support specific value creation initiatives.
|
|
◦
|
Data:
The goal of our research function is to extract as much information as possible from our portfolio about the current state of the economy and its likely evolution over the near-to-medium term. Our CPE investment portfolio includes over 175 active portfolio companies as of
December 31, 2017
, across a diverse range of industries and geographies that each generate multiple data points (e.g., orders, shipments, production volumes, occupancy rates, bookings). By evaluating these data on a systematic basis, we work to identify the data with the highest correlation with macroeconomic data and map observed movements in the portfolio to anticipated variation in the economy, including changes in growth rates across industries and geographies. We incorporate this proprietary data into our investment portfolio management strategy and exit decisions on an ongoing basis. We believe this robust data gives us an advantage over our peers who do not have as large of a global reach.
|
|
◦
|
Information Technology Resources
: Carlyle has established an Information Technology (“IT”) capability that contributes to due diligence, portfolio company strategy and portfolio company operations. The capability includes dedicated information technology and business process resources, including assistance with portfolio company risk assessments and enhanced deal analytics.
|
|
◦
|
Pursuing Best Exit Alternatives.
In determining when to exit an investment, our private equity teams consider whether a portfolio company has achieved its objectives, the financial returns and the appropriate timing in industry cycles and company development to strive for the optimal value. The fund’s investment committee approves all exit decisions.
|
10
Real Assets
Our Real Assets business includes investments in real estate assets, infrastructure and energy and natural resources (including power) companies and projects. The investment approach of the teams advising the international energy, power and infrastructure funds is similar to that of our CPE funds.
Generally, the investment approach of our real estate teams is characterized as follows:
|
•
|
Pursue Single Asset Transactions.
In general, our U.S. real estate funds have focused on single asset transactions. We follow this approach in the U.S. because we believe that pursuing single assets enables us to better understand the factors that contribute to the fundamental value of each property, mitigate concentration risk, establish appropriate asset-by-asset capital structures and maintain governance over major property-level decisions. In addition, the direct ownership of assets typically enables us to effectively employ an active asset management approach and reduce financing and operating risk, while increasing the visibility of factors that affect the overall returns of the investment. In the U.S., we plan to continue to focus on single asset transactions in both our opportunistic and core plus investment strategies. Outside the U.S., we continue to opportunistically invest in the Asia and European markets.
|
|
•
|
Seek out Strong Joint Venture Partners or Managers.
Where appropriate, we seek out joint venture partners or managers with significant operational expertise and/or deal sourcing capability. For each joint venture, we design structures and terms to align interests and provide situationally appropriate incentives, often including, for example, the subordination of the joint venture partner’s equity and profits interest to that of a fund, giveback provisions and/or profits escrow accounts in favor of a fund and exclusivity. We also typically structure positions with control or veto rights over major decisions.
|
|
•
|
Source Deals Directly.
Our teams endeavor to establish “market presence” in our target geographies where we have a history of operating in local markets and benefit from extensive long-term relationships with developers, corporate real estate owners, institutional investors and private owners. These relationships have resulted in our ability to source a large number of investments on a direct negotiated basis.
|
|
•
|
Focus on Sector-Specific Strategies.
Our real estate funds focus on specific sectors and markets in areas where we believe the fundamentals are sound and dynamic capital markets allow for identification of assets whose value is not fully recognized. The real estate funds we advise have invested according to strategies established in several main sectors: office, hotel, retail, residential, industrial, warehouse and logistics and senior living.
|
|
•
|
Actively Manage our Real Estate Investments.
Our real estate investments often require active management to uncover and create value. Accordingly, we have put in place experienced local asset management teams to assist in communicating with operating partners and property managers on a regular basis. These teams add value through analysis and execution of capital expenditure programs, development projects, lease negotiations, operating cost reduction programs and asset dispositions. The asset management teams work closely with the other real estate professionals to effectively formulate and implement strategic management plans.
|
|
•
|
Manage the Exit of Investments.
We believe that “exit management” is as important as traditional asset management in order to take full advantage of the typically short windows of opportunity created by temporary imbalances in capital market forces that affect real estate. In determining when to exit an investment, our real estate teams consider whether an investment has fulfilled its strategic plan, the depth of the market and generally prevailing industry conditions. Throughout our investment holding period, our investment professionals remain actively engaged in and focused on managing the steps needed to proceed to a successful exit.
|
Our energy and natural resources activities primarily focus on four areas: international energy, North American energy, power and infrastructure.
|
•
|
International Energy Investing.
Our international energy team pursues investment opportunities in oil and gas exploration and production, midstream, oilfield services and refining and marketing in Europe, Africa, Latin America and Asia. Seeking to take advantage of the lack of capital in the international energy market, we pursue transactions where we have a distinctive competitive advantage and can create tangible value for the companies in which we invest, through industry specialization, deployment of human capital and access to our global network. In seeking to build a geographically-diverse international energy portfolio, we focus on cash-generating opportunities, with a particular focus on proven reserves and production, and strategically seek to enhance the efficiency of the portfolio through exploration or infrastructure improvements. We may pursue investment
|
11
opportunities of variable size, and utilize alternative structures and sources of capital, including incorporating blank check companies to invest alongside our funds to effectively pursue large transactions.
|
•
|
North American Energy Investing.
We conduct our current North American energy investing through our strategic partnership with NGP, an Irving, Texas-based energy investment firm that focuses on investments across a range of energy and natural resource assets, including oil and gas resources, oilfield services, pipelines and processing, as well as agricultural investments and properties. NGP seeks to align itself with “owner-managers” who are invested in the enterprise, have a top-tier technical team and who have a proprietary edge that differentiates their business plan. NGP strives to establish a portfolio of platform companies to grow through acquisitions and development and provides financial and strategic support and access to additional capital at the lowest cost. We do not control or manage the NGP management fee funds or the existing carry funds that are advised by NGP. NGP is managed by its senior leadership.
|
|
•
|
Power Investing.
Our power team focuses on investment opportunities in the North American power generation sector. Leveraging the expertise of the investment professionals at Cogentrix Energy L.L.C., one of our portfolio companies, the team seeks investments where it can obtain direct or indirect operational control to facilitate the implementation of technical enhancements. We seek to capitalize on secular trends and to identify assets where engineering and technical expertise, in addition to a strong management team, can facilitate performance.
|
|
•
|
Global Infrastructure Investing.
Our global infrastructure team pursues investments across a variety of sectors and geographies. The fund team targets investment opportunities primarily domiciled in developed markets with strong commercial systems and rule of law. The team utilizes a value-added approach to transaction sourcing, diligence and asset management and seeks to generate attractive risk-adjusted returns for the fund. The team seeks to enhance the value of its investments through strategic and operational impact including risk management techniques utilized across Carlyle's global corporate private equity and natural resources investment businesses. The goal of this approach is to increase the profitability of the investments, increase cash flow yield and enhance the attractiveness of the asset for ultimate exit to a trade buyer, core infrastructure buyer or the public markets.
|
Global Credit
The investment approach of our Global Credit platform's credit-focused funds is generally characterized as follows:
|
•
|
Source Investment Opportunities.
Our Global Credit team sources investment opportunities from both the primary and secondary markets through our global network and strong relationships with the financial community. We typically target portfolio companies that have a demonstrated track record of profitability, market leadership in their respective niche, predictable cash flow, a definable competitive advantage and products or services that are value added to its customer base.
|
|
•
|
Conduct Fundamental Due Diligence and Perform Capital Structure Analyses
. After an opportunity is identified, our Global Credit investment professionals conduct fundamental due diligence to determine the relative value of the potential investment and capital structure analyses to determine credit worthiness. Our due diligence approach typically incorporates meetings with management, company facility visits, discussions with industry analysts and consultants and an in-depth examination of financial results and projections. In conducting due diligence, our Global Credit team employs an integrated, cross platform approach with industry-dedicated credit research analysts and non-investment grade expertise across the capital structure. Our Global Credit team also seeks to leverage resources from across the firm, utilizing information obtained from our more than 270 active portfolio companies and lending relationships with over 700 companies, 13 credit industry research analysts, and in-house government affairs and economic research teams.
|
|
•
|
Evaluation of Macroeconomic Factors.
Our Global Credit team evaluates technical factors such as supply and demand, the market’s expectations surrounding a company and the existence of short- and long-term value creation or destruction catalysts. Inherent in all stages of credit evaluation is a determination of the likelihood of potential catalysts emerging, such as corporate reorganizations, recapitalizations, asset sales, changes in a company’s liquidity and mergers and acquisitions.
|
|
•
|
Risk Minimization.
Our Global Credit team seeks to make investments in capital structures to enable companies to both expand and weather downturns and/or below-plan performance. The team works to structure investments with strong financial covenants, frequent reporting requirements and board representation, if possible. Through
|
12
board representation or observation rights, our Global Credit team works to provide a consultative, interactive approach to equity sponsors and management partners as part of the overall portfolio management process.
Investment Solutions
Our Investment Solutions team aims to apply a wide array of capabilities to help clients meet their investment objectives. The investment approach of our Investment Solutions platform is generally characterized as follows:
|
•
|
Well-informed, Disciplined Investment Process
: We follow a disciplined, highly-selective investment process and seek to achieve diversification by deploying capital across economic cycles, segments and investment styles. Our integrated and collaborative culture across our strategies, reinforced by investment in information technology solutions, provides deep insight into fund manager portfolios and operations to support our rigorous selection process.
|
|
•
|
Proactive Sourcing
: Our extensive network of private equity and real estate managers across the globe positions us to identify investment opportunities that may be unavailable to other investors. Our investment strategy is defined by a strong belief that the best opportunities are found in areas that are less subject to competitive pressures. As a result, our teams actively seek out proprietary investments that would otherwise be difficult for our investors to access.
|
|
•
|
Global Scale and Presence
: Our scale and on-the-ground presence across three continents - Asia, Europe and North America - give us a distinct and comprehensive perspective on the private equity and real estate markets. Our stable, dedicated, and experienced teams have deep knowledge of their respective markets across the globe. We believe this enhances our visibility across the global investment market and provides detailed local information that enhances our investment evaluation process.
|
Our Family of Funds
The following chart presents the name (acronym), total capital commitments (in the case of our carry funds, structured credit funds, and the NGP management fee funds), assets under management (in the case of structured products), gross assets (in the case of our business development companies) and vintage year of the active funds in each of our segments, as of
December 31, 2017
. We present total capital commitments (as opposed to assets under management) for our closed-end investment funds because we believe this metric provides the most useful information regarding the relative size and scale of such funds. In the case of our products which are open-ended and accordingly do not have permanent committed capital, we generally believe the most useful metric regarding relative size and scale is assets under management.
|
Corporate Private Equity
|
Global Credit
|
Real Assets
|
||||||||
|
Buyout Carry Funds
|
Loans & Structured Credit
|
Real Estate Carry Funds
|
||||||||
|
Carlyle Partners (U.S.)
|
Cash CLO's
|
Carlyle Realty Partners (U.S.)
|
||||||||
|
CP VII
|
$14.1 bn
|
2017
|
U.S.
|
$16.4 bn
|
2006-2017
|
CRP VIII
|
$5.0 bn
|
2017
|
||
|
CP VI
|
$13.0 bn
|
2014
|
Europe
|
€8.5 bn
|
2005-2017
|
CRP VII
|
$4.2 bn
|
2014
|
||
|
CP V
|
$13.7 bn
|
2007
|
Structured Credit Carry Funds
|
CRP VI
|
$2.3 bn
|
2011
|
||||
|
CP IV
|
$7.9 bn
|
2005
|
CSC
|
$838 mm
|
2016
|
CRP V
|
$3.0 bn
|
2006
|
||
|
Global Financial Services Partners
|
CASCOF
|
$445 mm
|
2015
|
CRP IV
|
$950 mm
|
2005
|
||||
|
CGFSP III
|
$491 mm
|
2017
|
Direct Lending
|
CRP III
|
$564 mm
|
2001
|
||||
|
CGFSP II
|
$1.0 bn
|
2013
|
Business Development Companies
1
|
Carlyle Europe Real Estate Partners
|
||||||
|
CGFSP I
|
$1.1 bn
|
2008
|
TCG BDC II, Inc.
|
$570 mm
|
2017
|
CER
|
€99 mm
|
2017
|
||
|
Carlyle Europe Partners
|
TCG BDC, Inc.
|
$2.0 bn
|
2013
|
CEREP III
|
€2.2 bn
|
2007
|
||||
|
CEP IV
|
€3.7 bn
|
2014
|
Corporate Mezzanine Carry Fund
|
Carlyle Asia Real Estate Partners
|
||||||
|
CEP III
|
€5.3 bn
|
2007
|
CMP II
|
$553 mm
|
2008
|
CCR
|
$120 mm
|
2016
|
||
|
CEP II
|
€1.8 bn
|
2003
|
Opportunistic Credit Carry Fund
|
CAREP II
|
$486 mm
|
2008
|
||||
|
Carlyle Asia Partners
|
CCOF
|
$757 mm
|
2017
|
Core Plus Real Estate (U.S.)
|
||||||
|
CAP V
|
$4.7 bn
|
2017
|
Energy Credit Carry Funds
|
CPI
|
$1.1 bn
|
2016
|
||||
|
CBPF II
|
RMB 301 mm
|
2017
|
CEMOF II
|
$2.8 bn
|
2015
|
Natural Resources Funds
|
||||
|
CAP IV
|
$3.9 bn
|
2014
|
CEMOF I
|
$1.4 bn
|
2011
|
Infrastructure Carry Fund
|
||||
|
CBPF I
|
RMB 2.0 bn
|
2010
|
Distressed Credit Carry Funds
|
CGIOF
|
$756 mm
|
2017
|
||||
|
CAP III
|
$2.6 bn
|
2008
|
CSP IV
|
$2.5 bn
|
2016
|
CIP I
|
$1.1 bn
|
2006
|
||
|
CAP II
|
$1.8 bn
|
2006
|
CSP III
|
$703 mm
|
2011
|
Power Carry Funds
|
||||
|
Carlyle Japan Partners
|
CSP II
|
$1.4 bn
|
2007
|
CPP II
|
$1.5 bn
|
2014
|
||||
|
CJP III
|
¥119.5 bn
|
2013
|
CPOCP
|
$478 mm
|
2013
|
|||||
|
CJP II
|
¥165.6 bn
|
2006
|
International Energy Carry Fund
|
|||||||
|
Carlyle MENA Partners
|
Investment Solutions
|
CIEP I
|
$2.5 bn
|
2013
|
||||||
|
MENA I
|
$471 mm
|
2008
|
AlpInvest
|
NGP Energy Carry Funds
|
||||||
|
Carlyle South American Buyout Fund
|
Fund of Private Equity Funds
|
NGP XII
|
$2.8 bn
|
2017
|
||||||
|
CSABF I
|
$776 mm
|
2009
|
67 vehicles
|
€41.6 bn
|
2000-2017
|
NGP XI
|
$5.3 bn
|
2014
|
||
|
Carlyle Sub-Saharan Africa Fund
|
Secondary Investments
|
NGP X
|
$3.6 bn
|
2012
|
||||||
|
CSSAF I
|
$698 mm
|
2012
|
50 vehicles
|
€14.7 bn
|
2000-2017
|
NGP Agribusiness Carry Fund
|
||||
|
Carlyle Peru Fund
|
Co-Investments
|
NGP GAP
|
$402 mm
|
2014
|
||||||
|
CPF I
|
$308 mm
|
2012
|
49 vehicles
|
€14.4 bn
|
2000-2017
|
NGP Management Fee Funds
|
||||
|
Carlyle Global Partners
|
Metropolitan Real Estate
|
Various
2
|
$7.2 bn
|
2004-2008
|
||||||
|
CGP
|
$3.6 bn
|
2015
|
Real Estate Fund of Funds
|
Legacy Energy Carry Funds
|
||||||
|
Growth Carry Funds
|
31 vehicles
|
$3.6 bn
|
2002-2017
|
Carlyle/Riverstone Global Energy
|
||||||
|
Carlyle U.S. Venture/Growth Partners
|
Energy IV
|
$6.0 bn
|
2008
|
|||||||
|
CEOF II
|
$2.4 bn
|
2015
|
Energy III
|
$3.8 bn
|
2005
|
|||||
|
CEOF I
|
$1.1 bn
|
2011
|
Energy II
|
$1.1 bn
|
2003
|
|||||
|
CUSGF III
|
$605 mm
|
2006
|
Carlyle/Riverstone Renewable Energy
|
|||||||
|
CVP II
|
$602 mm
|
2001
|
Renew II
|
$3.4 bn
|
2008
|
|||||
|
Carlyle Europe Technology Partners
|
||||||||||
|
CETP III
|
€657 mm
|
2014
|
||||||||
|
CETP II
|
€522 mm
|
2008
|
||||||||
|
Carlyle Asia Venture/Growth Partners
|
||||||||||
|
CAGP V
|
$292 mm
|
2017
|
||||||||
|
CAGP IV
|
$1.0 bn
|
2008
|
||||||||
|
CAGP III
|
$680 mm
|
2005
|
||||||||
|
Carlyle Cardinal Ireland
|
||||||||||
|
CCI
|
€292 mm
|
2014
|
||||||||
Note: All amounts shown represent total capital commitments as of
December 31, 2017
, unless otherwise noted. Certain of our recent vintage funds are currently in fundraising and total capital commitments are subject to change. In addition, certain carry funds included herein may be disclosed which are not included in fund performance if they have not made an initial capital call.
|
(1)
|
Amounts represent gross assets plus any available capital as of
December 31, 2017
.
|
|
(2)
|
Includes NGP ETP I, NGP M&R, NGP ETP II, NGP VIII and NGP IX.
|
13
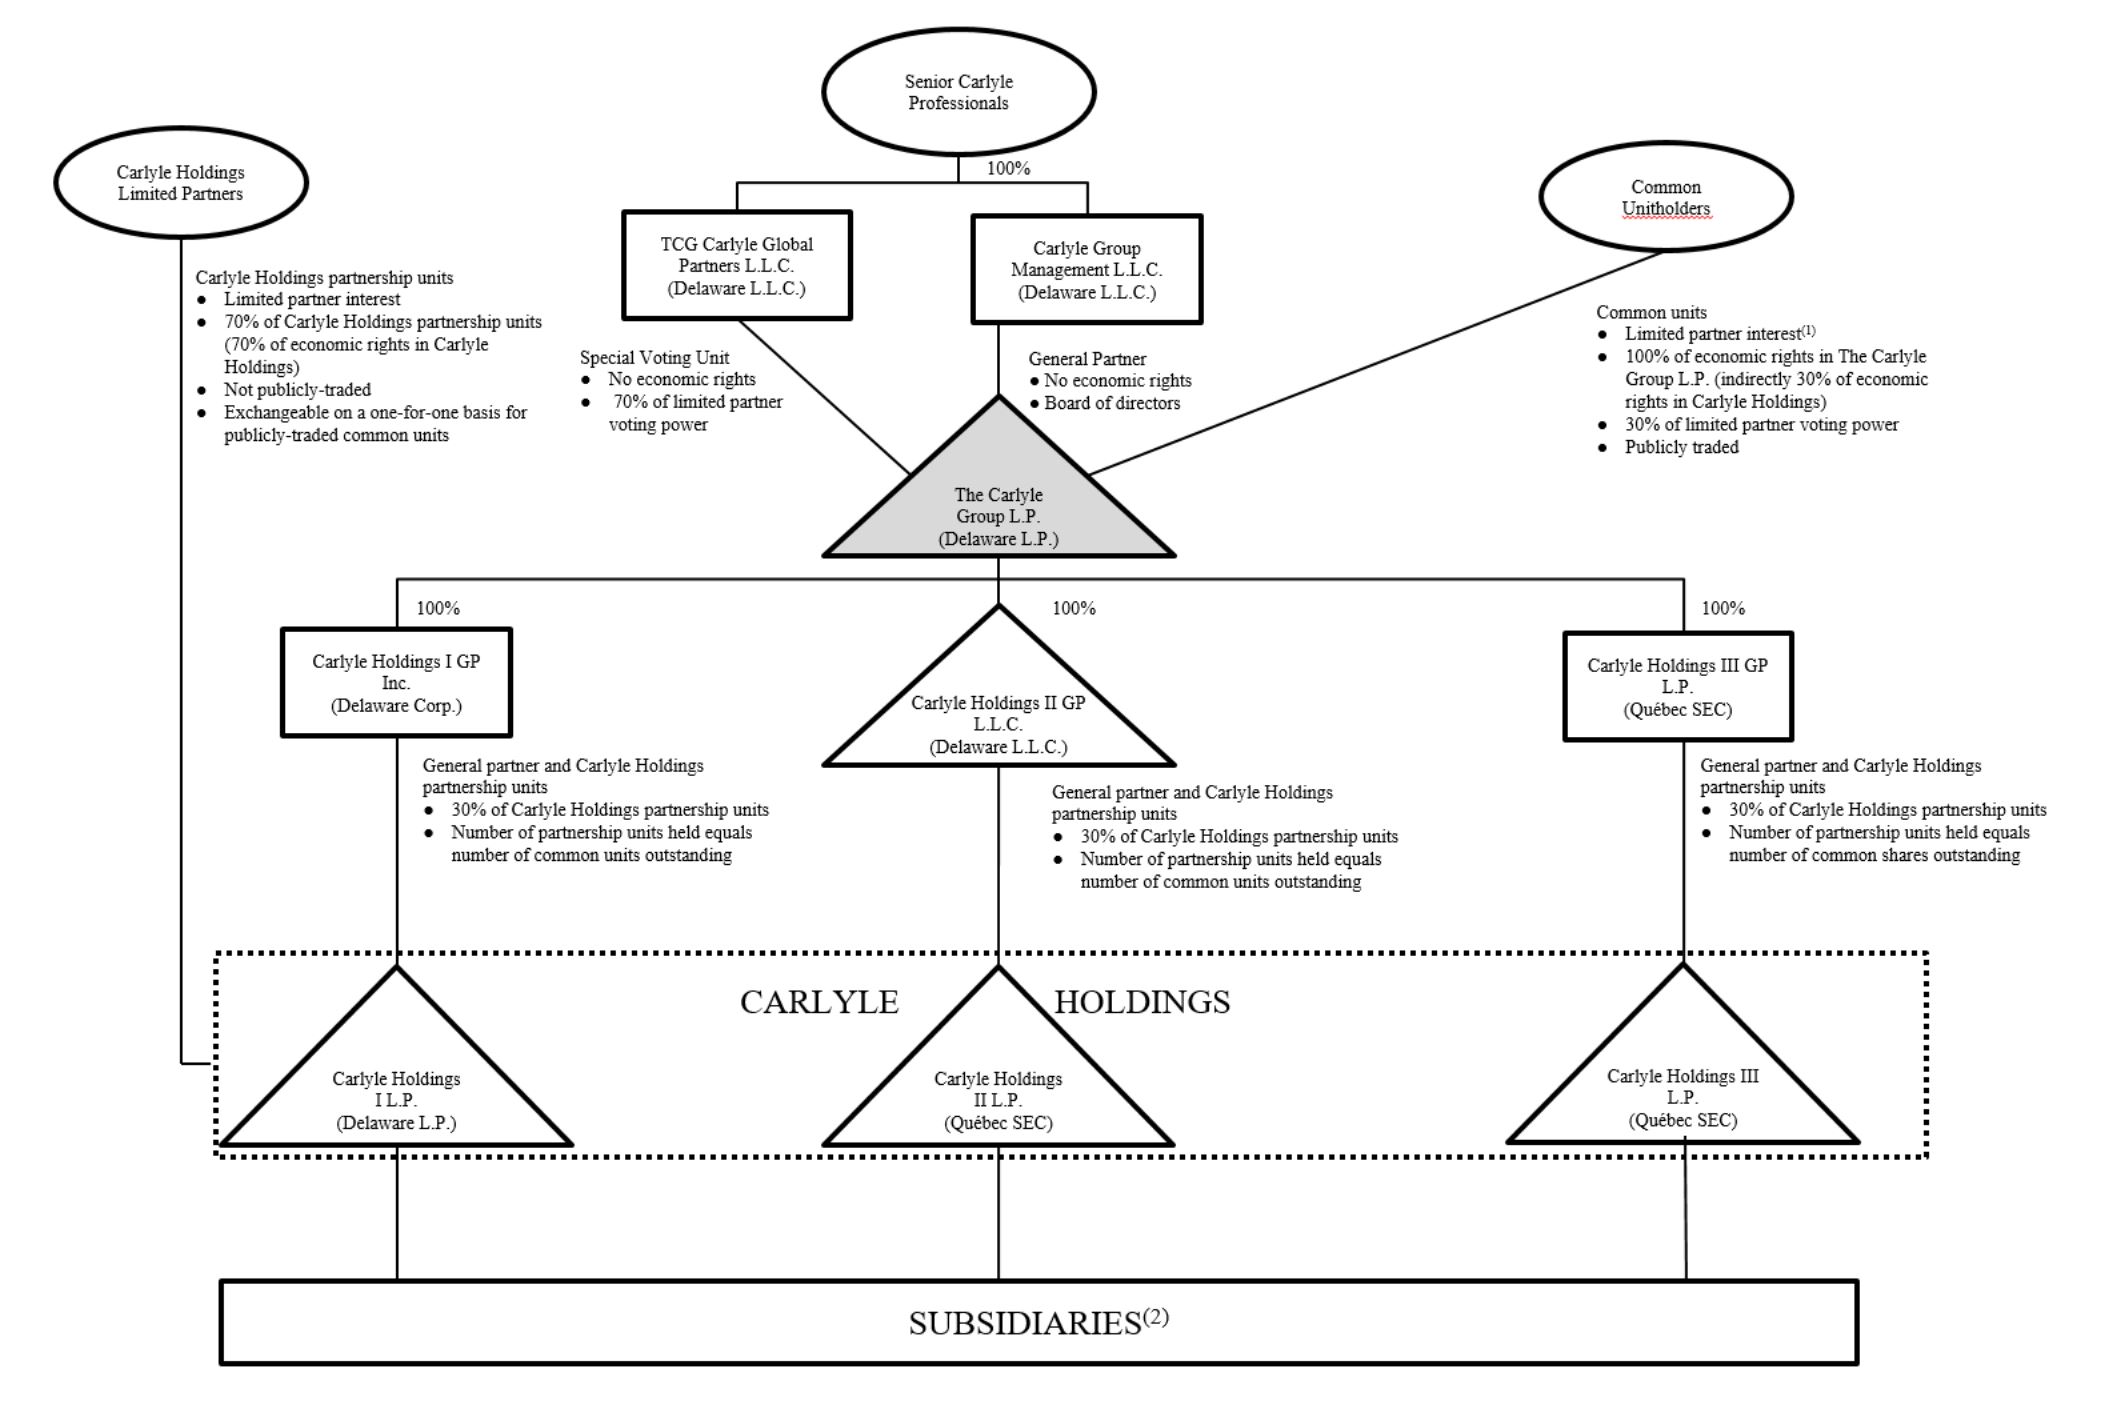
Organizational Structure
The simplified diagram below depicts our organizational structure. Ownership information in the diagram below is presented as of December 31, 2017. The diagram does not depict all of our subsidiaries, including intermediate holding companies through which certain of the subsidiaries depicted are held. As discussed in greater detail below, The Carlyle Group L.P. holds, through wholly owned subsidiaries, a number of Carlyle Holdings partnership units that is equal to the number of common units that The Carlyle Group L.P. has issued and benefits from the income of Carlyle Holdings to the extent of its equity interests in the Carlyle Holdings partnerships. While the holders of common units of The Carlyle Group L.P. are entitled to all of the economic rights in The Carlyle Group L.P., the limited partners of the Carlyle Holdings partnerships, like the wholly owned subsidiaries of The Carlyle Group L.P., hold Carlyle Holdings partnership units that entitle them to economic rights in Carlyle Holdings to the extent of their equity interests in the Carlyle Holdings partnerships. Public investors do not directly hold equity interests in the Carlyle Holdings partnerships.
|
(1)
|
The Carlyle Group L.P. common unitholders have only limited voting rights and have no right to remove our general partner or, except in limited circumstances, elect the directors of our general partner. TCG Carlyle Global Partners L.L.C., an entity wholly owned by our senior Carlyle professionals, holds a special voting unit in The Carlyle Group L.P. that entitles it, on those few matters that may be submitted for a vote of The Carlyle Group L.P. common unitholders, to participate in the vote on the same basis as the common unitholders and provides it with a number of votes that is equal to the aggregate number of vested and unvested partnership units in Carlyle Holdings held by the limited partners of Carlyle Holdings on the relevant record date.
|
|
(2)
|
Certain individuals engaged in our business own interests directly in selected subsidiaries, including, in certain instances, entities that receive management fees from funds that we advise. See “— Structure and Operation of Our Investment Funds — Incentive Arrangements/Fee Structure” in this Item 1 for additional information.
|
The Carlyle Group L.P. conducts all of its material business activities through Carlyle Holdings. Each of the Carlyle Holdings partnerships was formed to hold our interests in different businesses. Carlyle Holdings I L.P. owns all of our U.S. fee-generating businesses and many of our non-U.S. fee-generating businesses, as well as our carried interests (and other
14
investment interests) that derive income that we believe is not qualifying income for purposes of the U.S. federal income tax publicly-traded partnership rules and certain of our carried interests (and other investment interests) that do not relate to investments in stock of corporations or in debt, such as equity investments in entities that are pass-through for U.S. federal income tax purposes. Carlyle Holdings II L.P. holds a variety of assets, including our carried interests in many of the investments by our carry funds in entities that are treated as domestic corporations for U.S. federal income tax purposes and in certain non-U.S. entities. Certain of our non-U.S. fee-generating businesses, as well as our non-U.S. carried interests (and other investment interests) that derive income that we believe is not qualifying income for purposes of the U.S. federal income tax publicly-traded partnership rules and certain of our non-U.S. carried interests (and other investment interests) that do not relate to investments in stock of corporations or in debt, such as equity investments in entities that are pass-through for U.S. federal income tax purposes are held by Carlyle Holdings III L.P.
The Carlyle Group L.P. has wholly owned subsidiaries that serve as the general partners of the Carlyle Holdings partnerships: Carlyle Holdings I GP Inc. (a Delaware corporation that is a domestic corporation for U.S. federal income tax purposes), Carlyle Holdings II GP L.L.C. (a Delaware limited liability company that is a disregarded entity and not an association taxable as a corporation for U.S. federal income tax purposes) and Carlyle Holdings III GP L.P. (a Québec
société en commandite
that is a foreign corporation for U.S. federal income tax purposes) serve as the general partners of Carlyle Holdings I L.P., Carlyle Holdings II L.P. and Carlyle Holdings III L.P., respectively. Carlyle Holdings I GP Inc. and Carlyle Holdings III GP L.P. serve as the general partners of Carlyle Holdings I L.P. and Carlyle Holdings III L.P., respectively, through wholly owned subsidiaries that are disregarded for federal income tax purposes. We refer to Carlyle Holdings I GP Inc., Carlyle Holdings II GP L.L.C. and Carlyle Holdings III GP L.P. collectively as the “Carlyle Holdings General Partners.”
Holding Partnership Structure
The Carlyle Group L.P. is treated as a partnership and not as a corporation for U.S. federal income tax purposes, although our partnership agreement does not restrict our ability to take actions that may result in our being treated as an entity taxable as a corporation for U.S. federal (and applicable state) income tax purposes. An entity that is treated as a partnership for U.S. federal income tax purposes is not a taxable entity and incurs no U.S. federal income tax liability. Instead, each partner is required to take into account its allocable share of items of income, gain, loss and deduction of the partnership in computing its U.S. federal income tax liability, whether or not cash distributions are made. Each holder of our common units is a limited partner of The Carlyle Group L.P., and accordingly, is generally required to pay U.S. federal income taxes with respect to the income and gain of The Carlyle Group L.P. that is allocated to such holder, even if The Carlyle Group L.P. does not make cash distributions. We believe that the Carlyle Holdings partnerships should also be treated as partnerships and not as corporations for U.S. federal income tax purposes. Accordingly, the holders of partnership units in Carlyle Holdings, including The Carlyle Group L.P.’s wholly owned subsidiaries, incur U.S. federal, state and local income taxes on their proportionate share of any net taxable income of Carlyle Holdings.
Each of the Carlyle Holdings partnerships has an identical number of partnership units outstanding, and we use the terms “Carlyle Holdings partnership unit” or “partnership unit in/of Carlyle Holdings” to refer collectively to a partnership unit in each of the Carlyle Holdings partnerships. The Carlyle Group L.P. holds, through wholly owned subsidiaries, a number of Carlyle Holdings partnership units equal to the number of common units that The Carlyle Group L.P. has issued. The Carlyle Holdings partnership units that are held by The Carlyle Group L.P.’s wholly owned subsidiaries are economically identical to the Carlyle Holdings partnership units that are held by the limited partners of the Carlyle Holdings partnerships. Accordingly, the income of Carlyle Holdings benefits The Carlyle Group L.P. to the extent of its equity interest in Carlyle Holdings.
The Carlyle Group L.P. is managed and operated by our general partner, Carlyle Group Management L.L.C., to whom we refer as “our general partner,” which is in turn wholly owned by our senior Carlyle professionals. Our general partner does not have any business activities other than managing and operating us. We reimburse our general partner and its affiliates for all costs incurred in managing and operating us, and our partnership agreement provides that our general partner determines the expenses that are allocable to us. Although there are no ceilings on the expenses for which we will reimburse our general partner and its affiliates, the expenses to which they may be entitled to reimbursement from us, such as director fees, historically have not been, and are not expected to be, material.
LP Relations
Our diverse and sophisticated investor base includes
more than 1,750
active investors in our carry funds, excluding Investment Solutions, located in
83
countries. Included among our many longstanding fund investors are pension funds, sovereign wealth funds, insurance companies and high net worth individuals in the United States, Asia, Europe, the Middle East and South America.
15
We strive to maintain a systematic fundraising approach to support growth and serve our investor needs. This approach to fundraising has been critical in raising over $43 billion in 2017. We work for our fund investors and continuously seek to strengthen and expand our relationships with them through frequent investor engagement and by cross-selling products across our diverse platform. We have a dedicated in-house LP relations group, which includes 26 geographically-focused professionals with extensive investor relations and fundraising experience. In addition, we have 16 product specialists with a focus on specific business segments and 11 professionals focused on high net worth distribution. Our LP relations group is supported by 47 support staff responsible for project management and fulfillment. Our LP relations professionals are in constant dialogue with our fund investors, which enables us to monitor investor preferences and tailor future fund offerings to meet investor demand. We strive to secure a first-mover advantage with key investors, often by establishing a local presence and providing a broad and diverse range of investment opportunities.
As of December 31, 2017, approximately 92% of commitments to our active carry funds (by dollar amount) were from investors who are committed to more than one active carry fund and approximately 62% of commitments to our active carry funds (by dollar amount) were from investors who are committed to more than five active carry funds. We believe the loyalty of our carry fund investor base, as evidenced by our substantial number of multi-fund relationships, enhances our ability to raise new funds and successor funds in existing strategies.
Investor Services
We have a team of over 450 investor services professionals worldwide. The investor services group performs a range of functions to support our investment teams, LP relations group and the corporate infrastructure of Carlyle. Our investor services professionals provide an important control function, ensuring that transactions are structured pursuant to the partnership agreements, assisting in global regulatory compliance requirements and investor reporting to enable investors to easily monitor the performance of their investments. We have devoted substantial resources to creating comprehensive and timely investor reports, which are increasingly important to our investor base. The investor services group also works closely with each fund’s lifecycle, from fund formation and investments to portfolio monitoring and fund liquidation. We maintain an internal global legal and compliance team, which includes 27 professionals and a government relations group with a presence around the globe, which includes 16 professionals as of December 31, 2017. We intend to continue to build and invest in our legal, regulatory and compliance and tax functions to enable our investment teams to better serve our investors.
Structure and Operation of Our Investment Funds
We conduct the sponsorship and management of our carry funds and other investment vehicles primarily through limited partnerships, which are organized by us, to accept commitments and/or funds for investment from institutional investors and high net worth individuals. Each investment fund that is a limited partnership, or “partnership” fund, has a general partner that is responsible for the management and operation of the fund’s affairs and makes all policy and investment decisions relating to the conduct of the investment fund’s business. Generally, the limited partners of such funds take no part in the conduct or control of the business of such funds, have no right or authority to act for or bind such funds and have no influence over the voting or disposition of the securities or other assets held by such funds, although such limited partners may vote on certain partnership matters including the removal of the general partner or early liquidation of the partnership by majority vote, as discussed below. Most of our funds also have an investor advisory committee, comprising representatives of certain limited partners, which may consider and/or waive conflicts of interest or otherwise consult with the general partner on certain partnership matters. In the case of certain separately managed accounts advised by us, the investor, rather than us, may control the asset or the investment decisions related thereto or certain investment vehicles or entities that hold or have custody of such assets. More often, however, we retain investment discretion with respect to separately managed accounts we advise.
Each investment fund and in the case of our separately managed accounts, the client, engages an investment adviser. Carlyle Investment Management L.L.C. (“CIM”) or one of its subsidiaries or affiliates serves as an investment adviser for most of our carry funds and is registered under the Investment Advisers Act of 1940, as amended (the “Advisers Act”). Our investment advisers are generally entitled to a management fee from each investment fund for which they serve as investment advisers. For a discussion of the management fees to which our investment advisers are entitled across our various types of investment funds, see “—Incentive Arrangements / Fee Structure” below.
Investment funds themselves typically do not register as investment companies under the Investment Company Act of 1940, as amended (the “1940 Act” or the “Investment Company Act”), in reliance on Section 3(c)(7) or Section 7(d) thereof or, typically in the case of funds formed prior to 1997, Section 3(c)(1) thereof. Section 3(c)(7) of the 1940 Act exempts from the 1940 Act’s registration requirements investment funds privately placed in the United States whose securities are owned exclusively by persons who, at the time of acquisition of such securities, are “qualified purchasers” as defined under the 1940
16
Act and purchase their interests in a private placement. Section 3(c)(1) of the 1940 Act exempts from the 1940 Act’s registration requirements privately placed investment funds whose securities are beneficially owned by not more than 100 persons and purchase their interests in a private placement. In addition, under certain current interpretations of the Securities and Exchange Commission ("SEC"), Section 7(d) of the 1940 Act exempts from registration any non-U.S. investment fund all of whose outstanding securities are beneficially owned either by non-U.S. residents or by U.S. residents that are qualified purchasers and purchase their interests in a private placement. Certain of our investment funds, however, register as investment companies under the 1940 Act or elect to be regulated as business development companies under the 1940 Act.
The governing agreements of the vast majority of our investment funds provide that, subject to certain conditions, a majority in interest (based on capital commitments) of third-party investors in those funds have the right to remove the general partner of the fund for cause and/or to accelerate the liquidation date of the investment fund without cause. In addition, the governing agreements of many of our investment funds generally require investors in those funds to affirmatively vote to continue the investment period in the event that certain “key persons” in our investment funds do not provide the specified time commitment to the fund or our firm, cease to control the general partner (or similar managing entity) or the investment adviser or cease to hold a specified percentage of the economic interests in the general partner.
With limited exceptions, our carry funds, business development companies, and NGP management fee funds are closed-end funds. In a closed-end fund structure, once an investor makes an investment, the investor is generally not able to withdraw or redeem its interest, except in very limited circumstances. Furthermore, each limited partnership contains restrictions on an investor’s ability to transfer its interest in the fund. In the open-ended funds we advise, investors' interests are usually locked up for a period of time after which investors may generally redeem their interests on a quarterly basis, to the extent that sufficient cash is available.
With respect to our CPE, Real Assets and Global Credit carry funds, investors generally agree to fund their commitment over a period of time. For our private equity funds, the commitment period generally runs until the earlier of (i) the sixth anniversary of either the effective date (the date we start charging management fees for the fund) or the initial closing date or the fifth anniversary of the final closing date of the fund; (ii) the date the general partner cancels such obligation due to changes in applicable laws, business conditions or when at least a significant portion (which may range between 75% and 90%) of the capital commitments to the fund have been invested, committed or reserved for investments; (iii) the date a supermajority in interest (based on capital commitments) of investors vote to terminate the commitment period; or (iv) the failure of certain key persons to devote a specified amount of time to such fund or Carlyle, to control the general partner or the investment adviser or to hold a specified percentage of the economic interests in the general partner, unless upon any of these events the investors vote to continue the investment period. Following the termination of the commitment period, an investor generally will be released from any further obligation with respect to its undrawn capital commitment except to the extent necessary to pay partnership expenses and management fees, fund outstanding borrowings and guarantees, complete investments with respect to transactions committed to prior to the end of the commitment period and make follow-on investments in existing companies. Generally, an investor’s obligation to fund follow-on investments extends for a period of three years following the end of the commitment period, although certain funds do not have a time limit and there may be limitations on how much the fund is permitted to fund for such follow-on investments. In those funds where such limitations exist, they generally range from 15-20% of the fund's aggregate capital commitment.
For the latest generation of our real estate funds, the commitment period generally runs for a period of between two and five years from the final closing date, provided that the general partner may unilaterally extend such expiration date for one year and may extend it for another year with the consent of a majority of the limited partners or the investment advisory committee for that fund. Investors in the latest generation of our real estate funds are also obligated to continue to make capital contributions with respect to follow-on investments and to repay indebtedness for a period of time after the original expiration date of the commitment period, as well as to fund partnership expenses and management fees during the life of the fund.
The term of each of the CPE, Real Assets and Global Credit carry funds generally will end 10 years from the initial closing date, or in some cases, from the final closing date, but such termination date may be earlier in certain limited circumstances or later if extended by the general partner (in many instances with the consent of a majority in interest (based on capital commitments) of the investors or the investment advisory committee) for successive one-year periods, typically up to a maximum of two years. Certain of such investment funds may have a longer initial termination date (such funds, "long-dated funds"), such as 15 years from the final closing date.
With respect to our Investment Solutions vehicles and separately managed accounts, the commitment period generally runs for a period of one to five years after the initial closing date of the vehicle. Following the termination of the commitment period, an investor in one of our Investment Solutions vehicles or separately managed accounts generally will only be required
17
to fund additional amounts for partnership expenses, outstanding borrowings and guarantees, transactions in process or committed to during the commitment period follow-on investments in existing companies. The term of each of the funds generally will end 8 to 12 years from the initial closing date. In some cases, the termination date may be later if extended by the general partner (in many instances with the consent of a majority in interest (based on capital commitments) of the investors or the investment advisory committee) for successive up to two-year periods, potentially up to a maximum of four years or until such time as is reasonably necessary for the general partner to be able to liquidate the fund's assets.
Incentive Arrangements / Fee Structure
Fund Management Fees.
The Partnership provides management services to funds in which it holds a general partner interest or has a management agreement. For closed-end carry funds in the CPE, Real Assets and Global Credit segments, management fees generally range from 1.0% to 2.0% of commitments during the fund's investment period based on limited partners' capital commitments to the funds. Following the expiration or termination of the investment period, management fees generally are based on the lower of cost or fair value of invested capital and the rate charged may also be reduced to between 0.6% and 2.0%. For certain separately managed accounts and longer-dated carry funds, with expected terms greater than ten years, management fees generally range from 0.2% to 1.0% based on contributions for unrealized investments or the current value of the investment. The investment adviser will receive management fees during a specified period of time, which is generally ten years from the initial closing date, or, in some instances, from the final closing date, but such termination date may be earlier in certain limited circumstances or later if extended for successive one year periods, typically up to a maximum of two years. Depending on the contracted terms of the investment advisory or investment management and related agreements, these fees are generally called semi-annually in advance. For certain longer-dated carry funds, management fees are called quarterly over the life of the funds.
Within the Global Credit segment, for CLOs and other structured products, management fees generally range from 0.3% to 0.6% based on the total par amount of assets or the aggregate principal amount of the notes in the CLO and are due quarterly or semi-annually based on the terms. Management fees for the CLOs and other structured products are governed by indentures and collateral management agreements. The investment advisers will receive management fees for the CLOs until redemption of the securities issued by the CLOs, which is generally five to ten years after issuance. Investment adviser of the business development company generally receives management fees quarterly in arrears at annual rates of approximately 1.5% of gross assets, excluding cash and cash equivalents.
The investment adviser of our Investment Solutions private equity and real estate carry fund vehicles generally receives an annual management fee that ranges from 0.25% to 1.0% of the vehicle’s capital commitments during the commitment fee period of the relevant fund or the weighted-average investment period of the underlying funds. Following the expiration of the commitment fee period or weighted-average investment period of such funds, the management fees generally range from 0.25% to 1.0% on (i) the lower of cost or fair value of the capital invested, (ii) the net asset value for unrealized investments or (iii) the contributions for unrealized investments; however certain separately managed accounts earn management fees at all times on contributions for unrealized investments or on the initial commitment amount. The management fees we receive from our Investment Solutions carry fund vehicles typically are payable quarterly in advance.
Our equity interest in NGP previously entitled us to an allocation of income equal to 47.5%, which increased to 55% in January 2015, of the management fee-related revenues of the NGP entities that serve as advisors to the NGP management fee funds.
The general partners or investment advisers to certain of our CPE, Real Assets and Global Credit carry funds from time to time receive customary transaction fees upon consummation of many of our funds’ acquisition transactions, receive monitoring fees from many of their portfolio companies following acquisition and may from time to time receive other fees in connection with their activities. The ongoing monitoring fees that they receive are generally calculated as a percentage of a specified financial metric of a particular portfolio company. The transaction fees which they receive are generally calculated either as a fixed amount or as a percentage (that generally ranges up to 1%, but may exceed 1% in certain circumstances) of the total enterprise value or capitalization of the investment.The management fees charged to limited partner investors in our carry funds are generally reduced by 80% to 100% of such transaction fees and certain other fees that are received by the general partners and their affiliates.
Performance Fees.
The general partner of each of our carry funds also receives carried interest from the carry funds. Carried interest entitles the general partner to a special residual allocation of profit on third-party capital. In the case of our closed-end carry funds in the CPE, Real Assets and Global Credit segments, carried interest is generally calculated on a “realized gain” basis, and each general partner is generally entitled to a carried interest equal to 20% allocation (or 10% to 20% on certain longer-dated carry funds, certain credit funds and external co-investment vehicles, or approximately 10% in the case
18
of most of the recent Investment Solutions carry funds, and approximately 2% to 10% in the case of most of our more mature Investment Solutions carry funds) of the net realized profit (generally taking into account unrealized losses) generated by third-party capital invested in such fund. Net realized profit or loss is not netted between or among funds. Our senior Carlyle professionals and other personnel who work in these operations also own interests in the general partners of our carry funds and we generally allocate 45% of any carried interest that we earn to these individuals in order to better align their interests with our own and with those of the investors in the funds. For most carry funds, the carried interest is subject to an annual preferred return of 7% to 9% (or 4% to 7% for certain longer-dated carry funds) and return of certain fund costs (generally subject to catch-up provisions as set forth in the fund limited partnership agreement) from its CPE, Real Assets and Global Credit carry funds. If, as a result of diminished performance of later investments in the life of a fund, the fund does not achieve investment returns that (in most cases) exceed the preferred return threshold or (in almost all cases) the general partner receives in excess of 20% (or 10% to 20% on certain longer-dated carry funds as well as some external co-investment vehicles, or approximately 2% to 10% in the case of most of our Investment Solutions carry fund vehicles) of the net profits on third-party capital over the life of the fund, we will be obligated to repay the amount by which the carried interest that was previously distributed to us exceeds amounts to which we are ultimately entitled. This obligation, which is known as a “giveback” obligation, operates with respect to a given carry fund’s own net investment performance only and is typically capped at the after-tax amount of carried interest received by the general partner. Each recipient of carried interest distributions is individually responsible for his or her proportionate share of any "giveback" obligation; however, we may guarantee the full amount of such “giveback” obligation in respect of amounts received by Carlyle and certain other amounts. With respect to the portion of any carried interest allocated to the firm, we expect to fund any "giveback" obligation from available cash. Our ability to generate carried interest is an important element of our business and carried interest has historically accounted for a significant portion of our income.
The receipt of carried interest in respect of investments of our carry funds is dictated by the terms of the partnership agreements that govern such funds, which generally allow for carried interest distributions in respect of an investment upon a realization event after satisfaction of obligations relating to the return of capital from all realized investments, any realized losses, allocable fees and expenses and the applicable annual preferred return. Carried interest is ultimately realized and distributed when: (i) an underlying investment is profitably disposed of, (ii) certain costs borne by the limited partner investors have been reimbursed, (iii) the investment fund’s cumulative returns are in excess of the preferred return and (iv) we have decided to collect carry rather than return additional capital to limited partner investors. Distributions to eligible senior Carlyle professionals in respect of such carried interest are generally made shortly thereafter. Our decision to realize carry considers such factors as the level of embedded valuation gains, the portion of the fund invested, the portion of the fund returned to limited partner investors and the length of time the fund has been in carry, as well as other qualitative measures. Although Carlyle has seldom been obligated to pay a giveback obligation, such obligation, if any, in respect of previously realized carried interest, is generally determined and due upon the winding up or liquidation of a carry fund pursuant to the terms of the fund’s partnership agreement, although in certain cases the giveback is calculated at prior intervals.
With respect to our arrangements with NGP, we have acquired future interests in the general partners of certain future funds advised by NGP that will entitle us to an allocation of income equal to 47.5% of the carried interest received by such fund general partners. In addition, we also exercised our option to purchase interests in the general partner of the NGP X fund, which entitles us to an allocation of income equal to 40% of the carried interest received by NGP X's general partner.
Under our arrangements with the historical owners and management team of AlpInvest, we generally do not retain any carried interest in respect of the historical investments and commitments to our fund of funds vehicles that existed as of July 1, 2011 (including any options to increase any such commitments exercised after such date). We are entitled to 15% of the carried interest in respect of commitments from the historical owners of AlpInvest for the period between 2011 and 2020 and 40% of the carried interest in respect of all other commitments (including all future commitments from third parties).
Under our arrangements with the historical owners and management team of Metropolitan, the management team and employees are allocated all carried interest in respect of the historical investments and commitments to the fund vehicles that have had a final closing on or prior to July 31, 2013, and 45% of the carried interest in respect of all other commitments.
As noted above, in connection with raising new funds or securing additional investments in existing funds, we negotiate terms for such funds and investments with existing and potential investors. The outcome of such negotiations could result in our agreement to terms that are materially less favorable to us than for prior funds we have advised or funds advised by our competitors. See “Item 1A. Risk Factors — Risks Related to Our Business Operations — Our investors in future funds may negotiate to pay us lower management fees and the economic terms of our future funds may be less favorable to us than those of our existing funds, which could adversely affect our revenues.”
19
Capital Invested in and Alongside Our Investment Funds
To further align our interests with those of investors in our investment funds, we have invested our own capital and that of our senior Carlyle professionals in and alongside the investment funds we sponsor and advise. Carlyle generally expects to commit to fund approximately 0.75% to 1% of the capital commitments to our future CPE, Real Assets and Global Credit carry funds. We also intend to make investments in our Investment Solutions carry funds, our open-end funds and our CLO vehicles. In addition, certain qualified Carlyle professionals and other qualified individuals (including certain individuals who may not be employees of the firm but who have pre-existing business relationships with Carlyle or industry expertise in the sector in which a particular investment fund may be investing) are permitted, subject to certain restrictions, to invest alongside the investment funds we sponsor and advise. Fees assessed or profit allocations on such investments by such persons may be eliminated or substantially reduced.
Minimum general partner capital commitments to our investment funds are determined separately with respect to each investment fund. We may, from time to time, exercise our right to purchase additional interests in our investment funds that become available in the ordinary course of their operations. See “Item 7. Management’s Discussion and Analysis of Financial Condition and Results of Operations— Liquidity and Capital Resources” for more information regarding our minimum general partner capital commitments to our funds. Our general partner capital commitments are funded with cash and not with carried interest or through a management fee waiver program.
Carlyle and its eligible employees and officers generally have the right to co-invest with most of the CPE and Real Asset and Global Credit carry funds on a deal-by-deal basis, typically in an amount up to 5% of the investment opportunity (on top of our base commitment).
One Carlyle Culture
Our culture is built on promoting innovation, good citizenship and service to our investors. Carlyle uses its One Carlyle global network, deep industry knowledge, Operating Executive consultants and portfolio intelligence to create and execute a customized value creation plan for each of our CPE and Real Assets investments. To further this end, Carlyle has created a Global Investment Resources team that helps to translate our One Carlyle culture into services and capabilities supporting our investment process and portfolio companies. This team coordinates with our investment professionals and advisors, including our operating executive and other consultants, to create value during the investment lifecycle. We have also developed a leveraged purchasing effort to provide portfolio companies with effective sourcing programs with better pricing and service levels to help create operating value. This program seeks to drive down costs on common indirect spend categories and disseminate best practices on managing functional spend in the areas of HR/employee benefits, corporate real estate, information technology and treasury/risk. Our approach ensures that Carlyle’s global network, deep industry knowledge and operational expertise are used to support and enhance our investments.
Corporate Citizenship
We are committed to the principle that building a better business means investing responsibly. In September 2008, Carlyle developed a set of responsible investment guidelines that consider the environmental, social and governance implications of certain investments we make. These guidelines were integral to shaping the corporate social responsibility guidelines later adopted by the members of the American Investment Council. We use the principles in these guidelines to inform our investment decision-making process for controlling, corporate investments.
We also have worked to develop internal expertise in sustainability to support deal teams and portfolio companies. We provide sustainability resources from workshops to pre-screened vendors that provide sustainability services to individualized support from our Chief Sustainability Officer. We are a member of Businesses for Social Responsibility, a global nonprofit business network dedicated to sustainability. We also educate portfolio companies in which we have a controlling interest on the guidelines for responsible investment and encourage them to review the guidelines at the board level on an annual basis. We issue an annual Citizenship Report that highlights cases where strengthening environmental and social performance helps to create value by supporting core business imperatives. We most often see sustainability efforts adding value in four areas: customer satisfaction, brand equity, operational efficiency and cost savings and workforce.
We are a member of the British Venture Capital Association and seek to ensure that our U.K.-based portfolio companies are compliant, on a voluntary basis, with the Private Equity Reporting Group Guidelines for Disclosure and Transparency when such companies become subject to these guidelines. Carlyle is a member of Invest Europe and an active participant in its work on ESG-related industry issues. Further, we are also a member of the Bundesverband Deutscher
20
Kapitalbeteiligungsgesellschaften (BVK), the German private equity and venture capital trade association. We believe that we are compliant with the BVK Guidelines for Disclosure and Transparency and seek to ensure that our German portfolio companies comply with these guidelines when they are required to do so.
AlpInvest is a signatory of the Principles for Responsible Investment and has adopted the UN Global Compact as a corporate social responsibility (CSR) framework to evaluate fund managers and portfolio companies. AlpInvest has fully integrated CSR into its investment process and actively engages with fund managers and other stakeholders in the private equity markets to promote sustainability and improved corporate governance as an investment consideration.
Since Carlyle was established, we have recognized the value and benefits of maintaining a business model grounded in investment fundamentals, strong governance and transparency. We maintain strong internal corporate governance processes and fiduciary functions and are subject to regulatory supervision. Carlyle professionals receive regular and targeted training on many issues related to corporate governance and compliance, such as anti-corruption, conflicts of interest, economic sanctions and anti-money laundering. All employees annually certify to their understanding of and compliance with key global Carlyle policies and procedures.
At Carlyle, we believe that diverse teams and experiences bring tremendous value to our firm. We are committed to growing and cultivating an environment that fosters diversity in gender, race, ethnicity, sexual orientation, disability, religion and age, as well as cultural backgrounds and ideas.
In 2013, Carlyle established our Diversity & Inclusion Council, which we believe is the first of its kind in our industry. The mission of the 19 leaders of the Council was and still is twofold - to better enable Carlyle to hire the most talented professionals in the world, as well as fostering an environment of inclusiveness for diversity in all forms that will enhance our collaborative One Carlyle culture. Carlyle earned a 100% rating on the 2018 Corporate Equality Index (CEI), a national benchmarking survey and report on corporate policies and practices related to lesbian, gay, bisexual, transgender and queer (LGBTQ) workplace equality, administered by the Human Rights Campaign Foundation.
Global Information Technology and Solutions
Global Information Technology and Solutions, which we refer to as GTS, is essential for Carlyle to conduct investment activities, manage internal administration activities and connect a global enterprise. As part of our GTS strategy and governance processes, we develop and routinely refine our technology architecture to leverage solutions that will best serve the needs of our investors. Our systems, data, network and infrastructure are continuously monitored and administered by formal controls and risk management processes that also help protect the data and privacy of our employees and investors. Our business continuity plans are designed to allow all critical business functions to continue in an orderly manner in the event of an emergency. GTS work closely with our various segments to test Carlyle's business continuity plans via table top exercises and disaster recovery exercises. This annual testing is intended to help mitigate risk to the firm if an actual emergency were to occur.
Competition
As a global alternative asset manager, we compete with a broad array of regional and global investment firms, as well as global banking institutions and other types of financial institutions and markets, for both investors and investment opportunities. Generally, our competition varies across business lines, geographies, distribution channels and financial markets. We believe that our competition for investors is based primarily on investment performance, business relationships, the quality of services provided to investors, reputation and brand recognition, pricing and the relative attractiveness of the particular opportunity in which a particular fund intends to invest. To stay competitive, we believe it is also important to be able to offer fund investors a customized suite of investment products which enable them to tailor their investments across alternatives in private equity, real estate and credit. We believe that competition for investment opportunities varies across business lines, but is generally based on industry expertise and potential for value-add, pricing, terms and the structure of a proposed investment and certainty of execution.
We generally compete with sponsors of public and private investment funds across all of our segments. Within our CPE segment, we also compete with business development companies, sovereign wealth funds and operating companies acting as strategic acquirers. In our Global Credit segment, we compete with private credit strategies, business development companies, distressed debt funds, mezzanine funds and other CLO issuers. In our Real Assets segment, we compete with real estate development companies and other infrastructure investment business. In our Investment Solutions segment, we generally compete with other fund of funds managers and/or with advisers that are turning their business models towards discretionary
21
investment advisory services. In the United States, the new government administration may propose changes to financial regulation that could increase competition from banks and non-bank institutions in certain of our business segments.
In addition to these traditional competitors within the global alternative asset management industry, we have increasingly faced competition from local and regional firms, financial institutions, sovereign wealth funds, family offices and agencies and instrumentalities of governments in the various countries in which we invest. This trend has been especially apparent in emerging markets, where local firms tend to have more established relationships with the companies in which we are attempting to invest. In addition, large institutional investors and sovereign wealth funds have begun to develop their own in-house investment capabilities and may compete against us for investment opportunities. Furthermore, in some cases, large institutional investors have reduced allocations to “fund of funds” vehicles and turned instead to private equity advisory firms that assist with direct investments. Greater reliance on advisory firms or in-house investment management may reduce fund of funds’ appeal to large institutional investors. As we continue to target high net worth investors, we also face competition from mutual funds and alternative asset management firms that have competing products.
Some of the entities that we compete with as an alternative asset manager are substantially larger and have greater financial, technical, marketing and other resources and more personnel than we do. Several of our competitors also have recently raised or are expected to raise, significant amounts of capital and many of them have investment objectives similar to ours, which may create additional competition for investment opportunities and investor capital. Some of these competitors may also have a lower cost of capital and access to funding sources that are not available to us, which may create competitive disadvantages for us when sourcing investment opportunities. In addition, some of these competitors may have higher risk tolerances, different risk assessments or lower return thresholds, which could allow them to consider a wider range of investments and to bid more aggressively than us for investments. Strategic buyers may also be able to achieve synergistic cost savings or revenue enhancements with respect to a targeted portfolio company, which we may not be able to achieve through our own portfolio, and this may provide them with a competitive advantage in bidding for such investments.
Employees
We believe that one of the strengths and principal reasons for our success is the quality and dedication of our people. As of December 31, 2017, we employed more than
1,600
individuals, including
654
investment professionals, located in
31
offices across six continents.
Operating Executives
Supplementing Carlyle’s investment expertise, we have retained a group of
approximately 40
senior business executives who have an average of
more than 30
years of experience to help Carlyle invest wisely and create value across a range of industries. These operating executives are former CEOs and other high-level executives of some of the world’s most successful corporations and currently sit on the boards of directors of a diverse mix of companies. Operating executives are independent consultants and are not Carlyle employees. Operating executives are engaged by Carlyle primarily to assist with deal sourcing, due diligence and market intelligence. Carlyle typically retains these operating executives and bears the cost of such retainer fees. Operating executives may also be engaged by, and compensated by, our portfolio companies as directors or to otherwise advise portfolio company management.
Regulatory and Compliance Matters
United States
Our businesses, as well as the financial services industry generally, are subject to extensive regulation in the United States and elsewhere. The SEC, Commodity Futures Trading Commission (the “CFTC”) and other regulators around the globe have in recent years significantly increased their regulatory activities with respect to alternative asset management firms.
Certain of our subsidiaries are registered as investment advisers with the SEC. Registered investment advisers are subject to the requirements and regulations of the Advisers Act. Such requirements relate to, among other things, fiduciary duties to advisory clients, maintaining an effective compliance program, solicitation agreements, conflicts of interest, recordkeeping and reporting requirements, disclosure requirements, limitations on agency cross and principal transactions between an adviser and advisory clients and general anti-fraud prohibitions. In addition, our registered investment advisers are subject to routine periodic and other examinations by the staff of the SEC. In accordance with our efforts to enhance our compliance program and in response to recommendations received from the SEC in the course of routine examinations, certain additional policies and procedures have been put into place, but no material changes to our registered investment advisers’ operations have been made as a result of such examinations. Our registered investment advisers also have not been subject to
22
any regulatory or disciplinary actions by the SEC. Finally, certain of our investment advisers are subject to limited SEC disclosure requirements as “exempt reporting advisers.”
TCG Securities, L.L.C. (“TCG Securities”), the affiliate entity through which we conduct U.S.-based marketing and fundraising activities and house our anti-money laundering compliance function, is registered as a limited purpose broker/dealer with the SEC, is a member of the Financial Industry Regulatory Authority (“FINRA”) and is also registered as a broker/dealer in all 50 states, the District of Columbia, the Commonwealth of Puerto Rico and the Virgin Islands. Additionally, TCG Securities operates under an international broker-dealer exemption in the Canadian provinces of Alberta, British Columbia, Ontario and Quebec. TCG Securities acts as a placement agent, on a best efforts basis, for interests in private funds. Additionally, FINRA, a self-regulatory organization that is subject to SEC oversight, maintains regulatory authority over all securities firms doing business with the public in the United States (including our broker/dealer), adopts and enforces rules governing the activities of its member firms and conducts cycle examinations and targeted sweep inquiries on issues of immediate concern, among other roles and responsibilities. Our broker/dealer is subject to routine periodic and other examinations by the staff of FINRA. No material changes to our broker/dealer's operations have been made as a result of such examinations.
Broker/dealers are subject to rules relating to transactions on a particular exchange and/or market, and rules relating to the internal operations of the firms and their dealings with customers including, but not limited to the form or organization of the firm, qualifications of associated persons, officers and directors, net capital and customer protection rules, books and records and financial statements and reporting. In particular, as a result of its registered status, TCG Securities is subject to the SEC’s uniform net capital rule, Rule 15c3-1 under the Securities Exchange Act of 1934, as amended (the “Exchange Act”), which specifies both the minimum level of net capital a broker/dealer must maintain relative to the scope of its business activities and net capital liquidity parameters. The SEC and FINRA require compliance with key financial responsibility rules, including maintenance of adequate funds to meet expenses and contractual obligations, as well as early warning rules that compel notice to the regulators via accelerated financial reporting anytime a firm’s capital falls below the minimum required level. The uniform net capital rule limits the amount of qualifying subordinated debt that is treated as equity to a specific percentage under the debt-to-equity ratio test, and further limits the withdrawal of equity capital, which is subject to specific notice provisions. Finally, compliance with net capital rules may also limit a firm’s ability to expand its operations, particularly to those activities that require the use of capital. To date, TCG Securities has not had any capital adequacy issues and is currently capitalized in excess of the minimum maintenance amount required by regulators.
In late 2017, we filed a new membership application with FINRA for TCG Capital Markets LLC and contemporaneously applied for registration of this entity as a broker/dealer with the SEC. Upon effective registration with the SEC and membership with FINRA, TCG Capital Markets will operate as part of the Global Credit business and will engage in the placement of securities of corporate issuers in private transactions, among other related activities.
Carlyle Global Credit Investment Management L.L.C. one of our subsidiaries, serves as investment adviser to certain closed-end investment companies which have elected, or intend to elect, to be regulated as under the Investment Company Act. Accordingly, these BDCs are, or are expected to be, subject to all relevant provisions under the Investment Company Act as registered investment companies.
In 2011, the Dodd-Frank Wall Street Reform and Consumer Protection Act amended the Commodity Exchange Act to expand the CFTC’s regulatory jurisdiction with respect to certain derivative instruments, including swaps. In 2012, the CFTC rescinded an exemption from CFTC registration traditionally relied upon by private fund managers, narrowed an exception related to registered investment companies and amended related rules and guidance. As a result of these changes, managers of certain pooled investment vehicles with exposure in commodity interests now may be required to register with the CFTC as commodity pool operators (“CPOs”) and/or commodity trading advisors (“CTAs”) and become members of the National Futures Association (the “NFA”). As such, certain of our or our subsidiaries’ risk management or other commodities interest-related activities may be subject to CFTC oversight. Consequently, certain CFTC rules expose alternative asset managers, such as us, to increased registration and reporting requirements in connection with transactions in futures, swaps and other derivatives regulated by the CFTC. These regulations have required us to reassess certain business practices related to our pooled vehicles, consider registration of certain entities with the CFTC or file for additional exemptions from such registration requirements. In addition, as a result of their commodities interest-related activities, certain of our entities also may be subject to a wide range of other regulatory requirements, such as:
|
•
|
potential compliance with certain commodities interest position limits or position accountability rules;
|
|
•
|
administrative requirements, including recordkeeping, confirmation of transactions and reconciliation of trade data; and
|
23
|
•
|
mandatory central clearing and collateral requirements.
|
In addition, many Carlyle vehicles are subject to the Internal Revenue Service (“IRS”) Foreign Account Tax Compliance Act (“FATCA”) tax regulations intended to address tax compliance issues associated with U.S. taxpayers with foreign accounts. FATCA requires “foreign financial institutions” to report to the IRS information about financial accounts held by U.S. taxpayers and imposes due diligence, withholding, documentation and reporting requirements on such entities. In many instances, however, the precise nature of the FATCA-related requirements to which Carlyle is subject is governed by bilateral Intergovernmental Agreements (“IGAs”) between the United States and the countries in which Carlyle does business. Among other things, FATCA could subject investors within certain Carlyle funds to additional tax withholding.
United Kingdom and the European Union
CECP Advisors LLP (“CECP”), one of our subsidiaries in the United Kingdom, is authorized and regulated by the Financial Conduct Authority (the “FCA”). CECP operates in accordance with the Financial Services and Markets Act 2000 (the “FSMA”), which is the United Kingdom’s implementing legislation for the European Markets in Financial Instruments Directive (“MiFID”). CECP has permission to engage in a number of corporate finance activities regulated under the FSMA, including advising on, and arranging deals in relation to certain types of, investments. CECP is only permitted to carry out these activities in relation to eligible counterparties and professional clients. CECP has registered a branch office in Ireland in connection with Carlyle’s investment activities in that country. CELF Advisors LLP (“CELF”), another one of our subsidiaries in the United Kingdom, is also authorized and regulated by the FCA under the FSMA and has permission to engage in a number of activities regulated under the FSMA, including making arrangements with a view to transactions in investments, advising on, managing and arranging deals in relation to certain types of investments, dealing in investments as agent and arranging safeguarding and administration of assets. CELF is only permitted to carry out these activities in relation to eligible counterparties and professional clients. The FSMA and related rules govern most aspects of investment businesses, including sales, research and trading practices, provision of investment advice, corporate finance, use and safekeeping of client funds and securities, record keeping, margin practices and procedures, approval standards for individuals, anti-money laundering, periodic reporting and settlement procedures.
The FSMA says that any firm or individual which carries out a regulated activity in the United Kingdom must be authorized or regulated by the FCA, unless they are exempt. The FCA is responsible monitoring regulated entities’ compliance with the FSMA. Violations of these requirements may result in censures, fines, imposition of additional requirements, injunctions, restitution orders, revocation or modification of permissions or registrations, the suspension or expulsion from certain “controlled functions” within the financial services industry of officers or employees performing such functions or other similar consequences.
Similar to the United States, jurisdictions outside the United States in which we operate, in particular Europe, have become subject to extensive further regulation. Governmental regulators and other authorities in Europe have proposed or implemented a number of initiatives and additional rules and regulations that could adversely affect our business. Certain of our subsidiaries are subject to compliance requirements in connection with the Alternative Investment Fund Managers Directive (the “AIFMD”), which generally became effective in countries across the European Economic Area (the “EEA”) in 2014. The AIFMD imposes significant regulatory requirements on alternative investment fund managers operating or marketing funds to investors within the EEA, as well as prescribing certain conditions with regard to regulatory standards, cooperation and transparency that must be satisfied for non-EEA fund managers to market or manage alternative investment funds into EEA jurisdictions. Authorization under the AIFMD is currently available only to EEA fund managers. One of Carlyle’s subsidiaries, AlpInvest, obtained such authorization in 2015. As such, AlpInvest is licensed as an alternative investment fund manager under the AIFMD by the Authority for Financial Markets in the Netherlands (the “AFM”). AlpInvest is also licensed by the AFM to provide investment management services under the Markets in Financial Instruments Directive. In early 2018 one of our subsidiaries, CIM Europe S.a.r.l., was authorized as an alternative investment fund manager under the AIFMD in Luxembourg. Carlyle’s other subsidiaries that manage or market alternative investment funds in the EEA currently do so in accordance with the national private placement regimes of the various EEA jurisdictions. Compliance with applicable AIFMD requirements may restrict Carlyle’s fund marketing strategy and will place additional compliance obligations in the form of remuneration policies, capital requirements, reporting requirements, leverage oversight and liquidity management.
Additionally, certain of our subsidiaries are subject to various aspects of the European Market Infrastructure Regulation (“EMIR”). Among other things, EMIR imposes a set of requirements on European Union derivatives activities, including risk mitigation, risk management, regulatory reporting and margin and clearing requirements. Given the global scale of the derivatives activity of various Carlyle entities, the various regulatory regimes to which Carlyle is subject could result in duplication of administration and increased transaction costs related to such derivatives activities.
24
As outlined above, certain of our European subsidiaries must comply with the pan-European regime established by MiFID, which regulates the provision and conduct of investment services and activities throughout the EEA. MiFID sets out detailed requirements governing the organization and conduct of business of investment firms, regulated markets and certain other entities such as credit institutions to the extent they perform investment services or activities. It also includes pre- and post-trade transparency requirements for transactions within scope. MiFID has been substantially amended by Directive 2014/65/EU and Regulation 600/2014/EU (collectively referred to as “MiFID II”) that, save for certain provisions, has been effective from January 3, 2018. MiFID II is designed to amend the functioning of financial markets in light of the financial crisis and to strengthen investor protection. MiFID II has extended the MiFID requirements in a number of areas including market structure requirements, new and extended requirements in relation to transparency and transaction reporting, revised rules on research and inducements and product governance requirements. MiFID II has therefore imposed further compliance requirements on CECP, CELF and AlpInvest.
In addition, effective May 2018, the EU’s General Data Protection Regulation (“GDPR”) will strengthen and unify data protection rules for individuals within the EU. GDPR also addresses the export of personal data outside the EU. The primary objectives of GDPR are to give citizens control of their personal data and to simplify the regulatory environment for international businesses by unifying data protection regulation within the EU. Compliance with the stringent rules under GDPR requires an extensive review of all of our global data processing systems and vendor relationships.
Other Jurisdictions
Certain of our subsidiaries are subject to registration and compliance with laws and regulations of non-U.S. governments, their respective agencies and/or various self-regulatory organizations or exchanges relating to, among other things, investment advisory services and the marketing of investment products, and any failure to comply with these regulations could expose us to liability and/or damage our reputation. Certain of our private funds are also required to comply with the trading and disclosure rules and regulations of non-U.S. securities regulators.
The Organization for Economic Cooperation and Development (the “OECD”) has developed Common Reporting Standard (“CRS”) rules for the automatic exchange of FATCA-like financial account information amongst OECD member states. Like FATCA, CRS imposes certain due diligence, documentation and reporting requirements on various Carlyle entities. While CRS does not contain a potential withholding requirement, non-compliance could subject Carlyle to certain reputational harm.
Carlyle Hong Kong Equity Management Limited is licensed by the Hong Kong Securities and Futures Commission to carry on Type 1 (dealing in securities) regulated activity in respect of professional investors.
Carlyle Mauritius Investment Advisor Limited and Carlyle Mauritius CIS Investment Management Limited are licensed providers of investment management services in the Republic of Mauritius and are subject to applicable Mauritian securities laws and the oversight of the Financial Services Commission. In addition, Carlyle Mauritius Investment Advisor Limited holds a “Foreign Institutional Investor” license from the Securities and Exchange Board of India, which entitles this entity to engage in limited activities in India.
Carlyle Australia Equity Management Pty Limited is licensed by the Australian Securities and Investments Commission as an Australian financial services licensee and is authorized to carry on a financial services business to provide advice on and deal in financial products (managed investment schemes and securities) for wholesale clients.
Carlyle MENA Investment Advisors Limited, a company limited by shares in the Dubai Financial Centre, holds a Category 3C license issued by the Dubai Financial Services Authority and is authorized to arrange credit or deal in investments, advise on financial products or credit and manage collective investment funds.
Carlyle Singapore Investment Advisors Pte Limited holds a capital markets license and an exempt financial adviser status with the Monetary Authority of Singapore to carry on fund management and dealing in securities activities in respect of institutional and accredited investors.
Carlyle South Africa Advisors (Proprietary) Limited, a limited company incorporated in the Republic of South Africa, is licensed as a Category 1 Authorised Financial Services Provider under the Financial Advisory and Intermediary Services Act (No. 37 of 2002) and is thereby regulated by the Financial Services Board in South Africa.
Carlyle Global Credit Asia Limited is licensed by the Hong Kong Securities and Futures Commission to carry on Type 9 (asset management) regulated activity in respect of asset management activities to professional investors.
25
Carlyle Real Estate SGR S.p.A. holds an authorization from the Bank of Italy to carry on fund management and real estate activities, which license was extended in 2017 to carry out AIFMD compliant fund management and real estate activities.
AlpInvest Partners Limited is licensed by the Hong Kong Securities and Futures Commission to carry on Type 1 (dealing in securities) regulated activity in respect of professional investors.
In connection with the wind down of its operations, DGAM surrendered its investment fund manager and portfolio manager licenses, but it will retain its exempt market dealer license to facilitate certain Carlyle fund marketing activities in Canada.
TCG Gestor is licensed by the Securities & Exchange Commission of Brazil as an investment adviser.
AlpInvest is registered as a cross-border discretionary investment management company with the Financial Supervisory Service of South Korea.
In addition, we and/or our affiliates and subsidiaries may become subject to additional regulatory demands in the future to the extent we expand our investment advisory business in existing and new jurisdictions. There are also a number of pending or recently enacted legislative and regulatory initiatives in the United States and around the world that could significantly impact our business. See “Item 1A. Risk Factors-Risks Related to our Company- Extensive regulation in the United States and abroad affects our activities, increases the cost of doing business and creates the potential for significant liabilities and penalties,” “-Regulatory changes in the United States could adversely affect our business and the possibility of increased regulatory focus could result in additional burdens and expenses on our business” and “-Regulatory initiatives in jurisdictions outside the United States could adversely affect our business.”
Our businesses have operated for many years within a framework that requires our being able to monitor and comply with a broad range of legal and regulatory developments that affect our activities and we take our obligation to comply with all such laws, regulations and internal policies seriously. Our reputation depends on the integrity and business judgment of our employees and we strive to maintain a culture of compliance throughout the firm. We have developed, and adhere to, compliance policies and procedures such as codes of conduct, compliance systems, education and communication of compliance matters. These policies focus on matters such as insider trading, anti-corruption, document retention, conflicts of interest and other matters. Our legal and compliance team monitors our compliance with all of the legal and regulatory requirements to which we are subject and manages our compliance policies and procedures. Our legal and compliance team also monitors the information barriers that we maintain to restrict the flow of confidential information, including material, nonpublic information, across our business. Our enterprise risk management function analyzes our operations and investment strategies to identify key risks facing the firm and works closely with the legal and compliance team to address them. The firm also has an independent and objective internal audit department that employs a risk-based audit approach that focuses on Sarbanes-Oxley compliance, enterprise risk management functions and other areas of perceived risk and aims to give management and the Board of Directors of our general partner reasonable assurance that our risks are well managed and controls are appropriate and effective.
Website and Availability of SEC Filings
Our website address is www.carlyle.com. We make available free of charge on our website or provide a link on our website to our Annual Report on Form 10-K, Quarterly Reports on Form 10-Q and Current Reports on Form 8-K, and any amendments to those reports filed or furnished pursuant to Section 13(a) or 15(d) of the Exchange Act, as soon as reasonably practicable after those reports are electronically filed with, or furnished to, the SEC. To access these filings, go to the “Financial Information” portion of our “Public Investors” page on our website, and then click on “SEC Filings.” You may also read and copy any document we file at the SEC’s public reference room located at 100 F Street, N.E., Washington, DC 20549. Call the SEC at 1-800-SEC-0330 for further information on the public reference room. In addition, the reports and other documents we file with the SEC are available at a website maintained by the SEC at www.sec.gov.
We use our website (www.carlyle.com), our corporate Facebook page (https://www.facebook.com/onecarlyle/) and our corporate Twitter account (@OneCarlyle) as channels of distribution of material company information. For example, financial and other material information regarding our company is routinely posted on and accessible at www.carlyle.com. Accordingly, investors should monitor these channels, in addition to following our press releases, SEC filings and public conference calls and webcasts. In addition, you may automatically receive email alerts and other information about Carlyle when you enroll your email address by visiting the “Email Alert Subscription” section at http://ir.carlyle.com/alerts.cfm. The contents of our website
26
and social media channels are not, however, a part of this Annual Report on Form 10-K and are not incorporated by reference herein.
The Carlyle Group L.P. was formed in Delaware on July 18, 2011. Our principal executive offices are located at 1001 Pennsylvania Avenue, NW, Washington, D.C. 20004-2505.
Risks Related to Our Company
Adverse economic and market conditions could negatively impact our business in many ways, including by reducing the value or performance of the investments made by our investment funds and reducing the ability of our investment funds to raise capital, any of which could materially reduce our revenue, earnings and cash flow and adversely affect our financial prospects and condition.
Our business is materially affected by conditions in the global financial markets and economic conditions or events throughout the world that are outside of our control, including, but not limited to, changes in interest rates, availability of credit, inflation rates, economic uncertainty, slowdown in global growth, changes in laws (including laws relating to taxation and regulations on the financial industry), disease, trade barriers, commodity prices, currency exchange rates and controls and national and international political circumstances (including wars, terrorist acts or security operations). These factors may affect the level and volatility of securities prices and the liquidity and the value of investments, and we may not be able to or may choose not to manage our exposure to these market conditions and/or other events. In the event of a market downturn, each of our businesses could be affected in different ways.
Over the twelve months ending in January 2018, the S&P 500 and many other global stock market indexes returned nearly 25%, pushing public stock market multiples to near 17-year highs. At the start of February, the markets experienced a heightened level of volatility in connection with a widespread sell-off. The sell-off has been broad-based across equity sectors and regions, sending indexes in the U.S. and Asia into correction territory amid declines of at least 10% from a recent peak. The stock market correction has come despite strong growth in corporate earnings and upward revisions to forward-looking earnings estimates. As a result, bonds have also declined in value and this sell-off bears some similarities to the “taper tantrum” of 2013, when the market value of both the 10-year Treasury and S&P 500 declined by 6% on fears that the United States Federal Reserve would tighten policy more than previously anticipated. When the United States Federal Reserve clarified its policy intentions, stock and bond markets stabilized. It is possible, however, that the recent market volatility does not subside. If the global markets do not stabilize, it is possible sellers may readjust their valuations and attractive investment opportunities may become available. On the other hand, the valuations of certain assets we planned to sell in the near future could be negatively impacted.
Market volatility could adversely affect our fundraising efforts in several ways. Investors often allocate to alternative asset classes (including private equity) based on a target percentage of their overall portfolio. If the value of an investor’s portfolio decreases as a whole, the amount available to allocate to alternative assets (including private equity) could decline. Further, investors often evaluate the amount of distributions they have received from existing funds when considering commitments to new funds. General market volatility and/or a reduction in distributions to investors could cause investors to delay making new commitments to investment funds. With several large buyout funds in the market, a decrease in the amount an investor commits to our funds could have an impact on the ultimate size of the fund and amount of management fees we generate.
The availability and cost of financing for significant acquisition and disposition transactions could be impacted by heightened concerns around increases in interest rates. In the United States, short-term interest rates have risen by 90 to 120 basis points (bps) since the U.S. presidential election in November 2016, with 10 to 20 bps of such amount attributable to increases seen between January 1, 2018 and February 8, 2018. The increase in base interest rates (Treasury and swaps) has not yet materially affected the interest rates on speculative grade debt because credit spreads had been tightening over the past year. However, if credit markets continue to weaken, it is possible that we and our investment funds may not be able to consummate significant acquisition and disposition transactions on acceptable terms or at all if we or our funds are unable to finance these types of transactions on attractive terms or if the counterparty to the transaction is unable to secure suitable financing. If there is a general slowdown in global merger and acquisition activity due to the lack of availability of suitable financing, this could cause a slowdown in our investment pace, which in turn could have an adverse impact on our ability to generate future performance fees and to fully invest the available capital in our funds and reduce opportunities to exit and realize value from
27
our fund investments. A slowdown in the deployment of our available capital could also adversely affect our ability to raise and the timing of raising successor investment funds. In 2017, we invested a record
$22 billion
through our carry funds.
During periods of difficult market conditions or slowdowns (which may occur across one or more industries or geographies), our funds’ portfolio companies may experience adverse operating performance, decreased revenues, financial losses, credit rating downgrades, difficulty in obtaining access to financing and increased funding costs. Negative financial results in our funds’ portfolio companies may result in less appreciation across the portfolio and lower returns in our funds, which could materially and adversely affect our ability to raise new funds as well as our operating results and cash flow. During such periods of weakness, our funds’ portfolio companies may also have difficulty expanding their businesses and operations or meeting their debt service obligations or other expenses as they become due, including expenses payable to us. Furthermore, such negative market conditions could potentially result in a portfolio company entering bankruptcy proceedings, or in the case of certain real estate funds, the abandonment or foreclosure of investments, thereby potentially resulting in a complete loss of the fund’s investment in such portfolio company or real assets and a significant negative impact to the fund’s performance and consequently our operating results and cash flow, as well as to our reputation. In addition, negative market conditions would also increase the risk of default with respect to investments held by our funds that have significant debt investments, such as our Global Credit funds.
Finally, during periods of difficult market conditions or slowdowns, our fund investment performance could suffer, resulting in, for example, the payment of less or no performance fees to us or the creation of the obligation to repay performance fees previously received by us. The payment of less or no performance fees could cause our cash flow from operations to significantly decrease, which could materially and adversely affect our liquidity position and the amount of cash we have on hand to conduct our operations and to distribute to our unitholders. The generation of less performance fees could also impact our leverage ratios and compliance with our term loan covenants. Having less cash on hand could in turn require us to rely on other sources of cash (such as the capital markets, which may not be available to us on acceptable terms or at all) to conduct our operations, which include, for example, funding significant general partner and co-investment commitments to our carry funds. Furthermore, during adverse economic and market conditions, we might not be able to renew or refinance all or part of our credit facility or find alternate financing on commercially reasonable terms. As a result, our uses of cash may exceed our sources of cash, thereby potentially affecting our liquidity position.
Changes in the debt financing markets could negatively impact the ability of certain of our funds and their portfolio companies to obtain attractive financing or re-financing and could increase the cost of such financing if it is obtained, which could lead to lower-yielding investments and could potentially decrease our net income.
A significant contraction in the market for debt financing, such as the contraction that occurred in 2008 and 2009, or other adverse change relating to the terms of debt financing, including higher interest rates and equity requirements and more restrictive covenants, could have a material adverse impact on our business and that of our investment funds and their portfolio companies. Regulatory changes that constrain banks’ ability to provide debt financing also could have a material adverse impact on our business and that of our investment funds and their portfolio companies. If our funds are unable to obtain committed debt financing for potential acquisitions or are only able to obtain debt financing at unfavorable interest rates or on unfavorable terms, our funds may have difficulty completing acquisitions that may have otherwise been profitable or if completed, such acquisitions could generate lower than expected profits, both of which could lead to a decrease in our net income. Starting in the third quarter of 2015 and continuing through the first quarter of 2016, we experienced a period of elevated pricing for, and more limited access to, the high yield debt used in many of our buyout transactions. During that period, it was widely reported that the banks that committed to finance certain debt related to a large acquisition by one of our investment funds were unable to syndicate the debt because credit markets weakened and investor demand for financing waned. Due to unfavorable market conditions, our investment funds paid higher interest rates than originally anticipated, though the total amount of debt required for the transaction was reduced. At this point, we have seen a modest impact on the debt financing markets in response to the recent market sell-off. It is possible, however, that the debt financing markets could be adversely impacted.
Our funds’ portfolio companies also regularly utilize the corporate debt markets to obtain financing for their operations. Starting in the second quarter of 2017 and throughout 2017, credit has been available on increasingly attractive terms. In early February, we have seen a modest weakening in credit markets. It is possible that future tightening in the credit markets could render debt financing difficult to obtain, less attractive or more expensive, which may negatively impact the operating performance of our portfolio companies who use debt to fund certain of their operations. This may result in a negative impact on the investment returns of our funds. In addition, if market conditions make it difficult or impossible to refinance debt that is maturing in the near term, some of our portfolio companies’ operations may be negatively impacted or our portfolio companies may be unable to repay their debt at maturity and may be forced to sell assets, undergo a recapitalization or seek bankruptcy protection.
28
Our use of leverage may expose us to substantial risks.
We use indebtedness as a means to finance our business operations, which exposes us to the risks associated with using leverage. We are dependent on financial institutions extending credit to us on reasonable terms to finance our business. There is no guarantee that such institutions will continue to extend credit to us or will renew the existing credit agreements we have with them, or that we will be able to refinance our outstanding notes or other obligations when they mature. In addition, the incurrence of additional debt in the future could result in downgrades of our existing corporate credit ratings, which could limit the availability of future financing and/or increase our cost of borrowing. As borrowings under our credit facility or any other indebtedness mature, we may be required to either refinance them by entering into a new facility, which could result in higher borrowing costs, issuing additional debt or issuing additional equity, which would dilute existing unitholders. We could also repay them by using cash on hand, cash provided by our continuing operations or cash from the sale of our assets, which could reduce distributions to our unitholders. We could have difficulty entering into new facilities or issuing debt or equity securities in the future on attractive terms, or at all.
From time to time we may access the capital markets by issuing debt securities. For example, in January 2013, we issued $500 million aggregate principal amount of ten-year senior notes at a rate of 3.875%. In March 2013, we issued $400 million aggregate principal amount of thirty-year senior notes at a rate of 5.625% and in March 2014, we issued an additional $200 million aggregate principal amount of thirty-year senior notes at a rate of 5.625%. We may also access the capital markets by issuing preferred units. In September 2017, we issued 16,000,000 5.875% Series A Preferred Units. We also have a credit facility that provides for a term loan (of which $25.0 million was outstanding as of December 31, 2017) and revolving credit borrowings that has a final maturity date of May 5, 2020. The credit facility contains financial and non-financial covenants with which we need to comply to maintain access to this source of liquidity. Non-compliance with any of the financial or non-financial covenants without cure or waiver would constitute an event of default, and an event of default resulting from a breach of certain financial or non-financial covenants could result, at the option of the lenders, in an acceleration of the principal and interest outstanding, and a termination of the revolving credit facility. In addition, to the extent we incur additional debt relative to our current level of earnings or experience a decrease in our level of earnings, our credit rating could be adversely impacted, which would increase our interest expense under our credit facility. In September 2017 in connection with our issuance of Series A Preferred Units, Standard & Poor's downgraded our Long Term Issuer Default Rating from "A-" to "BBB+" based primarily on its assessment of our leverage ratio. In October 2017, Fitch's reaffirmed its "BBB+" stable rating.
Our revenue, earnings and cash flow are variable, which makes it difficult for us to achieve steady earnings growth on a quarterly basis.
Our revenue, earnings and cash flow are variable. For example, our cash flow fluctuates because we receive carried interest from our carry funds only when investments are realized and achieve a certain preferred return. We may also experience fluctuations in our quarterly and annual results, including our revenue and net income, due to a number of other factors, including changes in the carrying values and performance of our funds’ investments that can result in significant volatility in the carried interest that we have accrued (or as to which we have reversed prior accruals) from period to period, as well as changes in the amount of distributions, gains, dividends or interest paid in respect of investments, changes in our operating expenses, the degree to which we encounter competition and general economic and market conditions. The valuations of investments made by our funds could also be impacted by changes, or anticipated changes, in government policy, including policies related to tax reform, financial services regulation, international trade, immigration, healthcare, labor, infrastructure and energy. For instance, during the 2008 and 2009 economic downturn, we recorded significant reductions in the carrying values of many of the investments of the investment funds we advise. The carrying value of fund investments, particularly the public portion of our carry fund portfolios, may be more variable during times of market volatility. As of December 31, 2017,
14%
of our CPE, Real Assets and Global Credit carry fund portfolio was in public securities, which is a decrease from 17% of this portfolio that was held in public securities at December 31, 2016. In addition, transaction fees earned by our carry funds can vary from quarter-to-quarter and year-to-year depending on the nature of the investments in any given period. For example, in 2017, we earned approximately $27 million in transaction fees from our carry funds, which was a decrease of approximately $4 million as compared to the total transaction fees we earned in 2016 of approximately $31 million, but was still up significantly from the total transaction fees of approximately $10 million we earned in 2015. The decrease was due to greater investment activity, primarily in our U.S. buyout funds, in 2016 as compared to 2017. Going forward, we anticipate a general decline in net transaction fees earned as certain carry funds that are actively fundraising have increased the percentage of transaction fees that are shared with fund investors from 80% to 100% of the fees we generate. See “—A decline in the pace or size of investments by our carry funds could result in our receiving less revenue from transaction fees”.
During periods in which a significant portion of our AUM is attributable to carry funds that are in the fundraising period or are in the investment period that precedes harvesting, as has been the case from time to time, we may receive substantially lower distributions. During 2017, our fee-earning assets under management decreased as our existing funds
29
continued to harvest investments, and the capital that was raised for our successor funds has not yet been activate
d. Higher fundraising activity also generates incremental expenses and, as new capital commitments may not immediately generate fees until they activate management fees, which means that we could incur fundraising related costs ahead of generating revenues. Moreover, even if an investment proves to be profitable, it may be several years before any profits can be realized in cash. A
downturn in the equity markets also makes it more difficult to exit investments by selling equity securities at a reasonable value. If we were to have a realization event in a particular quarter, that event may have a significant impact on our quarterly results and cash flow for that particular quarter and may not be replicated in subsequent quarters. We cannot predict precisely when, or if, realizations of investments will occur, where a fund will be in its lifecycle when the realizations occur or whether a fund will realize carried interest.
We recognize revenue on investments in our investment funds based on our allocable share of realized and unrealized gains (or losses) reported by such investment funds, and a decline in realized or unrealized gains, or an increase in realized or unrealized losses, would adversely affect our revenue, which could further increase the volatility of our quarterly results and cash flow. Because our carry funds have preferred investor return thresholds that need to be met prior to us receiving any carried interest, declines in, or failures to increase sufficiently the carrying value of, the investment portfolios of a carry fund may delay or eliminate any carried interest distributions paid to us with respect to that fund. This is because the value of the assets in the fund would need to recover to their aggregate cost basis plus the preferred return over time before we would be entitled to receive any carried interest from that fund or vehicle.
The timing and receipt of realized carried interest also varies with the life cycle of our carry funds and there is often a difference between the time we start accruing carried interest for financial reporting purposes and the realization and distribution of such carried interest. However, performance fees are ultimately realized when (i) an investment is profitably disposed of, (ii) certain costs borne by the limited partner investors have been reimbursed, (iii) the investment fund’s cumulative net returns are in excess of the preferred return and (iv) we have decided to collect carried interest rather than return additional capital to limited partner investors. In deciding to realize carried interest we consider such factors as the level of embedded valuation gains, the portion of the fund invested, the portion of the fund returned to limited partner investors, the length of time the fund has been in carry, and other qualitative measures. When a fund enters into a position to take carried interest, we are generally entitled to a disproportionate “catch-up” level of profit allocation for a period before the amount of profit allocation to which we are entitled returns to a more normalized level. For example, during the period from late 2013 to early 2015, we benefited from “catch-up” realized carried interest on some of our largest funds, but in 2016 and 2017 we did not benefit from "catch-up" realized carried interest to the extent we had in prior years. In certain circumstances, we may also need to reduce the amount of realized carried interest we receive in order to maintain a sufficient level of reserves and reduce the risk of potential future giveback obligations. Under the terms of the limited partnership agreement for CP V we are entitled to a carried interest equal to 20% of the realized profits of the fund once a preferred return threshold has been met. In 2017, we decided to take carried interest from profitable exits in this fund at a reduced rate to reserve for potential risk in the portfolio and reduce the potential for giveback. See “— Our investors may negotiate to pay us lower management fees and the economic terms of our future funds may be less favorable to us than those of our existing funds, which could adversely affect our revenues.”
Our fee revenue may also depend on the pace of investment activity in our funds. In many of our carry funds, the base management fee may be reduced when the fund has invested substantially all of its capital commitments or the aggregate fair market value of a fund’s investments is below its cost. We may receive a lower management fee from such funds if there has been a decline in value or after the investing period and during the period the fund is harvesting its investments. As a result, the variable pace at which many of our carry funds invest capital and dispose of investments may cause our management fee revenue to vary from one quarter to the next. Additionally, in certain of our funds that derive management fees only on the basis of invested capital, the pace at which we make investments, the length of time we hold such investment and the timing of dispositions will directly impact our revenues.
The investment period of a fund may expire prior to the raising of a successor fund. Where appropriate, we may work with our limited partners to extend the investment period, which gives us the opportunity to invest any capital that remains in the fund. In general, the end of the original investment period (regardless of whether it is extended) will trigger a change in the capital base on which management fees are calculated from committed capital to invested capital. In some cases, a step-down in the applicable rate used to calculate management fees may also occur. For example, prior to raising a successor fund, the South America buyout fund’s original investment period ended in the second half of 2015, resulting in a change from committed capital to invested capital for the management fee base, despite a one-year extension to the investment period.
30
We depend on our founders, our Co-Chief Executive Officers and other key personnel, and the loss of their services or investor confidence in such personnel could have a material adverse effect on our business, results of operations and financial condition.
We depend on the efforts, skill, reputations and business contacts of our senior Carlyle professionals, including our founders, Messrs. Conway, D’Aniello and Rubenstein, our co-Chief Executive Officers, Messrs. Lee and Youngkin and other key personnel, including members of our Executive Group, our management committee, the investment committees of our investment funds and senior investment teams, the information and deal flow they and others generate during the normal course of their activities and the synergies among the diverse fields of expertise and knowledge held by our professionals. On January 1, 2018, Kewsong Lee and Glenn Youngkin became Co-Chief Executive Officers of our firm, Messrs. Conway and Rubenstein transitioned to be Co-Executive Chairmen and Mr. D'Aniello transitioned to be Chairman Emeritus. Mr. Conway also was joined by Peter Clare as Co-Chief Investment Officers as of January 1, 2018. Although our founders remain committed to our business, in these new roles, they will no longer have responsibility for the day-to-day operations of the firm and may choose to pursue philanthropic or other personal endeavors, including personal investment activities, in addition to their roles at Carlyle. Our founders and other key personnel are not obligated to remain employed with us in their current capacities or at all. To enhance our capabilities, we have and will continue to hire and internally develop senior professionals to assume key leadership positions throughout the firm into the future. The efficacy of such future leadership may constitute an adverse risk to our business.
All of the Carlyle Holdings partnership units held by our founders are vested. The majority of the Carlyle Holdings partnership units received by other key personnel (including Mr. Youngkin) at the time of the Partnership’s initial public offering are vested, with the unvested portion scheduled to vest in one remaining installment on May 2, 2018. Mr. Lee does not hold any Carlyle Holdings partnership units. In October 2017, we entered into employment agreements with Messrs. Lee and Youngkin. See "Part III. Item 11. Executive Compensation—Employment Agreements and Potential Payments upon Termination or Change in Control." Several key personnel have left the firm in the past and others may do so in the future, and we cannot predict the impact that the departure of any key personnel will have on our ability to achieve our objectives. The loss of the services of any of them could have a material adverse effect on our revenues, net income and cash flow and could harm our ability to maintain or grow AUM in existing funds or raise additional funds in the future. The governing agreements of many of our investment funds generally require investors in those funds to vote to continue the investment period in the event that certain "key persons" in our investment funds do not provide the specified time commitment to the fund or our firm ceases to control the general partner. We have historically relied in part on the interests of these professionals in the investment funds’ carried interest and incentive fees to discourage them from leaving the firm. However, to the extent our investment funds perform poorly, thereby reducing the potential for carried interest and incentive fees, their interests in carried interest and incentive fees become less valuable to them and may become a less effective retention tool.
Our senior Carlyle professionals and other key personnel possess substantial experience and expertise and have strong business relationships with investors in our funds and other members of the business community. As a result, the loss of these personnel could jeopardize our relationships with investors in our funds and members of the business community and result in the reduction of AUM or fewer investment opportunities. For example, if any of our senior Carlyle professionals were to join or form a competing firm, that action could have a material adverse effect on our business, results of operations and financial condition. Furthermore, to the extent investors in certain of our open-ended products have the ability to redeem their investment, the loss of a key manager could trigger redemptions and thus adversely impact the business.
Recruiting and retaining professionals may be more difficult in the future, which could adversely affect our business, results of operations and financial condition.
Our most important asset is our people, and our continued success is highly dependent upon the efforts of our senior Carlyle professionals and other professionals we employ. Our future success and growth depends to a substantial degree on our ability to retain and motivate our senior Carlyle professionals and other key personnel and to strategically recruit, retain and motivate new talented personnel, including new senior Carlyle professionals. The market for qualified investment professionals is extremely competitive and we may not be successful in our efforts to recruit, retain and motivate these professionals.
There are also certain factors that are not within our control that may affect our efforts to recruit, retain and motivate investment professionals, in particular as it relates to tax considerations regarding carried interest. For example, if the U.S. Congress or state, local or certain foreign governments enacted legislation to treat carried interest as ordinary income rather than as capital gain for tax purposes or impose a surcharge on carried interest, this could result in a material increase in the amount of taxes that our unitholders would be required to pay, which would in turn affect our ability to recruit, retain and motivate our current and future professionals. See “—Risks Related to U.S. Taxation—Our structure involves complex provisions of U.S. federal income tax law for which no clear precedent or authority may be available. Our structure also is subject to potential legislative, judicial or administrative change and differing interpretations, possibly on a retroactive basis”
31
and “—Risks Related to our Company—In past years, the U.S. Congress has considered legislation that would have: in some cases after a ten-year transition period, precluded us from qualifying as a partnership for U.S. federal income tax purposes or required us to hold carried interest through taxable subsidiary corporations. If any similar legislation were to be enacted and apply to us, the after tax income and gain related to our business could be reduced.” Recently enacted U.S. tax reform legislation, informally known as the Tax Cuts and Jobs Act ("TCJA") includes a provision that changes the treatment of carried interest with respect to an applicable partnership interest from long-term capital gains to short-term capital gains (taxable at ordinary income rates) to the extent such gains relate to property with a holding period not greater than three years, effective for tax years beginning after December 31, 2017. Outside the U.S., in April 2016, the United Kingdom adopted legislation that changed the scope of and tax rate for carried interest, which impacted certain of our investment funds and certain of our London-based investment professionals. There could certainly be other countries that clarify or modify their treatment of carried interest. These types of developments might make it more difficult for us to incentivize, recruit and retain investment professionals, which may have an adverse effect on our ability to achieve our investment objectives. In addition, the after-tax income and gain related to our business, our distributions to common unitholders and the market price of our common units, all could be reduced.
We have granted and expect to grant equity awards from our Equity Incentive Plan, which has caused dilution. While we evaluate the grant of equity awards from our Equity Incentive Plan to employees on an annual basis, the size of the grants, if any, is made at our discretion. If we increase the use of equity awards from our Equity Incentive Plan in the future, expenses associated with equity-based compensation may increase materially. In 2017, we incurred equity compensation expenses of $183 million in connection with grants of deferred restricted common units. We did not issue any deferred restricted phantom units in 2017. The value of our common units may drop in value or be volatile, which may make our equity less attractive to our employees since we may not be able to adequately incentivize them.
As of December 31, 2017, our employees held an aggregate of 15,470,416 unvested deferred restricted common units, which vest over various time periods, generally from one and a half to six years from the date of grant. As of December 31, 2017, our employees did not hold any unvested deferred restricted phantom units. In order to recruit and retain existing and future senior Carlyle professionals and other key personnel, we may need to increase the level of compensation that we pay to them. Accordingly, as we promote or hire new senior Carlyle professionals and other key personnel over time or attempt to retain the services of certain of our key personnel, we may increase the level of compensation we pay to these individuals, which could cause our total employee compensation and benefits expense as a percentage of our total revenue to increase and adversely affect our profitability. The issuance of equity interests in our business in the future to our senior Carlyle professionals and other personnel would also dilute our unitholders.
At the time of our initial public offering and in several subsequent acquisitions, we issued Carlyle Holdings partnership units that are exchangeable on a one-for-one basis for common units. The exchange and sale of these units will increase the number of our common units that are traded in the public market. All of the Carlyle Holdings partnership units held by our founders are fully vested. Of the outstanding Carlyle Holdings partnership units held by our other senior Carlyle professionals, 89% are vested and 11% are unvested as of December 31, 2017. The remaining unvested Carlyle Holdings units generally will vest in one installment on May 2, 2018. Subject to the terms of the Exchange Agreement, including the minimum retained ownership requirements and other restrictions, Carlyle Holdings unitholders were able to exchange their Carlyle Holdings partnership units for common units in the Partnership on a one-to-one basis each quarter starting in the second quarter of 2017. See “Part III. Item 13. Certain Relationships and Related Transactions, and Director Independence—Exchange Agreement.”
We strive to maintain our One Carlyle culture of collaboration and seek to continue to align our interests (and the interests of our employees) with those of our fund investors. If we do not continue to develop and implement the right processes and tools to maintain our culture, our ability to compete successfully and achieve our business objectives could be impaired, which could negatively impact our business, financial condition and results of operations.
Given the priority we afford the interests of our fund investors and our focus on achieving superior investment performance, we may reduce our AUM, restrain its growth, reduce our fees or otherwise alter the terms under which we do business when we deem it in the best interest of our fund investors—even in circumstances where such actions might be contrary to the near-term interests of unitholders.
In pursuing the interests of our fund investors, we may take actions that could reduce the profits we could otherwise realize in the short term. While we believe that our commitment to our fund investors and our discipline in this regard is in the long-term interest of us and our unitholders, our unitholders should understand this approach may have an adverse impact on our short-term profitability, and there is no guarantee that it will be beneficial in the long term. The means by which we seek to achieve superior investment performance in each of our strategies could include limiting the AUM in our strategies to an
32
amount that we believe can be invested appropriately in accordance with our investment philosophy and current or anticipated economic and market conditions. Additionally, we may voluntarily reduce management fee rates and terms for certain of our funds or strategies when we deem it appropriate, even when doing so may reduce our short-term revenue. For instance, in order to enhance our relationship with certain fund investors, we have reduced management fees or ceased charging management fees on certain funds in specific instances. In certain investment funds, we have agreed to charge management fees based on invested capital or net asset value as opposed to charging management fees based on committed capital. In certain cases, such as our most recent power fund, we have provided “fee holidays” to certain investors during which we do not charge management fees for a fixed period of time (such as the first six months). We may receive requests to reduce management fees on other funds in the future. “—See Risks Related to Our Business—Our investors may negotiate to pay us lower management fees and the economic terms of our future funds may be less favorable to us than those of our existing funds, which could adversely affect our revenues.”
Certain of our investment funds may utilize subscription lines of credit to fund investments prior to the receipt of capital contributions from the fund's investors. As capital calls made to a fund's investors are delayed when using a subscription line of credit, the investment period of such investor capital is shortened, which may increase the net internal rate of return of an investment fund. However, since interest expense and other costs of borrowings under subscription lines of credit are an expense of the investment fund, the investment fund's net multiple of invested capital will be reduced, as will the amount of carried interest generated by the fund. Any material reduction in the amount of carried interest generated by a fund will adversely affect our revenues.
In prioritizing the interests of our fund investors, we may also take other actions that could adversely impact our short-term results of operations when we deem such action appropriate. We have also waived management fees on certain leveraged finance vehicles at various times to improve returns. Furthermore, we typically delay the realization of carried interest to which we are otherwise entitled if we determine (based on a variety of factors, including the stage of the fund’s life cycle and the extent of fund profits accrued to date) that there would be an unacceptably high risk of potential future giveback obligations. Any such delay could result in a deferral of realized carried interest to a subsequent period. See “
—
Risks Related to Our Company
—
Our revenue, earnings and cash flow are variable, which makes it difficult for us to achieve steady earnings growth on a quarterly basis.”
We may not be successful in expanding into new investment strategies, markets and businesses, which could adversely affect our business, results of operations and financial condition.
Our growth strategy focuses on providing resources to foster the development of new product offerings and business strategies by our investment professionals. Given our diverse platform, these initiatives could create conflicts of interests with existing products, increase our costs and expose us to new market risks and legal and regulatory requirements. These products may have different economic structures than our traditional investment funds and may require a different marketing approach. These activities also may impose additional compliance burdens on us, subject us to enhanced regulatory scrutiny and expose us to greater reputation and litigation risk.
The success of our growth strategy will depend on, among other things:
|
•
|
our ability to correctly identify and create products that appeal to our investors;
|
|
•
|
the diversion of management’s time and attention from our existing businesses;
|
|
•
|
management's ability to spend time developing and integrating the new business and the success of the integration effort;
|
|
•
|
our ability to properly manage conflicts of interests;
|
|
•
|
our ability to identify and manage risks in new lines of businesses;
|
|
•
|
our ability to obtain requisite approvals and licenses from the relevant governmental authorities and to comply with applicable laws and regulations without incurring undue costs and delays; and
|
|
•
|
our ability to successfully negotiate and enter into beneficial arrangements with our counterparties.
|
In some instances, we may determine that growth in a specific area is best achieved through the acquisition of an existing business or a smaller scale lift out of an investment team to enhance our platform. Our ability to consummate an acquisition will depend on our ability to identify and value potential acquisition opportunities accurately and successfully compete for these businesses against companies that may have greater financial resources. Even if we are able to identify and
33
successfully negotiate and complete an acquisition, these transactions can be complex and we may encounter unexpected difficulties or incur unexpected costs.
In addition to the concerns noted above, the success of a firm acquisition will be affected by, on among other things:
|
•
|
difficulties and costs associated with the integration of operations and systems;
|
|
•
|
difficulties integrating the acquired business’s internal controls and procedures into our existing control structure;
|
|
•
|
difficulties and costs associated with the assimilation of employees; and
|
|
•
|
the risk that a change in ownership will negatively impact the relationship between an acquiree and the investors in its investment vehicles.
|
Each acquisition transaction presents unique challenges and if a new product, business or venture developed internally or by acquisition is unsuccessful, we may decide to wind down, liquidate and/or discontinue it. Such actions could negatively impact our relationships with fund investors in those businesses, could subject us to litigation or regulatory inquiries and can expose us to additional expenses, including impairment charges and potential liability from investor or other complaints.
Our organizational documents do not limit our ability to enter into new lines of business, and we intend to, from time to time, expand into new investment strategies, geographic markets and businesses, each of which may result in additional risks and uncertainties in our businesses.
We intend, to the extent that market conditions warrant, to seek to grow our businesses and expand into new investment strategies, geographic markets and businesses. Our organizational documents do not limit us to the asset management business and to the extent that we make strategic investments or acquisitions in new geographic markets or businesses, undertake other related strategic initiatives or enter into a new line of business, we may face numerous risks and uncertainties, including risks associated with the following:
|
•
|
the required investment of capital and other resources;
|
|
•
|
the possibility that we have insufficient expertise to engage in such activities profitably or without incurring inappropriate amounts of risk;
|
|
•
|
the diversion of management’s attention from our core businesses;
|
|
•
|
assumption of liabilities in any acquired business;
|
|
•
|
the disruption of our ongoing business;
|
|
•
|
the increasing demands on or issues related to the combination or integration of operational and management systems and controls;
|
|
•
|
compliance with or applicability to our business or our portfolio companies of regulations and laws, including, in particular, local regulations and laws (for example, consumer protection related laws) and customs in the numerous global jurisdictions in which we operate and the impact that noncompliance or even perceived noncompliance could have on us and our portfolio companies;
|
|
•
|
a potential increase in investor concentration; and
|
|
•
|
the broadening of our geographic footprint, including the risks associated with conducting operations in certain foreign jurisdictions where we currently have no presence.
|
Entry into certain lines of business may subject us to new laws and regulations with which we are not familiar or from which we are currently exempt, and may lead to increased liability and litigation and regulatory risk and expense. If a new business generates insufficient revenue or if we are unable to efficiently manage our expanded operations, our results of operations may be adversely affected.
34
Our strategic initiatives may include joint ventures, which may subject us to additional risks and uncertainties in that we may be dependent upon, and subject to liability, losses or reputational damage relating to, systems, controls and personnel that are not under our control. We currently participate in joint advisory arrangements and may elect to participate in additional joint venture opportunities in the future if we believe that operating in such a structure is in our best interests. There can be no assurances that our current joint advisory arrangements will continue in their current form, or at all, in the future or that we will be able to identify acceptable joint venture partners in the future or that our participation in any additional joint venture opportunities will be successful.
In past years, the U.S. Congress has considered legislation that would have: in some cases after a ten-year transition period, precluded us from qualifying as a partnership for U.S. federal income tax purposes or required us to hold carried interest through taxable subsidiary corporations. If any similar legislation were to be enacted and apply to us, the after tax income and gain related to our business could be reduced.
Legislative proposals by members of the U.S. Congress have provided that, for taxable years beginning ten years after the date of enactment, income derived with respect to carried interest would not meet the qualifying income requirements under the publicly traded partnership rules. Therefore, if similar legislation is enacted, following such ten-year period, we would be precluded from qualifying as a partnership for U.S. federal income tax purposes or be required to hold all such carried interest through corporations, possibly U.S. corporations. If we were taxed as a U.S. corporation or required to hold all carried interest through corporations, our effective tax rate increase significantly. The federal statutory rate for corporations is currently 21%. In addition, we could be subject to increased state and local taxes. Furthermore, common unitholders could be subject to tax on our conversion into a corporation or any restructuring required in order for us to hold our carried interest through a corporation.
States and local jurisdictions have considered and are considering changes to the income tax treatment of carried interest and partnerships generally that could, if enacted, cause us to incur a material increase in our tax liability and/or cause carried interest or other income allocable to holders of our common units to be subject to state or local income tax at higher rates than under current law.
States and other jurisdictions have also considered legislation to increase taxes with respect to carried interest. For example, New York has considered legislation under which common unitholders, even if they are not residents of New York, could be subject to New York state income tax on income in respect of our common units as a result of certain activities of our affiliates in New York, although it is unclear when or whether similar legislation may be enacted. In addition, states and other jurisdictions have considered legislation to increase taxes involving other aspects of our structure and have considered and enacted legislation which could increase taxes imposed on our income and gain. For example, the District of Columbia has passed legislation that could expand the portion of our income that could be subject to District of Columbia income or franchise tax. These and other proposals have recently been under heightened consideration in light of the recently enacted TCJA.
Proposed changes in U.S. and foreign taxation of businesses could adversely affect us.
Congress, the OECD, the European Commission and other government agencies in jurisdictions where we and our affiliates invest or do business have maintained a focus on issues related to the taxation of multinational corporations. The OECD, which represents a coalition of member countries, has proposed changes to numerous long-standing tax principles through its base erosion and profit shifting (“BEPS”) project, an area that focuses in part on payments made between affiliates from a jurisdiction with high tax rates to a jurisdiction with lower tax rates.
The OECD released the BEPS package in October 2015, which looks at various different ways in which domestic tax rules around the world, and the bilateral double tax treaties that govern the interplay between them, could be amended to address profit shifting among affiliated entities. Several of the proposed measures, including measures covering treaty abuse, the deductibility of interest expense, local nexus requirements, transfer pricing and hybrid mismatch arrangements are potentially relevant to some of our structures and could have an adverse tax impact on our funds, investors and/or our portfolio companies. Some member countries have been moving forward on the BEPS agenda but, because timing of implementation and the specific measures adopted will vary among participating states, significant uncertainty remains regarding the impact of BEPS proposals. If implemented, these proposals could result in a loss of tax treaty benefits and increased taxes on income from our investments.
A number of European jurisdictions have enacted taxes on financial transactions, and the European Commission has proposed legislation to harmonize these taxes under the so-called "enhanced cooperation procedure," which provides for adoption of EU-level legislation applicable to some but not all EU Member States. We are continuing to evaluate the impacts of of these contemplated changes which, if adopted by individual countries, could potentially increase tax uncertainty and/or costs
35
faced by us, our funds’ portfolio companies and our investors, change our business model and cause other adverse consequences.
As part of the TCJA, any gain recognized by a non-U.S. holder on the sale or exchange of a partnership interests that is deemed to be effectively connected with a U.S. trade or business will also be treated as ECI. The TCJA includes a provision effective after December 31, 2017 requiring the transferee of an interest in a partnership that is engaged in a U.S. trade or business to withhold 10 percent of the transferor’s realized (gross purchase price) on the sale, exchange or other disposition of such partnership interest, unless an applicable non-foreign person affadavit is furnished by the transferor or another exception applies. Until additional guidance is issued by the applicable authorities, due to lack of clarity this could have an adverse impact on our secondaries business.
Operational risks, including those associated with our business model, may disrupt our businesses, result in losses or limit our growth.
We rely heavily on our financial, accounting, information and other data processing systems. We face various security threats on a regular basis, including ongoing cyber security threats to and attacks on our information technology infrastructure that are intended to gain access to our proprietary information, destroy data or disable, degrade or sabotage our systems. These security threats could originate from a wide variety of sources, including unknown third parties outside the company.
There has been an increase in the frequency and sophistication of the cyber and security threats we face, with attacks ranging from those common to businesses generally to those that are more advanced and persistent, which may target us because, as an alternative asset management firm, we hold a significant amount of confidential and sensitive information about our investors, our portfolio companies and potential investments. As a result, we may face a heightened risk of a security breach or disruption with respect to this information resulting from an attack by computer hackers, foreign governments or cyber terrorists. If successful, these types of attacks on our network or other systems could have a material adverse effect on our business and results of operations, due to, among other things, the loss of investor or proprietary data, interruptions or delays in our business and damage to our reputation. Although we are not currently aware that we have been subject to cyber-attacks or other cyber- incidents which, individually or in the aggregate, have materially affected our operations or financial condition, there can be no assurance that the various procedures and controls we utilize to mitigate these threats will be sufficient to prevent disruptions to our systems, especially because the cyber-attack techniques used change frequently or are not recognized until launched, and because cyber-attacks can originate from a wide variety of sources. If any of these systems do not operate properly or are disabled for any reason or if there is any unauthorized disclosure of data, whether as a result of tampering, a breach of our network security systems, a cyber-incident or attack or otherwise, we could suffer substantial financial loss, increased costs, a disruption of our businesses, liability to our funds and fund investors, regulatory intervention or reputational damage. The costs related to cyber or other security threats or disruptions may not be fully insured or indemnified by other means. Cyber security also has become a top priority for regulators around the world. For example, in 2017, one of the examination priorities identified by the SEC's Office of Compliance Inspections and Examinations’ (OCIE) was to continue to examine for cyber security compliance procedures and controls, including testing the implementation of those procedures and controls.
Our information systems and technology may not continue to be able to accommodate our growth, and the cost of maintaining such systems may increase from its current level. For example, our existing systems may not be adequate to identify or control the relevant risks in investment strategies employed by new investment funds we may introduce. A failure to accommodate growth, or an increase in costs related to such information systems, could have a material adverse effect on us. In addition, we rely on third-party service providers for certain aspects of our business, including for certain information systems and technology and administration of our business development companies and structured credit funds. Any interruption or deterioration in the performance of these third parties or failures of their information systems and technology could impair the quality of the funds’ operations and could affect our reputation and hence adversely affect our businesses.
We depend on our headquarters in Washington, DC, where most of our administrative and operations personnel are located, and our office in Arlington, Virginia, which houses our treasury, tax and finance functions, for the continued operation of our business. However, our global employee base services the needs of our investment funds and investors out of
31
offices around the world. As our business needs evolve and/or in order to reduce expenses, we may close offices, terminate the employment of a significant number of our personnel or cut back or eliminate the use of certain services or service providers, that, in each case, could be important to our business and without which our operating results could be adversely affected. Furthermore, a restructuring of our corporate real estate that results in the closure of one or more offices could result in significant charges and other costs incurred by us.
A disaster or a disruption in the infrastructure that supports our businesses, including a disruption involving electronic communications or other services used by us or third parties with whom we conduct business, or directly affecting our headquarters, could have a material adverse impact on our ability to continue to operate our business without interruption. Our
36
disaster recovery programs may not be sufficient to mitigate the harm that may result from such a disaster or disruption. We may also need to commit additional management, operational and financial resources to identify new professionals to join our firm and to maintain appropriate operational and financial systems to adequately support expansion. The market for hiring talented professionals, including IT professionals, is competitive and we may not be able to grow at the pace we desire.
In addition, we may not be able to obtain or maintain sufficient insurance on commercially reasonable terms or with adequate coverage levels against potential liabilities we may face in connection with potential claims, which could have a material adverse affect on our business. We may face a risk of loss from a variety of claims, including related to securities, antitrust, contracts, fraud and various other potential claims, whether or not such claims are valid. Insurance and other safeguards might only partially reimburse us for our losses, if at all, and if a claim is successful and exceeds or is not covered by our insurance policies, we may be required to pay a substantial amount in respect of such successful claim. Certain losses of a catastrophic nature, such as wars, earthquakes, typhoons, terrorist attacks or other similar events, may be uninsurable or may only be insurable at rates that are so high that maintaining coverage would cause an adverse impact on our business, our investment funds and their portfolio companies. In general, losses related to terrorism are becoming harder and more expensive to insure against. Some insurers are excluding terrorism coverage from their all-risk policies. In some cases, insurers are offering significantly limited coverage against terrorist acts for additional premiums, which can greatly increase the total cost of casualty insurance for a property. As a result, we, our investment funds and their portfolio companies may not be insured against terrorism or certain other catastrophic losses.
Our portfolio companies also rely on data and processing systems and the secure processing, storage and transmission of information. A disruption or compromise of these systems could have a material adverse effect on the value of these businesses. Our funds may invest in strategic assets having a national or regional profile or in infrastructure assets, the nature of which could expose them to a greater risk of being subject to a terrorist attack or security breach than other assets or businesses. Such an event may have adverse consequences on our investment or assets of the same type or may require portfolio companies to increase preventative security measures or expand insurance coverage.
Failure to maintain the security of our information and technology networks, including personally identifiable and investor information, intellectual property and proprietary business information could have a material adverse effect on us.
We are subject to various risks and costs associated with the collection, handling, storage and transmission of sensitive information, including those related to compliance with U.S. and foreign data collection and privacy laws and other contractual obligations, as well as those associated with the compromise of our systems collecting such information. In the ordinary course of our business, we collect and store sensitive data, including our proprietary business information and intellectual property, and personally identifiable information of our employees and our investors, in our data centers and on our networks. The secure processing, maintenance and transmission of this information are critical to our operations. Although we take various measures and have made, and will continue to make, significant investments to ensure the integrity of our systems and to safeguard against such failures or security breaches, there can be no assurance that these measures and investments will provide protection. In addition, we and our employees may be the target of fraudulent emails or other targeted attempts to gain unauthorized access to proprietary or sensitive information. A significant actual or potential theft, loss, corruption, exposure, fraudulent use or misuse of investor, employee or other personally identifiable or proprietary business data, whether by third parties or as a result of employee malfeasance or otherwise, non-compliance with our contractual or other legal obligations regarding such data or intellectual property or a violation of our privacy and security policies with respect to such data could result in significant remediation and other costs, fines, litigation or regulatory actions against us by the U.S. federal and state governments, the European Union (the “EU”) or other jurisdictions or by various regulatory organizations or exchanges. Such an event could additionally disrupt our operations and the services we provide to investors, damage our reputation, result in a loss of a competitive advantage, impact our ability to provide timely and accurate financial data, and cause a loss of confidence in our services and financial reporting, which could adversely affect our business, revenues, competitive position and investor confidence.
Extensive regulation in the United States and abroad affects our activities, increases the cost of doing business and creates the potential for significant liabilities and penalties.
Our business is subject to extensive regulation, including periodic examinations, by governmental agencies and self-regulatory organizations in the jurisdictions in which we operate around the world. Many of these regulators, including U.S. and foreign government agencies and self-regulatory organizations and state securities commissions in the United States, are empowered to conduct investigations and administrative proceedings that can result in fines, suspensions of personnel or other sanctions, including censure, the issuance of cease-and-desist orders or the suspension or expulsion of a broker-dealer or investment adviser from registration or memberships. Even if an investigation or proceeding does not result in a sanction or the sanction imposed against us or our personnel by a regulator were small in monetary amount, the costs incurred in responding to
37
such matters could be material and the adverse publicity relating to the investigation, proceeding or imposition of these sanctions could harm our reputation and cause us to lose existing fund investors or fail to gain new investors or discourage others from doing business with us. Some of our investment funds invest in businesses that operate in highly regulated industries, including in businesses that are regulated by the U.S. Federal Communications Commission and U.S. federal and state banking authorities. The regulatory regimes to which such businesses are subject may, among other things, condition our funds’ ability to invest in those businesses upon the satisfaction of applicable ownership restrictions or qualification requirements. Our failure to obtain or maintain any regulatory approvals necessary for our funds to invest in such industries may disqualify our funds from participating in certain investments or require our funds to divest themselves of certain assets.
In recent years, the SEC and its staff have focused on issues relevant to alternative asset management firms and have formed specialized units devoted to examining such firms and, in certain cases, bringing enforcement actions against the firms, their principals and their employees. It is unclear whether the SEC and its staff will maintain the same level of enforcement activity under the current administration. Significant enforcement activity related to alternative asset management firms may cause us to reevaluate certain practices and adjust our compliance control function as necessary and appropriate.
It is generally expected that the SEC’s oversight of alternative asset managers will continue to focus on concerns related to transparency and investor disclosure practices. Although the SEC has cited improvements in disclosures and industry practices in this area, it has also indicated that there is room for improvement in particular areas, including fees and expenses (and the allocation of such fees and expenses) and co-investment practices. To this end, many firms have received inquiries during examinations or directly from the SEC Division of Enforcement regarding various transparency-related topics, including the acceleration of monitoring fees, the allocation of broken-deal expenses, the disclosure of operating partner or operating executive compensation, outside business activities of firm principals and employees, group purchasing arrangements and general conflicts of interest disclosures.
The SEC’s focus in these areas could impact Carlyle in various ways. For example, in November 2015, the SEC requested additional information about our historical monitoring fee acceleration practices, a topic of a recent enforcement action within the private equity industry. We continue to cooperate with the SEC’s informal request. In addition, our private equity funds frequently engage operating executives who often work (generally, on a part-time basis) with our investment teams during due diligence, provide board-level governance and support and advise portfolio company management. Operating executives generally are third parties, are not considered Carlyle employees and typically are retained by us pursuant to consulting agreements. Generally these consultants also are involved in non-Carlyle related activities, including serving on boards of companies that are not our portfolio companies. In some cases, an operating executive may be retained by a portfolio company directly and in such instances the portfolio company may compensate the operating executive directly (meaning that investors in our private equity funds may indirectly bear the cost of the operating executive’s compensation). While we believe we have made appropriate and timely disclosures regarding the engagement and compensation of our operating executives, the SEC staff may disagree.
We regularly are subject to requests for information and informal or formal investigations by the SEC and other regulatory authorities, with which we routinely cooperate and, in the current environment, even historical practices that have been previously examined are being revisited. In 2014, the SEC indicated that investment advisers that receive transaction-based compensation for investment banking or acquisition activities relating to fund portfolio companies may be required to register as broker-dealers. Specifically, the Staff noted that if a firm receives fees from a fund portfolio company in connection with the acquisition, disposition or recapitalization of such portfolio company, such fees could raise broker-dealer concerns under applicable regulations related to broker dealers. In 2016, the SEC charged an SEC-registered investment advisor to a private equity fund and its principal with violating Section 15(a) of the Exchange Act for providing brokerage services and receiving transaction-based compensation in connection with the purchase and sale of portfolio companies while not being registered as a broker-dealer. To the extent we receive such transaction fees and the SEC takes the position that such activities render us a “broker” under the applicable rules and regulations of the Exchange Act, we could be subject to additional regulation. If receipt of transaction fees from a portfolio company is determined to require a broker-dealer license, receipt of such transaction fees in the past or in the future during any time when we did not or do not have a broker-dealer license could subject us to liability for fines, penalties or damages. Even if a regulatory investigation or proceeding does not result in a sanction or the sanction imposed against us or our personnel by a regulator were small in monetary amount, the adverse publicity relating to such matters could harm our reputation. In addition, our ability to accelerate such fees in the future could be affected.
We regularly rely on exemptions from various requirements of the Securities Act of 1933, as amended (the “Securities Act”), the Exchange Act, the Investment Company Act, the Commodity Exchange Act, and the U.S. Employee Retirement Income Security Act of 1974, as amended (“ERISA”), in conducting our asset management activities in the United States.
38
Similarly, in conducting our asset management activities outside the United States, we rely on available exemptions from the regulatory regimes of various foreign jurisdictions. These exemptions from regulation within the United States and abroad are sometimes highly complex and may, in certain circumstances, depend on compliance by third parties whom we do not control. If for any reason these exemptions were to become unavailable to us, we could become subject to regulatory action or third-party claims and our business could be materially and adversely affected. For example, in 2014, the SEC amended Rule 506 of Regulation D under the Securities Act to impose “bad actor” disqualification provisions which ban an issuer from offering or selling securities pursuant to the safe harbor in Rule 506 if the issuer, or any other “covered person”, is the subject of a criminal, regulatory or court order or other “disqualifying event” under the rule which has not been waived by the SEC. The definition of “covered person” under the rule includes an issuer’s directors, general partners, managing members and executive officers; affiliates who are also issuing securities in the offering; beneficial owners of 20% or more of the issuer’s outstanding equity securities; and promoters and persons compensated for soliciting investors in the offering. Accordingly, our ability to rely on Rule 506 to offer or sell securities would be impaired if we or any “covered person” is the subject of a disqualifying event under the rule and we are unable to obtain a waiver from the SEC. Moreover, the requirements imposed by our regulators are designed primarily to ensure the integrity of the financial markets and to protect investors in our funds and are not designed to protect our unitholders. Consequently, these regulations often serve to limit our activities and impose burdensome compliance requirements. See—“Part I. Item 1. Business —Regulatory and Compliance Matters.”
We may become subject to additional regulatory and compliance burdens as we expand our product offerings and investment platform. For example, we have a number of closed-end investment companies in our Global Credit segment that are regulated as business development companies under the Investment Company Act. These business development companies are subject to inspection by the SEC and to the Investment Company Act and the rules thereunder, which, among other things impose regulatory restrictions on principal transactions between, and joint transactions among, business development company and certain of its affiliates, including its investment adviser. One such business development company completed an initial public offering in 2017, further subjecting that company to additional securities law requirements applicable to publicly traded issuers, as well as the listing standards of the applicable national securities exchange. These additional regulatory requirements will increase our compliance costs and may expose us to liabilities and penalties if we fail to comply with the applicable laws, rules and regulations.
In addition, the Iran Threat Reduction and Syria Human Rights Act of 2012 (the “ITRA”) expanded the scope of U.S. sanctions against Iran and Section 219 of the ITRA amended the Exchange Act to require companies subject to SEC reporting obligations under Section 13 of the Exchange Act to disclose in their periodic reports specified dealings or transactions involving Iran or other individuals and entities targeted by certain sanctions promulgated by the Office of Foreign Assets Control (“OFAC”) engaged in by the reporting company or any of its affiliates, including in our case some of our portfolio companies, during the period covered by the relevant periodic report. In some cases, the ITRA requires companies to disclose transactions even if they were permissible under U.S. law. Although the ITRA also expanded the scope of U.S. sanctions by requiring foreign entities majority owned or controlled by a U.S. person to abide by U.S. sanctions against Iran to the same extent as a U.S. person, this restriction and certain sanctions were eased on January 16, 2016, when OFAC issued General License H and the U.S. Government relaxed or revoked other sanctions pursuant to the Joint Comprehensive Plan of Action (the “JCPOA”), a multilateral agreement regarding Iran’s nuclear program. The JCPOA did not alter, however, our ITRA obligation to separately file with the SEC a notice that specified activities have been disclosed in our quarterly and annual reports, and the SEC is required to post this notice of disclosure on its website and send the report to the U.S. President and certain U.S. Congressional committees. Disclosure of ITRA-specified activity, even if such activity is legally permissible and not subject to sanctions under applicable law, and any fines or penalties actually imposed on us or our affiliates as a result of impermissible any Iran-related activities, could harm our reputation and have a negative impact on our business. In the past, we have disclosed pursuant to Section 13 of the Exchange Act, certain permissible dealings and transactions and to date, we have not received notice of any investigation into such activities.
It is unclear what impact the United Kingdom’s exit from the European Union will have on the Partnership or the fund portfolio companies.
The United Kingdom (the “UK”) held a referendum in June 2016 on whether to remain a member state of the EU, in which a majority of voters voted to leave the EU. Pursuant to the referendum, the UK government invoked Article 50 of the Lisbon Treaty relating to withdrawal (“Article 50”) on March 29, 2017. Under Article 50, the Treaty on the European Union and the Treaty on the Functioning of the European Union cease to apply in the relevant state from the date of entry into force of a withdrawal agreement or, failing that, two years after the notification of intention to withdraw, although this period may be extended in certain circumstances. It is at present unclear what type of relationship between the UK and the EU will be established, or at what date (whether by the time when, or after, the UK ceases to be a member of the EU), or what would be the content of such a relationship. It is possible that a new relationship would preserve the applicability of certain EU rules (or
39
equivalent rules) in the UK, and the UK government has indicated that it intends to bring existing EU law into UK law on the date of the UK’s exit from the EU in general, subject to certain powers to deal with deficiencies in such retained EU law.
Currently under the EU single market directives, mutual access rights to markets and market infrastructure exist across the EU and the mutual recognition of insolvency, bank recovery and resolution regimes applies. In addition, certain regulated entities licensed or authorized in one European Economic Area ("EEA") jurisdiction may operate on a cross-border basis in other EEA countries in reliance on passporting rights and without the need for a separate license or authorization. There is uncertainty as to whether, following a UK exit from the EU or the EEA (whatever the form thereof), a passporting regime (or similar regime in its effect) will apply (if at all). Depending on the terms of the UK’s exit and the terms of any replacement relationship, it is likely that UK regulated entities may, on the UK’s withdrawal from the EU, lose the right to passport their services to EEA countries, and EEA entities may lose the right to reciprocal passporting into the UK. Also, UK entities may no longer have access rights to market infrastructure across the EU and the recognition of insolvency, bank recovery and resolution regimes across the EU may no longer be mutual.
At this time, it is difficult to predict precisely how the UK’s withdrawal from the EU will be implemented and what the economic, tax, fiscal, legal, regulatory and other implications will be for the private investment funds industry and the broader European and global financial and real estate markets generally and for the Partnership, its investment funds and fund portfolio companies, specifically. Given the size and importance of the UK’s economy, uncertainty or unpredictability about its legal, political and/or economic relationships with Europe is now, and may continue to be for the foreseeable future (including beyond the date of the UK’s withdrawal from the EU), a source of instability, significant currency fluctuations and/or other adverse effects on international markets, international trade agreements and/or other existing cross-border cooperation arrangements (whether economic, tax, fiscal, legal, regulatory or otherwise). In addition, the withdrawal of the UK from the EU could have a destabilizing effect in which other member states may also consider withdrawing from the EU. The decision for any other member state to withdraw from the EU could exacerbate such uncertainty and instability and may present similar and/or additional potential risks and consequences for the Partnership, its investment funds and fund portfolio companies.
Regulatory changes in the United States could adversely affect our business and the possibility of increased regulatory focus could result in additional burdens and expenses on our business.
As a result of the global financial crisis and highly publicized financial scandals, there has been an active debate over the appropriate extent of regulation and oversight of the financial industry, including private investment funds and their managers. The regulatory and legal requirements that currently apply to our business are subject to change from time to time and may become more restrictive, which may impose additional expenses on us, make compliance with applicable requirements more difficult, require significant attention of our senior management team or otherwise restrict our ability to conduct our business activities in the manner in which they are now conducted.
The Dodd-Frank Wall Street Reform and Consumer Protection Act (the “Dodd-Frank Act”), enacted in 2010, has imposed significant changes on almost every aspect of the U.S. financial services industry, including aspects of our business. The current administration has indicated a desire to repeal, revise or replace aspects of the Dodd-Frank Act, but the timing and details on specific proposals are uncertain. Among other things, the Dodd-Frank Act currently includes the following provisions, which could have an adverse impact on our ability to conduct our business:
|
•
|
The Dodd-Frank Act imposes a number of restrictions on the relationship and activities of banking organizations with private equity funds and hedge funds and other provisions that will affect the private equity industry, either directly or indirectly. Among other things, the Volcker Rule generally prohibits any “banking entity” (broadly defined as any insured depository institution, any company that controls such an institution, a non-U.S. bank that is treated as a bank holding company for purposes of U.S. banking law and any affiliate or subsidiary of the foregoing entities) from sponsoring or acquiring or retaining an ownership interest in a fund that is not subject to the provisions of the 1940 Act in reliance upon either Section 3(c)(1) or Section 3(c)(7) of the 1940 Act. The Volcker Rule also requires certain nonbank financial companies that have been designated as systemically important by the Financial Stability Oversight Council ("FSOC") and subject to supervision by the Federal Reserve to comply with additional capital requirements and comply with certain other quantitative limits on such activities, although such entities are not expressly prohibited from engaging in proprietary trading or sponsoring or investing in such funds. Furthermore, divestitures by banking entities of impermissible ownership interests in covered funds to comply with the Volcker Rule may lead to lower prices in the secondary market for interests in our funds, which could have adverse implications for our ability to raise funds from investors who may have considered the availability of secondary market liquidity as a factor in determining whether to invest.
|
40
|
•
|
The Dodd-Frank Act also imposes a new regulatory structure on the “swaps” market, including requirements for clearing, exchange trading, capital, margin, reporting, and recordkeeping. In connection with the Dodd-Frank Act, the CFTC has finalized many rules applicable to swap market participants, including business conduct standards for swap dealers, reporting and recordkeeping, mandatory clearing for certain swaps, exchange trading rules applicable to swaps, initial and variation margin requirements for uncleared swap transactions and regulatory requirements for cross-border swap activities. For example, the CFTC finalized a rule governing margin requirements for uncleared swaps entered into by swap dealers and major swap participants who are not supervised by a “prudential regulator” (“covered swap entities”). The final rule generally requires covered swap entities, subject to certain thresholds and exemptions for inter-affiliate swaps, to collect and post margin in respect of uncleared swap transactions with other covered swap entities and financial end-users. In particular, the finalized rule requires covered swap entities and financial end-users having “material swaps exposure,” defined as such entity and certain affiliates have an average aggregate daily notional amount of uncleared swaps exceeding $8 billion for June, July and August of the previous calendar year, to collect and post a minimum amount of “initial margin” in respect of each uncleared swap. In addition, the finalized rule requires covered swap entities entering into uncleared swaps with other covered swap entities or financial-end users, regardless of swaps exposure, to post or collect (as appropriate) “variation margin”. These margin requirements for uncleared swaps could adversely affect our business, including our ability to enter such swaps or our available liquidity.
|
|
•
|
The Dodd-Frank Act amended the Exchange Act to direct the Federal Reserve and other federal regulatory agencies to adopt rules requiring sponsors of asset-backed securities (or a majority-owned affiliate thereof) to retain at least 5% of the credit risk relating to the assets collateralizing the asset-backed securities (the “U.S. Risk Retention Rules”). The U.S. Risk Retention Rules were issued by five federal banking and housing agencies (the Federal Deposit Insurance Corporation, the Comptroller of the Currency, the Board of Governors of the Federal Reserve System, the Department of Housing and Urban Development, and the Federal Housing Finance Agency) and the SEC in October 2014 and became effective on December 24, 2016 (the "U.S. Risk Retention Effective Date"). CLOs issued prior to the U.S. Risk Retention Effective Date are exempt from the requirements set forth in the U.S. Risk Retention Rules, except in connection with certain offers and sales of securities thereunder after the U.S. Risk Retention Effective Date (typically made in connection with any repricing, refinancing or reset of such CLO). With respect to the regulation of CLOs, the U.S. Risk Retention Rules require that either (i) the “sponsor” (which, in most cases, will be us) or a “majority-owned affiliate” thereof (in each case as defined in the U.S. Risk Retention Rules) retain such 5% portion described above as an “eligible vertical interest” or as an “eligible horizontal residual interest” (in each case as defined in the U.S. Risk Retention Rules) or any combination thereof in the CLO in the manner required by the U.S. Risk Retention Rules (provided that in certain circumstances, as described therein, a “sponsor” may offset the amount of “eligible interests” (as defined in the U.S. Risk Retention Rules) it is required to own by the eligible interests in the CLO acquired by an “originator” (as defined in the U.S. Risk Retention Rules) in such CLO) or (ii) the CLO is an “open market CLO” that buys and holds only certain “CLO-eligible loan tranches” (in each case as defined in the U.S. Risk Retention Rules) and for which the "lead arranger" - contrary to current market practice - retains at least 20% of the aggregate principal balance of the funded portion of the syndicated credit facility (that includes each "CLO-eligible loan tranche") at origination and thereafter retains (unhedged) at least 5% of the funded portion of the syndicated credit facility (that includes each "CLO-eligible loan tranche") through the life of the related CLO. The U.S. Risk Retention Rules contain provisions that may have adverse effects on us and/or the holders of the notes or other securities issued by our CLOs. The U.S. Risk Retention Rules permit the financing of a required retention interest to be financed only on a full recourse basis and, to the extent that we were to employ leverage for our required retention investments, the U.S. Risk Retention Rules generally prohibit the transfer or hedging of the related risk, which could cause losses to be earlier and larger than they would have been if leverage were not employed.
|
|
•
|
The Dodd-Frank Act authorizes federal regulatory agencies to review and, in certain cases, prohibit compensation arrangements at financial institutions that give employees incentives to engage in conduct deemed to encourage inappropriate risk taking by covered financial institutions. On May 16, 2016, the SEC re-proposed a rule, as part of a joint rulemaking effort with U.S. federal banking regulators, that would apply to "covered financial institutions," including registered investment advisers and broker-dealers that have total consolidated assets of at least $1 billion, and impose substantive and procedural requirements on incentive-based compensation arrangements. The application of this rule, if adopted, to us could limit our ability to recruit and retain investment professionals and senior management executives. However, the proposed rule remains pending and may be subject to significant modifications.
|
41
|
•
|
The Dodd-Frank Act requires public companies to adopt and disclose policies requiring, in the event the company is required to issue an accounting restatement, the giveback of any related incentive compensation from current and former executive officers.
|
|
•
|
The Dodd-Frank Act amended the Exchange Act to compensate and protect whistleblowers who voluntarily provide original information to the SEC and establishes a fund to be used to pay whistleblowers who will be entitled to receive a payment equal to between 10% and 30% of certain monetary sanctions imposed in a successful government action resulting from the information provided by the whistleblower.
|
On February 9, 2018, the U.S. Court of Appeals for the District of Columbia ruled that the U.S. Risk Retention Rules do not apply to managers of open-market CLOs - CLOs for which the underlying assets are not transferred by the manager to the CLO issuer via a sale. The agencies have 45 days from the date of the decision to petition the U.S. Court of Appeals for an
en banc
review, during which time the rule will remain effective. If such petition is not made, or if such petition is made but denied, the U.S. Court of Appeals' ruling will become effective 7 days later with retroactive effect on all existing open-market CLOs. We are in the process of reviewing this decision and its ultimate impact on our business.
In June 2010, the SEC approved Rule 206(4)-5 under the Advisers Act regarding “pay to play” practices by investment advisers involving campaign contributions and other payments to government clients and elected officials able to exert influence on such clients. The rule prohibits investment advisers from providing advisory services for compensation to a government client for two years, subject to very limited exceptions, after the investment adviser, its senior executives or its personnel involved in soliciting investments from government entities make contributions to certain candidates and officials in a position to influence the hiring of an investment adviser by such government client. Any failure on our part to comply with the rule could expose us to significant penalties, loss of fees, and reputational damage. In August 2016, the SEC approved “pay to play” regulations proposed by FINRA that are largely similar to the SEC’s regulations and such laws went into effect in August 2017. These FINRA rules effectively prohibit the receipt of compensation from state or local government agencies for solicitation and distribution activities within two years of a prohibited contribution by a broker-dealer or one of its covered associates. There have also been similar laws, rules and regulations and/or policies adopted by a number of states and municipal pension plans, which prohibit, restrict or require disclosure of payments to (and/or certain contracts with) state officials by individuals and entities seeking to do business with state entities, including investment by public retirement funds.
We may be impacted indirectly by guidance recently directed to regulated banking institutions with regard to leveraged lending practices. In March 2013, the U.S. federal banking agencies issued updated guidance on credit transactions characterized by a high degree of financial leverage. To the extent that such guidance limits the amount or increases the cost of financing we are able to obtain for our transactions, the returns on our investments may suffer. However, the status of the 2013 leveraged lending guidance remains in doubt following a determination by the Government Accountability Office, on October 19, 2017, that such guidance constituted a “rule” for purposes of the Congressional Review Act of 1996. As a result, the guidance was required to be submitted to Congress for review. It is possible the guidance could be overturned if a joint resolution of disapproval is passed by Congress.
The current administration’s short-term legislative agenda may include certain deregulatory measures for the U.S. financial services industry, including changes to the Volcker Rule, the U.S. Risk Retention Rules, capital and liquidity requirements, FSOC’s authority and other aspects of the Dodd-Frank Act. On February 3, 2017, the president signed an executive order calling for the administration to review U.S. financial laws and regulations in order to determine their consistency with a set of core principles identified in the order. Various proposals focused on deregulation of the U.S. financial services industry may have the effect of increasing competition for our credit-focused businesses or otherwise reducing investment opportunities. Increased competition from banks and other financial institutions in the credit markets could have the effect of reducing credit spreads, which may adversely affect the revenues of our credit and other businesses whose strategies include the provision of credit to borrowers.
The Dodd-Frank Act, as well as future related legislation, may have an adverse effect on the fund industry generally and/or us, specifically. It is difficult to determine the full extent of the impact on us of any new laws, regulations or initiatives that may be proposed or whether any of the proposals will become law. Any changes in the regulatory framework applicable to our business, including the changes described above, may impose additional costs on us, require the attention of our senior management or result in limitations on the manner in which we conduct our business. Moreover, there may be an increase in regulatory investigations of the trading and other investment activities of alternative asset management funds, including our funds. Compliance with any new laws or regulations could make compliance more difficult and expensive, affect the manner in which we conduct our business and adversely affect our profitability.
42
The short-term and long-term impact of the Basel III capital standards is uncertain.
In June 2011, the Basel Committee on Banking Supervision, an international body comprised of senior representatives of bank supervisory authorities and central banks from 27 countries, including the United States, announced the final framework for a comprehensive set of capital and liquidity standards, commonly referred to as “Basel III,” for internationally active banking organizations and certain other types of financial institutions. These new standards, which will be fully phased in by 2019, will require banks to hold more capital, predominantly in the form of common equity, than under the current capital framework. Implementation of Basel III will require implementing regulations and guidelines by member countries. In July 2013, the U.S. federal banking regulators announced the adoption of final regulations to implement Basel III for U.S. banking organizations, subject to various transition periods. Compliance with the Basel III standards may result in significant costs to banking organizations, which in turn may result in higher borrowing costs for the private sector and reduced access to certain types of credit.
Regulatory initiatives in jurisdictions outside the United States could adversely affect our business.
Similar to the environment in the United States, the current environment in jurisdictions outside the United States in which we operate, in particular the EU, has become subject to further regulation. Governmental regulators and other authorities in the EU have proposed or implemented a number of initiatives and additional rules and regulations that could adversely affect our business.
The Capital Requirements Regulation together with the recast Capital Requirements Directive (collectively “CRD IV”), reformed the EU's capital requirements regime for credit institutions and investment firms. CRD IV implements the key Basel III reforms in the EU. These include amendments to the definition of capital and counterparty credit risk and the introduction of a leverage ratio and liquidity requirements. CRD IV was also used to introduce other reforms, such as to introduce stricter control on remuneration of key employees and risk takers within certain credit institutions and investment firms. The regulation became applicable and member states were required to transpose the Directive's requirements from January 1, 2014. The extent of CRD IV’s impact on a credit institution or investment firm will depend on a variety of factors, including the firm’s size and the nature of its activities. It is possible that other regulators may seek to impose similar controls on remuneration of personnel. Currently, Carlyle is permitted to disapply certain of CRD IV’s restrictive remuneration provisions. However, to the extent that European regulators determine that Carlyle must comply with these restrictions or such regulators incorporate similar restrictions into other European directives to which Carlyle is subject, it may be necessary for certain of our subsidiaries to change their compensation structures for key personnel, thereby affecting our ability to recruit and retain these personnel.
The AIFMD was implemented in most jurisdictions in the EEA, on July 22, 2014. In general, the AIFMD regulates alternative investment fund managers (“AIFMs”) of a broad range of alternative investment funds (“AIFs”) domiciled within and (depending on the circumstances) outside the EEA. The AIFMD also regulates and imposes regulatory obligations in respect of the marketing in the EEA by AIFMs (whether established in the EEA or elsewhere) of AIFs (whether established in the EEA or elsewhere). The AIFMD was intended to have a staged implementation through 2018, but certain key milestones related to the implementation have been delayed. As a result of the business activities of certain of our subsidiaries, such subsidiaries currently are subject to various compliance obligations in connection with the AIFMD, including investor and regulatory reporting, portfolio company asset stripping restrictions, deal-related notifications and remuneration reporting. AlpInvest, one of our subsidiaries, obtained authorization in 2015 and is licensed as an AIFM under the AIFMD by the Authority for Financial Markets in the Netherlands. Additionally, in 2018, one of our subsidiaries, CIM Europe S.à.r.l., obtained authorization as an alternative investment fund manager in Luxembourg. The AIFMD obligations applicable to these and any other subsidiaries may have an adverse effect on us and/or our investment funds by, among other things, increasing the regulatory burden and costs of raising money and doing business in EEA jurisdictions, imposing capital requirements on our business, imposing extensive disclosure obligations on certain investment funds and portfolio companies, and disadvantaging our investment funds as bidders for and potential owners of private companies located in the EEA when compared to non-AIF/AIFM competitors, which may not be subject to the requirements of the AIFMD.
Certain of our European subsidiaries must comply with the pan-European regime established by the EU Markets in Financial Instruments Directive (Directive 2004/39/EC) ("MiFID") which regulates the provision and conduct of investment services and activities throughout the EEA. MiFID sets out detailed requirements governing the organization and conduct of business of investment firms, regulated markets and certain other entities such as credit institutions to the extent they perform investment services or activities. It also includes pre- and post-trade transparency requirements for securities markets and extensive transaction reporting requirements for transactions within scope.
43
MiFID has been substantially amended by Directive 2014/65/EU and Regulation 600/2014/EU (collectively referred to as "MiFID II") that, save for certain provisions, has been effective from January 3, 2018. MiFID II is designed to amend the functioning of financial markets in light of the financial crisis and to strengthen investor protection. MiFID II has extended the MiFID requirements in a number of areas including market structure requirements, new and extended requirements in relation to transparency and transaction reporting, revised rules on research and inducements and product governance requirements. MiFID II has therefore imposed further compliance requirements on our European operations, requiring additional management time and resources.
In December 2011, China’s National Development and Reform Commission (the "NDRC Regulation") issued a new circular regulating the activities of private equity funds established in China. The circular established new rules relating to the establishment, fundraising and investment scope of such funds; risk control mechanisms; basic responsibilities and duties of fund managers; information disclosure systems; and record filing. As a supplement to the NDRC regulations in August 2014, China Securities Regulatory Commission (“CSRC”), the Chinese securities regulator, promulgated the Interim Regulations on the Supervision and Administration of Private Investment Funds (the “CSRC Regulations”). These new regulations adopt a very broad definition of private investment funds, potentially including private equity funds. In recent years, regulations, directives and guidelines from, amongst others, the Administration for Industry and Commerce and the Asset Management Association of China (“AMAC”) have continued to regulate private investment funds incorporated in China. For example, during the course of 2016. AMAC issued “
Guidelines for Internal Control of Privately-raised Investment Fund Managers”
(February, 2016), “
Administrative Measures for Information Disclosure of Privately-raised Investment Fund”
(February, 2016), “
Announcement on Further Regulating Relevant Matters Concerning the Registration of the Managers of the Privately-Raised Funds”
(February, 2016), “
Measures for the Administration of Private Placement of Private Investment Funds”
(April, 2016) and “
Private Equity Fund Contract Guidelines No. 1, No. 2 and No. 3” (
April, 2016). These regulations may have an adverse effect on us and/or our
renminbi (
RMB)-denominated investment funds by, among other things, increasing the regulatory burden and costs of raising money for RMB-denominated investment funds, imposing extensive disclosure obligations on RMB-denominated investment funds and their associated portfolio companies, and disadvantaging our investment funds as bidders, imposing significant capital requirements on managers of RMB denominated investment funds, imposing numerous registrations and ongoing filings by private investment fund managers in China with multiple government authorities.
The legislative and regulatory framework for privacy and data protection issues worldwide is rapidly evolving and is likely to remain uncertain for the foreseeable future. The Company collects personally identifiable information (PII) and other data as an integral part of its business processes and activities. This data is subject to a variety of U.S. and international laws and regulations, including oversight by various regulatory or other governmental bodies. Many foreign countries and governmental bodies, including the European Union and other relevant jurisdictions where we conduct business, have laws and regulations concerning the collection and use of PII and other data obtained from their residents or by businesses operating within their jurisdiction that are more restrictive than those in the U.S. Additionally, in May 2016, the European Union adopted the General Data Protection Regulation (the "GDPR"), which will impose more stringent data protection requirements and will provide for greater penalties for noncompliance beginning in May 2018. A failure to comply with the GDPR could result in fines up to 20 million Euros or 4% of annual global revenues, whichever is higher. Further, any inability, or perceived inability, to adequately address privacy and data protection concerns, or comply with applicable laws, regulations, policies, industry standards, contractual obligations, or other legal obligations, even if unfounded, could result in additional cost and liability and could damage our reputation and adversely affect our business.
The EU has adopted certain risk retention and due diligence requirements (“EU Risk Retention and Due Diligence Requirements”) in respect of various types of EU-regulated investors including our credit institutions, authorized AIFMs, investment firms, insurance and reinsurance undertakings and (subject to the completion of secondary legislation) Undertakings for Collective Investment in Transferable Securities (UCITS) funds. Among other things, such requirements restrict an investor who is subject to the EU Risk Retention and Due Diligence Requirements, from investing in securitizations, including funds managed by us, unless: (i) the originator, sponsor or original lender in respect of the relevant securitization has explicitly disclosed that it will retain, on an on-going basis, a net economic interest of not less than 5% in respect of certain specified credit risk tranches or securitized exposures; and (ii) that investor is able to demonstrate that it has undertaken certain due diligence in respect of various matters including but not limited to its note position, the underlying assets and (in the case of certain types of investors) the relevant sponsor or originator.
To the extent the EU Risk Retention Rules are to be satisfied through the EU “sponsor” option, it is expected that the holder of the EU retention interest will be authorized by the UK Financial Conduct Authority under the Financial Services and Markets Act 2000 (“FSMA”) and capitalized (with regulatory capital and other required resources) in a manner necessary or advisable to enable it to satisfy the requirements of FSMA, MiFID II and relevant FCA rules. In addition, such “sponsor” holding the EU retention interest would be required to demonstrate that: (a) it meets the definition of investment firm under the CRR, (b) it is authorized to, and does, carry on a business of providing investment management services and activities listed in
44
paragraph (7) of Section A of Annex 1 of MiFID II (placing of financial instruments without a firm commitment basis), and (c) it is a “sponsor” for the purposes of Article 405 of the CRR. For purposes of these requirements, “CRR” means Regulation No 575/2013 of the European Parliament and of the Council (as amended from time to time and as implemented by Member States of the European Union) together with any implemented or delegated regulations, technical standards and guidance related thereto. Whether a collateral manager of a CLO qualifies as an EU “sponsor” under the CRR will depend upon the MiFID authorizations (or permissions) the collateral manager holds from its EU home country supervisor.
Certain of the CLOs currently being managed by one of our affiliates have been designed to comply with the EU Risk Retention Rules via the “sponsor” approach. For these CLOs, CELF Advisors LLP, one of our asset-management affiliates with the required MiFID II permissions to act as the “sponsor” of CLOs, has undertaken to hold the EU retention interests. In the future, certain other newly-formed affiliates may serve as “sponsor” and holder of the EU retention interests on CLO investments.
The EU Retention Rules may also be satisfied if the “originator” holds the EU retention interest. Article 4(1)(13) of the CRR defines “Originator” as either (1) an entity that itself or through related entities, directly or indirectly, was involved in the original agreement which created the obligations or potential obligations of the debtor or potential debtor giving rise to the exposure being securitized or (2) an entity that purchases a third party’s exposures for its own account and then securitizes them. In the future, certain newly-formed affiliates may serve as “originator” and holder of the EU retention interest on CLO investments.
The European Commission, on September 30, 2015, published a proposal to amend the CRR (the "CRR Amendment Regulation") and a proposed regulation relating to a European framework for simple, transparent and standardized securitizations (such regulation, including any implementing regulation, technical standards and official guidelines related thereto, the "Securitization Framework" and, together with the CRR Amendment Regulation, the "Securitization Regulation") which would, amongst other things, re-cast the EU Risk Retention and Due Diligence Requirements as part of wider changes to establish a "Capital Markets Union" in Europe (including, but not limited to, the imposition of a direct retention obligation on eligible risk retainers, transparency and due diligence requirements, as well as certain restrictions in connection with the retention of risk as an originator). On May 30, 2017, the European Commission, European Council of Ministers and European Parliament each announced that a political agreement had been reached in principle on the Securitization Regulation. Among other matters, the European Parliament announced that the minimum net economic interest required to be retained under the new regulation would remain at 5% irrespective of the permitted method of retention used. The Securitization Regulation (2017/2402/EU) entered into force on January 17, 2018, but will apply on and from January 1, 2019. On December 15, 2017, the European Banking Authority (“EBA”) launched a public consultation on its draft Regulatory Technical Standards specifying certain requirements for originators, sponsors and original lenders in relation to risk retention pursuant to the Securitization Regulation. The consultation will close on March 15, 2018. There are material differences between the current EU retention requirements and the requirements which will apply under the Securitization Regulation. Specifically, pursuant to Article 410(1) of the CRR, the EBA is required to report to the European Commission annually on measures taken by competent authorities to ensure compliance with the retention requirements of Articles 404-410. Articles 404-410 of the CRR will be repealed in their entirety by the CRR Amendment Regulation (2017/2401/EU) and will be replaced by provisions of the Securitization Framework, which will require a report from the European Commission on the functioning of the Securitization Regulation, together with a draft legislative proposal if appropriate, to be delivered to the European Council and Parliament within three years of its entry into force.
Though the Securitization Regulation will apply to securitizations the securities of which are issued on or after January 1, 2019, there can be no assurance as to whether relevant transactions or any potential refinancing will be affected by the Securitization Regulation or any change thereto or review thereof. There can also be no assurances as to whether relevant transactions or any potential refinancing will be affected by any other change in law or regulation relating to the EU Risk Retention and Due Diligence Requirements, including as a result of any changes recommended in future reports or reviews. Failure to comply with one or more of the requirements of the Securitization Regulations may result in various penalties, including, in the case of those investors subject to regulatory capital requirements, the imposition of a punitive capital charge on the notes issued by our CLOs acquired by the relevant investor. In addition such regulations could have a negative impact on the price and liquidity of certain of our EU CLO notes in the secondary market.
In December 2015, the EBA produced guidelines to set appropriate aggregate limits to shadow banking entities when carrying out banking activities. These guidelines came into effect on January 1, 2017. While most alternative investment funds are excluded from the definition of “shadow banking entity,” funds that use leverage on a substantial basis at fund level or have certain third-party lending exposures are within the definition. When dealing with shadow banking entities, the EEA financial institution would be required to implement additional effective processes (including with respect to due diligence) and set internal aggregate and individual limits to such exposures where they exceed 0.25% of the institution’s eligible capital. While
45
the guidelines do not themselves introduce a quantitative limit to institutions’ exposures to shadow banking entities at the individual or aggregate exposure level, they place the responsibility on the banking sector to demonstrate that risks are managed effectively. Affected institutions will be required to set internal aggregate and individual limits to exposures to individual shadow banking entities which could limit or restrict the availability of credit and/or increase the cost of credit from these institutions for impacted funds.
In May 2017, the European Central Bank (“ECB”) issued guidance on leveraged transactions. The ECB guidance applies to significant credit institutions supervised by the ECB in member states of the euro zone. Under the guidance, credit institutions are expected to have in place internal policies that include a definition of “leveraged transactions”. Loans or credit exposures to a borrower should be regarded as leveraged transactions if: (i) the borrower’s post-financing level of leverage exceeds a total debt to EBITDA ratio of 4.0 times; or (ii) the borrower is owned by one or more “financial sponsors”. For these purposes, a financial sponsor is an investment firm that undertakes private equity investments in and/or leveraged buyouts of companies. In summary, credit institutions are expected to define their appetite for underwriting and syndicating transactions, which will include defining acceptable leverage levels. Underwriting of transactions having a ratio of total debt to EBITDA exceeding 6.0 times at deal inception is a high level of leverage and should be exceptional. For most industries, the ECB believes a leverage level in excess of 6.0 times total debt to EBITDA should raise concerns. Following these guidelines, credit institutions in the euro zone could in the future limit, delay or restrict the availability of credit and/or increase the cost of credit for funds or portfolio companies involved in leveraged transactions. Credit institutions may be reluctant to enter into a leveraged transaction having a ratio of total debt to EBITDA exceeding 6.0 times absent an appropriate justification.
Our investment businesses are subject to the risk that similar measures might be introduced in other countries in which our funds currently have investments or plan to invest in the future, or that other legislative or regulatory measures that negatively affect their respective portfolio investments might be promulgated in any of the countries in which they invest. The reporting related to such initiatives may divert the attention of our personnel and the management teams of our portfolio companies. Moreover, sensitive business information relating to us or our portfolio companies could be publicly released.
See—“Risks Related to Our Business Operations —Our funds make investments in companies that are based outside of the United States, which may expose us to additional risks not typically associated with investing in companies that are based in the United States” and “Part I. Item 1. Busin
e
ss — Regulatory and Compliance Matters”—for more information.
Rapidly changing regulations regarding derivatives and commodity interest transactions could adversely impact various aspects of our business
.
The regulation of derivatives and commodity interest transactions in the United States and other countries is a rapidly changing area of law and is subject to ongoing modification by governmental and judicial action. We and our affiliates enter into derivatives and commodity interest transactions for various purposes, including to manage the financial risks related to our business. Accordingly, the impact of this evolving regulatory regime on our business is difficult to predict, but it could be substantial and adverse.
Among other things, the CFTC adopted certain amendments to its existing rules that potentially subject certain of our affiliated entities to registration, reporting and record-keeping obligations in connection with derivatives transactions (including for hedging/risk management purposes). As such, our business may incur increased ongoing costs associated with monitoring compliance with the CFTC registration and exemption obligations across platforms and complying with the various reporting and record-keeping requirements.
In addition, derivatives regulations in the United States and Europe are effectively transforming an over-the-counter market in which parties negotiate directly with each other into a regulated market in which a majority of swap transactions are executed on registered exchanges and cleared through central counterparties. These regulations could significantly increase the cost of entering into derivative contracts (including through requirements to post collateral which could adversely affect our available liquidity), materially alter the terms of derivative contracts, reduce the availability of derivatives to protect against risks that we encounter, reduce our ability to restructure our existing derivative contracts, and increase our exposure to less creditworthy counterparties. We are evaluating final rules promulgated separately by the CFTC and certain U.S. prudential regulators, as well as the rules issued by EMIR to determine the impact on our business. If we reduce our use of derivatives as a result of such regulations (and any new regulations), our results of operations may become more volatile and our cash flows may be less predictable, which could adversely affect our ability to satisfy our debt obligations or plan for and fund capital expenditures.
Furthermore, the CFTC has proposed rules relating to position limits on derivatives (including futures, options and swaps) with certain underlying reference assets, as well as supplemental rules relating to the aggregation of derivative positions
46
among commonly owned or controlled entities and exemptions from such aggregation. In December 2016, the CFTC finalized the rules related to the aggregation of positions, but proposed for further comment the position limit rules. It is unclear when the CFTC intends to finalize such rules. In addition to these U.S. requirements, we are subject to, where relevant and applicable, position limit requirements in Europe under MiFID II and related rules. Specifically, under MiFID II, national competent authorities (including the FCA), within EU member states, are required to establish position limits in relation to the maximum size of positions which a relevant person can hold in certain commodity derivatives. The limits apply to contracts traded on trading venues and their economically equivalent OTC contracts. The position limits established, as amended from time to time, and our ability to rely on any exemption thereunder may affect the size and types of investments we may make. Moreover, in order to avoid exceeding position limits, it is possible that we and our affiliates may need to significantly alter our business processes related to such trading, including by modifying trading strategies and instructions.
We are subject to substantial litigation risks and may face significant liabilities and damage to our professional reputation as a result of litigation allegations and negative publicity.
In the ordinary course of business, we are subject to the risk of substantial litigation and face significant regulatory oversight. In recent years, the volume of claims and the amount of potential damages claimed in such proceedings against the financial services industry have generally been increasing. The investment decisions we make in our asset management business and the activities of our investment professionals on behalf of portfolio companies of our carry funds may subject them and us to the risk of third-party litigation arising from investor dissatisfaction with the performance of those investment funds, alleged conflicts of interest, the activities of our portfolio companies and a variety of other litigation claims and regulatory inquiries and actions. From time to time we and our portfolio companies have been and may be subject to regulatory actions and shareholder class action suits relating to transactions in which we have agreed to acquire public companies.
To the extent that investors in our investment funds suffer losses resulting from fraud, gross negligence, willful misconduct or other similar misconduct, investors may have remedies against us, our investment funds, our principals or our affiliates. Heightened standards of care or additional fiduciary duties may apply in certain of our managed accounts or other advisory contracts. To the extent we enter into agreements with clients containing such terms or applicable law mandates a heightened standard of care or duties, we could, for example, be liable to certain clients for acts of simple negligence or breach of such duties, which might include the allocation of a client’s funds to our affiliated funds. Even in the absence of misconduct, we may be exposed to litigation or other adverse consequences where investments perform poorly and investors in or alongside our funds experience losses. The general partners and investment advisers to our investment funds, including their directors, officers, other employees and affiliates, are generally indemnified with respect to their conduct in connection with the management of the business and affairs of our investment funds. For example, we have agreed to indemnify directors and officers of Carlyle Capital Corporation Limited in connection with the matters involving that fund discussed under “Part I. Item 3. Legal Proceedings.” However, such indemnity generally does not extend to actions determined to have involved fraud, gross negligence, willful misconduct or other similar misconduct.
In addition, the laws and regulations governing the limited liability of such issuers and portfolio companies vary from jurisdiction to jurisdiction, and in certain contexts the laws of certain jurisdictions may provide not only for carve-outs from limited liability protection for the issuer or portfolio company that has incurred the liabilities, but also for recourse to assets of other entities under common control with, or that are part of the same economic group as, such issuer. For example, if one of our portfolio companies is subject to bankruptcy or insolvency proceedings in a jurisdiction and is found to have liabilities under the local consumer protection, labor, tax or bankruptcy laws, the laws of that jurisdiction may permit authorities or creditors to file a lien on, or to otherwise have recourse to, assets held by other portfolio companies (including the Partnership) in that jurisdiction. There can be no assurance that the Partnership will not be adversely affected as a result of the foregoing risks.
If any lawsuits were brought against us and resulted in a finding of substantial legal liability, the lawsuit could materially adversely affect our business, results of operations or financial condition or cause significant reputational harm to us, which could materially impact our business. We depend to a large extent on our business relationships and our reputation for integrity and high-caliber professional services to attract and retain investors and to pursue investment opportunities for our funds. As a result, allegations of improper conduct by private litigants (including investors in or alongside our funds) or regulators, whether the ultimate outcome is favorable or unfavorable to us, as well as negative publicity and press speculation about us, our investment activities or the private equity industry in general, whether or not valid, may harm our reputation, which may be more damaging to our business than to other types of businesses.
In addition, with a workforce composed of many highly paid professionals, we face the risk of litigation relating to claims for compensation, which may, individually or in the aggregate, be significant in amount. The cost of settling any such claims could negatively impact our business, results of operations and financial condition.
47
Employee misconduct or fraud could harm us and subject us to significant legal liability and reputational harm, which could impair our ability to attract and retain investors in our funds. Fraud, other deceptive practices or other misconduct at our portfolio companies could similarly subject us to liability and reputational damage and also harm performance.
There have been a number of highly publicized cases involving fraud or other misconduct by employees in the financial services industry in recent years, and there is a risk that our employees or advisors could engage in misconduct or fraud that adversely affects our business. Misconduct or fraud by employees, advisors or other third-party service providers could cause significant losses. Employee misconduct or fraud could include, among other things, binding the Partnership to transactions that exceed authorized limits or present unacceptable risks and other unauthorized activities or concealing unsuccessful investments (which, in either case, may result in unknown and unmanaged risks or losses), or otherwise charging (or seeking to charge) inappropriate expenses. It is not always possible to deter misconduct or fraud by employees or service providers, and the precautions we take to detect and prevent this activity may not be effective in all cases.
Our ability to attract and retain investors and to pursue investment opportunities for our funds depends heavily upon the reputation of our professionals, especially our senior Carlyle professionals. Because of our diverse business and the regulatory regimes under which we operate, we are subject to a number of obligations and standards (and related policies and procedures) arising from our asset management business and our authority over the assets managed by our asset management business. The violation of these obligations and standards (and related policies and procedures) by any of our employees would adversely affect us and our investment funds and fund investors. For example, we could lose our ability to raise new investment funds if any of our “covered persons” is the subject of a criminal, regulatory or court order or other “disqualifying event. See “—Extensive regulation in the United States and abroad affects our activities, increases the cost of doing business and creates the potential for significant liabilities and penalties.”
Our business often requires that we deal with confidential matters of great significance to companies in which our funds may invest. If our employees, advisors or other third-party service providers were to use or disclose confidential information improperly, we could suffer serious harm to our reputation, financial position and current and future business relationships, as well as face potentially significant litigation. It is not always possible to detect or deter employee misconduct or fraud, including financial fraud or the misappropriation of funds of our business or our investment funds, and the extensive precautions we take to detect and prevent this activity may not be effective in all cases. If any of our employees were to engage in misconduct or fraud or were to be accused of such misconduct or fraud, whether or not substantiated, our business and our reputation could be adversely affected and a loss of investor confidence could result, which would adversely impact our ability to raise future funds.
In recent years, the U.S. Department of Justice (the “DOJ”) and the SEC have devoted greater resources to enforcement of the Foreign Corrupt Practices Act (the “FCPA”). In addition, the United Kingdom and other jurisdictions have significantly expanded the reach of their anti-bribery laws. While we have developed and implemented policies and procedures designed to ensure compliance by us and our personnel with the FCPA and the UK anti-bribery laws, such policies and procedures may not be effective in all instances to prevent violations. Any determination that we have violated the FCPA, the UK anti-bribery laws or other applicable anticorruption laws could subject us to, among other things, civil and criminal penalties, material fines, profit disgorgement, injunctions on future conduct, securities litigation and a general loss of investor confidence, any one of which could adversely affect our business prospects, financial position or the market value of our common units.
In addition, we will also be adversely affected if there is fraud, other deceptive practices or other misconduct by personnel of the portfolio companies in which our funds invest. For example, improper or illegal conduct by personnel at our portfolio companies or failure by such personnel to comply with anti-bribery, trade sanctions, legal and regulatory requirements could adversely affect our business and reputation. Such misconduct or fraud could also undermine any due diligence efforts with respect to such companies and could negatively affect the valuation of a fund’s investments.
Certain policies and procedures implemented to mitigate potential conflicts of interest and address certain regulatory requirements may reduce the synergies across our various businesses and inhibit our ability to maintain our collaborative culture.
We consider our “One Carlyle” philosophy and the ability of our professionals to communicate and collaborate across funds, industries and geographies one of our significant competitive strengths. As a result of the expansion of our platform into various lines of business in the alternative asset management industry, our acquisition of new businesses, and the growth of our managed account business, we are subject to a number of actual and potential conflicts of interest and subject to greater regulatory oversight than that to which we would otherwise be subject if we had just one line of business. In addition, as we expand our platform, the allocation of investment opportunities among our investment funds is expected to become more
48
complex. In addressing these conflicts and regulatory requirements across our various businesses, we have and may continue to implement certain policies and procedures (for example, information barriers). As a practical matter, the establishment and maintenance of such information barriers means that collaboration between our investment professionals across various platforms or with respect to certain investments may be limited, reducing potential synergies that we cultivate across these businesses through our “One Carlyle” approach. For example, although we maintain ultimate control over the Investment Solutions segment's constituent firms: AlpInvest and Metropolitan, we have erected an information barrier between the management teams at these firms and the rest of Carlyle. See “—Risks Related to Our Business Operations—Our Investment Solutions business is subject to additional risks.” In addition, we may come into possession of material, non-public information with respect to issuers in which we may be considering making an investment. As a consequence, we may be precluded from providing such information or other ideas to our other businesses that could benefit from such information.
Risks Related to Our Business Operations
Poor performance of our investment funds would cause a decline in our revenue, income and cash flow, may obligate us to repay carried interest previously paid to us, and could adversely affect our ability to raise capital for future investment funds.
In the event that any of our investment funds were to perform poorly, our revenue, income and cash flow could decline. Investors could also demand lower fees or fee concessions for existing or future funds which would likewise decrease our revenue or require us to record an impairment of intangible assets and/or goodwill in the case of an acquired business. In some of our funds, such as our carry funds, a reduction in the value of the portfolio investments held in such funds could result in a reduction in the carried interest we earn or in our management fees. We also could experience losses on our investment of our own capital into our funds as a result of poor performance by our investment funds. If, as a result of poor performance of later investments in a carry fund’s life, the fund does not achieve certain investment returns for the fund over its life, we will be obligated to repay the amount by which carried interest that was previously distributed to us exceeds the amount to which we are ultimately entitled. These repayment obligations may be related to amounts previously distributed to our senior Carlyle professionals prior to the completion of our initial public offering, with respect to which our unitholders did not receive any benefit. See “—We may need to pay “giveback” obligations if and when they are triggered under the governing agreements with our investors” and Note 11 to our consolidated financial statements included in this Annual Report on Form 10-K.
Poor performance of our investment funds may also make it more difficult for us to raise new capital. Investors in our funds might decline to invest in future investment funds we raise. Investors and potential investors in our funds continually assess our investment funds’ performance, and our ability to raise capital for existing and future investment funds and avoid excessive redemption levels will depend on our investment funds’ continued satisfactory performance. Accordingly, poor fund performance may deter future investment in our funds and thereby decrease the capital invested in our funds and ultimately, our management fee income.
Our asset management business depends in large part on our ability to raise capital from third-party investors. If we are unable to raise capital from third-party investors, we would be unable to collect management fees or deploy their capital into investments and potentially collect carried interest, which would materially reduce our revenue and cash flow and adversely affect our financial condition.
In 2016, we commenced a four-year fundraising cycle during which we are targeting to raise approximately $100 billion in new capital commitments by the end of 2019. Through December 31, 2017, we have raised more than $57 billion in gross new capital commitments. Our ability to raise this capital from third-party investors depends on a number of factors, including certain factors that are outside our control. Certain of these factors such as the performance of the stock market, the pace of distributions from our funds and from the funds of other asset managers or the asset allocation rules or regulations or investment policies to which such third-party investors are subject, could inhibit or restrict the ability of third-party investors to make investments in our investment funds. Third-party investors in private equity, real assets and venture capital funds typically use distributions from prior investments to meet future capital calls. In cases where valuations of existing investments fall and the pace of distributions slows, investors may be unable or unwilling to make new commitments or fund existing commitments to third-party management investment funds such as those advised by us. Although many investors have increased the amount of commitments they are making to alternative investment funds and aggregate fundraising totals are near the highest they have been since 2008, there can be no assurance that this historical or current levels of commitments to our funds will continue. For example, there is a continuing shift away from defined benefit pension plans to defined contributions plans, which could reduce the amount of assets available for us to manage on behalf of certain of our clients. In addition, investors may downsize their investment allocations to alternative managers, including private funds and fund of funds vehicles, to rebalance a disproportionate weighting of their overall investment portfolio among asset classes. Investors may also seek to consolidate
49
their investments with a smaller number of alternative asset managers or prefer to pursue investments directly instead of investing through our funds, each of which could impact the amount of allocations they make to our funds. Moreover, as some existing investors cease or significantly curtail making commitments to alternative investment funds, we may need to identify and attract new investors in order to maintain or increase the size of our investment funds. The lack of clarity around regulations, including BEPS, may also limit our fund investors' ability to claim double tax treaty benefits on their investments, which may limit their investments in our funds. In addition, certain investors have implemented or may implement restrictions against investing in certain types of asset classes such as fossil fuels, which would affect our ability to raise new funds focused on those asset classes, such as funds focused on energy or natural resources. We are currently working to create avenues through which we expect to attract a new base of individual investors. There can be no assurances that we can find or secure commitments from those new investors. Our ability to raise new funds could similarly be hampered if the general appeal of private equity and alternative investments were to decline.
An investment in a private equity fund is more illiquid and the returns on such investment may be more volatile than an investment in securities for which there is a more active and transparent market. Private equity and alternative investments could fall into disfavor as a result of concerns about liquidity and short-term performance. Such concerns could be exhibited, in particular, by public pension funds, which have historically been among the largest investors in alternative assets. Concerns with liquidity could cause such public pension funds to reevaluate the appropriateness of alternative investments.
In addition, the evolving preferences of our fund investors may necessitate that alternatives to the traditional investment fund structure, such as managed accounts, smaller funds and co-investment vehicles, become a larger part of our business going forward. This could increase our cost of raising capital at the scale we have historically achieved. The failure to successfully raise capital commitments to new investment funds may also expose us to credit risk in respect of financing that we may provide such funds. When existing capital commitments to a new investment fund are insufficient to fund in full a new investment fund’s participation in a transaction, we may lend money to or borrow money from financial institutions on behalf of such investment funds to bridge this difference and repay this financing with capital from subsequent investors to the fund. Our inability to identify and secure capital commitments from new investors to these funds may expose us to losses (in the case of money that we lend directly to such funds) or adversely impact our ability to repay such borrowings or otherwise have an adverse impact on our liquidity position. Finally, if we seek to expand into other business lines, we may also be unable to raise a sufficient amount of capital to adequately support such businesses. The failure of our investment funds to raise capital in sufficient amounts could result in a decrease in our AUM as well as management fee and transaction fee revenue, or could result in a decline in the rate of growth of our AUM and management fee and transaction fee revenue, any of which could have a material adverse impact on our revenues and financial condition. Our past experience with growth of AUM provides no assurance with respect to the future.
Our investors may negotiate to pay us lower management fees and the economic terms of our future funds may be less favorable to us than those of our existing funds, which could adversely affect our revenues.
In connection with raising new funds or securing additional investments in existing funds, we negotiate terms for such funds and investments with existing and potential investors. The outcome of such negotiations could result in our agreement to terms that are materially less favorable to us than the terms of prior funds we have advised or funds advised by our competitors. Such terms could restrict our ability to raise investment funds with investment objectives or strategies that compete with existing funds, reduce fee revenues we earn, reduce the percentage of profits on third-party capital that we share in or add expenses and obligations for us in managing the fund or increase our potential liabilities, all of which could ultimately reduce our profitability. For instance, our newest U.S. buyout and Asia buyout funds, both currently fundraising and yet to begin investing, have increased the percentage of transaction fees that are shared with fund investors from 80% to 100% of the fees we generate. See “—A decline in the pace or size of investments by our carry funds could result in our receiving less revenue from transaction fees.” Additionally, a change in terms which increases the amount of fee revenue the fund investors are entitled to could result in a significant decline in revenue generated from transaction fees. Given this change in terms, and to the extent we change our fee practices for other successor funds, we could experience a meaningful decline in the amount of transaction fee revenue we earn. Moreover, certain institutional investors have publicly criticized certain fund fee and expense structures, including management fees. We have received and expect to continue to confront requests from a variety of investors and groups representing investors to decrease fees and to modify our carried interest and incentive fee structures, which could result in a reduction in or delay in the timing of receipt of the fees and carried interest and incentive fees we earn. In addition to negotiating the overall fund rate of the management fees offered, certain fund investors have negotiated alternative management fee structures in several of our investment funds. For example, certain funds have offered a management fee rate discount for certain investors that came into the first closing of each fund. In certain cases, we have agreed to charge management fees based on invested capital or net asset value as opposed charging management fees on committed capital. Any modification of our existing fee or carry arrangements or the fee or carry structures for new investment funds could adversely affect our results of operations. See “—The alternative asset management business is intensely competitive.”
50
Valuation methodologies for certain assets in our funds can involve subjective judgments, and the fair value of assets established pursuant to such methodologies may be incorrect, which could result in the misstatement of fund performance and accrued performance fees.
There are often no readily ascertainable market prices for a substantial majority of illiquid investments of our investment funds. We determine the fair value of the investments of each of our investment funds at least quarterly based on the fair value guidelines set forth by generally accepted accounting principles in the United States. The fair value measurement accounting guidance establishes a hierarchal disclosure framework that ranks the observability of market inputs used in measuring financial instruments at fair value. The observability of inputs is impacted by a number of factors, including the type of financial instrument, the characteristics specific to the financial instrument and the state of the marketplace, including the existence and transparency of transactions between market participants. Financial instruments with readily available quoted prices, or for which fair value can be measured from quoted prices in active markets, will generally have a higher degree of market price observability and a lesser degree of judgment applied in determining fair value.
Investments for which market prices are not observable include, but are not limited to illiquid investments in operating companies, real estate, energy ventures and structured vehicles, and encompass all components of the capital structure, including equity, mezzanine, debt, preferred equity and derivative instruments such as options and warrants. Fair values of such investments are determined by reference to the market approach (
i.e.
, multiplying a key performance metric of the investee company or asset, such as EBITDA, by a relevant valuation multiple observed in the range of comparable public entities or transactions, adjusted by management as appropriate for differences between the investment and the referenced comparables), the income approach (i.e., discounting projected future cash flows of the investee company or asset and/or capitalizing representative stabilized cash flows of the investee company or asset) and other methodologies such as prices provided by reputable dealers or pricing services, option pricing models and replacement costs. In addition, we continue to examine the impact of the TCJA on the future cash flows of certain investments, and it is possible that the TCJA could adversely impact certain investment valuations in future periods.
The determination of fair value using these methodologies takes into consideration a range of factors including but not limited to the price at which the investment was acquired, the nature of the investment, local market conditions, the multiples of comparable securities, current and projected operating performance and financing transactions subsequent to the acquisition of the investment. These valuation methodologies involve a significant degree of management judgment. For example, as to investments that we share with another sponsor, we may apply a different valuation methodology than the other sponsor does and/or derive a different value than the other sponsor has derived on the same investment, which could cause some investors to question our valuations.
Because there is significant uncertainty in the valuation of, or in the stability of the value of, illiquid investments, the fair values of such investments as reflected in an investment fund’s net asset value do not necessarily reflect the prices that would be obtained by us on behalf of the investment fund when such investments are realized. Realizations at values significantly lower than the values at which investments have been reflected in prior fund net asset values would result in reduced earnings or losses for the applicable fund, the loss of potential carried interest and incentive fees. Changes in values attributed to investments from quarter to quarter may result in volatility in the net asset values and results of operations that we report from period to period. Also, a situation where asset values turn out to be materially different than values reflected in prior fund net asset values could cause investors to lose confidence in us, which could in turn result in difficulty in raising additional funds.
The historical returns attributable to our funds, including those presented in this report, should not be considered as indicative of the future results of our funds or of our future results or of any returns expected on an investment in our common units.
We have presented in this Form 10-K information relating to the historical performance of our investment funds. The historical and potential future returns of the investment funds that we advise, however, are not directly linked to returns on our common units. Therefore, any continued positive performance of the investment funds that we advise will not necessarily result in positive returns on an investment in our common units. However, poor performance of the investment funds that we advise would cause a decline in our revenue from such investment funds, and could therefore have a negative effect on our performance, our ability to raise future funds and in all likelihood the returns on an investment in our common units.
Moreover, with respect to the historical returns of our investment funds:
|
•
|
we may create new funds in the future that reflect a different asset mix and different investment strategies, as well as a varied geographic and industry exposure as compared to our present funds, and any such new funds could have different returns than our existing or previous funds;
|
51
|
•
|
the rates of returns of our carry funds reflect unrealized gains as of the applicable measurement date that may never be realized, which may adversely affect the ultimate value realized from those funds’ investments;
|
|
•
|
unitholders will not benefit from any value that was created in our funds prior to our becoming a public company to the extent such value was previously realized;
|
|
•
|
in recent years, there has been increased competition for private equity investment opportunities resulting from the increased amount of capital invested in alternative investment funds, high liquidity in debt markets and strong equity markets, and the increased competition for investments may reduce our returns in the future;
|
|
•
|
the rates of returns of some of our funds in certain years have been positively influenced by a number of investments that experienced rapid and substantial increases in value following the dates on which those investments were made, which may not occur with respect to future investments;
|
|
•
|
our investment funds’ returns in some years have benefited from investment opportunities and general market conditions that may not repeat themselves;
|
|
•
|
our current or future investment funds might not be able to avail themselves of comparable investment opportunities or market conditions; and the circumstances under which our funds may make future investments may differ significantly from those conditions prevailing in the past (including, for example, particularly favorable borrowing conditions from 2013 through early 2015 for many of our investments that relied heavily on the use of leverage);
|
|
•
|
newly-established funds may generate lower returns during the period that they take to deploy their capital.
|
Our recent performance has benefited from today's high multiples and asset prices by selling investments made in past years at what we believe to be attractive prices. In the current market environment, earning such returns on new investments will be much more difficult than in the past and the future internal rate of return for any current or future fund may vary considerably from the historical internal rate of return generated by any particular fund or for our funds as a whole. Future returns will also be affected by the risks described elsewhere in this report, including risks of the industries and businesses in which a particular fund invests. See—“Part II. Item 7. Management’s Discussion and Analysis of Financial Condition and Results of Operations—Segment Analysis—Fund Performance Metrics” for additional information.
Dependence on significant leverage in investments by our funds could adversely affect our ability to achieve attractive rates of return on those investments.
Many of our carry funds’ investments rely heavily on the use of leverage, and our ability to achieve attractive rates of return on investments will depend on our ability to access sufficient sources of indebtedness at attractive rates. For example, in many private equity investments, indebtedness may constitute and historically has constituted up to 70% or more of a portfolio company’s or real estate asset’s total debt and equity capitalization, including debt that may be incurred in connection with the investment, whether incurred at or above the investment-level entity. The absence of available sources of sufficient debt financing for extended periods of time could therefore materially and adversely affect our CPE and Real Assets businesses. In addition, an increase in either the general levels of interest rates or in the risk spread demanded by sources of indebtedness would make it more expensive to finance those investments thereby reducing returns. Increases in interest rates could also make it more difficult to locate and consummate private equity investments because other potential buyers, including operating companies acting as strategic buyers, may be able to bid for an asset at a higher price due to a lower overall cost of capital or their ability to benefit from a higher amount of cost savings following the acquisition of the asset. In addition, a portion of the indebtedness used to finance private equity investments often includes high-yield debt securities issued in the capital markets. Availability of capital from the high-yield debt markets is subject to significant volatility, and there may be times when we might not be able to access those markets at attractive rates, or at all, when completing an investment. Certain investments may also be financed through borrowings on fund-level debt facilities, which may or may not be available for a refinancing at the end of their respective terms. Additionally, to the extent there is a reduction in the availability of financing for extended periods of time, the purchasing power of a prospective buyer may be more limited, adversely impacting the fair value of our funds’ investments and thereby reducing the acquisition price. Finally, the interest payments on the indebtedness used to finance our carry funds’ investments have historically been deductible expenses for income tax purposes, subject to limitations under applicable tax law and policy. The availability of interest deductions, however, may be limited under new rules imposed by the TCJA which apply complex limitations on the deductibility of business interest expense over 30% of a taxpayer’s taxable
52
income of such business (with adjustments for certain interest and taxes, and for taxable years before 2022, depreciation and amortization). These new rules, as well as any future changes in such tax law or policy to eliminate or substantially limit these income tax deductions, as has been discussed from time to time in various jurisdictions, could reduce the after-tax rates of return on the affected investments, which may have an adverse impact on our business and financial results. On October 5, 2015, the OECD published additional papers under the BEPS initiative. In action 4, the OECD recommends that countries adopt a limitation on excessive deductions under a fixed ratio rule and supplemented by a worldwide group ratio and certain targeted rules as needed. It is anticipated that ratios may range between 10% and 30%. It is still unclear how different countries will implement the various recommendations and it is unclear how this will affect the current deductibility of interest in the various jurisdictions. See “— Our funds make investments in companies that are based outside of the United States, which may expose us to additional risks not typically associated with investing in companies that are based in the United States.”
Investments in highly leveraged entities are also inherently more sensitive to declines in revenue, increases in expenses and interest rates and adverse economic, market and industry developments. Furthermore, the incurrence of a significant amount of indebtedness by an entity could, among other things:
|
•
|
subject the entity to a number of restrictive covenants, terms and conditions, any violation of which could be viewed by creditors as an event of default and could materially impact our ability to realize value from the investment;
|
|
•
|
allow even moderate reductions in operating cash flow to render the entity unable to service its indebtedness, leading to a bankruptcy or other reorganization of the entity and a loss of part or all of the equity investment in it;
|
|
•
|
give rise to an obligation to make mandatory prepayments of debt using excess cash flow, which might limit the entity’s ability to respond to changing industry conditions to the extent additional cash is needed for the response, to make unplanned but necessary capital expenditures or to take advantage of growth opportunities;
|
|
•
|
limit the entity’s ability to adjust to changing market conditions, thereby placing it at a competitive disadvantage compared to its competitors that have relatively less debt;
|
|
•
|
limit the entity’s ability to engage in strategic acquisitions that might be necessary to generate attractive returns or further growth; and
|
|
•
|
limit the entity’s ability to obtain additional financing or increase the cost of obtaining such financing, including for capital expenditures, working capital or other general corporate purposes.
|
As a result, the risk of loss associated with a leveraged entity is generally greater than for companies with comparatively less debt. Similarly, the leveraged nature of the investments of our Real Assets funds increases the risk that a decline in the fair value of the underlying real estate or tangible assets will result in their abandonment or foreclosure.
When our private equity funds’ portfolio investments reach the point when debt incurred to finance those investments matures in significant amounts and must be either repaid or refinanced, those investments may materially suffer if they have not generated sufficient cash flow to repay maturing debt and there is insufficient capacity and availability in the financing markets to permit them to refinance maturing debt on satisfactory terms, or at all. If a limited availability of financing for such purposes were to persist for an extended period of time, when significant amounts of the debt incurred to finance our CPE and Real Assets funds’ portfolio investments came due, these funds could be materially and adversely affected.
Many of our Global Credit funds may choose to use leverage as part of their respective investment programs and regularly borrow a substantial amount of their capital. The use of leverage poses a significant degree of risk and enhances the possibility of a significant loss in the value of the investment portfolio. A fund may borrow money from time to time to purchase or carry securities or may enter into derivative transactions (such as total return swaps) with counterparties that have embedded leverage. The interest expense and other costs incurred in connection with such borrowing may not be recovered by appreciation in the securities purchased or carried and will be lost, and the timing and magnitude of such losses may be accelerated or exacerbated, in the event of a decline in the market value of such securities. Gains realized with borrowed funds may cause the fund’s net asset value to increase at a faster rate than would be the case without borrowings. However, if investment results fail to cover the cost of borrowings, the fund’s net asset value could also decrease faster than if there had been no borrowings. Increases in interest rates could also decrease the value of fixed-rate debt investment that our investment
53
funds make. In addition, to the extent that any changes in tax law make debt financing less attractive to certain categories of borrowers, this could adversely affect the investment opportunities for our credit-focused funds.
Any of the foregoing circumstances could have a material adverse effect on our results of operations, financial condition and cash flow.
A decline in the pace or size of investments by our carry funds could result in our receiving less revenue from transaction fees.
The transaction fees that we earn are driven in part by the pace at which our funds make investments and the size of those investments. Any decline in that pace or the size of such investments could reduce our transaction fees and could make it more difficult for us to raise capital on our anticipated schedule. Many factors could cause such a decline in the pace of investment, including:
|
•
|
the inability of our investment professionals to identify attractive investment opportunities;
|
|
•
|
competition for such opportunities among other potential acquirers;
|
|
•
|
decreased availability of capital on attractive terms; and
|
|
•
|
our failure to consummate identified investment opportunities because of business, regulatory or legal complexities and adverse developments in the U.S. or global economy or financial markets.
|
In addition, we have confronted and expect to continue to confront requests from a variety of investors and groups representing investors to increase the percentage of transaction fees we share with our fund investors (or to decline to receive transaction fees from portfolio companies held by our funds). For example, in our Asia and U.S. Buyout funds currently in the market, we have increased the percentage of transaction fees that are shared with fund investors from 80% to 100% of the fees we generate. Given this change, and to the extent we change our fee practices for other successor funds, we could experience a meaningful decline in the amount of transaction fee revenue we earn. See “—Our investors may negotiate to pay us lower management fees and the economic terms of our future funds may be less favorable to us than those of our existing funds, which could adversely affect our revenues.”
The alternative asset management business is intensely competitive.
The alternative asset management business is intensely competitive, with competition based on a variety of factors, including investment performance, business relationships, quality of service provided to investors, investor liquidity and willingness to invest, fund terms (including fees), brand recognition, types of products offered and business reputation. Our alternative asset management business, as well as our investment funds, competes with a number of private equity funds, specialized investment funds, hedge funds, corporate buyers, traditional asset managers, real estate development companies, commercial banks, investment banks and other financial institutions (as well as sovereign wealth funds and other institutional investors).
Additionally, developments in financial technology (or fintech), such as a distributed ledger technology (or blockchain), have the potential to disrupt the financial industry and change the way financial institutions, as well as asset managers, do business. A number of factors serve to increase our competitive risks:
|
•
|
a number of our competitors in some of our businesses have greater financial, technical, marketing and other resources and more personnel than we do;
|
|
•
|
some of our funds may not perform as well as competitors’ funds or other available investment products;
|
|
•
|
several of our competitors have significant amounts of capital, and many of them have similar investment objectives to ours, which may create additional competition for investment opportunities and may reduce the size and duration of pricing inefficiencies that otherwise could be exploited;
|
|
•
|
some of these competitors (including strategic competitors) may also have a lower cost of capital and access to funding sources that are not available to us, which may create competitive disadvantages for our funds with respect to investment opportunities;
|
54
|
•
|
some of our competitors may have higher risk tolerances, different risk assessments or lower return thresholds than us, which could allow them to consider a wider variety of investments and to bid more aggressively than us for investments that we want to make;
|
|
•
|
some of our competitors may be subject to less regulation and accordingly may have more flexibility to undertake and execute certain businesses or investments than we do and/or bear less compliance expense than us;
|
|
•
|
some of our competitors may have more flexibility than us in raising certain types of investment funds under the investment management contracts they have negotiated with their investors;
|
|
•
|
some of our competitors may have better expertise or be regarded by investors as having better expertise in a specific asset class or geographic region than we do;
|
|
•
|
our competitors that are corporate buyers may be able to achieve synergistic cost savings in respect of an investment, which may provide them with a competitive advantage in bidding for an investment;
|
|
•
|
our competitors have instituted or may institute low cost high speed financial applications and services based on artificial intelligence and new competitors may enter the asset management space using new investment platforms based on artificial intelligence;
|
|
•
|
there are relatively few barriers to entry impeding the formation of new alternative asset management firms, and the successful efforts of new entrants into our various businesses, including former “star” portfolio managers at large diversified financial institutions as well as such institutions themselves, is expected to continue to result in increased competition;
|
|
•
|
some investors may prefer to pursue investments directly instead of investing through one of our funds;
|
|
•
|
some investors may prefer to invest with an asset manager that is not publicly traded or is smaller with only one or two investment products that it manages; and
|
|
•
|
other industry participants may, from time to time, seek to recruit our investment professionals and other employees away from us.
|
We may lose investment opportunities in the future if we do not match investment prices, structures, products or terms offered by our competitors. Alternatively, we may experience decreased rates of return and increased risks of loss if we match investment prices, structures and terms offered by our competitors. Moreover, if we are forced to compete with other alternative asset managers on the basis of price, we may not be able to maintain our current fund fee and carried interest terms. We have historically competed primarily on the performance of our funds, and not on the level of our fees or carried interest relative to those of our competitors. However, there is a risk that fees and carried interest in the alternative asset management industry will decline, without regard to the historical performance of a manager. Fee or carried interest income reductions on existing or future funds, without corresponding decreases in our cost structure, would adversely affect our revenues and profitability. See “—Our investors may negotiate to pay us lower management fees and the economic terms of our future funds may be less favorable to us than those of our existing funds, which could adversely affect our revenues.”
The attractiveness of our investment funds relative to investments in other investment products could decrease depending on economic conditions. In addition, to the extent that any changes in tax law make debt financing less attractive to certain categories of borrowers, this could adversely affect the investment opportunities for our credit-focused funds. This competitive pressure could adversely affect our ability to make successful investments and limit our ability to raise future investment funds, either of which would adversely impact our business, revenue, results of operations and cash flow. See “—Our investors may negotiate to pay us lower management fees and the economic terms of our future funds may be less favorable to us than those of our existing funds, which could adversely affect our revenues.”
The due diligence process that we undertake in connection with investments by our investment funds may not reveal all facts that may be relevant in connection with an investment.
Before making private equity and other investments, we conduct due diligence that we deem reasonable and appropriate based on the known facts and circumstances applicable to each investment. The objective of the due diligence process is to identify attractive investment opportunities based on the known facts and circumstances and initial risk assessment
55
surrounding an investment and, depending on our ownership or control of private equity investments, prepare a framework that may be used from the date of an acquisition to drive operational achievement and value creation. When conducting due diligence, we may be required to evaluate important and complex business, financial, regulatory, tax, accounting, environmental and legal issues. Outside consultants, legal advisors, accountants and investment banks may be involved in the due diligence process in varying degrees depending on the type of investment. Nevertheless, when conducting due diligence and making an assessment regarding an investment, we rely on the resources available to us, including information provided by the target of the investment and, in some circumstances, third-party investigations and analysis. The due diligence process may at times be subjective with respect to newly-organized companies for which only limited information is available. Accordingly, we cannot be certain that the due diligence investigation that we carry out with respect to any investment opportunity will reveal or highlight all relevant facts that may be necessary or helpful in evaluating such investment opportunity. The due diligence process in connection with carve-out transactions may underestimate the complexity and/or level of dependence a business has on its parent company and affiliated entities. Because a carve-out business often does not have financial statements that accurately reflect its true financial performance as a stand-alone business, due diligence assessments of such investments can be particularly difficult. Instances of fraud, accounting irregularities and other improper, illegal or deceptive practices can be difficult to detect, and fraud and other deceptive practices can be widespread in certain jurisdictions. Several of our funds invest in emerging market countries that may not have established laws and regulations that are as stringent as in more developed nations, or where existing laws and regulations may not be consistently enforced. For example, our funds invest throughout jurisdictions that have material perceptions of corruption according to international rating standards (such as “Transparency International's Corruption Perceptions Index”) such as China, India, Indonesia, Latin America, MENA and Sub-Saharan Africa. Similarly, our funds invest in companies in the U.S. and other jurisdictions and regions with low perceived corruption but whose business may be conducted in other high-risk jurisdictions.
Due diligence on investment opportunities in these jurisdictions is frequently more complicated because consistent and uniform commercial practices in such locations may not be developed or our access to information may be very limited. Fraud, accounting irregularities and deceptive practices can be especially difficult to detect in such locations. In addition, investment opportunities may arise in companies that have historic and/or unresolved regulatory, tax, fraud or accounting related investigations, audits or inquiries and/or have been subjected to public accusations of improper behavior. However, even heightened and specific due diligence and investigations with respect to such matters may not reveal or highlight all relevant facts that may be necessary or helpful in evaluating such investment opportunity and/or will be able to accurately identify, assess and quantify settlements, enforcement actions and judgments that may arise and which could have a material adverse effect on the portfolio company’s business, financial condition and operations, as well potential significant harm to the portfolio company’s reputation and prospects. We cannot be certain that our due diligence investigations will result in investments being successful or that the actual financial performance of an investment will not fall short of the financial projections we used when evaluating that investment. Failure to identify risks associated with our investments could have a material adverse effect on our business.
Our funds invest in relatively high-risk, illiquid assets, and we may fail to realize any profits from these activities for a considerable period of time or lose some or all of our principal investments.
Many of our investment funds invest in securities that are not publicly traded. In many cases, our investment funds may be prohibited by contract or by applicable securities laws from selling such securities for a period of time. Our investment funds will not be able to sell these securities publicly unless their sale is registered under applicable securities laws, or unless an exemption from such registration is available. The ability of many of our investment funds, particularly our private equity funds, to dispose of investments is heavily dependent on the public equity markets. For example, the ability to realize any value from an investment may depend upon the ability to complete an initial public offering of the portfolio company in which such investment is held. Even if the securities are publicly traded, large holdings of securities can often be disposed of only over a substantial length of time, exposing the investment returns to risks of downward movement in market prices during the intended disposition period. Moreover, because the investment strategy of many of our funds, particularly our private equity funds, often entails our having representation on our funds’ public portfolio company boards, our funds may be able to effect such sales only during limited trading windows. Additionally, certain provisions of the U.S. federal securities laws (e.g., Exchange Act Section 16) may constrain our investment funds' ability to effect purchases or sales of publicly traded securities. Accordingly, under certain conditions, our investment funds may be forced to either sell securities at lower prices than they had expected to realize or defer, potentially for a considerable period of time, sales that they had planned to make.
We have made and expect to continue to make significant principal investments in our current and future investment funds. Contributing capital to these investment funds is subject to significant risks, and we may lose some or all of the principal amount of our investments.
56
The investments of our private equity funds are subject to a number of inherent risks.
Our results are highly dependent on our continued ability to generate attractive returns from our investments. Investments made by our private equity funds involve a number of significant risks inherent to private equity investing, including the following:
|
•
|
we advise funds that invest in businesses that operate in a variety of industries that are subject to extensive domestic and foreign regulation, such as the telecommunications industry, the aerospace, defense and government services industry and the healthcare industry (including companies that supply equipment and services to governmental agencies), that may involve greater risk due to rapidly changing market and governmental conditions in those sectors;
|
|
•
|
significant failures of our portfolio companies to comply with laws and regulations applicable to them could affect the ability of our funds to invest in other companies in certain industries in the future and could harm our reputation;
|
|
•
|
companies in which private equity investments are made may have limited financial resources and may be unable to meet their obligations, which may be accompanied by a deterioration in the value of their equity securities or any collateral or guarantees provided with respect to their debt;
|
|
•
|
companies in which private equity investments are made are more likely to depend on the management talents and efforts of a small group of persons and, as a result, the death, disability, resignation or termination of one or more of those persons could have a material adverse impact on their business and prospects and the investment made;
|
|
•
|
companies in which private equity investments are made may be businesses or divisions acquired from larger operating entities which may require a rebuilding or replacement of financial reporting, information technology, back office and other operations;
|
|
•
|
companies in which private equity investments are made may from time to time be parties to litigation, may be engaged in rapidly changing businesses with products subject to a substantial risk of obsolescence and may require substantial additional capital to support their operations, finance expansion or maintain their competitive position;
|
|
•
|
companies in which private equity investments are made generally have less predictable operating results;
|
|
•
|
instances of fraud, corruption and other deceptive practices committed by senior management of portfolio companies in which our funds invest may undermine our due diligence efforts with respect to such companies and, upon the discovery of such fraud, negatively affect the valuation of a fund’s investments as well as contribute to overall market volatility that can negatively impact a fund’s investment program;
|
|
•
|
our funds may make investments that they do not advantageously dispose of prior to the date the applicable fund is dissolved, either by expiration of such fund’s term or otherwise, resulting in a lower than expected return on the investments and, potentially, on the fund itself;
|
|
•
|
our funds generally establish the capital structure of portfolio companies on the basis of the financial projections based primarily on management judgments and assumptions, and general economic conditions and other factors may cause actual performance to fall short of these financial projections, which could cause a substantial decrease in the value of our equity holdings in the portfolio company and cause our funds’ performance to fall short of our expectations;
|
|
•
|
under ERISA, a “trade or business” within a “controlled group” can be liable for the ERISA Title IV pension obligations (including withdrawal liability for union multiemployer plans) of any other member of the controlled group. This “controlled group” liability represents one of the few situations in which one entity’s liability can be imposed upon another simply because the entities are united by common ownership, but in order for such joint and several liability to be imposed, two tests must be satisfied: (1) the entity on which such liability is to be imposed must be a “trade or business” and (2) a “controlled group” relationship must exist among such entity and the pension plan sponsor or the contributing employer. While a number of cases have held that managing investments is not a “trade or business” for tax purposes, at least one federal Circuit Court case has concluded that an investment fund could be a “trade or business” for ERISA purposes (and,
|
57
consequently, could be liable for underfunded pension liabilities of an insolvent portfolio company) based upon a number of factors present in that case, including the fund’s level of involvement in the management of its portfolio companies and the nature of its management fee arrangements. Ongoing litigation related to the Circuit Court’s decision suggests that additional factors may be relevant for purposes of determining whether an investment fund could face “controlled group” liability under ERISA, including the structure of the investment, and the nature of the fund’s relationship with other affiliated investors and co-investors in the portfolio company. Moreover, regardless of whether or not an investment fund is determined to be a trade or business for purposes of ERISA, a court might hold that one of the fund’s portfolio companies could become jointly and severally liable for another portfolio company’s unfunded pension liabilities pursuant to the ERISA “controlled group” rules, depending upon the relevant investment structures and ownership interests as noted above; and
|
•
|
executive officers, directors and employees of an equity sponsor may be named as defendants in litigation involving a company in which a private equity investment is made or is being made.
|
Our real estate funds are subject to the risks inherent in the ownership and operation of real estate and the construction and development of real estate.
Investments in our real estate funds will be subject to the risks inherent in the ownership and operation of real estate and real estate-related businesses and assets. These risks include the following:
|
•
|
those associated with the burdens of ownership of real property;
|
|
•
|
general and local economic conditions;
|
|
•
|
changes in supply of and demand for competing properties in an area (as a result, for instance, of overbuilding);
|
|
•
|
fluctuations in the average occupancy and room rates for hotel properties;
|
|
•
|
the financial resources of tenants;
|
|
•
|
changes in building, environmental and other laws;
|
|
•
|
failure to obtain necessary approvals and/or permits;
|
|
•
|
energy and supply shortages;
|
|
•
|
various uninsured or uninsurable risks;
|
|
•
|
natural disasters;
|
|
•
|
changes in government regulations (such as rent control);
|
|
•
|
changes in real property tax rates;
|
|
•
|
changes in interest rates;
|
|
•
|
the reduced availability of mortgage funds which may render the sale or refinancing of properties difficult or impracticable;
|
|
•
|
negative developments in the economy that depress travel activity;
|
|
•
|
environmental liabilities;
|
|
•
|
contingent liabilities on disposition of assets;
|
|
•
|
unexpected cost overruns in connection with development projects;
|
58
|
•
|
terrorist attacks, war and other factors that are beyond our control; and
|
|
•
|
dependence on local operating partners.
|
In addition to real property assets, our real estate funds may also invest in real estate related operating companies such as logistics hubs and data centers. These investments are similar to the portfolio investments made by our Corporate Private Equity funds and are subject to similar risks and uncertainties as apply to those operating companies. See "—The investments of our private equity funds are subject to a number of inherent risks."
Real estate markets may experience sharp increases in capitalization rates and declines in value as a result of overall economic decline and the limited availability of financing and the value of certain investments in our real estate funds may decline significantly, as was the case in 2008 and 2009 in the United States, Europe and Japan. In addition, if our real estate funds acquire direct or indirect interests in undeveloped land or underdeveloped real property, which may often be non-income producing, they will be subject to the risks normally associated with such assets and development activities, including risks relating to the availability and timely receipt of zoning and other regulatory or environmental approvals, the cost and timely completion of construction (including risks beyond the control of our fund, such as weather or labor conditions or material shortages) and the availability of both construction and permanent financing on favorable terms. Additionally, our funds’ properties are often managed by a third party, which makes us dependent upon such third parties and subjects us to risks associated with the actions of such third parties. Any of these factors may cause the value of the investments in our real estate funds to decline, which may have a material impact on our results of operations.
We often pursue investment opportunities that involve business, regulatory, legal or other complexities.
As an element of our investment style, we may pursue unusually complex investment opportunities. This can often take the form of substantial business, regulatory, tax, or legal complexity that would deter other asset managers. Our tolerance for complexity presents risks, as such transactions can be more difficult, expensive and time-consuming to finance and execute; it can be more difficult to manage or realize value from the assets acquired in such transactions; and such transactions sometimes entail a higher level of regulatory scrutiny or a greater risk of contingent liabilities. The complexity of these transactions could also make it more difficult to find a suitable buyer. Any of these risks could harm the performance of our funds.
Our investment funds make investments in companies that we do not control.
Investments by many of our investment funds will include debt instruments and equity securities of companies that we do not control. Such instruments and securities may be acquired by our investment funds through trading activities or through purchases of securities from the issuer. In addition, our funds may acquire minority equity interests in large transactions, which may be structured as “consortium transactions” due to the size of the investment and the amount of capital required to be invested. A consortium transaction involves an equity investment in which two or more private equity or other firms serve together or collectively as equity sponsors. We participated in a number of consortium transactions in prior years due to the increased size of many of the transactions in which we were involved. Consortium transactions generally entail a reduced level of control by our firm over the investment because governance rights must be shared with the other consortium sponsors. Accordingly, we may not be able to control decisions relating to a consortium investment, including decisions relating to the management and operation of the company and the timing and nature of any exit. Our funds may also dispose of a portion of their majority equity investments in portfolio companies over time in a manner that results in the funds retaining a minority investment. Those investments may be subject to the risk that the company in which the investment is made may make business, tax, legal, financial or management decisions with which we do not agree or that the majority stakeholders or the management of the company may take risks or otherwise act in a manner that does not serve our interests. If any of the foregoing were to occur, the value of investments by our funds could decrease and our financial condition, results of operations and cash flow could suffer as a result.
Our investment funds may invest in assets denominated in currencies which differ from the currency in which the Fund is denominated.
When our investment funds invest in assets denominated in currencies that differ from the functional currency of the relevant fund, fluctuations in currency rates could impact the performance of the investment funds. For example, Carlyle sponsors U.S. dollar-denominated funds that invest in assets denominated in foreign currencies such as our Buyout, Growth Capital, and Real Estate funds in Asia as well as our buyout funds in South America and Africa. In the event that the U.S. dollar appreciates, the market value of the investments in these funds will decline even if the underlying investments perform well in local currency. In addition, our Europe buyout and Growth Capital funds are Euro-denominated and may have investments
59
denominated in U.S. Dollar, Great British Pound, or other currencies. In the event the Euro appreciates, the market value of investments in these funds would decline even if the underlying investments perform well in local currency.
We may employ hedging techniques to manage these risks, but we can offer no assurance that such strategies will be effective or tax-efficient
.
If we engage in hedging transactions, we may be exposed to additional risks associated with such transactions. See “—Risks Related to Our Business Operations—Risk management activities may adversely affect the return on our and our funds’ investments.” And “—Regulatory changes in the United States could adversely affect our business and the possibility of increased regulatory focus could result in additional burdens and expenses on our business.”
Our funds make investments in companies that are based outside of the United States, which may expose us to additional risks not typically associated with investing in companies that are based in the United States.
Many of our investment funds generally invest a significant portion of their assets in the equity, debt, loans or other securities of issuers that are headquartered outside of the United States, such as China, India, Indonesia, Latin America, MENA and Sub-Saharan Africa. A substantial amount of these foreign investments consist of investments made by our carry funds. For example, as of December 31, 2017, approximately 38% of the cumulative capital invested by our Corporate Private Equity, Real Assets and Global Credit carry funds was attributable to foreign investments. Investments in non-U.S. securities involve risks not typically associated with investing in U.S. securities, including:
|
•
|
certain economic and political risks, including potential exchange control regulations and restrictions on our non-U.S. investments and repatriation of profits on investments or of capital invested, the risks of political, economic or social instability, the possibility of expropriation or confiscatory taxation and adverse economic and political developments;
|
|
•
|
the imposition of non-U.S. taxes on gains from the sale of investments or other distributions by our funds;
|
|
•
|
the absence of uniform accounting, auditing and financial reporting standards, practices and disclosure requirements and less government supervision and regulation;
|
|
•
|
changes in laws or clarifications to existing laws that could impact our tax treaty positions, which could adversely impact the returns on our investments;
|
|
•
|
limitations on the deductibility of interest for income tax purposes in certain jurisdictions;
|
|
•
|
differences in the legal and regulatory environment or enhanced legal and regulatory compliance;
|
|
•
|
limitations on borrowings to be used to fund acquisitions or dividends;
|
|
•
|
political hostility to investments by foreign or private equity investors, including increased risk of government expropriation;
|
|
•
|
less liquid markets;
|
|
•
|
reliance on a more limited number of commodity inputs, service providers and/or distribution mechanisms;
|
|
•
|
adverse fluctuations in currency exchange rates and costs associated with conversion of investment principal and income from one currency into another;
|
|
•
|
higher rates of inflation;
|
|
•
|
higher transaction costs;
|
|
•
|
less government supervision of exchanges, brokers and issuers;
|
|
•
|
less developed bankruptcy, limited liability company, corporate, partnership and other laws (which may have the effect of disregarding or otherwise circumventing the limited liability structures potentially causing the actions or liabilities of one fund or a portfolio company to adversely impact us or an unrelated fund or portfolio company);
|
60
|
•
|
difficulty in enforcing contractual obligations;
|
|
•
|
less stringent requirements relating to fiduciary duties;
|
|
•
|
fewer investor protections and less publicly available information in respect of companies in non-U.S. markets; and
|
|
•
|
greater price volatility.
|
We operate in numerous national and subnational jurisdictions throughout the world and are subject to complex taxation requirements that could result in the imposition of taxes in excess of any amounts that are reserved
as a cash or financial statement matter for such purposes. In addition, the portfolio companies of our funds are typically subject to taxation in the jurisdictions in which they operate. It is possible that a taxing authority could take a contrary view of our tax position or there could be changes in law subsequent to the date of an investment in a particular portfolio company will adversely affect returns from that investment, or adversely affect any prospective investments in a particular jurisdiction, for example as a result of new legislation in any such local jurisdiction affecting the deductibility of interest or other expenses related to acquisition financing.
In the event a portfolio company outside the United States experiences financial difficulties, we may consider local laws, corporate organizational structure, potential impacts on other portfolio companies in the region and other factors in developing our business response. Among other actions, we may seek to enhance the management team or make fund capital investments from our investment funds, our senior Carlyle professionals and/or us. To the extent we and/or certain of our senior Carlyle professionals fund additional capital into a company that is experiencing difficulties, we may be required to consolidate the entity into our financial statements under applicable U.S. GAAP. See “—Risks Related to Our Organizational Structure—The consolidation of investment funds, holding companies or operating businesses of our portfolio companies could make it more difficult to understand the operating performance of the Partnership and could create operational risks for the Partnership.”
Our funds’ investments that are denominated in a foreign currency will be subject to the risk that the value of a particular currency will change in relation to one or more other currencies or that there will be changes in the cost of currency conversion and/or exchange control regulations. Among the factors that may affect currency values are trade balances, levels of short-term interest rates, differences in relative values of similar assets in different currencies, long-term opportunities for investment and capital appreciation and political developments. Additionally, the increase in the value of the dollar makes it more difficult for companies outside of the United States that depend on non-dollar revenues to repay or refinance their dollar liabilities and a stronger dollar also reduces the domestic value of the foreign sales and earnings of U.S.-based businesses.
Regulatory action to implement controls on foreign exchange and outbound remittances of currency could also impact the dollar value of investments proceeds, interest and dividends received by our investment funds, gains and losses realized on the sale of investments and the timing and amount of distributions, if any, made to us. For example certain Asian countries, including China have implemented stricter controls on foreign exchange and outbound remittances, and several governmental entities such as, The Peoples Bank of China (PBOC), the State Administration of Foreign Exchange (SAFE), the National Development and Reform Commission (NDRC) and the Ministry of Commerce (MOFCOM) have instituted additional reporting, review and verification steps around control outbound payments on capital account items. Furthermore, in certain cases, our fund management fees are denominated in foreign currencies. With respect to those funds, we are subject to the risk that the value of a particular currency will change in relation to one or more other currencies in which the fund has incurred expenses or has made investments.
We may need to pay “giveback” obligations if and when they are triggered under the governing agreements with our investors.
If, at the end of any of the life of our CPE, Real Assets and Global Credit carry funds (or earlier with respect to certain of our funds), the carry fund has not achieved investment returns that (in most cases) exceed the preferred return threshold or (in almost all cases) the general partner receives net profits over the life of the fund in excess of its allocable share under the applicable partnership agreement, we will be obligated to repay an amount equal to the extent to which carried interest that was previously distributed to us exceeds the amounts to which we are ultimately entitled. This repayment obligation is known as a “giveback” obligation. As of December 31, 2017, we had accrued a giveback obligation of $66.8 million, representing the giveback obligation that would need to be paid by the firm if the carry funds were liquidated at their current fair values at that date. The majority of these repayment obligations are related to amounts previously distributed to our senior Carlyle professionals prior to the completion of our initial public offering, with respect to which our common unitholders did not receive any benefit. As of December 31, 2017, approximately $28.9 million of the total accrued giveback obligation is
61
attributable to Carlyle Holdings, $27.4 million of which relates to the accrued giveback obligation from the Legacy Energy Funds.
When payment of a giveback obligation is anticipated (or "realized"), the portion of this liability that is expected to be borne by the unitholders (i.e., the amount not expected to be funded by Carlyle professionals) has the effect of reducing our Distributable Earnings, which therefore may result in a lower distribution to unitholders. Any remaining giveback obligation required to be funded on behalf of our funds (most of which is attributable to Energy IV and Renew II) would generally be due upon the liquidation of the remaining assets from the funds.
If, as of December 31, 2017, all of the investments held by our carry funds were deemed worthless, the amount of realized and distributed carried interest subject to potential giveback would have been $0.7 billion, on an after-tax basis where applicable. Since inception, we have paid $199.6 million in aggregate giveback obligations, which was funded primarily through collection of employee receivables related to giveback obligations and from Carlyle professionals and other non-controlling interests for their portion of the obligation.
Although a giveback obligation is several to each person who received a distribution, and not a joint obligation, the governing agreements of our funds generally provide that to the extent a recipient does not fund his or her respective share, then we may have to fund such additional amounts beyond the amount of carried interest we retained, although we generally will retain the right to pursue any remedies that we have under such governing agreements against those carried interest recipients who fail to fund their obligations. As of December 31, 2017, approximately $37.9 million of our $66.8 million accrued giveback obligation is attributable to various current and former senior Carlyle professionals. We have historically withheld a portion of the cash from carried interest distributions to individual senior Carlyle professionals and other employees as security for their potential giveback obligations. We also set aside cash reserves from carried interest we receive and retain for potential giveback obligations that we may be required to fund in the future. However, we have not set aside additional cash reserves relating to the secondary liability we retain for the giveback obligations attributable to our individual senior Carlyle professionals and other employees if they fail to satisfy these obligations. We may need to use or reserve cash to repay such giveback obligations instead of using the cash for other purposes. See “Part I. Item 1. Business—Structure and Operation of Our Investment Funds—Incentive Arrangements / Fee Structure” and “Management’s Discussion and Analysis of Financial Condition and Results of Operations—Contractual Obligations—Contingent Obligations (Giveback)” and Notes 2 and 9 to the consolidated financial statements included in this Annual Report on Form 10-K.
Our investment funds often make common equity investments that rank junior to preferred equity and debt in a company’s capital structure.
In most cases, the companies in which our investment funds invest have, or are permitted to have, outstanding indebtedness or equity securities that rank senior to our fund’s investment. By their terms, such instruments may provide that their holders are entitled to receive payments of dividends, interest or principal on or before the dates on which payments are to be made in respect of our investment. Also, in the event of insolvency, liquidation, dissolution, reorganization or bankruptcy of a company in which an investment is made, holders of securities ranking senior to our investment would typically be entitled to receive payment in full before distributions could be made in respect of our investment. After repaying senior security holders, the company may not have any remaining assets to use for repaying amounts owed in respect of our investment. To the extent that any assets remain, holders of claims that rank equally with our investment would be entitled to share on an equal and ratable basis in distributions that are made out of those assets. Also, during periods of financial distress or following an insolvency, the ability of our funds to influence a company’s affairs and to take actions to protect their investments may be substantially less than that of the senior creditors.
Third-party investors in substantially all of our carry funds have the right to remove the general partner of the fund for cause, to accelerate the liquidation date of the investment fund without cause by a simple majority vote and to terminate the investment period under certain circumstances and investors in certain of the investment funds we advise may redeem their investments. These events would lead to a decrease in our revenues, which could be substantial.
The governing agreements of almost all of our carry funds provide that, subject to certain conditions, third-party investors in those funds have the right to remove the general partner of the fund for cause or to accelerate the liquidation date of the investment fund without cause by a simple majority vote, resulting in a reduction in management fees we would earn from such investment funds and a significant reduction in the expected amounts of total carried interest and incentive fees from those funds. Carried interest and incentive fees could be significantly reduced as a result of our inability to maximize the value of investments by an investment fund during the liquidation process or in the event of the triggering of a “giveback” obligation. Finally, the applicable funds would cease to exist after completion of liquidation and winding-up. In addition, the governing agreements of certain of our investment funds provide that in the event certain “key persons” in our investment funds do not meet specified time commitments with regard to managing the fund (for example, certain of the investment professionals serving on the investment committee or advising the fund), then investors in certain funds have the right to vote to terminate the
62
investment period by a simple majority vote in accordance with specified procedures, accelerate the withdrawal of their capital on an investor-by-investor basis, or the fund’s investment period will automatically terminate and the vote of a simple majority of investors is required to restart it. In addition to having a significant negative impact on our revenue, earnings and cash flow, the occurrence of such an event with respect to any of our investment funds would likely result in significant reputational damage to us and could negatively impact our future fundraising efforts.
The AlpInvest funds generally provide for suspension of the investment period if there is a key person event, the right of a supermajority of investors to remove the general partner with cause and, in some cases, without cause, but generally have not provided for liquidation without cause.
The latest generation of Metropolitan funds generally provide for suspension of the investment period if there is a key person event, the right of a supermajority of investors to remove the general partner with or without cause, and the right of a majority of investors to accelerate the liquidation date of the fund without cause by a simple majority vote.
Where AlpInvest and Metropolitan funds include “key person” provisions, they are focused on specific existing AlpInvest or Metropolitan personnel as applicable. While we believe that existing management have appropriate incentives to remain in their respective positions, based on equity ownership, profit participation and other contractual provisions, we are not able to guarantee the ongoing participation of the management team members in respect of the funds vehicles. In addition, certain AlpInvest and Metropolitan vehicles are structured as "fund-of-one" managed accounts which typically have a single investor or a few affiliated investors. The investor(s) in such vehicles may hold disproportionate authority over decisions reserved for third-party investors. Further, in many cases, such investors have bespoke rights allowing them to, among other things, terminate the investment period or cause a dissolution of the account or vehicle for a variety of reasons. To the extent these fund-of-one vehicles cease to invest or are dissolved, the fees generated by them may be reduced.
In addition, because our investment funds generally have an adviser that is registered under the Advisers Act, the management agreements of each of our investment funds would be terminated upon an “assignment” to a third-party of these agreements without appropriate investor consent, which assignment may be deemed to occur in the event these advisers were to experience a change of control. We cannot be certain that consents required to assignments of our investment management agreements will be obtained if a change of control occurs. “Assignment” of these agreements without investor consent could cause us to lose the fees we earn from such investment funds.
Third-party investors in our investment funds with commitment-based structures may not satisfy their contractual obligation to fund capital calls when requested by us, which could adversely affect a fund’s operations and performance.
Investors in our carry funds make capital commitments to those funds that we are entitled to call from those investors at any time during prescribed periods. We depend on investors fulfilling their commitments when we call capital from them in order for those funds to consummate investments and otherwise pay their obligations (for example, management fees) when due. Any investor that did not fund a capital call would generally be subject to several possible penalties, including having a significant amount of its existing investment forfeited in that fund. However, the impact of the penalty is directly correlated to the amount of capital previously invested by the investor in the fund and if an investor has invested little or no capital, for instance early in the life of the fund, then the forfeiture penalty may not be as meaningful. Investors may also negotiate for lesser or reduced penalties at the outset of the fund, thereby inhibiting our ability to enforce the funding of a capital call. Our use of subscription lines of credit to purchase an investment prior to calling capital from fund investors could increase the prevalence of defaulting limited partners. Should the value of an investment funded through a fund line-of-credit decline, especially early in a fund's life-cycle where minimal capital has been contributed by the fund's investors, a limited partner may decide not to fund its commitment. In addition, third-party investors in private equity, real estate assets and venture capital funds typically use distributions from prior investments to meet future capital calls. In cases where valuations of investors’ existing investments fall and the pace of distributions slows, investors may be unable to make new commitments to third-party managed investment funds such as those advised by us. If investors were to fail to satisfy a significant amount of capital calls for any particular fund or funds, the operation and performance of those funds could be materially and adversely affected.
In addition, our failure to comply with applicable pay-to-play laws, regulations and/or policies adopted by a number of states and municipal pension funds as well as the New York Attorney General’s Public Pension Fund Reform Code of Conduct, may, in certain instances, excuse a public pension fund investor from its obligation to make further capital contributions relating to all or any part of an investment or allow it to withdraw from the fund. If a public pension fund investor were to seek to be excused from funding a significant amount of capital calls for any particular fund or funds, the operation and performance of those funds could be materially and adversely affected.
63
Our failure to deal appropriately with conflicts of interest in our investment business could damage our reputation and adversely affect our businesses.
As we have expanded and as we continue to expand the number and scope of our businesses, we increasingly confront potential conflicts of interest relating to our funds’ investment activities. For example, a decision to acquire material, non-public information about a company while pursuing an investment opportunity for a particular fund may give rise to a potential conflict of interest that results in our having to restrict the ability of other funds to take any action. Certain of our funds, managed accounts or investment vehicles may have overlapping investment objectives, including co-investment funds and funds that have different fee structures, and potential conflicts may arise with respect to our decisions regarding how to allocate investment opportunities among those funds, managed accounts or investors. Different private equity funds may invest in a single portfolio company, for example where the fund that made an initial investment no longer has capital available to invest. We may also cause different funds that we manage to purchase different classes of securities in the same portfolio company. For example, one of our funds could acquire a debt security issued by the same company in which one of our buyout funds owns common equity securities. A direct conflict of interest could arise between the debt holders and the equity holders if such a portfolio company was to develop insolvency concerns, and that conflict would have to be carefully managed by us. It is also possible that in the event the portfolio company goes through a bankruptcy proceeding, the interests of the fund holding the debt securities may be subordinated, recharacterized or otherwise adversely affected by virtue of the involvement and actions of the fund holding the equity in the portfolio company. In such a case, the debt security could be converted into equity and the prospects of repayment greatly diminished. Conflicts of interest may also exist in the valuation of our investments and regarding decisions about the allocation of specific investment opportunities among us and our funds and the allocation of fees and costs among us, our funds and their portfolio companies and conflicts could also arise in respect of the ultimate disposition of such investments. Due to recent changes in the tax treatment of carried interest under the TCJA, conflicts of interest may arise with investors in certain of our funds in connection with the general partner’s decisions with respect to the sequence and timing of disposals of investments in such funds. To the extent we fail to appropriately deal with any such conflicts, it could negatively impact our reputation and ability to raise additional funds and the willingness of counterparties to do business with us or result in regulatory liability or potential litigation against us.
Risk management activities may adversely affect the return on our and our funds’ investments.
When managing our exposure to market risks, we may (on our own behalf or on behalf of our funds) from time to time use forward contracts, options, swaps, caps, collars and floors or pursue other strategies or use other forms of derivative instruments to limit our exposure to changes in the relative values of investments that may result from market developments, including changes in prevailing interest rates, currency exchange rates and commodity prices. The scope of risk management activities undertaken by us varies based on the level and volatility of interest rates, prevailing foreign currency exchange rates, the types of investments that are made and other changing market conditions. The use of hedging transactions and other derivative instruments to reduce the effects of a decline in the value of a position does not eliminate the possibility of fluctuations in the value of the position or prevent losses if the value of the position declines. Such transactions may also limit the opportunity for gain if the value of a position increases. Moreover, it may not be possible to limit the exposure to a market development that is so generally anticipated that a hedging or other derivative transaction cannot be entered into at an acceptable price. The success of any hedging or other derivative transaction generally will depend on our ability to correctly predict market changes, the degree of correlation between price movements of a derivative instrument and the position being hedged, the creditworthiness of the counterparty and other factors. As a result, while we may enter into such a transaction in order to reduce our exposure to market risks, the transaction may result in poorer overall firm or investment performance than if it had not been executed. Such transactions may also limit the opportunity for gain if the value of a hedged position increases.
While such hedging arrangements may reduce certain risks, such arrangements themselves may entail certain other risks. These arrangements may require the posting of cash collateral at a time when a fund has insufficient cash or illiquid assets such that the posting of the cash is either impossible or requires the sale of assets at prices that do not reflect their underlying value. Moreover, these hedging arrangements may generate significant transaction costs, including potential tax costs, which may reduce the returns generated by the firm or a fund. See “—Rapidly changing regulations regarding derivatives and commodity interest transactions could adversely impact various aspects of our business."
Certain of our fund investments may be concentrated in particular asset types or geographic regions, which could exacerbate any negative performance of those funds to the extent those concentrated investments perform poorly.
The governing agreements of our investment funds contain only limited investment restrictions and only limited requirements as to diversification of fund investments, either by geographic region or asset type. For example, we advise funds that invest predominantly in the United States, Europe, Asia, South America, Ireland, Peru, Japan, or Sub-Saharan Africa; and we advise funds that invest in a single industry sector, such as financial services and power. During periods of difficult market conditions or slowdowns in these sectors or geographic regions, decreased revenue, difficulty in obtaining access to financing
64
and increased funding costs experienced by our funds may be exacerbated by this concentration of investments, which would result in lower investment returns for our funds. Such concentration may increase the risk that events affecting a specific geographic region or asset type will have an adverse or disparate impact on such investment funds, as compared to funds that invest more broadly. Idiosyncratic factors impacting specific companies or securities can materially affect fund performance depending on the size of the position.
Our energy business is involved in oil and gas exploration and development which involves a high degree of risk.
Our energy teams focus on investments in businesses involved in oil and gas exploration and development, which can be a speculative business involving a high degree of risk, including:
|
•
|
the use of new technologies;
|
|
•
|
reliance on estimates of oil and gas reserves in the evaluation of available geological, geophysical, engineering and economic data for each reservoir;
|
|
•
|
encountering unexpected formations or pressures, premature declines of reservoirs, blow-outs, equipment failures and other accidents in completing wells and otherwise, cratering, sour gas releases, uncontrollable flows of oil, natural gas or well fluids, adverse weather conditions, pollution, fires, spills and other environmental risks; and
|
|
•
|
the volatility of oil and natural gas prices.
|
While the price of oil generally increased in 2017, we continue to see volatility. Prices for oil and natural gas are subject to wide fluctuation in response to relatively minor changes in the supply of and demand for oil and natural gas as well as numerous additional factors such as market uncertainty, speculation, the level of consumer product demand, the refining capacity of oil purchasers, weather conditions, domestic and non-U.S. governmental regulations, the price and availability of alternative fuels, political conditions in the Middle East and Africa, actions of the Organization of Petroleum Exporting Countries, the non-U.S. supply of oil and natural gas, the price of non-U.S. imports and overall economic conditions. In addition, changes in commodity prices can vary widely from one location to the next depending upon the characteristics of the production and the availability of gathering, transportation, processing and storage facilities used to transport the oil and gas to markets. The increase in oil prices in 2017 had a positive impact on our natural resources and Legacy Energy portfolio which appreciated 30% and 6%, respectively, for the year. In the event oil prices decline, it is possible our portfolio could be adversely impacted.
Our funds may utilize special purpose acquisition companies (SPACs) to make investments in the energy industry. SPACs are publicly-traded companies that raise funds from public investors through an initial public offering (IPO) of units in order to compete an initial business combination within 24 months from the date of the IPO. If a SPAC does not complete the business combination within 24 months, our investment funds will bear certain sunk costs and the SPAC will dissolve.
Certain of our investment funds may invest in securities of companies that are experiencing significant financial or business difficulties, including companies involved in bankruptcy or other reorganization and liquidation proceedings. Such investments may be subject to a greater risk of poor performance or loss.
Certain of our investment funds, especially our distressed and corporate opportunities funds, may invest in business enterprises involved in work-outs, liquidations, reorganizations, bankruptcies and similar transactions and may purchase high risk receivables. An investment in such business enterprises entails the risk that the transaction in which such business enterprise is involved either will be unsuccessful, will take considerable time or will result in a distribution of cash or a new security the value of which will be less than the purchase price to the fund of the security or other financial instrument in respect of which such distribution is received. In addition, if an anticipated transaction does not in fact occur, the fund may be required to sell its investment at a loss. Investments in troubled companies may also be adversely affected by U.S. federal and state laws relating to, among other things, fraudulent conveyances, voidable preferences, lender liability and a bankruptcy court’s discretionary power to disallow, subordinate or disenfranchise particular claims. Investments in securities and private claims of troubled companies made in connection with an attempt to influence a restructuring proposal or plan of reorganization in a bankruptcy case may also involve substantial litigation, which has the potential to adversely impact us or unrelated funds or portfolio companies. Because there is substantial uncertainty concerning the outcome of transactions involving financially troubled companies, there is a potential risk of loss by a fund of its entire investment in such company.
65
Our private equity funds’ performance, and our performance, may be adversely affected by the financial performance of our portfolio companies and the industries in which our funds invest.
Our performance and the performance of our private equity funds are significantly impacted by the value of the companies in which our funds have invested. Our funds invest in companies in many different industries, each of which is subject to volatility based upon economic and market factors. Since the global financial crisis, we have experienced and subsequent recovery has caused significant fluctuations in the value of securities held by our funds. The concomitant recession and recovery in the real economy subsequent to the global financial crisis also exerted a significant impact on overall performance activity and the demands for many of the goods and services provided by portfolio companies of the funds we advise. Although the U.S. economy has registered eight consecutive years of growth in real GDP, there remain many obstacles to continued growth in the economy such as geopolitical events, increased risk of rising interest rates or a flattening yield curve, weakening credit markets, high levels of public debt, and potential economic crises outside of the U.S. These factors and other general economic trends are likely to impact the performance of portfolio companies in many industries and in particular, industries that anticipated that global GDP would quickly return to its pre-crisis trend. In addition, the value of our investments in portfolio companies in the financial services industry is impacted by the overall health and stability of the credit markets. A rebound in the strength of the U.S. Dollar could also increase default risk on U.S. dollar-denominated loans and bonds issued by businesses domiciled in emerging market economies (EMEs), particularly in those economies whose currencies declined sharply relative to the U.S. dollar between 2013 and 2016. An increase in emerging markets corporate or sovereign defaults could further impair funding conditions or depress asset prices in these economies. The performance of our private equity funds, and our performance, may be adversely affected to the extent our fund portfolio companies experience adverse performance or additional pressure due to these downward trends. With respect to real estate, various factors could have an adverse effect on investment performance, including, but not limited to, deflation in consumer prices, a low level of consumer confidence in the economy and/or the residential real estate market and rising mortgage interest rates. In response to financial difficulties that are currently being experienced or that may be experienced in the future by certain portfolio companies or real estate investments, we may consider legal, regulatory, tax or other factors in determining the steps we may take to support such companies or investments, which may include enhancing the management team or funding additional capital investments from our investment funds, our senior Carlyle professionals and/or us. The actions we may take to support companies or investments experiencing financial difficulties may not be successful in remedying the financial difficulties and our investment funds, our senior Carlyle professionals or we may not recoup some or all of any capital investments made in support of such companies or investments. To the extent we and/or certain of our senior Carlyle professionals fund additional capital into a portfolio company or real estate investment that is experiencing difficulties, we may be required to consolidate such entity into our financial statements under applicable U.S. GAAP. See “—Risks Related to Our Organizational Structure-The consolidation of investment funds, holding companies or operating businesses of our portfolio companies could make it more difficult to understand the operating performance of the Partnership and could create operational risks for the Partnership.”
The financial projections of our portfolio companies could prove inaccurate.
Our funds generally establish the capital structure of portfolio companies on the basis of financial projections prepared by the management of such portfolio companies. These projected operating results will normally be based primarily on judgments of the management of the portfolio companies. In all cases, projections are only estimates of future results that are based upon assumptions made at the time that the projections are developed. General economic conditions, which are not predictable, along with other factors may cause actual performance to fall short of the financial projections that were used to establish a given portfolio company’s capital structure. Because of the leverage that we typically employ in our investments, this could cause a substantial decrease in the value of our equity holdings in the portfolio company. The inaccuracy of financial projections could thus cause our funds’ performance to fall short of our expectations.
Contingent liabilities could harm fund performance.
We may cause our funds to acquire an investment that is subject to contingent liabilities. Such contingent liabilities could be unknown to us at the time of acquisition or, if they are known to us, we may not accurately assess or protect against the risks that they present. Acquired contingent liabilities could thus result in unforeseen losses for our funds. In addition, in connection with the disposition of an investment in a portfolio company, a fund may be required to make representations about the business and financial affairs of such portfolio company typical of those made in connection with the sale of a business. A fund may also be required to indemnify the purchasers of such investment to the extent that any such representations are inaccurate. These arrangements may result in the incurrence of contingent liabilities by a fund, even after the disposition of an investment. Accordingly, the inaccuracy of representations and warranties made by a fund could harm such fund’s performance.
66
We and our investment funds are subject to risks in using prime brokers, custodians, administrators and other agents and third-party service providers.
We and many of our investment funds depend on the services of prime brokers, custodians, administrators and other agents and third-party service providers to carry out certain securities transactions and other business functions.
The counterparty to one or more of our or our funds’ contractual arrangements could default on its obligations under the contract. If a counterparty defaults, we and our funds may be unable to take action to cover the exposure and we or one or more of our funds could incur material losses. Among other systems, our data security, data privacy, investor reporting and business continuity processes could be impacted by a third party's inability or unwillingness to perform pursuant to our arrangements with them. In addition, we could suffer legal and reputational damage from such failure to perform if we are then unable to satisfy our obligations under our contracts with third parties or otherwise and could suffer losses in the event we are unable to comply with certain other agreements.
The terms of our contracts with third parties surrounding securities transactions are often customized and complex, and many of these arrangements occur in markets or relate to products that are not subject to regulatory oversight. In particular, some of our funds utilize prime brokerage arrangements with a relatively limited number of counterparties, which has the effect of concentrating the transaction volume (and related counterparty default risk) of these funds with these counterparties.
The consolidation and elimination of counterparties resulting from the disruption in the financial markets has increased our concentration of counterparty risk and has decreased the number of potential counterparties. Our carry funds generally are not restricted from dealing with any particular counterparty or from concentrating any or all of their transactions with one counterparty. In the event of the insolvency of a party that is holding our assets or those of our funds as collateral, we and our funds may not be able to recover equivalent assets in full as we and our funds will rank among the counterparty’s unsecured creditors. In addition, our and our funds’ cash held with a prime broker, custodian or counterparty may not be segregated from the prime broker’s, custodian’s or counterparty’s own cash, and we and our funds therefore may rank as unsecured creditors in relation thereto. The inability to recover our or our investment funds’ assets could have a material impact on us or on the performance of our funds.
Investments in the natural resources industry, including the power industry, involve various operational, construction and regulatory risks.
The development, operation and maintenance of power generation facilities involves various operational risks, which can include mechanical and structural failure, accidents, labor issues or the failure of technology to perform as anticipated. Events outside our control, such as economic developments, changes in fuel prices or the price of other feedstocks, governmental policies, demand for energy and similar events, could materially reduce the revenues generated or increase the expenses of constructing, operating, maintaining or restoring power generation businesses. Such developments could impair a portfolio company’s ability to repay its debt or conduct its operations. We may also choose to or be required to decommission a power generation facility or other asset. The decommissioning process could be protracted and result in the incurrence of significant financial and/or regulatory obligations or other uncertainties.
Our natural resource portfolio companies may also face construction risks typical for power generation and related infrastructure businesses, including, without limitation:
|
•
|
labor disputes, work stoppages or shortages of skilled labor;
|
|
•
|
shortages of fuels or materials;
|
|
•
|
slower than projected construction progress and the unavailability or late delivery of necessary equipment;
|
|
•
|
delays caused by or in obtaining the necessary regulatory approvals or permits;
|
|
•
|
adverse weather conditions and unexpected construction conditions;
|
|
•
|
accidents or the breakdown or failure of construction equipment or processes;
|
|
•
|
difficulties in obtaining suitable or sufficient financing; and
|
|
•
|
force majeure or catastrophic events such as explosions, fires and terrorist activities and other similar events beyond our control.
|
67
Such developments could result in substantial unanticipated delays or expenses and, under certain circumstances, and could prevent completion of construction activities once undertaken. Construction costs may exceed estimates for various reasons, including inaccurate engineering and planning, labor and building material costs in excess of expectations and unanticipated problems with project start-up. Such unexpected increases may result in increased debt service costs and funds being insufficient to complete construction. Portfolio investments under development or portfolio investments acquired to be developed may receive little or no cash flow from the date of acquisition through the date of completion of development and may experience operating deficits after the date of completion. In addition, market conditions may change during the course of development that make such development less attractive than at the time it was commenced. Any events of this nature could severely delay or prevent the completion of, or significantly increase the cost of, the construction. In addition, there are risks inherent in the construction work which may give rise to claims or demands against one of our portfolio companies from time to time. Delays in the completion of any power project may result in lost revenues or increased expenses, including higher operation and maintenance costs related to such portfolio company.
Investments in electric utility industries both in the United States and abroad continue to experience increasing competitive pressures, primarily in wholesale markets, as a result of consumer demands, technological advances, greater availability of natural gas and other factors. Changes in regulation may support not only consolidation among domestic utilities, but also the disaggregation of vertically integrated utilities into separate generation, transmission and distribution businesses. As a result, additional significant competitors could become active in the independent power industry.
The power and energy sectors are the subject of substantial and complex laws, rules and regulation. These regulators include Federal Energy Regulatory Commission (the “FERC”), which has jurisdiction over the transmission and wholesale sale of electricity in interstate commerce and over the transportation, storage and certain sales of natural gas in interstate commerce, including the rates, charges and other terms and conditions for such services, respectively and the North American Electric Reliability Corporation (“NERC”), the purpose of which is to establish and enforce reliability standards applicable to all users, owners and operators of the bulk power system. These regulators derive their authority from, among other laws, the Federal Power Act, as amended (the “FPA”), The Energy Policy Act of 2005, Natural Gas Act, as amended (the “NGA”) and state and, perhaps, local public utility laws. On the state level, some state laws require approval from the state commission before an electric utility operating in the state may divest or transfer electric generation facilities. Most state laws require approval from the state commission before an electric utility company operating in the state may divest or transfer distribution facilities. Failure to comply with applicable laws, rules regulations and standards could result in the prevention of operation of certain facilities or the prevention of the sale of such a facility to a third party, as well as the loss of certain rate authority, refund liability, penalties and other remedies, all of which could result in additional costs to a portfolio company and adversely affect the investment results. In addition, any legislative efforts by the current administration or Congress to overturn or modify policies or regulations enacted by the prior administration that placed limitations on coal and gas electric generation, mining and/or exploration could adversely affect our alternative energy investments. Conversely, any governmental policy changes encouraging resource extraction could have the effect of holding down energy prices, which could have a negative impact on certain of our energy investments.
Our Investment Solutions business is subject to additional risks.
Our Investment Solutions business is subject to additional risks, including the following:
|
•
|
The Investment Solutions business is subject to business and other risks and uncertainties generally consistent with our business as a whole, including without limitation legal, tax and regulatory risks, the avoidance or management of conflicts of interest and the ability to attract and retain investment professionals and other personnel, and risks associated with the acquisition of new investment platforms.
|
|
•
|
Pursuant to our current arrangements with the various businesses, we currently restrict our participation in the investment activities undertaken by our Investment Solutions segment (including with respect to AlpInvest and Metropolitan), which may in turn limit our ability to address risks arising from their investment activities. For example, although we maintain ultimate control over AlpInvest, AlpInvest’s management team (who are our employees) continues to exercise independent investment authority without involvement by other Carlyle personnel. For so long as these arrangements are in place, Carlyle representatives will serve on the management board of AlpInvest, but we will observe substantial restrictions on our ability to access investment information or engage in day-to-day participation in the AlpInvest investment business, including a restriction that AlpInvest investment decisions are made and maintained without involvement by other Carlyle personnel and that no specific investment data, other than data on the investment performance of its investment funds and managed accounts, will be shared. Generally, we have a reduced ability to identify or
|
68
respond to investment and other operational issues that may arise within the Investment Solutions business, relative to other Carlyle investment funds.
|
•
|
Similar to other parts of our business, Investment Solutions is seeking to broaden its investor base by raising funds and advising separate accounts for investors on an account-by-account basis and the number and complexity of such investor mandates and fund structures has increased as a result of continuing fundraising efforts, and the activation of mandates with existing investors.
|
|
•
|
Conflicts may arise between such Investment Solutions funds or separate managed accounts (e.g., competition for investment opportunities), and in some cases conflicts may arise between a managed account and a Carlyle fund. In addition, such managed accounts may have different or heightened standards of care, and if they invest in other investment funds sponsored by us could result in lower management fees and carried interest to us than Carlyle’s typical investment funds.
|
|
•
|
Our Investment Solutions business is separated from the rest of the firm by an informational wall designed to prevent certain types of information from flowing from the Investment Solutions platform to the rest of the firm. This information barrier could limit the collaboration between our investment professionals with respect to specific investments.
|
Risks Related to Our Organizational Structure
Our common unitholders do not elect our general partner or, except in limited circumstances, vote on our general partner’s directors and have limited ability to influence decisions regarding our business.
Our general partner, Carlyle Group Management L.L.C., which is owned by our senior Carlyle professionals, manages all of our operations and activities. The limited liability company agreement of Carlyle Group Management L.L.C. establishes a Board of Directors that is responsible for the oversight of our business and operations. Unlike the holders of common stock in a corporation, our common unitholders have only limited voting rights and have no right to remove our general partner or, except in the limited circumstances described below, elect the directors of our general partner. Our common unitholders have no right to elect the directors of our general partner unless, as determined on January 31 of each year, the total voting power held by holders of the special voting units in The Carlyle Group L.P. (including voting units held by our general partner and its affiliates) in their capacity as such, or otherwise held by then-current or former Carlyle personnel (treating voting units deliverable to such persons pursuant to outstanding equity awards as being held by them), collectively, constitutes less than 10% of the voting power of the outstanding voting units of The Carlyle Group L.P. As of December 31, 2017, the percentage of the voting power of The Carlyle Group L.P. limited partners collectively held by those categories of holders and calculated in this manner was approximately 74%. Unless and until the foregoing voting power condition is satisfied, our general partner’s Board of Directors will be elected in accordance with its limited liability company agreement, which provides that directors may be appointed and removed by members of our general partner holding a majority in interest of the voting power of the members, which voting power is allocated to each member ratably according to his or her aggregate relative ownership of our common units and partnership units. As a result, our common unitholders have limited ability to influence decisions regarding our business.
In addition, holders of the preferred units generally have no voting rights and have none of the voting rights given to holders of our common units, subject to certain exceptions. See “Risks Related to Our Preferred Units—Holders of the preferred units have limited voting rights.”
Our senior Carlyle professionals will be able to determine the outcome of those few matters that may be submitted for a vote of the limited partners.
TCG Carlyle Global Partners L.L.C., an entity wholly owned by our senior Carlyle professionals, holds a special voting unit that provides it with a number of votes on any matter that may be submitted for a vote of our common unitholders (voting together as a single class on all such matters) that is equal to the aggregate number of vested and unvested Carlyle Holdings partnership units held by the limited partners of Carlyle Holdings. As of December 31, 2017, a special voting unit held by TCG Carlyle Global Partners L.L.C. provided it with approximately 70% of the total voting power of The Carlyle Group L.P. limited partners. Accordingly, our senior Carlyle professionals generally will have sufficient voting power to determine the outcome of those few matters that may be submitted for a vote of the limited partners of The Carlyle Group L.P.
Our common unitholders’ voting rights are further restricted by the provision in our partnership agreement stating that any common units held by a person that beneficially owns 20% or more of any class of The Carlyle Group L.P. common units
69
then outstanding (other than our general partner and its affiliates, or a direct or subsequently approved transferee of our general partner or its affiliates) cannot be voted on any matter. In addition, our partnership agreement contains provisions limiting the ability of our common unitholders to call meetings or to acquire information about our operations, as well as other provisions limiting the ability of our common unitholders to influence the manner or direction of our management. Our partnership agreement also does not restrict our general partner’s ability to take actions that may result in our being treated as an entity taxable as a corporation for U.S. federal (and applicable state) income tax purposes. Furthermore, the common unitholders are not entitled to dissenters’ rights of appraisal under our partnership agreement or applicable Delaware law in the event of a merger or consolidation, a sale of substantially all of our assets or any other transaction or event.
As a result of these matters and the provisions referred to under “— Our common unitholders do not elect our general partner or, except in limited circumstances, vote on our general partner’s directors and have limited ability to influence decisions regarding our business,” our common unitholders may be deprived of an opportunity to receive a premium for their common units in the future through a sale of The Carlyle Group L.P., and the trading prices of our common units may be adversely affected by the absence or reduction of a takeover premium in the trading price.
In addition, holders of the preferred units generally have no voting rights and have none of the voting rights given to holders of our common units, subject to certain exceptions. See “Risks Related to Our Preferred Units— Holders of the preferred units have limited voting rights.”
We are permitted to repurchase all of the outstanding common units under certain circumstances, and this repurchase may occur at an undesirable time or price.
We have the right to acquire all of our then-outstanding common units at the then-current trading price either if 10% or less of our common units is held by persons other than our general partner and its affiliates or if we are required to register as an investment company under the Investment Company Act. As a result of our general partner’s right to purchase outstanding common units, a holder of common units may have his common units purchased at an undesirable time or price.
We are a limited partnership and as a result qualify for and intend to continue to rely on exceptions from certain corporate governance and other requirements under the rules of the NASDAQ Global Select Market.
We are a limited partnership and qualify for exceptions from certain corporate governance and other requirements of the rules of the NASDAQ Global Select Market. Pursuant to these exceptions, limited partnerships may elect not to comply with certain corporate governance requirements of the NASDAQ Global Select Market, including the requirements (1) that a majority of the Board of Directors of our general partner consist of independent directors, (2) that we have a compensation committee that is composed entirely of independent directors, (3) that the compensation committee be required to consider certain independence factors when engaging compensation consultants, legal counsel and other committee advisors, (4) that we have independent director oversight of director nominations, and (5) that we obtain unitholder approval for (a) certain private placements of units that equal or exceed 20% of the outstanding common units or voting power, (b) certain acquisitions of stock or assets of another company or (c) a change of control transaction. In addition, we are not required to hold annual meetings of our common unitholders. We intend to continue to avail ourselves of these exceptions. Accordingly, common unitholders generally do not have the same protections afforded to equityholders of entities that are subject to all of the corporate governance requirements of the NASDAQ Global Select Market.
Potential conflicts of interest may arise among our general partner, its affiliates and us. Our general partner and its affiliates have limited fiduciary duties to us and our common and preferred unitholders, which may permit them to favor their own interests to the detriment of us and our common and preferred unitholders.
Conflicts of interest may arise among our general partner and its affiliates, on the one hand, and us and our common unitholders, on the other hand. As a result of these conflicts, our general partner may favor its own interests and the interests of its affiliates over the interests of our common and preferred unitholders. These conflicts include, among others, the following:
|
•
|
our general partner determines the amount and timing of our investments and dispositions, indebtedness, issuances of additional partnership interests and amounts of reserves, each of which can affect the amount of cash that is available for distribution to common and preferred unitholders;
|
|
•
|
our general partner is allowed to take into account the interests of parties other than us and the common and preferred unitholders in resolving conflicts of interest, which has the effect of limiting its duties (including fiduciary duties) to our common and preferred unitholders. For example, our subsidiaries that serve as the general partners of our investment funds have certain duties and obligations to those funds and their investors
|
70
as a result of which we expect to regularly take actions in a manner consistent with such duties and obligations but that might adversely affect our near term results of operations or cash flow;
|
•
|
because our senior Carlyle professionals hold their Carlyle Holdings partnership units directly or through entities that are not subject to corporate income taxation and The Carlyle Group L.P. holds Carlyle Holdings partnership units through wholly owned subsidiaries, some of which are subject to corporate income taxation, conflicts may arise between our senior Carlyle professionals and The Carlyle Group L.P. relating to the selection, structuring and disposition of investments and other matters. For example, the earlier disposition of assets following an exchange or acquisition transaction by a limited partner of the Carlyle Holdings partnerships generally will accelerate payments under the tax receivable agreement and increase the present value of such payments, and the disposition of assets before an exchange or acquisition transaction will increase the tax liability of a limited partner of the Carlyle Holdings partnerships without giving rise to any rights of a limited partner of the Carlyle Holdings partnerships to receive payments under the tax receivable agreement;
|
|
•
|
our partnership agreement does not prohibit affiliates of the general partner, including its owners, from engaging in other businesses or activities, including those that might directly compete with us;
|
|
•
|
our general partner has limited its liability and reduced or eliminated its duties (including fiduciary duties) under the partnership agreement, while also restricting the remedies available to our common and preferred unitholders for actions that, without these limitations, might constitute breaches of duty (including fiduciary duty). In addition, we have agreed to indemnify our general partner and its affiliates to the fullest extent permitted by law, except with respect to conduct involving bad faith, fraud or willful misconduct. By purchasing our common and preferred units, common and preferred unitholders have agreed and consented to the provisions set forth in our partnership agreement, including the provisions regarding conflicts of interest situations that, in the absence of such provisions, might constitute a breach of fiduciary or other duties under applicable state law;
|
|
•
|
our partnership agreement will not restrict our general partner from causing us to pay it or its affiliates for any services rendered, or from entering into additional contractual arrangements with any of these entities on our behalf, so long as our general partner agrees to the terms of any such additional contractual arrangements in good faith as determined under the partnership agreement;
|
|
•
|
our general partner determines how much we pay for acquisition targets and the structure of such consideration, including whether to incur debt to fund the transaction, whether to issue units as consideration and the number of units to be issued and the amount and timing of any earn-out payments;
|
|
•
|
our general partner determines whether to waive certain restrictions relating to such units pursuant to the terms of the Exchange Agreement;
|
|
•
|
our general partner determines how much debt we incur and whether to issue preferred securities and those decisions may adversely affect our credit ratings;
|
|
•
|
our general partner determines which costs incurred by it and its affiliates are reimbursable by us;
|
|
•
|
our general partner controls the enforcement of obligations owed to us by it and its affiliates; and
|
|
•
|
our general partner decides whether to retain separate counsel, accountants or others to perform services for us.
|
See “Part III. Item 13. Certain Relationships, Related Transactions and Director Independence” and “Part III. Items 10. Directors, Executive Officers and Corporate Governance—Committees of the Board of Directors—Conflicts Committee.”
71
Our partnership agreement contains provisions that reduce or eliminate duties (including fiduciary duties) of our general partner and limit remedies available to common and preferred unitholders for actions that might otherwise constitute a breach of duty. It will be difficult for a preferred or common unitholder to successfully challenge a resolution of a conflict of interest by our general partner or by its conflicts committee.
Our partnership agreement contains provisions that waive or consent to conduct by our general partner and its affiliates that might otherwise raise issues about compliance with fiduciary duties or applicable law. For example, our partnership agreement provides that when our general partner is acting in its individual capacity, as opposed to in its capacity as our general partner, it may act without any fiduciary obligations to us or our common and preferred unitholders whatsoever. When our general partner, in its capacity as our general partner, is permitted to or required to make a decision in its “sole discretion” or “discretion” or pursuant to any provision of our partnership agreement not subject to an express standard of “good faith,” then our general partner is entitled to consider only such interests and factors as it desires, including its own interests, and has no duty or obligation (fiduciary or otherwise) to give any consideration to any interest of or factors affecting us or any limited partners and will not be subject to any different standards imposed by the partnership agreement, otherwise existing at law, in equity or otherwise.
The modifications of fiduciary duties contained in our partnership agreement are expressly permitted by Delaware law. Hence, we and our common and preferred unitholders only have recourse and are able to seek remedies against our general partner if our general partner breaches its obligations pursuant to our partnership agreement. Unless our general partner breaches its obligations pursuant to our partnership agreement, we and our common and preferred unitholders do not have any recourse against our general partner even if our general partner were to act in a manner that was inconsistent with traditional fiduciary duties. Furthermore, even if there has been a breach of the obligations set forth in our partnership agreement, our partnership agreement provides that our general partner and its officers and directors are not be liable to us or our common and preferred unitholders for errors of judgment or for any acts or omissions unless there has been a final and non-appealable judgment by a court of competent jurisdiction determining that the general partner or its officers and directors acted in bad faith or engaged in fraud or willful misconduct. These modifications are detrimental to the common and preferred unitholders because they restrict the remedies available to common and preferred unitholders for actions that without those limitations might constitute breaches of duty (including fiduciary duty).
Whenever a potential conflict of interest exists between us, any of our subsidiaries or any of our partners, and our general partner or its affiliates, our general partner may resolve such conflict of interest. Our general partner’s resolution of the conflict of interest will conclusively be deemed approved by the partnership and all of our partners, and not to constitute a breach of the partnership agreement or any duty, unless the general partner subjectively believes such determination or action is opposed to the best interests of the partnership. A preferred or common unitholder seeking to challenge this resolution of the conflict of interest would bear the burden of proving that the general partner subjectively believed that such resolution was opposed to the best interests of the partnership. This is different from the situation with Delaware corporations, where a conflict resolution by an interested party would be presumed to be unfair and the interested party would have the burden of demonstrating that the resolution was fair.
Also, if our general partner obtains the approval of the conflicts committee of our general partner, any determination or action by the general partner will be conclusively deemed to be made or taken in good faith and not a breach by our general partner of the partnership agreement or any duties it may owe to us or our common and preferred unitholders. This is different from the situation with Delaware corporations, where a conflict resolution by a committee consisting solely of independent directors may, in certain circumstances, merely shift the burden of demonstrating unfairness to the plaintiff. Common and preferred unitholders, in purchasing our common and preferred units, are deemed as having consented to the provisions set forth in our partnership agreement, including the provisions regarding conflicts of interest situations that, in the absence of such provisions, might constitute a breach of fiduciary or other duties under applicable state law. As a result, common and preferred unitholders will, as a practical matter, not be able to successfully challenge an informed decision by the conflicts committee. See “Part III. Item 13. Certain Relationships, Related Transactions and Director Independence” and “Part III. Items 10. Directors, Executive Officers and Corporate Governance—Committees of the Board of Directors—Conflicts Committee.”
The control of our general partner may be transferred to a third party without common unitholder consent.
Our general partner may transfer its general partner interest to a third party in a merger or consolidation without the consent of our common unitholders. Furthermore, at any time, the members of our general partner may sell or transfer all or part of their limited liability company interests in our general partner without the approval of the common unitholders, subject to certain restrictions as described elsewhere in this annual report. A new general partner may not be willing or able to form new investment funds and could form funds that have investment objectives and governing terms that differ materially from those of our current investment funds. A new owner could also have a different investment philosophy, employ investment professionals who are less experienced, be unsuccessful in identifying investment opportunities or have a track record that is
72
not as successful as Carlyle’s track record. If any of the foregoing were to occur, we could experience difficulty in making new investments, and the value of our existing investments, our business, our results of operations and our financial condition could materially suffer.
We intend to pay periodic distributions to our common and preferred unitholders, but our ability to do so may be limited by our cash flow from operations and available liquidity, holding partnership structure, applicable provisions of Delaware law and contractual restrictions and obligations.
The Carlyle Group L.P. is a holding partnership and has no material assets other than the ownership of the partnership units in Carlyle Holdings held through wholly owned subsidiaries. The Carlyle Group L.P. has no independent means of generating revenue. Accordingly, we intend to cause Carlyle Holdings to make distributions to its partners, including The Carlyle Group L.P.’s wholly owned subsidiaries, to fund any distributions The Carlyle Group L.P. may declare on the common units. If Carlyle Holdings makes such distributions, the limited partners of Carlyle Holdings will be entitled to receive equivalent distributions pro rata based on their partnership interests in Carlyle Holdings. Because Carlyle Holdings I GP Inc. must pay taxes and make payments under the tax receivable agreement, the amounts ultimately distributed by The Carlyle Group L.P. to common unitholders are generally expected to be less, on a per unit basis, than the amounts distributed by the Carlyle Holdings partnerships to the limited partners of the Carlyle Holdings partnerships in respect of their Carlyle Holdings partnership units. In addition, each Carlyle Holdings partnership has issued a series of preferred units (the “GP Mirror Units”) with economic terms designed to mirror those of the Series A Preferred Units. The GP Mirror Units pay the same 5.875% rate per annum to our wholly-owned subsidiaries, including Carlyle Holdings I GP Inc., that we pay on our Series A Preferred Units. Although income allocated in respect of distributions on the GP Mirror Units made to Carlyle Holdings I GP Inc. is subject to tax, cash distributions to the holders of Series A Preferred Units will not be reduced on account of any income owed by Carlyle Holdings I GP Inc.
The declaration and payment of any distributions is at the sole discretion of our general partner, which may change our distribution policy at any time. There can be no assurance that any distributions, whether quarterly or otherwise, will or can be paid. Our ability to make cash distributions to our common unitholders depends on a number of factors, including among other things, general economic and business conditions, our strategic plans and prospects, our business and investment opportunities, our financial condition and operating results, working capital requirements and anticipated cash needs, contractual restrictions and obligations, including fulfilling our current and future capital commitments, legal, tax and regulatory restrictions, restrictions and other implications on the payment of distributions by us to our common unitholders or by our subsidiaries to us, payments required pursuant to the tax receivable agreement and such other factors as our general partner may deem relevant.
Our preferred units rank senior to our common units with respect to the payment of distributions. Subject to certain exceptions, unless distributions have been declared and paid or declared and set apart for payment on the preferred units for a quarterly distribution period, during the remainder of that distribution period we may not declare or pay or set apart payment for distributions on any units of the Partnership that are junior to the preferred units, including our common units, and we may not repurchase any such junior units. Distributions on the Series A Preferred Units will reduce after-tax Distributable Earnings.
Distributions on the preferred units are discretionary and non-cumulative. See “Risks Related to Our Preferred Units—Distributions on the preferred units are discretionary and non-cumulative.”
Under the Delaware Limited Partnership Act, we may not make a distribution to a partner if after the distribution all our liabilities, other than liabilities to partners on account of their partnership interests and liabilities for which the recourse of creditors is limited to specific property of the partnership, would exceed the fair value of our assets. If we were to make such an impermissible distribution, any limited partner who received a distribution and knew at the time of the distribution that the distribution was in violation of the Delaware Limited Partnership Act would be liable to us for the amount of the distribution for three years. In addition, the terms of our credit facility or other financing arrangements may from time to time include covenants or other restrictions that could constrain our ability to make distributions.
73
We are required to pay the limited partners of the Carlyle Holdings partnerships for most of the benefits relating to any additional tax depreciation or amortization deductions that we may claim as a result of the tax basis step-up we receive in connection with subsequent sales or exchanges of Carlyle Holdings partnership units and related transactions. In certain cases, payments under the tax receivable agreement with the limited partners of the Carlyle Holdings partnerships may be accelerated and/or significantly exceed the actual tax benefits we realize and our ability to make payments under the tax receivable agreement may be limited by our structure.
Limited partners of the Carlyle Holdings partnerships, may, subject to the terms of the exchange agreement and the Carlyle Holdings partnership agreements, exchange their Carlyle Holdings partnership units for The Carlyle Group L.P. common units on a one-for-one basis. A Carlyle Holdings limited partner must exchange one partnership unit in each of the three Carlyle Holdings partnerships to effect an exchange for a common unit. The exchanges are expected to result in increases in the tax basis of the tangible and intangible assets of Carlyle Holdings. These increases in tax basis may increase (for tax purposes) depreciation and amortization deductions. Such tax deductions are expected to reduce the amount of tax that Carlyle Holdings I GP Inc. and any other entity which may in the future pay taxes and become obligated to make payments under the tax receivable agreement as described in the fourth succeeding paragraph below, which we refer to as the “corporate taxpayers,” would otherwise be required to pay in the future, although the IRS may challenge all or part of that tax basis increase, and a court could sustain such a challenge.
We have entered into a tax receivable agreement with the limited partners of the Carlyle Holdings partnerships that provides for payment by the corporate taxpayers to such owners of 85% of the amount of cash savings, if any, in U.S. federal, state and local income tax or foreign or franchise tax that the corporate taxpayers realize as a result of these increases in tax basis and of certain other tax benefits related to our entering into the tax receivable agreement, including tax benefits attributable to payments under the tax receivable agreement. This payment obligation is an obligation of the corporate taxpayers and not of Carlyle Holdings. While the actual increase in tax basis, as well as the amount and timing of any payments under this agreement, will vary depending upon a number of factors, we expect that as a result of the size of the increases in the tax basis of the tangible and intangible assets of Carlyle Holdings, the payments that we may make pursuant to the tax receivable agreement will be substantial. The factors include:
|
•
|
the timing of exchanges
— for instance, the increase in any tax deductions will vary depending on the fair value, which may fluctuate over time, of the depreciable or amortizable assets of Carlyle Holdings at the time of each exchange;
|
|
•
|
the price of our common units at the time of the exchange
— the increase in any tax deductions, as well as the tax basis increase in other assets, of Carlyle Holdings, is directly proportional to the price of our common units at the time of the exchange;
|
|
•
|
the extent to which such exchanges are taxable
— if an exchange is not taxable for any reason, increased deductions will not be available;
|
|
•
|
the amount and timing of our income
— the corporate taxpayers will be required to pay 85% of the cash tax savings as and when realized, if any. If the corporate taxpayers do not have taxable income (without the tax receivable agreement related tax deductions), the corporate taxpayers are not required (absent a change of control or other circumstances requiring an early termination payment) to make payments under the tax receivable agreement for that taxable year because no cash tax savings will have been realized. However, any cash tax savings that do not result in realized benefits in a given tax year will likely generate tax attributes that may be utilized to generate benefits in previous or future tax years. The utilization of such tax attributes will result in payments under the tax receivables agreement; and
|
|
•
|
tax rate and tax legislation
- the impact of changes in tax rates or tax legislation may impact the tax paid, which would modify the amount paid under the agreement. For example the TCJA includes permanent reduction in the federal corporate income tax rate from 35% to 21%, which will likely reduce future amounts to be paid under the agreement with respect to tax years beginning in 2018. In addition, there are numerous other provisions which may also have an impact on the amount of tax to be paid.
|
The payments under the tax receivable agreement are not conditioned upon the tax receivable agreement counterparties’ continued ownership of us. In the event that The Carlyle Group L.P. or any of its wholly owned subsidiaries that are not treated as corporations for U.S. federal income tax purposes become taxable as a corporation for U.S. federal income tax purposes, these entities will also be obligated to make payments under the tax receivable agreement on the same basis and to the same extent as the corporate taxpayers, and could impact future amounts to be paid pursuant to the tax receivable agreement.
74
The tax receivable agreement provides that upon certain changes of control, or if, at any time, the corporate taxpayers elect an early termination of the tax receivable agreement, the corporate taxpayers’ obligations under the tax receivable agreement (with respect to all Carlyle Holdings partnership units whether or not previously exchanged) would be calculated by reference to the value of all future payments that the limited partners of the Carlyle Holdings partnerships would have been entitled to receive under the tax receivable agreement using certain valuation assumptions, including that the corporate taxpayers’ will have sufficient taxable income to fully utilize the deductions arising from the increased tax deductions and tax basis and other benefits related to entering into the tax receivable agreement and, in the case of an early termination election, that any Carlyle Holdings partnership units that have not been exchanged are deemed exchanged for the market value of the common units at the time of termination. Assuming that the market value of a common unit was equal to $22.90 per common unit, which was the closing price per common unit on December 29, 2017, and that LIBOR were to be 2.95%, we estimate that the aggregate amount of these termination payments would be approximately $618 million if the corporate taxpayers were to exercise their termination right.
The foregoing number is merely an estimate and the actual payments could differ materially. In addition, the limited partners of the Carlyle Holdings partnerships will not reimburse us for any payments previously made under the tax receivable agreement if such tax basis increase is successfully challenged by the IRS. The corporate taxpayers’ ability to achieve benefits from any tax basis increase, and the payments to be made under this agreement, will depend upon a number of factors, including the timing and amount of our future income. As a result, even in the absence of a change of control or an election to terminate the tax receivable agreement, payments to the limited partners of the Carlyle Holdings partnerships under the tax receivable agreement could be in excess of the corporate taxpayers’ actual cash tax savings.
Accordingly, it is possible that the actual cash tax savings realized by the corporate taxpayers may be significantly less than the corresponding tax receivable agreement payments. There may be a material negative effect on our liquidity if the payments under the tax receivable agreement exceed the actual cash tax savings that the corporate taxpayers realize in respect of the tax attributes subject to the tax receivable agreement and/or distributions to the corporate taxpayers by Carlyle Holdings are not sufficient to permit the corporate taxpayers to make payments under the tax receivable agreement after they have paid taxes and other expenses. We may need to incur debt to finance payments under the tax receivable agreement to the extent our cash resources are insufficient to meet our obligations under the tax receivable agreement as a result of timing discrepancies or otherwise.
See “Part III. Item 13. Certain Relationships, Related Transactions and Director Independence—Tax Receivable Agreement.”
If The Carlyle Group L.P. were deemed to be an “investment company” under the Investment Company Act, applicable restrictions could make it impractical for us to continue our business as contemplated and could have a material adverse effect on our business.
An entity generally will be deemed to be an “investment company” for purposes of the Investment Company Act if:
|
•
|
it is or holds itself out as being engaged primarily, or proposes to engage primarily, in the business of investing, reinvesting or trading in securities; or
|
|
•
|
absent an applicable exemption, it owns or proposes to acquire investment securities having a value exceeding 40% of the value of its total assets (exclusive of U.S. government securities and cash items) on an unconsolidated basis.
|
We believe that we are engaged primarily in the business of providing asset management services and not in the business of investing, reinvesting or trading in securities. We hold ourselves out as an asset management firm and do not propose to engage primarily in the business of investing, reinvesting or trading in securities. Accordingly, we do not believe that The Carlyle Group L.P. is an “orthodox” investment company as defined in section 3(a)(1)(A) of the Investment Company Act and described in the first bullet point above. Furthermore, The Carlyle Group L.P. does not have any material assets other than its interests in certain wholly owned subsidiaries, which in turn have no material assets other than general partner interests in the Carlyle Holdings partnerships. These wholly owned subsidiaries are the sole general partners of the Carlyle Holdings partnerships and are vested with all management and control over the Carlyle Holdings partnerships. We do not believe that the equity interests of The Carlyle Group L.P. in its wholly owned subsidiaries or the general partner interests of these wholly owned subsidiaries in the Carlyle Holdings partnerships are investment securities. Moreover, because we believe that the capital interests of the general partners of our funds in their respective funds are neither securities nor investment securities, we believe that less than 40% of The Carlyle Group L.P.’s total assets (exclusive of U.S. government securities and cash items) on an unconsolidated basis are composed of assets that could be considered investment securities. Accordingly, we do not believe that The Carlyle Group L.P. is an inadvertent investment company by virtue of the 40% test in section 3(a)(1)(C) of the Investment
75
Company Act as described in the second bullet point above. In addition, we believe that The Carlyle Group L.P. is not an investment company under section 3(b)(1) of the Investment Company Act because it is primarily engaged in a non-investment company business.
The Investment Company Act and the rules thereunder contain detailed parameters for the organization and operation of investment companies. Among other things, the Investment Company Act and the rules thereunder limit or prohibit transactions with affiliates, impose limitations on the issuance of debt and equity securities, generally prohibit the issuance of options and impose certain governance requirements. We intend to conduct our operations so that The Carlyle Group L.P. will not be deemed to be an investment company under the Investment Company Act. If anything were to happen which would cause The Carlyle Group L.P. to be deemed to be an investment company under the Investment Company Act, requirements imposed by the Investment Company Act, including limitations on our capital structure, ability to transact business with affiliates (including us) and ability to compensate key employees, could make it impractical for us to continue our business as currently conducted, impair the agreements and arrangements between and among The Carlyle Group L.P., Carlyle Holdings and our senior Carlyle professionals, or any combination thereof, and materially adversely affect our business, results of operations and financial condition. In addition, we may be required to limit the amount of investments that we make as a principal or otherwise conduct our business in a manner that does not subject us to the registration and other requirements of the Investment Company Act.
Changes in accounting standards issued by the Financial Accounting Standards Board (“FASB”) or other standard-setting bodies may adversely affect our financial statements.
Our financial statements are prepared in accordance with GAAP as defined in the Accounting Standards Codification (“ASC”) of the FASB. From time to time, we are required to adopt new or revised accounting standards or guidance that are incorporated into the ASC. It is possible that future accounting standards we are required to adopt could change the current accounting treatment that we apply to our consolidated financial statements and that such changes could have a material adverse effect on our financial condition and results of operations.
For instance, in the last three years, the FASB has issued several accounting standard updates that will change (or have already changed) how we account for and report significant areas of our business. On January 1, 2016, we changed the way we evaluate certain legal entities for consolidation. This accounting standard update reduced the number of funds we consolidate and reduced our total assets, total liabilities and total partners' capital. Further, in May 2014, the FASB issued a final accounting standard that changes the way entities recognize revenue in their financial statements. This new accounting method will affect how we recognize and present revenues in our financial statements. The accounting change related to the recognition of revenue is effective January 1, 2018. Additionally, in February 2016, the FASB issued a final accounting standard that will require us to recognize virtually all of our leases on our consolidated balance sheet. While this accounting change is not effective until January 1, 2019, it is required to be applied retrospectively and we expect that our total assets and total liabilities on our consolidated balance sheet to increase upon adoption of this accounting guidance.
The changes to GAAP will also impose special demands on entities in the areas of governance, employee training, internal controls and disclosure.
The consolidation of investment funds, holding companies or operating businesses of our portfolio companies could make it more difficult to understand the operating performance of the Partnership and could create operational risks for the Partnership.
Under applicable US GAAP standards, we may be required to consolidate certain of our investment funds, holding companies or operating businesses if we determine that these entities are VIEs and that the Partnership is the primary beneficiary of the VIE. The consolidation of such entities could make it difficult for an investor to differentiate the assets, liabilities, and results of operations of the Partnership apart from the assets, liabilities, and results of operations of the consolidated VIEs. The assets of the consolidated VIEs are not available to meet our liquidity requirements and similarly we generally have not guaranteed or assumed any obligation for repayment of the liabilities of the consolidated VIEs.
As of December 31, 2017 (and subsequent to the January 1, 2016, adoption of an accounting standard that changed the way we evaluate certain legal entities for consolidation as discussed in Note 2 to our consolidated financial statements included in this Annual Report on Form 10-K), the total assets and liabilities of our consolidated VIEs reflected in our consolidated balance sheets were not material.
As a public entity, we are subject to the reporting requirements of the Exchange Act, as amended, and requirements of the Sarbanes-Oxley Act of 2002 (the “Sarbanes-Oxley Act”). The Exchange Act requires that we file annual, quarterly and
76
current reports with respect to our business and financial condition, and provide an annual assessment of the effectiveness of our internal control over financial reporting. The Sarbanes-Oxley Act requires that we maintain effective disclosure controls and procedures and internal controls over financial reporting. In order to maintain and improve the effectiveness of our disclosure controls and procedures and internal controls over financial reporting as required by the Exchange Act, significant resources and management oversight are required. We have implemented procedures and processes for the purpose of addressing the standards and requirements applicable to public companies. The VIEs that we consolidate as the primary beneficiary are, subject to certain transition guidelines, included in our annual assessment of the effectiveness of our internal control over financial reporting under the Sarbanes-Oxley Act. As a result, we will need to continue to implement and oversee procedures and processes to integrate such operations into our internal control structure. If we are not able to implement or maintain the necessary procedures and processes, we may be unable to report our financial information on a timely or accurate basis and could be subject adverse consequences, including sanctions by the SEC or violations of applicable Nasdaq listing rules, and could result in a breach of the covenants under the agreements governing our financing arrangements. There could also be a negative reaction in the financial markets due to a loss of investor confidence in us and the reliability of our financial statements.
Risks Related to Our Common Units
The market price of our common units may decline due to the large number of common units eligible for exchange and future sale.
The market price of our common units could decline as a result of sales of a large number of common units in the market in the future or the perception that such sales could occur. These sales, or the possibility that these sales may occur, also might make it more difficult for us to sell common units in the future at a time and at a price that we deem appropriate. Subject to the restrictions described below, we may issue and sell in the future additional common units. Since our initial public offering, we have issued 4,500,000 common units in primary offerings and have granted 50,462,113 deferred restricted common units as of December 31, 2017. The issuance of additional equity securities or securities convertible into equity securities would also result in dilution of our existing unitholders’ equity interest. The issuance of the additional common units, the sale of common units upon the exchange of Carlyle Holdings partnership units and the vesting and sale of the deferred restricted common units could cause the market price of our common units to decline.
As of December 31, 2017, limited partners of the Carlyle Holdings partnerships owned an aggregate of 234,813,858 Carlyle Holdings partnership units. Pursuant to the exchange agreement with the limited partners of the Carlyle Holdings partnerships, the limited partners may, subject to any applicable remaining vesting and minimum retained ownership requirements other transfer restrictions applicable to such limited partners as set forth in the partnership agreements of the Carlyle Holdings partnerships, on a quarterly basis (subject to the terms of the exchange agreement), exchange their Carlyle Holdings partnership units for our common units on a one-for-one basis, which exchanges began in the second quarter of 2017. Of the total units in the Carlyle Holdings partnerships, entities affiliated with Mubadala Development Company, an Abu Dhabi-based strategic development and investment company (“Mubadala”) owned 23,517,939 Carlyle Holdings partnership units as of December 31, 2017. Mubadala is generally entitled to exchange Carlyle Holdings partnerships units for common units at any time (subject to the terms of the exchange agreement). Common units received upon an exchange of Carlyle Holdings partnership units are eligible for immediate sale.
We have entered into registration rights agreements with the limited partners of Carlyle Holdings that generally require us to register these common units under the Securities Act. See “Part III. Item 13. Certain Relationships, Related Transactions and Director Independence—Registration Rights Agreements.” Provisions of the partnership agreements of the Carlyle Holdings partnerships and related agreements that contractually restrict the limited partners of the Carlyle Holdings partnerships’ ability to transfer the Carlyle Holdings partnership units or The Carlyle Group L.P. common units they hold may lapse over time or be waived, modified or amended at any time.
Under our Equity Incentive Plan, we have granted 50,462,113 deferred restricted common units as of December 31, 2017. Additional common units and Carlyle Holdings partnership units will be available for future grant under our Equity Incentive Plan, which plan provides for automatic annual increases in the number of units available for future issuance. We have filed several registration statements and intend to file additional registration statements on Form S-8 under the Securities Act to register common units or securities convertible into or exchangeable for common units issued or available for future grant under our Equity Incentive Plan (including pursuant to automatic annual increases). Any such Form S-8 registration statement will automatically become effective upon filing. Accordingly, common units registered under such registration statement will be available for sale in the open market. Morgan Stanley, our equity plan service provider, may, from time to time, act as a broker, dealer, or agent for, or otherwise facilitate sales in the open market through block transactions or otherwise
77
of our common units on behalf of, plan participants, including in connection with sales of common units to fund tax obligations payable in connection with the vesting of awards under our Equity Incentive Plan.
In addition, our partnership agreement authorizes us to issue an unlimited number of additional partnership securities and options, rights, warrants and appreciation rights relating to partnership securities for the consideration and on the terms and conditions established by our general partner in its sole discretion without the approval of any limited partners. In accordance with the Delaware Limited Partnership Act and the provisions of our partnership agreement, we may also issue additional partnership interests that have certain designations, preferences, rights, powers and duties that are different from, and may be senior to, those applicable to common units. Similarly, the Carlyle Holdings partnership agreements authorize the wholly owned subsidiaries of The Carlyle Group L.P. which are the general partners of those partnerships to issue an unlimited number of additional partnership securities of the Carlyle Holdings partnerships with certain designations, preferences, rights, powers and duties that are different from, and may be senior to, those applicable to the Carlyle Holdings partnerships units, and which may be exchangeable for our common units.
If securities or industry analysts do not publish research or reports about our business, or if they downgrade their recommendations regarding our common units, our stock price and trading volume could decline.
The trading market for our common units is influenced by the research and reports that industry or securities analysts publish about us or our business. If any of the analysts who cover us downgrades our common units or publishes inaccurate or unfavorable research about our business, our common unit stock price may decline. If analysts cease coverage of us or fail to regularly publish reports on us, we could lose visibility in the financial markets, which in turn could cause our common unit stock price or trading volume to decline and our common units to be less liquid.
The market price of our common units may be volatile, which could cause the value of your investment to decline.
Our common units may trade less frequently than those of certain more mature companies due to the limited number of common units outstanding. Due to such limited trading volume, the price of our common units may display abrupt or erratic movements at times. Additionally, it may be more difficult for investors to buy and sell significant amounts of our common units without an unfavorable impact on prevailing market prices.
Even if a trading market develops, the market price of our common units may be highly volatile and could be subject to wide fluctuations. Securities markets worldwide experience significant price and volume fluctuations. This market volatility, as well as general economic, market or political conditions, could reduce the market price of common units in spite of our operating performance. In addition, our operating results could be below the expectations of public market analysts and investors due to a number of potential factors, including variations in our quarterly operating results or distributions to unitholders, additions or departures of key management personnel, failure to meet analysts’ earnings estimates, publication of research reports about our industry, litigation and government investigations, changes or proposed changes in laws or regulations or differing interpretations or enforcement thereof affecting our business, adverse market reaction to any indebtedness we may incur or securities we may issue in the future, changes in market valuations of similar companies or speculation in the press or investment community, announcements by our competitors of significant contracts, acquisitions, dispositions, strategic partnerships, joint ventures or capital commitments, adverse publicity about the industries in which we participate or individual scandals, and in response the market price of our common units could decrease significantly. You may be unable to resell your common units at or above the price you paid for them.
In the past few years, stock markets have experienced extreme price and volume fluctuations. In the past, following periods of volatility in the overall market and the market price of a company’s securities, securities class action litigation has often been instituted against public companies. This type of litigation, if instituted against us, could result in substantial costs and a diversion of our management’s attention and resources.
Risks Related to our Preferred Units
The market price of the preferred units could be adversely affected by various factors.
The market price for the preferred units may fluctuate based on a number of factors, including:
|
•
|
the trading price of our common units;
|
|
•
|
the incurrence of additional indebtedness or additional issuances of other series or classes of preferred units;
|
78
|
•
|
whether we declare or fail to declare distributions on the preferred units from time to time and our ability to make distributions under the terms of our indebtedness;
|
|
•
|
our creditworthiness, results of operations and financial condition;
|
|
•
|
the credit ratings of the preferred units;
|
|
•
|
the prevailing interest rates or rates of return being paid by other companies similar to us and the market for similar securities; and
|
|
•
|
economic, financial, geopolitical, regulatory or judicial events that affect us or the financial markets generally.
|
Our performance, market conditions and prevailing interest rates have fluctuated in the past and can be expected to fluctuate in the future. Fluctuations in these factors could have an adverse effect on the price and liquidity of the preferred units. In general, as market interest rates rise, securities with fixed interest rates or fixed distribution rates, such as the preferred units, decline in value. Consequently, if you purchase the preferred units and market interest rates increase, the market price of the preferred units may decline. We cannot predict the future level of market interest rates.
Our ability to pay quarterly distributions on the preferred units will be subject to, among other things, general business conditions, our financial results, restrictions under the terms of our existing and future indebtedness or senior units, and our liquidity needs. Any reduction or discontinuation of quarterly distributions could cause the market price of the preferred units to decline significantly. Accordingly, the preferred units may trade at a discount to their purchase price.
Distributions on the preferred units are discretionary and non-cumulative.
Distributions on the preferred units are discretionary and non-cumulative. Holders of preferred units will only receive distributions when, as, and if declared by the board of directors of our general partner. Consequently, if the board of directors of our general partner does not declare a distribution for a distribution period, holders of the preferred units would not be entitled to receive any distribution for such distribution period, and such unpaid distribution will not be payable in such distribution period or in later distribution periods. We will have no obligation to pay distributions for a distribution period if the board of directors of our general partner does not declare such distribution before the scheduled record date for such period, whether or not distributions are declared or paid for any subsequent distribution period with respect to our Series A Preferred Units or any other preferred units we may issue. This may result in holders of the preferred units not receiving the full amount of distributions that they expect to receive, or any distributions, and may make it more difficult to resell preferred units or to do so at a price that the holder finds attractive.
The board of directors of our general partner may, in its sole discretion, determine to suspend distributions on the preferred units, which may have a material adverse effect on the market price of the preferred units. There can be no assurances that our operations will generate sufficient cash flows to enable us to pay distributions on the preferred units. Our financial and operating performance is subject to prevailing economic and industry conditions and to financial, business and other factors, some of which are beyond our control.
The terms of the preferred units will not restrict our ability to distribute tax distribution amounts to the holders of our common units even in periods when distributions on the preferred units have been suspended.
Although we generally cannot repurchase any common units or junior units and we generally may not declare or pay or set apart payment for distributions on any common units or junior units unless distributions have been declared and paid or declared and set apart for payment on the preferred units, there are exceptions, including for tax distributions. Accordingly, even if the board of directors of our general partner determines, in its sole discretion, to suspend distributions on the preferred units, we may still make distributions to the holders of our common units of amounts equal to the tax distribution amounts received from Carlyle Holdings, which the Carlyle Holdings partnerships distribute in accordance with the terms of their partnership agreements. The holders of the preferred units will have no right to prohibit or participate in, and will have no claim over, any such distributions, which may be material in amount.
Holders of the preferred units have limited voting rights.
Holders of the preferred units generally have no voting rights and have none of the voting rights given to holders of our common units, subject to certain exceptions. In particular, if distributions on the preferred units have not been declared and
79
paid for the equivalent of six or more quarterly distribution periods, whether or not consecutive (a “Nonpayment Event”), holders of the preferred units, together as a class with holders of any other series of parity units then outstanding with like voting rights, will be entitled to vote for the election of two additional directors to the board of directors of our general partner, subject to the terms and to the limited extent provided in our partnership agreement. When quarterly distributions have been declared and paid on the preferred units for four consecutive quarters following a Nonpayment Event, the right of the holders of the preferred units and such parity units to elect these two additional directors will cease, the terms of office of these two additional directors will forthwith terminate, the number of directors constituting the board of directors of our general partner will be reduced accordingly and, for purposes of determining whether a subsequent Nonpayment Event has occurred, the number of quarterly distributions payable on the preferred units that have not been declared and paid shall reset to zero.
There is no limitation on our issuance of debt securities or equity securities that rank equally with the preferred units and we may issue equity securities that rank senior to the preferred units.
The terms of the preferred units do not limit our ability to incur indebtedness or other liabilities. As a result, we and our subsidiaries may incur indebtedness or other liabilities that will rank senior to the preferred units. In addition, while we do not currently have any outstanding equity securities that rank equally with or senior to the preferred units, we may issue additional equity securities that rank equally with the preferred units without limitation and, with the approval of the holders of two-thirds of the Series A Preferred Units and all other series of voting preferred units, acting as a single class, any equity securities that rank senior to the preferred units. The incurrence of indebtedness or other liabilities that will rank senior to the preferred units or the issuance of securities ranking equally with or senior to the preferred units may reduce the amount available for distributions and the amount recoverable by holders of the preferred units in the event of our liquidation, dissolution or winding-up.
Risks Related to U.S. Taxation
Our structure involves complex provisions of U.S. federal income tax law for which no clear precedent or authority may be available. Our structure also is subject to potential legislative, judicial or administrative change and differing interpretations, possibly on a retroactive basis.
The U.S. federal income tax treatment of common and preferred unitholders depends in some instances on determinations of fact and interpretations of complex provisions of U.S. federal income tax law for which no clear precedent or authority may be available. You should be aware that the U.S. federal income tax rules are constantly under review by persons involved in the legislative process, the IRS and the U.S. Treasury Department, frequently resulting in revised interpretations of established concepts, statutory changes, revisions to regulations and other modifications and interpretations. The IRS pays close attention to the proper application of tax laws to partnerships. The present U.S. federal income tax treatment of an investment in our common units may be modified by administrative, legislative or judicial interpretation at any time, possibly on a retroactive basis, and any such action may affect investments and commitments previously made. Changes to the U.S. federal income tax laws and interpretations thereof could make it more difficult or impossible to meet the exception that allows us to be treated as a partnership for U.S. federal income tax purposes, referred to as the “Qualifying Income Exception,” (for example, proposed regulations that would treat controlled foreign corporation ("CFC") Subpart F and passive foreign investment company ("PFIC") qualified electing fund income inclusions as non-qualifying income except to the extent earnings and profits attributable to the inclusions are distributed for the taxable year), affect or cause us to change our investments and commitments, affect the tax considerations of an investment in us, change the character or treatment of portions of our income (including, for instance, the treatment of carried interest as ordinary income rather than capital gain) and adversely affect an investment in our common units. For example, as discussed above under “— Risks Related to Our Company— In past years, the U.S. Congress has considered legislation that would have in some cases after a ten-year transition period, precluded us from qualifying as a partnership for U.S. federal income tax purposes or required us to hold carried interest through taxable subsidiary corporations. If any similar legislation were to be enacted and apply to us, the after tax income and gain related to our business could be reduced.”
Our organizational documents and governing agreements will permit our general partner to modify our limited partnership agreement from time to time, without the consent of the common or preferred unitholders, to address certain changes in U.S. federal income tax regulations, legislation or interpretation. In some circumstances, such revisions could have a material adverse impact on some or all common and preferred unitholders. For instance, our general partner could elect at some point to treat us as an association taxable as a corporation for U.S. federal (and applicable state) income tax purposes. If our general partner were to do this, the U.S. federal income tax consequences of owning our common and preferred units would be materially different (including as a result of all of our future net income being subject to a level of corporate tax).
80
Moreover, we will apply certain assumptions and conventions in an attempt to comply with applicable rules of the Internal Revenue Code and to report allocations of income, gain, deduction, loss and credit to common unitholders and allocations of gross income and gains to preferred unitholders in a manner that reflects such unitholders’ beneficial ownership of partnership items, taking into account variation in ownership interests during each taxable year because of trading activity. As a result, a common unitholder transferring units may be allocated income, gain, loss and deductions and a preferred unitholder may be allocated gross income and gains realized after the date of transfer. However, those assumptions and conventions may not be in compliance with all aspects of applicable tax requirements. It is possible that the IRS will assert successfully that the conventions and assumptions used by us do not satisfy the technical requirements of the Internal Revenue Code and/or Treasury regulations and could require that items of income, gain, deductions, loss or credit, including interest deductions, be adjusted, reallocated or disallowed in a manner that adversely affects common and preferred unitholders.
If we were treated as a corporation for U.S. federal income tax or state tax purposes or otherwise became subject to additional entity level taxation (including as a result of changes to current law), then the amount of cash available for distribution to common and preferred unitholders could be substantially reduced and the value of our units could be adversely affected.
We are currently treated as a partnership for U.S. federal income tax purposes, which requires that 90% or more of our gross income for every taxable year consist of qualifying income, as defined in Section 7704 of the Internal Revenue Code and that our partnership not be registered under the Investment Company Act. Qualifying income generally includes dividends, interest, capital gains from the sale or other disposition of stocks and securities and certain other forms of investment income. We may not meet these requirements or current law may change so as to cause, in either event, us to be treated as a corporation for U.S. federal income tax purposes or otherwise subject us to U.S. federal income tax. Moreover, the anticipated after-tax benefit of an investment in our common units depends largely on our being treated as a partnership for U.S. federal income tax purposes. We have not requested, and do not plan to request, a ruling from the IRS on this or any other matter affecting us.
If we were treated as a corporation for U.S. federal income tax purposes, we would pay U.S. federal income tax on our taxable income at the applicable tax rates. The TCJA included permanent reduction in the maximum U.S. federal corporate income tax rate from 35% to 21% effective as of January 1, 2018. In addition, we would likely be liable for state and local income and/or franchise tax on all our income. Distributions to you would generally be taxed again as corporate distributions, and no income, gains, losses, deductions or credits would otherwise flow through to you. Because a tax would be imposed upon us as a corporation, the amount of cash available for distributions to holders of our common and preferred units could be substantially reduced which could cause a reduction in the value of our units. The same changes would result if our general partner caused us to be taxed as a corporation for U.S. federal income tax purposes.
Current law may change, causing us to be treated as a corporation for U.S. federal or state income tax purposes or otherwise subjecting us to additional entity level taxation. See “—Risks Related to Our Company—In past years, the U.S. Congress has considered legislation that would have in some cases after a ten-year transition period, precluded us from qualifying as a partnership for U.S. federal income tax purposes or required us to hold carried interest through taxable subsidiary corporations. If any similar legislation were to be enacted and apply to us, the after tax income and gain related to our business could be reduced.” For example, several states are evaluating ways to subject partnerships to entity level taxation through the imposition of state income, franchise or other forms of taxation. If any state were to impose a tax upon us as an entity, our distributions to you would be reduced.
Recently enacted U.S. federal income tax reform could adversely affect us.
On December 22, 2017, the President signed into law the TCJA, which has resulted in fundamental changes to the Code. Some of the key elements of the TCJA include (i) the reduction of the corporate tax rate from 35% to 21%, (ii) new limitations on the utilization of net operating losses, (iii) partial limitations on the deductibility of business interest expense, (iv) a longer three-year holding period requirement for carried interest to be treated as long-term capital gain, (v) certain modifications to Section 162(m) of the Code and (vi) general changes to the taxation of corporations and businesses, including modifications to cost recovery rules and changes relating to the scope and timing of U.S. taxation on earnings from international business operations. Although we are continuing to analyze the impact of TCJA on us, we do not expect tax reform to have a material impact to our current taxes. We continue to examine the impact this tax reform legislation may have on our business including our investment funds and portfolio companies. The impact of this tax reform on holders of our preferred or common units is uncertain and could be adverse. Each unitholder should consult with its tax advisor regarding the implications of tax reform on holding one of our units.
81
Our common and preferred unitholders may be subject to U.S. federal income tax on their share of our taxable income, regardless of whether they receive any cash distributions from us.
As long as 90% of our gross income for each taxable year constitutes qualifying income as defined in Section 7704 of the Internal Revenue Code and we are not required to register as an investment company under the Investment Company Act on a continuing basis, and assuming there is no change in law or relevant change in our structure, we will be treated, for U.S. federal income tax purposes, as a partnership and not as an association or a publicly traded partnership taxable as a corporation. Accordingly, our common unitholders will be required to take into account their allocable share of our items of income, gain, loss and deduction, and our preferred unitholders will be required to take into account their allocable share of our gross income and gain. Distributions to our common and preferred unitholders generally will be taxable for U.S. federal income tax purposes only to the extent the amount distributed exceeds their tax basis in the units. That treatment contrasts with the treatment of a shareholder in a corporation. For example, a shareholder in a corporation who receives a distribution of earnings from the corporation generally will report the distribution as dividend income for U.S. federal income tax purposes. In contrast, a holder of our common and preferred units who receives a distribution of earnings from us will not report the distribution as dividend income (and will treat the distribution as taxable only to the extent the amount distributed exceeds the unitholder’s tax basis in the units), but will instead report the holder’s allocable share of items of our income for U.S. federal income tax purposes. As a result, you may be subject to U.S. federal, state, local and possibly, in some cases, foreign income taxation on your allocable share of our items of income, gain, loss, deduction and credit (including our allocable share of those items of any entity in which we invest that is treated as a partnership or is otherwise subject to tax on a flow through basis) for each of our taxable years ending with or within your taxable years, regardless of whether or not you receive cash distributions from us. See “—Risks Related to Our Company—In past years, the U.S. Congress has considered legislation that would have in some cases after a ten-year transition period, precluded us from qualifying as a partnership for U.S. federal income tax purposes or required us to hold carried interest through taxable subsidiary corporations. If any similar legislation were to be enacted and apply to us, the after tax income and gain related to our business could be reduced.”
Our common and preferred unitholders may not receive cash distributions equal to their allocable share of our net taxable income or even the tax liability that results from that income. In addition, certain of our holdings, including holdings, if any, in a CFC and a PFIC may produce taxable income prior to the receipt of cash relating to such income, and common and preferred unitholders that are U.S. taxpayers will be required to take such income into account in determining their taxable income. In the event of an inadvertent termination of our partnership status for which the IRS has granted us limited relief, each holder of our common and preferred units may be obligated to make such adjustments as the IRS may require in order to maintain our status as a partnership. Such adjustments may require persons holding our common and preferred units to recognize additional amounts in income during the years in which they hold such units.
Amounts distributed in respect of the Series A Preferred Units could be treated as “guaranteed payments” for U.S. federal income tax purposes.
The treatment of interests in a partnership such as the Series A Preferred Units and the payments received in respect of such interests is uncertain. The IRS may contend that payments on the Series A Preferred Units represent “guaranteed payments,” which would generally be treated as ordinary income but may not have the same character when received by a holder as our gross income had when earned by us. If distributions on the Series A Preferred Units are treated as “guaranteed payments,” a holder would always be treated as receiving income equal to the amount distributed or accrued, regardless of the amount of our gross income. Our partnership agreement provides that all holders agree to treat payments made in respect of the Series A Preferred Units as other than guaranteed payments.
The Carlyle Group L.P.’s interest in certain of our businesses will be held through Carlyle Holdings I GP Inc. and Carlyle Holdings III GP L.P., which will be treated as corporations for U.S. federal income tax purposes; such corporations may be liable for significant taxes and may create other adverse tax consequences, which could potentially adversely affect the value of your investment.
In light of the publicly traded partnership rules under U.S. federal income tax law and other requirements, The Carlyle Group L.P. holds its interest in certain of our businesses through Carlyle Holdings I GP Inc. and Carlyle Holdings III GP L.P., which are treated as corporations for U.S. federal income tax purposes. Carlyle Holdings I GP Inc. and Carlyle Holdings III GP L.P. could be liable for significant U.S. federal income taxes and applicable state, local and other taxes that would not otherwise be incurred, which could adversely affect the value of your investment.
82
Complying with certain tax-related requirements may cause us to invest through foreign or domestic corporations subject to corporate income tax or enter into acquisitions, borrowings, financings or arrangements we may not have otherwise entered into.
In order for us to be treated as a partnership for U.S. federal income tax purposes and not as an association or publicly traded partnership taxable as a corporation, we must meet the Qualifying Income Exception discussed above on a continuing basis and we must not be required to register as an investment company under the Investment Company Act. In order to effect such treatment, we (or our subsidiaries) may be required to invest through foreign or domestic corporations subject to corporate income tax, forgo attractive investment opportunities or enter into acquisitions, borrowings, financings or other transactions we may not have otherwise entered into. This may adversely affect our ability to operate solely to maximize our cash flow.
Our structure also may impede our ability to engage in certain corporate acquisitive transactions because we generally intend to hold all of our assets through the Carlyle Holdings partnerships. In addition, we may be unable to participate in certain corporate reorganization transactions that would be tax-free to our common and preferred unit holders if we were a corporation.
Tax gain or loss on disposition of our common or preferred units could be more or less than expected.
If you sell your common or preferred units, you will recognize a gain or loss equal to the difference between the amount realized and the adjusted tax basis in those units. Prior distributions to you in excess of the total net taxable income allocated to you, which decreased the tax basis in your units, will in effect become taxable income to you if the units are sold at a price greater than your tax basis in those units, even if the price is less than the original cost. A portion of the amount realized, whether or not representing gain, may be ordinary income to you.
Because we do not intend to make, or cause to be made, an otherwise available election under Section 754 of the Internal Revenue Code to adjust our asset basis or the asset basis of certain of the Carlyle Holdings partnerships, a holder of common units could be allocated more taxable income in respect of those common units prior to disposition than if we had made such an election.
We have not made and currently do not intend to make, or cause to be made, an election to adjust asset basis under Section 754 of the Internal Revenue Code with respect to us or Carlyle Holdings II L.P. If no such election is made, there generally will be no adjustment to the basis of the assets of Carlyle Holdings II L.P. upon our acquisition of interests in Carlyle Holdings II L.P. in connection with our initial public offering, or subsequent offerings, or to our assets or to the assets of Carlyle Holdings II L.P. upon a subsequent transferee’s acquisition of common units from a prior holder of such common units, even if the purchase price for those interests or units, as applicable, is greater than the share of the aggregate tax basis of our assets or the assets of Carlyle Holdings II L.P. attributable to those interests or units immediately prior to the acquisition. Consequently, upon a sale of an asset by us or Carlyle Holdings II L.P. gain allocable to a holder of common units could include built-in gain in the asset existing at the time we acquired those interests, or such holder acquired such units, which built-in gain would otherwise generally be eliminated if we had made a Section 754 election.
Non-U.S. persons face unique U.S. tax issues from owning common and preferred units that may result in adverse tax consequences to them.
In light of our intended investment activities, we generally do not expect to be treated as engaged in a U.S. trade or business or to generate significant amounts of income treated as effectively connected income with respect to non-U.S. holders of our common and preferred units (“ECI”). However, there can be no assurance that we will not generate ECI currently or in the future and, subject to the qualifying income rules, we are under no obligation to minimize ECI. To the extent our income is treated as ECI, non-U.S. holders generally would be subject to withholding tax on their allocable shares of such income, would be required to file a U.S. federal income tax return for such year reporting their allocable shares of income effectively connected with such trade or business and any other income treated as ECI, and would be subject to U.S. federal income tax at regular U.S. tax rates on any such income (state and local income taxes and filings may also apply in that event). In addition, certain income of non-U.S. holders from U.S. sources not connected to any such U.S. trade or business conducted by us could be treated as ECI. Non-U.S. holders that are corporations may also be subject to a 30% branch profits tax on their allocable share of such income. In addition, certain income from U.S. sources that is not ECI allocable to non-U.S. holders will be reduced by withholding taxes imposed at the highest effective applicable tax rate.
Any gain recognized by a non-U.S. holder on the sale or exchange of common units that is deemed to be effectively connected with a U.S. trade or business will also be treated as ECI. The TCJA includes a provision effective as of November 27, 2017 treating gain or loss from the sale, exchange or disposition of a partnership interest by a non-U.S. holder as ECI to the extent that the non-U.S. holder would have recognized ECI had the partnership sold all its assets for their fair market value on the date of the sale or exchange. In addition, effective after December 31, 2017, the legislation requires the transferee of an interest in a partnership that is engaged in a U.S. trade or business to withhold 10 percent of the transferor’s amount realized
83
(gross purchase price) on the sale, exchange or other disposition of such partnership interest, unless an applicable non-foreign person affidavit is furnished by the transferor or another exception applies. Pursuant to Notice 2018-8, the Department of the Treasury and the IRS have temporarily suspended the application of the 10 percent withholding obligation in the case of the sale, exchange or other disposition of certain publicly traded partnership interests pending further guidance. While we generally do not expect to directly or indirectly own ECI producing assets in light of our intended investment activities, there can be no assurance that we will not hold ECI assets currently or in the future and subject to the qualifying income rules, we are under no obligation to minimize ECI. Many issues and the overall effect of this legislation on us are uncertain and still evolving and we will continue to assess the impact of this legislation.
Generally, under the Foreign Investment in Real Property Tax Act of 1980 (“FIRPTA”) provisions of the Internal Revenue Code, certain non-U.S. persons are subject to U.S. federal income tax in the same manner as U.S. persons on any gain realized on the disposition of an interest, other than an interest solely as a creditor, in U.S. real property. In December 2015, the Protecting Americans from Tax Hikes Act of 2015 was signed into law providing some exemptions from FIRPTA tax for certain types of non-U.S. persons. An interest in U.S. real property includes stock in a U.S. corporation (except for certain stock of publicly traded U.S. corporations) if interests in U.S. real property constitute 50% or more by value of the sum of the corporation’s assets used in a trade or business, its U.S. real property interests and its interests in real property located outside the United States (a “United States Real Property Holding Corporation” or “USRPHC”). The FIRPTA tax applies to certain non-U.S. holders holding an interest in a partnership that realizes gain in respect of an interest in U.S. real property or an interest in a USRPHC. We may, from time to time, make certain investments (other than direct investments in U.S. real property), for example, through one of our investment funds held by Carlyle Holdings II GP L.L.C. that could constitute investments in U.S. real property or USRPHCs. If we make such investments certain non U.S. holders will be subject to U.S. federal income tax under FIRPTA on such holder’s allocable share of any gain we realize on the disposition of a FIRPTA interest and will be subject to the tax return filing requirements regarding ECI discussed above. Certain foreign pension funds (“Qualified Foreign Pension Funds”) are exempt from FIRPTA on their disposition of U.S. real property interests held directly or indirectly through one or more partnerships. A Qualified Foreign Pension Fund is a corporation, trust or other arrangement which (1) is created or organized outside of the United States, (2) is established to provide retirement or pension benefits to current or former employees of one or more employers in consideration for services rendered, (3) does not have any single participant or beneficiary with a right to more than 5% of the fund’s assets or income, (4) is subject to government regulation and provides annual information reporting about its beneficiaries to the relevant tax authorities in the country in which it is established or operates and (5) with respect to which, under the laws of the country in which it is established or operates, contributions to it are deductible or excludable from gross income or taxed at a reduced rate, or taxation of its investment income is deferred or taxed at a reduced rate.
Tax-exempt entities face unique tax issues from owning common or preferred units that may result in adverse tax consequences to them.
In light of our intended investment activities, we generally do not expect to make investments directly in operating businesses that generate significant amounts of unrelated business taxable income for tax-exempt holders of our common units (“UBTI”). However, certain of our investments may be treated as debt-financed investments, which may give rise to debt-financed UBTI. Accordingly, no assurance can be given that we will not generate UBTI currently or in the future and, subject to the qualifying income rules, we are under no obligation to minimize UBTI. Consequently, a holder of common units that is a tax-exempt organization may be subject to “unrelated business income tax” to the extent that its allocable share of our income consists of UBTI. A tax-exempt partner of a partnership could be treated as earning UBTI if the partnership regularly engages in a trade or business that is unrelated to the exempt function of the tax-exempt partner, if the partnership derives income from debt-financed property or if the partnership interest itself is debt-financed. The TCJA provides that losses from one unrelated trade or business cannot be used to offset income from another trade or business for purposes of calculating a tax-exempt entity's UBTI.
We cannot match transferors and transferees of common or preferred units, and we will therefore adopt certain income tax accounting positions that may not conform to all aspects of applicable tax requirements. The IRS may challenge this treatment, which could adversely affect the value of our units.
Because we cannot match transferors and transferees of common or preferred units, we will adopt depreciation, amortization and other tax accounting positions that may not conform to all aspects of existing Treasury regulations. A successful IRS challenge to those positions could adversely affect the amount of tax benefits available to our common and preferred unitholders. It also could affect the timing of these tax benefits or the amount of gain on the sale of common or preferred units and could have a negative impact on the value of our common units or result in audits of and adjustments to our unitholders’ tax returns.
84
In addition, our taxable income and losses will be determined and apportioned among investors using conventions we regard as consistent with applicable law. As a result, a common unitholder transferring units, may be allocated income, gain, loss and deductions, and a preferred unitholder may be allocated gross income and gains realized by us after the date of transfer. Similarly, a transferee of common units may be allocated income, gain, loss and deduction and a transferee or preferred units may be allocated gross income and gains realized by us prior to the date of the transferee’s acquisition of our units. A transferee may also bear the cost of withholding tax imposed with respect to income allocated to a transferor through a reduction in the cash distributed to the transferee.
Pursuant to the TCJA, beginning for partnership tax years beginning after 2017, the sale or exchange of 50% or more of our capital and profit interests will no longer result in the termination of our partnership for U.S. federal income tax purposes. We will instead be treated as continuing to exist for U.S. federal income tax purposes even if there is a sale or exchange of 50% or more of the total interests in our capital and profits within a twelve-month period.
We may be liable for adjustments to our tax returns as a result of partnership audit legislation.
Legislation was enacted in 2015 that significantly changed the rules for U.S. federal income tax audits of partnerships. Such audits will be conducted at the partnership level, and unless a partnership qualifies for and affirmatively elects an alternative procedure, any adjustments to the amount of tax due (including interest and penalties) will be payable by the partnership. Under the elective alternative procedure, a partnership would issue information returns to persons who were partners in the audited year, who would then be required to take the adjustments into account in calculating their own tax liability, and the partnership would not be liable for the adjustments. If a partnership elects the alternative procedure for a given adjustment, the amount of taxes for which its partners would be liable would be increased by any applicable penalties and a special interest charge. There can be no assurance that we will be eligible to make such an election or that we will, in fact, make such an election for any given adjustment. If we do not or are not able to make such an election, then (1) our then-current common and preferred unitholders, in the aggregate, could indirectly bear income tax liabilities in excess of the aggregate amount of taxes that would have been due had we elected the alternative procedure, and (2) a given common or preferred unitholder may indirectly bear taxes attributable to income allocable to other common and preferred unitholders or former common and preferred unitholders, including taxes (as well as interest and penalties) with respect to periods prior to such holder’s ownership of common or preferred units. Amounts available for distribution to our common and preferred unitholders may be reduced as a result of our obligation to pay any taxes associated with an adjustment. Many issues and the overall effect of this legislation on us are uncertain and still evolving and we will continue to assess the impact of this legislation.
Certain U.S. holders of common and preferred units are subject to additional tax on “net investment income.”
U.S. holders that are individuals, estates or trusts are currently subject to a Medicare tax of 3.8% on “net investment income” (or undistributed “net investment income,” in the case of estates and trusts) for each taxable year, with such tax applying to the lesser of such income or the excess of such person’s adjusted gross income (with certain adjustments) over a specified amount. Net investment income includes net income from interest, dividends, annuities, royalties and rents and net gain attributable to the disposition of investment property. Net income and gain attributable to an investment in the Partnership will be included in a U.S. holder’s “net investment income” subject to this Medicare tax.
Common and preferred unitholders may be subject to state and local taxes and return filing requirements as a result of investing in our units.
In addition to U.S. federal income taxes, our common and preferred unitholders may be subject to other taxes, including state and local taxes, unincorporated business taxes and estate, inheritance or intangible taxes that are imposed by the various jurisdictions in which we do business or own property now or in the future, even if our common and preferred unitholders do not reside in any of those jurisdictions. Our common and preferred unitholders may also be required to file state and local income tax returns and pay state and local income taxes in some or all of these jurisdictions. Further, common and preferred unitholders may be subject to penalties for failure to comply with those requirements. It is the responsibility of each common and preferred unitholder to file all U.S. federal, state and local tax returns that may be required of such unitholder. Our counsel has not rendered an opinion on the state or local tax consequences of an investment in our common or preferred units.
85
We may not be able to furnish to each unitholder specific tax information within 90 days after the close of each calendar year, which means that holders of common and preferred units who are U.S. taxpayers should anticipate the need to file annually a request for an extension of the due date of their income tax return. In addition, it is possible that common and preferred unitholders may be required to file amended income tax returns.
As a publicly traded partnership, our operating results, including distributions of income, dividends, gains, losses or deductions and adjustments to carrying basis, will be reported on Schedule K-1 and distributed to each unitholder annually. Although we currently intend to distribute Schedule K-1s on or around 90 days after the end of our fiscal year, it may require longer than 90 days after the end of our fiscal year to obtain the requisite information from all lower-tier entities so that K-1s may be prepared for us. For this reason, holders of common and preferred units who are U.S. taxpayers should anticipate that they may need to file annually with the IRS (and certain states) a request for an extension past April 15 or the otherwise applicable due date of their income tax return for the taxable year.
In addition, it is possible that holders of common and preferred units will be required to file amended income tax returns as a result of adjustments to items on the corresponding income tax returns of the partnership. Any obligation for holders common and preferred units to file amended income tax returns for that or any other reason, including any costs incurred in the preparation or filing of such returns, is the responsibility of each common unitholder.
We may hold or acquire certain investments through an entity classified as a PFIC or CFC for U.S. federal income tax purposes.
Certain of our investments may be in foreign corporations or may be acquired through a foreign subsidiary that would be classified as a corporation for U.S. federal income tax purposes and may be treated as a PFIC or a CFC. The TCJA imposes a deemed repatriation toll charge, as part of a move to a territorial system, on a U.S. person's pro-rata share of a CFC's previously untaxed foreign earnings. In addition, the TCJA expanded the definition of companies that could be CFCs which could have adverse implications to U.S. unitholders. U.S. holders of common and preferred units indirectly owning an interest in a PFIC or a CFC may experience adverse U.S. tax consequences.
Changes in U.S. and foreign tax law could adversely affect our ability to raise funds from certain foreign investors.
Under the Foreign Account Tax Compliance Act (“FATCA”), a broadly defined class of foreign financial institutions are required to comply with a complicated and expansive reporting regime or be subject to certain U.S. withholding taxes. In connection with this regulation, various foreign governments have entered into intergovernmental agreements, or IGAs, with the U.S. government. The reporting obligations imposed under FATCA require foreign financial institutions to enter into agreements with the IRS to obtain and disclose information about certain account holders and investors to the IRS (or in the case of certain foreign financial institutions that are resident in a jurisdiction that has entered into an IGA to implement this legislation, the foreign financial institutions may comply with revised diligence and reporting obligations of such IGA). Additionally, certain non-U.S. entities that are not foreign financial institutions are required to provide certain certifications or other information regarding their U.S. beneficial ownership or be subject to certain U.S. withholding taxes. Failure to comply with these requirements could expose us and/or our investors to a 30% withholding tax on certain U.S. payments (and beginning in 2019, a 30% withholding tax on gross proceeds from the sale of U.S. stocks and securities), and possibly limit our ability to open bank accounts and secure funding in the global capital markets. The administrative and economic costs of compliance with FATCA may discourage some foreign investors from investing in U.S. funds, which could adversely affect our ability to raise funds from these investors. In addition, we expect to incur additional expenses related to our compliance with such regulations. Other countries, such as Luxembourg, United Kingdom and the Cayman Islands, have implemented common reporting standards similar to that of FATCA and in some cases, have imposed penalties for non-compliance.
None.
Our principal executive offices are located in leased office space at 1001 Pennsylvania Avenue, NW, Washington, D.C. We also lease the space for our other
30
offices, including our office in Arlington, Virginia, which houses our treasury, tax and finance functions. We do not own any real property. We consider these facilities to be suitable and adequate for the management and operation of our business.
86
In the ordinary course of business, the Partnership is a party to litigation, investigations, inquiries, employment-related matters, disputes and other potential claims. Certain of these matters are described below. The Partnership is not currently able to estimate the reasonably possible amount of loss or range of loss, in excess of amounts accrued, for the matters that have not been resolved. The Partnership does not believe it is probable that the outcome of any existing litigation, investigations, disputes or other potential claims will materially affect the Partnership or these financial statements in excess of amounts accrued. The Partnership believes that the matters described below are without merit and intends to vigorously contest such allegations for the matters that have not been resolved.
Along with many other companies and individuals in the financial sector, the Partnership and Carlyle Mezzanine Partners, L.P. (“CMP”) are named as defendants in
Foy v. Austin Capital
, a case filed in June 2009 in state court in New Mexico, which purports to be a
qui tam
suit on behalf of the State of New Mexico under the state Fraud Against Taxpayers Act (“FATA”). The suit alleges that investment decisions by New Mexico public investment funds were improperly influenced by campaign contributions and payments to politically connected placement agents. The plaintiffs seek, among other things, actual damages for lost income, rescission of the investment transactions described in the complaint and disgorgement of all fees received. In September 2017, the Court dismissed the lawsuit and the plaintiffs then filed an appeal seeking to reverse that decision. The Attorney General may also pursue its own recovery from the defendants in the action.
Carlyle Capital Corporation Limited (“CCC”) was a fund sponsored by the Partnership that invested in AAA-rated residential mortgage backed securities on a highly leveraged basis. In March of 2008, amidst turmoil throughout the mortgage markets and money markets, CCC filed for insolvency protection in Guernsey. The Guernsey liquidators who took control of CCC in March 2008 filed a suit on July 7, 2010 against the Partnership, certain of its affiliates and the former directors of CCC in the Royal Court of Guernsey seeking more than $1.0 billion in damages in a case styled
Carlyle Capital Corporation Limited v. Conway et al
. On September 4, 2017, the Royal Court of Guernsey ruled that the Partnership and Directors of CCC acted reasonably and appropriately in the management and governance of CCC and that none of the Partnership, its affiliates or former directors of CCC had any liability. In December 2017, the plaintiff filed a notice of appeal of the trial court decision and the Partnership is preparing its response. The Partnership may be entitled to receive additional amounts from the plaintiff as reimbursement of legal fees and expenses incurred to defend against the claims. In December 2017, the Partnership received approximately $29.8 million from the plaintiff as a deposit towards its obligations to reimburse the Partnership for such expenses, but such amount is subject to repayment pending a final determination of the correct reimbursement amount and the ultimate outcome of the appeal process.
Cobalt International Energy, Inc. ("Cobalt") was a portfolio company owned by two of our Legacy Energy funds and funds advised by certain other private equity sponsors. Cobalt filed for bankruptcy protection on December 14, 2017. A federal securities class action against Cobalt (
In re Cobalt International Energy, Inc. Securities Litigation
) was filed in November 2014 in the U.S. District Court for the Southern District of Texas, seeking monetary damages and alleging that Cobalt and its directors made misrepresentations in certain of Cobalt’s securities offering filings relating to: (i) the value of oil reserves in Angola for which Cobalt had acquired drilling concessions, and (ii) its compliance with the Foreign Corrupt Practices Act regarding its operations in Angola and a U.S. government investigation regarding the same. The securities class action also named as co-defendants certain securities underwriters and the five private equity sponsors of Cobalt, including Riverstone and the Partnership. The class action alleged that the Partnership has liability as a "control person" for the alleged misrepresentations in Cobalt's securities offerings as well as insider trading liability. The federal court dismissed the insider trading claim against the Partnership. In addition to the class action in federal court, a class action claim was also filed in Texas state court in Houston (
Ira Gaines v. Joseph Bryant, et al.
) on similar grounds, alleging derivative claims that Cobalt and the private equity sponsors breached their fiduciary duties by engaging in insider trading. No Partnership employee served as a director or executive of Cobalt, and we vigorously contest all allegations made against the Partnership.
From 2007 to 2009, a Luxembourg subsidiary of CEREP I, a real estate fund, received proceeds from the sale of real estate located in Paris, France. Based on a provision in the Luxembourg-France tax treaty, it did not report or pay tax in France on gain from the sale. The French tax authorities asserted that CEREP I was ineligible to claim exemptions from French tax under the tax treaty, and issued a tax assessment seeking to collect taxes, interest and penalties. In April 2015, the French tax court issued an opinion in this matter that was adverse to CEREP I, holding the Luxembourg property company liable for approximately €105 million (including interest accrued since the beginning of the tax dispute). CEREP I paid approximately €30 million of the tax obligations and the Partnership paid the remaining approximately €75 million in its capacity as a guarantor. The Partnership disagreed with the outcome and filed a petition of appeal. In December 2017, the Partnership was successful on its appeal, with the French appellate court reversing the earlier tax court opinion and awarding the Partnership a refund of the full €105 million of tax and penalties (inclusive of amounts paid by CEREP I) and awarding interest on the refund
87
(which is estimated to be approximately €12.5 million, before tax). The appellate decision remains subject to the possibility of a further appeal, but the French tax authorities have not given notice as to whether they will pursue such a further appeal. Pending receipt of the refund and a final determination on any further appeal, the Partnership has not recognized income in respect of the refund as of December 31, 2017.
The Partnership currently is and expects to continue to be, from time to time, subject to examinations, formal and informal inquiries and investigations by various U.S. and non-U.S. governmental and regulatory agencies, including but not limited to, the SEC, Department of Justice, state attorneys general, FINRA, National Futures Association and the U.K. Financial Conduct Authority. The Partnership routinely cooperates with such examinations, inquiries and investigations, and they may result in the commencement of civil, criminal, or administrative or other proceedings against the Partnership or its personnel. For example, among various other requests for information, the SEC has requested information about: (i) the Partnership's historical practices relating to the acceleration of monitoring fees received from certain of the Partnership's funds' portfolio companies, and (ii) the Partnership's relationship with a third-party investment adviser to a registered investment company that has invested in various investment funds sponsored by the Partnership. The Partnership is cooperating fully with the SEC's inquiries.
During the year, the Partnership entered into settlement and purchase agreements with investors in a hedge fund and two structured finance vehicles managed by Vermillion related to investments of approximately $400 million in petroleum commodities that the Partnership believes were misappropriated by third parties outside the U.S. In total, the Partnership paid $265 million ($165 million of which was paid in 2017 with the remaining $100 million paid in 2016) to fully resolve all claims related to these matters and issued promissory notes in the aggregate amount of $54 million to repurchase the investors' interests in the two structured finance vehicles. In connection with these settlements, the Partnership also acquired certain rights to receive a portion of any proceeds obtained from marine cargo insurance policies and other efforts to pursue reimbursement for the misappropriation of petroleum. In the year ended December 31, 2017, the Partnership recognized $177 million, net of related recovery costs, in general liability insurance proceeds related to these settlements.
It is not possible to predict the ultimate outcome of all pending investigations and legal proceedings and employment-related matters, and some of the matters discussed above involve claims for potentially large and/or indeterminate amounts of damages. Based on information known by management, management does not believe that as of the date of this filing the final resolutions of the matters above will have a material effect upon the Partnership's consolidated financial statements. However, given the potentially large and/or indeterminate amounts of damages sought in certain of these matters and the inherent unpredictability of investigations and litigations, it is possible that an adverse outcome in certain matters could, from time to time, have a material effect on the Partnership's financial results in any particular period.
The Partnership accrues an estimated loss contingency liability when it is probable that such a liability has been incurred and the amount of the loss can be reasonably estimated. As of December 31, 2017, the Partnership had recorded liabilities aggregating to $35 million for litigation-related contingencies, regulatory examinations and inquiries, and other matters. The Partnership evaluates its outstanding legal and regulatory proceedings and other matters each quarter to assess its loss contingency accruals, and makes adjustments in such accruals, upwards or downward, as appropriate, based on management's best judgment after consultation with counsel. There is no assurance that the Partnership's accruals for loss contingencies will not need to be adjusted in the future or that, in light of the uncertainties involved in such matters, the ultimate resolution of these matters will not significantly exceed the accruals that the Partnership has recorded.
Not Applicable.
Our common units representing limited partner interests in The Carlyle Group L.P. are traded on the NASDAQ Global Select Market under the symbol “CG.” Our common units began trading on the NASDAQ Global Select Market Exchange on May 3, 2012.
The number of holders of record of our common units as of February 9, 2018 was 28. This does not include the number of unitholders that hold shares in “street name” through banks or broker-dealers.
88
Cash Distribution Policy for Common Units
It is Carlyle’s intention to cause Carlyle Holdings to make quarterly distributions to its partners, including The Carlyle Group L.P.’s wholly owned subsidiaries, that will enable The Carlyle Group L.P. to pay a quarterly distribution of approximately 75% of Distributable Earnings Attributable to Common Unitholders for the quarter. “Distributable Earnings Attributable to Common Unitholders” refers to The Carlyle Group L.P.'s share of Distributable Earnings, after an implied provision for current corporate income taxes (other than corporate income taxes attributable to The Carlyle Group L.P.) and preferred unit distributions, net of corporate income taxes attributable to The Carlyle Group L.P. and amounts payable under the tax receivable agreement. Carlyle’s general partner may adjust the distribution for amounts determined to be necessary or appropriate to provide for the conduct of its business, to make appropriate investments in its business and its funds or to comply with applicable law or any of its financing agreements, or to provide for future cash requirements such as tax-related payments, giveback obligations and distributions to unitholders for any ensuing quarter. The amount to be distributed could also be adjusted upward in any one quarter.
Notwithstanding the foregoing, the declaration and payment of any distributions will be at the sole discretion of our general partner, which may change our distribution policy at any time. Our general partner will take into account general economic and business conditions, our strategic plans and prospects, our business and investment opportunities, our financial condition and operating results, working capital requirements and anticipated cash needs, contractual restrictions and obligations, legal, tax and regulatory restrictions, other constraints on the payment of distributions by us to our common unitholders or by our subsidiaries to us, and such other factors as our general partner may deem relevant.
Because The Carlyle Group L.P. is a holding partnership and has no material assets other than its ownership of partnership units in Carlyle Holdings held through wholly owned subsidiaries, we will fund distributions by The Carlyle Group L.P. to common unitholders, if any, in three steps:
|
•
|
first, we will cause Carlyle Holdings to make distributions to its partners, including The Carlyle Group L.P.’s wholly owned subsidiaries. If Carlyle Holdings makes such distributions, the limited partners of Carlyle Holdings will be entitled to receive equivalent distributions pro rata based on their partnership interests in Carlyle Holdings;
|
|
•
|
second, we will cause The Carlyle Group L.P.’s wholly owned subsidiaries to distribute to The Carlyle Group L.P. their share of such distributions, net of taxes and amounts payable under the tax receivable agreement by such wholly owned subsidiaries; and
|
|
•
|
third, The Carlyle Group L.P. will distribute its net share of such distributions to our common unitholders on a pro rata basis.
|
Because our wholly owned subsidiaries must pay taxes and make payments under the tax receivable agreement, the amounts ultimately distributed by us to our common unitholders are expected to be less, on a per unit basis, than the amounts distributed by the Carlyle Holdings partnerships to the other limited partners of the Carlyle Holdings partnerships in respect of their Carlyle Holdings partnership units.
In addition, the partnership agreements of the Carlyle Holdings partnerships will provide for cash distributions, which we refer to as “tax distributions,” to the partners of such partnerships if the wholly owned subsidiaries of The Carlyle Group L.P. which are the general partners of the Carlyle Holdings partnerships determine that the taxable income of the relevant partnership will give rise to taxable income for its partners. Generally, these tax distributions will be computed based on our estimate of the net taxable income of the relevant partnership allocable to a partner multiplied by an assumed tax rate equal to the highest effective marginal combined U.S. federal, state and local income tax rate prescribed for an individual or corporate resident in New York, New York (taking into account the non-deductibility of certain expenses and the character of our income). The Carlyle Holdings partnerships will make tax distributions only to the extent distributions from such partnerships for the relevant year were otherwise insufficient to cover such tax liabilities. The Carlyle Group L.P. is not required to distribute to its common unitholders any of the cash that its wholly owned subsidiaries may receive as a result of tax distributions by the Carlyle Holdings partnerships.
Under the Delaware Limited Partnership Act, we may not make a distribution to a partner if after the distribution all our liabilities, other than liabilities to partners on account of their partnership interests and liabilities for which the recourse of creditors is limited to specific property of the partnership, would exceed the fair value of our assets. If we were to make such an impermissible distribution, any limited partner who received a distribution and knew at the time of the distribution that the distribution was in violation of the Delaware Limited Partnership Act would be liable to us for the amount of the distribution
89
for three years. In addition, the terms of our credit facility provide certain limits on our ability to make distributions. See “Management’s Discussion and Analysis of Financial Condition and Results of Operation—Liquidity and Capital Resources.”
Preferred Unit Distributions
With respect to distribution year 2017, the Board of Directors of our general partner has declared a distribution to preferred unitholders totaling approximately $6.0 million, or $0.375347 per Preferred Unit, which was paid on December 15, 2017. In February 2018, the Board of Directors of the general partner of the Partnership declared a distribution for the first quarter of 2018 of
$0.367188
per preferred unit to preferred unitholders of record at the close of business on March 1, 2018, payable on March 15, 2018. Distributions on the Preferred Units are discretionary and non-cumulative.
Common Unit Distributions
With respect to distribution year 2017, the Board of Directors of our general partner has declared cumulative distributions to common unitholders totaling approximately $137.5 million, or $1.41 per common unit, consisting of (i) $0.33 per common unit in respect of the fourth quarter of 2017, which is payable on February 27, 2018 to common unitholders of record on February 20, 2018, (ii) $0.56 per common unit in respect of the third quarter of 2017, which was paid in November 2017, (iii) $0.42 per common unit in respect of the second quarter of 2017, which was paid in August 2017, and (iv) $0.10 per common unit in respect of the first quarter of 2017, which was paid in May 2017. Distributions to common unitholders paid during the calendar year ended December 31, 2017 were $118.1 million, representing the distributions paid in February 2017 of $0.16 per common unit with respect to the fourth quarter of 2016, $0.10 per common unit with respect to the first quarter of 2017, $0.42 per common unit with respect to the second quarter of 2017, and $0.56 per common unit with respect to the third quarter of 2017.
With respect to distribution year 2016, the Board of Directors of our general partner has declared cumulative distributions to common unitholders totaling approximately $131.1 million, or $1.55 per common unit, consisting of (i) $0.16 per common unit in respect of the fourth quarter of 2016, which was paid in February 2017, (ii) $0.50 per common unit in respect of the third quarter of 2016, which was paid in November 2016, (iii) $0.63 per common unit in respect of the second quarter of 2016, which was paid in August 2016, and (iv) $0.26 per common unit in respect of the first quarter of 2016, which was paid in May 2016. Distributions to common unitholders paid during the calendar year ended December 31, 2016 were $140.9 million, representing the distributions paid in March 2016 of $0.29 per common unit with respect to the fourth quarter of 2015, $0.26 per common unit with respect to the first quarter of 2016, $0.63 per common unit with respect to the second quarter of 2016, and $0.50 per common unit with respect to the third quarter of 2016.
With respect to distribution year 2015, the Board of Directors of our general partner has declared cumulative distributions to common unitholders totaling approximately $163.7 million, or $2.07 per common unit, consisting of (i) $0.29 per common unit in respect of the fourth quarter of 2015, which was paid in March 2016, (ii) $0.56 per common unit in respect of the third quarter of 2015, which was paid in November 2015, (iii) $0.89 per common unit in respect of the second quarter of 2015, which was paid in August 2015, and (iv) $0.33 per common unit in respect of the first quarter of 2015, which was paid in May 2015. Distributions to common unitholders paid during the calendar year ended December 31, 2015 were $251.0 million, representing the distributions paid in March 2015 of $1.61 per common unit with respect to the fourth quarter of 2014, $0.33 per common unit with respect to the first quarter of 2015, $0.89 per common unit with respect to the second quarter of 2015, and $0.56 per common unit with respect to the third quarter of 2015.
Carlyle Holdings Unit Distributions
With respect to distribution year 2017, we declared distributions to the other limited partners of Carlyle Holdings totaling approximately $334.2 million, or $1.41 per Carlyle Holdings unit, consisting of (i) $0.33 per Carlyle Holdings unit in respect of the fourth quarter of 2017, which is payable on February 26, 2018 to Carlyle Holdings unitholders of record on February 20, 2018, (ii) $0.56 per Carlyle Holdings unit in respect of the third quarter of 2017, which was paid in November 2017, (iii) $0.42 per Carlyle Holdings unit in respect of the second quarter of 2017, which was paid in August 2017, and (iv) $0.10 per Carlyle Holdings unit in respect of the first quarter of 2017, which was paid in May 2017. Distributions to the other limited partners of Carlyle Holdings paid during the calendar year ended December 31, 2017 were $295.6 million, representing the distributions paid in February 2017 of $0.16 per Carlyle Holdings unit with respect to the fourth quarter of 2016, $0.10 per Carlyle Holdings unit with respect to the first quarter of 2017, $0.42 per Carlyle Holdings unit with respect to the second quarter of 2017, and $0.56 per Carlyle Holdings unit with respect to the third quarter of 2017.
With respect to distribution year 2016, we declared distributions to the other limited partners of Carlyle Holdings totaling approximately $376.2 million, or $1.55 per Carlyle Holdings unit, consisting of (i) $0.16 per Carlyle Holdings unit in
90
respect of the fourth quarter of 2016, which was paid in February 2017, (ii) $0.50 per Carlyle Holdings unit in respect of the third quarter of 2016, which was paid in November 2016, (iii) $0.63 per Carlyle Holdings unit in respect of the second quarter of 2016, which was paid in August 2016, and (iv) $0.26 per Carlyle Holdings unit in respect of the first quarter of 2016, which was paid in May 2016. Distributions to the other limited partners of Carlyle Holdings paid during the calendar year ended December 31, 2016 were
$422.6 million
, representing the distributions paid in March 2016 of $0.35 per Carlyle Holdings unit with respect to the fourth quarter of 2015, $0.26 per Carlyle Holdings unit with respect to the first quarter of 2016, $0.63 per Carlyle Holdings unit with respect to the second quarter of 2016, and $0.50 per Carlyle Holdings unit with respect to the third quarter of 2016.
With respect to distribution year 2015, we declared distributions to the other limited partners of Carlyle Holdings totaling approximately $530.1 million, or $2.17 per Carlyle Holdings unit, consisting of (i) $0.35 per Carlyle Holdings unit in respect of the fourth quarter of 2015, which was paid in March 2016, (ii) $0.60 per Carlyle Holdings unit in respect of the third quarter of 2015, which was paid in November 2015, (iii) $0.89 per Carlyle Holdings unit in respect of the second quarter of 2015, which was paid in August 2015, and (iv) $0.33 per Carlyle Holdings unit in respect of the first quarter of 2015, which was paid in May 2015. Distributions to the other limited partners of Carlyle Holdings paid during the calendar year ended December 31, 2015 were $848.5 million, representing the distributions paid in March 2015 of $1.61 per Carlyle Holdings unit with respect to the fourth quarter of 2014, $0.33 per Carlyle Holdings unit with respect to the first quarter of 2015, $0.89 per Carlyle Holdings unit with respect to the second quarter of 2015, and $0.60 per Carlyle Holdings unit with respect to the third quarter of 2015.
The following table sets forth the high and low sales prices per unit of our common units, for the periods indicated:
|
|
Sales Price
|
||||||||||||||
|
|
2017
|
2016
|
|||||||||||||
|
|
High
|
Low
|
High
|
Low
|
|||||||||||
|
First Quarter
|
$
|
17.50
|
|
$
|
15.20
|
|
$
|
17.40
|
|
$
|
11.25
|
|
|||
|
Second Quarter
|
$
|
20.00
|
|
$
|
15.60
|
|
$
|
17.97
|
|
$
|
15.30
|
|
|||
|
Third Quarter
|
$
|
24.70
|
|
$
|
18.85
|
|
$
|
17.44
|
|
$
|
14.82
|
|
|||
|
Fourth Quarter
|
$
|
24.85
|
|
$
|
19.50
|
|
$
|
16.45
|
|
$
|
14.35
|
|
|||
As permitted by our policies and procedures governing transactions in our securities by our directors, executive officers and other employees, from time to time some of these persons may establish plans or arrangements complying with Rule 10b5-1 under the Exchange Act, and similar plans and arrangements relating to our common units and Carlyle Holdings partnership units.
Issuer Purchases of Equity Securities
In February 2016, the Board of Directors of the general partner of the Partnership authorized the repurchase of up to $200 million of common units and/or Carlyle Holdings units. Under this unit repurchase program, units may be repurchased from time to time in open market transactions, in privately negotiated transactions or otherwise. We expect that the majority of repurchases under this program will be done via open market transactions. No units will be repurchased from our executive officers under this program. The timing and actual number of common units and/or Carlyle Holdings units repurchased will depend on a variety of factors, including legal requirements, price, and economic and market conditions. This unit repurchase program may be suspended or discontinued at any time and does not have a specified expiration date. During the three months ended December 31, 2017, no units were repurchased. As of December 31, 2017, we had approximately $141 million in remaining authorization under the unit repurchase program.
Sales of Unregistered Securities
None.
91
The following selected consolidated financial data presents selected data on the financial condition and results of operations of The Carlyle Group L.P. This financial data should be read together with “Management’s Discussion and Analysis of Financial Condition and Results of Operations” and the historical financial statements and related notes included in this Annual Report on Form 10-K.
We derived the following selected consolidated financial data of The Carlyle Group L.P. as of December 31, 2017 and 2016 and for the years ended December 31, 2017, 2016, and 2015 from the audited consolidated financial statements included in this Annual Report on Form 10-K. The selected consolidated financial data as of December 31, 2015, 2014 and 2013 were derived from the audited consolidated financial statements of The Carlyle Group L.P. which are not included in this Annual Report on Form 10-K. Historical results are not necessarily indicative of results for any future period.
|
|
Year Ended December 31,
|
||||||||||||||||||
|
|
2017
|
2016
|
2015
|
2014
|
2013
|
||||||||||||||
|
|
(Dollars in millions, except per unit data)
|
||||||||||||||||||
|
Statement of Operations Data
|
|||||||||||||||||||
|
Revenues
|
|||||||||||||||||||
|
Fund management fees
|
$
|
1,026.9
|
|
$
|
1,076.1
|
|
$
|
1,085.2
|
|
$
|
1,166.3
|
|
$
|
984.6
|
|
||||
|
Total Performance fees
|
2,093.9
|
|
751.8
|
|
824.9
|
|
1,674.4
|
|
2,375.3
|
|
|||||||||
|
Investment income (loss)
|
232.0
|
|
160.5
|
|
15.2
|
|
(7.2
|
)
|
18.8
|
|
|||||||||
|
Interest and other income and revenues
|
323.4
|
|
285.9
|
|
1,080.9
|
|
1,046.8
|
|
1,062.5
|
|
|||||||||
|
Total Revenues
|
3,676.2
|
|
2,274.3
|
|
3,006.2
|
|
3,880.3
|
|
4,441.2
|
|
|||||||||
|
Total Expenses
|
2,632.3
|
|
2,242.1
|
|
3,468.4
|
|
3,775.4
|
|
3,693.9
|
|
|||||||||
|
Other Income
|
88.4
|
|
13.1
|
|
864.4
|
|
887.0
|
|
696.7
|
|
|||||||||
|
Income before provision for income taxes
|
1,132.3
|
|
45.3
|
|
402.2
|
|
991.9
|
|
1,444.0
|
|
|||||||||
|
Provision for income taxes
|
124.9
|
|
30.0
|
|
2.1
|
|
76.8
|
|
96.2
|
|
|||||||||
|
Net income
|
1,007.4
|
|
15.3
|
|
400.1
|
|
915.1
|
|
1,347.8
|
|
|||||||||
|
Net income attributable to non-controlling interests in consolidated entities
|
72.5
|
|
41.0
|
|
537.9
|
|
485.5
|
|
676.0
|
|
|||||||||
|
Net income (loss) attributable to
Carlyle Holdings
|
934.9
|
|
(25.7
|
)
|
(137.8
|
)
|
429.6
|
|
$
|
671.8
|
|
||||||||
|
Net income (loss) attributable to non-controlling interests in Carlyle Holdings
|
690.8
|
|
(32.1
|
)
|
(119.4
|
)
|
343.8
|
|
567.7
|
|
|||||||||
|
Net income (loss) attributable to
The Carlyle Group L.P.
|
$
|
244.1
|
|
$
|
6.4
|
|
$
|
(18.4
|
)
|
$
|
85.8
|
|
104.1
|
|
|||||
|
Net income attributable to Series A Preferred Unitholders
|
6.0
|
|
—
|
—
|
—
|
—
|
|||||||||||||
|
Net income (loss) attributable to
The Carlyle Group L.P. Common Unitholders |
$
|
238.1
|
|
$
|
6.4
|
|
$
|
(18.4
|
)
|
$
|
85.8
|
|
$
|
104.1
|
|
||||
|
Net income (loss) attributable to The Carlyle Group L.P. per common unit
|
|||||||||||||||||||
|
Basic
|
$
|
2.58
|
|
$
|
0.08
|
|
$
|
(0.24
|
)
|
$
|
1.35
|
|
$
|
2.24
|
|
||||
|
Diluted
|
$
|
2.38
|
|
$
|
(0.08
|
)
|
$
|
(0.30
|
)
|
$
|
1.23
|
|
$
|
2.05
|
|
||||
|
Distributions declared per common unit
|
$
|
1.24
|
|
$
|
1.68
|
|
$
|
3.39
|
|
$
|
1.88
|
|
$
|
1.33
|
|
||||
92
|
|
As of December 31,
|
||||||||||||||||||
|
|
2017
|
2016
|
2015
|
2014
|
2013
|
||||||||||||||
|
|
(Dollars in millions)
|
||||||||||||||||||
|
Balance Sheet Data
|
|||||||||||||||||||
|
Cash and cash equivalents
|
$
|
1,000.1
|
|
$
|
670.9
|
|
$
|
991.5
|
|
$
|
1,242.0
|
|
$
|
966.6
|
|
||||
|
Corporate treasury investments
|
$
|
376.3
|
|
$
|
190.2
|
|
$
|
—
|
|
$
|
—
|
|
$
|
—
|
|
||||
|
Investments and accrued performance fees
|
$
|
5,294.9
|
|
$
|
3,588.1
|
|
$
|
3,874.5
|
|
$
|
4,727.2
|
|
$
|
4,418.9
|
|
||||
|
Investments of Consolidated Funds
(1)
|
$
|
4,534.3
|
|
$
|
3,893.7
|
|
$
|
23,998.8
|
|
$
|
26,028.8
|
|
$
|
26,886.4
|
|
||||
|
Total assets
|
$
|
12,280.6
|
|
$
|
9,973.0
|
|
$
|
32,181.6
|
|
$
|
35,994.3
|
|
$
|
35,622.3
|
|
||||
|
Debt obligations
|
$
|
1,573.6
|
|
$
|
1,265.2
|
|
$
|
1,135.7
|
|
$
|
1,146.9
|
|
$
|
940.6
|
|
||||
|
Loans payable of Consolidated Funds
|
$
|
4,303.8
|
|
$
|
3,866.3
|
|
$
|
17,064.7
|
|
$
|
16,052.2
|
|
$
|
15,220.7
|
|
||||
|
Total liabilities
|
$
|
9,331.6
|
|
$
|
8,519.0
|
|
$
|
23,258.1
|
|
$
|
23,138.3
|
|
$
|
20,892.9
|
|
||||
|
Redeemable non-controlling interests in consolidated entities
|
$
|
—
|
|
$
|
—
|
|
$
|
2,845.9
|
|
$
|
3,761.5
|
|
$
|
4,352.0
|
|
||||
|
Series A Preferred Units
|
$
|
387.5
|
|
$
|
—
|
|
$
|
—
|
|
$
|
—
|
|
$
|
—
|
|
||||
|
Total partners’ capital
|
$
|
2,949.0
|
|
$
|
1,454.0
|
|
$
|
6,077.6
|
|
$
|
9,094.5
|
|
$
|
10,377.4
|
|
||||
|
(1)
|
The entities comprising our Consolidated Funds are not the same entities for all periods presented. On January 1, 2016, The Carlyle Group L.P. adopted ASU 2015-2,
Consolidation (Topic 810): Amendments to the Consolidation Analysis
, which provides a revised consolidation model to use in evaluating whether to consolidate certain types of legal entities. As a result, The Carlyle Group L.P. deconsolidated a majority of its consolidated funds on January 1, 2016. The consolidation or deconsolidation of funds generally has the effect of grossing up or down, respectively, reported assets, liabilities, and cash flows, and has no effect on net income attributable to The Carlyle Group L.P. or partners’ capital.
|
93
The Carlyle Group L.P. (the “Partnership”) is a Delaware limited partnership formed on July 18, 2011. The Partnership is a holding partnership and its sole material assets are equity interests through wholly owned subsidiary entities representing partnership units in Carlyle Holdings I L.P., Carlyle Holdings II L.P. and Carlyle Holdings III L.P. (collectively,” Carlyle Holdings”). Through wholly owned subsidiary entities, the Partnership is the sole general partner of Carlyle Holdings and operates and controls all of the business and affairs of Carlyle Holdings and, through Carlyle Holdings and its subsidiaries, continues to conduct the business now conducted by these subsidiaries. Carlyle Group Management L.L.C. is the general partner of the Partnership.
As the sole general partner of Carlyle Holdings, the Partnership consolidates the financial position and results of operations of Carlyle Holdings into its financial statements, and the ownership interests of the limited partners of the Carlyle Holdings partnerships are reflected as a non-controlling interest in the Partnership’s financial statements.
The following discussion should be read in conjunction with the consolidated financial statements and the related notes included in this Annual Report on Form 10-K.
Overview
We conduct our operations through four reportable segments: Corporate Private Equity, Real Assets, Global Credit (formerly known as Global Market Strategies), and Investment Solutions.
|
•
|
Corporate Private Equity
— Our Corporate Private Equity segment advises our
23
buyout and
10
growth capital funds, which seek a wide variety of investments of different sizes and growth potentials. As of
December 31, 2017
, our Corporate Private Equity segment had approximately
$73 billion
in AUM and approximately
$36 billion
in Fee-earning AUM (Fee-earning AUM excludes $18 billion
*
in pending AUM for which we have not yet activated fees, although this capital is included in total AUM).
|
|
•
|
Real Assets
— Our Real Assets segment advises our
11
U.S. and internationally focused real estate funds, our two infrastructure funds, our
two
power funds, our international energy fund, as well as our
four
Legacy Energy funds (funds that we jointly advise with Riverstone). The segment also includes
five
NGP management fee funds and
four
carry funds advised by NGP. As of
December 31, 2017
, our Real Assets segment had approximately
$43 billion
in AUM and approximately
$32 billion
in Fee-earning AUM.
|
|
•
|
Global Credit
— Our Global Credit segment advises a group of
58
funds that pursue investment opportunities across structured credit, direct lending, distressed credit, energy credit and opportunistic credit. As of
December 31, 2017
, our Global Credit segment had approximately
$33 billion
in AUM and approximately
$27 billion
in Fee-earning AUM.
|
|
•
|
Investment Solutions
— Our Investment Solutions segment advises global private equity and real estate fund of funds programs and related co-investment and secondary activities across
197
fund vehicles. As of
December 31, 2017
, our Investment Solutions segment had approximately
$46 billion
in AUM and approximately
$30 billion
in Fee-earning AUM.
|
|
*
|
For the Partnership, Fee-earning AUM excludes $22 billion in pending AUM for which we have not yet activated fees, although this capital is included in total AUM.
|
We earn management fees pursuant to contractual arrangements with the investment funds that we manage and fees for transaction advisory and oversight services provided to portfolio companies of these funds. We also typically receive a performance fee from an investment fund, which may be either an incentive fee or a special residual allocation of income, which we refer to as a carried interest, in the event that specified investment returns are achieved by the fund. Under U.S. generally accepted accounting principles (“U.S. GAAP”), we are required to consolidate some of the investment funds that we advise. However, for segment reporting purposes, we present revenues and expenses on a basis that deconsolidates these investment funds. Accordingly, our segment revenues primarily consist of fund management and related advisory fees, performance fees (consisting of incentive fees and carried interest allocations), investment income, including realized and unrealized gains on our investments in our funds and other trading securities, as well as interest and other income. Our segment expenses primarily consist of compensation and benefits expenses, including salaries, bonuses, performance payment arrangements, and equity-based compensation excluding awards granted in our initial public offering or in connection with
94
acquisitions and strategic investments, and general and administrative expenses. While our segment expenses include depreciation and interest expense, our segment expenses exclude acquisition-related charges and amortization of intangibles and impairment. Refer to Note 16 to the consolidated financial statements included in this Annual Report on Form 10-K for more information on the differences between our financial results reported pursuant to U.S. GAAP and our financial results for segment reporting purposes.
Trends Affecting our Business
Expectations for global economic growth remained strong through the fourth quarter of 2017 and into early 2018, with particular optimism surrounding the outlook for growth in the eurozone. Our proprietary portfolio of industrial and manufacturing related indicators remained steady at or near six-year highs during the fourth quarter and into early 2018. As 2017 drew to a close, inflation continued to fall short of central bank targets. In the U.S., the core PCE price index (the Federal Reserve’s preferred measure of core inflation) rose by 1.5% in the twelve months ended December 2017, unchanged from November and still well below the Federal Reserve’s 2% target. Our proprietary portfolio data similarly lacked signs of inflationary pressure, a phenomenon we believe is almost entirely driven by weakness in construction activity. During the fourth quarter of 2017, eurozone core inflation rose more sluggishly than in the third quarter of 2017, with year-on-year rates of 0.9% observed in each month of the fourth quarter. On the other hand, U.S. bond market inflation expectations continue to rise, as the 10-year breakeven rate recently reached 2.1%. The U.S. dollar declined nearly 10% against global currencies in 2017, the largest annual decline in more than 10-years. During 2017, the Euro appreciated 12% against the U.S. dollar.
Stronger real global growth, relatively low longer-term interest rates, and the passage of tax reform pushed global equity markets to record highs in 2017. The MSCI World Index advanced 20% in 2017 and 5% in the fourth quarter alone, while the S&P 500 rose 19% over the calendar year and 6% in the fourth quarter of 2017. Underlying earnings growth at the companies comprising the S&P 500 has supported the upward movement of the markets. Estimated total 2017 earnings growth for the S&P 500 is 13.4%, the highest annual rate since 2011. As has been the case throughout the year, companies with greater global exposure have been driving this trend. As of mid-December 2017, S&P 500 companies with a concentration of at least 50% of sales outside the U.S. experienced earnings growth of approximately 15%, compared to approximately 7% for companies with a greater domestic focus. After strong recent performance pushing global market multiples to multi-year highs, during early February 2018, the markets experienced a heightened level of volatility in connection with a sell-off.
The U.S. 10-year Treasury yield ended 2017 at around 2.4% and has risen to more than 2.8% in the first two weeks of February 2018. While the yield curve continued to flatten through most of January, it has recently shown signs of steepening, with the credit spread between the 10-year and two-year Treasury yields rising to nearly 0.7% as of February 7, 2018. Credit spreads on B-rated corporate credit ticked up slightly to 370 basis points in the fourth quarter - well below long-run averages - while the trailing high-yield default rate continued to hover around 2.3% (measured globally). Sustained low interest rates and the availability of financing has continued to support valuation multiples near all-time highs, though rising inflation expectations and the repricing of risk may slow the pace of gains.
Our overall carry fund portfolio appreciated by
5%
during the fourth quarter and was up
20%
for 2017. In the fourth quarter, our Corporate Private Equity funds appreciated by
8%
(
32%
for the full year), our Real Asset funds appreciated by
4%
(
19%
for the full year) and our Global Credit carry funds appreciated by
1%
for the quarter (
11%
for the full year). Appreciation in Investment Solutions was
3%
in the fourth quarter and
10%
for the full-year, negatively impacted by the strength of the Euro relative to the U.S. dollar as AlpInvest funds are primarily denominated in Euros, with significant underlying USD-denominated investments. Our private carry fund portfolio appreciated by 6% and our public carry fund portfolio appreciated by 9% during the fourth quarter, each excluding Investment Solutions. The continued appreciation across our portfolio was aided by market tailwinds in 2017 as described above. However, with market valuation levels at all-time highs, increasing volatility and the potential for upward movement in interest rates, it will be difficult for the public markets to generate the same level of appreciation in 2018 as observed in 2017 and, accordingly, it will be difficult for our portfolio to do the same as well.
In December 2017, the President signed the Tax Cuts and Jobs Act (the "TCJA"), providing the most comprehensive overhaul of the U.S. federal tax code in decades. In general, the TCJA is a pro-growth, pro-business package that is designed to stimulate growth in the economy. We expect the TCJA to further support the recent strong growth in the U.S. and global economies. Although for the majority of our current portfolio companies, we expect the benefit of a lower corporate tax rate will outweigh the cost associated with the potential limitations on interest expense deductibility, we will continue to evaluate the provisions of the Act for any further potential impact. Most of our portfolio companies have reasonable capital structures, are growing earnings and benefit from low interest rates. Assuming we continue to create value and the economy remains strong, we anticipate the TCJA generally should be a net positive for our carry fund portfolio.
95
Private equity fundraising in 2017 hit a record $453 billion, more than 9.5% above the prior high of $414 billion set in 2007, raising total industry “dry powder” above $1 trillion. We raised approximately
$25 billion
and
$43 billion
of new capital, respectively, during the fourth quarter and full-year 2017. As of the end of 2017, we had raised 57% of our $100 billion fundraising target. We expect that our strong pace of fundraising will continue into 2018 and anticipate that we will raise approximately $25 billion during the year. Higher fundraising activity generates incremental expenses, generally in the quarter that the capital is raised. As the majority of new capital commitments will not generate fees until management fees are activated, we generally incur costs ahead of revenues. We expect management fees on several of our new large buyout funds will activate fees in the second half of 2018, at which time we expect Fee-Earning AUM and Fee Related Earnings to increase. Pending Fee-Earning AUM, which is capital that we have raised, but on which we have not yet activated fees, was $22 billion at December 31, 2017 up from $5 billion at September 30, 2017, primarily due to large closings on our Asia and U.S. Buyout funds.
We remain confident in our ability to find investment opportunities that meet the criteria and strategic focus of our investment funds despite higher asset valuations and competition that may put downward pressure on rates of return for new investments across all asset classes. During the fourth quarter, our carry funds invested
$7 billion
in new or follow-on transactions, and invested
$22 billion
in 2017. Our diverse fund mandates, geographical footprint and experienced investment teams combine to generate a high level of investment lead generation. With
$70 billion
in available capital ready to deploy, our global investment teams continue to pursue transactions across our platform. We generated
$8 billion
in realized proceeds in our carry funds in the fourth quarter and
$26 billion
in 2017, the sixth consecutive year we realized more than $25 billion in realized proceeds for our fund investors. We are at a point in the cycle for our carry funds where the prior generation of funds have exited substantial parts of their portfolios and newer funds, while in accrued carry, are not yet producing realized performance fees. We expect to remain in this position through 2018, and therefore expect net realized performance fees will likely be lower in 2018 than 2017.
In January 2018, we re-branded our “Global Market Strategies” segment to “Global Credit” to better reflect the underlying business strategy. During 2018, we plan to invest our resources in further expanding and supporting our Global Credit business. We are building a scalable foundation in Global Credit capable of supporting our existing operations and managing a higher-level of assets in their current strategies, while also enabling us to extend into adjacent strategies to meet the evolving needs of our investors. If we successfully execute on our business plans, we expect to grow AUM in the Global Credit segment and improve financial results over the next few years.
Recent Transactions
Distributions
In February 2018, the Board of Directors of our general partner declared a quarterly distribution of $0.33 per common unit to common unitholders of record at the close of business on February 20, 2018, payable on February 27, 2018.
The Board of Directors of our general partner declared a quarterly distribution of $0.367188 per Preferred Unit to holders of record at the close of business on March 1, 2018, payable on March 15, 2018. Distributions on the Preferred Units are discretionary and non-cumulative. See Note 14 to the consolidated financial statements for more information on these units.
Key Financial Measures
Our key financial measures are discussed in the following pages. Additional information regarding these key financial measures and our other significant accounting policies can be found in Note 2 to the consolidated financial statements included in this Annual Report on Form 10-K.
Revenues
Revenues primarily consist of fund management fees, performance fees, investment income, including realized and unrealized gains of our investments in our funds and other investments, as well as interest and other income.
Fund Management Fees.
Fund management fees include management fees and transaction and portfolio advisory fees. We earn management fees for advisory services we provide to funds in which we hold a general partner interest or with which we have an investment advisory or investment management agreement. Additionally, management fees include catch-up management fees, which are episodic in nature and represent management fees charged to fund investors in subsequent closings of a fund which apply to the time period between the fee initiation date and the subsequent closing date.
96
Management fees attributable to Carlyle Partners VI, L.P. (“CP VI”), our sixth U.S. buyout fund with approximately
$12.0 billion
of Fee-earning AUM as of December 31, 2017, were approximately 16%, 15%, and 15% of total management fees recognized during the years ended December 31, 2017, 2016, and 2015, respectively. No other fund generated over 10% of total management fees in the periods presented.
Fund management fees exclude the reimbursement of any partnership expenses paid by the Partnership on behalf of the Carlyle funds pursuant to the limited partnership agreements, including amounts related to the pursuit of actual, proposed, or unconsummated investments, professional fees, expenses associated with the acquisition, holding and disposition of investments, and other fund administrative expenses.
Transaction and Portfolio Advisory Fees.
Transaction and portfolio advisory fees are fees we receive for the transaction and portfolio advisory services we provide to our portfolio companies. When covered by separate contractual agreements, we recognize transaction and portfolio advisory fees for these services when the service has been provided and collection is reasonably assured. We are required to offset our fund management fees earned by a percentage of the transaction and advisory fees earned, which we refer to as the “rebate offsets.” Such rebate offset percentages generally approximate 80% of the fund's portion of the transaction and advisory fees earned. The recognition of portfolio advisory fees and transaction fees can be volatile as they are primarily generated by investment activity within our funds, and therefore are impacted by our investment pace. We have received and expect to continue to receive requests from a variety of investors and groups representing investors to increase the percentage of transaction and advisory fees we share with our investors in future funds; to the extent that we accommodate such requests on future funds, the rebate offset percentages would increase relative to historical levels.
Performance Fees.
Performance fees consist principally of the performance-based capital allocation from fund limited partners to us, commonly referred to as carried interest, from certain of our investment funds, which we refer to as the “carry funds.” Carried interest revenue, which historically has comprised over 90% of all performance fees in our consolidated financial statements, is recognized by Carlyle upon appreciation of the valuation of our funds’ investments above certain return hurdles as set forth in each respective partnership agreement and is based on the amount that would be due to us pursuant to the fund partnership agreement at each period end as if the funds were liquidated at such date. Accordingly, the amount of carried interest recognized as performance fees reflects our share of the fair value gains and losses of the associated funds’ underlying investments measured at their then-current fair values relative to the fair values as of the end of the prior period. As a result, the performance fees earned in an applicable reporting period are not indicative of any future period, as fair values are based on conditions prevalent as of the reporting date. Refer to “ — Trends Affecting our Business” for further discussion.
In addition to the performance fees from our Corporate Private Equity and Real Assets funds and closed-end carry funds in the Global Credit segment, we are also entitled to receive performance fees from our Investment Solutions and NGP carry funds. The timing of performance fee realizations for these funds is typically later than in our other carry funds based on the terms of such arrangements.
Our performance fees are generated by a diverse set of funds with different vintages, geographic concentration, investment strategies and industry specialties. For an explanation of the fund acronyms used throughout this Management’s Discussion and Analysis of Financial Condition and Results of Operations section, see “Item 1. Business — Our Family of Funds.”
Performance fees in excess of 10% of the total for the year ended December 31, 2017 were generated from the following funds:
|
•
|
$649.1 million from CP VI (with total AUM of approximately
$15.2 billion
at December 31, 2017),
|
|
•
|
$312.7 million from Carlyle Asia Partners IV, L.P. (“CAP IV”) (with total AUM of approximately
$5.5 billion
at December 31, 2017), and
|
|
•
|
$311.4 million from Carlyle Partners V, L.P. (“CP V”) (with total AUM of approximately
$3.7 billion
at December 31, 2017).
|
97
Performance fees in excess of 10% of the total for the year ended December 31, 2016 were generated primarily from the following funds:
•
$124.8 million from CP V, and
•
$89.4 million from Carlyle Realty Partners VII, L.P. (“CRP VII”).
Performance fees in excess of 10% of the total for the year ended December 31, 2015 were generated primarily from the following funds:
•
$236.8 million from Carlyle Europe Partners III, L.P. (“CEP III”),
•
$184.5 million from Carlyle Asia Partners III, L.P. (“CAP III”),
•
$101.1 million from Carlyle Realty Partners VI, L.P. (“CRP VI”), and
•
$(100.3) million from Carlyle/Riverstone Global Energy and Power Fund III, L.P. (“Energy III”).
No other fund generated over 10% of performance fees in the periods presented above.
Under our arrangements with the historical owners and management team of AlpInvest, we generally do not retain any carried interest in respect of the historical investments and commitments to our fund vehicles that existed as of July 1, 2011 (including any options to increase any such commitments exercised after such date). We are entitled to 15% of the carried interest in respect of commitments from the historical owners of AlpInvest for the period between 2011 and 2020 and 40% of the carried interest in respect of all other commitments (including all future commitments from third parties). In certain instances, carried interest associated with the AlpInvest fund vehicles is subject to entity level income taxes in the Netherlands.
Realized carried interest may be clawed back or given back to the fund if the fund’s investment values decline below certain return hurdles, which vary from fund to fund. When the fair value of a fund’s investments remains constant or falls below certain return hurdles, previously recognized performance fees are reversed. In all cases, each investment fund is considered separately in evaluating carried interest and potential giveback obligations. For any given period, performance fee revenue on our statement of operations may include reversals of previously recognized performance fees due to a decrease in the value of a particular fund that results in a decrease of cumulative performance fees earned to date. Since fund return hurdles are cumulative, previously recognized performance fees also may be reversed in a period of appreciation that is lower than the particular fund’s hurdle rate. For the years ended December 31, 2017, 2016, and 2015, the reversals of performance fees were $74.2 million, $109.6 million, and $253.4 million, respectively. Additionally, unrealized performance fees reverse when performance fees are realized, and unrealized performance fees can be negative if the amount of realized performance fees exceed total performance fees generated in the period.
As of December 31, 2017, accrued performance fees and accrued giveback obligations were approximately
$3.7 billion
and
$66.8 million
, respectively. Each balance assumes a hypothetical liquidation of the funds’ investments at December 31, 2017 at their then current fair values. These assets and liabilities will continue to fluctuate in accordance with the fair values of the fund investments until they are realized. As of December 31, 2017, approximately $37.9 million of the accrued giveback obligation is the responsibility of various current and former senior Carlyle professionals and other limited partners of the Carlyle Holdings partnerships, and the net accrued giveback obligation attributable to Carlyle Holdings is $28.9 million. The Partnership uses “net accrued performance fees” to refer to the accrued performance fees net of accrued giveback obligations, accrued performance fee compensation, performance fee-related tax obligations, and accrued performance fees attributable to non-controlling interests and excludes any net accrued performance fees that have been realized but will be collected in subsequent periods. The net accrued performance fees as of December 31, 2017 are $1.7 billion.
In addition, realized performance fees may be reversed in future periods to the extent that such amounts become subject to a giveback obligation. If at December 31, 2017, all investments held by our carry funds were deemed worthless, the amount of realized and previously distributed performance fees subject to potential giveback would be approximately
$0.7 billion
, on an after-tax basis where applicable. See the related discussion of “Contingent Obligations (Giveback)” within “— Liquidity and Capital Resources.” Since Carlyle's inception, we have realized a total of approximately $205.5 million in aggregate giveback obligations. Approximately $37.0 million of the $205.5 million in aggregate realized giveback obligations was attributable to Carlyle Holdings. The funding for employee obligations and givebacks related to carry realized pre-IPO is primarily through a collection of employee receivables related to giveback obligations and from non-controlling interests for their portion of the obligation. The realization of giveback obligations for the Partnership's portion of such obligations reduces
98
Distributable Earnings in the period realized and negatively impacts earnings available for distributions to unitholders in the period realized. Further, each individual recipient of realized carried interest typically signs a guarantee agreement or partnership agreement that personally obligates such person to return his/her pro rata share of any amounts of realized carried interest previously distributed that are later clawed back. Accordingly, carried interest as performance fee compensation is subject to return to the Partnership in the event a giveback obligation is funded. Generally, the actual giveback liability, if any, does not become due until the end of a fund’s life.
Each investment fund is considered separately in evaluating carried interest and potential giveback obligations. As a result, performance fees within funds will continue to fluctuate primarily due to certain investments within each fund constituting a material portion of the carry in that fund. Additionally, the fair value of investments in our funds may have substantial fluctuations from period to period.
In addition, in our discussion of our non-GAAP results, we use the term “net performance fees” to refer to the performance fees from our funds net of the portion allocated to our investment professionals, if any, and certain tax expenses associated with carried interest attributable to certain partners and employees, which are reflected as performance fee related compensation expense. We use the term “realized net performance fees” to refer to realized performance fees from our funds, net of the portion allocated to our investment professionals, if any, and certain tax expenses associated with carried interest attributable to certain partners and employees, which are reflected as realized performance fee related compensation expense. See “— Non-GAAP Financial Measures” for the amount of realized and unrealized performance fees recognized each period. See “— Segment Analysis” for the realized and unrealized performance fees by segment and related discussion for each period.
Fair Value Measurement.
U.S. GAAP establishes a hierarchal disclosure framework which ranks the observability of market price inputs used in measuring financial instruments at fair value. The observability of inputs is impacted by a number of factors, including the type of financial instrument, the characteristics specific to the financial instrument and the state of the marketplace, including the existence and transparency of transactions between market participants. Financial instruments with readily available quoted prices, or for which fair value can be measured from quoted prices in active markets, will generally have a higher degree of market price observability and a lesser degree of judgment applied in determining fair value.
The table below summarizes the valuation of investments and other financial instruments included within our AUM, by segment and fair value hierarchy levels, as of
December 31, 2017
(amounts in millions):
|
|
As of December 31, 2017
|
||||||||||||||||||
|
|
Corporate
Private
Equity
|
Real Assets
|
Global Credit
|
Investment
Solutions
|
Total
|
||||||||||||||
|
Consolidated Results
|
|||||||||||||||||||
|
Level I
|
$
|
2,729
|
|
$
|
2,380
|
|
$
|
276
|
|
$
|
947
|
|
$
|
6,332
|
|
||||
|
Level II
|
125
|
|
1,201
|
|
340
|
|
—
|
|
1,666
|
|
|||||||||
|
Level III
|
39,783
|
|
22,795
|
|
25,749
|
|
29,210
|
|
117,537
|
|
|||||||||
|
Fair Value of Investments
|
42,637
|
|
26,376
|
|
26,365
|
|
30,157
|
|
125,535
|
|
|||||||||
|
Available Capital
|
29,921
|
|
16,512
|
|
6,959
|
|
16,134
|
|
69,526
|
|
|||||||||
|
Total AUM
|
$
|
72,558
|
|
$
|
42,888
|
|
$
|
33,324
|
|
$
|
46,291
|
|
$
|
195,061
|
|
||||
Investment Income, Interest, and Other Income.
Investment income, interest, and other income represent the unrealized and realized gains and losses on our principal investments, including our investments in Carlyle funds that are not consolidated, our equity method investments and other principal investments, as well as any interest and other income. Investment income (loss) also includes the related amortization of the basis difference between the carrying value of our investment and our share of the underlying net assets of the investee, as well as the compensation expense associated with compensatory arrangements provided by us to employees of our equity method investee, as it relates to our investments in NGP. Realized investment income (loss) is recorded when we redeem all or a portion of our investment or when we receive or are due cash income, such as dividends or distributions. A realized investment loss is also recorded when an investment is deemed to be worthless. Unrealized investment income (loss) results from changes in the fair value of the underlying investment, as well as the reversal of previously recognized unrealized gains (losses) at the time an investment is realized.
Interest and Other Income of Consolidated Funds.
Interest and other income of Consolidated Funds primarily represents the interest earned on CLO assets. The Consolidated Funds are not the same entities in all periods presented. The Consolidated Funds in future periods may change due to changes in fund terms, formation of new funds, and terminations of funds.
99
Revenue of a Real Estate VIE.
Revenue of a real estate VIE consists of revenue generated by Urbplan, which primarily is revenue earned for land development services using the completed contract method and investment income earned on Urbplan’s investments. Under the completed contract method of revenue recognition, revenue is not recognized until the period in which the land development services contract is completed, which can cause volatility from period to period based on which contracts are completed. Urbplan was deconsolidated from the Partnership's financial results during 2017 as a result of the Partnership disposing of its interests in Urbplan in a transaction in which a third party acquired operational control and all of the economic interests in Urbplan (see Note 15 to the consolidated financial statements).
Net Investment Gains of Consolidated Funds.
Net investment gains of Consolidated Funds measures the change in the difference in fair value between the assets and the liabilities of the Consolidated Funds. A gain (loss) indicates that the fair value of the assets of the Consolidated Funds appreciated more (less), or depreciated less (more), than the fair value of the liabilities of the Consolidated Funds. A gain or loss is not necessarily indicative of the investment performance of the Consolidated Funds and does not impact the management or incentive fees received by Carlyle for its management of the Consolidated Funds. The portion of the net investment gains (losses) of Consolidated Funds attributable to the limited partner investors is allocated to non-controlling interests. Therefore a gain or loss is not expected to have a material impact on the revenues or profitability of the Partnership. Moreover, although the assets of the Consolidated Funds are consolidated onto our balance sheet pursuant to U.S. GAAP, ultimately we do not have recourse to such assets and such liabilities are generally non-recourse to us. Therefore, a gain or loss from the Consolidated Funds generally does not impact the assets available to our equity holders.
Expenses
Compensation and Benefits.
Compensation includes salaries, bonuses, equity-based compensation, and performance payment arrangements. Bonuses are accrued over the service period to which they relate.
We recognize as compensation expense the portion of performance fees that are due to our employees, senior Carlyle professionals, and operating executives in a manner consistent with how we recognize the performance fee revenue. These amounts are accounted for as compensation expense in conjunction with the related performance fee revenue and, until paid, are recognized as a component of the accrued compensation and benefits liability. Compensation in respect of performance fees is paid when the related performance fees are realized, and not when such performance fees are accrued. The funds do not have a uniform allocation of performance fees to our employees, senior Carlyle professionals and operating executives. Therefore, for any given period, the ratio of performance fee compensation to performance fee revenue may vary based on the funds generating the performance fee revenue for that period and their particular allocation percentages.
In addition, we have implemented various equity-based compensation arrangements that require senior Carlyle professionals and other employees to vest ownership of a portion of their equity interests over a service period of up to 60 months, which under U.S. GAAP will result in compensation charges over current and future periods. Further, in order to recruit and retain existing and future senior Carlyle professionals and other employees, we have implemented additional equity-based compensation programs that have resulted in increases to our equity-based compensation expenses, which is a trend that may continue in the future if we increase our issuance of deferred restricted common units as employee compensation. For example, in February 2017 and 2018, we granted approximately 7.6 million and 13.7 million, respectively, deferred restricted common units across a significant number of our employees; these awards vest over a period of 12 to 60 months. Compensation charges associated with the equity-based compensation grants issued in our initial public offering in May 2012 or grants issued in acquisitions or strategic investments are excluded from our calculation of Economic Income. Compensation charges associated with all equity-based compensation grants are excluded from Fee Related Earnings and Distributable Earnings.
We may hire additional individuals and overall compensation levels may correspondingly increase, which could result in an increase in compensation and benefits expense. As a result of acquisitions, we have charges associated with contingent consideration taking the form of earn-outs and profit participation, some of which are reflected as compensation expense. A portion of our compensation expense relates to internal fundraising costs, and compensation will fluctuate based on increases or decreases in our fundraising activity. Amounts due to employees related to such fundraising will be expensed when earned even though the benefit of the new capital and related fees will be reflected in operations over the life of the related fund.
General, Administrative and Other Expenses.
General, administrative, and other expenses include occupancy and equipment expenses and other expenses, which consist principally of professional fees, including those related to our global regulatory compliance program, external costs of fundraising, travel and related expenses, communications and information services, depreciation and amortization (including intangible asset amortization and impairment) and foreign currency transactions. We expect that general, administrative and other expenses will vary due to infrequently occurring or unusual
100
items, such as impairment of intangible assets and expenses associated with litigation and contingencies. Also, in periods of significant fundraising, to the extent that we use third parties to assist in our fundraising efforts, our general, administrative and other expenses may increase accordingly. Additionally, we anticipate that general, administrative and other expenses will fluctuate from period to period due to the impact of foreign exchange transactions.
We also could incur additional expenses in the future related to our acquisitions including amortization of acquired intangibles, earn-outs to equity holders and fair value adjustments on contingent consideration issued, as well as related to our global compliance efforts. As discussed in Note 6 to the consolidated financial statements, we evaluate our intangible assets (including goodwill) for impairment and could record additional impairment losses in future periods.
Interest and Other Expenses of Consolidated Funds.
The interest and other expenses of Consolidated Funds consist primarily of interest expenses related primarily to our CLO loans, professional fees and other third-party expenses.
Interest and Other Expenses of a Real Estate VIE and Loss on Deconsolidation.
Interest and other expenses of a real estate VIE and loss on deconsolidation reflects the loss recognized in 2017 as a result of the Partnership disposing of its interests in Urbplan in a transaction in which a third party acquired operational control and all of the economic interests in Urbplan, which resulted in the deconsolidation of Urbplan from the Partnership's financial results (see Note 15 to the consolidated financial statements). This line item also includes expenses incurred by Urbplan prior to deconsolidation, consisting primarily of interest expense, general and administrative expenses, impairment charges, compensation and benefits, and costs associated with land development services. Also included in this caption is the change in our estimate of the fair value of Urbplan’s loans payable.
Income Taxes.
The Carlyle Holdings partnerships and their subsidiaries primarily operate as pass-through entities for U.S. income tax purposes and record a provision for state and local income taxes for certain entities based on applicable laws and a provision for foreign income taxes for certain foreign entities. In addition, Carlyle Holdings I GP Inc. is subject to U.S. income taxes on only a portion of our income or loss. Depending on the sources of our taxable income or loss, our income tax provision or benefit can vary significantly from period to period.
Income taxes for foreign entities are accounted for using the asset and liability method of accounting. Under this method, deferred tax assets and liabilities are recognized for the expected future tax consequences of differences between the carrying amounts of assets and liabilities and their respective tax basis, using currently enacted tax rates. The effect on deferred tax assets and liabilities of a change in tax rates is recognized in income in the period in which the change is enacted. For instance, in December 2017, new corporate federal income tax rates were enacted, which impacted the Partnership's deferred tax assets and liabilities. See Note 11 of the consolidated financial statements for more information on the newly enacted corporate federal income tax rates. Deferred tax assets are reduced by a valuation allowance when it is more likely than not that some or all of the deferred tax assets will not be realized.
In the normal course of business, we are subject to examination by federal and certain state, local and foreign tax regulators. As of December 31, 2017, our U.S. federal income tax returns for the years 2014 through 2016 are open under the normal three-year statute of limitations and therefore subject to examination. State and local tax returns are generally subject to audit from 2012 to 2016. Foreign tax returns are generally subject to audit from 2009 to 2016. Certain of our affiliates are currently under audit by federal, state and foreign tax authorities. Currently, the Internal Revenue Service is examining the tax returns of certain subsidiaries for the 2013, 2014 and 2015 years. We do not believe the outcome of any future audit will have a material impact on our consolidated financial statements.
Non-controlling Interests in Consolidated Entities.
Non-controlling interests in consolidated entities represent the component of equity in consolidated entities not held by us. These interests are adjusted for general partner allocations.
We record significant non-controlling interests in Carlyle Holdings relating to the ownership interests of the limited partners of the Carlyle Holdings partnerships. The Partnership, through wholly owned subsidiaries, is the sole general partner of Carlyle Holdings. Accordingly, the Partnership consolidates the financial position and results of operations of Carlyle Holdings into its financial statements, and the other ownership interests in Carlyle Holdings are reflected as a non-controlling interest in the Partnership’s financial statements.
Non-GAAP Financial Measures
Economic Income.
Economic income, or “EI,” is a key performance benchmark used in our industry. EI was formerly defined as “Economic Net Income.” There has been no change to the computation of this measure.
EI differs from income (loss) before provision for income taxes computed in accordance with U.S. GAAP in that it includes certain tax expenses
101
associated with performance fees, and does not include net income (loss) attributable to non-Carlyle interests in consolidated entities or charges (credits) related to Carlyle corporate actions and non-recurring items. Charges (credits) related to Carlyle corporate actions and non-recurring items include: charges associated with equity-based compensation that was issued in the initial public offering in May 2012 or is issued in acquisitions or strategic investments, changes in the tax receivable agreement liability, amortization and any impairment charges associated with acquired intangible assets, transaction costs associated with acquisitions, charges associated with earnouts and contingent consideration including gains and losses associated with the estimated fair value of contingent consideration issued in conjunction with acquisitions or strategic investments, gains and losses from the retirement of debt, charges associated with contract terminations and employee severance.
We believe the inclusion or exclusion of these items provides investors with a meaningful indication of our core operating performance. For segment reporting purposes, revenues and expenses, and, accordingly, segment net income, are presented on a basis that deconsolidates the Consolidated Funds. Total Segment EI equals the aggregate of EI for all segments. This measure supplements and should be considered in addition to and not in lieu of the results of operations discussed further under “Consolidated Results of Operations” prepared in accordance with U.S. GAAP.
Fee Related Earnings.
Fee Related Earnings, or “FRE,” is a component of EI and is used to assess the ability of the business to cover direct base compensation and operating expenses from total fee revenues. FRE differs from income (loss) before provision for income taxes computed in accordance with U.S. GAAP in that it adjusts for the items included in the calculation of EI and also adjusts EI to exclude net performance fees, investment income from investments in Carlyle funds, equity-based compensation, net interest (interest income less interest expense), and certain general, administrative and other expenses when the timing of any future payment is uncertain. As of December 31, 2017, the Partnership updated the definition of FRE to exclude net interest (interest income less interest expense) in our segment results. FRE for all prior periods presented has been recast to reflect the updated definition.
Distributable Earnings.
Distributable Earnings is FRE plus realized net performance fees, realized investment income, and net interest. Distributable Earnings is intended to show the amount of net realized earnings without the effects of consolidation of the Consolidated Funds. Distributable Earnings is derived from our segment reported results and is an additional measure to assess performance and determine amounts potentially available for distribution from Carlyle Holdings to its unitholders. Distributable Earnings is evaluated regularly by management in making resource deployment and compensation decisions and in assessing performance of our four segments. We also use Distributable Earnings in our budgeting, forecasting, and the overall management of our segments. We believe that reporting Distributable Earnings is helpful to understanding our business and that investors should review the same supplemental financial measure that management uses to analyze our segment performance.
Operating Metrics
We monitor certain operating metrics that are common to the alternative asset management industry.
Fee-earning Assets under Management
Fee-earning assets under management or Fee-earning AUM refers to the assets we manage or advise from which we derive recurring fund management fees. Our Fee-earning AUM is generally based on one of the following, once fees have been activated:
|
(a)
|
the amount of limited partner capital commitments, generally for carry funds where the original investment period has not expired, for AlpInvest carry funds during the commitment fee period and for Metropolitan carry funds during the weighted-average investment period of the underlying funds (see “Fee-earning AUM based on capital commitments” in the table below for the amount of this component at each period);
|
|
(b)
|
the remaining amount of limited partner invested capital at cost, generally for carry funds and certain co-investment vehicles where the original investment period has expired, Metropolitan carry funds after the expiration of the weighted-average investment period of the underlying funds, and one of our business development companies (see “Fee-earning AUM based on invested capital” in the table below for the amount of this component at each period);
|
|
(c)
|
the amount of aggregate fee-earning collateral balance at par of our collateralized loan obligations (“CLOs”), as defined in the fund indentures (typically exclusive of equities and defaulted positions) as of the quarterly cut-off date for each CLO (see “Fee-earning AUM based on collateral balances, at par” in the table below for the amount of this component at each period);
|
102
|
(d)
|
the external investor portion of the net asset value of our hedge fund and fund of hedge funds vehicles (pre redemptions and subscriptions), as well as certain carry funds (see “Fee-earning AUM based on net asset value” in the table below for the amount of this component at each period);
|
|
(e)
|
the gross assets (including assets acquired with leverage), excluding cash and cash equivalents, of one of our business development companies and certain carry funds (see “Fee-earning AUM based on lower of cost or fair value and other” in the table below for the amount of this component at each period); and
|
|
(f)
|
the lower of cost or fair value of invested capital, generally for AlpInvest carry funds where the commitment fee period has expired and certain carry funds where the investment period has expired, (see “Fee-earning AUM based on lower of cost or fair value and other” in the table below for the amount of this component at each period).
|
The table below details Fee-earning AUM by its respective components at each period.
|
|
As of December 31,
|
||||||||||
|
|
2017
|
2016
|
2015
|
||||||||
|
Consolidated Results
|
(Dollars in millions)
|
||||||||||
|
Components of Fee-earning AUM
|
|||||||||||
|
Fee-earning AUM based on capital commitments (1)
|
$
|
58,618
|
|
$
|
51,455
|
|
$
|
47,745
|
|
||
|
Fee-earning AUM based on invested capital (2)
|
24,263
|
|
25,976
|
|
33,823
|
|
|||||
|
Fee-earning AUM based on collateral balances, at par (3)
|
18,625
|
|
16,999
|
|
17,896
|
|
|||||
|
Fee-earning AUM based on net asset value (4)
|
1,776
|
|
977
|
|
9,634
|
|
|||||
|
Fee-earning AUM based on lower of cost or fair value and other (5)
|
21,313
|
|
19,587
|
|
21,896
|
|
|||||
|
Balance, End of Period (6)
|
$
|
124,595
|
|
$
|
114,994
|
|
$
|
130,994
|
|
||
|
(1)
|
Reflects limited partner capital commitments where the original investment period, weighted-average investment period, or commitment fee period has not expired.
|
|
(2)
|
Reflects limited partner invested capital at cost and includes amounts committed to or reserved for investments for certain Real Assets and Investment Solutions funds.
|
|
(3)
|
Represents the amount of aggregate Fee-earning collateral balances and principal balances, at par, for our CLOs/structured products.
|
|
(4)
|
Reflects the net asset value (pre-redemptions and subscriptions) of our hedge funds, mutual fund and fund of hedge funds vehicles, as well as certain other carry funds.
|
|
(5)
|
Includes funds with fees based on gross asset value.
|
|
(6)
|
Energy II, Energy III, Energy IV, Renew I, and Renew II (collectively, the “Legacy Energy Funds”), are managed with Riverstone Holdings LLC and its affiliates. Affiliates of both Carlyle and Riverstone act as investment advisers to each of the Legacy Energy Funds. With the exception of Energy IV and Renew II, where Carlyle has a minority representation on the funds’ management committees, management of each of the Legacy Energy Funds is vested in committees with equal representation by Carlyle and Riverstone, and the consent of representatives of both Carlyle and Riverstone is required for investment decisions. As of
December 31, 2017
, the Legacy Energy Funds had, in the aggregate, approximately
$5.2 billion
in AUM and
$3.8 billion
in Fee-earning AUM. We are no longer raising capital for the Legacy Energy Funds and expect these balances to continue to decrease over time as the funds wind down.
|
103
The table below provides the period to period rollforward of Fee-earning AUM.
|
|
Year Ended December 31,
|
||||||||||
|
|
2017
|
2016
|
2015
|
||||||||
|
Consolidated Results
|
(Dollars in millions)
|
||||||||||
|
Fee-earning AUM Rollforward
|
|||||||||||
|
Balance, Beginning of Period
|
$
|
114,994
|
|
$
|
130,994
|
|
$
|
135,580
|
|
||
|
Acquisitions/(Divestments) (1)
|
—
|
|
(4,356
|
)
|
—
|
|
|||||
|
Inflows, including Commitments (2)
|
18,545
|
|
11,799
|
|
22,950
|
|
|||||
|
Outflows, including Distributions (3)
|
(14,658
|
)
|
(17,138
|
)
|
(18,940
|
)
|
|||||
|
Subscriptions, net of Redemptions (4)
|
—
|
|
(4,930
|
)
|
(4,528
|
)
|
|||||
|
Changes in CLO collateral balances (5)
|
843
|
|
(714
|
)
|
850
|
|
|||||
|
Market Appreciation/(Depreciation) (6)
|
(90
|
)
|
(73
|
)
|
(1,147
|
)
|
|||||
|
Foreign Exchange and other (7)
|
4,961
|
|
(588
|
)
|
(3,771
|
)
|
|||||
|
Balance, End of Period
|
$
|
124,595
|
|
$
|
114,994
|
|
$
|
130,994
|
|
||
|
(1)
|
Divestment activity in 2016 represents ESG assets which were transferred to the ESG founders in a transaction that closed in October 2016 and Claren Road assets which were transferred to the Claren Road founders in a transaction that closed in January 2017.
|
|
(2)
|
Inflows represent limited partner capital raised and capital invested by our carry funds and the NGP management fee funds outside the investment period, weighted-average investment period or commitment fee period. Inflows do not include funds raised of $22.1 billion, which are not yet earning fees.
|
|
(3)
|
Outflows represent limited partner distributions from our carry funds and NGP management fee funds, changes in basis for our carry funds where the investment period, weighted-average investment period or commitment fee period has expired, and reductions for funds that are no longer calling for fees.
|
|
(4)
|
Represents the net result of subscriptions to and redemptions from our hedge funds, mutual fund and fund of hedge funds vehicles.
|
|
(5)
|
Represents the change in the aggregate Fee-earning collateral balances at par of our CLOs/structured products, as of the quarterly cut-off dates.
|
|
(6)
|
Market Appreciation/(Depreciation) represents realized and unrealized gains (losses) on portfolio investments in our carry funds based on the lower of cost or fair value and net asset value.
|
|
(7)
|
Includes activity of funds with fees based on gross asset value. Represents the impact of foreign exchange rate fluctuations on the translation of our non-U.S. dollar denominated funds. Activity during the period is translated at the average rate for the period. Ending balances are translated at the spot rate as of the period end.
|
Refer to “— Segment Analysis” for a detailed discussion by segment of the activity affecting Fee-earning AUM for each of the periods presented by segment.
Assets under Management
“Assets under management” or “AUM” refers to the assets we manage or advise. Our AUM equals the sum of the following:
(a) the aggregate fair value of our carry funds and related co-investment vehicles, NGP management fee funds and separately managed accounts, plus the capital that Carlyle is entitled to call from investors in those funds and vehicles (including Carlyle commitments to those funds and vehicles and those of senior Carlyle professionals and employees) pursuant to the terms of their capital commitments to those funds and vehicles;
|
(b)
|
the amount of aggregate collateral balance and principal cash at par or aggregate principal amount of the notes of our CLOs and other structured products (inclusive of all positions);
|
|
(c)
|
the net asset value (pre-redemptions and subscriptions) of our long/short credit, emerging markets, multi-product macroeconomic, fund of hedge funds vehicles, mutual fund and other hedge funds; and
|
|
(d)
|
the gross assets (including assets acquired with leverage) of our business development companies, plus the capital that Carlyle is entitles to call from investors in those vehicles pursuant to the terms of their capital commitments to those vehicles.
|
104
We include in our calculation of AUM and Fee-earning AUM certain energy and renewable resources funds that we jointly advise with Riverstone Holdings L.L.C. (“Riverstone”) and certain NGP management fee funds and carry funds that are advised by NGP.
For most of our carry funds, total AUM includes the fair value of the capital invested, whereas Fee-earning AUM includes the amount of capital commitments or the remaining amount of invested capital, depending on whether the original investment period for the fund has expired. As such, Fee-earning AUM may be greater than total AUM when the aggregate fair value of the remaining investments is less than the cost of those investments.
Our calculations of AUM and Fee-earning AUM may differ from the calculations of other alternative asset managers. As a result, these measures may not be comparable to similar measures presented by other alternative asset managers. In addition, our calculation of AUM (but not Fee-earning AUM) includes uncalled commitments to, and the fair value of invested capital in, our investment funds from Carlyle and our personnel, regardless of whether such commitments or invested capital are subject to management or performance fees. Our calculations of AUM or Fee-earning AUM are not based on any definition of AUM or Fee-earning AUM that is set forth in the agreements governing the investment funds that we manage or advise.
We generally use Fee-earning AUM as a metric to measure changes in the assets from which we earn recurring management fees. Total AUM tends to be a better measure of our investment and fundraising performance as it reflects investments at fair value plus available capital.
Available Capital
"Available Capital" refers to the amount of capital commitments available to be called for investments, which may be reduced for equity invested that is funded via a fund credit facility and expected to be called from investors at a later date, plus any additional assets/liabilities at the fund level other than active investments. Amounts previously called may be added back to available capital following certain distributions. “Expired Available Capital” occurs when a fund has passed the investment and follow-on periods and can no longer invest capital into new or existing deals. Any remaining Available Capital, typically a result of either recycled distributions or specific reserves established for the follow-on period that are not drawn, can only be called for fees and expenses and is therefore removed from the Total AUM calculation.
The table below provides the period to period rollforward of Total AUM.
|
|
Twelve Months Ended December 31,
|
||||||||||
|
|
2017
|
2016
|
2015
|
||||||||
|
|
(Dollars in millions)
|
||||||||||
|
Consolidated Results
|
|||||||||||
|
Total AUM Rollforward
|
|||||||||||
|
Balance, Beginning of Period
|
$
|
157,607
|
|
$
|
182,595
|
|
$
|
194,473
|
|
||
|
Acquisitions/(Divestments) (1)
|
—
|
|
(4,707
|
)
|
—
|
|
|||||
|
New Commitments (2)
|
42,846
|
|
13,216
|
|
24,064
|
|
|||||
|
Outflows (3)
|
(27,409
|
)
|
(37,692
|
)
|
(39,139
|
)
|
|||||
|
Market Appreciation/(Depreciation) (4)
|
17,104
|
|
10,148
|
|
9,772
|
|
|||||
|
Foreign Exchange Gain/(Loss) (5)
|
6,493
|
|
(1,195
|
)
|
(6,121
|
)
|
|||||
|
Other (6)
|
(1,580
|
)
|
(4,758
|
)
|
(454
|
)
|
|||||
|
Balance, End of Period
|
$
|
195,061
|
|
$
|
157,607
|
|
$
|
182,595
|
|
||
|
(1)
|
Divestment activity represents ESG assets which were transferred to the ESG founders in a transaction that closed in October 2016 and Claren Road assets which were transferred to the Claren Road founders in a transaction that closed in January 2017.
|
|
(2)
|
New Commitments reflects the impact of gross fundraising during the period. For funds or vehicles denominated in foreign currencies, this reflects translation at the average quarterly rate, while the separately reported Fundraising metric is translated at the spot rate for each individual closing.
|
|
(3)
|
Outflows includes distributions in our carry funds and related co-investment vehicles, NGP management fee funds and separately managed accounts, as well as runoff of CLO collateral balances and redemptions in our hedge funds and fund of hedge funds vehicles.
|
105
|
(4)
|
Market Appreciation/(Depreciation) generally represents realized and unrealized gains (losses) on portfolio investments in our carry funds and related co-investment vehicles, NGP management fee funds, separately managed accounts, hedge funds and fund of hedge funds vehicles. Appreciation for 2017 was driven by 29% appreciation ($2.6 billion) in the public portfolio and 26% appreciation ($10.3 billion) in the private portfolio of our Corporate Private Equity, Real Assets, and Global Credit carry funds, in addition to $3.6 billion of appreciation in our Investment Solutions carry funds.
|
|
(5)
|
Represents the impact of foreign exchange rate fluctuations on the translation of our non-U.S. dollar denominated funds. Activity during the period is translated at the average rate for the period. Ending balances are translated at the spot rate as of the period end.
|
|
(6)
|
Includes expiring available capital, the impact of capital calls for fees and expenses, change in gross asset value for our business development companies and other changes in AUM.
|
Please refer to “— Segment Analysis” for a detailed discussion by segment of the activity affecting Total AUM for each of the periods presented.
The table below presents the change in appreciation on portfolio investments of our carry funds. Please refer to “— Segment Analysis” for a detailed discussion by segment of the activity affecting Total AUM for each of the periods presented.
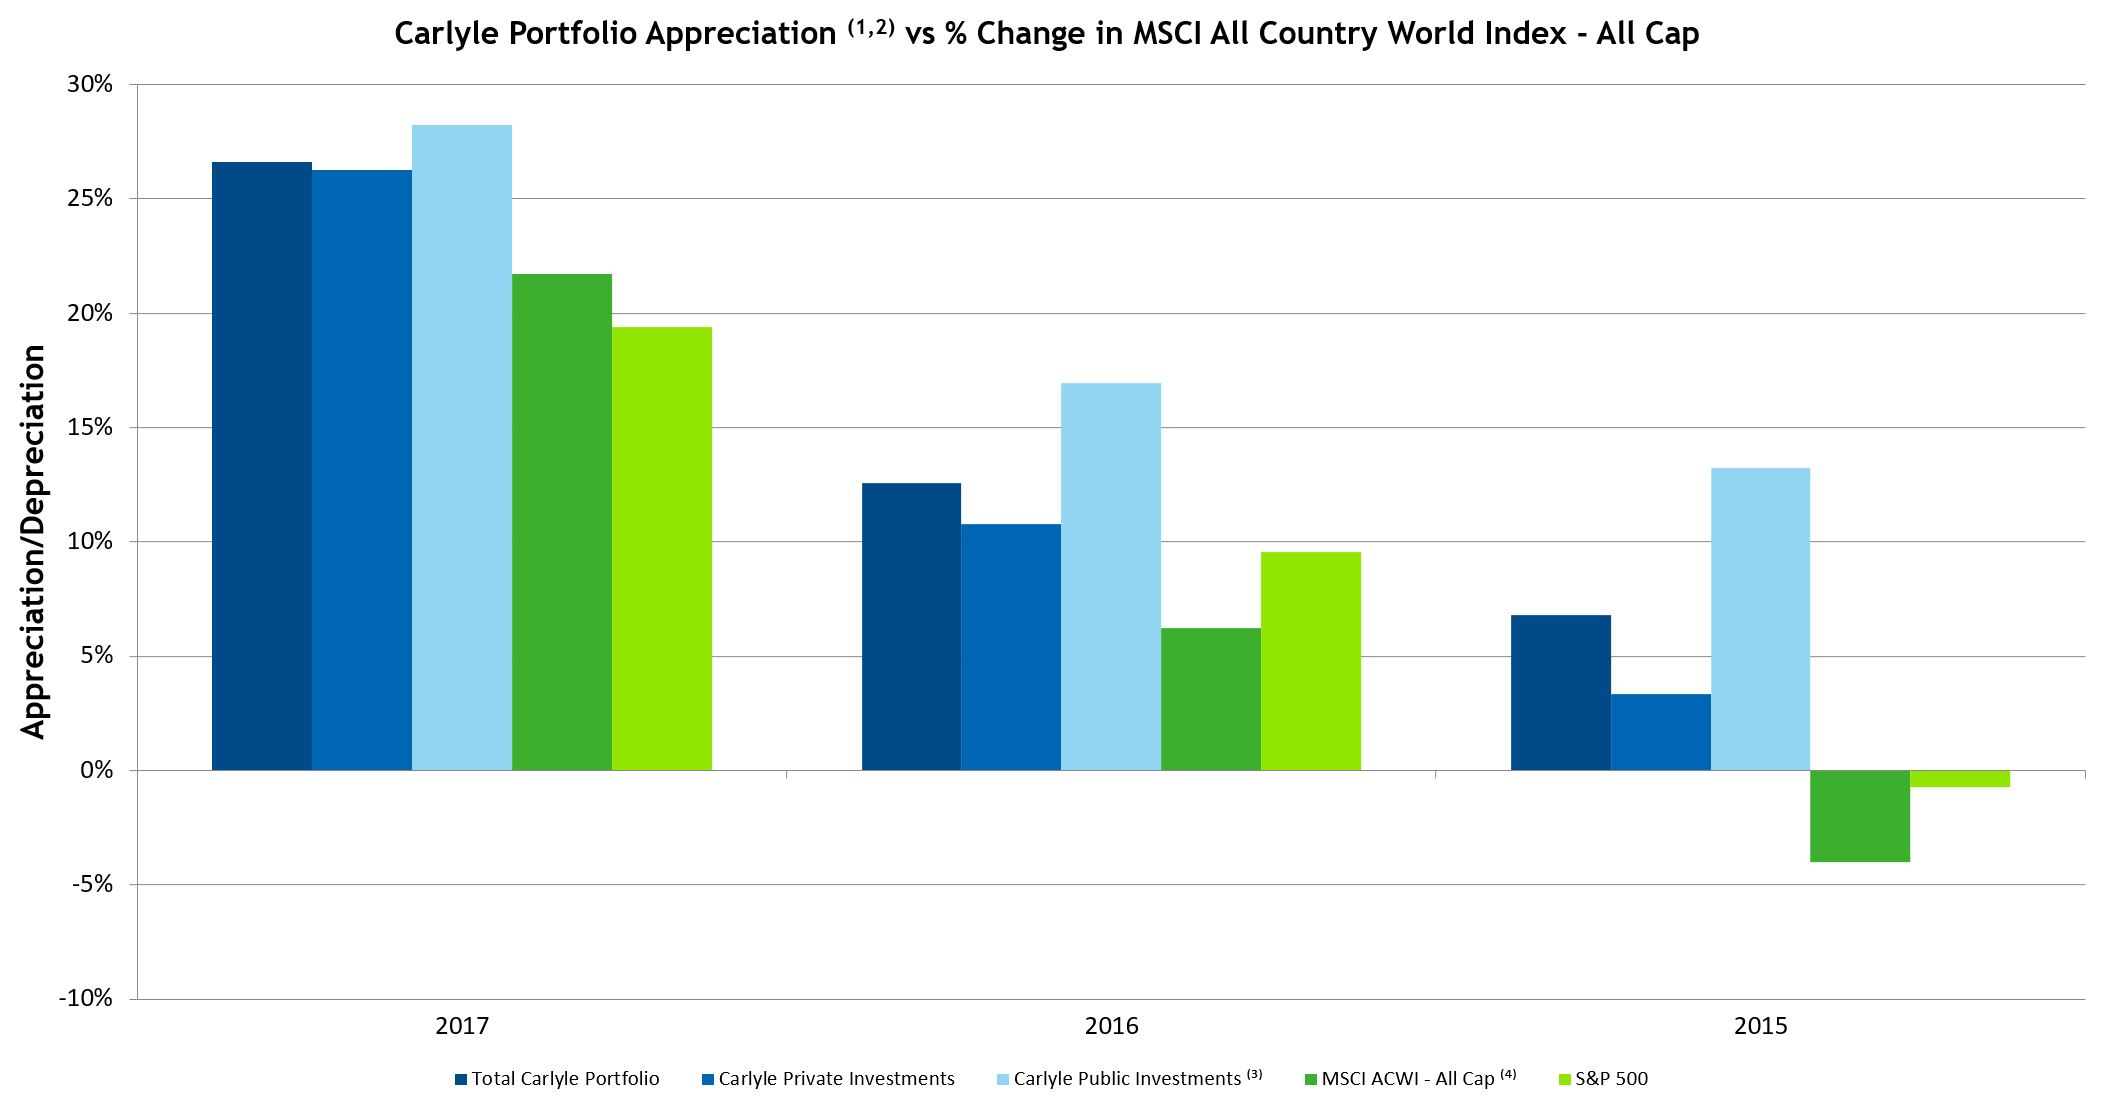
|
(1)
|
Corporate Private Equity, Real Assets, and Global Credit carry funds only, excluding external co-investment.
|
|
(2)
|
For Carlyle returns, “Appreciation/Depreciation” represents realized and unrealized gain / loss for the period on a total return basis before fees and expenses. The percentage of return is calculated as the sum of ending remaining investment fair market value ("FMV") and net investment outflow (sales proceeds less net purchases) less beginning remaining investment FMV divided by beginning remaining investment FMV.
|
|
(3)
|
Public portfolio includes initial public offerings ("IPO") that occurred in the quarter. Investments may be reported as private in quarters prior to the IPO quarter.
|
|
(4)
|
The MSCI ACWI - All Cap Index represents the performance of the MSCI All Country World Index across all market capitalization sizes of the global equity market. There are significant differences between the types of securities and assets typically acquired by our carry funds and the investments covered by the MSCI All Country World Index. Specifically, our carry funds may make investments in securities and other assets that have a greater degree of risk and volatility, and less liquidity, than those securities included in the MSCI All Country World Index. Moreover, investors in the securities included in the MSCI All Country World Index may not be subject to the management fees, carried interest or expenses to which investors in our carry funds are typically subject. Comparisons between the our carry fund appreciation and the MSCI All Country World Index are included for informational purposes only.
|
106
Consolidation of Certain Carlyle Funds
The Partnership consolidates all entities that it controls either through a majority voting interest or as the primary beneficiary of variable interest entities. On January 1, 2016, the Partnership adopted ASU 2015-2,
Consolidation (Topic 810): Amendments to the Consolidation Analysis,
which provides a revised consolidation model for all reporting entities to use in evaluating whether to consolidate certain types of legal entities. As a result, the Partnership deconsolidated the majority of the Partnership's consolidated funds on January 1, 2016. The entities we consolidate are referred to collectively as the Consolidated Funds in our consolidated financial statements. For further information on our consolidation policy, see Note 2 to the consolidated financial statements included in this Annual Report on Form 10-K.
As of December 31, 2017, our Consolidated Funds represent approximately
2%
of our AUM; 2% of our fund management fees; and less than 1% of our performance fees for the year ended December 31, 2017.
We are not required under the revised consolidation guidance to consolidate in our financial statements most of the investment funds we advise. However, we consolidate certain CLOs that we advise. As of December 31, 2017, our consolidated CLOs held approximately $4.9 billion of total assets and comprised substantially all of the assets and loans payable of the Consolidated Funds. The assets and liabilities of the Consolidated Funds are generally held within separate legal entities and, as a result, the liabilities of the Consolidated Funds are non-recourse to us. For further information on consolidation of certain funds, see Note 2 to the consolidated financial statements included in this Annual Report on Form 10-K.
Generally, the consolidation of the Consolidated Funds has a gross-up effect on our assets, liabilities and cash flows but has no net effect on the net income attributable to the Partnership and partners’ capital. The majority of the net economic ownership interests of the Consolidated Funds are reflected as non-controlling interests in consolidated entities in the consolidated financial statements. For further information, see Note 2 to the consolidated financial statements included in this Annual Report on Form 10-K.
Because only a small portion of our funds are consolidated, the performance of the Consolidated Funds is not necessarily consistent with or representative of the combined performance trends of all of our funds.
Consolidated Results of Operations
The following table and discussion sets forth information regarding our consolidated results of operations for the years ended December 31, 2017, 2016 and 2015. Our consolidated financial statements have been prepared on substantially the same basis for all historical periods presented; however, the consolidated funds are not the same entities in all periods shown due to changes in U.S. GAAP, changes in fund terms and the creation and termination of funds. As further described below, the consolidation of these funds primarily had the impact of increasing interest and other income of Consolidated Funds, interest and other expenses of Consolidated Funds, and net investment gains of Consolidated Funds in the year that the fund is initially consolidated. The consolidation of these funds had no effect on net income attributable to the Partnership for the periods presented.
107
|
|
Year Ended December 31,
|
||||||||||
|
|
2017
|
2016
|
2015
|
||||||||
|
|
(Dollars in millions, except unit and per unit data)
|
||||||||||
|
Revenues
|
|||||||||||
|
Fund management fees
|
$
|
1,026.9
|
|
$
|
1,076.1
|
|
$
|
1,085.2
|
|
||
|
Performance fees
|
|||||||||||
|
Realized
|
1,097.3
|
|
1,129.5
|
|
1,441.9
|
|
|||||
|
Unrealized
|
996.6
|
|
(377.7
|
)
|
(617.0
|
)
|
|||||
|
Total performance fees
|
2,093.9
|
|
751.8
|
|
824.9
|
|
|||||
|
Investment income (loss)
|
|||||||||||
|
Realized
|
70.4
|
|
112.9
|
|
32.9
|
|
|||||
|
Unrealized
|
161.6
|
|
47.6
|
|
(17.7
|
)
|
|||||
|
Total investment income
|
232.0
|
|
160.5
|
|
15.2
|
|
|||||
|
Interest and other income
|
36.7
|
|
23.9
|
|
18.6
|
|
|||||
|
Interest and other income of Consolidated Funds
|
177.7
|
|
166.9
|
|
975.5
|
|
|||||
|
Revenue of a real estate VIE
|
109.0
|
|
95.1
|
|
86.8
|
|
|||||
|
Total revenues
|
3,676.2
|
|
2,274.3
|
|
3,006.2
|
|
|||||
|
Expenses
|
|||||||||||
|
Compensation and benefits
|
|||||||||||
|
Base compensation
|
652.7
|
|
647.1
|
|
632.2
|
|
|||||
|
Equity-based compensation
|
320.3
|
|
334.6
|
|
378.0
|
|
|||||
|
Performance fee related
|
|||||||||||
|
Realized
|
520.7
|
|
580.5
|
|
650.5
|
|
|||||
|
Unrealized
|
467.6
|
|
(227.4
|
)
|
(139.6
|
)
|
|||||
|
Total compensation and benefits
|
1,961.3
|
|
1,334.8
|
|
1,521.1
|
|
|||||
|
General, administrative, and other expenses
|
276.8
|
|
521.1
|
|
712.8
|
|
|||||
|
Interest
|
65.5
|
|
61.3
|
|
58.0
|
|
|||||
|
Interest and other expenses of Consolidated Funds
|
197.6
|
|
128.5
|
|
1,039.3
|
|
|||||
|
Interest and other expenses of a real estate VIE and loss on deconsolidation
|
202.5
|
|
207.6
|
|
144.6
|
|
|||||
|
Other non-operating income
|
(71.4
|
)
|
(11.2
|
)
|
(7.4
|
)
|
|||||
|
Total expenses
|
2,632.3
|
|
2,242.1
|
|
3,468.4
|
|
|||||
|
Other income
|
|||||||||||
|
Net investment gains of Consolidated Funds
|
88.4
|
|
13.1
|
|
864.4
|
|
|||||
|
Income before provision for income taxes
|
1,132.3
|
|
45.3
|
|
402.2
|
|
|||||
|
Provision for income taxes
|
124.9
|
|
30.0
|
|
2.1
|
|
|||||
|
Net income
|
1,007.4
|
|
15.3
|
|
400.1
|
|
|||||
|
Net income attributable to non-controlling interests in consolidated entities
|
72.5
|
|
41.0
|
|
537.9
|
|
|||||
|
Net income (loss) attributable to Carlyle Holdings
|
934.9
|
|
(25.7
|
)
|
(137.8
|
)
|
|||||
|
Net income (loss) attributable to non-controlling interests in Carlyle Holdings
|
690.8
|
|
(32.1
|
)
|
(119.4
|
)
|
|||||
|
Net income (loss) attributable to The Carlyle Group L.P.
|
244.1
|
|
6.4
|
|
(18.4
|
)
|
|||||
|
Net income attributable to Series A Preferred Unitholders
|
6.0
|
|
—
|
|
—
|
|
|||||
|
Net income (loss) attributable to The Carlyle Group L.P. common unitholders
|
$
|
238.1
|
|
$
|
6.4
|
|
$
|
(18.4
|
)
|
||
|
Net income (loss) attributable to The Carlyle Group L.P. per common unit
|
|||||||||||
|
Basic
|
$
|
2.58
|
|
$
|
0.08
|
|
$
|
(0.24
|
)
|
||
|
Diluted
|
$
|
2.38
|
|
$
|
(0.08
|
)
|
$
|
(0.30
|
)
|
||
|
Weighted-average common units
|
|||||||||||
|
Basic
|
92,136,959
|
|
82,714,178
|
|
74,523,935
|
|
|||||
|
Diluted
|
100,082,548
|
|
308,522,990
|
|
298,739,382
|
|
|||||
108
Year Ended
December 31, 2017
Compared to Year Ended
December 31, 2016
and Year Ended
December 31, 2016
Compared to Year Ended
December 31, 2015
.
Revenues
Total revenues
increased
$
1,401.9 million
, or
62%
, for the year ended
December 31, 2017
as compared to
2016
and decreased $731.9 million, or 24%, for the year ended
December 31, 2016
as compared to
2015
. The following table provides the components of the changes in total revenues for the years ended
December 31, 2017 and 2016
:
|
|
Year Ended December 31,
|
|||||
|
|
2017
|
2016
|
||||
|
|
(Dollars in Millions)
|
|||||
|
Total Revenues, prior year
|
$
|
2,274.3
|
|
$
|
3,006.2
|
|
|
Increases (decreases):
|
||||||
|
Decrease in fund management fees
|
(49.2
|
)
|
(9.1
|
)
|
||
|
Increase (decrease) in performance fees
|
1,342.1
|
|
(73.1
|
)
|
||
|
Increase in investment income
|
71.5
|
|
145.3
|
|
||
|
Increase (decrease) in interest and other income of
Consolidated Funds |
10.8
|
|
(808.6
|
)
|
||
|
Increase in revenue of a real estate VIE
|
13.9
|
|
8.3
|
|
||
|
Increase in interest and other income
|
12.8
|
|
5.3
|
|
||
|
Total increase (decrease)
|
1,401.9
|
|
(731.9
|
)
|
||
|
Total Revenues, current year
|
$
|
3,676.2
|
|
$
|
2,274.3
|
|
Fund Management Fees.
Fund management fees
decreased
$
49.2 million
, or
5%
, for the year ended
December 31, 2017
as compared to
2016
, and decreased $9.1 million, or 1%, for the year ended
December 31, 2016
as compared to
2015
, primarily due to the following:
|
|
Year Ended December 31,
|
|||||
|
|
2017
|
2016
|
||||
|
|
(Dollars in Millions)
|
|||||
|
Management fees from funds that were deconsolidated as a result of
adoption of ASU 2015-2 on January 1, 2016 (See Note 2 to the consolidated financial statements) |
$
|
—
|
|
$
|
139.7
|
|
|
Higher management fees from the commencement of the
investment period for certain newly raised funds |
99.0
|
|
112.4
|
|
||
|
Lower management fees resulting from the change in basis for
earning management fees from commitments to invested capital for certain funds and from distributions from funds whose management fees are based on invested capital |
(63.0
|
)
|
(117.8
|
)
|
||
|
Decrease in catch-up management fees from subsequent closes of funds
that are in the fundraising period |
(6.6
|
)
|
(63.7
|
)
|
||
|
Lower management fees from lower assets under management in
our former hedge funds |
(66.4
|
)
|
(88.9
|
)
|
||
|
(Lower) higher transaction and portfolio advisory fees
|
(4.2
|
)
|
22.6
|
|
||
|
All other changes
|
(8.0
|
)
|
(13.4
|
)
|
||
|
Total decrease in fund management fees
|
$
|
(49.2
|
)
|
$
|
(9.1
|
)
|
Fund management fees include transaction and portfolio advisory fees, net of rebate offsets, of $
43.6 million
, $47.8 million, and $25.2 million for
the years ended December 31, 2017, 2016 and 2015
, respectively. The decrease in transaction and portfolio advisory fees for the year ended
December 31, 2017
as compared to
2016
and the increase for the year ended
December 31, 2016
as compared to
2015
resulted primarily from a significant transaction related to one of our U.S. buyout funds in
2016
.
109
Performance Fees.
Performance fees
increased
$
1,342.1 million
for the year ended
December 31, 2017
compared to
2016
and decreased $73.1 million for the year ended
December 31, 2016
as compared to
2015
. Performance fees by segment for
the years ended December 31, 2017, 2016 and 2015
comprised the following:
|
|
Year Ended December 31,
|
||||||||
|
|
2017
|
2016
|
2015
|
||||||
|
|
(Dollars in Millions)
|
||||||||
|
Corporate Private Equity
|
$
|
1,629.6
|
|
$
|
289.6
|
|
$
|
698.2
|
|
|
Real Assets
|
265.2
|
|
321.1
|
|
49.3
|
|
|||
|
Global Credit
|
56.6
|
|
37.4
|
|
(41.0
|
)
|
|||
|
Investment Solutions
|
142.5
|
|
103.7
|
|
118.4
|
|
|||
|
Total performance fees
|
$
|
2,093.9
|
|
$
|
751.8
|
|
$
|
824.9
|
|
|
|
|
|
|
||||||
|
Total carry fund appreciation
|
20%
|
12%
|
12%
|
||||||
Approximately $1,273.2 million of our performance fees for the year ended
December 31, 2017
were related to CP VI, CAP IV and CP V, while approximately $214.2 million of our performance fees for the year ended
December 31, 2016
were related to CP V and CRP VII, and approximately $422.1 million of our performance fees for the year ended
December 31, 2015
were related to CEP III, CAP III, CRP VI, and Energy III.
Expectations for global economic growth remained strong through the fourth quarter of 2017. Further, our proprietary portfolio of industrial and manufacturing related indicators remained steady at or near six-year highs during the fourth quarter of 2017. As inflation continues to fall short of central bank targets, stronger real global growth, relatively low longer-term interest rates, and the passage of tax reform pushed global equity markets to record highs in 2017 and early 2018. The MSCI World Index advanced 20% in 2017 and 5% in the fourth quarter alone, while the S&P 500 rose 19% over the calendar year and 6% in the fourth quarter of 2017. Underlying earnings growth at the companies comprising the S&P 500 has supported the upward movement of the markets. Further, in December 2017, the President signed the Tax Cuts and Jobs Act. This bill is a pro-growth, pro-business package designed to stimulate growth in the economy. Although for the majority of our current U.S. portfolio companies, we expect the benefit of a lower corporate tax rate will outweigh any limitations on interest expense deductibility, we will continue to evaluate the provisions of the Act for any further potential impact. Most of our U.S. portfolio companies have reasonable capital structures, are growing earnings and benefit from low interest rates. We anticipate this bill generally should be a net positive for our carry fund portfolio. During 2017, our overall carry fund portfolio appreciated 20%. Our Corporate Private Equity funds appreciated by 32%, our Real Asset funds appreciated by 19%, our Global Credit funds appreciated by 11% and our dollar denominated appreciation in Investment Solutions was 10% for 2017. With market valuation levels at all-time highs, increasing volatility and the potential for upward movement in interest rates, it will be difficult for the public markets to generate the same level of appreciation in 2018 as observed in 2017 and, accordingly, it will be difficult for our portfolio to do the same as well.
For the year ended
December 31, 2016
as compared to the year ended
December 31, 2015
, significant events in the global political landscape, including the results of the United States Presidential election, the vote on the Brexit referendum in the United Kingdom and the populist movement more broadly, introduced macroeconomic and political uncertainty for the United States and the global economy. However, since the United States Presidential election in early November 2016 until early 2017, global stocks rose more than 7%, on average, alongside an approximate 70 basis point increase in 5- and 10-year Treasury yields. In addition to increasing uncertainty, the general rebound in commodities prices during 2016 had far-reaching effects as the rebound caused inflationary pressures to re-emerge across the global economy. While this rebound in commodities prices, including those in oil and industrial metals, generally has benefited our energy and other commodities-related investments, both the actual increase in inflation and the perception and expectation of continuing increased inflation led to a relatively sizable increase in U.S. Treasury yields in the second half of 2016. The U.S. Federal Reserve raised its target for short-term interest rates by 25 basis points in December 2016, which followed a similar rate hike in December 2015. Rising rates also put upward pressure on property yields (cap rates), which depressed the market value of some categories of real estate in the latter part of 2016.
In addition, performance fees from consolidated funds increased $2.2 million for the year ended
December 31, 2017
as compared to
2016
, and performance fees from consolidated funds decreased $33.2 million for the year ended
December 31, 2016
as compared to
2015
. These fees eliminate upon consolidation.
110
Investment Income.
Investment income
increased
$
71.5 million
for the year ended
December 31, 2017
as compared to
2016
, and increased $145.3 million for the year ended
December 31, 2016
as compared to
2015
, primarily due to the following:
|
|
Year Ended December 31,
|
|||||
|
|
2017
|
2016
|
||||
|
|
(Dollars in Millions)
|
|||||
|
Increase in investment income from NGP, which includes performance fees
from the investments in NGP |
$
|
103.1
|
|
$
|
113.0
|
|
|
Investment loss related to NGP contingent consideration
(See Note 5 to the consolidated financial statements) |
(37.6
|
)
|
(9.6
|
)
|
||
|
Increase in investment income from our buyout and growth funds
|
10.8
|
|
32.5
|
|
||
|
Decrease (increase) in losses on foreign currency hedges
|
4.6
|
|
(6.5
|
)
|
||
|
(Decrease) increase in investment income from our real assets funds, excluding NGP
|
(14.9
|
)
|
10.7
|
|
||
|
Decrease (increase) in investment loss from our distressed debt funds, former
hedge funds, and energy mezzanine funds |
4.0
|
|
(1.6
|
)
|
||
|
(Decrease) increase in investment income from our CLOs
|
(6.7
|
)
|
10.4
|
|
||
|
All other changes
|
8.2
|
|
(3.6
|
)
|
||
|
Total increase in investment income
|
$
|
71.5
|
|
$
|
145.3
|
|
Interest and Other Income of Consolidated Funds.
Our CLOs generate interest income primarily from investments in bonds and loans inclusive of amortization of discounts and generate other income from consent and amendment fees. Substantially all interest and other income of the CLOs and other consolidated funds together with interest expense of our CLOs and net investment gains of Consolidated Funds is attributable to the related funds’ limited partners or CLO investors and therefore is allocated to non-controlling interests. Accordingly, such amounts have no material impact on net income attributable to the Partnership.
Interest and other income of consolidated funds
increased
$
10.8 million
for the year ended
December 31, 2017
as compared to
2016
, and decreased $808.6 million for the year ended
December 31, 2016
as compared to
2015
. The following table provides explanations of the changes in interest and other income of consolidated funds for the years ended
December 31, 2017 and 2016
:
|
|
Year Ended December 31,
|
|||||
|
|
2017
|
2016
|
||||
|
|
(Dollars in Millions)
|
|||||
|
Increase (decrease) in interest and other income from CLOs
|
$
|
28.1
|
|
$
|
(636.2
|
)
|
|
Decrease in interest and dividend income from consolidated
AlpInvest funds and vehicles |
—
|
|
(69.5
|
)
|
||
|
Decrease in interest and dividend income from consolidated
hedge funds |
—
|
|
(120.3
|
)
|
||
|
(Decrease) increase in other income from other consolidated
funds |
(17.3
|
)
|
17.4
|
|
||
|
Total increase (decrease) in interest and other income of
Consolidated Funds |
$
|
10.8
|
|
$
|
(808.6
|
)
|
Revenue of a Real Estate VIE.
Revenue of a real estate VIE was $
109.0 million
for the year ended
December 31, 2017
as compared to $95.1 million in
2016
and $86.8 million in
2015
. The increase in revenue of the real estate VIE for the year ended
December 31, 2017
as compared to
2016
and
2016
as compared to
2015
is primarily due to an increase in the number of land development projects completed in 2017, prior to deconsolidation, and 2016, respectively, as compared to 2016 and 2015, respectively. See Note 15 for more information on the deconsolidation of the real estate VIE.
111
Expenses
Total expenses
increased
$
390.2 million
for the year ended
December 31, 2017
as compared to
2016
, and decreased $1,226.3 million for the year ended
December 31, 2016
as compared to
2015
. The following table provides the components of the changes in total expenses for the year ended
December 31, 2017 and 2016
:
|
|
Year Ended December 31,
|
|||||
|
|
2017
|
2016
|
||||
|
|
(Dollars in Millions)
|
|||||
|
Total Expenses, prior year
|
$
|
2,242.1
|
|
$
|
3,468.4
|
|
|
Increases (Decreases):
|
||||||
|
Increase (decrease) in total compensation and benefits
|
626.5
|
|
(186.3
|
)
|
||
|
Decrease in general, administrative and other expenses
|
(244.3
|
)
|
(191.7
|
)
|
||
|
Increase (decrease) in interest and other expenses of Consolidated Funds
|
69.1
|
|
(910.8
|
)
|
||
|
(Decrease) increase in interest and other expenses of a real estate VIE and
loss on deconsolidation |
(5.1
|
)
|
63.0
|
|
||
|
Increase in other non-operating income
|
(60.2
|
)
|
(3.8
|
)
|
||
|
All other changes
|
4.2
|
|
3.3
|
|
||
|
Total increase (decrease)
|
390.2
|
|
(1,226.3
|
)
|
||
|
Total Expenses, current year
|
$
|
2,632.3
|
|
$
|
2,242.1
|
|
Total Compensation and Benefits.
Total compensation and benefits
increased
$
626.5 million
for the year ended
December 31, 2017
as compared to
2016
, and decreased $186.3 million for the year ended
December 31, 2016
as compared to
2015
, due to the following:
|
Year Ended December 31,
|
||||||
|
2017
|
2016
|
|||||
|
(Dollars in Millions)
|
||||||
|
Increase in base compensation
|
$
|
5.6
|
|
$
|
14.9
|
|
|
Decrease in equity-based compensation
|
(14.3
|
)
|
(43.4
|
)
|
||
|
Increase (decrease) in performance fee related compensation
|
635.2
|
|
(157.8
|
)
|
||
|
Total increase (decrease) in total compensation and benefits
|
$
|
626.5
|
|
$
|
(186.3
|
)
|
Base compensation and benefits.
Base compensation and benefits
increased
$
5.6 million
, or
1%
, for the year ended
December 31, 2017
as compared to
2016
, and increased $14.9 million, or 2%, for the year ended
December 31, 2016
as compared to
2015
, primarily due to the following:
|
|
Year Ended December 31,
|
|||||
|
|
2017
|
2016
|
||||
|
|
(Dollars in Millions)
|
|||||
|
Decrease in hedge fund headcount and bonuses
|
$
|
(24.9
|
)
|
$
|
—
|
|
|
Decrease in all other headcount and bonuses
|
(14.7
|
)
|
(40.7
|
)
|
||
|
Increase (decrease) in compensation costs associated with
fundraising activities |
30.4
|
|
(7.2
|
)
|
||
|
Absence in 2017 of prior year net write-down of acquisition-related
compensatory arrangements |
14.8
|
|
—
|
|
||
|
Higher expense associated with acquisition-related compensatory arrangements
1
|
—
|
|
62.8
|
|
||
|
Total increase in base compensation and benefits
|
$
|
5.6
|
|
$
|
14.9
|
|
1 Included in base compensation and benefits for the year ended December 31, 2016 is approximately $25.0 million of additional compensation expense as part of the transaction associated with Claren Road in which we transferred our 63%
112
ownership interest in Claren Road to its founders (see Note 9 to the consolidated financial statements for more information on this transaction).
Equity-based compensation.
Equity-based compensation
decreased
$
14.3 million
, or
4%
, for the year ended
December 31, 2017
as compared to
2016
. The decrease in equity-based compensation from
2016
to 2017 was due primarily to the forfeiture of equity-based awards due to employee terminations occurring in since 2016 and the accounting policy change on January 1, 2017 to account for forfeitures as they occur instead of estimating an expense at the grant date. These decreases were partially offset by the settlement of the DGAM earnout agreement due to the commencement of the wind down of DGAM in 2016 in which a reduction of expense was incurred in 2016 and by the ongoing granting of deferred restricted common units to new and existing employees during
2016
and 2017.
Equity-based compensation decreased $43.4 million, or 11%, for the year ended
December 31, 2016
as compared to
2015
. The decrease in equity-based compensation from 2015 to 2016 was due primarily to the settlement of the DGAM earnout agreement due to the wind down of DGAM in 2016, the reversal of an acquisition earnout, the forfeitures of equity-based awards due to employee terminations, and the absence in 2016 of a $7.5 million cumulative catch-up expense recorded in 2015 associated with a change in the estimated forfeiture rates in 2015. These decreases were partially offset by the ongoing granting of deferred restricted common units to new and existing employees during 2015 and 2016.
Performance fee related compensation expense.
Performance fee related compensation expense
increased
$
635.2 million
for the year ended
December 31, 2017
as compared to
2016
and decreased $157.8 million for the year ended
December 31, 2016
as compared to
2015
. Performance fee related compensation expense as a percentage of performance fees was
47%
,
47%
, and 62% in
the years ended December 31, 2017, 2016 and 2015
, respectively. The overall percentage of 62% for the year ended December 31, 2015 is primarily due to our private equity funds and vehicles in our Investment Solutions segment (which pay a higher ratio of performance fees as compensation) and the effect of our Legacy Energy funds in our Real Assets segment (which had carry reversals during the year without the corresponding reversal of performance fee compensation expense because the investment teams for the Legacy Energy funds are employed by Riverstone and not Carlyle). Performance fees earned from the Legacy Energy funds are allocated solely to Carlyle and are not otherwise shared or allocated with our investment professionals. For our largest segment, Corporate Private Equity, our performance fee related compensation expense as a percentage of performance fees is generally around 45%.
General, Administrative and Other Expenses.
General, administrative and other expenses
decreased
$
244.3 million
for the year ended
December 31, 2017
as compared to
2016
, and decreased $191.7 million for the year ended
December 31, 2016
as compared to
2015
, primarily due to:
|
|
Year Ended December 31,
|
|||||
|
|
2017
|
2016
|
||||
|
|
(Dollars in Millions)
|
|||||
|
Absence in 2016 of intangible asset impairment losses in 2015
|
$
|
—
|
|
$
|
(220.3
|
)
|
|
Lower intangible asset amortization
|
(32.3
|
)
|
(33.8
|
)
|
||
|
(Lower) higher expenses for litigation and contingencies *
|
(56.2
|
)
|
125.8
|
|
||
|
Net insurance proceeds recognized for certain legal matters
|
(187.6
|
)
|
(25.0
|
)
|
||
|
(Lower) higher professional fees and office expenses
|
(5.8
|
)
|
9.8
|
|
||
|
Higher (lower) external fundraising costs
|
6.0
|
|
(16.2
|
)
|
||
|
Foreign exchange adjustments and other changes
|
31.6
|
|
(32.0
|
)
|
||
|
Total decrease in general, administrative and other expenses
|
$
|
(244.3
|
)
|
$
|
(191.7
|
)
|
* For the year ended December 31, 2017 compared to the year ended December 31, 2016, this reflects the $175 million 2016 commodities charges as compared to the $25 million reversal of the CCC litigation reserve and $144 million of commodities charges in 2017. See Note 9 to the consolidated financial statements for more information on our legal matters.
Interest and Other Expenses of Consolidated Funds.
Interest and other expenses of Consolidated Funds
increased
$
69.1 million
for the year ended
December 31, 2017
as compared to
2016
and decreased $910.8 million for the year ended
December 31, 2016
as compared to
2015
. The increase for the year ended
December 31, 2017
as compared to
2016
is primarily due to higher interest expense on the consolidated CLOs. The decrease for the year ended
December 31, 2016
as compared to
2015
is primarily due to lower interest expense on the consolidated CLOs and the absence in 2016 of interest and other expenses of hedge funds and AlpInvest funds and vehicles that were deconsolidated on January 1, 2016.
113
The CLOs incur interest expense on their loans payable and incur other expenses consisting of trustee fees, rating agency fees and professional fees. Substantially all interest and other income of our CLOs together with interest expense of our CLOs and net investment gains of Consolidated Funds is attributable to the related funds’ limited partners or CLO investors and therefore is allocated to non-controlling interests. Accordingly, such amounts have no material impact on net income attributable to the Partnership.
Interest and Other Expenses of a Real Estate VIE and Loss on Deconsolidation.
Interest and other expenses of a real estate VIE and loss on deconsolidation
decreased
$
5.1 million
for the year ended
December 31, 2017
as compared to
2016
and increased $63.0 million for the year ended
December 31, 2016
as compared to
2015
, primarily due to:
|
|
Year Ended December 31,
|
|||||
|
|
2017
|
2016
|
||||
|
|
(Dollars in Millions)
|
|||||
|
Higher (lower) expenses associated with land development
services |
$
|
33.1
|
|
$
|
(17.2
|
)
|
|
Higher (lower) expenses related to fair market value adjustment
for Urbplan loans |
11.0
|
|
(26.8
|
)
|
||
|
(Lower) higher interest expense
|
(32.9
|
)
|
10.5
|
|
||
|
Lower compensation and benefits
|
(5.7
|
)
|
(2.2
|
)
|
||
|
(Lower) higher general, administrative and other expenses,
primarily due to asset impairments and litigation reserves |
(75.1
|
)
|
98.7
|
|
||
|
Loss on deconsolidation *
|
64.5
|
|
—
|
|
||
|
Total (decrease) increase in interest and other expenses of a real
estate VIE and loss on deconsolidation |
$
|
(5.1
|
)
|
$
|
63.0
|
|
* During the year ended December 31, 2017, the Partnership recognized a loss of approximately $65 million as a result of the Partnership disposing of its interests in Urbplan in a transaction in which a third party acquired operational control and all of the economic interests in Urbplan. With this transaction, Urbplan has been deconsolidated from the Partnership's financial results (see Note 15 to the consolidated financial statements).
Other Non-operating Income.
For the year ended December 31, 2017, this caption includes the impact of the newly enacted tax reform legislation on our tax receivable agreement liability, which was reduced by $71.5 million. See Note 11 to the consolidated financial statements for more information on the newly enacted tax reform legislation. In addition, for
the years ended December 31, 2017, 2016 and 2015
, this caption primarily represents the change in the fair value of contingent consideration associated with the Partnership's acquisitions.
The increase in other non-operating income for the year ended December 31, 2017 as compared to 2016 is primarily due to the $71.5 million reduction in the tax receivable agreement liability as mentioned above, the result of the separation from ESG and Claren Road and the associated termination of their respective earnout arrangements, and the change in fair value of contingent consideration associated with the Partnership's other acquisitions.
During the years ended December 31, 2016 and 2015, the overall estimated fair value of the contingent consideration associated with the Partnership’s acquisitions decreased based on management's assumptions in the probability-weighted discounted cash flow models used to estimate the fair value of these contingent consideration arrangements at December 31, 2016 and 2015, respectively, as well as the separation from ESG and Claren Road and the associated decrease in value of their respective earnout arrangements.
114
Net Investment Gains of Consolidated Funds.
For
the years ended December 31, 2017, 2016 and 2015
net investment gains of Consolidated Funds was $
88.4 million
, $13.1 million, and $864.4 million, respectively. For periods prior to January 1, 2016, this activity is predominantly driven by our consolidated AlpInvest funds and vehicles, CLOs, and hedge funds. On January 1, 2016, the Partnership adopted new consolidation accounting guidance that allowed the Partnership to deconsolidate the AlpInvest funds and vehicles, hedge funds, and the majority of its CLOs. As a result, beginning with the year ended December 31, 2016, net investment gains only comprise the activity of the remaining consolidated CLOs and certain other funds. For the consolidated CLOs, the amount reflects the net gain or loss on the fair value adjustment of both the assets and liabilities. The components of net investment gains of consolidated funds for the respective periods are:
|
|
Year Ended December 31,
|
||||||||||
|
|
2017
|
2016
|
2015
|
||||||||
|
|
(Dollars in millions)
|
||||||||||
|
Realized (losses) gains
|
$
|
(54.0
|
)
|
$
|
(33.4
|
)
|
$
|
1,114.7
|
|
||
|
Net change in unrealized gains (losses)
|
81.0
|
|
85.1
|
|
(688.5
|
)
|
|||||
|
Total gains
|
27.0
|
|
51.7
|
|
426.2
|
|
|||||
|
Gains (losses) on liabilities of CLOs
|
61.4
|
|
(40.5
|
)
|
436.5
|
|
|||||
|
Gains on other assets of CLOs
|
—
|
|
1.9
|
|
1.7
|
|
|||||
|
Total investment gains of Consolidated Funds
|
$
|
88.4
|
|
$
|
13.1
|
|
$
|
864.4
|
|
||
For periods prior to January 1, 2016, the unrealized investment gains/losses include the appreciation/depreciation of the equity investments within the consolidated AlpInvest funds and vehicles, the appreciation/depreciation of CLO investments in loans and bonds, as well as the appreciation/depreciation of investments made by our consolidated hedge funds and other consolidated funds. The gains/losses on the liabilities of the CLOs reflect the fair value adjustment on the debt of the CLOs. For the years ended December 31, 2017 and 2016, the unrealized investment gains/losses primarily include the appreciation/depreciation of consolidated CLO investments in loans and bonds.
The net investment gains for
the years ended December 31, 2017, 2016 and 2015
were due to the following:
|
|
Year Ended December 31,
|
||||||||
|
|
2017
|
2016
|
2015
|
||||||
|
|
(Dollars in Millions)
|
||||||||
|
Gains attributable to the consolidated AlpInvest funds and
vehicles |
$
|
—
|
|
$
|
—
|
|
$
|
978.8
|
|
|
Losses attributable to the consolidated hedge funds
|
—
|
|
—
|
|
(138.4
|
)
|
|||
|
Gains (losses) attributable to other consolidated funds
|
19.9
|
|
(0.1
|
)
|
(10.1
|
)
|
|||
|
Net appreciation of CLOs
|
68.5
|
|
13.2
|
|
34.1
|
|
|||
|
Total net investment gains
|
$
|
88.4
|
|
$
|
13.1
|
|
$
|
864.4
|
|
Net Income Attributable to Non-controlling Interests in Consolidated Entities
Net income attributable to non-controlling interests in consolidated entities was $
72.5 million
, $41.0 million, and $537.9 million for
the years ended December 31, 2017, 2016 and 2015
, respectively. These amounts are primarily attributable to the net earnings of the Consolidated Funds for each period, which are substantially all allocated to the related funds’ limited partners or CLO investors. This balance also includes the allocation of Urbplan's net losses that are attributable to non-controlling interests and net income attributable to non-controlling interests in carried interest, giveback obligations, and cash held for carried interest distributions.
115
The net income of our Consolidated Funds, after eliminations, for
the years ended December 31, 2017, 2016 and 2015
is comprised of the following:
|
|
Year Ended December 31,
|
||||||||
|
|
2017
|
2016
|
2015
|
||||||
|
|
(Dollars in Millions)
|
||||||||
|
Net income from the consolidated AlpInvest funds and
vehicles |
$
|
—
|
|
$
|
—
|
|
$
|
861.9
|
|
|
Net loss from the consolidated hedge funds
|
—
|
|
—
|
|
(185.9
|
)
|
|||
|
Net income (loss) from the consolidated CLOs
|
—
|
|
0.1
|
|
(54.3
|
)
|
|||
|
Net income from other consolidated funds
|
12.0
|
|
17.0
|
|
14.6
|
|
|||
|
Total net income of our Consolidated Funds, after eliminations
|
$
|
12.0
|
|
$
|
17.1
|
|
$
|
636.3
|
|
Net Income (Loss) Attributable to The Carlyle Group L.P. Common Unitholders
The net income (loss) attributable to the The Carlyle Group L.P. common unitholders was
$238.1 million
, $6.4 million, and $(18.4) million for
the years ended December 31, 2017, 2016 and 2015
, respectively. The Partnership is allocated a portion of the monthly net income (loss) attributable to Carlyle Holdings based on the Partnership’s ownership in Carlyle Holdings (which was approximately 30%, 26%, and 25% as of
December 31, 2017, 2016 and 2015
, respectively). Net income or loss attributable to the Partnership also includes 100% of the net income or loss attributable to the Partnership's wholly owned taxable subsidiary, Carlyle Holdings I GP Inc., which was $(30.3) million, $17.8 million, and $29.3 million for
the years ended December 31, 2017, 2016 and 2015
, respectively. As a result, the total net income or loss attributable to the Partnership will vary as a percentage of the net income or loss attributable to Carlyle Holdings.
Net income (loss) attributable to The Carlyle Group L.P. common unitholders per basic common unit was $2.58, $0.08, and $(0.24) for
the years ended December 31, 2017, 2016 and 2015
, respectively. Net income (loss) attributable to The Carlyle Group L.P. common unitholders per diluted common unit was $2.38, $(0.08), and $(0.30) for
the years ended December 31, 2017, 2016 and 2015
, respectively. For purposes of the diluted earnings per common unit calculation, for the years ended December 31, 2016 and 2015, Carlyle Holdings partnership units are assumed to have converted to common units of the Partnership and therefore, substantially all of the net income (loss) attributable to Carlyle Holdings is attributable to the Partnership resulting in a diluted loss per common unit.
Non-GAAP Financial Measures
The following tables set forth information in the format used by management when making resource deployment decisions and in assessing performance of our segments. These non-GAAP financial measures are presented for
the years ended December 31, 2017, 2016 and 2015
. The tables below show our total segment Economic Income which is the sum of Fee Related Earnings, Net Performance Fees, Investment Income (Loss), Reserve for Litigation and Contingencies, Net interest and Equity-based compensation expense (excluding equity-based compensation grants issued in May 2012 upon the completion of the initial public offering or grants issued in acquisitions or strategic investments). Our Non-GAAP financial measures exclude the effects of consolidated funds, acquisition-related items including amortization and any impairment charges of acquired intangible assets and contingent consideration taking the form of earn-outs, charges associated with equity-based compensation grants issued in May 2012 upon completion of the initial public offering or grants issued in acquisitions or strategic investments, changes in the tax receivable agreement liability, corporate actions and infrequently occurring or unusual events.
116
The following table shows our total segment Economic Income, Fee Related Earnings and Distributable Earnings for
the years ended December 31, 2017, 2016 and 2015
.
|
Year Ended December 31,
|
|||||||||||
|
2017
|
2016
|
2015
|
|||||||||
|
(Dollars in millions)
|
|||||||||||
|
Total Segment Revenues
|
$
|
3,378.8
|
|
$
|
1,958.6
|
|
$
|
2,132.4
|
|
||
|
Total Segment Expenses
|
2,109.5
|
|
1,652.7
|
|
1,735.8
|
|
|||||
|
Economic Income
|
$
|
1,269.3
|
|
$
|
305.9
|
|
$
|
396.6
|
|
||
|
(-) Net Performance Fees
|
1,177.8
|
|
393.7
|
|
391.7
|
|
|||||
|
(-) Investment Income (Loss)
|
47.2
|
|
50.3
|
|
(22.4
|
)
|
|||||
|
(+) Equity-based Compensation
|
123.9
|
|
119.6
|
|
121.5
|
|
|||||
|
(+) Net Interest
|
48.8
|
|
51.1
|
|
53.3
|
|
|||||
|
(+) Reserve for Litigation and Contingencies
|
(25.0
|
)
|
—
|
|
50.0
|
|
|||||
|
(=) Fee Related Earnings
|
$
|
192.0
|
|
$
|
32.6
|
|
$
|
252.1
|
|
||
|
(+) Realized Net Performance Fees
|
552.6
|
|
625.3
|
|
788.5
|
|
|||||
|
(+) Realized Investment Income (Loss)
|
(25.8
|
)
|
44.9
|
|
(64.8
|
)
|
|||||
|
(+) Net Interest
|
(48.8
|
)
|
(51.1
|
)
|
(53.3
|
)
|
|||||
|
(=) Distributable Earnings
|
$
|
670.0
|
|
$
|
651.7
|
|
$
|
922.5
|
|
||
The following table sets forth our total segment revenues for the years ended December 31, 2017, 2016 and 2015.
|
Year Ended December 31,
|
|||||||||||
|
2017
|
2016
|
2015
|
|||||||||
|
(Dollars in millions)
|
|||||||||||
|
Segment Revenues
|
|||||||||||
|
Fund level fee revenues
|
|||||||||||
|
Fund management fees
|
$
|
1,081.0
|
|
$
|
1,085.8
|
|
$
|
1,197.9
|
|
||
|
Portfolio advisory fees, net
|
16.7
|
|
16.6
|
|
15.4
|
|
|||||
|
Transaction fees, net
|
26.9
|
|
31.2
|
|
9.8
|
|
|||||
|
Total fund level fee revenues
|
1,124.6
|
|
1,133.6
|
|
1,223.1
|
|
|||||
|
Performance fees
|
|||||||||||
|
Realized
|
1,085.3
|
|
1,215.8
|
|
1,434.8
|
|
|||||
|
Unrealized
|
1,089.6
|
|
(464.1
|
)
|
(525.1
|
)
|
|||||
|
Total performance fees
|
2,174.9
|
|
751.7
|
|
909.7
|
|
|||||
|
Investment income (loss)
|
|||||||||||
|
Realized
|
(25.8
|
)
|
44.9
|
|
(64.8
|
)
|
|||||
|
Unrealized
|
73.0
|
|
5.4
|
|
42.4
|
|
|||||
|
Total investment income (loss)
|
47.2
|
|
50.3
|
|
(22.4
|
)
|
|||||
|
Interest income
|
16.7
|
|
10.2
|
|
4.8
|
|
|||||
|
Other income
|
15.4
|
|
12.8
|
|
17.2
|
|
|||||
|
Total Segment Revenues
|
$
|
3,378.8
|
|
$
|
1,958.6
|
|
$
|
2,132.4
|
|
||
117
The following table sets forth our total segment expenses for the years ended December 31, 2017, 2016 and 2015.
|
Year Ended December 31,
|
|||||||||||
|
2017
|
2016
|
2015
|
|||||||||
|
(Dollars in millions)
|
|||||||||||
|
Segment Expenses
|
|||||||||||
|
Compensation and benefits
|
|||||||||||
|
Direct base compensation
|
$
|
464.5
|
|
$
|
437.1
|
|
$
|
477.7
|
|
||
|
Indirect base compensation
|
193.5
|
|
164.2
|
|
172.1
|
|
|||||
|
Equity-based compensation
|
123.9
|
|
119.6
|
|
121.5
|
|
|||||
|
Performance fee related
|
|||||||||||
|
Realized
|
532.7
|
|
590.5
|
|
646.3
|
|
|||||
|
Unrealized
|
464.4
|
|
(232.5
|
)
|
(128.3
|
)
|
|||||
|
Total compensation and benefits
|
1,779.0
|
|
1,078.9
|
|
1,289.3
|
|
|||||
|
General, administrative, and other indirect expenses
|
233.9
|
|
483.5
|
|
362.8
|
|
|||||
|
Depreciation and amortization expense
|
31.1
|
|
29.0
|
|
25.6
|
|
|||||
|
Interest expense
|
65.5
|
|
61.3
|
|
58.1
|
|
|||||
|
Total Segment Expenses
|
$
|
2,109.5
|
|
$
|
1,652.7
|
|
$
|
1,735.8
|
|
||
Income before provision for income taxes is the GAAP financial measure most comparable to economic income, fee related earnings, and distributable earnings. The following table is a reconciliation of income before provision for income taxes to economic income, to fee related earnings, and to distributable earnings.
|
|
Year Ended December 31,
|
||||||||||
|
|
2017
|
2016
|
2015
|
||||||||
|
|
(Dollars in millions)
|
||||||||||
|
Income before provision for income taxes
|
$
|
1,132.3
|
|
$
|
45.3
|
|
$
|
402.2
|
|
||
|
Adjustments:
|
|||||||||||
|
Equity-based compensation issued in conjunction with the initial public offering, acquisitions and strategic investments
|
241.2
|
|
223.4
|
|
259.8
|
|
|||||
|
Acquisition related charges and amortization of intangibles and impairment
|
35.7
|
|
94.2
|
|
288.8
|
|
|||||
|
Other non-operating (income) expense
(1)
|
(71.4
|
)
|
(11.2
|
)
|
(7.4
|
)
|
|||||
|
Tax expense associated with performance fee compensation
|
(9.2
|
)
|
(15.1
|
)
|
(14.9
|
)
|
|||||
|
Net income attributable to non-controlling interests in consolidated entities
|
(72.5
|
)
|
(41.0
|
)
|
(537.9
|
)
|
|||||
|
Severance and other adjustments
|
13.2
|
|
10.3
|
|
6.0
|
|
|||||
|
Economic Income
|
$
|
1,269.3
|
|
$
|
305.9
|
|
$
|
396.6
|
|
||
|
Net performance fees
(2)
|
1,177.8
|
|
393.7
|
|
391.7
|
|
|||||
|
Investment income (loss)
(2)
|
47.2
|
|
50.3
|
|
(22.4
|
)
|
|||||
|
Equity-based compensation
|
123.9
|
|
119.6
|
|
121.5
|
|
|||||
|
Net Interest
|
48.8
|
|
51.1
|
|
53.3
|
|
|||||
|
Reserve for litigation and contingencies
|
(25.0
|
)
|
—
|
|
50.0
|
|
|||||
|
Fee Related Earnings
|
$
|
192.0
|
|
$
|
32.6
|
|
$
|
252.1
|
|
||
|
Realized performance fees, net of related compensation
|
552.6
|
|
625.3
|
|
788.5
|
|
|||||
|
Realized investment income (loss)
(2)
|
(25.8
|
)
|
44.9
|
|
(64.8
|
)
|
|||||
|
Net Interest
|
(48.8
|
)
|
(51.1
|
)
|
(53.3
|
)
|
|||||
|
Distributable Earnings
|
$
|
670.0
|
|
$
|
651.7
|
|
$
|
922.5
|
|
||
118
|
(1)
|
Included in other non-operating (income) expense for the year ended December 31, 2017 is a
$71.5 million
adjustment for the revaluation of the tax receivable agreement liability as result of the passage of the Tax Cuts and Jobs Act of 2017.
|
|
(2)
|
See reconciliation to most directly comparable U.S. GAAP measure below:
|
|
|
Year Ended December 31, 2017
|
||||||||||
|
|
Carlyle
Consolidated
|
Adjustments
(3)
|
Total
Reportable
Segments
|
||||||||
|
|
(Dollars in millions)
|
||||||||||
|
Performance fees
|
|||||||||||
|
Realized
|
$
|
1,097.3
|
|
$
|
(12.0
|
)
|
$
|
1,085.3
|
|
||
|
Unrealized
|
996.6
|
|
93.0
|
|
1,089.6
|
|
|||||
|
Total performance fees
|
2,093.9
|
|
81.0
|
|
2,174.9
|
|
|||||
|
Performance fee related compensation expense
|
|||||||||||
|
Realized
|
520.7
|
|
12.0
|
|
532.7
|
|
|||||
|
Unrealized
|
467.6
|
|
(3.2
|
)
|
464.4
|
|
|||||
|
Total performance fee related compensation expense
|
988.3
|
|
8.8
|
|
997.1
|
|
|||||
|
Net performance fees
|
|||||||||||
|
Realized
|
576.6
|
|
(24.0
|
)
|
552.6
|
|
|||||
|
Unrealized
|
529.0
|
|
96.2
|
|
625.2
|
|
|||||
|
Total net performance fees
|
$
|
1,105.6
|
|
$
|
72.2
|
|
$
|
1,177.8
|
|
||
|
Investment income (loss)
|
|||||||||||
|
Realized
|
$
|
70.4
|
|
$
|
(96.2
|
)
|
$
|
(25.8
|
)
|
||
|
Unrealized
|
161.6
|
|
(88.6
|
)
|
73.0
|
|
|||||
|
Total investment income (loss)
|
$
|
232.0
|
|
$
|
(184.8
|
)
|
$
|
47.2
|
|
||
|
|
Year Ended December 31, 2016
|
||||||||||
|
|
Carlyle
Consolidated
|
Adjustments
(3)
|
Total
Reportable
Segments
|
||||||||
|
|
(Dollars in millions)
|
||||||||||
|
Performance fees
|
|||||||||||
|
Realized
|
$
|
1,129.5
|
|
$
|
86.3
|
|
$
|
1,215.8
|
|
||
|
Unrealized
|
(377.7
|
)
|
(86.4
|
)
|
(464.1
|
)
|
|||||
|
Total performance fees
|
751.8
|
|
(0.1
|
)
|
751.7
|
|
|||||
|
Performance fee related compensation expense
|
|||||||||||
|
Realized
|
580.5
|
|
10.0
|
|
590.5
|
|
|||||
|
Unrealized
|
(227.4
|
)
|
(5.1
|
)
|
(232.5
|
)
|
|||||
|
Total performance fee related compensation expense
|
353.1
|
|
4.9
|
|
358.0
|
|
|||||
|
Net performance fees
|
|||||||||||
|
Realized
|
549.0
|
|
76.3
|
|
625.3
|
|
|||||
|
Unrealized
|
(150.3
|
)
|
(81.3
|
)
|
(231.6
|
)
|
|||||
|
Total net performance fees
|
$
|
398.7
|
|
$
|
(5.0
|
)
|
$
|
393.7
|
|
||
|
Investment income (loss)
|
|||||||||||
|
Realized
|
$
|
112.9
|
|
$
|
(68.0
|
)
|
$
|
44.9
|
|
||
|
Unrealized
|
47.6
|
|
(42.2
|
)
|
5.4
|
|
|||||
|
Total investment income (loss)
|
$
|
160.5
|
|
$
|
(110.2
|
)
|
$
|
50.3
|
|
||
119
|
|
Year Ended December 31, 2015
|
||||||||||
|
|
Carlyle
Consolidated
|
Adjustments
(3)
|
Total
Reportable
Segments
|
||||||||
|
|
(Dollars in millions)
|
||||||||||
|
Performance fees
|
|||||||||||
|
Realized
|
$
|
1,441.9
|
|
$
|
(7.1
|
)
|
$
|
1,434.8
|
|
||
|
Unrealized
|
(617.0
|
)
|
91.9
|
|
(525.1
|
)
|
|||||
|
Total performance fees
|
824.9
|
|
84.8
|
|
909.7
|
|
|||||
|
Performance fee related compensation expense
|
|||||||||||
|
Realized
|
650.5
|
|
(4.2
|
)
|
646.3
|
|
|||||
|
Unrealized
|
(139.6
|
)
|
11.3
|
|
(128.3
|
)
|
|||||
|
Total performance fee related compensation expense
|
510.9
|
|
7.1
|
|
518.0
|
|
|||||
|
Net performance fees
|
|||||||||||
|
Realized
|
791.4
|
|
(2.9
|
)
|
788.5
|
|
|||||
|
Unrealized
|
(477.4
|
)
|
80.6
|
|
(396.8
|
)
|
|||||
|
Total net performance fees
|
$
|
314.0
|
|
$
|
77.7
|
|
$
|
391.7
|
|
||
|
Investment income
|
|||||||||||
|
Realized
|
$
|
32.9
|
|
$
|
(97.7
|
)
|
$
|
(64.8
|
)
|
||
|
Unrealized
|
(17.7
|
)
|
60.1
|
|
42.4
|
|
|||||
|
Total investment income
|
$
|
15.2
|
|
$
|
(37.6
|
)
|
$
|
(22.4
|
)
|
||
|
(3)
|
Adjustments to performance fees and investment income (loss) relate to (i) amounts earned from the Consolidated Funds, which were eliminated in the U.S. GAAP consolidation but were included in the Non-GAAP results, (ii) amounts attributable to non-controlling interests in consolidated entities, which were excluded from the Non-GAAP results, (iii) the reclassification of NGP performance fees, which are included in investment income in the U.S. GAAP financial statements, and (iv) the reclassification of certain tax expenses associated with performance fees. Adjustments to investment income (loss) also include the reclassification of earnings for the investment in NGP Management and its affiliates to the appropriate operating captions for the Non-GAAP results, the exclusion of charges associated with the investment in NGP Management and its affiliates that are excluded from the Non-GAAP results, and adjustments to reflect the Partnership's share of Urbplan net losses, until Urbplan was deconsolidated during 2017, as investment losses for the Non-GAAP results. Adjustments are also included in these financial statement captions to reflect the Partnership's economic interests in Claren Road (through January 2017), ESG (through June 2016) and Vermillion.
|
120
Economic Income and Distributable Earnings for our reportable segments are as follows:
|
|
Year Ended December 31,
|
||||||||||
|
|
2017
|
2016
|
2015
|
||||||||
|
|
(Dollars in millions)
|
||||||||||
|
Economic Income (Loss)
|
|||||||||||
|
Corporate Private Equity
|
$
|
895.9
|
|
$
|
224.2
|
|
$
|
399.5
|
|
||
|
Real Assets
|
215.4
|
|
216.5
|
|
32.9
|
|
|||||
|
Global Credit
|
106.7
|
|
(159.1
|
)
|
(40.3
|
)
|
|||||
|
Investment Solutions
|
51.3
|
|
24.3
|
|
4.5
|
|
|||||
|
Economic Income
|
$
|
1,269.3
|
|
$
|
305.9
|
|
$
|
396.6
|
|
||
|
Distributable Earnings
|
|||||||||||
|
Corporate Private Equity
|
$
|
487.9
|
|
$
|
739.4
|
|
$
|
798.0
|
|
||
|
Real Assets
|
24.8
|
|
49.3
|
|
72.8
|
|
|||||
|
Global Credit
|
126.9
|
|
(157.4
|
)
|
38.8
|
|
|||||
|
Investment Solutions
|
30.4
|
|
20.4
|
|
12.9
|
|
|||||
|
Distributable Earnings
|
$
|
670.0
|
|
$
|
651.7
|
|
$
|
922.5
|
|
||
Segment Analysis
Discussed below is our DE, FRE, and EI for our segments for the periods presented. Our segment information is reflected in the manner used by our senior management to make operating and compensation decisions, assess performance and allocate resources.
For segment reporting purposes, revenues and expenses are presented on a basis that deconsolidates our Consolidated Funds. As a result, segment revenues from management fees, performance fees and investment income (loss) are different than those presented on a consolidated U.S. GAAP basis because fund management fees recognized in certain segments are received from Consolidated Funds and are eliminated in consolidation when presented on a consolidated U.S. GAAP basis. Furthermore, segment expenses are different than related amounts presented on a consolidated U.S. GAAP basis due to the exclusion of fund expenses that are paid by the Consolidated Funds. Segment revenue and expenses are also different than those presented on a consolidated U.S. GAAP basis because we present our segment revenues and expenses related to Claren Road, ESG, and, for periods prior to July 1, 2015, Vermillion based on our economic interest in those entities. Beginning in July 2015 in connection with the departure of certain Vermillion principals and the restructuring of its operations, our economic interests were increased in stages to currently 88% (to the extent Vermillion exceeds certain performance hurdles). Otherwise, our economic interest, and share of management fees of Vermillion, is 100%. Effective January 1, 2016 and through January 31, 2017 (the date we transferred our ownership interests to its principals), our segment revenue and expenses related to Claren Road are based on our approximate 63% economic interest in that entity as a result of a reallocation of interest from a departing founder. Further, our economic interest in ESG was 55% through June 30, 2016. Also, EI excludes expenses associated with equity-based compensation that was issued in our initial public offering or issued in acquisitions and strategic investments.
121
Corporate Private Equity
The following table presents our results of operations for our Corporate Private Equity segment:
|
|
Year Ended December 31,
|
||||||||||
|
|
2017
|
2016
|
2015
|
||||||||
|
|
(Dollars in millions)
|
||||||||||
|
Segment Revenues
|
|||||||||||
|
Fund level fee revenues
|
|||||||||||
|
Fund management fees
|
$
|
471.0
|
|
$
|
498.9
|
|
$
|
577.4
|
|
||
|
Portfolio advisory fees, net
|
15.2
|
|
14.5
|
|
14.3
|
|
|||||
|
Transaction fees, net
|
22.4
|
|
31.2
|
|
7.7
|
|
|||||
|
Total fund level fee revenues
|
508.6
|
|
544.6
|
|
599.4
|
|
|||||
|
Performance fees
|
|
|
|
||||||||
|
Realized
|
831.5
|
|
1,060.5
|
|
1,209.5
|
|
|||||
|
Unrealized
|
781.6
|
|
(777.5
|
)
|
(523.1
|
)
|
|||||
|
Total performance fees
|
1,613.1
|
|
283.0
|
|
686.4
|
|
|||||
|
Investment income (loss)
|
|
|
|
||||||||
|
Realized
|
25.4
|
|
60.3
|
|
23.3
|
|
|||||
|
Unrealized
|
37.0
|
|
(11.0
|
)
|
(5.2
|
)
|
|||||
|
Total investment income
|
62.4
|
|
49.3
|
|
18.1
|
|
|||||
|
Interest income
|
5.5
|
|
3.4
|
|
1.5
|
|
|||||
|
Other income
|
6.0
|
|
6.0
|
|
9.8
|
|
|||||
|
Total revenues
|
2,195.6
|
|
886.3
|
|
1,315.2
|
|
|||||
|
Segment Expenses
|
|
|
|
||||||||
|
Compensation and benefits
|
|
|
|
||||||||
|
Direct base compensation
|
235.7
|
|
210.8
|
|
224.2
|
|
|||||
|
Indirect base compensation
|
105.0
|
|
78.8
|
|
91.5
|
|
|||||
|
Equity-based compensation
|
60.5
|
|
69.3
|
|
65.1
|
|
|||||
|
Performance fee related
|
|
|
|
||||||||
|
Realized
|
372.9
|
|
472.1
|
|
540.9
|
|
|||||
|
Unrealized
|
362.6
|
|
(342.6
|
)
|
(221.7
|
)
|
|||||
|
Total compensation and benefits
|
1,136.7
|
|
488.4
|
|
700.0
|
|
|||||
|
General, administrative, and other indirect expenses
|
119.8
|
|
131.9
|
|
172.4
|
|
|||||
|
Depreciation and amortization expense
|
15.3
|
|
13.6
|
|
12.5
|
|
|||||
|
Interest expense
|
27.9
|
|
28.2
|
|
30.8
|
|
|||||
|
Total expenses
|
1,299.7
|
|
662.1
|
|
915.7
|
|
|||||
|
Economic Income
|
$
|
895.9
|
|
$
|
224.2
|
|
$
|
399.5
|
|
||
|
(-) Net Performance Fees
|
877.6
|
|
153.5
|
|
367.2
|
|
|||||
|
(-) Investment Income
|
62.4
|
|
49.3
|
|
18.1
|
|
|||||
|
(+) Equity-based Compensation
|
60.5
|
|
69.3
|
|
65.1
|
|
|||||
|
(+) Net Interest
|
22.4
|
|
24.8
|
|
29.3
|
|
|||||
|
(+) Reserve for Litigation and Contingencies
|
(12.5
|
)
|
—
|
|
26.8
|
|
|||||
|
(=) Fee Related Earnings
|
$
|
26.3
|
|
$
|
115.5
|
|
$
|
135.4
|
|
||
|
(+) Realized Net Performance Fees
|
458.6
|
|
588.4
|
|
668.6
|
|
|||||
|
(+) Realized Investment Income
|
25.4
|
|
60.3
|
|
23.3
|
|
|||||
|
(+) Net Interest
|
(22.4
|
)
|
(24.8
|
)
|
(29.3
|
)
|
|||||
|
(=) Distributable Earnings
|
$
|
487.9
|
|
$
|
739.4
|
|
$
|
798.0
|
|
||
122
Year Ended
December 31, 2017
Compared to Year Ended
December 31, 2016
and Year Ended
December 31, 2016
Compared to Year Ended
December 31, 2015
Distributable Earnings
Distributable earnings
decreased
$
251.5 million
for the year ended
December 31, 2017
as compared to
2016
, and decreased $
58.6 million
for the year ended
December 31, 2016
as compared to the same period in
2015
. The following table provides the components of the changes in distributable earnings for the years ended
December 31, 2017 and 2016
:
|
|
Year Ended December 31,
|
|||||
|
|
2017
|
2016
|
||||
|
|
(Dollars in Millions)
|
|||||
|
Distributable earnings, prior year
|
$
|
739.4
|
|
$
|
798.0
|
|
|
Increases (decreases):
|
||||||
|
Decrease in realized net performance fees
|
(129.8
|
)
|
(80.2
|
)
|
||
|
(Decrease) increase in realized investment income
|
(34.9
|
)
|
37.0
|
|
||
|
Decrease in fee related earnings
|
(89.2
|
)
|
(19.9
|
)
|
||
|
Decrease in net interest
|
2.4
|
|
4.5
|
|
||
|
Total decrease
|
(251.5
|
)
|
(58.6
|
)
|
||
|
Distributable earnings, current year
|
$
|
487.9
|
|
$
|
739.4
|
|
Realized Net Performance Fees.
Realized net performance fees
decreased
$
129.8 million
for the year ended
December 31, 2017
as compared to
2016
, and decreased $80.2 million for the year ended
December 31, 2016
as compared to
2015
. Our prior generations of carry funds have exited substantial parts of their portfolios, and our newer funds, while accruing carry, are not yet producing cash carry. Net realized performance fees declined in 2017 as realized proceeds from our funds declined to $11.2 billion from $14.8 billion in 2016. Specifically, the decrease in realized net performance fees for the year ended
December 31, 2017
as compared to
2016
was due to lower performance fee realizations from our Europe buyout funds, and to a lesser extent our U.S. buyout funds, partially offset by larger realizations from our Asia buyout funds in 2017 as compared to
2016
. We expect net realized performance fees to decrease in 2018 as compared to 2017 levels, primarily due to the mix of realized proceeds coming from funds not yet taking cash carry, even though we expect that those funds will still be accruing carry.
The decrease in realized net performance fees for the year ended
December 31, 2016
as compared to
2015
was primarily due to lower performance fee realizations in
2016
, primarily with our Asia buyout funds, as compared to
2015
. Realized net performance fees were primarily generated by the following funds for
the years ended December 31, 2017, 2016 and 2015
, respectively:
|
Year Ended December 31,
|
||
|
2017
|
2016
|
2015
|
|
CP V
|
CP V
|
CP V
|
|
CGFSP I
|
CEP III
|
CEP III
|
|
CAP III
|
CP IV
|
CP IV
|
|
CEP III
|
CEP II
|
CAP II
|
|
CETP II
|
CGFSP I
|
CAP III
|
|
|
CETP II
|
|
|
|
CAP III
|
|
Realized Investment Income.
Realized investment income
decreased
$
34.9 million
for the year ended
December 31, 2017
as compared to
2016
and increased $37.0 million for the year ended
December 31, 2016
as compared to
2015
. The decrease in realized investment income for the year ended
December 31, 2017
as compared to
2016
was primarily due to lower realized gains in our investments in U.S. and Europe buyout funds, partially offset by realized gains on U.S. growth funds in 2017 as compared to realized losses on these funds in 2016. The increase in realized investment income for the year ended
December 31, 2016
as compared to
2015
was primarily from our investments in U.S. and Europe buyout funds as well as Europe growth funds.
123
Fee Related Earnings
Fee related earnings
decreased
$
89.2 million
for the year ended
December 31, 2017
as compared to
2016
, and decreased $
19.9 million
for the year ended
December 31, 2016
as compared to
2015
. The following table provides the components of the change in fee related earnings for the years ended
December 31, 2017 and 2016
:
|
|
Year Ended December 31,
|
|||||
|
|
2017
|
2016
|
||||
|
|
(Dollars in Millions)
|
|||||
|
Fee related earnings, prior year
|
$
|
115.5
|
|
$
|
135.4
|
|
|
Increases (decreases):
|
||||||
|
Decrease in fee revenues
|
(36.0
|
)
|
(54.8
|
)
|
||
|
(Increase) decrease in direct and indirect base
compensation |
(51.1
|
)
|
26.1
|
|
||
|
(Increase) decrease in general, administrative and
other expenses |
(0.4
|
)
|
13.7
|
|
||
|
All other changes
|
(1.7
|
)
|
(4.9
|
)
|
||
|
Total decrease
|
(89.2
|
)
|
(19.9
|
)
|
||
|
Fee related earnings, current year
|
$
|
26.3
|
|
$
|
115.5
|
|
Fee Revenues.
Total fee revenues
decreased
$
36.0 million
for the year ended
December 31, 2017
as compared to
2016
and decreased
$54.8 million
for the year ended
December 31, 2016
as compared to
2015
, due to the following:
|
|
Year Ended December 31,
|
|||||
|
|
2017
|
2016
|
||||
|
|
(Dollars in Millions)
|
|||||
|
Lower fund management fees
|
$
|
(27.9
|
)
|
$
|
(78.5
|
)
|
|
(Lower) higher transaction fees
|
(8.8
|
)
|
23.5
|
|
||
|
Higher portfolio advisory fees
|
0.7
|
|
0.2
|
|
||
|
Total decrease in fee revenues
|
$
|
(36.0
|
)
|
$
|
(54.8
|
)
|
The
decrease
in fund management fees for the year ended
December 31, 2017
as compared to
2016
was primarily due to lower assets under management from sales of investments during
2016
for CP V, our first financial services fund (“CGFSP I”), our third Europe buyout fund (“CEP III”), and our second Asia buyout fund (“CAP II”). Management fees in 2017 do not benefit from $18 billion of pending AUM for which we have not yet activated the funds and turned on fees.
The
decrease
in fund management fees for the year ended
December 31, 2016
as compared to
2015
is primarily due to a $48.6 million decrease in catch-up management fees from $49.1 million in
2015
to $0.5 million in
2016
. Catch-up management fees for the year ended
December 31, 2016
were primarily driven by a subsequent closing for our second U.S. equity opportunity fund (“CEOF II”). Catch-up management fees for the year ended
December 31, 2015
were primarily driven by subsequent closings for our fourth Europe buyout fund (“CEP IV”), our third Japan buyout fund (“CJP III”), and our third Europe technology fund (“CETP III”). Furthermore, fund management fees decreased in
2016
due to the reduction in basis resulting from realizations in several large funds outside the investment period, including CP V and CAP III, totaling approximately $58.6 million. These decreases were partially offset by an increase of $28.7 million of management fees from CEOF II due to
2016
being the first full year of management fees from that fund.
The weighted average management fee rate increased from
1.28%
at December 31, 2016 to
1.31%
at December 31, 2017. The increase in the weighted average management fee rate is driven by significant exit activity in funds outside the investment period, which typically earn lower effective fee rates, while Fee-earning AUM for funds inside the investment period ticked up slightly. Fee-earning AUM was
$35.6 billion
and
$36.3 billion
as of December 31, 2017 and 2016, respectively, reflecting a decrease of
$0.7 billion
.
The weighted average management fee rate increased from 1.26% at December 31, 2015 to 1.28% at December 31, 2016. The increase in the weighted average management fee rate is driven by significant exit activity in funds outside the investment period, which typically earn lower effective fee rates, while Fee-earning AUM for funds inside the investment
124
period remained relatively flat. Fee-earning AUM was $36.3 billion and $40.9 billion as of December 31, 2016 and 2015, respectively, reflecting a decrease of $4.6 billion.
The
decrease
in transaction fees for the year ended
December 31, 2017
as compared to
2016
and the increase in transaction fees for the year ended December 31, 2016 as compared to 2015 was primarily from a significant investment in one of our U.S. buyout funds in
2016
.
Direct and indirect compensation expense.
Direct and indirect compensation expense
increased
$
51.1 million
, or
18%
, for the year ended
December 31, 2017
as compared to
2016
, primarily due to higher compensation costs related to fundraising activities for CP VII and CAP V of approximately $30.1 million, increased headcount and an increase in 2017 cash bonuses.
Direct and indirect compensation expense decreased $26.1 million, or 8%, for the year ended
December 31, 2016
as compared to
2015
, primarily due to lower compensation costs related to fundraising activities of approximately $11.7 million and lower cash bonuses in
2016
. These
increases
were partially offset by a slight increase in headcount.
General, administrative and other indirect expenses.
General, administrative and other indirect expenses increased $0.4 million for the year ended
December 31, 2017
as compared to
2016
primarily due to higher negative foreign currency adjustments and real estate costs, partially offset by lower professional fees and a $1.7 million decrease in external costs associated with fundraising activities in the year ended
December 31, 2017
as compared to
2016
.
General, administrative and other indirect expenses decreased $13.7 million for the year ended
December 31, 2016
as compared to
2015
primarily due to $13.9 million of lower external costs associated with fundraising activities in
2016
as compared to
2015
and lower information technology expenses. These decreases were partially offset by higher professional fees.
Economic Income
Economic income
increased
$
671.7 million
for the year ended
December 31, 2017
as compared to
2016
and decreased $
175.3 million
for the year ended
December 31, 2016
as compared to
2015
. The following table provides the components of the change in economic income for the years ended
December 31, 2017 and 2016
:
|
|
Year Ended December 31,
|
|||||
|
|
2017
|
2016
|
||||
|
|
(Dollars in Millions)
|
|||||
|
Economic income, prior year
|
$
|
224.2
|
|
$
|
399.5
|
|
|
Increases (decreases):
|
||||||
|
Increase (decrease) in net performance fees
|
724.1
|
|
(213.7
|
)
|
||
|
Increase in investment income
|
13.1
|
|
31.2
|
|
||
|
Decrease (increase) in equity-based compensation
|
8.8
|
|
(4.2
|
)
|
||
|
Decrease in fee related earnings
|
(89.2
|
)
|
(19.9
|
)
|
||
|
Decrease in net interest
|
2.4
|
|
4.5
|
|
||
|
Decrease in reserve for litigation and contingencies
|
12.5
|
|
26.8
|
|
||
|
Total increase (decrease)
|
671.7
|
|
(175.3
|
)
|
||
|
Economic income, current year
|
$
|
895.9
|
|
$
|
224.2
|
|
125
Performance Fees.
Performance fees (realized and unrealized)
increased
$1,330.1 million
for the year ended
December 31, 2017
as compared to the year ended
December 31, 2016
and decreased $403.4 million for the year ended
December 31, 2016
as compared to the year ended
December 31, 2015
. The increase in performance fees for the year ended
December 31, 2017
as compared to
2016
was primarily due to higher appreciation on certain of our U.S., Europe, and Asia buyout funds. The decrease in performance fees for
2016
as compared to
2015
is primarily due to lower fund appreciation from our buyout and growth capital funds. Performance fees are from the following types of funds:
|
Performance Fees
|
|||||||||||
|
|
Year Ended December 31,
|
||||||||||
|
|
2017
|
2016
|
2015
|
||||||||
|
|
(Dollars in millions)
|
||||||||||
|
Buyout funds
|
$
|
1,570.1
|
|
$
|
298.8
|
|
$
|
636.7
|
|
||
|
Growth Capital funds
|
43.0
|
|
(15.8
|
)
|
49.7
|
|
|||||
|
Total performance fees
|
$
|
1,613.1
|
|
$
|
283.0
|
|
$
|
686.4
|
|
||
The
$1,613.1 million
of performance fees for the year ended
December 31, 2017
was driven primarily by performance fees recognized from the following funds:
•
CP VI of $649.1 million,
•
CAP IV of $312.7 million,
•
CP V of $309.5 million,
•
CEP III of $76.8 million,
•
CEP IV of $69.8 million,
•
CGFSP II of $55.5 million,
•
CETP III of $33.6 million,
•
CETP II of $31.6 million, and
•
CGFSP I of $30.3 million.
The
$283.0 million
of performance fees for the year ended
December 31, 2016
was driven primarily by performance fees recognized from the following funds:
•
CP V of $124.3 million,
•
CEP III of $46.8 million,
•
CP VI of $37.4 million,
•
CEP II of $32.5 million,
•
CGFSP of $27.9 million,
•
CBPF of $24.7 million,
•
CAP III of $(33.8) million, and
•
CEOF of $(21.0) million.
The
$686.4 million
of performance fees for the year ended
December 31, 2015
was driven primarily by performance fees recognized from the following funds:
•
CEP III of $235.9 million,
•
CAP III of $184.2 million,
•
CP V of $67.9 million,
•
CP IV of $44.4 million, and
•
CGFSP I of $40.7 million.
Performance fees of $
1,613.1 million
, $
283.0 million
, and $
686.4 million
are inclusive of performance fees reversed of approximately $56.2 million, $86.6 million, and $12.3 million for
the years ended December 31, 2017, 2016 and 2015
, respectively. Additionally, during the year ended December 31, 2017, the Partnership paid $98.4 million to satisfy giveback obligations related to Energy II and Energy III. During the year ended December 31, 2016, the Partnership paid $47.3 million to satisfy a giveback obligation related to our second Asia buyout fund (“CAP II”). Substantially all of the giveback obligations were paid by current and former senior Carlyle professionals.
126
The appreciation in remaining value of assets for this segment by type of fund are as follows:
|
|
Year Ended December 31,
|
||
|
|
2017
|
2016
|
2015
|
|
Buyout funds
|
34%
|
12%
|
13%
|
|
Growth Capital funds
|
23%
|
3%
|
14%
|
|
Total
|
32%
|
11%
|
13%
|
Net performance fees as a percentage of total performance fees are as follows:
|
|
Year Ended December 31,
|
||
|
|
2017
|
2016
|
2015
|
|
|
(Dollars in millions)
|
||
|
Net Performance Fees
|
$877.6
|
$153.5
|
$367.2
|
|
|
|||
|
Percentage of Total Performance Fees
|
54%
|
54%
|
53%
|
Unrealized performance fees reflect the difference between total performance fees and realized performance fees. The recognition of realized performance fees results in a reversal of accumulated unrealized performance fees, generally resulting in minimal impact on total performance fees. Because unrealized performance fees are reversed upon a realization event, in periods where the Partnership generates significant realized performance fees unrealized performance fees can be negative even in periods of portfolio appreciation.
Total Investment Income.
Total investment income (realized and unrealized) for the year ended
December 31, 2017
was $
62.4 million
compared to investment income of $49.3 million for the year ended
December 31, 2016
. The increase in total investment income from
2016
to 2017 relates primarily to appreciation in our investments in our U.S. and Europe buyout funds in 2017 as compared to depreciation in our investments in these buyout funds in
2016
. Further contributing to the increase in total investment income was higher appreciation on investments in our Asia buyout funds in 2017 as compared to 2016. These increases to total investment income were partially offset by lower realized gains in our investments in the U.S. and Europe buyout funds as well as our investments in Europe growth funds in 2017 as compared to 2016.
Total investment income (realized and unrealized) for the year ended
December 31, 2016
was $49.3 million compared to investment income of $18.1 million for the year ended
December 31, 2015
. The increase in total investment income from
2015
to
2016
relates primarily to higher realized gains on investments in the U.S. and Europe buyout funds as well as appreciation on investments in the Asia buyout funds for
2016
as compared to depreciation on investments in these Asia buyout funds for
2015
. These increases were offset by unrealized losses on foreign currency hedges and depreciation on investments in our Europe buyout funds.
Equity-based Compensation.
Equity-based compensation was $
60.5 million
, $
69.3 million
, and $65.1 million for
the years ended December 31, 2017, 2016 and 2015
, respectively.
Reserve for Litigation and Contingencies.
Corporate Private Equity's share of the reserve for litigation and contingencies decreased $12.5 million for the year ended
December 31, 2017
. The decrease was primarily related to Corporate Private Equity's share of the $25 million reserve reversal related to the CCC litigation recognized in 2017. See Note 9 to the consolidated financial statements for more information on the CCC litigation. Corporate Private Equity had recognized its share of a $50 million reserve for litigation and contingencies for $26.8 million in
2015
.
127
Fee-earning AUM as of and for each of the Three Years in the Period Ended December 31, 2017
Fee-earning AUM is presented below for each period together with the components of change during each respective period.
The table below breaks out Fee-earning AUM by its respective components at each period.
|
|
As of December 31,
|
||||||||||
|
|
2017
|
2016
|
2015
|
||||||||
|
|
(Dollars in millions)
|
||||||||||
|
Corporate Private Equity
|
|||||||||||
|
Components of Fee-earning AUM (1)
|
|||||||||||
|
Fee-earning AUM based on capital commitments
|
$
|
25,809
|
|
$
|
25,390
|
|
$
|
25,438
|
|
||
|
Fee-earning AUM based on invested capital
|
7,675
|
|
9,377
|
|
13,647
|
|
|||||
|
Fee-earning AUM based on lower of cost or fair value and other
|
2,100
|
|
1,560
|
|
1,841
|
|
|||||
|
Total Fee-earning AUM
|
$
|
35,584
|
|
$
|
36,327
|
|
$
|
40,926
|
|
||
|
Weighted Average Management Fee Rates (2)
|
|||||||||||
|
All Funds
|
1.31
|
%
|
1.28
|
%
|
1.26
|
%
|
|||||
|
Funds in Investment Period
|
1.44
|
%
|
1.41
|
%
|
1.43
|
%
|
|||||
|
(1)
|
For additional information concerning the components of Fee-earning AUM, see “—Fee-earning Assets under Management.”
|
|
(2)
|
Represents the aggregate effective management fee rate of each fund in the segment, weighted by each fund’s Fee-earning AUM, as of the end of each period presented.
|
The table below provides the period to period rollforward of Fee-earning AUM.
|
|
Twelve Months Ended December 31,
|
||||||||||
|
|
2017
|
2016
|
2015
|
||||||||
|
|
(Dollars in millions)
|
||||||||||
|
Corporate Private Equity
|
|||||||||||
|
Fee-earning AUM Rollforward
|
|||||||||||
|
Balance, Beginning of Period
|
$
|
36,327
|
|
$
|
40,926
|
|
$
|
40,249
|
|
||
|
Inflows, including Fee-paying Commitments (1)
|
2,086
|
|
1,171
|
|
6,425
|
|
|||||
|
Outflows, including Distributions (2)
|
(3,692
|
)
|
(5,460
|
)
|
(4,854
|
)
|
|||||
|
Market Appreciation/(Depreciation) (3)
|
31
|
|
(220
|
)
|
(267
|
)
|
|||||
|
Foreign Exchange and other (4)
|
832
|
|
(90
|
)
|
(627
|
)
|
|||||
|
Balance, End of Period
|
$
|
35,584
|
|
$
|
36,327
|
|
$
|
40,926
|
|
||
|
(1)
|
Inflows represent limited partner capital raised and capital invested by carry funds outside the original investment period. Inflows do not include funds raised of $18.3 billion, which are not yet earning fees.
|
|
(2)
|
Outflows represent distributions from funds outside the investment period and changes in fee basis for our carry funds where the original investment period has expired.
|
|
(3)
|
Market Appreciation/(Depreciation) represents realized and unrealized gains (losses) on portfolio investments in our carry funds based on the lower of cost or fair value.
|
|
(4)
|
Represents the impact of foreign exchange rate fluctuations on the translation of our non-U.S. dollar denominated funds. Activity during the period is translated at the average rate for the period. Ending balances are translated at the spot rate as of period end.
|
Fee-earning AUM was
$35.6 billion
at
December 31, 2017
, a decrease of
$0.7 billion
, or
2%
, compared to
$36.3 billion
at
December 31, 2016
. This was driven by outflows of
$3.7 billion
which were principally a result of distributions from CP V and other buyout funds outside of their investment period. This decrease was partially offset by inflows of
$2.1 billion
primarily related to equity invested by CGP which charges management fees based on invested capital, as well well as new fee-paying commitments raised in CGFSP III. Also offsetting the decrease were
$0.8 billion
of foreign exchange gains from the
128
translation of our Euro-denominated Europe buyout and growth funds to USD for reporting purposes. Investment and distribution activity by funds still in the investment period does not impact Fee-earning AUM as these funds are based on commitments.
Fee-earning AUM was $36.3 billion at December 31, 2016, a decrease of $4.6 billion, or 11%, compared to $40.9 billion at December 31, 2015. This was driven by outflows of $5.5 billion which were principally a result of distributions from CP V, CEP III, and other buyout funds outside of their investment period. This decrease was partially offset by inflows of $1.2 billion primarily related to equity invested by CGP which charges management fees based on invested capital.
Fee-earning AUM was $40.9 billion at December 31, 2015, an increase of $0.7 billion, or 2%, compared to $40.2 billion at December 31, 2014. Inflows of $6.4 billion were primarily related to limited partner commitments raised by CEP IV, CJP III, and the activation of commitments in CEOF II. This was offset by outflows of $4.9 billion which were principally a result of distributions from several buyout funds that were outside of their investment period, in addition to the reduction in management fee basis from commitments to invested equity for funds at the end of their original investment period and $0.6 billion in foreign exchange loss.
Total AUM as of and for each of the Three Years in the Period Ended December 31, 2017
The table below provides the period to period rollforward of Total AUM.
|
|
Twelve Months Ended December 31,
|
||||||||||
|
|
2017
|
2016
|
2015
|
||||||||
|
|
(Dollars in millions)
|
||||||||||
|
Corporate Private Equity
|
|||||||||||
|
Total AUM Rollforward
|
|||||||||||
|
Balance, Beginning of Period
|
$
|
50,864
|
|
$
|
63,144
|
|
$
|
64,668
|
|
||
|
New Commitments (1)
|
20,544
|
|
818
|
|
8,164
|
|
|||||
|
Outflows (2)
|
(9,377
|
)
|
(12,910
|
)
|
(12,812
|
)
|
|||||
|
Market Appreciation/(Depreciation) (3)
|
9,668
|
|
3,226
|
|
5,358
|
|
|||||
|
Foreign Exchange Gain/(Loss) (4)
|
1,145
|
|
(25
|
)
|
(1,377
|
)
|
|||||
|
Other (5)
|
(286
|
)
|
(3,389
|
)
|
(857
|
)
|
|||||
|
Balance, End of Period
|
$
|
72,558
|
|
$
|
50,864
|
|
$
|
63,144
|
|
||
|
(1)
|
New Commitments reflects the impact of gross fundraising during the period. For funds or vehicles denominated in foreign currencies, this reflects translation at the average quarterly rate, while the separately reported Fundraising metric is translated at the spot rate for each individual closing.
|
|
(2)
|
Outflows includes distributions in our carry funds, related co-investment vehicles and separately managed accounts.
|
|
(3)
|
Market Appreciation/(Depreciation) generally represents realized and unrealized gains (losses) on portfolio investments in our carry funds, related co-investment vehicles and separately managed accounts.
|
|
(4)
|
Represents the impact of foreign exchange rate fluctuations on the translation of our non-U.S. dollar denominated funds. Activity during the period is translated at the average rate for the period. Ending balances are translated at the spot rate as of the period end.
|
|
(5)
|
Includes expiring available capital, the impact of capital calls for fees and expenses and other changes in AUM.
|
Total AUM was
$72.6 billion
at
December 31, 2017
, an increase of
$21.7 billion
, or
43%
, compared to
$50.9 billion
at
December 31, 2016
. This increase was driven by
$20.5 billion
of new commitments primarily due to fundraising in CP VII, CAP V, and CGFSP III. Also contributing to this increase was market appreciation of
$9.7 billion
. The carry funds driving appreciation for the period included
$2.8 billion
attributable to
CP VI
,
$1.7 billion
attributable to
CP V
, and
$1.5 billion
attributable to
CAP IV
. Partially offsetting the increase were
$9.4 billion
of outflows driven primarily by distributions in CP V, CEP III, and various other buyout funds.
Total AUM was $50.9 billion at December 31, 2016, a decrease of $12.2 billion, or 19%, compared to $63.1 billion at December 31, 2015. This decrease was driven by $12.9 billion of outflows primarily in our large prior vintage buyout funds and $3.4 billion of other activity, primarily related to the expiration of available capital in CP V, CJP II, and CEP III. Partially
129
offsetting this decrease was market appreciation of $3.2 billion. The carry funds driving appreciation for the period included
$1.4 billion
attributable to CP VI,
$0.7 billion
attributable to CP V, and
$0.5 billion
attributable to CAP IV.
Total AUM was $63.1 billion at December 31, 2015, a decrease of $1.6 billion, or 2%, compared to $64.7 billion at December 31, 2014. This decrease was primarily driven by outflows of $12.8 billion and $1.4 billion of foreign exchange loss. Offsetting this were $8.2 billion of new commitments driven by fundraising in CEP IV, CEOF II, CGP, CJP III and other funds and coinvestment vehicles and $5.4 billion of market appreciation, representing a 13% increase in our portfolio of carry funds for the period. The carry funds driving appreciation for the period included
$1.3 billion
attributable to CEP III,
$1.0 billion
attributable to CAP III, and
$0.4 billion
attributable to CP V.
Fund Performance Metrics
Fund performance information for our investment funds that generally have at least $1.0 billion in capital commitments, cumulative equity invested or total value as of
December 31, 2017
, which we refer to as our “significant funds,” is included throughout this discussion and analysis to facilitate an understanding of our results of operations for the periods presented. The fund return information reflected in this discussion and analysis is not indicative of the performance of The Carlyle Group L.P. and is also not necessarily indicative of the future performance of any particular fund. An investment in The Carlyle Group L.P. is not an investment in any of our funds. There can be no assurance that any of our funds or our other existing and future funds will achieve similar returns. See “Item 1A. Risk Factors — Risks Related to Our Business Operations — The historical returns attributable to our funds, including those presented in this report, should not be considered as indicative of the future results of our funds or of our future results or of any returns expected on an investment in our common units.”
130
The following tables reflect the performance of our significant funds in our Corporate Private Equity business. See “Item 1. Business — Our Family of Funds” for a legend of the fund acronyms listed below.
|
TOTAL INVESTMENTS
|
REALIZED/PARTIALLY REALIZED INVESTMENTS(5)
|
|||||||||||||||||||||||||||||||||
|
|
As of December 31, 2017
|
As of December 31, 2017
|
||||||||||||||||||||||||||||||||
|
Fund Inception Date (1)
|
Committed
Capital
|
Cumulative
Invested
Capital (2)
|
Total
Fair
Value (3)
|
MOIC(4)
|
Gross IRR (7)(12)
|
Net IRR (8)(12)
|
Cumulative
Invested
Capital(2)
|
Total
Fair
Value(3)
|
MOIC(4)
|
Gross
IRR(7)
|
||||||||||||||||||||||||
|
Corporate Private Equity
|
(Reported in Local Currency, in Millions)
|
(Reported in Local Currency, in Millions)
|
||||||||||||||||||||||||||||||||
|
Fully Invested/Committed Funds (6)
|
||||||||||||||||||||||||||||||||||
|
CP II
|
10/1994
|
$
|
1,331.1
|
|
$
|
1,362.4
|
|
$
|
4,072.2
|
|
3.0x
|
34
|
%
|
25
|
%
|
$
|
1,362.4
|
|
$
|
4,072.2
|
|
3.0x
|
34
|
%
|
||||||||||
|
CP III
|
2/2000
|
$
|
3,912.7
|
|
$
|
4,031.6
|
|
$
|
10,146.9
|
|
2.5x
|
27
|
%
|
21
|
%
|
$
|
4,031.6
|
|
$
|
10,146.9
|
|
2.5x
|
27
|
%
|
||||||||||
|
CP IV
|
12/2004
|
$
|
7,850.0
|
|
$
|
7,612.6
|
|
$
|
17,937.9
|
|
2.4x
|
16
|
%
|
13
|
%
|
$
|
7,612.6
|
|
$
|
17,937.9
|
|
2.4x
|
16
|
%
|
||||||||||
|
CP V
|
5/2007
|
$
|
13,719.7
|
|
$
|
13,190.9
|
|
$
|
27,362.9
|
|
2.1x
|
18
|
%
|
14
|
%
|
$
|
9,350.8
|
|
$
|
24,962.3
|
|
2.7x
|
26
|
%
|
||||||||||
|
CEP I
|
12/1997
|
€
|
1,003.6
|
|
€
|
981.6
|
|
€
|
2,126.5
|
|
2.2x
|
18
|
%
|
11
|
%
|
€
|
981.6
|
|
€
|
2,126.5
|
|
2.2x
|
18
|
%
|
||||||||||
|
CEP II
|
9/2003
|
€
|
1,805.4
|
|
€
|
2,048.4
|
|
€
|
4,122.3
|
|
2.0x
|
36
|
%
|
20
|
%
|
€
|
1,883.8
|
|
€
|
4,106.8
|
|
2.2x
|
43
|
%
|
||||||||||
|
CEP III
|
12/2006
|
€
|
5,294.9
|
|
€
|
5,116.1
|
|
€
|
11,572.3
|
|
2.3x
|
19
|
%
|
14
|
%
|
€
|
4,284.4
|
|
€
|
10,419.8
|
|
2.4x
|
20
|
%
|
||||||||||
|
CAP I
|
12/1998
|
$
|
750.0
|
|
$
|
627.7
|
|
$
|
2,521.8
|
|
4.0x
|
25
|
%
|
18
|
%
|
$
|
627.7
|
|
$
|
2,521.8
|
|
4.0x
|
25
|
%
|
||||||||||
|
CAP II
|
2/2006
|
$
|
1,810.0
|
|
$
|
1,628.2
|
|
$
|
3,051.5
|
|
1.9x
|
11
|
%
|
8
|
%
|
$
|
1,628.2
|
|
$
|
3,051.5
|
|
1.9x
|
11
|
%
|
||||||||||
|
CAP III
|
5/2008
|
$
|
2,551.6
|
|
$
|
2,543.2
|
|
$
|
4,817.2
|
|
1.9x
|
18
|
%
|
12
|
%
|
$
|
2,071.8
|
|
$
|
4,380.2
|
|
2.1x
|
20
|
%
|
||||||||||
|
CJP I
|
10/2001
|
¥
|
50,000.0
|
|
¥
|
47,291.4
|
|
¥
|
138,902.1
|
|
2.9x
|
61
|
%
|
37
|
%
|
¥
|
47,291.4
|
|
¥
|
138,902.1
|
|
2.9x
|
61
|
%
|
||||||||||
|
CJP II
|
7/2006
|
¥
|
165,600.0
|
|
¥
|
141,866.7
|
|
¥
|
216,622.1
|
|
1.5x
|
8
|
%
|
4
|
%
|
¥
|
126,166.7
|
|
¥
|
191,642.2
|
|
1.5x
|
7
|
%
|
||||||||||
|
CGFSP I
|
9/2008
|
$
|
1,100.2
|
|
$
|
1,080.7
|
|
$
|
2,462.1
|
|
2.3x
|
20
|
%
|
14
|
%
|
$
|
977.9
|
|
$
|
2,318.7
|
|
2.4x
|
22
|
%
|
||||||||||
|
CGFSP II
|
4/2013
|
$
|
1,000.0
|
|
$
|
897.2
|
|
$
|
1,320.5
|
|
1.5x
|
24%
|
|
15%
|
|
$
|
193.2
|
|
$
|
407.3
|
|
2.1x
|
32
|
%
|
||||||||||
|
CEOF I
|
5/2011
|
$
|
1,119.1
|
|
$
|
1,164.5
|
|
$
|
1,569.6
|
|
1.3x
|
12
|
%
|
8
|
%
|
$
|
346.9
|
|
$
|
827.7
|
|
2.4x
|
38
|
%
|
||||||||||
|
CETP II
|
2/2007
|
€
|
521.6
|
|
€
|
437.4
|
|
€
|
1,253.6
|
|
2.9x
|
28
|
%
|
19
|
%
|
€
|
278.8
|
|
€
|
1,140.8
|
|
4.1x
|
36
|
%
|
||||||||||
|
CAGP IV
|
6/2008
|
$
|
1,041.4
|
|
$
|
954.1
|
|
$
|
1,459.9
|
|
1.5x
|
12
|
%
|
7
|
%
|
$
|
502.1
|
|
$
|
928.6
|
|
1.8x
|
16
|
%
|
||||||||||
|
All Other Funds (9)
|
Various
|
|
$
|
4,655.4
|
|
$
|
7,220.2
|
|
1.6x
|
16
|
%
|
7
|
%
|
$
|
3,747.5
|
|
$
|
6,048.6
|
|
1.6x
|
17
|
%
|
||||||||||||
|
Co-investments and Other (10)
|
Various
|
|
$
|
11,040.3
|
|
$
|
24,964.7
|
|
2.3x
|
36
|
%
|
33
|
%
|
$
|
6,998.2
|
|
$
|
20,778.0
|
|
3.0x
|
36
|
%
|
||||||||||||
|
Total Fully Invested/Committed Funds
|
$
|
62,787.0
|
|
$
|
134,994.5
|
|
2.2x
|
26
|
%
|
19
|
%
|
$
|
49,921.3
|
|
$
|
122,707.5
|
|
2.5x
|
27
|
%
|
||||||||||||||
|
Funds in the Investment Period(6)
|
||||||||||||||||||||||||||||||||||
|
CP VI
|
5/2012
|
$
|
13,000.0
|
|
$
|
11,753.9
|
|
$
|
16,265.3
|
|
1.4x
|
20%
|
|
13%
|
|
|
|
|
|
|||||||||||||||
|
CEP IV
|
8/2013
|
€
|
3,669.5
|
|
€
|
3,074.2
|
|
€
|
3,720.3
|
|
1.2x
|
18%
|
|
7%
|
|
|
|
|
|
|
|
|
||||||||||||
|
CAP IV
|
11/2012
|
$
|
3,880.4
|
|
$
|
3,184.1
|
|
$
|
5,206.6
|
|
1.6x
|
31%
|
|
20%
|
|
|
|
|
|
|||||||||||||||
|
CGP
|
12/2014
|
$
|
3,588.0
|
|
$
|
2,668.7
|
|
$
|
2,795.1
|
|
1.0x
|
5%
|
|
4%
|
|
|
|
|
|
|||||||||||||||
|
CJP III
|
8/2013
|
¥
|
119,505.1
|
|
¥
|
60,094.5
|
|
¥
|
105,936.6
|
|
1.8x
|
NM
|
|
NM
|
|
|
|
|
|
|||||||||||||||
|
CEOF II
|
3/2015
|
$
|
2,400.0
|
|
$
|
1,150.1
|
|
$
|
1,332.4
|
|
1.2x
|
NM
|
|
NM
|
|
|
|
|
|
|||||||||||||||
|
All Other Funds (11)
|
Various
|
|
$
|
1,385.1
|
|
$
|
1,822.4
|
|
1.3x
|
NM
|
|
NM
|
|
|
|
|
|
|||||||||||||||||
|
Total Funds in the Investment Period
|
$
|
24,371.2
|
|
$
|
32,834.9
|
|
1.3x
|
21
|
%
|
12
|
%
|
$
|
1,391.0
|
|
$
|
3,731.1
|
|
2.7x
|
58
|
%
|
||||||||||||||
|
TOTAL CORPORATE PRIVATE EQUITY (13)
|
$
|
87,158.2
|
|
$
|
167,829.4
|
|
1.9x
|
26
|
%
|
18
|
%
|
$
|
51,312.2
|
|
$
|
126,438.7
|
|
2.5x
|
27
|
%
|
||||||||||||||
|
(1)
|
The data presented herein that provides “inception to date” performance results of our segments relates to the period following the formation of the first fund within each segment. For our Corporate Private Equity segment our first fund was formed in 1990.
|
|
(2)
|
Represents the original cost of all capital called for investments since inception of the fund.
|
|
(3)
|
Represents all realized proceeds combined with remaining fair value, before management fees, expenses and carried interest.
|
|
(4)
|
Multiple of invested capital (“MOIC”) represents total fair value, before management fees, expenses and carried interest, divided by cumulative invested capital.
|
|
(5)
|
An investment is considered realized when the investment fund has completely exited, and ceases to own an interest in, the investment. An investment is considered partially realized when the total amount of proceeds received in respect of such investment, including dividends, interest or other distributions and/or return of capital, represents at least 85% of invested capital and such investment is not yet fully realized. Because part of our value creation strategy involves pursuing best exit alternatives, we believe information regarding Realized/Partially Realized MOIC and Gross IRR, when considered together with the other investment performance metrics presented, provides investors with meaningful
|
131
information regarding our investment performance by removing the impact of investments where significant realization activity has not yet occurred. Realized/Partially Realized MOIC and Gross IRR have limitations as measures of investment performance, and should not be considered in isolation. Such limitations include the fact that these measures do not include the performance of earlier stage and other investments that do not satisfy the criteria provided above. The exclusion of such investments will have a positive impact on Realized/Partially Realized MOIC and Gross IRR in instances when the MOIC and Gross IRR in respect of such investments are less than the aggregate MOIC and Gross IRR. Our measurements of Realized/Partially Realized MOIC and Gross IRR may not be comparable to those of other companies that use similarly titled measures. We do not present Realized/Partially Realized performance information separately for funds that are still in the investment period because of the relatively insignificant level of realizations for funds of this type.
However, to the extent such funds have had realizations, they are included in the Realized/Partially Realized performance information presented for Total Corporate Private Equity.
|
(6)
|
Fully Invested funds are past the expiration date of the investment period as defined in the respective limited partnership agreement. In instances where a successor fund has had its first capital call, the predecessor fund is categorized as fully invested.
|
|
(7)
|
Gross Internal Rate of Return (“Gross IRR”) represents the annualized IRR for the period indicated on Limited Partner invested capital based on contributions, distributions and unrealized value before management fees, expenses and carried interest.
|
|
(8)
|
Net Internal Rate of Return (“Net IRR”) represents the annualized IRR for the period indicated on Limited Partner invested capital based on contributions, distributions and unrealized value after management fees, expenses and carried interest. Fund level IRRs are based on aggregate Limited Partner cash flows, and this blended return may differ from that of individual Limited Partners. As a result, certain funds may generate accrued performance fees with a blended Net IRR that is below the preferred return hurdle for that fund.
|
|
(9)
|
Aggregate includes the following funds: CP I, CMG, CVP I, CVP II, CUSGF III, CEVP, CETP I, CAVP I, CAVP II, CAGP III, CSABF, Mexico, CBPF, and MENA.
|
|
(10)
|
Includes co-investments and certain other stand-alone investments arranged by us.
|
|
(11)
|
Aggregate, which is considered not meaningful, includes the following funds and their respective commencement dates: CSSAF (April 2012) , CPF I (June 2012), CCI (December 2012), CETP III (May 2014), CAGP V (May 2016), and CBPF II (November 2017).
|
|
(12)
|
For funds marked “NM,” IRR may be positive or negative, but is not considered meaningful because of the limited time since initial investment and early stage of capital deployment. For funds marked “Neg,” IRR is negative as of reporting period end.
|
|
(13)
|
For purposes of aggregation, funds that report in foreign currency have been converted to U.S. dollars at the reporting period spot rate.
|
132
|
Remaining
Fair
Value (1)
|
Unrealized
MOIC (2)
|
Total
MOIC (3)
|
%
Invested(4)
|
In Accrued
Carry/
(Giveback) (5)
|
LTM
Realized
Carry (6)
|
Catch up
Rate
|
Fee Initiation
Date (7)
|
Quarters
Since Fee
Initiation
|
Original
Investment
Period
End Date
|
|||||||||||||||
|
|
As of December 31, 2017
|
|||||||||||||||||||||||
|
Corporate Private Equity
|
||||||||||||||||||||||||
|
CP VI
|
$
|
13,613.2
|
|
1.3x
|
1.4x
|
90
|
%
|
X
|
|
100
|
%
|
Jun-13
|
19
|
|
May-18
|
|||||||||
|
CAP IV
|
$
|
4,683.3
|
|
1.6x
|
1.6x
|
82
|
%
|
X
|
|
100
|
%
|
Jul-13
|
18
|
|
Nov-18
|
|||||||||
|
CEP IV
|
€
|
3,246.1
|
|
1.2x
|
1.2x
|
84
|
%
|
X
|
|
100
|
%
|
Sep-14
|
14
|
|
Aug-19
|
|||||||||
|
CGP
|
$
|
2,782.8
|
|
1.0x
|
1.0x
|
74
|
%
|
|
|
100
|
%
|
Jan-15
|
12
|
|
Dec-20
|
|||||||||
|
CP V
|
$
|
2,672.7
|
|
0.7x
|
2.1x
|
96
|
%
|
X
|
X
|
100
|
%
|
Jun-07
|
43
|
|
May-13
|
|||||||||
|
CEP III
|
€
|
1,398.2
|
|
1.6x
|
2.3x
|
97
|
%
|
X
|
X
|
100
|
%
|
Jul-07
|
42
|
|
Dec-12
|
|||||||||
|
CEOF II
|
$
|
1,220.3
|
|
1.1x
|
1.2x
|
48
|
%
|
|
|
80
|
%
|
Nov-15
|
9
|
|
Mar-21
|
|||||||||
|
CAP III
|
$
|
1,203.7
|
|
2.0x
|
1.9x
|
100
|
%
|
X
|
X
|
100
|
%
|
Jun-08
|
39
|
|
May-14
|
|||||||||
|
CGFSP II
|
$
|
885.4
|
|
1.4x
|
1.5x
|
90
|
%
|
X
|
|
100
|
%
|
Jun-13
|
19
|
|
Dec-17
|
|||||||||
|
CEOF I
|
$
|
765.9
|
|
0.9x
|
1.3x
|
104
|
%
|
X
|
|
80
|
%
|
Sep-11
|
26
|
|
May-17
|
|||||||||
|
CJP III
|
¥
|
78,171.1
|
|
1.6x
|
1.8x
|
50
|
%
|
X
|
|
100
|
%
|
Sep-13
|
18
|
|
Feb-20
|
|||||||||
|
CAGP IV
|
$
|
515.8
|
|
1.2x
|
1.5x
|
92
|
%
|
|
|
100
|
%
|
Aug-08
|
38
|
|
Jun-14
|
|||||||||
|
CGFSP I
|
$
|
210.6
|
|
1.2x
|
2.3x
|
98
|
%
|
X
|
X
|
100
|
%
|
Oct-08
|
37
|
|
Sep-14
|
|||||||||
|
CJP II
|
¥
|
21,555.0
|
|
1.4x
|
1.5x
|
86
|
%
|
|
|
80
|
%
|
Oct-06
|
45
|
|
Jul-12
|
|||||||||
|
CP IV
|
$
|
187.1
|
|
2.0x
|
2.4x
|
97
|
%
|
X
|
X
|
80
|
%
|
Apr-05
|
51
|
|
Dec-10
|
|||||||||
|
CETP II
|
€
|
111.5
|
|
0.7x
|
2.9x
|
84
|
%
|
X
|
X
|
100
|
%
|
Jan-08
|
40
|
|
Jul-13
|
|||||||||
|
All Other Funds (8)
|
$
|
2,669.5
|
|
1.2x
|
2.1x
|
NM
|
NM
|
|||||||||||||||||
|
Co-investment and Other (9)
|
$
|
4,623.9
|
|
1.2x
|
2.3x
|
NM
|
NM
|
|||||||||||||||||
|
Total Corporate Private Equity (10)
|
$
|
42,636.8
|
|
1.2x
|
1.9x
|
|||||||||||||||||||
|
(1)
|
Remaining Fair Value reflects the unrealized carrying value of investments in carry funds and related co-investment vehicles. Significant funds with remaining fair value of greater than $100 million are listed individually.
|
|
(2)
|
Unrealized multiple of invested capital (“MOIC”) represents remaining fair market value, before management fees, expenses and carried interest, divided by investment cost.
|
|
(3)
|
Total MOIC represents total fair value, before management fees, expenses and carried interest, divided by cumulative invested capital. For certain funds, represents the original cost of investments net of investment-level recallable proceeds, which is adjusted to reflect recyclability of invested capital for the purpose of calculating the fund MOIC.
|
|
(4)
|
Represents cumulative equity invested as of the reporting period divided by total commitments. Amount can be greater than 100% due to the re-investment of recallable distributions to fund investors.
|
|
(5)
|
Fund has accrued carry/(giveback) as of the reporting period.
|
|
(6)
|
Fund has realized carry in the last twelve months.
|
|
(7)
|
Represents the date of the first capital contribution for management fees.
|
|
(8)
|
Aggregate includes the following funds: CMG, CP I, CP II, CP III, CEP I, CEP II, CAP I, CAP II, CBPF, CBPF II, CJP I, CEVP, CETP I, CETP III, CCI, CAVP I, CAVP II, CAGP III, CAGP V, Mexico, MENA, CSABF, CSSAF, CPF, CVP I, CVP II, and CUSGF III. In Accrued Carry/(Clawback) and LTM Realized Carry not indicated because the indicator does not apply to each fund within the aggregate.
|
|
(9)
|
Includes co-investments, prefund investments and certain other stand-alone investments arranged by us. In Accrued Carry/(Giveback) and LTM Realized Carry not indicated because the indicator does not apply to each fund within the aggregate.
|
|
(10)
|
For purposes of aggregation, funds that report in foreign currency have been converted to U.S. dollars at the reporting period spot rate.
|
133
Real Assets
For purposes of presenting our results of operations for this segment, our earnings from our investments in NGP are presented in the respective operating captions and the net income or loss from Urbplan allocable to the Partnership (after consideration of amounts allocable to non-controlling interests) is presented within investment income. We disposed of our interests in Urbplan in a transaction in which a third party acquired operational control and all of the economic interests in Urbplan in 2017. With this transaction, we deconsolidated Urbplan from our financial results (see Note 15 to our consolidated financial statements) and we expect that this will reduce investment losses in the segment going forward. The following table presents our results of operations for our Real Assets segment:
|
|
Year Ended December 31,
|
||||||||||
|
|
2017
|
2016
|
2015
|
||||||||
|
|
(Dollars in millions)
|
||||||||||
|
Segment Revenues
|
|||||||||||
|
Fund level fee revenues
|
|||||||||||
|
Fund management fees
|
$
|
263.6
|
|
$
|
251.1
|
|
$
|
255.9
|
|
||
|
Portfolio advisory fees, net
|
0.8
|
|
0.2
|
|
0.4
|
|
|||||
|
Transaction fees, net
|
4.5
|
|
—
|
|
2.1
|
|
|||||
|
Total fund level fee revenues
|
268.9
|
|
251.3
|
|
258.4
|
|
|||||
|
Performance fees
|
|||||||||||
|
Realized
|
92.0
|
|
53.1
|
|
163.2
|
|
|||||
|
Unrealized
|
268.3
|
|
274.0
|
|
(42.5
|
)
|
|||||
|
Total performance fees
|
360.3
|
|
327.1
|
|
120.7
|
|
|||||
|
Investment income (loss)
|
|||||||||||
|
Realized
|
(63.2
|
)
|
(20.6
|
)
|
(93.6
|
)
|
|||||
|
Unrealized
|
26.7
|
|
1.4
|
|
63.1
|
|
|||||
|
Total investment loss
|
(36.5
|
)
|
(19.2
|
)
|
(30.5
|
)
|
|||||
|
Interest income
|
3.0
|
|
1.7
|
|
0.3
|
|
|||||
|
Other income
|
2.2
|
|
1.6
|
|
2.6
|
|
|||||
|
Total revenues
|
597.9
|
|
562.5
|
|
351.5
|
|
|||||
|
Segment Expenses
|
|||||||||||
|
Compensation and benefits
|
|||||||||||
|
Direct base compensation
|
77.6
|
|
72.1
|
|
70.0
|
|
|||||
|
Indirect base compensation
|
50.5
|
|
39.1
|
|
39.3
|
|
|||||
|
Equity-based compensation
|
34.9
|
|
26.3
|
|
25.0
|
|
|||||
|
Performance fee related
|
|||||||||||
|
Realized
|
41.6
|
|
37.6
|
|
68.5
|
|
|||||
|
Unrealized
|
75.3
|
|
81.9
|
|
26.3
|
|
|||||
|
Total compensation and benefits
|
279.9
|
|
257.0
|
|
229.1
|
|
|||||
|
General, administrative, and other indirect expenses
|
78.5
|
|
67.1
|
|
74.6
|
|
|||||
|
Depreciation and amortization expense
|
7.1
|
|
5.9
|
|
4.3
|
|
|||||
|
Interest expense
|
17.0
|
|
16.0
|
|
10.6
|
|
|||||
|
Total expenses
|
382.5
|
|
346.0
|
|
318.6
|
|
|||||
|
Economic Income
|
$
|
215.4
|
|
$
|
216.5
|
|
$
|
32.9
|
|
||
|
(-) Net Performance Fees
|
243.4
|
|
207.6
|
|
25.9
|
|
|||||
|
(-) Investment Loss
|
(36.5
|
)
|
(19.2
|
)
|
(30.5
|
)
|
|||||
|
(+) Equity-based Compensation
|
34.9
|
|
26.3
|
|
25.0
|
|
|||||
|
(+) Net interest
|
14.0
|
|
14.3
|
|
10.3
|
|
|||||
|
(+) Reserve for Litigation and Contingencies
|
(5.8
|
)
|
—
|
|
9.2
|
|
|||||
|
(=) Fee Related Earnings
|
$
|
51.6
|
|
$
|
68.7
|
|
$
|
82.0
|
|
||
|
(+) Realized Net Performance Fees
|
50.4
|
|
15.5
|
|
94.7
|
|
|||||
|
(+) Realized Investment Loss
|
(63.2
|
)
|
(20.6
|
)
|
(93.6
|
)
|
|||||
|
(+) Net interest
|
(14.0
|
)
|
(14.3
|
)
|
(10.3
|
)
|
|||||
|
(=) Distributable Earnings
|
$
|
24.8
|
|
$
|
49.3
|
|
$
|
72.8
|
|
||
134
Year Ended
December 31, 2017
Compared to Year Ended
December 31, 2016
and Year Ended
December 31, 2016
Compared to Year Ended
December 31, 2015
Distributable Earnings
Distributable earnings
decreased
$
24.5 million
for the year ended
December 31, 2017
as compared to
2016
and decreased $23.5 million for the year ended
December 31, 2016
as compared to
2015
. The following table provides the components of the change in distributable earnings for the years ended
December 31, 2017 and 2016
:
|
|
Year Ended December 31,
|
|||||
|
|
2017
|
2016
|
||||
|
|
(Dollars in Millions)
|
|||||
|
Distributable earnings, prior year
|
$
|
49.3
|
|
$
|
72.8
|
|
|
Increases (decreases):
|
||||||
|
Increase (decrease) in realized net performance fees
|
34.9
|
|
(79.2
|
)
|
||
|
(Increase) decrease in realized investment loss
|
(42.6
|
)
|
73.0
|
|
||
|
Decrease in fee related earnings
|
(17.1
|
)
|
(13.3
|
)
|
||
|
Decrease (increase) in net interest
|
0.3
|
|
(4.0
|
)
|
||
|
Total decrease
|
(24.5
|
)
|
(23.5
|
)
|
||
|
Distributable earnings, current year
|
$
|
24.8
|
|
$
|
49.3
|
|
Realized Net Performance Fees.
Realized net performance fees
increased
$
34.9 million
for the year ended
December 31, 2017
as compared to
2016
, and decreased $79.2 million for the year ended
December 31, 2016
as compared to
2015
. The increase in realized net performance fees for the year ended
December 31, 2017
as compared to
2016
was primarily due to higher realizations on a certain U.S real estate fund and our power opportunities fund as well as the absence in 2017 of the 2016 realization of giveback obligations on two of our Legacy Energy funds (Energy II and Energy III), which resulted in a decrease of $35.9 million in realized net performance fees in 2016. These realizations were partially offset by lower realizations on a Europe real estate external coinvestment fund in 2017 as compared to 2016. The decrease in realized net performance fees for the year ended
December 31, 2016
as compared to the year ended
December 31, 2015
was primarily due to lower realizations in our U.S. real estate funds in
2016
as compared to
2015
and the absence in
2016
of realizations in our power opportunities fund. In addition, we realized the giveback obligations in
2016
on Energy II and Energy III, which resulted in a decrease of $35.9 million in realized net performance fees. Realized net performance fees were primarily generated by the following funds for the years ended December 31, 2017, 2016 and 2015, respectively:
|
Year Ended December 31,
|
||
|
2017
|
2016
|
2015
|
|
CRP VI
|
CRP VI
|
CRP VI
|
|
CPOCP
|
CEREP III - External
Co-invest |
CRP III
|
|
|
CRP III
|
CPOCP
|
Realized Investment Loss.
Realized investment loss increased $
42.6 million
for the year ended
December 31, 2017
as compared to
2016
, and realized investment loss decreased $73.0 million for the year ended
December 31, 2016
as compared to
2015
. The increase in realized investment loss for the year ended
December 31, 2017
as compared to
2016
primarily relates to the recognition of $75.0 million of Urbplan losses, including a $65.0 million realized investment loss in 2017 associated with the disposal of our interests in Urbplan in a transaction in which a third party acquired operational control and all of the economic interests in Urbplan. With this transaction, we deconsolidated Urbplan from our financial results (see Note 15 to the consolidated financial statements). Additionally, we recognized realized investment losses related to Urbplan of $37.1 million during
2016
. These realized losses in 2017 were partially offset by higher realized gains on investments in our Europe real estate funds in 2017 as compared to 2016 and higher realized gains on NGP fund investments in 2016 as compared to 2017.
The decrease in realized investment loss for the year ended
December 31, 2016
as compared to
2015
primarily relates to the absence in
2016
of the realized investment loss recorded in
2015
relating to the realization of Carlyle's cumulative losses from our guarantee of liabilities of Carlyle Europe Real Estate Partners I, L.P. (“CEREP I”) associated with an adverse court
135
judgment in a French tax court proceeding of $80 million. (See Note 9 to the consolidated financial statements.) Additionally, there were higher realized investment losses of $16.0 million in
2016
as compared to
2015
associated with Urbplan. These realized investment losses were partially offset by higher realized gains on investments in our real estate funds and the NGP funds.
Fee Related Earnings
Fee related earnings
decreased
$
17.1 million
for the year ended
December 31, 2017
as compared to
2016
and decreased $13.3 million for the year ended
December 31, 2016
as compared to
2015
. The following table provides the components of the change in fee related earnings for the years ended
December 31, 2017 and 2016
:
|
|
Year Ended December 31,
|
|||||
|
|
2017
|
2016
|
||||
|
|
(Dollars in Millions)
|
|||||
|
Fee related earnings, prior year
|
$
|
68.7
|
|
$
|
82.0
|
|
|
Increases (decreases):
|
||||||
|
Increase (decrease) in fee revenues
|
17.6
|
|
(7.1
|
)
|
||
|
Increase in direct and indirect base compensation
|
(16.9
|
)
|
(1.9
|
)
|
||
|
Increase in general, administrative and other
expenses |
(17.2
|
)
|
(1.7
|
)
|
||
|
Increase in interest expense
|
(1.0
|
)
|
(5.4
|
)
|
||
|
All other changes
|
0.4
|
|
2.8
|
|
||
|
Total decrease
|
(17.1
|
)
|
(13.3
|
)
|
||
|
Fee related earnings, current year
|
$
|
51.6
|
|
$
|
68.7
|
|
Fee Revenues.
Total fee revenues
increased
$
17.6 million
for the year ended
December 31, 2017
as compared to
2016
and decreased $7.1 million for the year ended
December 31, 2016
as compared to the same period in
2015
, due to the following:
|
|
Year Ended December 31,
|
|||||
|
|
2017
|
2016
|
||||
|
|
(Dollars in Millions)
|
|||||
|
Higher (lower) fund management fees
|
$
|
12.5
|
|
$
|
(4.8
|
)
|
|
Higher (lower) transaction fees
|
4.5
|
|
(2.1
|
)
|
||
|
Higher (lower) portfolio advisory fees
|
0.6
|
|
(0.2
|
)
|
||
|
Total increase (decrease) in fee revenues
|
$
|
17.6
|
|
$
|
(7.1
|
)
|
The
increase
in fund management fees for the year ended
December 31, 2017
as compared to
2016
primarily reflects increased management fees from our eighth real estate fund (“CRP VIII”), which had its first closing in 2017. This increase was partially offset by a $8.6 million decrease in catch-up management fees for the year ended
December 31, 2017
as compared to
2016
. While there were no significant catch-up management fees during 2017, catch-up management fees of $8.6 million for the year ended
December 31, 2016
were primarily due to subsequent closes in
2016
for our second power fund (“CPP II”) and our first international energy fund (“CIEP I”).
The decrease in fund management fees for the year ended
December 31, 2016
as compared to 2015 primarily reflects a $15.2 million decrease in catch-up management fees from $23.8 million in
2015
to $8.6 million in
2016
. The higher catch-up management fees in
2015
primarily related to subsequent closings in
2015
on our seventh U.S. real estate fund (“CRP VII”), CIEP I and CPP II. This decrease was partially offset by increased management fee revenues due to higher assets under management from additional commitments raised during
2015
and
2016
for CPP II, CRP VII, and CIEP I as well as the activation of management fees in NGP XI.
The total weighted average management fee rate declined to
1.20%
at December 31, 2017 from
1.26%
at December 31, 2016 primarily due to new funds being raised with lower management fee rates. The weighted average management fee rate for funds in the investment period decreased to
1.35%
at December 31, 2017 from
1.43%
at December 31, 2016.
136
The total weighted average management fee rate increased to 1.26% at December 31, 2016 from 1.24% at December 31, 2015 primarily due to funds inside the investment period accounting for a larger portion of Fee-earning AUM in the segment. The weighted average management fee rate for funds in the investment period declined to 1.43% at December 31, 2016 from 1.44% at December 31, 2015.
Direct and indirect compensation expense.
Direct and indirect compensation expense
increased
$
16.9 million
for the year ended
December 31, 2017
as compared to
2016
primarily due to higher compensation associated with fundraising activities of $8.6 million in 2017 versus
2016
and an increase in 2017 cash bonuses.
Direct and indirect compensation expense increased $1.9 million for the year ended
December 31, 2016
as compared to
2015
primarily due to increased headcount, partially offset by lower compensation associated with fundraising activities of $3.3 million in
2016
versus
2015
.
General, administrative and other indirect expenses.
General, administrative and other indirect expenses increased $17.2 million for the year ended
December 31, 2017
as compared to
2016
. The primary drivers of the increase were foreign currency losses recorded in 2017 as compared to foreign currency gains recorded in
2016
, increased real estate costs, and increased external costs associated with fundraising activities of $10.0 million related to CRP VIII.
General, administrative and other indirect expenses increased $1.7 million for the year ended
December 31, 2016
as compared to
2015
, primarily due to an increase in professional fees, partially offset by a decrease in external costs associated with fundraising activities.
Economic Income
Economic income
decreased
$
1.1 million
for the year ended
December 31, 2017
as compared to
2016
and economic income increased $183.6 million for the year ended
December 31, 2016
as compared to
2015
. The following table provides the components of the change in economic income for the years ended
December 31, 2017 and 2016
:
|
|
Year Ended December 31,
|
|||||
|
|
2017
|
2016
|
||||
|
|
(Dollars in Millions)
|
|||||
|
Economic income, prior year
|
$
|
216.5
|
|
$
|
32.9
|
|
|
Increases (decreases):
|
||||||
|
Increase in net performance fees
|
35.8
|
|
181.7
|
|
||
|
(Increase) decrease in investment loss
|
(17.3
|
)
|
11.3
|
|
||
|
Increase in equity-based compensation
|
(8.6
|
)
|
(1.3
|
)
|
||
|
Decrease in fee related earnings
|
(17.1
|
)
|
(13.3
|
)
|
||
|
Decrease (increase) in net interest
|
0.3
|
|
(4.0
|
)
|
||
|
Decrease in reserve for litigation and contingencies
|
5.8
|
|
9.2
|
|
||
|
Total (decrease) increase
|
(1.1
|
)
|
183.6
|
|
||
|
Economic income, current year
|
$
|
215.4
|
|
$
|
216.5
|
|
Performance Fees.
Performance fees (realized and unrealized)
increased
$33.2 million
for the year ended
December 31, 2017
as compared to the year ended
December 31, 2016
primarily due to higher appreciation from the NGP funds, partially offset by a decrease in performance fees generated by the real estate funds. Performance fees (realized and unrealized) increased $206.4 million for the year ended
December 31, 2016
as compared to the year ended
December 31, 2015
primarily due to CRP VII exceeding its performance threshold in
2016
and, therefore recognizing performance fees, performance fees generated by the NGP funds in
2016
as compared to performance fee reversals in
2015
, and a reduction in the giveback liability associated with certain of our Legacy Energy funds in
2016
.
137
Performance fees are from the following types of funds:
|
Performance Fees
|
|||||||||||
|
|
Year Ended December 31,
|
||||||||||
|
|
2017
|
2016
|
2015
|
||||||||
|
|
(Dollars in millions)
|
||||||||||
|
Real Estate funds
|
$
|
196.8
|
|
$
|
261.0
|
|
$
|
204.1
|
|
||
|
Natural Resources funds
|
161.0
|
|
42.0
|
|
(0.8
|
)
|
|||||
|
Legacy Energy funds
|
2.5
|
|
24.1
|
|
(82.6
|
)
|
|||||
|
Total performance fees
|
$
|
360.3
|
|
$
|
327.1
|
|
$
|
120.7
|
|
||
The
$360.3 million
of performance fees for the year ended
December 31, 2017
was driven primarily by performance fees recognized from the following funds:
•
CRP VII of $107.7 million,
•
NGP XI of $96.2 million,
•
CIEP I of $54.0 million,
•
CRP V of $50.7 million, and
•
our third U.S. real estate fund (“CRP III”) of $27.1 million.
The
$327.1 million
of performance fees for the year ended
December 31, 2016
was driven primarily by performance fees recognized from the following funds:
•
CRP VII of $89.4 million,
•
our fifth U.S. real estate fund (“CRP V”) of $62.0 million,
•
NGP XI of $35.9 million,
•
CRP VI of $32.4 million, and
•
CRP III of $22.1 million.
The
$120.7 million
of performance fees for the year ended
December 31, 2015
was driven primarily by performance fees recognized from the following funds:
•
CRP VI of $101.1 million,
•
CRP V of $73.9 million,
•
CRP III of $22.9 million,
•
Energy III of $(38.7) million, and
•
Carlyle/Riverstone Global Energy and Power Fund IV (“Energy IV”) of $(37.8) million.
Performance fees of $
360.3 million
, $
327.1 million
, and $
120.7 million
are inclusive of performance fees reversed of approximately $9.2 million, $4.7 million, and $102.8 million for
the years ended December 31, 2017, 2016 and 2015
, respectively.
The appreciation (depreciation) in remaining value of assets for this segment by type of fund are as follows:
|
|
Year Ended December 31,
|
||
|
|
2017
|
2016
|
2015
|
|
Real Estate funds
|
17%
|
19%
|
27%
|
|
Natural Resources funds
|
30%
|
24%
|
(3)%
|
|
Legacy Energy funds
|
6%
|
10%
|
(26)%
|
|
Total
|
19%
|
18%
|
(3)%
|
Net performance fees for the year ended
December 31, 2017
were $
243.4 million
, representing
an increase
of $
35.8 million
from $
207.6 million
in net performance fees for the year ended
December 31, 2016
. The
increase
in net performance
138
fees was primarily due to increased performance fees from the NGP funds, for which there is no performance fee related compensation expense, partially offset by decreased performance fees from the real estate funds.
Net performance fees for the year ended
December 31, 2016
were $207.6 million, representing an increase of $181.7 million from $25.9 million in net performance fees for the year ended
December 31, 2015
. The increase in net performance fees primarily relates to increased performance fees from the U.S. real estate funds, the NGP funds, and reversals of performance fees in the Legacy Energy funds in
2015
as compared to a reduction of the giveback obligation in
2016
.
Performance fees earned from the Legacy Energy funds and from NGP funds are allocated solely to Carlyle and are not otherwise shared or allocated with our investment professionals since the investment teams are employed by Riverstone and NGP, respectively, and not Carlyle. Accordingly, performance fee compensation as a percentage of performance fees is generally not a comparable measurement for Real Assets from period to period.
Total Investment Loss.
Total investment loss (realized and unrealized) for the year ended
December 31, 2017
was $
36.5 million
compared to total investment loss of $19.2 million for the year ended
December 31, 2016
. The increase in total investment loss for the year ended
December 31, 2017
as compared to the year ended
December 31, 2016
was primarily due to the recognition of a $65.0 million realized investment loss recognized in 2017 associated with the disposal of our interests in Urbplan in a transaction in which a third party acquired operational control and all of the economic interests in Urbplan. With this transaction, we deconsolidated Urbplan from our financial results (see Note 15 to the consolidated financial statements). This increase in total investment loss was partially offset by higher appreciation on investments in our U.S. and Europe real estate funds, as well as the NGP funds, in 2017 as compared to
2016
.
Total investment loss (realized and unrealized) for the year ended
December 31, 2016
was $19.2 million compared to total investment loss of $30.5 million for the year ended
December 31, 2015
. The decrease in total investment loss for the year ended
December 31, 2016
as compared to the year ended
December 31, 2015
was primarily due to the absence in
2016
of approximately $34 million in losses from our guarantee of liabilities of CEREP I associated with an adverse court judgment in a French tax court proceeding that was recorded in
2015
. The decrease in total investment loss was also due to investment gains of approximately $0.8 million associated with our investments in NGP for
2016
as compared to approximately $5.5 million of investment losses associated with our investments in NGP in 2015, partially offset by higher investment losses associated with Urbplan.
Equity-based Compensation.
Equity-based compensation was $
34.9 million
, $26.3 million, and $25.0 million for
the years ended December 31, 2017, 2016 and 2015
, respectively. The
increase
from
2016
to 2017 is primarily attributable to equity-based compensation expense in connection with the March 2017 agreement with NGP (see Note 5 to the consolidated financial statements).
Reserve for Litigation and Contingencies.
Real Assets' share of the reserve for litigation and contingencies decreased $5.8 million for the year ended
December 31, 2017
. The decrease was primarily related to Real Assets' share of the $25 million reserve reversal related to the CCC litigation recognized in 2017. See Note 9 to the consolidated financial statements for more information on the CCC litigation. Real Assets had recognized its share of a $50 million reserve for litigation and contingencies for $9.2 million in
2015
.
139
Fee-earning AUM as of and for each of the Three Years in the Period Ended December 31, 2017
Fee-earning AUM is presented below for each period together with the components of change during each respective period.
The table below breaks out Fee-earning AUM by its respective components at each period.
|
|
As of December 31,
|
||||||||||
|
2017
|
2016
|
2015
|
|||||||||
|
|
(Dollars in millions)
|
||||||||||
|
Real Assets
|
|||||||||||
|
Components of Fee-earning AUM (1)
|
|||||||||||
|
Fee-earning AUM based on capital commitments
|
$
|
16,453
|
|
$
|
13,008
|
|
$
|
12,588
|
|
||
|
Fee-earning AUM based on invested capital (2)
|
13,901
|
|
13,878
|
|
17,353
|
|
|||||
|
Fee-earning AUM based on net asset value
|
892
|
|
285
|
|
—
|
|
|||||
|
Fee-earning AUM based on lower of cost or fair value and other (3)
|
353
|
|
316
|
|
964
|
|
|||||
|
Total Fee-earning AUM (4)
|
$
|
31,599
|
|
$
|
27,487
|
|
$
|
30,905
|
|
||
|
Weighted Average Management Fee Rates (5)
|
|||||||||||
|
All Funds
|
1.20
|
%
|
1.26
|
%
|
1.24
|
%
|
|||||
|
Funds in Investment Period
|
1.35
|
%
|
1.43
|
%
|
1.44
|
%
|
|||||
|
(1)
|
For additional information concerning the components of Fee-earning AUM, See “—Fee-earning Assets under Management.”
|
|
(2)
|
Includes amounts committed to or reserved for investments for certain real estate funds.
|
|
(3)
|
Includes certain funds that are calculated on gross asset value.
|
|
(4)
|
Energy II, Energy III, Energy IV, Renew I, and Renew II (collectively, the “Legacy Energy Funds”), are managed with Riverstone Holdings LLC and its affiliates. Affiliates of both Carlyle and Riverstone act as investment advisers to each of the Legacy Energy Funds. With the exception of Energy IV and Renew II, where Carlyle has a minority representation on the funds’ management committees, management of each of the Legacy Energy Funds is vested in committees with equal representation by Carlyle and Riverstone, and the consent of representatives of both Carlyle and Riverstone is required for investment decisions. As of
December 31, 2017
, the Legacy Energy Funds had, in the aggregate, approximately
$5.2 billion
in AUM and
$3.8 billion
in Fee-earning AUM. NGP VII, NGP VIII, NGP IX, or in the case of NGP M&R, NGP ETP I, and NGP ETP II, certain affiliated entities (collectively, the “NGP management fee funds”) and NGP X, NGP GAP and NGP XI (referred to herein as, "carry funds"), are managed by NGP Energy Capital Management. As of
December 31, 2017
, the NGP management fee funds and carry funds had, in the aggregate, approximately
$13.0 billion
in AUM and
$11.2 billion
in Fee-earning AUM.
|
|
(5)
|
Represents the aggregate effective management fee rate of each fund in the segment, weighted by each fund's Fee-earning AUM, as of the end of each period presented. Calculation reflects Carlyle’s 10% and 55% interest in management fees earned by the Legacy Energy funds, NGP management fee funds, and carry funds, respectively.
|
The table below provides the period to period rollforward of Fee-earning AUM.
|
|
Twelve Months Ended December 31,
|
||||||||||
|
|
2017
|
2016
|
2015
|
||||||||
|
|
(Dollars in millions)
|
||||||||||
|
Real Assets
|
|||||||||||
|
Fee-earning AUM Rollforward
|
|||||||||||
|
Balance, Beginning of Period
|
$
|
27,487
|
|
$
|
30,905
|
|
$
|
28,351
|
|
||
|
Inflows, including Fee-paying Commitments (1)
|
8,812
|
|
1,514
|
|
8,426
|
|
|||||
|
Outflows, including Distributions (2)
|
(4,925
|
)
|
(4,860
|
)
|
(5,655
|
)
|
|||||
|
Market Appreciation/(Depreciation) (3)
|
73
|
|
28
|
|
(1
|
)
|
|||||
|
Foreign Exchange and other (4)
|
152
|
|
(100
|
)
|
(216
|
)
|
|||||
|
Balance, End of Period
|
$
|
31,599
|
|
$
|
27,487
|
|
$
|
30,905
|
|
||
|
(1)
|
Inflows represent limited partner capital raised and capital invested by funds outside the investment period.
|
140
|
(2)
|
Outflows represent distributions from funds outside the investment period and changes in fee basis for our carry funds where the investment period has expired.
|
|
(3)
|
Market Appreciation/(Depreciation) represents realized and unrealized gains (losses) on portfolio investments in our carry funds based on the lower of cost or fair value and net asset value.
|
|
(4)
|
Represents the impact of foreign exchange rate fluctuations on the translation of our non-U.S. dollar denominated funds. Activity during the period is translated at the average rate for the period. Ending balances are translated at the spot rate as of the period end.
|
Fee-earning AUM was
$31.6 billion
at
December 31, 2017
, an increase of
$4.1 billion
, or
15%
, compared to
$27.5 billion
at
December 31, 2016
. The increase was driven by inflows of
$8.8 billion
primarily related to new fee-paying commitments raised in CRP VIII and NGP XII. This was partially offset by outflows of
$4.9 billion
primarily related to distributions in our Legacy Energy, U.S. Real Estate, and NGP Energy funds. Investment and distribution activity by funds still in the original investment period do not impact Fee-earning AUM as these funds are based on commitments and not invested capital.
Fee-earning AUM was $27.5 billion at December 31, 2016, a decrease of $3.4 billion, or 11%, compared to $30.9 billion at December 31, 2015. This decrease was driven by outflows of $4.9 billion primarily attributable to distributions in our Real Estate and NGP Energy funds outside of the investment period. Partially offsetting this decrease were inflows, including fee-paying commitments, of $1.5 billion driven by additional commitments raised in CPP II and capital invested by CPI, as well as additional capital invested by various funds outside of the original investment period.
Fee-earning AUM was $30.9 billion at December 31, 2015, an increase of $2.5 billion, or 9%, compared to $28.4 billion at December 31, 2014. This increase was driven by inflows of $8.4 billion primarily related to new commitments in CRP VII, CPP II, and CIEP I as well as the activation of previously raised commitments in NGP XI. This increase was partially offset by outflows of $5.7 billion, primarily related to distribution activity in our funds outside the original investment period in addition to the reduction in management fee basis for funds at the end of their original investment period.
Total AUM as of and for each of the Three Years in the Period Ended December 31, 2017
The table below provides the period to period rollforward of Total AUM.
|
|
Twelve Months Ended December 31,
|
||||||||||
|
|
2017
|
2016
|
2015
|
||||||||
|
|
(Dollars in millions)
|
||||||||||
|
Real Assets
|
|||||||||||
|
Total AUM Rollforward
|
|||||||||||
|
Balance, Beginning of Period
|
$
|
34,252
|
|
$
|
37,991
|
|
$
|
42,295
|
|
||
|
New Commitments (1)
|
10,205
|
|
1,203
|
|
3,828
|
|
|||||
|
Outflows (2)
|
(4,247
|
)
|
(6,844
|
)
|
(5,795
|
)
|
|||||
|
Market Appreciation/(Depreciation) (3)
|
3,614
|
|
3,317
|
|
(2,357
|
)
|
|||||
|
Foreign Exchange Gain/(Loss) (4)
|
112
|
|
(17
|
)
|
(256
|
)
|
|||||
|
Other (5)
|
(1,048
|
)
|
(1,398
|
)
|
276
|
|
|||||
|
Balance, End of Period
|
$
|
42,888
|
|
$
|
34,252
|
|
$
|
37,991
|
|
||
|
(1)
|
New Commitments reflects the impact of gross fundraising during the period. For funds or vehicles denominated in foreign currencies, this reflects translation at the average quarterly rate, while the separately reported Fundraising metric is translated at the spot rate for each individual closing.
|
|
(2)
|
Outflows includes distributions in our carry funds and related co-investment vehicles, NGP management fee funds and separately managed accounts.
|
|
(3)
|
Market Appreciation/(Depreciation) generally represents realized and unrealized gains (losses) on portfolio investments in our carry funds and related co-investment vehicles, NGP management fee funds and separately managed accounts.
|
|
(4)
|
Represents the impact of foreign exchange rate fluctuations on the translation of our non-U.S. dollar denominated funds. Activity during the period is translated at the average rate for the period. Ending balances are translated at the spot rate as of the period end.
|
|
(5)
|
Includes expiring available capital, the impact of capital calls for fees and expenses and other changes in AUM.
|
141
Total AUM was
$42.9 billion
at
December 31, 2017
, an increase of
$8.6 billion
, or
25%
, compared to
$34.3 billion
at
December 31, 2016
. This increase was driven by
$10.2 billion
of new commitments primarily attributable to fundraising in CRP VIII, NGP XII, and CPI. Also driving the increase was
$3.6 billion
of market appreciation including
$1.2 billion
attributable to
NGP XI
,
$0.5 billion
attributable to
CRP VII
, and
$0.3 billion
attributable to
CIEP
. Partially offsetting the increase were
$4.2 billion
of outflows primarily due to distributions in our U.S. Real Estate, Legacy Energy, and Europe Real Estate funds.
Total AUM was $34.3 billion at December 31, 2016, a decrease of $3.7 billion, or 10%, compared to $38.0 billion at December 31, 2015. This decrease was driven by $6.8 billion of outflows primarily related to distributions in the NGP and our U.S. Real Estate funds. Partially offsetting this decrease was $3.3 billion of market appreciation, representing a 18% increase in the value of our carry fund portfolio. The carry funds driving appreciation for the period included $0.5 billion attributable to NGP X , $0.5 billion attributable to NGP XI, and $0.4 billion attributable to CRP VII.
Total AUM was $38.0 billion at December 31, 2015, a decrease of $4.3 billion, or 10%, compared to $42.3 billion at December 31, 2014. This decrease was primarily driven by $5.8 billion of outflows primarily related to distributions in our U.S. Real Estate, NGP Energy, and Legacy Energy funds and $2.4 billion of market depreciation, representing a 3% decrease in the value of our carry fund portfolio. The carry funds driving depreciation for the period included $1.0 billion attributable to Energy IV,
$0.6 billion
attributable to Energy III, and
$0.4 billion
attributable to NGP X, partially offset by $0.5 billion of appreciation attributable to CRP VI . Offsetting this was $3.8 billion of new commitments driven by fundraising in CRP VII, NGP XI, and CPP II.
Fund Performance Metrics
Fund performance information for our investment funds that have at least $1.0 billion in capital commitments, cumulative equity invested or total value as of
December 31, 2017
and excluding the NGP management fee funds, which we refer to as our “significant funds,” is generally included throughout this discussion and analysis to facilitate an understanding of our results of operations for the periods presented. The fund return information reflected in this discussion and analysis is not indicative of the performance of The Carlyle Group L.P. and is also not necessarily indicative of the future performance of any particular fund. An investment in The Carlyle Group L.P. is not an investment in any of our funds. There can be no assurance that any of our funds or our other existing and future funds will achieve similar returns. See “Item 1A. Risk Factors — Risks Related to Our Business Operations — The historical returns attributable to our funds, including those presented in this report, should not be considered as indicative of the future results of our funds or of our future results or of any returns expected on an investment in our common units.”
142
The following tables reflect the performance of our significant funds in our Real Assets business. See “Business — Our Family of Funds” for a legend of the fund acronyms listed below.
|
|
|
|
TOTAL INVESTMENTS
|
REALIZED/PARTIALLY
REALIZED INVESTMENTS(5)
|
||||||||||||||||||||||||||||||
|
|
|
|
As of December 31, 2017
|
As of December 31, 2017
|
||||||||||||||||||||||||||||||
|
|
Fund Inception Date (1)
|
Committed Capital
|
Cumulative Invested Capital (2)
|
Total Fair Value (3)
|
MOIC (4)
|
Gross IRR (7) (12)
|
Net
IRR (8) (12) |
Cumulative Invested Capital (2)
|
Total Fair Value (3)
|
MOIC (4)
|
Gross IRR (7) (12)
|
|||||||||||||||||||||||
|
Real Assets
|
|
|
(Reported in Local Currency, in Millions)
|
(Reported in Local Currency, in Millions)
|
||||||||||||||||||||||||||||||
|
Fully Invested Funds (6)
|
|
|
||||||||||||||||||||||||||||||||
|
CRP III
|
11/2000
|
$
|
564.1
|
|
$
|
522.5
|
|
$
|
1,850.3
|
|
3.5x
|
44
|
%
|
30
|
%
|
$
|
522.5
|
|
$
|
1,850.3
|
|
3.5x
|
44
|
%
|
||||||||||
|
CRP IV
|
12/2004
|
$
|
950.0
|
|
$
|
1,282.2
|
|
$
|
2,022.6
|
|
1.6x
|
8
|
%
|
5
|
%
|
$
|
1,191.6
|
|
$
|
1,962.7
|
|
1.6x
|
8
|
%
|
||||||||||
|
CRP V
|
11/2006
|
$
|
3,000.0
|
|
$
|
3,430.0
|
|
$
|
5,669.6
|
|
1.7x
|
12
|
%
|
9
|
%
|
$
|
2,942.0
|
|
$
|
4,972.5
|
|
1.7x
|
14
|
%
|
||||||||||
|
CRP VI
|
9/2010
|
$
|
2,340.0
|
|
$
|
2,219.3
|
|
$
|
4,012.7
|
|
1.8x
|
29
|
%
|
20
|
%
|
$
|
1,581.6
|
|
$
|
3,190.4
|
|
2.0x
|
33
|
%
|
||||||||||
|
CRP VII
|
3/2014
|
$
|
4,161.6
|
|
$
|
3,220.4
|
|
$
|
4,282.4
|
|
1.3x
|
21%
|
|
12%
|
|
$
|
315.2
|
|
$
|
593.9
|
|
1.9x
|
33
|
%
|
||||||||||
|
CEREP I
|
3/2002
|
€
|
426.6
|
|
€
|
517.0
|
|
€
|
698.6
|
|
1.4x
|
14
|
%
|
7
|
%
|
€
|
517.0
|
|
€
|
698.6
|
|
1.4x
|
14
|
%
|
||||||||||
|
CEREP II
|
4/2005
|
€
|
762.7
|
|
€
|
833.8
|
|
€
|
128.1
|
|
0.2x
|
Neg
|
|
Neg
|
|
€
|
826.7
|
|
€
|
132.3
|
|
0.2x
|
Neg
|
|
||||||||||
|
CEREP III
|
5/2007
|
€
|
2,229.5
|
|
€
|
2,025.7
|
|
€
|
2,432.2
|
|
1.2x
|
4
|
%
|
1
|
%
|
€
|
1,706.7
|
|
€
|
2,247.6
|
|
1.3x
|
6
|
%
|
||||||||||
|
CIP
|
9/2006
|
$
|
1,143.7
|
|
$
|
1,069.8
|
|
$
|
1,427.6
|
|
1.3x
|
6
|
%
|
3
|
%
|
$
|
997.1
|
|
$
|
1,365.1
|
|
1.4x
|
6%
|
|
||||||||||
|
NGP X
|
1/2012
|
$
|
3,586.0
|
|
$
|
3,267.2
|
|
$
|
4,185.6
|
|
1.3x
|
9
|
%
|
6
|
%
|
$
|
1,382.9
|
|
$
|
2,505.2
|
|
1.8x
|
24
|
%
|
||||||||||
|
NGP XI
|
6/2014
|
$
|
5,325.0
|
|
$
|
3,696.7
|
|
$
|
5,348.6
|
|
1.4x
|
39%
|
|
27%
|
|
$
|
228.9
|
|
$
|
471.3
|
|
2.1x
|
169
|
%
|
||||||||||
|
Energy II
|
7/2002
|
$
|
1,100.0
|
|
$
|
1,334.8
|
|
$
|
3,130.9
|
|
2.3x
|
81
|
%
|
55
|
%
|
$
|
1,334.8
|
|
$
|
3,130.9
|
|
2.3x
|
81%
|
|
||||||||||
|
Energy III
|
10/2005
|
$
|
3,800.0
|
|
$
|
3,569.7
|
|
$
|
5,513.1
|
|
1.5x
|
10
|
%
|
7
|
%
|
$
|
2,873.9
|
|
$
|
5,045.9
|
|
1.8x
|
14
|
%
|
||||||||||
|
Energy IV
|
12/2007
|
$
|
5,979.1
|
|
$
|
6,262.0
|
|
$
|
8,167.3
|
|
1.3x
|
8
|
%
|
5
|
%
|
$
|
4,066.5
|
|
$
|
6,012.2
|
|
1.5x
|
14%
|
|
||||||||||
|
Renew II
|
3/2008
|
$
|
3,417.5
|
|
$
|
2,809.4
|
|
$
|
4,188.8
|
|
1.5x
|
9
|
%
|
6
|
%
|
$
|
1,555.3
|
|
$
|
2,440.9
|
|
1.6x
|
12
|
%
|
||||||||||
|
All Other Funds (9)
|
Various
|
|
$
|
2,939.5
|
|
$
|
3,289.7
|
|
1.1x
|
4
|
%
|
Neg
|
|
$
|
2,662.1
|
|
$
|
3,019.5
|
|
1.1x
|
5%
|
|
||||||||||||
|
Co-investments and Other(10)
|
Various
|
|
$
|
6,039.4
|
|
$
|
9,880.3
|
|
1.6x
|
16
|
%
|
13
|
%
|
$
|
4,180.4
|
|
$
|
7,228.9
|
|
1.7x
|
20
|
%
|
||||||||||||
|
Total Fully Invested Funds
|
|
$
|
45,721.8
|
|
$
|
66,887.1
|
|
1.5x
|
12
|
%
|
8
|
%
|
$
|
29,501.8
|
|
$
|
47,490.4
|
|
1.6x
|
16
|
%
|
|||||||||||||
|
Funds in the Investment Period (6)
|
|
|
|
|
|
|
|
|
|
|
||||||||||||||||||||||||
|
CRP VIII
|
5/2017
|
$
|
5,010.7
|
|
$
|
229.8
|
|
$
|
222.5
|
|
1.0x
|
NM
|
|
NM
|
|
|
|
|
|
|
|
|
||||||||||||
|
CIEP I
|
9/2013
|
$
|
2,500.0
|
|
$
|
988.8
|
|
$
|
1,510.4
|
|
1.5x
|
28%
|
|
11%
|
|
|
|
|
|
|
|
|
||||||||||||
|
NGP XII
|
7/2017
|
$
|
2,776.7
|
|
$
|
241.0
|
|
$
|
241.0
|
|
1.0x
|
NM
|
|
NM
|
|
|
|
|
|
|
|
|
||||||||||||
|
CPP II
|
6/2014
|
$
|
1,526.9
|
|
$
|
643.9
|
|
$
|
706.3
|
|
1.1x
|
NM
|
|
NM
|
|
|
|
|
|
|
|
|
||||||||||||
|
CPI
|
5/2016
|
$
|
1,144.0
|
|
$
|
863.4
|
|
$
|
968.3
|
|
1.1x
|
NM
|
|
NM
|
|
|
|
|
|
|
|
|
||||||||||||
|
All Other Funds (11)
|
Various
|
|
$
|
391.5
|
|
$
|
359.1
|
|
0.9x
|
NM
|
|
NM
|
|
|
|
|
|
|||||||||||||||||
|
Total Funds in the Investment Period
|
$
|
3,358.4
|
|
$
|
4,007.5
|
|
1.2x
|
16
|
%
|
4
|
%
|
$
|
—
|
|
$
|
—
|
|
n/a
|
n/a
|
|
||||||||||||||
|
TOTAL Real Assets (13)
|
|
|
$
|
49,080.2
|
|
$
|
70,894.6
|
|
1.4x
|
12
|
%
|
8
|
%
|
$
|
29,501.8
|
|
$
|
47,490.4
|
|
1.6x
|
16
|
%
|
||||||||||||
|
(1)
|
The data presented herein that provides “inception to date” performance results of our segments relates to the period following the formation of the first fund within each segment. For our Corporate Private Equity segment our first fund was formed in 1990.
For our Real Assets segment, our first fund was formed in 1997.
|
|
(2)
|
Represents the original cost of all capital called for investments since inception of the fund.
|
|
(3)
|
Represents all realized proceeds combined with remaining fair value, before management fees, expenses and carried interest.
|
|
(4)
|
Multiple of invested capital (“MOIC”) represents total fair value, before management fees, expenses and carried interest, divided by cumulative invested capital.
|
|
(5)
|
An investment is considered realized when the investment fund has completely exited, and ceases to own an interest in, the investment. An investment is considered partially realized when the total amount of proceeds received in respect of such investment, including dividends, interest or other distributions and/or return of capital, represents at least 85% of invested capital and such investment is not yet fully realized. Because part of our value creation strategy involves pursuing best exit alternatives, we believe information regarding Realized/Partially Realized MOIC and Gross IRR, when considered together with the other investment performance metrics presented, provides investors with meaningful information regarding our investment performance by removing the impact of investments where significant realization activity has not yet occurred. Realized/Partially Realized MOIC and Gross IRR have limitations as measures of investment performance, and should not be considered in isolation. Such limitations include the fact that these measures
|
143
do not include the performance of earlier stage and other investments that do not satisfy the criteria provided above. The exclusion of such investments will have a positive impact on Realized/Partially Realized MOIC and Gross IRR in instances when the MOIC and Gross IRR in respect of such investments are less than the aggregate MOIC and Gross IRR. Our measurements of Realized/Partially Realized MOIC and Gross IRR may not be comparable to those of other companies that use similarly titled measures. We do not present Realized/Partially Realized performance information separately for funds that are still in the investment period because of the relatively insignificant level of realizations for funds of this type.
However, to the extent such funds have had realizations, they are included in the Realized/Partially Realized performance information presented for Total Corporate Private Equity and Total Real Assets.
|
(6)
|
Fully Invested funds are past the expiration date of the investment period as defined in the respective limited partnership agreement. In instances where a successor fund has had its first capital call, the predecessor fund is categorized as fully invested.
|
|
(7)
|
Gross Internal Rate of Return (“Gross IRR”) represents the annualized IRR for the period indicated on Limited Partner invested capital based on contributions, distributions and unrealized value before management fees, expenses and carried interest.
|
|
(8)
|
Net Internal Rate of Return (“Net IRR”) represents the annualized IRR for the period indicated on Limited Partner invested capital based on contributions, distributions and unrealized value after management fees, expenses and carried interest. Fund level IRRs are based on aggregate Limited Partner cash flows, and this blended return may differ from that of individual Limited Partners. As a result, certain funds may generate accrued performance fees with a blended Net IRR that is below the preferred return hurdle for that fund.
|
|
(9)
|
Aggregate includes the following funds: CRP I, CRP II, CAREP I, CAREP II, CRCP I, CPOCP, Renew I and Energy I.
|
|
(10)
|
Includes co-investments and certain other stand-alone investments arranged by us.
|
|
(11)
|
Aggregate includes NGP GAP and CCR. Return is not considered meaningful, as the investment period commenced in December 2013 for NGP GAP and October 2016 for CCR.
|
|
(12)
|
For funds marked “NM,” IRR may be positive or negative, but is not considered meaningful because of the limited time since initial investment and early stage of capital deployment. For funds marked “Neg,” IRR is negative as of reporting period end.
|
|
(13)
|
For purposes of aggregation, funds that report in foreign currency have been converted to U.S. dollars at the reporting period spot rate.
|
|
Remaining Fair Value(1)
|
Unrealized MOIC(2)
|
Total MOIC(3)
|
% Invested(4)
|
In Accrued Carry/ (Giveback) (5)
|
LTM Realized Carry (6)
|
Catch up Rate
|
Fee Initiation Date (7)
|
Quarters Since Fee Initiation
|
Original Investment Period End Date
|
|||||||||||||||
|
|
As of December 31, 2017
|
|||||||||||||||||||||||
|
Real Assets
|
||||||||||||||||||||||||
|
NGP XI
|
$
|
4,684.7
|
|
1.4x
|
1.4x
|
69
|
%
|
X
|
|
80
|
%
|
Feb-15
|
12
|
|
Oct-19
|
|||||||||
|
CRP VII
|
$
|
3,625.0
|
|
1.3x
|
1.3x
|
77
|
%
|
X
|
|
80
|
%
|
Jun-14
|
15
|
|
Mar-19
|
|||||||||
|
Energy IV
|
$
|
2,820.6
|
|
1.0x
|
1.3x
|
104
|
%
|
(X)
|
|
80
|
%
|
Feb-08
|
40
|
|
Dec-13
|
|||||||||
|
NGP X
|
$
|
1,788.2
|
|
1.0x
|
1.3x
|
91
|
%
|
|
|
80
|
%
|
Jan-12
|
24
|
|
May-17
|
|||||||||
|
Renew II
|
$
|
1,708.6
|
|
0.8x
|
1.5x
|
82
|
%
|
(X)
|
|
80
|
%
|
Mar-08
|
40
|
|
May-14
|
|||||||||
|
CIEP I
|
$
|
1,428.2
|
|
1.5x
|
1.5x
|
40
|
%
|
X
|
|
80
|
%
|
Oct-13
|
17
|
|
Sep-19
|
|||||||||
|
CRP V
|
$
|
1,323.8
|
|
2.1x
|
1.7x
|
114
|
%
|
X
|
|
50
|
%
|
Nov-06
|
45
|
|
Nov-11
|
|||||||||
|
CPI
|
$
|
928.2
|
|
1.1x
|
1.1x
|
n/a
|
|
X
|
|
50
|
%
|
May-16
|
7
|
|
Apr-21
|
|||||||||
|
CRP VI
|
$
|
772.7
|
|
1.3x
|
1.8x
|
95
|
%
|
X
|
X
|
50
|
%
|
Mar-11
|
28
|
|
Mar-16
|
|||||||||
|
CRP IV
|
$
|
626.7
|
|
3.6x
|
1.6x
|
135
|
%
|
|
|
50
|
%
|
Jan-05
|
52
|
|
Dec-09
|
|||||||||
|
CPP II
|
$
|
590.6
|
|
1.1x
|
1.1x
|
42
|
%
|
|
|
80
|
%
|
Sep-14
|
14
|
|
Apr-21
|
|||||||||
|
CRP III
|
$
|
464.5
|
|
140.3x
|
3.5x
|
93
|
%
|
X
|
X
|
50
|
%
|
Mar-01
|
68
|
|
May-05
|
|||||||||
|
CEREP III
|
€
|
233.0
|
|
0.7x
|
1.2x
|
91
|
%
|
|
|
67
|
%
|
Jun-07
|
43
|
|
May-11
|
|||||||||
|
Energy III
|
$
|
264.7
|
|
0.3x
|
1.5x
|
94
|
%
|
(X)
|
|
80
|
%
|
Nov-05
|
49
|
|
Oct-11
|
|||||||||
|
NGP XII
|
$
|
241.0
|
|
1.0x
|
1.0x
|
9
|
%
|
|
|
80
|
%
|
Nov-17
|
1
|
|
Oct-19
|
|||||||||
|
CRP VIII
|
$
|
222.5
|
|
1.0x
|
1.0x
|
5
|
%
|
|
|
80
|
%
|
Aug-17
|
2
|
|
May-22
|
|||||||||
|
All Other Funds (8)
|
$
|
664.6
|
|
0.7x
|
1.3x
|
NM
|
NM
|
|
|
|
|
|||||||||||||
|
Co-investment and Other (9)
|
$
|
2,490.8
|
|
1.1x
|
1.6x
|
NM
|
NM
|
|
|
|
|
|||||||||||||
|
Total Real Assets (10)
|
$
|
24,925.6
|
|
1.2x
|
1.4x
|
|
|
|
|
|
|
|||||||||||||
|
(1)
|
Remaining Fair Value reflects the unrealized carrying value of investments in carry funds and related co-investment vehicles. Significant funds with remaining fair value of greater than $100 million are listed individually.
|
144
|
(2)
|
Unrealized multiple of invested capital (“MOIC”) represents remaining fair market value, before management fees, expenses and carried interest, divided by investment cost.
|
|
(3)
|
Total MOIC represents total fair value, before management fees, expenses and carried interest, divided by cumulative invested capital. For certain funds, represents the original cost of investments net of investment-level recallable proceeds, which is adjusted to reflect recyclability of invested capital for the purpose of calculating the fund MOIC.
|
|
(4)
|
Represents cumulative equity invested as of the reporting period divided by total commitments. Amount can be greater than 100% due to the re-investment of recallable distributions to fund investors.
|
|
(5)
|
Fund has accrued carry/(giveback) as of the reporting period.
|
|
(6)
|
Fund has realized carry in the last twelve months.
|
|
(7)
|
Represents the date of the first capital contribution for management fees.
|
|
(8)
|
Aggregate includes the following funds: CRP I, CRP II, CRCP I, CEREP I, CEREP II, CAREP I, CAREP II, CCR, CPOCP, CGIOF, NGP GAP, Energy I, Energy II and Renew I. In Accrued Carry/(Clawback) and LTM Realized Carry not indicated because the indicator does not apply to each fund within the aggregate.
|
|
(9)
|
Includes co-investments, prefund investments and certain other stand-alone investments arranged by us. In Accrued Carry/(Giveback) and LTM Realized Carry not indicated because the indicator does not apply to each fund within the aggregate.
|
|
(10)
|
For purposes of aggregation, funds that report in foreign currency have been converted to U.S. dollars at the reporting period spot rate.
|
145
Global Credit
We continue to invest in growing our Global Credit, formerly called Global Market Strategies, business. We conducted a review in 2016 of the segment in order to realign and reorganize certain of the segment's operations. We have exited our hedge fund business (ESG in 2016 and Claren Road in January 2017) and, as a result of settlements reached during 2017 with investors in two commodities investment vehicles managed by Vermillion, we have completed the exit of the commodities investment advisory business and other hedge fund investment advisory businesses that we had acquired from 2010 to 2014. In the near to mid term, this segment will incur additional expenses to build the credit business and raise additional capital.
For purposes of presenting our results of operations for this segment, we include only our economic interests in the results of operations of Claren Road (through January 2017) and ESG (through June 2016). The following table presents our results of operations for our Global Credit segment:
|
|
Year Ended December 31,
|
||||||||||
|
|
2017
|
2016
|
2015
|
||||||||
|
|
(Dollars in millions)
|
||||||||||
|
Segment Revenues
|
|||||||||||
|
Fund level fee revenues
|
|||||||||||
|
Fund management fees
|
$
|
191.5
|
|
$
|
195.5
|
|
$
|
210.7
|
|
||
|
Portfolio advisory fees, net
|
0.7
|
|
1.1
|
|
0.7
|
|
|||||
|
Transaction fees, net
|
—
|
|
—
|
|
—
|
|
|||||
|
Total fund level fee revenues
|
192.2
|
|
196.6
|
|
211.4
|
|
|||||
|
Performance fees
|
|||||||||||
|
Realized
|
75.4
|
|
36.6
|
|
38.0
|
|
|||||
|
Unrealized
|
(16.3
|
)
|
1.2
|
|
(63.1
|
)
|
|||||
|
Total performance fees
|
59.1
|
|
37.8
|
|
(25.1
|
)
|
|||||
|
Investment income (loss)
|
|||||||||||
|
Realized
|
11.9
|
|
5.1
|
|
5.4
|
|
|||||
|
Unrealized
|
5.4
|
|
15.3
|
|
(15.7
|
)
|
|||||
|
Total investment income (loss)
|
17.3
|
|
20.4
|
|
(10.3
|
)
|
|||||
|
Interest income
|
7.1
|
|
4.7
|
|
2.8
|
|
|||||
|
Other income
|
6.8
|
|
4.7
|
|
3.9
|
|
|||||
|
Total revenues
|
282.5
|
|
264.2
|
|
182.7
|
|
|||||
|
Segment Expenses
|
|||||||||||
|
Compensation and benefits
|
|||||||||||
|
Direct base compensation
|
79.2
|
|
87.4
|
|
101.2
|
|
|||||
|
Indirect base compensation
|
25.3
|
|
32.6
|
|
28.3
|
|
|||||
|
Equity-based compensation
|
20.7
|
|
17.6
|
|
19.0
|
|
|||||
|
Performance fee related
|
|||||||||||
|
Realized
|
35.0
|
|
17.6
|
|
16.6
|
|
|||||
|
Unrealized
|
(7.3
|
)
|
0.6
|
|
(27.7
|
)
|
|||||
|
Total compensation and benefits
|
152.9
|
|
155.8
|
|
137.4
|
|
|||||
|
General, administrative, and other indirect expenses
|
3.3
|
|
250.0
|
|
69.8
|
|
|||||
|
Depreciation and amortization expense
|
5.1
|
|
6.2
|
|
5.0
|
|
|||||
|
Interest expense
|
14.5
|
|
11.3
|
|
10.8
|
|
|||||
|
Total expenses
|
175.8
|
|
423.3
|
|
223.0
|
|
|||||
|
Economic Income (Loss)
|
$
|
106.7
|
|
$
|
(159.1
|
)
|
$
|
(40.3
|
)
|
||
|
(-) Net Performance Fees
|
31.4
|
|
19.6
|
|
(14.0
|
)
|
|||||
|
(-) Investment Income (Loss)
|
17.3
|
|
20.4
|
|
(10.3
|
)
|
|||||
|
(+) Equity-based Compensation
|
20.7
|
|
17.6
|
|
19.0
|
|
|||||
|
(+) Net Interest
|
7.4
|
|
6.6
|
|
8.0
|
|
|||||
|
(+) Reserve for Litigation and Contingencies
|
(4.1
|
)
|
—
|
|
9.0
|
|
|||||
|
(=) Fee Related Earnings
|
$
|
82.0
|
|
$
|
(174.9
|
)
|
$
|
20.0
|
|
||
|
(+) Realized Net Performance Fees
|
40.4
|
|
19.0
|
|
21.4
|
|
|||||
|
(+) Realized Investment Income
|
11.9
|
|
5.1
|
|
5.4
|
|
|||||
|
(+) Net Interest
|
(7.4
|
)
|
(6.6
|
)
|
(8.0
|
)
|
|||||
|
(=) Distributable Earnings
|
$
|
126.9
|
|
$
|
(157.4
|
)
|
$
|
38.8
|
|
||
146
Year Ended
December 31, 2017
Compared to Year Ended
December 31, 2016
and Year Ended
December 31, 2016
Compared to Year Ended
December 31, 2015
Distributable Earnings
Distributable earnings
increased
$
284.3 million
for the year ended
December 31, 2017
as compared to
2016
, and decreased $196.2 million for the year ended
December 31, 2016
as compared to
2015
. The following table provides the components of the changes in distributable earnings for the years ended
December 31, 2017 and 2016
:
|
|
Year Ended December 31,
|
|||||
|
|
2017
|
2016
|
||||
|
|
(Dollars in Millions)
|
|||||
|
Distributable earnings, prior year
|
$
|
(157.4
|
)
|
$
|
38.8
|
|
|
Increases (decreases):
|
||||||
|
Increase (decrease) in realized net performance fees
|
21.4
|
|
(2.4
|
)
|
||
|
Increase (decrease) in realized investment income
|
6.8
|
|
(0.3
|
)
|
||
|
Increase (decrease) in fee related earnings
|
256.9
|
|
(194.9
|
)
|
||
|
(Increase) decrease in net interest
|
(0.8
|
)
|
1.4
|
|
||
|
Total increase (decrease)
|
284.3
|
|
(196.2
|
)
|
||
|
Distributable earnings, current year
|
$
|
126.9
|
|
$
|
(157.4
|
)
|
Realized Net Performance Fees.
Realized net performance fees
increased
$
21.4 million
for the year ended
December 31, 2017
as compared to
2016
and decreased $2.4 million for the year ended
December 31, 2016
as compared to
2015
. The majority of realized net performance fees were generated by our distressed debt carry funds in 2017, our structured credit funds in 2016 and both our structured credit funds and ESG in 2015.
Realized Investment Income.
Realized investment income
increased
$
6.8 million
for the year ended
December 31, 2017
as compared to
2016
and decreased $0.3 million for the year ended
December 31, 2016
as compared to
2015
. The
increase
in realized investment income for the year ended
December 31, 2017
as compared to
2016
was primarily due to higher realizations on investments in our structured credit funds. The decrease in realized investment income for the year ended
December 31, 2016
as compared to
2015
was primarily due to greater realized losses on our hedge funds, partially offset by higher realizations on our structured credit funds and carry funds.
Fee Related Earnings
Fee related earnings
increased
$
256.9 million
for the year ended
December 31, 2017
as compared to
2016
, and decreased $194.9 million for the year ended
December 31, 2016
as compared to
2015
. The following table provides the components of the change in fee related earnings for the years ended
December 31, 2017 and 2016
:
|
|
Year Ended December 31,
|
|||||
|
|
2017
|
2016
|
||||
|
|
(Dollars in Millions)
|
|||||
|
Fee related earnings, prior year
|
$
|
(174.9
|
)
|
$
|
20.0
|
|
|
Increases (Decreases):
|
||||||
|
Decrease in fee revenues
|
(4.4
|
)
|
(14.8
|
)
|
||
|
Decrease in direct and indirect base compensation
|
15.5
|
|
9.5
|
|
||
|
Decrease (increase) in general, administrative and
other expenses |
242.6
|
|
(189.2
|
)
|
||
|
All other changes
|
3.2
|
|
(0.4
|
)
|
||
|
Total increase (decrease)
|
256.9
|
|
(194.9
|
)
|
||
|
Fee related earnings, current year
|
$
|
82.0
|
|
$
|
(174.9
|
)
|
147
Fee Revenues.
Total fee revenues
decreased
$
4.4 million
for the year ended
December 31, 2017
as compared to
2016
and decreased $14.8 million for the year ended
December 31, 2016
as compared to
2015
, due to the following:
|
|
Year Ended December 31,
|
|||||
|
|
2017
|
2016
|
||||
|
|
(Dollars in Millions)
|
|||||
|
Lower fund management fees
|
$
|
(4.0
|
)
|
$
|
(15.2
|
)
|
|
(Lower) higher portfolio advisory fees
|
(0.4
|
)
|
0.4
|
|
||
|
Total decrease in fee revenues
|
$
|
(4.4
|
)
|
$
|
(14.8
|
)
|
The
decrease
in fund management fees for the year ended
December 31, 2017
as compared to
2016
was primarily due to a decrease of $30.2 million in fund management fees related to the separation from the hedge funds and lower basis on certain carry funds. These decreases were partially offset by a $24.1 million increase in fund management fees primarily as a result of increased commitments and subsequent closings for CSP IV during 2017.
The
decrease
in fund management fees for the year ended
December 31, 2016
as compared to
2015
was primarily due to lower hedge fund assets under management and lower basis on certain carry funds, partially offset by the activation of fees on our second energy mezzanine opportunity fund (“CEMOF II”). Assets under management reflects no material amounts for hedge funds at
December 31, 2016
, down from from $8.3 billion at
December 31, 2015
, primarily due to the transactions related to ESG and Claren Road in which the Partnership transferred its interests in ESG and Claren Road back to their respective founders, redemptions and investment depreciation.
The weighted average management fee rate on our carry funds decreased slightly from
1.37%
at December 31, 2016 to
1.35%
at December 31, 2017 primarily due to a lower blended fee rate for CSP IV upon completion of the fundraising process.
The weighted average management fee rate on our carry funds decreased from 1.38% at December 31, 2015 to 1.37% at December 31, 2016 primarily due to a lower blended fee rate for CEMOF II upon completion of the fundraising process. Fee-earning AUM for our hedge funds was zero as of December 31, 2016.
Direct and indirect compensation expense.
Direct and indirect compensation expense
decreased
$
15.5 million
for the year ended
December 31, 2017
as compared to
2016
primarily due to lower headcount from the separation of the hedge fund business, which resulted in $24.9 million of lower compensation. This decrease was partially offset by an increase in 2017 cash bonuses.
Direct and indirect base compensation decreased $9.5 million for the year ended
December 31, 2016
as compared to
2015
primarily due to lower headcount, partially offset by increased compensation costs of $2.8 million related to fundraising activities.
General, administrative and other indirect expenses.
General, administrative and other indirect expenses decreased $242.6 million for the year ended
December 31, 2017
as compared to
2016
and increased $189.2 million for the year ended
December 31, 2016
as compared to
2015
, primarily due to the following:
|
Year Ended December 31,
|
||||||
|
2017
|
2016
|
|||||
|
(Dollars in Millions)
|
||||||
|
(Absence of) increase in commodities-related contingency reserves
|
$
|
(175.0
|
)
|
$
|
175.0
|
|
|
(Absence of) expenses incurred related to Claren Road transaction
|
(25.0
|
)
|
25.0
|
|
||
|
Increase in insurance recoveries related to litigation
|
(10.0
|
)
|
(25.0
|
)
|
||
|
Increase in professional fees, including legal costs related to commodities
|
144.2
|
|
11.5
|
|
||
|
Increase in insurance recovery related to commodities
|
(177.3
|
)
|
—
|
|
||
|
All other changes
|
0.5
|
|
2.7
|
|
||
|
Total (decrease) increase
|
$
|
(242.6
|
)
|
$
|
189.2
|
|
148
Economic Income (Loss)
Economic income (loss)
increased
$
265.8 million
for the year ended
December 31, 2017
as compared to
2016
, and decreased $118.8 million for the year ended
December 31, 2016
as compared to
2015
. The following table provides the components of the change in economic income (loss) for the years ended
December 31, 2017 and 2016
:
|
|
Year Ended December 31,
|
|||||
|
|
2017
|
2016
|
||||
|
|
(Dollars in Millions)
|
|||||
|
Economic income (loss), prior year
|
$
|
(159.1
|
)
|
$
|
(40.3
|
)
|
|
Increases (decreases):
|
||||||
|
Increase in net performance fees
|
11.8
|
|
33.6
|
|
||
|
(Decrease) increase in investment income
|
(3.1
|
)
|
30.7
|
|
||
|
(Increase) decrease in equity-based compensation
|
(3.1
|
)
|
1.4
|
|
||
|
Increase (decrease) in fee related earnings
|
256.9
|
|
(194.9
|
)
|
||
|
Increase (decrease) in net interest
|
(0.8
|
)
|
1.4
|
|
||
|
Decrease in reserve for litigation and contingencies
|
4.1
|
|
9.0
|
|
||
|
Total increase (decrease)
|
265.8
|
|
(118.8
|
)
|
||
|
Economic income (loss), current year
|
$
|
106.7
|
|
$
|
(159.1
|
)
|
Performance Fees.
Performance fees (realized and unrealized) for
the years ended December 31, 2017, 2016 and 2015
are from the following types of funds:
|
Performance Fees
|
|||||||||||
|
|
Year Ended December 31,
|
||||||||||
|
|
2017
|
2016
|
2015
|
||||||||
|
|
(Dollars in millions)
|
||||||||||
|
Carry funds
|
$
|
18.1
|
|
$
|
0.3
|
|
$
|
(62.9
|
)
|
||
|
Hedge funds
|
—
|
|
0.9
|
|
10.5
|
|
|||||
|
Structured credit funds and other
|
41.0
|
|
36.6
|
|
27.3
|
|
|||||
|
Total performance fees
|
$
|
59.1
|
|
$
|
37.8
|
|
$
|
(25.1
|
)
|
||
The
$59.1 million
of performance fees for the year ended
December 31, 2017
was driven primarily by performance fees recognized from the following funds:
•
CLOs of $18.1 million, and
•
Carlyle Strategic Partners III, L.P. (“CSP III”) of $13.2 million.
The
$37.8 million
of performance fees for the year ended
December 31, 2016
was driven primarily by performance fees recognized from the following funds:
•
CLOs of $19.0 million,
•
Carlyle Strategic Partners III, L.P. (“CSP III”) of $3.5 million,
•
Carlyle Strategic Partners II, L.P. (“CSP II”) of $2.6 million, and
•
Carlyle Mezzanine Partners II, L.P. (“CMP II”) of $(5.8) million.
The
$(25.1) million
of performance fees for the year ended
December 31, 2015
was driven primarily by performance fees recognized from the following funds:
•
our first energy mezzanine fund (“CEMOF”) of $(43.1) million,
•
CMP II of $(19.3) million, and
•
ESG funds of $7.3 million.
149
Performance fees of $
59.1 million
, $
37.8 million
, and $
(25.1) million
are inclusive of performance fees reversed of approximately $5.8 million, $5.8 million, and $63.1 million for
the years ended December 31, 2017, 2016 and 2015
, respectively.
The appreciation (depreciation) in remaining value of assets for this segment's carry funds are as follows:
|
|
Year Ended December 31,
|
||
|
|
2017
|
2016
|
2015
|
|
Carry funds
|
11%
|
(11)%
|
(8)%
|
Net performance fees as a percentage of total performance fees are as follows:
|
Year Ended December 31,
|
|||||||||
|
2017
|
2016
|
2015
|
|||||||
|
(Dollars in millions)
|
|||||||||
|
Net Performance Fees
|
$
|
31.4
|
|
$
|
19.6
|
|
$
|
(14.0
|
)
|
|
Percentage of Total Performance Fees
|
53
|
%
|
52
|
%
|
56
|
%
|
|||
The
increase
in net performance fees for the year ended
December 31, 2017
as compared to the year ended
December 31, 2016
is primarily due to increased performance fees generated from our carry funds and business development companies in 2017 as compared to
2016
. The increase in net performance fees for the year ended
December 31, 2016
as compared to the year ended
December 31, 2015
is primarily due to increased performance fees generated from our business development companies in
2016
as compared to
2015
.
Total Investment Income (Loss).
Total investment income (realized and unrealized) for the year ended
December 31, 2017
was $
17.3 million
compared to total investment income of $20.4 million for the year ended
December 31, 2016
. The
decrease
in investment income from
2016
to 2017 relates primarily to lower appreciation on certain U.S. and Euro-denominated collateralized loan obligations during 2017 as compared to
2016
. This decrease was partially offset by appreciation on our carry funds in 2017 as compared to depreciation on our carry funds in
2016
and higher realizations on our structured credit funds and carry funds in 2017 as compared to 2016.
Total investment income was $20.4 million for the year ended
December 31, 2016
compared to total investment loss of $10.3 million in
2015
. The increase in total investment income from
2015
to
2016
relates primarily to appreciation on certain U.S. and Euro-denominated collateralized loan obligations during
2016
as compared to depreciation on investments in U.S.-denominated collateralized loan obligations for
2015
.
Equity-based Compensation.
Equity-based compensation was $
20.7 million
, $17.6 million, and $19.0 million for
the years ended December 31, 2017, 2016 and 2015
, respectively.
Reserve for Litigation and Contingencies.
Global Credit's share of the reserve for litigation and contingencies decreased $4.1 million for the year ended
December 31, 2017
. The decrease was primarily related to Global Credit's share of the $25 million reserve reversal related to the CCC litigation recognized in 2017. See Note 9 to the consolidated financial statements for more information on the CCC litigation. Global Credit had recognized its share of a $50 million reserve for litigation and contingencies for $9.0 million in
2015
.
150
Fee-earning AUM as of and for each of the Three Years in the Period Ended December 31, 2017
Fee-earning AUM is presented below for each period together with the components of change during each respective period.
The table below breaks out Fee-earning AUM by its respective components at each period.
|
|
As of December 31,
|
||||||||||
|
|
2017
|
2016
|
2015
|
||||||||
|
|
(Dollars in millions)
|
||||||||||
|
Global Credit
|
|||||||||||
|
Components of Fee-earning AUM (1)
|
|||||||||||
|
Fee-earning AUM based on capital commitments
|
$
|
5,026
|
|
$
|
4,010
|
|
$
|
2,298
|
|
||
|
Fee-earning AUM based on invested capital
|
1,457
|
|
1,278
|
|
1,601
|
|
|||||
|
Fee-earning AUM based on collateral balances, at par
|
18,625
|
|
16,999
|
|
17,896
|
|
|||||
|
Fee-earning AUM based on net asset value
|
42
|
|
—
|
|
7,811
|
|
|||||
|
Fee-earning AUM based on other (2)
|
2,112
|
|
1,839
|
|
1,366
|
|
|||||
|
Total Fee-earning AUM
|
$
|
27,262
|
|
$
|
24,126
|
|
$
|
30,972
|
|
||
|
Weighted Average Management Fee Rates (3)
|
|||||||||||
|
All Funds, excluding CLOs
|
1.35
|
%
|
1.37
|
%
|
1.52
|
%
|
|||||
|
(1)
|
For additional information concerning the components of Fee-earning AUM, see “—Fee-earning Assets under Management.”
|
|
(2)
|
Includes funds with fees based on gross asset value.
|
|
(3)
|
Represents the aggregate effective management fee rate for carry funds and hedge funds, weighted by each fund’s Fee-earning AUM, as of the end of each period presented. Management fees for CLOs are based on the total par amount of the assets (collateral) and principal balance of the notes in the fund and are not calculated as a percentage of equity and are therefore not included.
|
The table below provides the period to period rollforward of Fee-earning AUM.
|
|
Twelve Months Ended December 31,
|
||||||||||
|
|
2017
|
2016
|
2015
|
||||||||
|
|
(Dollars in millions)
|
||||||||||
|
Global Credit
|
|||||||||||
|
Fee-earning AUM Rollforward
|
|||||||||||
|
Balance, Beginning of Period
|
$
|
24,126
|
|
$
|
30,972
|
|
$
|
33,898
|
|
||
|
Acquisitions/(Divestments) (1)
|
—
|
|
(4,356
|
)
|
—
|
|
|||||
|
Inflows, including Fee-paying Commitments (2)
|
1,413
|
|
1,901
|
|
2,422
|
|
|||||
|
Outflows, including Distributions (3)
|
(265
|
)
|
(668
|
)
|
(1,025
|
)
|
|||||
|
Subscriptions, net of Redemptions (4)
|
—
|
|
(2,764
|
)
|
(4,327
|
)
|
|||||
|
Changes in CLO collateral balances (5)
|
843
|
|
(714
|
)
|
850
|
|
|||||
|
Market Appreciation/(Depreciation) (6)
|
13
|
|
(475
|
)
|
(674
|
)
|
|||||
|
Foreign Exchange and other (7)
|
1,132
|
|
230
|
|
(172
|
)
|
|||||
|
Balance, End of Period
|
$
|
27,262
|
|
$
|
24,126
|
|
$
|
30,972
|
|
||
|
(1)
|
Divestment activity represents ESG assets which were transferred to the ESG founders in a transaction that closed in October 2016 and Claren Road assets which were transferred to the Claren Road founders in a transaction that closed in January 2017.
|
|
(2)
|
Inflows represent limited partner capital raised and capital invested by our carry funds outside the investment period.
|
|
(3)
|
Outflows represent limited partner distributions from our carry funds, changes in fee basis for our carry funds where the investment period has expired, and reductions for funds that are no longer calling fees.
|
|
(4)
|
Represents the net result of subscriptions to and redemptions from our hedge funds and mutual fund.
|
|
(5)
|
Represents the change in the aggregate Fee-earning collateral balances at par of our CLOs/structured products, as of the quarterly cut-off dates.
|
151
|
(6)
|
Market Appreciation/(Depreciation) represents realized and unrealized gains (losses) on portfolio investments in our carry funds based on the lower of cost or fair value and net asset value.
|
|
(7)
|
Includes activity of funds with fees based on gross asset value. Represents the impact of foreign exchange rate fluctuations on the translation of our non-U.S. dollar denominated funds. Activity during the period is translated at the average rate for the period. Ending balances are translated at the spot rate as of the period end.
|
Fee-earning AUM was
$27.3 billion
at
December 31, 2017
, an increase of
$3.2 billion
, or
13%
, compared to
$24.1 billion
at
December 31, 2016
. Driving the increase were inflows of
$1.4 billion
primarily attributable to new fee-paying commitments raised in CSP IV. Also driving the increase was foreign exchange and other activity of
$1.1 billion
primarily related to foreign exchange gains on our Euro-denominated CLO's and increases in our CLO collateral balances of
$0.8 billion
. Distributions from carry funds still in the investment period do not impact Fee-earning AUM as these funds are based on commitments and not invested capital.
Fee-earning AUM was $24.1 billion at December 31, 2016, a decrease of $6.9 billion, or 22%, compared to $31.0 billion at December 31, 2015. This was primarily the result of the divestments of our ESG and Claren Road hedge fund businesses which were sold back to their founders in separate transactions which closed in October 2016 and January 2017, respectively, and resulted in a decline in Fee-earning AUM of $4.4 billion. Also driving the decrease were net redemptions in our hedge funds of $2.8 billion and decreases in our CLO collateral balances of $0.7 billion. Partially offsetting this decrease was $1.9 billion of inflows primarily related to new commitments raised in CSP IV and CEMOF II.
Fee-earning AUM was $31.0 billion at December 31, 2015, a decrease of $2.9 billion, or 9%, compared to $33.9 billion at December 31, 2014. This was driven by $4.3 billion of net redemptions in our hedge funds, $1.0 billion of net outflows including distributions, primarily due to the change in basis from commitments to invested equity in CSP III and our first energy mezzanine fund (“CEMOF I”), and $0.7 billion in market depreciation. This was partially offset by $2.4 billion of inflows, including commitments, primarily driven by new commitments in CEMOF II and a $0.9 billion increase in the collateral balances of our CLO's.
Total AUM as of and for each of the Three Years in the Period Ended December 31, 2017
The table below provides the period to period rollforward of Total AUM.
|
|
Twelve Months Ended December 31,
|
||||||||||
|
|
2017
|
2016
|
2015
|
||||||||
|
|
(Dollars in millions)
|
||||||||||
|
Global Credit
|
|||||||||||
|
Total AUM Rollforward
|
|||||||||||
|
Balance, Beginning of Period
|
$
|
29,399
|
|
$
|
35,255
|
|
$
|
36,741
|
|
||
|
Acquisitions/(Divestments) (1)
|
—
|
|
(4,707
|
)
|
—
|
|
|||||
|
New Commitments (2)
|
6,643
|
|
7,115
|
|
8,545
|
|
|||||
|
Outflows (3)
|
(3,981
|
)
|
(7,506
|
)
|
(9,030
|
)
|
|||||
|
Market Appreciation/(Depreciation) (4)
|
177
|
|
(1,045
|
)
|
(945
|
)
|
|||||
|
Foreign Exchange Gain/(Loss) (5)
|
829
|
|
(190
|
)
|
(609
|
)
|
|||||
|
Other (6)
|
257
|
|
477
|
|
553
|
|
|||||
|
Balance, End of Period
|
$
|
33,324
|
|
$
|
29,399
|
|
$
|
35,255
|
|
||
|
(1)
|
Divestment activity represents ESG assets which were transferred to the ESG founders in a transaction that closed in October 2016 and Claren Road assets which were transferred to the Claren Road founders in a transaction that closed in January 2017.
|
|
(2)
|
New Commitments reflects the impact of gross fundraising during the period. For funds or vehicles denominated in foreign currencies, this reflects translation at the average quarterly rate, while the separately reported Fundraising metric is translated at the spot rate for each individual closing.
|
|
(3)
|
Outflows includes distributions in our carry funds, related co-investment vehicles and separately managed accounts, as well as runoff of CLO collateral balances and redemptions in our hedge funds.
|
|
(4)
|
Market Appreciation/(Depreciation) generally represents realized and unrealized gains (losses) on portfolio investments in our carry funds and related co-investment vehicles, separately managed accounts and hedge funds.
|
152
|
(5)
|
Represents the impact of foreign exchange rate fluctuations on the translation of our non-U.S. dollar denominated funds. Activity during the period is translated at the average rate for the period. Ending balances are translated at the spot rate as of the period end.
|
|
(6)
|
Includes expiring available capital, the impact of capital calls for fees and expenses, change in gross asset value for our business development companies and other changes in AUM.
|
Total AUM was
$33.3 billion
at
December 31, 2017
, an increase of
$3.9 billion
, or
13%
, compared to
$29.4 billion
at
December 31, 2016
. This was driven by
$6.6 billion
of new commitments primarily due to new U.S. and Europe CLO issuances, as well as fundraising in CSC and CCOF. Also contributing to the increase were foreign exchange gains of
$0.8 billion
attributable to our Euro-denominated CLO's. Partially offsetting the increase were outflows of
$4.0 billion
primarily related to CLO run-off and distributions in our Global Credit carry funds.
Total AUM was $29.4 billion at December 31, 2016, a decrease of $5.9 billion, or 17%, compared to $35.3 billion at December 31, 2015. This decrease was due to outflows of $7.5 billion which were the result of CLO run-off, hedge fund redemptions, and distributions in our carry funds. Also driving the decrease were divestments of our ESG and Claren Road hedge fund businesses which were sold back to their founders in separate transactions which closed in October 2016 and January 2017, respectively, and resulted in a decline in Total AUM of $4.7 billion. Market depreciation for the period of $1.0 billion represented a 11% ($0.2 billion) decrease on our portfolio of carry funds for the period and declines in our hedge funds. Partially offsetting this decrease were new commitments of $7.1 billion primarily due to new U.S. and Europe CLO issuances as well as fundraising in CSP IV and CEMOF II.
Total AUM was $35.3 billion at December 31, 2015, a decrease of $1.4 billion, or 4%, compared to $36.7 billion at December 31, 2014. This decrease was driven by outflows of $9.0 billion primarily attributable to redemptions from our hedge funds and CLO run-off, $0.9 billion of market depreciation, representing a 8% ($0.2 billion) decrease on our portfolio of carry funds for the period and declines in our hedge funds, and $0.6 billion of foreign exchange decreases in our Euro-denominated CLOs. Partially offsetting these decreases were $8.5 billion of new commitments primarily attributable to new U.S. and Europe CLO issuances, as well as new funds raised in CEMOF II.
Fund Performance Metrics
Fund performance information for certain of our Global Credit Funds is included throughout this discussion and analysis to facilitate an understanding of our results of operations for the periods presented. The fund return information reflected in this discussion and analysis is not indicative of the performance of The Carlyle Group L.P. and is also not necessarily indicative of the future performance of any particular fund. An investment in The Carlyle Group L.P. is not an investment in any of our funds. There can be no assurance that any of our funds or our other existing and future funds will achieve similar returns. See “Item 1A. Risk Factors — Risks Related to Our Business Operations — The historical returns attributable to our funds including those presented in this report should not be considered as indicative of the future results of our funds or of our future results or of any returns expected on an investment in our common units.”
153
The following table reflects the performance of certain funds in our Global Credit business. These tables separately present funds that, as of the periods presented, had at least $1.0 billion in capital commitments, cumulative equity invested or total equity value. See “Business — Our Family of Funds” for a legend of the fund acronyms listed below.
|
|
|
|
|
|
|
TOTAL INVESTMENTS
|
||||||||||||||||
|
|
|
|
|
|
|
As of December 31, 2017
|
|
Inception to December 31, 2017
|
||||||||||||||
|
Global Credit (Carry Funds Only)
|
|
Fund
Inception Date (1) |
Committed
Capital |
Cumulative
Invested Capital (2) |
Total Fair
Value (3) |
MOIC (4)
|
Gross IRR (5) (10)
|
Net IRR (6) (10)
|
||||||||||||||
|
|
|
(Reported in Local Currency, in Millions)
|
|
|
|
|
||||||||||||||||
|
Fully Invested/Committed Funds (7)
|
|
|
|
|
|
|
|
|
|
|
|
|
|
|
||||||||
|
CSP II
|
|
6/2007
|
|
$
|
1,352.3
|
|
|
$
|
1,352.3
|
|
|
$
|
2,465.6
|
|
|
1.8x
|
|
17
|
%
|
|
11
|
%
|
|
CSP III
|
|
8/2011
|
|
$
|
702.8
|
|
|
$
|
702.8
|
|
|
$
|
1,163.4
|
|
|
1.7x
|
|
32
|
%
|
|
20
|
%
|
|
CEMOF I
|
|
12/2010
|
|
$
|
1,382.5
|
|
|
$
|
1,599.9
|
|
|
$
|
1,419.4
|
|
|
0.9x
|
|
Neg
|
|
|
Neg
|
|
|
All Other Funds (8)
|
|
|
|
|
|
|
$
|
1,438.5
|
|
|
$
|
1,998.3
|
|
|
1.4x
|
|
12
|
%
|
|
7
|
%
|
|
|
Coinvestments and Other (9)
|
|
|
|
|
|
|
$
|
976.4
|
|
|
$
|
938.6
|
|
|
1.0x
|
|
NM
|
|
|
NM
|
|
|
|
Total Fully Invested/Committed Funds
|
|
$
|
6,069.9
|
|
|
$
|
7,985.3
|
|
|
1.3x
|
|
12
|
%
|
|
6
|
%
|
||||||
|
Funds in the Investment Period (7)
|
|
|
|
|
|
|
|
|
|
|
|
|
|
|
||||||||
|
CSP IV
|
|
3/2016
|
|
$
|
2,500.0
|
|
|
$
|
661.4
|
|
|
$
|
766.7
|
|
|
1.2x
|
|
NM
|
|
|
NM
|
|
|
CEMOF II
|
|
2/2015
|
|
$
|
2,819.2
|
|
|
$
|
878.4
|
|
|
$
|
933.1
|
|
|
1.1x
|
|
NM
|
|
|
NM
|
|
|
All Other Funds
|
|
|
|
|
|
|
$
|
173.9
|
|
|
$
|
179.5
|
|
|
1.0x
|
|
NM
|
|
|
NM
|
|
|
|
Total Funds in the Investment Period
|
|
|
|
|
|
|
$
|
1,713.7
|
|
|
$
|
1,879.3
|
|
|
1.1x
|
|
NM
|
|
|
NM
|
|
|
|
TOTAL Global Credit
|
|
|
|
|
|
|
$
|
7,783.6
|
|
|
$
|
9,864.6
|
|
|
1.3x
|
|
12
|
%
|
|
6
|
%
|
|
|
(1)
|
The data presented herein that provides “inception to date” performance results of our segments relates to the period following the formation of the first fund within each segment. For our Global Credit segment our first carry fund was formed in 2004.
|
|
(2)
|
Represents the original cost of all capital called for investments since inception of the fund.
|
|
(3)
|
Represents all realized proceeds combined with remaining fair value, before management fees, expenses and carried interest.
|
|
(4)
|
Multiple of invested capital (“MOIC”) represents total fair value, before management fees, expenses and carried interest, divided by cumulative invested capital.
|
|
(5)
|
Gross Internal Rate of Return (“Gross IRR”) represents the annualized IRR for the period indicated on Limited Partner invested capital based on contributions, distributions and unrealized value before management fees, expenses and carried interest.
|
|
(6)
|
Net Internal Rate of Return (“Net IRR”) represents the annualized IRR for the period indicated on Limited Partner invested capital based on contributions, distributions and unrealized value after management fees, expenses and carried interest. Fund level IRRs are based on aggregate Limited Partner cash flows, and this blended return may differ from that of individual Limited Partners. As a result, certain funds may generate accrued performance fees with a blended Net IRR that is below the preferred return hurdle for that fund.
|
|
(7)
|
Fully Invested funds are past the expiration date of the investment period as defined in the respective limited partnership agreement. In instances where a successor fund has had its first capital call, the predecessor fund is categorized as fully invested.
|
|
(8)
|
Aggregate includes the following funds: CMP I, CMP II, CSP I, and CASCOF.
|
|
(9)
|
Includes co-investments and certain other stand-alone investments arranged by us.
|
|
(10)
|
For funds marked “NM,” IRR may be positive or negative, but is not considered meaningful because of the limited time since initial investment and early stage of capital deployment. For funds marked “Neg,” IRR is negative as of reporting period end.
|
154
|
Remaining Fair Value (1)
|
Unrealized MOIC (2)
|
Total MOIC (3)
|
% Invested (4)
|
In Accrued Carry/ (Giveback) (5)
|
LTM Realized Carry (6)
|
Catch up Rate
|
Fee Initiation Date (7)
|
Quarters Since Fee Initiation
|
Original Investment Period End Date
|
||||||
|
|
As of December 31, 2017
|
||||||||||||||
|
Global Credit
|
|||||||||||||||
|
CEMOF II
|
$
|
892.4
|
|
1.0x
|
1.1x
|
31
|
%
|
|
100
|
%
|
Dec-15
|
9
|
|
Feb-20
|
|
|
CEMOF I
|
$
|
859.2
|
|
0.6x
|
0.9x
|
116
|
%
|
|
|
100
|
%
|
Dec-10
|
29
|
|
Dec-15
|
|
CSP IV
|
$
|
633.6
|
|
1.1x
|
1.2x
|
26
|
%
|
X
|
|
100
|
%
|
Feb-17
|
4
|
|
Jun-20
|
|
CSP III
|
$
|
324.8
|
|
1.1x
|
1.7x
|
100
|
%
|
X
|
X
|
80
|
%
|
Dec-11
|
25
|
|
Aug-15
|
|
All Other Funds (8)
|
$
|
366.1
|
|
0.9x
|
1.6x
|
|
NM
|
NM
|
|
|
|
|
|||
|
Co-investment and Other (9)
|
$
|
797.4
|
|
0.8x
|
1.0x
|
|
NM
|
NM
|
|
|
|
|
|||
|
Total Global Credit
|
$
|
3,873.5
|
|
0.8x
|
1.3x
|
|
|
|
|
|
|
|
|||
|
(1)
|
Remaining Fair Value reflects the unrealized carrying value of investments in carry funds and related co-investment vehicles. Significant funds with remaining fair value of greater than $100 million are listed individually.
|
|
(2)
|
Unrealized multiple of invested capital (“MOIC”) represents remaining fair market value, before management fees, expenses and carried interest, divided by investment cost.
|
|
(3)
|
Total MOIC represents total fair value, before management fees, expenses and carried interest, divided by cumulative invested capital. For certain funds, represents the original cost of investments net of investment-level recallable proceeds, which is adjusted to reflect recyclability of invested capital for the purpose of calculating the fund MOIC.
|
|
(4)
|
Represents cumulative equity invested as of the reporting period divided by total commitments. Amount can be greater than 100% due to the re-investment of recallable distributions to fund investors.
|
|
(5)
|
Fund has accrued carry/(giveback) as of the reporting period.
|
|
(6)
|
Fund has realized carry in the last twelve months.
|
|
(7)
|
Represents the date of the first capital contribution for management fees.
|
|
(8)
|
Aggregate includes the following funds: CSP I, CSP II, CMP I, CMP II, CSC, CCOF, and CASCOF. In Accrued Carry/(Clawback) and LTM Realized Carry not indicated because the indicator does not apply to each fund within the aggregate.
|
|
(9)
|
Includes co-investments, prefund investments and certain other stand-alone investments arranged by us. In Accrued Carry/(Giveback) and LTM Realized Carry not indicated because the indicator does not apply to each fund within the aggregate.
|
155
Investment Solutions
In February 2016, we decided to restructure our Investment Solutions segment to focus on private market secondaries, primary investments, co-investment and managed account activities and, given the challenging market environment, discontinue our fund of hedge funds and liquid alternative initiatives. As a result, the Partnership has substantially wound down the operations of DGAM.
The following table presents our results of operations for our Investment Solutions segment:
|
|
Year Ended December 31,
|
||||||||||
|
|
2017
|
2016
|
2015
|
||||||||
|
|
(Dollars in millions)
|
||||||||||
|
Segment Revenues
|
|||||||||||
|
Fund level fee revenues
|
|||||||||||
|
Fund management fees
|
$
|
154.9
|
|
$
|
140.3
|
|
$
|
153.9
|
|
||
|
Portfolio advisory fees, net
|
—
|
|
0.8
|
|
—
|
|
|||||
|
Total fund level fee revenues
|
154.9
|
|
141.1
|
|
153.9
|
|
|||||
|
Performance fees
|
|
|
|
||||||||
|
Realized
|
86.4
|
|
65.6
|
|
24.1
|
|
|||||
|
Unrealized
|
56.0
|
|
38.2
|
|
103.6
|
|
|||||
|
Total performance fees
|
142.4
|
|
103.8
|
|
127.7
|
|
|||||
|
Investment income (loss)
|
|
|
|
||||||||
|
Realized
|
0.1
|
|
0.1
|
|
0.1
|
|
|||||
|
Unrealized
|
3.9
|
|
(0.3
|
)
|
0.2
|
|
|||||
|
Total investment income (loss)
|
4.0
|
|
(0.2
|
)
|
0.3
|
|
|||||
|
Interest income
|
1.1
|
|
0.4
|
|
0.2
|
|
|||||
|
Other income
|
0.4
|
|
0.5
|
|
0.9
|
|
|||||
|
Total revenues
|
302.8
|
|
245.6
|
|
283.0
|
|
|||||
|
Segment Expenses
|
|
|
|
||||||||
|
Compensation and benefits
|
|
|
|
||||||||
|
Direct base compensation
|
72.0
|
|
66.8
|
|
82.3
|
|
|||||
|
Indirect base compensation
|
12.7
|
|
13.7
|
|
13.0
|
|
|||||
|
Equity-based compensation
|
7.8
|
|
6.4
|
|
12.4
|
|
|||||
|
Performance fee related
|
|
|
|
||||||||
|
Realized
|
83.2
|
|
63.2
|
|
20.3
|
|
|||||
|
Unrealized
|
33.8
|
|
27.6
|
|
94.8
|
|
|||||
|
Total compensation and benefits
|
209.5
|
|
177.7
|
|
222.8
|
|
|||||
|
General, administrative, and other indirect expenses
|
32.3
|
|
34.5
|
|
46.0
|
|
|||||
|
Depreciation and amortization expense
|
3.6
|
|
3.3
|
|
3.8
|
|
|||||
|
Interest expense
|
6.1
|
|
5.8
|
|
5.9
|
|
|||||
|
Total expenses
|
251.5
|
|
221.3
|
|
278.5
|
|
|||||
|
Economic Income
|
$
|
51.3
|
|
$
|
24.3
|
|
$
|
4.5
|
|
||
|
(-) Net Performance Fees
|
25.4
|
|
13.0
|
|
12.6
|
|
|||||
|
(-) Investment Income (Loss)
|
4.0
|
|
(0.2
|
)
|
0.3
|
|
|||||
|
(+) Equity-based Compensation
|
7.8
|
|
6.4
|
|
12.4
|
|
|||||
|
(+) Net Interest
|
5.0
|
|
5.4
|
|
5.7
|
|
|||||
|
(+) Reserve for Litigation and Contingencies
|
(2.6
|
)
|
—
|
|
5.0
|
|
|||||
|
(=) Fee Related Earnings
|
$
|
32.1
|
|
$
|
23.3
|
|
$
|
14.7
|
|
||
|
(+) Realized Net Performance Fees
|
3.2
|
|
2.4
|
|
3.8
|
|
|||||
|
(+) Realized Investment Income
|
0.1
|
|
0.1
|
|
0.1
|
|
|||||
|
(+) Net Interest
|
(5.0
|
)
|
(5.4
|
)
|
(5.7
|
)
|
|||||
|
(=) Distributable Earnings
|
$
|
30.4
|
|
$
|
20.4
|
|
$
|
12.9
|
|
||
156
Year Ended
December 31, 2017
Compared to Year Ended
December 31, 2016
and Year Ended
December 31, 2016
Compared to Year Ended
December 31, 2015
Distributable Earnings
Distributable earnings
increased
$
10.0 million
for the year ended
December 31, 2017
as compared to
2016
, and increased $7.5 million for the year ended
December 31, 2016
as compared to
2015
. The following table provides the components of the change in distributable earnings for the years ended
December 31, 2017 and 2016
:
|
|
Year Ended December 31,
|
|||||
|
|
2017
|
2016
|
||||
|
|
(Dollars in Millions)
|
|||||
|
Distributable earnings, prior year
|
$
|
20.4
|
|
$
|
12.9
|
|
|
Increases (decreases):
|
||||||
|
Increase (decrease) in realized net performance fees
|
0.8
|
|
(1.4
|
)
|
||
|
Increase in fee related earnings
|
8.8
|
|
8.6
|
|
||
|
Decrease in net interest
|
0.4
|
|
0.3
|
|
||
|
Total increase
|
10.0
|
|
7.5
|
|
||
|
Distributable earnings, current year
|
$
|
30.4
|
|
$
|
20.4
|
|
Realized Net Performance Fees.
Realized net performance fees
increased
$
0.8 million
for the year ended
December 31, 2017
as compared to
2016
, and decreased $1.4 million for the year ended
December 31, 2016
as compared to
2015
. Substantially all of the realized net performance fees were generated from the AlpInvest carry fund vehicles for
the years ended December 31, 2017, 2016 and 2015
.
Fee Related Earnings
Fee related earnings
increased
$
8.8 million
for the year ended
December 31, 2017
as compared to
2016
, and increased $8.6 million for the year ended
December 31, 2016
as compared to 2015. The following table provides the components of the change in fee related earnings for the years ended
December 31, 2017 and 2016
:
|
|
Year Ended December 31,
|
|||||
|
|
2017
|
2016
|
||||
|
|
(Dollars in Millions)
|
|||||
|
Fee related earnings, prior year
|
$
|
23.3
|
|
$
|
14.7
|
|
|
Increases (decreases):
|
||||||
|
Increase (decrease) in fee revenues
|
13.8
|
|
(12.8
|
)
|
||
|
(Increase) decrease in direct and indirect base
compensation |
(4.2
|
)
|
14.8
|
|
||
|
(Increase) decrease in general, administrative and
other expenses |
(0.4
|
)
|
6.5
|
|
||
|
All other changes
|
(0.4
|
)
|
0.1
|
|
||
|
Total increase
|
8.8
|
|
8.6
|
|
||
|
Fee related earnings, current year
|
$
|
32.1
|
|
$
|
23.3
|
|
Fee Revenues.
Total fee revenues
increased
$
13.8 million
for the year ended
December 31, 2017
as compared to
2016
, primarily due to increased management fees from our private equity fund vehicles as a result of closings of new fund vehicles, which have a higher average management fee rate than older fund vehicles, as well as $1.2 million of catch-up management fees in 2017. Fee revenues also benefited from favorable foreign currency adjustments during 2017. This increase is partially offset by the wind-down of DGAM and the related redemptions from its fund of hedge funds, which decreased our fee revenues by $5.6 million in 2017 as compared to
2016
.
157
Total fee revenues decreased $12.8 million for the year ended
December 31, 2016
as compared to
2015
, primarily due to the wind-down of DGAM and the related redemptions from its fund of hedge funds, which decreased our fee revenues by $10.9 million in
2016
.
Direct and indirect compensation expense.
Direct and indirect compensation expense
increased
$
4.2 million
for the year ended
December 31, 2017
as compared to
2016
, primarily due to an increase in 2017 cash bonuses.
Direct and indirect base compensation expense decreased $14.8 million for the year ended
December 31, 2016
as compared to
2015
, primarily due to lower headcount in 2016 resulting from the wind-down of DGAM, partially offset by higher compensation associated with fundraising activities of $4.1 million in
2016
versus
2015
.
General, administrative and other indirect expenses.
General, administrative and other indirect expenses increased $0.4 million for the year ended
December 31, 2017
as compared to
2016
, primarily due to negative foreign currency adjustments, partially offset by lower professional fees and lower external costs associated with fundraising activities.
General, administrative and other indirect expenses decreased $6.5 million for the year ended
December 31, 2016
as compared to
2015
, primarily due to lower professional fees, information technology and real estate costs, partially offset by lower foreign currency gains in
2016
as compared to
2015
.
Economic Income
Economic income
increased
$
27.0 million
for the year ended
December 31, 2017
as compared to
2016
and increased $19.8 million for the year ended
December 31, 2016
as compared to
2015
. The following table provides a rollforward of economic income for the years ended
December 31, 2017 and 2016
:
|
|
Year Ended December 31,
|
|||||
|
|
2017
|
2016
|
||||
|
|
(Dollars in Millions)
|
|||||
|
Economic income, prior year
|
$
|
24.3
|
|
$
|
4.5
|
|
|
Increases (decreases):
|
||||||
|
Increase in net performance fees
|
12.4
|
|
0.4
|
|
||
|
Increase (decrease) in investment income
|
4.2
|
|
(0.5
|
)
|
||
|
(Increase) decrease in equity-based compensation
|
(1.4
|
)
|
6.0
|
|
||
|
Increase in fee related earnings
|
8.8
|
|
8.6
|
|
||
|
Decrease in net interest
|
0.4
|
|
0.3
|
|
||
|
Decrease in reserve for litigation and contingencies
|
2.6
|
|
5.0
|
|
||
|
Total increase
|
27.0
|
|
19.8
|
|
||
|
Economic income, current year
|
$
|
51.3
|
|
$
|
24.3
|
|
Performance Fees.
Performance fees (realized and unrealized) for
the years ended December 31, 2017, 2016 and 2015
are from the following types of funds:
|
Performance Fees
|
|||||||||||
|
|
Year Ended December 31,
|
||||||||||
|
|
2017
|
2016
|
2015
|
||||||||
|
|
(Dollars in millions)
|
||||||||||
|
Private equity fund vehicles
|
$
|
138.5
|
|
$
|
103.3
|
|
$
|
125.6
|
|
||
|
Fund of hedge fund vehicles
|
—
|
|
—
|
|
0.4
|
|
|||||
|
Real estate fund vehicles
|
3.9
|
|
0.5
|
|
1.7
|
|
|||||
|
Total performance fees
|
$
|
142.4
|
|
$
|
103.8
|
|
$
|
127.7
|
|
||
158
Under our arrangements with the historical owners and management team of AlpInvest, we generally do not retain any carried interest in respect of the historical investments and commitments to our AlpInvest fund vehicles that existed as of July 1, 2011 (including any options to increase any such commitments exercised after such date). We are entitled to 15% of the carried interest in respect of commitments from the historical owners of AlpInvest for the period between 2011 and 2020 and 40% of the carried interest in respect of all other commitments (including all future commitments from third parties).
The increase in performance fees in 2017 as compared to
2016
is primarily due to higher realizations in our carry funds in 2017. Additionally, overall, our carry funds appreciated 10% in 2017 (excluding the impact of foreign currency, appreciation was 19% for 2017), while appreciating 12% in
2016
.
The decrease in performance fees in
2016
as compared to
2015
is primarily due to lower appreciation in our carry funds in
2016
. Our carry funds appreciated 12% in
2016
as compared to 23% in
2015
.
The
$142.4 million
of performance fees for the year ended
December 31, 2017
was driven by performance fees recognized from a variety of funds, the largest of which are listed below:
•
Co-investment Fund & Secondaries Fund (2014-2015) of $17.3 million,
•
Co-investment Fund & Secondaries Fund (2012-2013) of $11.8 million, and
•
Co-investment Fund & Secondaries Fund (2009-2010) of $11.3 million.
The
$103.8 million
of performance fees for the year ended
December 31, 2016
was driven primarily by performance fees recognized from a variety of funds, the largest of which are listed below:
•
Co-investment Fund & Secondaries Fund (2012-2013) of $19.2 million,
•
Co-investment Fund & Secondaries Fund (2009-2010) of $16.0 million, and
•
Co-investment Fund & Secondaries Fund (2014-2015) of $10.8 million.
The
$127.7 million
of performance fees for the year ended
December 31, 2015
was driven primarily by performance fees recognized from a variety of funds, the largest of which are listed below:
•
Co-investment Fund & Secondaries Fund (2012-2013) of $27.1 million,
•
Co-investment Fund & Secondaries Fund (2009-2010) of $22.6 million, and
•
Partnership Fund (2008) of $12.2 million.
Performance fees of $
142.4 million
, $
103.8 million
, and $
127.7 million
are inclusive of performance fees reversed of approximately $2.4 million and $11.5 million for the years ended December 31, 2016 and 2015, respectively. There were no significant performance fees reversed for the year ended December 31, 2017.
The appreciation in remaining value of our Investment Solutions carry funds for this segment are as follows:
|
|
Year Ended December 31,
|
||
|
|
2017
|
2016
|
2015
|
|
Carry funds
|
10%
|
12%
|
23%
|
Note: The appreciation presented is a weighted average blend of the remaining investments in the respective carry funds within Investment Solutions. These carry funds include private equity and real estate investments in primary fund, co-investment and secondaries strategies, which have different return profiles.
Net performance fees for the year ended
December 31, 2017
were $
25.4 million
, representing
an increase
of $
12.4 million
from $
13.0 million
in net performance fees for the year ended
December 31, 2016
. Net performance fees for the year ended
December 31, 2016
were $13.0 million, representing an increase of $0.4 million from $12.6 million in net performance fees for the year ended
December 31, 2015
.
Equity-based Compensation.
Equity-based compensation was $
7.8 million
, $6.4 million, and $12.4 million for
the years ended December 31, 2017, 2016 and 2015
, respectively.
159
Reserve for Litigation and Contingencies.
Investment Solutions' share of the reserve for litigation and contingencies decreased $2.6 million for the year ended
December 31, 2017
. The decrease was primarily related to Investment Solutions' share of the $25 million reserve reversal related to the CCC litigation recognized in 2017. See Note 9 to the consolidated financial statements for more information on the CCC litigation. Investment Solutions had recognized its share of a $50 million reserve for litigation and contingencies for $5.0 million in
2015
.
Fee-earning AUM as of and for each of the Three Years Ended December 31, 2017
Fee-earning AUM is presented below for each period together with the components of change during each respective period.
The table below breaks out Fee-earning AUM by its respective components during the period.
|
|
As of December 31,
|
||||||||||
|
|
2017
|
2016
|
2015
|
||||||||
|
|
(Dollars in millions)
|
||||||||||
|
Investment Solutions
|
|||||||||||
|
Components of Fee-earning AUM (1)
|
|||||||||||
|
Fee-earning AUM based on capital commitments
|
$
|
11,330
|
|
$
|
9,047
|
|
$
|
7,421
|
|
||
|
Fee-earning AUM based on invested capital (2)
|
1,230
|
|
1,443
|
|
1,222
|
|
|||||
|
Fee-earning AUM based on net asset value
|
842
|
|
692
|
|
1,823
|
|
|||||
|
Fee-earning AUM based on lower of cost or fair market value
|
16,748
|
|
15,872
|
|
17,725
|
|
|||||
|
Total Fee-earning AUM
|
$
|
30,150
|
|
$
|
27,054
|
|
$
|
28,191
|
|
||
|
(1)
|
For additional information concerning the components of Fee-earning AUM, see “—Fee-earning Assets under Management.”
|
|
(2)
|
Includes amounts committed to or reserved for certain AlpInvest and Metropolitan carry funds.
|
|
|
Twelve Months Ended December 31,
|
||||||||||
|
|
2017
|
2016
|
2015
|
||||||||
|
|
(Dollars in millions)
|
||||||||||
|
Investment Solutions
|
|||||||||||
|
Fee-earning AUM Rollforward
|
|||||||||||
|
Balance, Beginning of Period
|
$
|
27,054
|
|
$
|
28,191
|
|
$
|
33,082
|
|
||
|
Acquisitions
|
—
|
|
—
|
|
—
|
|
|||||
|
Inflows, including Commitments (1)
|
6,234
|
|
7,213
|
|
5,677
|
|
|||||
|
Outflows, including Distributions (2)
|
(5,776
|
)
|
(6,150
|
)
|
(7,406
|
)
|
|||||
|
Subscriptions, net of Redemptions (3)
|
—
|
|
(2,166
|
)
|
(201
|
)
|
|||||
|
Market Appreciation/(Depreciation) (4)
|
(207
|
)
|
594
|
|
(205
|
)
|
|||||
|
Foreign Exchange and other (5)
|
2,845
|
|
(628
|
)
|
(2,756
|
)
|
|||||
|
Balance, End of Period
|
$
|
30,150
|
|
$
|
27,054
|
|
$
|
28,191
|
|
||
|
(1)
|
Inflows represent mandates where commitment fee period was activated and capital invested by carry fund vehicles outside the commitment fee period or weighted-average investment period.
|
|
(2)
|
Outflows represent distributions from carry fund vehicles outside the commitment fee period or weighted-average investment period and changes in fee basis for carry fund vehicles where the commitment fee period or weighted-average investment period has expired.
|
|
(3)
|
Represents subscriptions and redemptions in our fund of hedge funds vehicles.
|
|
(4)
|
Market Appreciation/(Depreciation) represents changes in the net asset value of our fund of hedge funds vehicles and realized and unrealized gains (losses) on our carry fund vehicles based on the lower of cost or fair value.
|
|
(5)
|
Represents the impact of foreign exchange rate fluctuations on the translation of our non-U.S. dollar denominated funds. Activity during the period is translated at the average rate for the period. Ending balances are translated at the spot rate as of the period end.
|
Fee-earning AUM was
$30.2 billion
at
December 31, 2017
, an increase of
$3.1 billion
, or
11%
, compared to
$27.1 billion
at
December 31, 2016
. This increase was driven by inflows of
$6.2 billion
primarily related to the activation of fee-
160
paying mandates in our AlpInvest funds and
$2.8 billion
of foreign exchange gains related to the translation of our AlpInvest Fee-earning AUM from EUR to USD. Partially offsetting this increase were outflows of
$5.8 billion
primarily attributable to distributions in our AlpInvest funds. Distributions from funds still in the commitment or weighted-average investment period do not impact Fee-earning AUM as these funds are based on commitments and not invested capital. Increases in fair value may have an impact on Fee-earning AUM for Investment Solutions as the management fees for many fully committed funds are based on fair value or on the lower of cost or fair value of the underlying investments.
Fee-earning AUM was $27.1 billion at December 31, 2016, a decrease of $1.1 billion, or 4%, compared to $28.2 billion at December 31, 2015. This decrease was driven by outflows of $6.2 billion which were primarily due to distributions in the AlpInvest and Metropolitan funds outside of their commitment or weighted-average investment periods, in addition to the reduction in basis from commitments to invested equity for those funds that reached the end of their commitment period. Also driving the decrease was $2.2 billion of net redemptions, and $0.6 billion in foreign exchange attributable to the translation of our AlpInvest Fee-earning AUM from EUR to USD. Partially offsetting the decrease were inflows of $7.2 billion primarily from fundraising efforts in our AlpInvest Primary and Secondaries product lines and market appreciation of $0.6 billion in our AlpInvest and Metropolitan carry funds.
Fee-earning AUM was $28.2 billion at December 31, 2015, a decrease of $4.9 billion, or 15%, compared to $33.1 billion at December 31, 2014. This decrease was driven by outflows of $7.4 billion which were primarily due to distributions in the AlpInvest and Metropolitan funds outside of their commitment or weighted-average investment periods, in addition to the reduction in basis from commitments to invested equity for those funds that reached the end of their commitment period. Also driving the decrease was $2.8 billion in foreign exchange attributable to the translation of our AlpInvest fee-earning AUM from EUR to USD. Partially offsetting the decrease were inflows of $5.7 billion in our AlpInvest and Metropolitan funds.
Total AUM as of and for each of the Three Years Ended December 31, 2017
The table below provides the period to period rollforward of Total AUM.
|
|
Twelve Months Ended December 31,
|
||||||||||
|
|
2017
|
2016
|
2015
|
||||||||
|
|
(Dollars in millions)
|
||||||||||
|
Investment Solutions
|
|||||||||||
|
Total AUM Rollforward
|
|||||||||||
|
Balance, Beginning of Period
|
$
|
43,092
|
|
$
|
46,205
|
|
$
|
50,769
|
|
||
|
New Commitments (1)
|
5,454
|
|
4,080
|
|
3,527
|
|
|||||
|
Outflows (2)
|
(9,804
|
)
|
(10,432
|
)
|
(11,502
|
)
|
|||||
|
Market Appreciation/(Depreciation) (3)
|
3,645
|
|
4,650
|
|
7,716
|
|
|||||
|
Foreign Exchange Gain/(Loss) (4)
|
4,407
|
|
(963
|
)
|
(3,879
|
)
|
|||||
|
Other (5)
|
(503
|
)
|
(448
|
)
|
(426
|
)
|
|||||
|
Balance, End of Period
|
$
|
46,291
|
|
$
|
43,092
|
|
$
|
46,205
|
|
||
|
(1)
|
New Commitments reflects the impact of gross fundraising during the period. For funds or vehicles denominated in foreign currencies, this reflects translation at the average quarterly rate, while the separately reported Fundraising metric is translated at the spot rate for each individual closing.
|
|
(2)
|
Outflows includes distributions in our carry funds, related co-investment vehicles and separately managed accounts, as well as redemptions in our fund of hedge funds vehicles.
|
|
(3)
|
Market Appreciation/(Depreciation) generally represents realized and unrealized gains (losses) on portfolio investments in our carry funds and related co-investment vehicles, separately managed accounts, and fund of hedge funds vehicles. The fair market values for our Investment Solutions carry funds are based on the latest available valuations of the underlying limited partnership interests (in most cases as of September 30, 2017) as provided by their general partners, plus the net cash flows since the latest valuation, up to
December 31, 2017
.
|
|
(4)
|
Represents the impact of foreign exchange rate fluctuations on the translation of our non-U.S. dollar denominated funds. Activity during the period is translated at the average rate for the period. Ending balances are translated at the spot rate as of the period end.
|
|
(5)
|
Includes expiring available capital, the impact of capital calls for fees and expenses and other changes in AUM.
|
161
Total AUM was
$46.3 billion
as of
December 31, 2017
, an increase of
$3.2 billion
, or
7%
, compared to
$43.1 billion
as of
December 31, 2016
. This increase was driven by
$5.5 billion
of new commitments raised primarily in our AlpInvest funds,
$4.4 billion
of foreign exchange gains related to the translation of our AlpInvest AUM from EUR to USD, and
$3.6 billion
of market appreciation. Market appreciation was driven by 10% appreciation in our AlpInvest funds and 12% appreciation in our MRE funds. Offsetting this increase were
$9.8 billion
of outflows primarily due to distributions in our AlpInvest funds.
Total AUM was $43.1 billion as of December 31, 2016, a decrease of $3.1 billion, or 7%, compared to $46.2 billion as of December 31, 2015. This decrease was driven by $10.4 billion of outflows primarily related to distributions in our AlpInvest funds and redemptions in our DGAM fund of hedge funds vehicles. Partially offsetting these decreases were $4.1 billion of new commitments primarily in our AlpInvest Primary and Secondaries product lines and $4.7 billion of market appreciation. Market appreciation was driven by 12% appreciation in our AlpInvest funds and 4% appreciation in our MRE funds.
Total AUM was $46.2 billion as of December 31, 2015, a decrease of $4.6 billion, or 9%, compared to $50.8 billion as of December 31, 2014. This decrease was driven by $11.5 billion of outflows primarily related to distributions in our AlpInvest funds and $3.9 billion of foreign exchange decreases related to the translation of our AlpInvest AUM from EUR to USD. Offsetting these decreases were $3.5 billion of new commitments primarily in our AlpInvest and Metropolitan funds and
$7.7 billion
of market appreciation. Market appreciation was driven by appreciation of $7.6 billion in our AlpInvest funds, $0.1 billion in our Metropolitan funds, and $0.1 billion of depreciation in our DGAM fund of hedge funds vehicles.
Fund Performance Metrics
Fund performance information for our investment funds that have at least $1.0 billion in capital commitments, cumulative equity invested or total value as of
December 31, 2017
, which we refer to as our “significant funds,” is generally included throughout this discussion and analysis to facilitate an understanding of our results of operations for the periods presented. The fund return information reflected in this discussion and analysis is not indicative of the performance of The Carlyle Group L.P. and is also not necessarily indicative of the future performance of any particular fund. An investment in The Carlyle Group L.P. is not an investment in any of our funds. There can be no assurance that any of our funds or our other existing and future funds will achieve similar returns. See “Item 1A. Risk Factors—Risks Related to Our Business Operations—The historical returns attributable to our funds, including those presented in this report, should not be considered as indicative of the future results of our funds or of our future results or of any returns expected on an investment in our common units.”
162
The following tables reflect the performance of our significant funds in our Investment Solutions business.
|
|
|
|
TOTAL INVESTMENTS
|
||||||||||||||||||
|
|
|
|
as of December 31, 2017
|
||||||||||||||||||
|
Investment Solutions (1)
|
Vintage
Year
|
Fund Size
|
Cumulative
Invested
Capital
(2)(8)
|
Total Fair
Value (3)(8)
|
MOIC (4)
|
Gross
IRR (6) (10)
|
Net IRR
(7) (10)
|
||||||||||||||
|
|
|
|
(Reported in Local Currency, in Millions)
|
||||||||||||||||||
|
AlpInvest
|
|
||||||||||||||||||||
|
Fully Committed Funds (5)
|
|
||||||||||||||||||||
|
Main Fund I - Fund Investments
|
2000
|
€
|
5,174.6
|
|
€
|
4,151.9
|
|
€
|
6,831.8
|
|
1.6x
|
12
|
%
|
11
|
%
|
||||||
|
Main Fund II - Fund Investments
|
2003
|
€
|
4,545.0
|
|
€
|
4,727.2
|
|
€
|
7,509.9
|
|
1.6x
|
10
|
%
|
9
|
%
|
||||||
|
Main Fund III - Fund Investments
|
2005
|
€
|
11,500.0
|
|
€
|
12,476.5
|
|
€
|
19,895.6
|
|
1.6x
|
10
|
%
|
9
|
%
|
||||||
|
Main Fund IV - Fund Investments
|
2009
|
€
|
4,877.3
|
|
€
|
4,921.5
|
|
€
|
7,860.7
|
|
1.6x
|
16
|
%
|
16
|
%
|
||||||
|
Main Fund V - Fund Investments
|
2012
|
€
|
5,080.0
|
|
€
|
3,839.2
|
|
€
|
4,856.9
|
|
1.3x
|
13
|
%
|
12
|
%
|
||||||
|
Main Fund VI - Fund Investments
|
2015
|
€
|
1,106.4
|
|
€
|
393.1
|
|
€
|
403.0
|
|
1.0x
|
NM
|
|
NM
|
|
||||||
|
Main Fund I - Secondary Investments
|
2002
|
€
|
519.4
|
|
€
|
469.8
|
|
€
|
884.0
|
|
1.9x
|
57
|
%
|
53
|
%
|
||||||
|
Main Fund II - Secondary Investments
|
2003
|
€
|
998.4
|
|
€
|
983.6
|
|
€
|
1,799.8
|
|
1.8x
|
27
|
%
|
26
|
%
|
||||||
|
Main Fund III - Secondary Investments
|
2006
|
€
|
2,250.0
|
|
€
|
2,271.1
|
|
€
|
3,448.5
|
|
1.5x
|
11
|
%
|
10
|
%
|
||||||
|
Main Fund IV - Secondary Investments
|
2010
|
€
|
1,859.1
|
|
€
|
1,895.7
|
|
€
|
3,213.3
|
|
1.7x
|
20
|
%
|
19
|
%
|
||||||
|
Main Fund V - Secondary Investments
|
2011
|
€
|
4,272.8
|
|
€
|
3,739.8
|
|
€
|
5,658.7
|
|
1.5x
|
22
|
%
|
20
|
%
|
||||||
|
Main Fund II - Co-Investments
|
2003
|
€
|
1,090.0
|
|
€
|
891.1
|
|
€
|
2,491.5
|
|
2.8x
|
44
|
%
|
42
|
%
|
||||||
|
Main Fund III - Co-Investments
|
2006
|
€
|
2,760.0
|
|
€
|
2,696.9
|
|
€
|
3,739.2
|
|
1.4x
|
5
|
%
|
5
|
%
|
||||||
|
Main Fund IV - Co-Investments
|
2010
|
€
|
1,475.0
|
|
€
|
1,309.6
|
|
€
|
3,436.7
|
|
2.6x
|
24
|
%
|
22
|
%
|
||||||
|
Main Fund V - Co-Investments
|
2012
|
€
|
1,122.2
|
|
€
|
1,000.8
|
|
€
|
2,402.5
|
|
2.4x
|
34
|
%
|
31
|
%
|
||||||
|
Main Fund VI - Co-Investments
|
2014
|
€
|
1,114.6
|
|
€
|
907.0
|
|
€
|
1,372.3
|
|
1.5x
|
25
|
%
|
22
|
%
|
||||||
|
Main Fund II - Mezzanine Investments
|
2004
|
€
|
700.0
|
|
€
|
739.0
|
|
€
|
1,018.0
|
|
1.4x
|
8
|
%
|
7
|
%
|
||||||
|
Main Fund III - Mezzanine Investments
|
2006
|
€
|
2,000.0
|
|
€
|
1,905.8
|
|
€
|
2,583.3
|
|
1.4x
|
10
|
%
|
9
|
%
|
||||||
|
All Other Funds (9)
|
Various
|
|
€
|
1,945.0
|
|
€
|
2,697.6
|
|
1.4x
|
14
|
%
|
11
|
%
|
||||||||
|
Total Fully Committed Funds
|
|
|
€
|
51,264.6
|
|
€
|
82,103.3
|
|
1.6x
|
13
|
%
|
12
|
%
|
||||||||
|
Funds in the Commitment Period (5)
|
|
|
|
|
|
|
|
||||||||||||||
|
Main Fund VI - Secondary Investments
|
2017
|
€
|
4,263.5
|
|
€
|
668.9
|
|
€
|
769.0
|
|
1.1x
|
NM
|
|
NM
|
|
||||||
|
Main Fund VII - Co-Investments
|
2017
|
€
|
2,442.5
|
|
€
|
288.7
|
|
€
|
290.2
|
|
1.0x
|
NM
|
|
NM
|
|
||||||
|
All Other Funds (9)
|
Various
|
|
€
|
667.5
|
|
€
|
868.9
|
|
1.3x
|
21
|
%
|
17
|
%
|
||||||||
|
Total Funds in the Commitment Period
|
|
|
€
|
1,625.1
|
|
€
|
1,928.1
|
|
1.2x
|
22
|
%
|
14
|
%
|
||||||||
|
TOTAL ALPINVEST
|
|
|
€
|
52,889.7
|
|
€
|
84,031.4
|
|
1.6x
|
13
|
%
|
12
|
%
|
||||||||
|
TOTAL INVESTMENT SOLUTIONS (USD) (11)
|
$
|
63,577.0
|
|
$
|
101,011.4
|
|
1.6x
|
||||||||||||||
|
Metropolitan Real Estate
|
|
||||||||||||||||||||
|
Fully Committed Funds (5)
|
Various
|
$
|
2,978.4
|
|
$
|
3,826.2
|
|
1.3x
|
7
|
%
|
4
|
%
|
|||||||||
|
Funds in the Commitment Period (5)
|
Various
|
$
|
110.6
|
|
$
|
123.6
|
|
1.1x
|
NM
|
|
NM
|
|
|||||||||
|
TOTAL METROPOLITAN REAL ESTATE
|
|
$
|
3,089.0
|
|
$
|
3,949.8
|
|
1.3x
|
7
|
%
|
4
|
%
|
|||||||||
|
(1)
|
Includes private equity and mezzanine primary fund investments, secondary fund investments and co-investments originated by the AlpInvest team, as well as real estate primary fund investments, secondary fund investments and co-investments originated by the Metropolitan Real Estate team. Excluded from the performance information shown are a) investments that were not originated by AlpInvest, and b) Direct Investments, which was spun off from AlpInvest in 2005 and c) LP co-investment vehicles. As of December 31, 2017, these excluded investments represent $0.3 billion of AUM at AlpInvest.
|
163
|
(2)
|
Represents the original cost of all capital called for investments since inception of the fund.
|
|
(3)
|
Represents all realized proceeds combined with remaining fair value, before management fees, expenses and carried interest.
|
|
(4)
|
Multiple of invested capital (“MOIC”) represents total fair value, before management fees, expenses and carried interest, divided by cumulative invested capital.
|
|
(5)
|
Fully Committed funds are past the expiration date of the commitment period as defined in the respective limited partnership agreement.
|
|
(6)
|
Gross Internal Rate of Return (“Gross IRR”) represents the annualized IRR for the period indicated on Limited Partner invested capital based on investment contributions, distributions and unrealized value of the underlying investments before management fees, expenses and carried interest at the AlpInvest/Metropolitan Real Estate level.
|
|
(7)
|
Net Internal Rate of Return (“Net IRR”) represents the annualized IRR for the period indicated on Limited Partner invested capital based on contributions, distributions and unrealized value after management fees, expenses and carried interest. Fund level IRRs are based on aggregate Limited Partner cash flows, and this blended return may differ from that of individual Limited Partners. As a result, certain funds may generate accrued performance fees with a blended Net IRR that is below the preferred return hurdle for that fund.
|
|
(8)
|
To exclude the impact of FX, all AlpInvest foreign currency cash flows have been converted to Euro at the reporting period spot rate.
|
|
(9)
|
Aggregate includes Main Fund VII - Fund Investments, Main Fund VIII - Fund Investments, Main Fund I - Co-Investments, Main Fund I - Mezzanine Investments, Main Fund IV - Mezzanine Investments, Main Fund V - Mezzanine Investments, AlpInvest CleanTech Funds and funds which are not included as part of a main fund.
|
|
(10)
|
For funds marked “NM,” IRR may be positive or negative, but is not considered meaningful because of the limited time since initial investment and early stage of capital deployment. For funds marked “Neg,” IRR is negative as of reporting period end.
|
|
(11)
|
Represents the U.S. dollar equivalent balance translated at the spot rate as of period end.
|
Liquidity and Capital Resources
Historical Liquidity and Capital Resources
We have historically required limited capital resources to support the working capital and operating needs of our business. Our management fees have largely covered our operating costs and all realized performance fees, after covering the related compensation, are available for distribution to equityholders. Historically, approximately 95% of all capital commitments to our funds have been provided by our fund investors, with the remaining amount typically funded by our senior Carlyle professionals, advisors and other professionals.
Our Sources of Liquidity
We have multiple sources of liquidity to meet our capital needs, including cash on hand, annual cash flows, accumulated earnings and funds from our senior credit facility, including a term loan facility and a revolving credit facility with
$750.0 million
available as of
December 31, 2017
. We believe these sources will be sufficient to fund our capital needs for at least the next twelve months. If we determine that market conditions are favorable after taking into account our liquidity requirements, including the amounts available under our senior credit facility, we may seek to issue and sell common units in a registered public offering or a privately negotiated transaction, or we may issue additional senior notes, other debt or preferred equity. In September 2017, we issued 16 million of our 5.875% Series A Preferred Units for net proceeds of $387.5 million.
Cash and cash equivalents.
Cash and cash equivalents were approximately
$1.0 billion
at
December 31, 2017
. However, a portion of this cash is allocated for specific business purposes, including, but not limited to, (i) performance fee-related cash that has been received but not yet distributed as performance fee related compensation and amounts owed to non-controlling interests; (ii) proceeds received from realized investments that are allocable to non-controlling interests; and (iii) regulatory capital.
Corporate Treasury Investments.
Corporate treasury investments were approximately $
376.3 million
at
December 31, 2017
. These investments represent investments in U.S. Treasury and government agency obligations, commercial paper, certificates of deposit, other investment grade securities and other investments with original maturities of greater than three months when purchased.
164
After deducting cash amounts allocated to the specific requirements mentioned above, the remaining cash and cash equivalents, including corporate treasury investments, is approximately $1.2 billion as of
December 31, 2017
. This remaining amount will be used towards our primary liquidity needs, as outlined in the next section. This amount does not take into consideration ordinary course of business payables and reserves for specific business purposes.
Senior Credit Facility.
The senior credit facility includes $25.0 million in a term loan and $750.0 million in a revolving credit facility. The term loan and revolving credit facility mature on May 5, 2020. Principal amounts outstanding under the amended term loan and revolving credit facility accrue interest, at the option of the borrowers, either (a) at an alternate base rate plus an applicable margin not to exceed 0.75%, or (b) at LIBOR plus an applicable margin not to exceed 1.75% (
2.60%
at
December 31, 2017
).
The senior credit facility is unsecured. We are required to maintain management fee earning assets (as defined in the amended senior credit facility) of at least $65.3 billion and a total leverage ratio of less than 3.0 to 1.0, in each case, tested on a quarterly basis. Non-compliance with any of the financial or non-financial covenants without cure or waiver would constitute an event of default under the senior credit facility. An event of default resulting from a breach of certain financial or non-financial covenants may result, at the option of the lenders, in an acceleration of the principal and interest outstanding, and a termination of the revolving credit facility. The senior credit facility also contains other customary events of default, including defaults based on events of bankruptcy and insolvency, nonpayment of principal, interest or fees when due, breach of specified covenants, change in control and material inaccuracy of representations and warranties.
Our balance sheet at
December 31, 2017
reflects $25.0 million outstanding under our senior credit facility, comprised of $25.0 million of term loan balance outstanding. On April 6, 2017, we borrowed $250 million under the revolving credit facility of our senior credit facility. This amount was repaid in full on June 2, 2017.
CLO Term Loans.
For certain of our CLOs, the Partnership finances a portion of its investment in the CLOs through the proceeds received from term loans with financial institutions. The Partnership's outstanding CLO term loans consist of the following (Dollars in millions):
|
Formation Date
|
Borrowing
Outstanding December 31, 2017 |
Borrowing Outstanding December 31, 2016
|
Maturity Date
(1)
|
Interest Rate as of December 31, 2017
|
|||||||||||
|
October 3, 2013
|
$
|
—
|
|
(2)
|
$
|
13.2
|
|
(2)
|
September 28, 2018
|
NA
|
(3)
|
||||
|
June 7, 2016
|
20.6
|
|
20.6
|
|
July 15, 2027
|
3.16%
|
(4)
|
||||||||
|
February 28, 2017
|
74.3
|
|
—
|
|
September 21, 2029
|
2.33%
|
(5)
|
||||||||
|
April 19, 2017
|
22.8
|
|
—
|
|
April 22, 2031
|
3.29%
|
(6) (15)
|
||||||||
|
June 28, 2017
|
23.1
|
|
—
|
|
July 22, 2031
|
3.29%
|
(7) (15)
|
||||||||
|
July 20, 2017
|
24.4
|
|
—
|
|
April 21, 2027
|
2.90%
|
(8) (15)
|
||||||||
|
August 2, 2017
|
22.8
|
|
—
|
|
July 23, 2029
|
3.17%
|
(9) (15)
|
||||||||
|
August 2, 2017
|
20.9
|
|
—
|
|
August 3, 2022
|
1.75%
|
(10)
|
||||||||
|
August 14, 2017
|
22.6
|
|
—
|
|
August 15, 2030
|
3.26%
|
(11) (15)
|
||||||||
|
November 30, 2017
|
22.7
|
|
—
|
|
January 16, 2030
|
3.12%
|
(12) (15)
|
||||||||
|
December 6, 2017
|
19.1
|
|
—
|
|
October 16, 2030
|
3.01%
|
(13) (15)
|
||||||||
|
December 7, 2017
|
21.2
|
|
—
|
|
January 19, 2029
|
2.73%
|
(14) (15)
|
||||||||
|
$
|
294.5
|
|
$
|
33.8
|
|
||||||||||
(1) Maturity date is earlier of date indicated or the date that the CLO is dissolved.
(2) Original borrowing amount of
€12.6 million
.
(3) Note paid off during 2017.
|
(4)
|
Incurs interest at the weighted average rate of the underlying senior notes. Interest income on the underlying collateral approximated the amount of interest expense and was not significant for the year ended December 31, 2017.
|
|
(5)
|
Original borrowing of
€61.8 million
; incurs interest at EURIBOR plus applicable margins as defined in the agreement.
|
|
(6)
|
Incurs interest at LIBOR plus
1.932%
.
|
|
(7)
|
Incurs interest at LIBOR plus
1.923%
.
|
|
(8)
|
Incurs interest at LIBOR plus
1.536%
.
|
|
(9)
|
Incurs interest at LIBOR plus
1.808%
.
|
|
(10)
|
Original borrowing of
€17.4 million
; incurs interest at LIBOR plus
1.75%
and has full recourse to the Partnership.
|
165
|
(11)
|
Incurs interest at LIBOR plus
1.848%
.
|
(12) Incurs interest at LIBOR plus
1.7312%
.
|
(13)
|
Incurs interest at LIBOR plus
1.647%
.
|
|
(14)
|
Incurs interest at LIBOR plus
1.365%
.
|
|
(15)
|
Term loan issued under master credit agreement.
|
The CLO term loans are secured by the Partnership’s investments in the respective CLO, have a general unsecured interest in the Carlyle entity that manages the CLO, and generally do not have recourse to any other Carlyle entity.
European CLO Financing.
On February 28, 2017, a subsidiary of the Partnership entered into a financing agreement with several financial institutions under which these financial institutions provided a
€61.8 million
term loan (
$74.3 million
at
December 31, 2017
) to the Partnership. This term loan is secured by the Partnership’s investments in the retained notes in certain European CLOs that were formed in 2014 and 2015. This term loan will mature on the earlier of September 21, 2029 or the date that the certain European CLO retained notes have been redeemed. The Partnership may prepay the term loan in whole or in part at any time after the third year of the date of issuance without penalty. Prepayment of the term loan within the first three years will incur a penalty based on the prepayment amount. Interest on this term loan accrues at EURIBOR plus applicable margins (
2.3%
at
December 31, 2017
).
Master Credit Agreement - Term Loans.
In January 2017, the Partnership entered into a master credit agreement with a financial institution under which the financial institution expects to provide term loans to the Partnership for the Partnership to purchase eligible interests in CLOs. This agreement will terminate in January 2020. Any term loan to be issued under this master credit agreement will be secured by the Partnership’s investment in the respective CLO as well as any senior management fee and subordinated management fee payable by each CLO. Any term loan will bear interest at LIBOR plus a weighted average spread and an applicable margin. Interest will be due quarterly.
3.875% Senior Notes
. In January 2013, Carlyle Holdings Finance L.L.C., an indirect finance subsidiary of the Partnership issued $500.0 million of 3.875% senior notes due February 1, 2023 at 99.966% of par. Interest is payable semi-annually on February 1 and August 1, beginning August 1, 2013. The notes are unsecured and unsubordinated obligations of Carlyle Holdings Finance L.L.C. and are fully and unconditionally guaranteed, jointly and severally, by The Carlyle Group L.P. and each of the Carlyle Holdings partnerships. The indenture governing the notes contains customary covenants that, among other things, limit Carlyle Holdings Finance L.L.C. and the guarantors’ ability, subject to certain exceptions, to incur indebtedness secured by liens on voting stock or profit participating equity interests of their subsidiaries or merge, consolidate or sell, transfer or lease assets. The notes also contain customary events of default. All or a portion of the notes may be redeemed at our option, in whole or in part, at any time and from time to time, prior to their stated maturity, at the make-whole redemption price set forth in the notes. If a change of control repurchase event occurs, the notes are subject to repurchase at the repurchase price as set forth in the notes.
5.625% Senior Notes.
In March 2013, Carlyle Holdings II Finance L.L.C., an indirect finance subsidiary of the Partnership, issued $400.0 million of 5.625% Senior Notes due March 30, 2043 at 99.583% of par. Interest is payable semi-annually on March 30 and September 30, beginning September 30, 2013. The notes are unsecured and unsubordinated obligations of Carlyle Holdings Finance II L.L.C. and are fully and unconditionally guaranteed, jointly and severally, by The Carlyle Group L.P. and each of the Carlyle Holdings partnerships. The indenture governing the notes contains customary covenants and financial restrictions that, among other things, limit Carlyle Holdings Finance II L.L.C. and the guarantors’ ability, subject to certain exceptions, to incur indebtedness secured by liens on voting stock or profit participating equity interests of their subsidiaries or merge, consolidate or sell, transfer or lease assets. The notes also contain customary events of default. All or a portion of the notes may be redeemed at our option, in whole or in part, at any time and from time to time, prior to their stated maturity, at the make-whole redemption price set forth in the notes. If a change of control repurchase event occurs, the notes are subject to repurchase at the repurchase price as set forth in the notes.
In March 2014, Carlyle Holdings II Finance L.L.C. issued $200.0 million of 5.625% Senior Notes due March 30, 2043 at 104.315% of par. These notes were issued as additional 5.625% Senior Notes due March 30, 2043 and will be treated as a single class with the already outstanding $400.0 million aggregate principal amount of these senior notes.
Promissory Notes.
On January 1, 2016, the Partnership issued a $120.0 million promissory note to BNRI as a result of a contingent consideration arrangement entered into in 2012 between the Partnership and BNRI as part of the Partnership's strategic investment in NGP (see Note 5 to the consolidated financial statements). Interest on the promissory note accrues at the three month LIBOR plus 2.50% (
4.19%
at
December 31, 2017
). The Partnership may prepay the promissory note in whole or in part at any time without penalty. The promissory note is scheduled to mature on January 1, 2022. In December 2016, the Partnership repurchased $11.2 million of the promissory note.
166
Additionally, in June 2017, as part of the settlement with investors in two commodities investment vehicles managed by an affiliate of the Partnership (discussed in Note 9 to the unaudited condensed consolidated financial statements), the Partnership issued a series of promissory notes, aggregating to $53.9 million, to the investors of these commodities investment vehicles. Interest on these promissory notes accrues at the three month LIBOR plus 2% (
3.36%
at December 31, 2017). The Partnership may prepay these promissory notes in whole or in part at any time without penalty. In October 2017, the Partnership repaid
$6.7 million
of this promissory note. Accordingly,
$47.2 million
of this promissory note is outstanding at December 31, 2017. These promissory notes are scheduled to mature on July 15, 2019.
Obligations of CLOs.
Loans payable of the Consolidated Funds represent amounts due to holders of debt securities issued by the CLOs. We are not liable for any loans payable of the CLOs. Several of the CLOs issued preferred shares representing the most subordinated interest, however these tranches are mandatorily redeemable upon the maturity dates of the senior secured loans payable, and as a result have been classified as liabilities under U.S. GAAP, and are included in loans payable of Consolidated Funds in our consolidated balance sheets.
Loans payable of the CLOs are collateralized by the assets held by the CLOs and the assets of one CLO may not be used to satisfy the liabilities of another. This collateral consists of cash and cash equivalents, corporate loans, corporate bonds and other securities.
Preferred Units.
On September 13, 2017, we issued 16 million of our Preferred Units for net proceeds of approximately $387.5 million. We plan to use these proceeds for general corporate purposes, including to fund investments. Distributions on the Preferred Units are discretionary and non-cumulative. The Preferred Units may be redeemed at our option, in whole or in part, at any time on or after September 15, 2022 at a price of $25 per Preferred Unit, plus declared and unpaid distributions. In addition, the Preferred Units may be redeemed at our option prior to September 15, 2022, upon the occurrence of change of control, tax redemption or rating agency events. Holders of the Preferred Units will generally have no voting rights and have none of the voting rights given to holders of our common units, except as otherwise provided in Carlyle's limited partnership agreement. Holders of the Preferred Units have no right to require the redemption of the Preferred Units and the Preferred Units do not have a maturity date. See Note 14 of our consolidated financial statements for more information.
Realized performance fee revenue
. Another source of liquidity we may use to meet our capital needs is the realized performance fee revenue generated by our investment funds. Carried interest is generally realized when an underlying investment is profitably disposed of and the fund’s cumulative returns are in excess of the preferred return. For certain funds, carried interest is realized once all invested capital and expenses have been returned to the fund's investors and the fund's cumulative returns are in excess of the preferred return. Incentive fees earned on our CLO vehicles generally are paid upon the dissolution of such vehicles.
Our accrued performance fees by segment as of
December 31, 2017
, gross and net of accrued giveback obligations, are set forth below:
|
Asset Class
|
Accrued
Performance
Fees
|
Accrued
Giveback
Obligation
|
Net Accrued
Performance
Fees
|
||||||||
|
|
(Dollars in millions)
|
||||||||||
|
Corporate Private Equity
|
$
|
2,272.4
|
|
$
|
(8.7
|
)
|
$
|
2,263.7
|
|
||
|
Real Assets
|
657.5
|
|
(58.1
|
)
|
599.4
|
|
|||||
|
Global Credit
|
56.1
|
|
—
|
|
56.1
|
|
|||||
|
Investment Solutions
|
684.6
|
|
—
|
|
684.6
|
|
|||||
|
Total
|
$
|
3,670.6
|
|
$
|
(66.8
|
)
|
$
|
3,603.8
|
|
||
|
Plus: Accrued performance fees from NGP
|
143.2
|
|
|||||||||
|
Less: Accrued performance fee-related compensation
|
(1,894.8
|
)
|
|||||||||
|
Plus: Receivable for giveback obligations from current and former employees
|
5.0
|
|
|||||||||
|
Less: Deferred taxes on accrued performance fees
|
(67.6
|
)
|
|||||||||
|
Less: Net accrued performance fees attributable to non-controlling interests in consolidated entities
|
(0.8
|
)
|
|||||||||
|
Net accrued performance fees before timing differences
|
1,788.8
|
|
|||||||||
|
Less/Plus: Timing differences between the period when accrued performance fees are realized and the period they are collected/distributed
|
(71.6
|
)
|
|||||||||
|
Net accrued performance fees attributable to Carlyle Holdings
|
$
|
1,717.2
|
|
||||||||
167
As of
December 31, 2017
, the net accrued performance fees attributable to Carlyle Holdings, excluding realized amounts, related to our carry funds and our other vehicles by segment were as follows (Dollars in millions):
|
Carry fund-related
|
|||
|
Corporate Private Equity:
|
|||
|
Buyout
|
$
|
1,097.9
|
|
|
Growth Capital
|
41.7
|
|
|
|
Total Corporate Private Equity
|
1,139.6
|
|
|
|
Real Assets:
|
|||
|
Real Estate
|
312.7
|
|
|
|
Natural Resources
|
180.3
|
|
|
|
Legacy Energy
|
(16.2
|
)
|
|
|
Total Real Assets
|
476.8
|
|
|
|
Global Credit
|
27.2
|
|
|
|
Investment Solutions
|
73.6
|
|
|
|
Net accrued performance fees attributable to Carlyle Holdings
|
$
|
1,717.2
|
|
Realized investment income.
Another source of liquidity we may use to meet our capital needs is the realized investment income generated by our equity method investments and other principal investments. Investment income is realized when we redeem all or a portion of our investment or when we receive or are due cash income, such as dividends or distributions. Certain of the investments attributable to Carlyle Holdings (excluding certain general partner interests, strategic investments, and investments in certain CLOs) may be sold at our discretion as a source of liquidity.
Our Liquidity Needs
We generally use our working capital and cash flows to invest in growth initiatives, service our debt, fund the working capital needs of our business and investment funds and pay distributions to our unitholders.
In the future, we expect that our primary liquidity needs will be to:
|
•
|
provide capital to facilitate the growth of our existing business lines;
|
|
•
|
provide capital to facilitate our expansion into new, complementary business lines, including acquisitions;
|
|
•
|
pay operating expenses, including compensation and compliance costs and other obligations as they arise;
|
|
•
|
fund costs of litigation and contingencies, including related legal costs;
|
|
•
|
fund the capital investments of Carlyle in our funds;
|
|
•
|
fund capital expenditures;
|
|
•
|
repay borrowings and related interest costs and expenses;
|
|
•
|
pay earnouts and contingent cash consideration associated with our acquisitions and strategic investments;
|
|
•
|
pay income taxes;
|
|
•
|
make distributions to our common and preferred unitholders and the holders of the Carlyle Holdings partnership units in accordance with our distribution policy, and;
|
|
•
|
repurchase our units.
|
Preferred Unit Distributions.
With respect to distribution year 2017, the Board of Directors of our general partner has declared a distribution to preferred unitholders totaling approximately $6.0 million, or $0.375347 per Preferred Unit, which was paid on December 15, 2017. In February 2018, the Board of Directors of the general partner of the Partnership declared a distribution for the first quarter of 2018 of
$0.367188
per preferred unit to preferred unitholders of record at the close of
168
business on March 1, 2018, payable on March 15, 2018. Distributions on the Preferred Units are discretionary and non-cumulative.
Common Unit Distributions.
With respect to distribution year 2017, the Board of Directors of our general partner has declared cumulative distributions to common unitholders totaling approximately $137.5 million, or $1.41 per common unit, consisting of (i) $0.33 per common unit in respect of the fourth quarter of 2017, which is payable on February 27, 2018 to common unitholders of record on February 20, 2018, (ii) $0.56 per common unit in respect of the third quarter of 2017, which was paid in November 2017, (iii) $0.42 per common unit in respect of the second quarter of 2017, which was paid in August 2017, and (iv) $0.10 per common unit in respect of the first quarter of 2017, which was paid in May 2017. Distributions to common unitholders paid during the calendar year ended December 31, 2017 were $118.1 million, representing the distributions paid in February 2017 of $0.16 per common unit with respect to the fourth quarter of 2016, $0.10 per common unit with respect to the first quarter of 2017, $0.42 per common unit with respect to the second quarter of 2017, and $0.56 per common unit with respect to the third quarter of 2017.
With respect to distribution year 2016, the Board of Directors of our general partner has declared cumulative distributions to common unitholders totaling approximately $131.1 million, or $1.55 per common unit, consisting of (i) $0.16 per common unit in respect of the fourth quarter of 2016, which was paid in February 2017, (ii) $0.50 per common unit in respect of the third quarter of 2016, which was paid in November 2016, (iii) $0.63 per common unit in respect of the second quarter of 2016, which was paid in August 2016, and (iv) $0.26 per common unit in respect of the first quarter of 2016, which was paid in May 2016. Distributions to common unitholders paid during the calendar year ended December 31, 2016 were $140.9 million, representing the distributions paid in March 2016 of $0.29 per common unit with respect to the fourth quarter of 2015, $0.26 per common unit with respect to the first quarter of 2016, $0.63 per common unit with respect to the second quarter of 2016, and $0.50 per common unit with respect to the third quarter of 2016.
With respect to distribution year 2015, the Board of Directors of our general partner has declared cumulative distributions to common unitholders totaling approximately $163.7 million, or $2.07 per common unit, consisting of (i) $0.29 per common unit in respect of the fourth quarter of 2015, which was paid in March 2016, (ii) $0.56 per common unit in respect of the third quarter of 2015, which was paid in November 2015, (iii) $0.89 per common unit in respect of the second quarter of 2015, which was paid in August 2015, and (iv) $0.33 per common unit in respect of the first quarter of 2015, which was paid in May 2015. Distributions to common unitholders paid during the calendar year ended December 31, 2015 were $251.0 million, representing the distributions paid in March 2015 of $1.61 per common unit with respect to the fourth quarter of 2014, $0.33 per common unit with respect to the first quarter of 2015, $0.89 per common unit with respect to the second quarter of 2015, and $0.56 per common unit with respect to the third quarter of 2015.
Carlyle Holdings Units Distributions.
With respect to distribution year 2017, we declared distributions to the other limited partners of Carlyle Holdings totaling approximately $334.2 million, or $1.41 per Carlyle Holdings unit, consisting of (i) $0.33 per Carlyle Holdings unit in respect of the fourth quarter of 2017, which is payable on February 26, 2018 to Carlyle Holdings unitholders of record on February 20, 2018, (ii) $0.56 per Carlyle Holdings unit in respect of the third quarter of 2017, which was paid in November 2017, (iii) $0.42 per Carlyle Holdings unit in respect of the second quarter of 2017, which was paid in August 2017, and (iv) $0.10 per Carlyle Holdings unit in respect of the first quarter of 2017, which was paid in May 2017. Distributions to the other limited partners of Carlyle Holdings paid during the calendar year ended December 31, 2017 were $295.6 million, representing the distributions paid in February 2017 of $0.16 per Carlyle Holdings unit with respect to the fourth quarter of 2016, $0.10 per Carlyle Holdings unit with respect to the first quarter of 2017, $0.42 per Carlyle Holdings unit with respect to the second quarter of 2017, and $0.56 per Carlyle Holdings unit with respect to the third quarter of 2017.
With respect to distribution year 2016, we declared distributions to the other limited partners of Carlyle Holdings totaling approximately $376.2 million, or $1.55 per Carlyle Holdings unit, consisting of (i) $0.16 per Carlyle Holdings unit in respect of the fourth quarter of 2016, which was paid in February 2017, (ii) $0.50 per Carlyle Holdings unit in respect of the third quarter of 2016, which was paid in November 2016, (iii) $0.63 per Carlyle Holdings unit in respect of the second quarter of 2016, which was paid in August 2016, and (iv) $0.26 per Carlyle Holdings unit in respect of the first quarter of 2016, which was paid in May 2016. Distributions to the other limited partners of Carlyle Holdings paid during the calendar year ended December 31, 2016 were
$422.6 million
, representing the distributions paid in March 2016 of $0.35 per Carlyle Holdings unit with respect to the fourth quarter of 2015, $0.26 per Carlyle Holdings unit with respect to the first quarter of 2016, $0.63 per Carlyle Holdings unit with respect to the second quarter of 2016, and $0.50 per Carlyle Holdings unit with respect to the third quarter of 2016.
With respect to distribution year 2015, we declared distributions to the other limited partners of Carlyle Holdings totaling approximately $530.1 million, or $2.17 per Carlyle Holdings unit, consisting of (i) $0.35 per Carlyle Holdings unit in
169
respect of the fourth quarter of 2015, which was paid in March 2016, (ii) $0.60 per Carlyle Holdings unit in respect of the third quarter of 2015, which was paid in November 2015, (iii) $0.89 per Carlyle Holdings unit in respect of the second quarter of 2015, which was paid in August 2015, and (iv) $0.33 per Carlyle Holdings unit in respect of the first quarter of 2015, which was paid in May 2015. Distributions to the other limited partners of Carlyle Holdings paid during the calendar year ended December 31, 2015 were $848.5 million, representing the distributions paid in March 2015 of $1.61 per Carlyle Holdings unit with respect to the fourth quarter of 2014, $0.33 per Carlyle Holdings unit with respect to the first quarter of 2015, $0.89 per Carlyle Holdings unit with respect to the second quarter of 2015, and $0.60 per Carlyle Holdings unit with respect to the third quarter of 2015.
It is Carlyle’s intention to cause Carlyle Holdings to make quarterly distributions to its partners, including The Carlyle Group L.P.’s wholly owned subsidiaries, that will enable The Carlyle Group L.P. to pay a quarterly distribution of approximately 75% of Distributable Earnings Attributable to Common Unitholders for the quarter. “Distributable Earnings Attributable to Common Unitholders” refers to The Carlyle Group L.P.'s share of Distributable Earnings, after an implied provision for current corporate income taxes (other than corporate income taxes attributable to The Carlyle Group L.P.) and preferred unit distributions, net of corporate income taxes attributable to The Carlyle Group L.P. and amounts payable under the tax receivable agreement. Carlyle’s general partner may adjust the distribution for amounts determined to be necessary or appropriate to provide for the conduct of its business, to make appropriate investments in its business and its funds or to comply with applicable law or any of its financing agreements, or to provide for future cash requirements such as tax-related payments, giveback obligations and distributions to unitholders for any ensuing quarter. The amount to be distributed could also be adjusted upward in any one quarter.
Notwithstanding the foregoing, the declaration and payment of any distributions will be at the sole discretion of our general partner, which may change our distribution policy at any time. Our general partner will take into account general economic and business conditions, our strategic plans and prospects, our business and investment opportunities, our financial condition and operating results, working capital requirements and anticipated cash needs, contractual restrictions and obligations, legal, tax and regulatory restrictions, other constraints on the payment of distributions by us to our common unitholders or by our subsidiaries to us, and such other factors as our general partner may deem relevant.
Because our wholly owned subsidiaries must pay taxes and make payments under the tax receivable agreement, the amounts ultimately distributed by us to our common unitholders are expected to be less, on a per unit basis, than the amounts distributed by the Carlyle Holdings partnerships to the other limited partners of the Carlyle Holdings partnerships in respect of their Carlyle Holdings partnership units.
Fund commitments.
Generally, we intend to have Carlyle commit to fund approximately 0.75% to 1% of the capital commitments to our future carry funds, although we may elect to invest additional amounts in funds focused on new investment areas. We may, from time to time, exercise our right to purchase additional interests in our investment funds that become available in the ordinary course of their operations. We expect our senior Carlyle professionals and employees to continue to make significant capital contributions to our funds based on their existing commitments, and to make capital commitments to future funds consistent with the level of their historical commitments. We also intend to make investments in our open-end funds and our CLO vehicles. Our investments in our U.S. and European CLO vehicles will comply with the risk retention rules as discussed in “U.S. Risk Retention Rules” later in this section.
Since our inception through
December 31, 2017
, we and our senior Carlyle professionals, operating executives and other professionals have invested or committed to invest in or alongside our funds. Approximately 3% to 5% of all capital commitments to our funds are funded collectively by us and our senior Carlyle professionals, operating executives and other professionals. The current unfunded commitment of Carlyle and our senior Carlyle professionals, operating executives and other professionals to our investment funds as of
December 31, 2017
, consisted of the following:
|
Asset Class
|
Unfunded
Commitment
|
||
|
|
(Dollars in millions)
|
||
|
Corporate Private Equity
|
$
|
2,354.2
|
|
|
Real Assets
|
812.0
|
|
|
|
Global Credit
|
526.0
|
|
|
|
Investment Solutions
|
146.5
|
|
|
|
Total
|
$
|
3,838.7
|
|
170
A substantial majority of the remaining commitments are expected to be funded by, senior Carlyle professionals, operating executives and other professionals through our internal co-investment program. Of the
$3.8 billion
of unfunded commitments, approximately
$3.4 billion
is subscribed individually by senior Carlyle professionals, operating executives and other professionals, with the balance funded directly by the Partnership.
Investments as of
December 31, 2017
consist of the following (Dollars in millions):
|
Investments
|
$
|
1,624.3
|
|
|
Less: Amounts attributable to non-controlling interests in consolidated entities
|
(363.7
|
)
|
|
|
Less: Strategic equity method investments in NGP Management
|
(397.7
|
)
|
|
|
Less: Investment in NGP accrued performance fees
|
(143.2
|
)
|
|
|
Investments excluding non-controlling interests and NGP
|
719.7
|
|
|
|
Plus: investments in Consolidated Funds, eliminated in consolidation
|
219.9
|
|
|
|
Total investments attributable to Carlyle Holdings, exclusive of NGP management
|
$
|
939.6
|
|
Of the
$939.6 million
of total investments attributable to Carlyle Holdings, approximately $275 million are financed with loans (see
Sources of Liquidity
earlier in this section). The financing of our CLO investments within the last year has caused our total investments to increase at a faster rate than in prior periods. We expect this trend to continue in the near term.
Repurchase Program.
In February 2016, the Board of Directors of the general partner of the Partnership authorized the repurchase of up to $200 million of common units and/or Carlyle Holdings units. Under this unit repurchase program, units may be repurchased from time to time in open market transactions, in privately negotiated transactions or otherwise. We expect that the majority of repurchases under this program will be done via open market transactions. No units will be repurchased from our executive officers under this program. The timing and actual number of common units and/or Carlyle Holdings units repurchased will depend on a variety of factors, including legal requirements, price, and economic and market conditions. This unit repurchase program may be suspended or discontinued at any time and does not have a specified expiration date. For the year ended
December 31, 2017
, we have paid an aggregate of $0.2 million to repurchase and retire 14,190 units with all of the repurchases done via open market transactions. Since inception of the program, we have paid an aggregate of $59.1 million to repurchase and retire 3,695,889 units.
Cash Flows
The significant captions and amounts from our consolidated statements of cash flows which include the effects of our Consolidated Funds and CLOs in accordance with U.S. GAAP are summarized below.
|
|
Year Ended December 31,
|
||||||||||
|
|
2017
|
2016
|
2015
|
||||||||
|
|
(Dollars in millions)
|
||||||||||
|
Statements of Cash Flows Data
|
|||||||||||
|
Net cash (used in) provided by operating activities
|
$
|
(7.1
|
)
|
$
|
(300.6
|
)
|
$
|
3,902.8
|
|
||
|
Net cash used in investing activities
|
(49.5
|
)
|
(20.1
|
)
|
(21.5
|
)
|
|||||
|
Net cash provided by (used in) financing activities
|
318.6
|
|
15.3
|
|
(4,011.2
|
)
|
|||||
|
Effect of foreign exchange rate change
|
67.2
|
|
(15.2
|
)
|
(120.6
|
)
|
|||||
|
Net change in cash and cash equivalents
|
$
|
329.2
|
|
$
|
(320.6
|
)
|
$
|
(250.5
|
)
|
||
Net Cash Provided by (used in) Operating Activities.
Net cash provided by (used in) operating activities was primarily driven by our earnings in the respective periods after adjusting for significant non-cash activity, including non-cash performance fees, the related non-cash performance fee related compensation, non-cash equity-based compensation, and depreciation, amortization and impairments, all of which are included in earnings.
Operating cash inflows primarily include the receipt of management fees and realized performance fees, while operating cash outflows primarily include payments for operating expenses, including compensation and general, administrative, and other expenses. During
the years ended December 31, 2017, 2016 and 2015
, net cash provided by operating activities primarily includes the receipt of management fees and realized performance fees, totaling approximately $2.2 billion, $2.2 billion, and $2.7 billion, respectively. These inflows were partially offset by payments for compensation and
171
general, administrative, and other expenses of approximately $1.6 billion, $1.8 billion, and $1.9 billion for
the years ended December 31, 2017, 2016 and 2015
, respectively.
Cash used to purchase investments as well as the proceeds from the sale of such investments are also reflected in our operating activities as investments are a normal part of our operating activities. During the year ended
December 31, 2017
, investment proceeds were
$467.5 million
while investment purchases were
$888.5 million
. During the year ended
December 31, 2016
, investment proceeds were
$299.5 million
while investment purchases were
$368.2 million
. During the year ended
December 31, 2015
, investment proceeds were
$313.0 million
while investment purchases were
$91.9 million
.
The net cash used in operating activities for the year ended
December 31, 2017
also reflects the investment activity of our Consolidated Funds. For the year ended
December 31, 2017
, proceeds from the sales and settlements of investments by the Consolidated Funds were
$2,649.3 million
, while purchases of investments by the Consolidated Funds were
$2,875.0 million
. For the year ended
December 31, 2016
, proceeds from the sales and settlements of investments by the Consolidated Funds were
$1,282.9 million
, while purchases of investments by the Consolidated Funds were
$2,739.4 million
. For the year ended
December 31, 2015
, proceeds from the sales and settlements of investments by the Consolidated Funds were
$11,653.6 million
, while purchases of investments by the Consolidated Funds were
$10,472.1 million
.
Net Cash Used In Investing Activities.
Our investing activities generally reflect cash used for acquisitions, fixed assets and software for internal use, and changes in restricted cash. During the year ended
December 31, 2017
, cash used in investing activities principally reflects purchases of fixed assets. Purchases of fixed assets were
$34.0 million
,
$25.4 million
and
$62.3 million
for
the years ended December 31, 2017, 2016 and 2015
, respectively.
Net Cash Used in Financing Activities.
Financing activities are a net source of cash in 2017 and 2016 and a net use of cash in 2015. In 2017, we received net proceeds of $387.5 million from the issuance of preferred units. In 2016, we paid $58.9 million to repurchase 3.7 million units under our unit repurchase program. In June 2015, the Partnership received net proceeds from the issuance of 7,000,000 common units of $209.9 million. The Partnership used these net proceeds to acquire 7,000,000 Carlyle Holdings partnership units from the other limited partners of the Carlyle Holdings partnerships.
Distributions to our common unitholders were
$118.1 million
, $140.9 million, and $251.0 million for
the years ended December 31, 2017, 2016 and 2015
, respectively. Distributions to the non-controlling interest holders in Carlyle Holdings were
$295.6 million
, $422.6 million, and $848.5 million for
the years ended December 31, 2017, 2016 and 2015
, respectively. The net (payments) borrowings on loans payable by our Consolidated Funds during
the years ended December 31, 2017, 2016 and 2015
were $147.2 million, $594.2 million, and $734.3 million, respectively. For
the years ended December 31, 2017, 2016 and 2015
, contributions from non-controlling interest holders were
$119.2 million
, $113.0 million, and $2,376.6 million, respectively, which relate primarily to contributions from the non-controlling interest holders in Consolidated Funds. For
the years ended December 31, 2017, 2016 and 2015
, distributions to non-controlling interest holders were
$118.0 million
, $109.4 million, and $5,267.0 million, respectively, which relate primarily to distributions to the non-controlling interest holders in Consolidated Funds.
Total assets were
$12.3 billion
at
December 31, 2017
, an increase of $2.3 billion from
December 31, 2016
. The increase in total assets was primarily attributable to increases in accrued performance fees, investments in consolidated funds, investments, and cash and cash equivalents of $1,189.5 million, $640.6 million, $517.3 million, and $329.2 million, respectively. These increases were partially offset by a decrease in cash and cash equivalents held at Consolidated Funds of $383.9 million and the deconsolidation in 2017 of the total assets of the real estate VIE of $176.9 million. Cash and cash equivalents, including corporate treasury investments, were approximately $1.4 billion at
December 31, 2017
, an increase of $0.5 billion from
December 31, 2016
.
Total liabilities were
$9.3 billion
at
December 31, 2017
, an increase of $0.8 billion from
December 31, 2016
. The increase in liabilities was primarily attributable to increases in accrued compensation and benefits, loans payable of consolidated funds, and debt obligations of $560.8 million, $437.5 million, and $308.4 million, respectively. These increases were partially offset by decreases in other liabilities of Consolidated Funds and the deconsolidation in 2017 of the liabilities of the real estate VIE of $214.9 million and $203.9 million, respectively.
The assets and liabilities of the Consolidated Funds are generally held within separate legal entities and, as a result, the assets of the Consolidated Funds are not available to meet our liquidity requirements and similarly the liabilities of the Consolidated Funds are non-recourse to us. For example, as previously discussed, the CLO term loans generally are secured by
172
the Partnership's investment in the CLO, have a general unsecured interest in the Carlyle entity that manages the CLO, and do not have recourse to any other Carlyle entity.
Our balance sheet without the effect of the Consolidated Funds can be seen in Note 19 to the consolidated financial statements included in this Annual Report on Form 10-K. At
December 31, 2017
, our total assets were
$7.5 billion
, including cash and cash equivalents and corporate treasury investments totaling $1.4 billion and net accrued performance fees of $1.7 billion.
Unconsolidated Entities
Our corporate private equity funds and certain of our real estate funds have entered into lines of credit secured by their investors’ unpaid capital commitments or by a pledge of the equity of the underlying investment. These lines of credit are used primarily to reduce the overall number of capital calls to investors or for working capital needs. In certain instances, however, they may be used for other investment related activities, including serving as bridge financing for investments. The degree of leverage employed varies among portfolio companies.
Off-balance Sheet Arrangements
In the normal course of business, we enter into various off-balance sheet arrangements including sponsoring and owning limited or general partner interests in consolidated and non-consolidated funds, entering into derivative transactions, entering into operating leases and entering into guarantee arrangements. We also have ongoing capital commitment arrangements with certain of our consolidated and non-consolidated funds. We do not have any other off-balance sheet arrangements that would require us to fund losses or guarantee target returns to investors in any of our other investment funds.
For further information regarding our off-balance sheet arrangements, see Note 2 and Note 9 to the consolidated financial statements included in this Annual Report on Form 10-K.
Contractual Obligations
The following table sets forth information relating to our contractual obligations as of
December 31, 2017
on a consolidated basis and on a basis excluding the obligations of the Consolidated Funds:
|
2018
|
2019-2020
|
2021-2022
|
Thereafter
|
Total
|
|||||||||||||||
|
|
(Dollars in millions)
|
||||||||||||||||||
|
Debt obligations (including senior notes)
(a)
|
$
|
20.2
|
|
$
|
52.0
|
|
$
|
114.6
|
|
$
|
1,388.7
|
|
$
|
1,575.5
|
|
||||
|
Interest payable
(b)
|
69.1
|
|
135.4
|
|
125.9
|
|
727.5
|
|
1,057.9
|
|
|||||||||
|
Contingent cash and other consideration
(c)
|
83.3
|
|
13.6
|
|
—
|
|
—
|
|
96.9
|
|
|||||||||
|
Operating lease obligations
(d)
|
47.9
|
|
97.3
|
|
85.1
|
|
295.7
|
|
526.0
|
|
|||||||||
|
Capital commitments to Carlyle funds
(e)
|
3,838.7
|
|
—
|
|
—
|
|
—
|
|
3,838.7
|
|
|||||||||
|
Tax receivable agreement payments
(f)
|
1.3
|
|
—
|
|
13.1
|
|
79.6
|
|
94.0
|
|
|||||||||
|
Loans payable of Consolidated Funds
(g)
|
89.2
|
|
178.6
|
|
178.4
|
|
4,867.1
|
|
5,313.3
|
|
|||||||||
|
Unfunded commitments of the CLOs
(h)
|
4.3
|
|
—
|
|
—
|
|
—
|
|
4.3
|
|
|||||||||
|
Consolidated contractual obligations
|
4,154.0
|
|
476.9
|
|
517.1
|
|
7,358.6
|
|
12,506.6
|
|
|||||||||
|
Loans payable of Consolidated Funds
(g)
|
(89.2
|
)
|
(178.6
|
)
|
(178.4
|
)
|
(4,867.1
|
)
|
(5,313.3
|
)
|
|||||||||
|
Capital commitments to Carlyle funds
(e)
|
(3,378.3
|
)
|
—
|
|
—
|
|
—
|
|
(3,378.3
|
)
|
|||||||||
|
Unfunded commitments of the CLOs
(h)
|
(4.3
|
)
|
—
|
|
—
|
|
—
|
|
(4.3
|
)
|
|||||||||
|
Carlyle Operating Entities contractual obligations
|
$
|
682.2
|
|
$
|
298.3
|
|
$
|
338.7
|
|
$
|
2,491.5
|
|
$
|
3,810.7
|
|
||||
|
(a)
|
The table above assumes that no prepayments are made on the CLO term loans, promissory notes or senior notes and that the outstanding balance on the revolving credit facility is repaid on the maturity date of the senior credit facility, which is May 5, 2020. See Note 7 to the consolidated financial statements for the various maturity dates of the CLO term loans, promissory notes and senior notes.
|
|
(b)
|
The interest rate on the debt obligations as of December 31, 2017 consist of: 3.875% on $500.0 million of senior notes, 5.625% on $600.0 million of senior notes, approximately
2.60%
on $25.0 million remaining term loan under our senior credit facility, a range of approximately 1.75% to 3.29% for our CLO term loans, approximately
4.19%
on
$108.8 million
of the NGP promissory note and approximately
3.36%
on $53.9 million of our settlement promissory notes. Interest payments assume that no prepayments are made and loans are held until maturity.
|
173
|
(c)
|
These obligations represent our estimate of amounts to be paid on the contingent cash and other consideration obligations associated with our business acquisitions, strategic investment in NGP Management, payments related to the acquisition of secondary interests in Carlyle funds and other obligations.
|
|
(d)
|
We lease office space in various countries around the world and maintain our headquarters in Washington, D.C., where we lease our primary office space under a non-cancelable lease agreement expiring on July 31, 2026. Our office leases in other locations expire in various years from 2018 through 2032. The amounts in this table represent the minimum lease payments required over the term of the lease.
|
|
(e)
|
These obligations generally represent commitments by us to fund a portion of the purchase price paid for each investment made by our funds. These amounts are generally due on demand and are therefore presented in the less than one year category. A substantial majority of these investments is expected to be funded by senior Carlyle professionals and other professionals through our internal co-investment program. Of the
$3.8 billion
of unfunded commitments, approximately
$3.4 billion
is subscribed individually by senior Carlyle professionals, advisors and other professionals, with the balance funded directly by the Partnership.
|
|
(f)
|
Represents obligations by the Partnership’s corporate taxpayers to make payments under the tax receivable agreement. Holders of partnership units in Carlyle Holdings may exchange their Carlyle Holdings partnership units for common units in The Carlyle Group L.P. on a one-for-one basis. These exchanges may reduce the amount of tax that the corporate taxpayers would be required to pay in the future. The corporate taxpayers will pay to the limited partner of Carlyle Holdings making the exchange 85% of the amount of cash savings that the corporate taxpayers realize upon an exchange. See “Tax Receivable Agreement” below. Further, the amount and timing of payments is subject to change as the Partnership continues to analyze the 2017 Tax Reform Act (see Note 11 for more information about the Tax Reform Act).
|
|
(g)
|
These obligations represent amounts due to holders of debt securities issued by the consolidated CLO vehicles. These obligations include interest to be paid on debt securities issued by the consolidated CLO vehicles. Interest payments assume that no prepayments are made and loans are held until maturity. For debt securities with rights only to the residual value of the CLO and no stated interest, no interest payments were included in this calculation. Interest payments on variable-rate debt securities are based on interest rates in effect as of December 31, 2017, at spreads to market rates pursuant to the debt agreements, and range from 0.74% to 8.96%.
|
|
(h)
|
These obligations represent commitments of the CLOs to fund certain investments. These amounts are generally due on demand and are therefore presented in the less than one year category.
|
Excluded from the table above are liabilities for uncertain tax positions of $12.3 million at
December 31, 2017
as we are unable to estimate when such amounts may be paid.
Risk Retention Rules
The Dodd-Frank Act requires sponsors of asset-backed securities, including CLOs, to retain at least 5% of the credit risk related to the assets that underlie asset-backed securities (referred to herein as the U.S. Risk Retention Rules). The U.S. Risk Retention Rules became effective on December 24, 2016 and apply to sponsors of CLOs issued thereafter. As a sponsor of CLOs issued in Europe, we currently comply with similar risk retention rules that have been in place since 2014. To comply with the U.S. Risk Retention Rules, we expect that we will contribute approximately $750 million to new CLOs issued over the next five years. Our contribution to the new CLOs will be funded through a variety of sources, including direct funding from the Partnership, funding from senior Carlyle professionals, funding from third party investors, and limited recourse borrowing. The allocation of funding sources, and therefore the amount of capital required from the Partnership, will be determined in the future.
On February 9, 2018, the U.S. Court of Appeals for the District of Columbia ruled that the U.S. Risk Retention Rules do not apply to managers of open-market CLOs - CLOs for which the underlying assets are not transferred by the manager to the CLO issuer via a sale. The agencies have 45 days from the date of the decision to petition the U.S. Court of Appeals for an
en banc
review, during which time the rule will remain effective. If such petition is not made, or if such petition is made but denied, the U.S. Court of Appeals' ruling will become effective 7 days later with retroactive effect on all existing open-market CLOs. We are in the process of reviewing this decision and its ultimate impact on our business.
For additional information related to the U.S. Risk Retention Rules, see “-Regulatory changes in the United States could adversely affect our business and the possibility of increased regulatory focus could result in additional burdens and expenses on our business” within Item 1A.
Guarantees
See Note 9 to the consolidated financial statements included in this Annual Report on Form 10-K for information related to our material guarantees.
Indemnifications
In many of our service contracts, we agree to indemnify the third-party service provider under certain circumstances. The terms of the indemnities vary from contract to contract, and the amount of indemnification liability, if any, cannot be determined and has not been included in the estimate above or recorded in our consolidated financial statements as of
December 31, 2017
.
174
Tax Receivable Agreement
Holders of partnership units in Carlyle Holdings (other than The Carlyle Group L.P.’s wholly owned subsidiaries), subject to the vesting and minimum retained ownership requirements and transfer restrictions applicable to such holders as set forth in the partnership agreements of the Carlyle Holdings partnerships, may (subject to the terms of the exchange agreement) exchange their Carlyle Holdings partnership units for The Carlyle Group L.P. common units on a one-for-one basis. A Carlyle Holdings limited partner must exchange one partnership unit in each of the three Carlyle Holdings partnerships to effect an exchange for a common unit. The exchanges are expected to result in increases in the tax basis of the tangible and intangible assets of Carlyle Holdings. These increases in tax basis may increase (for tax purposes) depreciation and amortization deductions and therefore reduce the amount of tax that Carlyle Holdings I GP Inc. and any other corporate taxpayers would otherwise be required to pay in the future, although the IRS may challenge all or part of that tax basis increase, and a court could sustain such a challenge.
We have entered into a tax receivable agreement with the limited partners of the Carlyle Holdings partnerships that will provide for the payment by the corporate taxpayers to such parties of 85% of the amount of cash savings, if any, in U.S. federal, state and local income tax or franchise tax that the corporate taxpayers realize as a result of these increases in tax basis and of certain other tax benefits related to entering into the tax receivable agreement, including tax benefits attributable to payments under the tax receivable agreement. This payment obligation is an obligation of the corporate taxpayers and not of Carlyle Holdings. While the actual increase in tax basis, as well as the amount and timing of any payments under this agreement, will vary depending upon a number of factors, including the timing of exchanges, the price of our common units at the time of the exchange, the extent to which such exchanges are taxable and the amount and timing of our income, we expect that as a result of the size of the transfers and increases in the tax basis of the tangible and intangible assets of Carlyle Holdings, the payments that we may make under the tax receivable agreement will be substantial.
See Note 2 to the consolidated financial statements included in this Annual Report on Form 10-K for additional information related to our tax receivable agreement.
Contingent Obligations (Giveback)
Carried interest is ultimately realized when: (1) an underlying investment is profitably disposed of, (2) certain costs borne by the limited partner investors have been reimbursed, (3) the fund's cumulative returns are in excess of the preferred return and (4) we have decided to collect carry rather than return additional capital to limited partner investors. Realized carried interest may be required to be returned by us in future periods if the funds' investment values decline below certain levels. When the fair value of a fund's investments remains constant or falls below certain return hurdles, previously recognized performance fees are reversed.
See Note 9 to the consolidated financial statements included in this Annual Report on Form 10-K for additional information related to our contingent obligations (giveback).
Other Contingencies
In the ordinary course of business, we are a party to litigation, investigations, inquiries, employment-related matters, disputes and other potential claims. We discuss certain of these matters in Note 9 to the consolidated financial statements included in this Annual Report on Form 10-K.
Carlyle Common Units and Carlyle Holdings Partnership Units
Rollforwards of the outstanding Carlyle Group L.P. common units and Carlyle Holdings partnership units for the years ended
December 31, 2017 and 2016
are as follows:
|
|
Units as of
December 31, 2016 |
|
Units Issued - DRUs
|
|
Units
Forfeited |
|
Units
Exchanged |
|
Units
Repurchased / Retired |
|
Units as of
December 31, 2017 |
||||||
|
The Carlyle Group L.P. common units
|
84,610,951
|
|
|
8,907,265
|
|
|
—
|
|
|
6,596,624
|
|
|
(14,190
|
)
|
|
100,100,650
|
|
|
Carlyle Holdings partnership units
|
241,847,796
|
|
|
—
|
|
|
(437,314
|
)
|
|
(6,596,624
|
)
|
|
—
|
|
|
234,813,858
|
|
|
Total
|
326,458,747
|
|
|
8,907,265
|
|
|
(437,314
|
)
|
|
—
|
|
|
(14,190
|
)
|
|
334,914,508
|
|
175
|
Units as of
December 31,
2015
|
Units Issued - DRUs
|
Units Forfeited
|
Units Exchanged
|
Units Repurchased / Retired
|
Units as of
December 31,
2016
|
||||||||||||
|
The Carlyle Group L.P. common units
|
80,408,702
|
|
6,860,931
|
|
—
|
|
923,017
|
|
(3,581,699
|
)
|
84,610,951
|
|
|||||
|
Carlyle Holdings partnership units
|
243,619,604
|
|
—
|
|
(748,791
|
)
|
(923,017
|
)
|
(100,000
|
)
|
241,847,796
|
|
|||||
|
Total
|
324,028,306
|
|
6,860,931
|
|
(748,791
|
)
|
—
|
|
(3,681,699
|
)
|
326,458,747
|
|
|||||
The Carlyle Group L.P. common units issued during the period from December 31, 2016 through
December 31, 2017
relate to the vesting of the Partnership’s deferred restricted common units during the year ended
December 31, 2017
. Further, The Carlyle Group L.P. common units in the table above includes 7,782 common units that the Partnership is expected to acquire from Carlyle Holdings in future periods upon the vesting of certain of the Partnership’s unvested common units associated with the acquisition of the remaining 40% equity interest in AlpInvest in August 2013.
The Carlyle Holdings partnership units forfeited during the period from December 31, 2016 through
December 31, 2017
primarily relate to unvested Carlyle Holdings partnership units that were forfeited when the holder ceased to provide services to the Partnership.
The Carlyle Holdings partnership units exchanged relate to the exchange of Carlyle Holdings partnership units held by NGP and certain limited partners for common units on a one-for-one basis. Beginning with the second quarter of 2017, senior Carlyle professionals can exchange their Carlyle Holdings partnership units for common units on a quarterly basis, subject to the terms of the Exchange Agreement. We intend to facilitate an orderly exchange process to seek to minimize the impact on the trading price of our common units. During 2017, senior Carlyle professionals exchanged approximately 6.4 million of their Carlyle Holdings partnership units for common units.
The Carlyle Group L.P. common units repurchased during the period from December 31, 2016 through
December 31, 2017
relate to units repurchased and subsequently retired as part of our unit repurchase program that was initiated in February 2016.
The total units as of December 31, 2017 as shown above exclude approximately 0.4 million common units in connection with the vesting of deferred restricted common units subsequent to
December 31, 2017
that will participate in the unitholder distribution that will be paid in February 2018.
The Carlyle Group L.P. common units issued during the period from December 31, 2015 through December 31, 2016 relate to the vesting of the Partnership’s deferred restricted common units during the year ended December 31, 2016. Further, The Carlyle Group L.P. common units in the table above includes 38,911 common units that the Partnership is expected to acquire from Carlyle Holdings in future periods upon the vesting of certain of the Partnership’s unvested common units associated with the acquisition of the remaining 40% equity interest in AlpInvest in August 2013.
The Carlyle Holdings partnership units forfeited during the period from December 31, 2015 through December 31, 2016 primarily relate to unvested Carlyle Holdings partnership units that were forfeited when the holder ceased to provide services to the Partnership.
The Carlyle Holdings partnership units exchanged relate to the exchange of Carlyle Holdings partnership units held by NGP and certain limited partners for common units on a one-for-one basis.
The Carlyle Group L.P. common units and Carlyle Holdings partnership units repurchased during the period from December 31, 2015 through December 31, 2016 relate to units repurchased and subsequently retired as part of our unit repurchase program that was initiated in February 2016.
The total units as of December 31, 2016 as shown above exclude approximately 1.1 million common units in connection with the vesting of deferred restricted common units subsequent to December 31, 2016 that participated in the unitholder distribution that was paid in March 2017 and include 11,490 common units repurchased that were pending settlement as of December 31, 2016.
Critical Accounting Policies
Principles of Consolidation.
The Partnership consolidates all entities that it controls either through a majority voting interest or as the primary beneficiary of variable interest entities (“VIEs”). The Partnership describes the policies and procedures it uses in evaluating whether an entity is consolidated in Note 2 to the consolidated financial statements included in
176
this Annual Report on Form 10-K. As part of its consolidation procedures, the Partnership evaluates: (1) whether it holds a variable interest in an entity, (2) whether the entity is a VIE, and (3) whether the Partnership's involvement would make it the primary beneficiary.
|
•
|
In evaluating whether the Partnership holds a variable interest, fees (including management fees and performance fees) that are customary and commensurate with the level of services provided, and where the Partnership does not hold other economic interests in the entity that would absorb more than an insignificant amount of the expected losses or returns of the entity, are not considered variable interests. The Partnership considers all economic interests, including indirect interests, to determine if a fee is considered a variable interest.
|
|
•
|
For those entities where the Partnership holds a variable interest, the Partnership determines whether each of these entities qualifies as a VIE and, if so, whether or not the Partnership is the primary beneficiary. The assessment of whether the entity is a VIE is generally performed qualitatively, which requires judgment. These judgments include: (a) determining whether the equity investment at risk is sufficient to permit the entity to finance its activities without additional subordinated financial support, (b) evaluating whether the equity holders, as a group, can make decisions that have a significant effect on the economic performance of the entity, (c) determining whether two or more parties' equity interests should be aggregated, and (d) determining whether the equity investors have proportionate voting rights to their obligations to absorb losses or rights to receive returns from an entity.
|
|
•
|
For entities that are determined to be VIEs, the Partnership consolidates those entities where it has concluded it is the primary beneficiary. The primary beneficiary is defined as the variable interest holder with (a) the power to direct the activities of a VIE that most significantly impact the entity’s economic performance and (b) the obligation to absorb losses of the entity or the right to receive benefits from the entity that could potentially be significant to the VIE. In evaluating whether the Partnership is the primary beneficiary, the Partnership evaluates its economic interests in the entity held either directly or indirectly by the Partnership.
|
Changes to these judgments could result in a change in the consolidation conclusion for a legal entity.
Entities that do not qualify as VIEs are generally assessed for consolidation as voting interest entities. Under the voting interest entity model, the Partnership consolidates those entities it controls through a majority voting interest.
Performance Fees.
Performance fees consist principally of the allocation of profits from certain of the funds to which the Partnership is entitled (commonly known as carried interest). The Partnership is generally entitled to a 20% allocation (which can vary by fund) of the net realized income or gain as a carried interest after returning the invested capital, the allocation of preferred returns and return of certain fund costs (generally subject to catch-up provisions as set forth in the fund limited partnership agreement). Carried interest is ultimately realized when: (i) an underlying investment is profitably disposed of, (ii) certain costs borne by the limited partner investors have been reimbursed, (iii) the fund’s cumulative returns are in excess of the preferred return and (iv) the Partnership has decided to collect carry rather than return additional capital to limited partner investors.
While carried interest is recognized upon appreciation of the funds’ investment values above certain return hurdles set forth in each respective partnership agreement, the Partnership recognizes revenues attributable to performance fees based upon the amount that would be due pursuant to the fund partnership agreement at each period end as if the funds were terminated at that date. Accordingly, the amount recognized as performance fees reflects the Partnership’s share of the gains and losses of the associated funds’ underlying investments measured at their then-current fair values relative to the fair values as of the end of the prior period. Because of the inherent uncertainty, these estimated values may differ significantly from the values that would have been used had a ready market for the investments existed, and it is reasonably possible that the difference could be material. If, at
December 31, 2017
, all of the investments held by the Partnership's funds were deemed worthless, a possibility that management views as remote, the amount of realized and distributed carried interest subject to potential giveback would be
$0.7 billion
, on an after-tax basis where applicable.
See Note 2 to the consolidated financial statements included in this Annual Report on Form 10-K for information related to performance fee allocations for various fund types, preferred return hurdle rates, the timing of performance fee revenue recognition, and the potential for performance fee revenue reversal.
Performance Fee Related Compensation.
A portion of the performance fees earned is due to employees and advisors of the Partnership. These amounts are accounted for as compensation expense in conjunction with the recognition of the related
177
performance fee revenue and, until paid, are recognized as a component of the accrued compensation and benefits liability. Accordingly, upon a reversal of performance fee revenue, the related compensation expense, if any, is also reversed.
Income Taxes.
Certain of the wholly-owned subsidiaries of the Partnership and the Carlyle Holdings partnerships are subject to federal, state, local and foreign corporate income taxes at the entity level and the related tax provision attributable to the Partnership’s share of this income is reflected in the consolidated financial statements. Based on applicable federal, foreign, state and local tax laws, the Partnership records a provision for income taxes for certain entities. Tax positions taken by the Partnership are subject to periodic audit by U.S. federal, state, local and foreign taxing authorities.
The Partnership accounts for income taxes using the asset and liability method, which requires the recognition of deferred tax assets and liabilities for the expected future consequences of events that have been included in the financial statements or tax returns. Under this method, deferred tax assets and liabilities are determined based on the difference between the financial statement reporting and the tax basis of assets and liabilities using enacted tax rates in effect for the period in which the difference is expected to reverse. The effect of a change in tax rates on deferred tax assets and liabilities is recognized in the period of the change in the provision for income taxes. Further, deferred tax assets are recognized for the expected realization of available net operating loss and tax credit carry forwards. A valuation allowance is recorded on the Partnership’s gross deferred tax assets when it is more likely than not that such asset will not be realized. When evaluating the realizability of the Partnership’s deferred tax assets, all evidence, both positive and negative, is evaluated. Items considered in this analysis include the ability to carry back losses, the reversal of temporary differences, tax planning strategies, and expectations of future earnings.
The Partnership has approximately
$170 million
of deferred tax assets as of
December 31, 2017
. Changes in judgment as it relates to the realizability of these assets, as well as potential changes in corporate tax rates would have the effect of significantly reducing the value of the deferred tax assets. On December 22, 2017, the Tax Cuts and Jobs Act was enacted. The Act includes numerous changes in existing tax law, including a permanent reduction in the federal corporate income tax rate from
35%
to
21%
. The rate reduction takes effect on January 1, 2018. As a result of the reduction of the federal corporate income tax rate, the Partnership revalued its deferred tax assets and liabilities as of December 31, 2017 using the newly enacted rate. The revaluation resulted in the recognition of additional provision for income taxes of approximately
$113.0 million
. In addition, the Partnership's tax receivable agreement liability was reduced by approximately
$71.5 million
due to the reduction in the federal corporate income tax rate.
Under U.S. GAAP for income taxes, the amount of tax benefit to be recognized is the amount of benefit that is more likely than not to be sustained upon examination. The Partnership analyzes its tax filing positions in all of the U.S. federal, state, local and foreign tax jurisdictions where it is required to file income tax returns, as well as for all open tax years in these jurisdictions. If, based on this analysis, the Partnership determines that uncertainties in tax positions exist, a liability is established, which is included in accounts payable, accrued expenses and other liabilities in the consolidated financial statements. The Partnership recognizes accrued interest and penalties related to unrecognized tax positions in the provision for income taxes. If recognized, the entire amount of unrecognized tax positions would be recorded as a reduction in the provision for income taxes.
Fair Value Measurement.
U.S. GAAP establishes a hierarchal disclosure framework which ranks the observability of market price inputs used in measuring financial instruments at fair value. The observability of inputs is impacted by a number of factors, including the type of financial instrument, the characteristics specific to the financial instrument and the state of the marketplace, including the existence and transparency of transactions between market participants. Financial instruments with readily available quoted prices, or for which fair value can be measured from quoted prices in active markets, will generally have a higher degree of market price observability and a lesser degree of judgment applied in determining fair value.
Financial instruments measured and reported at fair value are classified and disclosed based on the observability of inputs used in the determination of fair values, as follows:
Level I
— inputs to the valuation methodology are quoted prices available in active markets for identical instruments as of the reporting date. The type of financial instruments included in Level I include unrestricted securities, including equities and derivatives, listed in active markets. The Partnership does not adjust the quoted price for these instruments, even in situations where the Partnership holds a large position and a sale could reasonably impact the quoted price.
Level II
— inputs to the valuation methodology are other than quoted prices in active markets, which are either directly or indirectly observable as of the reporting date. The type of financial instruments in this category includes less liquid and restricted securities listed in active markets, securities traded in other than
178
active markets, government and agency securities, and certain over-the-counter derivatives where the fair value is based on observable inputs.
Level III
— inputs to the valuation methodology are unobservable and significant to overall fair value measurement. The inputs into the determination of fair value require significant management judgment or estimation. Financial instruments that are included in this category include investments in privately-held entities, non-investment grade residual interests in securitizations, collateralized loan obligations, and certain over-the-counter derivatives where the fair value is based on unobservable inputs.
In certain cases, the inputs used to measure fair value may fall into different levels of the fair value hierarchy. In such cases, the determination of which category within the fair value hierarchy is appropriate for any given financial instrument is based on the lowest level of input that is significant to the fair value measurement. The Partnership’s assessment of the significance of a particular input to the fair value measurement in its entirety requires judgment and considers factors specific to the financial instrument.
In the absence of observable market prices, the Partnership values its investments using valuation methodologies applied on a consistent basis. For some investments little market activity may exist. Management's determination of fair value is then based on the best information available in the circumstances and may incorporate management's own assumptions and involves a significant degree of judgment, taking into consideration a combination of internal and external factors, including the appropriate risk adjustments for non-performance and liquidity risks. Investments for which market prices are not observable include private investments in the equity of operating companies and real estate properties, and certain debt positions. The valuation technique for each of these investments is described in Note 4 to the consolidated financial statements included in this Annual Report on Form 10-K.
The valuation methodologies can involve subjective judgments, and the fair value of assets established pursuant to such methodologies may be incorrect, which could result in the misstatement of fund performance and accrued performance fees. Because there is significant uncertainty in the valuation of, or in the stability of the value of, illiquid investments, the fair values of such investments as reflected in an investment fund’s net asset value do not necessarily reflect the prices that would be obtained by us on behalf of the investment fund when such investments are realized. Realizations at values significantly lower than the values at which investments have been reflected in prior fund net asset values would result in reduced earnings or losses for the applicable fund, the loss of potential carried interest and incentive fees and in the case of our hedge funds, management fees. Changes in values attributed to investments from quarter to quarter may result in volatility in the net asset values and results of operations that we report from period to period. Also, a situation where asset values turn out to be materially different than values reflected in prior fund net asset values could cause investors to lose confidence in us, which could in turn result in difficulty in raising additional funds. See “Risk Factors — Risks Related to Our Company — Valuation methodologies for certain assets in our funds can involve subjective judgments, and the fair value of assets established pursuant to such methodologies may be incorrect, which could result in the misstatement of fund performance and accrued performance fees.”
Equity-Method Investments.
The Partnership accounts for all investments in which it has or is otherwise presumed to have significant influence, including investments in the unconsolidated funds and strategic investments, using the equity method of accounting. The carrying value of equity-method investments is determined based on amounts invested by the Partnership, adjusted for the equity in earnings or losses of the investee allocated based on the respective partnership agreement, less distributions received. The Partnership evaluates its equity-method investments for impairment whenever events or changes in circumstances indicate that the carrying amounts of such investments may not be recoverable.
Equity-based Compensation.
Compensation expense relating to the issuance of equity-based awards to Carlyle employees is measured at fair value on the grant date. The compensation expense for awards that vest over a future service period is recognized over the relevant service period on a straight-line basis, adjusted for estimated forfeitures of awards that are not expected to vest. The compensation expense for awards that do not require future service is recognized immediately. Upon the end of the service period, compensation expense is adjusted to account for the actual forfeiture rate. Cash settled equity-based awards are classified as liabilities and are re-measured at the end of each reporting period. The compensation expense for awards that contain performance conditions is recognized when it is probable that the performance conditions will be achieved; in certain instances, such compensation expense may be recognized prior to the grant date of the award.
Equity-based awards issued to non-employees are recognized as general, administrative and other expenses. The grant-date fair value of equity-based awards granted to Carlyle’s non-employee directors is expensed on a straight-line basis over the vesting period. The cost of services received in exchange for an equity-based award issued to non-employees who are not directors is measured at each vesting date, and is not measured based on the grant-date fair value of the award unless the
179
award is vested at the grant date. Equity-based awards that require the satisfaction of future service criteria are recognized over the relevant service period, adjusted for estimated forfeitures of awards that are not expected to vest, based on the fair value of the award on each reporting date and adjusted for the actual fair value of the award at each vesting date. Accordingly, the measured value of the award will not be finalized until the vesting date.
In determining the aggregate fair value of any award grants, we make judgments, among others, as to the grant-date fair value and, until January 1, 2017, estimated forfeiture rates. Each of these elements, particularly the forfeiture assumptions used in valuing our equity awards, are subject to significant judgment and variability and the impact of changes in such elements on equity-based compensation expense could be material. The Partnership adopted ASU 2016-9,
Compensation - Stock Compensation (Topic 718): Improvements to Employee Share-Based Payment Accounting
on January 1, 2017. Upon adoption, the Partnership elected to recognize equity-based award forfeitures in the period they occur as a reversal of previously recognized compensation expense. The reduction is compensation expense is determined based on the specific awards forfeited during that period.
Intangible Assets and Goodwill.
The Partnership’s intangible assets consist of acquired contractual rights to earn future fee income, including management and advisory fees, customer relationships, and acquired trademarks. Finite-lived intangible assets are amortized over their estimated useful lives, which range from five to ten years, and are reviewed for impairment whenever events or changes in circumstances indicate that the carrying amount of the asset may not be recoverable. The Partnership’s intangible assets include acquired contractual rights for fee income related to open-ended funds. Open-ended funds are subject to redemptions on a quarterly or more frequent basis and investors can generally decide to exit their fund investments at any time. The resulting inherent volatility in fee income derived from these contractual rights increases the degree of judgment and estimates used by management in evaluating such intangible assets for impairment. Actual results could differ from management’s estimates and assumptions and such differences could result in a material impairment.
Goodwill represents the excess of cost over the identifiable net assets of businesses acquired and is recorded in the functional currency of the acquired entity. Goodwill is recognized as an asset and is reviewed for impairment annually as of October 1 and between annual tests when events and circumstances indicate that impairment may have occurred.
Recent Accounting Pronouncements
We discuss the recent accounting pronouncements in Note 2 to the consolidated financial statements included in this Annual Report on Form 10-K.
Our primary exposure to market risk is related to our role as general partner or investment advisor to our investment funds and the sensitivities to movements in the fair value of their investments, including the effect on management fees, performance fees and investment income.
Although our investment funds share many common themes, each of our alternative asset management asset classes runs its own investment and risk management processes, subject to our overall risk tolerance and philosophy. The investment process of our investment funds involves a comprehensive due diligence approach, including review of reputation of shareholders and management, company size and sensitivity of cash flow generation, business sector and competitive risks, portfolio fit, exit risks and other key factors highlighted by the deal team. Key investment decisions are subject to approval by both the fund-level managing directors, as well as the investment committee, which is generally comprised of one or more of the three founding partners, one “sector” head, one or more advisors and senior investment professionals associated with that particular fund. Once an investment in a portfolio company has been made, our fund teams closely monitor the performance of the portfolio company, generally through frequent contact with management and the receipt of financial and management reports.
Effect on Fund Management Fees
Management fees will only be directly affected by short-term changes in market conditions to the extent they are based on NAV or represent permanent impairments of value. These management fees will be increased (or reduced) in direct proportion to the effect of changes in the market value of our investments in the related funds. In addition, the terms of the governing agreements with respect to certain of our carry funds provide that the management fee base will be reduced when the aggregate fair market value of a fund’s investments is below its cost. The proportion of our management fees that are based on NAV, primarily hedge funds, is dependent on the number and types of investment funds in existence and the current stage of
180
each fund’s life cycle. In 2016, we conducted a review of our Global Credit segment in order to realign and reorganize certain of the segment's operations. As a result, we have exited our hedge fund business (ESG in 2016 and Claren Road in January 2017) and, as a result of settlements reached during 2017 with investors in two commodities investment vehicles managed by Vermillion, we have completed the exit of the commodities investment advisory business and other hedge fund investment advisory businesses that we had acquired from 2010 to 2014. Therefore, for the year ended
December 31, 2017
, an immaterial amount of our fund management fees were based on the NAV of the applicable funds.
Effect on Performance Fees
Performance fees reflect revenue primarily from carried interest on our carry funds and incentive fees from our hedge funds. In our discussion of “Key Financial Measures” and “Critical Accounting Policies”, we disclose that performance fees are recognized upon appreciation of the valuation of our funds’ investments above certain return hurdles and are based upon the amount that would be due to Carlyle at each reporting date as if the funds were liquidated at their then-current fair values. Changes in the fair value of the funds’ investments may materially impact performance fees depending upon the respective funds’ performance to date as compared to its hurdle rate and the related carry waterfall.
The following table summarizes the incremental impact, including our Consolidated Funds, of a 10% change in total remaining fair value by segment as of
December 31, 2017
on our performance fee revenue:
|
10% Increase
in Total
Remaining
Fair Value
|
10% Decrease
in Total
Remaining
Fair Value
|
||||||
|
|
(Dollars in Millions)
|
||||||
|
Corporate Private Equity
|
$
|
734.7
|
|
$
|
(602.8
|
)
|
|
|
Real Assets
|
265.1
|
|
(387.4
|
)
|
|||
|
Global Credit
|
22.1
|
|
(17.4
|
)
|
|||
|
Investment Solutions
|
131.4
|
|
(91.3
|
)
|
|||
|
Total
|
$
|
1,153.3
|
|
$
|
(1,098.9
|
)
|
|
The following table summarizes the incremental impact of a 10% change in Level III remaining fair value by segment as of
December 31, 2017
on our performance fee revenue:
|
10% Increase
in Level III
Remaining
Fair Value
|
10% Decrease
in Level III
Remaining
Fair Value
|
||||||
|
|
(Dollars in Millions)
|
||||||
|
Corporate Private Equity
|
$
|
723.0
|
|
$
|
(591.4
|
)
|
|
|
Real Assets
|
212.5
|
|
(351.5
|
)
|
|||
|
Global Credit
|
17.9
|
|
(17.0
|
)
|
|||
|
Investment Solutions
|
107.0
|
|
(88.4
|
)
|
|||
|
Total
|
$
|
1,060.4
|
|
$
|
(1,048.3
|
)
|
|
The effect of the variability in performance fee revenue would be in part offset by performance fee related compensation. See also related disclosure in “Segment Analysis.”
181
Effect on Assets Under Management
Generally, our Fee-earning assets under management are not affected by changes in valuation. However, total assets under management is impacted by valuation changes to net asset value. The table below shows the remaining fair value and the percentage amount classified as Level III investments as defined within the fair value standards of GAAP:
|
Remaining Fair Value
|
Percentage Amount
Classified as Level
III Investments
|
|||||
|
|
(Dollars in Millions)
|
|||||
|
Corporate Private Equity
|
$
|
42,637
|
|
93
|
%
|
|
|
Real Assets
|
$
|
26,376
|
|
86
|
%
|
|
|
Global Credit (1)
|
$
|
26,365
|
|
98
|
%
|
|
|
Investment Solutions
|
$
|
30,157
|
|
97
|
%
|
|
|
(1)
|
Comprised of approximately $
20.2 billion
(
100%
Level III Investments) in our structured credit/other structured products funds, $
3.9 billion
(
87%
Level III Investments) in our carry funds, and $
2.3 billion
(
95%
Level III Investments) in our business development companies.
|
Exchange Rate Risk
Our investment funds hold investments that are denominated in non-U.S. dollar currencies that may be affected by movements in the rate of exchange between the U.S. dollar and non-U.S. dollar currencies. Non-U.S. dollar denominated assets and liabilities are translated at year-end rates of exchange, and the consolidated statements of operations accounts are translated at rates of exchange in effect throughout the year. Additionally, a portion of our management fees are denominated in non-U.S. dollar currencies. We estimate that as of
December 31, 2017
, if the U.S. dollar strengthened 10% against all foreign currencies, the impact on our consolidated results of operations for the year then ended would be as follows: (a) fund management fees would decrease by $84.2 million, (b) performance fees would decrease by $48.4 million and (c) investment income would increase by $6.7 million.
Interest Rate Risk
We have obligations under our term loan facility, CLO term loans, and promissory notes that accrue interest at variable rates. Interest rate changes may therefore affect the amount of interest payments, future earnings and cash flows.
The term loan under our senior credit facility incurs interest at LIBOR plus an applicate rate. The CLO term loans incur interest at EURIBOR or LIBOR plus an applicable rate. The promissory notes incur interest at the three month LIBOR plus an applicable rate. We do not have any interest rate swaps in place for these borrowings.
Based on our debt obligations payable as of December 31, 2017, we estimate that interest expense relating to variable rates would increase by approximately $1.7 million on an annual basis in the event interest rates were to increase by one percentage point.
Credit Risk
Certain of our investment funds hold derivative instruments that contain an element of risk in the event that the counterparties are unable to meet the terms of such agreements. We minimize our risk exposure by limiting the counterparties with which we enter into contracts to banks and investment banks who meet established credit and capital guidelines. We do not expect any counterparty to default on its obligations and therefore do not expect to incur any loss due to counterparty default.
182
Report of Independent Registered Public Accounting Firm
To The Board of Directors and Unitholders of The Carlyle Group L.P.
Opinion on the Financial Statements
We have audited the accompanying consolidated balance sheets of The Carlyle Group L.P. (the “Partnership”) as of December 31, 2017 and 2016, and the related consolidated statements of operations, comprehensive income, changes in partners’ capital and redeemable non-controlling interests in consolidated entities, and cash flows for each of the three years in the period ended December 31, 2017, and the related notes (collectively referred to as the “financial statements”). In our opinion, the financial statements present fairly, in all material respects, the consolidated financial position of the Partnership at December 31, 2017 and 2016, and the consolidated results of its operations and its cash flows for each of the three years in the period ended December 31, 2017, in conformity with U.S. generally accepted accounting principles.
We also have audited, in accordance with the standards of the Public Company Accounting Oversight Board (United States) (PCAOB), the Partnership’s internal control over financial reporting as of December 31, 2017, based on criteria established in Internal Control-Integrated Framework issued by the Committee of Sponsoring Organizations of the Treadway Commission (2013 framework) and our report dated February 15, 2018 expressed an unqualified opinion thereon.
Adoption of ASU No. 2015-02
As discussed in Note 2 to the consolidated financial statements, the Partnership changed its evaluation of whether to consolidate certain types of legal entities in 2016 due to the adoption of ASU No. 2015-02,
Consolidation (Topic 810): Amendments to the Consolidation Analysis
.
Basis for Opinion
These financial statements are the responsibility of the Partnership's management. Our responsibility is to express an opinion on the Partnership's financial statements based on our audits. We are a public accounting firm registered with the PCAOB and are required to be independent with respect to the Partnership in accordance with the U.S. federal securities laws and the applicable rules and regulations of the Securities and Exchange Commission and the PCAOB.
We conducted our audits in accordance with the standards of the PCAOB. Those standards require that we plan and perform the audit to obtain reasonable assurance about whether the financial statements are free of material misstatement, whether due to error or fraud. Our audits included performing procedures to assess the risks of material misstatement of the financial statements, whether due to error or fraud, and performing procedures that respond to those risks. Such procedures included examining, on a test basis, evidence regarding the amounts and disclosures in the financial statements. Our audits also included evaluating the accounting principles used and significant estimates made by management, as well as evaluating the overall presentation of the financial statements. We believe that our audits provide a reasonable basis for our opinion.
/s/ Ernst & Young LLP
We have served as the Partnership's auditor since 2002.
Tysons, VA
February 15, 2018
183
Report of Independent Registered Public Accounting Firm
To The Board of Directors and Unitholders of The Carlyle Group L.P.
Opinion on Internal Control over Financial Reporting
We have audited The Carlyle Group L.P.’s internal control over financial reporting as of December 31, 2017, based on criteria established in Internal Control—Integrated Framework issued by the Committee of Sponsoring Organizations of the Treadway Commission (2013 framework) (the COSO criteria). In our opinion, The Carlyle Group L.P. (the “Partnership”) maintained, in all material respects, effective internal control over financial reporting as of December 31, 2017, based on the COSO criteria.
We also have audited, in accordance with the standards of the Public Company Accounting Oversight Board (United States) (PCAOB), the consolidated balance sheets of The Carlyle Group L.P. as of December 31, 2017 and 2016, the related consolidated statements of operations, comprehensive income, changes in partners’ capital and redeemable non-controlling interests in consolidated entities, and cash flows for each of the three years in the period ended December 31, 2017, and the related notes and our report dated February 15, 2018 expressed an unqualified opinion thereon.
Basis for Opinion
The Partnership's management is responsible for maintaining effective internal control over financial reporting and for its assessment of the effectiveness of internal control over financial reporting included in the accompanying Management's Report on Internal Controls Over Financial Reporting. Our responsibility is to express an opinion on the Partnership's internal control over financial reporting based on our audit. We are a public accounting firm registered with the PCAOB and are required to be independent with respect to the Partnership in accordance with the U.S. federal securities laws and the applicable rules and regulations of the Securities and Exchange Commission and the PCAOB.
We conducted our audit in accordance with the standards of the PCAOB. Those standards require that we plan and perform the audit to obtain reasonable assurance about whether effective internal control over financial reporting was maintained in all material respects.
Our audit included obtaining an understanding of internal control over financial reporting, assessing the risk that a material weakness exists, testing and evaluating the design and operating effectiveness of internal control based on the assessed risk, and performing such other procedures as we considered necessary in the circumstances. We believe that our audit provides a reasonable basis for our opinion.
Definition and Limitations of Internal Control Over Financial Reporting
A company’s internal control over financial reporting is a process designed to provide reasonable assurance regarding the reliability of financial reporting and the preparation of financial statements for external purposes in accordance with generally accepted accounting principles. A company’s internal control over financial reporting includes those policies and procedures that (1) pertain to the maintenance of records that, in reasonable detail, accurately and fairly reflect the transactions and dispositions of the assets of the company; (2) provide reasonable assurance that transactions are recorded as necessary to permit preparation of financial statements in accordance with generally accepted accounting principles, and that receipts and expenditures of the company are being made only in accordance with authorizations of management and directors of the company; and (3) provide reasonable assurance regarding prevention or timely detection of unauthorized acquisition, use, or disposition of the company’s assets that could have a material effect on the financial statements.
Because of its inherent limitations, internal control over financial reporting may not prevent or detect misstatements. Also, projections of any evaluation of effectiveness to future periods are subject to the risk that controls may become inadequate because of changes in conditions, or that the degree of compliance with the policies or procedures may deteriorate.
/s/ Ernst & Young LLP
Tysons, VA
February 15, 2018
184
The Carlyle Group L.P.
Notes to the Consolidated Financial Statements
Consolidated Balance Sheets
(Dollars in millions)
|
|
December 31,
|
||||||
|
|
2017
|
2016
|
|||||
|
Assets
|
|||||||
|
Cash and cash equivalents
|
$
|
1,000.1
|
|
$
|
670.9
|
|
|
|
Cash and cash equivalents held at Consolidated Funds
|
377.6
|
|
761.5
|
|
|||
|
Restricted cash
|
28.7
|
|
13.1
|
|
|||
|
Corporate treasury investments
|
376.3
|
|
190.2
|
|
|||
|
Accrued performance fees
|
3,670.6
|
|
2,481.1
|
|
|||
|
Investments
|
1,624.3
|
|
1,107.0
|
|
|||
|
Investments of Consolidated Funds
|
4,534.3
|
|
3,893.7
|
|
|||
|
Due from affiliates and other receivables, net
|
257.1
|
|
227.2
|
|
|||
|
Due from affiliates and other receivables of Consolidated Funds, net
|
50.8
|
|
29.5
|
|
|||
|
Receivables and inventory of a real estate VIE
|
—
|
|
145.4
|
|
|||
|
Fixed assets, net
|
100.4
|
|
106.1
|
|
|||
|
Deposits and other
|
54.1
|
|
39.4
|
|
|||
|
Other assets of a real estate VIE
|
—
|
|
31.5
|
|
|||
|
Intangible assets, net
|
35.9
|
|
42.0
|
|
|||
|
Deferred tax assets
|
170.4
|
|
234.4
|
|
|||
|
Total assets
|
$
|
12,280.6
|
|
$
|
9,973.0
|
|
|
|
Liabilities and partners’ capital
|
|||||||
|
Debt obligations
|
$
|
1,573.6
|
|
$
|
1,265.2
|
|
|
|
Loans payable of Consolidated Funds
|
4,303.8
|
|
3,866.3
|
|
|||
|
Loans payable of a real estate VIE at fair value (principal amount of $144.4 million as of December 31, 2016)
|
—
|
|
79.4
|
|
|||
|
Accounts payable, accrued expenses and other liabilities
|
355.1
|
|
369.8
|
|
|||
|
Accrued compensation and benefits
|
2,222.6
|
|
1,661.8
|
|
|||
|
Due to affiliates
|
229.9
|
|
223.6
|
|
|||
|
Deferred revenue
|
82.1
|
|
54.0
|
|
|||
|
Deferred tax liabilities
|
75.6
|
|
76.6
|
|
|||
|
Other liabilities of Consolidated Funds
|
422.1
|
|
637.0
|
|
|||
|
Other liabilities of a real estate VIE
|
—
|
|
124.5
|
|
|||
|
Accrued giveback obligations
|
66.8
|
|
160.8
|
|
|||
|
Total liabilities
|
9,331.6
|
|
8,519.0
|
|
|||
|
Commitments and contingencies
|
|
|
|||||
|
Series A preferred units (16,000,000 units issued and outstanding as of December 31, 2017)
|
387.5
|
|
—
|
|
|||
|
Partners’ capital (common units, 100,100,650 and 84,610,951 issued and outstanding as of December 31, 2017 and 2016, respectively)
|
701.8
|
|
403.1
|
|
|||
|
Accumulated other comprehensive loss
|
(72.7
|
)
|
(95.2
|
)
|
|||
|
Non-controlling interests in consolidated entities
|
404.7
|
|
277.8
|
|
|||
|
Non-controlling interests in Carlyle Holdings
|
1,527.7
|
|
868.3
|
|
|||
|
Total partners’ capital
|
2,949.0
|
|
1,454.0
|
|
|||
|
Total liabilities and partners’ capital
|
$
|
12,280.6
|
|
$
|
9,973.0
|
|
|
See accompanying notes.
185
The Carlyle Group L.P.
Notes to the Consolidated Financial Statements
(Dollars in millions, except unit and per unit data)
|
|
Year Ended December 31,
|
||||||||||
|
|
2017
|
2016
|
2015
|
||||||||
|
Revenues
|
|||||||||||
|
Fund management fees
|
$
|
1,026.9
|
|
$
|
1,076.1
|
|
$
|
1,085.2
|
|
||
|
Performance fees
|
|||||||||||
|
Realized
|
1,097.3
|
|
1,129.5
|
|
1,441.9
|
|
|||||
|
Unrealized
|
996.6
|
|
(377.7
|
)
|
(617.0
|
)
|
|||||
|
Total performance fees
|
2,093.9
|
|
751.8
|
|
824.9
|
|
|||||
|
Investment income (loss)
|
|||||||||||
|
Realized
|
70.4
|
|
112.9
|
|
32.9
|
|
|||||
|
Unrealized
|
161.6
|
|
47.6
|
|
(17.7
|
)
|
|||||
|
Total investment income (loss)
|
232.0
|
|
160.5
|
|
15.2
|
|
|||||
|
Interest and other income
|
36.7
|
|
23.9
|
|
18.6
|
|
|||||
|
Interest and other income of Consolidated Funds
|
177.7
|
|
166.9
|
|
975.5
|
|
|||||
|
Revenue of a real estate VIE
|
109.0
|
|
95.1
|
|
86.8
|
|
|||||
|
Total revenues
|
3,676.2
|
|
2,274.3
|
|
3,006.2
|
|
|||||
|
Expenses
|
|||||||||||
|
Compensation and benefits
|
|||||||||||
|
Base compensation
|
652.7
|
|
647.1
|
|
632.2
|
|
|||||
|
Equity-based compensation
|
320.3
|
|
334.6
|
|
378.0
|
|
|||||
|
Performance fee related
|
|||||||||||
|
Realized
|
520.7
|
|
580.5
|
|
650.5
|
|
|||||
|
Unrealized
|
467.6
|
|
(227.4
|
)
|
(139.6
|
)
|
|||||
|
Total compensation and benefits
|
1,961.3
|
|
1,334.8
|
|
1,521.1
|
|
|||||
|
General, administrative and other expenses
|
276.8
|
|
521.1
|
|
712.8
|
|
|||||
|
Interest
|
65.5
|
|
61.3
|
|
58.0
|
|
|||||
|
Interest and other expenses of Consolidated Funds
|
197.6
|
|
128.5
|
|
1,039.3
|
|
|||||
|
Interest and other expenses of a real estate VIE and loss on deconsolidation
|
202.5
|
|
207.6
|
|
144.6
|
|
|||||
|
Other non-operating income
|
(71.4
|
)
|
(11.2
|
)
|
(7.4
|
)
|
|||||
|
Total expenses
|
2,632.3
|
|
2,242.1
|
|
3,468.4
|
|
|||||
|
Other income
|
|||||||||||
|
Net investment gains of Consolidated Funds
|
88.4
|
|
13.1
|
|
864.4
|
|
|||||
|
Income before provision for income taxes
|
1,132.3
|
|
45.3
|
|
402.2
|
|
|||||
|
Provision for income taxes
|
124.9
|
|
30.0
|
|
2.1
|
|
|||||
|
Net income
|
1,007.4
|
|
15.3
|
|
400.1
|
|
|||||
|
Net income attributable to non-controlling interests in consolidated entities
|
72.5
|
|
41.0
|
|
537.9
|
|
|||||
|
Net income (loss) attributable to Carlyle Holdings
|
934.9
|
|
(25.7
|
)
|
(137.8
|
)
|
|||||
|
Net income (loss) attributable to non-controlling interests in Carlyle Holdings
|
690.8
|
|
(32.1
|
)
|
(119.4
|
)
|
|||||
|
Net income (loss) attributable to The Carlyle Group L.P.
|
244.1
|
|
6.4
|
|
(18.4
|
)
|
|||||
|
Net income attributable to Series A Preferred Unitholders
|
6.0
|
|
—
|
|
—
|
|
|||||
|
Net income (loss) attributable to The Carlyle Group L.P. Common Unitholders
|
$
|
238.1
|
|
$
|
6.4
|
|
$
|
(18.4
|
)
|
||
|
Net income (loss) attributable to The Carlyle Group L.P. per common unit (see Note 13)
|
|||||||||||
|
Basic
|
$
|
2.58
|
|
$
|
0.08
|
|
$
|
(0.24
|
)
|
||
|
Diluted
|
$
|
2.38
|
|
$
|
(0.08
|
)
|
$
|
(0.30
|
)
|
||
|
Weighted-average common units
|
|||||||||||
|
Basic
|
92,136,959
|
|
82,714,178
|
|
74,523,935
|
|
|||||
|
Diluted
|
100,082,548
|
|
308,522,990
|
|
298,739,382
|
|
|||||
|
Distributions declared per common unit
|
$
|
1.24
|
|
$
|
1.68
|
|
$
|
3.39
|
|
||
Substantially all revenue is earned from affiliates of the Partnership. See accompanying notes.
186
The Carlyle Group L.P.
Notes to the Consolidated Financial Statements
Consolidated Statements of Comprehensive Income
(Dollars in millions)
|
|
Year Ended December 31,
|
||||||||||
|
|
2017
|
2016
|
2015
|
||||||||
|
Net income
|
$
|
1,007.4
|
|
$
|
15.3
|
|
$
|
400.1
|
|
||
|
Other comprehensive income (loss)
|
|||||||||||
|
Foreign currency translation adjustments
|
95.8
|
|
(54.6
|
)
|
(801.0
|
)
|
|||||
|
Cash flow hedges
|
|||||||||||
|
Reclassification adjustment for loss included in interest expense
|
—
|
|
1.9
|
|
2.3
|
|
|||||
|
Defined benefit plans
|
|||||||||||
|
Unrealized gain (loss) for the period
|
(0.8
|
)
|
(6.8
|
)
|
4.1
|
|
|||||
|
Reclassification adjustment for unrecognized loss during the period, net, included in base compensation expense
|
1.2
|
|
—
|
|
0.3
|
|
|||||
|
Other comprehensive gain (loss)
|
96.2
|
|
(59.5
|
)
|
(794.3
|
)
|
|||||
|
Comprehensive income (loss)
|
1,103.6
|
|
(44.2
|
)
|
(394.2
|
)
|
|||||
|
Comprehensive loss attributable to partners’ capital appropriated for Consolidated Funds
|
—
|
|
—
|
|
63.7
|
|
|||||
|
Comprehensive (income) loss attributable to non-controlling interests in consolidated entities
|
(108.1
|
)
|
10.7
|
|
(143.8
|
)
|
|||||
|
Comprehensive (income) loss attributable to redeemable non-controlling interests in consolidated entities
|
—
|
|
(0.2
|
)
|
185.4
|
|
|||||
|
Comprehensive income (loss) attributable to Carlyle Holdings
|
995.5
|
|
(33.7
|
)
|
(288.9
|
)
|
|||||
|
Comprehensive (income) loss attributable to non-controlling interests in Carlyle Holdings
|
(734.3
|
)
|
39.5
|
|
239.1
|
|
|||||
|
Comprehensive income (loss) attributable to The Carlyle Group L.P.
|
$
|
261.2
|
|
$
|
5.8
|
|
$
|
(49.8
|
)
|
||
See accompanying notes.
187
The Carlyle Group L.P.
Notes to the Consolidated Financial Statements
Consolidated Statements of Changes in Partners’ Capital and Redeemable Non-controlling Interests in Consolidated Entities
(Dollars and units in millions)
|
Common
Units
|
Preferred Equity
|
Partners’
Capital
|
Accumulated
Other
Comprehensive
Income (Loss)
|
Partners’
Capital
Appropriated for
Consolidated
Funds
|
Non-controlling Interests in Consolidated Entities
|
Non-
controlling
Interests in
Carlyle
Holdings
|
Total
Partners’
Capital
|
Redeemable
Non-controlling
Interests in
Consolidated
Entities
|
||||||||||||||||||||||||||
|
Balance at December 31, 2014
|
67.8
|
|
—
|
|
$
|
566.0
|
|
$
|
(39.0
|
)
|
$
|
184.5
|
|
$
|
6,446.4
|
|
$
|
1,936.6
|
|
$
|
9,094.5
|
|
$
|
3,761.5
|
|
|||||||||
|
Reallocation of ownership interests in Carlyle Holdings
|
0.1
|
|
—
|
|
34.5
|
|
(12.6
|
)
|
—
|
|
—
|
|
(21.9
|
)
|
—
|
|
—
|
|
||||||||||||||||
|
Exchange of units in public offering, net of issuance costs
|
7.0
|
|
—
|
|
52.5
|
|
(7.1
|
)
|
—
|
|
—
|
|
(45.4
|
)
|
—
|
|
—
|
|
||||||||||||||||
|
Issuance of common units related to acquisitions
|
0.1
|
|
—
|
|
0.5
|
|
—
|
|
—
|
|
—
|
|
1.8
|
|
2.3
|
|
—
|
|
||||||||||||||||
|
Deferred tax effects resulting from acquisition of interests in Carlyle Holdings
|
—
|
|
—
|
|
5.5
|
|
—
|
|
—
|
|
—
|
|
—
|
|
5.5
|
|
—
|
|
||||||||||||||||
|
Equity-based compensation
|
—
|
|
—
|
|
92.8
|
|
—
|
|
—
|
|
—
|
|
283.2
|
|
376.0
|
|
—
|
|
||||||||||||||||
|
Net delivery of vested common units
|
5.4
|
|
—
|
|
3.5
|
|
—
|
|
—
|
|
—
|
|
0.5
|
|
4.0
|
|
—
|
|
||||||||||||||||
|
Contributions
|
—
|
|
—
|
|
—
|
|
—
|
|
—
|
|
1,090.5
|
|
—
|
|
1,090.5
|
|
1,286.1
|
|
||||||||||||||||
|
Distributions
|
—
|
|
—
|
|
(251.0
|
)
|
—
|
|
—
|
|
(3,230.8
|
)
|
(848.5
|
)
|
(4,330.3
|
)
|
(2,036.2
|
)
|
||||||||||||||||
|
Initial consolidation of a Consolidated Fund
|
—
|
|
—
|
|
—
|
|
—
|
|
—
|
|
43.9
|
|
—
|
|
43.9
|
|
19.9
|
|
||||||||||||||||
|
Net income (loss)
|
—
|
|
—
|
|
(18.4
|
)
|
—
|
|
(54.4
|
)
|
777.7
|
|
(119.4
|
)
|
585.5
|
|
(185.4
|
)
|
||||||||||||||||
|
Currency translation adjustments
|
—
|
|
—
|
|
—
|
|
(32.9
|
)
|
(9.3
|
)
|
(633.9
|
)
|
(124.9
|
)
|
(801.0
|
)
|
—
|
|
||||||||||||||||
|
Defined benefit plans, net
|
—
|
|
—
|
|
—
|
|
1.0
|
|
—
|
|
—
|
|
3.4
|
|
4.4
|
|
—
|
|
||||||||||||||||
|
Change in fair value of cash flow hedge instruments
|
—
|
|
—
|
|
—
|
|
0.5
|
|
—
|
|
—
|
|
1.8
|
|
2.3
|
|
—
|
|
||||||||||||||||
|
Balance at December 31, 2015
|
80.4
|
|
—
|
|
485.9
|
|
(90.1
|
)
|
120.8
|
|
4,493.8
|
|
1,067.2
|
|
6,077.6
|
|
2,845.9
|
|
||||||||||||||||
|
Reallocation of ownership interests in Carlyle Holdings
|
0.9
|
|
—
|
|
18.1
|
|
(4.5
|
)
|
—
|
|
—
|
|
(13.6
|
)
|
—
|
|
—
|
|
||||||||||||||||
|
Units repurchased
|
(3.6
|
)
|
—
|
|
(57.4
|
)
|
—
|
|
—
|
|
—
|
|
(1.5
|
)
|
(58.9
|
)
|
—
|
|
||||||||||||||||
|
Deferred tax effects resulting from acquisition of interests in Carlyle Holdings
|
—
|
|
—
|
|
0.4
|
|
|
—
|
|
|
—
|
|
|
—
|
|
|
—
|
|
|
0.4
|
|
|
—
|
|
||||||||||
|
Equity-based compensation
|
—
|
|
—
|
|
97.4
|
|
—
|
|
—
|
|
—
|
|
278.8
|
|
376.2
|
|
—
|
|
||||||||||||||||
|
Net delivery of vested common units
|
6.9
|
|
—
|
|
(6.2
|
)
|
—
|
|
—
|
|
—
|
|
(0.5
|
)
|
(6.7
|
)
|
—
|
|
||||||||||||||||
|
Contributions
|
—
|
|
—
|
|
—
|
|
—
|
|
—
|
|
119.3
|
|
—
|
|
119.3
|
|
—
|
|
||||||||||||||||
|
Distributions
|
—
|
|
—
|
|
(140.9
|
)
|
—
|
|
—
|
|
(107.9
|
)
|
(422.6
|
)
|
(671.4
|
)
|
(1.5
|
)
|
||||||||||||||||
|
Deconsolidation of ESG
|
—
|
|
—
|
|
(0.6
|
)
|
|
—
|
|
|
—
|
|
|
(5.6
|
)
|
|
—
|
|
|
(6.2
|
)
|
|
(6.3
|
)
|
||||||||||
|
Deconsolidation of Consolidated Funds upon adoption of ASU 2015-02 and the impact of adoption of ASU 2014-13 (see Note 2)
|
—
|
|
—
|
|
—
|
|
—
|
|
(120.8
|
)
|
|
(4,211.1
|
)
|
|
—
|
|
(4,331.9
|
)
|
(2,838.3
|
)
|
||||||||||||||
|
Net income (loss)
|
—
|
|
—
|
|
6.4
|
|
—
|
|
—
|
|
40.8
|
|
(32.1
|
)
|
15.1
|
|
0.2
|
|
||||||||||||||||
|
Currency translation adjustments
|
—
|
|
—
|
|
—
|
|
0.7
|
|
—
|
|
(51.5
|
)
|
(3.8
|
)
|
(54.6
|
)
|
—
|
|
||||||||||||||||
|
Defined benefit plans, net
|
—
|
|
—
|
|
—
|
|
(1.8
|
)
|
—
|
|
—
|
|
(5.0
|
)
|
(6.8
|
)
|
—
|
|
||||||||||||||||
|
Change in fair value of cash flow hedge instruments
|
—
|
|
—
|
|
—
|
|
0.5
|
|
—
|
|
—
|
|
1.4
|
|
1.9
|
|
—
|
|
||||||||||||||||
|
Balance at December 31, 2016
|
84.6
|
|
—
|
|
403.1
|
|
(95.2
|
)
|
$
|
—
|
|
277.8
|
|
868.3
|
|
1,454.0
|
|
—
|
|
|||||||||||||||
|
Reallocation of ownership interests in Carlyle Holdings
|
—
|
|
—
|
|
33.1
|
|
(8.3
|
)
|
—
|
|
—
|
|
(24.8
|
)
|
—
|
|
—
|
|
||||||||||||||||
|
Exchange of Carlyle Holdings units for common units
|
6.6
|
|
—
|
|
41.0
|
|
(6.5
|
)
|
—
|
|
—
|
|
(34.5
|
)
|
—
|
|
—
|
|
||||||||||||||||
|
Units repurchased
|
—
|
|
—
|
|
(0.2
|
)
|
—
|
|
—
|
|
—
|
|
—
|
|
(0.2
|
)
|
—
|
|
||||||||||||||||
|
Equity issued in connection with preferred units
|
—
|
|
387.5
|
|
—
|
|
—
|
|
—
|
|
—
|
|
—
|
|
387.5
|
|
—
|
|
||||||||||||||||
|
Deferred tax effects resulting from acquisition of interests in Carlyle Holdings
|
—
|
|
—
|
|
8.0
|
|
—
|
|
—
|
|
—
|
|
—
|
|
8.0
|
|
—
|
|
||||||||||||||||
|
Equity-based compensation
|
—
|
|
—
|
|
104.3
|
|
—
|
|
—
|
|
—
|
|
254.3
|
|
358.6
|
|
—
|
|
||||||||||||||||
|
Net delivery of vested common units
|
8.9
|
|
—
|
|
—
|
|
—
|
|
—
|
|
—
|
|
—
|
|
—
|
|
—
|
|
||||||||||||||||
|
Contributions
|
—
|
|
—
|
|
—
|
|
—
|
|
—
|
|
119.2
|
|
—
|
|
119.2
|
|
—
|
|
||||||||||||||||
|
Distributions
|
—
|
|
(6.0
|
)
|
(118.1
|
)
|
—
|
|
—
|
|
(118.0
|
)
|
(295.6
|
)
|
(537.7
|
)
|
—
|
|
||||||||||||||||
|
Net income
|
—
|
|
6.0
|
|
238.1
|
|
—
|
|
—
|
|
72.5
|
|
690.8
|
|
1,007.4
|
|
—
|
|
||||||||||||||||
|
Deconsolidation of a consolidated entity
|
—
|
|
—
|
|
(4.3
|
)
|
20.2
|
|
—
|
|
17.6
|
|
38.7
|
|
72.2
|
|
—
|
|
||||||||||||||||
|
Cumulative effect adjustment upon adoption of ASU 2016-09
|
—
|
|
—
|
|
(3.2
|
)
|
—
|
|
—
|
|
—
|
|
(13.0
|
)
|
(16.2
|
)
|
—
|
|
||||||||||||||||
|
Currency translation adjustments
|
—
|
|
—
|
|
—
|
|
17.0
|
|
—
|
|
35.6
|
|
43.2
|
|
95.8
|
|
—
|
|
||||||||||||||||
|
Defined benefit plans, net
|
—
|
|
—
|
|
—
|
|
0.1
|
|
—
|
|
—
|
|
0.3
|
|
0.4
|
|
—
|
|
||||||||||||||||
|
Balance at December 31, 2017
|
100.1
|
|
$
|
387.5
|
|
$
|
701.8
|
|
$
|
(72.7
|
)
|
$
|
—
|
|
$
|
404.7
|
|
$
|
1,527.7
|
|
$
|
2,949.0
|
|
$
|
—
|
|
||||||||
See accompanying notes.
188
The Carlyle Group L.P.
(Dollars in millions)
|
|
Year Ended December 31,
|
||||||||||
|
|
2017
|
2016
|
2015
|
||||||||
|
Cash flows from operating activities
|
|||||||||||
|
Net income
|
$
|
1,007.4
|
|
$
|
15.3
|
|
$
|
400.1
|
|
||
|
Adjustments to reconcile net income to net cash flows from operating activities:
|
|||||||||||
|
Depreciation, amortization, and impairment
|
41.3
|
|
72.0
|
|
322.8
|
|
|||||
|
Equity-based compensation
|
320.3
|
|
334.6
|
|
378.0
|
|
|||||
|
Excess tax benefits related to equity-based compensation
|
—
|
|
—
|
|
(4.0
|
)
|
|||||
|
Non-cash performance fees
|
(626.8
|
)
|
199.6
|
|
455.1
|
|
|||||
|
Other non-cash amounts
|
(74.6
|
)
|
(41.7
|
)
|
12.7
|
|
|||||
|
Consolidated Funds related:
|
|||||||||||
|
Realized/unrealized gain on investments of Consolidated Funds
|
(27.0
|
)
|
(51.7
|
)
|
(458.7
|
)
|
|||||
|
Realized/unrealized (gain) loss from loans payable of Consolidated Funds
|
(61.4
|
)
|
40.5
|
|
(436.5
|
)
|
|||||
|
Purchases of investments by Consolidated Funds
|
(2,875.0
|
)
|
(2,739.4
|
)
|
(10,472.1
|
)
|
|||||
|
Proceeds from sale and settlements of investments by Consolidated Funds
|
2,649.3
|
|
1,282.9
|
|
11,653.6
|
|
|||||
|
Non-cash interest (income) loss, net
|
(5.3
|
)
|
(5.5
|
)
|
3.3
|
|
|||||
|
Change in cash and cash equivalents held at Consolidated Funds
|
383.9
|
|
513.7
|
|
1,281.8
|
|
|||||
|
Change in other receivables held at Consolidated Funds
|
(16.7
|
)
|
1.1
|
|
534.6
|
|
|||||
|
Change in other liabilities held at Consolidated Funds
|
(266.1
|
)
|
268.9
|
|
48.0
|
|
|||||
|
Other non-cash amounts of Consolidated Funds
|
—
|
|
(17.5
|
)
|
—
|
|
|||||
|
Investment income
|
(227.1
|
)
|
(154.6
|
)
|
(0.5
|
)
|
|||||
|
Purchases of investments
|
(888.5
|
)
|
(368.2
|
)
|
(91.9
|
)
|
|||||
|
Proceeds from the sale of investments
|
467.5
|
|
299.5
|
|
313.0
|
|
|||||
|
Payments of contingent consideration
|
(22.6
|
)
|
(82.6
|
)
|
(17.8
|
)
|
|||||
|
Deconsolidation of Claren Road (see Note 9)
|
(23.3
|
)
|
—
|
|
—
|
|
|||||
|
Deconsolidation of Urbplan (see Note 15)
|
14.0
|
|
—
|
|
—
|
|
|||||
|
Deconsolidation of ESG
|
—
|
|
(34.5
|
)
|
—
|
|
|||||
|
Changes in deferred taxes, net
|
93.4
|
|
(4.4
|
)
|
(31.4
|
)
|
|||||
|
Change in due from affiliates and other receivables
|
0.3
|
|
(10.9
|
)
|
(1.4
|
)
|
|||||
|
Change in receivables and inventory of a real estate VIE
|
(14.5
|
)
|
29.0
|
|
(57.5
|
)
|
|||||
|
Change in deposits and other
|
(2.0
|
)
|
5.1
|
|
(10.8
|
)
|
|||||
|
Change in other assets of a real estate VIE
|
1.6
|
|
41.2
|
|
(17.4
|
)
|
|||||
|
Change in accounts payable, accrued expenses and other liabilities
|
50.5
|
|
66.6
|
|
62.5
|
|
|||||
|
Change in accrued compensation and benefits
|
(13.7
|
)
|
6.5
|
|
(35.3
|
)
|
|||||
|
Change in due to affiliates
|
35.7
|
|
(19.3
|
)
|
21.0
|
|
|||||
|
Change in other liabilities of a real estate VIE
|
47.9
|
|
34.3
|
|
101.6
|
|
|||||
|
Change in deferred revenue
|
24.4
|
|
18.9
|
|
(50.0
|
)
|
|||||
|
Net cash provided by (used in) operating activities
|
(7.1
|
)
|
(300.6
|
)
|
3,902.8
|
|
|||||
|
Cash flows from investing activities
|
|||||||||||
|
Change in restricted cash
|
(15.5
|
)
|
5.3
|
|
40.8
|
|
|||||
|
Purchases of fixed assets, net
|
(34.0
|
)
|
(25.4
|
)
|
(62.3
|
)
|
|||||
|
Net cash used in investing activities
|
(49.5
|
)
|
(20.1
|
)
|
(21.5
|
)
|
|||||
|
Cash flows from financing activities
|
|||||||||||
|
Borrowings under credit facility
|
250.0
|
|
—
|
|
—
|
|
|||||
|
Repayments under credit facility
|
(250.0
|
)
|
—
|
|
—
|
|
|||||
|
Proceeds from debt obligations
|
265.6
|
|
20.6
|
|
—
|
|
|||||
|
Payments on debt obligations
|
(21.7
|
)
|
(9.0
|
)
|
—
|
|
|||||
|
Net payments on loans payable of a real estate VIE
|
(14.3
|
)
|
(34.5
|
)
|
(65.3
|
)
|
|||||
|
Net borrowings on loans payable of Consolidated Funds
|
147.2
|
|
594.2
|
|
734.3
|
|
|||||
|
Payments of contingent consideration
|
(0.6
|
)
|
(3.3
|
)
|
(8.1
|
)
|
|||||
|
Distributions to common unitholders
|
(118.1
|
)
|
(140.9
|
)
|
(251.0
|
)
|
|||||
|
Distributions to preferred unitholders
|
(6.0
|
)
|
—
|
|
—
|
|
|||||
|
Distributions to non-controlling interest holders in Carlyle Holdings
|
(295.6
|
)
|
(422.6
|
)
|
(848.5
|
)
|
|||||
|
Net proceeds from issuance of common units, net of offering costs
|
—
|
|
—
|
|
209.9
|
|
|||||
|
Proceeds from issuance of preferred units, net of offering costs and expenses
|
387.5
|
|
—
|
|
—
|
|
|||||
|
Excess tax benefits related to equity-based compensation
|
—
|
|
—
|
|
4.0
|
|
|||||
|
Contributions from non-controlling interest holders
|
119.2
|
|
113.0
|
|
2,376.6
|
|
|||||
|
Distributions to non-controlling interest holders
|
(118.0
|
)
|
(109.4
|
)
|
(5,267.0
|
)
|
|||||
|
Acquisition of non-controlling interests in Carlyle Holdings
|
—
|
|
—
|
|
(209.9
|
)
|
|||||
|
Common units repurchased
|
(0.2
|
)
|
(58.9
|
)
|
—
|
|
|||||
|
Change in due to/from affiliates financing activities
|
(26.4
|
)
|
66.1
|
|
(62.7
|
)
|
|||||
|
Change in due to/from affiliates and other receivables of Consolidated Funds
|
—
|
|
—
|
|
(623.5
|
)
|
|||||
|
Net cash provided by (used in) financing activities
|
318.6
|
|
15.3
|
|
(4,011.2
|
)
|
|||||
|
Effect of foreign exchange rate changes
|
67.2
|
|
(15.2
|
)
|
(120.6
|
)
|
|||||
|
Increase (Decrease) in cash and cash equivalents
|
329.2
|
|
(320.6
|
)
|
(250.5
|
)
|
|||||
|
Cash and cash equivalents, beginning of period
|
670.9
|
|
991.5
|
|
1,242.0
|
|
|||||
|
Cash and cash equivalents, end of period
|
$
|
1,000.1
|
|
$
|
670.9
|
|
$
|
991.5
|
|
||
|
Supplemental cash disclosures
|
|||||||||||
|
Cash paid for interest
|
$
|
59.5
|
|
$
|
59.0
|
|
$
|
56.0
|
|
||
|
Cash paid for income taxes
|
$
|
24.8
|
|
$
|
35.1
|
|
$
|
41.6
|
|
||
|
Supplemental non-cash disclosures
|
|||||||||||
|
Increase in partners’ capital related to reallocation of ownership interest in Carlyle Holdings
|
$
|
24.8
|
|
$
|
13.6
|
|
$
|
21.9
|
|
||
|
Initial consolidation of Consolidated Funds
|
$
|
—
|
|
$
|
—
|
|
$
|
63.8
|
|
||
|
Net asset impact of deconsolidation of Consolidated Funds
|
$
|
—
|
|
$
|
(7,170.2
|
)
|
$
|
—
|
|
||
|
Non-cash contributions from non-controlling interest holders
|
$
|
—
|
|
$
|
6.3
|
|
$
|
—
|
|
||
|
Tax effect from acquisition of Carlyle Holdings partnership units:
|
|||||||||||
|
Deferred tax asset
|
$
|
38.7
|
|
$
|
3.0
|
|
$
|
59.6
|
|
||
|
Deferred tax liability
|
$
|
—
|
|
$
|
—
|
|
$
|
2.6
|
|
||
|
Tax receivable agreement liability
|
$
|
30.7
|
|
$
|
2.6
|
|
$
|
51.5
|
|
||
|
Total partners’ capital
|
$
|
8.0
|
|
$
|
0.4
|
|
$
|
5.5
|
|
||
See accompanying notes.
189
The Carlyle Group L.P.
Notes to the Consolidated Financial Statements
1. Organization and Basis of Presentation
The Carlyle Group L.P., together with its consolidated subsidiaries is one of the world’s largest global alternative asset management firms that originates, structures and acts as lead equity investor in management-led buyouts, strategic minority equity investments, equity private placements, consolidations and buildups, growth capital financings, real estate opportunities, bank loans, high-yield debt, distressed assets, mezzanine debt and other investment opportunities. The Carlyle Group L.P. is a Delaware limited partnership formed on July 18, 2011, which is managed and operated by its general partner, Carlyle Group Management L.L.C., which is in turn wholly-owned and controlled by Carlyle’s founders and other senior Carlyle professionals. Except as otherwise indicated by the context, references to the “Partnership” or “Carlyle” refer to The Carlyle Group L.P., together with its consolidated subsidiaries.
Carlyle provides investment management services to, and has transactions with, various private equity funds, real estate funds, private credit funds, collateralized loan obligations (“CLOs”), and other investment products sponsored by the Partnership for the investment of client assets in the normal course of business. Carlyle typically serves as the general partner, investment manager or collateral manager, making day-to-day investment decisions concerning the assets of these products. Carlyle operates its business through
four
reportable segments: Corporate Private Equity, Real Assets, Global Credit (formerly known as Global Market Strategies) and Investment Solutions (see Note 16).
Basis of Presentation
The accompanying financial statements include the accounts of the Partnership and its consolidated subsidiaries. In addition, certain Carlyle-affiliated funds, related co-investment entities, certain CLOs managed by the Partnership (collectively the “Consolidated Funds”) and a real estate development company have been consolidated in the accompanying financial statements pursuant to accounting principles generally accepted in the United States (“U.S. GAAP”), as described in Note 2. The accounts of the real estate development company were deconsolidated during 2017 (see Note 15). The consolidation of the Consolidated Funds generally has a gross-up effect on assets, liabilities and cash flows, and generally has no effect on the net income attributable to the Partnership. The economic ownership interests of the other investors in the Consolidated Funds are reflected as non-controlling interests in consolidated entities in the accompanying consolidated financial statements (see Note 2).
2. Summary of Significant Accounting Policies
Principles of Consolidation
The Partnership consolidates all entities that it controls either through a majority voting interest or as the primary beneficiary of variable interest entities (“VIEs”). On January 1, 2016, the Partnership adopted ASU 2015-2,
Consolidation (Topic 810): Amendments to the Consolidation Analysis,
which provides a revised consolidation model for all reporting entities to use in evaluating whether to consolidate certain types of legal entities. As a result, the Partnership deconsolidated the majority of the Partnership's Consolidated Funds on January 1, 2016. Upon adoption, the Partnership deconsolidated approximately
$23.2 billion
in assets and approximately
$16.1 billion
in liabilities, and, using the modified retrospective method, recorded a
$4.3 billion
cumulative effect adjustment to partners' capital and
$2.8 billion
to redeemable non-controlling interests in consolidated entities. The adoption of the new consolidation guidance had no impact on net income (loss) attributable to Carlyle Holdings or to net income (loss) attributable to the Partnership. Prior period results were not restated upon adoption.
The Partnership evaluates (1) whether it holds a variable interest in an entity, (2) whether the entity is a VIE, and (3) whether the Partnership's involvement would make it the primary beneficiary. In evaluating whether the Partnership holds a variable interest, fees (including management fees and performance fees) that are customary and commensurate with the level of services provided, and where the Partnership does not hold other economic interests in the entity that would absorb more than an insignificant amount of the expected losses or returns of the entity, are not considered variable interests. The Partnership considers all economic interests, including indirect interests, to determine if a fee is considered a variable interest. For the funds the Partnership deconsolidated on January 1, 2016, the Partnership's fee arrangements were not considered to be variable interests.
For those entities where the Partnership holds a variable interest, the Partnership determines whether each of these entities qualifies as a VIE and, if so, whether or not the Partnership is the primary beneficiary. The assessment of whether the entity is a VIE is generally performed qualitatively, which requires judgment. These judgments include: (a) determining
190
The Carlyle Group L.P.
Notes to the Consolidated Financial Statements
whether the equity investment at risk is sufficient to permit the entity to finance its activities without additional subordinated financial support, (b) evaluating whether the equity holders, as a group, can make decisions that have a significant effect on the economic performance of the entity, (c) determining whether two or more parties' equity interests should be aggregated, and (d) determining whether the equity investors have proportionate voting rights to their obligations to absorb losses or rights to receive returns from an entity.
For entities that are determined to be VIEs, the Partnership consolidates those entities where it has concluded it is the primary beneficiary. The primary beneficiary is defined as the variable interest holder with (a) the power to direct the activities of a VIE that most significantly impact the entity’s economic performance and (b) the obligation to absorb losses of the entity or the right to receive benefits from the entity that could potentially be significant to the VIE. In evaluating whether the Partnership is the primary beneficiary, the Partnership evaluates its economic interests in the entity held either directly or indirectly by the Partnership.
As of
December 31, 2017
, assets and liabilities of the consolidated VIEs reflected in the consolidated balance sheets were
$5.0 billion
and
$4.8 billion
, respectively. Except to the extent of the consolidated assets of the VIEs, the holders of the consolidated VIEs’ liabilities generally do not have recourse to the Partnership.
Substantially all of our Consolidated Funds are CLOs, which are VIEs that issue loans payable that are backed by diversified collateral asset portfolios consisting primarily of loans or structured debt. In exchange for managing the collateral for the CLOs, the Partnership earns investment management fees, including in some cases subordinated management fees and contingent incentive fees. In cases where the Partnership consolidates the CLOs (primarily because of a retained interest that is significant to the CLO), those management fees have been eliminated as intercompany transactions. As of
December 31, 2017
, the Partnership held
$220.6 million
of investments in these CLOs which represents its maximum risk of loss. The Partnership’s investments in these CLOs are generally subordinated to other interests in the entities and entitle the Partnership to receive a pro rata portion of the residual cash flows, if any, from the entities. Investors in the CLOs have no recourse against the Partnership for any losses sustained in the CLO structure.
Entities that do not qualify as VIEs are generally assessed for consolidation as voting interest entities. Under the voting interest entity model, the Partnership consolidates those entities it controls through a majority voting interest.
All significant inter-entity transactions and balances of entities consolidated have been eliminated.
Investments in Unconsolidated Variable Interest Entities
The Partnership holds variable interests in certain VIEs that are not consolidated because the Partnership is not the primary beneficiary, including its investments in certain CLOs and strategic investment in NGP Management Company, L.L.C. (“NGP Management” and, together with its affiliates, “NGP”). Refer to Note 5 for information on the strategic investment in NGP. The Partnership’s involvement with such entities is in the form of direct equity interests and fee arrangements. The maximum exposure to loss represents the loss of assets recognized by the Partnership relating to its variable interests in these unconsolidated entities. The assets recognized in the Partnership’s consolidated balance sheets related to the Partnership’s variable interests in these non-consolidated VIEs and the Partnership’s maximum exposure to loss relating to unconsolidated VIEs were as follows:
|
|
As of December 31,
|
||||||
|
|
2017
|
2016
|
|||||
|
|
(Dollars in millions)
|
||||||
|
Investments
|
$
|
975.3
|
|
$
|
664.2
|
|
|
|
Due from affiliates, net
|
0.1
|
|
1.8
|
|
|||
|
Maximum Exposure to Loss
|
$
|
975.4
|
|
$
|
666.0
|
|
|
Additionally, as of
December 31, 2017
, the Partnership had
$62.0 million
and
$11.7 million
recognized in the consolidated balance sheet related to performance fee and management fee arrangements, respectively, related to the unconsolidated VIEs.
191
The Carlyle Group L.P.
Notes to the Consolidated Financial Statements
Basis of Accounting
The accompanying financial statements are prepared in accordance with U.S. GAAP. Management has determined that the Partnership’s Funds are investment companies under U.S. GAAP for the purposes of financial reporting. U.S. GAAP for an investment company requires investments to be recorded at estimated fair value and the unrealized gains and/or losses in an investment’s fair value are recognized on a current basis in the statements of operations. Additionally, the Funds do not consolidate their majority-owned and controlled investments (the “Portfolio Companies”). In the preparation of these consolidated financial statements, the Partnership has retained the specialized accounting for the Funds.
All of the investments held and notes issued by the Consolidated Funds are presented at their estimated fair values in the Partnership’s consolidated balance sheets. Interest and other income of the Consolidated Funds as well as interest expense and other expenses of the Consolidated Funds are included in the Partnership’s consolidated statements of operations. Prior to January 1, 2016, the excess of the CLO assets over the CLO liabilities upon consolidation was reflected in the Partnership’s consolidated balance sheets as partners’ capital appropriated for Consolidated Funds. Net income attributable to the investors in the CLOs was included in net income (loss) attributable to non-controlling interests in consolidated entities in the consolidated statements of operations and partners’ capital appropriated for Consolidated Funds in the consolidated balance sheets.
On January 1, 2016, the Partnership adopted ASU 2014-13,
Consolidation (Topic 810): Measuring the Financial Assets and the Financial Liabilities of a Consolidated Collateralized Financing Entity.
ASU 2014-13 relates to reporting entities that elect to measure all eligible financial assets and financial liabilities of a consolidated collateralized financing entity at fair value. The Partnership's consolidated CLOs are consolidated collateralized financing entities for which the Partnership has measured financial assets and financial liabilities at fair value. ASU 2014-13 provides the option for a reporting entity to initially measure both the financial assets and financial liabilities using the fair value of either the financial assets or financial liabilities, whichever is more observable. In adopting this guidance on January 1, 2016, the Partnership applied the modified retrospective method by recording a cumulative effect adjustment to appropriated partners' capital of
$2.0 million
as of January 1, 2016. As a result of applying this adoption method, prior periods have not been impacted. The adoption of this guidance did not have an impact on net income attributable to Carlyle Holdings or to net income attributable to the Partnership.
Use of Estimates
The preparation of financial statements in conformity with U.S. GAAP requires management to make assumptions and estimates that affect the reported amounts of assets and liabilities and disclosure of contingent assets and liabilities at the date of the financial statements and the reported amounts of revenues and expenses during the reporting period. Management’s estimates are based on historical experiences and other factors, including expectations of future events that management believes to be reasonable under the circumstances. It also requires management to exercise judgment in the process of applying the Partnership’s accounting policies. Assumptions and estimates regarding the valuation of investments and their resulting impact on performance fees involve a higher degree of judgment and complexity and these assumptions and estimates may be significant to the consolidated financial statements and the resulting impact on performance fees. Actual results could differ from these estimates and such differences could be material.
Revenue Recognition
Fund Management Fees
The Partnership provides management services to funds in which it holds a general partner interest or has a management agreement.
For closed-end carry funds in the Corporate Private Equity, Real Assets and Global Credit segments, management fees generally range from
1.0%
to
2.0%
of commitments during the fund's investment period based on limited partners' capital commitments to the funds. Following the expiration or termination of the investment period, management fees generally are based on the lower of cost or fair value of invested capital and the rate charged may also be reduced to between
0.6%
and
2.0%
. For certain separately managed accounts and longer-dated carry funds, with expected terms greater than
ten years
, management fees generally range from
0.2%
to
1.0%
based on contributions for unrealized investments or the current value of the investment. The Partnership will receive management fees during a specified period of time, which is generally
ten years
from the initial closing date, or, in some instances, from the final closing date, but such termination date may be earlier in certain limited circumstances or later if extended for successive
one year
periods, typically up to a maximum of
two years
. Depending upon the contracted terms of investment advisory or investment management and related agreements, these fees are generally
192
The Carlyle Group L.P.
Notes to the Consolidated Financial Statements
called semi-annually in advance and are recognized as earned over the subsequent
six
month period. For certain longer-dated carry funds, management fees are called quarterly over the life of the funds.
Within the Global Credit segment, for CLOs and other structured products, management fees generally range from
0.3%
to
0.6%
based on the total par amount of assets or the aggregate principal amount of the notes in the CLO and are due quarterly or semi-annually based on the terms and recognized over the respective period. Management fees for the CLOs and other structured products are governed by indentures and collateral management agreements. The Partnership will receive management fees for the CLOs until redemption of the securities issued by the CLOs, which is generally
five
to
ten
years after issuance. Management fees for the business development companies are due quarterly in arrears at annual rates that range from
0.25%
to
1.5%
of gross assets, excluding cash and cash equivalents.
Management fees for the Partnership's private equity and real estate carry fund vehicles in the Investment Solutions segment generally range from
0.25%
to
1.0%
on the vehicle’s capital commitments during the commitment fee period of the relevant fund or the weighted-average investment period of the underlying funds. Following the expiration of the commitment fee period or weighted-average investment period of such funds, the management fees generally range from
0.25%
to
1.0%
on (i) the lower of cost or fair value of the capital invested, (ii) the net asset value for unrealized investments, or (iii) the contributions for unrealized investments; however, certain separately managed accounts earn management fees at all times on contributions for unrealized investments or on the initial commitment amount. Management fees for the Investment Solutions carry fund vehicles are generally due quarterly and recognized over the related quarter.
The Partnership also provides transaction advisory and portfolio advisory services to the portfolio companies, and where covered by separate contractual agreements, recognizes fees for these services when the service has been provided and collection is reasonably assured. Fund management fees includes transaction and portfolio advisory fees of
$43.6 million
,
$47.8 million
and
$25.2 million
for
the years ended December 31, 2017, 2016 and 2015
, respectively, net of any offsets as defined in the respective partnership agreements. Fund management fees exclude the reimbursement of any partnership expenses paid by the Partnership on behalf of the Carlyle funds pursuant to the limited partnership agreements, including amounts related to the pursuit of actual, proposed, or unconsummated investments, professional fees, expenses associated with the acquisition, holding and disposition of investments, and other fund administrative expenses.
Performance Fees
Performance fees consist principally of the performance-based capital allocation from fund limited partners to the Partnership (commonly known as "carried interest").
For closed-end carry funds in the Corporate Private Equity, Real Assets and Global Credit segments, the Partnership is generally entitled to a
20%
allocation (or
10%
to
20%
on certain longer-dated carry funds, certain credit funds, and external co-investment vehicles, or approximately
2%
to
10%
for most of the recent Investment Solutions carry fund vehicles) of the net realized income or gain as a carried interest after returning the invested capital, the allocation of preferred returns of generally
7%
to
9%
(or
4%
to
7%
for certain longer-dated carry funds) and return of certain fund costs (generally subject to catch-up provisions as set forth in the fund limited partnership agreement). Carried interest is recognized upon appreciation of the funds’ investment values above certain return hurdles set forth in each respective partnership agreement. The Partnership recognizes revenues attributable to performance fees based upon the amount that would be due pursuant to the fund partnership agreement at each period end as if the funds were terminated at that date. Accordingly, the amount recognized as performance fees reflects the Partnership’s share of the gains and losses of the associated funds’ underlying investments measured at their then-current fair values relative to the fair values as of the end of the prior period. Because of the inherent uncertainty, these estimated values may differ significantly from the values that would have been used had a ready market for the investments existed, and it is reasonably possible that the difference could be material.
Carried interest is ultimately realized when: (i) an underlying investment is profitably disposed of, (ii) certain costs borne by the limited partner investors have been reimbursed, (iii) the fund’s cumulative returns are in excess of the preferred return and (iv) the Partnership has decided to collect carry rather than return additional capital to limited partner investors. Realized carried interest may be required to be returned by the Partnership in future periods if the funds’ investment values decline below certain levels. When the fair value of a fund’s investments remains constant or falls below certain return hurdles, previously recognized performance fees are reversed. In all cases, each fund is considered separately in this regard, and for a given fund, performance fees can never be negative over the life of a fund. If upon a hypothetical liquidation of a fund’s investments at their then current fair values, previously recognized and distributed carried interest would be required to be returned, a liability is established for the potential giveback obligation. As of
December 31, 2017
and
2016
, the Partnership has recognized
$66.8 million
and
$160.8 million
, respectively, for giveback obligations.
193
The Carlyle Group L.P.
Notes to the Consolidated Financial Statements
The Partnership is also entitled to receive performance fees pursuant to management contracts from certain of its Global Credit funds when the return on assets under management exceeds certain benchmark returns or other performance targets. In such arrangements, performance fees are recognized when the performance benchmark has been achieved, and are included in performance fees in the accompanying consolidated statements of operations.
Investment Income (Loss)
Investment income (loss) represents the unrealized and realized gains and losses resulting from the Partnership’s equity method investments and other principal investments, including CLOs. Equity method investment income (loss) includes the related amortization of the basis difference between the Partnership’s carrying value of its investment and the Partnership’s share of underlying net assets of the investee, as well as the compensation expense associated with compensatory arrangements provided by the Partnership to employees of its equity method investee, as it relates to its investment in NGP (see Note 5). Investment income (loss) is realized when the Partnership redeems all or a portion of its investment or when the Partnership receives or is due cash income, such as dividends or distributions. Unrealized investment income (loss) results from changes in the fair value of the underlying investment as well as the reversal of unrealized gain (loss) at the time an investment is realized.
Interest Income
Interest income is recognized when earned. For debt securities representing non-investment grade beneficial interests in securitizations, the effective yield is determined based on the estimated cash flows of the security. Changes in the effective yield of these securities due to changes in estimated cash flows are recognized on a prospective basis as adjustments to interest income in future periods. Interest income earned by the Partnership is included in interest and other income in the accompanying consolidated statements of operations. Interest income of the Consolidated Funds was
$167.3 million
,
$140.4 million
and
$873.1 million
for
the years ended December 31, 2017, 2016 and 2015
, respectively, and is included in interest and other income of Consolidated Funds in the accompanying consolidated statements of operations.
Compensation and Benefits
Base Compensation
– Base compensation includes salaries, bonuses (discretionary awards and guaranteed amounts), performance payment arrangements and benefits paid and payable to Carlyle employees. Bonuses are accrued over the service period to which they relate.
Equity-Based Compensation
– Compensation expense relating to the issuance of equity-based awards to Carlyle employees is measured at fair value on the grant date. The compensation expense for awards that vest over a future service period is recognized over the relevant service period on a straight-line basis. The compensation expense for awards that do not require future service is recognized immediately. Cash settled equity-based awards are classified as liabilities and are re-measured at the end of each reporting period. The compensation expense for awards that contain performance conditions is recognized when it is probable that the performance conditions will be achieved; in certain instances, such compensation expense may be recognized prior to the grant date of the award.
Equity-based awards issued to non-employees are recognized as general, administrative and other expenses, except to the extent they are recognized as part of our equity method earnings because they are issued to employees of our equity method investees. The grant-date fair value of equity-based awards granted to Carlyle’s non-employee directors is expensed on a straight-line basis over the vesting period. The cost of services received in exchange for an equity-based award issued to non-employees who are not directors is measured at each vesting date, and is not measured based on the grant-date fair value of the award unless the award is vested at the grant date. Equity-based awards that require the satisfaction of future service criteria are recognized over the relevant service period based on the fair value of the award on each reporting date and adjusted for the actual fair value of the award at each vesting date. Accordingly, the measured value of the award will not be finalized until the vesting date.
On January 1, 2017, the Partnership adopted ASU 2016-9,
Compensation - Stock Compensation (Topic 718)
. In accordance with ASU 2016-9, the Partnership elected to recognize equity-based award forfeitures in the period they occur as a reversal of previously recognized compensation expense. The reduction in compensation expense is determined based on the specific awards forfeited during that period. Furthermore, the Partnership is required to recognize prospectively all excess tax benefits and deficiencies as income tax benefit or expense in the statement of operations.
194
The Carlyle Group L.P.
Notes to the Consolidated Financial Statements
Performance Fee Related Compensation –
A portion of the performance fees earned is due to employees and advisors of the Partnership. These amounts are accounted for as compensation expense in conjunction with the recognition of the related performance fee revenue and, until paid, are recognized as a component of the accrued compensation and benefits liability. Accordingly, upon a reversal of performance fee revenue, the related compensation expense, if any, is also reversed. As of
December 31, 2017 and 2016
, the Partnership had recorded a liability of
$1.9 billion
and
$1.3 billion
, respectively, related to the portion of accrued performance fees due to employees and advisors, which was included in accrued compensation and benefits in the accompanying consolidated financial statements.
Income Taxes
Certain of the wholly-owned subsidiaries of the Partnership and the Carlyle Holdings partnerships are subject to federal, state, local and foreign corporate income taxes at the entity level and the related tax provision attributable to the Partnership’s share of this income is reflected in the consolidated financial statements. Based on applicable federal, foreign, state and local tax laws, the Partnership records a provision for income taxes for certain entities. Tax positions taken by the Partnership are subject to periodic audit by U.S. federal, state, local and foreign taxing authorities.
The Partnership accounts for income taxes using the asset and liability method, which requires the recognition of deferred tax assets and liabilities for the expected future consequences of events that have been included in the financial statements or tax returns. Under this method, deferred tax assets and liabilities are determined based on the difference between the financial statement reporting and the tax basis of assets and liabilities using enacted tax rates in effect for the period in which the difference is expected to reverse. The effect of a change in tax rates on deferred tax assets and liabilities is recognized in the period of the change in the provision for income taxes. For instance, in December 2017, new corporate federal income tax rates were enacted, which impacted the Partnership's deferred tax assets and liabilities. See Note 11 for more information on the newly enacted corporate federal income tax rates. Further, deferred tax assets are recognized for the expected realization of available net operating loss and tax credit carry forwards. A valuation allowance is recorded on the Partnership’s gross deferred tax assets when it is more likely than not that such asset will not be realized. When evaluating the realizability of the Partnership’s deferred tax assets, all evidence, both positive and negative is evaluated. Items considered in this analysis include the ability to carry back losses, the reversal of temporary differences, tax planning strategies, and expectations of future earnings.
Under U.S. GAAP for income taxes, the amount of tax benefit to be recognized is the amount of benefit that is more likely than not to be sustained upon examination. The Partnership analyzes its tax filing positions in all of the U.S. federal, state, local and foreign tax jurisdictions where it is required to file income tax returns, as well as for all open tax years in these jurisdictions. If, based on this analysis, the Partnership determines that uncertainties in tax positions exist, a liability is established, which is included in accounts payable, accrued expenses and other liabilities in the consolidated financial statements. The Partnership recognizes accrued interest and penalties related to unrecognized tax positions in the provision for income taxes. If recognized, the entire amount of unrecognized tax positions would be recorded as a reduction in the provision for income taxes.
Tax Receivable Agreement
Exchanges of Carlyle Holdings partnership units for the Partnership’s common units that are executed by the limited partners of the Carlyle Holdings partnerships result in transfers of and increases in the tax basis of the tangible and intangible assets of Carlyle Holdings, primarily attributable to a portion of the goodwill inherent in the business. These transfers and increases in tax basis will increase (for tax purposes) depreciation and amortization and therefore reduce the amount of tax that certain of the Partnership’s subsidiaries, including Carlyle Holdings I GP Inc., which are referred to as the “corporate taxpayers,” would otherwise be required to pay in the future. This increase in tax basis may also decrease gain (or increase loss) on future dispositions of certain capital assets to the extent tax basis is allocated to those capital assets. The Partnership has entered into a tax receivable agreement with the limited partners of the Carlyle Holdings partnerships whereby the corporate taxpayers have agreed to pay to the limited partners of the Carlyle Holdings partnerships involved in any exchange transaction
85%
of the amount of cash tax savings, if any, in U.S. federal, state and local income tax or foreign or franchise tax that the corporate taxpayers realize as a result of these increases in tax basis and, in limited cases, transfers or prior increases in tax basis. The corporate taxpayers expect to benefit from the remaining
15%
of cash tax savings, if any, in income tax they realize. Payments under the tax receivable agreement will be based on the tax reporting positions that the Partnership will determine. The corporate taxpayers will not be reimbursed for any payments previously made under the tax receivable agreement if a tax basis increase is successfully challenged by the Internal Revenue Service.
195
The Carlyle Group L.P.
Notes to the Consolidated Financial Statements
The Partnership records an increase in deferred tax assets for the estimated income tax effects of the increases in tax basis based on enacted federal and state tax rates at the date of the exchange. To the extent that the Partnership estimates that the corporate taxpayers will not realize the full benefit represented by the deferred tax asset, based on an analysis that will consider, among other things, its expectation of future earnings, the Partnership will reduce the deferred tax asset with a valuation allowance and will assess the probability that the related liability owed under the tax receivable agreement will be paid. The Partnership records
85%
of the estimated realizable tax benefit (which is the recorded deferred tax asset less any recorded valuation allowance) as an increase to the liability due under the tax receivable agreement, which is included in due to affiliates in the accompanying consolidated financial statements. The remaining
15%
of the estimated realizable tax benefit is initially recorded as an increase to the Partnership’s partners’ capital.
All of the effects to the deferred tax asset of changes in any of the Partnership’s estimates after the tax year of the exchange will be reflected in the provision for income taxes. Similarly, the effect of subsequent changes in the enacted tax rates will be reflected in the provision for income taxes.
Non-controlling Interests
Non-controlling interests in consolidated entities represent the component of equity in consolidated entities held by third-party investors. These interests are adjusted for general partner allocations and by subscriptions and redemptions in hedge funds which occur during the reporting period. Any change in ownership of a subsidiary while the controlling financial interest is retained is accounted for as an equity transaction between the controlling and non-controlling interests. Transaction costs incurred in connection with such changes in ownership of a subsidiary are recorded as a direct charge to partners’ capital.
Non-controlling interests in Carlyle Holdings relate to the ownership interests of the other limited partners of the Carlyle Holdings partnerships. The Partnership, through wholly-owned subsidiaries, is the sole general partner of Carlyle Holdings. Accordingly, the Partnership consolidates Carlyle Holdings into its consolidated financial statements, and the other ownership interests in Carlyle Holdings are reflected as non-controlling interests in the Partnership’s consolidated financial statements. Any change to the Partnership’s ownership interest in Carlyle Holdings while it retains the controlling financial interest in Carlyle Holdings is accounted for as a transaction within partners’ capital as a reallocation of ownership interests in Carlyle Holdings.
Earnings Per Common Unit
The Partnership computes earnings per common unit in accordance with ASC 260,
Earnings Per Share
(“ASC 260”)
.
Basic earnings per common unit is calculated by dividing net income (loss) attributable to the common units of the Partnership by the weighted-average number of common units outstanding for the period. Diluted earnings per common unit reflects the assumed conversion of all dilutive securities. Net income (loss) attributable to the common units excludes net income (loss) and dividends attributable to any participating securities under the two-class method of ASC 260.
Investments
Investments include (i) the Partnership’s ownership interests (typically general partner interests) in the Funds, (ii) strategic investments made by the Partnership (both of which are accounted for as equity method investments), (iii) the investments held by the Consolidated Funds (which are presented at fair value in the Partnership’s consolidated financial statements), and (iv) certain credit-oriented investments, including investments in the CLOs (which are accounted for as trading securities).
The valuation procedures utilized for investments of the Funds vary depending on the nature of the investment. The fair value of investments in publicly-traded securities is based on the closing price of the security with adjustments to reflect appropriate discounts if the securities are subject to restrictions.
The fair value of non-equity securities or other investments, which may include instruments that are not listed on an exchange, considers, among other factors, external pricing sources, such as dealer quotes or independent pricing services, recent trading activity or other information that, in the opinion of the Partnership, may not have been reflected in pricing obtained from external sources.
When valuing private securities or assets without readily determinable market prices, the Partnership gives consideration to operating results, financial condition, economic and/or market events, recent sales prices and other pertinent information. These valuation procedures may vary by investment, but include such techniques as comparable public market
196
The Carlyle Group L.P.
Notes to the Consolidated Financial Statements
valuation, comparable acquisition valuation and discounted cash flow analysis. Because of the inherent uncertainty, these estimated values may differ significantly from the values that would have been used had a ready market for the investments existed, and it is reasonably possible that the difference could be material. Furthermore, there is no assurance that, upon liquidation, the Partnership will realize the values presented herein.
Upon the sale of a security or other investment, the realized net gain or loss is computed on a weighted average cost basis, with the exception of the investments held by the CLOs, which compute the realized net gain or loss on a first in, first out basis. Securities transactions are recorded on a trade date basis.
Equity-Method Investments
The Partnership accounts for all investments in which it has or is otherwise presumed to have significant influence, including investments in the unconsolidated Funds and strategic investments, using the equity method of accounting. The carrying value of equity-method investments is determined based on amounts invested by the Partnership, adjusted for the equity in earnings or losses of the investee allocated based on the respective partnership agreement, less distributions received. The Partnership evaluates its equity-method investments for impairment whenever events or changes in circumstances indicate that the carrying amounts of such investments may not be recoverable.
Cash and Cash Equivalents
Cash and cash equivalents include cash held at banks and cash held for distributions, including temporary investments with original maturities of less than three months when purchased.
Cash and Cash Equivalents Held at Consolidated Funds
Cash and cash equivalents held at Consolidated Funds consists of cash and cash equivalents held by the Consolidated Funds, which, although not legally restricted, is not available to fund the general liquidity needs of the Partnership.
Restricted Cash
Restricted cash primarily represents cash held by the Partnership's foreign subsidiaries due to certain government regulatory capital requirements as well as certain amounts held on behalf of Carlyle funds.
Corporate Treasury Investments
Corporate treasury investments represent investments in U.S. Treasury and government agency obligations, commercial paper, certificates of deposit, other investment grade securities and other investments with original maturities of greater than three months when purchased. These investments are accounted for as trading securities in which changes in the fair value of each investment are recorded through investment income (loss). Any interest earned on debt investments is recorded through interest and other income.
Derivative Instruments
The Partnership uses derivative instruments primarily to reduce its exposure to changes in foreign currency exchange rates. Derivative instruments are recognized at fair value in the consolidated balance sheets with changes in fair value recognized in the consolidated statements of operations for all derivatives not designated as hedging instruments.
Fixed Assets
Fixed assets consist of furniture, fixtures and equipment, leasehold improvements, and computer hardware and software and are stated at cost, less accumulated depreciation and amortization. Depreciation is recognized on a straight-line method over the assets’ estimated useful lives, which for leasehold improvements are the lesser of the lease terms or the life of the asset, and
three
to
seven years
for other fixed assets. Fixed assets are reviewed for impairment whenever events or changes in circumstances indicate that the carrying amount of an asset may not be recoverable.
Intangible Assets and Goodwill
The Partnership’s intangible assets consist of acquired contractual rights to earn future fee income, including management and advisory fees, customer relationships, and acquired trademarks. Finite-lived intangible assets are amortized
197
The Carlyle Group L.P.
Notes to the Consolidated Financial Statements
over their estimated useful lives, which range from
five
to
ten years
, and are reviewed for impairment whenever events or changes in circumstances indicate that the carrying amount of the asset may not be recoverable.
Goodwill represents the excess of cost over the identifiable net assets of businesses acquired and is recorded in the functional currency of the acquired entity. Goodwill is recognized as an asset and is reviewed for impairment annually as of October 1st and between annual tests when events and circumstances indicate that impairment may have occurred.
Deferred Revenue
Deferred revenue represents management fees and other revenue received prior to the balance sheet date, which has not yet been earned.
Accumulated Other Comprehensive Income (Loss)
The Partnership’s accumulated other comprehensive income (loss) is comprised of foreign currency translation adjustments and gains and losses on defined benefit plans sponsored by AlpInvest. The components of accumulated other comprehensive income (loss) as of
December 31, 2017 and 2016
were as follows:
|
|
As of December 31,
|
||||||
|
|
2017
|
2016
|
|||||
|
|
(Dollars in millions)
|
||||||
|
Currency translation adjustments
|
$
|
(68.8
|
)
|
$
|
(91.7
|
)
|
|
|
Unrealized losses on defined benefit plans
|
(3.9
|
)
|
(3.5
|
)
|
|||
|
Total
|
$
|
(72.7
|
)
|
$
|
(95.2
|
)
|
|
Foreign Currency Translation
Non-U.S. dollar denominated assets and liabilities are translated at period-end rates of exchange, and the consolidated statements of operations are translated at rates of exchange in effect throughout the period. Foreign currency (gains) losses resulting from transactions outside of the functional currency of an entity of
$(3.9) million
,
$(26.3) million
and
$2.5 million
for
the years ended December 31, 2017, 2016 and 2015
, respectively, are included in general, administrative and other expenses in the consolidated statements of operations.
Recent Accounting Pronouncements
In August 2017, the FASB issued ASU 2017-12,
Derivatives and Hedging (Topic 815) - Targeted Improvements to Accounting for Hedging Activities
. ASU 2017-12, among other things, permits hedge accounting for risk components in hedging relationships to now involve nonfinancial risk components and requires an entity to present the earnings effect of the hedging instrument in the same income statement line item in which the earnings effect of the hedge item is reported. The guidance is effective for the Partnership on January 1, 2019 and requires cash flow hedges and net investment hedges existing at the date of adoption to apply a cumulative effect adjustment to eliminate the measurement of ineffectiveness to accumulated other comprehensive income with a corresponding adjustment to the opening balance of partners’ capital as of the beginning of the fiscal year that an entity adopts the guidance. The amended presentation and disclosure guidance is required only prospectively. Early adoption is permitted. While the Partnership is still assessing the guidance in ASU 2017-12, it does not expect the impact of this guidance to be material.
In January 2017, the FASB issued ASU 2017-1,
Business Combinations (Topic 805) - Clarifying the Definition of a Business
. ASU 2017-01 changes the criteria for determining whether a group of assets acquired is a business. Specifically, when substantially all of the fair value of the gross assets acquired is concentrated in a single identifiable asset or group of similar identifiable assets, the assets acquired would not be considered a business. The guidance is effective for the Partnership on January 1, 2018 and is required to be applied prospectively, however, early adoption is permitted. This guidance will impact the Partnership's analysis of the accounting for any future acquisitions occurring after the date of adoption.
In January 2017, the FASB issued ASU 2017-4,
Intangibles - Goodwill and Other (Topic 350) - Simplifying the Test for Goodwill Impairment
. ASU 2017-04 simplifies an entity’s annual goodwill test for impairment by eliminating the requirement to calculate the implied fair value of goodwill, and instead an entity should compare the fair value of a reporting
198
The Carlyle Group L.P.
Notes to the Consolidated Financial Statements
unit with its carrying amount. The impairment charge will then be the amount by which the carrying amount exceeds the reporting unit’s fair value. An entity would still have the option to perform a qualitative assessment for a reporting unit to determine if the quantitative impairment test is necessary. The guidance is effective for the Partnership on January 1, 2020 and requires the guidance to be applied using a prospective transition method. Early adoption is permitted. The Partnership does not expect the impact of this guidance to be material.
In November 2016, the FASB issued ASU 2016-18,
Statement of Cash Flows (Topic 230) - Restricted Cash
. ASU 2016-18 clarifies the presentation of restricted cash in the statement of cash flows by requiring the amounts described as restricted cash be included with cash and cash equivalents when reconciling the beginning of period and end of period total amounts shown on the statement of cash flows. If cash and cash equivalents and restricted cash are presented separately on the statement of financial position, a reconciliation of these separate line items to the total cash amount included in the statement of cash flows will be required either in the footnotes or on the face of the statement of cash flows. The guidance is effective for the Partnership on January 1, 2018 and ASU 2016-18 requires the guidance to be applied using a retrospective transition method. Early adoption is permitted; however, the Partnership will reflect this change in presentation of restricted cash in its first quarter 2018 consolidated financial statements.
I
n August 2016, the FASB issued ASU 2016-15,
Statement of Cash Flows (Topic 230) - Classification of Certain Cash Receipts and Cash Payments
. ASU 2016-15 clarifies the classification of several discrete cash flow issues, including the treatment of cash distributions from equity method investments. The guidance is effective for the Partnership on January 1, 2018 and ASU 2016-15 requires the guidance to be applied using a retrospective transition method. Early adoption is permitted, provided that all of the amendments for all of the topics are adopted in the same period. The Partnership does not expect the impact of this guidance to its consolidated statements of cash flows to be material.
In June 2016, the FASB issued ASU 2016-13,
Accounting for Financial Instruments - Credit Losses (Topic 326)
. ASU 2016-13 requires an organization to measure all expected credit losses for financial assets held at the reporting date based on historical experience, current conditions, and reasonable and supportable forecasts. Currently, GAAP requires an "incurred loss" methodology that delays recognition until it is probable a loss has been incurred. Under the new standard, the allowance for credit losses must be deducted from the amortized cost of the financial asset to present the net amount expected to be collected. The income statement will reflect the measurement of credit losses for newly recognized financial assets as well as the expected increases or decreases of expected credit losses that have taken place during the period. This provision of the guidance requires a modified retrospective transition method and will result in a cumulative-effect adjustment in retained earnings upon adoption. This guidance is effective for the Partnership on January 1, 2020 and early adoption is permitted. The Partnership is currently assessing the potential impact of this guidance.
In March 2016, the FASB issued ASU 2016-9,
Compensation - Stock Compensation (Topic 718): Improvements to Employee Share-Based Payment Accounting
. ASU 2016-9 changes certain aspects of accounting for share-based payments to employees. ASU 2016-9 requires the income tax effects of awards to be recognized through the income statement when the awards vest or are settled. Previously, an entity was required to determine for each award whether the difference between the deduction for tax purposes and the compensation cost recognized for financial reporting purposes resulted in either an excess tax benefit or a tax deficiency. Excess tax benefits were recognized in partners’ capital, while tax deficiencies were recognized as an offset to accumulated excess tax benefits or in the income statement. Under ASU 2016-9, all excess tax benefits and tax deficiencies are required to be recognized as income tax benefit or expense in the income statement. This provision of the guidance is required to be applied prospectively. Additionally, ASU 2016-9 allows an employer to withhold employee shares upon vest up to maximum statutory tax rates without causing an award to be classified as a liability. This provision of the guidance requires a modified retrospective transition method. Finally, the previous equity-based compensation guidance required cost to be measured based on the number of awards that are expected to vest. Under ASU 2016-9, an accounting policy election can be made to either estimate the number of awards that are expected to vest or account for forfeitures when they occur. This guidance was effective for the Partnership on January 1, 2017. The Partnership adopted this guidance on that date by recording an adjustment for the cumulative effect of adoption in partners' capital on January 1, 2017. The impact of the adjustment was not material to total partners' capital.
In February 2016, the FASB issued ASU 2016-2,
Leases (Topic 842)
. ASU 2016-2 requires lessees to recognize virtually all of their leases on the balance sheet, by recording a right-of-use asset and a lease liability. The lease liability will be measured at the present value of lease payments and the right-of-use asset will be based on the lease liability value, subject to adjustments. Leases can be classified as either operating leases or finance leases. Operating leases will result in straight-line lease expense, while finance leases will result in front-loaded expense. This guidance is effective for the Partnership on
199
The Carlyle Group L.P.
Notes to the Consolidated Financial Statements
January 1, 2019 and ASU 2016-2 requires the guidance to be applied using a modified retrospective method. Early adoption is permitted. The Partnership is currently assessing the potential impact of this guidance, however, the Partnership's total assets and total liabilities on its consolidated balance sheet will increase upon adoption of this guidance.
The FASB issued ASU 2014-9,
Revenue from Contracts with Customers (Topic 606)
(“ASU 2014-9”) in May 2014 and subsequently issued several amendments to the standard. ASU 2014-9, and related amendments, provide comprehensive guidance for recognizing revenue from contracts with customers. Entities will be able to recognize revenue when the entity transfers promised goods or services to customers in an amount that reflects the consideration to which the entity expects to be entitled to in exchange for those goods or services. The guidance includes a five-step framework that requires an entity to: (i) identify the contract(s) with a customer, (ii) identify the performance obligations in the contract, (iii) determine the transaction price, (iv) allocate the transaction price to the performance obligations in the contract, and (v) recognize revenue when the entity satisfies a performance obligation. The guidance in ASU 2014-9, and the related amendments, is effective for the Partnership beginning on January 1, 2018, and the Partnership adopted this guidance on that date.
Upon adoption of ASU 2014-9, performance fees that represent a performance-based capital allocation from fund limited partners to the Partnership (commonly known as “carried interest”, which comprised over
90%
of the Partnership's performance fee revenues for each of the years ended December 31, 2017, 2016 and 2015) will be accounted for as earnings from financial assets within the scope of ASC 323,
Investments - Equity Method and Joint Ventures
, and therefore will not be in the scope of ASU 2014-9. In accordance with ASC 323, the Partnership will record equity method income (losses) as a component of investment income based on the change in our proportionate claim on net assets of the investment fund, including performance-based capital allocations, assuming the investment fund was liquidated as of each reporting date pursuant to each fund's governing agreements. The Partnership will apply this change in accounting on a full retrospective basis. This change in accounting will result in a reclassification from performance fee revenues to investment income (losses).
The Partnership is currently in the process of implementing ASU 2014-9 and its related amendments. The Partnership does not expect significant changes to our historical pattern of recognizing revenue for management fees and performance fees (both for arrangements within the scope of ASC 323 and arrangements within the scope of ASU 2014-9). Additionally, while the determination of who is the customer in a contractual arrangement will be made on a contract-by-contract basis, the Partnership expects that the customer will generally be the investment fund for our significant management and advisory contracts. Also, certain costs incurred on behalf of Carlyle funds, primarily travel and entertainment costs, that were previously presented net in our consolidated statements of operations will be presented gross beginning January 1, 2018. Finally, the Partnership will apply the modified retrospective method for adopting ASU 2014-9 and its related amendments.
3. Fair Value Measurement
The fair value measurement accounting guidance establishes a hierarchal disclosure framework which ranks the observability of market price inputs used in measuring financial instruments at fair value. The observability of inputs is impacted by a number of factors, including the type of financial instrument, the characteristics specific to the financial instrument and the state of the marketplace, including the existence and transparency of transactions between market participants. Financial instruments with readily available quoted prices, or for which fair value can be measured from quoted prices in active markets, will generally have a higher degree of market price observability and a lesser degree of judgment applied in determining fair value.
Financial instruments measured and reported at fair value are classified and disclosed based on the observability of inputs used in the determination of fair values, as follows:
Level I
– inputs to the valuation methodology are quoted prices available in active markets for identical instruments as of the reporting date. The type of financial instruments included in Level I include unrestricted securities, including equities and derivatives, listed in active markets. The Partnership does not adjust the quoted price for these instruments, even in situations where the Partnership holds a large position and a sale could reasonably impact the quoted price.
Level II
– inputs to the valuation methodology are other than quoted prices in active markets, which are either directly or indirectly observable as of the reporting date. The type of financial instruments in this category includes less liquid and restricted securities listed in active markets, securities traded in other than active markets, government and agency securities, and certain over-the-counter derivatives where the fair value is based on observable inputs.
Level III
– inputs to the valuation methodology are unobservable and significant to overall fair value measurement. The inputs into the determination of fair value require significant management judgment or estimation. Financial instruments
200
The Carlyle Group L.P.
Notes to the Consolidated Financial Statements
that are included in this category include investments in privately-held entities, non-investment grade residual interests in securitizations, collateralized loan obligations, and certain over-the-counter derivatives where the fair value is based on unobservable inputs.
In certain cases, the inputs used to measure fair value may fall into different levels of the fair value hierarchy. In such cases, the determination of which category within the fair value hierarchy is appropriate for any given financial instrument is based on the lowest level of input that is significant to the fair value measurement. The Partnership’s assessment of the significance of a particular input to the fair value measurement in its entirety requires judgment and considers factors specific to the financial instrument.
In certain cases, debt and equity securities are valued on the basis of prices from an orderly transaction between market participants provided by reputable dealers or pricing services. In determining the value of a particular investment, pricing services may use certain information with respect to transactions in such investments, quotations from dealers, pricing matrices, market transactions in comparable investments and various relationships between investments.
The following table summarizes the Partnership’s assets and liabilities measured at fair value on a recurring basis by the above fair value hierarchy levels as of
December 31, 2017
:
|
(Dollars in millions)
|
Level I
|
|
Level II
|
|
Level III
|
|
Total
|
||||||||
|
Assets
|
|||||||||||||||
|
Investments of Consolidated Funds:
|
|||||||||||||||
|
Equity securities
|
$
|
—
|
|
$
|
—
|
|
$
|
7.9
|
|
$
|
7.9
|
|
|||
|
Bonds
|
—
|
|
—
|
|
413.4
|
|
413.4
|
|
|||||||
|
Loans
|
—
|
|
—
|
|
4,112.7
|
|
4,112.7
|
|
|||||||
|
Other
|
—
|
|
—
|
|
0.3
|
|
0.3
|
|
|||||||
|
—
|
|
—
|
|
4,534.3
|
|
4,534.3
|
|
||||||||
|
Investments in CLOs and other
|
—
|
|
—
|
|
405.4
|
|
405.4
|
|
|||||||
|
Corporate treasury investments
|
|||||||||||||||
|
Bonds
|
—
|
|
194.1
|
|
—
|
|
194.1
|
|
|||||||
|
Commercial paper and other
|
—
|
|
182.2
|
|
—
|
|
182.2
|
|
|||||||
|
—
|
|
376.3
|
|
—
|
|
376.3
|
|
||||||||
|
Foreign currency forward contracts
|
—
|
|
0.4
|
|
—
|
|
0.4
|
|
|||||||
|
Total
|
$
|
—
|
|
$
|
376.7
|
|
$
|
4,939.7
|
|
$
|
5,316.4
|
|
|||
|
Liabilities
|
|||||||||||||||
|
Loans payable of Consolidated Funds
(1)
|
$
|
—
|
|
$
|
—
|
|
$
|
4,303.8
|
|
$
|
4,303.8
|
|
|||
|
Contingent consideration
|
—
|
|
—
|
|
1.0
|
|
1.0
|
|
|||||||
|
Foreign currency forward contracts
|
—
|
|
1.2
|
|
—
|
|
1.2
|
|
|||||||
|
Total
|
$
|
—
|
|
$
|
1.2
|
|
$
|
4,304.8
|
|
$
|
4,306.0
|
|
|||
|
(1)
|
Senior and subordinated notes issued by CLO vehicles are classified based on the more observable fair value of the CLO financial assets, less (i) the fair value of any beneficial interests held by the Partnership and (ii) the carrying value of any beneficial interests that represent compensation for services.
|
201
The Carlyle Group L.P.
Notes to the Consolidated Financial Statements
The following table summarizes the Partnership’s assets and liabilities measured at fair value on a recurring basis by the above fair value hierarchy levels as of
December 31, 2016
:
|
(Dollars in millions)
|
Level I
|
Level II
|
Level III
|
Total
|
|||||||||||
|
Assets
|
|||||||||||||||
|
Investments of Consolidated Funds:
|
|||||||||||||||
|
Equity securities
|
$
|
—
|
|
$
|
—
|
|
$
|
10.3
|
|
$
|
10.3
|
|
|||
|
Bonds
|
—
|
|
—
|
|
396.4
|
|
396.4
|
|
|||||||
|
Loans
|
—
|
|
—
|
|
3,485.6
|
|
3,485.6
|
|
|||||||
|
Other
|
—
|
|
—
|
|
1.4
|
|
1.4
|
|
|||||||
|
—
|
|
—
|
|
3,893.7
|
|
3,893.7
|
|
||||||||
|
Investments in CLOs and other
|
—
|
|
—
|
|
152.6
|
|
152.6
|
|
|||||||
|
Corporate treasury investments
|
|
|
|
|
|
|
|
|
|||||||
|
Bonds
|
—
|
|
91.3
|
|
—
|
|
91.3
|
|
|||||||
|
Commercial paper and other
|
—
|
|
98.9
|
|
—
|
|
98.9
|
|
|||||||
|
—
|
|
190.2
|
|
—
|
|
190.2
|
|
||||||||
|
Foreign currency forward contracts
|
—
|
|
2.5
|
|
—
|
|
2.5
|
|
|||||||
|
Total
|
$
|
—
|
|
$
|
192.7
|
|
$
|
4,046.3
|
|
$
|
4,239.0
|
|
|||
|
Liabilities
|
|||||||||||||||
|
Loans payable of Consolidated Funds
(1)
|
$
|
—
|
|
$
|
—
|
|
$
|
3,866.3
|
|
$
|
3,866.3
|
|
|||
|
Contingent consideration
|
—
|
|
—
|
|
1.5
|
|
1.5
|
|
|||||||
|
Loans payable of a real estate VIE
|
—
|
|
—
|
|
79.4
|
|
79.4
|
|
|||||||
|
Foreign currency forward contracts
|
—
|
|
10.0
|
|
—
|
|
10.0
|
|
|||||||
|
Total
|
$
|
—
|
|
$
|
10.0
|
|
$
|
3,947.2
|
|
$
|
3,957.2
|
|
|||
|
(1)
|
Senior and subordinated notes issued by CLO vehicles are classified based on the more observable fair value of the CLO financial assets, less (i) the fair value of any beneficial interests held by the Partnership and (ii) the carrying value of any beneficial interests that represent compensation for services.
|
There were no transfers from Level II to Level I during the year ended
December 31, 2017
and
2016
.
Investment professionals with responsibility for the underlying investments are responsible for preparing the investment valuations pursuant to the policies, methodologies and templates prepared by the Partnership’s valuation group, which is a team made up of dedicated valuation professionals reporting to the Partnership’s chief accounting officer. The valuation group is responsible for maintaining the Partnership’s valuation policy and related guidance, templates and systems that are designed to be consistent with the guidance found in ASC 820,
Fair Value Measurement
. These valuations, inputs and preliminary conclusions are reviewed by the fund accounting teams. The valuations are then reviewed and approved by the respective fund valuation subcommittees, which are comprised of the respective fund head(s), segment head, chief financial officer and chief accounting officer, as well as members of the valuation group. The valuation group compiles the aggregate results and significant matters and presents them for review and approval by the global valuation committee, which is comprised of the Partnership’s co-executive chairman of the board, chairman emeritus, co-chief executive officers, chief risk officer, chief financial officer, chief accounting officer, co-chief investment officer, the business segment heads, and observed by the chief compliance officer, the director of internal audit and the Partnership’s audit committee. Additionally, each quarter a sample of valuations are reviewed by external valuation firms.
In the absence of observable market prices, the Partnership values its investments using valuation methodologies applied on a consistent basis. For some investments little market activity may exist. Management’s determination of fair value is then based on the best information available in the circumstances and may incorporate management’s own assumptions and involves a significant degree of judgment, taking into consideration a combination of internal and external factors, including the appropriate risk adjustments for non-performance and liquidity risks. Investments for which market prices are not observable include private
202
The Carlyle Group L.P.
Notes to the Consolidated Financial Statements
investments in the equity of operating companies and real estate properties, and certain debt positions. The valuation technique for each of these investments is described below:
Private Equity and Real Estate Investments
– The fair values of private equity investments are determined by reference to projected net earnings, earnings before interest, taxes, depreciation and amortization (“EBITDA”), the discounted cash flow method, public market or private transactions, valuations for comparable companies or sales of comparable assets, and other measures which, in many cases, are unaudited at the time received. The methods used to estimate the fair value of real estate investments include the discounted cash flow method and/or capitalization rate (“cap rate”) analysis. Valuations may be derived by reference to observable valuation measures for comparable companies or transactions (e.g., applying a key performance metric of the investment such as EBITDA or net operating income to a relevant valuation multiple or cap rate observed in the range of comparable companies or transactions), adjusted by management for differences between the investment and the referenced comparables, and in some instances by reference to option pricing models or other similar models. Adjustments to observable valuation measures are frequently made upon the initial investment to calibrate the initial investment valuation to industry observable inputs. Such adjustments are made to align the investment to observable industry inputs for differences in size, profitability, projected growth rates, geography and capital structure if applicable. The adjustments are reviewed with each subsequent valuation to assess how the investment has evolved relative to the observable inputs. Additionally, the investment may be subject to certain specific risks and/or development milestones which are also taken into account in the valuation assessment. Option pricing models and similar tools do not currently drive a significant portion of private equity or real estate valuations and are used primarily to value warrants, derivatives, certain restrictions and other atypical investment instruments.
Credit-Oriented Investments
– The fair values of credit-oriented investments (including corporate treasury investments) are generally determined on the basis of prices between market participants provided by reputable dealers or pricing services. In determining the value of a particular investment, pricing services may use certain information with respect to transactions in such investments, quotations from dealers, pricing matrices, market transactions in comparable investments and various relationships between investments. Specifically, for investments in distressed debt and corporate loans and bonds, the fair values are generally determined by valuations of comparable investments. In some instances, the Partnership may utilize other valuation techniques, including the discounted cash flow method.
CLO Investments and CLO Loans Payable
– The Partnership measures the financial liabilities of its consolidated CLOs based on the fair value of the financial assets of its consolidated CLOs, as the Partnership believes the fair value of the financial assets are more observable. The fair values of the CLO loan and bond assets are primarily based on quotations from reputable dealers or relevant pricing services. In situations where valuation quotations are unavailable, the assets are valued based on similar securities, market index changes, and other factors. The Partnership corroborates quotations from pricing services either with other available pricing data or with its own models. Generally, the loan and bond assets of the CLOs are not actively traded and are classified as Level III. The fair values of the CLO structured asset positions are determined based on both discounted cash flow analyses and third party quotes. Those analyses consider the position size, liquidity, current financial condition of the CLOs, the third party financing environment, reinvestment rates, recovery lags, discount rates and default forecasts and are compared to broker quotations from market makers and third party dealers.
The Partnership measures the CLO loan payables held by third party beneficial interest holders on the basis of the fair value of the financial assets of the CLO and the beneficial interests held by the Partnership. The Partnership continues to measure the CLO loans payable that it holds at fair value based on both discounted cash flow analyses and third party quotes, as described above.
Loans Payable of a Real Estate VIE
– Prior to September 30, 2017, the Partnership elected the fair value option to measure the loans payable of a real estate VIE at fair value. The fair values of the loans were primarily based on discounted cash flow analyses, which considered the liquidity and current financial condition of the real estate VIE. These loans were classified as Level III.
Fund Investments
– The Partnership’s investments in external funds are valued based on its proportionate share of the net assets provided by the third party general partners of the underlying fund partnerships based on the most recent available information which typically has a lag of up to
90 days
. The terms of the investments generally preclude the ability to redeem the investment. Distributions from these investments will be received as the underlying assets in the funds are liquidated, the timing of which cannot be readily determined.
203
The Carlyle Group L.P.
Notes to the Consolidated Financial Statements
The changes in financial instruments measured at fair value for which the Partnership has used Level III inputs to determine fair value are as follows (Dollars in millions):
|
|
Financial Assets Year Ended December 31, 2017
|
||||||||||||||||||||||
|
Investments of Consolidated Funds
|
Investments in CLOs and other
|
Total
|
|||||||||||||||||||||
|
Equity
securities |
Bonds
|
Loans
|
Other
|
||||||||||||||||||||
|
Balance, beginning of period
|
$
|
10.3
|
|
$
|
396.4
|
|
$
|
3,485.6
|
|
$
|
1.4
|
|
$
|
152.6
|
|
$
|
4,046.3
|
|
|||||
|
Purchases
|
0.1
|
|
280.6
|
|
2,594.3
|
|
—
|
|
255.8
|
|
3,130.8
|
|
|||||||||||
|
Sales and distributions
|
(27.0
|
)
|
(310.9
|
)
|
(1,223.9
|
)
|
(3.0
|
)
|
(28.2
|
)
|
(1,593.0
|
)
|
|||||||||||
|
Settlements
|
—
|
|
—
|
|
(1,084.1
|
)
|
—
|
|
—
|
|
(1,084.1
|
)
|
|||||||||||
|
Realized and unrealized gains (losses), net
|
|||||||||||||||||||||||
|
Included in earnings
|
23.5
|
|
(7.5
|
)
|
16.6
|
|
1.7
|
|
12.2
|
|
46.5
|
|
|||||||||||
|
Included in other comprehensive income
|
1.0
|
|
54.8
|
|
324.2
|
|
0.2
|
|
13.0
|
|
393.2
|
|
|||||||||||
|
Balance, end of period
|
$
|
7.9
|
|
$
|
413.4
|
|
$
|
4,112.7
|
|
$
|
0.3
|
|
$
|
405.4
|
|
$
|
4,939.7
|
|
|||||
|
Changes in unrealized gains (losses) included in earnings related to financial assets still held at the reporting date
|
$
|
6.7
|
|
$
|
(5.0
|
)
|
$
|
18.5
|
|
$
|
—
|
|
$
|
11.3
|
|
$
|
31.5
|
|
|||||
|
|
Financial Assets Year Ended December 31, 2016
|
||||||||||||||||||||||||||||||
|
|
Investments of Consolidated Funds
|
Investments in CLOs and other
|
Restricted
securities of Consolidated Funds |
Total
|
|||||||||||||||||||||||||||
|
|
Equity
securities |
Bonds
|
Loans
|
Partnership
and LLC interests (2) |
Other
|
||||||||||||||||||||||||||
|
Balance, beginning of period
|
$
|
575.3
|
|
$
|
1,180.9
|
|
$
|
15,686.7
|
|
$
|
59.6
|
|
$
|
5.0
|
|
$
|
1.4
|
|
$
|
8.7
|
|
$
|
17,517.6
|
|
|||||||
|
Deconsolidation of funds
(1)
|
(562.1
|
)
|
(890.7
|
)
|
(13,506.9
|
)
|
(74.3
|
)
|
(5.0
|
)
|
123.8
|
|
(8.7
|
)
|
(14,923.9
|
)
|
|||||||||||||||
|
Purchases
|
12.2
|
|
268.8
|
|
2,446.7
|
|
12.4
|
|
—
|
|
25.9
|
|
—
|
|
2,766.0
|
|
|||||||||||||||
|
Sales and distributions
|
(5.1
|
)
|
(152.0
|
)
|
(356.7
|
)
|
—
|
|
—
|
|
(7.8
|
)
|
—
|
|
(521.6
|
)
|
|||||||||||||||
|
Settlements
|
—
|
|
—
|
|
(771.1
|
)
|
—
|
|
—
|
|
—
|
|
—
|
|
(771.1
|
)
|
|||||||||||||||
|
Realized and unrealized gains (losses), net
|
|||||||||||||||||||||||||||||||
|
Included in earnings
|
(9.7
|
)
|
4.3
|
|
52.7
|
|
2.3
|
|
1.5
|
|
29.1
|
|
—
|
|
80.2
|
|
|||||||||||||||
|
Included in other comprehensive
|
(0.3
|
)
|
(14.9
|
)
|
(65.8
|
)
|
—
|
|
(0.1
|
)
|
(19.8
|
)
|
—
|
|
(100.9
|
)
|
|||||||||||||||
|
Balance, end of period
|
$
|
10.3
|
|
$
|
396.4
|
|
$
|
3,485.6
|
|
$
|
—
|
|
$
|
1.4
|
|
$
|
152.6
|
|
$
|
—
|
|
$
|
4,046.3
|
|
|||||||
|
Changes in unrealized gains (losses) included in earnings related to financial assets still held at the reporting date
|
$
|
(9.5
|
)
|
$
|
2.8
|
|
$
|
41.2
|
|
$
|
—
|
|
$
|
1.5
|
|
$
|
29.1
|
|
$
|
—
|
|
$
|
65.1
|
|
|||||||
|
(1)
|
As a result of the adoption of ASU 2015-2 and the deconsolidation of certain CLOs on January 1, 2016,
$123.8 million
of investments that the Partnership held in those CLOs were no longer eliminated in consolidation and were included in investments in CLOs and other for the year ended December 31, 2016.
|
|
(2)
|
As a result of the retrospective adoption of ASU 2015-7, the beginning balance of Partnership and LLC interests that are measured at fair value using the NAV per share practical expedient have been revised to reflect their exclusion from the fair value hierarchy.
|
204
The Carlyle Group L.P.
Notes to the Consolidated Financial Statements
|
|
Financial Liabilities Year Ended December 31, 2017
|
||||||||||||||
|
|
Loans Payable
of Consolidated Funds |
Contingent
Consideration |
Loans Payable of
a real estate VIE |
Total
|
|||||||||||
|
Balance, beginning of period
|
$
|
3,866.3
|
|
$
|
1.5
|
|
$
|
79.4
|
|
$
|
3,947.2
|
|
|||
|
Borrowings
|
2,314.3
|
|
—
|
|
—
|
|
2,314.3
|
|
|||||||
|
Paydowns
|
(2,167.1
|
)
|
(0.7
|
)
|
(14.3
|
)
|
(2,182.1
|
)
|
|||||||
|
Deconsolidation of a real estate VIE
|
—
|
|
—
|
|
(72.6
|
)
|
(72.6
|
)
|
|||||||
|
Realized and unrealized (gains) losses, net
|
|||||||||||||||
|
Included in earnings
|
(61.5
|
)
|
0.1
|
|
3.3
|
|
(58.1
|
)
|
|||||||
|
Included in other comprehensive income
|
351.8
|
|
0.1
|
|
4.2
|
|
356.1
|
|
|||||||
|
Balance, end of period
|
$
|
4,303.8
|
|
$
|
1.0
|
|
$
|
—
|
|
$
|
4,304.8
|
|
|||
|
Changes in unrealized (gains) losses included in earnings related to financial liabilities still held at the reporting date
|
$
|
(57.0
|
)
|
$
|
0.1
|
|
$
|
—
|
|
$
|
(56.9
|
)
|
|||
|
|
Financial Liabilities Year Ended December 31, 2016
|
||||||||||||||||||
|
|
Loans Payable
of Consolidated Funds |
Derivative
Instruments of Consolidated Funds |
Contingent
Consideration |
Loans Payable of
a consolidated real estate VIE |
Total
|
||||||||||||||
|
Balance, beginning of period
|
$
|
17,046.7
|
|
$
|
29.1
|
|
$
|
20.8
|
|
$
|
75.4
|
|
$
|
17,172.0
|
|
||||
|
Initial consolidation/deconsolidation of funds
|
(13,742.6
|
)
|
(29.0
|
)
|
—
|
|
—
|
|
(13,771.6
|
)
|
|||||||||
|
Borrowings
|
1,336.7
|
|
—
|
|
—
|
|
—
|
|
1,336.7
|
|
|||||||||
|
Paydowns
|
(742.5
|
)
|
—
|
|
(10.3
|
)
|
(34.5
|
)
|
(787.3
|
)
|
|||||||||
|
Sales
|
—
|
|
(1.7
|
)
|
—
|
|
—
|
|
(1.7
|
)
|
|||||||||
|
Realized and unrealized (gains) losses, net
|
|||||||||||||||||||
|
Included in earnings
|
40.4
|
|
1.6
|
|
(9.0
|
)
|
19.8
|
|
52.8
|
|
|||||||||
|
Included in other comprehensive income
|
(72.4
|
)
|
—
|
|
—
|
|
18.7
|
|
(53.7
|
)
|
|||||||||
|
Balance, end of period
|
$
|
3,866.3
|
|
$
|
—
|
|
$
|
1.5
|
|
$
|
79.4
|
|
$
|
3,947.2
|
|
||||
|
Changes in unrealized (gains) losses included in earnings related to financial liabilities still held at the reporting date
|
$
|
37.6
|
|
$
|
—
|
|
$
|
(0.1
|
)
|
$
|
19.8
|
|
$
|
57.3
|
|
||||
Realized and unrealized gains and losses included in earnings for Level III investments for investments in CLOs and other investments are included in investment income (loss), and such gains and losses for investments of Consolidated Funds and loans payable and derivative instruments of the CLOs are included in net investment gains (losses) of Consolidated Funds in the consolidated statements of operations.
Realized and unrealized gains and losses included in earnings for Level III contingent consideration liabilities are included in other non-operating expense (income), and such gains and losses for loans payable of a real estate VIE are included in interest and other expenses of a real estate VIE in the consolidated statement of operations.
Gains and losses included in other comprehensive income for all Level III financial asset and liabilities are included in accumulated other comprehensive loss, non-controlling interests in consolidated entities and non-controlling interests in Carlyle Holdings in the consolidated balance sheets.
205
The Carlyle Group L.P.
Notes to the Consolidated Financial Statements
The following table summarizes quantitative information about the Partnership’s Level III inputs as of
December 31, 2017
:
|
Fair Value at
|
Range
(Weighted Average) |
||||||||
|
(Dollars in millions)
|
December 31, 2017
|
Valuation Technique(s)
|
Unobservable Input(s)
|
||||||
|
Assets
|
|||||||||
|
Investments of Consolidated Funds:
|
|||||||||
|
Equity securities
|
$
|
5.7
|
|
Discounted Cash Flow
|
Discount Rates
|
10% - 10% (10%)
|
|||
|
|
|
|
|
|
|||||
|
2.2
|
|
Consensus Pricing
|
Indicative Quotes
($ per share) |
0 - 33 (30)
|
|||||
|
|
|
|
|||||||
|
Bonds
|
413.4
|
|
Consensus Pricing
|
Indicative Quotes (% of Par)
|
44 - 107 (98)
|
||||
|
Loans
|
4,112.7
|
|
Consensus Pricing
|
Indicative Quotes (% of Par)
|
64 - 103 (100)
|
||||
|
Other
|
0.3
|
|
Counterparty Pricing
|
Indicative Quotes
(% of Notional Amount) |
9 - 9 (9)
|
||||
|
4,534.3
|
|
|
|
|
|||||
|
Investments in CLOs and other
|
|
|
|
||||||
|
Senior secured notes
|
357.2
|
|
Discounted Cash Flow with Consensus Pricing
|
Discount Rate
|
1% - 9% (3%)
|
||||
|
|
Default Rates
|
1% - 3% (2%)
|
|||||||
|
|
Recovery Rates
|
50% - 70% (60%)
|
|||||||
|
|
Indicative Quotes (% of Par)
|
98 - 104 (101)
|
|||||||
|
Subordinated notes and preferred shares
|
48.2
|
|
Discounted Cash Flow with Consensus Pricing
|
Discount Rate
|
8% - 11% (9%)
|
||||
|
|
Default Rates
|
1% - 3% (2%)
|
|||||||
|
|
Recovery Rates
|
50% - 70% (60%)
|
|||||||
|
|
Indicative Quotes (% of Par)
|
63 - 97 (81)
|
|||||||
|
Total
|
$
|
4,939.7
|
|
|
|
|
|||
|
Liabilities
|
|
|
|
||||||
|
Loans payable of Consolidated Funds:
|
|
|
|
||||||
|
Senior secured notes
|
$
|
4,100.5
|
|
Other
|
N/A
|
N/A
|
|||
|
Subordinated notes and preferred shares
|
26.9
|
|
Other
|
N/A
|
N/A
|
||||
|
176.4
|
|
Discounted Cash Flow with Consensus Pricing
|
Discount Rates
|
8% - 11% (10%)
|
|||||
|
|
Default Rates
|
1% - 3% (2%)
|
|||||||
|
|
Recovery Rates
|
50% - 70% (60%)
|
|||||||
|
|
Indicative Quotes (% of Par)
|
79 - 93 (86)
|
|||||||
|
Contingent consideration
|
1.0
|
|
Other
|
N/A
|
N/A
|
||||
|
Total
|
$
|
4,304.8
|
|
||||||
206
The Carlyle Group L.P.
Notes to the Consolidated Financial Statements
The following table summarizes quantitative information about the Partnership’s Level III inputs as of
December 31, 2016
:
|
(Dollars in millions)
|
Fair Value at
December 31, 2016 |
Valuation Technique(s)
|
Unobservable Input(s)
|
Range
(Weighted Average) |
|||||
|
Assets
|
|||||||||
|
Investments of Consolidated Funds:
|
|||||||||
|
Equity securities
|
$
|
9.6
|
|
Discounted Cash Flow
|
Discount Rates
|
9% - 10% (9%)
|
|||
|
|
Exit Cap Rate
|
7% - 9% (7%)
|
|||||||
|
0.7
|
|
Consensus Pricing
|
Indicative Quotes
($ per share) |
10 - 10 (10)
|
|||||
|
|
|
|
|||||||
|
Bonds
|
396.4
|
|
Consensus Pricing
|
Indicative Quotes (% of Par)
|
74 - 108 (99)
|
||||
|
Loans
|
3,485.6
|
|
Consensus Pricing
|
Indicative Quotes (% of Par)
|
31 - 102 (99)
|
||||
|
Other
|
1.4
|
|
Counterparty Pricing
|
Indicative Quotes
(% of Notional Amount) |
6 - 8 (7)
|
||||
|
3,893.7
|
|
|
|
|
|||||
|
Senior secured notes
|
115.9
|
|
Discounted Cash Flow with Consensus Pricing
|
Discount Rate
|
1% - 11% (2%)
|
||||
|
|
Default Rates
|
1% - 3% (2%)
|
|||||||
|
|
Recovery Rates
|
50% - 74% (71%)
|
|||||||
|
|
Indicative Quotes (% of Par)
|
82 - 102 (99)
|
|||||||
|
Subordinated notes and preferred shares
|
35.4
|
|
Discounted Cash Flow with Consensus Pricing
|
Discount Rate
|
9% - 14% (12%)
|
||||
|
|
Default Rates
|
1% - 10% (2%)
|
|||||||
|
|
Recovery Rates
|
50% - 74% (64%)
|
|||||||
|
|
Indicative Quotes (% of Par)
|
2 - 101 (96)
|
|||||||
|
Other
|
1.3
|
|
Comparable Multiple
|
LTM EBITDA Multiple
|
5.7x - 5.7x (5.7x)
|
||||
|
Total
|
$
|
4,046.3
|
|
|
|
|
|||
|
Liabilities
|
|
|
|
||||||
|
Loans payable of Consolidated Funds:
|
|
|
|
||||||
|
Senior secured notes
(1)
|
3,672.5
|
|
Other
|
N/A
|
N/A
|
||||
|
Subordinated notes and preferred shares
(1)
|
26.9
|
|
Other
|
N/A
|
N/A
|
||||
|
166.9
|
|
Discounted Cash Flow with Consensus Pricing
|
Discount Rates
|
9% - 14% (12%)
|
|||||
|
|
Default Rates
|
1% - 3% (2%)
|
|||||||
|
|
Recovery Rates
|
50% - 74% (66%)
|
|||||||
|
|
Indicative Quotes (% of Par)
|
7 - 90 (68)
|
|||||||
|
Loans payable of a real estate VIE
|
79.4
|
|
Discounted Cash Flow
|
Discount to Expected Payment
|
10% - 55% (37%)
|
||||
|
|
Discount Rate
|
20% - 30% (23%)
|
|||||||
|
Contingent consideration
|
1.5
|
|
Other
|
N/A
|
N/A
|
||||
|
Total
|
$
|
3,947.2
|
|
||||||
|
(1)
|
Beginning on January 1, 2016, CLO loan payables held by third party beneficial interest holders are measured on the basis of fair value of the financial assets of the CLOs and the beneficial interests held by the Partnership.
|
The significant unobservable inputs used in the fair value measurement of the Partnership’s investments in equity securities include indicative quotes, discount rates and exit cap rates. Significant decreases in indicative quotes in isolation would result in a significantly lower fair value measurement. Significant increases in discount rates and exit cap rates in isolation would result in a significantly lower fair value measurement.
207
The Carlyle Group L.P.
Notes to the Consolidated Financial Statements
The significant unobservable inputs used in the fair value measurement of the Partnership’s investments in bonds and loans are indicative quotes. Significant decreases in indicative quotes in isolation would result in a significantly lower fair value measurement.
The significant unobservable inputs used in the fair value measurement of the Partnership’s investments in CLOs and other investments include EBITDA multiples, discount rates, default rates, recovery rates and indicative quotes. Significant decreases in EBITDA multiples, recovery rates or indicative quotes in isolation would result in a significantly lower fair value measurement. Significant increases in discount rates or default rates in isolation would result in a significantly lower fair value measurement.
The significant unobservable inputs used in the fair value measurement of the Partnership’s loans payable of Consolidated Funds are discount rates, default rates, recovery rates and indicative quotes. Significant increases in discount rates or default rates in isolation would result in a significantly lower fair value measurement, while a significant increase in recovery rates and indicative quotes in isolation would result in a significantly higher fair value.
4. Accrued Performance Fees
The components of accrued performance fees are as follows:
|
|
As of December 31,
|
||||||
|
|
2017
|
2016
|
|||||
|
|
(Dollars in millions)
|
||||||
|
Corporate Private Equity
|
$
|
2,272.4
|
|
$
|
1,375.4
|
|
|
|
Real Assets
|
657.5
|
|
483.4
|
|
|||
|
Global Credit
|
56.1
|
|
68.6
|
|
|||
|
Investment Solutions
|
684.6
|
|
553.7
|
|
|||
|
Total
|
$
|
3,670.6
|
|
$
|
2,481.1
|
|
|
Approximately
19%
of accrued performance fees at
December 31, 2017
are related to Carlyle Partners VI,
one
of the Partnership’s Corporate Private Equity funds.
Approximately
27%
of accrued performance fees at
December 31, 2016
are related to Carlyle Partners V, L.P. and Carlyle Asia Partners III, L.P.,
two
of the Partnership’s Corporate Private Equity funds.
Accrued performance fees are shown gross of the Partnership’s accrued performance fee-related compensation (see Note 8), and accrued giveback obligations, which are separately presented in the consolidated balance sheets. The components of the accrued giveback obligations are as follows:
|
|
As of December 31,
|
||||||
|
|
2017
|
2016
|
|||||
|
|
(Dollars in millions)
|
||||||
|
Corporate Private Equity
|
$
|
(8.7
|
)
|
$
|
(3.9
|
)
|
|
|
Real Assets
|
(58.1
|
)
|
(156.9
|
)
|
|||
|
Total
|
$
|
(66.8
|
)
|
$
|
(160.8
|
)
|
|
During the year ended
December 31, 2017
, the Partnership paid
$98.4 million
to satisfy giveback obligations related to
two
of its Real Assets funds. Approximately
$67.1 million
of these obligations was paid by current and former senior Carlyle professionals and
$31.3 million
by Carlyle Holdings.
During the year ended
December 31, 2016
, the Partnership paid
$47.3 million
to satisfy a giveback obligation related to
one
of its Corporate Private Equity funds. Substantially all of the giveback obligation was paid by current and former senior Carlyle professionals.
208
The Carlyle Group L.P.
Notes to the Consolidated Financial Statements
Performance Fees
The performance fees included in revenues are derived from the following segments:
|
|
Year Ended December 31,
|
||||||||||
|
|
2017
|
2016
|
2015
|
||||||||
|
|
(Dollars in millions)
|
||||||||||
|
Corporate Private Equity
|
$
|
1,629.6
|
|
$
|
289.6
|
|
$
|
698.2
|
|
||
|
Global Credit
|
56.6
|
|
37.4
|
|
(41.0
|
)
|
|||||
|
Real Assets
|
265.2
|
|
321.1
|
|
49.3
|
|
|||||
|
Investment Solutions
|
142.5
|
|
103.7
|
|
118.4
|
|
|||||
|
Total
|
$
|
2,093.9
|
|
$
|
751.8
|
|
$
|
824.9
|
|
||
Approximately
61%
, or
$1,273.2 million
, of performance fees for the year ended
December 31, 2017
are related to the following funds along with total revenue recognized (total revenue includes performance fees, fund management fees, and investment income):
•
Carlyle Partners V, L.P. (Corporate Private Equity segment) -
$335.1 million
,
•
Carlyle Partners VI, L.P. (Corporate Private Equity segment) -
$844.5 million
, and
•
Carlyle Asia Partners IV, L.P. (Corporate Private Equity segment) -
$381.8 million
.
Approximately
28%
, or
$214.2 million
, of performance fees for the year ended
December 31, 2016
are related to the following funds along with total revenue recognized (total revenue includes performance fees, fund management fees, and investment income):
•
Carlyle Partners V, L.P. (Corporate Private Equity segment) -
$194.4 million
, and
•
Carlyle Realty Partners VII, L.P. (Real Assets segment) -
$138.7 million
.
Approximately
51%
, or
$422.1 million
, of performance fees for the year ended
December 31, 2015
are related to the following funds along with total revenue recognized (total revenue includes performance fees, fund management fees, and investment income for the following funds):
•
Carlyle Europe Partners III, L.P. (Corporate Private Equity segment) -
$273.4 million
,
•
Carlyle Asia Partners III, L.P. (Corporate Private Equity segment) -
$202.7 million
,
•
Carlyle Realty Partners VI, L.P. (Real Assets segment) -
$116.4 million
, and
•
Carlyle/Riverstone Global Energy and Power Fund III, L.P. (Real Assets segment) -
$(102.6) million
.
5. Investments
Investments consist of the following:
|
|
As of December 31,
|
||||||
|
|
2017
|
2016
|
|||||
|
|
(Dollars in millions)
|
||||||
|
Equity method investments, excluding accrued performance fees
|
$
|
1,218.4
|
|
$
|
950.9
|
|
|
|
Investments in CLOs and other
|
405.9
|
|
156.1
|
|
|||
|
Total investments
|
$
|
1,624.3
|
|
$
|
1,107.0
|
|
|
209
The Carlyle Group L.P.
Notes to the Consolidated Financial Statements
Strategic Investment in NGP
In December 2012, the Partnership entered into an agreement with ECM Capital, L.P. (“ECM”) and Barclays Natural Resource Investments, a division of Barclays Bank PLC (“BNRI”), to make an investment in NGP Management Company, L.L.C. (“NGP Management” and, together with its affiliates, “NGP”), an Irving, Texas-based energy investor. The agreement was amended in March 2017 to further align the interests of the Partnership and NGP. The Partnership’s equity interests in NGP Management entitle the Partnership to an allocation of income equal to
55.0%
of the management fee-related revenues of the NGP entities that serve as the advisors to certain private equity funds, and future interests in the general partners of certain future carry funds advised by NGP that entitle the Partnership to an allocation of income equal to
47.5%
of the carried interest received by such fund general partners.
In consideration for these interests, the Partnership paid an aggregate of
$504.6 million
in cash to ECM and BNRI, and issued
996,572
Carlyle Holdings partnership units to ECM that vest ratably through 2017. In January 2016, the Partnership also paid contingent consideration to BNRI of
$183.0 million
, of which
$63.0 million
was paid in cash and
$120.0 million
was paid by the Partnership by issuing a promissory note due in 2022 (see Note 7). The transaction also included contingent consideration payable to ECM of up to
$45.0 million
in cash (of which
$22.5 million
was paid in March 2017 with the balance paid in January 2018), together with an additional
$15.0 million
in cash, which was paid in January 2018, and
597,944
Carlyle Holdings partnership units that were issued in December 2012 and substantially vested upon the amendment in March 2017. The Partnership has also agreed to issue common units on each of February 1, 2018, 2019, and 2020, with a value of
$10.0 million
per year to an affiliate of NGP Management, and subsequent to 2020, to issue common units on an annual basis with a value not to exceed
$10.0 million
per year based on a prescribed formula, which will vest over a
42
-month period. The Partnership has the right to purchase the remaining equity interests in NGP Management in specific remote situations designed to protect the Partnership's interest.
The Partnership accounts for its investments in NGP under the equity method of accounting. The Partnership recorded its investments in NGP initially at cost, excluding any elements in the transaction that were deemed to be compensatory arrangements to NGP personnel. The Carlyle Holdings partnership units issued in the transaction and the deferred restricted common units (which were granted in 2012 to certain NGP personnel) were deemed to be compensatory arrangements; these elements are recognized as an expense under applicable U.S. GAAP.
The Partnership records investment income (loss) for its equity income allocation from NGP management fees and performance fees, and also records its share of any allocated expenses from NGP Management, expenses associated with the compensatory elements of the transaction, and the amortization of the basis differences related to the definitive-lived identifiable intangible assets of NGP Management. The net investment earnings (loss) recognized in the Partnership’s consolidated statements of operations for
the years ended December 31, 2017, 2016 and 2015
were as follows:
|
|
Year Ended December 31,
|
||||||||||
|
|
2017
|
2016
|
2015
|
||||||||
|
|
(Dollars in millions)
|
||||||||||
|
Management fees
|
$
|
80.5
|
|
$
|
80.7
|
|
$
|
53.9
|
|
||
|
Performance fees
|
98.4
|
|
44.7
|
|
(18.5
|
)
|
|||||
|
Investment income (loss)
|
12.1
|
|
9.4
|
|
(3.3
|
)
|
|||||
|
Expenses
|
(54.0
|
)
|
(16.0
|
)
|
(15.3
|
)
|
|||||
|
Amortization of basis differences
|
(8.5
|
)
|
(55.2
|
)
|
(56.6
|
)
|
|||||
|
Net investment income (loss)
|
$
|
128.5
|
|
$
|
63.6
|
|
$
|
(39.8
|
)
|
||
The difference between the Partnership’s remaining carrying value of its investment and its share of the underlying net assets of the investee was
$21.3 million
,
$29.8 million
and
$85.0 million
as of
December 31, 2017, 2016 and 2015
, respectively; these differences are amortized over a period of
10 years
from the initial investment date.
210
The Carlyle Group L.P.
Notes to the Consolidated Financial Statements
Equity-Method Investments
The Partnership’s equity method investments include its fund investments in Corporate Private Equity, Real Assets, Global Credit, and Investment Solutions typically as general partner interests, and its strategic investments in NGP (included within Real Assets), which are not consolidated. Investments are related to the following segments:
|
|
As of December 31,
|
||||||
|
|
2017
|
2016
|
|||||
|
|
(Dollars in millions)
|
||||||
|
Corporate Private Equity
|
$
|
369.5
|
|
$
|
282.4
|
|
|
|
Real Assets
|
775.1
|
|
622.8
|
|
|||
|
Global Credit
|
23.0
|
|
20.1
|
|
|||
|
Investment Solutions
|
50.8
|
|
25.6
|
|
|||
|
Total
|
$
|
1,218.4
|
|
$
|
950.9
|
|
|
The summarized financial information of the Partnership’s equity method investees from the date of initial investment is as follows (Dollars in millions):
|
|
Corporate
Private Equity
|
|
Real Assets
|
Global Credit
|
|
Investment Solutions
|
Aggregate Totals
|
||||||||||||||||||||||||||||||||||||||||||||||||||||
|
|
For the Year Ended
December 31,
|
|
For the Year Ended
December 31, |
For the Year Ended
December 31,
|
|
For the Year Ended December 31,
|
For the Year Ended
December 31,
|
||||||||||||||||||||||||||||||||||||||||||||||||||||
|
|
2017
|
2016
|
2015
|
2017
|
2016
|
2015
|
2017
|
2016
|
2015
|
2017
|
2016
|
2015
|
2017
|
2016
|
2015
|
||||||||||||||||||||||||||||||||||||||||||||
|
Statement of operations information
|
|||||||||||||||||||||||||||||||||||||||||||||||||||||||||||
|
Investment income
|
$
|
630.8
|
|
$
|
532.2
|
|
$
|
380.7
|
|
$
|
230.4
|
|
$
|
679.5
|
|
$
|
441.2
|
|
$
|
267.7
|
|
$
|
167.4
|
|
$
|
193.6
|
|
$
|
78.6
|
|
$
|
107.2
|
|
$
|
118.6
|
|
$
|
1,207.5
|
|
$
|
1,486.3
|
|
$
|
1,134.1
|
|
||||||||||||||
|
Expenses
|
553.3
|
|
597.1
|
|
613.8
|
|
572.4
|
|
544.3
|
|
604.4
|
|
118.8
|
|
95.1
|
|
45.7
|
|
665.5
|
|
493.0
|
|
436.5
|
|
1,910.0
|
|
1,729.5
|
|
1,700.4
|
|
|||||||||||||||||||||||||||||
|
Net investment income (loss)
|
77.5
|
|
(64.9
|
)
|
(233.1
|
)
|
(342.0
|
)
|
135.2
|
|
(163.2
|
)
|
148.9
|
|
72.3
|
|
147.9
|
|
(586.9
|
)
|
(385.8
|
)
|
(317.9
|
)
|
(702.5
|
)
|
(243.2
|
)
|
(566.3
|
)
|
|||||||||||||||||||||||||||||
|
Net realized and unrealized gain (loss)
|
9,587.4
|
|
2,906.8
|
|
4,831.6
|
|
2,605.6
|
|
2,184.2
|
|
(3,047.6
|
)
|
(51.5
|
)
|
(504.6
|
)
|
(323.1
|
)
|
2,676.3
|
|
2,360.2
|
|
2,511.1
|
|
14,817.8
|
|
6,946.6
|
|
3,972.0
|
|
|||||||||||||||||||||||||||||
|
Net income (loss)
|
$
|
9,664.9
|
|
$
|
2,841.9
|
|
$
|
4,598.5
|
|
$
|
2,263.6
|
|
$
|
2,319.4
|
|
$
|
(3,210.8
|
)
|
$
|
97.4
|
|
$
|
(432.3
|
)
|
$
|
(175.2
|
)
|
$
|
2,089.4
|
|
$
|
1,974.4
|
|
$
|
2,193.2
|
|
$
|
14,115.3
|
|
$
|
6,703.4
|
|
$
|
3,405.7
|
|
||||||||||||||
|
|
Corporate
Private Equity
|
|
Real Assets
|
Global Credit
|
|
Investment Solutions
|
Aggregate Totals
|
||||||||||||||||||||||||||||||||
|
|
As of December 31,
|
|
As of December 31,
|
As of December 31,
|
|
As of December 31,
|
As of December 31,
|
||||||||||||||||||||||||||||||||
|
|
2017
|
2016
|
2017
|
2016
|
2017
|
2016
|
2017
|
2016
|
2017
|
2016
|
|||||||||||||||||||||||||||||
|
Balance sheet information
|
|||||||||||||||||||||||||||||||||||||||
|
Investments
|
$
|
42,129.8
|
|
$
|
31,427.7
|
|
$
|
24,352.0
|
|
$
|
21,460.2
|
|
$
|
3,873.5
|
|
$
|
2,240.8
|
|
$
|
16,155.4
|
|
$
|
13,312.6
|
|
$
|
86,510.7
|
|
$
|
68,441.3
|
|
|||||||||
|
Total assets
|
$
|
44,987.0
|
|
$
|
33,605.0
|
|
$
|
25,894.9
|
|
$
|
22,666.0
|
|
$
|
4,050.0
|
|
$
|
2,502.5
|
|
$
|
16,402.5
|
|
$
|
13,476.3
|
|
$
|
91,334.4
|
|
$
|
72,249.8
|
|
|||||||||
|
Debt
|
$
|
2,141.8
|
|
$
|
416.2
|
|
$
|
2,633.0
|
|
$
|
1,552.9
|
|
$
|
508.1
|
|
$
|
170.4
|
|
$
|
135.0
|
|
$
|
96.8
|
|
$
|
5,417.9
|
|
$
|
2,236.3
|
|
|||||||||
|
Other liabilities
|
$
|
693.2
|
|
$
|
607.2
|
|
$
|
239.6
|
|
$
|
384.1
|
|
$
|
128.7
|
|
$
|
94.3
|
|
$
|
379.5
|
|
$
|
304.1
|
|
$
|
1,441.0
|
|
$
|
1,389.7
|
|
|||||||||
|
Total liabilities
|
$
|
2,835.0
|
|
$
|
1,023.4
|
|
$
|
2,872.6
|
|
$
|
1,937.0
|
|
$
|
636.8
|
|
$
|
264.7
|
|
$
|
514.5
|
|
$
|
400.9
|
|
$
|
6,858.9
|
|
$
|
3,626.0
|
|
|||||||||
|
Partners’ capital
|
$
|
42,152.0
|
|
$
|
32,581.6
|
|
$
|
23,022.3
|
|
$
|
20,729.0
|
|
$
|
3,413.2
|
|
$
|
2,237.8
|
|
$
|
15,888.0
|
|
$
|
13,075.4
|
|
$
|
84,475.5
|
|
$
|
68,623.8
|
|
|||||||||
211
The Carlyle Group L.P.
Notes to the Consolidated Financial Statements
Investment Income (Loss)
The components of investment income (loss) are as follows:
|
|
Year Ended December 31,
|
||||||||||
|
|
2017
|
2016
|
2015
|
||||||||
|
|
(Dollars in millions)
|
||||||||||
|
Income from equity investments
|
$
|
226.4
|
|
$
|
150.6
|
|
$
|
10.4
|
|
||
|
Income (loss) from investments in CLOs and other investments
|
5.6
|
|
9.6
|
|
(1.7
|
)
|
|||||
|
Other investment income
|
—
|
|
0.3
|
|
6.5
|
|
|||||
|
Total
|
$
|
232.0
|
|
$
|
160.5
|
|
$
|
15.2
|
|
||
Carlyle’s income (loss) from its equity-method investments is included in investment income (loss) in the consolidated statements of operations and consists of:
|
|
Year Ended December 31,
|
||||||||||
|
|
2017
|
2016
|
2015
|
||||||||
|
|
(Dollars in millions)
|
||||||||||
|
Corporate Private Equity
|
$
|
64.8
|
|
$
|
51.8
|
|
$
|
28.9
|
|
||
|
Real Assets
|
151.7
|
|
101.2
|
|
(18.6
|
)
|
|||||
|
Global Credit
|
1.7
|
|
(3.8
|
)
|
(0.9
|
)
|
|||||
|
Investment Solutions
|
8.2
|
|
1.4
|
|
1.0
|
|
|||||
|
Total
|
$
|
226.4
|
|
$
|
150.6
|
|
$
|
10.4
|
|
||
Investments in CLOs and Other Investments
Investments in CLOs and other investments as of
December 31, 2017 and 2016
primarily consisted of
$405.9 million
and
$156.1 million
, respectively, of investments in CLO senior and subordinated notes, derivative instruments, and corporate mezzanine securities and bonds.
Investments of Consolidated Funds
The Partnership consolidates the financial positions and results of operations of certain CLOs in which it is the primary beneficiary. During the year ended
December 31, 2017
, the Partnership formed
seven
new CLOs for which the Partnership is primary beneficiary of
two
of those CLOs. As of
December 31, 2017
, the total assets of these CLOs formed during the year and included in the Partnership’s consolidated financial statements were approximately
$1.2 billion
.
212
The Carlyle Group L.P.
Notes to the Consolidated Financial Statements
The following table presents a summary of the investments held by the Consolidated Funds. Investments held by the Consolidated Funds do not represent the investments of all Carlyle sponsored funds. The table below presents investments as a percentage of investments of Consolidated Funds:
|
|
Fair Value
|
Percentage of Investments of
Consolidated Funds |
||||||||||||
|
Geographic Region/Instrument Type/ Industry
|
December 31,
|
December 31,
|
||||||||||||
|
Description or Investment Strategy
|
2017
|
2016
|
2017
|
2016
|
||||||||||
|
|
(Dollars in millions)
|
|
|
|||||||||||
|
United States
|
||||||||||||||
|
Assets of the CLOs:
|
|
|
|
|
||||||||||
|
Bonds
|
$
|
36.6
|
|
$
|
12.5
|
|
0.81
|
%
|
0.32
|
%
|
||||
|
Equity
|
2.2
|
|
0.7
|
|
0.05
|
%
|
0.02
|
%
|
||||||
|
Loans
|
1,644.4
|
|
1,941.7
|
|
36.27
|
%
|
49.87
|
%
|
||||||
|
Total assets of the CLOs (cost of $1,661.1 and $1,958.6 at
December 31, 2017 and 2016, respectively) |
1,683.2
|
|
1,954.9
|
|
37.13
|
%
|
50.21
|
%
|
||||||
|
Total United States
|
$
|
1,683.2
|
|
$
|
1,954.9
|
|
37.13
|
%
|
50.21
|
%
|
||||
|
Europe
|
|||||||||||||
|
Equity securities:
|
|||||||||||||
|
Other
|
5.7
|
|
$
|
9.6
|
|
0.13
|
%
|
0.25
|
%
|
||||
|
Total equity securities (cost of $28.1 and $97.0 at
December 31, 2017 and 2016, respectively) |
5.7
|
|
9.6
|
|
0.13
|
%
|
0.25
|
%
|
|||||
|
Assets of the CLOs:
|
|
|
|||||||||||
|
Bonds
|
368.5
|
|
377.7
|
|
8.13
|
%
|
9.70
|
%
|
|||||
|
Loans
|
2,369.9
|
|
1,403.9
|
|
52.26
|
%
|
36.06
|
%
|
|||||
|
Other
|
0.3
|
|
1.4
|
|
—
|
%
|
0.03
|
%
|
|||||
|
Total assets of the CLOs (cost of $2,745.1 and $1,777.0 at
December 31, 2017 and 2016, respectively) |
2,738.7
|
|
1,783.0
|
|
60.39
|
%
|
45.79
|
%
|
|||||
|
Total Europe
|
$
|
2,744.4
|
|
$
|
1,792.6
|
|
60.52
|
%
|
46.04
|
%
|
|||
|
Global
|
|
|
|||||||||||
|
Assets of the CLOs:
|
|
|
|||||||||||
|
Bonds
|
$
|
8.3
|
|
$
|
6.2
|
|
0.18
|
%
|
0.16
|
%
|
|||
|
Loans
|
98.4
|
|
140.0
|
|
2.17
|
%
|
3.59
|
%
|
|||||
|
Total assets of the CLOs (cost of $107.7 and $147.9 at
December 31, 2017 and 2016, respectively) |
106.7
|
|
146.2
|
|
2.35
|
%
|
3.75
|
%
|
|||||
|
Total Global
|
$
|
106.7
|
|
$
|
146.2
|
|
2.35
|
%
|
3.75
|
%
|
|||
|
Total investments of Consolidated Funds (cost of $4,542.0 and $3,980.5 at December 31, 2017 and 2016, respectively)
|
$
|
4,534.3
|
|
$
|
3,893.7
|
|
100.00
|
%
|
100.00
|
%
|
|||
There were no individual investments with a fair value greater than
five percent
of the Partnership’s total assets for any period presented.
Interest and Other Income of Consolidated Funds
The components of interest and other income of Consolidated Funds are as follows:
|
|
Year Ended December 31,
|
||||||||||
|
|
2017
|
2016
|
2015
|
||||||||
|
|
(Dollars in millions)
|
||||||||||
|
Interest income from investments
|
$
|
167.3
|
|
$
|
140.4
|
|
$
|
873.1
|
|
||
|
Other income
|
10.4
|
|
26.5
|
|
102.4
|
|
|||||
|
Total
|
$
|
177.7
|
|
$
|
166.9
|
|
$
|
975.5
|
|
||
213
The Carlyle Group L.P.
Notes to the Consolidated Financial Statements
Net Investment Gains (Losses) of Consolidated Funds
Net investment gains (losses) of Consolidated Funds include net realized gains (losses) from sales of investments and unrealized gains (losses) resulting from changes in fair value of the Consolidated Funds’ investments. The components of net investment gains (losses) of Consolidated Funds are as follows:
|
|
Year Ended December 31,
|
||||||||||
|
|
2017
|
2016
|
2015
|
||||||||
|
|
(Dollars in millions)
|
||||||||||
|
Gains from investments of Consolidated Funds
|
$
|
27.0
|
|
$
|
51.7
|
|
$
|
426.2
|
|
||
|
Gains (losses) from liabilities of CLOs
|
61.4
|
|
(40.5
|
)
|
436.5
|
|
|||||
|
Gains on other assets of CLOs
|
—
|
|
1.9
|
|
1.7
|
|
|||||
|
Total
|
$
|
88.4
|
|
$
|
13.1
|
|
$
|
864.4
|
|
||
The following table presents realized and unrealized gains (losses) earned from investments of the Consolidated Funds:
|
|
Year Ended December 31,
|
||||||||||
|
|
2017
|
2016
|
2015
|
||||||||
|
|
(Dollars in millions)
|
||||||||||
|
Realized gains (losses)
|
$
|
(54.0
|
)
|
$
|
(33.4
|
)
|
$
|
1,114.7
|
|
||
|
Net change in unrealized gains (losses)
|
81.0
|
|
85.1
|
|
(688.5
|
)
|
|||||
|
Total
|
$
|
27.0
|
|
$
|
51.7
|
|
$
|
426.2
|
|
||
6.
Intangible Assets and Goodwill
The following table summarizes the carrying amount of intangible assets as of
December 31, 2017 and 2016
:
|
|
As of December 31,
|
||||||
|
|
2017
|
2016
|
|||||
|
|
(Dollars in millions)
|
||||||
|
Acquired contractual rights
(1)
|
$
|
81.4
|
|
$
|
74.1
|
|
|
|
Acquired trademarks
(1)
|
1.2
|
|
1.0
|
|
|||
|
Accumulated amortization
|
(57.8
|
)
|
(43.2
|
)
|
|||
|
Finite-lived intangible assets, net
|
24.8
|
|
31.9
|
|
|||
|
Goodwill
(1)
|
11.1
|
|
10.1
|
|
|||
|
Intangible assets, net
|
$
|
35.9
|
|
$
|
42.0
|
|
|
(1) Changes in the carrying amounts of acquired contractual rights, acquired trademarks, and goodwill are due to foreign currency translation.
As of December 31, 2017, all of the remaining finite-lived intangible assets, net, are associated with the Partnership's Investment Solutions segment.
As discussed in Note 2, the Partnership reviews its intangible assets for impairment whenever events or changes in circumstances indicate that the carrying amount of the asset may not be recoverable.
No
impairment losses were recorded during the years ended
December 31, 2017 and 2016
. During the year ended December 31, 2015, the Partnership evaluated for indicators of impairment certain definite-lived intangible assets associated with acquired contractual rights for fee income. These intangible assets are included in the Global Credit and Investment Solutions segments. The Partnership recorded impairment losses, primarily as a result of the redemptions received on the open-ended credit hedge funds in the Global Credit segment and with the open-ended fund of hedge funds in the Investment Solutions segment, of
$186.6 million
and
$15.0 million
, respectively, during the year ended December 31, 2015. Additionally, the Partnership recorded a
$7.0 million
goodwill impairment charge during the year ended December 31, 2015 as a result of the Partnership's decision to restructure the Investment Solutions segment. Finally, the Partnership recorded an additional impairment loss of
$11.8 million
for the year ended December 31, 2015 to reduce the carrying value of other Global Credit intangible assets to their estimated fair value.
214
The Carlyle Group L.P.
Notes to the Consolidated Financial Statements
The fair value determinations were based on a probability-weighted discounted cash flow model. These fair value measurements were based on significant inputs not observable in the market (primarily discount rates ranging from
10%
to
20%
) and thus represented Level III measurements as defined in the accounting guidance for fair value measurements. The impairment losses were included in general, administrative and other expenses in the accompanying consolidated financial statements.
Intangible asset amortization expense, excluding impairment losses, was
$10.1 million
,
$42.5 million
and
$76.1 million
for
the years ended December 31, 2017, 2016 and 2015
, respectively, and is included in general, administrative, and other expenses in the consolidated statements of operations.
The following table summarizes the expected amortization expense for 2018 through 2022 and thereafter (Dollars in millions):
|
2018
|
$
|
9.8
|
|
|
2019
|
6.0
|
|
|
|
2020
|
6.0
|
|
|
|
2021
|
3.0
|
|
|
|
$
|
24.8
|
|
|
7. Borrowings
The Partnership borrows and enters into credit agreements for its general operating and investment purposes. The Partnership’s debt obligations consist of the following (Dollars in millions):
|
|
As of December 31,
|
||||||||||||||
|
|
2017
|
2016
|
|||||||||||||
|
Borrowing
Outstanding |
Carrying
Value |
Borrowing
Outstanding |
Carrying
Value |
||||||||||||
|
Senior Credit Facility Term Loan Due 5/05/2020
|
$
|
25.0
|
|
$
|
24.8
|
|
$
|
25.0
|
|
$
|
24.7
|
|
|||
|
CLO Term Loans (See below)
|
294.5
|
|
294.5
|
|
33.8
|
|
33.8
|
|
|||||||
|
3.875% Senior Notes Due 2/01/2023
|
500.0
|
|
497.6
|
|
500.0
|
|
497.2
|
|
|||||||
|
5.625% Senior Notes Due 3/30/2043
|
600.0
|
|
600.7
|
|
600.0
|
|
600.7
|
|
|||||||
|
Promissory Note Due 1/01/2022
|
108.8
|
|
108.8
|
|
108.8
|
|
108.8
|
|
|||||||
|
Promissory Notes Due 7/15/2019
|
47.2
|
|
47.2
|
|
—
|
|
—
|
|
|||||||
|
Total debt obligations
|
$
|
1,575.5
|
|
$
|
1,573.6
|
|
$
|
1,267.6
|
|
$
|
1,265.2
|
|
|||
Senior Credit Facility
As of
December 31, 2017
, the senior credit facility included
$25.0 million
in a term loan and
$750.0 million
in a revolving credit facility. As of
December 31, 2017
, the term loan and revolving credit facility were scheduled to mature on
May 5, 2020
. Principal amounts outstanding under the term loan and revolving credit facility accrue interest, at the option of the borrowers, either (a) at an alternate base rate plus an applicable margin not to exceed
0.75%
, or (b) at LIBOR plus an applicable margin not to exceed
1.75%
(at
December 31, 2017
, the interest rate was
2.60%
). There was
no
amount outstanding under the revolving credit facility at
December 31, 2017
. Interest expense under the senior credit facility was not significant for
the years ended December 31, 2017, 2016 and 2015
. The fair value of the outstanding balances of the term loan and revolving credit facility at
December 31, 2017 and 2016
approximated par value based on current market rates for similar debt instruments and are classified as Level III within the fair value hierarchy.
On April 6, 2017, the Partnership borrowed
$250.0 million
against the
$750.0 million
revolving credit facility. This amount was repaid in full on June 2, 2017.
215
The Carlyle Group L.P.
Notes to the Consolidated Financial Statements
CLO Term Loans
For certain of our CLOs, the Partnership finances a portion of its investment in the CLOs through the proceeds received from term loans with financial institutions. The Partnership's outstanding CLO term loans consist of the following (Dollars in millions):
|
Formation Date
|
Borrowing
Outstanding December 31, 2017 |
Borrowing Outstanding December 31, 2016
|
Maturity Date (1)
|
Interest Rate as of December 31, 2017
|
||||||||||
|
October 3, 2013
|
$
|
—
|
|
(2)
|
$
|
13.2
|
|
(2)
|
September 28, 2018
|
NA
|
(3)
|
|||
|
June 7, 2016
|
20.6
|
|
20.6
|
|
July 15, 2027
|
3.16%
|
(4)
|
|||||||
|
February 28, 2017
|
74.3
|
|
—
|
|
September 21, 2029
|
2.33%
|
(5)
|
|||||||
|
April 19, 2017
|
22.8
|
|
—
|
|
April 22, 2031
|
3.29%
|
(6) (15)
|
|||||||
|
June 28, 2017
|
23.1
|
|
—
|
|
July 22, 2031
|
3.29%
|
(7) (15)
|
|||||||
|
July 20, 2017
|
24.4
|
|
—
|
|
April 21, 2027
|
2.90%
|
(8) (15)
|
|||||||
|
August 2, 2017
|
22.8
|
|
—
|
|
July 23, 2029
|
3.17%
|
(9) (15)
|
|||||||
|
August 2, 2017
|
20.9
|
|
—
|
|
August 3, 2022
|
1.75%
|
(10)
|
|||||||
|
August 14, 2017
|
22.6
|
|
—
|
|
August 15, 2030
|
3.26%
|
(11) (15)
|
|||||||
|
November 30, 2017
|
22.7
|
|
—
|
|
January 16, 2030
|
3.12%
|
(12) (15)
|
|||||||
|
December 6, 2017
|
19.1
|
|
—
|
|
October 16, 2030
|
3.01%
|
(13) (15)
|
|||||||
|
December 7, 2017
|
21.2
|
|
—
|
|
January 19, 2029
|
2.73%
|
(14) (15)
|
|||||||
|
$
|
294.5
|
|
$
|
33.8
|
|
|||||||||
(1) Maturity date is earlier of date indicated or the date that the CLO is dissolved.
(2) Original borrowing of
€12.6 million
.
(3) Note paid off in 2017.
(4) Incurs interest at the weighted average rate of the underlying senior notes.
|
(5)
|
Original borrowing of
€61.8 million
; incurs interest at EURIBOR plus applicable margins as defined in the agreement.
|
|
(6)
|
Incurs interest at LIBOR plus
1.932%
.
|
|
(7)
|
Incurs interest at LIBOR plus
1.923%
.
|
|
(8)
|
Incurs interest at LIBOR plus
1.536%
.
|
|
(9)
|
Incurs interest at LIBOR plus
1.808%
.
|
|
(10)
|
Original borrowing of
€17.4 million
; incurs interest at LIBOR plus
1.75%
and has full recourse to the Partnership.
|
|
(11)
|
Incurs interest at LIBOR plus
1.848%
.
|
|
(12)
|
Incurs interest at LIBOR plus
1.7312%
.
|
|
(13)
|
Incurs interest at LIBOR plus
1.647%
.
|
|
(14)
|
Incurs interest at LIBOR plus
1.365%
.
|
|
(15)
|
Term loan issued under master credit agreement.
|
The CLO term loans are secured by the Partnership's investments in the respective CLO, have a general unsecured interest in the Carlyle entity that manages the CLO, and generally do not have recourse to any other Carlyle entity. Interest expense on these term loans was not significant for the years ended
December 31, 2017, 2016 and 2015
. The fair value of the outstanding balance of the CLO term loans at
December 31, 2017 and 2016
approximated par value based on current market rates for similar debt instruments. These CLO term loans are classified as Level III within the fair value hierarchy.
European CLO Financing - February 28, 2017
On February 28, 2017, a subsidiary of the Partnership entered into a financing agreement with several financial institutions under which these financial institutions provided a
€61.8 million
term loan (
$74.3 million
at December 31, 2017) to the Partnership. This term loan is secured by the Partnership’s investments in the retained notes in certain European CLOs that were formed in 2014 and 2015. This term loan will mature on the earlier of September 21, 2029 or the date that the certain European CLO retained notes have been redeemed. The Partnership may prepay the term loan in whole or in part at any time after the third anniversary of the date of issuance without penalty. Prepayment of the term loan within the first
three years
will
216
The Carlyle Group L.P.
Notes to the Consolidated Financial Statements
incur a penalty based on the prepayment amount. Interest on this term loan accrues at EURIBOR plus applicable margins (
2.33%
at December 31, 2017).
Master Credit Agreement - Term Loans
In January 2017, the Partnership entered into a master credit agreement with a financial institution under which the financial institution expects to provide term loans to the Partnership for the purchase of eligible interests in CLOs. This agreement will terminate in January 2020. Any term loan issued under this master credit agreement is secured by the Partnership’s investment in the respective CLO as well as any senior management fee and subordinated management fee payable by each CLO. Any term loan bears interest at LIBOR plus a weighted average spread over LIBOR on the CLO notes and an applicable margin. Interest is due quarterly.
3.875%
Senior Notes
In January 2013, an indirect finance subsidiary of the Partnership issued
$500.0 million
in aggregate principal amount of
3.875%
senior notes due
February 1, 2023
at
99.966%
of par. Interest is payable
semi-annually on February 1 and August 1
, beginning
August 1, 2013
. This subsidiary may redeem the senior notes in whole at any time or in part from time to time at a price equal to the greater of
100%
of the principal amount of the notes being redeemed and the sum of the present values of the remaining scheduled payments of principal and interest on any notes being redeemed discounted to the redemption date on a semi-annual basis at the Treasury rate plus
30 basis points
plus accrued and unpaid interest on the principal amounts being redeemed to the redemption date.
Interest expense on the notes was
$19.8 million
for
the years ended December 31, 2017, 2016 and 2015
. At
December 31, 2017 and 2016
, the fair value of the notes, including accrued interest, was approximately
$520.4 million
and
$512.8 million
, respectively, based on indicative quotes. The notes are classified as Level II within the fair value hierarchy.
5.625%
Senior Notes
In March 2013, an indirect finance subsidiary of the Partnership issued
$400.0 million
in aggregate principal amount of
5.625%
senior notes due
March 30, 2043
at
99.583%
of par. Interest is payable semi-annually on March 30 and September 30, beginning
September 30, 2013
. This subsidiary may redeem the senior notes in whole at any time or in part from time to time at a price equal to the greater of
100%
of the principal amount of the notes being redeemed and the sum of the present values of the remaining scheduled payments of principal and interest on any notes being redeemed discounted to the redemption date on a semi-annual basis at the Treasury rate plus
40 basis points
plus accrued and unpaid interest on the principal amounts being redeemed to the redemption date.
In March 2014, an indirect finance subsidiary of the Partnership issued
$200.0 million
of
5.625%
Senior Notes due
March 30, 2043
at
104.315%
of par. These notes were issued as additional
5.625%
Senior Notes and will be treated as a single class with the already outstanding
$400.0 million
aggregate principal amount of these senior notes.
Interest expense on the notes was
$33.7 million
for
the years ended December 31, 2017, 2016 and 2015
, respectively. At
December 31, 2017 and 2016
, the fair value of the notes, including accrued interest, was approximately
$696.3 million
and
$603.1 million
, respectively, based on indicative quotes. The notes are classified as Level II within the fair value hierarchy.
Promissory Notes
Promissory Note Due January 1, 2022
On January 1, 2016, the Partnership issued a
$120.0 million
promissory note to BNRI as a result of a contingent consideration arrangement entered into in 2012 between the Partnership and BNRI as part of the Partnership's strategic investment in NGP (see Note 5). Interest on the promissory note accrues at the three month LIBOR plus
2.50%
(
4.19%
at
December 31, 2017
). The Partnership may prepay the promissory note in whole or in part at any time without penalty. The promissory note is scheduled to mature on January 1, 2022. Interest expense on the promissory note was not significant for the year ended
December 31, 2017
. The fair value of the outstanding balance of the promissory note at
December 31, 2017
approximated par value based on current market rates for similar debt instruments and is classified as Level III within the fair value hierarchy.
In December 2016, the Partnership repurchased
$11.2 million
of the promissory note for a purchase price of approximately
$9.0 million
. Approximately
$108.8 million
of the promissory note is outstanding at December 31, 2017.
217
The Carlyle Group L.P.
Notes to the Consolidated Financial Statements
Promissory Notes Due July 15, 2019
In June 2017, as part of the settlement with investors in
two
commodities investment vehicles managed by an affiliate of the Partnership (disclosed in Note 9), the Partnership issued a series of promissory notes, aggregating to
$53.9 million
, to the investors of these commodities investment vehicles. Interest on these promissory notes accrues at the three month LIBOR plus
2%
(
3.36%
at December 31, 2017). The Partnership may prepay these promissory notes in whole or in part at any time without penalty. In October 2017, the Partnership repaid
$6.7 million
of these promissory notes. Accordingly,
$47.2 million
of these promissory notes are outstanding at December 31, 2017. These promissory notes are scheduled to mature on July 15, 2019. Interest expense on these promissory notes was not significant for the year ended December 31, 2017. The fair value of the outstanding balance of these promissory notes at December 31, 2017 approximated par value based on current market rates for similar debt instruments and is classified as Level III within the fair value hierarchy.
The Partnership is subject to various financial covenants under its loan agreements including, among other items, maintenance of a minimum amount of management fee-earning assets. The Partnership is also subject to various non-financial covenants under its loan agreements and the indentures governing its senior notes. The Partnership was in compliance with all financial and non-financial covenants under its various loan agreements as of
December 31, 2017
.
Loans Payable of Consolidated Funds
Loans payable of Consolidated Funds primarily represent amounts due to holders of debt securities issued by the CLOs. Several of the CLOs issued preferred shares representing the most subordinated interest, however these tranches are mandatorily redeemable upon the maturity dates of the senior secured loans payable, and as a result have been classified as liabilities and are included in loans payable of Consolidated Funds in the consolidated balance sheets.
As of
December 31, 2017 and 2016
, the following borrowings were outstanding, which includes preferred shares classified as liabilities (Dollars in millions):
|
|
As of December 31, 2017
|
|||||||||||||
|
|
Borrowing
Outstanding |
Fair Value
|
Weighted
Average Interest Rate |
|
Weighted
Average Remaining Maturity in Years |
|||||||||
|
Senior secured notes
|
$
|
4,128.3
|
|
$
|
4,100.5
|
|
2.16
|
%
|
|
11.44
|
||||
|
Subordinated notes, preferred shares, and other
|
195.2
|
|
203.3
|
|
N/A
|
|
(a)
|
9.85
|
||||||
|
Total
|
$
|
4,323.5
|
|
$
|
4,303.8
|
|
||||||||
|
|
As of December 31, 2016
|
|||||||||||||
|
|
Borrowing
Outstanding |
Fair Value
|
Weighted
Average Interest Rate |
|
Weighted
Average Remaining Maturity in Years |
|||||||||
|
Senior secured notes
|
$
|
3,681.0
|
|
$
|
3,672.5
|
|
2.45
|
%
|
|
10.22
|
||||
|
Subordinated notes, preferred shares, and other
|
195.6
|
|
193.8
|
|
N/A
|
|
(a)
|
9.26
|
||||||
|
Total
|
$
|
3,876.6
|
|
$
|
3,866.3
|
|
||||||||
|
(a)
|
The subordinated notes and preferred shares do not have contractual interest rates, but instead receive distributions from the excess cash flows of the CLOs.
|
Loans payable of the CLOs are collateralized by the assets held by the CLOs and the assets of one CLO may not be used to satisfy the liabilities of another. This collateral consisted of cash and cash equivalents, corporate loans, corporate bonds and other securities. As of
December 31, 2017 and 2016
, the fair value of the CLO assets was
$4.9 billion
and
$4.7 billion
, respectively.
218
The Carlyle Group L.P.
Notes to the Consolidated Financial Statements
8.
Accrued Compensation and Benefits
Accrued compensation and benefits consist of the following:
|
|
As of December 31,
|
||||||
|
|
2017
|
2016
|
|||||
|
|
(Dollars in millions)
|
||||||
|
Accrued performance fee-related compensation
|
$
|
1,894.8
|
|
$
|
1,307.4
|
|
|
|
Accrued bonuses
|
202.6
|
|
177.2
|
|
|||
|
Other
|
125.2
|
|
177.2
|
|
|||
|
Total
|
$
|
2,222.6
|
|
$
|
1,661.8
|
|
|
Certain employees of AlpInvest are covered by defined benefit pension plans sponsored by AlpInvest. As of
December 31, 2017 and 2016
, the benefit obligation of those pension plans totaled approximately
$73.4 million
and
$61.9 million
, respectively. As of
December 31, 2017 and 2016
, the fair value of the plans’ assets was approximately
$56.3 million
and
$46.3 million
, respectively. At
December 31, 2017 and 2016
, the Partnership recognized a liability of
$17.1 million
and
$15.6 million
, respectively, representing the funded status of the plans, which was included in accrued compensation and benefits in the accompanying consolidated financial statements. For
the years ended December 31, 2017, 2016 and 2015
, the net periodic benefit cost recognized was
$4.2 million
,
$2.5 million
and
$2.8 million
, respectively, which is included in base compensation expense in the accompanying consolidated financial statements. No other employees of the Partnership are covered by defined benefit pension plans.
9.
Commitments and Contingencies
Capital Commitments
The Partnership and its unconsolidated affiliates have unfunded commitments to entities within the following segments as of
December 31, 2017
(Dollars in millions):
|
|
Unfunded
|
||
|
|
Commitments
|
||
|
Corporate Private Equity
|
$
|
2,354.2
|
|
|
Real Assets
|
812.0
|
|
|
|
Global Credit
|
526.0
|
|
|
|
Investment Solutions
|
146.5
|
|
|
|
Total
|
$
|
3,838.7
|
|
Of the
$3.8 billion
of unfunded commitments, approximately
$3.4 billion
is subscribed individually by senior Carlyle professionals, advisors and other professionals, with the balance funded directly by the Partnership. In addition to these unfunded commitments, the Partnership may from time to time exercise its right to purchase additional interests in its investment funds that become available in the ordinary course of their operations.
Guaranteed Loans
On August 4, 2001, the Partnership entered into an agreement with a financial institution pursuant to which the Partnership is the guarantor on a credit facility for eligible employees investing in Carlyle sponsored funds. This credit facility renews on an annual basis, allowing for annual incremental borrowings up to an aggregate of
$11.3 million
, and accrues interest at the lower of the prime rate, as defined, or
three-month LIBOR
plus
3%
, reset quarterly (
4.34%
weighted-average rate at
December 31, 2017
). As of
December 31, 2017 and 2016
, approximately
$13.3 million
and
$9.6 million
, respectively, were outstanding under the credit facility and payable by the employees. The amount funded by the Partnership under this guarantee as of
December 31, 2017
was not material. The Partnership believes the likelihood of any material funding under this guarantee to be remote. The fair value of this guarantee is not significant to the consolidated financial statements.
Certain consolidated subsidiaries of the Partnership are the guarantor of revolving credit facilities for certain funds in the Investment Solutions segment. The guarantee is limited to the lesser of the total amount drawn under the credit facilities or
219
The Carlyle Group L.P.
Notes to the Consolidated Financial Statements
the NAV of the guarantor subsidiaries, which was approximately
$7.3 million
as of December 31, 2017. The outstanding balances are secured by uncalled capital commitments from the underlying funds and the Partnership believes the likelihood of any material funding under this guarantee to be remote.
Contingent Obligations (Giveback)
A liability for potential repayment of previously received performance fees of
$66.8 million
at
December 31, 2017
, is shown as accrued giveback obligations in the consolidated balance sheets, representing the giveback obligation that would need to be paid if the funds were liquidated at their current fair values at
December 31, 2017
. However, the ultimate giveback obligation, if any, generally is not paid until the end of a fund’s life or earlier if the giveback becomes fixed and early payment is agreed upon by the fund's partners (see Note 2). The Partnership has recorded
$5.1 million
and
$5.6 million
of unbilled receivables from former and current employees and senior Carlyle professionals as of
December 31, 2017 and 2016
, respectively, related to giveback obligations, which are included in due from affiliates and other receivables, net in the accompanying consolidated balance sheets. The receivables are collateralized by investments made by individual senior Carlyle professionals and employees in Carlyle-sponsored funds. In addition,
$247.6 million
and
$356.9 million
have been withheld from distributions of carried interest to senior Carlyle professionals and employees for potential giveback obligations as of
December 31, 2017 and 2016
, respectively. Such amounts are held on behalf of the respective current and former Carlyle employees to satisfy any givebacks they may owe and are held by entities not included in the accompanying consolidated balance sheets. Current and former senior Carlyle professionals and employees are personally responsible for their giveback obligations. As of
December 31, 2017
, approximately
$37.9 million
of the Partnership's accrued giveback obligation is the responsibility of various current and former senior Carlyle professionals and other limited partners of the Carlyle Holdings partnerships, and the net accrued giveback obligation attributable to Carlyle Holdings is
$28.9 million
.
If, at
December 31, 2017
, all of the investments held by the Partnership’s Funds were deemed worthless, a possibility that management views as remote, the amount of realized and distributed carried interest subject to potential giveback would be
$0.7 billion
, on an after-tax basis where applicable.
Leases
The Partnership leases office space in various countries around the world and maintains its headquarters in Washington, D.C., where it leases its primary office space under a non-cancelable lease agreement expiring on
July 31, 2026
. Office leases in other locations expire in various years from 2018 through 2032. These leases are accounted for as operating leases. Rent expense was approximately
$56.6 million
,
$55.0 million
and
$56.3 million
for
the years ended December 31, 2017, 2016 and 2015
, respectively, and is included in general, administrative and other expenses in the consolidated statements of operations.
The future minimum commitments for the leases are as follows (Dollars in millions):
|
2018
|
$
|
47.9
|
|
|
2019
|
48.9
|
|
|
|
2020
|
48.4
|
|
|
|
2021
|
44.1
|
|
|
|
2022
|
41.0
|
|
|
|
Thereafter
|
295.7
|
|
|
|
$
|
526.0
|
|
|
The Partnership records contractual escalating minimum lease payments on a straight-line basis over the term of the lease. Deferred rent payable under the leases was
$62.9 million
and
$60.3 million
as of
December 31, 2017 and 2016
, respectively, and is included in accounts payable, accrued expenses and other liabilities in the accompanying consolidated balance sheets.
220
The Carlyle Group L.P.
Notes to the Consolidated Financial Statements
Legal Matters
In the ordinary course of business, the Partnership is a party to litigation, investigations, inquiries, employment-related matters, disputes and other potential claims. Certain of these matters are described below. The Partnership is not currently able to estimate the reasonably possible amount of loss or range of loss, in excess of amounts accrued, for the matters that have not been resolved. The Partnership does not believe it is probable that the outcome of any existing litigation, investigations, disputes or other potential claims will materially affect the Partnership or these financial statements in excess of amounts accrued. The Partnership believes that the claims asserted against the Partnership in the pending litigation matters described below are without merit and intends to vigorously contest such allegations.
Along with many other companies and individuals in the financial sector, the Partnership and Carlyle Mezzanine Partners, L.P. (“CMP”) are named as defendants in
Foy v. Austin Capital
, a case filed in June 2009 in state court in New Mexico, which purports to be a
qui tam
suit on behalf of the State of New Mexico under the state Fraud Against Taxpayers Act (“FATA”). The suit alleges that investment decisions by New Mexico public investment funds were improperly influenced by campaign contributions and payments to politically connected placement agents. The plaintiffs seek, among other things, actual damages for lost income, rescission of the investment transactions described in the complaint and disgorgement of all fees received. In September 2017, the Court dismissed the lawsuit and the plaintiffs then filed an appeal seeking to reverse that decision. The Attorney General may also pursue its own recovery from the defendants in the action.
Carlyle Capital Corporation Limited (“CCC”) was a fund sponsored by the Partnership that invested in AAA-rated residential mortgage backed securities on a highly leveraged basis. In March of 2008, amidst turmoil throughout the mortgage markets and money markets, CCC filed for insolvency protection in Guernsey. The Guernsey liquidators who took control of CCC in March 2008 filed a suit on July 7, 2010 against the Partnership, certain of its affiliates and the former directors of CCC in the Royal Court of Guernsey seeking more than
$1.0 billion
in damages in a case styled
Carlyle Capital Corporation Limited v. Conway et al
. On September 4, 2017, the Royal Court of Guernsey ruled that the Partnership and Directors of CCC acted reasonably and appropriately in the management and governance of CCC and that none of the Partnership, its affiliates or former directors of CCC had any liability. In December 2017, the plaintiff filed a notice of appeal of the trial court decision and the Partnership is preparing its response. The Partnership may be entitled to receive additional amounts from the plaintiff as reimbursement of legal fees and expenses incurred to defend against the claims. In December 2017, the Partnership received approximately
$29.8 million
from the plaintiff as a deposit towards its obligations to reimburse the Partnership for such expenses, but such amount is subject to repayment pending a final determination of the correct reimbursement amount and the ultimate outcome of the appeal process.
Cobalt International Energy, Inc. ("Cobalt") was a portfolio company owned by
two
of our Legacy Energy funds and funds advised by certain other private equity sponsors. Cobalt filed for bankruptcy protection on December 14, 2017. A federal securities class action against Cobalt (
In re Cobalt International Energy, Inc. Securities Litigation
) was filed in November 2014 in the U.S. District Court for the Southern District of Texas, seeking monetary damages and alleging that Cobalt and its directors made misrepresentations in certain of Cobalt’s securities offering filings relating to: (i) the value of oil reserves in Angola for which Cobalt had acquired drilling concessions, and (ii) its compliance with the Foreign Corrupt Practices Act regarding its operations in Angola and a U.S. government investigation regarding the same. The securities class action also named as co-defendants certain securities underwriters and the five private equity sponsors of Cobalt, including Riverstone and the Partnership. The class action alleged that the Partnership has liability as a "control person" for the alleged misrepresentations in Cobalt's securities offerings as well as insider trading liability. The federal court dismissed the insider trading claim against the Partnership. In addition to the class action in federal court, a class action claim was also filed in Texas state court in Houston (
Ira Gaines v. Joseph Bryant, et al.
) on similar grounds, alleging derivative claims that Cobalt and the private equity sponsors breached their fiduciary duties by engaging in insider trading.
No
Partnership employee served as a director or executive of Cobalt, and we vigorously contest all allegations made against the Partnership.
From 2007 to 2009, a Luxembourg subsidiary of CEREP I, a real estate fund, received proceeds from the sale of real estate located in Paris, France. Based on a provision in the Luxembourg-France tax treaty, it did not report or pay tax in France on gain from the sale. The French tax authorities asserted that CEREP I was ineligible to claim exemptions from French tax under the tax treaty, and issued a tax assessment seeking to collect taxes, interest and penalties. In April 2015, the French tax court issued an opinion in this matter that was adverse to CEREP I, holding the Luxembourg property company liable for approximately
€105 million
(including interest accrued since the beginning of the tax dispute). CEREP I paid approximately
€30 million
of the tax obligations and the Partnership paid the remaining approximately
€75 million
in its capacity as a guarantor. The Partnership disagreed with the outcome and filed a petition of appeal. In December 2017, the Partnership was successful on its appeal, with the French appellate court reversing the earlier tax court opinion and awarding the Partnership a
221
The Carlyle Group L.P.
Notes to the Consolidated Financial Statements
refund of the full
€105 million
of tax and penalties (inclusive of amounts paid by CEREP I) and awarding interest on the refund (which is estimated to be approximately
€12.5 million
, before tax). The appellate decision remains subject to the possibility of a further appeal, but the French tax authorities have not given notice as to whether they will pursue such a further appeal. Pending receipt of the refund and a final determination on any further appeal, the Partnership has not recognized income in respect of the refund as of December 31, 2017.
The Partnership currently is and expects to continue to be, from time to time, subject to examinations, formal and informal inquiries and investigations by various U.S. and non-U.S. governmental and regulatory agencies, including but not limited to, the SEC, Department of Justice, state attorneys general, FINRA, National Futures Association and the U.K. Financial Conduct Authority. The Partnership routinely cooperates with such examinations, inquiries and investigations, and they may result in the commencement of civil, criminal, or administrative or other proceedings against the Partnership or its personnel. For example, among various other requests for information, the SEC has requested information about: (i) the Partnership's historical practices relating to the acceleration of monitoring fees received from certain of the Partnership's funds' portfolio companies, and (ii) the Partnership's relationship with a third-party investment adviser to a registered investment company that has invested in various investment funds sponsored by the Partnership. The Partnership is cooperating fully with the SEC's inquiries.
During the year, the Partnership entered into settlement and purchase agreements with investors in a hedge fund and
two
structured finance vehicles managed by Vermillion related to investments of approximately
$400 million
in petroleum commodities that the Partnership believes were misappropriated by third parties outside the U.S. In total, the Partnership paid
$265 million
(
$165 million
of which was paid in 2017 with the remaining
$100 million
paid in 2016) to fully resolve all claims related to these matters and issued promissory notes in the aggregate amount of
$54 million
to repurchase the investors' interests in the
two
structured finance vehicles. In connection with these settlements, the Partnership also acquired certain rights to receive a portion of any proceeds obtained from marine cargo insurance policies and other efforts to pursue reimbursement for the misappropriation of petroleum. In the year ended December 31, 2017, the Partnership recognized
$177 million
, net of related recovery costs, in general liability insurance proceeds related to these settlements.
It is not possible to predict the ultimate outcome of all pending investigations and legal proceedings and employment-related matters, and some of the matters discussed above involve claims for potentially large and/or indeterminate amounts of damages. Based on information known by management, management does not believe that as of the date of this filing the final resolutions of the matters above will have a material effect upon the Partnership’s condensed consolidated financial statements. However, given the potentially large and/or indeterminate amounts of damages sought in certain of these matters and the inherent unpredictability of investigations and litigations, it is possible that an adverse outcome in certain matters could, from time to time, have a material effect on the Partnership's financial results in any particular period.
The Partnership accrues an estimated loss contingency liability when it is probable that such a liability has been incurred and the amount of the loss can be reasonably estimated. As of December 31, 2017, the Partnership had recorded liabilities aggregating to approximately
$35 million
for litigation-related contingencies, regulatory examinations and inquiries, and other matters. The Partnership evaluates its outstanding legal and regulatory proceedings and other matters each quarter to assess its loss contingency accruals, and makes adjustments in such accruals, upward or downward, as appropriate, based on management's best judgment after consultation with counsel. There is no assurance that the Partnership's accruals for loss contingencies will not need to be adjusted in the future or that, in light of the uncertainties involved in such matters, the ultimate resolution of these matters will not significantly exceed the accruals that the Partnership has recorded.
Transaction with Claren Road
O
n December 12, 2016, the Partnership signed an agreement with the founders of Claren Road Asset Management, LLC and its subsidiaries (collectively, “Claren Road”) to transfer all of the Partnership's
63%
ownership interest in Claren Road to its founders. As a result of the transaction, the Partnership is also relieved of all of its obligations under the 2010 acquisition agreement, including any potential future obligations thereunder. This transaction closed on January 31, 2017. The Partnership recorded additional base compensation expense of approximately
$25.0 million
in the year ended December 31, 2016 associated with the transfer of the interests to Claren Road in addition to the disposition of approximately
$4.4 million
of intangible assets and approximately
$10.8 million
of potential future obligations. The remaining income before provision for income taxes for the year ended December 31, 2016 was not material. Claren Road was part of the Partnership's Global Credit segment.
222
The Carlyle Group L.P.
Notes to the Consolidated Financial Statements
Transaction with ESG
On October 31, 2016, the Partnership closed a transaction with the founders of Emerging Sovereign Group and its subsidiaries and affiliates (collectively,“ESG”) and transferred the Partnership's
55%
ownership interest in ESG to its founders. Prior to the transaction closing, the carrying value of the contingent consideration liability for the Partnership's obligation to purchase the
45%
ownership interest in 2020 (or after) was
$49.5 million
(substantially all of which was included in accrued compensation and benefits in the accompanying consolidated balance sheet) and the Partnership also had
$22.4 million
of intangible assets and
$28.0 million
of goodwill related to its 2011 acquisition of its
55%
ownership interest in ESG as of October 31, 2016, all of which was disposed of upon the transaction closing. ESG's income before provision for income taxes for the year ended December 31, 2016 was not material to the Partnership's consolidated financial statements. There was no material gain or loss associated with the transfer of the interests to ESG. ESG was part of the Partnership's Global Credit segment.
Indemnifications
In the normal course of business, the Partnership and its subsidiaries enter into contracts that contain a variety of representations and warranties and provide general indemnifications. The Partnership’s maximum exposure under these arrangements is unknown as this would involve future claims that may be made against the Partnership that have not yet occurred. However, based on experience, the Partnership believes the risk of material loss to be remote.
Risks and Uncertainties
Carlyle’s funds seek investment opportunities that offer the possibility of attaining substantial capital appreciation. Certain events particular to each industry in which the underlying investees conduct their operations, as well as general economic conditions, may have a significant negative impact on the Partnership’s investments and profitability. Such events are beyond the Partnership’s control, and the likelihood that they may occur and the effect on the Partnership cannot be predicted.
Furthermore, certain of the funds’ investments are made in private companies and there are generally no public markets for the underlying securities at the current time. The funds’ ability to liquidate their publicly-traded investments are often subject to limitations, including discounts that may be required to be taken on quoted prices due to the number of shares being sold. The funds’ ability to liquidate their investments and realize value is subject to significant limitations and uncertainties, including among others currency fluctuations and natural disasters.
The Partnership and the funds make investments outside of the United States. Investments outside the United States may be subject to less developed bankruptcy, corporate, partnership and other laws (which may have the effect of disregarding or otherwise circumventing the limited liability structures potentially causing the actions or liabilities of one fund or a portfolio company to adversely impact the Partnership or an unrelated fund or portfolio company). Non-U.S. investments are subject to the same risks associated with the Partnership’s U.S. investments as well as additional risks, such as fluctuations in foreign currency exchange rates, unexpected changes in regulatory requirements, heightened risk of political and economic instability, difficulties in managing non-U.S. investments, potentially adverse tax consequences and the burden of complying with a wide variety of foreign laws.
Furthermore, Carlyle is exposed to economic risk concentrations related to certain large investments as well as concentrations of investments in certain industries and geographies.
Additionally, the Partnership encounters credit risk. Credit risk is the risk of default by a counterparty in the Partnership’s investments in debt securities, loans, leases and derivatives that result from a borrower’s, lessee’s or derivative counterparty’s inability or unwillingness to make required or expected payments.
The Partnership considers cash, cash equivalents, securities, receivables, equity method investments, accounts payable, accrued expenses, other liabilities, loans, senior notes, assets and liabilities of Consolidated Funds and contingent and other consideration for acquisitions to be its financial instruments. Except for the senior notes, the carrying amounts reported in the consolidated balance sheets for these financial instruments equal or closely approximate their fair values. The fair value of the senior notes is disclosed in Note 7.
223
The Carlyle Group L.P.
Notes to the Consolidated Financial Statements
10.
Related Party Transactions
Due from Affiliates and Other Receivables, Net
The Partnership had the following due from affiliates and other receivables at
December 31, 2017 and 2016
:
|
|
As of December 31,
|
||||||
|
|
2017
|
2016
|
|||||
|
|
(Dollars in millions)
|
||||||
|
Unbilled receivable for giveback obligations from current and former employees
|
$
|
5.1
|
|
$
|
5.6
|
|
|
|
Notes receivable and accrued interest from affiliates
|
22.8
|
|
37.6
|
|
|||
|
Other receivables from unconsolidated funds and affiliates, net
|
229.2
|
|
184.0
|
|
|||
|
Total
|
$
|
257.1
|
|
$
|
227.2
|
|
|
Notes receivable represent loans that the Partnership has provided to certain unconsolidated funds to meet short-term obligations to purchase investments. Other receivables from certain of the unconsolidated funds and portfolio companies relate to management fees receivable from limited partners, advisory fees receivable and expenses paid on behalf of these entities. These costs represent costs related to the pursuit of actual or proposed investments, professional fees and expenses associated with the acquisition, holding and disposition of the investments. The affiliates are obligated at the discretion of the Partnership to reimburse the expenses. Based on management’s determination, the Partnership accrues and charges interest on amounts due from affiliate accounts at interest rates ranging up to
7.07%
as of
December 31, 2017
. The accrued and charged interest to the affiliates was not significant for any period presented.
These receivables are assessed regularly for collectability and amounts determined to be uncollectible are charged directly to general, administrative and other expenses in the consolidated statements of operations. A corresponding allowance for doubtful accounts is recorded and such amounts were not significant for any period presented.
Due to Affiliates
The Partnership had the following due to affiliates balances at
December 31, 2017 and 2016
:
|
|
As of December 31,
|
||||||
|
|
2017
|
2016
|
|||||
|
|
(Dollars in millions)
|
||||||
|
Due to affiliates of Consolidated Funds
|
$
|
—
|
|
$
|
0.2
|
|
|
|
Due to non-consolidated affiliates
|
75.7
|
|
29.7
|
|
|||
|
Performance-based contingent cash consideration related to acquisitions
|
37.5
|
|
36.1
|
|
|||
|
Amounts owed under the tax receivable agreement
|
94.0
|
|
137.8
|
|
|||
|
Other
|
22.7
|
|
19.8
|
|
|||
|
Total
|
$
|
229.9
|
|
$
|
223.6
|
|
|
The Partnership has recorded obligations for amounts due to certain of its affiliates. The Partnership periodically offsets expenses it has paid on behalf of its affiliates against these obligations. The amount owed under the tax receivable agreement is related primarily to the acquisition by the Partnership of Carlyle Holdings partnership units in June 2015 and March 2014, respectively, the exchange in May 2012 by CalPERS of its Carlyle Holdings partnership units for Partnership common units, as well as certain unit exchanges by senior Carlyle professionals which began in 2017 (see Note 14).
Other Related Party Transactions
In the normal course of business, the Partnership has made use of aircraft owned by entities controlled by senior Carlyle professionals. The senior Carlyle professionals paid for their purchases of the aircraft and bear all operating, personnel and maintenance costs associated with their operation for personal use. Payment by the Partnership for the business use of these aircraft by senior Carlyle professionals and other employees, which is made at market rates, totaled
$5.4 million
,
$4.8 million
224
The Carlyle Group L.P.
Notes to the Consolidated Financial Statements
and
$4.4 million
for
the years ended December 31, 2017, 2016 and 2015
, respectively. These fees are included in general, administrative, and other expenses in the consolidated statements of operations.
Senior Carlyle professionals and employees are permitted to participate in co-investment entities that invest in Carlyle funds or alongside Carlyle funds. In many cases, participation is limited by law to individuals who qualify under applicable legal requirements. These co-investment entities generally do not require senior Carlyle professionals and employees to pay management or performance fees, however, Carlyle professionals and employees are required to pay their portion of partnership expenses.
Carried interest income from the funds can be distributed to senior Carlyle professionals and employees on a current basis, but is subject to repayment by the subsidiary of the Partnership that acts as general partner of the fund in the event that certain specified return thresholds are not ultimately achieved. The senior Carlyle professionals and certain other investment professionals have personally guaranteed, subject to certain limitations, the obligation of these subsidiaries in respect of this general partner obligation. Such guarantees are several and not joint and are limited to a particular individual’s distributions received.
The Partnership does business with some of its portfolio companies; all such arrangements are on a negotiated basis.
Substantially all revenue is earned from affiliates of Carlyle.
11.
Income Taxes
On December 22, 2017, the Tax Cuts and Jobs Act (the “Act”) was enacted. The Act includes numerous changes in existing tax law, including a permanent reduction in the federal corporate income tax rate from
35%
to
21%
. The rate reduction takes effect on January 1, 2018. As a result of the reduction of the federal corporate income tax rate, the Partnership revalued its deferred tax assets and liabilities as of December 31, 2017 using the newly enacted rate. The revaluation resulted in the recognition of additional provision for income taxes of approximately
$113.0 million
. In addition, the Partnership's tax receivable agreement liability was reduced by approximately
$71.5 million
due to the reduction in expected future benefits owed to the limited partners of Carlyle Holdings resulting from the decrease in the federal corporate income tax rate. The reduction in the tax receivable agreement liability resulting from the Act is included in other non-operating income in the consolidated statements of operations. The SEC Staff issued Staff Accounting Bulletin No. 118 (“SAB 118”) in December 2017, which allows for reporting provisional amounts during a measurement period until the evaluation is complete. The Partnership assessed the potential impact of the Act on its consolidated financial statements at December 31, 2017 and believes the material provisions have been properly considered. The Partnership will continue to evaluate the provisions of the Act and the impact of any future authoritative guidance.
The provision for income taxes consists of the following:
|
|
Year Ended December 31,
|
||||||||||
|
|
2017
|
2016
|
2015
|
||||||||
|
|
(Dollars in millions)
|
||||||||||
|
Current
|
|||||||||||
|
Federal income tax
|
$
|
(6.2
|
)
|
$
|
0.4
|
|
$
|
0.7
|
|
||
|
State and local income tax
|
(0.2
|
)
|
(0.4
|
)
|
4.9
|
|
|||||
|
Foreign income tax
|
38.8
|
|
34.9
|
|
27.4
|
|
|||||
|
Subtotal
|
32.4
|
|
34.9
|
|
33.0
|
|
|||||
|
Deferred
|
|||||||||||
|
Federal income tax
|
106.2
|
|
(9.8
|
)
|
(36.7
|
)
|
|||||
|
State and local income tax
|
(2.7
|
)
|
(1.3
|
)
|
(2.6
|
)
|
|||||
|
Foreign income tax
|
(11.0
|
)
|
6.2
|
|
8.4
|
|
|||||
|
Subtotal
|
92.5
|
|
(4.9
|
)
|
(30.9
|
)
|
|||||
|
Total provision for income taxes
|
$
|
124.9
|
|
$
|
30.0
|
|
$
|
2.1
|
|
||
225
The Carlyle Group L.P.
Notes to the Consolidated Financial Statements
Deferred income taxes reflect the net tax effects of temporary differences that may exist between the carrying amounts of assets and liabilities for financial reporting purposes and the amounts used for income tax purposes using enacted tax rates in effect for the year in which the differences are expected to reverse.
A summary of the tax effects of the temporary differences is as follows:
|
|
As of December 31,
|
||||||
|
|
2017
|
|
2016
|
||||
|
|
(Dollars in millions)
|
||||||
|
Deferred tax assets
|
|
|
|||||
|
Federal foreign tax credit
|
$
|
11.9
|
|
$
|
12.8
|
|
|
|
Federal net operating loss carry forward
|
22.8
|
|
12.1
|
|
|||
|
State net operating loss carry forwards
|
11.8
|
|
4.3
|
|
|||
|
Tax basis goodwill and intangibles
|
98.2
|
|
149.8
|
|
|||
|
Depreciation and amortization
|
16.6
|
|
25.3
|
|
|||
|
Deferred restricted common unit compensation
|
9.4
|
|
12.1
|
|
|||
|
Accrued compensation
|
31.0
|
|
25.0
|
|
|||
|
Basis difference in investments
|
24.4
|
|
34.0
|
|
|||
|
Other
|
24.3
|
|
25.5
|
|
|||
|
Deferred tax assets before valuation allowance
|
250.4
|
|
300.9
|
|
|||
|
Valuation allowance
|
(27.3
|
)
|
(21.8
|
)
|
|||
|
Total deferred tax assets
|
$
|
223.1
|
|
$
|
279.1
|
|
|
|
Deferred tax liabilities
(1)
|
|
|
|||||
|
Intangible assets
|
$
|
4.8
|
|
$
|
5.5
|
|
|
|
Unrealized appreciation on investments
|
121.0
|
|
111.0
|
|
|||
|
Other
|
2.5
|
|
4.8
|
|
|||
|
Total deferred tax liabilities
|
$
|
128.3
|
|
$
|
121.3
|
|
|
|
Net deferred tax assets (liabilities)
|
$
|
94.8
|
|
$
|
157.8
|
|
|
|
(1)
|
As of
December 31, 2017 and 2016
,
$52.7 million
and
$44.7 million
, respectively, of deferred tax liabilities were offset and presented as a single deferred tax asset amount on the Partnership’s balance sheet as these deferred tax assets and liabilities relate to the same jurisdiction.
|
As of
December 31, 2017
, the Partnership has a federal net operating loss carry forward of approximately
$108.6 million
and cumulative net operating loss carry forwards of approximately
$197.1 million
for separate state tax jurisdictions, which will be available to offset future taxable income. If not used, a portion of the federal and state carry forwards will expire in
2035
and years forward and
2020
and years forward, respectively. As of
December 31, 2017
, the Partnership had a federal foreign tax credit (“FTC”) carryforward of
$11.9 million
. The FTCs are related to taxes paid in various foreign jurisdictions and if not utilized a portion will expire in
2023
and years forward.
The Partnership had
$170.4 million
and
$234.4 million
in deferred tax assets as of
December 31, 2017 and 2016
, respectively. These deferred tax assets resulted primarily from future amortization of tax basis intangible assets generated from exchanges covered by the Tax Receivable Agreement (see Note 2) and acquisitions by the Partnership and temporary differences between the financial statement and tax bases of depreciation on fixed assets and accrued compensation on lower-tier partnerships. The realization of the deferred tax assets is dependent on the Partnership’s future taxable income before deductions related to the establishment of its deferred tax assets. The deferred tax asset balance is comprised of a portion that would be realized in connection with future ordinary income and a portion that would be realized in connection with future capital gains.
The Partnership evaluated various sources of evidence in determining the ultimate realizability of its deferred tax assets including the character and timing of projected future taxable income. During 2017 and 2016, a Partnership entity subject to entity level income tax in certain states incurred a significant tax loss. Management evaluated specific factors associated with the realizability of its net operating losses and the entity’s deferred tax assets and determined that it is more likely than not that
226
The Carlyle Group L.P.
Notes to the Consolidated Financial Statements
the Partnership will not realize these tax assets. Additionally, the Partnership determined that a portion of the US federal FTC carryforward earned in 2013 and forward will not ultimately be realized due to federal limitations on FTC utilization. As of December 31, 2017 and 2016, the Partnership has established a valuation allowance of
$27.3 million
and
$21.8 million
, respectively, for these items. For all other deferred tax assets, the Partnership has concluded it is more likely than not that they will be realized and that a valuation allowance is not needed at
December 31, 2017
.
The Partnership had deferred tax liabilities of
$75.6 million
and
$76.6 million
at
December 31, 2017 and 2016
, respectively, which primarily relate to unrealized appreciation on the Partnership’s investments in the U.S. and in the Netherlands. Deferred tax liabilities related to unrealized appreciation were also recorded for outside tax basis differences as a result of the Partnership’s investment in Carlyle Holdings (see Note 1). The deferred tax liabilities related to intangible assets were recorded as part of the Partnership’s business acquisitions.
The Partnership’s income tax expense was
$124.9 million
,
$30.0 million
and
$2.1 million
for
the years ended December 31, 2017, 2016 and 2015
, respectively. The following table reconciles the provision for income taxes to the U.S. Federal statutory tax rate:
|
|
Year Ended December 31,
|
|||||||
|
|
2017
|
2016
|
2015
|
|||||
|
Statutory U.S. federal income tax rate
|
35.00
|
%
|
35.00
|
%
|
35.00
|
%
|
||
|
Income passed through to common unitholders and non-controlling interest holders
(1)
|
(31.55
|
)%
|
(40.00
|
)%
|
(40.64
|
)%
|
||
|
Reduction in U.S. corporate tax rate
|
7.77
|
%
|
—
|
%
|
—
|
%
|
||
|
Unvested Carlyle Holdings partnership units and other compensation
|
1.45
|
%
|
36.74
|
%
|
1.87
|
%
|
||
|
Foreign income taxes
|
0.12
|
%
|
28.75
|
%
|
1.61
|
%
|
||
|
State and local income taxes
|
(0.19
|
)%
|
(6.70
|
)%
|
4.13
|
%
|
||
|
Valuation allowance impacting provision for income taxes
|
0.07
|
%
|
16.84
|
%
|
(3.88
|
)%
|
||
|
Other adjustments
|
(1.64
|
)%
|
(4.40
|
)%
|
2.43
|
%
|
||
|
Effective income tax rate
(2)
|
11.03
|
%
|
66.23
|
%
|
0.52
|
%
|
||
|
(1)
|
The Partnership is organized as a series of pass through entities pursuant to the United States Internal Revenue Code. As such, the Partnership is not responsible for the tax liability due on certain income earned during the year. Such income is taxed at the unitholder and non-controlling interest holder level, and any income tax is the responsibility of the unitholders and is paid at that level.
|
|
(2)
|
The effective income tax rate is calculated on income before provision for income taxes. The effective tax rate is impacted by a variety of factors, including, but not limited to, changes in the sources of income or loss during the period and whether such income or loss is attributable to the Partnership's taxable subsidiaries.
|
Under U.S. GAAP for income taxes, the amount of tax benefit to be recognized is the amount of benefit that is “more likely than not” to be sustained upon examination. The Partnership has recorded a liability for uncertain tax positions of
$12.3 million
and
$19.0 million
as of
December 31, 2017 and 2016
, respectively, which is reflected in accounts payable, accrued expenses and other liabilities in the accompanying consolidated balance sheets. These balances include
$3.4 million
and
$6.0 million
as of
December 31, 2017 and 2016
, related to interest and penalties associated with uncertain tax positions. If recognized,
$12.3 million
of uncertain tax positions would be recorded as a reduction in the provision for income taxes. A reconciliation of the beginning and ending amount of unrecognized tax benefits, exclusive of penalties and interest, is as follows:
|
|
As of December 31,
|
||||||||||
|
|
2017
|
2016
|
2015
|
||||||||
|
|
(Dollars in millions)
|
||||||||||
|
Balance at January 1
|
$
|
13.0
|
|
$
|
13.1
|
|
$
|
13.8
|
|
||
|
Additions for tax positions of prior years
|
1.6
|
|
1.3
|
|
(0.7
|
)
|
|||||
|
Reductions due to lapse of statute of limitations
|
(5.7
|
)
|
(1.4
|
)
|
—
|
|
|||||
|
Balance at December 31
|
$
|
8.9
|
|
$
|
13.0
|
|
$
|
13.1
|
|
||
227
The Carlyle Group L.P.
Notes to the Consolidated Financial Statements
In the normal course of business, the Partnership is subject to examination by federal and certain state, local and foreign tax regulators. With a few exceptions, as of
December 31, 2017
, the Partnership’s U.S. federal income tax returns for the years
2014
through
2016
are open under the normal
three years
statute of limitations and therefore subject to examination. State and local tax returns are generally subject to audit from
2013
to
2016
. Foreign tax returns are generally subject to audit from
2010
to
2016
. Certain of the Partnership’s affiliates are currently under audit by federal, state and foreign tax authorities. Currently. the Internal Revenue Service is examining the tax returns of certain subsidiaries for the 2013, 2014, and 2015 years.
The Partnership does not believe that the outcome of these audits will require it to record reserves for uncertain tax positions or that the outcome will have a material impact on the consolidated financial statements. The Partnership does not believe that it has any tax positions for which it is reasonably possible that the total amounts of unrecognized tax benefits will significantly increase or decrease within the next twelve months.
12. Non-controlling Interests in Consolidated Entities
The components of the Partnership’s non-controlling interests in consolidated entities are as follows:
|
|
As of December 31,
|
||||||
|
|
2017
|
2016
|
|||||
|
|
(Dollars in millions)
|
||||||
|
Non-Carlyle interests in Consolidated Funds
|
$
|
13.3
|
|
$
|
13.5
|
|
|
|
Non-Carlyle interests in majority-owned subsidiaries
|
386.5
|
|
331.7
|
|
|||
|
Non-controlling interest in carried interest, giveback obligations and cash held for carried interest distributions
|
4.9
|
|
(67.4
|
)
|
|||
|
Non-controlling interests in consolidated entities
|
$
|
404.7
|
|
$
|
277.8
|
|
|
The components of the Partnership’s non-controlling interests in income of consolidated entities are as follows:
|
|
Year Ended December 31,
|
||||||||||
|
|
2017
|
2016
|
2015
|
||||||||
|
|
(Dollars in millions)
|
||||||||||
|
Non-Carlyle interests in Consolidated Funds
|
$
|
12.0
|
|
$
|
17.1
|
|
$
|
876.6
|
|
||
|
Non-Carlyle interests in majority-owned subsidiaries
|
41.3
|
|
(8.6
|
)
|
(20.6
|
)
|
|||||
|
Non-controlling interest in carried interest, giveback obligations and cash held for carried interest distributions
|
19.2
|
|
32.3
|
|
(78.3
|
)
|
|||||
|
Net income attributable to other non-controlling interests in consolidated entities
|
72.5
|
|
40.8
|
|
777.7
|
|
|||||
|
Net loss attributable to partners’ capital appropriated for CLOs
|
—
|
|
—
|
|
(54.4
|
)
|
|||||
|
Net income (loss) attributable to redeemable non-controlling interests in consolidated entities
|
—
|
|
0.2
|
|
(185.4
|
)
|
|||||
|
Non-controlling interests in income of consolidated entities
|
$
|
72.5
|
|
$
|
41.0
|
|
$
|
537.9
|
|
||
228
The Carlyle Group L.P.
Notes to the Consolidated Financial Statements
13. Earnings Per Common Unit
Basic and diluted net income (loss) per common unit are calculated as follows:
|
|
Year Ended December 31, 2017
|
Year Ended December 31, 2016
|
Year Ended December 31, 2015
|
||||||||||||||||||||
|
|
Basic
|
Diluted
|
Basic
|
Diluted
|
Basic
|
Diluted
|
|||||||||||||||||
|
Net income (loss) attributable to The Carlyle Group L.P. common unitholders
|
$
|
238,100,000
|
|
$
|
238,100,000
|
|
$
|
6,400,000
|
|
$
|
6,400,000
|
|
$
|
(18,400,000
|
)
|
$
|
(18,400,000
|
)
|
|||||
|
Dilution of earnings due to participating securities with distribution rights
|
—
|
|
—
|
|
—
|
|
—
|
|
167,000
|
|
(1,743,000
|
)
|
|||||||||||
|
Incremental net income (loss) from assumed exchange of Carlyle Holdings partnership units
|
—
|
|
—
|
|
—
|
|
(32,100,000
|
)
|
—
|
|
(69,300,000
|
)
|
|||||||||||
|
Net income (loss) attributable to common units
|
$
|
238,100,000
|
|
$
|
238,100,000
|
|
$
|
6,400,000
|
|
$
|
(25,700,000
|
)
|
$
|
(18,233,000
|
)
|
$
|
(89,443,000
|
)
|
|||||
|
Weighted-average common units outstanding
|
92,136,959
|
|
100,082,548
|
|
82,714,178
|
|
308,522,990
|
|
74,523,935
|
|
298,739,382
|
|
|||||||||||
|
Net income (loss) per common unit
|
$
|
2.58
|
|
$
|
2.38
|
|
$
|
0.08
|
|
$
|
(0.08
|
)
|
$
|
(0.24
|
)
|
$
|
(0.30
|
)
|
|||||
The weighted-average common units outstanding, basic and diluted, are calculated as follows:
|
|
Year Ended December 31, 2017
|
Year Ended December 31, 2016
|
Year Ended December 31, 2015
|
||||||||||||||
|
|
Basic
|
Diluted
|
Basic
|
Diluted
|
Basic
|
Diluted
|
|||||||||||
|
The Carlyle Group L.P. weighted-average common units outstanding
|
92,136,959
|
|
92,136,959
|
|
82,714,178
|
|
82,714,178
|
|
74,523,935
|
|
74,523,935
|
|
|||||
|
Unvested deferred restricted common units
|
—
|
|
7,347,645
|
|
—
|
|
3,331,282
|
|
—
|
|
—
|
|
|||||
|
Contingently issuable Carlyle Holdings partnership units and common units
|
—
|
|
597,944
|
|
—
|
|
—
|
|
—
|
|
—
|
|
|||||
|
Weighted-average vested Carlyle Holdings partnership units
|
—
|
|
—
|
|
—
|
|
222,183,911
|
|
—
|
|
216,943,053
|
|
|||||
|
Unvested Carlyle Holdings partnership units
|
—
|
|
—
|
|
—
|
|
293,619
|
|
—
|
|
7,272,394
|
|
|||||
|
Weighted-average common units outstanding
|
92,136,959
|
|
100,082,548
|
|
82,714,178
|
|
308,522,990
|
|
74,523,935
|
|
298,739,382
|
|
|||||
The Carlyle Group L.P. weighted-average common units outstanding includes vested deferred restricted common units and common units associated with acquisitions that have been earned for which issuance of the related common units is deferred until future periods.
The Partnership applies the treasury stock method to determine the dilutive weighted-average common units represented by the unvested deferred restricted common units. Also included in the determination of dilutive weighted-average common units are issuable and contingently issuable Carlyle Holdings partnership units and common units associated with the Partnership's acquisitions and strategic investments in NGP. For purposes of determining the dilutive weighted-average common units, it is assumed that
December 31, 2017, 2016 and 2015
represent the end of the contingency period.
The Partnership applies the “if-converted” method to the vested Carlyle Holdings partnership units to determine the dilutive weighted-average common units outstanding. The Partnership applies the treasury stock method to the unvested Carlyle Holdings partnership units and the “if-converted” method on the resulting number of additional Carlyle Holdings partnership units to determine the dilutive weighted-average common units represented by the unvested Carlyle Holdings partnership units.
In computing the dilutive effect that the exchange of Carlyle Holdings partnership units would have on earnings per common unit, the Partnership considered that net income available to holders of common units would decrease due to the elimination of non-controlling interests in Carlyle Holdings (including any tax impact). Based on these calculations,
227,275,453
of vested Carlyle Holdings partnership units and
2,579,831
of unvested Carlyle Holdings partnership units for the year ended December 31, 2017 were antidilutive, and therefore have been excluded.
229
The Carlyle Group L.P.
Notes to the Consolidated Financial Statements
For the year ended December 31, 2016,
222,183,911
of vested Carlyle Holdings partnership units and
293,619
of unvested Carlyle Holdings partnership units for the year ended December 31, 2016 were dilutive. As a result, the net loss of non-controlling interests in Carlyle Holdings associated with this assumed exchange of $
(32.1) million
for the year ended December 31, 2016 has been included in net income (loss) attributable to The Carlyle Group L.P. for purposes of the dilutive earnings per common unit calculation.
For the year ended December 31, 2015,
216,943,053
of vested Carlyle Holdings partnership units and
7,272,394
of unvested Carlyle Holdings partnership units were dilutive. As a result, the net loss of non-controlling interests in Carlyle Holdings associated with this assumed exchange of
$69.3 million
for the year ended December 31, 2015 has been included in net income (loss) attributable to The Carlyle Group L.P. for purposes of the dilutive earnings per common unit calculation. However, for the year ended December 31, 2015,
3,978,436
of unvested deferred restricted common units were antidilutive, and therefore have been excluded.
On August 1, 2013, as part of acquiring the remaining
40%
equity interests in AlpInvest, the Partnership issued
914,087
common units that are subject to vesting conditions. As of
December 31, 2017
,
7,782
common units remain unvested. The common units participate immediately in any Partnership distributions. Under ASC 260, these common units are considered participating securities and are required to be included in the computation of earnings per common unit pursuant to the two-class method.
14.
Equity and Equity-Based Compensation
Preferred Unit Issuance
On September 13, 2017, the Partnership issued
16,000,000
of
5.875%
Series A Preferred Units (the “Preferred Units”) for gross proceeds of
$400.0 million
, or
$387.5 million
, net of issuance costs and expenses. The Partnership plans to use the net proceeds from the sale of the Preferred Units for general corporate purposes, including to fund investments.
Distributions on the Preferred Units will be payable quarterly on March 15, June 15, September 15, and December 15 of each year, beginning on December 15, 2017, when, as and if declared by the Board of Directors of the general partner of the Partnership, at a rate per annum of
5.875%
. Distributions on the Preferred Units are discretionary and non-cumulative.
Subject to certain exceptions, unless distributions have been declared and paid or declared and set apart for payment on the Preferred Units for a quarterly distribution period, during the remainder of that distribution period, the Partnership may not repurchase any common units or any other units that are junior in rank to the Preferred Units and the Partnership may not declare or pay or set apart payment for distributions on any common or junior units for the remainder of that distribution period, other than (i) distributions of tax distribution amounts received from Carlyle Holdings in accordance with the terms of the partnership agreements of the Carlyle Holdings partnerships as in effect on the date the Preferred Units were first issued, (ii) the net unit settlement of equity-based awards granted under The Carlyle Group L.P. 2012 Equity Incentive Plan (the “Equity Incentive Plan”) (or any successor or any similar plan) in order to satisfy associated tax obligations, or (iii) distributions paid in junior units or options, warrants or rights to subscribe for or purchase other units or with proceeds from the substantially concurrent sale of junior units. These restrictions are not applicable during the period from original issue date to, but excluding, December 15, 2017.
The Preferred Units may be redeemed at the Partnership’s option, in whole or in part, at any time on or after September 15, 2022 at a price of
$25.00
per Preferred Unit, plus declared and unpaid distributions to, but excluding, the redemption date, without payment of any undeclared distributions. Holders of the Preferred Units have no right to require the redemption of the Preferred Units and there is no maturity date.
If a change of control event or tax redemption event occurs prior to September 15, 2022, the Partnership may, at its option, redeem the Preferred Units, in whole but not in part, upon at least
30 days
’ notice, within
60 days
of the occurrence of such change in control event or such tax redemption event, as applicable, at a price of
$25.25
per Preferred Unit, plus declared and unpaid distributions to, but excluding, the redemption date, without payment of any undeclared distributions. If (i) a change of control event occurs (whether before, on or after September 15, 2022) and (ii) the Partnership does not give notice prior to the 31
st
day following the change in control event to redeem all the outstanding Preferred Units, the distribution rate per annum on the Preferred Units will increase by
5.00%
, beginning on the 31
st
day following such change in control event.
230
The Carlyle Group L.P.
Notes to the Consolidated Financial Statements
If a rating agency event occurs prior to September 15, 2022, the Partnership may, at its option, redeem the Preferred Units, in whole but not in part, upon at least
30 days
’ notice, within
60 days
of the occurrence of such rating agency event, as applicable, at a price of
$25.50
per Preferred Unit, plus declared and unpaid distributions to, but excluding, the redemption date, without payment of any undeclared distributions.
The Preferred Units are not convertible into common units or any other class or series of interests or any other security. Holders of the Preferred Units will generally have no voting rights and have none of the voting rights given to holders of the Partnership’s common units, except as otherwise provided in the Partnership's limited partnership agreement.
Unit Repurchase Program
In February 2016, the Board of Directors of the general partner of the Partnership authorized the repurchase of up to
$200 million
of common units and/or Carlyle Holdings units. Under this unit repurchase program, units may be repurchased from time to time in open market transactions, in privately negotiated transactions or otherwise. The Partnership expects that the majority of repurchases under this program will be done via open market transactions. No units will be repurchased from the Partnership's executive officers under this program. The timing and actual number of common units and/or Carlyle Holdings units repurchased will depend on a variety of factors, including legal requirements, price, and economic and market conditions. This unit repurchase program may be suspended or discontinued at any time and does not have a specified expiration date. During the year ended December 31, 2017, the Partnership paid an aggregate of
$0.2 million
to repurchase and retire
14,190
units with all of the repurchases done via open market transactions. Since inception of this program, the Partnership has paid an aggregate of
$59.1 million
to repurchase and retire
3.7 million
units.
Quarterly Unit Exchange Program
Beginning in the second quarter of 2017, current and former senior Carlyle professionals are able to exchange their Carlyle Holdings partnership units for common units on a quarterly basis, subject to the terms of the Exchange Agreement. During the year ended December 31, 2017, current and former senior Carlyle professionals exchanged
6,430,383
Carlyle Holdings partnership units for common units, resulting in a reallocation of capital of
$33.9 million
from non-controlling interests in Carlyle Holdings to partners' capital and accumulated other comprehensive loss. None of Carlyle's named executive officers participated in the quarterly unit exchange.
Equity-Based Compensation
In May 2012, Carlyle Group Management L.L.C., the general partner of the Partnership, adopted The Equity Incentive Plan. The Equity Incentive Plan is a source of equity-based awards permitting the Partnership to grant to Carlyle employees, directors of the Partnership’s general partner and consultants non-qualified options, unit appreciation rights, common units, restricted common units, deferred restricted common units, phantom restricted common units and other awards based on the Partnership’s common units and Carlyle Holdings partnership units. The total number of the Partnership’s common units and Carlyle Holdings partnership units which were initially available for grant under the Equity Incentive Plan was
30,450,000
. The Equity Incentive Plan contains a provision which automatically increases the number of the Partnership’s common units and Carlyle Holdings partnership units available for grant based on a pre-determined formula; this increase occurs annually on January 1. As of January 1, 2018, pursuant to the formula, the total number of the Partnership’s common units and Carlyle Holdings partnership units available for grant under the Equity Incentive Plan was
32,645,874
.
Unvested Partnership Common Units
On August 1, 2013, the Partnership acquired the remaining
40%
equity interest in AlpInvest. As part of the transaction, the Partnership issued
914,087
common units to AlpInvest sellers who are employees of the Partnership that are subject to vesting conditions. These common units were unvested at grant and vest over a period of up to
five years
. The unvested common units are accounted for as equity-based compensation in accordance with ASC Topic 718,
Compensation – Stock Compensation
(“ASC 718”). The grant-date fair value of the unvested common units is charged to equity-based compensation on a straight-line basis over the required service period. For
the years ended December 31, 2017, 2016 and 2015
, the Partnership recorded
$0.2 million
,
$1.6 million
and
$9.0 million
in equity-based compensation expense associated with these awards, respectively.
As of
December 31, 2017
, the total unrecognized equity-based compensation expense related to unvested common units was
no
t material and is expected to be recognized within the next year.
231
The Carlyle Group L.P.
Notes to the Consolidated Financial Statements
Unvested Carlyle Holdings Partnership Units
Unvested Carlyle Holdings partnership units are held by senior Carlyle professionals and other individuals engaged in Carlyle’s business and generally vest ratably over a
six
-year period. The unvested Carlyle Holdings partnership units are accounted for as equity-based compensation in accordance with ASC 718. The grant-date fair value of the unvested Carlyle Holdings partnership units are charged to equity-based compensation expense on a straight-line basis over the required service period. The Partnership recorded equity-based compensation expense associated with these awards of
$166.4 million
,
$183.7 million
and
$191.1 million
for
the years ended December 31, 2017, 2016 and 2015
, respectively.
No
tax benefits have been recorded related to the unvested Carlyle Holdings partnership units, as the vesting of these units does not result in a tax deduction to the corporate taxpayers.
In connection with the Partnership’s investment in NGP Management in December 2012, the Partnership issued
996,572
Carlyle Holdings partnership units to ECM Capital, L.P. which vest ratably over a period of
five years
. The Partnership also issued
597,944
Carlyle Holdings partnership units to ECM Capital, L.P. that were issued at closing but vest upon the achievement of performance conditions. As disclosed in Note 5, the performance condition was removed as part of the March 2017 agreement with NGP. The fair value of these units will be recognized as a reduction to the Partnership’s investment income in NGP Management over the relevant service or performance period, based on the fair value of the units on each reporting date and adjusted for the actual fair value of the units at each vesting date. For the periods prior to 2017 for Carlyle Holdings partnership units that vest based on the achievement of performance conditions, the Partnership uses the minimum number of partnership units within the range of potential values for measurement and recognition purposes.
As of
December 31, 2017
, the total unrecognized equity-based compensation expense related to unvested Carlyle Holdings partnership units is
$55.6 million
, which is expected to be recognized over a weighted-average term of
0.3 years
Deferred Restricted Common Units
The deferred restricted common units are unvested when granted and vest ratably over a service period, which ranges up to
six years
. The grant-date fair value of the deferred restricted common units granted to Carlyle’s employees is charged to equity-based compensation expense on a straight-line basis over the required service period. Additionally, the calculation of the expense assumes a per unit discount that generally ranges up to
40.0%
, as these unvested awards do not participate in any Partnership distributions. The Partnership recorded compensation expense of
$153.7 million
,
$149.2 million
and
$176.2 million
for
the years ended December 31, 2017, 2016 and 2015
, with
$13.6 million
,
$17.2 million
and
$16.4 million
of corresponding deferred tax benefits, respectively. A portion of the accumulated deferred tax asset associated with equity-based compensation expense was reclassified as a current tax benefit due to units vesting during
the years ended December 31, 2017, 2016 and 2015
. Equity-based compensation expense generates deferred tax assets, which are realized when the units vest. The net impact of additional deferred tax assets due to equity-based compensation expense less the reduction to the deferred tax assets for units that vested was
no
t significant for the year ended December 31 2017, and was
$4.8 million
and
$2.9 million
for the years ended December 31, 2016 and 2015, respectively. As of
December 31, 2017
, the total unrecognized equity-based compensation expense related to unvested deferred restricted common units is
$154.7 million
, which is expected to be recognized over a weighted-average term of
1.9 years
.
Equity-based awards issued to non-employees are recognized as general, administrative and other expenses. The expense associated with the deferred restricted common units granted to NGP personnel by the Partnership are recognized as a reduction of the Partnership’s investment income in NGP Management. The grant-date fair value of deferred restricted common units granted to Carlyle’s non-employee directors is charged to expense on a straight-line basis over the vesting period. The cost of services received in exchange for an equity-based award issued to consultants is measured at each vesting date. Equity-based awards that require the satisfaction of future service criteria are recognized over the relevant service period, adjusted for estimated forfeitures of awards not expected to vest, based on the fair value of the award on each reporting date and adjusted for the actual fair value of the award at each vesting date. The expense for equity-based awards issued to non-employees was not significant for
the years ended December 31, 2017, 2016 and 2015
.
The vesting of deferred restricted common units creates taxable income for the Partnership's employees in certain jurisdictions. Accordingly, the employees may elect to engage the Partnership's equity plan service provider to sell sufficient common units and generate proceeds to cover their minimum tax obligations.
232
The Carlyle Group L.P.
Notes to the Consolidated Financial Statements
In February 2018, the Partnership granted approximately
13.7 million
deferred restricted common units across a significant number of the Partnership's employees. The total estimated grant-date fair value of these awards was approximately
$283 million
. The awards vest generally over a period of
12
to
60 months
.
A summary of the status of the Partnership’s non-vested equity-based awards as of
December 31, 2017
and a summary of changes from December 31, 2014 through
December 31, 2017
, are presented below:
|
|
Carlyle Holdings
|
The Carlyle Group, L.P.
|
|||||||||||||||||||||||||
|
|
|
|
Equity Settled Awards
|
Cash Settled Awards
|
|||||||||||||||||||||||
|
Unvested Units
|
Partnership
Units |
Weighted-
Average Grant Date Fair Value |
Deferred
Restricted Common Units |
Weighted-
Average Grant Date Fair Value |
Unvested
Common Units |
Weighted-
Average Grant Date Fair Value |
Phantom
Units |
Weighted-
Average Grant Date Fair Value |
|||||||||||||||||||
|
Balance, December 31, 2014
|
35,997,415
|
|
$
|
22.16
|
|
18,929,270
|
|
$
|
26.12
|
|
809,797
|
|
$
|
27.19
|
|
104,070
|
|
$
|
23.40
|
|
|||||||
|
Granted
|
—
|
|
$
|
—
|
|
6,770,420
|
|
$
|
22.39
|
|
—
|
|
$
|
—
|
|
—
|
|
$
|
—
|
|
|||||||
|
Vested
|
8,733,826
|
|
$
|
22.11
|
|
5,452,961
|
|
$
|
26.91
|
|
31,132
|
|
$
|
21.53
|
|
93,109
|
|
$
|
22.52
|
|
|||||||
|
Forfeited
|
444,477
|
|
$
|
22.00
|
|
1,826,295
|
|
$
|
24.98
|
|
11,674
|
|
$
|
27.99
|
|
4,220
|
|
$
|
24.80
|
|
|||||||
|
Balance, December 31, 2015
|
26,819,112
|
|
$
|
22.18
|
|
18,420,434
|
|
$
|
24.62
|
|
766,991
|
|
$
|
27.41
|
|
6,741
|
|
$
|
34.58
|
|
|||||||
|
Granted
|
—
|
|
$
|
—
|
|
6,730,159
|
|
$
|
11.30
|
|
—
|
|
$
|
—
|
|
—
|
|
$
|
—
|
|
|||||||
|
Vested
|
8,830,325
|
|
$
|
22.11
|
|
7,007,857
|
|
$
|
25.14
|
|
728,080
|
|
$
|
27.71
|
|
3,480
|
|
$
|
34.45
|
|
|||||||
|
Forfeited
|
748,787
|
|
$
|
22.00
|
|
1,436,816
|
|
$
|
22.91
|
|
—
|
|
$
|
—
|
|
741
|
|
$
|
34.39
|
|
|||||||
|
Balance, December 31, 2016
|
17,240,000
|
|
$
|
22.22
|
|
16,705,920
|
|
$
|
19.21
|
|
38,911
|
|
$
|
21.67
|
|
2,520
|
|
$
|
34.81
|
|
|||||||
|
Granted
|
—
|
|
$
|
—
|
|
8,260,455
|
|
$
|
14.17
|
|
—
|
|
$
|
—
|
|
—
|
|
$
|
—
|
|
|||||||
|
Vested
|
8,707,671
|
|
$
|
22.40
|
|
8,864,747
|
|
$
|
19.63
|
|
31,129
|
|
$
|
21.53
|
|
2,520
|
|
$
|
34.81
|
|
|||||||
|
Forfeited
|
437,314
|
|
$
|
22.00
|
|
582,037
|
|
$
|
19.62
|
|
—
|
|
$
|
—
|
|
—
|
|
$
|
—
|
|
|||||||
|
Balance, December 31, 2017
|
8,095,015
|
|
$
|
22.03
|
|
15,519,591
|
|
$
|
16.25
|
|
7,782
|
|
$
|
22.22
|
|
—
|
|
$
|
—
|
|
|||||||
15.
Deconsolidation of a Real Estate Development Company
The Partnership, indirectly through certain Carlyle real estate investment funds, had an investment in Urbplan Desenvolvimento Urbano S.A. (“Urbplan”), a Brazilian residential subdivision and land development company. During the year ended December 31, 2017, the Partnership disposed of its interests in Urbplan in a transaction with a third party. The third party acquired operational control and all of the economic interests in Urbplan in the transaction. Since the Partnership is no longer the primary beneficiary of Urbplan, Urbplan was deconsolidated from the Partnership's financial results. The Partnership recorded a pre-tax loss upon deconsolidation of
$65 million
during the third quarter of 2017, which includes the impact of deconsolidation, the terms of the transaction with the third party and related reserves. The loss is recorded in interest and other expenses of a real estate VIE and loss on deconsolidation in the consolidated statements of operations. Excluding the effect of this transaction, Urbplan's income before provision for income taxes prior to the transaction was not material to the Partnership's consolidated financial statements.
The Partnership concluded that Urbplan was a VIE as of September 30, 2013 because Urbplan's equity investment at risk was not sufficient to permit it to finance its activities without additional financial support. The Partnership also concluded that it was the primary beneficiary of Urbplan. As such, the Partnership began consolidating Urbplan into its consolidated financial statements as of September 30, 2013. Due to the timing and availability of financial information from Urbplan, the Partnership consolidated the financial position and results of operations of Urbplan on a financial reporting lag of
90 days
. The assets and liabilities of Urbplan were held in legal entities separate from the Partnership; the Partnership did not guarantee or assume any obligation for repayment of Urbplan’s liabilities nor were the assets of Urbplan available to meet the liquidity requirements of the Partnership.
Urbplan is party to various litigation, government investigations and proceedings, including disputes with creditors and customers. The Partnership does not believe it is probable that the outcome of any Urbplan litigation, disputes or other potential claims will materially affect the Partnership or these consolidated financial statements.
233
The Carlyle Group L.P.
Notes to the Consolidated Financial Statements
The assets and liabilities recognized in the Partnership’s consolidated balance sheets as of December 31, 2016 related to Urbplan were as follows:
|
As of December 31,
|
|||
|
2016
|
|||
|
(Dollars in millions)
|
|||
|
Receivables and inventory of a real estate VIE:
|
|||
|
Customer and other receivables
|
$
|
99.4
|
|
|
Inventory costs in excess of billings and advances
|
46.0
|
|
|
|
|
$
|
145.4
|
|
|
Other assets of a real estate VIE:
|
|
||
|
Restricted investments
|
$
|
12.7
|
|
|
Fixed assets, net
|
0.2
|
|
|
|
Deferred tax assets
|
9.1
|
|
|
|
Other assets
|
9.5
|
|
|
|
|
$
|
31.5
|
|
|
Loans payable of a real estate VIE, at fair value (principal amount of $144.4 million as of December 31, 2016)
|
$
|
79.4
|
|
|
Other liabilities of a real estate VIE:
|
|
||
|
Accounts payable
|
$
|
14.6
|
|
|
Other liabilities
|
109.9
|
|
|
|
|
$
|
124.5
|
|
The revenues and expenses recognized in the Partnership’s consolidated statements of operations for the years ended
December 31, 2017, 2016 and 2015
, related to Urbplan were as follows:
|
Year Ended December 31,
|
||||||||||||
|
2017
|
2016
|
2015
|
||||||||||
|
(Dollars in millions)
|
||||||||||||
|
Revenue of a real estate VIE:
|
||||||||||||
|
Land development services
|
$
|
104.6
|
|
$
|
69.3
|
|
$
|
80.0
|
|
|||
|
Investment income
|
4.4
|
|
25.8
|
|
6.8
|
|
||||||
|
|
$
|
109.0
|
|
$
|
95.1
|
|
$
|
86.8
|
|
|||
|
|
|
|
||||||||||
|
Interest and other expenses of a real estate VIE and loss on deconsolidation:
|
|
|
||||||||||
|
Costs of products sold and services rendered
|
$
|
64.4
|
|
$
|
31.3
|
|
$
|
48.5
|
|
|||
|
Interest expense
|
18.5
|
|
51.4
|
|
40.9
|
|
||||||
|
Change in fair value of loans payable
|
(6.6
|
)
|
(17.6
|
)
|
9.2
|
|
||||||
|
Compensation and benefits
|
2.8
|
|
8.5
|
|
10.7
|
|
||||||
|
G&A and other expenses
|
58.9
|
|
134.0
|
|
35.3
|
|
||||||
|
Loss on deconsolidation
|
64.5
|
|
—
|
|
—
|
|
—
|
|
||||
|
|
$
|
202.5
|
|
$
|
207.6
|
|
$
|
144.6
|
|
|||
The following is a summary of the significant classifications of revenues and expenses of Urbplan:
Revenue of a real estate VIE
– This balance consisted primarily of amounts earned for land development services using the completed contract method and investment income earned on Urbplan’s investments. Under the completed contract method of accounting, revenue was not recorded until the period in which the land development services contract is completed.
Interest and other expenses of a real estate VIE and loss on deconsolidation
– This balance consisted primarily of interest expense on Urbplan’s borrowings, general and administrative expenses, compensation and benefits, costs associated
234
The Carlyle Group L.P.
Notes to the Consolidated Financial Statements
with land development services, and the loss incurred upon the deconsolidation of Urbplan in the third quarter of 2017. Also included in this caption was the change in the Partnership’s estimate of the fair value of Urbplan’s loans payable during the period. Interest expense was recorded on Urbplan’s borrowings at variable rates as defined. Costs related to Urbplan’s land development services activities were capitalized until the services are complete. Costs associated with advertising, marketing and other selling activities were expensed when incurred.
16. Segment Reporting
Carlyle conducts its operations through
four
reportable segments:
Corporate Private Equity
– The Corporate Private Equity segment is comprised of the Partnership’s operations that advise a diverse group of funds that invest in buyout and growth capital transactions that focus on either a particular geography or a particular industry.
Real Assets
– The Real Assets segment is comprised of the Partnership’s operations that advise U.S. and international funds focused on real estate, infrastructure, energy and renewable energy transactions.
Global Credit
– The Global Credit segment advises a group of funds that pursue investment opportunities across various types of credit, equities and alternative instruments, and (as regards certain macroeconomic strategies) currencies, and interest rate products and their derivatives. We have now completed the exit of our hedge fund investment advisory and commodities investment advisory businesses.
Investment Solutions
– The Investment Solutions segment advises global private equity fund of funds programs and related co-investment and secondary activities through AlpInvest. This segment also includes Metropolitan, a global manager of real estate fund of funds and related co-investment and secondary activities, and, through the first quarter of 2016, Diversified Global Asset Management (“DGAM”). The Partnership wound down of the operations of DGAM throughout 2016.
The Partnership’s reportable business segments are differentiated by their various investment focuses and strategies. Overhead costs are generally allocated based on direct base compensation expense for each segment. The Partnership includes adjustments to reflect the Partnership’s economic interests in Claren Road (through January 2017) and ESG (through June 2016). Effective January 1, 2016, the Partnership's economic interest in Claren Road increased from
55%
to
63%
as a result of reallocation of interest from a departing founder. On January 31, 2017, the Partnership transferred all of its economic interests in Claren Road to its founders (see Note 9). The Partnership's earnings from its investment in NGP are presented in the respective operating captions within the Real Assets segment. The net income or loss from Urbplan allocable to the Partnership (after consideration of amounts allocable to non-controlling interests) is presented within investment income in the Real Assets segment until the third quarter of 2017 when Urbplan was deconsolidated from the Partnership's financial results (see Note 15).
Economic Income (“EI”) and its components are key performance measures used by management to make operating decisions and assess the performance of the Partnership’s reportable segments. EI was formerly defined as “Economic Net Income.” There has been no change to the computation of this measure. EI differs from income (loss) before provision for income taxes computed in accordance with U.S. GAAP in that it includes certain tax expenses associated with performance fees, and does not include net income (loss) attributable to non-Carlyle interests in consolidated entities or charges (credits) related to Carlyle corporate actions and non-recurring items. Charges (credits) related to Carlyle corporate actions and non-recurring items include: charges associated with equity-based compensation that was issued in the initial public offering in May 2012 or is issued in acquisitions or strategic investments, changes in the tax receivable agreement liability, amortization and any impairment charges associated with acquired intangible assets, transaction costs associated with acquisitions, charges associated with earnouts and contingent consideration including gains and losses associated with the estimated fair value of contingent consideration issued in conjunction with acquisitions or strategic investments, gains and losses from the retirement of debt, charges associated with contract terminations and employee severance.
Fee Related Earnings (“FRE”) is a component of EI and is used to assess the ability of the business to cover direct base compensation and operating expenses from total fee revenues. FRE differs from income (loss) before provision for income taxes computed in accordance with U.S. GAAP in that it adjusts for the items included in the calculation of EI and also adjusts EI to exclude net performance fees, investment income from investments in Carlyle funds, equity-based compensation, net interest (interest income less interest expense), and certain general, administrative and other expenses when the timing of any future payment is uncertain. As of December 31, 2017, the Partnership updated the definition of FRE to exclude net interest
235
The Carlyle Group L.P.
Notes to the Consolidated Financial Statements
(interest income less interest expense) in our segment results. FRE for all prior periods presented has been recast to reflect the updated definition.
Distributable Earnings (“DE”) is FRE plus realized net performance fees, realized investment income, and net interest, and is used to assess performance and amounts potentially available for distribution. DE is used by management primarily in making resource deployment and compensation decisions across the Partnership’s
four
reportable segments. Management also uses Distributable Earnings in our budgeting, forecasting, and the overall management of our segments. Management makes operating decisions and assesses the performance of each of the Partnership’s business segments based on financial and operating metrics and data that is presented without the consolidation of any of the Consolidated Funds. Consequently, the key performance measures discussed above and all segment data exclude the assets, liabilities and operating results related to the Consolidated Funds.
236
The Carlyle Group L.P.
Notes to the Consolidated Financial Statements
The following tables present the financial data for the Partnership’s
four
reportable segments as of and for the year ended
December 31, 2017
:
|
|
December 31, 2017 and the Year Then Ended
|
||||||||||||||||||
|
|
Corporate
Private Equity |
Real Assets
|
Global Credit
|
Investment
Solutions |
Total
|
||||||||||||||
|
|
(Dollars in millions)
|
||||||||||||||||||
|
Segment Revenues
|
|||||||||||||||||||
|
Fund level fee revenues
|
|||||||||||||||||||
|
Fund management fees
|
$
|
471.0
|
|
$
|
263.6
|
|
$
|
191.5
|
|
$
|
154.9
|
|
$
|
1,081.0
|
|
||||
|
Portfolio advisory fees, net
|
15.2
|
|
0.8
|
|
0.7
|
|
—
|
|
16.7
|
|
|||||||||
|
Transaction fees, net
|
22.4
|
|
4.5
|
|
—
|
|
—
|
|
26.9
|
|
|||||||||
|
Total fund level fee revenues
|
508.6
|
|
268.9
|
|
192.2
|
|
154.9
|
|
1,124.6
|
|
|||||||||
|
Performance fees
|
|||||||||||||||||||
|
Realized
|
831.5
|
|
92.0
|
|
75.4
|
|
86.4
|
|
1,085.3
|
|
|||||||||
|
Unrealized
|
781.6
|
|
268.3
|
|
(16.3
|
)
|
56.0
|
|
1,089.6
|
|
|||||||||
|
Total performance fees
|
1,613.1
|
|
360.3
|
|
59.1
|
|
142.4
|
|
2,174.9
|
|
|||||||||
|
Investment income (loss)
|
|||||||||||||||||||
|
Realized
|
25.4
|
|
(63.2
|
)
|
11.9
|
|
0.1
|
|
(25.8
|
)
|
|||||||||
|
Unrealized
|
37.0
|
|
26.7
|
|
5.4
|
|
3.9
|
|
73.0
|
|
|||||||||
|
Total investment income (loss)
|
62.4
|
|
(36.5
|
)
|
17.3
|
|
4.0
|
|
47.2
|
|
|||||||||
|
Interest income
|
5.5
|
|
3.0
|
|
7.1
|
|
1.1
|
|
16.7
|
|
|||||||||
|
Other income
|
6.0
|
|
2.2
|
|
6.8
|
|
0.4
|
|
15.4
|
|
|||||||||
|
Total revenues
|
2,195.6
|
|
597.9
|
|
282.5
|
|
302.8
|
|
3,378.8
|
|
|||||||||
|
Segment Expenses
|
|||||||||||||||||||
|
Compensation and benefits
|
|||||||||||||||||||
|
Direct base compensation
|
235.7
|
|
77.6
|
|
79.2
|
|
72.0
|
|
464.5
|
|
|||||||||
|
Indirect base compensation
|
105.0
|
|
50.5
|
|
25.3
|
|
12.7
|
|
193.5
|
|
|||||||||
|
Equity-based compensation
|
60.5
|
|
34.9
|
|
20.7
|
|
7.8
|
|
123.9
|
|
|||||||||
|
Performance fee related
|
|||||||||||||||||||
|
Realized
|
372.9
|
|
41.6
|
|
35.0
|
|
83.2
|
|
532.7
|
|
|||||||||
|
Unrealized
|
362.6
|
|
75.3
|
|
(7.3
|
)
|
33.8
|
|
464.4
|
|
|||||||||
|
Total compensation and benefits
|
1,136.7
|
|
279.9
|
|
152.9
|
|
209.5
|
|
1,779.0
|
|
|||||||||
|
General, administrative, and other indirect expenses
|
119.8
|
|
78.5
|
|
3.3
|
|
32.3
|
|
233.9
|
|
|||||||||
|
Depreciation and amortization expense
|
15.3
|
|
7.1
|
|
5.1
|
|
3.6
|
|
31.1
|
|
|||||||||
|
Interest expense
|
27.9
|
|
17.0
|
|
14.5
|
|
6.1
|
|
65.5
|
|
|||||||||
|
Total expenses
|
1,299.7
|
|
382.5
|
|
175.8
|
|
251.5
|
|
2,109.5
|
|
|||||||||
|
Economic Income
|
$
|
895.9
|
|
$
|
215.4
|
|
$
|
106.7
|
|
$
|
51.3
|
|
$
|
1,269.3
|
|
||||
|
(-) Net Performance Fees
|
877.6
|
|
243.4
|
|
31.4
|
|
25.4
|
|
1,177.8
|
|
|||||||||
|
(-) Investment Income (Loss)
|
62.4
|
|
(36.5
|
)
|
17.3
|
|
4.0
|
|
47.2
|
|
|||||||||
|
(+) Equity-based Compensation
|
60.5
|
|
34.9
|
|
20.7
|
|
7.8
|
|
123.9
|
|
|||||||||
|
(+) Net Interest
|
22.4
|
|
14.0
|
|
7.4
|
|
5.0
|
|
48.8
|
|
|||||||||
|
(+) Reserve for Litigation and Contingencies
|
(12.5
|
)
|
(5.8
|
)
|
(4.1
|
)
|
(2.6
|
)
|
(25.0
|
)
|
|||||||||
|
(=) Fee Related Earnings
|
$
|
26.3
|
|
$
|
51.6
|
|
$
|
82.0
|
|
$
|
32.1
|
|
$
|
192.0
|
|
||||
|
(+) Realized Net Performance Fees
|
458.6
|
|
50.4
|
|
40.4
|
|
3.2
|
|
552.6
|
|
|||||||||
|
(+) Realized Investment Income (Loss)
|
25.4
|
|
(63.2
|
)
|
11.9
|
|
0.1
|
|
(25.8
|
)
|
|||||||||
|
(+) Net Interest
|
(22.4
|
)
|
(14.0
|
)
|
(7.4
|
)
|
(5.0
|
)
|
(48.8
|
)
|
|||||||||
|
(=) Distributable Earnings
|
$
|
487.9
|
|
$
|
24.8
|
|
$
|
126.9
|
|
$
|
30.4
|
|
$
|
670.0
|
|
||||
|
Segment assets as of December 31, 2017
|
$
|
3,644.6
|
|
$
|
1,946.3
|
|
$
|
881.0
|
|
$
|
1,071.2
|
|
$
|
7,543.1
|
|
||||
237
The Carlyle Group L.P.
Notes to the Consolidated Financial Statements
The following tables present the financial data for the Partnership’s
four
reportable segments as of and for the year ended
December 31, 2016
:
|
|
December 31, 2016 and the Year Then Ended
|
||||||||||||||||||
|
|
Corporate
Private Equity |
Real Assets
|
Global Credit
|
|
Investment
Solutions |
|
Total
|
||||||||||||
|
|
(Dollars in millions)
|
||||||||||||||||||
|
Segment Revenues
|
|
|
|
|
|
||||||||||||||
|
Fund level fee revenues
|
|
|
|
|
|
|
|
||||||||||||
|
Fund management fees
|
$
|
498.9
|
|
$
|
251.1
|
|
$
|
195.5
|
|
$
|
140.3
|
|
|
$
|
1,085.8
|
|
|||
|
Portfolio advisory fees, net
|
14.5
|
|
0.2
|
|
1.1
|
|
|
0.8
|
|
|
16.6
|
|
|||||||
|
Transaction fees, net
|
31.2
|
|
—
|
|
—
|
|
|
—
|
|
|
31.2
|
|
|||||||
|
Total fund level fee revenues
|
544.6
|
|
251.3
|
|
196.6
|
|
141.1
|
|
|
1,133.6
|
|
||||||||
|
Performance fees
|
|
|
|
||||||||||||||||
|
Realized
|
1,060.5
|
|
53.1
|
|
36.6
|
|
65.6
|
|
|
1,215.8
|
|
||||||||
|
Unrealized
|
(777.5
|
)
|
274.0
|
|
1.2
|
|
38.2
|
|
|
(464.1
|
)
|
||||||||
|
Total performance fees
|
283.0
|
|
327.1
|
|
37.8
|
|
|
103.8
|
|
|
751.7
|
|
|||||||
|
Investment income (loss)
|
|
|
|
|
|||||||||||||||
|
Realized
|
60.3
|
|
(20.6
|
)
|
5.1
|
|
|
0.1
|
|
|
44.9
|
|
|||||||
|
Unrealized
|
(11.0
|
)
|
1.4
|
|
15.3
|
|
|
(0.3
|
)
|
|
5.4
|
|
|||||||
|
Total investment income (loss)
|
49.3
|
|
(19.2
|
)
|
20.4
|
|
(0.2
|
)
|
|
50.3
|
|
||||||||
|
Interest income
|
3.4
|
|
1.7
|
|
4.7
|
|
0.4
|
|
10.2
|
|
|||||||||
|
Other income
|
6.0
|
|
1.6
|
|
4.7
|
|
0.5
|
|
12.8
|
|
|||||||||
|
Total revenues
|
886.3
|
|
562.5
|
|
264.2
|
|
245.6
|
|
|
1,958.6
|
|
||||||||
|
Segment Expenses
|
|
|
|||||||||||||||||
|
Compensation and benefits
|
|
|
|
|
|||||||||||||||
|
Direct base compensation
|
210.8
|
|
72.1
|
|
87.4
|
|
66.8
|
|
|
437.1
|
|
||||||||
|
Indirect base compensation
|
78.8
|
|
39.1
|
|
32.6
|
|
|
13.7
|
|
|
164.2
|
|
|||||||
|
Equity-based compensation
|
69.3
|
|
26.3
|
|
17.6
|
|
|
6.4
|
|
|
119.6
|
|
|||||||
|
Performance fee related
|
|
|
|
|
|||||||||||||||
|
Realized
|
472.1
|
|
37.6
|
|
17.6
|
|
|
63.2
|
|
590.5
|
|
||||||||
|
Unrealized
|
(342.6
|
)
|
81.9
|
|
0.6
|
|
27.6
|
|
|
(232.5
|
)
|
||||||||
|
Total compensation and benefits
|
488.4
|
|
257.0
|
|
155.8
|
|
|
177.7
|
|
|
1,078.9
|
|
|||||||
|
General, administrative, and other indirect expenses
|
131.9
|
|
67.1
|
|
250.0
|
|
|
34.5
|
|
|
483.5
|
|
|||||||
|
Depreciation and amortization expense
|
13.6
|
|
5.9
|
|
6.2
|
|
3.3
|
|
|
29.0
|
|
||||||||
|
Interest expense
|
28.2
|
|
16.0
|
|
11.3
|
|
5.8
|
|
61.3
|
|
|||||||||
|
Total expenses
|
662.1
|
|
346.0
|
|
423.3
|
|
|
221.3
|
|
|
1,652.7
|
|
|||||||
|
Economic Income (Loss)
|
$
|
224.2
|
|
$
|
216.5
|
|
$
|
(159.1
|
)
|
$
|
24.3
|
|
$
|
305.9
|
|
||||
|
(-) Net Performance Fees
|
153.5
|
|
207.6
|
|
19.6
|
|
13.0
|
|
393.7
|
|
|||||||||
|
(-) Investment Income (Loss)
|
49.3
|
|
(19.2
|
)
|
20.4
|
|
|
(0.2
|
)
|
|
50.3
|
|
|||||||
|
(+) Equity-based Compensation
|
69.3
|
|
26.3
|
|
17.6
|
|
|
6.4
|
|
|
119.6
|
|
|||||||
|
(+) Net Interest
|
24.8
|
|
14.3
|
|
6.6
|
|
5.4
|
|
51.1
|
|
|||||||||
|
(=) Fee Related Earnings
|
$
|
115.5
|
|
$
|
68.7
|
|
$
|
(174.9
|
)
|
|
$
|
23.3
|
|
$
|
32.6
|
|
|||
|
(+) Realized Net Performance Fees
|
588.4
|
|
15.5
|
|
19.0
|
|
|
2.4
|
|
|
625.3
|
|
|||||||
|
(+) Realized Investment Income (Loss)
|
60.3
|
|
(20.6
|
)
|
5.1
|
|
|
0.1
|
|
|
44.9
|
|
|||||||
|
(+) Net Interest
|
(24.8
|
)
|
(14.3
|
)
|
(6.6
|
)
|
(5.4
|
)
|
(51.1
|
)
|
|||||||||
|
(=) Distributable Earnings
|
$
|
739.4
|
|
$
|
49.3
|
|
$
|
(157.4
|
)
|
$
|
20.4
|
|
|
$
|
651.7
|
|
|||
|
Segment assets as of December 31, 2016
|
$
|
2,435.8
|
|
$
|
1,515.0
|
|
$
|
656.4
|
|
|
$
|
850.1
|
|
$
|
5,457.3
|
|
|||
238
The Carlyle Group L.P.
Notes to the Consolidated Financial Statements
The following tables present the financial data for the Partnership’s
four
reportable segments for the year ended
December 31, 2015
:
|
|
Year Ended December 31, 2015
|
||||||||||||||||||
|
|
Corporate
Private Equity |
Real Assets
|
Global Credit
|
Investment
Solutions |
Total
|
||||||||||||||
|
|
(Dollars in millions)
|
||||||||||||||||||
|
Segment Revenues
|
|||||||||||||||||||
|
Fund level fee revenues
|
|||||||||||||||||||
|
Fund management fees
|
$
|
577.4
|
|
$
|
255.9
|
|
$
|
210.7
|
|
$
|
153.9
|
|
$
|
1,197.9
|
|
||||
|
Portfolio advisory fees, net
|
14.3
|
|
0.4
|
|
0.7
|
|
—
|
|
15.4
|
|
|||||||||
|
Transaction fees, net
|
7.7
|
|
2.1
|
|
—
|
|
—
|
|
9.8
|
|
|||||||||
|
Total fund level fee revenues
|
599.4
|
|
258.4
|
|
211.4
|
|
153.9
|
|
1,223.1
|
|
|||||||||
|
Performance fees
|
|||||||||||||||||||
|
Realized
|
1,209.5
|
|
163.2
|
|
38.0
|
|
24.1
|
|
1,434.8
|
|
|||||||||
|
Unrealized
|
(523.1
|
)
|
(42.5
|
)
|
(63.1
|
)
|
103.6
|
|
(525.1
|
)
|
|||||||||
|
Total performance fees
|
686.4
|
|
120.7
|
|
(25.1
|
)
|
127.7
|
|
909.7
|
|
|||||||||
|
Investment income (loss)
|
|||||||||||||||||||
|
Realized
|
23.3
|
|
(93.6
|
)
|
5.4
|
|
0.1
|
|
(64.8
|
)
|
|||||||||
|
Unrealized
|
(5.2
|
)
|
63.1
|
|
(15.7
|
)
|
0.2
|
|
42.4
|
|
|||||||||
|
Total investment income (loss)
|
18.1
|
|
(30.5
|
)
|
(10.3
|
)
|
0.3
|
|
(22.4
|
)
|
|||||||||
|
Interest income
|
1.5
|
|
0.3
|
|
2.8
|
|
0.2
|
|
4.8
|
|
|||||||||
|
Other income
|
9.8
|
|
2.6
|
|
3.9
|
|
0.9
|
|
17.2
|
|
|||||||||
|
Total revenues
|
1,315.2
|
|
351.5
|
|
182.7
|
|
283.0
|
|
2,132.4
|
|
|||||||||
|
Segment Expenses
|
|||||||||||||||||||
|
Compensation and benefits
|
|||||||||||||||||||
|
Direct base compensation
|
224.2
|
|
70.0
|
|
101.2
|
|
82.3
|
|
477.7
|
|
|||||||||
|
Indirect base compensation
|
91.5
|
|
39.3
|
|
28.3
|
|
13.0
|
|
172.1
|
|
|||||||||
|
Equity-based compensation
|
65.1
|
|
25.0
|
|
19.0
|
|
12.4
|
|
121.5
|
|
|||||||||
|
Performance fee related
|
|||||||||||||||||||
|
Realized
|
540.9
|
|
68.5
|
|
16.6
|
|
20.3
|
|
646.3
|
|
|||||||||
|
Unrealized
|
(221.7
|
)
|
26.3
|
|
(27.7
|
)
|
94.8
|
|
(128.3
|
)
|
|||||||||
|
Total compensation and benefits
|
700.0
|
|
229.1
|
|
137.4
|
|
222.8
|
|
1,289.3
|
|
|||||||||
|
General, administrative, and other indirect expenses
|
172.4
|
|
74.6
|
|
69.8
|
|
46.0
|
|
362.8
|
|
|||||||||
|
Depreciation and amortization expense
|
12.5
|
|
4.3
|
|
5.0
|
|
3.8
|
|
25.6
|
|
|||||||||
|
Interest expense
|
30.8
|
|
10.6
|
|
10.8
|
|
5.9
|
|
58.1
|
|
|||||||||
|
Total expenses
|
915.7
|
|
318.6
|
|
223.0
|
|
278.5
|
|
1,735.8
|
|
|||||||||
|
Economic Income (Loss)
|
$
|
399.5
|
|
$
|
32.9
|
|
$
|
(40.3
|
)
|
$
|
4.5
|
|
$
|
396.6
|
|
||||
|
(-) Net Performance Fees
|
367.2
|
|
25.9
|
|
(14.0
|
)
|
12.6
|
|
391.7
|
|
|||||||||
|
(-) Investment Income (Loss)
|
18.1
|
|
(30.5
|
)
|
(10.3
|
)
|
0.3
|
|
(22.4
|
)
|
|||||||||
|
(+) Equity-based Compensation
|
65.1
|
|
25.0
|
|
19.0
|
|
12.4
|
|
121.5
|
|
|||||||||
|
(+) Net Interest
|
29.3
|
|
10.3
|
|
8.0
|
|
5.7
|
|
53.3
|
|
|||||||||
|
(+) Reserve for Litigation and Contingencies
|
26.8
|
|
9.2
|
|
9.0
|
|
5.0
|
|
50.0
|
|
|||||||||
|
(=) Fee Related Earnings
|
$
|
135.4
|
|
$
|
82.0
|
|
$
|
20.0
|
|
$
|
14.7
|
|
$
|
252.1
|
|
||||
|
(+) Realized Net Performance Fees
|
668.6
|
|
94.7
|
|
21.4
|
|
3.8
|
|
788.5
|
|
|||||||||
|
(+) Realized Investment Income (loss)
|
23.3
|
|
(93.6
|
)
|
5.4
|
|
0.1
|
|
(64.8
|
)
|
|||||||||
|
(+) Net Interest
|
(29.3
|
)
|
(10.3
|
)
|
(8.0
|
)
|
(5.7
|
)
|
(53.3
|
)
|
|||||||||
|
(=) Distributable Earnings
|
$
|
798.0
|
|
$
|
72.8
|
|
$
|
38.8
|
|
$
|
12.9
|
|
$
|
922.5
|
|
||||
239
The Carlyle Group L.P.
Notes to the Consolidated Financial Statements
The following tables reconcile the Total Segments to the Partnership’s Total Assets and Income Before Provision for Income Taxes as of and for the years ended
December 31, 2017 and 2016
:
|
|
December 31, 2017 and the Year then Ended
|
||||||||||||||||
|
|
Total Reportable
Segments |
Consolidated
Funds |
Reconciling
Items |
|
Carlyle
Consolidated |
||||||||||||
|
|
(Dollars in millions)
|
||||||||||||||||
|
Revenues
|
$
|
3,378.8
|
|
$
|
177.7
|
|
$
|
119.7
|
|
(a)
|
$
|
3,676.2
|
|
||||
|
Expenses
|
$
|
2,109.5
|
|
$
|
240.4
|
|
$
|
282.4
|
|
(b)
|
$
|
2,632.3
|
|
||||
|
Other income
|
$
|
—
|
|
$
|
123.5
|
|
$
|
(35.1
|
)
|
(c)
|
$
|
88.4
|
|
||||
|
Economic income
|
$
|
1,269.3
|
|
$
|
60.8
|
|
$
|
(197.8
|
)
|
(d)
|
$
|
1,132.3
|
|
||||
|
Total assets
|
$
|
7,543.1
|
|
$
|
4,962.7
|
|
$
|
(225.2
|
)
|
(e)
|
$
|
12,280.6
|
|
||||
|
|
December 31, 2016 and the Year then Ended
|
||||||||||||||||
|
|
Total Reportable
Segments |
Consolidated
Funds |
Reconciling
Items |
|
Carlyle
Consolidated |
||||||||||||
|
|
(Dollars in millions)
|
||||||||||||||||
|
Revenues
|
$
|
1,958.6
|
|
$
|
166.9
|
|
$
|
148.8
|
|
(a)
|
$
|
2,274.3
|
|
||||
|
Expenses
|
$
|
1,652.7
|
|
$
|
153.1
|
|
$
|
436.3
|
|
(b)
|
$
|
2,242.1
|
|
||||
|
Other income
|
$
|
—
|
|
$
|
13.1
|
|
$
|
—
|
|
(c)
|
$
|
13.1
|
|
||||
|
Economic income
|
$
|
305.9
|
|
$
|
26.9
|
|
$
|
(287.5
|
)
|
(d)
|
$
|
45.3
|
|
||||
|
Total assets
|
$
|
5,457.3
|
|
$
|
4,684.7
|
|
$
|
(169.0
|
)
|
(e)
|
$
|
9,973.0
|
|
||||
The following table reconciles the Total Segments to the Partnership’s Income Before Provision for Income Taxes for the year ended
December 31, 2015
:
|
|
Year Ended December 31, 2015
|
||||||||||||||||
|
|
Total Reportable
Segments |
Consolidated
Funds |
Reconciling
Items |
|
Carlyle
Consolidated |
||||||||||||
|
|
(Dollars in millions)
|
||||||||||||||||
|
Revenues
|
$
|
2,132.4
|
|
$
|
975.5
|
|
$
|
(101.7
|
)
|
(a)
|
$
|
3,006.2
|
|
||||
|
Expenses
|
$
|
1,735.8
|
|
$
|
1,258.8
|
|
$
|
473.8
|
|
(b)
|
$
|
3,468.4
|
|
||||
|
Other income
|
$
|
—
|
|
$
|
886.9
|
|
$
|
(22.5
|
)
|
(c)
|
$
|
864.4
|
|
||||
|
Economic income
|
$
|
396.6
|
|
$
|
603.6
|
|
$
|
(598.0
|
)
|
(d)
|
$
|
402.2
|
|
||||
|
(a)
|
The Revenues adjustment principally represents fund management and performance fees earned from the Consolidated Funds that were eliminated in consolidation to arrive at the Partnership’s total revenues, adjustments for amounts attributable to non-controlling interests in consolidated entities, adjustments related to expenses associated with the investments in NGP Management and its affiliates that are included in operating captions or are excluded from the segment results, adjustments to reflect the Partnership’s share of Urbplan’s net losses as a component of investment income until Urbplan was deconsolidated during the third quarter of 2017, the inclusion of tax expenses associated with certain performance fees, and adjustments to reflect the Partnership’s ownership interests in Claren Road (through January 2017) and ESG (through June 2016) that were included in Revenues in the Partnership’s segment reporting.
|
240
The Carlyle Group L.P.
Notes to the Consolidated Financial Statements
|
(b)
|
The Expenses adjustment represents the elimination of intercompany expenses of the Consolidated Funds payable to the Partnership, the inclusion of certain tax expenses associated with performance fee compensation, adjustments related to expenses associated with the investment in NGP Management that are included in operating captions, adjustments to reflect the Partnership’s share of Urbplan’s net losses as a component of investment income until Urbplan was deconsolidated during the third quarter of 2017, changes in the tax receivable agreement liability, charges and credits associated with Carlyle corporate actions and non-recurring items and adjustments to reflect the Partnership’s economic interests in Claren Road (through January 2017) and ESG (through June 2016) as detailed below (Dollars in millions):
|
|
|
Year Ended December 31,
|
||||||||||
|
|
2017
|
2016
|
2015
|
||||||||
|
Equity-based compensation issued in conjunction with the initial public offering, acquisitions and strategic investments
|
$
|
241.2
|
|
$
|
223.4
|
|
$
|
259.8
|
|
||
|
Acquisition related charges and amortization of intangibles and impairment
|
35.7
|
|
94.2
|
|
288.8
|
|
|||||
|
Other non-operating (income) expense
|
(71.4
|
)
|
(11.2
|
)
|
(7.4
|
)
|
|||||
|
Tax provision associated with performance fees
|
(9.2
|
)
|
(15.1
|
)
|
(14.9
|
)
|
|||||
|
Non-Carlyle economic interests in acquired business
|
115.7
|
|
159.0
|
|
160.3
|
|
|||||
|
Severance and other adjustments
|
13.2
|
|
10.6
|
|
6.7
|
|
|||||
|
Elimination of expenses of Consolidated Funds
|
(42.8
|
)
|
(24.6
|
)
|
(219.5
|
)
|
|||||
|
$
|
282.4
|
|
$
|
436.3
|
|
$
|
473.8
|
|
|||
|
(c)
|
The Other Income (Loss) adjustment results from the Consolidated Funds which were eliminated in consolidation to arrive at the Partnership’s total Other Income (Loss).
|
|
(d)
|
The following table is a reconciliation of Income Before Provision for Income Taxes to Economic Income, to Fee Related Earnings, and to Distributable Earnings (Dollars in millions):
|
|
|
Year Ended December 31,
|
||||||||||
|
|
2017
|
2016
|
2015
|
||||||||
|
Income before provision for income taxes
|
$
|
1,132.3
|
|
$
|
45.3
|
|
$
|
402.2
|
|
||
|
Adjustments:
|
|||||||||||
|
Equity-based compensation issued in conjunction with the initial public offering, acquisitions and strategic investments
|
241.2
|
|
223.4
|
|
259.8
|
|
|||||
|
Acquisition related charges and amortization of intangibles and impairment
|
35.7
|
|
94.2
|
|
288.8
|
|
|||||
|
Other non-operating (income) expense
(1)
|
(71.4
|
)
|
(11.2
|
)
|
(7.4
|
)
|
|||||
|
Tax provision associated with performance fees
|
(9.2
|
)
|
(15.1
|
)
|
(14.9
|
)
|
|||||
|
Net income attributable to non-controlling interests in Consolidated entities
|
(72.5
|
)
|
(41.0
|
)
|
(537.9
|
)
|
|||||
|
Severance and other adjustments
|
13.2
|
|
10.3
|
|
6.0
|
|
|||||
|
Economic Income
|
$
|
1,269.3
|
|
$
|
305.9
|
|
$
|
396.6
|
|
||
|
Net performance fees
(2)
|
1,177.8
|
|
393.7
|
|
391.7
|
|
|||||
|
Investment income (loss)
(2)
|
47.2
|
|
50.3
|
|
(22.4
|
)
|
|||||
|
Equity-based compensation
|
123.9
|
|
119.6
|
|
121.5
|
|
|||||
|
Net Interest
|
48.8
|
|
51.1
|
|
53.3
|
|
|||||
|
Reserve for litigation and contingencies
|
(25.0
|
)
|
—
|
|
50.0
|
|
|||||
|
Fee Related Earnings
|
$
|
192.0
|
|
$
|
32.6
|
|
$
|
252.1
|
|
||
|
Realized performance fees, net of related compensation
|
552.6
|
|
625.3
|
|
788.5
|
|
|||||
|
Realized investment income (loss)
(2)
|
(25.8
|
)
|
44.9
|
|
(64.8
|
)
|
|||||
|
Net Interest
|
(48.8
|
)
|
(51.1
|
)
|
(53.3
|
)
|
|||||
|
Distributable Earnings
|
$
|
670.0
|
|
$
|
651.7
|
|
$
|
922.5
|
|
||
241
The Carlyle Group L.P.
Notes to the Consolidated Financial Statements
(1) Included in other non-operating (income) expense for the year ended December 31, 2017 is a
$71.5 million
adjustment for the revaluation of the tax receivable agreement liability as result of the passage of the Tax Cuts and Jobs Act of 2017.
(2) See reconciliation to most directly comparable U.S. GAAP measure below:
|
|
Year Ended December 31, 2017
|
||||||||||
|
|
Carlyle
Consolidated |
Adjustments
(3)
|
Total
Reportable Segments |
||||||||
|
|
(Dollars in millions)
|
||||||||||
|
Performance fees
|
|||||||||||
|
Realized
|
$
|
1,097.3
|
|
$
|
(12.0
|
)
|
$
|
1,085.3
|
|
||
|
Unrealized
|
996.6
|
|
93.0
|
|
1,089.6
|
|
|||||
|
Total performance fees
|
2,093.9
|
|
81.0
|
|
2,174.9
|
|
|||||
|
Performance fee related compensation expense
|
|||||||||||
|
Realized
|
520.7
|
|
12.0
|
|
532.7
|
|
|||||
|
Unrealized
|
467.6
|
|
(3.2
|
)
|
464.4
|
|
|||||
|
Total performance fee related compensation expense
|
988.3
|
|
8.8
|
|
997.1
|
|
|||||
|
Net performance fees
|
|||||||||||
|
Realized
|
576.6
|
|
(24.0
|
)
|
552.6
|
|
|||||
|
Unrealized
|
529.0
|
|
96.2
|
|
625.2
|
|
|||||
|
Total net performance fees
|
$
|
1,105.6
|
|
$
|
72.2
|
|
$
|
1,177.8
|
|
||
|
Investment income (loss)
|
|||||||||||
|
Realized
|
$
|
70.4
|
|
$
|
(96.2
|
)
|
$
|
(25.8
|
)
|
||
|
Unrealized
|
161.6
|
|
(88.6
|
)
|
73.0
|
|
|||||
|
Total investment income (loss)
|
$
|
232.0
|
|
$
|
(184.8
|
)
|
$
|
47.2
|
|
||
|
|
Year Ended December 31, 2016
|
||||||||||
|
|
Carlyle
Consolidated |
Adjustments
(3)
|
Total
Reportable Segments |
||||||||
|
|
(Dollars in millions)
|
||||||||||
|
Performance fees
|
|||||||||||
|
Realized
|
$
|
1,129.5
|
|
$
|
86.3
|
|
$
|
1,215.8
|
|
||
|
Unrealized
|
(377.7
|
)
|
(86.4
|
)
|
(464.1
|
)
|
|||||
|
Total performance fees
|
751.8
|
|
(0.1
|
)
|
751.7
|
|
|||||
|
Performance fee related compensation expense
|
|||||||||||
|
Realized
|
580.5
|
|
10.0
|
|
590.5
|
|
|||||
|
Unrealized
|
(227.4
|
)
|
(5.1
|
)
|
(232.5
|
)
|
|||||
|
Total performance fee related compensation expense
|
353.1
|
|
4.9
|
|
358.0
|
|
|||||
|
Net performance fees
|
|||||||||||
|
Realized
|
549.0
|
|
76.3
|
|
625.3
|
|
|||||
|
Unrealized
|
(150.3
|
)
|
(81.3
|
)
|
(231.6
|
)
|
|||||
|
Total net performance fees
|
$
|
398.7
|
|
$
|
(5.0
|
)
|
$
|
393.7
|
|
||
|
Investment income (loss)
|
|||||||||||
|
Realized
|
$
|
112.9
|
|
$
|
(68.0
|
)
|
$
|
44.9
|
|
||
|
Unrealized
|
47.6
|
|
(42.2
|
)
|
5.4
|
|
|||||
|
Total investment income (loss)
|
$
|
160.5
|
|
$
|
(110.2
|
)
|
$
|
50.3
|
|
||
242
The Carlyle Group L.P.
Notes to the Consolidated Financial Statements
|
|
Year Ended December 31, 2015
|
||||||||||
|
|
Carlyle
Consolidated |
Adjustments
(3)
|
Total
Reportable Segments |
||||||||
|
|
(Dollars in millions)
|
||||||||||
|
Performance fees
|
|||||||||||
|
Realized
|
$
|
1,441.9
|
|
$
|
(7.1
|
)
|
$
|
1,434.8
|
|
||
|
Unrealized
|
(617.0
|
)
|
91.9
|
|
(525.1
|
)
|
|||||
|
Total performance fees
|
824.9
|
|
84.8
|
|
909.7
|
|
|||||
|
Performance fee related compensation expense
|
|||||||||||
|
Realized
|
650.5
|
|
(4.2
|
)
|
646.3
|
|
|||||
|
Unrealized
|
(139.6
|
)
|
11.3
|
|
(128.3
|
)
|
|||||
|
Total performance fee related compensation expense
|
510.9
|
|
7.1
|
|
518.0
|
|
|||||
|
Net performance fees
|
|||||||||||
|
Realized
|
791.4
|
|
(2.9
|
)
|
788.5
|
|
|||||
|
Unrealized
|
(477.4
|
)
|
80.6
|
|
(396.8
|
)
|
|||||
|
Total net performance fees
|
$
|
314.0
|
|
$
|
77.7
|
|
$
|
391.7
|
|
||
|
Investment income
|
|||||||||||
|
Realized
|
$
|
32.9
|
|
$
|
(97.7
|
)
|
$
|
(64.8
|
)
|
||
|
Unrealized
|
(17.7
|
)
|
60.1
|
|
42.4
|
|
|||||
|
Total investment income
|
$
|
15.2
|
|
$
|
(37.6
|
)
|
$
|
(22.4
|
)
|
||
|
(3)
|
Adjustments to performance fees and investment income (loss) relate to (i) amounts earned from the Consolidated Funds, which were eliminated in the U.S. GAAP consolidation but were included in the segment results, (ii) amounts attributable to non-controlling interests in consolidated entities, which were excluded from the segment results and (iii) the reclassification of NGP performance fees, which are included in investment income in the U.S. GAAP financial statements, and (iv) the reclassification of certain tax expenses associated with performance fees. Adjustments to investment income (loss) also include the reclassification of earnings for the investments in NGP Management and its affiliates to the appropriate operating captions for the segment results, the exclusion of charges associated with the investment in NGP Management and its affiliates that are excluded from the segment results, and adjustments to reflect the Partnership’s share of Urbplan’s net losses as investment losses for the segment results until Urbplan was deconsolidated during the third quarter of 2017. Adjustments are also included in these financial statement captions to reflect the Partnership’s economic interest in Claren Road (through January 2017) and ESG (through June 2016).
|
|
(e)
|
The Total Assets adjustment represents the addition of the assets of the Consolidated Funds that were eliminated in consolidation to arrive at the Partnership’s total assets.
|
243
The Carlyle Group L.P.
Notes to the Consolidated Financial Statements
Information by Geographic Location
Carlyle primarily transacts business in the United States and a significant amount of its revenues are generated domestically. The Partnership has established investment vehicles whose primary focus is making investments in specified geographical locations. The tables below present consolidated revenues and assets based on the geographical focus of the associated investment vehicle.
|
|
Total Revenues
|
Total Assets
|
|||||||||||
|
|
Share
|
%
|
Share
|
%
|
|||||||||
|
|
(Dollars in millions)
|
||||||||||||
|
Year Ended December 31, 2017
|
|||||||||||||
|
Americas
(1)
|
$
|
2,299.0
|
|
62
|
%
|
$
|
5,033.5
|
|
41
|
%
|
|||
|
EMEA
(2)
|
837.6
|
|
23
|
%
|
6,085.6
|
|
50
|
%
|
|||||
|
Asia-Pacific
(3)
|
539.6
|
|
15
|
%
|
1,161.5
|
|
9
|
%
|
|||||
|
Total
|
$
|
3,676.2
|
|
100
|
%
|
$
|
12,280.6
|
|
100
|
%
|
|||
|
|
Total Revenues
|
Total Assets
|
|||||||||||
|
|
Share
|
%
|
Share
|
%
|
|||||||||
|
|
(Dollars in millions)
|
||||||||||||
|
Year Ended December 31, 2016
|
|||||||||||||
|
Americas
(1)
|
$
|
1,473.5
|
|
65
|
%
|
$
|
5,048.7
|
|
50
|
%
|
|||
|
EMEA
(2)
|
615.1
|
|
27
|
%
|
4,245.1
|
|
43
|
%
|
|||||
|
Asia-Pacific
(3)
|
185.7
|
|
8
|
%
|
679.2
|
|
7
|
%
|
|||||
|
Total
|
$
|
2,274.3
|
|
100
|
%
|
$
|
9,973.0
|
|
100
|
%
|
|||
|
|
Total Revenues
|
Total Assets
|
|||||||||||
|
|
Share
|
%
|
Share
|
%
|
|||||||||
|
|
(Dollars in millions)
|
||||||||||||
|
Year Ended December 31, 2015
|
|||||||||||||
|
Americas
(1)
|
$
|
1,518.7
|
|
51
|
%
|
$
|
19,049.3
|
|
59
|
%
|
|||
|
EMEA
(2)
|
1,090.1
|
|
36
|
%
|
12,369.1
|
|
39
|
%
|
|||||
|
Asia-Pacific
(3)
|
397.4
|
|
13
|
%
|
763.2
|
|
2
|
%
|
|||||
|
Total
|
$
|
3,006.2
|
|
100
|
%
|
$
|
32,181.6
|
|
100
|
%
|
|||
|
(1)
|
Relates to investment vehicles whose primary focus is the United States, Mexico or South America.
|
|
(2)
|
Relates to investment vehicles whose primary focus is Europe, the Middle East, and Africa.
|
|
(3)
|
Relates to investment vehicles whose primary focus is Asia, including China, Japan, India and Australia.
|
244
The Carlyle Group L.P.
Notes to the Consolidated Financial Statements
17.
Quarterly Financial Data (Unaudited)
Unaudited quarterly information for each of the three months in the years ended
December 31, 2017 and 2016
are presented below.
|
|
Three Months Ended
|
||||||||||||||
|
|
March 31,
2017 |
June 30,
2017 |
September 30,
2017 |
December 31,
2017 |
|||||||||||
|
|
(Dollars in millions)
|
||||||||||||||
|
Revenues
|
$
|
1,120.1
|
|
$
|
908.4
|
|
$
|
639.9
|
|
$
|
1,007.8
|
|
|||
|
Expenses
|
809.5
|
|
705.4
|
|
492.6
|
|
624.8
|
|
|||||||
|
Other income
|
17.1
|
|
40.7
|
|
18.6
|
|
12.0
|
|
|||||||
|
Income before provision for income taxes
|
$
|
327.7
|
|
$
|
243.7
|
|
$
|
165.9
|
|
$
|
395.0
|
|
|||
|
Net income
|
$
|
321.9
|
|
$
|
230.5
|
|
$
|
167.2
|
|
$
|
287.8
|
|
|||
|
Net income attributable to The Carlyle Group L.P. common unitholders
|
$
|
83.0
|
|
$
|
57.6
|
|
$
|
44.6
|
|
$
|
52.9
|
|
|||
|
Net income attributable to The Carlyle Group L.P. per common unit
(1)
|
|
|
|
|
|||||||||||
|
Basic
|
$
|
0.97
|
|
$
|
0.65
|
|
$
|
0.47
|
|
$
|
0.53
|
|
|||
|
Diluted
|
$
|
0.90
|
|
$
|
0.59
|
|
$
|
0.43
|
|
$
|
0.49
|
|
|||
|
Distributions declared per common unit
(2)
|
$
|
0.16
|
|
$
|
0.10
|
|
$
|
0.42
|
|
$
|
0.56
|
|
|||
|
|
Three Months Ended
|
||||||||||||||
|
|
March 31,
2016 |
June 30,
2016 |
September 30,
2016 |
December 31,
2016 |
|||||||||||
|
|
(Dollars in millions)
|
||||||||||||||
|
Revenues
|
$
|
483.1
|
|
$
|
608.0
|
|
$
|
607.3
|
|
$
|
575.9
|
|
|||
|
Expenses
|
459.4
|
|
546.9
|
|
661.8
|
|
574.0
|
|
|||||||
|
Other income (loss)
|
(8.4
|
)
|
6.7
|
|
4.8
|
|
10.0
|
|
|||||||
|
Income (loss) before provision for income taxes
|
$
|
15.3
|
|
$
|
67.8
|
|
$
|
(49.7
|
)
|
$
|
11.9
|
|
|||
|
Net income (loss)
|
$
|
7.9
|
|
$
|
43.5
|
|
$
|
(50.7
|
)
|
$
|
14.6
|
|
|||
|
Net income (loss) attributable to The Carlyle Group L.P. common unitholders
|
$
|
8.4
|
|
$
|
6.1
|
|
$
|
0.8
|
|
$
|
(8.9
|
)
|
|||
|
Net income (loss) attributable to The Carlyle Group L.P. per common unit
(1)
|
|
|
|
|
|||||||||||
|
Basic
|
$
|
0.10
|
|
$
|
0.07
|
|
$
|
0.01
|
|
$
|
(0.11
|
)
|
|||
|
Diluted
|
$
|
0.01
|
|
$
|
0.07
|
|
$
|
(0.02
|
)
|
$
|
(0.16
|
)
|
|||
|
Distributions declared per common unit
(2)
|
$
|
0.29
|
|
$
|
0.26
|
|
$
|
0.63
|
|
$
|
0.50
|
|
|||
|
(1)
|
The sum of the quarterly earnings per common unit amounts may not equal the total for the year due to the effects of rounding and dilution.
|
|
(2)
|
Distributions declared reflects the calendar date of the declaration of each distribution.
|
18.
Subsequent Events
In February 2018, the Board of Directors of the general partner of the Partnership declared a distribution of
$0.33
per common unit to common unitholders of record at the close of business on
February 20, 2018
, payable on
February 27, 2018
.
In February 2018, the Board of Directors of the general partner of the Partnership declared a distribution for the first quarter of 2018 of
$0.367188
per preferred unit to preferred unitholders of record at the close of business on March 1, 2018, payable on March 15, 2018. See Note 14 for more information on the preferred units.
245
The Carlyle Group L.P.
Notes to the Consolidated Financial Statements
19.
Supplemental Financial Information
The following supplemental financial information illustrates the consolidating effects of the Consolidated Funds on the Partnership’s financial position as of
December 31, 2017 and 2016
and results of operations for
the years ended December 31, 2017, 2016 and 2015
. The supplemental statement of cash flows is presented without effects of the Consolidated Funds.
|
|
As of December 31, 2017
|
||||||||||||||
|
|
Consolidated
Operating Entities |
Consolidated
Funds |
Eliminations
|
Consolidated
|
|||||||||||
|
|
(Dollars in millions)
|
||||||||||||||
|
Assets
|
|||||||||||||||
|
Cash and cash equivalents
|
$
|
1,000.1
|
|
$
|
—
|
|
$
|
—
|
|
$
|
1,000.1
|
|
|||
|
Cash and cash equivalents held at Consolidated Funds
|
—
|
|
377.6
|
|
—
|
|
377.6
|
|
|||||||
|
Restricted cash
|
28.7
|
|
—
|
|
—
|
|
28.7
|
|
|||||||
|
Corporate treasury investments
|
376.3
|
|
—
|
|
—
|
|
376.3
|
|
|||||||
|
Accrued performance fees
|
3,670.6
|
|
—
|
|
—
|
|
3,670.6
|
|
|||||||
|
Investments
|
1,844.2
|
|
—
|
|
(219.9
|
)
|
1,624.3
|
|
|||||||
|
Investments of Consolidated Funds
|
—
|
|
4,534.3
|
|
—
|
|
4,534.3
|
|
|||||||
|
Due from affiliates and other receivables, net
|
262.4
|
|
—
|
|
(5.3
|
)
|
257.1
|
|
|||||||
|
Due from affiliates and other receivables of Consolidated Funds, net
|
—
|
|
50.8
|
|
—
|
|
50.8
|
|
|||||||
|
Fixed assets, net
|
100.4
|
|
—
|
|
—
|
|
100.4
|
|
|||||||
|
Deposits and other
|
54.1
|
|
—
|
|
—
|
|
54.1
|
|
|||||||
|
Intangible assets, net
|
35.9
|
|
—
|
|
—
|
|
35.9
|
|
|||||||
|
Deferred tax assets
|
170.4
|
|
—
|
|
—
|
|
170.4
|
|
|||||||
|
Total assets
|
$
|
7,543.1
|
|
$
|
4,962.7
|
|
$
|
(225.2
|
)
|
$
|
12,280.6
|
|
|||
|
Liabilities and partners’ capital
|
|||||||||||||||
|
Debt obligations
|
$
|
1,573.6
|
|
$
|
—
|
|
$
|
—
|
|
$
|
1,573.6
|
|
|||
|
Loans payable of Consolidated Funds
|
—
|
|
4,303.8
|
|
—
|
|
4,303.8
|
|
|||||||
|
Accounts payable, accrued expenses and other liabilities
|
355.1
|
|
—
|
|
—
|
|
355.1
|
|
|||||||
|
Accrued compensation and benefits
|
2,222.6
|
|
—
|
|
—
|
|
2,222.6
|
|
|||||||
|
Due to affiliates
|
229.9
|
|
—
|
|
—
|
|
229.9
|
|
|||||||
|
Deferred revenue
|
82.1
|
|
—
|
|
—
|
|
82.1
|
|
|||||||
|
Deferred tax liabilities
|
75.6
|
|
—
|
|
—
|
|
75.6
|
|
|||||||
|
Other liabilities of Consolidated Funds
|
—
|
|
422.1
|
|
—
|
|
422.1
|
|
|||||||
|
Accrued giveback obligations
|
66.8
|
|
—
|
|
—
|
|
66.8
|
|
|||||||
|
Total liabilities
|
4,605.7
|
|
4,725.9
|
|
—
|
|
9,331.6
|
|
|||||||
|
Series A preferred units
|
387.5
|
|
—
|
|
—
|
|
387.5
|
|
|||||||
|
Partners’ capital
|
701.8
|
|
62.8
|
|
(62.8
|
)
|
701.8
|
|
|||||||
|
Accumulated other comprehensive income (loss)
|
(72.2
|
)
|
4.1
|
|
(4.6
|
)
|
(72.7
|
)
|
|||||||
|
Non-controlling interests in consolidated entities
|
391.4
|
|
13.3
|
|
—
|
|
404.7
|
|
|||||||
|
Non-controlling interests in Carlyle Holdings
|
1,528.9
|
|
156.6
|
|
(157.8
|
)
|
1,527.7
|
|
|||||||
|
Total partners’ capital
|
2,937.4
|
|
236.8
|
|
(225.2
|
)
|
2,949.0
|
|
|||||||
|
Total liabilities and partners’ capital
|
$
|
7,543.1
|
|
$
|
4,962.7
|
|
$
|
(225.2
|
)
|
$
|
12,280.6
|
|
|||
|
As of December 31, 2016
|
|||||||||||||||
|
|
Consolidated
Operating Entities |
Consolidated
Funds |
Eliminations
|
Consolidated
|
|||||||||||
|
|
(Dollars in millions)
|
||||||||||||||
|
Assets
|
|||||||||||||||
|
Cash and cash equivalents
|
$
|
670.9
|
|
$
|
—
|
|
$
|
—
|
|
$
|
670.9
|
|
|||
|
Cash and cash equivalents held at Consolidated Funds
|
—
|
|
761.5
|
|
—
|
|
761.5
|
|
|||||||
|
Restricted cash
|
13.1
|
|
—
|
|
—
|
|
13.1
|
|
|||||||
|
Corporate treasury investments
|
190.2
|
|
—
|
|
—
|
|
190.2
|
|
|||||||
|
Accrued performance fees
|
2,481.1
|
|
—
|
|
—
|
|
2,481.1
|
|
|||||||
|
Investments
|
1,272.2
|
|
—
|
|
(165.2
|
)
|
1,107.0
|
|
|||||||
|
Investments of Consolidated Funds
|
—
|
|
3,893.7
|
|
—
|
|
3,893.7
|
|
|||||||
|
Due from affiliates and other receivables, net
|
231.0
|
|
—
|
|
(3.8
|
)
|
227.2
|
|
|||||||
|
Due from affiliates and other receivables of Consolidated Funds, net
|
—
|
|
29.5
|
|
—
|
|
29.5
|
|
|||||||
|
Receivables and inventory of a real estate VIE
|
145.4
|
|
—
|
|
—
|
|
145.4
|
|
|||||||
|
Fixed assets, net
|
106.1
|
|
—
|
|
—
|
|
106.1
|
|
|||||||
|
Deposits and other
|
39.4
|
|
—
|
|
—
|
|
39.4
|
|
|||||||
|
Other assets of a real estate VIE
|
31.5
|
|
—
|
|
—
|
|
31.5
|
|
|||||||
|
Intangible assets, net
|
42.0
|
|
—
|
|
—
|
|
42.0
|
|
|||||||
|
Deferred tax assets
|
234.4
|
|
—
|
|
—
|
|
234.4
|
|
|||||||
|
Total assets
|
$
|
5,457.3
|
|
$
|
4,684.7
|
|
$
|
(169.0
|
)
|
$
|
9,973.0
|
|
|||
|
Liabilities and partners’ capital
|
|||||||||||||||
|
Debt obligations
|
$
|
1,265.2
|
|
$
|
—
|
|
$
|
—
|
|
$
|
1,265.2
|
|
|||
|
Loans payable of Consolidated Funds
|
—
|
|
3,866.3
|
|
—
|
|
3,866.3
|
|
|||||||
|
Loans payable of a real estate VIE at fair value (principal amount of $144.4 million)
|
79.4
|
|
—
|
|
—
|
|
79.4
|
|
|||||||
|
Accounts payable, accrued expenses and other liabilities
|
369.8
|
|
—
|
|
—
|
|
369.8
|
|
|||||||
|
Accrued compensation and benefits
|
1,661.8
|
|
—
|
|
—
|
|
1,661.8
|
|
|||||||
|
Due to affiliates
|
223.4
|
|
0.2
|
|
—
|
|
223.6
|
|
|||||||
|
Deferred revenue
|
54.0
|
|
—
|
|
—
|
|
54.0
|
|
|||||||
|
Deferred tax liabilities
|
76.6
|
|
—
|
|
—
|
|
76.6
|
|
|||||||
|
Other liabilities of Consolidated Funds
|
—
|
|
669.0
|
|
(32.0
|
)
|
637.0
|
|
|||||||
|
Other liabilities of a real estate VIE
|
124.5
|
|
—
|
|
—
|
|
124.5
|
|
|||||||
|
Accrued giveback obligations
|
160.8
|
|
—
|
|
—
|
|
160.8
|
|
|||||||
|
Total liabilities
|
4,015.5
|
|
4,535.5
|
|
(32.0
|
)
|
8,519.0
|
|
|||||||
|
Partners’ capital
|
403.1
|
|
36.7
|
|
(36.7
|
)
|
403.1
|
|
|||||||
|
Accumulated other comprehensive income (loss)
|
(94.9
|
)
|
(1.5
|
)
|
1.2
|
|
(95.2
|
)
|
|||||||
|
Non-controlling interests in consolidated entities
|
264.3
|
|
13.5
|
|
—
|
|
277.8
|
|
|||||||
|
Non-controlling interests in Carlyle Holdings
|
869.3
|
|
100.5
|
|
(101.5
|
)
|
868.3
|
|
|||||||
|
Total partners’ capital
|
1,441.8
|
|
149.2
|
|
(137.0
|
)
|
1,454.0
|
|
|||||||
|
Total liabilities and partners’ capital
|
$
|
5,457.3
|
|
$
|
4,684.7
|
|
$
|
(169.0
|
)
|
$
|
9,973.0
|
|
|||
|
|
Year Ended December 31, 2017
|
||||||||||||||
|
|
Consolidated
Operating Entities |
Consolidated
Funds |
Eliminations
|
Consolidated
|
|||||||||||
|
|
(Dollars in millions)
|
||||||||||||||
|
Revenues
|
|||||||||||||||
|
Fund management fees
|
$
|
1,045.4
|
|
$
|
—
|
|
$
|
(18.5
|
)
|
$
|
1,026.9
|
|
|||
|
Performance fees
|
|||||||||||||||
|
Realized
|
1,099.7
|
|
—
|
|
(2.4
|
)
|
1,097.3
|
|
|||||||
|
Unrealized
|
996.6
|
|
—
|
|
—
|
|
996.6
|
|
|||||||
|
Total performance fees
|
2,096.3
|
|
—
|
|
(2.4
|
)
|
2,093.9
|
|
|||||||
|
Investment income
|
|||||||||||||||
|
Realized
|
77.5
|
|
—
|
|
(7.1
|
)
|
70.4
|
|
|||||||
|
Unrealized
|
166.3
|
|
—
|
|
(4.7
|
)
|
161.6
|
|
|||||||
|
Total investment income
|
243.8
|
|
—
|
|
(11.8
|
)
|
232.0
|
|
|||||||
|
Interest and other income
|
60.5
|
|
—
|
|
(23.8
|
)
|
36.7
|
|
|||||||
|
Interest and other income of Consolidated Funds
|
—
|
|
177.7
|
|
—
|
|
177.7
|
|
|||||||
|
Revenue of a real estate VIE
|
109.0
|
|
—
|
|
—
|
|
109.0
|
|
|||||||
|
Total revenues
|
3,555.0
|
|
177.7
|
|
(56.5
|
)
|
3,676.2
|
|
|||||||
|
Expenses
|
|||||||||||||||
|
Compensation and benefits
|
|||||||||||||||
|
Base compensation
|
652.7
|
|
—
|
|
—
|
|
652.7
|
|
|||||||
|
Equity-based compensation
|
320.3
|
|
—
|
|
—
|
|
320.3
|
|
|||||||
|
Performance fee related
|
|||||||||||||||
|
Realized
|
520.7
|
|
—
|
|
—
|
|
520.7
|
|
|||||||
|
Unrealized
|
467.6
|
|
—
|
|
—
|
|
467.6
|
|
|||||||
|
Total compensation and benefits
|
1,961.3
|
|
—
|
|
—
|
|
1,961.3
|
|
|||||||
|
General, administrative and other expenses
|
276.8
|
|
—
|
|
—
|
|
276.8
|
|
|||||||
|
Interest
|
65.5
|
|
—
|
|
—
|
|
65.5
|
|
|||||||
|
Interest and other expenses of Consolidated Funds
|
—
|
|
240.4
|
|
(42.8
|
)
|
197.6
|
|
|||||||
|
Interest and other expenses of a real estate VIE and loss on deconsolidation
|
202.5
|
|
—
|
|
—
|
|
202.5
|
|
|||||||
|
Other non-operating income
|
(71.4
|
)
|
—
|
|
—
|
|
(71.4
|
)
|
|||||||
|
Total expenses
|
2,434.7
|
|
240.4
|
|
(42.8
|
)
|
2,632.3
|
|
|||||||
|
Other income
|
|||||||||||||||
|
Net investment gains of Consolidated Funds
|
—
|
|
123.5
|
|
(35.1
|
)
|
88.4
|
|
|||||||
|
Income before provision for income taxes
|
1,120.3
|
|
60.8
|
|
(48.8
|
)
|
1,132.3
|
|
|||||||
|
Provision for income taxes
|
124.9
|
|
—
|
|
—
|
|
124.9
|
|
|||||||
|
Net income
|
995.4
|
|
60.8
|
|
(48.8
|
)
|
1,007.4
|
|
|||||||
|
Net income attributable to non-controlling interests in consolidated entities
|
60.5
|
|
—
|
|
12.0
|
|
72.5
|
|
|||||||
|
Net income attributable to Carlyle Holdings
|
934.9
|
|
60.8
|
|
(60.8
|
)
|
934.9
|
|
|||||||
|
Net income attributable to non-controlling interests in Carlyle Holdings
|
690.8
|
|
—
|
|
—
|
|
690.8
|
|
|||||||
|
Net income attributable to The Carlyle Group L.P.
|
244.1
|
|
60.8
|
|
(60.8
|
)
|
244.1
|
|
|||||||
|
Net income attributable to Series A Preferred Unitholders
|
6.0
|
|
—
|
|
—
|
|
6.0
|
|
|||||||
|
Net income attributable to The Carlyle Group L.P. Common Unitholders
|
$
|
238.1
|
|
$
|
60.8
|
|
$
|
(60.8
|
)
|
$
|
238.1
|
|
|||
|
|
Year Ended December 31, 2016
|
||||||||||||||
|
|
Consolidated
Operating
Entities
|
Consolidated
Funds
|
Eliminations
|
Consolidated
|
|||||||||||
|
|
(Dollars in millions)
|
||||||||||||||
|
Revenues
|
|||||||||||||||
|
Fund management fees
|
$
|
1,090.3
|
|
$
|
—
|
|
$
|
(14.2
|
)
|
$
|
1,076.1
|
|
|||
|
Performance fees
|
|||||||||||||||
|
Realized
|
1,129.7
|
|
—
|
|
(0.2
|
)
|
1,129.5
|
|
|||||||
|
Unrealized
|
(377.7
|
)
|
—
|
|
—
|
|
(377.7
|
)
|
|||||||
|
Total performance fees
|
752.0
|
|
—
|
|
(0.2
|
)
|
751.8
|
|
|||||||
|
Investment income
|
|||||||||||||||
|
Realized
|
115.5
|
|
—
|
|
(2.6
|
)
|
112.9
|
|
|||||||
|
Unrealized
|
50.0
|
|
—
|
|
(2.4
|
)
|
47.6
|
|
|||||||
|
Total investment income
|
165.5
|
|
—
|
|
(5.0
|
)
|
160.5
|
|
|||||||
|
Interest and other income
|
38.9
|
|
—
|
|
(15.0
|
)
|
23.9
|
|
|||||||
|
Interest and other income of Consolidated Funds
|
—
|
|
166.9
|
|
—
|
|
166.9
|
|
|||||||
|
Revenue of a real estate VIE
|
95.1
|
|
—
|
|
—
|
|
95.1
|
|
|||||||
|
Total revenues
|
2,141.8
|
|
166.9
|
|
(34.4
|
)
|
2,274.3
|
|
|||||||
|
Expenses
|
|||||||||||||||
|
Compensation and benefits
|
|||||||||||||||
|
Base compensation
|
647.1
|
|
—
|
|
—
|
|
647.1
|
|
|||||||
|
Equity-based compensation
|
334.6
|
|
—
|
|
—
|
|
334.6
|
|
|||||||
|
Performance fee related
|
|||||||||||||||
|
Realized
|
580.5
|
|
—
|
|
—
|
|
580.5
|
|
|||||||
|
Unrealized
|
(227.4
|
)
|
—
|
|
—
|
|
(227.4
|
)
|
|||||||
|
Total compensation and benefits
|
1,334.8
|
|
—
|
|
—
|
|
1,334.8
|
|
|||||||
|
General, administrative and other expenses
|
521.1
|
|
—
|
|
—
|
|
521.1
|
|
|||||||
|
Interest
|
61.3
|
|
—
|
|
—
|
|
61.3
|
|
|||||||
|
Interest and other expenses of Consolidated Funds
|
—
|
|
153.1
|
|
(24.6
|
)
|
128.5
|
|
|||||||
|
Interest and other expenses of a real estate VIE
|
207.6
|
|
—
|
|
—
|
|
207.6
|
|
|||||||
|
Other non-operating income
|
(11.2
|
)
|
—
|
|
—
|
|
(11.2
|
)
|
|||||||
|
Total expenses
|
2,113.6
|
|
153.1
|
|
(24.6
|
)
|
2,242.1
|
|
|||||||
|
Other income
|
|||||||||||||||
|
Net investment gains of Consolidated Funds
|
—
|
|
13.1
|
|
—
|
|
13.1
|
|
|||||||
|
Income before provision for income taxes
|
28.2
|
|
26.9
|
|
(9.8
|
)
|
45.3
|
|
|||||||
|
Provision for income taxes
|
30.0
|
|
—
|
|
—
|
|
30.0
|
|
|||||||
|
Net income (loss)
|
(1.8
|
)
|
26.9
|
|
(9.8
|
)
|
15.3
|
|
|||||||
|
Net income attributable to non-controlling interests in consolidated entities
|
23.9
|
|
—
|
|
17.1
|
|
41.0
|
|
|||||||
|
Net income (loss) attributable to Carlyle Holdings
|
(25.7
|
)
|
26.9
|
|
(26.9
|
)
|
(25.7
|
)
|
|||||||
|
Net loss attributable to non-controlling interests in Carlyle Holdings
|
(32.1
|
)
|
—
|
|
—
|
|
(32.1
|
)
|
|||||||
|
Net income attributable to The Carlyle Group L.P.
|
$
|
6.4
|
|
$
|
26.9
|
|
$
|
(26.9
|
)
|
$
|
6.4
|
|
|||
|
|
Year Ended December 31, 2015
|
||||||||||||||
|
|
Consolidated
Operating
Entities
|
Consolidated
Funds
|
Eliminations
|
Consolidated
|
|||||||||||
|
|
(Dollars in millions)
|
||||||||||||||
|
Revenues
|
|||||||||||||||
|
Fund management fees
|
$
|
1,239.1
|
|
$
|
—
|
|
$
|
(153.9
|
)
|
$
|
1,085.2
|
|
|||
|
Performance fees
|
|||||||||||||||
|
Realized
|
1,460.3
|
|
—
|
|
(18.4
|
)
|
1,441.9
|
|
|||||||
|
Unrealized
|
(602.0
|
)
|
—
|
|
(15.0
|
)
|
(617.0
|
)
|
|||||||
|
Total performance fees
|
858.3
|
|
—
|
|
(33.4
|
)
|
824.9
|
|
|||||||
|
Investment income (loss)
|
|||||||||||||||
|
Realized
|
(35.4
|
)
|
—
|
|
68.3
|
|
32.9
|
|
|||||||
|
Unrealized
|
23.3
|
|
—
|
|
(41.0
|
)
|
(17.7
|
)
|
|||||||
|
Total investment income (loss)
|
(12.1
|
)
|
—
|
|
27.3
|
|
15.2
|
|
|||||||
|
Interest and other income
|
22.9
|
|
—
|
|
(4.3
|
)
|
18.6
|
|
|||||||
|
Interest and other income of Consolidated Funds
|
—
|
|
975.5
|
|
—
|
|
975.5
|
|
|||||||
|
Revenue of a real estate VIE
|
86.8
|
|
—
|
|
—
|
|
86.8
|
|
|||||||
|
Total revenues
|
2,195.0
|
|
975.5
|
|
(164.3
|
)
|
3,006.2
|
|
|||||||
|
Expenses
|
|||||||||||||||
|
Compensation and benefits
|
|||||||||||||||
|
Base compensation
|
632.2
|
|
—
|
|
—
|
|
632.2
|
|
|||||||
|
Equity-based compensation
|
378.0
|
|
—
|
|
—
|
|
378.0
|
|
|||||||
|
Performance fee related
|
|||||||||||||||
|
Realized
|
650.5
|
|
—
|
|
—
|
|
650.5
|
|
|||||||
|
Unrealized
|
(139.6
|
)
|
—
|
|
—
|
|
(139.6
|
)
|
|||||||
|
Total compensation and benefits
|
1,521.1
|
|
—
|
|
—
|
|
1,521.1
|
|
|||||||
|
General, administrative and other expenses
|
712.8
|
|
—
|
|
—
|
|
712.8
|
|
|||||||
|
Interest
|
58.0
|
|
—
|
|
—
|
|
58.0
|
|
|||||||
|
Interest and other expenses of Consolidated Funds
|
—
|
|
1,258.8
|
|
(219.5
|
)
|
1,039.3
|
|
|||||||
|
Interest and other expenses of a real estate VIE
|
144.6
|
|
—
|
|
—
|
|
144.6
|
|
|||||||
|
Other non-operating income
|
(7.4
|
)
|
—
|
|
—
|
|
(7.4
|
)
|
|||||||
|
Total expenses
|
2,429.1
|
|
1,258.8
|
|
(219.5
|
)
|
3,468.4
|
|
|||||||
|
Other income
|
|||||||||||||||
|
Net investment gains of Consolidated Funds
|
—
|
|
886.9
|
|
(22.5
|
)
|
864.4
|
|
|||||||
|
Income (loss) before provision for income taxes
|
(234.1
|
)
|
603.6
|
|
32.7
|
|
402.2
|
|
|||||||
|
Provision for income taxes
|
2.1
|
|
—
|
|
—
|
|
2.1
|
|
|||||||
|
Net income (loss)
|
(236.2
|
)
|
603.6
|
|
32.7
|
|
400.1
|
|
|||||||
|
Net income (loss) attributable to non-controlling interests in consolidated entities
|
(98.4
|
)
|
—
|
|
636.3
|
|
537.9
|
|
|||||||
|
Net income (loss) attributable to Carlyle Holdings
|
(137.8
|
)
|
603.6
|
|
(603.6
|
)
|
(137.8
|
)
|
|||||||
|
Net loss attributable to non-controlling interests in Carlyle Holdings
|
(119.4
|
)
|
—
|
|
—
|
|
(119.4
|
)
|
|||||||
|
Net income (loss) attributable to The Carlyle Group L.P.
|
$
|
(18.4
|
)
|
$
|
603.6
|
|
$
|
(603.6
|
)
|
$
|
(18.4
|
)
|
|||
|
|
Year Ended December 31,
|
||||||||||
|
|
2017
|
2016
|
2015
|
||||||||
|
|
(Dollars in millions)
|
||||||||||
|
Cash flows from operating activities
|
|||||||||||
|
Net income (loss)
|
$
|
995.4
|
|
$
|
(1.8
|
)
|
$
|
(236.2
|
)
|
||
|
Adjustments to reconcile net income (loss) to net cash flows from operating activities:
|
|||||||||||
|
Depreciation, amortization, and impairment
|
41.3
|
|
72.0
|
|
322.8
|
|
|||||
|
Equity-based compensation
|
320.3
|
|
334.6
|
|
378.0
|
|
|||||
|
Excess tax benefits related to equity-based compensation
|
—
|
|
—
|
|
(4.0
|
)
|
|||||
|
Non-cash performance fees, net
|
(626.8
|
)
|
199.6
|
|
437.4
|
|
|||||
|
Other non-cash amounts
|
(79.8
|
)
|
(55.8
|
)
|
12.7
|
|
|||||
|
Investment (income) loss
|
(222.8
|
)
|
(159.5
|
)
|
26.7
|
|
|||||
|
Purchases of investments
|
(938.6
|
)
|
(458.3
|
)
|
(174.5
|
)
|
|||||
|
Proceeds from the sale of investments
|
477.6
|
|
325.1
|
|
349.6
|
|
|||||
|
Payments of contingent consideration
|
(22.6
|
)
|
(82.6
|
)
|
(17.8
|
)
|
|||||
|
Change in deferred taxes, net
|
93.4
|
|
(4.4
|
)
|
(31.4
|
)
|
|||||
|
Change in due from affiliates and other receivables
|
(1.1
|
)
|
(12.4
|
)
|
(1.4
|
)
|
|||||
|
Change in receivables and inventory of a real estate VIE
|
(14.5
|
)
|
29.0
|
|
(57.5
|
)
|
|||||
|
Change in deposits and other
|
(2.0
|
)
|
6.1
|
|
(9.0
|
)
|
|||||
|
Change in other assets of a real estate VIE
|
1.6
|
|
41.2
|
|
(17.4
|
)
|
|||||
|
Deconsolidation of Claren Road (see Note 9)
|
(23.3
|
)
|
—
|
|
—
|
|
|||||
|
Deconsolidation of Urbplan (see Note 15)
|
14.0
|
|
—
|
|
—
|
|
|||||
|
Deconsolidation of ESG
|
—
|
|
(34.5
|
)
|
—
|
|
|||||
|
Change in accounts payable, accrued expenses and other liabilities
|
50.5
|
|
66.6
|
|
(20.3
|
)
|
|||||
|
Change in accrued compensation and benefits
|
(13.7
|
)
|
6.5
|
|
(35.3
|
)
|
|||||
|
Change in due to affiliates
|
35.7
|
|
(19.3
|
)
|
21.0
|
|
|||||
|
Change in other liabilities of a real estate VIE
|
47.9
|
|
34.3
|
|
101.6
|
|
|||||
|
Change in deferred revenue
|
24.4
|
|
18.9
|
|
(50.0
|
)
|
|||||
|
Net cash provided by operating activities
|
156.9
|
|
305.3
|
|
995.0
|
|
|||||
|
Cash flows from investing activities
|
|||||||||||
|
Change in restricted cash
|
(15.5
|
)
|
5.3
|
|
40.8
|
|
|||||
|
Purchases of fixed assets, net
|
(34.0
|
)
|
(25.4
|
)
|
(62.3
|
)
|
|||||
|
Net cash used in investing activities
|
(49.5
|
)
|
(20.1
|
)
|
(21.5
|
)
|
|||||
|
Cash flows from financing activities
|
|||||||||||
|
Borrowings under credit facility
|
250.0
|
|
—
|
|
—
|
|
|||||
|
Repayments under credit facility
|
(250.0
|
)
|
—
|
|
—
|
|
|||||
|
Proceeds from debt obligations
|
265.6
|
|
20.6
|
|
—
|
|
|||||
|
Payments on debt obligations
|
(21.7
|
)
|
(9.0
|
)
|
—
|
|
|||||
|
Net payments on loans payable of a real estate VIE
|
(14.3
|
)
|
(34.5
|
)
|
(65.3
|
)
|
|||||
|
Payments of contingent consideration
|
(0.6
|
)
|
(3.3
|
)
|
(8.1
|
)
|
|||||
|
Net proceeds from issuance of common units, net of offering costs
|
—
|
|
—
|
|
209.9
|
|
|||||
|
Proceeds from issuance of preferred units
|
387.5
|
|
—
|
|
—
|
|
|||||
|
Excess tax benefits related to equity-based compensation
|
—
|
|
—
|
|
4.0
|
|
|||||
|
Distributions to common unitholders
|
(118.1
|
)
|
(140.9
|
)
|
(251.0
|
)
|
|||||
|
Distributions to preferred unitholders
|
(6.0
|
)
|
—
|
|
—
|
|
|||||
|
Distributions to non-controlling interest holders in Carlyle Holdings
|
(295.6
|
)
|
(422.6
|
)
|
(848.5
|
)
|
|||||
|
Contributions from non-controlling interest holders
|
119.2
|
|
113.0
|
|
168.5
|
|
|||||
|
Distributions to non-controlling interest holders
|
(100.8
|
)
|
(104.2
|
)
|
(110.8
|
)
|
|||||
|
Acquisition of non-controlling interests in Carlyle Holdings
|
—
|
|
—
|
|
(209.9
|
)
|
|||||
|
Units repurchased
|
(0.2
|
)
|
(58.9
|
)
|
—
|
|
|||||
|
Change in due to/from affiliates financing activities
|
(26.4
|
)
|
53.6
|
|
(62.7
|
)
|
|||||
|
Net cash provided by (used in) financing activities
|
188.6
|
|
(586.2
|
)
|
(1,173.9
|
)
|
|||||
|
Effect of foreign exchange rate changes
|
33.2
|
|
(19.6
|
)
|
(50.1
|
)
|
|||||
|
Increase (decrease) in cash and cash equivalents
|
329.2
|
|
(320.6
|
)
|
(250.5
|
)
|
|||||
|
Cash and cash equivalents, beginning of period
|
670.9
|
|
991.5
|
|
1,242.0
|
|
|||||
|
Cash and cash equivalents, end of period
|
$
|
1,000.1
|
|
$
|
670.9
|
|
$
|
991.5
|
|
||
246
None.
Evaluation of Disclosure Controls and Procedures
We maintain disclosure controls and procedures (as that term is defined in Rules 13a-15(e) and 15d-15(e) under the Securities Exchange Act of 1934, as amended (the “Exchange Act”)) that are designed to ensure that information required to be disclosed in our reports under the Exchange Act is recorded, processed, summarized and reported within the time periods specified in the SEC’s rules and forms, and that such information is accumulated and communicated to our management, including our co-principal executive officers and principal financial officer, as appropriate, to allow timely decisions regarding required disclosures. In designing disclosure controls and procedures, our management necessarily was required to apply its judgment in evaluating the cost-benefit relationship of possible disclosure controls and procedures. The design of any disclosure controls and procedures also is based in part upon certain assumptions about the likelihood of future events, and there can be no assurance that any design will succeed in achieving its stated goals under all potential future conditions. Any controls and procedures, no matter how well designed and operated, can provide only reasonable, not absolute, assurance of achieving the desired control objectives.
Our management, with the participation of our co-principal executive officers and principal financial officer, has evaluated the effectiveness of the design and operation of our disclosure controls and procedures as of the end of the period covered by this report. Based upon that evaluation and subject to the foregoing, our co-principal executive officers and principal financial officer concluded that, as of the end of the period covered by this report, the design and operation of our disclosure controls and procedures were effective to accomplish their objectives at the reasonable assurance level.
Changes in Internal Control over Financial Reporting
There have been no changes in our internal control over financial reporting (as defined in Rule 13a-15(f) and 15d-15(f) under the Exchange Act) during the fiscal quarter ended December 31, 2017 that have materially affected, or that are reasonably likely to materially affect, our internal control over financial reporting.
Management’s Report on Internal Control Over Financial Reporting
Management of The Carlyle Group L.P. and its consolidated subsidiaries (the “Partnership”) is responsible for establishing and maintaining adequate internal control over financial reporting. The Partnership’s internal control over financial reporting is a process designed under the supervision of its co-principal executive and principal financial officers and effected by the Partnership’s Board of Directors, management and other personnel, to provide reasonable assurance regarding the reliability of financial reporting and the preparation of its consolidated financial statements for external reporting purposes in accordance with U.S. generally accepted accounting principles.
The Partnership’s internal control over financial reporting includes policies and procedures that pertain to the maintenance of records that, in reasonable detail, accurately and fairly reflect transactions and dispositions of the Partnership’s assets; provide reasonable assurance that transactions are recorded as necessary to permit preparation of consolidated financial statements in accordance with U.S. generally accepted accounting principles, and that receipts and expenditures of the Partnership are being made only in accordance with authorizations of management and the directors; and provide reasonable assurance regarding prevention or timely detection of unauthorized acquisition, use or disposition of the Partnership’s assets that could have a material effect on its consolidated financial statements.
Because of its inherent limitations, internal control over financial reporting may not prevent or detect misstatements. In addition, projections of any evaluation of effectiveness to future periods are subject to the risk that controls may become inadequate because of changes in conditions or that the degree of compliance with the policies or procedures may deteriorate.
Management conducted an assessment of the effectiveness of the Partnership’s internal control over financial reporting as of December 31, 2017 based on the framework established in
Internal Control—Integrated Framework (2013)
issued by the Committee of Sponsoring Organizations of the Treadway Commission. Based on this assessment, management has determined that the Partnership’s internal control over financial reporting as of December 31, 2017 was effective.
247
Ernst & Young LLP, an independent registered public accounting firm, has audited the Partnership’s consolidated financial statements included in this report on Form 10-K and issued its report on the effectiveness of the Partnership’s internal control over financial reporting as of December 31, 2017, which is included herein.
None.
ITEM 10.
DIRECTORS, EXECUTIVE OFFICERS AND CORPORATE GOVERNANCE
Directors and Executive Officers
The following table sets forth the names, ages and positions of the directors and executive officers of our general partner, Carlyle Group Management L.L.C.
|
Name
|
Age
|
Position
|
||
|
William E. Conway, Jr.
|
68
|
Founder, Co-Executive Chairman, Co-Chief Investment Officer and Director
|
||
|
Daniel A. D’Aniello
|
71
|
Founder, Chairman Emeritus and Director
|
||
|
David M. Rubenstein
|
68
|
Founder, Co-Executive Chairman and Director
|
||
|
Kewsong Lee
|
52
|
Co-Chief Executive Officer and Director
|
||
|
Glenn A. Youngkin
|
51
|
Co-Chief Executive Officer and Director
|
||
|
Lawton W. Fitt
|
64
|
Director
|
||
|
James H. Hance, Jr.
|
73
|
Operating Executive and Director
|
||
|
Janet Hill
|
70
|
Director
|
||
|
Dr. Thomas S. Robertson
|
75
|
Director
|
||
|
William J. Shaw
|
72
|
Director
|
||
|
Anthony Welters
|
62
|
Director
|
||
|
Curtis L. Buser
|
54
|
Chief Financial Officer
|
||
|
Peter J. Clare
|
52
|
Co-Chief Investment Officer and Director
|
||
|
Jeffrey W. Ferguson
|
52
|
General Counsel
|
||
William E. Conway, Jr.
Mr. Conway is a founder and Co-Chief Executive Chairman, Co-Chief Investment Officer and director of Carlyle. Mr. Conway was elected to the Board of Directors of our general partner effective July 18, 2011. Previously, Mr. Conway served as our Co-Chief Executive Officer and Chief Investment Officer. Mr. Conway also serves on Carlyle's Executive Group. Prior to forming Carlyle in 1987, Mr. Conway was the Senior Vice President and Chief Financial Officer of MCI Communications Corporation (“MCI”). Mr. Conway was a Vice President and Treasurer of MCI from 1981 to 1984. Mr. Conway is a member of the Board of Trustees of the Johns Hopkins Medical Center and the Board of Trustees of the Catholic University of America. He previously served as chairman and/or director of several public and private companies in which Carlyle had significant investment interests. Mr. Conway received his BA from Dartmouth College and his MBA. in finance from the University of Chicago Graduate School of Business.
Daniel A. D’Aniello.
Mr. D’Aniello is a founder and Chairman Emeritus of Carlyle and was elected to the Board of Directors of our general partner effective July 18, 2011. Previously, Mr. D'Aniello served as Chairman of Carlyle. Mr. D'Aniello also serves on Carlyle's Executive Group. Prior to forming Carlyle in 1987, Mr. D’Aniello was the Vice President for Finance and Development at Marriott Corporation for eight years. Before joining Marriott, Mr. D’Aniello was a financial officer at PepsiCo, Inc. and Trans World Airlines. Mr. D'Aniello served in the United States Navy from 1969 through 1971 during which time he was a Distinguished Naval Graduate of Officer Candidate School, Newport R.I.; a Supply Officer (LTJG) aboard the USS Wasp (CVS 18); and in 2016, Mr. D'Aniello was awarded the designation of Lone Sailor by the U.S. Navy Memorial Foundation. Mr. D’Aniello is Co-Chairman of the American Enterprise Institute for Public Research; Co-Chairman of the Institute for Veterans and Military Families; Chairman of the Wolf Trap Foundation of the Performing Arts; a member of the U.S.–China CEO and Former Senior Officials’ Dialogue of the U.S. Chamber of Commerce; an Advisor to the John Templeton Foundation; a founding Trustee of the Lumen Institute; and a Lifetime Member of the Board of Trustees of Syracuse University, a member of the Chancellor’s Council and a member of the Corporate Advisory Council to the Martin J. Whitman School of Management. Mr. D’Aniello previously served as chairman and/or director of several private companies in which
248
Carlyle had significant investment interests. Mr. D’Aniello is a 1968 magna cum laude graduate of Syracuse University, where he was a member of Beta Gamma Sigma, and a 1974 graduate of the Harvard Business School, where he was a Teagle Foundation Fellow.
David M. Rubenstein.
Mr. Rubenstein is a founder and Co-Executive Chairman of Carlyle. He was elected to the Board of Directors of our general partner effective July 18, 2011. Previously, Mr. Rubenstein served as Co-Chief Executive Officer of Carlyle. Mr. Rubenstein also serves on Carlyle's Executive Group. Prior to forming Carlyle in 1987, Mr. Rubenstein practiced law in Washington, D.C. with Shaw, Pittman, Potts & Trowbridge LLP (now Pillsbury Winthrop Shaw Pittman LLP). From 1977 to 1981 Mr. Rubenstein was Deputy Assistant to the President for Domestic Policy. From 1975 to 1976, he served as Chief Counsel to the U.S. Senate Judiciary Committee’s Subcommittee on Constitutional Amendments. From 1973 to 1975, Mr. Rubenstein practiced law in New York with Paul, Weiss, Rifkind, Wharton & Garrison LLP. Among other philanthropic endeavors, Mr. Rubenstein is Chairman of the Board of Trustees of the John F. Kennedy Center for the Performing Arts, the Smithsonian Institution, and the Council on Foreign Relations and serves on the Board of Directors or Trustees of Johns Hopkins Medicine, University of Chicago, Memorial Sloan-Kettering Cancer Center, the Lincoln Center for the Performing Arts and the Institute for Advanced Study. Mr. Rubenstein serves as Fellow of the Harvard Corporation and as President of the Economic Club of Washington. Mr. Rubenstein is Vice Chairman of the Board of the Brookings Institution, a member of the American Academy of Arts and Sciences, Business Council, Chairman of the Harvard Global Advisory Council, Chairman of the Madison Council of the Library of Congress, a member of the Board of Dean’s Advisors of the Business School at Harvard, a member of the Advisory Board of the School of Economics and Management at Tsinghua University, and Board of the World Economic Forum Global Shapers Community. Mr. Rubenstein is a magna cum laude graduate of Duke University, where he was elected Phi Beta Kappa. Following Duke, Mr. Rubenstein graduated from The University of Chicago Law School.
Kewsong Lee.
Mr. Lee is a member of the Board of Directors of our general partner. Mr. Lee was elected to the Board of Directors of our general partner effective January 1, 2018. Mr. Lee currently serves as Co-Chief Executive Officer of Carlyle. Mr. Lee is Chairman of Carlyle’s Executive Group. Previously, Mr. Lee served as Deputy CIO for the Partnership’s CPE segment and Head of our Global Credit segment. Prior to joining Carlyle in 2013, Mr. Lee was a partner at Warburg Pincus and a member of the firm’s Executive Management Group. During his 21 years at the firm, he led the Consumer, Industrial and Services group, and was actively involved in the firm’s financial services efforts, capital markets group and the development of the firm’s buyout practice. Mr. Lee serves as President of the Board of the Lincoln Center Theater and serves on Harvard’s Global Advisory Council and the University Campaign Steering Committee. Mr. Lee served as the lead director of Arch Capital Group from 2009 to 2017, and has served on numerous corporate boards including Transdigm, Aramark and Neiman Marcus. He earned his AB in applied mathematics in economics at Harvard College and his MBA from Harvard Business School.
Glenn A. Youngkin.
Mr. Youngkin is a member of the Board of Directors of our general partner. Mr. Youngkin was elected to the Board of Directors of our general partner effective January 1, 2018. Mr. Youngkin currently serves as Co-Chief Executive Officer of Carlyle. Mr. Youngkin also serves on Carlyle's Executive Group. Previously, Mr. Youngkin served as President and Chief Operating Officer from May 2015 to December 2017. From June 2014 to May 2015, Mr. Youngkin served as Co-President and Co-Chief Operating Officer. From March 2011 until June 2014, Mr. Youngkin served as Chief Operating Officer. From October 2010 until March 2011, Mr. Youngkin served as Carlyle's interim principal financial officer. From 2005 to 2008, Mr. Youngkin was the Global Head of the Industrial Sector investment team. From 2000 to 2005, Mr. Youngkin led Carlyle's buyout activities in the United Kingdom and from 1995 to 2000, he was a member of the U.S. buyout team. Prior to joining Carlyle in 1995, Mr. Youngkin was a management consultant with McKinsey & Company and he also previously worked in the investment banking group at CS First Boston. Mr. Youngkin previously served on the Board of Directors of numerous Carlyle portfolio companies. Mr. Youngkin also serves on the Board of Governors of the National Cathedral School, the Dean's Advisory Board at Harvard Business School, the Board of Directors of Meadowkirk, Inc., the Museum of the Bible, the Rice Management Company and as Church Warden for the Vestry of Holy Trinity Church. Mr. Youngkin received a B.S. in mechanical engineering and a BA in managerial studies from Rice University and an MBA from the Harvard Business School, where he was a Baker Scholar.
Lawton W. Fitt.
Ms. Fitt is a member of the Board of Directors of our general partner. Ms. Fitt was elected to the Board of Directors of our general partner effective May 2, 2012. Ms. Fitt served as Secretary (CEO) of the Royal Academy of Arts in London from October 2002 to March 2005. Prior to that, Ms. Fitt was an investment banker with Goldman Sachs & Co., where she became a partner in 1994 and a managing director in 1996. She retired from Goldman Sachs in 2002. Ms. Fitt is currently a director of Ciena Corporation (where she serves as chair of the audit committee), Micro Focus International (where she serves on the audit committee and nominating committee) and The Progressive Corporation (where she serves as the lead independent director, and serves on the Executive committee, as chair of the investment and capital committee and on the nominating and governance committee). Ms. Fitt is a former director of ARM Holdings PLC and Thomson Reuters. She is also a trustee or director of several not-for-profit organizations, including the Goldman Sachs Foundation and the Thomson
249
Reuters Foundation. Ms. Fitt received her bachelor's degree from Brown University and her MBA from the Darden School of the University of Virginia.
James H. Hance, Jr.
Mr. Hance is an Operating Executive of Carlyle and a member of the Board of Directors of our general partner. Mr. Hance was elected to the Board of Directors of our general partner effective May 2, 2012. Mr. Hance joined Carlyle in November 2005 and has worked primarily in our Global Credit segment and the financial services sector. Prior to joining Carlyle in 2005, Mr. Hance served as Vice Chairman of Bank of America from 1993 until his retirement on January 31, 2005 and served as Chief Financial Officer from 1988 to 2004. Prior to joining Bank of America, Mr. Hance spent 17 years with Price Waterhouse (now PricewaterhouseCoopers LLP). Mr. Hance is currently a director of Acuity Brands Inc. Mr. Hance is a former director of Ford Motor Company, Sprint Nextel Corporation, Morgan Stanley, Duke Energy Corporation, Cousins Properties and Parkway, Inc. Mr. Hance serves as Emeritus Trustee on the Board of Trustees at Washington University in St. Louis and as Chairman of the Board of Trustees at Johnson & Wales University in Providence, RI. Mr. Hance graduated from Westminster College and received an MBA from Washington University in St. Louis. He is a certified public accountant.
Janet Hill.
Ms. Hill is a member of the Board of Directors of our general partner. Ms. Hill was elected to the Board of Directors of our general partner effective May 2, 2012. Ms. Hill serves as Principal at Hill Family Advisors. From 1981 until her retirement in 2010, Ms. Hill served as Vice President of Alexander & Associates, Inc., a corporate consulting firm which she co-owned in Washington, D.C. Ms. Hill is currently a director of Dean Foods Company and Esquire Bank. Ms. Hill is a former director of Wendy’s/Arby’s Group, Inc., Sprint Nextel Corporation and The Wendy's Company. She also serves on the Board of Trustees at Duke University, the John F. Kennedy Center for the Performing Arts, the Knight Commission on Intercollegiate Athletics, and the Wolf Trap Foundation. Ms. Hill graduated from Wellesley College with a Bachelor of Arts in Mathematics and received a Master of Arts in Teaching Mathematics from the Graduate School of the University of Chicago.
Dr. Thomas S. Robertson.
Dr. Robertson is a member of the Board of Directors of our general partner. Dr. Robertson was elected to the Board of Directors of our general partner effective May 2, 2012. Dr. Robertson is the Joshua J. Harris Professor of Marketing at the Wharton School at the University of Pennsylvania. Prior to rejoining Wharton in 2007, Dr. Robertson was special assistant to Emory University’s president on issues of international strategy and a founding director of the Institute for Developing Nations established jointly by Emory University and The Carter Center in fall 2006. From 1998 until 2007, Dr. Robertson was Dean of Emory University’s Goizueta Business School and, from 1994 until 1998, he was the Sainsbury Professor at, and the Chair of Marketing and Deputy Dean of, the London Business School. From 1971 to 1994, Dr. Robertson was a member of the faculty at the Wharton School, and from 2007 to 2014, was the Dean of the Wharton School. He is a former director of CRA International, Inc. and PRGX Global, Inc. Dr. Robertson graduated from Wayne State University and received his M.A. and Ph.D. in marketing from Northwestern University.
William J. Shaw.
Mr. Shaw is a member of the Board of Directors of our general partner. Mr. Shaw was elected to the Board of Directors of our general partner effective May 2, 2012. Mr. Shaw was the Vice Chairman of Marriott International, Inc. until his retirement in March 2011. Prior to becoming Vice Chairman of Marriott, Mr. Shaw served as President and Chief Operating Officer of Marriott from 1997 until 2009. Mr. Shaw joined Marriott in 1974 and held various positions, including Corporate Controller, Corporate Vice President, Senior Vice President-Finance, Treasurer, Chief Financial Officer, Executive Vice President and President of Marriott Service Group. Prior to joining Marriott, Mr. Shaw worked at Arthur Andersen & Co. Mr. Shaw is Chairman of the Board of Directors of Marriott Vacations Worldwide Corporation, a Director of DiamondRock Hospitality (where he serves on the audit committee) and is a former member of the Board of Trustees of three funds in the American Family of mutual funds from 2009 to 2015. Mr. Shaw also serves on the Board of Trustees of the University of Notre Dame and the Board of Trustees of Suburban Hospital in Bethesda, Maryland. Mr. Shaw graduated from the University of Notre Dame and received an MBA from Washington University in St. Louis.
Anthony Welters.
Mr. Welters is a member of the Board of Directors of our general partner. Mr. Welters was elected to the Board of Directors of our general partner effective October 27, 2015. Mr. Welters is Executive Chairman of the Black Ivy Group, LLC. He recently retired as Senior Adviser to the Office of the CEO of UnitedHealth Group having served in such position since April 2014. Prior to this appointment, he was Executive Vice President and a Member of the Office of the CEO of UnitedHealth Group from November 2006 until April 2014. Mr. Welters previously led UHG's Public and Senior Markets Group. Mr. Welters joined UHG in June 2002 upon its acquisition of AmeriChoice, a health care company he founded in 1989. Mr. Welters is currently a director of Loews Corporation, West Pharmaceutical Services, Inc. (where he serves on the Nominating and Governance committee) and C.R. Bard, Inc. (where he is a member of the compensation, regulatory and governance committees). Mr. Welters previously served as a director West Pharmaceutical Services, Inc. from 1997 to 2016. He is Trustee Emeritus of the Morehouse School of Medicine Board of Trustees, Chairman of the Board of New York University School of Law, as well as Vice Chairman of the Board of New York University, a Trustee of NYU Langone Medical Center, a trustee of the John F. Kennedy Center for the Performing Arts, where he is Chairman of the finance committee, as well as on the Board of the Horatio Alger Association. Mr. Welters is a founding member of the National Museum of African
250
American History and Culture. Mr. Welters is a graduate of Manhattanville College and received his law degree from New York University School of Law.
Curtis L. Buser.
Mr. Buser is the Chief Financial Officer of Carlyle and has served in such capacity since December 2014. Mr. Buser also serves on Carlyle’s Executive Group. From May 2014 until December 2014, Mr. Buser served as Carlyle’s Interim Chief Financial Officer. Mr. Buser joined Carlyle in 2004 as a managing director and served as the firm’s Chief Accounting Officer until May 2014. Prior to joining Carlyle, Mr. Buser was an audit partner with Ernst & Young, LLP. He began his career with Arthur Andersen in 1985 and was admitted to the partnership in 1997. Mr. Buser graduated from Georgetown University.
Peter J. Clare.
Mr. Clare is a member of the Board of Directors of our general partner. Mr. Clare was elected to the Board of Directors of our general partner effective January 1, 2018. Mr. Clare is the Co-Chief Investment Officer of Carlyle and is Co-Head of the U.S. buyout group. Mr. Clare also serves on Carlyle's Executive Group. Mr. Clare previously served as Deputy CIO of the Partnership’s CPE segment. From 1999 to 2001, Mr. Clare was based in Hong Kong and was a founding member of the Carlyle Asia Buyout team and continues to serve on the Carlyle Asia Buyout Investment Committee. In 2001 and 2002, Mr. Clare launched Carlyle’s initial investments in distressed debt, which led to the creation of Carlyle Strategic Partners. From 2004 to 2011, Mr. Clare served as the Global Head of the Aerospace, Defense & Government Services sector team. Prior to joining Carlyle, Mr. Clare was with First City Capital Corporation, a private equity group that invested in buyouts, public equities, distressed bonds and restructurings. Prior to joining First City Capital, he was with the Merchant Banking Group of Prudential-Bache. Mr. Clare is currently a member of the Boards of Directors of Booz Allen Hamilton and Signode Industrial. Mr. Clare has previously served on the boards of CommScope, Inc. and Pharmaceutical Product Development (PPD). Mr. Clare also serves on the Board of Directors of Georgetown University. Mr. Clare is a magna cum laude graduate of Georgetown University and received his MBA from the Wharton School at the University of Pennsylvania.
Jeffrey W. Ferguson.
Mr. Ferguson is the General Counsel of Carlyle and has served in such capacity since 1999. Mr. Ferguson also serves on Carlyle’s Executive Group. Prior to joining Carlyle, Mr. Ferguson was an associate with the law firm of Latham & Watkins LLP. Mr. Ferguson received a BA from the University of Virginia, where he was a member of Phi Beta Kappa. He also received his law degree from the University of Virginia, and is admitted to the bars of the District of Columbia and Virginia.
There are no family relationships among any of the directors or executive officers of our general partner.
Composition of the Board of Directors
The limited liability company agreement of Carlyle Group Management L.L.C. establishes a Board of Directors that is responsible for the oversight of our business and operations. Our common unitholders have no right to elect the directors of our general partner unless, as determined on January 31 of each year, the total voting power held by holders of the special voting units in The Carlyle Group L.P. (including voting units held by our general partner and its affiliates) in their capacity as such, or otherwise held by then-current or former Carlyle personnel (treating voting units deliverable to such persons pursuant to outstanding equity awards as being held by them), collectively, constitutes less than 10% of the voting power of the outstanding voting units of The Carlyle Group L.P. Unless and until the foregoing voting power condition is satisfied, our general partner’s Board of Directors is elected in accordance with its limited liability company agreement, which provides that directors may be appointed and removed by members of our general partner holding a majority in interest of the voting power of the members, which voting power is allocated to each member ratably according to his or her aggregate ownership of our common units and partnership units.
The Carlyle Group L.P. is a limited partnership that is advised by our general partner. As a limited partnership, we are excepted from certain governance rules, which eliminate the requirements that we have a majority of independent directors on our Board of Directors and that we have independent director oversight of executive officer compensation and director nominations. In addition, we are not required to hold annual meetings of our common unitholders.
Director Qualifications
When determining that each of our directors is particularly well-suited to serve on the Board of Directors of our general partner and that each has the experience, qualifications, attributes and skills, taken as a whole, to enable our Board of Directors to satisfy its oversight responsibilities effectively, we considered the experience and qualifications of each described above under “— Directors and Executive Officers.”
251
With regard to:
|
•
|
Messrs. Conway, D’Aniello and Rubenstein — We considered that these three individuals are the original founders of our firm, that each has played an integral role in our firm’s successful growth since its founding in 1987, and that each has developed a unique and unparalleled understanding of our business. Finally, we also noted that these three individuals are our largest equity owners and, as a consequence of such alignment of interest with our other equity owners, each has additional motivation to diligently fulfill his oversight responsibilities as a member of the Board of Directors of our general partner.
|
|
•
|
Mr. Lee — We considered his business acumen, creative ideas and leadership experience in a variety of senior roles at financial institutions.
|
|
•
|
Mr. Youngkin — We considered his leadership and extensive knowledge of our business and operations gained through his years of service at our firm.
|
|
•
|
Ms. Fitt — We considered her extensive financial background and experience in a distinguished career at Goldman Sachs in the areas of investment banking and risk analysis, including her unique insights into the operation of global capital markets.
|
|
•
|
Mr. Hance — We considered his invaluable perspective owing to his experience in various senior leadership roles in the financial services industry, including his role as the Chief Financial Officer of Bank of America Corporation, which included responsibility for financial and accounting matters, as well as his familiarity with our business and operations as an Operating Executive of Carlyle.
|
|
•
|
Ms. Hill — We considered her insights into the operations of public companies owing to her experience as a consultant, as well as her familiarity with board responsibilities, oversight and control resulting from her significant experience serving on the boards of directors of various public companies.
|
|
•
|
Dr. Robertson — We considered his distinguished career as a professor and Dean of the Wharton School at the University of Pennsylvania and his extensive knowledge and expertise in finance and business administration.
|
|
•
|
Mr. Shaw — We considered his extensive financial background and public company operating and management experience resulting from his distinguished career in various senior leadership roles at Marriott.
|
|
•
|
Mr. Welters — We considered his business acumen and entrepreneurial experience, extensive operating expertise as well as his familiarity with board responsibilities, oversight and control resulting from his significant experience serving on the boards of directors of various public companies.
|
|
•
|
Mr. Clare — We considered his extensive investment and leadership experience as a co-head of our U.S. buyout business and as Co-Deputy CIO of our CPE segment.
|
Director Independence
Because we are a publicly traded limited partnership, the NASDAQ rules do not require our general partner’s board to be made up of a majority of independent directors. However, our general partner’s board has five directors who satisfy the independence and financial literacy requirements of the NASDAQ and the Securities and Exchange Commission (the “SEC”). These directors are Ms. Fitt, Ms. Hill, Dr. Robertson, Mr. Shaw and Mr. Welters. Based on all the relevant facts and circumstances, the Board of Directors determined that the independent directors have no relationship with us or our general partner that would impair their independence as it is defined in the NASDAQ rules and The Carlyle Group L.P. Governance Policy. To assist it in making its independence determinations, the Board of Directors of our general partner adheres to the following standards in determining independence:
Under any circumstances, a director is not independent if:
|
•
|
the director is, or has been within the preceding three years, employed by a Carlyle Entity. A Carlyle Entity means the general partner, us and any parent or subsidiary that the general partner or we control and consolidate into the general partner’s or our financial statements, respectively, filed with the SEC, (but not if the general partner or we reflect such entity solely as an investment in these financial statements);
|
252
|
•
|
the director, or an immediate family member of that director, accepted any compensation from a Carlyle Entity in excess of $120,000 during any period of twelve consecutive months within the three years preceding the determination of independence, other than (i) compensation for director or committee service, (ii) compensation paid to an immediate family member who is an employee (other than an executive officer) of a Carlyle Entity and (iii) benefits under a tax-qualified retirement plan, or non-discretionary compensation;
|
|
•
|
the director is an immediate family member of an individual who is, or at any time during the past three years was, employed by us as an executive officer;
|
|
•
|
the director is, or has an immediate family member who is, a partner in, or a controlling shareholder or an executive officer of any organization to which a Carlyle Entity made, or from which a Carlyle Entity received, payments for property or services in the current or any of the past three fiscal years that exceed five percent (5%) of the recipient’s consolidated gross revenues for that year, or $200,000, whichever is more, other than the following:
|
|
•
|
payments arising solely from investments in a Carlyle Entity’s securities; or
|
|
•
|
payments under non-discretionary charitable contribution matching programs
|
|
•
|
the director is, or has an immediate family member who is, employed as an executive officer of another entity where at any time during the past three years any of the executive officers of a Carlyle Entity serve on the compensation committee of such other entity; or
|
|
•
|
the director is, or has an immediate family member who is, a current partner of a Carlyle Entity’s outside auditor, or was a partner or employee of a Carlyle Entity’s outside auditor who worked on a Carlyle Entity’s audit at any time during any of the past three years.
|
The following commercial or charitable relationships will not be considered to be material relationships that would impair a director’s independence:
|
•
|
if the director or an immediate family member of that director serves as an executive officer, director or trustee of a charitable organization, and our annual charitable contributions to that organization (excluding contributions by us under any established matching gift program) are less than the greater of $200,000 or five percent (5%) of that organization’s consolidated gross revenues in its most recent fiscal year, provided, however, that in calculating such amount (i) payments arising solely from investments in the Carlyle Entity’s securities and (ii) payments under non-discretionary charitable contribution matching programs shall be excluded; and
|
|
•
|
if the director or an immediate family member of that director (or a company for which the director serves as a director or executive officer) invests in or alongside of one or more investment funds or investment companies managed by us or any of our subsidiaries, whether or not fees or other incentive arrangements for us or our subsidiaries are borne by the investing person.
|
Committees of the Board of Directors
The Board of Directors of Carlyle Group Management L.L.C. has five standing committees: the audit committee, the conflicts committee, the compensation committee, the executive committee and the nominating and corporate governance committee.
Audit committee.
Our audit committee consists of Messrs. Shaw (Chairman) and Robertson and Ms. Fitt. The purpose of the audit committee of the Board of Directors of Carlyle Group Management L.L.C. is to provide assistance to the Board of Directors in fulfilling its obligations with respect to matters involving our accounting, auditing, financial reporting, internal control and legal compliance functions, including, without limitation, assisting the board of director’s oversight of (1) the quality and integrity of our financial statements, (2) our compliance with legal and regulatory requirements, (3) our independent registered public accounting firm’s qualifications and independence, and (4) the performance of our independent registered public accounting firm and our internal audit function, and directly appointing, retaining, reviewing and terminating our independent registered public accounting firm. The members of our audit committee meet the independence standards and financial literacy requirements for service on an audit committee of a Board of Directors pursuant to the federal securities laws and NASDAQ Marketplace rules relating to corporate governance matters. The Board of Directors of our general partner has
253
determined that Mr. Shaw is an “audit committee financial expert” within the meaning of Item 407(d)(5) of Regulation S-K. The audit committee has a charter which is available on our internet website at http://ir.carlyle.com.
Conflicts committee.
The conflicts committee consists of Ms. Fitt and Ms. Hill, Dr. Robertson and Messrs. Shaw and Welters and is responsible for reviewing specific matters that our general partner’s Board of Directors believes may involve conflicts of interest. The conflicts committee determines if the resolution of any conflict of interest submitted to it is fair and reasonable to us. Any matters approved by the conflicts committee are conclusively deemed to be fair and reasonable to us and not a breach by us of any duties we may owe to our common unitholders. In addition, the conflicts committee may review and approve any related person transactions, other than those that are approved pursuant to our related person policy, as described under “Item 13. Certain Relationships and Related Person Transactions and Director Independence — Statement of Policy Regarding Transactions with Related Persons,” and may establish guidelines or rules to cover specific categories of transactions. The members of the conflicts committee meet the independence standards for service on an audit committee of a Board of Directors pursuant to federal and NASDAQ Global Select Market rules relating to corporate governance matters.
Compensation committee
. In December 2017, the Board of Directors formed a compensation committee. Our compensation committee is responsible for, among other duties and responsibilities, reviewing and approving all forms of compensation to be provided to, and employment agreements with, our Co-Chief Executive Officers, establishing and reviewing the overall compensation philosophy of the Partnership, and reviewing, approving, and overseeing the administration of the our Equity Incentive Plan. The members of our compensation committee are Messrs. Welters (Chairman), Conway, D’Aniello and Rubenstein and Ms. Fitt.
Executive committee.
The executive committee of the Board of Directors of Carlyle Group Management L.L.C. consists of Messrs. Conway, D’Aniello and Rubenstein. The Board of Directors has generally delegated all of the power and authority of the full Board of Directors to the executive committee to act when the Board of Directors is not in session.
Nominating & Corporate Governance committee
. In December 2017, the Board of Directors formed a nominating and corporate governance committee. Our nominating and corporate governance committee is responsible for, among its other duties and responsibilities, identifying candidates qualified to serve on our Board of Directors, reviewing the composition of the Board of Directors and its committees, developing and recommending to the Board of Directors corporate governance principles that are applicable to the Partnership, and overseeing the evolution of the Board of Directors. The members of our nominating and corporate governance committee are Ms. Hill (Chairman), Mr. D’Aniello, Ms. Fitt and Mr. Hance.
Code of Conduct and Code of Ethics for Financial Professionals
We have a Code of Conduct and a Code of Ethics for Financial Professionals, which apply to our principal executive officers, principal financial officer and principal accounting officer. Each of these codes is available on our website at http://ir.carlyle.com. We intend to disclose any amendment to or waiver of the Code of Conduct and any waiver of our Code of Ethics for Financial Professionals on behalf of an executive officer or director either on our website or in a Form 8-K filing.
Governance Policy
The Board of Directors of our general partner has a governance policy, which addresses matters such as the Board of Directors’ responsibilities and duties and the Board of Directors’ composition and compensation. The governance policy is available on our website at http://ir.carlyle.com.
Section 16(a) Beneficial Ownership Reporting Compliance
Section 16(a) of the Securities Exchange Act of 1934, as amended, requires the executive officers and directors of our general partner, and persons who own more than ten percent of a registered class of the Partnership’s equity securities, to file initial reports of ownership and reports of changes in ownership with the SEC and to furnish the Partnership with copies of all Section 16(a) forms they file. To our knowledge, based solely on our review of the copies of such reports furnished to us or written representations from such persons that they were not required to file a Form 5 to report previously unreported ownership or changes in ownership, we believe that, with respect to the fiscal year ended December 31, 2017, such persons complied with all such filing requirements.
254
ITEM 11.
EXECUTIVE COMPENSATION
Compensation Discussion and Analysis
Compensation Philosophy
Our business as an alternative asset management firm is dependent on the services of our named executive officers and other key employees. Among other things, we rely on our executive officers to set the strategy for our business and to allocate resources to manage our complex global operations. In addition, we depend on our personnel's ability to find, select and execute investments, oversee and improve portfolio company operations to create value for our investors, find and develop relationships with fund investors and other sources of capital and provide other services that are essential to our success by supporting our investment teams, LP relations group and the corporate infrastructure of our firm. Therefore, it is important that our named executive officers and other key employees are compensated in a manner that motivates them to excel and encourages them to remain with our firm.
Our compensation policy has several primary objectives: (1) establish a clear relationship between performance and compensation, (2) align short-term and long-term incentives with our fund investors and common unitholders, and (3) provide competitive incentive opportunities, with an appropriate balance between short-term and long-term incentives that induce our named executive officers and other key employees to work to achieve the firm's goals and design and execute its strategic plan. We believe that the key to achieving these objectives is an organized, unbiased approach that is well understood, responsive to changes in the industry and the general labor market and, above all, flexible and timely.
Our senior Carlyle professionals (including our named executive officers) and other key employees invest a significant amount of their own capital in or alongside the funds we advise. In addition, certain of these individuals may be allocated a portion of the carried interest or incentive fees payable in respect of our investment funds. We believe that this approach of seeking to align the interests of our named executive officers and other key employees with those of the investors in our funds has been a key contributor to our strong performance and growth. We also believe that significant equity ownership by our named executive officers and other key employees results in the alignment of their interests with those of our common unitholders.
For the year ended December 31, 2017, our founders, Daniel A. D’Aniello, William E. Conway, Jr. and David M. Rubenstein, served as our co-principal executive officers. We refer to our co-principal executive officers during 2017, together with Glenn A. Youngkin, who served as President and Chief Operating Officer during 2017, Curtis L. Buser, our Chief Financial Officer and Principal Financial Officer, and Jeffrey W. Ferguson, our General Counsel, as our “named executive officers.”
Appointment of New Co-Chief Executive Officers and Directors
In 2017, our Board of Directors undertook a project to identify a new CEO or CEOs and to determine the employment and compensation arrangements for such individual or individuals. Our founders, together with a subcommittee of the Board comprised of Lawton Fitt, Tony Welters and Janet Hill, lead a search process to identify possible internal and external candidates. The Board of Directors retained Russell Reynolds to assist in the evaluation and assessment of the skills and characteristics of possible internal CEO candidates and other members of the executive management team. The Board subcommittee met on numerous occasions to discuss the candidates, possible leadership structures and future roles, including the future roles of our founders, both with Russell Reynolds and among themselves. They also met frequently with the founders and reported to the full Board of Directors. Once Messrs. Lee and Youngkin were identified, these directors and our founders held further meetings to discuss the new Co-CEO employment and compensation arrangements. The Board of Directors engaged Korn Ferry Hay Group as its compensation consultant to assist with the determination of the new arrangements for the Co-CEOs. Korn Ferry Hay Group provided market compensation data in order to provide a general understanding of current compensation practices, information on best practices and trends and modeling of various alternative compensation structures to our Board of Directors. They also worked closely with the Board of Directors on determining an appropriate selection of metrics to be used in measuring performance under the new incentive plan arrangements.
Effective January 1, 2018, Kewsong Lee and Glenn Youngkin were appointed as our new Co-Chief Executive Officers and also became members of our Board of Directors. In connection with their appointments, effective January 1, 2018, Messrs. Conway and Rubenstein transitioned from their prior roles as Co-Chief Executive Officers and became Co-Executive Chairmen of our Board and Mr. D’Aniello became Chairman Emeritus of our Board. Each of Messrs. Conway, D'Aniello and Rubenstein continue to serve as members of our Executive Group.
255
Effective on January 1, 2018, in connection with their respective new appointments, our Board of Directors approved new compensation arrangements for Messrs. Lee and Youngkin and, on October 23, 2017, we entered into new employment agreements with each of Messrs. Lee and Youngkin related to their service as our Co-Chief Executive Officers. The compensation arrangements for the Co-CEOs were designed to further align their interests with our investors.
The employment agreements each provide for a five-year term commencing on January 1, 2018 and continuing until December 31, 2022 or until such employment agreement is otherwise terminated in accordance with its terms (the “Term”). Under the employment agreements, each Co-CEO will receive a base salary of $275,000, which may be increased from time to time by our Board of Directors. In addition, during the Term, each Co-CEO will be eligible to receive an annual cash bonus equal to the distributions per common unit of the Partnership paid with respect to the applicable calendar year multiplied by 2,500,000 (subject to equitable adjustment by our Board of Directors in order to account for distributions, splits, reorganizations, recapitalizations, mergers, consolidations, spin-offs, combinations, exchanges or other similar events; and, following a Change of Control (as defined in the Second Amended and Restated Agreement of Limited Partnership of Partnership, dated as of September 13, 2017), the parties must negotiate and agree to an adjustment such that after the Change of Control the bonus opportunity is no less favorable to the Co-CEO than prior to the Change of Control). The employment agreements also provided for the payment by us of legal fees incurred by the Co-CEOs in connection with the negotiation of the employment agreements. The employment agreements also contain specified severance provisions and restrictive covenants that are described below in the section entitled “—Potential Payments Upon Termination or Change in Control.”
Pursuant to the terms of the employment agreement and as approved by the Co-CEO Award Committee of our Board of Directors in February 2018, each of our Co-Chief Executive Officers also received a one-time grant of time-vesting deferred restricted common units (“DRUs”) with respect to 1,250,000 common units of the Partnership and a one-time performance-vesting DRU award with respect to a target of 1,250,000 common units of the Partnership, in each case under The Carlyle Group L.P. 2012 Equity Incentive Plan (the “Equity Incentive Plan”). The time-vesting DRUs were granted on February 1, 2018 and the performance-vesting DRUs were granted on February 6, 2018. The time-vesting DRUs generally will vest in equal installments over five years, subject to the continued employment of the Co-CEO. The performance-vesting DRUs generally will vest and settle annually in five equal target installments, subject to the continued employment of the Co-CEO, with the opportunity to earn between 0% and 200% of the target amount of the performance-vesting DRUs based on the level of achievement of specified performance metrics that will be set by our Board of Directors at the beginning of each performance year. For the fiscal 2018 performance year, the first installment of the performance-vesting DRUs will vest and settle at the end of the one-year performance period based on the Partnership’s level of achievement against the Fee Related Earnings, Distributable Earnings and Fee-Earning Assets Under Management Raised targets established by our of Board of Directors. Of the total target number of performance DRUs awarded for the fiscal 2018 performance year, 75% will vest subject to achievement against the Fee Related Earnings target, 15% will vest subject to achievement against the Distributable Earnings target and 10% will vest subject to achievement against Fee-Earning Assets Under Management Raised ("FEAUM Raised") target. Fee Related Earnings is described under “Management’s Discussion and Analysis of Financial Condition and Results of Operations-Key Financial Measures-Non-GAAP Financial Measures-Fee Related Earnings.” Distributable Earnings is described under “Management’s Discussion and Analysis of Financial Condition and Results of Operations Key Financial Measures-Non-GAAP Financial Measures-Distributable Earnings.” FEAUM Raised represents fee earning capital raised from limited partners and excludes capital commitments made by the firm or through our internal coinvestment program. Any performance-vesting DRUs earned will vest upon certification by our Board of Directors of the performance of the Partnership against the applicable target performance metrics for the prior year. When assessing performance against the applicable prior year target performance metrics, our Board of Directors reserves the ability to adjust the actual fiscal year results to exclude the effects of extraordinary, unusual or infrequently occurring events. Following a Change of Control, the parties must agree on performance measures that provide for a threshold, target and maximum opportunity that is substantially similar to the opportunity in place prior to the Change of Control. See “—Potential Payments upon Termination or Change in Control” below for a description of the potential vesting that each of the Co-Chief Executive Officers may be entitled to in connection with a Change in Control or certain terminations of employment.
Compensation Committee
Executive compensation decisions for 2017 and prior years were made by our founders. In December 2017, in connection with the appointment of our new Co-Chief Executive Officers, we formed a compensation committee that will assume responsibility for approving all forms of compensation to be provided to, and employment agreements with, our Co-Chief Executive Officers, establishing and reviewing our general compensation philosophy, and reviewing, approving and overseeing the administration of our Equity Incentive Plan. Our Co-Chief Executive Officers will review and approve, or recommend to the compensation committee, compensation for our other executive officers.
256
Compensation Elements
The primary elements of our compensation program for our named executive officers are base salary, annual cash bonuses and long-term incentives, including the ownership of Carlyle Holdings partnership units, DRUs and, for certain of our named executive officers, carried interest, equity pool or key executive incentive plan ("KEIP") interests. We believe that the elements of compensation for our named executive officers serve the primary objectives of our compensation program. We periodically review the compensation of our key employees, including our named executive officers, and, from time to time, we may implement new plans or programs or otherwise make changes to the compensation structure relating to current or future key employees, including our named executive officers. In 2017, compensation decisions and decisions regarding the allocation of carried interest and KEIP interests to our named executive officers, senior Carlyle professionals and other employees were made by our founders and other senior Carlyle professionals and not by our independent directors.
Base Salary.
For 2017, each of our named executive officers was paid an annual salary of $275,000. We believe that the base salary of our named executive officers typically should not be the most significant component of total compensation. Our founders determined that this amount was a sufficient minimum base salary for our named executive officers and decided that it should be the same for all named executive officers.
Annual Discretionary Bonuses.
For 2017, our named executive officers were awarded bonuses, with the exception of our founders. The aggregate amounts of the bonuses were $1,500,000 for Mr. Youngkin, $1,500,000 for Mr. Buser and $1,500,000 for Mr. Ferguson. We paid 90% of each named executive officer's bonus in cash in December 2017 and paid the balance by granting an amount of DRUs that was equal to the remaining 10% of the total bonus amount in February 2018. The DRUs granted as part of the discretionary bonus for services provided in 2017 for the remaining 10% of the total bonus amount vest on August 1, 2019, 18 months after the grant date of February 1, 2018. These DRUs will be included in the Summary Compensation Table in our Form 10-K for the year-ended December 31, 2018.
The discretionary bonuses for each of our named executive officers were recommended by Mr. D’Aniello and were approved by all three of our founders. The specific factors considered in determining the discretionary bonuses for Messrs. Youngkin, Buser and Ferguson are discussed below. Our founders determined that they would not accept an annual bonus for 2017 in order to further align their interests with our unitholders.
The subjective factors that contributed to the determination of the bonus amounts included an assessment of the performance of Carlyle and the investments of the funds that we advise, the individual performance and contributions of the named executive officer to our business during 2017, the named executive officer’s potential to enhance investment returns and contribute to the long-term value of our common units and the named executive officer's tenure at his level. An overview of the main factors that were considered in determining the annual cash bonuses for 2017 include:
|
•
|
Achieving strong investment fund performance to create value for our investors;
|
|
•
|
Strategically expanding the firm's product offerings for our fund investors;
|
|
•
|
Raising approximately $43 billion in new commitments across our platform during 2017;
|
|
•
|
Managing our business through a continuing period of intense regulatory scrutiny of our industry;
|
|
•
|
Resolving certain historical legacy liabilities;
|
|
•
|
Continuing to enhance and grow our Global Credit business and develop additional ancillary Global Credit investment products;
|
|
•
|
Driving and overseeing the development of new or improved processes to further enhance the capabilities of our our investor services teams;
|
|
•
|
Maintaining disciplined cost control management and accountability for meeting or exceeding our firm operating budget.
|
Each of our named executive officers provided critical and significant contributions to Carlyle’s achievements in 2017. In assessing Mr. Youngkin’s performance and individual contribution, we considered his overall leadership role, including in evaluating new products and business strategies and in investor outreach, and his operational oversight of our business on a global basis. In assessing Mr. Buser’s performance, we considered his oversight of our accounting, finance and treasury functions and his leadership role in managing our preferred unit offering that closed in September 2017, driving and overseeing the development of new or improved processes to further enhance the capabilities of our investor services teams and maintaining disciplined cost control management and accountability for meeting or exceeding our firm operating budget across our global business. In assessing Mr. Ferguson’s performance, we considered his oversight of our global legal and compliance
257
team, his role in managing our litigation and his efforts to address legal and regulatory considerations applicable to our investment advisory business and to our firm as a public company, including his role in the successful resolution of certain historical legacy liabilities.
Carried Interest and Incentive Fees.
The general partners of our carry funds typically receive a special residual allocation of income, which we refer to as a carried interest, from our investment funds if investors in such funds achieve a specified threshold return. Similarly, the collateral managers of our structured credit funds are entitled to receive incentive fees from our credit funds if investors in such funds achieve a specified threshold return. While the Carlyle Holdings partnerships own controlling equity interests in these collateral managers and fund general partners, our senior Carlyle professionals and other personnel who work in these operations directly own a portion of the carried interest in these entities or are allocated a portion of the incentive fees, in order to better align their interests with our own and with those of the investors in these funds. We generally seek to concentrate the direct ownership of carried interest in respect of each carry fund and the incentive fees in our structured credit funds among those of our professionals who directly work with that fund so as to align their interests with those of our fund investors and of our firm. Our founders and Mr. Buser do not currently receive allocations of direct carried interest ownership or incentive fees at the fund level. Mr. Youngkin and Mr. Ferguson previously received allocations of direct carried interest ownership at the fund level in respect of certain corporate private equity funds, but neither continues to receive such allocations for subsequent funds.
Carried interest, if any, in respect of any particular investment, is only paid in cash when the underlying investment is realized. To the extent any “giveback” obligation is triggered, carried interest previously distributed by the fund would need to be returned to such fund. Our professionals who receive direct allocations of carried interest at the fund level are personally subject to the “giveback” obligation, pursuant to which they may be required to repay carried interest previously distributed to them, thereby reducing the amount of cash received by such recipients for any such year. There is no "giveback" obligation with respect to incentive fees. Because the amount of carried interest and incentive fees payable is directly tied to the realized performance of the underlying investments, we believe this fosters a strong alignment of interests among the investors in those funds and the professionals who are allocated direct carried interest, which also indirectly benefits our unitholders.
The percentage of carried interest owned at the fund level by individual professionals varies by year, by investment fund and, with respect to each carry fund, by investment. Ownership of carried interest by senior Carlyle professionals and other personnel at the fund level getting carry is also subject to a range of vesting schedules. Vesting is tied to continued employment over specified periods of time, which fosters employment retention and enhances the alignment of interests between our professionals who receive carried interest allocations, the firm and our fund investors.
Equity Pool Program
. Prior to our initial public offering in 2012, we facilitated employees sharing in the future potential value of all our investment activities through our equity pool program, which gave participants equity pool units that represented an economic stake in all the investments made in that calendar year. The last equity pool was formed in 2011, prior to our IPO. The equity pool was structured so that in a given year, the equity pool receives a portion of any carried interest proceeds Carlyle earns from all investments made during the respective calendar year. On a semi-annual basis, participants receive cash distributions equivalent to the equity pool unit value times their number of equity pool units. We anticipate that distributions from the equity pools will decline over the next few years as we exit investments in the respective equity pools. Of our named executive officers, only Mr. Youngkin, Mr. Buser and Mr. Ferguson previously received equity pool units and only Messrs. Buser and Ferguson received equity pool distributions in 2017.
Key Executive Incentive Program (KEIP).
In March 2014, we adopted a new methodology for determining potential future grants to certain key executives of DRUs and/or common units of the Partnership under the Equity Incentive Plan. The KEIP is intended to be an incentive to participants to align their economic interests with those of our fund investors and our common unitholders, as well as with Carlyle’s overall performance. Under the terms of the KEIP, for each applicable calendar year commencing with 2014, when we began the program, we calculate the number of DRUs to be issued to the participating executives based on the carried interest generated by the investment pool composed of the portfolio investments acquired during the calendar year by any of our carry funds. On a semi-annual basis, based on the amount of carried interest distributed during that period (less any funds escrowed to secure giveback obligations during that period) in the investment pool and the participating executive’s participation percentage, we calculate a number of DRUs to be granted to such executive for that period by reference to that executive’s interest in the investment pool for that period divided by the fair market value of our common units on the relevant grant date. The grant of such DRUs is anticipated to be made on November 1 of each year for carry distributed during the first and second quarters of the calendar year and on May 1 of the following year for carry distributed during the third and fourth quarters of the calendar year, subject in each case to a minimum grant threshold value of $100,000 for each six-month period. Each DRU grant will vest six months from the grant date.
258
Mr. Youngkin received participation percentages in the KEIP for 2014, 2015 and 2016. From time to time, additional key executives may be eligible to participate in the KEIP at our discretion. We did not allocate any participation percentages in the KEIP for 2017. On May 1, 2017, we granted Mr. Youngkin 6,470 DRUs, which represented his accrued but unpaid KEIP distributions in the 2014, 2015 and 2016 KEIP as of December 31, 2016. These DRUs vested on November 1, 2017. We anticipate that in May 2018, Mr. Youngkin will be granted DRUs with a value equivalent to $120,646, which represents his accrued but unpaid KEIP distributions in the 2014, 2015 and 2016 KEIP as of December 31, 2017.
Other Equity Grants.
Carlyle Holdings Partnership Units
. At the time of the initial public offering, our pre-IPO owners contributed to the Carlyle Holdings partnerships equity interests in our business in exchange for partnership units of Carlyle Holdings. All of the Carlyle Holdings partnership units received by our founders as part of the reorganization were fully vested upon receipt. A portion of the Carlyle Holdings partnership units received by employees other than our founders in exchange for their contribution of interests in the Parent Entities and other interests are subject to vesting, as are certain additional Carlyle Holdings partnership units we have issued subsequent to our IPO in connection with certain acquisitions. As of December 31, 2017, of the portion of the Carlyle Holdings partnership units that are subject to vesting, only one tranche, representing one sixth of the Carlyle Holdings partnership units subject to vesting, remains unvested and will vest on May 2, 2018.
Bonus Holdback DRU Grants
. As part of the annual bonuses awarded to our named executive officers (other than the founders, who do not receive bonuses), we paid a portion of such bonuses in Bonus Holdback DRUs. On February 1, 2017, Messrs. Buser, Youngkin and Ferguson each were granted 7,559, 8,721 and 7,559 Bonus Holdback DRUs, respectively. These Bonus Holdback DRUs represented 10% of the total bonus amount awarded to each respective named executive officer for services provided in 2016. These Bonus Holdback DRUs will vest on August 1, 2018, 18 months after the grant date. These Bonus Holdback DRUs are reflected as stock awards for 2017 in the Summary Compensation Table and in the Grants of Plan-Based Awards in 2017 table.
On February 1, 2018, Messrs. Buser, Youngkin and Ferguson each were granted 5,803 Bonus Holdback DRUs. These Bonus Holdback DRUs represented 10% of the total bonus amount awarded to each respective named executive officer for services provided in 2017. These Bonus Holdback DRUs will be reflected as stock awards for 2018 in the Summary Compensation Table and in the Grants of Plan-Based Awards in 2018 table in our Form 10-K for the year-ended December 31, 2018. Because the value of these Bonus Holdback DRUs is directly tied to the performance of the Partnership, we believe this fosters a strong alignment of interests between our named executive officers and our unitholders.
Annual Discretionary DRU Grants
. As part of our year-end compensation program, on February 1, 2017, we awarded discretionary DRU grants to Messrs. Buser and Ferguson, based on their 2016 performance, leadership, overall responsibilities and expected future contribution to the firm’s success. The size of each DRU grant was approved by our Equity Plan Administrator, which for 2016 was comprised of our three founders. On February 1, 2017, Mr. Buser received a grant of 174,194 DRUs and Mr. Ferguson received a grant of 96,775 DRUs. These DRU grants vest 40% on August 1, 2018, 30% on August 1, 2019 and 30% on August 1, 2020. These DRUs are reflected as stock awards for 2017 in the Summary Compensation Table and in the Grants of Plan-Based Awards in 2017 table.
As part of our year-end compensation program, on February 1, 2018, we awarded discretionary DRU grants to Messrs. Youngkin, Buser and Ferguson based on their 2017 performance, leadership, overall responsibilities and expected future contribution to the firm's success. The size of each grant was approved by our Equity Plan Administrator, which for 2017 was comprised of our three founders.
|
•
|
Time-Vested DRU Grants
. On February 1, 2018, Mr. Youngkin received a grant of 100,000 time-vesting DRUs, Mr. Buser received a grant of 113,379 time-vesting DRUs and Mr. Ferguson received a grant of 68,028 time-vesting DRUs. These time-vesting DRU grants vest 40% on August 1, 2019, 30% on August 1, 2020 and 30% on August 1, 2021. Mr. Youngkin received this grant due to his overall leadership role, including in evaluating new products and business strategies and in investor outreach, and his operational oversight of our business on a global basis. Mr. Buser received this grant due to his strong performance during 2017 as our Chief Financial Officer, including his oversight of our accounting, finance and treasury functions and his leadership role in managing our preferred unit offering that closed in September 2017, driving and overseeing the development of new or improved processes to further enhance the capabilities of our investor services teams and maintaining disciplined cost control management and accountability for meeting or exceeding our firm operating budget across our global business. Mr. Ferguson received this grant due to his oversight of our global legal and compliance team, his role in managing our litigation and his efforts to address legal and regulatory considerations applicable to our
|
259
investment advisory business and to our firm as a public company, including his role in the successful resolution of certain historical legacy liabilities. These DRUs will be reflected as stock awards for 2018 in the Summary Compensation Table and in the Grants of Plan-Based Awards in 2018 table in our Form 10-K for the year-ended December 31, 2018.
|
•
|
Performance DRU Grants
. On February 6, 2018, Mr. Buser received a performance-vesting DRU award with respect to a target of 45,352 performance-vesting DRUs. Mr. Buser will have the opportunity to earn between 0% and 200% of the target amount of performance-vesting DRUs based on the level of achievement against the performance targets, subject to Mr. Buser's continued employment by the Partnership. Mr. Buser's performance-vesting DRUs will vest subject to the Partnership's achievement of the same performance targets and weighting as is applicable to our Co-CEOs which are described above under "—Appointment of New Co-Chief Executive Officers and Directors." Mr. Buser received this DRU grant due to his strong performance during 2017 as our Chief Financial Officer, including his oversight of our accounting, finance and treasury functions and his leadership role in managing our preferred unit offering that closed in September 2017, driving and overseeing the development of new or improved processes to further enhance the capabilities of our investor services teams and maintaining disciplined cost control management and accountability for meeting or exceeding our firm operating budget across our global business. These DRUs will be reflected as stock awards for 2018 in the Summary Compensation Table and in the Grants of Plan-Based Awards in 2018 table in our Form 10-K for the year-ended December 31, 2018.
|
Our founders do not receive DRU awards.
Compensation Committee Report
In December 2017, we formed a compensation committee of the Board of Directors. The compensation committee of the Board of Directors has reviewed and discussed with management the foregoing Compensation Discussion and Analysis and, based on such review and discussion, has determined that the Compensation Discussion and Analysis should be included in this annual report.
|
|
|
Anthony Welters (Chairman)
|
||
|
William E. Conway, Jr.
|
||||
|
Daniel A. D'Aniello
|
||||
|
David M. Rubenstein
|
||||
|
Lawton W. Fitt
|
||||
Compensation Committee Interlocks and Insider Participation
Executive compensation decisions for 2017 and prior years were made by our founders. In December 2017, our Board of Directors formed a compensation committee consisting of Messrs. Welters (Chairman), Conway, D'Aniello and Rubenstein and Ms. Fitt. Our founders served as co-principal executive officers during 2017 and continue to serve as executive officers of the Partnership following the appointments of Messrs. Youngkin and Lee as our new Co-Chief Executive Officers. For a description of certain transactions between us and the members of our compensation committee, see “Item 13. Certain Relationships, Related Transactions and Director Independence.”
260
Summary Compensation Table
The following table presents summary information concerning compensation of our named executive officers during the fiscal years ended December 31, 2017, December 31, 2016 and December 31, 2015. For our named executive officers who own direct carried interest allocations or allocations of incentive fees at the fund level or who participate in the equity pool program, we have reported in the "All Other Compensation" column amounts that reflect the actual cash distributions received by our named executive officers in respect of such allocations during the relevant year. The Principal Positions referenced below are as of January 1, 2018.
|
Name and Principal Position
|
Year
|
Salary ($)
|
|
Cash Bonus
($)(1)
|
Stock Awards
($)(2)
|
|
All Other
Compensation
($)
|
|
Total
($)
|
||||||
|
William E. Conway, Jr.
|
2017
|
275,000
|
—
|
|
—
|
|
6,750
|
|
(3)
|
281,750
|
|
||||
|
Founder, Co-Executive Chairman and Co-Chief Investment Officer
|
2016
|
275,000
|
—
|
|
—
|
|
6,625
|
|
(3)
|
281,625
|
|
||||
|
(co-principal executive officer)
|
2015
|
275,000
|
|
—
|
|
—
|
|
|
6,625
|
|
(3)
|
281,625
|
|
||
|
Daniel A. D'Aniello
|
2017
|
275,000
|
—
|
|
6,750
|
|
(4)
|
281,750
|
|
||||||
|
Founder and Chairman Emeritus
|
2016
|
275,000
|
—
|
|
6,625
|
|
(3)
|
281,625
|
|
||||||
|
(co-principal executive officer)
|
2015
|
275,000
|
|
—
|
|
—
|
|
|
6,625
|
|
(3)
|
281,625
|
|
||
|
David M. Rubenstein
|
2017
|
275,000
|
—
|
|
—
|
|
6,750
|
|
(3)
|
281,750
|
|
||||
|
Founder and Co-Executive Chairman
|
2016
|
275,000
|
—
|
|
—
|
|
6,625
|
|
(3)
|
281,625
|
|
||||
|
(co-principal executive officer)
|
2015
|
275,000
|
|
—
|
|
—
|
|
|
6,625
|
|
(3)
|
281,625
|
|
||
|
Curtis L. Buser
|
2017
|
275,000
|
1,350,000
|
|
2,510,672
|
|
132,800
|
|
(4)
|
4,268,472
|
|
||||
|
Chief Financial Officer
|
2016
|
275,000
|
1,170,000
|
|
987,741
|
|
132,892
|
|
(4)
|
2,565,633
|
|
||||
|
(principal financial officer)
|
2015
|
275,000
|
|
1,350,000
|
|
992,522
|
|
|
247,476
|
|
(4)
|
2,864,998
|
|
||
|
Glenn A. Youngkin
|
2017
|
275,000
|
1,350,000
|
|
246,094
|
|
3,704,275
|
|
(5)
|
5,575,369
|
|
||||
|
Co-Chief Executive Officer
|
2016
|
275,000
|
1,350,000
|
|
196,927
|
|
3,389,484
|
|
(5)
|
5,211,411
|
|
||||
|
2015
|
275,000
|
2,025,000
|
|
2,077,513
|
|
1,360,033
|
|
(5)
|
5,737,546
|
|
|||||
|
Jeffrey W. Ferguson
|
2017
|
275,000
|
|
1,350,000
|
|
1,445,387
|
|
|
8,880
|
|
(6)
|
3,079,267
|
|
||
|
General Counsel
|
2016
|
275,000
|
|
1,170,000
|
|
122,533
|
|
|
213,395
|
|
(6)
|
1,780,928
|
|
||
|
2015
|
275,000
|
1,260,000
|
|
1,029,524
|
|
621,690
|
|
(6)
|
3,186,214
|
|
|||||
|
(1)
|
For each year shown, the amount shown represents the cash portion of the year-end bonus paid in December of that year, but excludes the portion paid in Bonus Holdback DRUs in February of the following year. As part of the discretionary bonuses for services provided in 2017, 2016 and 2015, each of our named executive officers (other than our founders) received 10% of his bonus in a grant of DRUs.
|
|
(2)
|
This amount represents the grant-date fair value of DRUs granted in for the year shown, computed in accordance with U.S. GAAP pertaining to equity-based compensation. For additional information regarding the determination of grant-date fair value see Note 14 to our consolidated financial statements included in this Annual Report on Form 10-K. Amounts reported for 2017 reflect the portion of the 2016 year-end bonus paid in Bonus Holdback DRU awards, which were granted to Messrs. Buser, Youngkin and Ferguson on February 1, 2017. The grant-date fair value of the Bonus Holdback DRU awards is computed in accordance with GAAP and differs from the dollar amount of the portion of the 2016 year-end bonus that was held back. Amounts reported also reflect a DRU award granted to Mr. Youngkin on May 1, 2017 with respect to his accrued KEIP distributions through December 31, 2016 and the annual discretionary DRU awards that were granted to Messrs. Buser and Ferguson on February 1, 2017.
|
|
(3)
|
This amount represents our 401(k) matching contributions.
|
|
(4)
|
This amount represents cash distributions of $126,050, $126,267 and $240,851 received by Mr. Buser in respect of his equity pool interest for 2017, 2016 and 2015 respectively, and also includes $6,750, $6,625, and $6,625 in 401(k) matching contributions for 2017, 2016 and 2015, respectively.
|
|
(5)
|
This amount represents actual cash distributions received by Mr. Youngkin in respect of direct carried interest allocations at the fund level of $3,697,525, $3,382,859 and $1,353,408 for 2017, 2016 and 2015, respectively; and also includes $6,750, $6,625 and $6,625 in 401(k) matching contributions for 2017, 2016 and 2015, respectively.
|
|
(6)
|
This amount represents actual cash distributions received by Mr. Ferguson in respect of direct carried interest allocations at the fund level of $0, $206,770 and $615,065 for 2017, 2016 and 2015, respectively. This amount also includes $6,750, $6,625 and $6,625 in 401(k) matching contributions for 2017, 2016 and 2015, respectively and $2,130 received by Mr. Ferguson in respect of his equity pool interest for 2017.
|
261
Grants of Plan-Based Awards in 2017
The number of DRUs shown under the column heading “All Other Stock Awards: Number of Shares of Stock or Units” in the table below represents the aggregate number of unvested DRUs that were granted to the relevant named executive officers in 2017. The dollar amounts shown under the column heading “Grant Date Fair Value of Stock and Option Awards” in the table below were calculated in accordance with ASC Topic 718. For additional information regarding the determination of grant date fair value, see Note 14 to our consolidated financial statements included in this Annual Report on Form 10-K.
|
|
|
Stock Awards
(1)
|
|||||||||
|
Name
|
Grant
Date
|
All Other
Stock Awards:
Number of
Shares of Stock
or Units (#)
|
Grant Date
Fair Value of
Stock and
Option
Awards
|
||||||||
|
William E. Conway, Jr.
|
—
|
|
—
|
|
$
|
—
|
|
||||
|
Daniel A. D’Aniello
|
—
|
|
—
|
|
$
|
—
|
|
||||
|
David M. Rubenstein
|
—
|
|
—
|
|
$
|
—
|
|
||||
|
Curtis L. Buser
|
2/1/2017
|
|
174,194
|
|
(2)
|
$
|
2,396,909
|
|
|||
|
2/1/2017
|
|
7,559
|
|
(3)
|
$
|
113,763
|
|
||||
|
Glenn A. Youngkin
|
2/1/2017
|
|
8,721
|
|
(3)
|
$
|
131,251
|
|
|||
|
5/1/2017
|
|
6,470
|
|
(4)
|
$
|
114,843
|
|
||||
|
Jeffrey W. Ferguson
|
2/1/2017
|
|
96,775
|
|
(2)
|
$
|
1,331,624
|
|
|||
|
2/1/2017
|
|
7,559
|
|
(3)
|
$
|
113,763
|
|
||||
|
(1)
|
The references to “stock,” “shares” or “units” in this table refer to DRUs.
|
|
(2)
|
Represents discretionary DRU grants awarded to Messrs. Buser and Ferguson. These DRU grants will vest 40% on August 1, 2018; 30% on August 1, 2019; and 30% on August 1, 2020.
|
|
(3)
|
Represents Bonus Holdback DRUs awarded to Messrs. Buser, Youngkin and Ferguson, all of which will vest on August 1, 2018.
|
|
(4)
|
Represents a DRU grant with respect to Mr. Youngkin's accrued KEIP distributions through December 31, 2016. These DRUs vested on November 1, 2017.
|
Narrative Disclosure to Summary Compensation Table and Grants of Plan-Based Awards in 2017
Terms of Carlyle Holdings Partnership Units
Our pre-IPO owners, including certain of our named executive officers, received Carlyle Holdings partnership units in the reorganization in exchange for the contribution of their equity interests in the former Parent Entities and a portion of the equity interests they owned in certain of our operating subsidiaries. Each holder of our Carlyle Holdings partnership units who is employed by us will generally be required to hold at least 25% of such units until one year following the termination of active service with us. A holder who is our employee generally will forfeit all unvested Carlyle Holdings partnership units once he or she is no longer providing services. Notwithstanding the foregoing, upon the death or permanent disability of a holder of all of his or her unvested Carlyle Holdings partnership units held at that time will vest immediately. In addition, all vested and unvested Carlyle Holdings partnership units held by a holder who is employed by us will be immediately forfeited in the event his or her service is terminated for cause, or if such person materially breaches the non-solicitation provisions of the partnership agreements of the Carlyle Holdings partnership agreements.
Transfer Restrictions
. As of May 2, 2017, the fifth anniversary of our initial public filing, employee holders of our Carlyle Holdings partnership units, including our founders and our other senior Carlyle professionals, are permitted to transfer or exchange any such units without our consent. See “Item 13. Certain Relationships and Related Transactions, and Director Independence—Exchange Agreement."
Equity Incentive Plan Awards
In connection with our initial public offering, the firm adopted the Equity Incentive Plan, which is a source of new equity-based awards and permits us to grant to our senior Carlyle professionals, employees, directors of our general partner and consultants non-qualified options, unit appreciation rights, common units, restricted common units, DRUs, phantom restricted common units and other awards based on our common units and Carlyle Holdings partnership units. Unvested DRUs granted
262
to our named executive officers under the Equity Incentive Plan generally will be forfeited upon termination of employment. For a description of the potential vesting that the named executive officers may be entitled to with respect to their DRUs in connection with a Change of Control (as defined in the Equity Incentive Plan) or certain terminations of employment see “Potential Payments upon Termination or Change in Control” below. In addition, all vested and unvested DRUs will be immediately forfeited in the event the holder is terminated for cause, or if such person materially breaches any applicable restrictive covenant. For more information regarding the DRUs granted to our named executive officers under the Equity Incentive Plan, including the vesting criteria, see the sections entitled “Key Executive Incentive Program (KEIP)” and “Other Equity Awards” above.
Outstanding Equity Awards at 2017 Fiscal-Year End
The following table provides information regarding outstanding unvested equity awards held by our named executive officers as of December 31, 2017. Some of the Carlyle Holdings partnership units received by certain of our named executive officers as a part of the reorganization we effected prior to our initial public offering are subject to vesting; however, all of the Carlyle Holdings partnership units received by our founders as part of the reorganization were fully vested at issuance. The dollar amounts shown under the column heading “Market Value of Shares or Units of Stock That Have Not Vested” in the table below were calculated by multiplying the number of unvested Carlyle Holdings partnership units and unvested DRUs held by the named executive officer by the closing market price of $22.90 per Carlyle common unit on December 29, 2017, the last trading day of 2017.
|
|
Stock Awards
(1)
|
|||||
|
|
Number of Shares or Units
of Stock That Have Not
Vested (#)
|
Market Value of Shares or
Units of Stock That Have Not
Vested ($)
|
||||
|
William E. Conway, Jr.
|
—
|
|
||||
|
Daniel A. D’Aniello
|
—
|
|
—
|
|
||
|
David M. Rubenstein
|
—
|
|
—
|
|
||
|
Curtis L. Buser (2)
|
316,864
|
|
$
|
7,256,186
|
|
|
|
Glenn A. Youngkin (3)
|
724,824
|
|
$
|
16,598,470
|
|
|
|
Jeffrey W. Ferguson (4)
|
216,055
|
|
$
|
4,947,660
|
|
|
|
(1)
|
The references to “stock,” “shares” or “units” in this table refer to Carlyle Holdings partnership units and DRUs.
|
|
(2)
|
Mr. Buser's 316,864 units are composed of 32,588 unvested Carlyle Holdings partnership units, all of which will vest on May 2, 2018; 276,717 discretionary DRUs of which 105,097 will vest on August 1, 2018, 119,362 will vest on August 1, 2019, 52,258 will vest on August 1, 2020; and 7,559 Bonus Holdback DRUs, all of which will vest on August 1, 2018.
|
|
(3)
|
Mr. Youngkin’s 724,824 units are composed of 650,199 unvested Carlyle Holdings partnership units, all of which will vest on May 2, 2018; 65,904 discretionary DRUs of which 22,813 will vest on August 1, 2018 and 43,091 will vest on August 1, 2019; and 8,721 Bonus Holdback DRUs, all of which will vest on August 1, 2018.
|
|
(4)
|
Mr. Ferguson's 216,055 units are composed of 85,951 unvested Carlyle Holdings partnership units, all of which will vest on May 2, 2018; 122,545 discretionary DRUs, of which 50,116 will vest on August 1, 2018; 43,397 will vest on August 1, 2019; and 29,032 will vest on August 1, 2020; and 7,559 Bonus Holdback DRUs, all of which will vest on August 1, 2018.
|
Option Exercises and Stock Vested in 2017
As we have never issued any options, our named executive officers had no option exercises during the year ended December 31, 2017. Some of our named executive officers had equity awards vest during the year ended December 31, 2017.
|
|
Stock Awards
(1)
|
|||||
|
|
Number of Shares Acquired on Vesting (#)
|
Value Realized on Vesting ($) (5)
|
||||
|
William E. Conway, Jr.
|
—
|
|
—
|
|
||
|
Daniel A. D’Aniello
|
—
|
|
—
|
|
||
|
David M. Rubenstein
|
—
|
|
—
|
|
||
|
Curtis L. Buser (2)
|
91,533
|
|
$
|
1,787,193
|
|
|
|
Glenn A. Youngkin (3)
|
739,393
|
|
$
|
13,168,833
|
|
|
|
Jeffrey W. Ferguson (4)
|
122,186
|
|
$
|
2,245,612
|
|
|
|
(1)
|
The references to “stock”, “shares” or “units” in this table refer to Carlyle Holdings partnership units and Carlyle common units.
|
263
|
(2)
|
The value for Mr. Buser is based on the value of 32,588 Carlyle Holdings partnership units that vested on May 2, 2017 and 58,945 common units received upon the vesting of DRUs on August 1, 2017.
|
|
(3)
|
The value for Mr. Youngkin is based on the value of 650,200 Carlyle Holdings partnership units that vested on May 2, 2017 and 82,723 common units received upon the vesting of DRUs on August 1, 2017 and 6,470 common units received upon vesting of DRUs on November 1, 2017.
|
|
(4)
|
The value for Mr. Ferguson is based on the value of 85,951 Carlyle Holdings partnership units that vested on May 2, 2017 and 36,235 common units received upon the vesting of DRUs on August 1, 2017.
|
|
(5)
|
For both Carlyle Holdings partnership units and common units, the value realized on vesting was calculated by multiplying the number of Carlyle Holdings partnership units and the number of common units received upon vesting by the closing market price per common unit on the applicable vesting date.
|
Pension Benefits for 2017
We do not provide pension benefits to our named executive officers.
Nonqualified Deferred Compensation for 2017
We do not provide defined contribution plans for the deferral of compensation on a basis that is not tax-qualified.
Potential Payments upon Termination or Change in Control
Other than as described below, none of our named executive officers are entitled to any additional payments or benefits upon termination of employment, upon a change in control of our company or upon retirement, death or disability.
Upon a Change of Control (as defined in the Equity Incentive Plan) or a termination of employment because of death or disability, any unvested DRUs held by any of our named executive officers will automatically be deemed vested as of immediately prior to such occurrence of such change of control or such termination of employment. Had such a change of control or such a termination of employment occurred on December 29, 2017, the last business day of 2017, each of our named executive officers would have vested in the following numbers of DRUs, having the following values based on our closing market price of $22.90 per Carlyle common unit on December 29, 2017: Messrs. Conway, D’Aniello and Rubenstein had no outstanding unvested DRUs at December 29, 2017; Mr. Buser – 284,276 DRUs with an aggregate value of $6,509,920; Mr. Youngkin – 74,625 DRUs with an aggregate value of $1,708,913 and Mr. Ferguson – 130,104 DRUs with an aggregate value of $2,979,382.
Co-Chief Executive Officer Employment Agreements
Severance Arrangements.
The Co-Chief Executive Officer employment agreements provide that, upon a termination of employment by a Co-CEO for Good Reason or by Carlyle without Cause, such Co-CEO is entitled to receive cash severance, subject to the execution of a release and compliance with certain restrictive covenants, payable over the 12-month severance period (or, if shorter, through the end of the Term) of a monthly amount equal to annual base salary, Average Annual Bonus (as defined in the employment agreements; the Average Annual Bonus is payable in a lump sum in the later of February 2019 or the end of the severance period if termination occurs in the first year of the Term rather than over a 12-month period) and 12-months of COBRA premiums divided by the number of months in the severance period. Upon a termination of employment by a Co-CEO for Good Reason or by Carlyle without Cause or in the case of the death or disability of a Co-CEO, such Co-CEO is also entitled to a prorated portion of his annual bonus for the portion of the year of termination during which the Co-CEO was employed and, if terminated after the end of a calendar year and before payment of the annual bonus for such year, the annual bonus for the prior year. If a Co-CEO is terminated for any reason other than Cause after the end of the Term, any annual bonus payment for the fifth year of the Term that has not yet been paid will be paid.
Equity Awards
. The Co-Chief Executive Officer employment agreements provide that, upon a termination of employment by a Co-CEO for Good Reason (as defined in the employment agreements) or by us without Cause (as defined in the employment agreements), subject to the execution of a release and compliance with certain restrictive covenants, a portion of such Co-CEO’s time-vesting and performance-vesting DRUs will vest (at target with respect to performance-vesting DRUs) on the next scheduled vesting date following the date of such termination, in an amount equal to: (i) the amount that would have vested on such vesting date had such Co-CEO remained employed through such date
plus
(ii) if such termination occurs in the first four years of the Term, a pro rata portion of the DRUs related to the portion of the year of termination prior to termination (or, if such termination occurs in the January or February prior to the scheduled vesting date in such year, 12 months). If such a termination occurs following a Change of Control during the Term, a Co-CEO will vest in an additional year of DRUs (both time-vesting DRUs and performance-vesting DRUs (at target with respect to performance-vesting DRUs)), but in a maximum amount that is not more than the total number of DRUs granted. Upon the death or disability of a Co-CEO, the time-vesting and performance-vesting DRUs that were granted to such Co-CEO will vest in full (with vesting to occur at the target amount
264
with respect to the performance-vesting DRUs) to the extent not yet vested. Upon a termination of employment of a Co-CEO for Cause, all vested and unvested time-vesting and performance-vesting DRUs of such Co-CEO will be automatically forfeited.
If a Co-CEO is terminated for any reason other than Cause after the end of the Term, any time-vesting or performance-vesting DRUs that are not yet vested will continue to vest (based on actual performance for the performance-vesting DRUs).
Restrictive Covenants.
The Co-Chief Executive Officer employment agreements also include restrictive covenants limiting the Co-CEO’s ability to solicit employees of Carlyle for 12 months following the termination of employment (but not past the occurrence of a Change of Control) or compete with Carlyle or solicit its investors for 12 months following a termination of employment (but not past the earlier of the end of the Term or the occurrence of a Change of Control). The Co-CEOs are also subject to confidentiality covenants and may not disclose publicly or discuss our fundraising efforts or the name of any fund vehicle that has not had a final closing with any member of the press. The Co-CEOs and Carlyle are subject to certain cooperation covenants and, during a Co-CEOs employment and for five years following a termination, non-disparagement obligations.
Founders’ Non-Competition and Non-Solicitation Agreements
The following is a description of the material terms of the non-competition agreements we have with each of our founders.
Non-Competition.
Each founder agreed that during the period he is a controlling partner (as defined in the non-competition agreement) and for the period of three years thereafter (the “Restricted Period”), he will not engage in any business or activity that is competitive with our business.
Non-Solicitation of Carlyle Employees.
Each founder agreed that during the Restricted Period, he will not solicit any of our employees, or employees of our subsidiaries, to leave their employment with us or otherwise terminate or cease or materially modify their relationship with us, or employ or engage any such employee.
Non-Solicitation of Clients
. In addition, during the Restricted Period, each founder will not solicit any of the investors of the funds we advise to invest in any funds or activities that are competitive with our businesses.
Confidentiality.
During the Restricted Period, each founder is required to protect and only use “proprietary information” that relates to our business in accordance with strict restrictions placed by us on its use and disclosure. Each founder agreed that during the Restricted Period he will not disclose any of the proprietary information, except (1) as required by his duties on behalf of Carlyle or with our consent or (2) as required by virtue of subpoena, court or governmental agency order or as otherwise required by law or (3) to a court, mediator or arbitrator in connection with any dispute between such founder and us.
Investment Activities.
During the Restricted Period, each founder has agreed that he will not pursue or otherwise seek to develop any investment opportunities under active consideration by Carlyle.
Specific Performance.
In the case of any breach of the non-competition, non-solicitation, confidentiality and investment activity limitation provisions, each founder agrees that we will be entitled to seek equitable relief in the form of specific performance and injunctive relief.
Pay Ratio Disclosure
As required by Section 953(b) of the Dodd-Frank Wall Street Reform and Consumer Protection Act, and Item 402(u) of Regulation S-K, we are providing the following information regarding the ratio of the total annual compensation for each of our co-principal executive officers to the median of the annual total compensation of all our employees (other than our co-principal executive officers) (the “CEO Pay Ratio”). For 2017, our co-principal executive officers were Messrs. Conway, D’Aniello and Rubenstein. Our CEO Pay Ratio is a reasonable estimate calculated in a manner consistent with Item 402(u). However, due to the flexibility afforded by Item 402(u) in calculating the CEO Pay Ratio, our CEO Pay Ratio may not be comparable to the CEO pay ratios presented by other companies.
As of December 31, 2017, we employed more than 1,600 individuals, including 654 investment professionals, located in 31 offices across six continents. We identified our median employee using our global employee population as of October 31, 2017. To identify our median employee, we used annual base salary and bonuses earned (guaranteed and discretionary) in
265
2017. Application of our consistently applied compensation measure identified eight employees with the same total annual base salary and bonus earned in 2017. Therefore, in order to identify our median employee, we calculated the annual total compensation in accordance with the requirements of the Summary Compensation Table for all eight employees and identified the two middle employees from the even-numbered group. We then selected our median employee from among the two middle employees by reviewing the components of their annual total compensation and selecting the employee whose compensation characteristics more accurately reflected the compensation of a typical employee.
For 2017, the annual total compensation for each of our co-principal executive officers was $281,750, respectively, and our median employee’s annual total compensation was $201,315. Accordingly, our CEO Pay Ratio for 2017 for each of our co-principal executive officers was 1.4:1.
Going forward, we expect that our CEO Pay Ratio will differ substantially from our 2017 CEO Pay Ratio as a result of the appointments of Messrs. Lee and Youngkin as our new Co-CEOs, effective January 1, 2018. While historically the annual total compensation received by our former co-principal executive officers has been limited solely to an annual base salary and 401(k) matching contributions in light of their unique status as founders of our firm, the employment agreements entered into with our new Co-CEOs provide for additional significant elements of compensation.
Director Compensation
No additional remuneration is paid to our employees or advisors for service as a director or on committees of the Board of Directors of our general partner. Certain of the directors of our general partner are employees or advisors to Carlyle and have received compensation or other payments in respect of their services in such capacities. See “Item 13. Certain Relationships and Related Person Transactions—Other Transactions.” In addition, each director is reimbursed for reasonable out-of-pocket expenses incurred in connection with such service.
In 2017, each director who was not an employee of or advisor to Carlyle received an annual retainer of $225,004, $125,000 of which was paid in cash and $100,004 of which was paid in the form of a grant of DRUs on May 1, 2017. These DRUs will vest on May 1, 2018, the first anniversary of the grant date. We paid an additional $25,000 annual cash retainer to Mr. Shaw, the Chairman of the audit committee for 2017.
At the end of 2017, our Board of Directors reviewed our non-employee director compensation, which has remained unchanged since 2014, and determined it was appropriate to make a moderate increase in the annual compensation payable to non-employee directors of the Company. Beginning in 2018, each director that is not an employee of or advisor to Carlyle will receive an annual retainer of $250,000, $130,000 of which is payable in cash and $120,000 of which is payable in the form of an annual deferred restricted common unit award that will vest on the first anniversary of the grant date. In addition and in connection with the above review, our Board of Directors also determined it was appropriate to pay our lead independent director and the Chair of our newly formed compensation and nominating & corporate governance committees the same additional $25,000 annual cash retainer that is paid to the Chair of our audit committee. These changes in the Company’s non-employee director compensation policy are effective as of the beginning of 2018.
Director Compensation in 2017
The following table provides the director compensation for Mr. Hance and Mr. Mathias and our non-employee directors for 2017:
|
Name
|
Fees Earned
or
Paid in Cash
|
Stock
Awards(1)
|
Total
|
||||||||
|
Lawton W. Fitt
|
$
|
125,000
|
|
$
|
100,004
|
|
$
|
225,004
|
|
||
|
James H. Hance, Jr.
(2)
|
$
|
—
|
|
$
|
—
|
|
$
|
—
|
|
||
|
Janet Hill
|
$
|
125,000
|
|
$
|
100,004
|
|
$
|
225,004
|
|
||
|
Edward J. Mathias
(2)(3)
|
$
|
—
|
|
$
|
—
|
|
$
|
—
|
|
||
|
Dr. Thomas S. Robertson
|
$
|
125,000
|
|
$
|
100,004
|
|
$
|
225,004
|
|
||
|
William J. Shaw
|
$
|
150,000
|
|
$
|
100,004
|
|
$
|
250,004
|
|
||
|
Anthony Welters
|
$
|
125,000
|
|
$
|
100,004
|
|
$
|
225,004
|
|
||
|
(1)
|
The reference to “stock” in this table refers to DRUs. Amounts represent the grant date fair value of the DRU awards granted on May 1, 2017 to each director who is not an employee of or advisor to the Partnership, computed in accordance with U.S. GAAP pertaining to equity-based compensation. For
|
266
additional information regarding the computation of grant date fair value, see Note 14 to our consolidated financial statements included in this Annual Report on Form 10-K.
|
(2)
|
As Mr. Hance is an Operating Executive and Mr. Mathias is an employee, no additional remuneration is paid to them as directors of our general partner. Mr. Hance and Mr. Mathias’ compensation is discussed in “Item 13. Certain Relationships and Related Transactions, and Director Independence.”
|
|
(3)
|
Mr. Mathias resigned as a director of our general partner effective December 31, 2017.
|
The following table provides information regarding outstanding unvested equity awards held by our non-employee directors as of December 31, 2017:
|
|
Stock Awards (1)
|
|||||
|
Name
|
Number of Shares
or Units of Stock
That Have Not
Vested
|
Market Value of
Shares or Units of
Stock That Have Not
Vested (2)
|
||||
|
Lawton W. Fitt
|
5,634
|
|
$
|
129,019
|
|
|
|
Janet Hill
|
5,634
|
|
$
|
129,019
|
|
|
|
Dr. Thomas S. Robertson
|
5,634
|
|
$
|
129,019
|
|
|
|
William J. Shaw
|
5,634
|
|
$
|
129,019
|
|
|
|
Anthony Welters
|
5,634
|
|
$
|
129,019
|
|
|
|
(1)
|
The references to “stock” or “shares” in this table refer to our DRUs.
|
|
(2)
|
The dollar amounts shown under this column were calculated by multiplying the number of unvested DRUs held by the director by the closing market price of $22.90 per Carlyle common unit on December 29, 2017, the last trading day of 2017.
|
ITEM 12.
SECURITY OWNERSHIP OF CERTAIN BENEFICIAL OWNERS AND MANAGEMENT AND RELATED STOCKHOLDER MATTERS
The following table sets forth information regarding the beneficial ownership of The Carlyle Group L.P. common units and Carlyle Holdings partnership units as of February 9, 2018 by each person known to us to beneficially own more than 5% of any class of the outstanding voting securities of The Carlyle Group L.P., each of the directors and named executive officers of our general partner and all directors and executive officers of our general partner as a group. None of the directors or executive officers of our general partner hold any preferred units of The Carlyle Group L.P. We are managed by our general partner, Carlyle Group Management L.L.C., and the limited partners of The Carlyle Group L.P. do not presently have the right to elect or remove our general partner or its directors. Accordingly, we do not believe that the common units or the preferred units are “voting securities” as such term is defined in Rule 12b-2 under the Exchange Act.
|
|
Common Units
Beneficially Owned
|
Carlyle Holdings
Partnership Units
Beneficially Owned (1)
|
|||||||||
|
Name of Beneficial Owner (2)
|
Number
|
% of
Class
|
Number
|
% of
Class
|
|||||||
|
William E. Conway, Jr.
|
—
|
|
—
|
|
44,499,644
|
|
19.0
|
%
|
|||
|
Daniel A. D’Aniello (3)
|
—
|
|
—
|
|
44,499,644
|
|
19.0
|
%
|
|||
|
David M. Rubenstein
|
—
|
|
—
|
|
46,999,644
|
|
20.0
|
%
|
|||
|
Kewsong Lee
|
329,472
|
|
*
|
|
—
|
|
—
|
|
|||
|
Glenn A. Youngkin (3)
|
389,293
|
|
*
|
|
5,671,088
|
|
2.4
|
%
|
|||
|
Lawton W. Fitt
|
25,220
|
|
*
|
|
—
|
|
—
|
|
|||
|
James H. Hance, Jr.
|
12,285
|
|
*
|
|
251,380
|
|
*
|
|
|||
|
Janet Hill
|
25,220
|
|
*
|
|
—
|
|
—
|
|
|||
|
Thomas S. Robertson
|
25,220
|
|
*
|
|
—
|
|
—
|
|
|||
|
William J. Shaw
|
25,220
|
|
*
|
|
—
|
|
—
|
|
|||
|
Anthony Welters
|
33,643
|
|
*
|
|
—
|
|
—
|
|
|||
|
Curtis L. Buser
|
70,334
|
|
*
|
|
260,708
|
|
*
|
|
|||
|
Peter J. Clare (3)
|
18,660
|
|
*
|
|
4,611,030
|
|
2.0
|
%
|
|||
|
Jeffrey W. Ferguson
|
31,852
|
|
*
|
|
627,816
|
|
*
|
|
|||
|
All executive officers and directors as a group (14 persons)
|
986,419
|
|
*
|
|
147,420,954
|
|
62.8
|
%
|
|||
267
|
*
|
Less than 1%
|
|
(1)
|
Subject to certain requirements and restrictions, the partnership units of Carlyle Holdings are exchangeable for common units of The Carlyle Group L.P. on a one-for-one basis (subject to the terms of the exchange agreement). A Carlyle Holdings limited partner must exchange one partnership unit in each of the three Carlyle Holdings partnerships to effect an exchange for a common unit. See “Item 13. Certain Relationships and Related Transactions, and Director Independence—Exchange Agreement.” Beneficial ownership of Carlyle Holdings partnership units reflected in this table is presented separately from the beneficial ownership of the common units of The Carlyle Group L.P. for which such partnership units may be exchanged.
|
|
(2)
|
TCG Carlyle Global Partners L.L.C., an entity wholly owned by our senior Carlyle professionals, holds a special voting unit of The Carlyle Group L.P. that entitles it, on those few matters that may be submitted for a vote of the common unitholders of The Carlyle Group L.P., to participate in the vote on the same basis as the common unitholders and provides it with a number of votes that is equal to the aggregate number of vested and unvested partnership units in Carlyle Holdings held by the limited partners of Carlyle Holdings on the relevant record date.
|
|
(3)
|
The Carlyle Holdings partnership units shown in the table above for the named executive officers and directors include the following units held for the benefit of family members with respect to which such person disclaims beneficial ownership: Mr. D’Aniello – 285,714 units held in a trust for which Mr. D’Aniello is the investment trustee; Mr. Youngkin – 142,857 units held in a trust for which Mr. Youngkin is the investment trustee; and Mr. Clare – 273,632 units held in a trust for which Mr. Clare is the investment trustee.
|
Securities Authorized for Issuance under Equity Compensation Plans
The table set forth below provides information concerning the awards that may be issued under The Carlyle Group L.P. 2012 Equity Incentive Plan (the “Equity Incentive Plan”) as of December 31, 2017:
|
Plan category
|
Number of securities
to be issued upon exercise of
outstanding options,
warrants and rights
(1)
|
Weighted-
average
exercise price
of outstanding
options, warrants
and rights
|
Number of
securities remaining
available for future
issuance under equity
compensation plans
(excluding securities
reflected in column)
(2)
|
|||||
|
Equity compensation plans approved by security holders
|
15,470,416
|
|
—
|
|
—
|
|
||
|
Equity compensation plans not approved by security holders
|
—
|
|
—
|
|
—
|
|
||
|
Total
|
15,470,416
|
|
—
|
|
—
|
|
||
|
(1)
|
Reflects the outstanding number of our deferred restricted common units granted under the Equity Incentive Plan as of December 31, 2017.
|
|
(2)
|
The aggregate number of our common units and Carlyle Holdings partnership units covered by the Equity Incentive Plan is increased on the first day of each fiscal year during its term by a number of units equal to the positive difference, if any, of (a) 10% of the aggregate number of our common units and Carlyle Holdings partnership units outstanding on the last day of the immediately preceding fiscal year (excluding Carlyle Holdings partnership units held by The Carlyle Group L.P. or its wholly owned subsidiaries) minus (b) the aggregate number of our common units and Carlyle Holdings partnership units which were available for the issuance of future awards under the Equity Plan as of such last day (unless the administrator of the Equity Incentive Plan should decide to increase the number of our common units and Carlyle Holdings partnership units available for future grants under the plan by a lesser amount). As of January 1, 2018, pursuant to this formula, 33,491,450 units were available for issuance under the Equity Incentive Plan. We have filed a registration statement and intend to file additional registration statements on Form S-8 under the Securities Act to register common units covered by the Equity Incentive Plan (including pursuant to automatic annual increases). Any such Form S-8 registration statement will automatically become effective upon filing. Accordingly, common units registered under such registration statement will be available for sale in the open market.
|
ITEM 13.
CERTAIN RELATIONSHIPS AND RELATED TRANSACTIONS, AND DIRECTOR INDEPENDENCE
Tax Receivable Agreement
Limited partners of the Carlyle Holdings partnerships, may, subject to the terms of the exchange agreement and the Carlyle Holdings partnership agreements, exchange their Carlyle Holdings partnership units for The Carlyle Group L.P.
268
common units on a one-for-one basis. A Carlyle Holdings limited partner must exchange one partnership unit in each of the three Carlyle Holdings partnerships to effect an exchange for a common unit. Carlyle Holdings I L.P. has made an election under Section 754 of the Code effective for each taxable year in which an exchange of partnership units for common units occurred and will do so for all future tax years in which an exchange occurs. The election has resulted in increases to the tax basis of the assets of Carlyle Holdings at the time of an exchange of partnership units and future exchanges are expected to result in similar increases in future tax years. These increases in tax basis have reduced the amount of tax that certain of our subsidiaries, including Carlyle Holdings I GP Inc., which we refer to as, together with any successors thereto, the “corporate taxpayers,” would otherwise be required to pay in current period as well as in the future. These increases in tax basis may also decrease gains (or increase losses) on future dispositions of certain capital assets to the extent tax basis was and is allocated to those capital assets. The IRS may challenge all or part of the tax basis increase and increased deductions, and a court could sustain such a challenge.
We have entered into a tax receivable agreement with the limited partners of the Carlyle Holdings partnerships that provides for the payment by the corporate taxpayers to such owners of 85% of the amount of cash tax savings, if any, in U.S. federal, state and local income tax or foreign or franchise tax that the corporate taxpayers realize (or are deemed to realize in the case of an early termination payment by the corporate taxpayers or a change in control, as discussed below) as a result of increases in tax basis and certain other tax benefits related to our entering into the tax receivable agreement, including tax benefits attributable to payments under the tax receivable agreement. This payment obligation is an obligation of the corporate taxpayers and not of Carlyle Holdings. The corporate taxpayers expect to benefit from the remaining 15% of cash tax savings, if any, in income tax they realize. For purposes of the tax receivable agreement, the cash tax savings in income tax will be computed by comparing the actual income tax liability of the corporate taxpayers (calculated with certain assumptions) to the amount of such taxes that the corporate taxpayers would have been required to pay had there been no increase to the tax basis of the assets of Carlyle Holdings as a result of the exchanges and had the corporate taxpayers not entered into the tax receivable agreement. The term of the tax receivable agreement commenced upon consummation of our initial public offering and will continue until all such tax benefits have been utilized or expired, unless the corporate taxpayers exercise their right to terminate the tax receivable agreement for an amount based on the agreed payments remaining to be made under the agreement (as described in more detail below) or the corporate taxpayers breach any of their material obligations under the tax receivable agreement in which case all obligations generally will be accelerated and due as if the corporate taxpayers had exercised their right to terminate the tax receivable agreement. We expect that as a result of the size of the increases in the tax basis of the tangible and intangible assets of Carlyle Holdings, the payments that we may make under the tax receivable agreement will be substantial. There may be a material negative effect on our liquidity if, as a result of timing discrepancies or otherwise, the payments under the tax receivable agreement exceed the actual cash tax savings that the corporate taxpayers realize in respect of the tax attributes subject to the tax receivable agreement and/or distributions to the corporate taxpayers by Carlyle Holdings are not sufficient to permit the corporate taxpayers to make payments under the tax receivable agreement after they have paid taxes. Late payments under the tax receivable agreement generally will accrue interest at an uncapped rate equal to LIBOR plus 500 basis points. The payments under the tax receivable agreement are not conditioned upon the continued ownership of us by the limited partners of the Carlyle Holdings partnerships.
For the year ended December 31, 2017, we made payments totaling $2,673,251 pursuant to the tax receivable agreement. Those payments included $251,165 to Mr. Conway; $250,561 to Mr. D'Aniello; $0 to Mr. Rubenstein; $0 to Mr. Youngkin; $0 to Mr. Hance; $0 to Mr. Buser; $89,943 to Mr. Clare; $11,536 to Mr. Ferguson; and $10,080 to Mr. Mathias. None of our independent directors nor Mr. Lee are limited partners of the Carlyle Holdings partnerships and hence, they are not eligible to receive any payments under the tax receivable agreement.
In addition, the tax receivable agreement provides that upon certain changes of control, the corporate taxpayers’ (or their successors’) obligations with respect to exchanged or acquired units (whether exchanged or acquired before or after such transaction) would be based on certain assumptions, including that the corporate taxpayers would have sufficient taxable income to fully utilize the deductions arising from the increased tax deductions and tax basis and other benefits related to entering into the tax receivable agreement. Furthermore, the corporate taxpayers may elect to terminate the tax receivable agreement early by making an immediate payment equal to the present value of the anticipated future cash tax savings. In determining such anticipated future cash tax savings, the tax receivable agreement includes several assumptions, including (i) that any Carlyle Holdings partnership units that have not been exchanged are deemed exchanged for the market value of the common units at the time of termination, (ii) the corporate taxpayers will have sufficient taxable income in each future taxable year to fully realize all potential tax savings, (iii) the tax rates for future years will be those specified in the law as in effect at the time of termination and (iv) certain non-amortizable assets are deemed disposed of within specified time periods. In addition, the present value of such anticipated future cash tax savings are discounted at a rate equal to LIBOR plus 100 basis points.
269
As a result of the change in control provisions and the early termination right, the corporate taxpayers could be required to make payments under the tax receivable agreement that are greater than or less than the specified percentage of the actual cash tax savings that the corporate taxpayers realize in respect of the tax attributes subject to the tax receivable agreement. In these situations, our obligations under the tax receivable agreement could have a substantial negative impact on our liquidity.
Decisions we make in the course of running our business may influence the timing and amount of payments that are received by an exchanging or selling limited partner of the Carlyle Holdings partnerships under the tax receivable agreement. For example, the earlier disposition of assets following an exchange or acquisition transaction generally will accelerate payments under the tax receivable agreement and increase the present value of such payments, and the disposition of assets before an exchange or acquisition transaction will increase the tax liability of a limited partner of the Carlyle Holdings partnerships without giving rise to any rights of a limited partner of the Carlyle Holdings partnerships to receive payments under the tax receivable agreement.
Payments under the tax receivable agreement will be based on the tax reporting positions that we will determine. The corporate taxpayers will not be reimbursed for any payments previously made under the tax receivable agreement if a tax basis increase is successfully challenged by the IRS. As a result, in certain circumstances, payments could be made under the tax receivable agreement in excess of the corporate taxpayers’ cash tax savings.
In the event that The Carlyle Group L.P. or any of its wholly-owned subsidiaries become taxable as a corporation for U.S. federal income tax purposes, these entities will also be obligated to make payments under the tax receivable agreement on the same basis and to the same extent as the corporate taxpayers.
Registration Rights Agreements
We have entered into a registration rights agreement with the limited partners of the Carlyle Holdings partnerships who are our personnel, including our inside directors and executive officers, pursuant to which we granted them, their affiliates and certain of their transferees the right, under certain circumstances and subject to certain restrictions, to require us to register under the Securities Act common units delivered in exchange for Carlyle Holdings partnership units or common units (and other securities convertible into or exchangeable or exercisable for our common units) otherwise held by them. Under the registration rights agreement, we agreed to register the exchange of Carlyle Holdings partnership units for common units by the limited partners of the Carlyle Holdings partnerships, including certain of our directors and officers. In addition, TCG Carlyle Global Partners L.L.C., an entity wholly-owned by our senior Carlyle professionals, has the right to request that we register the sale of common units held by such persons an unlimited number of times and may require us to make available shelf registration statements permitting sales of common units into the market from time to time over an extended period. In addition, TCG Carlyle Global Partners L.L.C. has the ability to exercise certain piggyback registration rights in respect of common units held by our pre-IPO owners in connection with registered offerings requested by other registration rights holders or initiated by us.
In addition, in accordance with the terms of the subscription agreement which governs its investment in our business, we entered into a registration rights agreements with Mubadala.
Carlyle Holdings Partnership Agreements
The Carlyle Group L.P. is a holding partnership and, through wholly owned subsidiaries, holds equity interests in Carlyle Holdings I L.P., Carlyle Holdings II L.P. and Carlyle Holdings III L.P., which we refer to collectively as “Carlyle Holdings.” Wholly owned subsidiaries of The Carlyle Group L.P. are the sole general partner of each of the three Carlyle Holdings partnerships. Accordingly, The Carlyle Group L.P. operates and controls all of the business and affairs of Carlyle Holdings and, through Carlyle Holdings and its operating entity subsidiaries, conducts our business. Through its wholly owned subsidiaries, The Carlyle Group L.P. has unilateral control over all of the affairs and decision making of Carlyle Holdings. Furthermore, the wholly owned subsidiaries of The Carlyle Group L.P. cannot be removed as the general partners of the Carlyle Holdings partnerships without their approval. Because our general partner, Carlyle Group Management L.L.C., operates and controls the business of The Carlyle Group L.P., the Board of Directors and officers of our general partner are responsible for all operational and administrative decisions of Carlyle Holdings and the day-to-day management of Carlyle Holdings’ business.
Pursuant to the partnership agreements of the Carlyle Holdings partnerships, the wholly owned subsidiaries of The Carlyle Group L.P. which are the general partners of those partnerships, have the right to determine when distributions will be made to the partners of Carlyle Holdings and the amount of any such distributions. If a distribution is authorized, such
270
distribution will be made to the partners of Carlyle Holdings pro rata in accordance with the percentages of their respective partnership interests.
Each of the Carlyle Holdings partnerships has an identical number of partnership units outstanding, and we use the terms “Carlyle Holdings partnership unit” or “partnership unit in/of Carlyle Holdings” to refer, collectively, to a partnership unit in each of the Carlyle Holdings partnerships. The holders of partnership units in Carlyle Holdings, including The Carlyle Group L.P.’s wholly owned subsidiaries, incur U.S. federal, state and local income taxes on their proportionate share of any net taxable income of Carlyle Holdings. Net profits and net losses of Carlyle Holdings generally will be allocated to its partners (including The Carlyle Group L.P.’s wholly owned subsidiaries) pro rata in accordance with the percentages of their respective partnership interests. The partnership agreements of the Carlyle Holdings partnerships provide for cash distributions, which we refer to as “tax distributions,” to the partners of such partnerships if the wholly owned subsidiaries of The Carlyle Group L.P. which are the general partners of the Carlyle Holdings partnerships determine that the taxable income of the relevant partnership will give rise to taxable income for its partners. Generally, these tax distributions are computed based on our estimate of the net taxable income of the relevant partnership allocable to a partner multiplied by an assumed tax rate equal to the highest effective marginal combined U.S. federal, state and local income tax rate prescribed for an individual or corporate resident in New York, New York (taking into account the non-deductibility of certain expenses and the character of our income). Tax distributions are made only to the extent all distributions from such partnerships for the relevant year are insufficient to cover such tax liabilities.
The partnership agreements of the Carlyle Holdings partnerships contain non-solicitation provisions that provide that during the term of his or her employment and for a period of one year after the effective date of his or her withdrawal, resignation or expulsion, each limited partner of the Carlyle Holdings partnerships that is employed by us shall not, directly or indirectly, whether alone or in concert with other persons, solicit any person employed by us or our affiliates to abandon such employment, hire any person who is, or within the prior year was, employed by us or solicit any Carlyle fund investor for the purpose of obtaining funds or inducing such fund investor to make an investment which is sponsored or promoted by such person.
The partnership agreements of the Carlyle Holdings partnerships also provide that substantially all of our expenses, including substantially all expenses solely incurred by or attributable to The Carlyle Group L.P. such as expenses incurred in connection with our initial public offering but not including obligations incurred under the tax receivable agreement by The Carlyle Group L.P. or its wholly owned subsidiaries, income tax expenses of The Carlyle Group L.P. or its wholly owned subsidiaries and payments on indebtedness incurred by The Carlyle Group L.P. or its wholly owned subsidiaries, are borne by Carlyle Holdings.
On September 13, 2017, in connection with the issuance of the Series A Preferred Units, the limited partnership agreements of the Carlyle Holdings partnerships were amended to provide for preferred units with economic terms designed to mirror those of the Series A Preferred Units, which we refer to as the Mirror Units. The Carlyle Group L.P., directly or through its wholly owned subsidiaries, holds all of the issued and outstanding Mirror Units.
Exchange Agreement
We have entered into an exchange agreement with the limited partners of the Carlyle Holdings partnerships. Under the exchange agreement, which includes applicable remaining vesting and minimum retained ownership requirements and other applicable transfer restrictions, each holder and certain transferees of Carlyle Holdings partnership units may exchange these partnership units for The Carlyle Group L.P. common units on a one-for-one basis up to four times per year, subject to customary conversion rate adjustments for splits, unit distributions and reclassifications. Following such exchanges, the common units typically will be immediately sold.
As of December 31, 2017, limited partners of the Carlyle Holdings partnerships owned an aggregate of 234,813,858 Carlyle Holdings partnership units (including the Holdings Units held by Mubadala). All of the Carlyle Holdings partnership units held by our founders and Mubadala are fully vested. Of the outstanding Carlyle Holdings partnership units held by our other senior Carlyle professionals, 89% are vested and 11% are unvested as of December 31, 2017. The remaining unvested Carlyle Holdings units generally will vest in one remaining installment on May 2, 2018. Commencing in the second quarter of 2017, senior Carlyle professionals were able to exchange their Carlyle Holdings partnership units for common units on a quarterly basis, subject to the terms of the Exchange Agreement. We facilitate an orderly exchange process to seek to minimize the impact on the trading price of our common units.
271
In addition, Mubadala is generally entitled to exchange Carlyle Holdings partnerships units for common units at any time. Under the exchange agreement, to effect an exchange a holder of partnership units in Carlyle Holdings must simultaneously exchange one partnership unit in each of the Carlyle Holdings partnerships. The Carlyle Group L.P. will hold, through wholly owned subsidiaries, a number of Carlyle Holdings partnership units equal to the number of common units that The Carlyle Group L.P. has issued. As a holder exchanges its Carlyle Holdings partnership units, The Carlyle Group L.P.’s indirect interest in the Carlyle Holdings partnerships will be correspondingly increased.
Firm Use of Our Executive Officers' Private Aircraft
In the normal course of business, our personnel have made use of aircraft owned by entities controlled by Messrs. Conway, D’Aniello, Rubenstein and Lee. Messrs. Conway, D’Aniello, Rubenstein and Lee paid for their purchases of the aircraft and bear all operating, personnel and maintenance costs associated with their operation for personal use. Payment by us for the business use of these aircraft by Messrs. Conway, D’Aniello, Rubenstein and Lee and other of our personnel is made at market rates, which during 2017 totaled $8,700 for Mr. Conway, $232,065 for Mr. D’Aniello, $436,385 for Mr. Rubenstein and $66,499 for Mr. Lee. We also made payments for services and supplies relating to business use flight operations to managers of the aircrafts of Messrs. D’Aniello, Conway, Rubenstein and Lee, which during 2017 aggregated $470,886 in the case of Mr. Conway’s aircraft, $972,397 in the case of Mr. D’Aniello’s aircraft, $2,897,308 in the case of Mr. Rubenstein’s aircraft and $178,613 in the case of Mr. Lee's aircraft. Consistent with the terms of our agreement with a third party administrator (the "Aircraft Administrator"), in 2017, we received payments from and made payments to the Aircraft Administrator to adjust the estimated annual costs of operating the aircraft related to 2016 flight operations. In 2017, we made payments to the Aircraft Administrator in the amount of $18,170 related to Mr. Conway's aircraft, and received payments from the Aircraft Administrator in the amounts of $65,606 and $73,182 related to Mr. D'Aniello's and Mr. Rubenstein's aircraft, respectively.
Investments In and Alongside Carlyle Funds
Our directors and executive officers are permitted to co-invest their own capital in and alongside our investment funds. The opportunity to invest in and alongside our investment funds is also available to all of our senior Carlyle professionals and to those of our employees whom we have determined have a status that reasonably permits us to offer them these types of investments in compliance with applicable laws. We encourage our eligible professionals to invest in and alongside our investment funds because we believe that such investing further aligns the interests of our professionals with those of our fund investors and our firm. Our directors and officers may also purchase outstanding interests in our investment funds, whereupon the interests may no longer be subject to management fees or carried interest in some cases.
Co-investments are investments in investment vehicles or other assets on the same terms and conditions as those available to the applicable fund, except that these co-investments generally are not subject to management fees, incentive fees or carried interest. These co-investments are funded with our professionals’ own “after tax” cash and not with deferral of management or incentive fees. Co-investors are responsible for their pro-rata share of partnership and other general and administrative fees and expenses. In addition, our directors and executive officers are permitted to invest their own capital directly in investment funds we advise, in most instances not subject to management fees, incentive fees or carried interest. We intend to continue our co-investment program and we expect that our eligible professionals, including our senior Carlyle professionals and our executive officers and directors collectively will continue to invest significant amounts of their own capital in and alongside the investment funds that we advise or manage.
Certain members of the Board of Directors of our general partner are employees of Carlyle (Messrs. Conway, D’Aniello, Rubenstein, Lee, Youngkin and Clare) and one member of the Board of Directors of our general partner is an operating executive of Carlyle (Mr. Hance) and each also own investments in and alongside our investment funds. The amount invested in and alongside our investment funds during 2017 by certain of our directors and by our executive officers (and their family members and investment vehicles), including amounts funded pursuant to third party capital commitments assumed by such persons, was $161,847,726 for Mr. Conway; $123,535,882 for Mr. D’Aniello; $120,123,945 for Mr. Rubenstein; $4,576,722 for Mr. Lee; $17,774,580 for Mr. Youngkin; $987,669 for Mr. Hance; $600,546 for Mr. Shaw; $1,947,335 for Mr. Welters; $681,986 for Mr. Buser; $24,686,514 for Mr. Clare; $804,499 for Mr. Ferguson; and $28,925 for Mr. Mathias. None of Ms. Fitt, Ms. Hill or Mr. Robertson made any co-investments in 2017.
Certain of our directors and our executive officers (and their family members and investment vehicles) also made additional commitments to our investment funds during 2017. In the aggregate, our directors and executive officers (and their family members and investment vehicles) made commitments to our investment funds during 2017 of approximately $752.4 million, and the total unfunded commitments of our directors and executive officers (and their family members and investment vehicles) to our investment funds as of December 31, 2017 was $291,888,653 for Mr. Conway; $271,593,388 for
272
Mr. D’Aniello; $291,147,571 for Mr. Rubenstein; $13,632,202 for Mr. Lee; $65,748,239 for Mr. Youngkin; $3,553,074 for Mr. Hance; $2,489,327 for Mr. Shaw; $24,272,617 for Mr. Welters; $2,794,298 for Mr. Buser; $70,583,251 for Mr. Clare; $2,105,645 for Mr. Ferguson and $105,039 for Mr. Mathias. None of Ms. Fitt, Ms. Hill or Mr. Robertson has any unfunded commitments to our investment funds as of December 31, 2017.
Other Transactions
Mr. Hance, a member of the Board of Directors of our general partner, is an Operating Executive of Carlyle and received, for the year ended December 31, 2017, an operating executive fee in respect of his service in such capacity of $250,000 and, on May 1, 2017, a grant of 5,634 deferred restricted common units. Mr. Hance was also previously allocated direct carried interest ownership at the fund level in respect of certain corporate private equity funds. For the year ended December 31, 2017, Mr. Hance received distributions of $7,241 in respect of such carried interest.
Mr. Mathias, who resigned as a member of the Board of Directors of our general partner on December 31, 2017, is a Managing Director of Carlyle and received, for the year ended December 31, 2017, total cash compensation in respect of his service in such capacity of $865,381. Mr. Mathias received a salary of $250,000. Of Mr. Mathias’ $500,000 discretionary bonus, $450,000 was paid in cash and the balance was mandatorily granted in deferred restricted common units in February 2018. These deferred restricted common units will vest on August 1, 2019. Mr. Mathias was also previously allocated interests in the firm’s equity pool, as well as direct carried interest ownership at the fund level in respect of certain corporate private equity funds. For the year ended December 31, 2017, Mr. Mathias received distributions of $2,130 in respect of such equity pool and of $163,251 in respect of such carried interest.
Statement of Policy Regarding Transactions with Related Persons
The Board of Directors of our general partner has adopted a written statement of policy regarding transactions with related persons, which we refer to as our “related person policy.” Our related person policy requires that a “related person” (as defined in paragraph (a) of Item 404 of Regulation S-K) must promptly disclose to the General Counsel of our general partner any “related person transaction” (defined as any transaction that is anticipated would be reportable by us under Item 404(a) of Regulation S-K in which we were or are to be a participant and the amount involved exceeds $120,000 and in which any related person had or will have a direct or indirect material interest) and all material facts with respect thereto. The General Counsel will then promptly communicate that information to our conflicts committee or another independent body of the Board of Directors of our general partner. No related person transaction will be executed without the approval or ratification of our conflicts committee or another independent body of the Board of Directors of our general partner. It is our policy that directors interested in a related person transaction will recuse themselves from any vote of a related person transaction in which they have an interest.
Indemnification of Directors and Officers
Under our partnership agreement we generally will indemnify the following persons, to the fullest extent permitted by law, from and against all losses, claims, damages, liabilities, joint or several, expenses (including legal fees and expenses), judgments, fines, penalties, interest, settlements or other amounts on an after tax basis: our general partner, any departing general partner, any person who is or was a tax matters partner, officer or director of our general partner or any departing general partner, any officer or director of our general partner or any departing general partner who is or was serving at the request of our general partner or any departing general partner as an officer, director, employee, member, partner, tax matters partner, agent, fiduciary or trustee of another person, any person who is named in this Annual Report on Form 10-K as being or about to become a director or a person performing similar functions of our general partner and any person our general partner in its sole discretion designates as an “indemnitee” for purposes of our partnership agreement. We have agreed to provide this indemnification unless there has been a final and non-appealable judgment by a court of competent jurisdiction determining that these persons acted in bad faith or engaged in fraud or willful misconduct. We have also agreed to provide this indemnification for criminal proceedings. Any indemnification under these provisions will only be out of our assets. The general partner will not be personally liable for, or have any obligation to contribute or loan funds or assets to us to enable it to effectuate, indemnification. We may purchase insurance against liabilities asserted against and expenses incurred by persons for our activities, regardless of whether we would have the power to indemnify the person against liabilities under our partnership agreement.
In addition, we have entered into indemnification arrangements with each of our executive officers and directors. The indemnification agreements provide the executive officers and directors with contractual rights to indemnification, expense
273
advancement and reimbursement, to the fullest extent permitted by applicable law. We also indemnify such persons to the extent they serve at our request as directors, officers, employees or other agents of any other entity, such as an investment vehicle advised by us or its portfolio companies.
ITEM 14.
PRINCIPAL ACCOUNTING FEES AND SERVICES
The following table summarizes the aggregate fees for professional services provided by Ernst & Young LLP (“Ernst & Young”) for the years ended December 31, 2017 and 2016 (dollars in millions):
|
|
Year Ended December 31, 2017
|
||||||||||||||
|
|
Carlyle
|
|
Carlyle Funds
|
|
Total
|
||||||||||
|
Audit Fees
|
$
|
5.9
|
|
(a)
|
$
|
13.9
|
|
(d)
|
$
|
19.8
|
|
||||
|
Audit-Related Fees
|
$
|
1.9
|
|
(b)
|
$
|
12.4
|
|
(e)
|
$
|
14.3
|
|
||||
|
Tax Fees
|
$
|
1.0
|
|
(c)
|
$
|
0.3
|
|
(d)
|
$
|
1.3
|
|
||||
|
All Other Fees
|
$
|
—
|
|
|
$
|
—
|
|
|
$
|
—
|
|
||||
|
Total
|
$
|
8.8
|
|
|
$
|
26.6
|
|
|
$
|
35.4
|
|
||||
|
|
Year Ended December 31, 2016
|
||||||||||||||
|
|
Carlyle
|
|
Carlyle Funds
|
|
Total
|
||||||||||
|
Audit Fees
|
$
|
6.2
|
|
(a)
|
$
|
13.4
|
|
(d)
|
$
|
19.6
|
|
||||
|
Audit-Related Fees
|
$
|
0.1
|
|
(b)
|
$
|
10.1
|
|
(e)
|
$
|
10.2
|
|
||||
|
Tax Fees
|
$
|
0.7
|
|
(c)
|
$
|
0.8
|
|
(d)
|
$
|
1.5
|
|
||||
|
All Other Fees
|
$
|
—
|
|
|
$
|
—
|
|
|
$
|
—
|
|
||||
|
Total
|
$
|
7.0
|
|
|
$
|
24.3
|
|
|
$
|
31.3
|
|
||||
|
(a)
|
Audit Fees consisted of fees for (1) the audits of our consolidated financial statements included in this Annual Report on Form 10-K and our internal controls over financial reporting, and services required by statute or regulation; (2) reviews of interim consolidated financial statements included in our quarterly reports on Form 10-Q; (3) comfort letters, consents and other services related to SEC and other regulatory filings. This also includes fees for accounting consultation billed as audit services.
|
|
(b)
|
Audit-Related Fees consisted of due diligence in connection with acquisitions, and other audit and attest services not required by statute or regulation.
|
|
(c)
|
Tax Fees consisted of fees for services rendered for tax compliance and tax planning and advisory services. We also use other accounting firms to provide these services. Fees for tax compliance services were approximately $0.4 million and $0 for the years ended December 31, 2017 and 2016, respectively.
|
|
(d)
|
Ernst & Young also provided audit and tax services to certain investment funds managed by Carlyle in its capacity as the general partner or investment advisor. The tax services provided consist primarily of tax compliance and tax advisory services. We also use other accounting firms to provide these services. Fees for tax compliance services were approximately $0 and $0.3 million for the years ended December 31, 2017 and 2016, respectively.
|
|
(e)
|
Audit-Related Fees included assurance, merger and acquisition due diligence services provided in connection with contemplated investments by Carlyle-sponsored investment funds and attest services not required by statute or regulation. In addition, Ernst & Young provided audit, audit-related, tax and other services to certain Carlyle fund portfolio companies, which are approved directly by the portfolio company’s management and are not included in the amounts presented here. We also use other accounting firms to provide these services.
|
Our audit committee charter, which is available on our website at www.carlyle.com under “Public Investors”, requires the audit committee to approve in advance all audit and non-audit related services to be provided by our independent registered public accounting firm in accordance with the audit and non-audit related services pre-approval policy. All services reported in the Audit, Audit-Related, and Tax categories above were approved by the audit committee.
274
ITEM 15.
EXHIBITS, FINANCIAL STATEMENT SCHEDULES
The following is a list of all exhibits filed or furnished as part of this report:
|
Exhibit
No.
|
|
Description
|
|
3.1
|
|
|
|
3.2
|
|
|
|
4.1
|
|
|
|
4.2
|
|
|
|
4.3
|
|
|
|
4.4
|
|
|
|
4.5
|
|
|
|
4.6
|
|
|
|
4.7
|
||
|
4.8
|
||
|
10.1
|
|
|
|
10.2
|
|
|
|
10.3
|
|
|
|
10.4
|
|
|
275
|
Exhibit
No.
|
|
Description
|
|
10.4.1
|
||
|
10.4.2
|
|
|
|
10.5
|
|
|
|
10.6
|
|
|
|
10.7
|
|
|
|
10.8+
|
|
|
|
10.9+
|
|
|
|
10.10+
|
|
|
|
10.11+
|
|
|
|
10.12
|
|
|
|
10.13
|
|
|
|
10.14
|
|
|
|
10.15
|
|
|
276
|
10.16.1
|
|
|
|
10.17
|
|
|
|
10.17.1
|
|
|
|
10.18
|
|
|
|
10.18.1
|
|
|
|
10.19*
|
|
|
|
10.20
|
|
|
|
10.21
|
|
|
|
10.22
|
|
|
|
10.22.1
|
|
|
277
|
Exhibit
No. |
|
Description
|
|
10.22.2
|
||
|
10.22.3
|
||
|
10.23
|
|
|
|
10.24+*
|
||
|
10.25+*
|
||
|
10.26+*
|
|
|
|
10.27+
|
|
|
|
10.28+
|
||
|
12.1*
|
||
|
21.1*
|
|
|
|
23.1*
|
|
|
|
31.1*
|
|
|
|
31.2*
|
|
|
|
31.3*
|
|
|
|
32.1*
|
|
|
|
32.2*
|
|
|
|
32.3*
|
|
|
|
99.1
|
|
|
|
Exhibit
No.
|
|
Description
|
|
101.INS*
|
|
XBRL Instance Document.
|
|
101.SCH*
|
|
XBRL Taxonomy Extension Schema Document.
|
|
101.CAL*
|
|
XBRL Taxonomy Extension Calculation Linkbase Document.
|
|
101.DEF*
|
|
XBRL Taxonomy Extension Definition Linkbase Document.
|
|
101.LAB*
|
|
XBRL Taxonomy Extension Labels Linkbase Document.
|
|
101.PRE*
|
|
XBRL Taxonomy Extension Presentation Linkbase Document.
|
278
|
*
|
Filed herewith.
|
|
+
|
Management contract or compensatory plan or arrangement in which directors and/or executive officers are eligible to participate.
|
The agreements and other documents filed as exhibits to this report are not intended to provide factual information or other disclosure other than with respect to the terms of the agreements or other documents themselves, and you should not rely on them for that purpose. In particular, any representations and warranties made by us in these agreements or other documents were made solely within the specific context of the relevant agreement or document and may not describe the actual state of affairs as of the date they were made or at any other time.
279
SIGNATURES
Pursuant to the requirements of Section 13 or 15(d) of the Securities Exchange Act of 1934, the Registrant has duly caused this report to be signed on its behalf by the undersigned, thereunto duly authorized.
Date:
February 15, 2018
|
The Carlyle Group L.P.
|
||
|
By: Carlyle Group Management L.L.C., its general partner
|
||
|
By:
|
|
/s/ Curtis L. Buser
|
|
|
Name: Curtis L. Buser
|
|
|
|
Title: Chief Financial Officer
|
|
Pursuant to the requirements of the Securities Exchange Act of 1934, this report has been signed by the following persons on behalf of the registrant and in the capacities indicated on the 15th day of February 2018.
|
Signature
|
|
Title
|
|
/s/ William E. Conway, Jr.
William E. Conway, Jr.
|
|
Co-Executive Chairman, Co-Chief Investment Officer and Director
|
|
/s/ Daniel A. D’Aniello
Daniel A. D’Aniello
|
|
Chairman Emeritus and Director
|
|
/s/ David M. Rubenstein
David M. Rubenstein
|
|
Co-Executive Chairman and Director
|
|
/s/ Kewsong Lee
Kewsong Lee
|
|
Co-Chief Executive Officer and Director
(co-principal executive officer)
|
|
/s/ Glenn A. Youngkin
Glenn A. Youngkin
|
|
Co-Chief Executive Officer and Director
(co-principal executive officer)
|
|
/s/ Lawton W. Fitt
Lawton W. Fitt
|
|
Director
|
|
/s/ James H. Hance, Jr.
James H. Hance, Jr.
|
|
Director
|
|
/s/ Janet Hill
Janet Hill
|
|
Director
|
|
/s/ Dr. Thomas S. Robertson
Dr. Thomas S. Robertson
|
|
Director
|
|
/s/ William J. Shaw
William J. Shaw
|
|
Director
|
|
/s/ Anthony Welters
Anthony Welters
|
|
Director
|
|
/s/ Curtis L. Buser
Curtis L. Buser
|
|
Chief Financial Officer
(principal financial officer)
|
|
/s/ Pamela L. Bentley
Pamela L. Bentley
|
|
Chief Accounting Officer
(principal accounting officer)
|
|
/s/ Peter J. Clare
Peter J. Clare
|
|
Co-Chief Investment Officer and Director
|
280
TABLE OF CONTENTS
Part IItem 1. BusinessItem 1A. Risk FactorsItem 1B. Unresolved Staff CommentsItem 2. PropertiesItem 3. Legal ProceedingsItem 4. Mine Safety DisclosuresPart IIItem 5. Market For Registrant's Common Equity, Related Stockholder Matters and Issuer Purchases Of Equity SecuritiesItem 6. Selected Financial DataItem 7. Management's Discussion and Analysis Of Financial Condition and Results Of OperationsItem 7A. Quantitative and Qualitative Disclosures About Market RiskItem 8. Financial Statements and Supplementary DataItem 9. Changes and Disagreements with Accountants on Accounting and Financial DisclosureItem 9A. Controls and ProceduresItem 9B. Other InformationPart IIIItem 10. Directors, Executive Officers and Corporate GovernanceItem 11. Executive CompensationItem 12. Security Ownership Of Certain Beneficial Owners and Management and Related Stockholder MattersItem 13. Certain Relationships and Related Transactions, and Director IndependenceItem 14. Principal Accounting Fees and ServicesPart IVItem 15. Exhibits, Financial Statement Schedules