CARLYLE GROUP INC.
10-Ks and 10-Qs
|
|
|
|
|
|
|
|
|
|
|
|
|
|
|
|
|
UNITED STATES
SECURITIES AND EXCHANGE COMMISSION
WASHINGTON, D.C. 20549
FORM 10-Q
(Mark One)
|
ý
|
QUARTERLY REPORT PURSUANT TO SECTION 13 OR 15(d) OF THE SECURITIES EXCHANGE ACT OF 1934
|
FOR THE QUARTERLY PERIOD ENDED
JUNE 30, 2017
OR
|
¨
|
TRANSITION REPORT PURSUANT TO SECTION 13 OR 15(d) OF THE SECURITIES EXCHANGE ACT OF 1934
|
FOR THE TRANSITION PERIOD FROM TO
Commission File Number: 001-35538
The Carlyle Group L.P.
(Exact name of registrant as specified in its charter)
|
Delaware
|
|
45-2832612
|
|
(State or other jurisdiction of
incorporation or organization)
|
|
(I.R.S. Employer
Identification No.)
|
1001 Pennsylvania Avenue, NW
Washington, D.C., 20004-2505
(Address of principal executive offices) (Zip Code)
(202) 729-5626
(Registrant’s telephone number, including area code)
Not Applicable
(Former name or former address, if changed since last report)
Indicate by check mark whether the registrant (1) has filed all reports required to be filed by Section 13 or 15(d) of the Securities Exchange Act of 1934 during the preceding 12 months (or for such shorter period that the registrant was required to file such reports), and (2) has been subject to such filing requirements for the past 90 days. Yes
ý
No
¨
Indicate by check mark whether the registrant has submitted electronically and posted on its corporate Web site, if any, every Interactive Data File required to be submitted and posted pursuant to Rule 405 of Regulation S-T (§232.405 of this chapter) during the preceding 12 months (or for such shorter period that the registrant was required to submit and post such files). Yes
ý
No
¨
Indicate by check mark whether the registrant is a large accelerated filer, an accelerated filer, a non-accelerated filer, smaller reporting company or an emerging growth company. See the definitions of “large accelerated filer,” “accelerated filer,” “smaller reporting company,” and “emerging growth company” in Rule 12b-2 of the Exchange Act.
|
Large accelerated filer
|
|
ý
|
|
Accelerated filer
|
|
¨
|
|
Non-accelerated filer
|
|
¨
(Do not check if a smaller reporting company)
|
|
Smaller reporting company
|
|
¨
|
|
Emerging growth company
|
|
¨
|
||||
If an emerging growth company, indicate by check mark if the registrant has elected not to use the extended transition period for complying with any new or revised financial accounting standards provided pursuant to Section 13(a) of the Exchange Act.
¨
Indicate by check mark whether the registrant is a shell company (as defined in Rule 12b-2 of the Exchange Act). Yes
¨
No
ý
The number of the registrant’s common units representing limited partner interests outstanding as of July 28, 2017 was 91,051,380.
TABLE OF CONTENTS
|
|
|
Page
|
|
Item 1.
|
||
|
Unaudited Condensed Consolidated Financial Statements – June 30, 2017 and 2016:
|
||
|
Item 2.
|
||
|
Item 3.
|
||
|
Item 4.
|
||
|
Item 1.
|
||
|
Item 1A.
|
||
|
Item 2.
|
||
|
Item 3.
|
||
|
Item 4.
|
||
|
Item 5.
|
||
|
Item 6.
|
||
1
Forward-Looking Statements
This report may contain forward-looking statements within the meaning of Section 27A of the Securities Act of 1933 and Section 21E of the Securities Exchange Act of 1934. These statements include, but are not limited to, statements related to our expectations regarding the performance of our business, our financial results, our liquidity and capital resources, contingencies, our distribution policy, and other non-historical statements. You can identify these forward-looking statements by the use of words such as “outlook,” “believes,” “expects,” “potential,” “continues,” “may,” “will,” “should,” “seeks,” “approximately,” “predicts,” “intends,” “plans,” “estimates,” “anticipates” or the negative version of these words or other comparable words. Such forward-looking statements are subject to various risks, uncertainties and assumptions. Accordingly, there are or will be important factors that could cause actual outcomes or results to differ materially from those indicated in these statements including, but not limited to, those described under the section entitled “Risk Factors” in our Annual Report on Form 10-K for the year ended December 31, 2016 filed with the United States Securities and Exchange Commission (“SEC”) on February 16, 2017, as such factors may be updated from time to time in our periodic filings with the SEC, which are accessible on the SEC’s website at www.sec.gov. These factors should not be construed as exhaustive and should be read in conjunction with the other cautionary statements that are included in this report and in our other periodic filings with the SEC. We undertake no obligation to publicly update or review any forward-looking statements, whether as a result of new information, future developments or otherwise, except as required by applicable law.
Website and Social Media Disclosure
We use our website (www.carlyle.com), our corporate Facebook page (https://www.facebook.com/The-Carlyle-Group-103519702981/) and our corporate Twitter account (@OneCarlyle) as channels of distribution of material company information. For example, financial and other material information regarding our company is routinely posted on and accessible at www.carlyle.com. Accordingly, investors should monitor these channels, in addition to following our press releases, SEC filings and public conference calls and webcasts. In addition, you may automatically receive email alerts and other information about Carlyle when you enroll your email address by visiting the “Email Alert Subscription” section at https://ir.carlyle.com/alerts.cfm?. The contents of our website and social media channels are not, however, a part of this Quarterly Report on Form 10-Q and are not incorporated by reference herein.
Unless the context suggests otherwise, references in this report to “Carlyle,” the “Company,” “we,” “us” and “our” refer to The Carlyle Group L.P. and its consolidated subsidiaries. When we refer to the “partners of The Carlyle Group L.P.,” we are referring specifically to the common unitholders and our general partner and any others who may from time to time be partners of that specific Delaware limited partnership. When we refer to our “senior Carlyle professionals,” we are referring to the partner-level personnel of our firm. References in this report to the ownership of the senior Carlyle professionals include the ownership of personal planning vehicles of these individuals.
“Carlyle funds,” “our funds” and “our investment funds” refer to the investment funds and vehicles advised by Carlyle.
“Carry funds” generally refers to closed-end investment vehicles, in which commitments are drawn down over a specified investment period, and in which the general partner receives a special residual allocation of income from limited partners, which we refer to as carried interest, in the event that specified investment returns are achieved by the fund. Disclosures referring to carry funds will also include the impact of certain commitments which do not earn carried interest, but are either part of, or associated with our carry funds. The rate of carried interest, as well as the share of carried interest allocated to Carlyle, may vary across the carry fund platform. Carry funds generally include the following investment vehicles across our four business segments:
|
•
|
Corporate Private Equity: Buyout & growth funds advised by Carlyle
|
|
•
|
Real Assets: Real estate, power, infrastructure and energy funds advised by Carlyle, as well as those energy funds advised by NGP Energy Capital Management in which Carlyle is entitled to receive a share of carried interest
|
|
•
|
Global Market Strategies: Distressed credit, corporate mezzanine and energy credit funds, as well as certain closed-end credit funds advised by Carlyle
|
|
•
|
Investment Solutions: Funds and vehicles advised by AlpInvest Partners B.V. (“AlpInvest”) and Metropolitan Real Estate Equity Management, LLC (“Metropolitan), which include primary fund, secondary and co-investment strategies
|
Carry funds specifically exclude those funds advised by NGP Energy Capital Management in which Carlyle is not entitled to receive a share of carried interest (or “NGP management fee funds”), collateralized loan obligation vehicles (CLOs), business development companies, and our former hedge fund platform.
2
For an explanation of the fund acronyms used throughout this Quarterly Report, refer to “Item 2. Management's Discussion and Analysis of Financial Condition and Results of Operation - Our Family of Funds.”
“Fee-earning assets under management” or “Fee-earning AUM” refers to the assets we manage or advise from which we derive recurring fund management fees. Our Fee-earning AUM is generally based on one of the following, once fees have been activated:
|
(a)
|
the amount of limited partner capital commitments, generally for carry funds where the original investment period has not expired, for AlpInvest carry funds during the commitment fee period and for Metropolitan carry funds during the weighted-average investment period of the underlying funds;
|
|
(b)
|
the remaining amount of limited partner invested capital at cost, generally for carry funds and certain co-investment vehicles where the original investment period has expired and Metropolitan carry funds after the expiration of the weighted-average investment period of the underlying funds;
|
|
(c)
|
the amount of aggregate fee-earning collateral balance at par of our collateralized loan obligations (“CLOs”), as defined in the fund indentures (typically exclusive of equities and defaulted positions) as of the quarterly cut-off date for each CLO;
|
|
(d)
|
the external investor portion of the net asset value of our hedge fund and fund of hedge funds vehicles (pre redemptions and subscriptions), as well as certain carry funds;
|
|
(e)
|
the gross assets (including assets acquired with leverage), excluding cash and cash equivalents of our business development companies and certain carry funds; or
|
|
(f)
|
the lower of cost or fair value of invested capital, generally for AlpInvest carry funds where the commitment fee period has expired and certain carry funds where the investment period has expired.
|
“Assets under management” or “AUM” refers to the assets we manage or advise. Our AUM equals the sum of the following:
(a) the fair value of the capital invested in carry funds and related co-investment vehicles and NGP management fee funds plus the capital that Carlyle is entitled to call from investors in those funds and vehicles (including Carlyle commitments to those funds and vehicles and those of senior Carlyle professionals and employees) pursuant to the terms of their capital commitments to those funds and vehicles;
|
(b)
|
the amount of aggregate collateral balance and principal cash at par or aggregate principal amount of the notes of our CLOs and other structured products (inclusive of all positions);
|
|
(c)
|
the net asset value (pre-redemptions and subscriptions) of our long/short credit, emerging markets, multi-product macroeconomic, fund of hedge funds vehicles, mutual fund and other hedge funds; and
|
|
(d)
|
the gross assets (including assets acquired with leverage) of our business development companies.
|
We include in our calculation of AUM and Fee-earning AUM certain energy and renewable resources funds that we jointly advise with Riverstone Holdings L.L.C. (“Riverstone”) and certain NGP management fee funds and carry funds that are advised by NGP.
For most of our carry funds, total AUM includes the fair value of the capital invested, whereas Fee-earning AUM includes the amount of capital commitments or the remaining amount of invested capital, depending on whether the original investment period for the fund has expired. As such, Fee-earning AUM may be greater than total AUM when the aggregate fair value of the remaining investments is less than the cost of those investments.
Our calculations of AUM and Fee-earning AUM may differ from the calculations of other alternative asset managers. As a result, these measures may not be comparable to similar measures presented by other alternative asset managers. In addition, our calculation of AUM (but not Fee-earning AUM) includes uncalled commitments to, and the fair value of invested capital in, our investment funds from Carlyle and our personnel, regardless of whether such commitments or invested capital are subject to management or performance fees. Our calculations of AUM or Fee-earning AUM are not based on any definition of AUM or Fee-earning AUM that is set forth in the agreements governing the investment funds that we manage or advise.
“Vermillion” refers to our commodities advisor and business advised by Carlyle Commodity Management L.L.C., which was formerly known as Vermillion Asset Management until August 2015.
3
Changes to Disclosure and Presentation of Key Performance Metrics
Investment funds and vehicles advised by AlpInvest Partners B.V. and Metropolitan Real Estate Equity Management, LLC, which comprise our Investment Solutions segment, are now included in our "carry funds" definition. Accordingly, they are now included in our Invested Capital, Realized Proceeds and Fund Appreciation metrics. We have recast metrics for 2016, including supplemental key metrics information available on our website. In addition, we have also adjusted the methodology for recognition of Invested Capital to an investment timing basis, rather than the timing of cash flows to and from our fund investors, to better reflect capital deployed by our funds during a given period.
4
The Carlyle Group L.P.
(Dollars in millions)
|
June 30,
2017 |
December 31,
2016 |
||||||
|
|
(Unaudited)
|
|
|||||
|
Assets
|
|||||||
|
Cash and cash equivalents
|
$
|
789.9
|
|
$
|
670.9
|
|
|
|
Cash and cash equivalents held at Consolidated Funds
|
416.1
|
|
761.5
|
|
|||
|
Restricted cash
|
9.4
|
|
13.1
|
|
|||
|
Corporate treasury investments
|
115.4
|
|
190.2
|
|
|||
|
Accrued performance fees
|
3,364.5
|
|
2,481.1
|
|
|||
|
Investments
|
1,302.3
|
|
1,107.0
|
|
|||
|
Investments of Consolidated Funds
|
3,907.7
|
|
3,893.7
|
|
|||
|
Due from affiliates and other receivables, net
|
253.1
|
|
227.2
|
|
|||
|
Due from affiliates and other receivables of Consolidated Funds, net
|
60.1
|
|
29.5
|
|
|||
|
Receivables and inventory of a consolidated real estate VIE
|
167.2
|
|
145.4
|
|
|||
|
Fixed assets, net
|
98.6
|
|
106.1
|
|
|||
|
Deposits and other
|
50.3
|
|
39.4
|
|
|||
|
Other assets of a consolidated real estate VIE
|
33.0
|
|
31.5
|
|
|||
|
Intangible assets, net
|
39.5
|
|
42.0
|
|
|||
|
Deferred tax assets
|
249.3
|
|
234.4
|
|
|||
|
Total assets
|
$
|
10,856.4
|
|
$
|
9,973.0
|
|
|
|
Liabilities and partners’ capital
|
|||||||
|
Debt obligations
|
$
|
1,437.1
|
|
$
|
1,265.2
|
|
|
|
Loans payable of Consolidated Funds
|
3,721.2
|
|
3,866.3
|
|
|||
|
Loans payable of a consolidated real estate VIE at fair value (principal amount of $145.3 million and $144.4 million as of June 30, 2017 and December 31, 2016, respectively)
|
72.6
|
|
79.4
|
|
|||
|
Accounts payable, accrued expenses and other liabilities
|
305.2
|
|
369.8
|
|
|||
|
Accrued compensation and benefits
|
2,017.8
|
|
1,661.8
|
|
|||
|
Due to affiliates
|
234.8
|
|
223.6
|
|
|||
|
Deferred revenue
|
83.4
|
|
54.0
|
|
|||
|
Deferred tax liabilities
|
78.0
|
|
76.6
|
|
|||
|
Other liabilities of Consolidated Funds
|
448.9
|
|
637.0
|
|
|||
|
Other liabilities of a consolidated real estate VIE
|
173.4
|
|
124.5
|
|
|||
|
Accrued giveback obligations
|
162.2
|
|
160.8
|
|
|||
|
Total liabilities
|
8,734.6
|
|
8,519.0
|
|
|||
|
Commitments and contingencies
|
|
|
|
|
|||
|
Partners’ capital (common units 91,051,380 and 84,610,951 issued and outstanding as of June 30, 2017 and December 31, 2016, respectively)
|
603.0
|
|
403.1
|
|
|||
|
Accumulated other comprehensive loss
|
(92.4
|
)
|
(95.2
|
)
|
|||
|
Non-controlling interests in consolidated entities
|
280.5
|
|
277.8
|
|
|||
|
Non-controlling interests in Carlyle Holdings
|
1,330.7
|
|
868.3
|
|
|||
|
Total partners’ capital
|
2,121.8
|
|
1,454.0
|
|
|||
|
Total liabilities and partners’ capital
|
$
|
10,856.4
|
|
$
|
9,973.0
|
|
|
See accompanying notes.
5
The Carlyle Group L.P.
(Unaudited)
(Dollars in millions, except unit and per unit data)
|
|
Three Months Ended June 30,
|
Six Months Ended
June 30,
|
|||||||||||||
|
|
2017
|
2016
|
2017
|
2016
|
|||||||||||
|
Revenues
|
|||||||||||||||
|
Fund management fees
|
$
|
238.8
|
|
$
|
272.5
|
|
$
|
485.1
|
|
$
|
562.0
|
|
|||
|
Performance fees
|
|||||||||||||||
|
Realized
|
357.7
|
|
389.9
|
|
440.9
|
|
521.7
|
|
|||||||
|
Unrealized
|
185.9
|
|
(179.0
|
)
|
784.3
|
|
(165.6
|
)
|
|||||||
|
Total performance fees
|
543.6
|
|
210.9
|
|
1,225.2
|
|
356.1
|
|
|||||||
|
Investment income
|
|||||||||||||||
|
Realized
|
26.7
|
|
38.9
|
|
26.5
|
|
51.5
|
|
|||||||
|
Unrealized
|
32.3
|
|
26.4
|
|
78.8
|
|
4.2
|
|
|||||||
|
Total investment income
|
59.0
|
|
65.3
|
|
105.3
|
|
55.7
|
|
|||||||
|
Interest and other income
|
5.6
|
|
5.0
|
|
16.0
|
|
9.7
|
|
|||||||
|
Interest and other income of Consolidated Funds
|
45.0
|
|
35.9
|
|
87.9
|
|
64.8
|
|
|||||||
|
Revenue of a consolidated real estate VIE
|
16.4
|
|
18.4
|
|
109.0
|
|
42.8
|
|
|||||||
|
Total revenues
|
908.4
|
|
608.0
|
|
2,028.5
|
|
1,091.1
|
|
|||||||
|
Expenses
|
|||||||||||||||
|
Compensation and benefits
|
|||||||||||||||
|
Base compensation
|
151.0
|
|
149.9
|
|
297.0
|
|
316.2
|
|
|||||||
|
Equity-based compensation
|
88.0
|
|
109.0
|
|
160.8
|
|
184.4
|
|
|||||||
|
Performance fee related
|
|||||||||||||||
|
Realized
|
166.7
|
|
172.4
|
|
212.5
|
|
234.0
|
|
|||||||
|
Unrealized
|
90.4
|
|
(75.9
|
)
|
361.7
|
|
(68.0
|
)
|
|||||||
|
Total compensation and benefits
|
496.1
|
|
355.4
|
|
1,032.0
|
|
666.6
|
|
|||||||
|
General, administrative and other expenses
|
95.8
|
|
91.4
|
|
189.6
|
|
173.7
|
|
|||||||
|
Interest
|
16.5
|
|
15.4
|
|
31.5
|
|
30.7
|
|
|||||||
|
Interest and other expenses of Consolidated Funds
|
78.5
|
|
31.6
|
|
123.7
|
|
55.0
|
|
|||||||
|
Interest and other expenses of a consolidated real estate VIE
|
18.4
|
|
52.4
|
|
138.0
|
|
75.8
|
|
|||||||
|
Other non-operating expenses
|
0.1
|
|
0.7
|
|
0.1
|
|
4.5
|
|
|||||||
|
Total expenses
|
705.4
|
|
546.9
|
|
1,514.9
|
|
1,006.3
|
|
|||||||
|
Other income
|
|||||||||||||||
|
Net investment gains (losses) of Consolidated Funds
|
40.7
|
|
6.7
|
|
57.8
|
|
(1.7
|
)
|
|||||||
|
Income before provision for income taxes
|
243.7
|
|
67.8
|
|
571.4
|
|
83.1
|
|
|||||||
|
Provision for income taxes
|
13.2
|
|
24.3
|
|
19.0
|
|
31.7
|
|
|||||||
|
Net income
|
230.5
|
|
43.5
|
|
552.4
|
|
51.4
|
|
|||||||
|
Net income (loss) attributable to non-controlling interests in consolidated entities
|
16.5
|
|
1.6
|
|
19.8
|
|
(0.7
|
)
|
|||||||
|
Net income attributable to Carlyle Holdings
|
214.0
|
|
41.9
|
|
532.6
|
|
52.1
|
|
|||||||
|
Net income attributable to non-controlling interests in Carlyle Holdings
|
156.4
|
|
35.8
|
|
392.0
|
|
37.6
|
|
|||||||
|
Net income attributable to The Carlyle Group L.P.
|
$
|
57.6
|
|
$
|
6.1
|
|
$
|
140.6
|
|
$
|
14.5
|
|
|||
|
Net income attributable to The Carlyle Group L.P. per common unit (see Note 14)
|
|||||||||||||||
|
Basic
|
$
|
0.65
|
|
$
|
0.07
|
|
$
|
1.61
|
|
$
|
0.18
|
|
|||
|
Diluted
|
$
|
0.59
|
|
$
|
0.07
|
|
$
|
1.49
|
|
$
|
0.09
|
|
|||
|
Weighted-average common units
|
|||||||||||||||
|
Basic
|
88,801,343
|
|
81,683,415
|
|
87,079,007
|
|
81,284,238
|
|
|||||||
|
Diluted
|
96,986,255
|
|
85,849,938
|
|
94,486,422
|
|
304,176,760
|
|
|||||||
|
Distributions declared per common unit
|
$
|
0.10
|
|
$
|
0.26
|
|
$
|
0.26
|
|
$
|
0.55
|
|
|||
Substantially all revenue is earned from affiliates of the Partnership. See accompanying notes.
6
The Carlyle Group L.P.
Condensed Consolidated Statements of Comprehensive Income
(Unaudited)
(Dollars in millions)
|
|
Three Months Ended June 30,
|
Six Months Ended June 30,
|
||||||||||||||||
|
|
2017
|
2016
|
2017
|
2016
|
||||||||||||||
|
Net income
|
$
|
230.5
|
|
$
|
43.5
|
|
$
|
552.4
|
|
$
|
51.4
|
|
||||||
|
Other comprehensive income (loss)
|
||||||||||||||||||
|
Foreign currency translation adjustments
|
39.3
|
|
(36.2
|
)
|
49.4
|
|
(17.2
|
)
|
||||||||||
|
Cash flow hedges
|
||||||||||||||||||
|
Reclassification adjustment for loss included in interest expense
|
—
|
|
0.6
|
|
—
|
|
1.2
|
|
||||||||||
|
Defined benefit plans
|
||||||||||||||||||
|
Unrealized gain (loss) for the period
|
(1.0
|
)
|
0.7
|
|
(1.0
|
)
|
0.5
|
|
||||||||||
|
Less: reclassification adjustment for loss during the period, included in base compensation expense
|
0.3
|
|
—
|
|
0.6
|
|
—
|
|
||||||||||
|
Other comprehensive income (loss)
|
38.6
|
|
—
|
|
(34.9
|
)
|
—
|
|
49.0
|
|
—
|
|
(15.5
|
)
|
||||
|
Comprehensive income
|
269.1
|
|
8.6
|
|
601.4
|
|
35.9
|
|
||||||||||
|
Comprehensive (income) loss attributable to non-controlling interests in consolidated entities
|
(23.0
|
)
|
19.9
|
|
(29.9
|
)
|
24.8
|
|
||||||||||
|
Comprehensive loss attributable to redeemable non-controlling interests in consolidated entities
|
—
|
|
0.2
|
|
—
|
|
0.1
|
|
||||||||||
|
Comprehensive income attributable to Carlyle Holdings
|
246.1
|
|
28.7
|
|
571.5
|
|
60.8
|
|
||||||||||
|
Comprehensive income attributable to non-controlling interests in Carlyle Holdings
|
(179.6
|
)
|
(25.8
|
)
|
(420.2
|
)
|
(43.9
|
)
|
||||||||||
|
Comprehensive income attributable to The Carlyle Group L.P.
|
$
|
66.5
|
|
$
|
2.9
|
|
$
|
151.3
|
|
$
|
16.9
|
|
||||||
See accompanying notes.
7
The Carlyle Group L.P.
(Unaudited)
(Dollars in millions)
|
|
Six Months Ended June 30,
|
||||||
|
|
2017
|
2016
|
|||||
|
Cash flows from operating activities
|
|||||||
|
Net income
|
$
|
552.4
|
|
$
|
51.4
|
|
|
|
Adjustments to reconcile net income to net cash flows from operating activities:
|
|||||||
|
Depreciation and amortization
|
20.1
|
|
34.2
|
|
|||
|
Equity-based compensation
|
160.8
|
|
184.4
|
|
|||
|
Non-cash performance fees
|
(511.8
|
)
|
67.2
|
|
|||
|
Other non-cash amounts
|
(6.1
|
)
|
(11.6
|
)
|
|||
|
Consolidated Funds related:
|
|||||||
|
Realized/unrealized gain on investments of Consolidated Funds
|
(29.6
|
)
|
(26.4
|
)
|
|||
|
Realized/unrealized (gain) loss from loans payable of Consolidated Funds
|
(28.2
|
)
|
27.9
|
|
|||
|
Purchases of investments by Consolidated Funds
|
(1,514.9
|
)
|
(1,310.5
|
)
|
|||
|
Proceeds from sale and settlements of investments by Consolidated Funds
|
1,746.8
|
|
466.6
|
|
|||
|
Non-cash interest income, net
|
(2.6
|
)
|
(1.9
|
)
|
|||
|
Change in cash and cash equivalents held at Consolidated Funds
|
345.4
|
|
391.3
|
|
|||
|
Change in other receivables held at Consolidated Funds
|
(28.1
|
)
|
0.7
|
|
|||
|
Change in other liabilities held at Consolidated Funds
|
(219.3
|
)
|
(14.6
|
)
|
|||
|
Investment income
|
(103.8
|
)
|
(54.3
|
)
|
|||
|
Purchases of investments
|
(204.3
|
)
|
(162.9
|
)
|
|||
|
Proceeds from the sale of investments
|
306.9
|
|
133.3
|
|
|||
|
Payments of contingent consideration
|
(22.5
|
)
|
(75.6
|
)
|
|||
|
Deconsolidation of Claren Road (see Note 10)
|
(23.3
|
)
|
—
|
|
|||
|
Changes in deferred taxes, net
|
0.3
|
|
14.7
|
|
|||
|
Change in due from affiliates and other receivables
|
(74.2
|
)
|
8.8
|
|
|||
|
Change in receivables and inventory of a consolidated real estate VIE
|
(14.5
|
)
|
(4.9
|
)
|
|||
|
Change in deposits and other
|
(9.3
|
)
|
(2.5
|
)
|
|||
|
Change in other assets of a consolidated real estate VIE
|
1.6
|
|
8.8
|
|
|||
|
Change in accounts payable, accrued expenses and other liabilities
|
(3.3
|
)
|
(16.3
|
)
|
|||
|
Change in accrued compensation and benefits
|
(41.1
|
)
|
(96.4
|
)
|
|||
|
Change in due to affiliates
|
0.1
|
|
(22.4
|
)
|
|||
|
Change in other liabilities of a consolidated real estate VIE
|
47.9
|
|
9.6
|
|
|||
|
Change in deferred revenue
|
27.7
|
|
7.4
|
|
|||
|
Net cash provided by (used in) operating activities
|
373.1
|
|
(394.0
|
)
|
|||
|
Cash flows from investing activities
|
|||||||
|
Change in restricted cash
|
3.8
|
|
6.4
|
|
|||
|
Purchases of fixed assets, net
|
(16.7
|
)
|
(8.4
|
)
|
|||
|
Net cash used in investing activities
|
(12.9
|
)
|
(2.0
|
)
|
|||
|
Cash flows from financing activities
|
|||||||
|
Borrowings under credit facility
|
250.0
|
|
—
|
|
|||
|
Repayments under credit facility
|
(250.0
|
)
|
—
|
|
|||
|
Proceeds from debt obligations
|
112.1
|
|
20.6
|
|
|||
|
Net payments on loans payable of a consolidated real estate VIE
|
(14.3
|
)
|
(16.9
|
)
|
|||
|
Net (payments) borrowings on loans payable of Consolidated Funds
|
(310.4
|
)
|
412.3
|
|
|||
|
Payments of contingent consideration
|
(0.4
|
)
|
(0.3
|
)
|
|||
|
Distributions to common unitholders
|
(22.7
|
)
|
(45.0
|
)
|
|||
|
Distributions to non-controlling interest holders in Carlyle Holdings
|
(63.1
|
)
|
(148.4
|
)
|
|||
|
Contributions from non-controlling interest holders
|
25.8
|
|
71.6
|
|
|||
|
Distributions to non-controlling interest holders
|
(53.0
|
)
|
(61.3
|
)
|
|||
|
Units repurchased
|
(0.2
|
)
|
(36.2
|
)
|
|||
|
Change in due to/from affiliates financing activities
|
49.2
|
|
13.4
|
|
|||
|
Net cash (used in) provided by financing activities
|
(277.0
|
)
|
209.8
|
|
|||
|
Effect of foreign exchange rate changes
|
35.8
|
|
2.0
|
|
|||
|
Increase (decrease) in cash and cash equivalents
|
119.0
|
|
(184.2
|
)
|
|||
|
Cash and cash equivalents, beginning of period
|
670.9
|
|
991.5
|
|
|||
|
Cash and cash equivalents, end of period
|
$
|
789.9
|
|
$
|
807.3
|
|
|
|
Supplemental non-cash disclosures
|
|||||||
|
Net increase in partners’ capital and accumulated other comprehensive income related to reallocation of ownership interest in Carlyle Holdings
|
$
|
6.9
|
|
$
|
1.7
|
|
|
|
Net asset impact of deconsolidation of Consolidated Funds
|
$
|
—
|
|
$
|
(7,170.2
|
)
|
|
|
Tax effect from acquisition of Carlyle Holdings partnership units:
|
|||||||
|
Deferred tax asset
|
$
|
14.8
|
|
$
|
(0.2
|
)
|
|
|
Tax receivable agreement liability
|
$
|
12.9
|
|
$
|
(0.2
|
)
|
|
|
Total partners’ capital
|
$
|
1.9
|
|
$
|
—
|
|
|
See accompanying notes.
8
The Carlyle Group L.P.
Notes to the Condensed Consolidated Financial Statements
(Unaudited)
1. Organization and Basis of Presentation
The Carlyle Group L.P., together with its consolidated subsidiaries, is one of the world’s largest global alternative asset management firms that originates, structures and acts as lead equity investor in management-led buyouts, strategic minority equity investments, equity private placements, consolidations and buildups, growth capital financings, real estate opportunities, bank loans, high-yield debt, distressed assets, mezzanine debt and other investment opportunities. The Carlyle Group L.P. is a Delaware limited partnership formed on July 18, 2011, which is managed and operated by its general partner, Carlyle Group Management L.L.C., which is in turn wholly-owned and controlled by Carlyle’s founders and other senior Carlyle professionals. Except as otherwise indicated by the context, references to the “Partnership” or “Carlyle” refer to The Carlyle Group L.P., together with its consolidated subsidiaries.
Carlyle provides investment management services to, and has transactions with, various private equity funds, real estate funds, private credit funds, collateralized loan obligations (“CLOs”), and other investment products sponsored by the Partnership for the investment of client assets in the normal course of business. Carlyle typically serves as the general partner, investment manager or collateral manager, making day-to-day investment decisions concerning the assets of these products. Carlyle operates its business through
four
reportable segments: Corporate Private Equity, Real Assets, Global Market Strategies, and Investment Solutions (see Note 17).
Basis of Presentation
The accompanying financial statements include the accounts of the Partnership and its consolidated subsidiaries. In addition, certain Carlyle-affiliated funds, related co-investment entities, certain CLOs managed by the Partnership (collectively the “Consolidated Funds”) and a real estate development company (see Note 16) have been consolidated in the accompanying financial statements pursuant to accounting principles generally accepted in the United States (“U.S. GAAP”), as described in Note 2. The consolidation of the Consolidated Funds generally has a gross-up effect on assets, liabilities and cash flows, and generally has no effect on the net income attributable to the Partnership. The economic ownership interests of the other investors in the Consolidated Funds are reflected as non-controlling interests in consolidated entities in the accompanying condensed consolidated financial statements (see Note 2).
The accompanying condensed consolidated financial statements have been prepared in accordance with U.S. GAAP for interim financial information. These statements, including notes, have not been audited, exclude some of the disclosures required for annual financial statements, and should be read in conjunction with the audited consolidated financial statements included in the Partnership’s Annual Report on Form 10-K for the year ended December 31, 2016 filed with the Securities and Exchange Commission (“SEC”). The operating results presented for interim periods are not necessarily indicative of the results that may be expected for any other interim period or for the entire year. In the opinion of management, the condensed consolidated financial statements reflect all adjustments, consisting of normal recurring accruals, which are necessary for the fair presentation of the financial condition and results of operations for the interim periods presented.
2. Summary of Significant Accounting Policies
Principles of Consolidation
The Partnership consolidates all entities that it controls either through a majority voting interest or as the primary beneficiary of variable interest entities (“VIEs”). On January 1, 2016, the Partnership adopted ASU 2015-2,
Consolidation (Topic 810): Amendments to the Consolidation Analysis,
which provides a revised consolidation model for all reporting entities to use in evaluating whether to consolidate certain types of legal entities.
The Partnership evaluates (1) whether it holds a variable interest in an entity, (2) whether the entity is a VIE, and (3)whether the Partnership's involvement would make it the primary beneficiary. In evaluating whether the Partnership holds a variable interest, fees (including management fees and performance fees) that are customary and commensurate with the level of services provided, and where the Partnership does not hold other economic interests in the entity that would absorb more than an insignificant amount of the expected losses or returns of the entity, are not considered variable interests. The Partnership considers all economic interests, including indirect interests, to determine if a fee is considered a variable interest.
For those entities where the Partnership holds a variable interest, the Partnership determines whether each of these entities qualifies as a VIE and, if so, whether or not the Partnership is the primary beneficiary. The assessment of whether the entity is
9
The Carlyle Group L.P.
Notes to the Condensed Consolidated Financial Statements
(Unaudited)
a VIE is generally performed qualitatively, which requires judgment. These judgments include: (a) determining whether the equity investment at risk is sufficient to permit the entity to finance its activities without additional subordinated financial support, (b) evaluating whether the equity holders, as a group, can make decisions that have a significant effect on the economic performance of the entity, (c) determining whether two or more parties' equity interests should be aggregated, and (d) determining whether the equity investors have proportionate voting rights to their obligations to absorb losses or rights to receive returns from an entity.
For entities that are determined to be VIEs, the Partnership consolidates those entities where it has concluded it is the primary beneficiary. The primary beneficiary is defined as the variable interest holder with (a) the power to direct the activities of a VIE that most significantly impact the entity’s economic performance and (b) the obligation to absorb losses of the entity or the right to receive benefits from the entity that could potentially be significant to the VIE. In evaluating whether the Partnership is the primary beneficiary, the Partnership evaluates its economic interests in the entity held either directly or indirectly by the Partnership.
As of
June 30, 2017
, assets and liabilities of the consolidated VIEs reflected in the unaudited condensed consolidated balance sheets were
$4.6 billion
and
$4.5 billion
, respectively. Except to the extent of the consolidated assets of the VIEs, the holders of the consolidated VIEs’ liabilities generally do not have recourse to the Partnership.
Substantially all of our Consolidated Funds are CLOs, which are VIEs that issue loans payable that are backed by diversified collateral asset portfolios consisting primarily of loans or structured debt. In exchange for managing the collateral for the CLOs, the Partnership earns investment management fees, including in some cases subordinated management fees and contingent incentive fees. In cases where the Partnership consolidates the CLOs (primarily because of a retained interest that is significant to the CLO), those management fees have been eliminated as intercompany transactions. As of
June 30, 2017
, the Partnership held
$194.1 million
of investments in these CLOs which represents its maximum risk of loss. The Partnership’s investments in these CLOs are generally subordinated to other interests in the entities and entitle the Partnership to receive a pro rata portion of the residual cash flows, if any, from the entities. Investors in the CLOs have no recourse against the Partnership for any losses sustained in the CLO structure.
Entities that do not qualify as VIEs are generally assessed for consolidation as voting interest entities. Under the voting interest entity model, the Partnership consolidates those entities it controls through a majority voting interest.
All significant inter-entity transactions and balances of entities consolidated have been eliminated.
Investments in Unconsolidated Variable Interest Entities
The Partnership holds variable interests in certain VIEs that are not consolidated because the Partnership is not the primary beneficiary, including its investments in certain CLOs and strategic investment in NGP Management Company, L.L.C. (“NGP Management” and, together with its affiliates, “NGP”). Refer to Note 5 for information on the strategic investment in NGP. The Partnership’s involvement with such entities is in the form of direct equity interests and fee arrangements. The maximum exposure to loss represents the loss of assets recognized by the Partnership relating to its variable interests in these unconsolidated entities. The assets recognized in the Partnership’s unaudited condensed consolidated balance sheets related to the Partnership’s variable interests in these non-consolidated VIEs and the Partnership’s maximum exposure to loss relating to unconsolidated VIEs were as follows:
|
As of
|
|||||||
|
|
June 30, 2017
|
December 31, 2016
|
|||||
|
|
(Dollars in millions)
|
||||||
|
Investments
|
$
|
771.1
|
|
$
|
664.2
|
|
|
|
Due from affiliates, net
|
—
|
|
1.8
|
|
|||
|
Maximum Exposure to Loss
|
$
|
771.1
|
|
$
|
666.0
|
|
|
10
The Carlyle Group L.P.
Notes to the Condensed Consolidated Financial Statements
(Unaudited)
Additionally, as of
June 30, 2017
, the Partnership had
$44.7 million
and
$10.6 million
recognized in the condensed consolidated balance sheet related to accrued carry and management fee receivables, respectively, related to the unconsolidated VIEs.
Basis of Accounting
The accompanying financial statements are prepared in accordance with U.S. GAAP. Management has determined that the Partnership’s Funds are investment companies under U.S. GAAP for the purposes of financial reporting. U.S. GAAP for an investment company requires investments to be recorded at estimated fair value and the unrealized gains and/or losses in an investment’s fair value are recognized on a current basis in the statements of operations. Additionally, the Funds do not consolidate their majority-owned and controlled investments (the “Portfolio Companies”). In the preparation of these condensed consolidated financial statements, the Partnership has retained the specialized accounting for the Funds.
All of the investments held and notes issued by the Consolidated Funds are presented at their estimated fair values in the Partnership’s condensed consolidated balance sheets. Interest and other income of the Consolidated Funds as well as interest expense and other expenses of the Consolidated Funds are included in the Partnership’s condensed consolidated statements of operations.
Use of Estimates
The preparation of financial statements in conformity with U.S. GAAP requires management to make assumptions and estimates that affect the reported amounts of assets and liabilities and disclosure of contingent assets and liabilities at the date of the financial statements and the reported amounts of revenues and expenses during the reporting period. Management’s estimates are based on historical experiences and other factors, including expectations of future events that management believes to be reasonable under the circumstances. It also requires management to exercise judgment in the process of applying the Partnership’s accounting policies. Assumptions and estimates regarding the valuation of investments and their resulting impact on performance fees involve a higher degree of judgment and complexity and these assumptions and estimates may be significant to the consolidated financial statements and the resulting impact on performance fees. Actual results could differ from these estimates and such differences could be material.
Revenue Recognition
Fund Management Fees
The Partnership provides management services to funds in which it holds a general partner interest or has a management agreement.
For closed-end carry funds in the Corporate Private Equity, Real Assets and Global Market Strategies segments, management fees generally range from
1.0%
to
2.0%
of commitments during the fund's investment period based on limited partners' capital commitments to the funds. Following the expiration or termination of the investment period, management fees generally are based on the lower of cost or fair value of invested capital and the rate charged may also be reduced to between
0.6%
and
2.0%
. For certain managed accounts and longer-dated carry funds, with expected terms greater than
ten years
, management fees generally range from
0.2%
to
1.0%
based on contributions for unrealized investments or the current value of the investment. The Partnership will receive management fees during a specified period of time, which is generally
ten years
from the initial closing date, or, in some instances, from the final closing date, but such termination date may be earlier in certain limited circumstances or later if extended for successive
one
-year periods, typically up to a maximum of
two years
. Depending upon the contracted terms of investment advisory or investment management and related agreements, these fees are generally called semi-annually in advance and are recognized as earned over the subsequent
six
month period. For certain longer-dated carry funds, management fees are called quarterly over the life of the funds.
Within the Global Market Strategies segment, for CLOs and other structured products, management fees generally range from
0.3%
to
0.6%
based on the total par amounts of assets or the aggregate principal amount of the notes in the CLO and are due quarterly or semi-annually based on the terms and recognized over the respective period. Management fees for the CLOs and other structured products are governed by indentures and collateral management agreements. The Partnership will receive management fees for the CLOs until redemption of the securities issued by the CLOs, which is generally
five
to
ten
years after issuance. Management fees for the business development companies are due quarterly in arrears at annual rates that range from
0.25%
to
1.0%
of gross assets, excluding cash and cash equivalents.
11
The Carlyle Group L.P.
Notes to the Condensed Consolidated Financial Statements
(Unaudited)
Management fees for the Partnership's private equity and real estate carry fund vehicles in the Investment Solutions segment generally range from
0.25%
to
1.0%
of the vehicle’s capital commitments during the commitment fee period of the relevant fund or the weighted-average investment period of the underlying funds. Following the expiration of the commitment fee period or weighted-average investment period of such funds, the management fees generally range from
0.25%
to
1.0%
of the lower of cost or fair value of the capital invested, the net asset value for unrealized investments, or the contributions for unrealized investments; however, certain managed accounts earn management fees at all times on contributions for unrealized investments. Management fees for the Investment Solutions carry fund vehicles are generally due quarterly and recognized over the related quarter.
The Partnership also provides transaction advisory and portfolio advisory services to the portfolio companies, and where covered by separate contractual agreements, recognizes fees for these services when the service has been provided and collection is reasonably assured. Fund management fees includes transaction and portfolio advisory fees of
$6.1 million
and
$8.4 million
for the
three months ended June 30, 2017 and 2016
, respectively, and
$17.8 million
and
$31.9 million
for the
six months ended June 30, 2017 and 2016
, respectively, net of any offsets as defined in the respective partnership agreements. Fund management fees exclude the reimbursement of any partnership expenses paid by the Partnership on behalf of the Carlyle funds pursuant to the limited partnership agreements, including amounts related to the pursuit of actual, proposed, or unconsummated investments, professional fees, expenses associated with the acquisition, holding and disposition of investments, and other fund administrative expenses.
Performance Fees
Performance fees consist principally of the allocation of profits from certain of the funds to which the Partnership is entitled (commonly known as carried interest).
For closed-end carry funds in the Corporate Private Equity, Real Assets and Global Market Strategies segments, the Partnership is generally entitled to a
20%
allocation (or
10%
to
20%
on certain longer-dated carry funds and external co-investment vehicles, or approximately
2%
to
10%
in the majority of the Investment Solutions segment carry fund vehicles) of the net realized income or gain as a carried interest after returning the invested capital, the allocation of preferred returns of generally
7%
to
9%
(or
4%
to
7%
for certain longer-dated carry funds) and return of certain fund costs (generally subject to catch-up provisions as set forth in the fund limited partnership agreement). Carried interest is recognized upon appreciation of the funds’ investment values above certain return hurdles set forth in each respective partnership agreement. The Partnership recognizes revenues attributable to performance fees based upon the amount that would be due pursuant to the fund partnership agreement at each period end as if the funds were terminated at that date. Accordingly, the amount recognized as performance fees reflects the Partnership’s share of the gains and losses of the associated funds’ underlying investments measured at their then-current fair values relative to the fair values as of the end of the prior period. Because of the inherent uncertainty, these estimated values may differ significantly from the values that would have been used had a ready market for the investments existed, and it is reasonably possible that the difference could be material.
Carried interest is ultimately realized when: (i) an underlying investment is profitably disposed of, (ii) certain costs borne by the limited partner investors have been reimbursed, (iii) the fund’s cumulative returns are in excess of the preferred return and (iv) the Partnership has decided to collect carry rather than return additional capital to limited partner investors. Realized carried interest may be required to be returned by the Partnership in future periods if the funds’ investment values decline below certain levels. When the fair value of a fund’s investments remains constant or falls below certain return hurdles, previously recognized performance fees are reversed. In all cases, each fund is considered separately in this regard, and for a given fund, performance fees can never be negative over the life of a fund. If upon a hypothetical liquidation of a fund’s investments at their then-current fair values, previously recognized and distributed carried interest would be required to be returned, a liability is established for the potential giveback obligation. As of
June 30, 2017
and
December 31, 2016
, the Partnership has recognized
$162.2 million
and
$160.8 million
, respectively, for giveback obligations.
The Partnership is also entitled to receive performance fees pursuant to management contracts from certain of its Global Market Strategies funds when the return on assets under management exceeds certain benchmark returns or other performance targets. In such arrangements, performance fees are recognized when the performance benchmark has been achieved, and are included in performance fees in the accompanying unaudited condensed consolidated statements of operations.
12
The Carlyle Group L.P.
Notes to the Condensed Consolidated Financial Statements
(Unaudited)
Investment Income (Loss)
Investment income (loss) represents the unrealized and realized gains and losses resulting from the Partnership’s equity method investments and other principal investments, including CLOs. Equity method investment income (loss) includes the related amortization of the basis difference between the Partnership’s carrying value of its investment and the Partnership’s share of underlying net assets of the investee, as well as the compensation expense associated with compensatory arrangements provided by the Partnership to employees of its equity method investee, as it relates to its investments in NGP (see Note 5). Investment income (loss) is realized when the Partnership redeems all or a portion of its investment or when the Partnership receives or is due cash income, such as dividends or distributions. Unrealized investment income (loss) results from changes in the fair value of the underlying investment as well as the reversal of unrealized gain (loss) at the time an investment is realized.
Interest Income
Interest income is recognized when earned. For debt securities representing non-investment grade beneficial interests in securitizations, the effective yield is determined based on the estimated cash flows of the security. Changes in the effective yield of these securities due to changes in estimated cash flows are recognized on a prospective basis as adjustments to interest income in future periods. Interest income earned by the Partnership is included in interest and other income in the accompanying unaudited condensed consolidated statements of operations. Interest income of the Consolidated Funds was
$41.8 million
and
$33.9 million
for the
three months ended June 30, 2017 and 2016
, respectively, and
$82.3 million
and
$61.6 million
for the
six months ended June 30, 2017 and 2016
, respectively, and is included in interest and other income of Consolidated Funds in the accompanying unaudited condensed consolidated statements of operations.
Compensation and Benefits
Base Compensation
– Base compensation includes salaries, bonuses (discretionary awards and guaranteed amounts), performance payment arrangements and benefits paid and payable to Carlyle employees. Bonuses are accrued over the service period to which they relate.
Equity-Based Compensation
– Compensation expense relating to the issuance of equity-based awards to Carlyle employees is measured at fair value on the grant date. The compensation expense for awards that vest over a future service period is recognized over the relevant service period on a straight-line basis. The compensation expense for awards that do not require future service is recognized immediately. Cash settled equity-based awards are classified as liabilities and are re-measured at the end of each reporting period. The compensation expense for awards that contain performance conditions is recognized when it is probable that the performance conditions will be achieved; in certain instances, such compensation expense may be recognized prior to the grant date of the award.
Equity-based awards issued to non-employees are generally recognized as general, administrative and other expenses, except to the extent they are recognized as part of our equity method earnings because they are issued to employees of our equity method investees. The grant-date fair value of equity-based awards granted to Carlyle’s non-employee directors is expensed on a straight-line basis over the vesting period. The cost of services received in exchange for an equity-based award issued to non-employees who are not directors is measured at each vesting date, and is not measured based on the grant-date fair value of the award unless the award is vested at the grant date. Equity-based awards that require the satisfaction of future service criteria are recognized over the relevant service period based on the fair value of the award on each reporting date and adjusted for the actual fair value of the award at each vesting date. Accordingly, the measured value of the award will not be finalized until the vesting date.
On January 1, 2017, the Partnership adopted ASU 2016-9,
Compensation - Stock Compensation (Topic 718)
. In accordance with ASU 2016-9, the Partnership elected to recognize equity-based award forfeitures in the period they occur as a reversal of previously recognized compensation expense. The reduction in compensation expense is determined based on the specific awards forfeited during that period. Furthermore, the Partnership is required to recognize prospectively all excess tax benefits and deficiencies as income tax benefit or expense in the statement of operations.
Performance Fee Related Compensation –
A portion of the performance fees earned is due to employees and advisors of the Partnership. These amounts are accounted for as compensation expense in conjunction with the recognition of the related performance fee revenue and, until paid, are recognized as a component of the accrued compensation and benefits liability. Accordingly, upon a reversal of performance fee revenue, the related compensation expense, if any, is also reversed. As of
June 30, 2017
and
December 31, 2016
, the Partnership had recorded a liability of
$1.7 billion
and
$1.3 billion
related to the
13
The Carlyle Group L.P.
Notes to the Condensed Consolidated Financial Statements
(Unaudited)
portion of accrued performance fees due to employees and advisors, respectively, which was included in accrued compensation and benefits in the accompanying unaudited condensed consolidated financial statements.
Income Taxes
Certain of the wholly-owned subsidiaries of the Partnership and the Carlyle Holdings partnerships are subject to federal, state, local and foreign corporate income taxes at the entity level and the related tax provision attributable to the Partnership’s share of this income is reflected in the unaudited condensed consolidated financial statements. Based on applicable federal, foreign, state and local tax laws, the Partnership records a provision for income taxes for certain entities. Tax positions taken by the Partnership are subject to periodic audit by U.S. federal, state, local and foreign taxing authorities.
The Partnership accounts for income taxes using the asset and liability method, which requires the recognition of deferred tax assets and liabilities for the expected future consequences of events that have been included in the financial statements or tax returns. Under this method, deferred tax assets and liabilities are determined based on the difference between the financial statement reporting and the tax basis of assets and liabilities using enacted tax rates in effect for the period in which the difference is expected to reverse. The effect of a change in tax rates on deferred tax assets and liabilities is recognized in the period of the change in the provision for income taxes. Further, deferred tax assets are recognized for the expected realization of available net operating loss and tax credit carry forwards. A valuation allowance is recorded on the Partnership’s gross deferred tax assets when it is “more likely than not” that such asset will not be realized. When evaluating the realizability of the Partnership’s deferred tax assets, all evidence, both positive and negative, is evaluated. Items considered in this analysis include the ability to carry back losses, the reversal of temporary differences, tax planning strategies, and expectations of future earnings.
Under U.S. GAAP for income taxes, the amount of tax benefit to be recognized is the amount of benefit that is “more likely than not” to be sustained upon examination. The Partnership analyzes its tax filing positions in all of the U.S. federal, state, local and foreign tax jurisdictions where it is required to file income tax returns, as well as for all open tax years in these jurisdictions. If, based on this analysis, the Partnership determines that uncertainties in tax positions exist, a liability is established, which is included in accounts payable, accrued expenses and other liabilities in the unaudited condensed consolidated financial statements. The Partnership recognizes accrued interest and penalties related to unrecognized tax positions in the provision for income taxes. If recognized, the entire amount of unrecognized tax positions would be recorded as a reduction in the provision for income taxes.
Tax Receivable Agreement
Exchanges of Carlyle Holdings partnership units for the Partnership’s common units that are executed by the limited partners of the Carlyle Holdings partnerships result in transfers of and increases in the tax basis of the tangible and intangible assets of Carlyle Holdings, primarily attributable to a portion of the goodwill inherent in the business. These transfers and increases in tax basis will increase (for tax purposes) depreciation and amortization and therefore reduce the amount of tax that certain of the Partnership’s subsidiaries, including Carlyle Holdings I GP Inc., which are referred to as the “corporate taxpayers,” would otherwise be required to pay in the future. This increase in tax basis may also decrease gain (or increase loss) on future dispositions of certain capital assets to the extent tax basis is allocated to those capital assets. The Partnership has entered into a tax receivable agreement with the limited partners of the Carlyle Holdings partnerships whereby the corporate taxpayers have agreed to pay to the limited partners of the Carlyle Holdings partnerships involved in any exchange transaction
85%
of the amount of cash tax savings, if any, in U.S. federal, state and local income tax or foreign or franchise tax that the corporate taxpayers realize as a result of these increases in tax basis and, in limited cases, transfers or prior increases in tax basis. The corporate taxpayers expect to benefit from the remaining
15%
of cash tax savings, if any, in income tax they realize. Payments under the tax receivable agreement will be based on the tax reporting positions that the Partnership will determine. The corporate taxpayers will not be reimbursed for any payments previously made under the tax receivable agreement if a tax basis increase is successfully challenged by the Internal Revenue Service.
The Partnership records an increase in deferred tax assets for the estimated income tax effects of the increases in tax basis based on enacted federal and state tax rates at the date of the exchange. To the extent that the Partnership estimates that the corporate taxpayers will not realize the full benefit represented by the deferred tax asset, based on an analysis that will consider, among other things, its expectation of future earnings, the Partnership will reduce the deferred tax asset with a valuation allowance and will assess the probability that the related liability owed under the tax receivable agreement will be paid. The Partnership records
85%
of the estimated realizable tax benefit (which is the recorded deferred tax asset less any recorded valuation allowance) as an increase to the liability due under the tax receivable agreement, which is included in due to affiliates
14
The Carlyle Group L.P.
Notes to the Condensed Consolidated Financial Statements
(Unaudited)
in the accompanying condensed consolidated financial statements. The remaining
15%
of the estimated realizable tax benefit is initially recorded as an increase to the Partnership’s partners’ capital.
All of the effects to the deferred tax asset of changes in any of the Partnership’s estimates after the tax year of the exchange will be reflected in the provision for income taxes. Similarly, the effect of subsequent changes in the enacted tax rates will be reflected in the provision for income taxes.
Non-controlling Interests
Non-controlling interests in consolidated entities represent the component of equity in consolidated entities held by third-party investors. These interests are adjusted for general partner allocations and by subscriptions and redemptions in hedge funds which occur during the reporting period. Any change in ownership of a subsidiary while the controlling financial interest is retained is accounted for as an equity transaction between the controlling and non-controlling interests. Transaction costs incurred in connection with such changes in ownership of a subsidiary are recorded as a direct charge to partners’ capital.
Non-controlling interests in Carlyle Holdings relate to the ownership interests of the other limited partners of the Carlyle Holdings partnerships. The Partnership, through wholly-owned subsidiaries, is the sole general partner of Carlyle Holdings. Accordingly, the Partnership consolidates Carlyle Holdings into its consolidated financial statements, and the other ownership interests in Carlyle Holdings are reflected as non-controlling interests in the Partnership’s unaudited condensed consolidated financial statements. Any change to the Partnership’s ownership interest in Carlyle Holdings while it retains the controlling financial interest in Carlyle Holdings is accounted for as a transaction within partners’ capital as a reallocation of ownership interests in Carlyle Holdings.
Earnings Per Common Unit
The Partnership computes earnings per common unit in accordance with ASC 260,
Earnings Per Share
(“ASC 260”)
.
Basic earnings per common unit is calculated by dividing net income (loss) attributable to the common units of the Partnership by the weighted-average number of common units outstanding for the period. Diluted earnings per common unit reflects the assumed conversion of all dilutive securities. Net income (loss) attributable to the common units excludes net income (loss) and dividends attributable to any participating securities under the two-class method of ASC 260.
Investments
Investments include (i) the Partnership’s ownership interests (typically general partner interests) in the Funds, (ii) strategic investments made by the Partnership (both of which are accounted for as equity method investments), (iii) the investments held by the Consolidated Funds (which are presented at fair value in the Partnership’s unaudited condensed consolidated financial statements), and (iv) investments in the CLOs and certain credit-oriented investments (which are accounted for as trading securities).
The valuation procedures utilized for investments of the Funds vary depending on the nature of the investment. The fair value of investments in publicly-traded securities is based on the closing price of the security with adjustments to reflect appropriate discounts if the securities are subject to restrictions.
The fair value of non-equity securities or other investments, which may include instruments that are not listed on an exchange, considers, among other factors, external pricing sources, such as dealer quotes or independent pricing services, recent trading activity or other information that, in the opinion of the Partnership, may not have been reflected in pricing obtained from external sources.
When valuing private securities or assets without readily determinable market prices, the Partnership gives consideration to operating results, financial condition, economic and/or market events, recent sales prices and other pertinent information. These valuation procedures may vary by investment, but include such techniques as comparable public market valuation, comparable acquisition valuation and discounted cash flow analysis. Because of the inherent uncertainty, these estimated values may differ significantly from the values that would have been used had a ready market for the investments existed, and it is reasonably possible that the difference could be material. Furthermore, there is no assurance that, upon liquidation, the Partnership will realize the values presented herein.
Upon the sale of a security or other investment, the realized net gain or loss is computed on a weighted average cost basis, with the exception of the investments held by the CLOs, which compute the realized net gain or loss on a first in, first out basis. Securities transactions are recorded on a trade date basis.
15
The Carlyle Group L.P.
Notes to the Condensed Consolidated Financial Statements
(Unaudited)
Equity Method Investments
The Partnership accounts for all investments in which it has or is otherwise presumed to have significant influence, including investments in the unconsolidated Funds and strategic investments, using the equity method of accounting. The carrying value of equity method investments is determined based on amounts invested by the Partnership, adjusted for the equity in earnings or losses of the investee allocated based on the respective partnership agreement, less distributions received. The Partnership evaluates its equity method investments for impairment whenever events or changes in circumstances indicate that the carrying amounts of such investments may not be recoverable.
Cash and Cash Equivalents
Cash and cash equivalents include cash held at banks and cash held for distributions, including temporary investments with original maturities of less than three months when purchased.
Cash and Cash Equivalents Held at Consolidated Funds
Cash and cash equivalents held at Consolidated Funds consists of cash and cash equivalents held by the Consolidated Funds, which, although not legally restricted, is not available to fund the general liquidity needs of the Partnership.
Restricted Cash
Restricted cash primarily represents cash held by the Partnership’s foreign subsidiaries due to certain government regulatory capital requirements.
Corporate Treasury Investments
Corporate treasury investments represent investments in U.S. Treasury and government agency obligations, commercial paper, certificates of deposit, other investment grade securities and other investments with original maturities of greater than three months when purchased. These investments are accounted for as trading securities in which changes in the fair value of each investment are recorded through investment income (loss). Any interest earned on debt investments is recorded through interest and other income.
Derivative Instruments
The Partnership uses derivative instruments primarily to reduce its exposure to changes in foreign currency exchange rates. Derivative instruments are recognized at fair value in the unaudited condensed consolidated balance sheets with changes in fair value recognized in the unaudited condensed consolidated statements of operations for all derivatives not designated as hedging instruments.
Fixed Assets
Fixed assets consist of furniture, fixtures and equipment, leasehold improvements, and computer hardware and software and are stated at cost, less accumulated depreciation and amortization. Depreciation is recognized on a straight-line method over the assets’ estimated useful lives, which for leasehold improvements are the lesser of the lease terms or the life of the asset, and
three
to
seven
years for other fixed assets. Fixed assets are reviewed for impairment whenever events or changes in circumstances indicate that the carrying amount of an asset may not be recoverable.
Intangible Assets and Goodwill
The Partnership’s intangible assets consist of acquired contractual rights to earn future fee income, including management and advisory fees, customer relationships, and acquired trademarks. Finite-lived intangible assets are amortized over their estimated useful lives, which range from
five
to
ten
years, and are reviewed for impairment whenever events or changes in circumstances indicate that the carrying amount of the asset may not be recoverable.
Goodwill represents the excess of cost over the identifiable net assets of businesses acquired and is recorded in the functional currency of the acquired entity. Goodwill is recognized as an asset and is reviewed for impairment annually as of October 1st and between annual tests when events and circumstances indicate that impairment may have occurred.
16
The Carlyle Group L.P.
Notes to the Condensed Consolidated Financial Statements
(Unaudited)
Deferred Revenue
Deferred revenue represents management fees and other revenue received prior to the balance sheet date, which has not yet been earned.
Accumulated Other Comprehensive Income (Loss)
The Partnership’s accumulated other comprehensive income (loss) is comprised of foreign currency translation adjustments and gains and losses on defined benefit plans sponsored by AlpInvest. The components of accumulated other comprehensive income (loss) as of
June 30, 2017
and
December 31, 2016
were as follows:
|
|
As of
|
||||||
|
|
June 30, 2017
|
December 31, 2016
|
|||||
|
|
(Dollars in millions)
|
||||||
|
Currency translation adjustments
|
$
|
(88.6
|
)
|
$
|
(91.7
|
)
|
|
|
Unrealized losses on defined benefit plans
|
(3.8
|
)
|
(3.5
|
)
|
|||
|
Total
|
$
|
(92.4
|
)
|
$
|
(95.2
|
)
|
|
Foreign Currency Translation
Non-U.S. dollar denominated assets and liabilities are translated at period-end rates of exchange, and the unaudited condensed consolidated statements of operations are translated at rates of exchange in effect throughout the period. Foreign currency gains resulting from transactions outside of the functional currency of an entity of
$5.2 million
and
$12.1 million
for the
three months ended June 30, 2017 and 2016
, respectively, and
$1.5 million
and
$22.9 million
for the
six months ended June 30, 2017 and 2016
, respectively, are included in general, administrative and other expenses in the unaudited condensed consolidated statements of operations.
Recent Accounting Pronouncements
In January 2017, the FASB issued ASU 2017-1,
Business Combinations (Topic 805) - Clarifying the Definition of a Business
. ASU 2017-01 changes the criteria for determining whether a group of assets acquired is a business. Specifically, when substantially all of the fair value of the gross assets acquired is concentrated in a single identifiable asset or group of similar identifiable assets, the assets acquired would not be considered a business. The guidance is effective for the Partnership on January 1, 2018 and is required to be applied prospectively, however, early adoption is permitted. This guidance will impact the Partnership's analysis of the accounting for any future acquisitions occurring after the date of adoption.
In January 2017, the FASB issued ASU 2017-4,
Intangibles - Goodwill and Other (Topic 350) - Simplifying the Test for Goodwill Impairment
. ASU 2017-04 simplifies an entity’s annual goodwill test for impairment by eliminating the requirement to calculate the implied fair value of goodwill, and instead an entity should compare the fair value of a reporting unit with its carrying amount. The impairment charge will then be the amount by which the carrying amount exceeds the reporting unit’s fair value. An entity would still have the option to perform a qualitative assessment for a reporting unit to determine if the quantitative impairment test is necessary. The guidance is effective for the Partnership on January 1, 2020 and requires the guidance to be applied using a prospective transition method. Early adoption is permitted. The Partnership does not expect the impact of this guidance to be material.
In November 2016, the FASB issued ASU 2016-18,
Statement of Cash Flows (Topic 230) - Restricted Cash
. ASU 2016-18 clarifies the presentation of restricted cash in the statement of cash flows by requiring the amounts described as restricted cash be included with cash and cash equivalents when reconciling the beginning of period and end of period total amounts shown on the statement of cash flows. If cash and cash equivalents and restricted cash are presented separately on the statement of financial position, a reconciliation of these separate line items to the total cash amount included in the statement of cash flows will be required either in the footnotes or on the face of the statement of cash flows. The guidance is effective for the Partnership on January 1, 2018 and ASU 2016-18 requires the guidance to be applied using a retrospective transition method. Early adoption is permitted; however, the Partnership expects to reflect this change in presentation of restricted cash in its first quarter 2018 condensed consolidated financial statements.
17
The Carlyle Group L.P.
Notes to the Condensed Consolidated Financial Statements
(Unaudited)
I
n August 2016, the FASB issued ASU 2016-15,
Statement of Cash Flows (Topic 230) - Classification of Certain Cash Receipts and Cash Payments
. ASU 2016-15 clarifies the classification of several discrete cash flow issues, including the treatment of cash distributions from equity method investments. The guidance is effective for the Partnership on January 1, 2018 and ASU 2016-15 requires the guidance to be applied using a retrospective transition method. Early adoption is permitted, provided that all of the amendments for all of the topics are adopted in the same period. The Partnership is currently assessing the potential impact of this guidance to its consolidated statements of cash flows.
In June 2016, the FASB issued ASU 2016-13,
Accounting for Financial Instruments - Credit Losses (Topic 326)
. ASU 2016-13 requires an organization to measure all expected credit losses for financial assets held at the reporting date based on historical experience, current conditions, and reasonable and supportable forecasts. Currently, GAAP requires an "incurred loss" methodology that delays recognition until it is probable a loss has been incurred. Under the new standard, the allowance for credit losses must be deducted from the amortized cost of the financial asset to present the net amount expected to be collected. The income statement will reflect the measurement of credit losses for newly recognized financial assets as well as the expected increases or decreases of expected credit losses that have taken place during the period. This provision of the guidance requires a modified retrospective transition method and will result in a cumulative-effect adjustment in retained earnings upon adoption. This guidance is effective for the Partnership on January 1, 2020 and early adoption is permitted. The Partnership is currently assessing the potential impact of this guidance.
In March 2016, the FASB issued ASU 2016-9,
Compensation - Stock Compensation (Topic 718): Improvements to Employee Share-Based Payment Accounting
. ASU 2016-9 changes certain aspects of accounting for share-based payments to employees. ASU 2016-9 requires the income tax effects of awards to be recognized through the income statement when the awards vest or are settled. Previously, an entity was required to determine for each award whether the difference between the deduction for tax purposes and the compensation cost recognized for financial reporting purposes resulted in either an excess tax benefit or a tax deficiency. Excess tax benefits were recognized in partners’ capital, while tax deficiencies were recognized as an offset to accumulated excess tax benefits or in the income statement. Under ASU 2016-9, all excess tax benefits and tax deficiencies are required to be recognized as income tax benefit or expense in the income statement. This provision of the guidance is required to be applied prospectively. Additionally, ASU 2016-9 allows an employer to withhold employee shares upon vest up to maximum statutory tax rates without causing an award to be classified as a liability. This provision of the guidance requires a modified retrospective transition method. Finally, the previous equity-based compensation guidance required cost to be measured based on the number of awards that are expected to vest. Under ASU 2016-9, an accounting policy election can be made to either estimate the number of awards that are expected to vest or account for forfeitures when they occur. This guidance was effective for the Partnership on January 1, 2017. The Partnership adopted this guidance on that date by recording an adjustment for the cumulative effect of adoption in partners' capital on January 1, 2017. The impact of the adjustment was not material to total partners' capital.
In February 2016, the FASB issued ASU 2016-2,
Leases (Topic 842)
. ASU 2016-2 requires lessees to recognize virtually all of their leases on the balance sheet, by recording a right-of-use asset and a lease liability. The lease liability will be measured at the present value of lease payments and the right-of-use asset will be based on the lease liability value, subject to adjustments. Leases can be classified as either operating leases or finance leases. Operating leases will result in straight-line lease expense, while finance leases will result in front-loaded expense. This guidance is effective for the Partnership on January 1, 2019 and ASU 2016-2 requires the guidance to be applied using a modified retrospective method. Early adoption is permitted. The Partnership is currently assessing the potential impact of this guidance, however, the Partnership's total assets and total liabilities on its consolidated balance sheet will increase upon adoption of this guidance.
The FASB issued ASU 2014-9,
Revenue from Contracts with Customers (Topic 606)
(“ASU 2014-9”) in May 2014 and subsequently issued several amendments to the standard. ASU 2014-9, and related amendments, provide comprehensive guidance for recognizing revenue from contracts with customers. Entities will be able to recognize revenue when the entity transfers promised goods or services to customers in an amount that reflects the consideration to which the entity expects to be entitled to in exchange for those goods or services. The guidance includes a five-step framework that requires an entity to: (i) identify the contract(s) with a customer, (ii) identify the performance obligations in the contract, (iii) determine the transaction price, (iv) allocate the transaction price to the performance obligations in the contract, and (v) recognize revenue when the entity satisfies a performance obligation. The guidance in ASU 2014-9, and the related amendments, is effective for the Partnership beginning on January 1, 2018, and the Partnership plans to adopt this guidance on that date.
Upon adoption of ASU 2014-9, performance fees that represent a performance-based capital allocation from fund limited partners to the Partnership (commonly known as “carried interest”, which comprised over
80%
of the Partnership's performance
18
The Carlyle Group L.P.
Notes to the Condensed Consolidated Financial Statements
(Unaudited)
fee revenues for each of the years ended December 31, 2016, 2015 and 2014) will be accounted for as earnings from financial assets within the scope of ASC 323,
Investments - Equity Method and Joint Ventures
, and therefore will not be in the scope of ASU 2014-9. In accordance with ASC 323, the Partnership will record equity method income (losses) as a component of investment income based on the change in our proportionate claim on net assets of the investment fund, including performance-based capital allocations, assuming the investment fund was liquidated as of each reporting date pursuant to each fund's governing agreements. The Partnership will apply this change in accounting on a full retrospective basis. This change in accounting will result in a reclassification from performance fee revenues to investment income (losses). The Partnership is still determining the potential additional impacts of ASU 2014-9 on its financial statements for those arrangements within the scope of ASU 2014-9, including its accounting for management fees and performance fees earned under other types of contracts.
3. Fair Value Measurement
The fair value measurement accounting guidance establishes a hierarchal disclosure framework which ranks the observability of market price inputs used in measuring financial instruments at fair value. The observability of inputs is impacted by a number of factors, including the type of financial instrument, the characteristics specific to the financial instrument and the state of the marketplace, including the existence and transparency of transactions between market participants. Financial instruments with readily available quoted prices, or for which fair value can be measured from quoted prices in active markets, will generally have a higher degree of market price observability and a lesser degree of judgment applied in determining fair value.
Financial instruments measured and reported at fair value are classified and disclosed based on the observability of inputs used in the determination of fair values, as follows:
Level I
– inputs to the valuation methodology are quoted prices available in active markets for identical instruments as of the reporting date. The type of financial instruments included in Level I include unrestricted securities, including equities and derivatives, listed in active markets. The Partnership does not adjust the quoted price for these instruments, even in situations where the Partnership holds a large position and a sale could reasonably impact the quoted price.
Level II
– inputs to the valuation methodology are other than quoted prices in active markets, which are either directly or indirectly observable as of the reporting date. The type of financial instruments in this category includes less liquid and restricted securities listed in active markets, securities traded in other than active markets, government and agency securities, and certain over-the-counter derivatives where the fair value is based on observable inputs.
Level III
– inputs to the valuation methodology are unobservable and significant to overall fair value measurement. The inputs into the determination of fair value require significant management judgment or estimation. Financial instruments that are included in this category include investments in privately-held entities, non-investment grade residual interests in securitizations, collateralized loan obligations, and certain over-the-counter derivatives where the fair value is based on unobservable inputs.
In certain cases, the inputs used to measure fair value may fall into different levels of the fair value hierarchy. In such cases, the determination of which category within the fair value hierarchy is appropriate for any given financial instrument is based on the lowest level of input that is significant to the fair value measurement. The Partnership’s assessment of the significance of a particular input to the fair value measurement in its entirety requires judgment and considers factors specific to the financial instrument.
In certain cases, debt and equity securities are valued on the basis of prices from an orderly transaction between market participants provided by reputable dealers or pricing services. In determining the value of a particular investment, pricing services may use certain information with respect to transactions in such investments, quotations from dealers, pricing matrices, market transactions in comparable investments and various relationships between investments.
19
The Carlyle Group L.P.
Notes to the Condensed Consolidated Financial Statements
(Unaudited)
The following table summarizes the Partnership’s assets and liabilities measured at fair value on a recurring basis by the above fair value hierarchy levels as of
June 30, 2017
:
|
(Dollars in millions)
|
Level I
|
Level II
|
Level III
|
Total
|
|||||||||||
|
Assets
|
|||||||||||||||
|
Investments of Consolidated Funds:
|
|||||||||||||||
|
Equity securities
|
$
|
—
|
|
$
|
—
|
|
$
|
9.7
|
|
$
|
9.7
|
|
|||
|
Bonds
|
—
|
|
—
|
|
395.9
|
|
395.9
|
|
|||||||
|
Loans
|
—
|
|
—
|
|
3,500.1
|
|
3,500.1
|
|
|||||||
|
Other
|
—
|
|
—
|
|
2.0
|
|
2.0
|
|
|||||||
|
—
|
|
—
|
|
3,907.7
|
|
3,907.7
|
|
||||||||
|
Investments in CLOs and other
|
—
|
|
—
|
|
222.9
|
|
222.9
|
|
|||||||
|
Corporate treasury investments
|
|||||||||||||||
|
Bonds
|
—
|
|
80.6
|
|
—
|
|
80.6
|
|
|||||||
|
Commercial paper and other
|
—
|
|
34.8
|
|
—
|
|
34.8
|
|
|||||||
|
—
|
|
115.4
|
|
—
|
|
115.4
|
|
||||||||
|
Foreign currency forward contracts
|
—
|
|
0.7
|
|
—
|
|
0.7
|
|
|||||||
|
Total
|
$
|
—
|
|
$
|
116.1
|
|
$
|
4,130.6
|
|
$
|
4,246.7
|
|
|||
|
Liabilities
|
|||||||||||||||
|
Loans payable of Consolidated Funds
(1)
|
$
|
—
|
|
$
|
—
|
|
$
|
3,721.2
|
|
$
|
3,721.2
|
|
|||
|
Contingent consideration
(2)
|
—
|
|
—
|
|
1.3
|
|
1.3
|
|
|||||||
|
Loans payable of a consolidated real estate VIE
|
—
|
|
—
|
|
72.6
|
|
72.6
|
|
|||||||
|
Foreign currency forward contracts
|
—
|
|
7.4
|
|
—
|
|
7.4
|
|
|||||||
|
Total
|
$
|
—
|
|
$
|
7.4
|
|
$
|
3,795.1
|
|
$
|
3,802.5
|
|
|||
|
(1)
|
Senior and subordinated notes issued by CLO vehicles are classified based on the more observable fair value of the CLO financial assets, less (i) the fair value of any beneficial interests held by the Partnership and (ii) the carrying value of any beneficial interests that represent compensation for services.
|
|
(2)
|
Related to contingent consideration associated with the Partnership's acquisitions, excluding employment-based contingent consideration (see Note 8).
|
20
The Carlyle Group L.P.
Notes to the Condensed Consolidated Financial Statements
(Unaudited)
The following table summarizes the Partnership’s assets and liabilities measured at fair value on a recurring basis by the above fair value hierarchy levels as of
December 31, 2016
:
|
(Dollars in millions)
|
Level I
|
Level II
|
Level III
|
Total
|
|||||||||||
|
Assets
|
|||||||||||||||
|
Investments of Consolidated Funds:
|
|||||||||||||||
|
Equity securities
|
$
|
—
|
|
$
|
—
|
|
$
|
10.3
|
|
$
|
10.3
|
|
|||
|
Bonds
|
—
|
|
—
|
|
396.4
|
|
396.4
|
|
|||||||
|
Loans
|
—
|
|
—
|
|
3,485.6
|
|
3,485.6
|
|
|||||||
|
Other
|
—
|
|
—
|
|
1.4
|
|
1.4
|
|
|||||||
|
—
|
|
—
|
|
3,893.7
|
|
3,893.7
|
|
||||||||
|
Investments in CLOs and other
|
—
|
|
—
|
|
152.6
|
|
152.6
|
|
|||||||
|
Corporate treasury investments
|
|||||||||||||||
|
Bonds
|
—
|
|
91.3
|
|
—
|
|
91.3
|
|
|||||||
|
Commercial paper and other
|
—
|
|
98.9
|
|
—
|
|
98.9
|
|
|||||||
|
—
|
|
190.2
|
|
—
|
|
190.2
|
|
||||||||
|
Foreign currency forward contracts
|
—
|
|
2.5
|
|
—
|
|
2.5
|
|
|||||||
|
Total
|
$
|
—
|
|
$
|
192.7
|
|
$
|
4,046.3
|
|
$
|
4,239.0
|
|
|||
|
Liabilities
|
|||||||||||||||
|
Loans payable of Consolidated Funds
(1)
|
$
|
—
|
|
$
|
—
|
|
$
|
3,866.3
|
|
$
|
3,866.3
|
|
|||
|
Contingent consideration
(2)
|
—
|
|
—
|
|
1.5
|
|
1.5
|
|
|||||||
|
Loans payable of a consolidated real estate VIE
|
—
|
|
—
|
|
79.4
|
|
79.4
|
|
|||||||
|
Foreign currency forward contracts
|
—
|
|
10.0
|
|
—
|
|
10.0
|
|
|||||||
|
Total
|
$
|
—
|
|
$
|
10.0
|
|
$
|
3,947.2
|
|
$
|
3,957.2
|
|
|||
|
(1)
|
Senior and subordinated notes issued by CLO vehicles are classified based on the more observable fair value of the CLO financial assets, less (i) the fair value of any beneficial interests held by the Partnership and (ii) the carrying value of any beneficial interests that represent compensation for services.
|
|
(2)
|
Related to contingent consideration associated with the Partnership's acquisitions, excluding employment-based contingent consideration (see Note 8).
|
There were no transfers from Level II to Level I during the
six months ended June 30, 2017
and
2016
.
Investment professionals with responsibility for the underlying investments are responsible for preparing the investment valuations pursuant to the policies, methodologies and templates prepared by the Partnership’s valuation group, which is a team made up of dedicated valuation professionals reporting to the Partnership’s chief accounting officer. The valuation group is responsible for maintaining the Partnership’s valuation policy and related guidance, templates and systems that are designed to be consistent with the guidance found in ASC 820,
Fair Value Measurement
. These valuations, inputs and preliminary conclusions are reviewed by the fund accounting teams. The valuations are then reviewed and approved by the respective fund valuation subcommittees, which are comprised of the respective fund head(s), segment head, chief financial officer and chief accounting officer, as well as members of the valuation group. The valuation group compiles the aggregate results and significant matters and presents them for review and approval by the global valuation committee, which is comprised of the Partnership’s co-chief executive officers, president and chief operating officer, chief risk officer, chief financial officer, chief accounting officer, deputy chief investment officers for Corporate Private Equity, the business segment heads, and observed by the chief compliance officer, the director of internal audit and the Partnership’s audit committee. Additionally, each quarter a sample of valuations is reviewed by external valuation firms.
In the absence of observable market prices, the Partnership values its investments using valuation methodologies applied on a consistent basis. For some investments little market activity may exist. Management’s determination of fair value is then based on the best information available in the circumstances and may incorporate management’s own assumptions and involves a significant degree of judgment, taking into consideration a combination of internal and external factors, including the appropriate risk adjustments for non-performance and liquidity risks. Investments for which market prices are not observable include private
21
The Carlyle Group L.P.
Notes to the Condensed Consolidated Financial Statements
(Unaudited)
investments in the equity of operating companies and real estate properties, and certain debt positions. The valuation technique for each of these investments is described below:
Private Equity and Real Estate Investments
– The fair values of private equity investments are determined by reference to projected net earnings, earnings before interest, taxes, depreciation and amortization (“EBITDA”), the discounted cash flow method, public market or private transactions, valuations for comparable companies or sales of comparable assets, and other measures which, in many cases, are unaudited at the time received. The methods used to estimate the fair value of real estate investments include the discounted cash flow method and/or capitalization rate (“cap rate”) analysis. Valuations may be derived by reference to observable valuation measures for comparable companies or transactions (e.g., applying a key performance metric of the investment such as EBITDA or net operating income to a relevant valuation multiple or cap rate observed in the range of comparable companies or transactions), adjusted by management for differences between the investment and the referenced comparables, and in some instances by reference to option pricing models or other similar models. Adjustments to observable valuation measures are frequently made upon the initial investment to calibrate the initial investment valuation to industry observable inputs. Such adjustments are made to align the investment to observable industry inputs for differences in size, profitability, projected growth rates, geography and capital structure if applicable. The adjustments are reviewed with each subsequent valuation to assess how the investment has evolved relative to the observable inputs. Additionally, the investment may be subject to certain specific risks and/or development milestones which are also taken into account in the valuation assessment. Option pricing models and similar tools do not currently drive a significant portion of private equity or real estate valuations and are used primarily to value warrants, derivatives, certain restrictions and other atypical investment instruments.
Credit-Oriented Investments
– The fair values of credit-oriented investments (including corporate treasury investments) are generally determined on the basis of prices between market participants provided by reputable dealers or pricing services. In determining the value of a particular investment, pricing services may use certain information with respect to transactions in such investments, quotations from dealers, pricing matrices, market transactions in comparable investments and various relationships between investments. Specifically, for investments in distressed debt and corporate loans and bonds, the fair values are generally determined by valuations of comparable investments. In some instances, the Partnership may utilize other valuation techniques, including the discounted cash flow method.
CLO Investments and CLO Loans Payable
– The Partnership measures the financial liabilities of its consolidated CLOs based on the fair value of the financial assets of its consolidated CLOs, as the Partnership believes the fair value of the financial assets are more observable. The fair values of the CLO loan and bond assets are primarily based on quotations from reputable dealers or relevant pricing services. In situations where valuation quotations are unavailable, the assets are valued based on similar securities, market index changes, and other factors. The Partnership corroborates quotations from pricing services either with other available pricing data or with its own models. Generally, the loan and bond assets of the CLOs are not actively traded and are classified as Level III. The fair values of the CLO structured asset positions are determined based on both discounted cash flow analyses and third party quotes. Those analyses consider the position size, liquidity, current financial condition of the CLOs, the third party financing environment, reinvestment rates, recovery lags, discount rates and default forecasts and are compared to broker quotations from market makers and third party dealers.
The Partnership measures the CLO loan payables held by third party beneficial interest holders on the basis of the fair value of the financial assets of the CLO and the beneficial interests held by the Partnership. The Partnership continues to measure the CLO loans payable that it holds at fair value based on both discounted cash flow analyses and third-party quotes, as described above.
Loans Payable of a Consolidated Real Estate VIE
– The Partnership has elected the fair value option to measure the loans payable of a consolidated real estate VIE at fair value. The fair values of the loans are primarily based on discounted cash flows analyses, which consider the liquidity and current financial condition of the consolidated real estate VIE. These loans are classified as Level III.
Fund Investments
– The Partnership’s investments in external funds are valued based on its proportionate share of the net assets provided by the third party general partners of the underlying fund partnerships based on the most recent available information which typically has a lag of up to
90 days
. The terms of the investments generally preclude the ability to redeem the investment. Distributions from these investments will be received as the underlying assets in the funds are liquidated, the timing of which cannot be readily determined.
22
The Carlyle Group L.P.
Notes to the Condensed Consolidated Financial Statements
(Unaudited)
The changes in financial instruments measured at fair value for which the Partnership has used Level III inputs to determine fair value are as follows (Dollars in millions):
|
Financial Assets
|
|||||||||||||||||||||||
|
Three Months Ended June 30, 2017
|
|||||||||||||||||||||||
|
|
Investments of Consolidated Funds
|
|
|
||||||||||||||||||||
|
|
Equity
securities |
Bonds
|
Loans
|
Other
|
Investments in CLOs and other
|
Total
|
|||||||||||||||||
|
Balance, beginning of period
|
$
|
10.8
|
|
$
|
417.6
|
|
$
|
3,473.2
|
|
$
|
1.5
|
|
$
|
155.9
|
|
$
|
4,059.0
|
|
|||||
|
Purchases
|
—
|
|
50.7
|
|
772.7
|
|
—
|
|
60.8
|
|
884.2
|
|
|||||||||||
|
Sales and distributions
|
(1.6
|
)
|
(99.9
|
)
|
(595.4
|
)
|
0.1
|
|
(1.0
|
)
|
(697.8
|
)
|
|||||||||||
|
Settlements
|
—
|
|
—
|
|
(294.3
|
)
|
—
|
|
—
|
|
(294.3
|
)
|
|||||||||||
|
Realized and unrealized gains (losses), net
|
|||||||||||||||||||||||
|
Included in earnings
|
—
|
|
0.4
|
|
(5.1
|
)
|
0.3
|
|
3.2
|
|
(1.2
|
)
|
|||||||||||
|
Included in other comprehensive income
|
0.5
|
|
27.1
|
|
149.0
|
|
0.1
|
|
4.0
|
|
180.7
|
|
|||||||||||
|
Balance, end of period
|
$
|
9.7
|
|
$
|
395.9
|
|
$
|
3,500.1
|
|
$
|
2.0
|
|
$
|
222.9
|
|
$
|
4,130.6
|
|
|||||
|
Changes in unrealized gains (losses) included in earnings related to financial assets still held at the reporting date
|
$
|
5.0
|
|
$
|
0.7
|
|
$
|
5.8
|
|
$
|
0.4
|
|
$
|
3.2
|
|
$
|
15.1
|
|
|||||
|
Financial Assets
|
|||||||||||||||||||||||
|
Six Months Ended June 30, 2017
|
|||||||||||||||||||||||
|
|
Investments of Consolidated Funds
|
|
|
||||||||||||||||||||
|
|
Equity
securities |
Bonds
|
Loans
|
Other
|
Investments in CLOs and other
|
Total
|
|||||||||||||||||
|
Balance, beginning of period
|
$
|
10.3
|
|
$
|
396.4
|
|
$
|
3,485.6
|
|
$
|
1.4
|
|
$
|
152.6
|
|
$
|
4,046.3
|
|
|||||
|
Purchases
|
—
|
|
116.8
|
|
1,398.1
|
|
—
|
|
60.8
|
|
1,575.7
|
|
|||||||||||
|
Sales and distributions
|
(1.6
|
)
|
(156.3
|
)
|
(1,003.5
|
)
|
0.1
|
|
(3.1
|
)
|
(1,164.4
|
)
|
|||||||||||
|
Settlements
|
—
|
|
—
|
|
(585.4
|
)
|
—
|
|
—
|
|
(585.4
|
)
|
|||||||||||
|
Realized and unrealized gains (losses), net
|
|||||||||||||||||||||||
|
Included in earnings
|
0.3
|
|
5.7
|
|
25.9
|
|
0.4
|
|
6.1
|
|
38.4
|
|
|||||||||||
|
Included in other comprehensive income
|
0.7
|
|
33.3
|
|
179.4
|
|
0.1
|
|
6.5
|
|
220.0
|
|
|||||||||||
|
Balance, end of period
|
$
|
9.7
|
|
$
|
395.9
|
|
$
|
3,500.1
|
|
$
|
2.0
|
|
$
|
222.9
|
|
$
|
4,130.6
|
|
|||||
|
Changes in unrealized gains (losses) included in earnings related to financial assets still held at the reporting date
|
$
|
5.3
|
|
$
|
5.6
|
|
$
|
24.7
|
|
$
|
0.4
|
|
$
|
6.1
|
|
$
|
42.1
|
|
|||||
23
The Carlyle Group L.P.
Notes to the Condensed Consolidated Financial Statements
(Unaudited)
|
Financial Assets
|
|||||||||||||||||||||||||||
|
Three Months Ended June 30, 2016
|
|||||||||||||||||||||||||||
|
|
Investments of Consolidated Funds
|
|
|||||||||||||||||||||||||
|
|
Equity
securities |
Bonds
|
Loans
|
Partnership
and LLC interests |
Other
|
Investments in CLOs and other
|
Total
|
||||||||||||||||||||
|
Balance, beginning of period
|
$
|
11.5
|
|
$
|
331.9
|
|
$
|
2,263.9
|
|
$
|
74.3
|
|
$
|
0.2
|
|
$
|
124.2
|
|
$
|
2,806.0
|
|
||||||
|
Initial consolidation /
deconsolidation of funds |
—
|
|
—
|
|
—
|
|
(74.3
|
)
|
—
|
|
—
|
|
(74.3
|
)
|
|||||||||||||
|
Purchases
|
2.2
|
|
101.1
|
|
886.2
|
|
—
|
|
—
|
|
24.9
|
|
1,014.4
|
|
|||||||||||||
|
Sales and distributions
|
(0.1
|
)
|
(24.8
|
)
|
(68.6
|
)
|
—
|
|
—
|
|
(1.6
|
)
|
(95.1
|
)
|
|||||||||||||
|
Settlements
|
—
|
|
—
|
|
(195.5
|
)
|
—
|
|
—
|
|
—
|
|
(195.5
|
)
|
|||||||||||||
|
Realized and unrealized gains (losses), net
|
|||||||||||||||||||||||||||
|
Included in earnings
|
(1.5
|
)
|
9.8
|
|
85.6
|
|
—
|
|
(0.1
|
)
|
14.2
|
|
108.0
|
|
|||||||||||||
|
Included in other comprehensive income
|
(0.2
|
)
|
(10.2
|
)
|
(38.5
|
)
|
—
|
|
—
|
|
(9.0
|
)
|
(57.9
|
)
|
|||||||||||||
|
Balance, end of period
|
$
|
11.9
|
|
$
|
407.8
|
|
$
|
2,933.1
|
|
$
|
—
|
|
$
|
0.1
|
|
$
|
152.7
|
|
$
|
3,505.6
|
|
||||||
|
Changes in unrealized gains (losses) included in earnings related to financial assets still held at the reporting date
|
$
|
0.1
|
|
$
|
9.4
|
|
$
|
78.2
|
|
$
|
(2.3
|
)
|
$
|
(0.1
|
)
|
$
|
14.2
|
|
$
|
99.5
|
|
||||||
|
Financial Assets
|
|||||||||||||||||||||||||||||||
|
Six Months Ended June 30, 2016
|
|||||||||||||||||||||||||||||||
|
|
Investments of Consolidated Funds
|
|
|
||||||||||||||||||||||||||||
|
|
Equity
securities |
Bonds
|
Loans
|
Partnership
and LLC interests (2) |
Other
|
Investments in CLOs and other
|
Restricted securities of Consolidated Funds
|
Total
|
|||||||||||||||||||||||
|
Balance, beginning of period
|
$
|
575.3
|
|
$
|
1,180.9
|
|
$
|
15,686.7
|
|
$
|
59.6
|
|
$
|
5.0
|
|
$
|
1.4
|
|
$
|
8.7
|
|
$
|
17,517.6
|
|
|||||||
|
Deconsolidation of funds
(1)
|
(562.1
|
)
|
(890.7
|
)
|
(13,506.9
|
)
|
(74.3
|
)
|
(5.0
|
)
|
123.8
|
|
(8.7
|
)
|
(14,923.9
|
)
|
|||||||||||||||
|
Purchases
|
11.1
|
|
149.0
|
|
1,138.0
|
|
12.4
|
|
—
|
|
24.9
|
|
—
|
|
1,335.4
|
|
|||||||||||||||
|
Sales and distributions
|
(5.2
|
)
|
(37.3
|
)
|
(127.9
|
)
|
—
|
|
—
|
|
(4.2
|
)
|
—
|
|
(174.6
|
)
|
|||||||||||||||
|
Settlements
|
—
|
|
—
|
|
(296.2
|
)
|
—
|
|
—
|
|
—
|
|
—
|
|
(296.2
|
)
|
|||||||||||||||
|
Realized and unrealized gains (losses), net
|
|||||||||||||||||||||||||||||||
|
Included in earnings
|
(7.5
|
)
|
1.8
|
|
23.9
|
|
2.3
|
|
0.1
|
|
18.2
|
|
—
|
|
38.8
|
|
|||||||||||||||
|
Included in other comprehensive income
|
0.3
|
|
4.1
|
|
15.5
|
|
—
|
|
—
|
|
(11.4
|
)
|
—
|
|
8.5
|
|
|||||||||||||||
|
Balance, end of period
|
$
|
11.9
|
|
$
|
407.8
|
|
$
|
2,933.1
|
|
$
|
—
|
|
$
|
0.1
|
|
$
|
152.7
|
|
$
|
—
|
|
$
|
3,505.6
|
|
|||||||
|
Changes in unrealized gains (losses) included in earnings related to financial assets still held at the reporting date
|
$
|
(5.6
|
)
|
$
|
1.9
|
|
$
|
22.8
|
|
$
|
—
|
|
$
|
0.3
|
|
$
|
18.2
|
|
$
|
—
|
|
$
|
37.6
|
|
|||||||
|
(1)
|
As a result of the adoption of ASU 2015-2 and the deconsolidation of certain CLOs on January 1, 2016, $
123.8 million
of investments that the Partnership held in those CLOs are no longer eliminated in consolidation and are now included in investments in CLOs and other for the
six months ended June 30, 2016
.
|
|
(2)
|
As a result of the retrospective adoption of ASU 2015-7, the beginning balance of Partnership and LLC interests that are measured at fair value using the NAV per share practical expedient have been revised to reflect their exclusion from the fair value hierarchy.
|
24
The Carlyle Group L.P.
Notes to the Condensed Consolidated Financial Statements
(Unaudited)
|
Financial Liabilities
|
|||||||||||||||
|
Three Months Ended June 30, 2017
|
|||||||||||||||
|
|
Loans Payable
of Consolidated Funds |
Contingent
Consideration |
Loans Payable of
a consolidated real estate VIE |
Total
|
|||||||||||
|
Balance, beginning of period
|
$
|
3,587.5
|
|
$
|
1.5
|
|
$
|
77.8
|
|
$
|
3,666.8
|
|
|||
|
Borrowings
|
1,137.5
|
|
—
|
|
—
|
|
1,137.5
|
|
|||||||
|
Paydowns
|
(1,117.4
|
)
|
(0.4
|
)
|
(6.9
|
)
|
(1,124.7
|
)
|
|||||||
|
Realized and unrealized (gains) losses, net
|
|||||||||||||||
|
Included in earnings
|
(46.4
|
)
|
0.1
|
|
(2.0
|
)
|
(48.3
|
)
|
|||||||
|
Included in other comprehensive income
|
160.0
|
|
0.1
|
|
3.7
|
|
163.8
|
|
|||||||
|
Balance, end of period
|
$
|
3,721.2
|
|
$
|
1.3
|
|
$
|
72.6
|
|
$
|
3,795.1
|
|
|||
|
Changes in unrealized (gains) losses included in earnings related to financial liabilities still held at the reporting date
|
$
|
(42.5
|
)
|
$
|
0.1
|
|
$
|
(2.0
|
)
|
$
|
(44.4
|
)
|
|||
|
Financial Liabilities
|
|||||||||||||||
|
|
Six Months Ended June 30, 2017
|
||||||||||||||
|
|
Loans Payable
of Consolidated Funds |
Contingent
Consideration |
Loans Payable of
a consolidated real estate VIE |
Total
|
|||||||||||
|
Balance, beginning of period
|
$
|
3,866.3
|
|
$
|
1.5
|
|
$
|
79.4
|
|
$
|
3,947.2
|
|
|||
|
Borrowings
|
1,569.0
|
|
—
|
|
—
|
|
1,569.0
|
|
|||||||
|
Paydowns
|
(1,879.4
|
)
|
(0.4
|
)
|
(14.3
|
)
|
(1,894.1
|
)
|
|||||||
|
Realized and unrealized (gains) losses, net
|
|||||||||||||||
|
Included in earnings
|
(28.3
|
)
|
0.1
|
|
3.3
|
|
(24.9
|
)
|
|||||||
|
Included in other comprehensive income
|
193.6
|
|
0.1
|
|
4.2
|
|
197.9
|
|
|||||||
|
Balance, end of period
|
$
|
3,721.2
|
|
$
|
1.3
|
|
$
|
72.6
|
|
$
|
3,795.1
|
|
|||
|
Changes in unrealized (gains) losses included in earnings related to financial liabilities still held at the reporting date
|
$
|
(25.8
|
)
|
$
|
0.1
|
|
$
|
3.3
|
|
$
|
(22.4
|
)
|
|||
25
The Carlyle Group L.P.
Notes to the Condensed Consolidated Financial Statements
(Unaudited)
|
Financial Liabilities
|
|||||||||||||||||||
|
Three Months Ended June 30, 2016
|
|||||||||||||||||||
|
|
Loans Payable
of Consolidated Funds |
Derivative
Instruments of Consolidated Funds |
Contingent
Consideration |
Loans Payable of a consolidated real estate VIE
|
Total
|
||||||||||||||
|
Balance, beginning of period
|
$
|
2,459.0
|
|
$
|
—
|
|
$
|
24.3
|
|
$
|
73.5
|
|
$
|
2,556.8
|
|
||||
|
Initial consolidation of funds
|
379.0
|
|
—
|
|
—
|
|
—
|
|
379.0
|
|
|||||||||
|
Borrowings
|
632.0
|
|
—
|
|
—
|
|
—
|
|
632.0
|
|
|||||||||
|
Paydowns
|
(227.3
|
)
|
—
|
|
—
|
|
(7.5
|
)
|
(234.8
|
)
|
|||||||||
|
Realized and unrealized (gains) losses, net
|
|||||||||||||||||||
|
Included in earnings
|
87.3
|
|
0.3
|
|
0.7
|
|
6.7
|
|
95.0
|
|
|||||||||
|
Included in other comprehensive income
|
(45.3
|
)
|
—
|
|
—
|
|
9.0
|
|
(36.3
|
)
|
|||||||||
|
Balance, end of period
|
$
|
3,284.7
|
|
$
|
0.3
|
|
$
|
25.0
|
|
$
|
81.7
|
|
$
|
3,391.7
|
|
||||
|
Changes in unrealized (gains) losses included in earnings related to financial liabilities still held at the reporting date
|
$
|
88.8
|
|
$
|
0.3
|
|
$
|
0.7
|
|
$
|
6.7
|
|
$
|
96.5
|
|
||||
|
Financial Liabilities
|
|||||||||||||||||||
|
Six Months Ended June 30, 2016
|
|||||||||||||||||||
|
|
Loans Payable
of Consolidated Funds |
Derivative
Instruments of Consolidated Funds |
Contingent
Consideration |
Loans Payable of a consolidated real estate VIE
|
Total
|
||||||||||||||
|
Balance, beginning of period
|
$
|
17,046.7
|
|
$
|
29.1
|
|
$
|
20.8
|
|
$
|
75.4
|
|
$
|
17,172.0
|
|
||||
|
Initial consolidation /
deconsolidation of funds |
(14,221.3
|
)
|
(29.0
|
)
|
—
|
|
—
|
|
(14,250.3
|
)
|
|||||||||
|
Borrowings
|
644.7
|
|
—
|
|
—
|
|
—
|
|
644.7
|
|
|||||||||
|
Paydowns
|
(232.4
|
)
|
—
|
|
(0.3
|
)
|
(16.9
|
)
|
(249.6
|
)
|
|||||||||
|
Realized and unrealized (gains) losses, net
|
|||||||||||||||||||
|
Included in earnings
|
28.0
|
|
0.2
|
|
4.5
|
|
13.8
|
|
46.5
|
|
|||||||||
|
Included in other comprehensive income
|
19.0
|
|
—
|
|
—
|
|
9.4
|
|
28.4
|
|
|||||||||
|
Balance, end of period
|
$
|
3,284.7
|
|
$
|
0.3
|
|
$
|
25.0
|
|
$
|
81.7
|
|
$
|
3,391.7
|
|
||||
|
Changes in unrealized (gains) losses included in earnings related to financial liabilities still held at the reporting date
|
$
|
26.3
|
|
$
|
(0.3
|
)
|
$
|
4.5
|
|
$
|
13.8
|
|
$
|
44.3
|
|
||||
Realized and unrealized gains and losses included in earnings for Level III investments for investments in CLOs and other investments are included in investment income (loss), and such gains and losses for investments of Consolidated Funds and loans payable and derivative instruments of the CLOs are included in net investment gains (losses) of Consolidated Funds in the condensed consolidated statements of operations.
Realized and unrealized gains and losses included in earnings for Level III contingent consideration liabilities are included in other non-operating expense (income), and such gains and losses for loans payable of a consolidated real estate VIE are included in interest and other expenses of a consolidated real estate VIE in the condensed consolidated statement of operations.
Gains and losses included in other comprehensive income for all Level III financial asset and liabilities are included in accumulated other comprehensive loss, non-controlling interests in consolidated entities and non-controlling interests in Carlyle Holdings in the condensed consolidated balance sheets.
26
The Carlyle Group L.P.
Notes to the Condensed Consolidated Financial Statements
(Unaudited)
The following table summarizes quantitative information about the Partnership’s Level III inputs as of
June 30, 2017
:
|
Fair Value at
|
Valuation Technique(s)
|
Unobservable Input(s)
|
Range
(Weighted Average) |
||||||
|
(Dollars in millions)
|
June 30, 2017
|
||||||||
|
Assets
|
|||||||||
|
Investments of Consolidated Funds:
|
|||||||||
|
Equity securities
|
$
|
8.8
|
|
Discounted Cash Flow
|
Discount Rates
|
9% - 10% (9%)
|
|||
|
Exit Cap Rate
|
7% - 10% (7%)
|
||||||||
|
0.9
|
|
Consensus Pricing
|
Indicative Quotes ($ per share)
|
13 - 13 (13)
|
|||||
|
Bonds
|
395.9
|
|
Consensus Pricing
|
Indicative Quotes (% of Par)
|
77 - 110 (101)
|
||||
|
Loans
|
3,500.1
|
|
Consensus Pricing
|
Indicative Quotes (% of Par)
|
49 - 102 (100)
|
||||
|
Other
|
2.0
|
|
Counterparty Pricing
|
Indicative Quotes
(% of Notional Amount) |
8 - 9 (8)
|
||||
|
3,907.7
|
|
||||||||
|
Investments in CLOs and other:
|
|||||||||
|
Senior secured notes
|
181.1
|
|
Discounted Cash Flow with Consensus Pricing
|
Discount Rates
|
1% - 9% (2%)
|
||||
|
Default Rates
|
1% - 3% (2%)
|
||||||||
|
Recovery Rates
|
50% - 70% (60%)
|
||||||||
|
Indicative Quotes (% of Par)
|
91 - 102 (100)
|
||||||||
|
Subordinated notes and preferred shares
|
39.6
|
|
Discounted Cash Flow with Consensus Pricing
|
Discount Rates
|
8% - 10% (9%)
|
||||
|
Default Rates
|
1% - 3% (2%)
|
||||||||
|
Recovery Rates
|
50% - 70% (60%)
|
||||||||
|
Indicative Quotes (% of Par)
|
0 - 100 (92)
|
||||||||
|
Other
|
2.2
|
|
Comparable Multiple
|
LTM EBITDA Multiple
|
5.8x - 5.8x (5.8x)
|
||||
|
Total
|
$
|
4,130.6
|
|
||||||
|
Liabilities
|
|||||||||
|
Loans payable of Consolidated Funds:
|
|||||||||
|
Senior secured notes
(1)
|
$
|
3,544.7
|
|
Other
|
N/A
|
N/A
|
|||
|
Subordinated notes and preferred shares
(1)
|
29.4
|
|
Other
|
N/A
|
N/A
|
||||
|
147.1
|
|
Discounted Cash Flow with Consensus Pricing
|
Discount Rates
|
8% - 10% (9%)
|
|||||
|
Default Rates
|
1% - 3% (2%)
|
||||||||
|
Recovery Rates
|
50% - 70% (60%)
|
||||||||
|
Indicative Quotes (% of Par)
|
9 - 99 (82)
|
||||||||
|
Loans payable of a consolidated real estate VIE
|
72.6
|
|
Discounted Cash Flow
|
Discount to Expected Payment
|
10% - 60% (45%)
|
||||
|
Discount Rate
|
20% - 30% (23%)
|
||||||||
|
Contingent consideration
(2)
|
1.3
|
|
Other
|
N/A
|
N/A
|
||||
|
Total
|
$
|
3,795.1
|
|
||||||
|
(1)
|
Beginning on January 1, 2016, CLO loan payables held by third party beneficial interest holders are measured on the basis of the fair value of the financial assets of the CLO and the beneficial interests held by the Partnership.
|
|
(2)
|
Relates to contingent consideration associated with the Partnership's acquisitions (see Note 8).
|
27
The Carlyle Group L.P.
Notes to the Condensed Consolidated Financial Statements
(Unaudited)
The following table summarizes quantitative information about the Partnership’s Level III inputs as of
December 31, 2016
:
|
Fair Value at
|
Valuation Technique(s)
|
Unobservable Input(s)
|
Range
(Weighted Average) |
||||||
|
(Dollars in millions)
|
December 31, 2016
|
||||||||
|
Assets
|
|||||||||
|
Investments of Consolidated Funds:
|
|||||||||
|
Equity securities
|
$
|
9.6
|
|
Discounted Cash Flow
|
Discount Rates
|
9% - 10% (9%)
|
|||
|
Exit Cap Rate
|
7% - 9% (7%)
|
||||||||
|
0.7
|
|
Consensus Pricing
|
Indicative Quotes ($ per share)
|
10 - 10 (10)
|
|||||
|
Bonds
|
396.4
|
|
Consensus Pricing
|
Indicative Quotes (% of Par)
|
74 - 108 (99)
|
||||
|
Loans
|
3,485.6
|
|
Consensus Pricing
|
Indicative Quotes (% of Par)
|
31 - 102 (99)
|
||||
|
Other
|
1.4
|
|
Counterparty Pricing
|
Indicative Quotes
(% of Notional Amount) |
6 - 8 (7)
|
||||
|
3,893.7
|
|
||||||||
|
Investments in CLOs and other
|
|||||||||
|
Senior secured notes
|
115.9
|
|
Discounted Cash Flow with Consensus Pricing
|
Discount Rate
|
1% - 11% (2%)
|
||||
|
Default Rates
|
1% - 3% (2%)
|
||||||||
|
Recovery Rates
|
50% - 74% (71%)
|
||||||||
|
Indicative Quotes (% of Par)
|
82 - 102 (99)
|
||||||||
|
Subordinated notes and preferred shares
|
35.4
|
|
Discounted Cash Flow with Consensus Pricing
|
Discount Rate
|
9% - 14% (12%)
|
||||
|
Default Rates
|
1% - 10% (2%)
|
||||||||
|
Recovery Rates
|
50% - 74% (64%)
|
||||||||
|
Indicative Quotes (% of Par)
|
2 - 101 (96)
|
||||||||
|
Other
|
1.3
|
|
Comparable Multiple
|
LTM EBITDA Multiple
|
5.7 x - 5.7x (5.7x)
|
||||
|
Total
|
$
|
4,046.3
|
|
||||||
|
Liabilities
|
|||||||||
|
Loans payable of Consolidated Funds:
|
|||||||||
|
Senior secured notes
(1)
|
$
|
3,672.5
|
|
Other
|
N/A
|
N/A
|
|||
|
Subordinated notes and preferred shares
(1)
|
26.9
|
|
Other
|
N/A
|
N/A
|
||||
|
166.9
|
|
Discounted Cash Flow with Consensus Pricing
|
Discount Rates
|
9% - 14% (12%)
|
|||||
|
Default Rates
|
1% - 3% (2%)
|
||||||||
|
Recovery Rates
|
50% - 74% (66%)
|
||||||||
|
Indicative Quotes (% of Par)
|
7 - 90 (68)
|
||||||||
|
Loans payable of a consolidated real estate VIE
|
79.4
|
|
Discounted Cash Flow
|
Discount to Expected Payment
|
10% - 55% (37%)
|
||||
|
Discount Rate
|
20% - 30% (23%)
|
||||||||
|
Contingent consideration
(2)
|
1.5
|
|
Other
|
N/A
|
N/A
|
||||
|
Total
|
$
|
3,947.2
|
|
||||||
|
(1)
|
Beginning on January 1, 2016, CLO loan payables held by third party beneficial interest holders are measured on the basis of the fair value of the financial assets of the CLOs and the beneficial interests held by the Partnership.
|
|
(2)
|
Relates to contingent consideration associated with the Partnership's acquisitions (see Note 8).
|
The significant unobservable inputs used in the fair value measurement of the Partnership’s investments in equity securities include EBITDA multiples, indicative quotes, discount rates and exit cap rates. Significant decreases in EBITDA multiples or indicative quotes in isolation would result in a significantly lower fair value measurement. Significant increases in discount rates or exit cap rates in isolation would result in a significantly lower fair value measurement.
28
The Carlyle Group L.P.
Notes to the Condensed Consolidated Financial Statements
(Unaudited)
The significant unobservable inputs used in the fair value measurement of the Partnership’s investments in bonds and loans are market yields and indicative quotes. Significant increases in market yields in isolation would result in a significantly lower fair value measurement. Significant decreases in indicative quotes in isolation would result in a significantly lower fair value measurement.
The significant unobservable inputs used in the fair value measurement of the Partnership’s investments in CLOs and other investments include EBITDA multiples, discount rates, default rates, recovery rates and indicative quotes. Significant decreases in EBITDA multiples, recovery rates or indicative quotes in isolation would result in a significantly lower fair value measurement. Significant increases in discount rates or default rates in isolation would result in a significantly lower fair value measurement.
The significant unobservable inputs used in the fair value measurement of the Partnership’s loans payable of Consolidated Funds are discount rates, default rates, recovery rates and indicative quotes. Significant increases in discount rates or default rates in isolation would result in a significantly lower fair value measurement, while a significant increase in recovery rates or indicative quotes in isolation would result in a significantly higher fair value.
The significant unobservable inputs used in the fair value measurement of the Partnership’s loans payable of a consolidated real estate VIE are discount to expected payment and discount rate. A significant increase in either of these inputs in isolation would result in a significantly lower fair value measurement.
4. Accrued Performance Fees
The components of accrued performance fees are as follows:
|
|
As of
|
||||||
|
|
June 30, 2017
|
December 31, 2016
|
|||||
|
|
(Dollars in millions)
|
||||||
|
Corporate Private Equity
|
$
|
2,076.5
|
|
$
|
1,375.4
|
|
|
|
Real Assets
|
573.3
|
|
483.4
|
|
|||
|
Global Market Strategies
|
86.3
|
|
68.6
|
|
|||
|
Investment Solutions
|
628.4
|
|
553.7
|
|
|||
|
Total
|
$
|
3,364.5
|
|
$
|
2,481.1
|
|
|
Approximately
29%
of accrued performance fees at
June 30, 2017
are related to Carlyle Partners V, L.P. and Carlyle Partners VI, L.P.,
two
of the Partnership's Corporate Private Equity funds.
Approximately
27%
of accrued performance fees at
December 31, 2016
, are related to Carlyle Partners V, L.P. and Carlyle Asia Partners III, L.P.,
two
of the Partnership’s Corporate Private Equity funds.
Accrued performance fees are shown gross of the Partnership’s accrued performance fee-related compensation (see Note 9), and accrued giveback obligations, which are separately presented in the condensed consolidated balance sheets. The components of the accrued giveback obligations are as follows:
|
|
As of
|
||||||
|
|
June 30, 2017
|
December 31, 2016
|
|||||
|
|
(Dollars in millions)
|
||||||
|
Corporate Private Equity
|
$
|
(4.6
|
)
|
$
|
(3.9
|
)
|
|
|
Real Assets
|
(157.6
|
)
|
(156.9
|
)
|
|||
|
Total
|
$
|
(162.2
|
)
|
$
|
(160.8
|
)
|
|
29
The Carlyle Group L.P.
Notes to the Condensed Consolidated Financial Statements
(Unaudited)
Performance Fees
The performance fees included in revenues are derived from the following segments:
|
|
Three Months Ended June 30,
|
Six Months Ended June 30,
|
|||||||||||||
|
|
2017
|
2016
|
2017
|
2016
|
|||||||||||
|
|
(Dollars in millions)
|
||||||||||||||
|
Corporate Private Equity
|
$
|
419.8
|
|
$
|
69.1
|
|
$
|
987.8
|
|
$
|
96.6
|
|
|||
|
Real Assets
|
81.7
|
|
115.5
|
|
139.5
|
|
217.7
|
|
|||||||
|
Global Market Strategies
|
13.6
|
|
7.4
|
|
33.6
|
|
9.0
|
|
|||||||
|
Investment Solutions
|
28.5
|
|
18.9
|
|
64.3
|
|
32.8
|
|
|||||||
|
Total
|
$
|
543.6
|
|
$
|
210.9
|
|
$
|
1,225.2
|
|
$
|
356.1
|
|
|||
Approximately
62%
, or
$339.0 million
, of performance fees for the
three months ended June 30, 2017
are related to the following funds along with total revenue recognized (total revenue includes performance fees, fund management fees, and investment income):
•
Carlyle Partners V, L.P. (Corporate Private Equity segment) -
$76.8 million
,
•
Carlyle Partners VI, L.P. (Corporate Private Equity segment) -
$240.8 million
, and
•
Carlyle Asia Partners IV, L.P. (Corporate Private Equity segment) -
$98.0 million
.
Approximately
72%
, or
$876.5 million
, of performance fees for the
six months ended June 30, 2017
are related to the following funds along with total revenue recognized (total revenue includes performance fees, fund management fees, and investment income):
•
Carlyle Partners V, L.P. (Corporate Private Equity segment) -
$261.3 million
,
•
Carlyle Partners VI, L.P. (Corporate Private Equity segment) -
$494.5 million
, and
•
Carlyle Asia Partners IV, L.P. (Corporate Private Equity segment) -
$263.1 million
.
Approximately
58%
, or
$122.4 million
, of performance fees for the
three months ended June 30, 2016
are related to the following funds along with total revenue recognized (total revenue includes performance fees, fund management fees, and investment income):
•
Carlyle Beijing Partners, L.P. (Corporate Private Equity segment) -
$39.5 million
,
•
Carlyle Realty Partners V, L.P. (Real Assets segment) -
$54.2 million
, and
•
Carlyle Realty Partners VII, L.P. (Real Assets segment) -
$44.3 million
.
Approximately
76%
, or
$271.1 million
, of performance fees for the
six months ended June 30, 2016
are related to the following funds along with total revenue recognized (total revenue includes performance fees, fund management fees, and investment income):
•
Carlyle Partners V, L.P. (Corporate Private Equity segment) -
$109.7 million
,
•
Carlyle Beijing Partners, L.P. (Corporate Private Equity segment) -
$39.5 million
,
•
Carlyle Realty Partners V, L.P. (Real Assets segment) -
$106.1 million
, and
•
Carlyle Realty Partners VII, L.P. (Real Assets segment) -
$80.6 million
.
30
The Carlyle Group L.P.
Notes to the Condensed Consolidated Financial Statements
(Unaudited)
5. Investments
Investments consist of the following:
|
|
As of
|
||||||
|
|
June 30, 2017
|
December 31, 2016
|
|||||
|
|
(Dollars in millions)
|
||||||
|
Equity method investments, excluding accrued performance fees
|
$
|
1,078.6
|
|
$
|
950.9
|
|
|
|
Investments in CLOs and other
|
223.7
|
|
156.1
|
|
|||
|
Total investments
|
$
|
1,302.3
|
|
$
|
1,107.0
|
|
|
Strategic Investment in NGP
In December 2012, the Partnership entered into an agreement with ECM Capital, L.P. (“ECM”) and Barclays Natural Resource Investments, a division of Barclays Bank PLC (“BNRI”), to make an investment in NGP Management Company, L.L.C. (“NGP Management” and, together with its affiliates, “NGP”), an Irving, Texas-based energy investor. The agreement was amended in March 2017 to further align the interests of the Partnership and NGP. The Partnership’s equity interests in NGP Management entitle the Partnership to an allocation of income equal to
55.0%
of the management fee-related revenues of the NGP entities that serve as the advisors to certain private equity funds, and future interests in the general partners of certain future carry funds advised by NGP that entitle the Partnership to an allocation of income equal to
47.5%
of the carried interest received by such fund general partners.
In consideration for these interests, the Partnership paid an aggregate of
$504.6 million
in cash to ECM and BNRI, and issued
996,572
Carlyle Holdings partnership units to ECM that vest ratably through 2017. In January 2016, the Partnership also paid contingent consideration to BNRI of
$183.0 million
, of which
$63.0 million
was paid in cash and
$120.0 million
was paid by a
six
year promissory note issued by the Partnership (see Note 7). The transaction also included contingent consideration payable to ECM comprised of up to
$45.0 million
in cash (of which
$22.5 million
was paid in March 2017 with the balance payable in January 2018), together with an additional
$15.0 million
in cash, which is payable in January 2018, and
597,944
Carlyle Holdings partnership units that were issued in December 2012 and substantially vested upon the amendment in March 2017. The Partnership has also agreed to issue common units on each of February 1, 2018, 2019, and 2020, with a value of
$10.0 million
per year to an affiliate of NGP Management, and subsequent to 2020, to issue common units on an annual basis with a value not to exceed
$10.0 million
per year based on a prescribed formula, which will vest over a
42
-month period. The Partnership has the right to purchase the remaining equity interests in NGP Management in specific remote situations designed to protect the Partnership's interest.
The Partnership accounts for its investments in NGP under the equity method of accounting. The Partnership recorded its investments in NGP initially at cost, excluding any elements in the transaction that were deemed to be compensatory arrangements to NGP personnel. The Carlyle Holdings partnership units issued in the transaction and the deferred restricted common units (which were granted in 2012 to certain NGP personnel) were deemed to be compensatory arrangements; these elements are recognized as an expense under applicable U.S. GAAP.
31
The Carlyle Group L.P.
Notes to the Condensed Consolidated Financial Statements
(Unaudited)
The Partnership records investment income (loss) for its equity income allocation from NGP management fees and performance fees, and also records its share of any allocated expenses from NGP Management, expenses associated with the compensatory elements of the transaction, and the amortization of the basis differences related to the definitive-lived identifiable intangible assets of NGP Management. The net investment earnings (loss) recognized in the Partnership’s condensed consolidated statements of operations for the
three months and six months ended June 30, 2017
and
2016
were as follows:
|
|
Three Months Ended June 30,
|
Six Months Ended June 30,
|
|||||||||||||
|
|
2017
|
2016
|
2017
|
2016
|
|||||||||||
|
|
(Dollars in millions)
|
||||||||||||||
|
Management fees
|
$
|
20.0
|
|
$
|
20.5
|
|
$
|
37.6
|
|
$
|
41.2
|
|
|||
|
Performance fees
|
19.7
|
|
9.7
|
|
55.3
|
|
9.7
|
|
|||||||
|
Investment income
|
2.2
|
|
5.9
|
|
6.2
|
|
4.4
|
|
|||||||
|
Expenses
|
(9.6
|
)
|
(3.0
|
)
|
(35.6
|
)
|
(6.6
|
)
|
|||||||
|
Amortization of basis differences
|
(2.2
|
)
|
(13.8
|
)
|
(4.3
|
)
|
(27.6
|
)
|
|||||||
|
Net investment income
|
$
|
30.1
|
|
$
|
19.3
|
|
$
|
59.2
|
|
$
|
21.1
|
|
|||
The difference between the Partnership’s remaining carrying value of its investment and its share of the underlying net assets of the investee was
$25.5 million
and
$29.8 million
as of
June 30, 2017
and
December 31, 2016
, respectively; these differences are amortized over a period of
10 years
from the initial investment date. In addition, net investment income for the
six months ended June 30, 2017
includes
$24.1 million
of accelerated expenses (that the Partnership otherwise would have incurred later in the year) as a result of the March 2017 amendment to acknowledge that the performance conditions related to the contingently issuable Carlyle Holdings partnership units had substantially been met ahead of the measurement date.
Equity Method Investments
The Partnership’s equity method investments include its fund investments in Corporate Private Equity, Real Assets, Global Market Strategies, and Investment Solutions, typically as general partner interests, and its strategic investments in NGP (included within Real Assets), which are not consolidated. Investments are related to the following segments:
|
|
As of
|
||||||
|
|
June 30, 2017
|
December 31, 2016
|
|||||
|
|
(Dollars in millions)
|
||||||
|
Corporate Private Equity
|
$
|
324.3
|
|
$
|
282.4
|
|
|
|
Real Assets
|
703.6
|
|
622.8
|
|
|||
|
Global Market Strategies
|
17.0
|
|
20.1
|
|
|||
|
Investment Solutions
|
33.7
|
|
25.6
|
|
|||
|
Total
|
$
|
1,078.6
|
|
$
|
950.9
|
|
|
32
The Carlyle Group L.P.
Notes to the Condensed Consolidated Financial Statements
(Unaudited)
Investment Income (Loss)
The components of investment income (loss) are as follows:
|
|
Three Months Ended June 30,
|
Six Months Ended June 30,
|
|||||||||||||
|
|
2017
|
2016
|
2017
|
2016
|
|||||||||||
|
|
(Dollars in millions)
|
||||||||||||||
|
Income from equity investments
|
$
|
58.9
|
|
$
|
56.8
|
|
$
|
104.3
|
|
$
|
50.4
|
|
|||
|
Income from investments in CLOs and other investments
|
0.1
|
|
8.5
|
|
1.0
|
|
5.0
|
|
|||||||
|
Other investment income
|
—
|
|
—
|
|
—
|
|
0.3
|
|
|||||||
|
Total
|
$
|
59.0
|
|
$
|
65.3
|
|
$
|
105.3
|
|
$
|
55.7
|
|
|||
Carlyle’s income (loss) from its equity method investments is included in investment income (loss) in the condensed consolidated statements of operations and consists of:
|
|
Three Months Ended June 30,
|
Six Months Ended June 30,
|
|||||||||||||
|
|
2017
|
2016
|
2017
|
2016
|
|||||||||||
|
|
(Dollars in millions)
|
||||||||||||||
|
Corporate Private Equity
|
$
|
22.0
|
|
$
|
20.8
|
|
$
|
29.6
|
|
$
|
18.5
|
|
|||
|
Real Assets
|
36.6
|
|
35.6
|
|
71.6
|
|
37.4
|
|
|||||||
|
Global Market Strategies
|
(0.7
|
)
|
(0.1
|
)
|
0.6
|
|
(5.0
|
)
|
|||||||
|
Investment Solutions
|
1.0
|
|
0.5
|
|
2.5
|
|
(0.5
|
)
|
|||||||
|
Total
|
$
|
58.9
|
|
$
|
56.8
|
|
$
|
104.3
|
|
$
|
50.4
|
|
|||
Investments in CLOs and Other Investments
Investments in CLOs and other investments as of
June 30, 2017
and
December 31, 2016
primarily consisted of
$223.7 million
and
$156.1 million
, respectively, of investments in CLO senior and subordinated notes, derivative instruments, and corporate mezzanine securities and bonds.
Investments of Consolidated Funds
The Partnership consolidates the financial positions and results of operations of certain CLOs in which it is the primary beneficiary. During the
six months ended June 30, 2017
, the Partnership formed
three
CLOs for which the Partnership is the primary beneficiary of
one
of those CLOs. As of June 30, 2017, the total assets of this CLO included in the Partnership's condensed consolidated financial statements were approximately
$653.5 million
.
There were no individual investments with a fair value greater than
five
percent of the Partnership’s total assets for any period presented.
Interest and Other Income of Consolidated Funds
The components of interest and other income of Consolidated Funds are as follows:
|
|
Three Months Ended June 30,
|
Six Months Ended June 30,
|
|||||||||||||
|
|
2017
|
2016
|
2017
|
2016
|
|||||||||||
|
|
(Dollars in millions)
|
||||||||||||||
|
Interest income from investments
|
$
|
41.8
|
|
$
|
33.9
|
|
$
|
82.3
|
|
$
|
61.6
|
|
|||
|
Other income
|
3.2
|
|
2.0
|
|
5.6
|
|
3.2
|
|
|||||||
|
Total
|
$
|
45.0
|
|
$
|
35.9
|
|
$
|
87.9
|
|
$
|
64.8
|
|
|||
33
The Carlyle Group L.P.
Notes to the Condensed Consolidated Financial Statements
(Unaudited)
Net Investment Gains (Losses) of Consolidated Funds
Net investment gains (losses) of Consolidated Funds include net realized gains (losses) from sales of investments and unrealized gains (losses) resulting from changes in fair value of the Consolidated Funds’ investments. The components of net investment gains (losses) of Consolidated Funds are as follows:
|
|
Three Months Ended June 30,
|
Six Months Ended June 30,
|
|||||||||||||
|
|
2017
|
2016
|
2017
|
2016
|
|||||||||||
|
|
(Dollars in millions)
|
||||||||||||||
|
Gains (losses) from investments of Consolidated Funds
|
$
|
(5.6
|
)
|
$
|
94.2
|
|
$
|
29.6
|
|
$
|
26.4
|
|
|||
|
Gains (losses) from liabilities of CLOs
|
46.3
|
|
(87.3
|
)
|
28.2
|
|
(27.9
|
)
|
|||||||
|
Losses on other assets of CLOs
|
—
|
|
(0.2
|
)
|
—
|
|
(0.2
|
)
|
|||||||
|
Total
|
$
|
40.7
|
|
$
|
6.7
|
|
$
|
57.8
|
|
$
|
(1.7
|
)
|
|||
The following table presents realized and unrealized gains (losses) earned from investments of the Consolidated Funds:
|
|
Three Months Ended June 30,
|
Six Months Ended June 30,
|
|||||||||||||
|
|
2017
|
2016
|
2017
|
2016
|
|||||||||||
|
|
(Dollars in millions)
|
||||||||||||||
|
Realized losses
|
$
|
(3.7
|
)
|
$
|
(3.4
|
)
|
$
|
(5.8
|
)
|
$
|
(9.6
|
)
|
|||
|
Net change in unrealized gains (losses)
|
(1.9
|
)
|
97.6
|
|
35.4
|
|
36.0
|
|
|||||||
|
Total
|
$
|
(5.6
|
)
|
$
|
94.2
|
|
$
|
29.6
|
|
$
|
26.4
|
|
|||
6. Intangible Assets and Goodwill
The following table summarizes the carrying amount of intangible assets as of
June 30, 2017
and
December 31, 2016
:
|
|
As of
|
||||||
|
|
June 30, 2017
|
December 31, 2016
|
|||||
|
|
(Dollars in millions)
|
||||||
|
Acquired contractual rights
(1)
|
$
|
78.4
|
|
$
|
74.1
|
|
|
|
Acquired trademarks
(1)
|
1.1
|
|
1.0
|
|
|||
|
Accumulated amortization
|
(50.7
|
)
|
(43.2
|
)
|
|||
|
Finite-lived intangible assets, net
|
28.8
|
|
31.9
|
|
|||
|
Goodwill
(1)
|
10.7
|
|
10.1
|
|
|||
|
Intangible assets, net
|
$
|
39.5
|
|
$
|
42.0
|
|
|
(1) Changes in the carrying amount of acquired contractual rights, acquired trademarks, and goodwill are due to foreign currency translation.
As of
June 30, 2017
, all of the remaining finite-lived intangible assets, net, and goodwill are associated with the Partnership's Investment Solutions segment.
As discussed in Note 2, the Partnership reviews its intangible assets for impairment whenever events or changes in circumstances indicate that the carrying amount of the asset may not be recoverable.
No
impairment losses were recorded during the
six months ended June 30, 2017 and 2016
.
Intangible asset amortization expense was
$2.5 million
and
$8.9 million
during the
three months ended June 30, 2017 and 2016
, respectively, and
$5.0 million
and
$19.3 million
during the
six months ended June 30, 2017 and 2016
, respectively, and is included in general, administrative, and other expenses in the unaudited condensed consolidated statements of operations.
34
The Carlyle Group L.P.
Notes to the Condensed Consolidated Financial Statements
(Unaudited)
The following table summarizes the expected amortization expense for July 1,
2017
through December 31,
2021
(Dollars in millions):
|
2017
|
$
|
5.0
|
|
|
2018
|
9.5
|
|
|
|
2019
|
5.7
|
|
|
|
2020
|
5.7
|
|
|
|
2021
|
2.9
|
|
|
|
$
|
28.8
|
|
|
7. Borrowings
The Partnership borrows and enters into credit agreements for its general operating and investment purposes. The Partnership’s debt obligations consist of the following (Dollars in millions):
|
|
June 30, 2017
|
December 31, 2016
|
|||||||||||||
|
|
Borrowing
Outstanding |
Carrying
Value |
Borrowing
Outstanding |
Carrying
Value |
|||||||||||
|
Senior Credit Facility Term Loan Due 5/05/2020
|
$
|
25.0
|
|
$
|
24.8
|
|
$
|
25.0
|
|
$
|
24.7
|
|
|||
|
CLO Term Loans
(See below)
|
151.5
|
|
151.5
|
|
33.8
|
|
33.8
|
|
|||||||
|
3.875% Senior Notes Due 2/01/2023
|
500.0
|
|
497.4
|
|
500.0
|
|
497.2
|
|
|||||||
|
5.625% Senior Notes Due 3/30/2043
|
600.0
|
|
600.7
|
|
600.0
|
|
600.7
|
|
|||||||
|
Promissory Note Due 1/01/2022
|
108.8
|
|
108.8
|
|
108.8
|
|
108.8
|
|
|||||||
|
Promissory Notes Due 7/15/2019
|
53.9
|
|
53.9
|
|
—
|
|
—
|
|
|||||||
|
Total debt obligations
|
$
|
1,439.2
|
|
$
|
1,437.1
|
|
$
|
1,267.6
|
|
$
|
1,265.2
|
|
|||
Senior Credit Facility
As of
June 30, 2017
, the senior credit facility included
$25.0 million
in a term loan and
$750.0 million
in a revolving credit facility. As of
June 30, 2017
, the term loan and revolving credit facility were scheduled to mature on
May 5, 2020
. Principal amounts outstanding under the term loan and revolving credit facility accrue interest, at the option of the borrowers, either (a) at an alternate base rate plus an applicable margin not to exceed
0.75%
, or (b) at LIBOR plus an applicable margin not to exceed
1.75%
(at
June 30, 2017
, the interest rate was
2.18%
). There was
no
amount outstanding under the revolving credit facility at
June 30, 2017
. Interest expense under the senior credit facility was not significant for the
three months and six months ended June 30, 2017
and
2016
. The fair value of the outstanding balances of the term loan and revolving credit facility at
June 30, 2017
and
December 31, 2016
approximated par value based on current market rates for similar debt instruments and are classified as Level III within the fair value hierarchy.
On April 6, 2017, the Partnership borrowed
$250.0 million
against the
$750.0 million
revolving credit facility. This amount was repaid in full on June 2, 2017.
35
The Carlyle Group L.P.
Notes to the Condensed Consolidated Financial Statements
(Unaudited)
CLO Term Loans
For certain of our CLOs, the Partnership finances a portion of its investment in the CLOs through the proceeds received from term loans with financial institutions. The Partnership's outstanding CLO term loans consist of the following (Dollars in millions):
|
Formation Date
|
Borrowing Outstanding
June 30, 2017 |
Borrowing Outstanding
December 31, 2016 |
Maturity Date (2)
|
Interest Rate as of
June 30, 2017 |
|||||||||||
|
October 3, 2013
|
$
|
14.4
|
|
(1)
|
$
|
13.2
|
|
(1)
|
September 28, 2018
|
1.75%
|
(3)
|
||||
|
June 7, 2016
|
20.6
|
|
20.6
|
|
July 15, 2027
|
2.96%
|
(4)
|
||||||||
|
April 19, 2017
|
22.8
|
|
—
|
|
April 22, 2031
|
3.09%
|
(5)
|
||||||||
|
June 28, 2017
|
23.2
|
|
—
|
|
July 22, 2031
|
3.25%
|
(6)
|
||||||||
|
February 28, 2017
|
70.5
|
|
—
|
|
September 21, 2029
|
2.33%
|
(7)
|
||||||||
|
$
|
151.5
|
|
$
|
33.8
|
|
||||||||||
(1) Original borrowing of
€12.6 million
.
(2) Maturity date is earlier of date indicated or the date that the CLO is dissolved.
(3) Incurs interest at EURIBOR plus
1.75%
.
(4) Incurs interest at the weighted average rate of the underlying senior notes. Interest income on the underlying collateral approximated the amount of interest expense and was not significant for the
three months and six months ended June 30, 2017
and
2016
.
(5) Incurs interest at LIBOR plus
1.932%
.
(6) Incurs interest at LIBOR plus
1.923%
.
(7) Original borrowing of
€61.8 million
; incurs interest at EURIBOR plus applicable margins as defined in agreement.
The CLO term loans are secured by the Partnership's investments in the respective CLO, have a general unsecured interest in the Carlyle entity that manages the CLO, and do not have recourse to any other Carlyle entity. Interest expense on these term loans was not significant for the
three months and six months ended June 30, 2017
and
2016
. The fair value of the outstanding balance of the CLO term loans at
June 30, 2017
approximated par value based on current market rates for similar debt instruments. These CLO term loans are classified as Level III within the fair value hierarchy.
Master Credit Agreement - Term Loans
In January 2017, the Partnership entered into a master credit agreement with a financial institution under which the financial institution expects to provide term loans to the Partnership for the purchase of eligible interests in CLOs. This master credit agreement is available to the Partnership to purchase up to
$100 million
of eligible interests in up to five CLOs. This agreement will terminate at the earlier of the last closing of the fifth CLO term loan under this agreement and January 2020. Any term loan to be issued under this master credit agreement will be secured by the Partnership’s investment in the respective CLO as well as any senior management fee and subordinated management fee payable by each CLO. Any term loan will bear interest at LIBOR plus a weighted average spread over LIBOR on the CLO notes and an applicable margin. Interest will be due quarterly. As of
June 30, 2017
, the following term loans were outstanding under this master credit agreement:
•
$22.8 million
issued on April 19, 2017, due April 22, 2031, with an interest rate of
3.09%
as of
June 30, 2017
.
•
$23.2 million
issued on June 28, 2017, due July 22, 2031, with an interest rate of
3.25%
as of
June 30, 2017
.
European CLO Financing - February 28, 2017
On February 28, 2017, a subsidiary of the Partnership entered into a financing agreement with several financial institutions under which these financial institutions provided a
€61.8 million
term loan (
$70.5 million
at
June 30, 2017
) to the Partnership. This term loan is secured by the Partnership’s investments in the retained notes in certain European CLOs that were formed in 2014 and 2015. This term loan will mature on the earlier of September 21, 2029 or the date that the certain European CLO retained notes have been redeemed. The Partnership may prepay the term loan in whole or in part at any time
36
The Carlyle Group L.P.
Notes to the Condensed Consolidated Financial Statements
(Unaudited)
after the third anniversary of the date of issuance without penalty. Prepayment of the term loan within the first three years will incur a penalty based on the prepayment amount. Interest on this term loan accrues at EURIBOR plus applicable margins (
2.33%
at
June 30, 2017
).
3.875%
Senior Notes
In January 2013, an indirect finance subsidiary of the Partnership issued
$500.0 million
in aggregate principal amount of
3.875%
senior notes due
February 1, 2023
at
99.966%
of par. Interest is payable semi-annually on February 1 and August 1, beginning
August 1, 2013
. This subsidiary may redeem the senior notes in whole at any time or in part from time to time at a price equal to the greater of
100%
of the principal amount of the notes being redeemed and the sum of the present values of the remaining scheduled payments of principal and interest on any notes being redeemed discounted to the redemption date on a semi-annual basis at the Treasury rate plus
30 basis points
plus accrued and unpaid interest on the principal amounts being redeemed to the redemption date.
Interest expense on the notes was
$4.9 million
for both the
three months ended June 30, 2017 and 2016
, and
$9.9 million
for both the
six months ended June 30, 2017 and 2016
. At
June 30, 2017
and
December 31, 2016
, the fair value of the notes, including accrued interest, was approximately
$522.1 million
and
$512.8 million
, respectively, based on indicative quotes. The notes are classified as Level II within the fair value hierarchy.
5.625%
Senior Notes
In March 2013, an indirect finance subsidiary of the Partnership issued
$400.0 million
in aggregate principal amount of
5.625%
senior notes due March 30, 2043 at
99.583%
of par. Interest is payable semi-annually on March 30 and September 30, beginning
September 30, 2013
. This subsidiary may redeem the senior notes in whole at any time or in part from time to time at a price equal to the greater of
100%
of the principal amount of the notes being redeemed and the sum of the present values of the remaining scheduled payments of principal and interest on any notes being redeemed discounted to the redemption date on a semi-annual basis at the Treasury rate plus
40 basis points
plus accrued and unpaid interest on the principal amounts being redeemed to the redemption date.
In March 2014, an indirect finance subsidiary of the Partnership issued
$200.0 million
of
5.625%
Senior Notes due
March 30, 2043
at
104.315%
of par. These notes were issued as additional
5.625%
Senior Notes and are treated as a single class with the already outstanding
$400.0 million
aggregate principal amount of these senior notes.
Interest expense on the notes was
$8.5 million
for both the
three months ended June 30, 2017 and 2016
and
$16.9 million
for both the
six months ended June 30, 2017 and 2016
. At
June 30, 2017
and
December 31, 2016
, the fair value of the notes, including accrued interest, was approximately
$692.3 million
and
$603.1 million
, respectively, based on indicative quotes. The notes are classified as Level II within the fair value hierarchy.
Promissory Notes
Promissory Note Due January 1, 2022
On January 1, 2016, the Partnership issued a $
120.0 million
promissory note to BNRI as a result of a contingent consideration arrangement entered into in 2012 between the Partnership and BNRI as part of the Partnership's strategic investment in NGP (see Note 5). Interest on the promissory note accrues at the three month LIBOR plus
2.50%
(
3.80%
at
June 30, 2017
). The Partnership may prepay the promissory note in whole or in part at any time without penalty. The promissory note is scheduled to mature on January 1, 2022. Interest expense on the promissory note was not significant for the
three months and six months ended June 30, 2017
and
2016
. The fair value of the outstanding balance of the promissory note at
June 30, 2017
and
December 31, 2016
approximated par value based on current market rates for similar debt instruments and is classified as Level III within the fair value hierarchy.
In December 2016, the Partnership repurchased
$11.2 million
of the promissory note for a purchase price of approximately
$9.0 million
. Approximately
$108.8 million
of the promissory note is outstanding at
June 30, 2017
and
December 31, 2016
.
37
The Carlyle Group L.P.
Notes to the Condensed Consolidated Financial Statements
(Unaudited)
Promissory Notes Due July 15, 2019
In June 2017, as part of the settlement with investors in two commodities investment vehicles managed by an affiliate of the Partnership (disclosed in Note 10), the Partnership issued a series of promissory notes, aggregating to
$53.9 million
, to the investors of these commodities investment vehicles. Interest on these promissory notes accrues at the three month LIBOR plus
2%
(
3.30%
at
June 30, 2017
). The Partnership may prepay these promissory notes in whole or in part at any time without penalty. These promissory notes are scheduled to mature on July 15, 2019. Interest expense on these promissory notes was not significant for the
three months ended June 30, 2017
. The fair value of the outstanding balance of these promissory notes at
June 30, 2017
approximated par value based on current market rates for similar debt instruments and is classified as Level III within the fair value hierarchy.
The Partnership is subject to various financial covenants under its loan agreements including, among other items, maintenance of a minimum amount of management fee-earning assets. The Partnership is also subject to various non-financial covenants under its loan agreements and the indentures governing its senior notes. The Partnership was in compliance with all financial and non-financial covenants under its various loan agreements as of
June 30, 2017
.
The consolidated real estate VIE was not in compliance with the debt covenants related to substantially all of its loans payable as of
June 30, 2017
(see Note 16); such violations do not cause a default or event of default under the Partnership’s senior credit facility, CLO term loans, senior notes, or the loans payable of Consolidated Funds.
Loans Payable of Consolidated Funds
Loans payable of Consolidated Funds primarily represent amounts due to holders of debt securities issued by the CLOs. Several of the CLOs issued preferred shares representing the most subordinated interest, however these tranches are mandatorily redeemable upon the maturity dates of the senior secured loans payable, and as a result have been classified as liabilities and are included in loans payable of Consolidated Funds in the condensed consolidated balance sheets.
As of
June 30, 2017
and
December 31, 2016
, the following borrowings were outstanding, which includes preferred shares classified as liabilities (Dollars in millions):
|
|
As of June 30, 2017
|
|||||||||||||
|
|
Borrowing
Outstanding |
Fair Value
|
Weighted
Average Interest Rate |
|
Weighted
Average Remaining Maturity in Years |
|||||||||
|
Senior secured notes
|
$
|
3,539.7
|
|
$
|
3,544.7
|
|
2.22
|
%
|
11.73
|
|||||
|
Subordinated notes, preferred shares and other
|
185.4
|
|
176.5
|
|
N/A
|
|
(a)
|
9.63
|
||||||
|
Total
|
$
|
3,725.1
|
|
$
|
3,721.2
|
|
||||||||
|
|
As of December 31, 2016
|
|||||||||||||
|
|
Borrowing
Outstanding |
Fair Value
|
Weighted
Average Interest Rate |
|
Weighted
Average Remaining Maturity in Years |
|||||||||
|
Senior secured notes
|
$
|
3,681.0
|
|
$
|
3,672.5
|
|
2.45
|
%
|
10.22
|
|||||
|
Subordinated notes, preferred shares and other
|
195.6
|
|
193.8
|
|
N/A
|
|
(a)
|
9.26
|
||||||
|
Total
|
$
|
3,876.6
|
|
$
|
3,866.3
|
|
||||||||
|
(a)
|
The subordinated notes and preferred shares do not have contractual interest rates, but instead receive distributions from the excess cash flows of the CLOs.
|
38
The Carlyle Group L.P.
Notes to the Condensed Consolidated Financial Statements
(Unaudited)
Loans payable of the CLOs are collateralized by the assets held by the CLOs and the assets of one CLO may not be used to satisfy the liabilities of another. This collateral consisted of cash and cash equivalents, corporate loans, corporate bonds and other securities. As of
June 30, 2017
and
December 31, 2016
, the fair value of the CLO assets was
$4.4 billion
and
$4.7 billion
, respectively.
8. Contingent Consideration
The Partnership has contingent cash and other consideration obligations related to its business acquisitions and strategic investments. The changes in the contingent consideration liabilities are as follows:
|
|
Contingent cash and other consideration payable to non-Carlyle personnel
|
||||||
|
|
Rollforward For The Three Months Ended June 30, 2017
|
Rollforward For The Six Months Ended June 30, 2017
|
|||||
|
(Dollars in millions)
|
|||||||
|
Balance, beginning of period
|
$
|
29.6
|
|
$
|
37.6
|
|
|
|
Change in carrying value
|
3.3
|
|
17.8
|
|
|||
|
Payments
|
(0.4
|
)
|
(22.9
|
)
|
|||
|
Balance, end of period
|
$
|
32.5
|
|
$
|
32.5
|
|
|
The fair value of contingent cash and other consideration payable to non-Carlyle personnel is included in accounts payable, accrued expenses and other liabilities, or due to affiliates for amounts payable to NGP, in the accompanying condensed consolidated balance sheets. Changes in the fair value of this contingent consideration are recorded in other non-operating expense (income), or investment income in the case of amounts payable to NGP, in the condensed consolidated statements of operations.
The fair values of the performance-based contingent cash consideration for business acquisitions were based on probability-weighted discounted cash flow models. These fair value measurements are based on significant inputs not observable in the market and thus represent Level III measurements as defined in the accounting guidance for fair value measurement. Refer to Note 3 for additional disclosures related to the fair value of these instruments as of
June 30, 2017
and
December 31, 2016
.
Based on the terms of the underlying contracts, the maximum amounts that could be paid from contingent cash obligations associated with business acquisitions and the strategic investment in NGP Management as of
June 30, 2017
is $
49.1 million
versus the liabilities recognized on the balance sheet of $
32.5 million
. Based on the historical and projected performance of the Partnership's acquisitions, the Partnership believes that approximately $
10.3 million
of the maximum amounts of the contingent cash obligations are unlikely to be paid.
9. Accrued Compensation and Benefits
Accrued compensation and benefits consist of the following:
|
|
As of
|
||||||
|
|
June 30, 2017
|
December 31, 2016
|
|||||
|
|
(Dollars in millions)
|
||||||
|
Accrued performance fee-related compensation
|
$
|
1,725.5
|
|
$
|
1,307.4
|
|
|
|
Accrued bonuses
|
164.5
|
|
177.2
|
|
|||
|
Other
|
127.8
|
|
177.2
|
|
|||
|
Total
|
$
|
2,017.8
|
|
$
|
1,661.8
|
|
|
39
The Carlyle Group L.P.
Notes to the Condensed Consolidated Financial Statements
(Unaudited)
10. Commitments and Contingencies
Capital Commitments
The Partnership and its unconsolidated affiliates have unfunded commitments to entities within the following segments as of
June 30, 2017
(Dollars in millions):
|
|
Unfunded
Commitments |
||
|
Corporate Private Equity
|
$
|
1,385.6
|
|
|
Real Assets
|
789.4
|
|
|
|
Global Market Strategies
|
538.5
|
|
|
|
Investment Solutions
|
148.9
|
|
|
|
Total
|
$
|
2,862.4
|
|
Of the
$2.9 billion
of unfunded commitments, approximately
$2.5 billion
is subscribed individually by senior Carlyle professionals, advisors and other professionals, with the balance funded directly by the Partnership. In addition to these unfunded commitments, the Partnership may from time to time exercise its right to purchase additional interests in its investment funds that become available in the ordinary course of their operations.
Guaranteed Loans
On August 4, 2001, the Partnership entered into an agreement with a financial institution pursuant to which the Partnership is the guarantor on a credit facility for eligible employees investing in Carlyle sponsored funds. This credit facility renews on an annual basis, allowing for annual incremental borrowings up to an aggregate of
$11.3 million
, and accrues interest at the lower of the prime rate, as defined, or
three-month LIBOR
plus
3%
, reset quarterly (
4.15%
weighted-average rate at
June 30, 2017
). As of
June 30, 2017
and
December 31, 2016
, approximately
$11.0 million
and
$9.6 million
, respectively, were outstanding under the credit facility and payable by the employees. The amount funded by the Partnership under this guarantee as of
June 30, 2017
was not material. The Partnership believes the likelihood of any material funding under this guarantee to be remote. The fair value of this guarantee is not significant to the consolidated financial statements.
Contingent Obligations (Giveback)
A liability for potential repayment of previously received performance fees of
$162.2 million
at
June 30, 2017
, is shown as accrued giveback obligations in the condensed consolidated balance sheets, representing the giveback obligation that would need to be paid if the funds were liquidated at their current fair values at
June 30, 2017
. However, the ultimate giveback obligation, if any, generally is not paid until the end of a fund’s life or earlier if the giveback becomes fixed and early payment is agreed upon by the fund's partners (see Note 2). The Partnership has recorded
$3.0 million
and
$5.6 million
of unbilled receivables from former and current employees and senior Carlyle professionals as of
June 30, 2017
and
December 31, 2016
, respectively, related to giveback obligations, which are included in due from affiliates and other receivables, net in the accompanying condensed consolidated balance sheets. The receivables are collateralized by investments made by individual senior Carlyle professionals and employees in Carlyle-sponsored funds. In addition,
$310.3 million
and
$356.9 million
have been withheld from distributions of carried interest to senior Carlyle professionals and employees for potential giveback obligations as of
June 30, 2017
and
December 31, 2016
, respectively. Such amounts are held on behalf of the respective current and former Carlyle employees to satisfy any givebacks they may owe and are held by entities not included in the accompanying condensed consolidated balance sheets. Current and former senior Carlyle professionals and employees are personally responsible for their giveback obligations. As of
June 30, 2017
, approximately $
103.4 million
of the Partnership's accrued giveback obligation is the responsibility of various current and former senior Carlyle professionals and other limited partners of the Carlyle Holdings partnerships, and the net accrued giveback obligation attributable to Carlyle Holdings is $
58.8 million
.
If, at
June 30, 2017
, all of the investments held by the Partnership’s Funds were deemed worthless, a possibility that management views as remote, the amount of realized and distributed carried interest subject to potential giveback would be
$1.1 billion
, on an after-tax basis where applicable.
40
The Carlyle Group L.P.
Notes to the Condensed Consolidated Financial Statements
(Unaudited)
Leases
The Partnership leases office space in various countries around the world and maintains its headquarters in Washington, D.C., where it leases its primary office space under a non-cancelable lease agreement expiring on
July 31, 2026
. Office leases in other locations expire in various years from 2017 through 2032. These leases are accounted for as operating leases. Rent expense was approximately
$14.1 million
and
$13.8 million
for the
three months ended June 30, 2017 and 2016
, respectively, and
$28.2 million
and
$27.4 million
for the
six months ended June 30, 2017 and 2016
, respectively, and is included in general, administrative and other expenses in the condensed consolidated statements of operations.
The future minimum commitments for the leases are as follows (Dollars in millions):
|
2017
|
$
|
26.3
|
|
|
2018
|
49.1
|
|
|
|
2019
|
47.7
|
|
|
|
2020
|
47.1
|
|
|
|
2021
|
42.7
|
|
|
|
Thereafter
|
332.0
|
|
|
|
$
|
544.9
|
|
|
The Partnership records contractual escalating minimum lease payments on a straight-line basis over the term of the lease. Deferred rent payable under the leases was
$54.6 million
and
$60.3 million
as of
June 30, 2017
and
December 31, 2016
, respectively, and is included in accounts payable, accrued expenses and other liabilities in the accompanying condensed consolidated balance sheets.
Legal Matters
In the ordinary course of business, the Partnership is a party to litigation, investigations, inquiries, employment-related matters, disputes and other potential claims. Certain of these matters are described below. The Partnership is not currently able to estimate the reasonably possible amount of loss or range of loss, in excess of amounts accrued, for the matters that have not been resolved. The Partnership does not believe it is probable that the outcome of any existing litigation, investigations, disputes or other potential claims will materially affect the Partnership or these financial statements in excess of amounts accrued. The Partnership believes that the claims asserted against the Partnership in the pending litigation matters described below are without merit and intends to vigorously contest such allegations.
Along with many other companies and individuals in the financial sector, the Partnership and Carlyle Mezzanine Partners, L.P. (“CMP”) are named as defendants in
Foy v. Austin Capital
, a case filed in June 2009, pending in the State of New Mexico’s First Judicial District Court, County of Santa Fe, which purports to be a
qui tam
suit on behalf of the State of New Mexico under the state Fraud Against Taxpayers Act (“FATA”). The suit alleges that investment decisions by New Mexico public investment funds were improperly influenced by campaign contributions and payments to politically connected placement agents. The plaintiffs seek, among other things, actual damages for lost income, rescission of the investment transactions described in the complaint and disgorgement of all fees received. In June 2017, the Court granted a motion by the New Mexico Attorney General to dismiss the lawsuit so that the Attorney General can pursue its own recovery from the defendants in the action. That ruling may be appealed by the
qui tam
plaintiffs
.
Carlyle Capital Corporation Limited (“CCC”) was a fund sponsored by the Partnership that invested in AAA-rated residential mortgage backed securities on a highly leveraged basis. In March of 2008, amidst turmoil throughout the mortgage markets and money markets, CCC filed for insolvency protection in Guernsey. The Guernsey liquidators who took control of CCC in March 2008 filed a suit on July 7, 2010 against the Partnership, certain of its affiliates and the former directors of CCC in the Royal Court of Guernsey seeking more than
$1.0 billion
in damages in a case styled
Carlyle Capital Corporation Limited v. Conway et al
. The Guernsey liquidators allege that the Partnership and the CCC board of directors were negligent, grossly negligent or willfully mismanaged the CCC investment program and breached certain fiduciary duties allegedly owed to CCC and its shareholders. The liquidators further allege (among other things) that the directors and the Partnership put the interests of the Partnership ahead of the interests of CCC and its shareholders and gave priority to preserving and enhancing the Partnership’s reputation and its “brand” over the best interests of CCC. The trial, in the Royal Court of Guernsey, began in June 2016 and ended in December 2016. The Court has not rendered its decision.
41
The Carlyle Group L.P.
Notes to the Condensed Consolidated Financial Statements
(Unaudited)
The Partnership currently is and expects to continue to be, from time to time, subject to examinations, formal and informal inquiries and investigations by various U.S. and non-U.S. governmental and regulatory agencies, including but not limited to, the SEC, Department of Justice, state attorneys general, FINRA, National Futures Association and the U.K. Financial Conduct Authority. The Partnership routinely cooperates with such examinations, inquiries and investigations, and they may result in the commencement of civil, criminal, or administrative or other proceedings against the Partnership or its personnel. For example, among various other requests for information, the SEC has requested information about: (i) the Partnership's historical practices relating to the acceleration of monitoring fees received from certain of the Partnership's funds' portfolio companies, (ii) the Partnership's relationship with a third-party investment adviser to a registered investment company that has invested in various investment funds sponsored by the Partnership, and (iii) a complaint allegedly made by a former employee who has filed a claim against the Partnership in district court for wrongful termination of his employment. The Partnership is cooperating fully with the SEC's inquiries.
A hedge fund and two structured finance vehicles managed by Vermillion invested approximately
$400 million
in petroleum commodities that the Partnership believes were misappropriated by third parties outside the U.S. In December 2016, the Partnership paid
$100 million
to the hedge fund investor, repurchasing its interests in the hedge fund, settling claims against the Partnership and acquiring rights to the hedge fund's share of proceeds from marine cargo insurance policies and other efforts to pursue reimbursement for the misappropriation of petroleum (collectively, “Recovery Proceeds”). On June 30, 2017 and July 3, 2017, the Partnership entered into settlement and purchase agreements that fully resolve all claims with investors in the two structured finance vehicles. Pursuant to the settlement and purchase agreements, the Partnership paid a total of approximately
$165 million
in cash in exchange for a full release and waiver of the investors' claims against the Partnership and its affiliates. In addition, the Partnership agreed to repurchase the investors' interests in the two structured finance vehicles for consideration consisting of promissory notes in the aggregate amount of approximately
$54 million
(see Note 7) and the right of the investors to receive a percentage (which ranges from
50%
-
62.5%
) of Recovery Proceeds allocable to their interests. The Partnership is funding the settlement payments in part with general liability insurance proceeds, of which the Partnership has recognized
$103 million
to date. The Partnership also is pursuing Recovery Proceeds on behalf of the investors and itself, but the timing and amount of any additional recovery is uncertain.
It is not possible to predict the ultimate outcome of all pending investigations and legal proceedings and employment-related matters, and some of the matters discussed above involve claims for potentially large and/or indeterminate amounts of damages. Based on information known by management, management does not believe that as of the date of this filing the final resolutions of the matters above will have a material effect upon the Partnership’s condensed consolidated financial statements. However, given the potentially large and/or indeterminate amounts of damages sought in certain of these matters and the inherent unpredictability of investigations and litigations, it is possible that an adverse outcome in certain matters could, from time to time, have a material effect on the Partnership's financial results in any particular period.
The Partnership accrues an estimated loss contingency liability when it is probable that such a liability has been incurred and the amount of the loss can be reasonably estimated. As of
June 30, 2017
, the Partnership had recorded liabilities aggregating to approximately
$60 million
for litigation-related contingencies, regulatory examinations and inquiries, and other matters. The Partnership evaluates its outstanding legal and regulatory proceedings and other matters each quarter to assess its loss contingency accruals, and makes adjustments in such accruals, upward or downward, as appropriate, based on management's best judgment after consultation with counsel. There is no assurance that the Partnership's accruals for loss contingencies will not need to be adjusted in the future or that, in light of the uncertainties involved in such matters, the ultimate resolution of these matters will not significantly exceed the accruals that the Partnership has recorded.
Transaction with Claren Road
O
n December 12, 2016, the Partnership signed an agreement with the founders of Claren Road Asset Management, LLC and its subsidiaries (collectively, “Claren Road”) to transfer all of the Partnership's
63%
ownership interest in Claren Road to its founders. As a result of the transaction, the Partnership was also relieved of all of its obligations under the 2010 acquisition agreement, including any potential future obligations thereunder. This transaction closed on January 31, 2017. The Partnership recorded additional base compensation expense of approximately
$25.0 million
in the year ended
December 31, 2016
associated with the transfer of the interests to Claren Road in addition to the disposition of approximately
$4.4 million
of intangible assets and approximately
$10.8 million
of potential future obligations. The remaining income before provision for income taxes for the year ended
December 31, 2016
was not material. The impact of this transaction on our results for the
three months and six months ended June 30, 2017
was not material. Claren Road was part of the Partnership's Global Market Strategies segment.
42
The Carlyle Group L.P.
Notes to the Condensed Consolidated Financial Statements
(Unaudited)
Indemnifications
In the normal course of business, the Partnership and its subsidiaries enter into contracts that contain a variety of representations and warranties and provide general indemnifications. The Partnership’s maximum exposure under these arrangements is unknown as this would involve future claims that may be made against the Partnership that have not yet occurred. However, based on experience, the Partnership believes the risk of material loss to be remote.
Risks and Uncertainties
Carlyle’s funds seek investment opportunities that offer the possibility of attaining substantial capital appreciation. Certain events particular to each industry in which the underlying investees conduct their operations, as well as general economic conditions, may have a significant negative impact on the Partnership’s investments and profitability. Such events are beyond the Partnership’s control, and the likelihood that they may occur and the effect on the Partnership cannot be predicted.
Furthermore, certain of the funds’ investments are made in private companies and there are generally no public markets for the underlying securities at the current time. The funds’ ability to liquidate their publicly-traded investments are often subject to limitations, including discounts that may be required to be taken on quoted prices due to the number of shares being sold. The funds’ ability to liquidate their investments and realize value is subject to significant limitations and uncertainties, including among others currency fluctuations and natural disasters.
The Partnership and the funds make investments outside of the United States. Investments outside the United States may be subject to less developed bankruptcy, corporate, partnership and other laws (which may have the effect of disregarding or otherwise circumventing the limited liability structures potentially causing the actions or liabilities of one fund or a portfolio company to adversely impact the Partnership or an unrelated fund or portfolio company). Non-U.S. investments are subject to the same risks associated with the Partnership’s U.S. investments as well as additional risks, such as fluctuations in foreign currency exchange rates, unexpected changes in regulatory requirements, heightened risk of political and economic instability, difficulties in managing non-U.S. investments, potentially adverse tax consequences and the burden of complying with a wide variety of foreign laws.
Furthermore, Carlyle is exposed to economic risk concentrations related to certain large investments as well as concentrations of investments in certain industries and geographies.
Additionally, the Partnership encounters credit risk. Credit risk is the risk of default by a counterparty in the Partnership’s investments in debt securities, loans, leases and derivatives that result from a borrower’s, lessee’s or derivative counterparty’s inability or unwillingness to make required or expected payments.
The Partnership considers cash, cash equivalents, securities, receivables, equity method investments, accounts payable, accrued expenses, other liabilities, loans, senior notes, assets and liabilities of Consolidated Funds and contingent and other consideration for acquisitions to be its financial instruments. Except for the senior notes, the carrying amounts reported in the condensed consolidated balance sheets for these financial instruments equal or closely approximate their fair values. The fair value of the senior notes is disclosed in Note 7.
43
The Carlyle Group L.P.
Notes to the Condensed Consolidated Financial Statements
(Unaudited)
11. Related Party Transactions
Due from Affiliates and Other Receivables, Net
The Partnership had the following due from affiliates and other receivables at
June 30, 2017
and
December 31, 2016
:
|
|
As of
|
||||||
|
|
June 30, 2017
|
December 31, 2016
|
|||||
|
|
(Dollars in millions)
|
||||||
|
Unbilled receivable for giveback obligations from current and former employees
|
$
|
3.0
|
|
$
|
5.6
|
|
|
|
Notes receivable and accrued interest from affiliates
|
14.2
|
|
37.6
|
|
|||
|
Other receivables from unconsolidated funds and affiliates, net
|
235.9
|
|
184.0
|
|
|||
|
Total
|
$
|
253.1
|
|
$
|
227.2
|
|
|
Notes receivable represent loans that the Partnership has provided to certain unconsolidated funds to meet short-term obligations to purchase investments. Other receivables from certain of the unconsolidated funds and portfolio companies relate to management fees receivable from limited partners, advisory fees receivable and expenses paid on behalf of these entities. These costs represent costs related to the pursuit of actual or proposed investments, professional fees and expenses associated with the acquisition, holding and disposition of the investments. The affiliates are obligated at the discretion of the Partnership to reimburse the expenses. Based on management’s determination, the Partnership accrues and charges interest on amounts due from affiliate accounts at interest rates ranging up to
6.81%
as of
June 30, 2017
. The accrued and charged interest to the affiliates was not significant for any period presented.
These receivables are assessed regularly for collectability and amounts determined to be uncollectible are charged directly to general, administrative and other expenses in the condensed consolidated statements of operations. A corresponding allowance for doubtful accounts is recorded and such amounts were not significant for any period presented.
Due to Affiliates
The Partnership had the following due to affiliates balances at
June 30, 2017
and
December 31, 2016
:
|
|
As of
|
||||||
|
|
June 30, 2017
|
December 31, 2016
|
|||||
|
|
(Dollars in millions)
|
||||||
|
Due to affiliates of Consolidated Funds
|
$
|
0.2
|
|
$
|
0.2
|
|
|
|
Due to non-consolidated affiliates
(1)
|
39.4
|
|
29.7
|
|
|||
|
Performance-based contingent cash consideration related to acquisitions
|
31.2
|
|
36.1
|
|
|||
|
Amounts owed under the tax receivable agreement
|
147.5
|
|
137.8
|
|
|||
|
Other
|
16.5
|
|
19.8
|
|
|||
|
Total
|
$
|
234.8
|
|
$
|
223.6
|
|
|
(1) Refer to Note 2 for information on the restricted cash due to one of the Partnership's non-consolidated funds.
The Partnership has recorded obligations for amounts due to certain of its affiliates. The Partnership periodically offsets expenses it has paid on behalf of its affiliates against these obligations. The amount owed under the tax receivable agreement is related primarily to the acquisition by the Partnership of Carlyle Holdings partnership units in June 2015 and March 2014, respectively, the exchange in May 2012 by CalPERS of its Carlyle Holdings partnership units for Partnership common units, as well as certain unit exchanges by senior Carlyle professionals which began in the second quarter of 2017.
44
The Carlyle Group L.P.
Notes to the Condensed Consolidated Financial Statements
(Unaudited)
Other Related Party Transactions
In the normal course of business, the Partnership has made use of aircraft owned by entities controlled by senior Carlyle professionals. The senior Carlyle professionals paid for their purchases of aircraft and bear all operating, personnel and maintenance costs associated with their operation for personal use. Payment by the Partnership for the business use of these aircraft by senior Carlyle professionals and other employees, which is made at market rates, totaled
$1.0 million
and
$1.1 million
for the
three months ended June 30, 2017 and 2016
, respectively, and
$2.2 million
for both the
six months ended June 30, 2017 and 2016
. These fees are included in general, administrative, and other expenses in the condensed consolidated statements of operations.
Senior Carlyle professionals and employees are permitted to participate in co-investment entities that invest in Carlyle funds or alongside Carlyle funds. In many cases, participation is limited by law to individuals who qualify under applicable legal requirements. These co-investment entities generally do not require senior Carlyle professionals and employees to pay management or performance fees, however, Carlyle professionals and employees are required to pay their portion of partnership expenses.
Carried interest income from the funds can be distributed to senior Carlyle professionals and employees on a current basis, but is subject to repayment by the subsidiary of the Partnership that acts as general partner of the fund in the event that certain specified return thresholds are not ultimately achieved. The senior Carlyle professionals and certain other investment professionals have personally guaranteed, subject to certain limitations, the obligation of these subsidiaries in respect of this general partner obligation. Such guarantees are several and not joint and are limited to a particular individual’s distributions received.
The Partnership does business with some of its portfolio companies; all such arrangements are on a negotiated basis.
Substantially all revenue is earned from affiliates of Carlyle.
12. Income Taxes
The Partnership is generally organized as a series of pass through entities pursuant to the United States Internal Revenue Code. As such, the Partnership is not responsible for the tax liability due on certain income earned during the year. Such income is taxed at the unitholder and non-controlling interest holder level, and any income tax is the responsibility of the unitholders and is paid at that level. For income taxes on income earned for which the Partnership is responsible for the tax liability, the Partnership’s income tax expense was
$13.2 million
and
$24.3 million
for the
three months ended June 30, 2017 and 2016
, respectively, and
$19.0 million
and
$31.7 million
for the
six months ended June 30, 2017 and 2016
, respectively.
In the normal course of business, the Partnership is subject to examination by federal and certain state, local and foreign tax regulators. As of
June 30, 2017
, the Partnership’s U.S. federal income tax returns for the years
2013
through
2016
are open under the normal
three
-year statute of limitations and therefore subject to examination. State and local tax returns are generally subject to audit from
2012
to
2016
. Foreign tax returns are generally subject to audit from
2009
to
2016
. Certain of the Partnership’s affiliates are currently under audit by federal, state and foreign tax authorities.
The Partnership does not believe that the outcome of these audits will require it to record reserves for uncertain tax positions or that the outcome will have a material impact on the consolidated financial statements. The Partnership does not believe that it has any tax positions for which it is reasonably possible that the total amounts of unrecognized tax benefits will significantly increase or decrease within the
next twelve months
.
45
The Carlyle Group L.P.
Notes to the Condensed Consolidated Financial Statements
(Unaudited)
13. Non-controlling Interests in Consolidated Entities
The components of the Partnership’s non-controlling interests in consolidated entities are as follows:
|
|
As of
|
||||||
|
|
June 30, 2017
|
December 31, 2016
|
|||||
|
|
(Dollars in millions)
|
||||||
|
Non-Carlyle interests in Consolidated Funds
|
$
|
14.7
|
|
$
|
13.5
|
|
|
|
Non-Carlyle interests in majority-owned subsidiaries
|
329.0
|
|
331.7
|
|
|||
|
Non-controlling interest in carried interest, giveback obligations and cash held for carried interest distributions
|
(63.2
|
)
|
(67.4
|
)
|
|||
|
Non-controlling interests in consolidated entities
|
$
|
280.5
|
|
$
|
277.8
|
|
|
The components of the Partnership’s non-controlling interests in income (loss) of consolidated entities are as follows:
|
|
Three Months Ended June 30,
|
Six Months Ended June 30,
|
|||||||||||||
|
|
2017
|
2016
|
2017
|
2016
|
|||||||||||
|
|
(Dollars in millions)
|
||||||||||||||
|
Non-Carlyle interests in Consolidated Funds
|
$
|
—
|
|
$
|
0.2
|
|
$
|
(0.1
|
)
|
$
|
1.4
|
|
|||
|
Non-Carlyle interests in majority-owned subsidiaries
|
10.7
|
|
1.4
|
|
11.5
|
|
3.1
|
|
|||||||
|
Non-controlling interest in carried interest, giveback obligations and cash held for carried interest distributions
|
5.8
|
|
0.2
|
|
8.4
|
|
(5.1
|
)
|
|||||||
|
Net income (loss) attributable to other non-controlling interests in consolidated entities
|
16.5
|
|
1.8
|
|
19.8
|
|
(0.6
|
)
|
|||||||
|
Net loss attributable to redeemable non-controlling interests in consolidated entities
|
—
|
|
(0.2
|
)
|
—
|
|
(0.1
|
)
|
|||||||
|
Non-controlling interests in income (loss) of consolidated entities
|
$
|
16.5
|
|
$
|
1.6
|
|
$
|
19.8
|
|
$
|
(0.7
|
)
|
|||
14. Earnings Per Common Unit
Basic and diluted net income (loss) per common unit are calculated as follows:
|
|
Three Months Ended June 30, 2017
|
Six Months Ended
June 30, 2017 |
|||||||||||||
|
|
Basic
|
Diluted
|
Basic
|
Diluted
|
|||||||||||
|
Net income attributable to common units
|
$
|
57,600,000
|
|
$
|
57,600,000
|
|
$
|
140,600,000
|
|
$
|
140,600,000
|
|
|||
|
Weighted-average common units outstanding
|
88,801,343
|
|
96,986,255
|
|
87,079,007
|
|
94,486,422
|
|
|||||||
|
Net income per common unit
|
$
|
0.65
|
|
$
|
0.59
|
|
$
|
1.61
|
|
$
|
1.49
|
|
|||
|
Three Months Ended June 30, 2016
|
Six Months Ended
June 30, 2016 |
||||||||||||||
|
Basic
|
Diluted
|
Basic
|
Diluted
|
||||||||||||
|
Net income attributable to The Carlyle Group L.P.
|
$
|
6,100,000
|
|
$
|
6,100,000
|
|
$
|
14,500,000
|
|
$
|
14,500,000
|
|
|||
|
Incremental net income from assumed exchange of Carlyle Holdings partnership units
|
—
|
|
—
|
|
—
|
|
13,600,000
|
|
|||||||
|
Net income attributable to common units
|
$
|
6,100,000
|
|
$
|
6,100,000
|
|
$
|
14,500,000
|
|
$
|
28,100,000
|
|
|||
|
Weighted-average common units outstanding
|
81,683,415
|
|
85,849,938
|
|
81,284,238
|
|
304,176,760
|
|
|||||||
|
Net income per common unit
|
$
|
0.07
|
|
$
|
0.07
|
|
$
|
0.18
|
|
$
|
0.09
|
|
|||
46
The Carlyle Group L.P.
Notes to the Condensed Consolidated Financial Statements
(Unaudited)
The weighted-average common units outstanding, basic and diluted, are calculated as follows:
|
|
Three Months Ended June 30, 2017
|
Six Months Ended
June 30, 2017 |
|||||||||
|
|
Basic
|
Diluted
|
Basic
|
Diluted
|
|||||||
|
The Carlyle Group L.P. weighted-average common units outstanding
|
88,801,343
|
|
88,801,343
|
|
87,079,007
|
|
87,079,007
|
|
|||
|
Unvested deferred restricted common units
|
—
|
|
7,586,968
|
|
—
|
|
6,809,471
|
|
|||
|
Issuable Carlyle Holdings Partnership units
|
—
|
|
597,944
|
|
—
|
|
597,944
|
|
|||
|
Weighted-average common units outstanding
|
88,801,343
|
|
96,986,255
|
|
87,079,007
|
|
94,486,422
|
|
|||
|
Three Months Ended June 30, 2016
|
Six Months Ended
June 30, 2016 |
||||||||||
|
Basic
|
Diluted
|
Basic
|
Diluted
|
||||||||
|
The Carlyle Group L.P. weighted-average common units outstanding
|
81,683,415
|
|
81,683,415
|
|
81,284,238
|
|
81,284,238
|
|
|||
|
Unvested deferred restricted common units
|
—
|
|
4,166,523
|
|
—
|
|
2,988,087
|
|
|||
|
Weighted-average vested Carlyle Holdings Partnership units
|
—
|
|
—
|
|
—
|
|
219,634,462
|
|
|||
|
Unvested Carlyle Holdings Partnership units
|
—
|
|
—
|
|
—
|
|
269,973
|
|
|||
|
Weighted-average common units outstanding
|
81,683,415
|
|
85,849,938
|
|
81,284,238
|
|
304,176,760
|
|
|||
The Carlyle Group L.P. weighted-average common units outstanding includes vested deferred restricted common units and common units associated with acquisitions that have been earned for which issuance of the related common units is deferred until future periods.
The Partnership applies the treasury stock method to determine the dilutive weighted-average common units represented by the unvested deferred restricted common units. Also included in the determination of dilutive weighted-average common units are issuable Carlyle Holdings partnership units associated with the Partnership's strategic investments in NGP.
The Partnership applies the “if-converted” method to the vested Carlyle Holdings partnership units to determine the dilutive weighted-average common units outstanding. The Partnership applies the treasury stock method to the unvested Carlyle Holdings partnership units and the “if-converted” method on the resulting number of additional Carlyle Holdings partnership units to determine the dilutive weighted-average common units represented by the unvested Carlyle Holdings partnership units.
In computing the dilutive effect that the exchange of Carlyle Holdings partnership units would have on earnings per common unit, the Partnership considered that net income available to holders of common units would increase due to the elimination of non-controlling interests in Carlyle Holdings (including any tax impact). Based on these calculations,
228,386,148
of vested Carlyle Holdings partnership units and
897,070
of unvested Carlyle Holdings partnership units for the
three months ended June 30, 2017
and
226,541,019
of vested Carlyle Holdings partnership units and
1,944,401
of unvested Carlyle Holdings partnership units for the
six months ended June 30, 2017
were antidilutive, and therefore have been excluded.
Further, based on these calculations,
219,634,462
of vested Carlyle Holdings partnership units and
269,973
of unvested Carlyle Holdings partnership units for the
six months ended June 30, 2016
were dilutive. As a result, a net income of non-controlling interests in Carlyle Holdings associated with the assumed exchange of
$13.6 million
for the
six months ended June 30, 2016
has been included in net income attributable to The Carlyle Group L.P. for purposes of the dilutive earnings per common unit calculation. However, for the
three months ended June 30, 2016
,
222,553,813
of vested and unvested Carlyle Holdings partnership units were antidilutive, and therefore have been excluded.
On August 1, 2013, as part of acquiring the remaining
40%
equity interests in AlpInvest, the Partnership issued
914,087
common units that are subject to vesting conditions. As of
June 30, 2017
,
7,782
common units remain unvested. The common units participate immediately in any Partnership distributions. Under ASC 260, these common units are considered participating securities and are required to be included in the computation of earnings per common unit pursuant to the two-class method.
47
The Carlyle Group L.P.
Notes to the Condensed Consolidated Financial Statements
(Unaudited)
15. Equity and Equity-Based Compensation
Unit Repurchase Program
In February 2016, the Board of Directors of the general partner of the Partnership authorized the repurchase of up to
$200 million
of common units and/or Carlyle Holdings units. Under this unit repurchase program, units may be repurchased from time to time in open market transactions, in privately negotiated transactions or otherwise. The Partnership expects that the majority of repurchases under this program will be done via open market transactions. No units will be repurchased from the Partnership's executive officers under this program. The timing and actual number of common units and/or Carlyle Holdings units repurchased will depend on a variety of factors, including legal requirements, price, and economic and market conditions. This unit repurchase program may be suspended or discontinued at any time and does not have a specified expiration date. During the
six months ended June 30, 2017
, the Partnership paid an aggregate of
$0.2 million
to repurchase and retire
14,190
units with all of the repurchases done via open market transactions. There were
no
unit repurchases for the
three months ended June 30, 2017
. Since inception of this program, the Partnership has paid an aggregate of
$59.1 million
to repurchase and retire
3.7 million
units.
Quarterly Unit Exchange Program
Beginning in the second quarter of 2017, current and former senior Carlyle professionals are able to exchange their Carlyle Holdings partnership units for common units on a quarterly basis, subject to the terms of the Exchange Agreement. During the
three months ended June 30, 2017
, current and former senior Carlyle professionals exchanged
2,987,252
Carlyle Holdings partnership units for common units, resulting in a reallocation of capital of
$14.0 million
from non-controlling interests in Carlyle Holdings to partners' capital and accumulated other comprehensive loss. None of Carlyle's named executive officers participated in the quarterly unit exchange.
Equity-Based Compensation
In May 2012, Carlyle Group Management L.L.C., the general partner of the Partnership, adopted The Carlyle Group L.P. 2012 Equity Incentive Plan (the “Equity Incentive Plan”). The Equity Incentive Plan is a source of equity-based awards permitting the Partnership to grant to Carlyle employees, directors of the Partnership’s general partner and consultants non-qualified options, unit appreciation rights, common units, restricted common units, deferred restricted common units, phantom restricted common units and other awards based on the Partnership’s common units and Carlyle Holdings partnership units. The total number of the Partnership’s common units and Carlyle Holdings partnership units which were initially available for grant under the Equity Incentive Plan was
30,450,000
. The Equity Incentive Plan contains a provision which automatically increases the number of the Partnership’s common units and Carlyle Holdings partnership units available for grant based on a pre-determined formula; this increase occurs annually on January 1. As of January 1, 2017, pursuant to the formula, the total number of the Partnership’s common units and Carlyle Holdings partnership units available for grant under the Equity Incentive Plan was
32,645,874
.
Unvested Partnership Common Units
On August 1, 2013, the Partnership acquired the remaining
40%
equity interest in AlpInvest. As part of the transaction, the Partnership issued
914,087
common units to AlpInvest sellers who are employees of the Partnership that are subject to vesting conditions. These common units were unvested at grant and vest over a period of up to
five years
. The unvested common units are accounted for as equity-based compensation in accordance with ASC Topic 718,
Compensation – Stock Compensation
(“ASC 718”). The grant-date fair value of the unvested common units is charged to equity-based compensation on a straight-line basis over the required service period. For
three months and six months ended June 30, 2017
and
2016
, the expense associated with these awards was not material.
As of
June 30, 2017
, the total unrecognized equity-based compensation expense related to unvested common units was not material and is expected to be recognized within the year.
48
The Carlyle Group L.P.
Notes to the Condensed Consolidated Financial Statements
(Unaudited)
Unvested Carlyle Holdings Partnership Units
Unvested Carlyle Holdings partnership units are held by senior Carlyle professionals and other individuals engaged in Carlyle’s business and generally vest ratably over a
six
-year period. The unvested Carlyle Holdings partnership units are accounted for as equity-based compensation in accordance with ASC 718. The grant-date fair value of the unvested Carlyle Holdings partnership units are charged to equity-based compensation expense on a straight-line basis over the required service period. The Partnership recorded equity-based compensation expense associated with these awards of
$43.7 million
and
$64.3 million
for the
three months ended June 30, 2017 and 2016
, respectively, and
$79.0 million
and
$106.8 million
for the
six months ended June 30, 2017 and 2016
, respectively.
No
tax benefits have been recorded related to the unvested Carlyle Holdings partnership units, as the vesting of these units does not result in a tax deduction to the corporate taxpayers.
In connection with the Partnership’s investment in NGP Management in December 2012, the Partnership issued
996,572
Carlyle Holdings partnership units to ECM Capital, L.P. which vest ratably over a period of
five years
. The Partnership also issued
597,944
Carlyle Holdings partnership units to ECM Capital, L.P. that were issued at closing but vest upon the achievement of performance conditions. As disclosed in Note 5, the performance condition was removed as part of the March 2017 agreement with NGP. The fair value of these units will be recognized as a reduction to the Partnership’s investment income in NGP Management over the relevant service period, based on the fair value of the units on each reporting date and adjusted for the actual fair value of the units at each vesting date. For the periods prior to 2017 for Carlyle Holdings partnership units that vest based on the achievement of performance conditions, the Partnership used the minimum number of partnership units within the range of potential values for measurement and recognition purposes.
As of
June 30, 2017
, the total unrecognized equity-based compensation expense related to unvested Carlyle Holdings partnership units is
$144.0 million
, which is expected to be recognized over a weighted-average term of
0.8 years
.
Deferred Restricted Common Units
The deferred restricted common units are unvested when granted and vest ratably over a service period, which ranges up to
six years
. The grant-date fair value of the deferred restricted common units granted to Carlyle’s employees is charged to equity-based compensation expense on a straight-line basis over the required service period. Additionally, the calculation of the expense assumes a per unit discount that generally ranges up to
40%
, as these unvested awards do not participate in any Partnership distributions. The Partnership recorded compensation expense of
$44.3 million
and
$44.5 million
for the
three months ended June 30, 2017 and 2016
, respectively, with
$5.2 million
and
$4.8 million
of corresponding deferred tax benefits, respectively. The Partnership recorded compensation expense of
$81.8 million
and
$76.2 million
for the
six months ended June 30, 2017 and 2016
, respectively with
$9.4 million
and
$9.1 million
of corresponding deferred tax benefits, respectively. As of
June 30, 2017
, the total unrecognized equity-based compensation expense related to unvested deferred restricted common units is
$224.2 million
, which is expected to be recognized over a weighted-average term of
2.1 years
.
Equity-based awards issued to non-employees are recognized as general, administrative and other expenses. The expense associated with the deferred restricted common units granted to NGP personnel by the Partnership are recognized as a reduction of the Partnership’s investment income in NGP Management. The grant-date fair value of deferred restricted common units granted to Carlyle’s non-employee directors is charged to expense on a straight-line basis over the vesting period. The cost of services received in exchange for an equity-based award issued to consultants is measured at each vesting date. Equity-based awards that require the satisfaction of future service criteria are recognized over the relevant service period based on the fair value of the award on each reporting date and adjusted for the actual fair value of the award at each vesting date. The expense for equity-based awards issued to non-employees was not significant for the
three months and six months ended June 30, 2017
and
2016
.
49
The Carlyle Group L.P.
Notes to the Condensed Consolidated Financial Statements
(Unaudited)
A summary of the status of the Partnership’s non-vested equity-based awards as of
June 30, 2017
and a summary of changes for the
six months ended June 30, 2017
, are presented below:
|
|
Carlyle Holdings
|
The Carlyle Group L.P.
|
|||||||||||||||||||||||||
|
|
|
|
Equity Settled Awards
|
Cash Settled Awards
|
|||||||||||||||||||||||
|
Unvested Units
|
Partnership
Units |
Weighted-
Average Grant Date Fair Value |
Deferred
Restricted Common Units |
Weighted-
Average Grant Date Fair Value |
Unvested
Common Units |
Weighted-
Average Grant Date Fair Value |
Phantom
Units |
Weighted-
Average Grant Date Fair Value |
|||||||||||||||||||
|
Balance, December 31, 2016
|
17,240,000
|
|
$
|
22.22
|
|
16,705,920
|
|
$
|
19.21
|
|
38,911
|
|
$
|
21.67
|
|
2,520
|
|
$
|
34.81
|
|
|||||||
|
Granted
|
—
|
|
$
|
—
|
|
7,810,889
|
|
$
|
14.07
|
|
—
|
|
$
|
—
|
|
—
|
|
$
|
—
|
|
|||||||
|
Vested
|
8,145,924
|
|
$
|
22.00
|
|
3,294,213
|
|
$
|
22.19
|
|
31,129
|
|
$
|
21.53
|
|
2,520
|
|
$
|
34.81
|
|
|||||||
|
Forfeited
|
437,314
|
|
$
|
22.00
|
|
335,641
|
|
$
|
20.99
|
|
—
|
|
$
|
—
|
|
—
|
|
$
|
—
|
|
|||||||
|
Balance, June 30, 2017
|
8,656,762
|
|
$
|
22.00
|
|
20,886,955
|
|
$
|
16.77
|
|
7,782
|
|
$
|
22.22
|
|
—
|
|
$
|
—
|
|
|||||||
16. Consolidation of a Real Estate Development Company
The Partnership, indirectly through certain Carlyle real estate investment funds, has an investment in Urbplan Desenvolvimento Urbano S.A. (“Urbplan”), a Brazilian residential subdivision and land development company.
In late 2012, it was determined that Urbplan was facing serious liquidity problems and would require additional capital infusions to continue operations. The Partnership and certain of its senior Carlyle professionals provided capital to Urbplan through one of the Carlyle investment funds starting in 2013. The Partnership concluded that Urbplan was a VIE as of September 30, 2013 because Urbplan’s equity investment at risk was not sufficient to permit it to finance its activities without additional financial support. The Partnership also concluded that it was the primary beneficiary of Urbplan since the Partnership has the power to direct the activities of Urbplan that most significantly impact its economic performance and the Partnership’s investments in Urbplan will absorb losses incurred by Urbplan. As such, the Partnership began consolidating Urbplan into its consolidated financial statements as of September 30, 2013. Due to the timing and availability of financial information from Urbplan, the Partnership consolidates the financial position and results of operations of Urbplan on a financial reporting lag of
90 days
. The Partnership will disclose the effect of intervening events at Urbplan that materially affect the financial position or results of operations of the Partnership, if any.
The assets and liabilities of Urbplan are held in legal entities separate from the Partnership; the Partnership has not guaranteed or assumed any obligation for repayment of Urbplan’s liabilities nor are the assets of Urbplan available to meet the liquidity requirements of the Partnership. Urbplan has substantially completed construction of its development projects, and no new development projects have been approved. At this time, Urbplan's projected revenues and cash flow may be insufficient to timely satisfy all of Urbplan's debt obligations, necessitating a restructuring of its debt obligations or a potential bankruptcy reorganization or insolvency proceeding. Furthermore, while the Partnership has not expressly assumed any of Urbplan's obligations or liabilities, in any such proceeding customers or other creditors in certain circumstances might seek to assert claims against the Partnership and its affiliate assets unrelated to Urbplan under certain consumer protection, labor or other laws.
Urbplan is currently a party to a significant number of claims filed against Urbplan by its customers. In addition, Urbplan is a party to various other litigation, government investigations and proceedings, disputes and other potential claims. As of
June 30, 2017
, the Partnership has recorded liabilities of approximately
$75 million
related to such matters in other liabilities of a consolidated real estate VIE. The Partnership does not believe it is probable that the outcome of any existing Urbplan litigation, disputes or other potential claims will materially affect the Partnership or these consolidated financial statements.
From 2013 through
June 30, 2017
,
$383.9 million
has been funded to Urbplan by the Partnership and its senior Carlyle professionals (including losses from related foreign currency forward contracts). The Partnership has funded
$136.4 million
of the
$383.9 million
and the remaining
$247.5 million
has been funded by senior Carlyle professionals indirectly through the Partnership. For the
three months ended June 30, 2017
,
$8.1 million
was funded to Urbplan by the Partnership.
No contractual or other obligations exist to provide additional financial support to Urbplan from the Partnership. Urbplan continues to seek opportunities to restructure its existing debt obligations to reduce its cash requirements and is also pursuing other strategic alternatives. The Partnership does not anticipate providing any additional financial support to satisfy Urbplan's debt obligations. The Partnership may consider providing additional financial support for other purposes, depending on the
50
The Carlyle Group L.P.
Notes to the Condensed Consolidated Financial Statements
(Unaudited)
circumstances at the time, including the ability of Urbplan to satisfactorily restructure its debt obligations with its financial creditors or to facilitate other strategic alternatives. Such contemplated transactions, if consummated, could result in future charges related to the Partnership's ownership of Urbplan, and such charges, if any, are currently estimated to be in the range of
$30 million
to
$50 million
.
The assets and liabilities recognized in the Partnership’s condensed consolidated balance sheets as of
June 30, 2017
and
December 31, 2016
related to Urbplan were as follows:
|
|
As of
|
||||||
|
|
June 30, 2017
|
December 31, 2016
|
|||||
|
|
(Dollars in millions)
|
||||||
|
Receivables and inventory of a consolidated real estate VIE:
|
|||||||
|
Customer and other receivables
|
$
|
107.2
|
|
$
|
99.4
|
|
|
|
Inventory costs in excess of billings and advances
|
60.0
|
|
46.0
|
|
|||
|
$
|
167.2
|
|
$
|
145.4
|
|
||
|
Other assets of a consolidated real estate VIE:
|
|||||||
|
Restricted investments
|
$
|
12.2
|
|
$
|
12.7
|
|
|
|
Fixed assets, net
|
0.2
|
|
0.2
|
|
|||
|
Deferred tax assets
|
4.0
|
|
9.1
|
|
|||
|
Other assets
|
16.6
|
|
9.5
|
|
|||
|
$
|
33.0
|
|
$
|
31.5
|
|
||
|
Loans payable of a consolidated real estate VIE at fair value (principal amount of $145.3 million and $144.4 million as of June 30, 2017 and December 31, 2016, respectively)
|
$
|
72.6
|
|
$
|
79.4
|
|
|
|
Other liabilities of a consolidated real estate VIE:
|
|||||||
|
Accounts payable
|
$
|
14.0
|
|
$
|
14.6
|
|
|
|
Other liabilities
|
159.4
|
|
109.9
|
|
|||
|
$
|
173.4
|
|
$
|
124.5
|
|
||
The revenues and expenses recognized in the Partnership’s unaudited condensed consolidated statements of operations for the
three months and six months ended June 30, 2017
and
2016
, respectively, related to Urbplan were as follows:
|
Three Months Ended
June 30, 2017 |
Six Months Ended June 30, 2017
|
||||||
|
|
(Dollars in millions)
|
||||||
|
Revenue of a consolidated real estate VIE:
|
|||||||
|
Land development services
|
$
|
12.8
|
|
$
|
104.6
|
|
|
|
Investment income
|
3.6
|
|
4.4
|
|
|||
|
$
|
16.4
|
|
$
|
109.0
|
|
||
|
Interest and other expenses of a consolidated real estate VIE:
|
|||||||
|
Costs of products sold and services rendered
|
$
|
8.5
|
|
$
|
64.4
|
|
|
|
Interest expense
|
9.6
|
|
18.5
|
|
|||
|
Change in fair value of loans payable
|
(7.2
|
)
|
(6.6
|
)
|
|||
|
Compensation and benefits
|
1.4
|
|
2.8
|
|
|||
|
G&A and other expenses
|
6.1
|
|
58.9
|
|
|||
|
$
|
18.4
|
|
$
|
138.0
|
|
||
51
The Carlyle Group L.P.
Notes to the Condensed Consolidated Financial Statements
(Unaudited)
|
Three Months Ended June 30, 2016
|
Six Months Ended June 30, 2016
|
||||||
|
|
(Dollars in millions)
|
||||||
|
Revenue of a consolidated real estate VIE:
|
|||||||
|
Land development services
|
$
|
8.6
|
|
$
|
27.7
|
|
|
|
Investment income
|
9.8
|
|
15.1
|
|
|||
|
$
|
18.4
|
|
$
|
42.8
|
|
||
|
Interest and other expenses of a consolidated real estate VIE:
|
|||||||
|
Costs of products sold and services rendered
|
$
|
3.5
|
|
$
|
14.2
|
|
|
|
Interest expense
|
16.0
|
|
23.5
|
|
|||
|
Change in fair value of loans payable
|
(0.8
|
)
|
(0.1
|
)
|
|||
|
Compensation and benefits
|
1.7
|
|
3.4
|
|
|||
|
G&A and other expenses
|
32.0
|
|
34.8
|
|
|||
|
$
|
52.4
|
|
$
|
75.8
|
|
||
The following is a summary of the significant classifications of assets and liabilities of Urbplan:
Customer and other receivables –
This balance consists primarily of amounts owed for land development services using the completed contract method. Customer receivables accrue interest at rates ranging from
9%
to
12%
per year and are secured by the underlying real estate. Most of the receivables are pledged as collateral for Urbplan’s borrowings. The carrying value of the receivables includes an appropriate allowance for estimated uncollectible accounts to reflect any loss anticipated on the balances. Urbplan calculates this allowance based on its history of write-offs, the level of past-due accounts based on the contractual terms of the receivables, and its relationships with, and the economic status of, Urbplan’s customers.
Inventory costs in excess of billings and advances
– This balance consists primarily of capitalized land development cost, net of approximately
$29.7 million
and
$91.5 million
of customer advances received as of
June 30, 2017
and
December 31, 2016
, respectively, and lots returned or otherwise recovered by Urbplan. Urbplan records valuation adjustments on inventory when events and circumstances indicate that the inventory may be impaired and when the cash flows estimated to be generated by the real estate project are less than its carrying amount. Real estate projects that demonstrate potential impairment indicators are tested for impairment by Urbplan by comparing the expected undiscounted cash flows for the real estate project to its carrying value. For those real estate projects whose carrying values exceed the expected undiscounted cash flows, Urbplan estimates the fair value of the real estate projects. Impairment charges are recorded if the fair value of the inventory is less than its carrying value. The estimates used in the determination of the estimated fair value of the real estate projects were based on factors known to Urbplan at the time such estimates were made and the expectations of future operations and economic conditions. Should the estimates or expectations used in determining estimated fair value deteriorate in the future, Urbplan may be required to recognize additional impairment charges and write-offs related to real estate projects.
Loans payable of a consolidated real estate VIE
– This balance consists of Urbplan’s borrowings for its real estate development activities. The estimated fair value approximates
50%
of the outstanding principal amounts of the loans as of
June 30, 2017
. The fair value of the loans was based on discounted cash flow analyses which considered the liquidity and current financial condition of Urbplan and applicable discount rates. The Partnership has elected to re-measure the loans at fair value at each reporting period through the term of the loans. The principal amounts of the loans accrue interest at a variable rate based on an index plus an applicable margin. Interest rates are based on: (i) CDI plus a margin of
4.0%
(
14.2%
as of
June 30, 2017
); (ii) IGP-M plus a margin of
12.0%
(
11.2%
as of
June 30, 2017
); or (iii) IPCA plus a margin ranging from
8.8%
to
15.0%
(
11.8%
to
18.0%
as of
June 30, 2017
). Outstanding principal amounts on the loans based on current contractual terms are payable as follows (Dollars in millions):
52
The Carlyle Group L.P.
Notes to the Condensed Consolidated Financial Statements
(Unaudited)
|
2017
|
$
|
13.1
|
|
|
2018
|
15.6
|
|
|
|
2019
|
23.2
|
|
|
|
2020
|
23.1
|
|
|
|
2021
|
21.0
|
|
|
|
Thereafter
|
49.3
|
|
|
|
$
|
145.3
|
|
|
Most of Urbplan’s customer and other receivables and investments have been pledged as collateral for the loans. As of
June 30, 2017
, substantially all of Urbplan’s loans payable are not in compliance with their related debt covenants or are otherwise in technical default. These violations do not cause a default or event of default under the Partnership’s senior credit facility or senior notes.
All of the loans payable of Urbplan are contractually non-recourse to the Partnership.
Other liabilities
– This balance consists of amounts owed to landowners, commissions payable to brokers, real estate taxes, social charges and other liabilities. This balance also includes amounts accrued for various litigation, government investigations and proceedings, disputes and other potential claims, including claims filed against Urbplan by its customers.
Revenue of a consolidated real estate VIE
– This balance consists primarily of amounts earned for land development services using the completed contract method and investment income earned on Urbplan’s investments. Under the completed contract method of accounting, revenue is not recorded until the period in which the land development services contract is completed.
Interest and other expenses of a consolidated real estate VIE
– This balance consists primarily of interest expense on Urbplan’s borrowings, general and administrative expenses, compensation and benefits, and costs associated with land development services. Also included in this caption is the change in the Partnership’s estimate of the fair value of Urbplan’s loans payable during the period. Interest expense is recorded on Urbplan’s borrowings at variable rates as defined. Costs related to Urbplan’s land development services activities are capitalized until the services are complete. Costs associated with advertising, marketing and other selling activities are expensed when incurred.
Impairment
– Urbplan evaluates its assets for impairment whenever events or changes in circumstances indicate that the carrying amount of such asset may not be recoverable, but not less than annually. Impairment charges are recorded in general and administrative expenses within interest and other expenses of a consolidated real estate VIE.
As of
June 30, 2017
, Urbplan's outstanding commitments for land development services are estimated to be less than
$10.0 million
of future costs to be incurred.
17. Segment Reporting
Carlyle conducts its operations through
four
reportable segments:
Corporate Private Equity
– The Corporate Private Equity segment is comprised of the Partnership’s operations that advise a diverse group of funds that invest in buyout and growth capital transactions that focus on either a particular geography or a particular industry.
Real Assets
– The Real Assets segment is comprised of the Partnership’s operations that advise U.S. and international funds focused on real estate, infrastructure, energy and renewable energy transactions.
Global Market Strategies
– The Global Market Strategies segment advises a group of funds that pursue investment opportunities across various types of credit, equities and alternative instruments, and (as regards certain macroeconomic strategies) currencies, and interest rate products and their derivatives. We have now completed the exit of our hedge fund investment advisory and commodities investment advisory businesses.
Investment Solutions
– The Investment Solutions segment advises global private equity fund of funds programs and related co-investment and secondary activities through AlpInvest. This segment also includes Metropolitan, a global manager of real estate fund of funds and related co-investment and secondary activities, and for the three months ended
53
The Carlyle Group L.P.
Notes to the Condensed Consolidated Financial Statements
(Unaudited)
March 31, 2016, Diversified Global Asset Management ("DGAM"). The Partnership wound down the operations of DGAM throughout 2016.
The Partnership’s reportable business segments are differentiated by their various investment focuses and strategies. Overhead costs are generally allocated based on direct base compensation expense for each segment. The Partnership includes adjustments to reflect the Partnership’s economic interests in Claren Road (through January 2017) and ESG (through June 2016). Effective January 1, 2016, the Partnership's economic interest in Claren Road increased from
55%
to
63%
as a result of reallocation of interest from a departing founder. On January 31, 2017, the Partnership transferred all of its economic interests in Claren Road to its founders (see Note 10). The Partnership’s earnings from its investment in NGP are presented in the respective operating captions within the Real Assets segment. The net income or loss from the consolidation of Urbplan allocable to the Partnership (after consideration of amounts allocable to non-controlling interests) is presented within investment income in the Real Assets segment.
Economic Net Income (“ENI”) and its components are key performance measures used by management to make operating decisions and assess the performance of the Partnership’s reportable segments. ENI differs from income (loss) before provision for income taxes computed in accordance with U.S. GAAP in that it includes certain tax expenses associated with performance fees, and does not include net income (loss) attributable to non-Carlyle interests in consolidated entities or charges (credits) related to Carlyle corporate actions and non-recurring items. Charges (credits) related to Carlyle corporate actions and non-recurring items include: charges associated with equity-based compensation that was issued in the initial public offering in May 2012 or is issued in acquisitions or strategic investments, changes in the tax receivable agreement liability, amortization and any impairment charges associated with acquired intangible assets, transaction costs associated with acquisitions, charges associated with earnouts and contingent consideration including gains and losses associated with the estimated fair value of contingent consideration issued in conjunction with acquisitions or strategic investments, gains and losses from the retirement of debt, charges associated with contract terminations and employee severance.
Fee Related Earnings (“FRE”) is a component of ENI and is used to assess the ability of the business to cover direct base compensation and operating expenses from total fee revenues. FRE differs from income (loss) before provision for income taxes computed in accordance with U.S. GAAP in that it adjusts for the items included in the calculation of ENI and also adjusts ENI to exclude net performance fees, investment income from investments in Carlyle funds, equity-based compensation and certain general, administrative and other expenses when the timing of any future payment is uncertain.
Distributable Earnings (“DE”) is FRE plus realized net performance fees and realized investment income, and is used to assess performance and amounts potentially available for distribution. DE is used by management primarily in making resource deployment and compensation decisions across the Partnership’s
four
reportable segments. Management also uses Distributable Earnings in our budgeting, forecasting, and the overall management of our segments. Management makes operating decisions and assesses the performance of each of the Partnership’s business segments based on financial and operating metrics and data that is presented without the consolidation of any of the Consolidated Funds. Consequently, the key performance measures discussed above and all segment data exclude the assets, liabilities and operating results related to the Consolidated Funds.
54
The Carlyle Group L.P.
Notes to the Condensed Consolidated Financial Statements
(Unaudited)
The following table presents the financial data for the Partnership’s
four
reportable segments for the
three months and six months ended June 30, 2017
:
|
|
Three Months Ended June 30, 2017
|
||||||||||||||||||
|
|
Corporate
Private Equity |
Real
Assets |
Global
Market Strategies |
Investment
Solutions |
Total
|
||||||||||||||
|
|
(Dollars in millions)
|
||||||||||||||||||
|
Segment Revenues
|
|||||||||||||||||||
|
Fund level fee revenues
|
|||||||||||||||||||
|
Fund management fees
|
$
|
117.7
|
|
$
|
58.2
|
|
$
|
45.1
|
|
$
|
36.2
|
|
$
|
257.2
|
|
||||
|
Portfolio advisory fees, net
|
4.5
|
|
0.1
|
|
0.3
|
|
—
|
|
4.9
|
|
|||||||||
|
Transaction fees, net
|
1.2
|
|
—
|
|
—
|
|
—
|
|
1.2
|
|
|||||||||
|
Total fund level fee revenues
|
123.4
|
|
58.3
|
|
45.4
|
|
36.2
|
|
263.3
|
|
|||||||||
|
Performance fees
|
|||||||||||||||||||
|
Realized
|
272.1
|
|
39.7
|
|
17.2
|
|
23.7
|
|
352.7
|
|
|||||||||
|
Unrealized
|
142.9
|
|
60.6
|
|
(1.6
|
)
|
4.7
|
|
206.6
|
|
|||||||||
|
Total performance fees
|
415.0
|
|
100.3
|
|
15.6
|
|
28.4
|
|
559.3
|
|
|||||||||
|
Investment income (loss)
|
|||||||||||||||||||
|
Realized
|
8.9
|
|
0.3
|
|
1.5
|
|
(0.1
|
)
|
10.6
|
|
|||||||||
|
Unrealized
|
13.3
|
|
6.8
|
|
0.1
|
|
0.4
|
|
20.6
|
|
|||||||||
|
Total investment income (loss)
|
22.2
|
|
7.1
|
|
1.6
|
|
0.3
|
|
31.2
|
|
|||||||||
|
Interest income
|
0.8
|
|
0.4
|
|
1.0
|
|
0.2
|
|
2.4
|
|
|||||||||
|
Other income
|
1.3
|
|
0.3
|
|
1.1
|
|
0.1
|
|
2.8
|
|
|||||||||
|
Total revenues
|
562.7
|
|
166.4
|
|
64.7
|
|
65.2
|
|
859.0
|
|
|||||||||
|
Segment Expenses
|
|||||||||||||||||||
|
Compensation and benefits
|
|||||||||||||||||||
|
Direct base compensation
|
54.7
|
|
17.4
|
|
15.2
|
|
16.1
|
|
103.4
|
|
|||||||||
|
Indirect base compensation
|
18.0
|
|
19.9
|
|
7.6
|
|
4.1
|
|
49.6
|
|
|||||||||
|
Equity-based compensation
|
17.8
|
|
9.3
|
|
7.5
|
|
2.1
|
|
36.7
|
|
|||||||||
|
Performance fee related
|
|||||||||||||||||||
|
Realized
|
121.6
|
|
17.4
|
|
8.2
|
|
23.4
|
|
170.6
|
|
|||||||||
|
Unrealized
|
69.4
|
|
19.2
|
|
(0.7
|
)
|
1.4
|
|
89.3
|
|
|||||||||
|
Total compensation and benefits
|
281.5
|
|
83.2
|
|
37.8
|
|
47.1
|
|
449.6
|
|
|||||||||
|
General, administrative, and other indirect expenses
|
28.4
|
|
26.5
|
|
21.8
|
|
8.7
|
|
85.4
|
|
|||||||||
|
Depreciation and amortization expense
|
3.7
|
|
1.6
|
|
1.3
|
|
0.9
|
|
7.5
|
|
|||||||||
|
Interest expense
|
7.3
|
|
4.4
|
|
3.2
|
|
1.5
|
|
16.4
|
|
|||||||||
|
Total expenses
|
320.9
|
|
115.7
|
|
64.1
|
|
58.2
|
|
558.9
|
|
|||||||||
|
Economic Net Income
|
$
|
241.8
|
|
$
|
50.7
|
|
$
|
0.6
|
|
$
|
7.0
|
|
$
|
300.1
|
|
||||
|
(-) Net Performance Fees
|
224.0
|
|
63.7
|
|
8.1
|
|
3.6
|
|
299.4
|
|
|||||||||
|
(-) Investment Income
|
22.2
|
|
7.1
|
|
1.6
|
|
0.3
|
|
31.2
|
|
|||||||||
|
(+) Equity-based Compensation
|
17.8
|
|
9.3
|
|
7.5
|
|
2.1
|
|
36.7
|
|
|||||||||
|
(=) Fee Related Earnings
|
$
|
13.4
|
|
$
|
(10.8
|
)
|
$
|
(1.6
|
)
|
$
|
5.2
|
|
$
|
6.2
|
|
||||
|
(+) Realized Net Performance Fees
|
150.5
|
|
22.3
|
|
9.0
|
|
0.3
|
|
182.1
|
|
|||||||||
|
(+) Realized Investment Income (Loss)
|
8.9
|
|
0.3
|
|
1.5
|
|
(0.1
|
)
|
10.6
|
|
|||||||||
|
(=) Distributable Earnings
|
$
|
172.8
|
|
$
|
11.8
|
|
$
|
8.9
|
|
$
|
5.4
|
|
$
|
198.9
|
|
||||
55
The Carlyle Group L.P.
Notes to the Condensed Consolidated Financial Statements
(Unaudited)
|
|
June 30, 2017 and the Six Months Then Ended
|
||||||||||||||||||
|
|
Corporate
Private Equity |
Real
Assets |
Global
Market Strategies |
Investment Solutions
|
Total
|
||||||||||||||
|
|
(Dollars in millions)
|
||||||||||||||||||
|
Segment Revenues
|
|||||||||||||||||||
|
Fund level fee revenues
|
|||||||||||||||||||
|
Fund management fees
|
$
|
233.4
|
|
$
|
114.2
|
|
$
|
93.2
|
|
$
|
72.0
|
|
$
|
512.8
|
|
||||
|
Portfolio advisory fees, net
|
8.3
|
|
0.2
|
|
0.4
|
|
—
|
|
8.9
|
|
|||||||||
|
Transaction fees, net
|
8.9
|
|
—
|
|
—
|
|
—
|
|
8.9
|
|
|||||||||
|
Total fund level fee revenues
|
250.6
|
|
114.4
|
|
93.6
|
|
72.0
|
|
530.6
|
|
|||||||||
|
Performance fees
|
|||||||||||||||||||
|
Realized
|
323.4
|
|
53.2
|
|
22.8
|
|
36.3
|
|
435.7
|
|
|||||||||
|
Unrealized
|
658.2
|
|
139.3
|
|
12.9
|
|
27.9
|
|
838.3
|
|
|||||||||
|
Total performance fees
|
981.6
|
|
192.5
|
|
35.7
|
|
64.2
|
|
1,274.0
|
|
|||||||||
|
Investment income (loss)
|
|||||||||||||||||||
|
Realized
|
9.1
|
|
(7.8
|
)
|
3.9
|
|
—
|
|
5.2
|
|
|||||||||
|
Unrealized
|
18.8
|
|
12.0
|
|
4.3
|
|
1.5
|
|
36.6
|
|
|||||||||
|
Total investment income (loss)
|
27.9
|
|
4.2
|
|
8.2
|
|
1.5
|
|
41.8
|
|
|||||||||
|
Interest income
|
1.9
|
|
1.0
|
|
2.6
|
|
0.3
|
|
5.8
|
|
|||||||||
|
Other income
|
2.6
|
|
0.7
|
|
4.5
|
|
0.2
|
|
8.0
|
|
|||||||||
|
Total revenues
|
1,264.6
|
|
312.8
|
|
144.6
|
|
138.2
|
|
1,860.2
|
|
|||||||||
|
Segment Expenses
|
|||||||||||||||||||
|
Compensation and benefits
|
|||||||||||||||||||
|
Direct base compensation
|
110.1
|
|
37.1
|
|
32.3
|
|
32.2
|
|
211.7
|
|
|||||||||
|
Indirect base compensation
|
36.7
|
|
30.8
|
|
14.2
|
|
6.9
|
|
88.6
|
|
|||||||||
|
Equity-based compensation
|
32.8
|
|
18.1
|
|
11.8
|
|
4.1
|
|
66.8
|
|
|||||||||
|
Performance fee related
|
|||||||||||||||||||
|
Realized
|
147.7
|
|
24.2
|
|
10.9
|
|
35.5
|
|
218.3
|
|
|||||||||
|
Unrealized
|
297.2
|
|
38.5
|
|
6.1
|
|
20.4
|
|
362.2
|
|
|||||||||
|
Total compensation and benefits
|
624.5
|
|
148.7
|
|
75.3
|
|
99.1
|
|
947.6
|
|
|||||||||
|
General, administrative, and other indirect expenses
|
63.4
|
|
42.1
|
|
45.0
|
|
15.5
|
|
166.0
|
|
|||||||||
|
Depreciation and amortization expense
|
7.4
|
|
3.4
|
|
2.5
|
|
1.7
|
|
15.0
|
|
|||||||||
|
Interest expense
|
14.1
|
|
8.5
|
|
5.8
|
|
3.0
|
|
31.4
|
|
|||||||||
|
Total expenses
|
709.4
|
|
202.7
|
|
128.6
|
|
119.3
|
|
1,160.0
|
|
|||||||||
|
Economic Net Income
|
$
|
555.2
|
|
$
|
110.1
|
|
$
|
16.0
|
|
$
|
18.9
|
|
$
|
700.2
|
|
||||
|
(-) Net Performance Fees
|
536.7
|
|
129.8
|
|
18.7
|
|
8.3
|
|
693.5
|
|
|||||||||
|
(-) Investment Income
|
27.9
|
|
4.2
|
|
8.2
|
|
1.5
|
|
41.8
|
|
|||||||||
|
(+) Equity-based Compensation
|
32.8
|
|
18.1
|
|
11.8
|
|
4.1
|
|
66.8
|
|
|||||||||
|
(=) Fee Related Earnings
|
$
|
23.4
|
|
$
|
(5.8
|
)
|
$
|
0.9
|
|
$
|
13.2
|
|
$
|
31.7
|
|
||||
|
(+) Realized Net Performance Fees
|
175.7
|
|
29.0
|
|
11.9
|
|
0.8
|
|
217.4
|
|
|||||||||
|
(+) Realized Investment Income (Loss)
|
9.1
|
|
(7.8
|
)
|
3.9
|
|
—
|
|
5.2
|
|
|||||||||
|
(=) Distributable Earnings
|
$
|
208.2
|
|
$
|
15.4
|
|
$
|
16.7
|
|
$
|
14.0
|
|
$
|
254.3
|
|
||||
|
Segment assets as of June 30, 2017
|
$
|
3,153.5
|
|
$
|
1,697.8
|
|
$
|
892.8
|
|
$
|
928.5
|
|
$
|
6,672.6
|
|
||||
56
The Carlyle Group L.P.
Notes to the Condensed Consolidated Financial Statements
(Unaudited)
The following table presents the financial data for the Partnership’s
four
reportable segments for the
three months and six months ended June 30, 2016
:
|
|
Three Months Ended June 30, 2016
|
||||||||||||||||||
|
Corporate
Private Equity |
Real
Assets |
Global
Market Strategies |
Investment
Solutions |
Total
|
|||||||||||||||
|
|
(Dollars in millions)
|
||||||||||||||||||
|
Segment Revenues
|
|||||||||||||||||||
|
Fund level fee revenues
|
|||||||||||||||||||
|
Fund management fees
|
$
|
126.8
|
|
$
|
66.5
|
|
$
|
52.2
|
|
$
|
34.2
|
|
$
|
279.7
|
|
||||
|
Portfolio advisory fees, net
|
5.2
|
|
0.1
|
|
0.5
|
|
—
|
|
5.8
|
|
|||||||||
|
Transaction fees, net
|
2.6
|
|
—
|
|
—
|
|
—
|
|
2.6
|
|
|||||||||
|
Total fund level fee revenues
|
134.6
|
|
66.6
|
|
52.7
|
|
34.2
|
|
288.1
|
|
|||||||||
|
Performance fees
|
|||||||||||||||||||
|
Realized
|
337.9
|
|
58.8
|
|
5.4
|
|
4.2
|
|
406.3
|
|
|||||||||
|
Unrealized
|
(278.9
|
)
|
66.1
|
|
1.8
|
|
15.0
|
|
(196.0
|
)
|
|||||||||
|
Total performance fees
|
59.0
|
|
124.9
|
|
7.2
|
|
19.2
|
|
210.3
|
|
|||||||||
|
Investment income (loss)
|
|||||||||||||||||||
|
Realized
|
18.0
|
|
(9.5
|
)
|
0.8
|
|
—
|
|
9.3
|
|
|||||||||
|
Unrealized
|
3.0
|
|
6.7
|
|
9.9
|
|
—
|
|
19.6
|
|
|||||||||
|
Total investment income (loss)
|
21.0
|
|
(2.8
|
)
|
10.7
|
|
—
|
|
28.9
|
|
|||||||||
|
Interest income
|
0.9
|
|
0.4
|
|
1.1
|
|
0.1
|
|
2.5
|
|
|||||||||
|
Other income
|
1.2
|
|
0.2
|
|
1.2
|
|
0.1
|
|
2.7
|
|
|||||||||
|
Total revenues
|
216.7
|
|
189.3
|
|
72.9
|
|
53.6
|
|
532.5
|
|
|||||||||
|
Segment Expenses
|
|||||||||||||||||||
|
Compensation and benefits
|
|||||||||||||||||||
|
Direct base compensation
|
53.3
|
|
18.0
|
|
22.2
|
|
15.0
|
|
108.5
|
|
|||||||||
|
Indirect base compensation
|
18.2
|
|
10.1
|
|
7.0
|
|
3.1
|
|
38.4
|
|
|||||||||
|
Equity-based compensation
|
18.4
|
|
7.0
|
|
4.4
|
|
1.1
|
|
30.9
|
|
|||||||||
|
Performance fee related
|
|||||||||||||||||||
|
Realized
|
143.3
|
|
25.3
|
|
0.7
|
|
3.7
|
|
173.0
|
|
|||||||||
|
Unrealized
|
(117.4
|
)
|
26.1
|
|
2.0
|
|
11.2
|
|
(78.1
|
)
|
|||||||||
|
Total compensation and benefits
|
115.8
|
|
86.5
|
|
36.3
|
|
34.1
|
|
272.7
|
|
|||||||||
|
General, administrative, and other indirect expenses
|
32.0
|
|
18.6
|
|
20.2
|
|
7.9
|
|
78.7
|
|
|||||||||
|
Depreciation and amortization expense
|
3.4
|
|
1.5
|
|
1.6
|
|
0.8
|
|
7.3
|
|
|||||||||
|
Interest expense
|
7.3
|
|
4.0
|
|
2.8
|
|
1.4
|
|
15.5
|
|
|||||||||
|
Total expenses
|
158.5
|
|
110.6
|
|
60.9
|
|
44.2
|
|
374.2
|
|
|||||||||
|
Economic Net Income
|
$
|
58.2
|
|
$
|
78.7
|
|
$
|
12.0
|
|
$
|
9.4
|
|
$
|
158.3
|
|
||||
|
(-) Net Performance Fees
|
33.1
|
|
73.5
|
|
4.5
|
|
4.3
|
|
115.4
|
|
|||||||||
|
(-) Investment Income (Loss)
|
21.0
|
|
(2.8
|
)
|
10.7
|
|
—
|
|
28.9
|
|
|||||||||
|
(+) Equity-based Compensation
|
18.4
|
|
7.0
|
|
4.4
|
|
1.1
|
|
30.9
|
|
|||||||||
|
(=) Fee Related Earnings
|
$
|
22.5
|
|
$
|
15.0
|
|
$
|
1.2
|
|
$
|
6.2
|
|
$
|
44.9
|
|
||||
|
(+) Realized Net Performance Fees
|
194.6
|
|
33.5
|
|
4.7
|
|
0.5
|
|
233.3
|
|
|||||||||
|
(+) Realized Investment Income (Loss)
|
18.0
|
|
(9.5
|
)
|
0.8
|
|
—
|
|
9.3
|
|
|||||||||
|
(=) Distributable Earnings
|
$
|
235.1
|
|
$
|
39.0
|
|
$
|
6.7
|
|
$
|
6.7
|
|
$
|
287.5
|
|
||||
57
The Carlyle Group L.P.
Notes to the Condensed Consolidated Financial Statements
(Unaudited)
|
|
Six Months Ended June 30, 2016
|
||||||||||||||||||
|
Corporate
Private Equity |
Real
Assets |
Global
Market Strategies |
Investment Solutions
|
Total
|
|||||||||||||||
|
|
(Dollars in millions)
|
||||||||||||||||||
|
Segment Revenues
|
|||||||||||||||||||
|
Fund level fee revenues
|
|||||||||||||||||||
|
Fund management fees
|
$
|
254.0
|
|
$
|
131.7
|
|
$
|
103.3
|
|
$
|
70.6
|
|
$
|
559.6
|
|
||||
|
Portfolio advisory fees, net
|
8.3
|
|
0.1
|
|
0.6
|
|
—
|
|
9.0
|
|
|||||||||
|
Transaction fees, net
|
22.9
|
|
—
|
|
—
|
|
—
|
|
22.9
|
|
|||||||||
|
Total fund level fee revenues
|
285.2
|
|
131.8
|
|
103.9
|
|
70.6
|
|
591.5
|
|
|||||||||
|
Performance fees
|
|||||||||||||||||||
|
Realized
|
464.1
|
|
60.6
|
|
7.2
|
|
6.4
|
|
538.3
|
|
|||||||||
|
Unrealized
|
(372.0
|
)
|
163.8
|
|
1.5
|
|
26.7
|
|
(180.0
|
)
|
|||||||||
|
Total performance fees
|
92.1
|
|
224.4
|
|
8.7
|
|
33.1
|
|
358.3
|
|
|||||||||
|
Investment income (loss)
|
|||||||||||||||||||
|
Realized
|
22.5
|
|
(7.3
|
)
|
1.6
|
|
—
|
|
16.8
|
|
|||||||||
|
Unrealized
|
(3.1
|
)
|
2.0
|
|
7.8
|
|
(1.0
|
)
|
5.7
|
|
|||||||||
|
Total investment income (loss)
|
19.4
|
|
(5.3
|
)
|
9.4
|
|
(1.0
|
)
|
22.5
|
|
|||||||||
|
Interest income
|
1.8
|
|
0.9
|
|
2.6
|
|
0.2
|
|
5.5
|
|
|||||||||
|
Other income
|
2.7
|
|
0.6
|
|
2.3
|
|
0.2
|
|
5.8
|
|
|||||||||
|
Total revenues
|
401.2
|
|
352.4
|
|
126.9
|
|
103.1
|
|
983.6
|
|
|||||||||
|
Segment Expenses
|
|||||||||||||||||||
|
Compensation and benefits
|
|||||||||||||||||||
|
Direct base compensation
|
113.1
|
|
38.2
|
|
45.4
|
|
33.6
|
|
230.3
|
|
|||||||||
|
Indirect base compensation
|
37.8
|
|
19.3
|
|
15.2
|
|
5.9
|
|
78.2
|
|
|||||||||
|
Equity-based compensation
|
36.2
|
|
13.2
|
|
9.4
|
|
3.5
|
|
62.3
|
|
|||||||||
|
Performance fee related
|
|||||||||||||||||||
|
Realized
|
201.9
|
|
26.1
|
|
1.5
|
|
5.4
|
|
234.9
|
|
|||||||||
|
Unrealized
|
(162.1
|
)
|
70.9
|
|
0.9
|
|
23.0
|
|
(67.3
|
)
|
|||||||||
|
Total compensation and benefits
|
226.9
|
|
167.7
|
|
72.4
|
|
71.4
|
|
538.4
|
|
|||||||||
|
General, administrative, and other indirect expenses
|
62.9
|
|
33.5
|
|
39.4
|
|
17.3
|
|
153.1
|
|
|||||||||
|
Depreciation and amortization expense
|
6.8
|
|
3.0
|
|
3.1
|
|
1.7
|
|
14.6
|
|
|||||||||
|
Interest expense
|
14.2
|
|
8.0
|
|
5.5
|
|
3.0
|
|
30.7
|
|
|||||||||
|
Total expenses
|
310.8
|
|
212.2
|
|
120.4
|
|
93.4
|
|
736.8
|
|
|||||||||
|
Economic Net Income
|
$
|
90.4
|
|
$
|
140.2
|
|
$
|
6.5
|
|
$
|
9.7
|
|
$
|
246.8
|
|
||||
|
(-) Net Performance Fees
|
52.3
|
|
127.4
|
|
6.3
|
|
4.7
|
|
190.7
|
|
|||||||||
|
(-) Investment Income (Loss)
|
19.4
|
|
(5.3
|
)
|
9.4
|
|
(1.0
|
)
|
22.5
|
|
|||||||||
|
(+) Equity-based Compensation
|
36.2
|
|
13.2
|
|
9.4
|
|
3.5
|
|
62.3
|
|
|||||||||
|
(=) Fee Related Earnings
|
$
|
54.9
|
|
$
|
31.3
|
|
$
|
0.2
|
|
$
|
9.5
|
|
$
|
95.9
|
|
||||
|
(+) Realized Net Performance Fees
|
262.2
|
|
34.5
|
|
5.7
|
|
1.0
|
|
303.4
|
|
|||||||||
|
(+) Realized Investment Income (Loss)
|
22.5
|
|
(7.3
|
)
|
1.6
|
|
—
|
|
16.8
|
|
|||||||||
|
(=) Distributable Earnings
|
$
|
339.6
|
|
$
|
58.5
|
|
$
|
7.5
|
|
$
|
10.5
|
|
$
|
416.1
|
|
||||
58
The Carlyle Group L.P.
Notes to the Condensed Consolidated Financial Statements
(Unaudited)
The following table reconciles the Total Segments to the Partnership’s Income Before Provision for Taxes for the
three months ended June 30, 2017 and 2016
.
|
|
Three Months Ended June 30, 2017
|
||||||||||||||||
|
|
Total Reportable Segments
|
Consolidated Funds
|
Reconciling Items
|
Carlyle Consolidated
|
|||||||||||||
|
|
|||||||||||||||||
|
|
(Dollars in millions)
|
||||||||||||||||
|
Revenues
|
$
|
859.0
|
|
$
|
45.0
|
|
$
|
4.4
|
|
(a)
|
$
|
908.4
|
|
||||
|
Expenses
|
$
|
558.9
|
|
$
|
91.9
|
|
$
|
54.6
|
|
(b)
|
$
|
705.4
|
|
||||
|
Other income
|
$
|
—
|
|
$
|
40.7
|
|
$
|
—
|
|
(c)
|
$
|
40.7
|
|
||||
|
Economic net income
|
$
|
300.1
|
|
$
|
(6.2
|
)
|
$
|
(50.2
|
)
|
(d)
|
$
|
243.7
|
|
||||
|
|
Three Months Ended June 30, 2016
|
||||||||||||||||
|
|
Total Reportable Segments
|
Consolidated Funds
|
Reconciling Items
|
|
Carlyle Consolidated
|
||||||||||||
|
|
|
||||||||||||||||
|
|
(Dollars in millions)
|
||||||||||||||||
|
Revenues
|
$
|
532.5
|
|
$
|
35.9
|
|
$
|
39.6
|
|
(a)
|
$
|
608.0
|
|
||||
|
Expenses
|
$
|
374.2
|
|
$
|
35.0
|
|
$
|
137.7
|
|
(b)
|
$
|
546.9
|
|
||||
|
Other income
|
$
|
—
|
|
$
|
6.7
|
|
$
|
—
|
|
(c)
|
$
|
6.7
|
|
||||
|
Economic net income (loss)
|
$
|
158.3
|
|
$
|
7.6
|
|
$
|
(98.1
|
)
|
(d)
|
$
|
67.8
|
|
||||
The following table reconciles the Total Segments to the Partnership’s Income Before Provision for Taxes for the
six months ended June 30, 2017 and 2016
, and Total Assets as of
June 30, 2017
.
|
|
June 30, 2017 and the Six Months Then Ended
|
||||||||||||||||
|
|
Total Reportable Segments
|
Consolidated Funds
|
Reconciling Items
|
Carlyle Consolidated
|
|||||||||||||
|
|
|||||||||||||||||
|
|
(Dollars in millions)
|
||||||||||||||||
|
Revenues
|
$
|
1,860.2
|
|
$
|
87.9
|
|
$
|
80.4
|
|
(a)
|
$
|
2,028.5
|
|
||||
|
Expenses
|
$
|
1,160.0
|
|
$
|
144.9
|
|
$
|
210.0
|
|
(b)
|
$
|
1,514.9
|
|
||||
|
Other income
|
$
|
—
|
|
$
|
57.8
|
|
$
|
—
|
|
(c)
|
$
|
57.8
|
|
||||
|
Economic net income
|
$
|
700.2
|
|
$
|
0.8
|
|
$
|
(129.6
|
)
|
(d)
|
$
|
571.4
|
|
||||
|
Total assets
|
$
|
6,672.6
|
|
$
|
4,383.9
|
|
$
|
(200.1
|
)
|
(e)
|
$
|
10,856.4
|
|
||||
|
|
Six Months Ended June 30, 2016
|
||||||||||||||||
|
|
Total Reportable Segments
|
Consolidated Funds
|
Reconciling Items
|
|
Carlyle Consolidated
|
||||||||||||
|
|
|
||||||||||||||||
|
|
(Dollars in millions)
|
||||||||||||||||
|
Revenues
|
$
|
983.6
|
|
$
|
64.8
|
|
$
|
42.7
|
|
(a)
|
$
|
1,091.1
|
|
||||
|
Expenses
|
$
|
736.8
|
|
$
|
64.7
|
|
$
|
204.8
|
|
(b)
|
$
|
1,006.3
|
|
||||
|
Other loss
|
$
|
—
|
|
$
|
(1.7
|
)
|
$
|
—
|
|
(c)
|
$
|
(1.7
|
)
|
||||
|
Economic net income (loss)
|
$
|
246.8
|
|
$
|
(1.6
|
)
|
$
|
(162.1
|
)
|
(d)
|
$
|
83.1
|
|
||||
|
(a)
|
The Revenues adjustment principally represents fund management and performance fees earned from the Consolidated Funds which were eliminated in consolidation to arrive at the Partnership’s total revenues, adjustments for amounts attributable to non-controlling interests in consolidated entities, adjustments related to expenses associated with the investments in NGP Management and its affiliates that are included in operating captions or are excluded from the segment results, adjustments to reflect the Partnership’s share of Urbplan’s net losses as a component of investment income, the inclusion of tax expenses associated with certain performance fees, and adjustments to reflect the
|
59
The Carlyle Group L.P.
Notes to the Condensed Consolidated Financial Statements
(Unaudited)
Partnership’s ownership interests in Claren Road
(through January 2017) and
ESG (through June 2016) that were included in Revenues in the Partnership’s segment reporting.
|
(b)
|
The Expenses adjustment represents the elimination of intercompany expenses of the Consolidated Funds payable to the Partnership, the inclusion of certain tax expenses associated with performance fee compensation, adjustments related to expenses associated with the investment in NGP Management that are included in operating captions, adjustments to reflect the Partnership’s share of Urbplan’s net losses as a component of investment income, changes in the tax receivable agreement liability, charges and credits associated with Carlyle corporate actions and non-recurring items and adjustments to reflect the Partnership’s economic interests in Claren Road
(through January 2017) and
ESG (through June 2016), as detailed below (Dollars in millions):
|
|
Three Months Ended June 30,
|
Six Months Ended June 30,
|
||||||||||||||
|
|
2017
|
2016
|
2017
|
2016
|
|||||||||||
|
Equity-based compensation issued in conjunction with the initial public offering, acquisitions and strategic investments
|
$
|
58.5
|
|
$
|
79.3
|
|
$
|
125.5
|
|
$
|
124.7
|
|
|||
|
Acquisition related charges, including amortization of intangibles and impairment
|
9.2
|
|
21.6
|
|
18.0
|
|
39.3
|
|
|||||||
|
Other non-operating expense
|
0.1
|
|
0.7
|
|
0.1
|
|
4.5
|
|
|||||||
|
Tax expense associated with performance fees
|
(2.4
|
)
|
(10.8
|
)
|
(5.3
|
)
|
(14.1
|
)
|
|||||||
|
Non-Carlyle economic interests in acquired businesses and the consolidated real estate VIE
|
(4.9
|
)
|
48.9
|
|
82.6
|
|
51.3
|
|
|||||||
|
Severance and other adjustments
|
7.5
|
|
1.4
|
|
10.3
|
|
8.8
|
|
|||||||
|
Elimination of expenses of Consolidated Funds
|
(13.4
|
)
|
(3.4
|
)
|
(21.2
|
)
|
(9.7
|
)
|
|||||||
|
$
|
54.6
|
|
$
|
137.7
|
|
$
|
210.0
|
|
$
|
204.8
|
|
||||
|
(c)
|
The Other Income (Loss) adjustment results from the Consolidated Funds which were eliminated in consolidation to arrive at the Partnership’s total Other Income (Loss).
|
|
(d)
|
The following table is a reconciliation of Income Before Provision for Income Taxes to Economic Net Income, to Fee Related Earnings, and to Distributable Earnings (Dollars in millions):
|
|
Three Months Ended June 30,
|
Six Months Ended June 30,
|
||||||||||||||
|
|
2017
|
2016
|
2017
|
2016
|
|||||||||||
|
Income before provision for income taxes
|
$
|
243.7
|
|
$
|
67.8
|
|
$
|
571.4
|
|
$
|
83.1
|
|
|||
|
Adjustments:
|
|||||||||||||||
|
Equity-based compensation issued in conjunction with the initial public offering, acquisitions and strategic investments
|
58.5
|
|
79.3
|
|
125.5
|
|
124.7
|
|
|||||||
|
Acquisition related charges, including amortization of intangibles and impairment
|
9.2
|
|
21.6
|
|
18.0
|
|
39.3
|
|
|||||||
|
Other non-operating expense
|
0.1
|
|
0.7
|
|
0.1
|
|
4.5
|
|
|||||||
|
Tax provision associated with performance fees
|
(2.4
|
)
|
(10.8
|
)
|
(5.3
|
)
|
(14.1
|
)
|
|||||||
|
Net (income) loss attributable to non-controlling interests in consolidated entities
|
(16.5
|
)
|
(1.6
|
)
|
(19.8
|
)
|
0.7
|
|
|||||||
|
Severance and other adjustments
|
7.5
|
|
1.3
|
|
10.3
|
|
8.6
|
|
|||||||
|
Economic Net Income
|
$
|
300.1
|
|
$
|
158.3
|
|
$
|
700.2
|
|
$
|
246.8
|
|
|||
|
Net performance fees
(1)
|
299.4
|
|
115.4
|
|
693.5
|
|
190.7
|
|
|||||||
|
Investment income
(1)
|
31.2
|
|
28.9
|
|
41.8
|
|
22.5
|
|
|||||||
|
Equity-based compensation
|
36.7
|
|
30.9
|
|
66.8
|
|
62.3
|
|
|||||||
|
Fee Related Earnings
|
$
|
6.2
|
|
$
|
44.9
|
|
$
|
31.7
|
|
$
|
95.9
|
|
|||
|
Realized performance fees, net of related compensation
|
182.1
|
|
233.3
|
|
217.4
|
|
303.4
|
|
|||||||
|
Realized investment income
(1)
|
10.6
|
|
9.3
|
|
5.2
|
|
16.8
|
|
|||||||
|
Distributable Earnings
|
$
|
198.9
|
|
$
|
287.5
|
|
$
|
254.3
|
|
$
|
416.1
|
|
|||
60
The Carlyle Group L.P.
Notes to the Condensed Consolidated Financial Statements
(Unaudited)
(1) See reconciliation to most directly comparable U.S. GAAP measure below:
|
|
Three Months Ended June 30, 2017
|
||||||||||
|
|
Carlyle
Consolidated |
Adjustments
(2)
|
Total
Reportable Segments |
||||||||
|
|
(Dollars in millions)
|
||||||||||
|
Performance fees
|
|||||||||||
|
Realized
|
$
|
357.7
|
|
$
|
(5.0
|
)
|
$
|
352.7
|
|
||
|
Unrealized
|
185.9
|
|
20.7
|
|
206.6
|
|
|||||
|
Total performance fees
|
543.6
|
|
15.7
|
|
559.3
|
|
|||||
|
Performance fee related compensation expense
|
|||||||||||
|
Realized
|
166.7
|
|
3.9
|
|
170.6
|
|
|||||
|
Unrealized
|
90.4
|
|
(1.1
|
)
|
89.3
|
|
|||||
|
Total performance fee related compensation expense
|
257.1
|
|
2.8
|
|
259.9
|
|
|||||
|
Net performance fees
|
|||||||||||
|
Realized
|
191.0
|
|
(8.9
|
)
|
182.1
|
|
|||||
|
Unrealized
|
95.5
|
|
21.8
|
|
117.3
|
|
|||||
|
Total net performance fees
|
$
|
286.5
|
|
$
|
12.9
|
|
$
|
299.4
|
|
||
|
Investment income (loss)
|
|||||||||||
|
Realized
|
$
|
26.7
|
|
$
|
(16.1
|
)
|
$
|
10.6
|
|
||
|
Unrealized
|
32.3
|
|
(11.7
|
)
|
20.6
|
|
|||||
|
Investment income (loss)
|
$
|
59.0
|
|
$
|
(27.8
|
)
|
$
|
31.2
|
|
||
|
|
Three Months Ended June 30, 2016
|
||||||||||
|
|
Carlyle
Consolidated |
Adjustments
(2)
|
Total
Reportable Segments |
||||||||
|
|
(Dollars in millions)
|
||||||||||
|
Performance fees
|
|||||||||||
|
Realized
|
$
|
389.9
|
|
$
|
16.4
|
|
$
|
406.3
|
|
||
|
Unrealized
|
(179.0
|
)
|
(17.0
|
)
|
(196.0
|
)
|
|||||
|
Total performance fees
|
210.9
|
|
(0.6
|
)
|
210.3
|
|
|||||
|
Performance fee related compensation expense
|
|||||||||||
|
Realized
|
172.4
|
|
0.6
|
|
173.0
|
|
|||||
|
Unrealized
|
(75.9
|
)
|
(2.2
|
)
|
(78.1
|
)
|
|||||
|
Total performance fee related compensation expense
|
96.5
|
|
(1.6
|
)
|
94.9
|
|
|||||
|
Net performance fees
|
|||||||||||
|
Realized
|
217.5
|
|
15.8
|
|
233.3
|
|
|||||
|
Unrealized
|
(103.1
|
)
|
(14.8
|
)
|
(117.9
|
)
|
|||||
|
Total net performance fees
|
$
|
114.4
|
|
$
|
1.0
|
|
$
|
115.4
|
|
||
|
Investment income (loss)
|
|||||||||||
|
Realized
|
$
|
38.9
|
|
$
|
(29.6
|
)
|
$
|
9.3
|
|
||
|
Unrealized
|
26.4
|
|
(6.8
|
)
|
19.6
|
|
|||||
|
Total investment income (loss)
|
$
|
65.3
|
|
$
|
(36.4
|
)
|
$
|
28.9
|
|
||
61
The Carlyle Group L.P.
Notes to the Condensed Consolidated Financial Statements
(Unaudited)
|
Six Months Ended June 30, 2017
|
|||||||||||
|
Carlyle
Consolidated |
Adjustments
(2)
|
Total
Reportable Segments |
|||||||||
|
(Dollars in millions)
|
|||||||||||
|
Performance fees
|
|||||||||||
|
Realized
|
$
|
440.9
|
|
$
|
(5.2
|
)
|
$
|
435.7
|
|
||
|
Unrealized
|
784.3
|
|
54.0
|
|
838.3
|
|
|||||
|
Total performance fees
|
1,225.2
|
|
48.8
|
|
1,274.0
|
|
|||||
|
Performance fee related compensation expense
|
|||||||||||
|
Realized
|
212.5
|
|
5.8
|
|
218.3
|
|
|||||
|
Unrealized
|
361.7
|
|
0.5
|
|
362.2
|
|
|||||
|
Total performance fee related compensation expense
|
574.2
|
|
6.3
|
|
580.5
|
|
|||||
|
Net performance fees
|
|||||||||||
|
Realized
|
228.4
|
|
(11.0
|
)
|
217.4
|
|
|||||
|
Unrealized
|
422.6
|
|
53.5
|
|
476.1
|
|
|||||
|
Total net performance fees
|
$
|
651.0
|
|
$
|
42.5
|
|
$
|
693.5
|
|
||
|
Investment income (loss)
|
|||||||||||
|
Realized
|
$
|
26.5
|
|
$
|
(21.3
|
)
|
$
|
5.2
|
|
||
|
Unrealized
|
78.8
|
|
(42.2
|
)
|
36.6
|
|
|||||
|
Investment income (loss)
|
$
|
105.3
|
|
$
|
(63.5
|
)
|
$
|
41.8
|
|
||
|
Six Months Ended June 30, 2016
|
|||||||||||
|
Carlyle
Consolidated |
Adjustments
(2)
|
Total
Reportable Segments |
|||||||||
|
(Dollars in millions)
|
|||||||||||
|
Performance fees
|
|||||||||||
|
Realized
|
$
|
521.7
|
|
$
|
16.6
|
|
$
|
538.3
|
|
||
|
Unrealized
|
(165.6
|
)
|
(14.4
|
)
|
(180.0
|
)
|
|||||
|
Total performance fees
|
356.1
|
|
2.2
|
|
358.3
|
|
|||||
|
Performance fee related compensation expense
|
|||||||||||
|
Realized
|
234.0
|
|
0.9
|
|
234.9
|
|
|||||
|
Unrealized
|
(68.0
|
)
|
0.7
|
|
(67.3
|
)
|
|||||
|
Total performance fee related compensation expense
|
166.0
|
|
1.6
|
|
167.6
|
|
|||||
|
Net performance fees
|
|||||||||||
|
Realized
|
287.7
|
|
15.7
|
|
303.4
|
|
|||||
|
Unrealized
|
(97.6
|
)
|
(15.1
|
)
|
(112.7
|
)
|
|||||
|
Total net performance fees
|
$
|
190.1
|
|
$
|
0.6
|
|
$
|
190.7
|
|
||
|
Investment income (loss)
|
|||||||||||
|
Realized
|
$
|
51.5
|
|
$
|
(34.7
|
)
|
$
|
16.8
|
|
||
|
Unrealized
|
4.2
|
|
1.5
|
|
5.7
|
|
|||||
|
Total investment income (loss)
|
$
|
55.7
|
|
$
|
(33.2
|
)
|
$
|
22.5
|
|
||
(2) Adjustments to performance fees and investment income (loss) relate to (i) amounts earned from the Consolidated Funds, which were eliminated in the U.S. GAAP consolidation but were included in the segment results, (ii) amounts attributable to non-controlling interests in consolidated entities, which were excluded from the segment results, (iii) the reclassification of NGP performance fees, which are included in investment income in U.S. GAAP financial statements, and (iv) the
62
The Carlyle Group L.P.
Notes to the Condensed Consolidated Financial Statements
(Unaudited)
reclassification of certain tax expenses associated with performance fees. Adjustments to investment income (loss) also include the reclassification of earnings for the investments in NGP Management and its affiliates to the appropriate operating captions for the segment results, the exclusion of charges associated with the investment in NGP Management and its affiliates that are excluded from the segment results, and adjustments to reflect the Partnership’s share of Urbplan’s net losses as investment losses for the segment results. Adjustments are also included in these financial statement captions to reflect the Partnership’s economic interests in Claren Road
(through January 2017) and
ESG (through June 2016).
(e) The Total Assets adjustment represents the addition of the assets of the Consolidated Funds that were eliminated in consolidation to arrive at the Partnership’s total assets.
18. Subsequent Events
In August 2017, the Board of Directors of the general partner of the Partnership declared a quarterly distribution of
$0.42
per common unit to common unitholders of record at the close of business on
August 14, 2017
, payable on
August 21, 2017
.
63
The Carlyle Group L.P.
Notes to the Condensed Consolidated Financial Statements
(Unaudited)
19. Supplemental Financial Information
The following supplemental financial information illustrates the consolidating effects of the Consolidated Funds on the Partnership’s financial position as of
June 30, 2017
and
December 31, 2016
and results of operations for the
three months and six months ended June 30, 2017
and
2016
. The supplemental statement of cash flows is presented without effects of the Consolidated Funds.
|
|
As of June 30, 2017
|
||||||||||||||
|
|
Consolidated
Operating Entities |
Consolidated
Funds |
Eliminations
|
Consolidated
|
|||||||||||
|
|
(Dollars in millions)
|
||||||||||||||
|
Assets
|
|||||||||||||||
|
Cash and cash equivalents
|
$
|
789.9
|
|
$
|
—
|
|
$
|
—
|
|
$
|
789.9
|
|
|||
|
Cash and cash equivalents held at Consolidated Funds
|
—
|
|
416.1
|
|
—
|
|
416.1
|
|
|||||||
|
Restricted cash
|
9.4
|
|
—
|
|
—
|
|
9.4
|
|
|||||||
|
Corporate treasury investments
|
115.4
|
|
—
|
|
—
|
|
115.4
|
|
|||||||
|
Accrued performance fees
|
3,364.5
|
|
—
|
|
—
|
|
3,364.5
|
|
|||||||
|
Investments
|
1,497.6
|
|
—
|
|
(195.3
|
)
|
1,302.3
|
|
|||||||
|
Investments of Consolidated Funds
|
—
|
|
3,907.7
|
|
—
|
|
3,907.7
|
|
|||||||
|
Due from affiliates and other receivables, net
|
257.9
|
|
—
|
|
(4.8
|
)
|
253.1
|
|
|||||||
|
Due from affiliates and other receivables of Consolidated Funds, net
|
—
|
|
60.1
|
|
—
|
|
60.1
|
|
|||||||
|
Receivables and inventory of a consolidated real estate VIE
|
167.2
|
|
—
|
|
—
|
|
167.2
|
|
|||||||
|
Fixed assets, net
|
98.6
|
|
—
|
|
—
|
|
98.6
|
|
|||||||
|
Deposits and other
|
50.3
|
|
—
|
|
—
|
|
50.3
|
|
|||||||
|
Other assets of a consolidated real estate VIE
|
33.0
|
|
—
|
|
—
|
|
33.0
|
|
|||||||
|
Intangible assets, net
|
39.5
|
|
—
|
|
—
|
|
39.5
|
|
|||||||
|
Deferred tax assets
|
249.3
|
|
—
|
|
—
|
|
249.3
|
|
|||||||
|
Total assets
|
$
|
6,672.6
|
|
$
|
4,383.9
|
|
$
|
(200.1
|
)
|
$
|
10,856.4
|
|
|||
|
Liabilities and partners’ capital
|
|||||||||||||||
|
Debt obligations
|
$
|
1,437.1
|
|
$
|
—
|
|
$
|
—
|
|
$
|
1,437.1
|
|
|||
|
Loans payable of Consolidated Funds
|
—
|
|
3,721.2
|
|
—
|
|
3,721.2
|
|
|||||||
|
Loans payable of a consolidated real estate VIE at fair value (principal amount of $145.3 million)
|
72.6
|
|
—
|
|
—
|
|
72.6
|
|
|||||||
|
Accounts payable, accrued expenses and other liabilities
|
305.2
|
|
—
|
|
—
|
|
305.2
|
|
|||||||
|
Accrued compensation and benefits
|
2,017.8
|
|
—
|
|
—
|
|
2,017.8
|
|
|||||||
|
Due to affiliates
|
234.6
|
|
0.2
|
|
—
|
|
234.8
|
|
|||||||
|
Deferred revenue
|
83.4
|
|
—
|
|
—
|
|
83.4
|
|
|||||||
|
Deferred tax liabilities
|
78.0
|
|
—
|
|
—
|
|
78.0
|
|
|||||||
|
Other liabilities of Consolidated Funds
|
—
|
|
481.0
|
|
(32.1
|
)
|
448.9
|
|
|||||||
|
Other liabilities of a consolidated real estate VIE
|
173.4
|
|
—
|
|
—
|
|
173.4
|
|
|||||||
|
Accrued giveback obligations
|
162.2
|
|
—
|
|
—
|
|
162.2
|
|
|||||||
|
Total liabilities
|
4,564.3
|
|
4,202.4
|
|
(32.1
|
)
|
8,734.6
|
|
|||||||
|
Partners’ capital
|
603.0
|
|
44.8
|
|
(44.8
|
)
|
603.0
|
|
|||||||
|
Accumulated other comprehensive loss
|
(92.1
|
)
|
1.4
|
|
(1.7
|
)
|
(92.4
|
)
|
|||||||
|
Non-controlling interests in consolidated entities
|
265.8
|
|
14.7
|
|
—
|
|
280.5
|
|
|||||||
|
Non-controlling interests in Carlyle Holdings
|
1,331.6
|
|
120.6
|
|
(121.5
|
)
|
1,330.7
|
|
|||||||
|
Total partners’ capital
|
2,108.3
|
|
181.5
|
|
(168.0
|
)
|
2,121.8
|
|
|||||||
|
Total liabilities and partners’ capital
|
$
|
6,672.6
|
|
$
|
4,383.9
|
|
$
|
(200.1
|
)
|
$
|
10,856.4
|
|
|||
64
The Carlyle Group L.P.
Notes to the Condensed Consolidated Financial Statements
(Unaudited)
|
|
As of December 31, 2016
|
||||||||||||||
|
|
Consolidated
Operating Entities |
Consolidated
Funds |
Eliminations
|
Consolidated
|
|||||||||||
|
|
(Dollars in millions)
|
||||||||||||||
|
Assets
|
|||||||||||||||
|
Cash and cash equivalents
|
$
|
670.9
|
|
$
|
—
|
|
$
|
—
|
|
$
|
670.9
|
|
|||
|
Cash and cash equivalents held at Consolidated Funds
|
—
|
|
761.5
|
|
—
|
|
761.5
|
|
|||||||
|
Restricted cash
|
13.1
|
|
—
|
|
—
|
|
13.1
|
|
|||||||
|
Corporate treasury investments
|
190.2
|
|
—
|
|
—
|
|
190.2
|
|
|||||||
|
Accrued performance fees
|
2,481.1
|
|
—
|
|
—
|
|
2,481.1
|
|
|||||||
|
Investments
|
1,272.2
|
|
—
|
|
(165.2
|
)
|
1,107.0
|
|
|||||||
|
Investments of Consolidated Funds
|
—
|
|
3,893.7
|
|
—
|
|
3,893.7
|
|
|||||||
|
Due from affiliates and other receivables, net
|
231.0
|
|
—
|
|
(3.8
|
)
|
227.2
|
|
|||||||
|
Due from affiliates and other receivables of Consolidated Funds, net
|
—
|
|
29.5
|
|
—
|
|
29.5
|
|
|||||||
|
Receivables and inventory of a consolidated real estate VIE
|
145.4
|
|
—
|
|
—
|
|
145.4
|
|
|||||||
|
Fixed assets, net
|
106.1
|
|
—
|
|
—
|
|
106.1
|
|
|||||||
|
Deposits and other
|
39.4
|
|
—
|
|
—
|
|
39.4
|
|
|||||||
|
Other assets of a consolidated real estate VIE
|
31.5
|
|
—
|
|
—
|
|
31.5
|
|
|||||||
|
Intangible assets, net
|
42.0
|
|
—
|
|
—
|
|
42.0
|
|
|||||||
|
Deferred tax assets
|
234.4
|
|
—
|
|
—
|
|
234.4
|
|
|||||||
|
Total assets
|
$
|
5,457.3
|
|
$
|
4,684.7
|
|
$
|
(169.0
|
)
|
$
|
9,973.0
|
|
|||
|
Liabilities and partners’ capital
|
|||||||||||||||
|
Loans payable
|
$
|
1,265.2
|
|
$
|
—
|
|
$
|
—
|
|
$
|
1,265.2
|
|
|||
|
Loans payable of Consolidated Funds
|
—
|
|
3,866.3
|
|
—
|
|
3,866.3
|
|
|||||||
|
Loans payable of a consolidated real estate VIE at fair value (principal amount of $144.4 million)
|
79.4
|
|
—
|
|
—
|
|
79.4
|
|
|||||||
|
Accounts payable, accrued expenses and other liabilities
|
369.8
|
|
—
|
|
—
|
|
369.8
|
|
|||||||
|
Accrued compensation and benefits
|
1,661.8
|
|
—
|
|
—
|
|
1,661.8
|
|
|||||||
|
Due to affiliates
|
223.4
|
|
0.2
|
|
—
|
|
223.6
|
|
|||||||
|
Deferred revenue
|
54.0
|
|
—
|
|
—
|
|
54.0
|
|
|||||||
|
Deferred tax liabilities
|
76.6
|
|
—
|
|
—
|
|
76.6
|
|
|||||||
|
Other liabilities of Consolidated Funds
|
—
|
|
669.0
|
|
(32.0
|
)
|
637.0
|
|
|||||||
|
Other liabilities of a consolidated real estate VIE
|
124.5
|
|
—
|
|
—
|
|
124.5
|
|
|||||||
|
Accrued giveback obligations
|
160.8
|
|
—
|
|
—
|
|
160.8
|
|
|||||||
|
Total liabilities
|
4,015.5
|
|
4,535.5
|
|
(32.0
|
)
|
8,519.0
|
|
|||||||
|
Partners’ capital
|
403.1
|
|
36.7
|
|
(36.7
|
)
|
403.1
|
|
|||||||
|
Accumulated other comprehensive income (loss)
|
(94.9
|
)
|
(1.5
|
)
|
1.2
|
|
(95.2
|
)
|
|||||||
|
Non-controlling interests in consolidated entities
|
264.3
|
|
13.5
|
|
—
|
|
277.8
|
|
|||||||
|
Non-controlling interests in Carlyle Holdings
|
869.3
|
|
100.5
|
|
(101.5
|
)
|
868.3
|
|
|||||||
|
Total partners’ capital
|
1,441.8
|
|
149.2
|
|
(137.0
|
)
|
1,454.0
|
|
|||||||
|
Total liabilities and partners’ capital
|
$
|
5,457.3
|
|
$
|
4,684.7
|
|
$
|
(169.0
|
)
|
$
|
9,973.0
|
|
|||
65
The Carlyle Group L.P.
Notes to the Condensed Consolidated Financial Statements
(Unaudited)
|
|
Three Months Ended June 30, 2017
|
||||||||||||||
|
|
Consolidated
Operating Entities |
Consolidated
Funds |
Eliminations
|
Consolidated
|
|||||||||||
|
|
(Dollars in millions)
|
||||||||||||||
|
Revenues
|
|||||||||||||||
|
Fund management fees
|
$
|
243.4
|
|
$
|
—
|
|
$
|
(4.6
|
)
|
$
|
238.8
|
|
|||
|
Performance fees
|
|||||||||||||||
|
Realized
|
359.7
|
|
—
|
|
(2.0
|
)
|
357.7
|
|
|||||||
|
Unrealized
|
185.9
|
|
—
|
|
—
|
|
185.9
|
|
|||||||
|
Total performance fees
|
545.6
|
|
—
|
|
(2.0
|
)
|
543.6
|
|
|||||||
|
Investment income
|
|||||||||||||||
|
Realized
|
27.3
|
|
—
|
|
(0.6
|
)
|
26.7
|
|
|||||||
|
Unrealized
|
27.6
|
|
—
|
|
4.7
|
|
32.3
|
|
|||||||
|
Investment income
|
54.9
|
|
—
|
|
4.1
|
|
59.0
|
|
|||||||
|
Interest and other income
|
10.3
|
|
—
|
|
(4.7
|
)
|
5.6
|
|
|||||||
|
Interest and other income of Consolidated Funds
|
—
|
|
45.0
|
|
—
|
|
45.0
|
|
|||||||
|
Revenue of a consolidated real estate VIE
|
16.4
|
|
—
|
|
—
|
|
16.4
|
|
|||||||
|
Total revenues
|
870.6
|
|
45.0
|
|
(7.2
|
)
|
908.4
|
|
|||||||
|
Expenses
|
|||||||||||||||
|
Compensation and benefits
|
|||||||||||||||
|
Base compensation
|
151.0
|
|
—
|
|
—
|
|
151.0
|
|
|||||||
|
Equity-based compensation
|
88.0
|
|
—
|
|
—
|
|
88.0
|
|
|||||||
|
Performance fee related
|
|||||||||||||||
|
Realized
|
166.7
|
|
—
|
|
—
|
|
166.7
|
|
|||||||
|
Unrealized
|
90.4
|
|
—
|
|
—
|
|
90.4
|
|
|||||||
|
Total compensation and benefits
|
496.1
|
|
—
|
|
—
|
|
496.1
|
|
|||||||
|
General, administrative and other expenses
|
95.8
|
|
—
|
|
—
|
|
95.8
|
|
|||||||
|
Interest
|
16.5
|
|
—
|
|
—
|
|
16.5
|
|
|||||||
|
Interest and other expenses of Consolidated Funds
|
—
|
|
91.9
|
|
(13.4
|
)
|
78.5
|
|
|||||||
|
Interest and other expenses of a consolidated real estate VIE
|
18.4
|
|
—
|
|
—
|
|
18.4
|
|
|||||||
|
Other non-operating expenses
|
0.1
|
|
—
|
|
—
|
|
0.1
|
|
|||||||
|
Total expenses
|
626.9
|
|
91.9
|
|
(13.4
|
)
|
705.4
|
|
|||||||
|
Other income
|
|||||||||||||||
|
Net investment gains of Consolidated Funds
|
—
|
|
40.7
|
|
—
|
|
40.7
|
|
|||||||
|
Income before provision for income taxes
|
243.7
|
|
(6.2
|
)
|
6.2
|
|
243.7
|
|
|||||||
|
Provision for income taxes
|
13.2
|
|
—
|
|
—
|
|
13.2
|
|
|||||||
|
Net income
|
230.5
|
|
(6.2
|
)
|
6.2
|
|
230.5
|
|
|||||||
|
Net income attributable to non-controlling interests in consolidated entities
|
16.5
|
|
—
|
|
—
|
|
16.5
|
|
|||||||
|
Net income attributable to Carlyle Holdings
|
214.0
|
|
(6.2
|
)
|
6.2
|
|
214.0
|
|
|||||||
|
Net income attributable to non-controlling interests in Carlyle Holdings
|
156.4
|
|
—
|
|
—
|
|
156.4
|
|
|||||||
|
Net income attributable to The Carlyle Group L.P.
|
$
|
57.6
|
|
$
|
(6.2
|
)
|
$
|
6.2
|
|
$
|
57.6
|
|
|||
66
The Carlyle Group L.P.
Notes to the Condensed Consolidated Financial Statements
(Unaudited)
|
|
Six Months Ended June 30, 2017
|
||||||||||||||
|
|
Consolidated
Operating Entities |
Consolidated
Funds |
Eliminations
|
Consolidated
|
|||||||||||
|
|
(Dollars in millions)
|
||||||||||||||
|
Revenues
|
|||||||||||||||
|
Fund management fees
|
$
|
493.7
|
|
$
|
—
|
|
$
|
(8.6
|
)
|
$
|
485.1
|
|
|||
|
Performance fees
|
|||||||||||||||
|
Realized
|
442.9
|
|
—
|
|
(2.0
|
)
|
440.9
|
|
|||||||
|
Unrealized
|
784.3
|
|
—
|
|
—
|
|
784.3
|
|
|||||||
|
Total performance fees
|
1,227.2
|
|
—
|
|
(2.0
|
)
|
1,225.2
|
|
|||||||
|
Investment income
|
|||||||||||||||
|
Realized
|
27.2
|
|
—
|
|
(0.7
|
)
|
26.5
|
|
|||||||
|
Unrealized
|
79.4
|
|
—
|
|
(0.6
|
)
|
78.8
|
|
|||||||
|
Investment income
|
106.6
|
|
—
|
|
(1.3
|
)
|
105.3
|
|
|||||||
|
Interest and other income
|
26.2
|
|
—
|
|
(10.2
|
)
|
16.0
|
|
|||||||
|
Interest and other income of Consolidated Funds
|
—
|
|
87.9
|
|
—
|
|
87.9
|
|
|||||||
|
Revenue of a consolidated real estate VIE
|
109.0
|
|
—
|
|
—
|
|
109.0
|
|
|||||||
|
Total revenues
|
1,962.7
|
|
87.9
|
|
(22.1
|
)
|
2,028.5
|
|
|||||||
|
Expenses
|
|||||||||||||||
|
Compensation and benefits
|
|||||||||||||||
|
Base compensation
|
297.0
|
|
—
|
|
—
|
|
297.0
|
|
|||||||
|
Equity-based compensation
|
160.8
|
|
—
|
|
—
|
|
160.8
|
|
|||||||
|
Performance fee related
|
|||||||||||||||
|
Realized
|
212.5
|
|
—
|
|
—
|
|
212.5
|
|
|||||||
|
Unrealized
|
361.7
|
|
—
|
|
—
|
|
361.7
|
|
|||||||
|
Total compensation and benefits
|
1,032.0
|
|
—
|
|
—
|
|
1,032.0
|
|
|||||||
|
General, administrative and other expenses
|
189.6
|
|
—
|
|
—
|
|
189.6
|
|
|||||||
|
Interest
|
31.5
|
|
—
|
|
—
|
|
31.5
|
|
|||||||
|
Interest and other expenses of Consolidated Funds
|
—
|
|
144.9
|
|
(21.2
|
)
|
123.7
|
|
|||||||
|
Interest and other expenses of a consolidated real estate VIE
|
138.0
|
|
—
|
|
—
|
|
138.0
|
|
|||||||
|
Other non-operating expenses
|
0.1
|
|
—
|
|
—
|
|
0.1
|
|
|||||||
|
Total expenses
|
1,391.2
|
|
144.9
|
|
(21.2
|
)
|
1,514.9
|
|
|||||||
|
Other income
|
|||||||||||||||
|
Net investment gains of Consolidated Funds
|
—
|
|
57.8
|
|
—
|
|
57.8
|
|
|||||||
|
Income before provision for income taxes
|
571.5
|
|
0.8
|
|
(0.9
|
)
|
571.4
|
|
|||||||
|
Provision for income taxes
|
19.0
|
|
—
|
|
—
|
|
19.0
|
|
|||||||
|
Net income
|
552.5
|
|
0.8
|
|
(0.9
|
)
|
552.4
|
|
|||||||
|
Net income attributable to non-controlling interests in consolidated entities
|
19.9
|
|
—
|
|
(0.1
|
)
|
19.8
|
|
|||||||
|
Net income attributable to Carlyle Holdings
|
532.6
|
|
0.8
|
|
(0.8
|
)
|
532.6
|
|
|||||||
|
Net income attributable to non-controlling interests in Carlyle Holdings
|
392.0
|
|
—
|
|
—
|
|
392.0
|
|
|||||||
|
Net income attributable to The Carlyle Group L.P.
|
$
|
140.6
|
|
$
|
0.8
|
|
$
|
(0.8
|
)
|
$
|
140.6
|
|
|||
67
The Carlyle Group L.P.
Notes to the Condensed Consolidated Financial Statements
(Unaudited)
|
|
Three Months Ended June 30, 2016
|
||||||||||||||
|
|
Consolidated
Operating Entities |
Consolidated
Funds |
Eliminations
|
Consolidated
|
|||||||||||
|
|
(Dollars in millions)
|
||||||||||||||
|
Revenues
|
|||||||||||||||
|
Fund management fees
|
$
|
276.0
|
|
$
|
—
|
|
$
|
(3.5
|
)
|
$
|
272.5
|
|
|||
|
Performance fees
|
|||||||||||||||
|
Realized
|
390.0
|
|
—
|
|
(0.1
|
)
|
389.9
|
|
|||||||
|
Unrealized
|
(179.0
|
)
|
—
|
|
—
|
|
(179.0
|
)
|
|||||||
|
Total performance fees
|
211.0
|
|
—
|
|
(0.1
|
)
|
210.9
|
|
|||||||
|
Investment income
|
|||||||||||||||
|
Realized
|
39.1
|
|
—
|
|
(0.2
|
)
|
38.9
|
|
|||||||
|
Unrealized
|
33.0
|
|
—
|
|
(6.6
|
)
|
26.4
|
|
|||||||
|
Total investment income
|
72.1
|
|
—
|
|
(6.8
|
)
|
65.3
|
|
|||||||
|
Interest and other income
|
5.2
|
|
—
|
|
(0.2
|
)
|
5.0
|
|
|||||||
|
Interest and other income of Consolidated Funds
|
—
|
|
35.9
|
|
—
|
|
35.9
|
|
|||||||
|
Revenue of a consolidated real estate VIE
|
18.4
|
|
—
|
|
—
|
|
18.4
|
|
|||||||
|
Total revenues
|
582.7
|
|
35.9
|
|
(10.6
|
)
|
608.0
|
|
|||||||
|
Expenses
|
|||||||||||||||
|
Compensation and benefits
|
|||||||||||||||
|
Base compensation
|
149.9
|
|
—
|
|
—
|
|
149.9
|
|
|||||||
|
Equity-based compensation
|
109.0
|
|
—
|
|
—
|
|
109.0
|
|
|||||||
|
Performance fee related
|
|||||||||||||||
|
Realized
|
172.4
|
|
—
|
|
—
|
|
172.4
|
|
|||||||
|
Unrealized
|
(75.9
|
)
|
—
|
|
—
|
|
(75.9
|
)
|
|||||||
|
Total compensation and benefits
|
355.4
|
|
—
|
|
—
|
|
355.4
|
|
|||||||
|
General, administrative and other expenses
|
91.4
|
|
—
|
|
—
|
|
91.4
|
|
|||||||
|
Interest
|
15.4
|
|
—
|
|
—
|
|
15.4
|
|
|||||||
|
Interest and other expenses of Consolidated Funds
|
—
|
|
35.0
|
|
(3.4
|
)
|
31.6
|
|
|||||||
|
Interest and other expenses of a consolidated real estate VIE
|
52.4
|
|
—
|
|
—
|
|
52.4
|
|
|||||||
|
Other non-operating expenses
|
0.7
|
|
—
|
|
—
|
|
0.7
|
|
|||||||
|
Total expenses
|
515.3
|
|
35.0
|
|
(3.4
|
)
|
546.9
|
|
|||||||
|
Other income
|
|||||||||||||||
|
Net investment gains of Consolidated Funds
|
—
|
|
6.7
|
|
—
|
|
6.7
|
|
|||||||
|
Income before provision for income taxes
|
67.4
|
|
7.6
|
|
(7.2
|
)
|
67.8
|
|
|||||||
|
Provision for income taxes
|
24.3
|
|
—
|
|
—
|
|
24.3
|
|
|||||||
|
Net income
|
43.1
|
|
7.6
|
|
(7.2
|
)
|
43.5
|
|
|||||||
|
Net income attributable to non-controlling interests in consolidated entities
|
1.2
|
|
—
|
|
0.4
|
|
1.6
|
|
|||||||
|
Net income attributable to Carlyle Holdings
|
41.9
|
|
7.6
|
|
(7.6
|
)
|
41.9
|
|
|||||||
|
Net income attributable to non-controlling interests in Carlyle Holdings
|
35.8
|
|
—
|
|
—
|
|
35.8
|
|
|||||||
|
Net income attributable to The Carlyle Group L.P.
|
$
|
6.1
|
|
$
|
7.6
|
|
$
|
(7.6
|
)
|
$
|
6.1
|
|
|||
68
The Carlyle Group L.P.
Notes to the Condensed Consolidated Financial Statements
(Unaudited)
|
|
Six Months Ended June 30, 2016
|
||||||||||||||
|
|
Consolidated
Operating Entities |
Consolidated
Funds |
Eliminations
|
Consolidated
|
|||||||||||
|
|
(Dollars in millions)
|
||||||||||||||
|
Revenues
|
|||||||||||||||
|
Fund management fees
|
$
|
568.4
|
|
$
|
—
|
|
$
|
(6.4
|
)
|
$
|
562.0
|
|
|||
|
Performance fees
|
|||||||||||||||
|
Realized
|
521.9
|
|
—
|
|
(0.2
|
)
|
521.7
|
|
|||||||
|
Unrealized
|
(165.6
|
)
|
—
|
|
—
|
|
(165.6
|
)
|
|||||||
|
Total performance fees
|
356.3
|
|
—
|
|
(0.2
|
)
|
356.1
|
|
|||||||
|
Investment income
|
|||||||||||||||
|
Realized
|
52.4
|
|
—
|
|
(0.9
|
)
|
51.5
|
|
|||||||
|
Unrealized
|
2.1
|
|
—
|
|
2.1
|
|
4.2
|
|
|||||||
|
Total investment income
|
54.5
|
|
—
|
|
1.2
|
|
55.7
|
|
|||||||
|
Interest and other income
|
10.9
|
|
—
|
|
(1.2
|
)
|
9.7
|
|
|||||||
|
Interest and other income of Consolidated Funds
|
—
|
|
64.8
|
|
—
|
|
64.8
|
|
|||||||
|
Revenue of a consolidated real estate VIE
|
42.8
|
|
—
|
|
—
|
|
42.8
|
|
|||||||
|
Total revenues
|
1,032.9
|
|
64.8
|
|
(6.6
|
)
|
1,091.1
|
|
|||||||
|
Expenses
|
|||||||||||||||
|
Compensation and benefits
|
|||||||||||||||
|
Base compensation
|
316.2
|
|
—
|
|
—
|
|
316.2
|
|
|||||||
|
Equity-based compensation
|
184.4
|
|
—
|
|
—
|
|
184.4
|
|
|||||||
|
Performance fee related
|
|||||||||||||||
|
Realized
|
234.0
|
|
—
|
|
—
|
|
234.0
|
|
|||||||
|
Unrealized
|
(68.0
|
)
|
—
|
|
—
|
|
(68.0
|
)
|
|||||||
|
Total compensation and benefits
|
666.6
|
|
—
|
|
—
|
|
666.6
|
|
|||||||
|
General, administrative and other expenses
|
173.7
|
|
—
|
|
—
|
|
173.7
|
|
|||||||
|
Interest
|
30.7
|
|
—
|
|
—
|
|
30.7
|
|
|||||||
|
Interest and other expenses of Consolidated Funds
|
—
|
|
64.7
|
|
(9.7
|
)
|
55.0
|
|
|||||||
|
Interest and other expenses of a consolidated real estate VIE
|
75.8
|
|
—
|
|
—
|
|
75.8
|
|
|||||||
|
Other non-operating expenses
|
4.5
|
|
—
|
|
—
|
|
4.5
|
|
|||||||
|
Total expenses
|
951.3
|
|
64.7
|
|
(9.7
|
)
|
1,006.3
|
|
|||||||
|
Other expense
|
|||||||||||||||
|
Net investment losses of Consolidated Funds
|
—
|
|
(1.7
|
)
|
—
|
|
(1.7
|
)
|
|||||||
|
Income before provision for income taxes
|
81.6
|
|
(1.6
|
)
|
3.1
|
|
83.1
|
|
|||||||
|
Provision for income taxes
|
31.7
|
|
—
|
|
—
|
|
31.7
|
|
|||||||
|
Net income
|
49.9
|
|
(1.6
|
)
|
3.1
|
|
51.4
|
|
|||||||
|
Net loss attributable to non-controlling interests in consolidated entities
|
(2.2
|
)
|
—
|
|
1.5
|
|
(0.7
|
)
|
|||||||
|
Net income attributable to Carlyle Holdings
|
52.1
|
|
(1.6
|
)
|
1.6
|
|
52.1
|
|
|||||||
|
Net income attributable to non-controlling interests in Carlyle Holdings
|
37.6
|
|
—
|
|
—
|
|
37.6
|
|
|||||||
|
Net income attributable to The Carlyle Group L.P.
|
$
|
14.5
|
|
$
|
(1.6
|
)
|
$
|
1.6
|
|
$
|
14.5
|
|
|||
69
The Carlyle Group L.P.
Notes to the Condensed Consolidated Financial Statements
(Unaudited)
|
|
Six Months Ended June 30,
|
||||||
|
|
2017
|
2016
|
|||||
|
|
(Dollars in millions)
|
||||||
|
Cash flows from operating activities
|
|||||||
|
Net income
|
$
|
552.5
|
|
$
|
49.9
|
|
|
|
Adjustments to reconcile net income to net cash flows from operating activities:
|
|||||||
|
Depreciation and amortization
|
20.1
|
|
34.2
|
|
|||
|
Equity-based compensation
|
160.8
|
|
184.4
|
|
|||
|
Non-cash performance fees
|
(511.8
|
)
|
67.2
|
|
|||
|
Other non-cash amounts
|
(9.4
|
)
|
(11.6
|
)
|
|||
|
Investment income
|
(95.8
|
)
|
(53.1
|
)
|
|||
|
Purchases of investments
|
(236.9
|
)
|
(207.0
|
)
|
|||
|
Proceeds from the sale of investments
|
311.9
|
|
140.8
|
|
|||
|
Payments of contingent consideration
|
(22.5
|
)
|
(75.6
|
)
|
|||
|
Deconsolidation of Claren Road (see Note 10)
|
(23.3
|
)
|
—
|
|
|||
|
Change in deferred taxes, net
|
0.3
|
|
14.7
|
|
|||
|
Change in due from affiliates and other receivables
|
(75.1
|
)
|
6.6
|
|
|||
|
Change in receivables and inventory of a consolidated real estate VIE
|
(14.5
|
)
|
(4.9
|
)
|
|||
|
Change in deposits and other
|
(9.3
|
)
|
(1.5
|
)
|
|||
|
Change in other assets of a consolidated real estate VIE
|
1.6
|
|
8.8
|
|
|||
|
Change in accounts payable, accrued expenses and other liabilities
|
(3.3
|
)
|
(16.3
|
)
|
|||
|
Change in accrued compensation and benefits
|
(41.1
|
)
|
(96.4
|
)
|
|||
|
Change in due to affiliates
|
0.1
|
|
(22.4
|
)
|
|||
|
Change in other liabilities of a consolidated real estate VIE
|
47.9
|
|
9.6
|
|
|||
|
Change in deferred revenue
|
27.7
|
|
7.4
|
|
|||
|
Net cash provided by operating activities
|
79.9
|
|
34.8
|
|
|||
|
Cash flows from investing activities
|
|||||||
|
Change in restricted cash
|
3.8
|
|
6.4
|
|
|||
|
Purchases of fixed assets, net
|
(16.7
|
)
|
(8.4
|
)
|
|||
|
Net cash used in investing activities
|
(12.9
|
)
|
(2.0
|
)
|
|||
|
Cash flows from financing activities
|
|||||||
|
Borrowings under credit facility
|
250.0
|
|
—
|
|
|||
|
Repayments under credit facility
|
(250.0
|
)
|
—
|
|
|||
|
Proceeds from debt obligations
|
112.1
|
|
20.6
|
|
|||
|
Net payments on loans payable of a consolidated real estate VIE
|
(14.3
|
)
|
(16.9
|
)
|
|||
|
Payments of contingent consideration
|
(0.4
|
)
|
(0.3
|
)
|
|||
|
Distributions to common unitholders
|
(22.7
|
)
|
(45.0
|
)
|
|||
|
Distributions to non-controlling interest holders in Carlyle Holdings
|
(63.1
|
)
|
(148.4
|
)
|
|||
|
Contributions from non-controlling interest holders
|
25.8
|
|
71.6
|
|
|||
|
Distributions to non-controlling interest holders
|
(53.0
|
)
|
(59.5
|
)
|
|||
|
Units repurchased
|
(0.2
|
)
|
(36.2
|
)
|
|||
|
Change in due to/from affiliates financing activities
|
49.2
|
|
1.0
|
|
|||
|
Net cash provided by (used in) financing activities
|
33.4
|
|
(213.1
|
)
|
|||
|
Effect of foreign exchange rate changes
|
18.6
|
|
(3.9
|
)
|
|||
|
Increase (decrease) in cash and cash equivalents
|
119.0
|
|
(184.2
|
)
|
|||
|
Cash and cash equivalents, beginning of period
|
670.9
|
|
991.5
|
|
|||
|
Cash and cash equivalents, end of period
|
$
|
789.9
|
|
$
|
807.3
|
|
|
70
The following discussion analyzes the financial condition and results of operations of The Carlyle Group L.P. (the “Partnership”). Such analysis should be read in conjunction with the consolidated financial statements and the related notes included in this Quarterly Report on Form 10-Q and the Annual Report on Form 10-K for the year ended December 31, 2016.
Overview
We conduct our operations through four reportable segments: Corporate Private Equity, Real Assets, Global Market Strategies, and Investment Solutions.
|
•
|
Corporate Private Equity
— Our Corporate Private Equity segment advises our
21
buyout and
10
growth capital funds, which seek a wide variety of investments of different sizes and growth potentials. As of
June 30, 2017
, our Corporate Private Equity segment had over
$54 billion
in AUM and over
$36 billion
in Fee-earning AUM.
|
|
•
|
Real Assets
— Our Real Assets segment advises our
eleven
U.S. and internationally focused real estate funds, our
two
infrastructure funds, our
two
power funds, our international energy fund, as well as our
four
Legacy Energy funds (funds that we jointly advise with Riverstone). The segment also includes
five
NGP management fee funds and
three
carry funds advised by NGP. As of
June 30, 2017
, our Real Assets segment had approximately
$39 billion
in AUM and over
$26 billion
in Fee-earning AUM.
|
|
•
|
Global Market Strategies
— Our Global Market Strategies segment advises a group of
60
funds that pursue investment opportunities across structured credit, distressed debt, corporate and energy mezzanine debt, and middle-market and senior debt. As of
June 30, 2017
, our Global Market Strategies segment had approximately
$31 billion
in AUM and over
$25 billion
in Fee-earning AUM.
|
|
•
|
Investment Solutions
— Our Investment Solutions segment advises global private equity and real estate fund of funds programs and related co-investment and secondary activities across
180
fund vehicles. As of
June 30, 2017
, our Investment Solutions segment had approximately
$46 billion
in AUM and over
$28 billion
in Fee-earning AUM.
|
We earn management fees pursuant to contractual arrangements with the investment funds that we manage and fees for transaction advisory and oversight services provided to portfolio companies of these funds. We also typically receive a performance fee from an investment fund, which may be either an incentive fee or a special residual allocation of income, which we refer to as a carried interest, in the event that specified investment returns are achieved by the fund. Under U.S. generally accepted accounting principles (“U.S. GAAP”), we are required to consolidate some of the investment funds that we advise. However, for segment reporting purposes, we present revenues and expenses on a basis that deconsolidates these investment funds. Accordingly, our segment revenues primarily consist of fund management and related advisory fees, performance fees (consisting of incentive fees and carried interest allocations), investment income, including realized and unrealized gains on our investments in our funds and other trading securities, as well as interest and other income. Our segment expenses primarily consist of compensation and benefits expenses, including salaries, bonuses, performance payment arrangements, and equity-based compensation excluding awards granted in our initial public offering or in connection with acquisitions and strategic investments, and general and administrative expenses. While our segment expenses include depreciation and interest expense, our segment expenses exclude acquisition-related charges and amortization of intangibles and impairment. Refer to Note 17 to the unaudited condensed consolidated financial statements included in this Quarterly Report on Form 10-Q for more information on the differences between our financial results reported pursuant to U.S. GAAP and our financial results for segment reporting purposes.
Our Family of Funds
The following chart presents the name (acronym), total capital commitments (in the case of our carry funds, structured credit funds, and the NGP management fee funds), assets under management (in the case of structured products), gross assets (in the case of our business development companies), and vintage year of the active funds in each of our segments, as of
June 30, 2017
. We present total capital commitments (as opposed to assets under management) for our closed-end investment funds because we believe this metric provides the most useful information regarding the relative size and scale of such funds. In the case of our products which are open-ended, and accordingly do not have permanent committed capital, we generally believe the most useful metric regarding relative size and scale is assets under management.
71
|
Corporate Private Equity
|
Real Assets
|
Global Market Strategies
|
||||||||
|
Buyout Carry Funds
|
Real Estate Carry Funds
|
Structured Credit
|
||||||||
|
Carlyle Partners (U.S.)
|
Carlyle Realty Partners (U.S.)
|
Cash CLOs
|
||||||||
|
CP VI
|
$13.0 bn
|
2013
|
CRP VIII
|
$3.3 bn
|
2017
|
U.S.
|
$16.4 bn
|
2006-2017
|
||
|
CP V
|
$13.7 bn
|
2007
|
CRP VII
|
$4.2 bn
|
2014
|
Europe
|
€8.9 bn
|
2005-2017
|
||
|
CP IV
|
$7.9 bn
|
2005
|
CRP VI
|
$2.3 bn
|
2011
|
Structured Credit Carry Funds
|
||||
|
Global Financial Services Partners
|
CRP V
|
$3.0 bn
|
2006
|
CSC
|
$722 mm
|
2016
|
||||
|
CGFSP III
|
$315 mm
|
2017
|
CRP IV
|
$950 mm
|
2005
|
CASCOF
|
$445 mm
|
2015
|
||
|
CGFSP II
|
$1.0 bn
|
2013
|
CRP III
|
$564 mm
|
2001
|
Private Credit
|
||||
|
CGFSP I
|
$1.1 bn
|
2008
|
Carlyle Europe Real Estate Partners
|
Business Development Company
1
|
||||||
|
Carlyle Europe Partners
|
CEREP III
|
€2.2 bn
|
2007
|
TCG BDC, Inc.
|
$1.8 bn
|
2013
|
||||
|
CEP IV
|
€3.7 bn
|
2014
|
CEREP II
|
€763 mm
|
2005
|
Corporate Mezzanine Carry Fund
|
||||
|
CEP III
|
€5.3 bn
|
2007
|
Carlyle Asia Real Estate Partners
|
CMP II
|
$553 mm
|
2008
|
||||
|
CEP II
|
€1.8 bn
|
2003
|
CCR
|
$120 mm
|
2016
|
Opportunistic Credit Carry Funds
|
||||
|
Carlyle Asia Partners
|
CAREP II
|
$486 mm
|
2008
|
CCOF
|
$542 mm
|
2017
|
||||
|
CAP IV
|
$3.9 bn
|
2013
|
Core Plus Real Estate (U.S.)
|
Energy Credit Carry Funds
|
||||||
|
CBPF
|
RMB 2.0 bn
|
2010
|
CPI
|
$972 mm
|
2016
|
CEMOF II
|
$2.8 bn
|
2015
|
||
|
CAP III
|
$2.6 bn
|
2008
|
Natural Resources Funds
|
CEMOF I
|
$1.4 bn
|
2010
|
||||
|
CAP II
|
$1.8 bn
|
2006
|
Infrastructure Carry Fund
|
Distressed Credit Carry Funds
|
||||||
|
Carlyle Japan Partners
|
CIP I
|
$1.1 bn
|
2006
|
CSP IV
|
$2.5 bn
|
2016
|
||||
|
CJP III
|
¥119.5 bn
|
2013
|
Power Carry Funds
|
CSP III
|
$703 mm
|
2011
|
||||
|
CJP II
|
¥165.6 bn
|
2006
|
CPP II
|
$1.5 bn
|
2014
|
CSP II
|
$1.4 bn
|
2007
|
||
|
Carlyle Mexico Partners
|
CPOCP
|
$478 mm
|
2013
|
|||||||
|
Mexico
|
$134 mm
|
2005
|
International Energy Carry Fund
|
|||||||
|
Carlyle MENA Partners
|
CIEP
|
$2.5 bn
|
2013
|
|||||||
|
MENA I
|
$471 mm
|
2008
|
NGP Energy Carry Funds
|
Investment Solutions
|
||||||
|
Carlyle South America Buyout Fund
|
NGP XI
|
$5.3 bn
|
2014
|
AlpInvest
|
||||||
|
CSABF I
|
$776 mm
|
2009
|
NGP X
|
$3.6 bn
|
2012
|
Fund of Private Equity Funds
|
||||
|
Carlyle Sub-Saharan Africa Fund
|
NGP Agribusiness Carry Fund
|
60 vehicles
|
€41.2 bn
|
2000-2017
|
||||||
|
CSSAF I
|
$698 mm
|
2012
|
NGP GAP
|
$402 mm
|
2014
|
Secondary Investments
|
||||
|
Carlyle Peru Fund
|
NGP Management Fee Funds
|
45 vehicles
|
€14.3 bn
|
2002-2017
|
||||||
|
CPF I
|
$308 mm
|
2012
|
Various
2
|
$7.2 bn
|
2004-2008
|
Co-Investments
|
||||
|
Carlyle Global Partners
|
Legacy Energy Carry Funds
|
45 vehicles
|
€13.3 bn
|
2000-2017
|
||||||
|
CGP
|
$3.6 bn
|
2015
|
Carlyle/Riverstone Global Energy
|
Metropolitan Real Estate
|
||||||
|
Growth Carry Funds
|
Energy IV
|
$6.0 bn
|
2008
|
Real Estate Fund of Funds
|
||||||
|
Carlyle U.S. Venture/Growth Partners
|
Energy III
|
$3.8 bn
|
2005
|
30 vehicles
|
$3.6 bn
|
2002-2017
|
||||
|
CEOF II
|
$2.4 bn
|
2015
|
Energy II
|
$1.1 bn
|
2003
|
|||||
|
CEOF I
|
$1.1 bn
|
2011
|
Carlyle/Riverstone Renewable Energy
|
|||||||
|
CUSGF III
|
$605 mm
|
2006
|
Renew II
|
$3.4 bn
|
2008
|
|||||
|
CVP II
|
$602 mm
|
2001
|
||||||||
|
Carlyle Europe Technology Partners
|
||||||||||
|
CETP III
|
€657 mm
|
2014
|
||||||||
|
CETP II
|
€522 mm
|
2008
|
||||||||
|
Carlyle Asia Venture/Growth Partners
|
||||||||||
|
CAGP V
|
$292 mm
|
2016
|
||||||||
|
CAGP IV
|
$1.0 bn
|
2008
|
||||||||
|
CAGP III
|
$680 mm
|
2005
|
||||||||
|
Carlyle Cardinal Ireland
|
||||||||||
|
CCI
|
€292 mm
|
2014
|
||||||||
Note: All amounts shown represent total capital commitments as of
June 30, 2017
unless otherwise noted. Certain of our recent vintage funds are currently in fundraising and total capital commitments are subject to change. In addition, certain carry funds included herein may be disclosed which are not included in fund performance if they have not made an initial capital call.
|
(1)
|
Amounts represent gross assets as of
June 30, 2017
.
|
|
(2)
|
Includes NGP ETP I, NGP M&R, NGP ETP II, NGP VIII and NGP IX.
|
72
Trends Affecting our Business
Over the course of the second quarter of 2017, public and proprietary data generally pointed to a synchronized global recovery. Improved economic conditions translated to robust corporate earnings growth in most major economies, with S&P 500 earnings advancing by 7.2%, on average, in the second quarter after recording 13.9% annual growth in the first quarter of 2017. Strong earnings growth supported higher asset prices, with the MSCI World Index rising by 3.2% during the second quarter and continuing to rise through the end of July 2017.
Stronger economic growth also raised the prospect that central banks would remove policy accommodation at a faster pace than previously anticipated. The level and volatility of government bond yields increased as a result and these higher yields led directly to an appreciation in the euro, which surged from 1.06 against the U.S. dollar at the end of the first quarter to 1.14 as of the end of the second quarter and 1.18 as of the end of July 2017. Uncertainty about the course of monetary policy could be a key driver of asset price volatility in the months ahead. In 2013, the “taper tantrum” led a simultaneous decline in stock and bond prices, as market participants revised their expectations for U.S. Federal Reserve policy. The pace of any policy tightening, however, should be restrained by inflation data, which remained muted despite the improved economic backdrop. The annual change in consumer prices in the U.S., Europe and Japan all remained well below central banks’ targets in the second quarter 2017. With inflation pressures subdued, futures markets anticipate just one additional rate hike in the U.S. and no change in euro area short-term rates over the next 12 months.
Despite the increase and volatility in yields, leveraged finance markets remained strong in the second quarter of 2017, with combined leveraged loan and high-yield bond issuance exceeding $600 billion in the first half of the year, up by 37% relative to the same period in 2016. Favorable deal finance terms supported a robust private equity investment environment. Global private equity investment reached $84 billion in the second quarter of 2017, up from $55 billion in the first quarter. For the first half of the year, private equity-backed deal volumes reached their highest levels in a decade.
Faster real growth and a continuation of low interest rates are likely to sustain elevated valuations in the near term. While higher valuations could place downward pressure on rates of return for new investments across all asset classes, we remain confident in our ability to find investment opportunities that meet our investment criteria. During the second quarter, we invested
$3.4 billion
in new or follow-on transactions, and currently have more than $6 billion of pending invested capital for transactions that have been signed, but have not yet closed. We also generated
$6.0 billion
in realized proceeds in the second quarter.
During the second quarter of 2017, our overall carry fund portfolio appreciated by
5%
, with an
8%
increase in our Corporate Private Equity funds and a
6%
increase in our Real Assets funds. The valuation of our Global Market Strategies carry funds was flat in the second quarter with strength in distressed credit offset by weakness in energy debt funds. Appreciation in Investment Solutions was
1%
and was negatively impacted by the strength of the euro relative to the U.S. dollar. Excluding the negative impact of investment-level foreign exchange translation, the Investment Solutions portfolio of funds appreciated by 5%. Our private carry fund portfolio appreciated by
6%
and our public carry fund portfolio appreciated by
10%
during the quarter, each excluding Investment Solutions.
We anticipate raising $100 billion in gross new capital over the four-year period that began in 2016 and will continue through the end of 2019. During the second quarter of 2017, we raised
$8.4 billion
of new capital and we raised $18.1 billion of gross new capital over the last twelve months. We expect that the pace of fundraising will accelerate for the remainder of 2017 and into 2018 as our largest buyout funds come into the market. In general, fundraising activity generates one-time costs that are incurred upon the closing of new commitments; however, those new commitments may not generate fees for several quarters, which creates costs ahead of revenues. When fees on those new commitments are activated, we expect to see an increase in Fee-Earning AUM and management fee revenue. Pending Fee-Earning AUM, which is capital that we have raised, but on which we have not yet activated fees, was approximately
$9 billion
at June 30, 2017, up from $4 billion at the beginning of the quarter.
During the second quarter, one of our business development companies went public and we raised three new collateralized loan obligations. We raised
$2.7 billion
of total new capital for the Global Market Strategies segment, reflecting the strong demand that we are seeing for private credit strategies. We also made key hires in our global credit business as part of our effort to grow and enhance that business. As we continue to hire new employees and expand our global credit operations, we anticipate that expenses in our Global Market Strategies segment will be elevated as compared to prior periods. We have fully resolved investor claims related to the commodities matters in our Global Market Strategies segment. As we move forward, our strategy for this segment is to aggressively focus on opportunities in the global credit space.
73
Recent Transactions
Distribution
In August 2017, the Board of Directors of our general partner declared a quarterly distribution of $0.42 per common unit to common unitholders of record at the close of business on August 14, 2017, payable on August 21, 2017.
Key Financial Measures
Our key financial measures are discussed in the following pages. Additional information regarding these key financial measures and our other significant accounting policies can be found in Note 2 to the unaudited condensed consolidated financial statements included in this Quarterly Report on Form 10-Q.
Revenues
Revenues primarily consist of fund management fees, performance fees, investment income, including realized and unrealized gains of our investments in our funds and other investments, as well as interest and other income.
Fund Management Fees.
Fund management fees include management fees and transaction and portfolio advisory fees. We earn management fees for advisory services we provide to funds in which we hold a general partner interest or with which we have an investment advisory or investment management agreement. Additionally, management fees include catch-up management fees, which are episodic in nature and represent management fees charged to fund investors in subsequent closings of a fund which apply to the time period between the fee initiation date and the subsequent closing date.
Management fees attributable to Carlyle Partners VI, L.P. (“CP VI”), our sixth U.S. buyout fund with approximately
$12.0 billion
of Fee-earning AUM as of
June 30, 2017
, were approximately 16% of total management fees recognized during both the
three months and six months ended June 30, 2017
, respectively. Management fees attributable to CP VI were approximately 15% and 14% of total management fees recognized during the
three months and six months ended June 30, 2016
, respectively. No other fund generated over 10% of total management fees in the periods presented.
Fund management fees exclude the reimbursement of any partnership expenses paid by the Partnership on behalf of the Carlyle funds pursuant to the limited partnership agreements, including amounts related to the pursuit of actual, proposed, or unconsummated investments, professional fees, expenses associated with the acquisition, holding and disposition of investments, and other fund administrative expenses.
Transaction and Portfolio Advisory Fees.
Transaction and portfolio advisory fees are fees we receive for the transaction and portfolio advisory services we provide to our portfolio companies. When covered by separate contractual agreements, we recognize transaction and portfolio advisory fees for these services when the service has been provided and collection is reasonably assured. We are required to offset our fund management fees earned by a percentage of the transaction and advisory fees earned, which we refer to as the “rebate offsets.” Such rebate offset percentages generally approximate 80% of the fund’s portion of the transaction and advisory fees earned. The recognition of portfolio advisory fees and transactions fees can be volatile as they are primarily generated by investment activity within our funds, and therefore are impacted by our investment pace. We have received and expect to continue to receive requests from a variety of investors and groups representing investors to increase the percentage of transaction and advisory fees we share with our investors in future funds; to the extent that we accommodate such requests on future funds, the rebate offset percentages would increase relative to historical levels.
Performance Fees.
Performance fees consist principally of the performance-based capital allocation from fund limited partners to us, commonly referred to as carried interest, from certain of our investment funds, which we refer to as the “carry funds.” Carried interest revenue, which historically has comprised over 80% of all performance fees in our consolidated financial statements, is recognized by Carlyle upon appreciation of the valuation of our funds' investments above certain return hurdles as set forth in each respective partnership agreement and is based on the amount that would be due to us pursuant to the fund partnership agreement at each period end as if the funds were liquidated at such date. Accordingly, the amount of carried interest recognized as performance fees reflects our share of the fair value gains and losses of the associated funds' underlying investments measured at their then-current fair values relative to the fair values as of the end of the prior period. As a result, the performance fees earned in an applicable reporting period are not indicative of any future period, as fair values are based on conditions prevalent as of the reporting date. Refer to “— Trends Affecting our Business” for further discussion.
In addition to its performance fees from our Corporate Private Equity and Real Assets funds and closed-end carry funds in the Global Market Strategies segment, we are also entitled to receive performance fees from our Investment Solutions and NGP carry funds. The timing of performance fee realizations for these funds is typically later than in our other carry funds based on the terms of such arrangements.
74
Our performance fees are generated by a diverse set of funds with different vintages, geographic concentration, investment strategies and industry specialties. For an explanation of the fund acronyms used throughout this Management’s Discussion and Analysis of Financial Condition and Results of Operations section, refer to “— Our Family of Funds.”
Performance fees in excess of 10% of the total for the
three months ended June 30, 2017
were generated from the following funds:
|
•
|
$192.4 million from CP VI (with total AUM of approximately
$14.1 billion
),
|
|
•
|
$80.7 million from Carlyle Asia Partners IV, L.P. (“CAP IV”) (with total AUM of approximately
$5.0 billion
, and
|
|
•
|
$66.0 million from Carlyle Partners V, L.P. (“CP V”) (with total AUM of approximately
$5.5 billion
).
|
Performance fees in excess of 10% of the total for the
six months ended June 30, 2017
were generated from the following funds:
|
•
|
$397.2 million from CP VI,
|
|
•
|
$253.0 million from CP V, and
|
|
•
|
$226.3 million from CAP IV.
|
Performance fees in excess of 10% of the total for the
three months ended June 30, 2016
were generated primarily from the following funds:
•
$51.0 million from Carlyle Realty Partners V, L.P. (“CRP V”),
•
$39.5 million from Carlyle Beijing Partners, L.P. (“CBPF”), and
•
$32.0 million from Carlyle Realty Partners VII, L.P. (“CRP VII”).
Performance fees in excess of 10% of the total for the
six months ended June 30, 2016
were generated primarily from the following funds:
•
$99.9 million from CRP V,
•
$75.8 million from CP V,
•
$55.9 million from CRP VII, and
•
$39.5 million from CBPF.
No other fund generated over 10% of performance fees in the periods presented above.
Under our arrangements with the historical owners and management team of AlpInvest, we generally do not retain any carried interest in respect of the historical investments and commitments to our fund vehicles that existed as of July 1, 2011 (including any options to increase any such commitments exercised after such date). We are entitled to 15% of the carried interest in respect of commitments from the historical owners of AlpInvest for the period between 2011 and 2020 and 40% of the carried interest in respect of all other commitments (including all future commitments from third parties). In certain instances, carried interest associated with the AlpInvest fund vehicles is subject to entity level income taxes in the Netherlands.
Realized carried interest may be clawed back or given back to the fund if the fund’s investment values decline below certain return hurdles, which vary from fund to fund. When the fair value of a fund’s investments remains constant or falls below certain return hurdles, previously recognized performance fees are reversed. In all cases, each investment fund is considered separately in evaluating carried interest and potential giveback obligations. For any given period, performance fee revenue on our statement of operations may include reversals of previously recognized performance fees due to a decrease in the value of a particular fund that results in a decrease of cumulative performance fees earned to date. Since fund return hurdles are cumulative, previously recognized performance fees also may be reversed in a period of appreciation that is lower
75
than the particular fund’s hurdle rate. For the
three months ended June 30, 2017 and 2016
, the reversals of performance fees were $17.2 million and $32.0 million, respectively. For the
six months ended June 30, 2017 and 2016
, the reversals of performance fees were $57.9 million and $57.8 million, respectively.
As of
June 30, 2017
, accrued performance fees and accrued giveback obligations were approximately
$3.4 billion
and
$162.2 million
, respectively. Each balance assumes a hypothetical liquidation of the funds’ investments at
June 30, 2017
at their then current fair values. These assets and liabilities will continue to fluctuate in accordance with the fair values of the fund investments until they are realized. As of
June 30, 2017
, approximately $103.4 million of the accrued giveback obligation is the responsibility of various current and former senior Carlyle professionals and other limited partners of the Carlyle Holdings partnerships, and the net accrued giveback obligation attributable to Carlyle Holdings is $58.8 million. The Partnership uses “net accrued performance fees” to refer to the accrued performance fees net of accrued giveback obligations, accrued performance fee compensation, performance fee-related tax obligations, and accrued performance fees attributable to non-controlling interests and excludes any net accrued performance fees that have been realized but will be collected in subsequent periods. Net accrued performance fees as of
June 30, 2017
are $1.6 billion.
In addition, realized performance fees may be reversed in future periods to the extent that such amounts become subject to a giveback obligation. If, at
June 30, 2017
, all investments held by our carry funds were deemed worthless, the amount of realized and previously distributed performance fees subject to potential giveback would be approximately
$1.1 billion
on an after-tax basis where applicable. See the related discussion of “Contingent Obligations (Giveback)” within “— Liquidity and Capital Resources.” Since Carlyle’s inception, we have realized a total of approximately $218.6 million in aggregate giveback obligations. Approximately $37.2 million of the $218.6 million in aggregate realized giveback obligations was attributable to Carlyle Holdings. The funding for employee obligations and givebacks related to carry realized pre-IPO is primarily through a collection of employee receivables related to giveback obligations and from non-controlling interests for their portion of the obligation. The realization of giveback obligations for the Partnership's portion of such obligations reduces Distributable Earnings in the period realized and negatively impacts earnings available for distribution to unitholders in the period realized. Further, each individual recipient of realized carried interest typically signs a guarantee agreement or partnership agreement that personally obligates such person to return his/her pro rata share of any amounts of realized carried interest previously distributed that are later clawed back. Accordingly, carried interest as performance fee compensation is subject to return to the Partnership in the event a giveback obligation is funded. Generally, the actual giveback liability, if any, does not become due until the end of a fund's life.
Each investment fund is considered separately in evaluating carried interest and potential giveback obligations. As a result, performance fees within funds will continue to fluctuate primarily due to certain investments within each fund constituting a material portion of the carry in that fund. Additionally, the fair value of investments in our funds may have substantial fluctuations from period to period.
In addition, in our discussion of our non-GAAP results, we use the term “net performance fees” to refer to the performance fees from our funds net of the portion allocated to our investment professionals, if any, and certain tax expenses associated with carried interest attributable to certain partners and employees, which are reflected as performance fee related compensation expense. We use the term “realized net performance fees” to refer to realized performance fees from our funds, net of the portion allocated to our investment professionals, if any, and certain tax expenses associated with carried interest attributable to certain partners and employees, which are reflected as realized performance fee related compensation expense. See “— Non-GAAP Financial Measures” for the amount of realized and unrealized performance fees recognized each period. See “— Segment Analysis” for the realized and unrealized performance fees by segment and related discussion for each period.
Fair Value Measurement.
U.S. GAAP establishes a hierarchal disclosure framework which ranks the observability of market price inputs used in measuring financial instruments at fair value. The observability of inputs is impacted by a number of factors, including the type of financial instrument, the characteristics specific to the financial instrument and the state of the marketplace, including the existence and transparency of transactions between market participants. Financial instruments with readily available quoted prices, or for which fair value can be measured from quoted prices in active markets, will generally have a higher degree of market price observability and a lesser degree of judgment applied in determining fair value.
76
The table below summarizes the valuation of investments and other financial instruments included within our AUM, by segment and fair value hierarchy levels, as of
June 30, 2017
(amounts in millions):
|
|
As of June 30, 2017
|
||||||||||||||||||
|
|
Corporate
Private Equity |
Real
Assets
|
Global Market Strategies
|
Investment Solutions
|
Total
|
||||||||||||||
|
Consolidated Results
|
|||||||||||||||||||
|
Level I
|
$
|
1,185
|
|
$
|
2,560
|
|
$
|
207
|
|
$
|
1,002
|
|
$
|
4,954
|
|
||||
|
Level II
|
178
|
|
967
|
|
60
|
|
169
|
|
1,374
|
|
|||||||||
|
Level III
|
35,327
|
|
21,213
|
|
23,135
|
|
29,285
|
|
108,960
|
|
|||||||||
|
Total Fair Value
|
36,690
|
|
24,740
|
|
23,402
|
|
30,456
|
|
115,288
|
|
|||||||||
|
Other Net Asset Value
|
1,638
|
|
(432
|
)
|
(211
|
)
|
(554
|
)
|
441
|
|
|||||||||
|
Total AUM, Excluding Available Capital Commitments
|
38,328
|
|
24,308
|
|
23,191
|
|
29,902
|
|
115,729
|
|
|||||||||
|
Available Capital Commitments
|
15,995
|
|
14,636
|
|
7,701
|
|
15,764
|
|
54,096
|
|
|||||||||
|
Total AUM
|
$
|
54,323
|
|
$
|
38,944
|
|
$
|
30,892
|
|
$
|
45,666
|
|
$
|
169,825
|
|
||||
Investment Income, Interest, and Other Income.
Investment income, interest, and other income represent the unrealized and realized gains and losses on our principal investments, including our investments in Carlyle funds that are not consolidated, our equity method investments and other principal investments, as well as any interest and other income. Investment income (loss) also includes the related amortization of the basis difference between the carrying value of our investment and our share of the underlying net assets of the investee, as well as the compensation expense associated with compensatory arrangements provided by us to employees of our equity method investee. Realized investment income (loss) is recorded when we redeem all or a portion of our investment or when we receive or are due cash income, such as dividends or distributions. A realized investment loss is also recorded when an investment is deemed to be worthless. Unrealized investment income (loss) results from changes in the fair value of the underlying investment, as well as the reversal of previously recognized unrealized gains (losses) at the time an investment is realized.
Interest and Other Income of Consolidated Funds.
Interest and other income of Consolidated Funds primarily represents the interest earned on CLO assets. However, the Consolidated Funds are not the same entities in all periods presented. The Consolidated Funds in future periods may change due to changes in fund terms, formation of new funds, and terminations of funds.
Revenue of a Consolidated Real Estate VIE.
Revenue of a consolidated real estate VIE consists of revenue generated by Urbplan, which primarily is revenue earned for land development services using the completed contract method and investment income earned on Urbplan’s investments. Under the completed contract method of revenue recognition, revenue is not recognized until the period in which the land development services contract is completed, which can cause volatility from period to period based on which contracts are completed.
Net Investment Gains (Losses) of Consolidated Funds.
Net investment gains (losses) of Consolidated Funds measures the change in the difference in fair value between the assets and the liabilities of the Consolidated Funds. A gain (loss) indicates that the fair value of the assets of the Consolidated Funds appreciated more (less), or depreciated less (more), than the fair value of the liabilities of the Consolidated Funds. A gain or loss is not necessarily indicative of the investment performance of the Consolidated Funds and does not impact the management or incentive fees received by Carlyle for its management of the Consolidated Funds. The portion of the net investment gains (losses) of Consolidated Funds attributable to the limited partner investors is allocated to non-controlling interests. Therefore a gain or loss is not expected to have a material impact on the revenues or profitability of the Partnership. Moreover, although the assets of the Consolidated Funds are consolidated onto our balance sheet pursuant to U.S. GAAP, ultimately we do not have recourse to such assets and such liabilities are generally non-recourse to us. Therefore, a gain or loss from the Consolidated Funds generally does not impact the assets available to our equity holders.
77
Expenses
Compensation and Benefits.
Compensation includes salaries, bonuses, equity-based compensation, and performance payment arrangements. Bonuses are accrued over the service period to which they relate.
We recognize as compensation expense the portion of performance fees that are due to our employees, senior Carlyle professionals, and operating executives in a manner consistent with how we recognize the performance fee revenue. These amounts are accounted for as compensation expense in conjunction with the related performance fee revenue and, until paid, are recognized as a component of the accrued compensation and benefits liability. Compensation in respect of performance fees is paid when the related performance fees are realized, and not when such performance fees are accrued. The funds do not have a uniform allocation of performance fees to our employees, senior Carlyle professionals and operating executives. Therefore, for any given period, the ratio of performance fee compensation to performance fee revenue may vary based on the funds generating the performance fee revenue for that period and their particular allocation percentages.
In addition, we have implemented various equity-based compensation arrangements that require senior Carlyle professionals and other employees to vest ownership of a portion of their equity interests over a service period of up to 60 months, which under U.S. GAAP will result in compensation charges over current and future periods. Further, in order to recruit and retain existing and future senior Carlyle professionals and other employees, we have implemented additional equity-based compensation programs that have resulted in increases to our equity-based compensation expenses, which is a trend that may continue in the future if we increase our issuance of deferred restricted common units as employee compensation. For example, in February 2017, we granted approximately 7.6 million deferred restricted common units across a significant number of our employees for a total estimated grant-date fair value of approximately $106 million; these awards vest over a period of 18 to 60 months. Compensation charges associated with the equity-based compensation grants issued in our initial public offering in May 2012 or grants issued in acquisitions or strategic investments are excluded from our calculation of Economic Net Income. Compensation charges associated with all equity-based compensation grants are excluded from Fee Related Earnings and Distributable Earnings.
We may hire additional individuals and overall compensation levels may correspondingly increase, which could result in an increase in compensation and benefits expense. As a result of acquisitions, we have charges associated with contingent consideration taking the form of earn-outs and profit participation, some of which are reflected as compensation expense. A portion of our compensation expense relates to internal fundraising costs, and compensation will fluctuate based on increases or decreases in our fundraising activity. Amounts due to employees related to such fundraising will be expensed when earned even though the benefit of the new capital and related fees will be reflected in operations over the life of the related fund.
General, Administrative and Other Expenses.
General, administrative, and other expenses include occupancy and equipment expenses and other expenses, which consist principally of professional fees, including those related to our global regulatory compliance program, external costs of fundraising, travel and related expenses, communications and information services, depreciation and amortization (including intangible asset amortization and impairment) and foreign currency transactions. We expect that general, administrative and other expenses will vary due to infrequently occurring or unusual items, such as the impairment of intangible assets and expenses associated with litigation and contingencies. Also, in periods of significant fundraising, to the extent that we use third parties to assist in our fundraising efforts, our general, administrative and other expenses may increase accordingly. Additionally, we anticipate that general, administrative and other expenses will fluctuate from period to period due to the impact of foreign exchange transactions.
We also could incur additional expenses in the future related to our acquisitions including amortization of acquired intangibles, earn-outs to equity holders and fair value adjustments on contingent consideration issued, as well as related to our global compliance efforts. As discussed in Note 6 to the unaudited condensed consolidated financial statements, we evaluate our intangible assets (including goodwill) for impairment and could record additional impairment losses in future periods.
Interest and Other Expenses of Consolidated Funds.
The interest and other expenses of Consolidated Funds consist primarily of interest expenses related primarily to our CLO loans, professional fees and other third-party expenses.
Interest and Other Expenses of a Consolidated Real Estate VIE.
Interest and other expenses of a consolidated real estate VIE reflect expenses incurred by Urbplan, consisting primarily of interest expense, general and administrative expenses, impairment charges, compensation and benefits, and costs associated with land development services. Also included in this caption is the change in our estimate of the fair value of Urbplan’s loans payable during the period.
Income Taxes.
The Carlyle Holdings partnerships and their subsidiaries primarily operate as pass-through entities for U.S. income tax purposes and record a provision for state and local income taxes for certain entities based on applicable laws and a
78
provision for foreign income taxes for certain foreign entities. In addition, Carlyle Holdings I GP Inc. is subject to U.S. income taxes on only a portion of our income or loss. Depending on the sources of our taxable income or loss, our income tax provision or benefit can vary significantly from period to period.
Income taxes for foreign entities are accounted for using the asset and liability method of accounting. Under this method, deferred tax assets and liabilities are recognized for the expected future tax consequences of differences between the carrying amounts of assets and liabilities and their respective tax basis, using currently enacted tax rates. The effect on deferred tax assets and liabilities of a change in tax rates is recognized in income in the period in which the change is enacted. Deferred tax assets are reduced by a valuation allowance when it is more likely than not that some or all of the deferred tax assets will not be realized.
In the normal course of business, we are subject to examination by federal and certain state, local and foreign tax regulators. As of
June 30, 2017
, our U.S. federal income tax returns for the years 2013 through 2016 are open under the normal three-year statute of limitations and therefore subject to examination. State and local tax returns are generally subject to audit from 2012 to 2016. Foreign tax returns are generally subject to audit from 2009 to 2016. Certain of our affiliates are currently under audit by federal, state and foreign tax authorities.
Non-controlling Interests in Consolidated Entities.
Non-controlling interests in consolidated entities represent the component of equity in consolidated entities not held by us. These interests are adjusted for general partner allocations.
We record significant non-controlling interests in Carlyle Holdings relating to the ownership interests of the limited partners of the Carlyle Holdings partnerships. The Partnership, through wholly owned subsidiaries, is the sole general partner of Carlyle Holdings. Accordingly, the Partnership consolidates the financial position and results of operations of Carlyle Holdings into its financial statements, and the other ownership interests in Carlyle Holdings are reflected as a non-controlling interest in the Partnership’s financial statements.
Non-GAAP Financial Measures
Economic Net Income.
Economic net income, or “ENI,” is a key performance benchmark used in our industry.
ENI differs from income (loss) before provision for income taxes computed in accordance with U.S. GAAP in that it includes certain tax expenses associated with performance fees, and does not include net income (loss) attributable to non-Carlyle interests in consolidated entities or charges (credits) related to Carlyle corporate actions and non-recurring items. Charges (credits) related to Carlyle corporate actions and non-recurring items include: charges associated with equity-based compensation that was issued in the initial public offering in May 2012 or is issued in acquisitions or strategic investments, changes in the tax receivable agreement liability, amortization and any impairment charges associated with acquired intangible assets, transaction costs associated with acquisitions, charges associated with earnouts and contingent consideration including gains and losses associated with the estimated fair value of contingent consideration issued in conjunction with acquisitions or strategic investments, gains and losses from the retirement of debt, charges associated with contract terminations and employee severance.
We believe the inclusion or exclusion of these items provides investors with a meaningful indication of our core operating performance. For segment reporting purposes, revenues and expenses, and, accordingly, segment net income, are presented on a basis that deconsolidates the Consolidated Funds. Total Segment ENI equals the aggregate of ENI for all segments. This measure supplements and should be considered in addition to and not in lieu of the results of operations discussed further under “Consolidated Results of Operations” prepared in accordance with U.S. GAAP.
Fee Related Earnings.
Fee Related Earnings, or “FRE,” is a component of ENI and measures our operating profitability exclusive of performance fees, investment income from investments in our funds, performance fee-related compensation, equity-based compensation expense, and certain general, administrative and other expenses when the timing of any future payment is uncertain. Accordingly, Fee Related Earnings reflect the ability of the business to cover direct base compensation and operating expenses from fee revenues other than performance fees. Fee Related Earnings are reported as part of our segment results. We use Fee Related Earnings from operations to measure our profitability from fund management fees.
Distributable Earnings.
Distributable Earnings is FRE plus realized net performance fees and realized investment income. Distributable Earnings is intended to show the amount of net realized earnings without the effects of consolidation of the Consolidated Funds. Distributable Earnings is derived from our segment reported results and is an additional measure to assess performance and determine amounts potentially available for distribution from Carlyle Holdings to its unitholders. Distributable Earnings is evaluated regularly by management in making resource deployment and compensation decisions and in assessing performance of our four segments. We also use Distributable Earnings in our budgeting, forecasting, and the overall management of our segments. We believe that reporting Distributable Earnings is helpful to understanding our business
79
and that investors should review the same supplemental financial measure that management uses to analyze our segment performance.
Operating Metrics
We monitor certain operating metrics that are common to the alternative asset management industry.
Fee-earning Assets under Management
Fee-earning assets under management or Fee-earning AUM refers to the assets we manage or advise from which we derive recurring fund management fees. Our Fee-earning AUM is generally based on one of the following, once fees have been activated:
|
(a)
|
the amount of limited partner capital commitments, generally for carry funds where the original investment period has not expired, for AlpInvest carry funds during the commitment fee period and for Metropolitan carry funds during the weighted-average investment period of the underlying funds (see “Fee-earning AUM based on capital commitments” in the table below for the amount of this component at each period);
|
|
(b)
|
the remaining amount of limited partner invested capital at cost, generally for carry funds and certain co-investment vehicles where the original investment period has expired and Metropolitan carry funds after the expiration of the weighted-average investment period of the underlying funds (see “Fee-earning AUM based on invested capital” in the table below for the amount of this component at each period);
|
|
(c)
|
the amount of aggregate fee-earning collateral balance at par of our collateralized loan obligations (“CLOs”), as defined in the fund indentures (typically exclusive of equities and defaulted positions) as of the quarterly cut-off date for each CLO (see “Fee-earning AUM based on collateral balances, at par” in the table below for the amount of this component at each period);
|
|
(d)
|
the external investor portion of the net asset value of our hedge fund and fund of hedge funds vehicles (pre redemptions and subscriptions), as well as certain carry funds (see “Fee-earning AUM based on net asset value” in the table below for the amount of this component at each period);
|
|
(e)
|
the gross assets (including assets acquired with leverage), excluding cash and cash equivalents of our business development companies and certain carry funds (see “Fee-earning AUM based on lower of cost or fair value and other” in the table below for the amount of this component at each period); and
|
|
(f)
|
the lower of cost or fair value of invested capital, generally for AlpInvest carry funds where the commitment fee period has expired and certain carry funds where the investment period has expired, (see “Fee-earning AUM based on lower of cost or fair value and other” in the table below for the amount of this component at each period).
|
The table below details Fee-earning AUM by its respective components at each period.
|
|
As of June 30,
|
||||||
|
|
2017
|
2016
|
|||||
|
Consolidated Results
|
(Dollars in millions)
|
||||||
|
Components of Fee-earning AUM
|
|||||||
|
Fee-earning AUM based on capital commitments (1)
|
$
|
53,412
|
|
$
|
48,712
|
|
|
|
Fee-earning AUM based on invested capital (2)
|
23,222
|
|
29,893
|
|
|||
|
Fee-earning AUM based on collateral balances, at par (3)
|
17,111
|
|
17,863
|
|
|||
|
Fee-earning AUM based on net asset value (4)
|
1,310
|
|
6,239
|
|
|||
|
Fee-earning AUM based on lower of cost or fair value and other (5)
|
21,079
|
|
22,612
|
|
|||
|
Balance, End of Period (6)
|
$
|
116,134
|
|
$
|
125,319
|
|
|
|
(1)
|
Reflects limited partner capital commitments where the original investment period, weighted-average investment period, or commitment fee period has not expired.
|
|
(2)
|
Reflects limited partner invested capital at cost and includes amounts committed to or reserved for investments for certain Real Assets and Investment Solutions funds.
|
|
(3)
|
Represents the amount of aggregate Fee-earning collateral balances and principal balances, at par, for our CLOs/structured products.
|
80
|
(4)
|
Reflects the net asset value (pre-redemptions and subscriptions) of our hedge funds, fund of hedge funds vehicles, and certain other carry funds.
|
|
(5)
|
Includes funds with fees based on gross asset value.
|
|
(6)
|
Energy II, Energy III, Energy IV, and Renew II (collectively, the “Legacy Energy Funds”), are managed with Riverstone Holdings LLC and its affiliates. Affiliates of both Carlyle and Riverstone act as investment advisers to each of the Legacy Energy Funds. Carlyle has a minority representation on the management committees of Energy IV and Renew II. Carlyle and Riverstone each hold half of the seats on the management committees of Energy II and Energy III, but the investment period for these funds has expired and the remaining investments in such funds are being disposed of in the ordinary course of business. As of
June 30, 2017
, the Legacy Energy Funds had, in the aggregate, approximately
$6.3 billion
in AUM and
$4.7 billion
in Fee-earning AUM. We are no longer raising capital for the Legacy Energy Funds and expect these balances to continue to decrease over time as the funds wind down.
|
The table below provides the period to period rollforward of Fee-earning AUM.
|
|
Three Months Ended June 30,
|
Six Months Ended June 30,
|
|||||||||||||
|
|
2017
|
2016
|
2017
|
2016
|
|||||||||||
|
Consolidated Results
|
(Dollars in millions)
|
(Dollars in millions)
|
|||||||||||||
|
Fee-earning AUM Rollforward
|
|||||||||||||||
|
Balance, Beginning of Period
|
$
|
114,905
|
|
$
|
130,339
|
|
$
|
114,994
|
|
$
|
130,994
|
|
|||
|
Inflows, including Fee-paying Commitments (1)
|
2,303
|
|
1,873
|
|
5,039
|
|
4,605
|
|
|||||||
|
Outflows, including Distributions (2)
|
(3,495
|
)
|
(5,584
|
)
|
(6,161
|
)
|
(7,688
|
)
|
|||||||
|
Subscriptions, net of Redemptions (3)
|
—
|
|
(1,181
|
)
|
—
|
|
(2,895
|
)
|
|||||||
|
Changes in CLO collateral balances (4)
|
389
|
|
843
|
|
(349
|
)
|
(133
|
)
|
|||||||
|
Market Appreciation/(Depreciation) (5)
|
(179
|
)
|
(145
|
)
|
(155
|
)
|
(729
|
)
|
|||||||
|
Foreign Exchange and other (6)
|
2,211
|
|
(826
|
)
|
2,766
|
|
1,165
|
|
|||||||
|
Balance, End of Period
|
$
|
116,134
|
|
$
|
125,319
|
|
$
|
116,134
|
|
$
|
125,319
|
|
|||
|
(1)
|
Inflows represent limited partner capital raised and capital invested by our carry funds and NGP management fee funds outside the investment period, weighted-average investment period or commitment fee period. Inflows do not include amounts raised of $8.6 billion for which fees have not yet commenced.
|
|
(2)
|
Outflows represent limited partner distributions from our carry funds and NGP management fee funds, changes in basis for our carry funds where the investment period, weighted-average investment period or commitment fee period has expired, and reductions for funds that are no longer calling for fees.
|
|
(3)
|
Represents the net result of subscriptions to and redemptions from our hedge funds and fund of hedge funds vehicles.
|
|
(4)
|
Represents the change in the aggregate Fee-earning collateral balances at par of our CLOs/structured products, as of the quarterly cut-off dates.
|
|
(5)
|
Market Appreciation/(Depreciation) represents changes in the net asset value of our hedge funds and fund of hedge funds vehicles, and realized and unrealized gains (losses) on portfolio investments in our carry funds based on the lower of cost or fair value and net asset value.
|
|
(6)
|
Includes activity of funds with fees based on gross asset value. Represents the impact of foreign exchange rate fluctuations on the translation of our non-U.S. dollar denominated funds. Activity during the period is translated at the average rate for the period. Ending balances are translated at the spot rate as of the period end.
|
Refer to “— Segment Analysis” for a detailed discussion by segment of the activity affecting Fee-earning AUM for each of the periods presented by segment.
Assets under Management
Assets under management or AUM refers to the assets we manage or advise. Our AUM equals the sum of the following:
(a) the fair value of the capital invested in carry funds and related co-investment vehicles and NGP management fee funds plus the capital that Carlyle is entitled to call from investors in those funds and vehicles (including Carlyle commitments to those funds and vehicles and those of senior Carlyle professionals and employees) pursuant to the terms of their capital commitments to those funds and vehicles;
81
|
(b)
|
the amount of aggregate collateral balance and principal cash at par or aggregate principal amount of the notes of our CLOs and other structured products (inclusive of all positions);
|
|
(c)
|
the net asset value (pre-redemptions and subscriptions) of our long/short credit, emerging markets, multi-product macroeconomic, fund of hedge funds vehicles, mutual fund and other hedge funds; and
|
|
(d)
|
the gross assets (including assets acquired with leverage) of our business development companies.
|
We include in our calculation of AUM and Fee-earning AUM certain energy and renewable resources funds that we jointly advise with Riverstone and certain NGP management fee funds and carry funds that are advised by NGP.
For most of our carry funds, total AUM includes the fair value of the capital invested, whereas Fee-earning AUM includes the amount of capital commitments or the remaining amount of invested capital at cost, depending on whether the original investment period for the fund has expired. As such, Fee-earning AUM may be greater than total AUM when the aggregate fair value of the remaining investments is less than the cost of those investments.
Our calculations of Fee-earning AUM and AUM may differ from the calculations of other alternative asset managers. As a result, these measures may not be comparable to similar measures presented by other alternative asset managers. In addition, our calculation of AUM (but not Fee-earning AUM) includes uncalled commitments to, and the fair value of invested capital in, our investment funds from Carlyle and our personnel, regardless of whether such commitments or invested capital are subject to management or performance fees. Our calculations of AUM or Fee-earning AUM are not based on any definition of AUM or Fee-earning AUM that is set forth in the agreements governing the investment funds that we manage or advise.
We generally use Fee-earning AUM as a metric to measure changes in the assets from which we earn recurring management fees. Total AUM tends to be a better measure of our investment and fundraising performance as it reflects assets at fair value plus available uncalled capital.
Available Capital
Available capital, commonly known as “dry powder,” for our carry funds and NGP management fee funds refer to the amount of capital commitments available to be called for investments. Amounts previously called may be added back to available capital following certain distributions. “Expired Available Capital” occurs when a fund has passed the investment and follow-on periods and can no longer invest capital into new or existing deals. Any remaining Available Capital, typically a result of either recycled distributions or specific reserves established for the follow-on period that are not drawn, can only be called for fees and expenses and is therefore removed from the Total AUM calculation.
The table below provides the period to period rollforward of Available Capital and Fair Value of Capital, and the resulting rollforward of Total AUM.
|
|
Three Months Ended June 30, 2017
|
Six Months Ended June 30, 2017
|
|||||||||||||||||||||
|
|
Available
Capital |
Fair Value
of Capital |
Total
AUM |
Available
Capital |
Fair Value
of Capital |
Total
AUM |
|||||||||||||||||
|
|
(Dollars in millions)
|
(Dollars in millions)
|
|||||||||||||||||||||
|
Consolidated Results
|
|||||||||||||||||||||||
|
Balance, Beginning of Period
|
$
|
49,863
|
|
$
|
112,079
|
|
$
|
161,942
|
|
$
|
50,140
|
|
$
|
107,467
|
|
$
|
157,607
|
|
|||||
|
Commitments (1)
|
6,319
|
|
—
|
|
6,319
|
|
9,049
|
|
—
|
|
9,049
|
|
|||||||||||
|
Capital Called, net (2)
|
(3,135
|
)
|
3,047
|
|
(88
|
)
|
(6,721
|
)
|
6,490
|
|
(231
|
)
|
|||||||||||
|
Distributions (3)
|
533
|
|
(6,426
|
)
|
(5,893
|
)
|
956
|
|
(10,519
|
)
|
(9,563
|
)
|
|||||||||||
|
Subscriptions, net of Redemptions (4)
|
—
|
|
—
|
|
—
|
|
—
|
|
(7
|
)
|
(7
|
)
|
|||||||||||
|
Changes in CLO collateral balances (5)
|
—
|
|
124
|
|
124
|
|
—
|
|
(246
|
)
|
(246
|
)
|
|||||||||||
|
Market Appreciation/(Depreciation) (6)
|
—
|
|
4,479
|
|
4,479
|
|
—
|
|
9,420
|
|
9,420
|
|
|||||||||||
|
Foreign Exchange and other (7)
|
516
|
|
2,426
|
|
2,942
|
|
672
|
|
3,124
|
|
3,796
|
|
|||||||||||
|
Balance, End of Period
|
$
|
54,096
|
|
$
|
115,729
|
|
$
|
169,825
|
|
$
|
54,096
|
|
$
|
115,729
|
|
$
|
169,825
|
|
|||||
|
(1)
|
Represents capital raised by our carry funds and NGP management fee funds, net of expired available capital.
|
82
|
(2)
|
Represents capital called by our carry funds and NGP management fee funds, net of fund fees and expenses and investments in our business development companies. Invested capital amounts may vary from capital called due to timing differences between investment acquisition and capital call dates.
|
|
(3)
|
Represents distributions from our carry funds and NGP management fee funds, net of amounts recycled and distributions from our business development companies. Distributions are based on when proceeds are actually distributed to investors, which may differ from when they are realized.
|
|
(4)
|
Represents the net result of subscriptions to and redemptions from our hedge funds and and fund of hedge funds vehicles.
|
|
(5)
|
Represents the change in the aggregate collateral balance and principal cash at par of the CLOs/structured products.
|
|
(6)
|
Market Appreciation/(Depreciation) represents realized and unrealized gains (losses) on portfolio investments and changes in the net asset value of our hedge funds, mutual fund, and fund of hedge funds vehicles. Appreciation for the second quarter of 2017 was driven by 10% appreciation ($0.8 billion) in the public portfolio and 6% appreciation ($2.9 billion) in the private portfolio of our Corporate Private Equity, Real Assets, and Global Market Strategies carry funds, in addition to $0.4 billion of appreciation in our Investment Solutions carry funds.
|
|
(7)
|
Represents the impact of foreign exchange rate fluctuations on the translation of our non-U.S. dollar denominated funds and other changes in AUM. Activity during the period is translated at the average rate for the period. Ending balances are translated at the spot rate as of the period end.
|
Please refer to “— Segment Analysis” for a detailed discussion by segment of the activity affecting Total AUM for each of the periods presented.
The table below presents the change in appreciation on portfolio investments of our carry funds. Please refer to “— Segment Analysis” for a detailed discussion by segment of the activity affecting Total AUM for each of the periods presented.
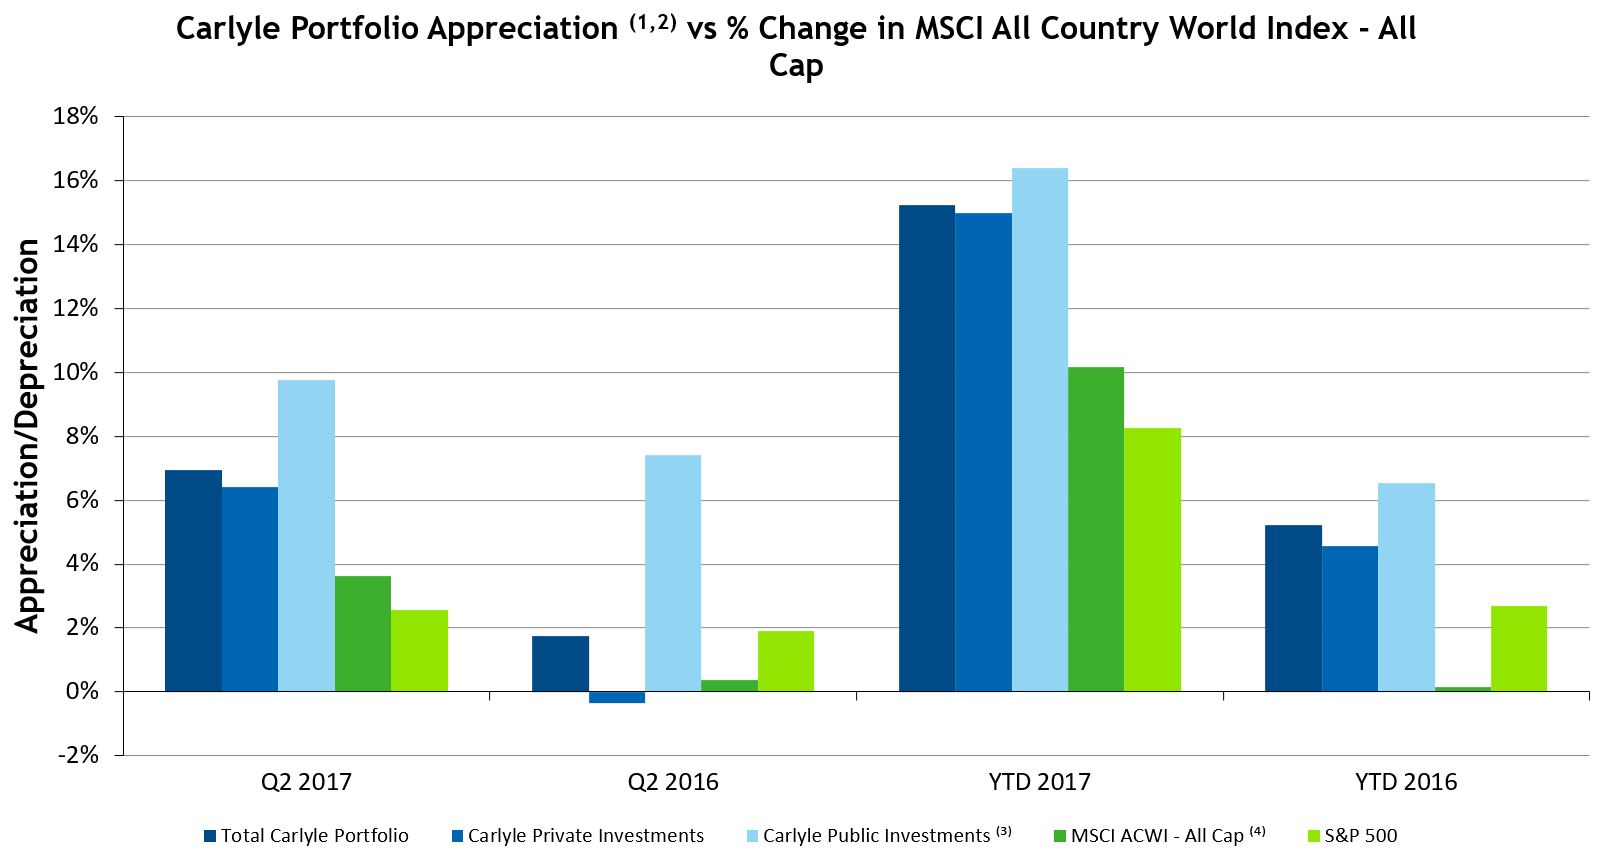
|
(1)
|
Corporate Private Equity, Real Assets, and Global Market Strategies carry funds only, excluding external co-investment.
|
|
(2)
|
For Carlyle returns, “Appreciation/Depreciation” represents realized and unrealized gain / loss for the period on a total return basis before fees and expenses. The percentage of return is calculated as the sum of ending remaining investment fair market value ("FMV") and net investment outflow (sales proceeds less net purchases) less beginning remaining investment FMV divided by beginning remaining investment FMV.
|
|
(3)
|
Public portfolio includes initial public offerings ("IPO") that occurred in the quarter. Investments may be reported as private in quarters prior to the IPO quarter.
|
|
(4)
|
The MSCI ACWI - All Cap Index represents the performance of the MSCI All Country World Index across all market capitalization sizes of the global equity market. There are significant differences between the types of securities and
|
83
assets typically acquired by our carry funds and the investments covered by the MSCI All Country World Index. Specifically, our carry funds may make investments in securities and other assets that have a greater degree of risk and volatility, and less liquidity, than those securities included in the MSCI All Country World Index. Moreover, investors in the securities included in the MSCI All Country World Index may not be subject to the management fees, carried interest or expenses to which investors in our carry funds are typically subject. Comparisons between the our carry fund appreciation and the MSCI All Country World Index are included for informational purposes only.
Consolidation of Certain Carlyle Funds and Variable Interest Entities
The Partnership consolidates all entities that it controls either through a majority voting interest or as the primary beneficiary of variable interest entities. On January 1, 2016, the Partnership adopted ASU 2015-2,
Consolidation (Topic 810): Amendments to the Consolidation Analysis,
which provides a revised consolidation model for all reporting entities to use in evaluating whether to consolidate certain types of legal entities. As a result, the Partnership deconsolidated the majority of the Partnership's consolidated funds on January 1, 2016. The entities we consolidate are referred to collectively as the Consolidated Funds in our unaudited condensed consolidated financial statements. For further information on our consolidation policy, see Note 2 to the unaudited condensed consolidated financial statements included in this Quarterly Report on Form 10-Q.
As of
June 30, 2017
, our Consolidated Funds represent approximately
2%
of our AUM; 2% of our fund management fees for both the
three months and six months ended June 30, 2017
; and less than 1% of our performance fees for both the
three months and six months ended June 30, 2017
.
We are not required under the consolidation guidance to consolidate in our financial statements most of the investment funds we advise. However, we consolidate certain CLOs that we advise. As of
June 30, 2017
, our consolidated CLOs held approximately $4.4 billion of total assets and comprised substantially all of the assets and loans payable of the Consolidated Funds. The assets and liabilities of the Consolidated Funds are generally held within separate legal entities and, as a result, the liabilities of the Consolidated Funds are non-recourse to us. For further information on consolidation of certain funds, see Note 2 to the unaudited condensed consolidated financial statements included in this Quarterly Report on Form 10-Q.
Generally, the consolidation of the Consolidated Funds has a gross-up effect on our assets, liabilities and cash flows but has no net effect on the net income attributable to the Partnership and partners’ capital. The majority of the net economic ownership interests of the Consolidated Funds are reflected as non-controlling interests in consolidated entities in the consolidated financial statements. For further information, see Note 2 to the unaudited condensed consolidated financial statements included in this Quarterly Report on Form 10-Q.
Because only a small portion of our funds are consolidated, the performance of the Consolidated Funds is not necessarily consistent with or representative of the combined performance trends of all of our funds.
In addition, as described in Note 16 to the unaudited condensed consolidated financial statements included in this Quarterly Report on Form 10-Q, we consolidate Urbplan, a Brazilian real estate portfolio company held by certain of our real estate investment funds. Due to the timing and availability of financial information of Urbplan, we consolidate the financial position and results of operations of Urbplan on a financial reporting lag of 90 days. As of
June 30, 2017
, our unaudited condensed consolidated financial statements included approximately $200 million of assets related to Urbplan.
Consolidated Results of Operations
The following table and discussion sets forth information regarding our unaudited condensed consolidated results of operations for the
three months and six months ended June 30, 2017 and 2016
. The unaudited condensed consolidated financial statements have been prepared on substantially the same basis for all historical periods presented; however, the consolidated funds are not the same entities in all periods shown due to changes in U.S. GAAP, changes in fund terms and the creation and termination of funds. As further described below, the consolidation of these funds primarily had the impact of increasing interest and other income of Consolidated Funds, interest and other expenses of Consolidated Funds, and net investment gains (losses) of Consolidated Funds in the year that the fund is initially consolidated. The consolidation of these funds had no effect on net income attributable to the Partnership for the periods presented.
84
|
|
Three Months Ended June 30,
|
Six Months Ended June 30,
|
|||||||||||||
|
|
2017
|
2016
|
2017
|
2016
|
|||||||||||
|
|
(Dollars in millions, except unit and per unit data)
|
||||||||||||||
|
Revenues
|
|||||||||||||||
|
Fund management fees
|
$
|
238.8
|
|
$
|
272.5
|
|
$
|
485.1
|
|
$
|
562.0
|
|
|||
|
Performance fees
|
|||||||||||||||
|
Realized
|
357.7
|
|
389.9
|
|
440.9
|
|
521.7
|
|
|||||||
|
Unrealized
|
185.9
|
|
(179.0
|
)
|
784.3
|
|
(165.6
|
)
|
|||||||
|
Total performance fees
|
543.6
|
|
210.9
|
|
1,225.2
|
|
356.1
|
|
|||||||
|
Investment income
|
|||||||||||||||
|
Realized
|
26.7
|
|
38.9
|
|
26.5
|
|
51.5
|
|
|||||||
|
Unrealized
|
32.3
|
|
26.4
|
|
78.8
|
|
4.2
|
|
|||||||
|
Total investment income
|
59.0
|
|
65.3
|
|
105.3
|
|
55.7
|
|
|||||||
|
Interest and other income
|
5.6
|
|
5.0
|
|
16.0
|
|
9.7
|
|
|||||||
|
Interest and other income of Consolidated Funds
|
45.0
|
|
35.9
|
|
87.9
|
|
64.8
|
|
|||||||
|
Revenue of a consolidated real estate VIE
|
16.4
|
|
18.4
|
|
109.0
|
|
42.8
|
|
|||||||
|
Total revenues
|
908.4
|
|
608.0
|
|
2,028.5
|
|
1,091.1
|
|
|||||||
|
Expenses
|
|||||||||||||||
|
Compensation and benefits
|
|||||||||||||||
|
Base compensation
|
151.0
|
|
149.9
|
|
297.0
|
|
316.2
|
|
|||||||
|
Equity-based compensation
|
88.0
|
|
109.0
|
|
160.8
|
|
184.4
|
|
|||||||
|
Performance fee related
|
|||||||||||||||
|
Realized
|
166.7
|
|
172.4
|
|
212.5
|
|
234.0
|
|
|||||||
|
Unrealized
|
90.4
|
|
(75.9
|
)
|
361.7
|
|
(68.0
|
)
|
|||||||
|
Total compensation and benefits
|
496.1
|
|
355.4
|
|
1,032.0
|
|
666.6
|
|
|||||||
|
General, administrative and other expenses
|
95.8
|
|
91.4
|
|
189.6
|
|
173.7
|
|
|||||||
|
Interest
|
16.5
|
|
15.4
|
|
31.5
|
|
30.7
|
|
|||||||
|
Interest and other expenses of Consolidated Funds
|
78.5
|
|
31.6
|
|
123.7
|
|
55.0
|
|
|||||||
|
Interest and other expenses of a consolidated real estate VIE
|
18.4
|
|
52.4
|
|
138.0
|
|
75.8
|
|
|||||||
|
Other non-operating expenses
|
0.1
|
|
0.7
|
|
0.1
|
|
4.5
|
|
|||||||
|
Total expenses
|
705.4
|
|
546.9
|
|
1,514.9
|
|
1,006.3
|
|
|||||||
|
Other income
|
|||||||||||||||
|
Net investment gains (losses) of Consolidated Funds
|
40.7
|
|
6.7
|
|
57.8
|
|
(1.7
|
)
|
|||||||
|
Income before provision for income taxes
|
243.7
|
|
67.8
|
|
571.4
|
|
83.1
|
|
|||||||
|
Provision for income taxes
|
13.2
|
|
24.3
|
|
19.0
|
|
31.7
|
|
|||||||
|
Net income
|
230.5
|
|
43.5
|
|
552.4
|
|
51.4
|
|
|||||||
|
Net income (loss) attributable to non-controlling interests in consolidated entities
|
16.5
|
|
1.6
|
|
19.8
|
|
(0.7
|
)
|
|||||||
|
Net income attributable to Carlyle Holdings
|
214.0
|
|
41.9
|
|
532.6
|
|
52.1
|
|
|||||||
|
Net income attributable to non-controlling interests in Carlyle Holdings
|
156.4
|
|
35.8
|
|
392.0
|
|
37.6
|
|
|||||||
|
Net income attributable to The Carlyle Group L.P.
|
$
|
57.6
|
|
$
|
6.1
|
|
$
|
140.6
|
|
$
|
14.5
|
|
|||
|
Net income attributable to The Carlyle Group L.P. per common unit
|
|||||||||||||||
|
Basic
|
$
|
0.65
|
|
$
|
0.07
|
|
$
|
1.61
|
|
$
|
0.18
|
|
|||
|
Diluted
|
$
|
0.59
|
|
$
|
0.07
|
|
$
|
1.49
|
|
$
|
0.09
|
|
|||
|
Weighted-average common units
|
|||||||||||||||
|
Basic
|
88,801,343
|
|
81,683,415
|
|
87,079,007
|
|
81,284,238
|
|
|||||||
|
Diluted
|
96,986,255
|
|
85,849,938
|
|
94,486,422
|
|
304,176,760
|
|
|||||||
85
Three Months Ended June 30, 2017
Compared to the
Three Months Ended June 30, 2016
and
Six Months Ended June 30, 2017
Compared to the
Six Months Ended June 30, 2016
Revenues
Total revenues
increased
$300.4 million
, or
49%
, for the
three months ended June 30, 2017
as compared to the
three months ended June 30, 2016
and
increased
$937.4 million
, or
86%
for the
six months ended June 30, 2017
as compared to the
six months ended June 30, 2016
. The following table provides the components of the changes in total revenues for the
three months and six months ended June 30, 2017
:
|
Three Months Ended
June 30, |
Six Months Ended
June 30, |
|||||
|
(Dollars in Millions)
|
||||||
|
Total Revenue, June 30, 2016
|
$
|
608.0
|
|
$
|
1,091.1
|
|
|
Decrease in fund management fees
|
(33.7
|
)
|
(76.9
|
)
|
||
|
Increase in performance fees
|
332.7
|
|
869.1
|
|
||
|
(Decrease) increase in investment income
|
(6.3
|
)
|
49.6
|
|
||
|
Increase in interest and other income of Consolidated Funds
|
9.1
|
|
23.1
|
|
||
|
(Decrease) increase in revenue from a consolidated real estate VIE
|
(2.0
|
)
|
66.2
|
|
||
|
All other changes
|
0.6
|
|
6.3
|
|
||
|
Total increase
|
300.4
|
|
937.4
|
|
||
|
Total Revenue, June 30, 2017
|
$
|
908.4
|
|
$
|
2,028.5
|
|
Fund Management Fees.
Fund management fees
decreased
$33.7 million
, or
12%
, to
$238.8 million
for the
three months ended June 30, 2017
as compared to the
three months ended June 30, 2016
and
decreased
$76.9 million
, or
14%
, to
$485.1 million
for the
six months ended June 30, 2017
as compared to the
six months ended June 30, 2016
, primarily due to the following:
|
Three Months Ended
June 30, |
Six Months Ended
June 30, |
|||||
|
2017 v. 2016
|
||||||
|
(Dollars in Millions)
|
||||||
|
Higher management fees from the commencement of the
investment period for certain newly raised funds |
$
|
15.0
|
|
25.5
|
|
|
|
Lower management fees resulting from the change in basis for
earning management fees from commitments to invested capital for certain funds and from distributions from funds whose management fees are based on invested capital |
(17.5
|
)
|
(36.0
|
)
|
||
|
Decrease in catch-up management fees from subsequent closes of
funds that are in the fundraising period |
(4.9
|
)
|
(6.5
|
)
|
||
|
Lower management fees from lower assets under management in
our former hedge funds |
(20.5
|
)
|
(43.6
|
)
|
||
|
Lower transaction and portfolio advisory fees
|
(2.3
|
)
|
(14.1
|
)
|
||
|
All other changes
|
(3.5
|
)
|
(2.2
|
)
|
||
|
Total decrease in fund management fees
|
$
|
(33.7
|
)
|
$
|
(76.9
|
)
|
Fund management fees include transaction and portfolio advisory fees, net of rebate offsets, of
$6.1 million
and
$8.4 million
for the
three months ended June 30, 2017 and 2016
, respectively, and
$17.8 million
and
$31.9 million
for the
six months ended June 30, 2017 and 2016
, respectively. The $14.1 million decrease in transaction and portfolio advisory fees for the
six months ended June 30, 2017
as compared to the
six months ended June 30, 2016
resulted primarily from a significant transaction related to one of our U.S. buyout funds in the
six months ended June 30, 2016
as compared to the
six months ended June 30, 2017
.
86
Performance Fees.
Performance fees
increased
$332.7 million
for the
three months ended June 30, 2017
as compared to the
three months ended June 30, 2016
and
increased
$869.1 million
for the
six months ended June 30, 2017
as compared to the
six months ended June 30, 2016
. Performance fees by segment on a consolidated U.S. GAAP basis for the
three months and six months ended June 30, 2017 and 2016
comprised the following:
|
Three Months Ended
June 30, |
Six Months Ended
June 30, |
||||||||||||
|
2017
|
2016
|
2017
|
2016
|
||||||||||
|
(Dollars in Millions)
|
|||||||||||||
|
Corporate Private Equity
|
$
|
419.8
|
|
$
|
69.1
|
|
$
|
987.8
|
|
$
|
96.6
|
|
|
|
Real Assets
|
81.7
|
|
115.5
|
|
139.5
|
|
217.7
|
|
|||||
|
Global Market Strategies
|
13.6
|
|
7.4
|
|
33.6
|
|
9.0
|
|
|||||
|
Investment Solutions
|
28.5
|
|
18.9
|
|
64.3
|
|
32.8
|
|
|||||
|
Total performance fees
|
$
|
543.6
|
|
$
|
210.9
|
|
$
|
1,225.2
|
|
$
|
356.1
|
|
|
|
Total carry fund appreciation
|
5%
|
4%
|
11%
|
4%
|
|||||||||
Approximately $339.0 million of our performance fees for the
three months ended June 30, 2017
were related to CP VI, CAP IV, and CP V, while approximately $122.4 million of our performance fees for the
three months ended June 30, 2016
were related to CRP V, CBPF, and CRP VII. Approximately $876.5 million of our performance fees for the
six months ended June 30, 2017
were related to CP VI, CP V, and CAP IV, while approximately $271.1 million of our performance fees for the
six months ended June 30, 2016
were related to CRP V, CP V, CRP VII, and CBPF.
Over the course of the second quarter of 2017, economic conditions continued to improve and translated to robust corporate earnings growth in most major economies, with the S&P 500 earnings advancing by 7.2%, on average, in the second quarter after recording 13.9% annual growth in the first quarter of 2017. Strong earnings growth supported higher asset prices, with the MSCI World Index rising by 3.2% during the second quarter and continuing to rise through the end of July 2017. Further, stronger economic growth also led to an increase in the level and volatility of government bond yields. Higher bond yields led directly to an appreciation in the Euro, which surged from 1.06 against the U.S. dollar at the end of the first quarter to 1.14 as of the end of the second quarter and 1.18 as of the end of July 2017. Despite the increase and volatility in yields, leveraged finance markets remained strong in the second quarter of 2017, and favorable deal finance terms supported a robust private equity investment environment. For the first half of 2017, private equity-backed deal volumes reached their highest levels in a decade. The positive economic climate and the strong underlying performance of many of the portfolio companies in our funds facilitated the appreciation of our carry funds during the second quarter. The measurement of our performance fees for any given period reflects the change in the valuation of our portfolios for funds that have exceeded their performance hurdles and are otherwise in accrued carry which is impacted by market volatility. Our carry fund portfolio valuations increased
5%
during the quarter and increased 11% since December 31, 2016.
87
Investment Income (Loss).
Investment income
decreased
$6.3 million
to
$59.0 million
for the
three months ended June 30, 2017
as compared to investment income of
$65.3 million
for the
three months ended June 30, 2016
and
increased
$49.6 million
to
$105.3 million
for the
six months ended June 30, 2017
as compared to investment income of
$55.7 million
for the
six months ended June 30, 2016
, primarily due to the following:
|
Three Months Ended
June 30, |
Six Months Ended
June 30, |
|||||
|
2017 v. 2016
|
||||||
|
(Dollars in Millions)
|
||||||
|
Increase in investment income from NGP, which includes performance fees
from the investments in NGP |
$
|
11.0
|
|
$
|
59.0
|
|
|
Investment loss related to Q1 2017 amended NGP agreements
(See Note 5 to the unaudited condensed consolidated financial statements) |
—
|
|
(20.8
|
)
|
||
|
Increase in investment income from our buyout and growth funds
|
2.9
|
|
6.9
|
|
||
|
(Increase) decrease in losses on foreign currency hedges
|
(3.7
|
)
|
9.5
|
|
||
|
Decrease in investment income from our real assets funds,
excluding NGP |
(8.9
|
)
|
(7.3
|
)
|
||
|
Decrease in investment loss from our distressed debt funds,
former hedge funds, and energy mezzanine funds |
—
|
|
3.3
|
|
||
|
Decrease in investment income from CLOs
|
(9.0
|
)
|
(5.0
|
)
|
||
|
All other changes
|
1.4
|
|
4.0
|
|
||
|
Total (decrease) increase in investment income
|
$
|
(6.3
|
)
|
$
|
49.6
|
|
Interest and Other Income of Consolidated Funds.
Our CLOs generate interest income primarily from investments in bonds and loans inclusive of amortization of discounts and generate other income from consent and amendment fees. Substantially all interest and other income of the CLOs and other consolidated funds together with interest expense of our CLOs and net investment gains (losses) of Consolidated Funds is attributable to the related funds’ limited partners or CLO investors and therefore is allocated to non-controlling interests. Accordingly, such amounts have no material impact on net income attributable to the Partnership.
Interest and other income of Consolidated Funds
increased
$9.1 million
for the
three months ended June 30, 2017
as compared to the
three months ended June 30, 2016
and
increased
$23.1 million
for the
six months ended June 30, 2017
as compared to the
six months ended June 30, 2016
. Substantially all of the increase in interest and other income of Consolidated Funds for both periods relates to increased interest income from CLOs.
Revenue of a Consolidated Real Estate VIE.
Revenue of a consolidated real estate VIE was
$16.4 million
for the
three months ended June 30, 2017
as compared to
$18.4 million
for the
three months ended June 30, 2016
. The
decrease
in revenue of a consolidated real estate VIE for the
three months ended June 30, 2017
as compared to the
three months ended June 30, 2016
was primarily due to a decrease in investment income, partially offset by an increase in the the number of completed land development projects in the
three months ended June 30, 2017
as compared to the
three months ended June 30, 2016
. Urbplan recognizes revenue for land development services under the completed contract method.
Revenue of a consolidated real estate VIE was
$109.0 million
for the
six months ended June 30, 2017
as compared to
$42.8 million
for the
six months ended June 30, 2016
. The
increase
in revenue of a consolidated real estate VIE for the
six months ended June 30, 2017
as compared to the
six months ended June 30, 2016
was primarily due to an increase in the number of completed land development projects in 2017 as compared to 2016, partially offset by a decrease in investment income.
88
Expenses
Total expenses
increased
$158.5 million
for the
three months ended June 30, 2017
as compared to the
three months ended June 30, 2016
and
increased
$508.6 million
for the
six months ended June 30, 2017
as compared to the
six months ended June 30, 2016
. The following table provides the components of the changes in total expenses for the
three months and six months ended June 30, 2017
:
|
Three Months Ended
June 30, |
Six Months Ended
June 30, |
|||||
|
(Dollars in Millions)
|
||||||
|
Total Expenses, June 30, 2016
|
$
|
546.9
|
|
$
|
1,006.3
|
|
|
Increases (Decreases):
|
||||||
|
Increase in total compensation and benefits
|
140.7
|
|
365.4
|
|
||
|
Increase in general, administrative and other expenses
|
4.4
|
|
15.9
|
|
||
|
Increase in interest and other expenses of Consolidated Funds
|
46.9
|
|
68.7
|
|
||
|
(Decrease) increase in interest and other expenses of a consolidated real
estate VIE |
(34.0
|
)
|
62.2
|
|
||
|
All other changes
|
0.5
|
|
(3.6
|
)
|
||
|
Total increase
|
158.5
|
|
508.6
|
|
||
|
Total Expenses, June 30, 2017
|
$
|
705.4
|
|
$
|
1,514.9
|
|
Total Compensation and Benefits.
Total compensation and benefits
increased
$140.7 million
, or
40%
, for the
three months ended June 30, 2017
as compared to the
three months ended June 30, 2016
and
increased
$365.4 million
, or
55%
, for the
six months ended June 30, 2017
as compared to the
six months ended June 30, 2016
, due to the following:
|
Three Months Ended
June 30, |
Six Months Ended
June 30, |
|||||
|
2017 v. 2016
|
||||||
|
(Dollars in Millions)
|
||||||
|
Increase (decrease) in base compensation
|
$
|
1.1
|
|
$
|
(19.2
|
)
|
|
Decrease in equity-based compensation
|
(21.0
|
)
|
(23.6
|
)
|
||
|
Increase in performance fee related compensation
|
160.6
|
|
408.2
|
|
||
|
Total increase in total compensation and benefits
|
$
|
140.7
|
|
$
|
365.4
|
|
Base compensation and benefits.
Base compensation and benefits
increased
$1.1 million
, or
1%
, for the
three months ended June 30, 2017
as compared to the
three months ended June 30, 2016
and
decreased
$19.2 million
, or
6%
, for the
six months ended June 30, 2017
as compared to the
six months ended June 30, 2016
, primarily due to the following:
|
Three Months Ended
June 30, |
Six Months Ended
June 30, |
|||||
|
2017 v. 2016
|
||||||
|
(Dollars in Millions)
|
||||||
|
Decrease in hedge fund headcount and bonuses
|
$
|
(9.1
|
)
|
$
|
(18.2
|
)
|
|
Decrease in all other headcount and bonuses
|
(5.3
|
)
|
(26.0
|
)
|
||
|
Increase in compensation costs associated with fundraising
activities |
12.0
|
|
12.1
|
|
||
|
Absence in 2017 of prior year net write-down of acquisition-
related compensatory arrangements |
3.5
|
|
12.9
|
|
||
|
Total increase (decrease) in base compensation and benefits
|
$
|
1.1
|
|
$
|
(19.2
|
)
|
Equity-based Compensation.
Equity-based compensation
decreased
$21.0 million
for the
three months ended June 30, 2017
as compared to
three months ended June 30, 2016
. The
decrease
in equity-based compensation was due primarily to the timing of the component of the expense related to forfeitures as a result of the accounting policy change on January 1, 2017
89
to account for forfeitures as they occur instead of estimating forfeitures at the grant date. For the
three months ended June 30, 2017
, the primary impacts of this accounting policy change relate to the vesting of units in May 2017 related to our initial public offering in 2012 and the absence in 2017 of a true-up for additional compensation expense recorded in 2016 related to the May 2016 vesting of units. The
decrease
in equity-based compensation for the
three months ended June 30, 2017
as compared to
three months ended June 30, 2016
was partially offset by ongoing grants of deferred restricted common units to new and existing employees during 2016 and 2017.
Equity-based compensation
decreased
$23.6 million
for the
six months ended June 30, 2017
as compared to the
six months ended June 30, 2016
. The
decrease
in equity-based compensation was due primarily to the forfeiture of equity-based awards due to employee terminations occurring since the second quarter of 2016 and the accounting policy change on January 1, 2017 to account for forfeitures as they occur instead of estimating an expense at the grant date. These
decrease
s were partially offset by the settlement of the DGAM earnout arrangement due to the wind down of DGAM during 2016 in which additional expense was incurred and by ongoing grants of deferred restricted common units to new and existing employees during 2016 and 2017.
Performance fee related compensation expense.
Performance fee related compensation expense
increased
$160.6 million
for the
three months ended June 30, 2017
as compared to
three months ended June 30, 2016
and
increased
$408.2 million
for the
six months ended June 30, 2017
as compared to the
six months ended June 30, 2016
. Performance fee related compensation as a percentage of performance fees was
47%
for both the
three months and six months ended June 30, 2017
, and
46%
and
47%
for the
three months and six months ended June 30, 2016
, respectively. For our largest segment, Corporate Private Equity, our performance fee related compensation expense as a percentage of performance fees is generally around 45%. Performance fees from our Investment Solutions segment pay a higher ratio of performance fees as compensation. Conversely, performance fees from the Legacy Energy funds in the Real Assets segment are primarily allocated to Carlyle because the investment teams for the Legacy Energy funds are employed by Riverstone and not Carlyle.
General, Administrative and Other Expenses.
General, administrative and other expenses
increased
$4.4 million
for the
three months ended June 30, 2017
as compared to
three months ended June 30, 2016
and
increased
$15.9 million
for the
six months ended June 30, 2017
as compared to the
six months ended June 30, 2016
, primarily due to:
|
Three Months Ended
June 30, |
Six Months Ended
June 30, |
|||||
|
2017 v. 2016
|
||||||
|
(Dollars in Millions)
|
||||||
|
Lower intangible asset amortization
|
$
|
(6.4
|
)
|
(14.3
|
)
|
|
|
Higher expenses for litigation and contingencies *
(See Note 10 to the unaudited condensed consolidated financial statements) |
104.2
|
|
148.8
|
|
||
|
Insurance proceeds recognized for certain legal matters *
|
(103.3
|
)
|
(138.6
|
)
|
||
|
Lower professional fees and office expenses
|
(0.5
|
)
|
(0.9
|
)
|
||
|
Higher external fundraising costs
|
3.1
|
|
0.6
|
|
||
|
Foreign exchange and other changes
|
7.3
|
|
20.3
|
|
||
|
Total increase in general, administrative and other expenses
|
$
|
4.4
|
|
$
|
15.9
|
|
*
Included in these amounts are components of the net $5.9 million in costs and insurance proceeds recognized in our Global Market Strategies segment, primarily attributable to the settlement and purchase agreements to fully resolve all claims with investors in two structured finance vehicles managed by Vermillion (see Note 10 to the unaudited condensed consolidated financial statements).
Interest and Other Expenses of Consolidated Funds.
Interest and other expenses of Consolidated Funds
increased
$46.9 million
for the
three months ended June 30, 2017
as compared to
three months ended June 30, 2016
and
increased
$68.7 million
for the
six months ended June 30, 2017
as compared to the
six months ended June 30, 2016
. The
increase
for both periods is primarily due to higher interest expense on the consolidated CLOs.
The CLOs incur interest expense on their loans payable and incur other expenses consisting of trustee fees, rating agency fees and professional fees. Substantially all interest and other income of the CLOs together with interest expense of our CLOs and net investment gains (losses) of Consolidated Funds is attributable to the related funds’ limited partners or CLO investors
90
and therefore is allocated to non-controlling interests. Accordingly, such amounts have no material impact on net income attributable to the Partnership.
Interest and Other Expenses of a Consolidated Real Estate VIE.
Interest and other expenses of a consolidated real estate VIE
decreased
$34.0 million
for the
three months ended June 30, 2017
as compared to the
three months ended June 30, 2016
and
increased
$62.2 million
for the
six months ended June 30, 2017
as compared to the
six months ended June 30, 2016
, primarily due to:
|
Three Months Ended
June 30, |
Six Months Ended
June 30, |
|||||
|
2017 v. 2016
|
||||||
|
(Dollars in Millions)
|
||||||
|
Higher expenses associated with land development services as a result
of the completion of the related land development projects |
$
|
5.0
|
|
$
|
50.2
|
|
|
Higher income related to fair market value adjustment for Urbplan loans *
|
(6.4
|
)
|
(6.5
|
)
|
||
|
Lower interest expense
|
(6.4
|
)
|
(5.0
|
)
|
||
|
Lower compensation and benefits
|
(0.3
|
)
|
(0.6
|
)
|
||
|
(Lower) higher general, administrative and other expenses, primarily due to a
(decrease) increase in asset impairments and litigation-related liabilities |
(25.9
|
)
|
24.1
|
|
||
|
Total (decrease) increase in interest and other expenses of a Consolidated Real
Estate VIE |
$
|
(34.0
|
)
|
$
|
62.2
|
|
* The Partnership records the Urbplan loans at fair value at each reporting period and records the change in fair value to interest and other expenses of a consolidated real estate VIE.
Other Non-operating Expenses.
For the
three months and six months ended June 30, 2017 and 2016
, this caption primarily represents the change in fair value of contingent consideration associated with the Partnership's acquisitions.
The
decrease
in other non-operating expenses for both the
three months and six months ended June 30, 2017
as compared to the
three months and six months ended June 30, 2016
was the result of the separation from ESG and Claren Road and the associated termination of their respective earnout arrangements. See Note 8 to the unaudited condensed consolidated financial statements for more information on our contingent consideration arrangements.
Net Investment Gains (Losses) of Consolidated Funds
For the
three months ended June 30, 2017
, net investment gains of Consolidated Funds were
$40.7 million
as compared to net investment gains of
$6.7 million
for the
three months ended June 30, 2016
. For the
six months ended June 30, 2017
, net investment gains of Consolidated Funds were
$57.8 million
as compared to net investment losses of
$1.7 million
for the
six months ended June 30, 2016
. For both the
three months and six months ended June 30, 2017 and 2016
, net investment gains (losses) comprise the activity of the consolidated CLOs and certain other funds. For the consolidated CLOs, the amount reflects the net gain or loss on the fair value adjustment of both assets and liabilities. The components of net investment gains of consolidated funds for the respective periods are:
|
|
Three Months Ended June 30,
|
Six Months Ended June 30,
|
|||||||||||||
|
|
2017
|
2016
|
2017
|
2016
|
|||||||||||
|
|
(Dollars in millions)
|
||||||||||||||
|
Realized losses
|
$
|
(3.7
|
)
|
$
|
(3.4
|
)
|
$
|
(5.8
|
)
|
$
|
(9.6
|
)
|
|||
|
Net change in unrealized gains (losses)
|
(1.9
|
)
|
97.6
|
|
35.4
|
|
36.0
|
|
|||||||
|
Total gains (losses)
|
(5.6
|
)
|
94.2
|
|
29.6
|
|
26.4
|
|
|||||||
|
Gains (losses) from liabilities of CLOs
|
46.3
|
|
(87.3
|
)
|
28.2
|
|
(27.9
|
)
|
|||||||
|
Losses on other assets of CLOs
|
—
|
|
(0.2
|
)
|
—
|
|
(0.2
|
)
|
|||||||
|
Total investment gains (losses) of Consolidated Funds
|
$
|
40.7
|
|
$
|
6.7
|
|
$
|
57.8
|
|
$
|
(1.7
|
)
|
|||
91
For the
three months and six months ended June 30, 2017 and 2016
, the unrealized investment gains/losses primarily included the appreciation/depreciation of consolidated CLO investments in loans and bonds.
The net investment gains (losses) for the
three months and six months ended June 30, 2017 and 2016
were due to the following:
|
Three Months Ended
June 30, |
Six Months Ended
June 30, |
||||||||||||
|
2017
|
2016
|
2017
|
2016
|
||||||||||
|
(Dollars in Millions)
|
|||||||||||||
|
Gains attributable to other consolidated funds
|
$
|
—
|
|
$
|
0.4
|
|
$
|
—
|
|
$
|
2.7
|
|
|
|
Net appreciation (depreciation) of CLOs
|
40.7
|
|
6.3
|
|
57.8
|
|
(4.4
|
)
|
|||||
|
Total net investment gains (losses)
|
$
|
40.7
|
|
$
|
6.7
|
|
$
|
57.8
|
|
$
|
(1.7
|
)
|
|
Net Income Attributable to Non-controlling Interests in Consolidated Entities
Net income attributable to non-controlling interests in consolidated entities was
$16.5 million
for the
three months ended June 30, 2017
as compared to net income attributable to non-controlling interests in consolidated entities of
$1.6 million
for the
three months ended June 30, 2016
. Net income attributable to non-controlling interests in consolidated entities was
$19.8 million
for the
six months ended June 30, 2017
as compared to net loss attributable to non-controlling interests in consolidated entities of
$0.7 million
for the
six months ended June 30, 2016
. These amounts are primarily attributable to the net earnings or losses of non-Carlyle interests in majority-owned subsidiaries and non-controlling interest in carried interest and giveback obligations for each period. This balance also includes the allocation of Urbplan’s net losses that are attributable to non-controlling interests.
The net income (loss) of our Consolidated Funds for the
three months and six months ended June 30, 2017 and 2016
is comprised of the following:
|
Three Months Ended
June 30, |
Six Months Ended
June 30, |
||||||||||||
|
2017
|
2016
|
2017
|
2016
|
||||||||||
|
(Dollars in Millions)
|
|||||||||||||
|
Net income (loss) from the consolidated CLOs
|
$
|
(6.2
|
)
|
$
|
7.2
|
|
$
|
0.9
|
|
$
|
(3.1
|
)
|
|
|
Net income (loss) from other consolidated funds
|
—
|
|
0.4
|
|
(0.1
|
)
|
1.5
|
|
|||||
|
Total net income (loss) of our Consolidated Funds
|
$
|
(6.2
|
)
|
$
|
7.6
|
|
$
|
0.8
|
|
$
|
(1.6
|
)
|
|
Net Income Attributable to The Carlyle Group L.P.
The net income attributable to the Partnership was
$57.6 million
for the
three months ended June 30, 2017
as compared to net income attributable to the Partnership of
$6.1 million
for the
three months ended June 30, 2016
. The net income attributable to the Partnership was
$140.6 million
for the
six months ended June 30, 2017
as compared to net income attributable to the Partnership of
$14.5 million
for the
six months ended June 30, 2016
. The Partnership is allocated a portion of the monthly net income (loss) attributable to Carlyle Holdings based on the Partnership’s ownership in Carlyle Holdings (which was approximately 28% and 25% as of
June 30, 2017
and
2016
, respectively). Net income or loss attributable to the Partnership also includes 100% of the net income or loss attributable to the Partnership’s wholly-owned taxable subsidiary, Carlyle Holdings I GP Inc., which was $(2.1) million and $(6.2) million for the
three months ended June 30, 2017 and 2016
, respectively, and $(2.9) million and $1.3 million for the
six months ended June 30, 2017 and 2016
, respectively. As a result, the total net income or loss attributable to the Partnership will vary as a percentage of the net income or loss attributable to Carlyle Holdings.
92
Non-GAAP Financial Measures
The following tables set forth information in the format used by management when making resource deployment decisions and in assessing performance of our segments. These non-GAAP financial measures are presented for the
three months and six months ended June 30, 2017 and 2016
. The tables below show our total segment Economic Net Income which is the sum of Fee Related Earnings, Net Performance Fees, Investment Income (Loss), and Equity-based compensation expense (excluding equity-based compensation grants issued in May 2012 upon the completion of the initial public offering or grants issued in acquisitions or strategic investments). Our Non-GAAP financial measures exclude the effects of consolidated funds, acquisition-related items including amortization and any impairment charges of acquired intangible assets and contingent consideration taking the form of earn-outs, charges associated with equity-based compensation grants issued in May 2012 upon completion of the initial public offering or grants issued in acquisitions or strategic investments, changes in the tax receivable agreement liability, corporate actions and infrequently occurring or unusual events.
The following table shows our total segment Economic Net Income, Fee Related Earnings and Distributable Earnings for the
three months and six months ended June 30, 2017 and 2016
.
|
Three Months Ended June 30,
|
Six Months Ended June 30,
|
||||||||||||||
|
2017
|
2016
|
2017
|
2016
|
||||||||||||
|
(Dollars in millions)
|
|||||||||||||||
|
Total Segment Revenues
|
$
|
859.0
|
|
$
|
532.5
|
|
$
|
1,860.2
|
|
$
|
983.6
|
|
|||
|
Total Segment Expenses
|
558.9
|
|
374.2
|
|
1,160.0
|
|
736.8
|
|
|||||||
|
Economic Net Income
|
$
|
300.1
|
|
$
|
158.3
|
|
$
|
700.2
|
|
$
|
246.8
|
|
|||
|
(-) Net Performance Fees
|
299.4
|
|
115.4
|
|
693.5
|
|
190.7
|
|
|||||||
|
(-) Investment Income
|
31.2
|
|
28.9
|
|
41.8
|
|
22.5
|
|
|||||||
|
(+) Equity-based Compensation
|
36.7
|
|
30.9
|
|
66.8
|
|
62.3
|
|
|||||||
|
(=) Fee Related Earnings
|
$
|
6.2
|
|
$
|
44.9
|
|
$
|
31.7
|
|
$
|
95.9
|
|
|||
|
(+) Realized Net Performance Fees
|
182.1
|
|
233.3
|
|
217.4
|
|
303.4
|
|
|||||||
|
(+) Realized Investment Income
|
10.6
|
|
9.3
|
|
5.2
|
|
16.8
|
|
|||||||
|
(=) Distributable Earnings
|
$
|
198.9
|
|
$
|
287.5
|
|
$
|
254.3
|
|
$
|
416.1
|
|
|||
93
The following table sets forth our total segment revenues for the
three months and six months ended June 30, 2017 and 2016
.
|
Three Months Ended June 30,
|
Six Months Ended June 30,
|
||||||||||||||
|
2017
|
2016
|
2017
|
2016
|
||||||||||||
|
(Dollars in millions)
|
|||||||||||||||
|
Segment Revenues
|
|||||||||||||||
|
Fund level fee revenues
|
|||||||||||||||
|
Fund management fees
|
$
|
257.2
|
|
$
|
279.7
|
|
$
|
512.8
|
|
$
|
559.6
|
|
|||
|
Portfolio advisory fees, net
|
4.9
|
|
5.8
|
|
8.9
|
|
9.0
|
|
|||||||
|
Transaction fees, net
|
1.2
|
|
2.6
|
|
8.9
|
|
22.9
|
|
|||||||
|
Total fund level fee revenues
|
263.3
|
|
288.1
|
|
530.6
|
|
591.5
|
|
|||||||
|
Performance fees
|
|||||||||||||||
|
Realized
|
352.7
|
|
406.3
|
|
435.7
|
|
538.3
|
|
|||||||
|
Unrealized
|
206.6
|
|
(196.0
|
)
|
838.3
|
|
(180.0
|
)
|
|||||||
|
Total performance fees
|
559.3
|
|
210.3
|
|
1,274.0
|
|
358.3
|
|
|||||||
|
Investment income
|
|||||||||||||||
|
Realized
|
10.6
|
|
9.3
|
|
5.2
|
|
16.8
|
|
|||||||
|
Unrealized
|
20.6
|
|
19.6
|
|
36.6
|
|
5.7
|
|
|||||||
|
Total investment income
|
31.2
|
|
28.9
|
|
41.8
|
|
22.5
|
|
|||||||
|
Interest income
|
2.4
|
|
2.5
|
|
5.8
|
|
5.5
|
|
|||||||
|
Other income
|
2.8
|
|
2.7
|
|
8.0
|
|
5.8
|
|
|||||||
|
Total Segment Revenues
|
$
|
859.0
|
|
$
|
532.5
|
|
$
|
1,860.2
|
|
$
|
983.6
|
|
|||
The following table sets forth our total segment expenses for the
three months and six months ended June 30, 2017 and 2016
.
|
Three Months Ended June 30,
|
Six Months Ended June 30,
|
||||||||||||||
|
2017
|
2016
|
2017
|
2016
|
||||||||||||
|
(Dollars in millions)
|
|||||||||||||||
|
Segment Expenses
|
|||||||||||||||
|
Compensation and benefits
|
|||||||||||||||
|
Direct base compensation
|
$
|
103.4
|
|
$
|
108.5
|
|
$
|
211.7
|
|
$
|
230.3
|
|
|||
|
Indirect base compensation
|
49.6
|
|
38.4
|
|
88.6
|
|
78.2
|
|
|||||||
|
Equity-based compensation
|
36.7
|
|
30.9
|
|
66.8
|
|
62.3
|
|
|||||||
|
Performance fee related
|
|||||||||||||||
|
Realized
|
170.6
|
|
173.0
|
|
218.3
|
|
234.9
|
|
|||||||
|
Unrealized
|
89.3
|
|
(78.1
|
)
|
362.2
|
|
(67.3
|
)
|
|||||||
|
Total compensation and benefits
|
449.6
|
|
272.7
|
|
947.6
|
|
538.4
|
|
|||||||
|
General, administrative, and other indirect expenses
|
85.4
|
|
78.7
|
|
166.0
|
|
153.1
|
|
|||||||
|
Depreciation and amortization expense
|
7.5
|
|
7.3
|
|
15.0
|
|
14.6
|
|
|||||||
|
Interest expense
|
16.4
|
|
15.5
|
|
31.4
|
|
30.7
|
|
|||||||
|
Total Segment Expenses
|
$
|
558.9
|
|
$
|
374.2
|
|
$
|
1,160.0
|
|
$
|
736.8
|
|
|||
94
Income before provision for income taxes is the GAAP financial measure most comparable to economic net income, fee related earnings, and distributable earnings. The following table is a reconciliation of income before provision for income taxes to economic net income, to fee related earnings, and to distributable earnings.
|
Three Months Ended June 30,
|
Six Months Ended June 30,
|
||||||||||||||
|
|
2017
|
2016
|
2017
|
2016
|
|||||||||||
|
|
(Dollars in millions)
|
||||||||||||||
|
Income before provision for income taxes
|
$
|
243.7
|
|
$
|
67.8
|
|
$
|
571.4
|
|
$
|
83.1
|
|
|||
|
Adjustments:
|
|||||||||||||||
|
Equity-based compensation issued in conjunction with the initial public offering, acquisitions and strategic investments
|
58.5
|
|
79.3
|
|
125.5
|
|
124.7
|
|
|||||||
|
Acquisition related charges, including amortization of intangibles and impairment
|
9.2
|
|
21.6
|
|
18.0
|
|
39.3
|
|
|||||||
|
Other non-operating expense
|
0.1
|
|
0.7
|
|
0.1
|
|
4.5
|
|
|||||||
|
Tax provision associated with performance fees
|
(2.4
|
)
|
(10.8
|
)
|
(5.3
|
)
|
(14.1
|
)
|
|||||||
|
Net (income) loss attributable to non-controlling interests in consolidated entities
|
(16.5
|
)
|
(1.6
|
)
|
(19.8
|
)
|
0.7
|
|
|||||||
|
Severance and other adjustments
|
7.5
|
|
1.3
|
|
10.3
|
|
8.6
|
|
|||||||
|
Economic Net Income
|
$
|
300.1
|
|
$
|
158.3
|
|
$
|
700.2
|
|
$
|
246.8
|
|
|||
|
(-) Net performance fees
(1)
|
299.4
|
|
115.4
|
|
693.5
|
|
190.7
|
|
|||||||
|
(-) Investment income
(1)
|
31.2
|
|
28.9
|
|
41.8
|
|
22.5
|
|
|||||||
|
(+) Equity-based compensation
|
36.7
|
|
30.9
|
|
66.8
|
|
62.3
|
|
|||||||
|
(=) Fee Related Earnings
|
$
|
6.2
|
|
$
|
44.9
|
|
$
|
31.7
|
|
$
|
95.9
|
|
|||
|
(+) Realized performance fees, net of related compensation
(1)
|
182.1
|
|
233.3
|
|
217.4
|
|
303.4
|
|
|||||||
|
(+) Realized investment income
(1)
|
10.6
|
|
9.3
|
|
5.2
|
|
16.8
|
|
|||||||
|
(=) Distributable Earnings
|
$
|
198.9
|
|
$
|
287.5
|
|
$
|
254.3
|
|
$
|
416.1
|
|
|||
95
|
(1)
|
– See reconciliation to most directly comparable U.S. GAAP measure below:
|
|
|
Three Months Ended June 30, 2017
|
||||||||||
|
|
Carlyle
Consolidated |
Adjustments
(2)
|
Total
Reportable Segments |
||||||||
|
|
(Dollars in millions)
|
||||||||||
|
Performance fees
|
|||||||||||
|
Realized
|
$
|
357.7
|
|
$
|
(5.0
|
)
|
$
|
352.7
|
|
||
|
Unrealized
|
185.9
|
|
20.7
|
|
206.6
|
|
|||||
|
Total performance fees
|
543.6
|
|
15.7
|
|
559.3
|
|
|||||
|
Performance fee related compensation expense
|
|||||||||||
|
Realized
|
166.7
|
|
3.9
|
|
170.6
|
|
|||||
|
Unrealized
|
90.4
|
|
(1.1
|
)
|
89.3
|
|
|||||
|
Total performance fee related compensation expense
|
257.1
|
|
2.8
|
|
259.9
|
|
|||||
|
Net performance fees
|
|||||||||||
|
Realized
|
191.0
|
|
(8.9
|
)
|
182.1
|
|
|||||
|
Unrealized
|
95.5
|
|
21.8
|
|
117.3
|
|
|||||
|
Total net performance fees
|
$
|
286.5
|
|
$
|
12.9
|
|
$
|
299.4
|
|
||
|
Investment income (loss)
|
|||||||||||
|
Realized
|
$
|
26.7
|
|
$
|
(16.1
|
)
|
$
|
10.6
|
|
||
|
Unrealized
|
32.3
|
|
(11.7
|
)
|
20.6
|
|
|||||
|
Investment income (loss)
|
$
|
59.0
|
|
$
|
(27.8
|
)
|
$
|
31.2
|
|
||
|
Six Months Ended June 30, 2017
|
|||||||||||
|
Carlyle
Consolidated |
Adjustments
(2)
|
Total
Reportable Segments |
|||||||||
|
(Dollars in millions)
|
|||||||||||
|
Performance fees
|
|||||||||||
|
Realized
|
$
|
440.9
|
|
$
|
(5.2
|
)
|
$
|
435.7
|
|
||
|
Unrealized
|
784.3
|
|
54.0
|
|
838.3
|
|
|||||
|
Total performance fees
|
1,225.2
|
|
48.8
|
|
1,274.0
|
|
|||||
|
Performance fee related compensation expense
|
|||||||||||
|
Realized
|
212.5
|
|
5.8
|
|
218.3
|
|
|||||
|
Unrealized
|
361.7
|
|
0.5
|
|
362.2
|
|
|||||
|
Total performance fee related compensation expense
|
574.2
|
|
6.3
|
|
580.5
|
|
|||||
|
Net performance fees
|
|||||||||||
|
Realized
|
228.4
|
|
(11.0
|
)
|
217.4
|
|
|||||
|
Unrealized
|
422.6
|
|
53.5
|
|
476.1
|
|
|||||
|
Total net performance fees
|
$
|
651.0
|
|
$
|
42.5
|
|
$
|
693.5
|
|
||
|
Investment income (loss)
|
|||||||||||
|
Realized
|
$
|
26.5
|
|
$
|
(21.3
|
)
|
$
|
5.2
|
|
||
|
Unrealized
|
78.8
|
|
(42.2
|
)
|
36.6
|
|
|||||
|
Investment income (loss)
|
$
|
105.3
|
|
$
|
(63.5
|
)
|
$
|
41.8
|
|
||
96
|
|
Three Months Ended June 30, 2016
|
||||||||||
|
|
Carlyle
Consolidated |
Adjustments
(2)
|
Total
Reportable Segments |
||||||||
|
|
(Dollars in millions)
|
||||||||||
|
Performance fees
|
|||||||||||
|
Realized
|
$
|
389.9
|
|
$
|
16.4
|
|
$
|
406.3
|
|
||
|
Unrealized
|
(179.0
|
)
|
(17.0
|
)
|
(196.0
|
)
|
|||||
|
Total performance fees
|
210.9
|
|
(0.6
|
)
|
210.3
|
|
|||||
|
Performance fee related compensation expense
|
|||||||||||
|
Realized
|
172.4
|
|
0.6
|
|
173.0
|
|
|||||
|
Unrealized
|
(75.9
|
)
|
(2.2
|
)
|
(78.1
|
)
|
|||||
|
Total performance fee related compensation expense
|
96.5
|
|
(1.6
|
)
|
94.9
|
|
|||||
|
Net performance fees
|
|||||||||||
|
Realized
|
217.5
|
|
15.8
|
|
233.3
|
|
|||||
|
Unrealized
|
(103.1
|
)
|
(14.8
|
)
|
(117.9
|
)
|
|||||
|
Total net performance fees
|
$
|
114.4
|
|
$
|
1.0
|
|
$
|
115.4
|
|
||
|
Investment income (loss)
|
|||||||||||
|
Realized
|
$
|
38.9
|
|
$
|
(29.6
|
)
|
$
|
9.3
|
|
||
|
Unrealized
|
26.4
|
|
(6.8
|
)
|
19.6
|
|
|||||
|
Total investment income (loss)
|
$
|
65.3
|
|
$
|
(36.4
|
)
|
$
|
28.9
|
|
||
|
Six Months Ended June 30, 2016
|
|||||||||||
|
Carlyle
Consolidated |
Adjustments
(2)
|
Total
Reportable Segments |
|||||||||
|
(Dollars in millions)
|
|||||||||||
|
Performance fees
|
|||||||||||
|
Realized
|
$
|
521.7
|
|
$
|
16.6
|
|
$
|
538.3
|
|
||
|
Unrealized
|
(165.6
|
)
|
(14.4
|
)
|
(180.0
|
)
|
|||||
|
Total performance fees
|
356.1
|
|
2.2
|
|
358.3
|
|
|||||
|
Performance fee related compensation expense
|
|||||||||||
|
Realized
|
234.0
|
|
0.9
|
|
234.9
|
|
|||||
|
Unrealized
|
(68.0
|
)
|
0.7
|
|
(67.3
|
)
|
|||||
|
Total performance fee related compensation expense
|
166.0
|
|
1.6
|
|
167.6
|
|
|||||
|
Net performance fees
|
|||||||||||
|
Realized
|
287.7
|
|
15.7
|
|
303.4
|
|
|||||
|
Unrealized
|
(97.6
|
)
|
(15.1
|
)
|
(112.7
|
)
|
|||||
|
Total net performance fees
|
$
|
190.1
|
|
$
|
0.6
|
|
$
|
190.7
|
|
||
|
Investment income (loss)
|
|||||||||||
|
Realized
|
$
|
51.5
|
|
$
|
(34.7
|
)
|
$
|
16.8
|
|
||
|
Unrealized
|
4.2
|
|
1.5
|
|
5.7
|
|
|||||
|
Total investment income (loss)
|
$
|
55.7
|
|
$
|
(33.2
|
)
|
$
|
22.5
|
|
||
|
(2)
|
Adjustments to performance fees and investment income (loss) relate to (i) amounts earned from the Consolidated Funds, which were eliminated in the U.S. GAAP consolidation but were included in the Non-GAAP results, (ii) amounts attributable to non-controlling interests in consolidated entities, which were excluded from the Non-GAAP results, (iii) the reclassification of NGP performance fees, which are included in investment income in the U.S. GAAP financial statements, and (iv) the reclassification of certain tax expenses associated with performance fees.
|
97
Adjustments to investment income (loss) also include the reclassification of earnings for the investment in NGP Management and its affiliates to the appropriate operating captions for the Non-GAAP results, the exclusion of charges associated with the investment in NGP Management and its affiliates that are excluded from the Non-GAAP results and adjustments to reflect the Partnership’s share of Urbplan net losses as investment losses for the Non-GAAP results. Adjustments are also included in these financial statement captions to reflect Carlyle’s economic interests in Claren Road (through January 2017), ESG (through June 2016) and Vermillion.
Economic Net Income and Distributable Earnings for our reportable segments are as follows:
|
|
Three Months Ended June 30,
|
Six Months Ended June 30,
|
|||||||||||||
|
|
2017
|
2016
|
2017
|
2016
|
|||||||||||
|
|
(Dollars in millions)
|
||||||||||||||
|
Economic Net Income
|
|||||||||||||||
|
Corporate Private Equity
|
$
|
241.8
|
|
$
|
58.2
|
|
$
|
555.2
|
|
$
|
90.4
|
|
|||
|
Real Assets
|
50.7
|
|
78.7
|
|
110.1
|
|
140.2
|
|
|||||||
|
Global Market Strategies
|
0.6
|
|
12.0
|
|
16.0
|
|
6.5
|
|
|||||||
|
Investment Solutions
|
7.0
|
|
9.4
|
|
18.9
|
|
9.7
|
|
|||||||
|
Economic Net Income
|
$
|
300.1
|
|
$
|
158.3
|
|
$
|
700.2
|
|
$
|
246.8
|
|
|||
|
Distributable Earnings
|
|||||||||||||||
|
Corporate Private Equity
|
$
|
172.8
|
|
$
|
235.1
|
|
$
|
208.2
|
|
$
|
339.6
|
|
|||
|
Real Assets
|
11.8
|
|
39.0
|
|
15.4
|
|
58.5
|
|
|||||||
|
Global Market Strategies
|
8.9
|
|
6.7
|
|
16.7
|
|
7.5
|
|
|||||||
|
Investment Solutions
|
5.4
|
|
6.7
|
|
14.0
|
|
10.5
|
|
|||||||
|
Distributable Earnings
|
$
|
198.9
|
|
$
|
287.5
|
|
$
|
254.3
|
|
$
|
416.1
|
|
|||
Segment Analysis
Discussed below is our DE, FRE and ENI for our segments for the periods presented. Our segment information is reflected in the manner used by our senior management to make operating and compensation decisions, assess performance and allocate resources.
For segment reporting purposes, revenues and expenses are presented on a basis that deconsolidates our Consolidated Funds. As a result, segment revenues from management fees, performance fees and investment income (loss) are different than those presented on a consolidated U.S. GAAP basis because fund management fees recognized in certain segments are received from Consolidated Funds and are eliminated in consolidation when presented on a consolidated U.S. GAAP basis. Furthermore, segment expenses are different than related amounts presented on a consolidated U.S. GAAP basis due to the exclusion of fund expenses that are paid by the Consolidated Funds. Segment revenue and expenses are also different than those presented on a consolidated U.S. GAAP basis because we present our segment revenues and expenses related to Claren Road and ESG based on our economic interest in those entities. Effective January 1, 2016 and through January 31, 2017 (the date we transferred our ownership interests to its principals), our segment revenue and expenses related to Claren Road are based on our approximate 63% economic interest in that entity as a result of a reallocation of interest from a departing founder. Further, our economic interest in ESG was 55% through June 30, 2016. Also, ENI excludes expenses associated with equity-based compensation that was issued in our initial public offering or issued in acquisitions and strategic investments.
98
Corporate Private Equity
The following table presents our results of operations for our Corporate Private Equity segment:
|
|
Three Months Ended June 30,
|
Six Months Ended June 30,
|
|||||||||||||
|
|
2017
|
2016
|
2017
|
2016
|
|||||||||||
|
|
(Dollars in millions)
|
||||||||||||||
|
Segment Revenues
|
|||||||||||||||
|
Fund level fee revenues
|
|||||||||||||||
|
Fund management fees
|
$
|
117.7
|
|
$
|
126.8
|
|
$
|
233.4
|
|
$
|
254.0
|
|
|||
|
Portfolio advisory fees, net
|
4.5
|
|
5.2
|
|
8.3
|
|
8.3
|
|
|||||||
|
Transaction fees, net
|
1.2
|
|
2.6
|
|
8.9
|
|
22.9
|
|
|||||||
|
Total fund level fee revenues
|
123.4
|
|
134.6
|
|
250.6
|
|
285.2
|
|
|||||||
|
Performance fees
|
|||||||||||||||
|
Realized
|
272.1
|
|
337.9
|
|
323.4
|
|
464.1
|
|
|||||||
|
Unrealized
|
142.9
|
|
(278.9
|
)
|
658.2
|
|
(372.0
|
)
|
|||||||
|
Total performance fees
|
415.0
|
|
59.0
|
|
981.6
|
|
92.1
|
|
|||||||
|
Investment income (loss)
|
|||||||||||||||
|
Realized
|
8.9
|
|
18.0
|
|
9.1
|
|
22.5
|
|
|||||||
|
Unrealized
|
13.3
|
|
3.0
|
|
18.8
|
|
(3.1
|
)
|
|||||||
|
Total investment income
|
22.2
|
|
21.0
|
|
27.9
|
|
19.4
|
|
|||||||
|
Interest income
|
0.8
|
|
0.9
|
|
1.9
|
|
1.8
|
|
|||||||
|
Other income
|
1.3
|
|
1.2
|
|
2.6
|
|
2.7
|
|
|||||||
|
Total revenues
|
562.7
|
|
216.7
|
|
1,264.6
|
|
401.2
|
|
|||||||
|
Segment Expenses
|
|||||||||||||||
|
Compensation and benefits
|
|||||||||||||||
|
Direct base compensation
|
54.7
|
|
53.3
|
|
110.1
|
|
113.1
|
|
|||||||
|
Indirect base compensation
|
18.0
|
|
18.2
|
|
36.7
|
|
37.8
|
|
|||||||
|
Equity-based compensation
|
17.8
|
|
18.4
|
|
32.8
|
|
36.2
|
|
|||||||
|
Performance fee related
|
|||||||||||||||
|
Realized
|
121.6
|
|
143.3
|
|
147.7
|
|
201.9
|
|
|||||||
|
Unrealized
|
69.4
|
|
(117.4
|
)
|
297.2
|
|
(162.1
|
)
|
|||||||
|
Total compensation and benefits
|
281.5
|
|
115.8
|
|
624.5
|
|
226.9
|
|
|||||||
|
General, administrative, and other indirect expenses
|
28.4
|
|
32.0
|
|
63.4
|
|
62.9
|
|
|||||||
|
Depreciation and amortization expense
|
3.7
|
|
3.4
|
|
7.4
|
|
6.8
|
|
|||||||
|
Interest expense
|
7.3
|
|
7.3
|
|
14.1
|
|
14.2
|
|
|||||||
|
Total expenses
|
320.9
|
|
158.5
|
|
709.4
|
|
310.8
|
|
|||||||
|
Economic Net Income
|
$
|
241.8
|
|
$
|
58.2
|
|
$
|
555.2
|
|
$
|
90.4
|
|
|||
|
(-) Net Performance Fees
|
224.0
|
|
33.1
|
|
536.7
|
|
52.3
|
|
|||||||
|
(-) Investment Income
|
22.2
|
|
21.0
|
|
27.9
|
|
19.4
|
|
|||||||
|
(+) Equity-based Compensation
|
17.8
|
|
18.4
|
|
32.8
|
|
36.2
|
|
|||||||
|
(=) Fee Related Earnings
|
$
|
13.4
|
|
$
|
22.5
|
|
$
|
23.4
|
|
$
|
54.9
|
|
|||
|
(+) Realized Net Performance Fees
|
150.5
|
|
194.6
|
|
175.7
|
|
262.2
|
|
|||||||
|
(+) Realized Investment Income
|
8.9
|
|
18.0
|
|
9.1
|
|
22.5
|
|
|||||||
|
(=) Distributable Earnings
|
$
|
172.8
|
|
$
|
235.1
|
|
$
|
208.2
|
|
$
|
339.6
|
|
|||
99
Three Months Ended June 30, 2017
Compared to the
Three Months Ended June 30, 2016
and
Six Months Ended June 30, 2017
Compared to the
Six Months Ended June 30, 2016
Distributable Earnings
Distributable Earnings
decreased
$62.3 million
for the
three months ended June 30, 2017
as compared to the
three months ended June 30, 2016
and
decreased
$131.4 million
for the
six months ended June 30, 2017
as compared to the
six months ended June 30, 2016
. The following table provides the components of the changes in distributable earnings for the
three months and six months ended June 30, 2017
:
|
Three Months Ended
June 30, |
Six Months Ended
June 30, |
|||||
|
(Dollars in Millions)
|
||||||
|
Distributable earnings, June 30, 2016
|
$
|
235.1
|
|
$
|
339.6
|
|
|
Increases (decreases):
|
||||||
|
Decrease in realized net performance fees
|
(44.1
|
)
|
(86.5
|
)
|
||
|
Decrease in realized investment income
|
(9.1
|
)
|
(13.4
|
)
|
||
|
Decrease in fee related earnings
|
(9.1
|
)
|
(31.5
|
)
|
||
|
Total decrease
|
(62.3
|
)
|
(131.4
|
)
|
||
|
Distributable earnings, June 30, 2017
|
$
|
172.8
|
|
$
|
208.2
|
|
Realized Net Performance Fees.
Realized net performance fees
decreased
$44.1 million
for the
three months ended June 30, 2017
as compared to the
three months ended June 30, 2016
and
decreased
$86.5 million
for the
six months ended June 30, 2017
as compared to the
six months ended June 30, 2016
. The
decrease
in realized net performance fees for the
three months ended June 30, 2017
as compared to the
three months ended June 30, 2016
was primarily due to larger realizations from our Europe buyout and growth funds in carry in
2016
as compared to
2017
, partially offset by larger realizations in our Asia buyout funds in
2017
as compared to
2016
. The
decrease
in realized net performance fees for the
six months ended June 30, 2017
as compared to the
six months ended June 30, 2016
was primarily due to larger realizations from our U.S. and Europe buyout funds in carry in
2016
as compared to
2017
. Realized net performance fees were primarily generated by the following funds for the
three months and six months ended June 30, 2017
and
2016
:
|
Three Months Ended
June 30, |
Six Months Ended
June 30, |
|||
|
2017
|
2016
|
2017
|
2016
|
|
|
CP V
|
CEP III
|
CP V
|
CEP III
|
|
|
CAP III
|
CP V
|
CAP III
|
CP V
|
|
|
CEP III
|
CETP II
|
CEP III
|
CETP II
|
|
|
CP IV
|
CGFSP
|
CAP III
|
||
|
CVP III
|
||||
|
CP IV
|
||||
Realized Investment Income.
Realized investment income
decreased
$9.1 million
for the
three months ended June 30, 2017
as compared to the
three months ended June 30, 2016
and
decreased
$13.4 million
for the
six months ended June 30, 2017
as compared to the
six months ended June 30, 2016
. The
decrease
in realized investment income for both the
three months ended June 30, 2017
as compared to the
three months ended June 30, 2016
and the
six months ended June 30, 2017
as compared to the
six months ended June 30, 2016
was primarily due to lower realized gains in our investments in U.S. and Europe buyout funds as well as our investments in Europe growth funds.
100
Fee Related Earnings
Fee related earnings
decreased
$9.1 million
for the
three months ended June 30, 2017
as compared to the
three months ended June 30, 2016
and
decreased
$31.5 million
for the
six months ended June 30, 2017
as compared to the
six months ended June 30, 2016
. The following table provides the components of the changes in fee related earnings for the
three months and six months ended June 30, 2017
:
|
Three Months Ended
June 30, |
Six Months Ended
June 30, |
|||||
|
(Dollars in Millions)
|
||||||
|
Fee related earnings, June 30, 2016
|
$
|
22.5
|
|
$
|
54.9
|
|
|
Increases (decreases):
|
||||||
|
Decrease in fee revenues
|
(11.2
|
)
|
(34.6
|
)
|
||
|
(Increase) decrease in direct and indirect base compensation
|
(1.2
|
)
|
4.1
|
|
||
|
Decrease (increase) in general, administrative and other indirect expenses
|
3.6
|
|
(0.5
|
)
|
||
|
All other changes
|
(0.3
|
)
|
(0.5
|
)
|
||
|
Total decrease
|
(9.1
|
)
|
(31.5
|
)
|
||
|
Fee related earnings, June 30, 2017
|
$
|
13.4
|
|
$
|
23.4
|
|
Fee Revenues.
Total fee revenues
decreased
$11.2 million
for the
three months ended June 30, 2017
as compared to the
three months ended June 30, 2016
and
decreased
$34.6 million
for the
six months ended June 30, 2017
as compared to the
six months ended June 30, 2016
, due to the following:
|
Three Months Ended
June 30, |
Six Months Ended
June 30, |
|||||
|
2017 v. 2016
|
||||||
|
(Dollars in Millions)
|
||||||
|
Lower fund management fees
|
$
|
(9.1
|
)
|
$
|
(20.6
|
)
|
|
Lower transaction fees
|
(1.4
|
)
|
(14.0
|
)
|
||
|
Lower portfolio advisory fees
|
(0.7
|
)
|
—
|
|
||
|
Total decrease in fee revenues
|
$
|
(11.2
|
)
|
$
|
(34.6
|
)
|
The
decrease
in fund management fees for both the
three months and six months ended June 30, 2017
as compared to both the
three months and six months ended June 30, 2016
was primarily due to lower assets under management from sales of investments during
2016
for CP V, our third Europe buyout fund (“CEP III”), and our second Asia buyout fund (“CAP II”).
The total weighted-average management fee rate increased from
1.30%
at
June 30, 2016
to
1.31%
at
June 30, 2017
. The modest increase in the total weighted-average management fee rate reflects the increased weighted impact of funds in the original investment period with fees based on commitments, which charge higher fee rates, compared to those funds with fees based on invested equity or fair value. Fee-earning assets under management were
$36.2 billion
and
$38.9 billion
as of
June 30, 2017
and
2016
, respectively, reflecting a decrease of
$2.7 billion
.
The
decrease
in transaction fees for the
three months ended June 30, 2017
as compared to the
three months ended June 30, 2016
was primarily from a significant investment in one of our Japan buyout funds in the
three months ended June 30, 2016
as compared to the
three months ended June 30, 2017
. The
decrease
in transaction fees for the
six months ended June 30, 2017
as compared to the
six months ended June 30, 2016
was primarily from a significant investment in one of our U.S. buyout funds in the
six months ended June 30, 2016
as compared to the
six months ended June 30, 2017
.
Direct and indirect base compensation expense.
Direct and indirect base compensation expense
increased
$1.2 million
, or
2%
, for the
three months ended June 30, 2017
as compared to the
three months ended June 30, 2016
, primarily due to increased headcount, partially offset by lower bonus accruals.
101
Direct and indirect base compensation expense
decreased
$4.1 million
, or
3%
, for the
six months ended June 30, 2017
as compared to the
six months ended June 30, 2016
, primarily due to lower bonus accruals, partially offset by increased headcount.
General, administrative and other indirect expenses.
General, administrative and other indirect expenses
decreased
$3.6 million
for the
three months ended June 30, 2017
as compared to the
three months ended June 30, 2016
, primarily due to lower costs for litigation and contingencies and lower professional fees, partially offset by higher negative foreign currency adjustments and higher real estate costs.
General, administrative and other indirect expenses
increased
$0.5 million
for the
six months ended June 30, 2017
as compared to the
six months ended June 30, 2016
, primarily due to higher negative foreign currency adjustments and real estate costs, partially offset by lower professional fees and decreased external costs associated with fundraising activities in
six months ended June 30, 2017
as compared to the
six months ended June 30, 2016
of $2.1 million.
Economic Net Income
Economic net income
increased
$183.6 million
for the
three months ended June 30, 2017
as compared to the
three months ended June 30, 2016
and
increased
$464.8 million
for the
six months ended June 30, 2017
as compared to the
six months ended June 30, 2016
. The following table provides the components of the changes in economic net income for the
three months and six months ended June 30, 2017
:
|
Three Months Ended
June 30, |
Six Months Ended
June 30, |
|||||
|
(Dollars in Millions)
|
||||||
|
Economic net income, June 30, 2016
|
$
|
58.2
|
|
$
|
90.4
|
|
|
Increases (decreases):
|
||||||
|
Increase in net performance fees
|
190.9
|
|
484.4
|
|
||
|
Increase in investment income
|
1.2
|
|
8.5
|
|
||
|
Decrease in equity-based compensation
|
0.6
|
|
3.4
|
|
||
|
Decrease in fee related earnings
|
(9.1
|
)
|
(31.5
|
)
|
||
|
Total increase
|
183.6
|
|
464.8
|
|
||
|
Economic net income, June 30, 2017
|
$
|
241.8
|
|
$
|
555.2
|
|
Performance Fees.
Performance Fees (realized and unrealized)
increased
$356.0 million
for the
three months ended June 30, 2017
as compared to the
three months ended June 30, 2016
and
increased
$889.5 million
for the
six months ended June 30, 2017
as compared to the
six months ended June 30, 2016
. The
increase
for both the
three months ended June 30, 2017
as compared to the
three months ended June 30, 2016
and the
six months ended June 30, 2017
as compared to the
six months ended June 30, 2016
was primarily due to higher investment appreciation in our U.S. and Asia buyout funds as well as our financial services funds. Performance fees are from the following types of funds:
|
Performance Fees
|
|||||||||||||||
|
|
Three Months Ended June 30,
|
Six Months Ended June 30,
|
|||||||||||||
|
|
2017
|
2016
|
2017
|
2016
|
|||||||||||
|
|
(Dollars in millions)
|
||||||||||||||
|
Buyout funds
|
$
|
410.5
|
|
$
|
19.5
|
|
$
|
948.2
|
|
$
|
63.0
|
|
|||
|
Growth Capital funds
|
4.5
|
|
39.5
|
|
33.4
|
|
29.1
|
|
|||||||
|
Total
|
$
|
415.0
|
|
$
|
59.0
|
|
$
|
981.6
|
|
$
|
92.1
|
|
|||
102
The
$415.0 million
of performance fees for the
three months ended June 30, 2017
was driven primarily by performance fees recognized from the following funds:
•
CP VI of $192.4 million,
•
CAP IV of $80.7 million,
•
CP V of $65.4 million,
•
CGFSP II of $22.5 million,
•
CAP III of $17.3 million, and
•
CGFSP of $14.4 million.
The
$59.0 million
of performance fees for the
three months ended June 30, 2016
was driven by performance fees recognized from the following funds:
•
CBPF of $27.8 million,
•
CP V of $14.8 million,
•
CAP III of $12.6 million, and
•
CETP II of $9.7 million.
The
$981.6 million
of performance fees for the
six months ended June 30, 2017
was driven primarily by performance fees recognized from the following funds:
•
CP VI of $397.2 million,
•
CP V of $251.6 million,
•
CAP IV of $226.3 million,
•
CGFSP II of $29.7 million,
•
CETP II of $24.6 million, and
•
CEP III of $21.2 million.
The
$92.1 million
of performance fees for the
six months ended June 30, 2016
was driven by performance fees recognized from the following funds:
•
CP V of $75.6 million,
•
CBPF of $27.8 million,
•
CETP II of $7.2 million,
•
CEP II of $(7.5) million,
•
CAP II of $(5.9) million, and
•
CAP III of $(4.7) million.
Performance fees of
$415.0 million
and
$59.0 million
are inclusive of performance fees reversed of approximately $11.2 million and $15.6 million for the
three months ended June 30, 2017 and 2016
, respectively. Performance fees of
$981.6 million
and
$92.1 million
are inclusive of performance fees reversed of approximately $40.7 million and $34.5 million for the
six months ended June 30, 2017 and 2016
, respectively. Additionally, during the
three months ended June 30, 2016
, the Partnership paid $47.3 million to satisfy a giveback obligation related to CAP II. Substantially all of the giveback obligation was paid by current and former senior Carlyle professionals.
The appreciation (depreciation) in remaining value of assets for this segment by type of fund are as follows:
|
Three Months Ended June 30,
|
Six Months Ended June 30,
|
||||
|
2017
|
2016
|
2017
|
2016
|
||
|
Buyout funds
|
9%
|
4%
|
19%
|
6%
|
|
|
Growth Capital funds
|
4%
|
3%
|
11%
|
0%
|
|
|
Total
|
8%
|
4%
|
18%
|
5%
|
|
103
Net performance fees as a percentage of total performance fees are as follows:
|
Three Months Ended June 30,
|
Six Months Ended June 30,
|
||||
|
2017
|
2016
|
2017
|
2016
|
||
|
(Dollars in millions)
|
|||||
|
Net Performance Fees
|
$224.0
|
$33.1
|
$536.7
|
$52.3
|
|
|
Percentage of Total Performance Fees
|
54%
|
56%
|
55%
|
57%
|
|
Unrealized performance fees reflect the difference between total performance fees and realized performance fees. The recognition of realized performance fees results in a reversal of accumulated unrealized performance fees, generally resulting in minimal impact on total performance fees. Because unrealized performance fees are reversed upon a realization event, in periods where the Partnership generates significant realized performance fees unrealized performance fees may be negative even in periods of portfolio appreciation.
Total investment income.
Total investment income (realized and unrealized) for the
three months ended June 30, 2017
was
$22.2 million
as compared to total investment income of
$21.0 million
for the
three months ended June 30, 2016
. The
increase
in total investment income from the
three months ended June 30, 2016
to the
three months ended June 30, 2017
relates primarily to higher appreciation on investments in our Asia buyout funds for the
three months ended June 30, 2017
as compared to the
three months ended June 30, 2016
. The increase to total investment income was mostly offset by lower realized gains in our investments in U.S. and Europe buyout funds as well as our investments in Europe growth funds.
Total investment income (realized and unrealized) for the
six months ended June 30, 2017
was
$27.9 million
as compared to total investment income of
$19.4 million
for the
six months ended June 30, 2016
. The
increase
in total investment income from the
six months ended June 30, 2016
to the
six months ended June 30, 2017
related primarily to higher appreciation across our buyout and growth funds, particularly on investments in our Asia buyout funds for the
six months ended June 30, 2017
as compared to the
six months ended June 30, 2016
. These increases to total investment income were partially offset by lower realized gains in our investments in U.S. and Europe buyout funds as well as our investments in Europe growth funds.
Equity-based compensation.
Equity-based compensation was
$17.8 million
for the
three months ended June 30, 2017
,
a decrease
of
$0.6 million
from
$18.4 million
for the
three months ended June 30, 2016
.
Equity-based compensation was
$32.8 million
for the
six months ended June 30, 2017
,
a decrease
of
$3.4 million
from
$36.2 million
for the
six months ended June 30, 2016
.
Fee-earning AUM as of and for the
Three and Six
Months Ended
June 30, 2017
and
2016
Fee-earning AUM is presented below for each period together with the components of change during each respective period.
The table below breaks out Fee-earning AUM by its respective components at each period.
|
|
As of June 30,
|
||||||
|
|
2017
|
2016
|
|||||
|
Corporate Private Equity
|
(Dollars in millions)
|
||||||
|
Components of Fee-earning AUM (1)
|
|||||||
|
Fee-earning AUM based on capital commitments
|
$
|
26,004
|
|
$
|
25,731
|
|
|
|
Fee-earning AUM based on invested capital
|
8,466
|
|
10,846
|
|
|||
|
Fee-earning AUM based on lower of cost or fair value
|
1,746
|
|
2,361
|
|
|||
|
Total Fee-earning AUM
|
$
|
36,216
|
|
$
|
38,938
|
|
|
|
Weighted Average Management Fee Rates (2)
|
|||||||
|
All Funds
|
1.31
|
%
|
1.30
|
%
|
|||
|
Funds in Investment Period
|
1.44
|
%
|
1.43
|
%
|
|||
104
|
(1)
|
For additional information concerning the components of Fee-earning AUM, see “—Fee-earning Assets under Management.”
|
|
(2)
|
Represents the aggregate effective management fee rate of each fund in the segment, weighted by each fund’s Fee-earning AUM, as of the end of each period presented.
|
The table below provides the period to period rollforward of Fee-earning AUM.
|
|
Three Months Ended June 30,
|
Six Months Ended June 30,
|
|||||||||||||
|
|
2017
|
2016
|
2017
|
2016
|
|||||||||||
|
Corporate Private Equity
|
(Dollars in millions)
|
(Dollars in millions)
|
|||||||||||||
|
Fee-earning AUM Rollforward
|
|||||||||||||||
|
Balance, Beginning of Period
|
$
|
36,878
|
|
$
|
40,909
|
|
$
|
36,327
|
|
$
|
40,926
|
|
|||
|
Inflows, including Fee-paying Commitments (1)
|
41
|
|
325
|
|
527
|
|
592
|
|
|||||||
|
Outflows, including Distributions (2)
|
(1,046
|
)
|
(2,238
|
)
|
(1,132
|
)
|
(2,965
|
)
|
|||||||
|
Market Appreciation/(Depreciation) (3)
|
4
|
|
(13
|
)
|
(9
|
)
|
(13
|
)
|
|||||||
|
Foreign Exchange and other (4)
|
339
|
|
(45
|
)
|
503
|
|
398
|
|
|||||||
|
Balance, End of Period
|
$
|
36,216
|
|
$
|
38,938
|
|
$
|
36,216
|
|
$
|
38,938
|
|
|||
|
(1)
|
Inflows represent limited partner capital raised and capital invested by carry funds outside the original investment period.
|
|
(2)
|
Outflows represent distributions from funds outside the investment period and changes in fee basis for our carry funds where the original investment period has expired.
|
|
(3)
|
Market Appreciation/(Depreciation) represents realized and unrealized gains (losses) on portfolio investments in our carry funds based on the lower of cost or fair value.
|
|
(4)
|
Represents the impact of foreign exchange rate fluctuations on the translation of our non-U.S. dollar denominated funds. Activity during the period is translated at the average rate for the period. Ending balances are translated at the spot rate as of period end.
|
Fee-earning AUM was
$36.2 billion
at
June 30, 2017
, a decrease of
$0.7 billion
, or approximately
2%
, compared to
$36.9 billion
at
March 31, 2017
. The decrease was driven by outflows of
$1.0 billion
primarily due to dispositions in CP V. This decrease was partially offset by foreign exchange gains of
$0.3 billion
primarily due to the translation of Fee-earning AUM in our Europe buyout and growth funds from EUR to USD. Investment and distribution activity by funds still in the investment period does not impact Fee-earning AUM as these funds are based on commitments.
Fee-earning AUM was
$36.2 billion
at
June 30, 2017
, a decrease of
$0.1 billion
compared to
$36.3 billion
at
December 31, 2016
. The decrease was driven by outflows of
$1.1 billion
primarily due to dispositions in CP V. This was largely offset by inflows of
$0.5 billion
primarily related to new investments made by CGP and new commitments to CAGP V, and foreign exchange gains of
$0.5 billion
primarily due to the translation of Fee-earning AUM in our Europe buyout and growth funds from EUR to USD.
Fee-earning AUM was
$36.2 billion
at
June 30, 2017
, a decrease of
$2.7 billion
, or approximately
7%
, compared to
$38.9 billion
at
June 30, 2016
. Driving the decrease were outflows of
$3.6 billion
primarily driven by dispositions in our US, Europe, and Asia buyout funds, as well as other funds outside of their original investment period. Partially offsetting the decrease were inflows of
$1.1 billion
primarily attributable to new limited partner capital invested by CGP, in addition to new fee-paying commitments raised by CAGP V.
Fee-earning AUM was $38.9 billion at June 30, 2016, a decrease of $2.0 billion, or approximately 5%, compared to $40.9 billion at March 31, 2016. The decrease was driven by outflows of $2.2 billion from distributions in CP V and several other funds outside of the original investment period, partially offset by $0.3 billion of inflows primarily attributable to equity invested by CGP.
Fee-earning AUM was $38.9 billion at June 30, 2016, a decrease of $2.0 billion, or approximately 5%, compared to $40.9 billion at December 31, 2015. The decrease was driven by outflows of $3.0 billion from distributions in CP V and several other funds outside of the original investment period, partially offset by $0.6 billion of inflows primarily attributable to equity invested by funds outside of the original investment period and $0.4 billion of foreign exchange gain primarily from our Europe and Japan buyout funds.
105
Total AUM as of and for the
Three and Six
Months Ended
June 30, 2017
The table below provides the period to period rollforwards of Available Capital and Fair Value of Capital, and the resulting rollforward of Total AUM.
|
|
Three Months Ended June 30, 2017
|
Six Months Ended June 30, 2017
|
|||||||||||||||||||||
|
|
Available
Capital |
Fair Value
of Capital |
Total
AUM |
Available
Capital |
Fair Value
of Capital |
Total
AUM |
|||||||||||||||||
|
|
(Dollars in millions)
|
(Dollars in millions)
|
|||||||||||||||||||||
|
Corporate Private Equity
|
|||||||||||||||||||||||
|
Balance, Beginning of Period
|
$
|
16,100
|
|
$
|
36,870
|
|
$
|
52,970
|
|
$
|
17,499
|
|
$
|
33,365
|
|
$
|
50,864
|
|
|||||
|
Commitments (1)
|
344
|
|
—
|
|
344
|
|
511
|
|
—
|
|
511
|
|
|||||||||||
|
Capital Called, net (2)
|
(1,001
|
)
|
960
|
|
(41
|
)
|
(2,864
|
)
|
2,817
|
|
(47
|
)
|
|||||||||||
|
Distributions (3)
|
355
|
|
(2,711
|
)
|
(2,356
|
)
|
577
|
|
(3,830
|
)
|
(3,253
|
)
|
|||||||||||
|
Market Appreciation/(Depreciation) (4)
|
—
|
|
2,937
|
|
2,937
|
|
—
|
|
5,548
|
|
5,548
|
|
|||||||||||
|
Foreign Exchange and other (5)
|
197
|
|
272
|
|
469
|
|
272
|
|
428
|
|
700
|
|
|||||||||||
|
Balance, End of Period
|
$
|
15,995
|
|
$
|
38,328
|
|
$
|
54,323
|
|
$
|
15,995
|
|
$
|
38,328
|
|
$
|
54,323
|
|
|||||
|
(1)
|
Represents capital raised by our carry funds, net of expired available capital.
|
|
(2)
|
Represents capital called by our carry funds, net of fund fees and expenses. Equity invested amounts may vary from capital called due to timing differences between acquisition and capital call dates.
|
|
(3)
|
Represents distributions from our carry funds, net of amounts recycled. Distributions are based on when proceeds are actually distributed to investors, which may differ from when they are realized.
|
|
(4)
|
Market Appreciation/(Depreciation) represents realized and unrealized gains (losses) on portfolio investments.
|
|
(5)
|
Represents the impact of foreign exchange rate fluctuations on the translation of our non-U.S. dollar denominated funds. Activity during the period is translated at the average rate for the period. Ending balances are translated at the spot rate as of the period end.
|
Total AUM was
$54.3 billion
at
June 30, 2017
, an increase of
$1.3 billion
, or approximately
2%
, compared to
$53.0 billion
as of
March 31, 2017
. This increase was driven by
$2.9 billion
of market appreciation due to a
16%
increase in our public portfolio of carry funds and a
7%
increase in our private portfolio of carry funds for the period, resulting in overall segment appreciation of
8%
for the period. The carry funds driving appreciation for the period included
$0.9 billion
attributable to
CP VI
,
$0.5 billion
attributable to
CAP IV
, and
$0.4 billion
attributable to
CP V
. Also driving the increase were
$0.5 billion
of foreign exchange gains primarily due to the translation of AUM in our Europe buyout and growth funds from EUR to USD and
$0.3 billion
of new commitments raised in CGFSP III and CAGP V. The increase was partially offset by distributions of
$2.7 billion
, of which
$0.4 billion
were recallable, primarily in our US, Asia, and Europe buyout funds.
Total AUM was
$54.3 billion
at
June 30, 2017
, an increase of
$3.4 billion
, or approximately
7%
, compared to
$50.9 billion
as of
December 31, 2016
. This increase was driven by
$5.5 billion
of market appreciation due to a
28%
increase in our public portfolio of carry funds and a
17%
increase in our private portfolio of carry funds for the period, resulting in overall segment appreciation of
18%
for the period. The carry funds driving appreciation for the period included
$1.4 billion
attributable to
CP VI
,
$1.3 billion
attributable to
CP V
and
$1.0 billion
attributable to
CAP IV
. Also driving the increase were
$0.7 billion
of foreign exchange gains due to the translation of AUM in our Europe buyout and growth funds from EUR to USD and
$0.5 billion
of new commitments raised primarily in CGFSP III and CAGP V. The increase was partially offset by distributions of
$3.8 billion
, of which
$0.6 billion
were recallable, primarily in our US, Asia, and Europe buyout funds.
Fund Performance Metrics
Fund performance information for our investment funds that generally have at least $1.0 billion in capital commitments, cumulative equity invested or total value as of
June 30, 2017
, which we refer to as our “significant funds” is included throughout this discussion and analysis to facilitate an understanding of our results of operations for the periods presented. The fund return information reflected in this discussion and analysis is not indicative of the performance of The Carlyle Group L.P. and is also not necessarily indicative of the future performance of any particular fund. An investment in The Carlyle Group L.P. is not an investment in any of our funds. There can be no assurance that any of our funds or our other existing and future funds will achieve similar returns.
106
The following tables reflect the performance of our significant funds in our Corporate Private Equity business. Please see “— Our Family of Funds” for a legend of the fund acronyms listed below.
|
|
|
|
TOTAL INVESTMENTS
|
REALIZED/PARTIALLY REALIZED INVESTMENTS(5)
|
||||||||||||||||||||||||||||||
|
|
|
|
As of June 30, 2017
|
As of June 30, 2017
|
||||||||||||||||||||||||||||||
|
|
Fund
Inception Date(1) |
Committed
Capital |
Cumulative
Invested Capital(2) |
Total Fair
Value(3) |
MOIC(4)
|
Gross
IRR
(7)(12)
|
Net
IRR
(8)(12)
|
Cumulative
Invested Capital(2) |
Total Fair
Value(3) |
MOIC
(4)
|
Gross
IRR(7) |
|||||||||||||||||||||||
|
Corporate Private Equity
|
(Reported in Local Currency, in Millions)
|
(Reported in Local Currency, in
Millions)
|
||||||||||||||||||||||||||||||||
|
Fully Invested Funds(6)
|
||||||||||||||||||||||||||||||||||
|
CP II
|
10/1994
|
$
|
1,331.1
|
|
$
|
1,362.4
|
|
$
|
4,072.2
|
|
3.0x
|
34
|
%
|
25
|
%
|
$
|
1,362.4
|
|
$
|
4,072.2
|
|
3.0x
|
34
|
%
|
||||||||||
|
CP III
|
2/2000
|
$
|
3,912.7
|
|
$
|
4,031.6
|
|
$
|
10,146.9
|
|
2.5x
|
27
|
%
|
21
|
%
|
$
|
4,031.6
|
|
$
|
10,146.9
|
|
2.5x
|
27
|
%
|
||||||||||
|
CP IV
|
12/2004
|
$
|
7,850.0
|
|
$
|
7,612.6
|
|
$
|
18,009.9
|
|
2.4x
|
16
|
%
|
13
|
%
|
$
|
7,612.6
|
|
$
|
18,009.9
|
|
2.4x
|
16
|
%
|
||||||||||
|
CP V
|
5/2007
|
$
|
13,719.7
|
|
$
|
13,190.9
|
|
$
|
27,046.4
|
|
2.1x
|
18
|
%
|
14
|
%
|
$
|
8,190.5
|
|
$
|
22,585.2
|
|
2.8x
|
27
|
%
|
||||||||||
|
CEP I
|
12/1997
|
€
|
1,003.6
|
|
€
|
981.6
|
|
€
|
2,126.5
|
|
2.2x
|
18
|
%
|
11
|
%
|
€
|
981.6
|
|
€
|
2,126.5
|
|
2.2x
|
18
|
%
|
||||||||||
|
CEP II
|
9/2003
|
€
|
1,805.4
|
|
€
|
2,048.4
|
|
€
|
4,120.3
|
|
2.0x
|
36
|
%
|
20
|
%
|
€
|
1,883.8
|
|
€
|
4,105.9
|
|
2.2x
|
43
|
%
|
||||||||||
|
CEP III
|
12/2006
|
€
|
5,294.9
|
|
€
|
5,116.1
|
|
€
|
11,323.2
|
|
2.2x
|
19
|
%
|
14
|
%
|
€
|
3,969.9
|
|
€
|
9,851.4
|
|
2.5x
|
21
|
%
|
||||||||||
|
CAP I
|
12/1998
|
$
|
750.0
|
|
$
|
627.7
|
|
$
|
2,521.8
|
|
4.0x
|
25
|
%
|
18
|
%
|
$
|
627.7
|
|
$
|
2,521.8
|
|
4.0x
|
25
|
%
|
||||||||||
|
CAP II
|
2/2006
|
$
|
1,810.0
|
|
$
|
1,628.2
|
|
$
|
2,976.0
|
|
1.8x
|
11
|
%
|
8
|
%
|
$
|
1,452.4
|
|
$
|
2,829.7
|
|
1.9x
|
12
|
%
|
||||||||||
|
CAP III
|
5/2008
|
$
|
2,551.6
|
|
$
|
2,543.2
|
|
$
|
4,663.9
|
|
1.8x
|
18
|
%
|
12
|
%
|
$
|
2,071.8
|
|
$
|
4,232.6
|
|
2.0x
|
20
|
%
|
||||||||||
|
CJP I
|
10/2001
|
¥
|
50,000.0
|
|
¥
|
47,291.4
|
|
¥
|
138,902.1
|
|
2.9x
|
61
|
%
|
37
|
%
|
¥
|
47,291.4
|
|
¥
|
138,902.1
|
|
2.9x
|
61
|
%
|
||||||||||
|
CJP II
|
7/2006
|
¥
|
165,600.0
|
|
¥
|
141,866.7
|
|
¥
|
211,860.5
|
|
1.5x
|
7
|
%
|
4
|
%
|
¥
|
70,933.1
|
|
¥
|
130,219.6
|
|
1.8x
|
12
|
%
|
||||||||||
|
CGFSP I
|
9/2008
|
$
|
1,100.2
|
|
$
|
1,080.7
|
|
$
|
2,364.5
|
|
2.2x
|
20
|
%
|
14
|
%
|
$
|
807.5
|
|
$
|
1,696.6
|
|
2.1x
|
19
|
%
|
||||||||||
|
CEOF I
|
5/2011
|
$
|
1,119.1
|
|
$
|
1,150.6
|
|
$
|
1,547.9
|
|
1.3x
|
13
|
%
|
8
|
%
|
$
|
221.0
|
|
$
|
600.9
|
|
2.7x
|
47
|
%
|
||||||||||
|
CETP II
|
2/2007
|
€
|
521.6
|
|
€
|
436.4
|
|
€
|
1,218.8
|
|
2.8x
|
27
|
%
|
18
|
%
|
€
|
246.2
|
|
€
|
988.0
|
|
4.0x
|
35
|
%
|
||||||||||
|
CAGP IV
|
6/2008
|
$
|
1,041.4
|
|
$
|
954.1
|
|
$
|
1,415.3
|
|
1.5x
|
11
|
%
|
6
|
%
|
$
|
414.0
|
|
$
|
738.5
|
|
1.8x
|
15
|
%
|
||||||||||
|
All Other Funds (9)
|
Various
|
$
|
4,608.7
|
|
$
|
7,060.5
|
|
1.5x
|
16
|
%
|
7
|
%
|
$
|
3,409.2
|
|
$
|
5,776.3
|
|
1.7x
|
18
|
%
|
|||||||||||||
|
Coinvestments and
Other (10)
|
Various
|
$
|
9,915.8
|
|
$
|
23,414.0
|
|
2.4x
|
36
|
%
|
33
|
%
|
$
|
6,420.6
|
|
$
|
19,535.3
|
|
3.0x
|
36
|
%
|
|||||||||||||
|
Total Fully Invested Funds
|
$
|
60,185.2
|
|
$
|
129,804.8
|
|
2.2x
|
26
|
%
|
19
|
%
|
$
|
45,755.8
|
|
$
|
114,625.2
|
|
2.5x
|
28
|
%
|
||||||||||||||
|
Funds in the Investment Period (6)
|
||||||||||||||||||||||||||||||||||
|
CP VI
|
5/2012
|
$
|
13,000.0
|
|
$
|
9,348.9
|
|
$
|
12,432.5
|
|
1.3x
|
19%
|
|
11%
|
|
|||||||||||||||||||
|
CEP IV
|
8/2013
|
€
|
3,669.5
|
|
€
|
2,427.1
|
|
€
|
2,746.6
|
|
1.1x
|
NM
|
|
NM
|
|
|||||||||||||||||||
|
CAP IV
|
11/2012
|
$
|
3,880.4
|
|
$
|
2,320.0
|
|
$
|
3,844.4
|
|
1.7x
|
NM
|
|
NM
|
|
|||||||||||||||||||
|
CGP
|
12/2014
|
$
|
3,588.0
|
|
$
|
1,520.6
|
|
$
|
1,587.9
|
|
1.0x
|
NM
|
|
NM
|
|
|||||||||||||||||||
|
CGFSP II
|
4/2013
|
$
|
1,000.0
|
|
$
|
768.2
|
|
$
|
1,042.9
|
|
1.4x
|
21
|
%
|
11%
|
|
|||||||||||||||||||
|
CJP III
|
8/2013
|
¥
|
119,505.1
|
|
¥
|
60,094.5
|
|
¥
|
92,717.9
|
|
1.5x
|
NM
|
|
NM
|
|
|||||||||||||||||||
|
CEOF II
|
3/2015
|
$
|
2,400.0
|
|
$
|
562.8
|
|
$
|
695.0
|
|
1.2x
|
NM
|
|
NM
|
|
|||||||||||||||||||
|
All Other Funds (11)
|
Various
|
$
|
1,106.7
|
|
$
|
1,295.2
|
|
1.2x
|
NM
|
|
NM
|
|
||||||||||||||||||||||
|
Total Funds in the Investment Period
|
$
|
18,932.3
|
|
$
|
24,857.8
|
|
1.3x
|
19
|
%
|
10
|
%
|
$
|
1,122.7
|
|
$
|
2,824.7
|
|
2.5x
|
64
|
%
|
||||||||||||||
|
TOTAL CORPORATE PRIVATE EQUITY (13)
|
$
|
79,117.6
|
|
$
|
154,662.6
|
|
2.0x
|
26
|
%
|
18
|
%
|
$
|
46,878.5
|
|
$
|
117,449.9
|
|
2.5x
|
28
|
%
|
||||||||||||||
|
(1)
|
The data presented herein that provides “inception to date” performance results of our segments relates to the period following the formation of the first fund within each segment. For our Corporate Private Equity segment our first fund was formed in 1990.
|
|
(2)
|
Represents the original cost of investments since inception of the fund.
|
|
(3)
|
Represents all realized proceeds combined with remaining fair value, before management fees, expenses and carried interest.
|
|
(4)
|
Multiple of invested capital (“MOIC”) represents total fair value, before management fees, expenses and carried interest, divided by cumulative invested capital.
|
|
(5)
|
An investment is considered realized when the investment fund has completely exited, and ceases to own an interest in, the investment. An investment is considered partially realized when the total amount of proceeds received in respect of such investment, including dividends, interest or other distributions and/or return of capital, represents at least 85% of invested capital and such investment is not yet fully realized. Because part of our value creation strategy involves pursuing best exit alternatives, we believe information regarding Realized/Partially Realized MOIC and Gross IRR, when considered together
|
107
with the other investment performance metrics presented, provides investors with meaningful information regarding our investment performance by removing the impact of investments where significant realization activity has not yet occurred. Realized/Partially Realized MOIC and Gross IRR have limitations as measures of investment performance, and should not be considered in isolation. Such limitations include the fact that these measures do not include the performance of earlier stage and other investments that do not satisfy the criteria provided above. The exclusion of such investments will have a positive impact on Realized/Partially Realized MOIC and Gross IRR in instances when the MOIC and Gross IRR in respect of such investments are less than the aggregate MOIC and Gross IRR. Our measurements of Realized/Partially Realized MOIC and Gross IRR may not be comparable to those of other companies that use similarly titled measures. We do not present Realized/Partially Realized performance information separately for funds that are still in the investment period because of the relatively insignificant level of realizations for funds of this type. However, to the extent such funds have had realizations, they are included in the Realized/Partially Realized performance information presented for
Total Corporate Private Equity.
|
(6)
|
Fully Invested funds are past the expiration date of the investment period as defined in the respective limited partnership agreement. In instances where a successor fund has had its first capital call, the predecessor fund is categorized as fully invested.
|
|
(7)
|
Gross Internal Rate of Return (“Gross IRR”) represents the annualized IRR for the period indicated on Limited Partner invested capital based on contributions, distributions and unrealized value before management fees, expenses and carried interest.
|
|
(8)
|
Net Internal Rate of Return (“Net IRR”) represents the annualized IRR for the period indicated on Limited Partner invested capital based on contributions, distributions and unrealized value after management fees, expenses and carried interest.
|
|
(9)
|
Aggregate includes the following funds: CP I, CMG, CVP I, CVP II, CUSGF III, CEVP, CETP I, CAVP I, CAVP II, CAGP III, CSABF, Mexico, CBPF, and MENA.
|
|
(10)
|
Includes coinvestments and certain other stand-alone investments arranged by us.
|
|
(11)
|
Aggregate, which is considered not meaningful, includes the following funds and their respective commencement dates: CSSAF (April 2012) , CPF I (June 2012), CCI (December 2012), CETP III (May 2014), and CAGP V (May 2016).
|
|
(12)
|
For funds marked “NM,” IRR may be positive or negative, but is not considered meaningful because of the limited time since initial investment and early stage of capital deployment. For funds marked “Neg,” IRR is negative as of reporting period end.
|
|
(13)
|
For purposes of aggregation, funds that report in foreign currency have been converted to U.S. dollars at the reporting period spot rate.
|
|
Remaining
Fair Value(1) |
Unrealized
MOIC(2) |
Total
MOIC(3) |
%
Invested(4) |
In Accrued
Carry/ (Clawback) (5) |
LTM
Realized Carry (6) |
Catch-up
Rate |
Fee
Initiation Date(7) |
Quarters
Since Fee Initiation |
Original
Investment Period End Date |
||||||||||||||
|
|
As of June 30, 2017
|
||||||||||||||||||||||
|
Corporate Private Equity
|
(Reported in Local Currency, in Millions)
|
||||||||||||||||||||||
|
CP VI
|
$
|
9,738.9
|
|
1.2x
|
1.3x
|
72
|
%
|
X
|
|
100
|
%
|
Jun-13
|
17
|
May-18
|
|||||||||
|
CP V
|
$
|
5,251.4
|
|
0.8x
|
2.1x
|
96
|
%
|
X
|
X
|
100
|
%
|
Jun-07
|
41
|
May-13
|
|||||||||
|
CAP IV
|
$
|
3,429.2
|
|
1.7x
|
1.7x
|
60
|
%
|
X
|
|
100
|
%
|
Jul-13
|
16
|
Nov-18
|
|||||||||
|
CEP IV
|
€
|
1,803.0
|
|
1.1x
|
1.1x
|
66
|
%
|
|
|
100
|
%
|
Sep-14
|
12
|
Aug-19
|
|||||||||
|
CEP III
|
€
|
1,412.8
|
|
1.5x
|
2.2x
|
97
|
%
|
X
|
X
|
100
|
%
|
Jul-07
|
40
|
Dec-12
|
|||||||||
|
CGP
|
$
|
1,590.0
|
|
1.0x
|
1.0x
|
42
|
%
|
|
|
100
|
%
|
Jan-15
|
10
|
Dec-20
|
|||||||||
|
CAP III
|
$
|
1,557.3
|
|
1.9x
|
1.8x
|
100
|
%
|
X
|
X
|
100
|
%
|
Jun-08
|
37
|
May-14
|
|||||||||
|
CEOF I
|
$
|
1,007.7
|
|
1.1x
|
1.3x
|
103
|
%
|
X
|
|
80
|
%
|
Sep-11
|
24
|
May-17
|
|||||||||
|
CGFSP II
|
$
|
903.9
|
|
1.4x
|
1.4x
|
77
|
%
|
X
|
|
100
|
%
|
Jun-13
|
17
|
Dec-17
|
|||||||||
|
CJP III
|
¥
|
85,013.5
|
|
1.5x
|
1.5x
|
50
|
%
|
X
|
|
100
|
%
|
Sep-13
|
16
|
Feb-20
|
|||||||||
|
CGFSP I
|
$
|
688.0
|
|
1.9x
|
2.2x
|
98
|
%
|
X
|
X
|
100
|
%
|
Oct-08
|
35
|
Sep-14
|
|||||||||
|
CAGP IV
|
$
|
671.2
|
|
1.2x
|
1.5x
|
92
|
%
|
|
|
100
|
%
|
Aug-08
|
36
|
Jun-14
|
|||||||||
|
CEOF II
|
$
|
604.8
|
|
1.2x
|
1.2x
|
23
|
%
|
|
|
80
|
%
|
Nov-15
|
7
|
Mar-21
|
|||||||||
|
CJP II
|
¥
|
60,222.0
|
|
1.1x
|
1.5x
|
86
|
%
|
|
|
80
|
%
|
Oct-06
|
43
|
Jul-12
|
|||||||||
|
CP IV
|
$
|
267.7
|
|
2.7x
|
2.4x
|
97
|
%
|
X
|
X
|
80
|
%
|
Apr-05
|
49
|
Dec-10
|
|||||||||
|
CETP II
|
€
|
231.2
|
|
1.4x
|
2.8x
|
84
|
%
|
X
|
X
|
100
|
%
|
Jan-08
|
38
|
Jul-13
|
|||||||||
|
CAP II
|
$
|
223.7
|
|
1.2x
|
1.8x
|
90
|
%
|
|
|
80
|
%
|
Mar-06
|
46
|
Feb-12
|
|||||||||
|
All Other Funds (8)
|
$
|
2,563.4
|
|
1.0x
|
2.1x
|
NM
|
NM
|
||||||||||||||||
|
Coinvestment and Other (9)
|
$
|
4,600.3
|
|
1.3x
|
2.4x
|
NM
|
NM
|
||||||||||||||||
|
Total Corporate Private Equity (12)
|
$
|
38,324.4
|
|
1.2x
|
2.0x
|
|
|
||||||||||||||||
|
(1)
|
Net asset value of our carry funds. Reflects significant funds with remaining fair value of greater than $100 million.
|
108
|
(2)
|
Unrealized multiple of invested capital (“MOIC”) represents remaining fair market value, before management fees, expenses and carried interest, divided by remaining investment cost.
|
|
(3)
|
Total MOIC represents total fair value (realized proceeds combined with remaining fair value), before management fees, expenses and carried interest, divided by cumulative invested capital. For certain funds, represents the original cost of investments net of investment-level recallable proceeds, which is adjusted to reflect recyclability of invested capital for the purpose of calculating the fund MOIC.
|
|
(4)
|
Represents cumulative equity invested as of the reporting period divided by total commitments. Amount can be greater than 100% due to the re-investment of recallable distributions to fund investors.
|
|
(5)
|
Fund has a net accrued performance fee balance/(giveback obligation) as of the current quarter end, driven by a significant portion of the fund’s asset base.
|
|
(6)
|
Fund has generated realized net performance fees/(realized giveback) in the last twelve months.
|
|
(7)
|
Represents the date of the first capital contribution for management fees.
|
|
(8)
|
Aggregate includes the following funds: CMG, CP I, CP II, CP III, CEP I, CEP II, CAP I, CBPF, CJP I, CEVP, CETP I, CETP III, CCI, CAVP I, CAVP II, CAGP III, CAGP V, Mexico, MENA, CSABF, CSSAF, CPF, CVP I, CVP II, and CUSGF III. In Accrued Carry/(Clawback) and LTM Realized Carry not indicated because the indicator does not apply to each fund within the aggregate.
|
|
(9)
|
Includes co-investments, prefund investments and certain other stand-alone investments arranged by us. In Accrued Carry/(Clawback) and LTM Realized Carry not indicated because the indicator does not apply to each fund within the aggregate.
|
|
(10)
|
For purposes of aggregation, funds that report in foreign currency have been converted to U.S. dollars at the reporting period spot rate.
|
109
Real Assets
For purposes of presenting results of operations for this segment, our earnings from our investments in NGP are presented in the respective operating captions, and the net income or loss from the consolidation of Urbplan allocable to the Partnership (after consideration of amounts allocable to non-controlling interests) is presented within investment income. The following table presents our results of operations for our Real Assets segment:
|
|
Three Months Ended June 30,
|
Six Months Ended June 30,
|
|||||||||||||
|
|
2017
|
2016
|
2017
|
2016
|
|||||||||||
|
|
(Dollars in millions)
|
||||||||||||||
|
Segment Revenues
|
|||||||||||||||
|
Fund level fee revenues
|
|||||||||||||||
|
Fund management fees
|
$
|
58.2
|
|
$
|
66.5
|
|
$
|
114.2
|
|
$
|
131.7
|
|
|||
|
Portfolio advisory fees, net
|
0.1
|
|
0.1
|
|
0.2
|
|
0.1
|
|
|||||||
|
Transaction fees, net
|
—
|
|
—
|
|
—
|
|
—
|
|
|||||||
|
Total fund level fee revenues
|
58.3
|
|
66.6
|
|
114.4
|
|
131.8
|
|
|||||||
|
Performance fees
|
|||||||||||||||
|
Realized
|
39.7
|
|
58.8
|
|
53.2
|
|
60.6
|
|
|||||||
|
Unrealized
|
60.6
|
|
66.1
|
|
139.3
|
|
163.8
|
|
|||||||
|
Total performance fees
|
100.3
|
|
124.9
|
|
192.5
|
|
224.4
|
|
|||||||
|
Investment income (loss)
|
|||||||||||||||
|
Realized
|
0.3
|
|
(9.5
|
)
|
(7.8
|
)
|
(7.3
|
)
|
|||||||
|
Unrealized
|
6.8
|
|
6.7
|
|
12.0
|
|
2.0
|
|
|||||||
|
Total investment income (loss)
|
7.1
|
|
(2.8
|
)
|
4.2
|
|
(5.3
|
)
|
|||||||
|
Interest
|
0.4
|
|
0.4
|
|
1.0
|
|
0.9
|
|
|||||||
|
Other income
|
0.3
|
|
0.2
|
|
0.7
|
|
0.6
|
|
|||||||
|
Total revenues
|
166.4
|
|
189.3
|
|
312.8
|
|
352.4
|
|
|||||||
|
Segment Expenses
|
|||||||||||||||
|
Compensation and benefits
|
|||||||||||||||
|
Direct base compensation
|
17.4
|
|
18.0
|
|
37.1
|
|
38.2
|
|
|||||||
|
Indirect base compensation
|
19.9
|
|
10.1
|
|
30.8
|
|
19.3
|
|
|||||||
|
Equity-based compensation
|
9.3
|
|
7.0
|
|
18.1
|
|
13.2
|
|
|||||||
|
Performance fee related
|
|||||||||||||||
|
Realized
|
17.4
|
|
25.3
|
|
24.2
|
|
26.1
|
|
|||||||
|
Unrealized
|
19.2
|
|
26.1
|
|
38.5
|
|
70.9
|
|
|||||||
|
Total compensation and benefits
|
83.2
|
|
86.5
|
|
148.7
|
|
167.7
|
|
|||||||
|
General, administrative, and other indirect expenses
|
26.5
|
|
18.6
|
|
42.1
|
|
33.5
|
|
|||||||
|
Depreciation and amortization expense
|
1.6
|
|
1.5
|
|
3.4
|
|
3.0
|
|
|||||||
|
Interest expense
|
4.4
|
|
4.0
|
|
8.5
|
|
8.0
|
|
|||||||
|
Total expenses
|
115.7
|
|
110.6
|
|
202.7
|
|
212.2
|
|
|||||||
|
Economic Net Income
|
$
|
50.7
|
|
$
|
78.7
|
|
$
|
110.1
|
|
$
|
140.2
|
|
|||
|
(-) Net Performance Fees
|
63.7
|
|
73.5
|
|
129.8
|
|
127.4
|
|
|||||||
|
(-) Investment Income (Loss)
|
7.1
|
|
(2.8
|
)
|
4.2
|
|
(5.3
|
)
|
|||||||
|
(+) Equity-based Compensation
|
9.3
|
|
7.0
|
|
18.1
|
|
13.2
|
|
|||||||
|
(=) Fee Related Earnings
|
$
|
(10.8
|
)
|
$
|
15.0
|
|
$
|
(5.8
|
)
|
$
|
31.3
|
|
|||
|
(+) Realized Net Performance Fees
|
22.3
|
|
33.5
|
|
29.0
|
|
34.5
|
|
|||||||
|
(+) Realized Investment Income (Loss)
|
0.3
|
|
(9.5
|
)
|
(7.8
|
)
|
(7.3
|
)
|
|||||||
|
(=) Distributable Earnings
|
$
|
11.8
|
|
$
|
39.0
|
|
$
|
15.4
|
|
$
|
58.5
|
|
|||
110
Three Months Ended June 30, 2017
Compared to the
Three Months Ended June 30, 2016
and
Six Months Ended June 30, 2017
Compared to the
Six Months Ended June 30, 2016
Distributable Earnings
Distributable earnings
decreased
$27.2 million
for the
three months ended June 30, 2017
as compared to the
three months ended June 30, 2016
and
decreased
$43.1 million
for the
six months ended June 30, 2017
as compared to the
six months ended June 30, 2016
. The following table provides the components of the changes in distributable earnings for the
three months and six months ended June 30, 2017
:
|
Three Months Ended
June 30, |
Six Months Ended
June 30, |
|||||
|
(Dollars in Millions)
|
||||||
|
Distributable earnings, June 30, 2016
|
$
|
39.0
|
|
$
|
58.5
|
|
|
Increases (decreases):
|
||||||
|
Decrease in realized net performance fees
|
(11.2
|
)
|
(5.5
|
)
|
||
|
Decrease (increase) in realized investment loss
|
9.8
|
|
(0.5
|
)
|
||
|
Decrease in fee related earnings
|
(25.8
|
)
|
(37.1
|
)
|
||
|
Total decrease
|
(27.2
|
)
|
(43.1
|
)
|
||
|
Distributable earnings, June 30, 2017
|
$
|
11.8
|
|
$
|
15.4
|
|
Realized Net Performance Fees.
Realized net performance fees
decreased
$11.2 million
for the
three months ended June 30, 2017
as compared to the
three months ended June 30, 2016
and
decreased
$5.5 million
for the
six months ended June 30, 2017
as compared to the
six months ended June 30, 2016
. The
decrease
in realized net performance fees for both the
three months ended June 30, 2017
as compared to the
three months ended June 30, 2016
and the
six months ended June 30, 2017
as compared to the
six months ended June 30, 2016
was primarily due to lower realizations in certain of our U.S and Europe real estate funds in 2017 as compared to 2016, partially offset by higher realizations in our U.S real estate fund VI in 2017 as compared to 2016. Realized net performance fees were primarily generated by the following funds for the
three months and six months ended June 30, 2017
and
2016
:
|
Three Months Ended
June 30, |
Six Months Ended
June 30, |
|||
|
2017
|
2016
|
2017
|
2016
|
|
|
CRP VI
|
CEREP III
|
CRP VI
|
CEREP III
|
|
|
CPOCP
|
CRP III
|
CPOCP
|
CRP III
|
|
|
CRP VI
|
CRP VI
|
|||
Realized Investment Income (Loss).
Realized investment income for the
three months ended June 30, 2017
was
$0.3 million
as compared to realized investment loss of
$9.5 million
for the
three months ended June 30, 2016
, a decrease of realized investment loss of
$9.8 million
. The decrease in realized investment loss for the
three months ended June 30, 2017
as compared to the
three months ended June 30, 2016
primarily related to lower realized investment losses of $9.7 million recorded in the
three months ended June 30, 2017
associated with Urbplan (see Note 16 to the unaudited condensed consolidated financial statements) and higher realized gains on investments in the NGP funds. These decreases in realized investment loss were partially offset by lower realized gains on investments in our U.S. real estate funds.
Realized investment loss for the
six months ended June 30, 2017
was
$7.8 million
as compared to realized investment loss of
$7.3 million
for the
six months ended June 30, 2016
, an increase of realized investment loss of
$0.5 million
. The increase in realized investment loss for the
six months ended June 30, 2017
as compared to the
six months ended June 30, 2016
primarily related to lower realized gains on investments in our U.S. real estate funds. This increase in realized loss was partially offset by lower realized investment losses of $1.4 million recorded in the
six months ended June 30, 2017
associated with Urbplan (see Note 16 to the unaudited condensed consolidated financial statements) and higher realized gains on investments in the NGP funds.
111
Fee Related Earnings
Fee related earnings
decreased
$25.8 million
for the
three months ended June 30, 2017
as compared to the
three months ended June 30, 2016
and
decreased
$37.1 million
for the
six months ended June 30, 2017
as compared to the
six months ended June 30, 2016
. The following table provides the components of the changes in fee related earnings for the
three months and six months ended June 30, 2017
:
|
Three Months Ended
June 30, |
Six Months Ended
June 30, |
|||||
|
(Dollars in Millions)
|
||||||
|
Fee related earnings, June 30, 2016
|
$
|
15.0
|
|
$
|
31.3
|
|
|
Increases (decreases):
|
||||||
|
Decrease in fee revenues
|
(8.3
|
)
|
(17.4
|
)
|
||
|
Increase in direct and indirect base compensation
|
(9.2
|
)
|
(10.4
|
)
|
||
|
Increase in general, administrative and other indirect expenses
|
(7.9
|
)
|
(8.6
|
)
|
||
|
Increase in interest expense
|
(0.4
|
)
|
(0.5
|
)
|
||
|
All other changes
|
—
|
|
(0.2
|
)
|
||
|
Total decrease
|
(25.8
|
)
|
(37.1
|
)
|
||
|
Fee related earnings, June 30, 2017
|
$
|
(10.8
|
)
|
$
|
(5.8
|
)
|
Fee Revenues.
Fee revenues
decreased
$8.3 million
for the
three months ended June 30, 2017
as compared to the
three months ended June 30, 2016
and
decreased
$17.4 million
for the
six months ended June 30, 2017
as compared to the
six months ended June 30, 2016
, due to the following:
|
Three Months Ended
June 30, |
Six Months Ended
June 30, |
|||||
|
2017 v. 2016
|
||||||
|
(Dollars in Millions)
|
||||||
|
Lower fund management fees
|
$
|
(8.3
|
)
|
$
|
(17.5
|
)
|
|
Higher portfolio advisory fees
|
—
|
|
0.1
|
|
||
|
Total decrease in fee revenues
|
$
|
(8.3
|
)
|
$
|
(17.4
|
)
|
The
decrease
in fund management fees for the
three months ended June 30, 2017
as compared to the
three months ended June 30, 2016
primarily reflected a $5.1 million decrease in catch-up management fees for the
three months ended June 30, 2017
as compared to the
three months ended June 30, 2016
. While there were $0.3 million of catch-up management fees for the
three months ended June 30, 2017
, catch-up management fees of $5.4 million for the
three months ended June 30, 2016
were primarily due to subsequent closes in 2016 for our second power fund (“CPP II”). Additionally, this decrease is also due to lower assets under management from sales of investments in 2016.
The
decrease
in fund management fees for the
six months ended June 30, 2017
as compared to the
six months ended June 30, 2016
primarily reflects a $8.5 million decrease in catch-up management fees for the
six months ended June 30, 2017
as compared to the
six months ended June 30, 2016
. While there were no significant catch-up management fees for the
six months ended June 30, 2017
, catch-up management fees of $8.6 million for the
six months ended June 30, 2016
were primarily due to subsequent closes in 2016 for our second power fund (“CPP II”) and our first international energy fund (“CIEP I”). Additionally, this decrease was also due to lower assets under management from sales of investments in 2016.
The weighted average management fee rate for funds in the investment period decreased to
1.43%
at
June 30, 2017
from
1.44%
at
June 30, 2016
due to new funds being raised with lower management fee rates than our other funds in the original investment period. The total weighted average management fee was
1.24%
at
June 30, 2017
, the same as at
June 30, 2016
.
Direct and indirect base compensation expense.
Direct and indirect base compensation expense
increased
$9.2 million
for the
three months ended June 30, 2017
as compared to the
three months ended June 30, 2016
, primarily due to higher
112
compensation associated with fundraising activities of $10.2 million for the
three months ended June 30, 2017
as compared to the
three months ended June 30, 2016
, partially offset by lower bonus accruals.
Direct and indirect base compensation expense
increased
$10.4 million
for the
six months ended June 30, 2017
as compared to the
six months ended June 30, 2016
, primarily due to higher compensation associated with fundraising activities of $11.3 million for the
six months ended June 30, 2017
as compared to the
six months ended June 30, 2016
, partially offset by lower bonus accruals.
General, administrative and other indirect expenses.
General, administrative and other indirect expenses
increased
$7.9 million
for the
three months ended June 30, 2017
as compared to the
three months ended June 30, 2016
. The primary drivers of the increase were increased professional fees, foreign currency losses recorded in the
three months ended June 30, 2017
as compared to foreign currency gains recorded in the
three months ended June 30, 2016
, as well as increased external costs associated with fundraising activities of $2.0 million.
General, administrative and other indirect expenses
increased
$8.6 million
for the
six months ended June 30, 2017
as compared to the
six months ended June 30, 2016
. The primary drivers of the increase were foreign currency losses recorded in the
six months ended June 30, 2017
as compared to foreign currency gains recorded in the
six months ended June 30, 2016
, increased real estate costs, and increased external costs associated with fundraising activities of $2.2 million.
Economic Net Income
Economic net income
decreased
$28.0 million
for the
three months ended June 30, 2017
as compared to the
three months ended June 30, 2016
and
decreased
$30.1 million
for the
six months ended June 30, 2017
as compared to the
six months ended June 30, 2016
. The following table provides the components of the changes in economic net income for the
three months and six months ended June 30, 2017
:
|
Three Months Ended
June 30, |
Six Months Ended
June 30, |
|||||
|
(Dollars in Millions)
|
||||||
|
Economic net income, June 30, 2016
|
$
|
78.7
|
|
$
|
140.2
|
|
|
Increases (decreases):
|
||||||
|
(Decrease) increase in net performance fees
|
(9.8
|
)
|
2.4
|
|
||
|
Increase in investment income
|
9.9
|
|
9.5
|
|
||
|
Increase in equity-based compensation
|
(2.3
|
)
|
(4.9
|
)
|
||
|
Decrease in fee related earnings
|
(25.8
|
)
|
(37.1
|
)
|
||
|
Total decrease
|
(28.0
|
)
|
(30.1
|
)
|
||
|
Economic net income, June 30, 2017
|
$
|
50.7
|
|
$
|
110.1
|
|
Performance Fees.
Performance fees (realized and unrealized)
decreased
$24.6 million
for the
three months ended June 30, 2017
as compared to the
three months ended June 30, 2016
primarily due to lower appreciation from our real estate and natural resources funds, partially offset by performance fees generated by the NGP funds. Performance fees (realized and unrealized)
decreased
$31.9 million
for the
six months ended June 30, 2017
as compared to the
six months ended June 30, 2016
primarily due to lower appreciation from our real estate funds, partially offset by performance fees generated by the NGP funds.
113
Performance fees are from the following types of funds:
|
Performance Fees
|
|||||||||||||||
|
|
Three Months Ended June 30,
|
Six Months Ended June 30,
|
|||||||||||||
|
|
2017
|
2016
|
2017
|
2016
|
|||||||||||
|
|
(Dollars in millions)
|
||||||||||||||
|
Real Estate funds
|
$
|
77.0
|
|
$
|
116.4
|
|
$
|
131.3
|
|
$
|
216.0
|
|
|||
|
Natural Resources funds
|
23.5
|
|
8.2
|
|
60.9
|
|
8.4
|
|
|||||||
|
Legacy Energy funds
|
(0.2
|
)
|
0.3
|
|
0.3
|
|
—
|
|
|||||||
|
Total
|
$
|
100.3
|
|
$
|
124.9
|
|
$
|
192.5
|
|
$
|
224.4
|
|
|||
The
$100.3 million
of performance fees for the
three months ended June 30, 2017
was driven primarily by performance fees recognized from the following funds:
•
CRP VII of $40.4 million,
•
NGP XI of $19.5 million,
•
CRP V of $18.7 million, and
•
CRP III of $10.5 million.
The
$124.9 million
of performance fees for the
three months ended June 30, 2016
was driven primarily by performance fees recognized from the following funds:
•
CRP V of $49.5 million,
•
CRP VII of $32.0 million,
•
CRP III of $15.0 million,
•
CRP VI of $11.0 million,
•
NGP XI of $6.9 million, and
•
NGP X of $2.7 million.
The
$192.5 million
of performance fees for the
six months ended June 30, 2017
was driven primarily by performance fees recognized from the following funds:
•
CRP VII of $61.3 million,
•
NGP XI of $55.1 million,
•
CRP V of $43.6 million, and
•
CRP III of $18.3 million.
The
$224.4 million
of performance fees for the
six months ended June 30, 2016
was driven primarily by performance fees recognized from the following funds:
•
CRP V of $97.1 million,
•
CRP VII of $55.9 million,
•
CRP VI of $27.9 million,
•
CRP III of $27.8 million,
•
NGP XI of $6.9 million, and
•
NGP X of $2.7 million.
Performance fees of
$100.3 million
and
$124.9 million
are inclusive of performance fees reversed of approximately $3.3 million and $5.3 million for the
three months ended June 30, 2017
and
2016
, respectively. Performance fees of
$192.5 million
and
$224.4 million
are inclusive of performance fees reversed of approximately $9.5 million and $6.2 million for the
six months ended June 30, 2017
and
2016
, respectively.
114
The appreciation (depreciation) in remaining value of assets for this segment by type of fund are as follows:
|
Three Months Ended
June 30, |
Six Months Ended
June 30, |
||||
|
2017
|
2016
|
2017
|
2016
|
||
|
Real Estate funds
|
6%
|
8%
|
11%
|
16%
|
|
|
Natural Resources funds
|
6%
|
11%
|
15%
|
9%
|
|
|
Legacy Energy funds
|
4%
|
3%
|
7%
|
0%
|
|
|
Total
|
6%
|
7%
|
11%
|
9%
|
|
Net performance fees for the
three months ended June 30, 2017
were
$63.7 million
, representing
a decrease
of
$9.8 million
from
$73.5 million
in net performance fees for the
three months ended June 30, 2016
. The
decline
was primarily due to decreased performance fees from the real estate funds, partially offset by increased performance fees from the NGP funds, for which there is no performance fee related compensation expense. Net performance fees for the
six months ended June 30, 2017
were
$129.8 million
, representing
an increase
of
$2.4 million
from
$127.4 million
in net performance fees for the
six months ended June 30, 2016
. The
increase
was primarily due to increased performance fees from the NGP funds, for which there is no performance fee related compensation expense, partially offset by decreased performance fees from the real estate funds.
Performance fees earned from the Legacy Energy funds and from NGP funds are primarily allocated to Carlyle and are not otherwise shared or allocated with our investment professionals since the investment teams are employed by Riverstone and NGP, respectively, and not Carlyle. Accordingly, performance fee compensation as a percentage of performance fees is generally not a comparable measurement for Real Assets from period to period.
Total Investment Income (Loss).
Total investment income (realized and unrealized) for the
three months ended June 30, 2017
was
$7.1 million
as compared to total investment loss of
$2.8 million
for the
three months ended June 30, 2016
. The decrease in total investment loss for the
three months ended June 30, 2017
as compared to the
three months ended June 30, 2016
was primarily due to lower investment losses associated with Urbplan (see Note 16 to the unaudited condensed consolidated financial statements), partially offset by lower investment gains of approximately $4.6 million associated with our investments in NGP for the
three months ended June 30, 2017
as compared the
three months ended June 30, 2016
.
Total investment income (realized and unrealized) for the
six months ended June 30, 2017
was
$4.2 million
as compared to total investment loss of
$5.3 million
for the
six months ended June 30, 2016
. The decrease in total investment loss for the
six months ended June 30, 2017
as compared to the
six months ended June 30, 2016
was primarily due to lower investment losses associated with Urbplan (see Note 16 to the unaudited condensed consolidated financial statements) and higher investment gains of approximately $1.7 million associated with our investments in NGP for the
six months ended June 30, 2017
as compared to the
six months ended June 30, 2016
.
Equity-based Compensation.
Equity-based compensation was
$9.3 million
for the
three months ended June 30, 2017
,
an increase
of
$2.3 million
from
$7.0 million
for the
three months ended June 30, 2016
and was
$18.1 million
for the
six months ended June 30, 2017
,
an increase
of
$4.9 million
from
$13.2 million
for the
six months ended June 30, 2016
. The
increase
in both periods is primarily attributable to equity-based compensation expense in connection with the March 2017 agreement with NGP (see Note 5 to the unaudited condensed consolidated financial statements).
115
Fee-earning AUM as of and for the
Three and Six
Months Ended
June 30, 2017
and
2016
Fee-earning AUM is presented below for each period together with the components of change during each respective period.
The table below breaks out Fee-earning AUM by its respective components at each period.
|
|
As of June 30,
|
||||||
|
|
2017
|
2016
|
|||||
|
Real Assets
|
(Dollars in millions)
|
||||||
|
Components of Fee-earning AUM (1)
|
|||||||
|
Fee-earning AUM based on capital commitments
|
$
|
13,063
|
|
$
|
12,941
|
|
|
|
Fee-earning AUM based on invested capital (2)
|
12,345
|
|
16,410
|
|
|||
|
Fee-earning AUM based on net asset value
|
509
|
|
121
|
|
|||
|
Fee-earning AUM based on lower of cost or fair value and other (3)
|
319
|
|
950
|
|
|||
|
Total Fee-earning AUM (4)
|
$
|
26,236
|
|
$
|
30,422
|
|
|
|
Weighted Average Management Fee Rates (5)
|
|||||||
|
All Funds
|
1.24
|
%
|
1.24
|
%
|
|||
|
Funds in Investment Period
|
1.43
|
%
|
1.44
|
%
|
|||
|
(1)
|
For additional information concerning the components of Fee-earning AUM, See “—Fee-earning Assets under Management.”
|
|
(2)
|
Includes amounts committed to or reserved for investments for certain real estate funds.
|
|
(3)
|
Includes certain funds that are calculated on gross asset value.
|
|
(4)
|
Energy II, Energy III, Energy IV, and Renew II (collectively, the “Legacy Energy Funds”), are managed with Riverstone Holdings LLC and its affiliates. Affiliates of both Carlyle and Riverstone act as investment advisers to each of the Legacy Energy Funds. Carlyle has a minority representation on the management committees of Energy IV and Renew II. Carlyle and Riverstone each hold half of the seats on the management committees of Energy II and Energy III, but the investment period for these funds has expired and the remaining investments in such funds are being disposed of in the ordinary course of business. As of
June 30, 2017
, the Legacy Energy Funds had, in the aggregate, approximately
$6.3 billion
in AUM and
$4.7 billion
in Fee-earning AUM. We are no longer raising capital for the Legacy Energy Funds and expect these balances to continue to decrease over time as the funds wind down. NGP VII, NGP VIII, NGP IX, or in the case of NGP M&R, NGP ETP I, and NGP ETP II, certain affiliated entities (collectively, the “NGP management fee funds”) and NGP X, NGP GAP and NGP XI (referred to herein as “carry funds”), are managed by NGP Energy Capital Management. As of
June 30, 2017
, the NGP management fee funds and carry funds had, in the aggregate, approximately
$10.0 billion
in AUM and
$9.6 billion
in Fee-earning AUM.
|
|
(5)
|
Represents the aggregate effective management fee rate of each fund in the segment, weighted by each fund’s Fee-earning AUM, as of the end of each period presented. Calculation reflects Carlyle’s 10% interest in management fees earned by the Legacy Energy funds and 55% interest in management fees earned by the NGP management fee funds and carry funds. Accounts based on gross asset base generally have an effective management fee rate of 0.5% or less.
|
The table below provides the period to period rollforward of Fee-earning AUM.
|
|
Three Months Ended June 30,
|
Six Months Ended June 30,
|
|||||||||||||
|
|
2017
|
2016
|
2017
|
2016
|
|||||||||||
|
Real Assets
|
(Dollars in millions)
|
(Dollars in millions)
|
|||||||||||||
|
Fee-earning AUM Rollforward
|
|||||||||||||||
|
Balance, Beginning of Period
|
$
|
27,157
|
|
$
|
30,651
|
|
$
|
27,487
|
|
$
|
30,905
|
|
|||
|
Inflows, including Fee-paying Commitments (1)
|
286
|
|
646
|
|
471
|
|
975
|
|
|||||||
|
Outflows, including Distributions (2)
|
(1,272
|
)
|
(846
|
)
|
(1,838
|
)
|
(1,500
|
)
|
|||||||
|
Market Appreciation/(Depreciation) (3)
|
7
|
|
16
|
|
25
|
|
8
|
|
|||||||
|
Foreign Exchange and other (4)
|
58
|
|
(45
|
)
|
91
|
|
34
|
|
|||||||
|
Balance, End of Period
|
$
|
26,236
|
|
$
|
30,422
|
|
$
|
26,236
|
|
$
|
30,422
|
|
|||
116
|
(1)
|
Inflows represent limited partner capital raised and capital invested by funds outside the investment period.
|
|
(2)
|
Outflows represent distributions from funds outside the investment period and changes in fee basis for our carry funds where the investment period has expired.
|
|
(3)
|
Market Appreciation/(Depreciation) represents realized and unrealized gains (losses) on portfolio investments in our carry funds based on the lower of cost or fair value and net asset value.
|
|
(4)
|
Represents the impact of foreign exchange rate fluctuations on the translation of our non-U.S. dollar denominated funds. Activity during the period is translated at the average rate for the period. Ending balances are translated at the spot rate as of the period end.
|
Fee-earning AUM was
$26.2 billion
at
June 30, 2017
, a decrease of
$1.0 billion
, or approximately
4%
, compared to
$27.2 billion
at
March 31, 2017
. This decrease was driven by outflows of
$1.3 billion
, primarily related to distribution activity in our funds outside the original investment period. The decrease was partially offset by inflows of
$0.3 billion
, primarily related to new limited partner capital invested in CPI and new fee-paying commitments to our China real estate platform. Changes in fair value have no material impact on Fee-earning AUM for Real Assets as substantially all of the funds generate management fees based on either commitments or invested capital at cost, neither of which is impacted by fair value movements. Investment and distribution activity by funds still in the original investment period do not impact Fee-earning AUM as these funds are based on commitments and not invested capital.
Fee-earning AUM was
$26.2 billion
at
June 30, 2017
, a decrease of
$1.3 billion
, or approximately
5%
, compared to
$27.5 billion
at
December 31, 2016
. This decrease was driven by outflows of
$1.8 billion
primarily related to distribution activity in our funds outside the original investment period. The decrease was partially offset by inflows of
$0.5 billion
, primarily related to new limited partner capital invested in CPI and new fee-paying commitments to our China real estate platform.
Fee-earning AUM was
$26.2 billion
at
June 30, 2017
, a decrease of
$4.2 billion
, or
14%
, compared to
$30.4 billion
at
June 30, 2016
. This decrease was driven by outflows of
$5.2 billion
, including dispositions in various funds with fees based on invested capital, primarily in our NGP carry and management fee funds, Legacy Energy funds, and in our Asia, Europe, and US real estate funds. The decrease was partially offset by inflows of
$1.0 billion
, primarily due to new limited partner capital invested in CPI, purchases by several funds and external coinvestment vehicles outside their original investment period, and new fee-paying commitments to our China real estate platform.
Fee-earning AUM was $30.4 billion at June 30, 2016, a decrease of $0.3 billion, or approximately 1%, compared to $30.7 billion at March 31, 2016. This decrease was driven by outflows of $0.8 billion, primarily related to distribution activity in our funds outside the original investment period. The decrease was partially offset by inflows of $0.6 billion, primarily related to new limited partner commitments in CPP II and purchases by funds outside the original investment period.
Fee-earning AUM was $30.4 billion at June 30, 2016, a decrease of $0.5 billion, or 2%, compared to $30.9 billion at December 31, 2015. The decrease is related to outflows of $1.5 billion primarily attributable to dispositions in various funds with fees based on invested capital. The decrease was partially offset by inflows of $1.0 billion, primarily related to new limited partner commitments in CPP II and purchases by funds outside the original investment period.
117
Total AUM as of and for the
Three and Six
Months Ended
June 30, 2017
The table below provides the period to period rollforwards of Available Capital and Fair Value of Capital, and the resulting rollforward of Total AUM.
|
|
Three Months Ended June 30, 2017
|
Six Months Ended June 30, 2017
|
|||||||||||||||||||||
|
|
Available
Capital |
Fair Value
of Capital |
Total
AUM |
Available
Capital |
Fair Value
of Capital |
Total
AUM |
|||||||||||||||||
|
|
(Dollars in millions)
|
(Dollars in millions)
|
|||||||||||||||||||||
|
Real Assets
|
|||||||||||||||||||||||
|
Balance, Beginning of Period
|
$
|
11,916
|
|
$
|
23,658
|
|
$
|
35,574
|
|
$
|
11,573
|
|
$
|
22,679
|
|
$
|
34,252
|
|
|||||
|
Commitments (1)
|
3,484
|
|
—
|
|
3,484
|
|
4,346
|
|
—
|
|
4,346
|
|
|||||||||||
|
Capital Called, net (2)
|
(855
|
)
|
751
|
|
(104
|
)
|
(1,514
|
)
|
1,353
|
|
(161
|
)
|
|||||||||||
|
Distributions (3)
|
83
|
|
(1,236
|
)
|
(1,153
|
)
|
220
|
|
(2,063
|
)
|
(1,843
|
)
|
|||||||||||
|
Market Appreciation/(Depreciation) (4)
|
—
|
|
1,114
|
|
1,114
|
|
—
|
|
2,276
|
|
2,276
|
|
|||||||||||
|
Foreign Exchange and other (5)
|
8
|
|
21
|
|
29
|
|
11
|
|
63
|
|
74
|
|
|||||||||||
|
Balance, End of Period
|
$
|
14,636
|
|
$
|
24,308
|
|
$
|
38,944
|
|
$
|
14,636
|
|
$
|
24,308
|
|
$
|
38,944
|
|
|||||
|
(1)
|
Represents capital raised by our carry funds and NGP management fee funds, net of expired available capital.
|
|
(2)
|
Represents capital called by our carry funds and NGP management fee funds, net of fund fees and expenses. Equity invested amounts may vary from capital called due to timing differences between acquisition and capital call dates.
|
|
(3)
|
Represents distributions from our carry funds and NGP management fee funds, net of amounts recycled. Distributions are based on when proceeds are actually distributed to investors, which may differ from when they are realized.
|
|
(4)
|
Market Appreciation/(Depreciation) represents realized and unrealized gains (losses) on portfolio investments.
|
|
(5)
|
Represents the impact of foreign exchange rate fluctuations on the translation of our non-U.S. dollar denominated funds. Activity during the period is translated at the average rate for the period. Ending balances are translated at the spot rate as of the period end.
|
Total AUM was
$38.9 billion
at
June 30, 2017
, an increase of
$3.3 billion
, or approximately
9%
, compared to
$35.6 billion
at
March 31, 2017
. The increase was driven by new commitments of
$3.5 billion
resulting from new funds raised primarily in CRP VIII, and market appreciation of
$1.1 billion
. Carry fund market appreciation of
6%
was driven by a
6%
increase in both our private and public portfolios. The carry funds driving appreciation for the period included
$0.2 billion
attributable to
NGP XI
,
$0.2 billion
attributable to
CRP VII
, and
$0.2 billion
attributable to
Energy IV
. This increase was partially offset by distributions of
$1.2 billion
, of which
$0.1 billion
were recallable, primarily in our US real estate and NGP carry funds.
Total AUM was
$38.9 billion
at
June 30, 2017
, an increase of
$4.6 billion
, or approximately
13%
, compared to
$34.3 billion
at
December 31, 2016
. The increase was driven by new commitments of
$4.3 billion
resulting from new funds raised primarily in CRP VIII, and market appreciation of
$2.3 billion
. Carry fund market appreciation of
11%
was driven by a
13%
increase in our private portfolio and a
6%
increase in our public portfolio. The carry funds driving appreciation for the period included
$0.7 billion
attributable to
NGP XI
,
$0.3 billion
attributable to
CRP VII
, and
$0.3 billion
attributable to
Energy IV
. This increase was partially offset by distributions of
$2.1 billion
, of which
$0.2 billion
were recallable, primarily in our US and Europe real estate funds and NGP carry funds.
Fund Performance Metrics
Fund performance information for our carry funds that generally have at least $1.0 billion in capital commitments, cumulative equity invested or total value as of
June 30, 2017
, which we refer to as our “significant funds,” is included throughout this discussion and analysis to facilitate an understanding of our results of operations for the periods presented. The fund return information reflected in this discussion and analysis is not indicative of the performance of The Carlyle Group L.P. and is also not necessarily indicative of the future performance of any particular fund. An investment in The Carlyle Group L.P. is not an investment in any of our funds. There can be no assurance that any of our funds or our other existing and future funds will achieve similar returns. The following tables reflect the performance of our significant funds in our Real Assets business. Please see “— Our Family of Funds” for a legend of the fund acronyms listed below.
118
|
|
|
|
TOTAL INVESTMENTS
|
REALIZED/PARTIALLY REALIZED
INVESTMENTS(5) |
||||||||||||||||||||||||||||||
|
|
|
|
As of June 30, 2017
|
As of June 30, 2017
|
||||||||||||||||||||||||||||||
|
|
Fund
Inception Date(1) |
Committed
Capital |
Cumulative
Invested Capital(2) |
Total Fair
Value(3) |
MOIC(4)
|
Gross
IRR
(7)(12)
|
Net
IRR
(8)(12)
|
Cumulative
Invested Capital(2) |
Total Fair
Value(3) |
MOIC(4)
|
Gross
IRR
(7)(12)
|
|||||||||||||||||||||||
|
Real Assets
|
|
|
(Reported in Local Currency, in Millions)
|
(Reported in Local Currency, in Millions)
|
||||||||||||||||||||||||||||||
|
Fully Invested Funds(6)
|
||||||||||||||||||||||||||||||||||
|
CRP III
|
11/2000
|
$
|
564.1
|
|
$
|
522.5
|
|
$
|
1,803.3
|
|
3.5x
|
44
|
%
|
30
|
%
|
$
|
522.5
|
|
$
|
1,803.3
|
|
3.5x
|
44
|
%
|
||||||||||
|
CRP IV
|
12/2004
|
$
|
950.0
|
|
$
|
1,198.5
|
|
$
|
1,903.0
|
|
1.6x
|
7
|
%
|
4
|
%
|
$
|
984.8
|
|
$
|
1,623.8
|
|
1.6x
|
9
|
%
|
||||||||||
|
CRP V
|
11/2006
|
$
|
3,000.0
|
|
$
|
3,293.5
|
|
$
|
5,487.8
|
|
1.7x
|
12
|
%
|
9
|
%
|
$
|
2,923.3
|
|
$
|
5,013.8
|
|
1.7x
|
14
|
%
|
||||||||||
|
CRP VI
|
9/2010
|
$
|
2,340.0
|
|
$
|
2,108.0
|
|
$
|
3,904.7
|
|
1.9x
|
30
|
%
|
21
|
%
|
$
|
1,439.9
|
|
$
|
2,963.6
|
|
2.1x
|
35
|
%
|
||||||||||
|
CEREP I
|
3/2002
|
€
|
426.6
|
|
€
|
517.0
|
|
€
|
698.6
|
|
1.4x
|
14%
|
|
7%
|
|
€
|
517.0
|
|
€
|
698.6
|
|
1.4x
|
14%
|
|
||||||||||
|
CEREP II
|
4/2005
|
€
|
762.7
|
|
€
|
833.8
|
|
€
|
128.1
|
|
0.2x
|
Neg
|
|
Neg
|
|
€
|
798.2
|
|
€
|
135.5
|
|
0.2x
|
Neg
|
|
||||||||||
|
CEREP III
|
5/2007
|
€
|
2,229.5
|
|
€
|
2,054.2
|
|
€
|
2,413.7
|
|
1.2x
|
3
|
%
|
0
|
%
|
€
|
1,432.7
|
|
€
|
1,900.9
|
|
1.3x
|
6
|
%
|
||||||||||
|
CIP
|
9/2006
|
$
|
1,143.7
|
|
$
|
1,069.8
|
|
$
|
1,307.3
|
|
1.2x
|
4
|
%
|
1
|
%
|
$
|
857.0
|
|
$
|
1,041.8
|
|
1.2x
|
4
|
%
|
||||||||||
|
NGP X
|
1/2012
|
$
|
3,586.0
|
|
$
|
3,261.9
|
|
$
|
3,969.0
|
|
1.2x
|
8
|
%
|
5
|
%
|
$
|
1,237.5
|
|
$
|
2,400.2
|
|
1.9x
|
29
|
%
|
||||||||||
|
Energy II
|
7/2002
|
$
|
1,100.0
|
|
$
|
1,334.8
|
|
$
|
3,134.8
|
|
2.3x
|
81
|
%
|
55
|
%
|
$
|
1,116.2
|
|
$
|
3,133.4
|
|
2.8x
|
94
|
%
|
||||||||||
|
Energy III
|
10/2005
|
$
|
3,800.0
|
|
$
|
3,569.7
|
|
$
|
5,424.0
|
|
1.5x
|
9
|
%
|
6
|
%
|
$
|
2,510.6
|
|
$
|
5,044.2
|
|
2.0x
|
17
|
%
|
||||||||||
|
Energy IV
|
12/2007
|
$
|
5,979.1
|
|
$
|
6,269.1
|
|
$
|
8,296.7
|
|
1.3x
|
9
|
%
|
6
|
%
|
$
|
3,379.4
|
|
$
|
5,734.6
|
|
1.7x
|
23
|
%
|
||||||||||
|
Renew II
|
3/2008
|
$
|
3,417.5
|
|
$
|
2,809.4
|
|
$
|
4,127.3
|
|
1.5x
|
9
|
%
|
6
|
%
|
$
|
1,490.3
|
|
$
|
2,428.8
|
|
1.6x
|
14
|
%
|
||||||||||
|
All Other Funds(9)
|
Various
|
$
|
2,939.5
|
|
$
|
3,284.6
|
|
1.1x
|
4
|
%
|
Neg
|
|
$
|
2,662.1
|
|
$
|
3,019.7
|
|
1.1x
|
5
|
%
|
|||||||||||||
|
Coinvestments and Other(10)
|
Various
|
$
|
5,635.0
|
|
$
|
9,308.4
|
|
1.7x
|
17
|
%
|
13
|
%
|
$
|
3,999.5
|
|
$
|
7,403.2
|
|
1.9x
|
20
|
%
|
|||||||||||||
|
Total Fully Invested Funds
|
$
|
37,897.9
|
|
$
|
55,649.4
|
|
1.5x
|
12
|
%
|
7
|
%
|
$
|
26,259.4
|
|
$
|
44,731.9
|
|
1.7x
|
18
|
%
|
||||||||||||||
|
Funds in the Investment Period(6)
|
|
|
|
|
|
|
|
|
|
|||||||||||||||||||||||||
|
CRP VII
|
3/2014
|
$
|
4,161.6
|
|
$
|
2,605.3
|
|
$
|
3,420.7
|
|
1.3x
|
NM
|
|
NM
|
|
|
|
|
|
|
|
|
||||||||||||
|
CIEP I
|
9/2013
|
$
|
2,500.0
|
|
$
|
501.3
|
|
$
|
841.2
|
|
1.7x
|
NM
|
|
NM
|
|
|
|
|
|
|||||||||||||||
|
NGP XI
|
6/2014
|
$
|
5,325.0
|
|
$
|
3,009.7
|
|
$
|
4,161.5
|
|
1.4x
|
NM
|
|
NM
|
|
|
|
|
|
|
|
|
||||||||||||
|
CPP II
|
6/2014
|
$
|
1,526.9
|
|
$
|
501.0
|
|
$
|
549.2
|
|
1.1x
|
NM
|
|
NM
|
|
|
|
|
|
|||||||||||||||
|
All Other Funds(11)
|
Various
|
$
|
883.4
|
|
$
|
980.0
|
|
1.1x
|
NM
|
|
NM
|
|
|
|
|
|
|
|
|
|||||||||||||||
|
Total Funds in the Investment Period
|
$
|
7,500.6
|
|
$
|
9,952.6
|
|
1.3x
|
28
|
%
|
18
|
%
|
$
|
275.5
|
|
$
|
563.9
|
|
2.0x
|
NM
|
|
||||||||||||||
|
TOTAL Real Assets(13)
|
$
|
45,398.5
|
|
$
|
65,602.0
|
|
1.4x
|
13
|
%
|
8
|
%
|
$
|
26,534.9
|
|
$
|
45,295.8
|
|
1.7x
|
18
|
%
|
||||||||||||||
|
(1)
|
The data presented herein that provides “inception to date” performance results of our segments relates to the period following the formation of the first fund within each segment. For our Corporate Private Equity segment our first fund was formed in 1990. For our Real Assets segment our first fund was formed in 1997. For our Global Market Strategies segment our first carry fund was formed in 2004.
|
|
(2)
|
Represents the original cost of investments since inception of the fund.
|
|
(3)
|
Represents all realized proceeds combined with remaining fair value, before management fees, expenses and carried interest.
|
|
(4)
|
Multiple of invested capital (“MOIC”) represents total fair value, before management fees, expenses and carried interest, divided by cumulative invested capital.
|
|
(5)
|
An investment is considered realized when the investment fund has completely exited, and ceases to own an interest in, the investment. An investment is considered partially realized when the total amount of proceeds received in respect of such investment, including dividends, interest or other distributions and/or return of capital, represents at least 85% of invested capital and such investment is not yet fully realized. Because part of our value creation strategy involves pursuing best exit alternatives, we believe information regarding Realized/Partially Realized MOIC and Gross IRR, when considered together with the other investment performance metrics presented, provides investors with meaningful information regarding our investment performance by removing the impact of investments where significant realization activity has not yet occurred. Realized/Partially Realized MOIC and Gross IRR have limitations as measures of investment performance, and should not be considered in isolation. Such limitations include the fact that these measures do not include the performance of earlier stage and other investments that do not satisfy the criteria provided above. The exclusion of such investments will have a positive impact on Realized/Partially Realized MOIC and Gross IRR in instances when the MOIC and Gross IRR in respect of such investments are less than the aggregate MOIC and Gross IRR. Our measurements of Realized/Partially Realized MOIC and Gross IRR may not be comparable to those of other companies that use similarly titled measures. We do not present Realized/Partially Realized performance information separately for funds that are still in the investment period because of the relatively insignificant level of realizations for funds of this type. However, to the extent such funds have had realizations, they are included in the Realized/Partially Realized performance information presented for
Total Real Assets.
|
119
|
(6)
|
Fully Invested funds are past the expiration date of the investment period as defined in the respective limited partnership agreement. In instances where a successor fund has had its first capital call, the predecessor fund is categorized as fully invested.
|
|
(7)
|
Gross Internal Rate of Return (“Gross IRR”) represents the annualized IRR for the period indicated on Limited Partner invested capital based on contributions, distributions and unrealized value before management fees, expenses and carried interest.
|
|
(8)
|
Net Internal Rate of Return (“Net IRR”) represents the annualized IRR for the period indicated on Limited Partner invested capital based on contributions, distributions and unrealized value after management fees, expenses and carried interest.
|
|
(9)
|
Aggregate includes the following funds: CRP I, CRP II, CAREP I, CAREP II, CRCP I, CPOCP, Energy I and Renew I.
|
|
(10)
|
Includes coinvestments and certain other stand-alone investments arranged by us.
|
|
(11)
|
Aggregate includes NGP GAP, CPI, CCR, and CRP VIII. Return is not considered meaningful, as the investment period commenced in December 2013 for NGP GAP, May 2016 for CPI, October 2016 for CCR, and May 2017 for CRP VIII.
|
|
(12)
|
For funds marked “NM,” IRR may be positive or negative, but is not considered meaningful because of the limited time since initial investment and early stage of capital deployment. For funds marked “Neg,” IRR is negative as of reporting period end.
|
|
(13)
|
For purposes of aggregation, funds that report in foreign currency have been converted to U.S. dollars at the reporting period spot rate.
|
|
Remaining
Fair Value(1) |
Unrealized
MOIC(2) |
Total
MOIC(3) |
%
Invested(4) |
In Accrued
Carry/ (Clawback) (5) |
LTM
Realized Carry (6) |
Catch-up Rate
|
Fee
Initiation Date(7) |
Quarters
Since Fee Initiation |
Original
Investment Period End Date |
||||||||||||||
|
|
As of June 30, 2017
|
||||||||||||||||||||||
|
Real Assets
|
(Reported in Local Currency, in Millions)
|
|
|
|
|
||||||||||||||||||
|
NGP XI
|
$
|
3,545.5
|
|
1.3x
|
1.4x
|
57
|
%
|
X
|
|
80
|
%
|
Feb-15
|
10
|
Oct-19
|
|||||||||
|
CRP VII
|
$
|
3,281.7
|
|
1.3x
|
1.3x
|
63
|
%
|
X
|
|
80
|
%
|
Jun-14
|
13
|
Mar-19
|
|||||||||
|
Energy IV
|
$
|
3,192.9
|
|
0.8x
|
1.3x
|
105
|
%
|
(X)
|
|
80
|
%
|
Feb-08
|
38
|
Dec-13
|
|||||||||
|
Renew II
|
$
|
1,985.7
|
|
1.3x
|
1.5x
|
82
|
%
|
(X)
|
|
80
|
%
|
Mar-08
|
38
|
May-14
|
|||||||||
|
NGP X
|
$
|
1,664.0
|
|
0.8x
|
1.2x
|
91
|
%
|
|
|
80
|
%
|
Jan-12
|
22
|
May-17
|
|||||||||
|
CRP V
|
$
|
1,210.1
|
|
2.0x
|
1.7x
|
110
|
%
|
X
|
|
50
|
%
|
Nov-06
|
43
|
Nov-11
|
|||||||||
|
CRP VI
|
$
|
961.7
|
|
1.4x
|
1.9x
|
90
|
%
|
X
|
X
|
50
|
%
|
Mar-11
|
26
|
Mar-16
|
|||||||||
|
CIEP I
|
$
|
825.0
|
|
1.6x
|
1.7x
|
20
|
%
|
|
|
80
|
%
|
Oct-13
|
15
|
Sep-19
|
|||||||||
|
CRP IV
|
$
|
719.8
|
|
2.5x
|
1.6x
|
126
|
%
|
|
|
50
|
%
|
Jan-05
|
50
|
Dec-09
|
|||||||||
|
CEREP III
|
€
|
423.5
|
|
0.8x
|
1.2x
|
92
|
%
|
|
|
67
|
%
|
Jun-07
|
41
|
May-11
|
|||||||||
|
CPP II
|
$
|
447.6
|
|
1.1x
|
1.1x
|
33
|
%
|
|
|
80
|
%
|
Sep-14
|
12
|
Apr-21
|
|||||||||
|
CRP III
|
$
|
428.8
|
|
127.5x
|
3.5x
|
93
|
%
|
X
|
X
|
50
|
%
|
Mar-01
|
66
|
May-05
|
|||||||||
|
CIP
|
$
|
342.5
|
|
1.2x
|
1.2x
|
94
|
%
|
|
|
80
|
%
|
Oct-06
|
43
|
Sep-12
|
|||||||||
|
Energy III
|
$
|
338.6
|
|
0.2x
|
1.5x
|
94
|
%
|
|
(X)
|
80
|
%
|
Nov-05
|
47
|
Oct-11
|
|||||||||
|
All Other Funds (10)
|
$
|
914.7
|
|
0.7x
|
1.2x
|
NM
|
NM
|
||||||||||||||||
|
Coinvestment and Other (9)
|
$
|
2,263.2
|
|
1.3x
|
1.7x
|
NM
|
NM
|
||||||||||||||||
|
Total Real Assets (12)
|
$
|
22,605.3
|
|
1.1x
|
1.4x
|
|
|
||||||||||||||||
|
(1)
|
Net asset value of our carry funds. Reflects significant funds with remaining fair value of greater than $100 million.
|
|
(2)
|
Unrealized multiple of invested capital (“MOIC”) represents remaining fair market value, before management fees, expenses and carried interest, divided by remaining investment cost.
|
|
(3)
|
Total MOIC represents total fair value (realized proceeds combined with remaining fair value), before management fees, expenses and carried interest, divided by cumulative invested capital. For certain funds, represents the original cost of investments net of investment-level recallable proceeds, which is adjusted to reflect recyclability of invested capital for the purpose of calculating the fund MOIC.
|
|
(4)
|
Represents cumulative equity invested as of the reporting period divided by total commitments. Amount can be greater than 100% due to the re-investment of recallable distributions to fund investors.
|
|
(5)
|
Fund has a net accrued performance fee balance/(giveback obligation) as of the current quarter end, driven by a significant portion of the fund’s asset base.
|
|
(6)
|
Fund has generated realized net performance fees/(realized giveback) in the last twelve months.
|
|
(7)
|
Represents the date of the first capital contribution for management fees.
|
|
(8)
|
Aggregate includes the following funds: CRP I, CRP II, CRCP I, CPI, CRP VIII, CEREP I, CEREP II, CAREP I, CAREP II, CCR, CPOCP I, NGP GAP, Energy I, Energy II and Renew I. In Accrued Carry/(Clawback) and LTM Realized Carry not indicated because the indicator does not apply to each fund within the aggregate.
|
|
(9)
|
Includes co-investments, prefund investments and certain other stand-alone investments arranged by us. In Accrued Carry/(Clawback) and LTM Realized Carry not indicated because the indicator does not apply to each fund within the aggregate.
|
|
(10)
|
For purposes of aggregation, funds that report in foreign currency have been converted to U.S. dollars at the reporting period spot rate.
|
120
Global Market Strategies
Global Market Strategies is now focused on building our global credit business. We conducted a review in 2016 of the segment in order to realign and reorganize certain of the segment’s operations. We have exited our hedge fund business (ESG in 2016 and Claren Road in January 2017) and, as a result of settlements reached during 2017 with investors in two commodities investment vehicles managed by Vermillion, we have completed the exit of the commodities investment advisory business and other hedge fund investment advisory businesses that we had acquired from 2010 to 2014. In the near to mid term, this segment will incur additional expenses to build the credit business and raise additional capital.
For purposes of presenting our results of operations for this segment, we include only our economic interests in the results of operations of Claren Road (through January 2017) and ESG (through June 2016). The following table presents our results of operations for our Global Market Strategies segment:
|
|
Three Months Ended June 30,
|
Six Months Ended June 30,
|
|||||||||||||
|
|
2017
|
2016
|
2017
|
2016
|
|||||||||||
|
|
(Dollars in millions)
|
||||||||||||||
|
Segment Revenues
|
|||||||||||||||
|
Fund level fee revenues
|
|||||||||||||||
|
Fund management fees
|
$
|
45.1
|
|
$
|
52.2
|
|
$
|
93.2
|
|
$
|
103.3
|
|
|||
|
Portfolio advisory fees, net
|
0.3
|
|
0.5
|
|
0.4
|
|
0.6
|
|
|||||||
|
Transaction fees, net
|
—
|
|
—
|
|
—
|
|
—
|
|
|||||||
|
Total fund level fee revenues
|
45.4
|
|
52.7
|
|
93.6
|
|
103.9
|
|
|||||||
|
Performance fees
|
|||||||||||||||
|
Realized
|
17.2
|
|
5.4
|
|
22.8
|
|
7.2
|
|
|||||||
|
Unrealized
|
(1.6
|
)
|
1.8
|
|
12.9
|
|
1.5
|
|
|||||||
|
Total performance fees
|
15.6
|
|
7.2
|
|
35.7
|
|
8.7
|
|
|||||||
|
Investment income
|
|||||||||||||||
|
Realized
|
1.5
|
|
0.8
|
|
3.9
|
|
1.6
|
|
|||||||
|
Unrealized
|
0.1
|
|
9.9
|
|
4.3
|
|
7.8
|
|
|||||||
|
Total investment income
|
1.6
|
|
10.7
|
|
8.2
|
|
9.4
|
|
|||||||
|
Interest
|
1.0
|
|
1.1
|
|
2.6
|
|
2.6
|
|
|||||||
|
Other income
|
1.1
|
|
1.2
|
|
4.5
|
|
2.3
|
|
|||||||
|
Total revenues
|
64.7
|
|
72.9
|
|
144.6
|
|
126.9
|
|
|||||||
|
Segment Expenses
|
|||||||||||||||
|
Compensation and benefits
|
|||||||||||||||
|
Direct base compensation
|
15.2
|
|
22.2
|
|
32.3
|
|
45.4
|
|
|||||||
|
Indirect base compensation
|
7.6
|
|
7.0
|
|
14.2
|
|
15.2
|
|
|||||||
|
Equity-based compensation
|
7.5
|
|
4.4
|
|
11.8
|
|
9.4
|
|
|||||||
|
Performance fee related
|
|||||||||||||||
|
Realized
|
8.2
|
|
0.7
|
|
10.9
|
|
1.5
|
|
|||||||
|
Unrealized
|
(0.7
|
)
|
2.0
|
|
6.1
|
|
0.9
|
|
|||||||
|
Total compensation and benefits
|
37.8
|
|
36.3
|
|
75.3
|
|
72.4
|
|
|||||||
|
General, administrative, and other indirect expenses
|
21.8
|
|
20.2
|
|
45.0
|
|
39.4
|
|
|||||||
|
Depreciation and amortization expense
|
1.3
|
|
1.6
|
|
2.5
|
|
3.1
|
|
|||||||
|
Interest expense
|
3.2
|
|
2.8
|
|
5.8
|
|
5.5
|
|
|||||||
|
Total expenses
|
64.1
|
|
60.9
|
|
128.6
|
|
120.4
|
|
|||||||
|
Economic Net Income
|
$
|
0.6
|
|
$
|
12.0
|
|
$
|
16.0
|
|
$
|
6.5
|
|
|||
|
(-) Net Performance Fees
|
8.1
|
|
4.5
|
|
18.7
|
|
6.3
|
|
|||||||
|
(-) Investment Income
|
1.6
|
|
10.7
|
|
8.2
|
|
9.4
|
|
|||||||
|
(+) Equity-based Compensation
|
7.5
|
|
4.4
|
|
11.8
|
|
9.4
|
|
|||||||
|
(=) Fee Related Earnings
|
$
|
(1.6
|
)
|
$
|
1.2
|
|
$
|
0.9
|
|
$
|
0.2
|
|
|||
|
(+) Realized Net Performance Fees
|
9.0
|
|
4.7
|
|
11.9
|
|
5.7
|
|
|||||||
|
(+) Realized Investment Income
|
1.5
|
|
0.8
|
|
3.9
|
|
1.6
|
|
|||||||
|
(=) Distributable Earnings
|
$
|
8.9
|
|
$
|
6.7
|
|
$
|
16.7
|
|
$
|
7.5
|
|
|||
121
Three Months Ended June 30, 2017
Compared to the
Three Months Ended June 30, 2016
and
Six Months Ended June 30, 2017
Compared to the
Six Months Ended June 30, 2016
Distributable Earnings
Distributable earnings
increased
$2.2 million
for the
three months ended June 30, 2017
as compared to the
three months ended June 30, 2016
and
increased
$9.2 million
for the
six months ended June 30, 2017
as compared to the
six months ended June 30, 2016
. The following table provides the components of the changes in distributable earnings for the
three months and six months ended June 30, 2017
:
|
Three Months Ended
June 30, |
Six Months Ended
June 30, |
|||||
|
(Dollars in Millions)
|
||||||
|
Distributable earnings, June 30, 2016
|
$
|
6.7
|
|
$
|
7.5
|
|
|
Increases (decreases):
|
||||||
|
Increase in realized net performance fees
|
4.3
|
|
6.2
|
|
||
|
Increase in realized investment income
|
0.7
|
|
2.3
|
|
||
|
(Decrease) increase in fee related earnings
|
(2.8
|
)
|
0.7
|
|
||
|
Total increase
|
2.2
|
|
9.2
|
|
||
|
Distributable earnings, June 30, 2017
|
$
|
8.9
|
|
$
|
16.7
|
|
Realized Net Performance Fees.
Realized net performance fees
increased
$4.3 million
for the
three months ended June 30, 2017
as compared to the
three months ended June 30, 2016
and
increased
$6.2 million
for the
six months ended June 30, 2017
as compared to the
six months ended June 30, 2016
. All of the realized net performance fees were generated by the business development companies, the structured credit funds and our third distressed and corporate opportunities fund (“CSP III”) for both the
three months and six months ended June 30, 2017
. Net realized performance fees generated by the structured credit funds primarily contributed to realized net performance fees for the
six months ended June 30, 2016
.
Realized Investment Income.
Realized investment income for the
three months ended June 30, 2017
was
$1.5 million
compared to realized investment income of
$0.8 million
for the
three months ended June 30, 2016
. The
increase
in realized investment income for the
three months ended June 30, 2017
was primarily due to higher realizations on investments in our structured credit funds.
Realized investment income for the
six months ended June 30, 2017
was
$3.9 million
compared to realized investment income of
$1.6 million
for the
six months ended June 30, 2016
. The
increase
in realized investment income for the
six months ended June 30, 2017
was primarily due to higher realizations on investments in our structured credit funds and carry funds.
122
Fee Related Earnings
Fee related earnings
decreased
$2.8 million
for the
three months ended June 30, 2017
as compared to the
three months ended June 30, 2016
and
increased
$0.7 million
for the
six months ended June 30, 2017
as compared to the
six months ended June 30, 2016
. The following table provides the components of the changes in fee related earnings for the
three months and six months ended June 30, 2017
:
|
Three Months Ended
June 30, |
Six Months Ended
June 30, |
|||||
|
(Dollars in Millions)
|
||||||
|
Fee related earnings, June 30, 2016
|
$
|
1.2
|
|
$
|
0.2
|
|
|
Increases (decreases):
|
||||||
|
Decrease in fee revenues
|
(7.3
|
)
|
(10.3
|
)
|
||
|
Decrease in direct and indirect base compensation
|
6.4
|
|
14.1
|
|
||
|
Increase in general, administrative and other indirect expenses
|
(1.6
|
)
|
(5.6
|
)
|
||
|
All other changes
|
(0.3
|
)
|
2.5
|
|
||
|
Total (decrease) increase
|
(2.8
|
)
|
0.7
|
|
||
|
Fee related earnings, June 30, 2017
|
$
|
(1.6
|
)
|
$
|
0.9
|
|
Fee Revenues.
Fee revenues
decreased
$7.3 million
for the
three months ended June 30, 2017
as compared to the
three months ended June 30, 2016
primarily due to
a decrease
of $12.1 million in fund management fees related to the separation from the hedge funds and lower basis on certain carry funds. These decreases were partially offset by a $7.6 million increase in fund management fees primarily as a result of increased commitments and subsequent closings for our fourth distressed fund (“CSP IV”) in the first quarter of 2017.
Fee revenues
decreased
$10.3 million
for the
six months ended June 30, 2017
as compared to the
six months ended June 30, 2016
primarily due to
a decrease
of $26.1 million in fund management fees related to the separation from the hedge funds and lower basis on certain carry funds. These decreases were partially offset by a $18.9 million increase in fund management fees primarily as a result of increased commitments and subsequent closings for CSP IV in the first quarter of 2017.
The weighted average management fee rate on our carry funds increased from 1.33% at June 30, 2016 to
1.37%
at June 30, 2017. The increase was primarily attributable to new fee-paying commitments raised in CSP IV which has a higher effective fee rate than most other carry funds in the segment.
Direct and indirect base compensation expense.
Direct and indirect base compensation expense
decreased
$6.4 million
for the
three months ended June 30, 2017
as compared to the
three months ended June 30, 2016
, primarily due to lower headcount from the separation of the hedge fund businesses, which resulted in $9.1 million of lower compensation. However, included in our direct and indirect compensation expense for the
three months ended June 30, 2017
is $2.2 million of compensation associated with fundraising activities, which is $0.6 million higher than the
three months ended June 30, 2016
.
Direct and indirect base compensation expense
decreased
$14.1 million
for the
six months ended June 30, 2017
as compared to the
six months ended June 30, 2016
, primarily due to lower headcount from the separation of the hedge fund businesses, which resulted in $18.2 million of lower compensation. Also, included in our direct and indirect compensation expense for the
six months ended June 30, 2017
is $3.4 million of compensation associated with fundraising activities, which is $0.7 million lower than the
six months ended June 30, 2016
.
General, administrative and other indirect expenses.
General, administrative and other indirect expenses
increased
$1.6 million
for the
three months ended June 30, 2017
as compared to the
three months ended June 30, 2016
, primarily due to increased expenses for litigation and contingencies attributable to the Vermillion matter (see Note 10 to the unaudited condensed consolidated financial statements).
General, administrative and other indirect expenses
increased
$5.6 million
for the
six months ended June 30, 2017
as compared to the
six months ended June 30, 2016
, primarily due to increased expenses for litigation and contingencies attributable to the Vermillion matter (see Note 10 to the unaudited condensed consolidated financial statements).
123
Economic Net Income
Economic net income
decreased
$11.4 million
for the
three months ended June 30, 2017
as compared to the
three months ended June 30, 2016
and
increased
$9.5 million
for the
six months ended June 30, 2017
as compared to the
six months ended June 30, 2016
. The following table provides the components of the changes in economic net income for the
three months and six months ended June 30, 2017
:
|
Three Months Ended
June 30, |
Six Months Ended
June 30, |
|||||
|
(Dollars in Millions)
|
||||||
|
Economic net income, June 30, 2016
|
$
|
12.0
|
|
$
|
6.5
|
|
|
Increases (decreases):
|
||||||
|
Increase in net performance fees
|
3.6
|
|
12.4
|
|
||
|
Decrease in investment income
|
(9.1
|
)
|
(1.2
|
)
|
||
|
Increase in equity-based compensation
|
(3.1
|
)
|
(2.4
|
)
|
||
|
(Decrease) increase in fee related earnings
|
(2.8
|
)
|
0.7
|
|
||
|
Total (decrease) increase
|
(11.4
|
)
|
9.5
|
|
||
|
Economic net income, June 30, 2017
|
$
|
0.6
|
|
$
|
16.0
|
|
Performance Fees.
Performance fees (realized and unrealized) for the
three months and six months ended June 30, 2017
and
2016
are from the following types of funds:
|
Performance Fees
|
|||||||||||||||
|
|
Three Months Ended June 30,
|
Six Months Ended June 30,
|
|||||||||||||
|
|
2017
|
2016
|
2017
|
2016
|
|||||||||||
|
|
(Dollars in millions)
|
||||||||||||||
|
Carry funds
|
$
|
2.3
|
|
$
|
2.6
|
|
$
|
15.8
|
|
$
|
1.1
|
|
|||
|
Hedge funds
|
—
|
|
(0.4
|
)
|
—
|
|
0.9
|
|
|||||||
|
Structured credit funds and business development companies
|
13.3
|
|
5.0
|
|
19.9
|
|
6.7
|
|
|||||||
|
Performance fees
|
$
|
15.6
|
|
$
|
7.2
|
|
$
|
35.7
|
|
$
|
8.7
|
|
|||
The
$15.6 million
of performance fees for the
three months ended June 30, 2017
was driven primarily by performance fees recognized from the following funds:
•
CLOs and business development companies of $13.3 million, and
•
CSP III of $4.2 million.
The
$7.2 million
of performance fees for the
three months ended June 30, 2016
was driven by performance fees recognized from the following funds:
•
CLOs of $5.0 million,
•
CSP III of $4.1 million, and
•
CMP II of $(1.9) million.
The
$35.7 million
of performance fees for the
six months ended June 30, 2017
was driven primarily by performance fees recognized from the following funds:
•
CLOs and business development companies of $19.9 million,
•
CSP III of $12.8 million,
•
CSP IV of $5.3 million,
•
CSP II of $3.5 million, and
•
Carlyle Mezzanine Partners II, L.P. (“CMP II”) of $(5.8) million.
124
The
$8.7 million
of performance fees for the
six months ended June 30, 2016
was driven by performance fees recognized from the following funds:
•
CLOs of $6.7 million,
•
CMP II of $1.4 million,
•
CSP II of $1.2 million, and
•
CSP III of $(1.5) million.
Performance fees of
$15.6 million
and
$7.2 million
are inclusive of performance fees reversed of approximately $1.9 million and $2.5 million for the
three months ended June 30, 2017 and 2016
, respectively. Performance fees of
$35.7 million
and
$8.7 million
are inclusive of performance fees reversed of approximately $5.8 million and $1.5 million for the
six months ended June 30, 2017 and 2016
, respectively.
The appreciation (depreciation) in remaining value of assets for this segment's carry funds are as follows:
|
Three Months Ended
June 30, |
Six Months Ended
June 30, |
||||
|
2017
|
2016
|
2017
|
2016
|
||
|
Carry funds
|
0%
|
(2)%
|
7%
|
(13)%
|
|
Net performance fees as a percentage of total performance fees are as follows:
|
Three Months Ended
June 30, |
Six Months Ended
June 30, |
||||
|
2017
|
2016
|
2017
|
2016
|
||
|
(Dollars in millions)
|
|||||
|
Net Performance Fees
|
$8.1
|
$4.5
|
$18.7
|
$6.3
|
|
|
Percentage of Total Performance Fees
|
52%
|
63%
|
52%
|
72%
|
|
The
increase
in net performance fees for the
three months ended June 30, 2017
as compared to the
three months ended June 30, 2016
was primarily due to increased performance fees generated from our business development companies in the
three months ended June 30, 2017
as compared to the
three months ended June 30, 2016
.
The
increase
in net performance fees for the
six months ended June 30, 2017
as compared to the
six months ended June 30, 2016
was primarily due to increased performance fees generated from our carry funds and business development companies in the
six months ended June 30, 2017
as compared to the
six months ended June 30, 2016
.
Total Investment Income (Loss).
Total investment income (realized and unrealized) for the
three months ended June 30, 2017
was
$1.6 million
compared to total investment income of
$10.7 million
for the
three months ended June 30, 2016
. The
decrease
in investment income relates primarily to depreciation on certain U.S.-denominated collateralized loan obligations for the
three months ended June 30, 2017
as compared to appreciation on our U.S.-denominated collateralized loan obligations for the
three months ended June 30, 2016
.
Total investment income (realized and unrealized) for the
six months ended June 30, 2017
was
$8.2 million
compared to total investment income of
$9.4 million
for the
six months ended June 30, 2016
. The
decrease
in investment income relates primarily to lower appreciation on certain U.S. and Euro-denominated collateralized loan obligations for the
six months ended June 30, 2017
as compared to the
six months ended June 30, 2016
. This decrease is partially offset by appreciation on our carry funds for the
six months ended June 30, 2017
as compared to depreciation on our carry funds for the
six months ended June 30, 2016
.
Equity-based Compensation.
Equity-based compensation was
$7.5 million
for the
three months ended June 30, 2017
,
an increase
of
$3.1 million
from
$4.4 million
for the
three months ended June 30, 2016
.
125
Equity-based compensation was
$11.8 million
for the
six months ended June 30, 2017
,
an increase
of
$2.4 million
from
$9.4 million
for the
six months ended June 30, 2016
.
Fee-earning AUM as of and for the
Three and Six
Months Ended
June 30, 2017
and
2016
Fee-earning AUM is presented below for each period together with the components of change during each respective period.
The table below breaks out Fee-earning AUM by its respective components at each period.
|
|
As of June 30,
|
||||||
|
|
2017
|
2016
|
|||||
|
Global Market Strategies
|
(Dollars in millions)
|
||||||
|
Components of Fee-earning AUM (1)
|
|||||||
|
Fee-earning AUM based on capital commitments
|
$
|
5,026
|
|
$
|
2,630
|
|
|
|
Fee-earning AUM based on invested capital
|
1,212
|
|
1,366
|
|
|||
|
Fee-earning AUM based on collateral balances, at par
|
17,111
|
|
17,863
|
|
|||
|
Fee-earning AUM based on net asset value
|
18
|
|
5,302
|
|
|||
|
Fee-earning AUM based on other (2)
|
1,847
|
|
1,571
|
|
|||
|
Total Fee-earning AUM
|
$
|
25,214
|
|
$
|
28,732
|
|
|
|
Weighted Average Management Fee Rates (3)
|
|||||||
|
All Funds, excluding CLOs
|
1.37
|
%
|
1.42
|
%
|
|||
|
(1)
|
For additional information concerning the components of Fee-earning AUM, see “—Fee-earning Assets under Management.”
|
|
(2)
|
Includes funds with fees based on gross asset value.
|
(3) Represents the aggregate effective management fee rate for carry funds and hedge funds, weighted by each fund’s Fee-earning AUM, as of the end of each period presented. Management fees for CLOs are based on the total par amount of the assets (collateral) and principal balance of the notes in the fund and are not calculated as a percentage of equity and are therefore not included.
The table below provides the period to period rollforward of Fee-earning AUM.
|
|
Three Months Ended June 30,
|
Six Months Ended June 30,
|
|||||||||||||
|
|
2017
|
2016
|
2017
|
2016
|
|||||||||||
|
Global Market Strategies
|
(Dollars in millions)
|
(Dollars in millions)
|
|||||||||||||
|
Fee-earning AUM Rollforward
|
|||||||||||||||
|
Balance, Beginning of Period
|
$
|
24,442
|
|
$
|
28,598
|
|
$
|
24,126
|
|
$
|
30,972
|
|
|||
|
Inflows, including Fee-paying Commitments (1)
|
45
|
|
109
|
|
1,109
|
|
458
|
|
|||||||
|
Outflows, including Distributions (2)
|
(99
|
)
|
(326
|
)
|
(146
|
)
|
(549
|
)
|
|||||||
|
Subscriptions, net of Redemptions (3)
|
—
|
|
(445
|
)
|
—
|
|
(1,893
|
)
|
|||||||
|
Changes in CLO collateral balances (4)
|
389
|
|
843
|
|
(349
|
)
|
(133
|
)
|
|||||||
|
Market Appreciation/(Depreciation) (5)
|
1
|
|
31
|
|
1
|
|
(402
|
)
|
|||||||
|
Foreign Exchange and other (6)
|
436
|
|
(78
|
)
|
473
|
|
279
|
|
|||||||
|
Balance, End of Period
|
$
|
25,214
|
|
$
|
28,732
|
|
$
|
25,214
|
|
$
|
28,732
|
|
|||
|
(1)
|
Inflows represent limited partner capital raised and capital invested by our carry funds outside the investment period.
|
|
(2)
|
Outflows represent limited partner distributions from our carry funds, changes in fee basis for our carry funds where the investment period has expired, and reductions for funds that are no longer calling fees.
|
|
(3)
|
Represents subscriptions and redemptions in our hedge funds.
|
|
(4)
|
Represents the change in the aggregate Fee-earning collateral balances and principal balances at par of our CLOs/structured products, as of the quarterly cut-off dates.
|
|
(5)
|
Market Appreciation/ (Depreciation) represents changes in the net asset value of our hedge funds.
|
126
|
(6)
|
Represents the impact of foreign exchange rate fluctuations on the translation of our non-U.S. dollar denominated funds and other changes in Total AUM. Activity during the period is translated at the average rate for the period. Ending balances are translated at the spot rate as of the period end.
|
Fee-earning AUM was
$25.2 billion
at
June 30, 2017
, an increase of
$0.8 billion
, or approximately
3%
, compared to
$24.4 billion
at
March 31, 2017
. The difference was driven by foreign exchange gains of
$0.4 billion
primarily due to the translation of Fee-earning AUM in our European CLO's from EUR to USD and increases in CLO collateral balances of
$0.4 billion
. Distributions from carry funds still in the investment period do not impact Fee-earning AUM as these funds are based on commitments and not invested capital.
Fee-earning AUM was
$25.2 billion
at
June 30, 2017
, an increase of
$1.1 billion
, or approximately
5%
, compared to
$24.1 billion
at
December 31, 2016
. The increase was driven by net inflows of
$1.1 billion
primarily due to new limited partner commitments raised in CSP IV and foreign exchange gains of
$0.5 billion
primarily due to the translation of Fee-earning AUM in our European CLO's from EUR to USD. This increase was partially offset by
$0.4 billion
of decreases in our CLO collateral balances.
Fee-earning AUM was
$25.2 billion
at
June 30, 2017
, a decrease of
$3.5 billion
, or approximately
12%
, compared to
$28.7 billion
at
June 30, 2016
. This decrease was driven by divestment activity of
$4.4 billion
related to the transfer of our ESG and Claren Road hedge fund assets back to their founders, as well as net redemptions in our hedge funds of
$0.9 billion
, primarily in our hedge funds at Claren Road and ESG. Also driving the decrease were decreases in CLO collateral balances of
$0.9 billion
. This decrease was partially offset by net inflows of
$2.6 billion
, primarily related to new limited partner commitments raised in CSP IV.
Fee-earning AUM was $28.7 billion at June 30, 2016, an increase of $0.1 billion, compared to $28.6 billion at March 31, 2016. This increase was driven by net increases in our CLO collateral balances of $0.8 billion primarily due to the launch of three new CLO's. Offsetting this increase were net redemptions in our hedge funds of $0.4 billion and net outflows of $0.3 billion.
Fee-earning AUM was $28.7 billion at June 30, 2016, a decrease of $2.3 billion, or approximately 7%, compared to $31.0 billion at December 31, 2015. This decrease was driven by (a) net redemptions in our hedge funds of $1.9 billion, primarily in our hedge funds at Claren Road and ESG, (b) net outflows including distributions of $0.5 billion, primarily due to fees no longer being charged on one of our commodities hedge funds and distributions by funds with a management fee basis of invested equity, and (c) $0.4 billion of market depreciation in our hedge funds. This decrease was partially offset by net inflows of $0.5 billion, primarily due to fundraising in CEMOF II.
Total AUM as of and for the
Three and Six
Months Ended
June 30, 2017
.
The table below provides the period to period rollforwards of Available Capital and Fair Value of Capital, and the resulting rollforward of Total AUM.
|
|
Three Months Ended June 30, 2017
|
Six Months Ended June 30, 2017
|
|||||||||||||||||||||
|
|
Available
Capital |
Fair Value
of Capital |
Total
AUM |
Available
Capital |
Fair Value
of Capital |
Total
AUM |
|||||||||||||||||
|
|
(Dollars in millions)
|
(Dollars in millions)
|
|||||||||||||||||||||
|
Global Market Strategies
|
|||||||||||||||||||||||
|
Balance, Beginning of Period
|
$
|
6,971
|
|
$
|
22,455
|
|
$
|
29,426
|
|
$
|
6,774
|
|
$
|
22,625
|
|
$
|
29,399
|
|
|||||
|
Commitments (1)
|
953
|
|
—
|
|
953
|
|
1,311
|
|
—
|
|
1,311
|
|
|||||||||||
|
Capital Called, net (2)
|
(265
|
)
|
396
|
|
131
|
|
(453
|
)
|
573
|
|
120
|
|
|||||||||||
|
Distributions (3)
|
42
|
|
(90
|
)
|
(48
|
)
|
63
|
|
(250
|
)
|
(187
|
)
|
|||||||||||
|
Subscriptions, net of Redemptions (4)
|
—
|
|
—
|
|
—
|
|
—
|
|
(7
|
)
|
(7
|
)
|
|||||||||||
|
Changes in CLO collateral balances (5)
|
—
|
|
124
|
|
124
|
|
—
|
|
(246
|
)
|
(246
|
)
|
|||||||||||
|
Market Appreciation/(Depreciation) (6)
|
—
|
|
13
|
|
13
|
|
—
|
|
140
|
|
140
|
|
|||||||||||
|
Foreign Exchange and other (7)
|
—
|
|
293
|
|
293
|
|
6
|
|
356
|
|
362
|
|
|||||||||||
|
Balance, End of Period (8)
|
$
|
7,701
|
|
$
|
23,191
|
|
$
|
30,892
|
|
$
|
7,701
|
|
$
|
23,191
|
|
$
|
30,892
|
|
|||||
127
|
(1)
|
Represents capital raised by our carry funds, net of expired available capital.
|
|
(2)
|
Represents capital called by our carry funds and business development companies, net of fund fees and expenses. Equity invested amounts may vary from capital called due to timing differences between acquisition and capital call dates.
|
|
(3)
|
Represents distributions from our carry funds and business development companies, net of amounts recycled. Distributions are based on when proceeds are actually distributed to investors, which may differ from when they are realized.
|
|
(4)
|
Represents the net result of subscriptions to and redemptions from our hedge funds.
|
|
(5)
|
Represents the change in the aggregate collateral balance and principal cash and principal notes at par of the CLOs/structured products.
|
|
(6)
|
Market Appreciation/(Depreciation) represents realized and unrealized gains (losses) on portfolio investments and changes in the net asset value of our hedge funds.
|
|
(7)
|
Represents the impact of foreign exchange rate fluctuations on the translation of our non-U.S. dollar denominated funds and other changes in AUM. Activity during the period is translated at the average rate for the period. Ending balances are translated at the spot rate as of the period end.
|
|
(8)
|
Ending balance is comprised of approximately
$18.8 billion
from our structured credit funds,
$10.3 billion
(including
$7.7 billion
of Available Capital) in our carry funds, and
$1.8 billion
from our business development company.
|
Total AUM was
$30.9 billion
at
June 30, 2017
, an increase of
$1.5 billion
, or approximately
5%
, compared to
$29.4 billion
at
March 31, 2017
. The increase was driven by
$1.0 billion
of new commitments raised primarily in CSC and CCOF, as well as foreign exchange and other gains of
$0.3 billion
primarily due to the translation of AUM in our European CLO's from EUR to USD.
Total AUM was
$30.9 billion
at
June 30, 2017
, an increase of
$1.5 billion
, or approximately
5%
, compared to
$29.4 billion
at
December 31, 2016
. The increase was driven by
$1.3 billion
of new commitments raised primarily in CSC, CCOF, and CSP IV, as well as foreign exchange and other gains of
$0.4 billion
primarily due to the translation of AUM in our European CLO's from EUR to USD. This increase was partially offset by
$0.2 billion
of decreases in our CLO collateral balances.
Fund Performance Metrics
Fund performance information for certain of our Global Market Strategies funds is included throughout this discussion and analysis to facilitate an understanding of our results of operations for the periods presented. The fund return information reflected in this discussion and analysis is not indicative of the performance of The Carlyle Group L.P. and is also not necessarily indicative of the future performance of any particular fund. An investment in The Carlyle Group L.P. is not an investment in any of our funds. There can be no assurance that any of our funds or our other existing and future funds will achieve similar returns.
128
The following table reflects the performance of carry funds in our Global Market Strategies business. These tables separately present carry funds that, as of
June 30, 2017
, had at least $1.0 billion in capital commitments, cumulative equity invested or total equity value. Please see “— Our Family of Funds” for a legend of the fund acronyms listed below.
|
|
|
|
TOTAL INVESTMENTS
|
||||||||||||||||||
|
|
|
|
As of June 30, 2017
|
As of June 30, 2017
|
|||||||||||||||||
|
|
Fund
Inception Date(1) |
Committed
Capital |
Cumulative
Invested Capital(2) |
Total Fair
Value(3) |
MOIC(4)
|
Gross IRR
(5)(10)
|
Net IRR (6)(10)
|
||||||||||||||
|
Global Market Strategies (Carry Funds Only)
|
(Reported in Local Currency, in Millions)
|
|
|
||||||||||||||||||
|
Fully Invested Funds (7)
|
|||||||||||||||||||||
|
CSP II
|
6/2007
|
$
|
1,352.3
|
|
$
|
1,352.3
|
|
$
|
2,465.6
|
|
1.8x
|
17
|
%
|
11
|
%
|
||||||
|
CSP III
|
8/2011
|
$
|
702.8
|
|
$
|
738.1
|
|
$
|
1,193.1
|
|
1.6x
|
34
|
%
|
22
|
%
|
||||||
|
CEMOF I
|
12/2010
|
$
|
1,382.5
|
|
$
|
1,249.9
|
|
$
|
1,075.7
|
|
0.9x
|
Neg
|
|
Neg
|
|
||||||
|
All Other Funds(8)
|
$
|
1,438.5
|
|
$
|
2,001.0
|
|
1.4x
|
12
|
%
|
7
|
%
|
||||||||||
|
Coinvestments and Other(9)
|
$
|
629.8
|
|
$
|
588.9
|
|
0.9x
|
NM
|
|
NM
|
|
||||||||||
|
Total Fully Invested Funds
|
$
|
5,408.7
|
|
$
|
7,324.3
|
|
1.4x
|
12
|
%
|
7
|
%
|
||||||||||
|
Funds in the Investment Period (7)
|
|||||||||||||||||||||
|
CSP IV
|
3/2016
|
$
|
2,500.0
|
|
$
|
477.8
|
|
$
|
568.0
|
|
1.2x
|
NM
|
|
NM
|
|
||||||
|
CEMOF II
|
2/2015
|
$
|
2,819.2
|
|
$
|
203.0
|
|
$
|
226.1
|
|
1.1x
|
NM
|
|
NM
|
|
||||||
|
All Other Funds
|
$
|
27.5
|
|
$
|
28.5
|
|
1.0x
|
NM
|
|
NM
|
|
||||||||||
|
Total Funds in the Investment Period
|
$
|
708.3
|
|
$
|
822.6
|
|
1.2x
|
NM
|
|
NM
|
|
||||||||||
|
TOTAL Global Market Strategies
|
$
|
6,117.0
|
|
$
|
8,146.9
|
|
1.3x
|
13
|
%
|
7
|
%
|
||||||||||
|
(1)
|
The data presented herein that provides “inception to date” performance results of our segments relates to the period following the formation of the first fund within each segment. For our Global Market Strategies segment our first carry fund was formed in 2004.
|
|
(2)
|
Represents the original cost of investments net of investment level recallable proceeds which is adjusted to reflect recyclability of invested capital for the purpose of calculating the fund MOIC.
|
|
(3)
|
Represents all realized proceeds combined with remaining fair value, before management fees, expenses and carried interest.
|
|
(4)
|
Multiple of invested capital (“MOIC”) represents total fair value, before management fees, expenses and carried interest, divided by cumulative invested capital.
|
|
(5)
|
Gross Internal Rate of Return (“Gross IRR”) represents the annualized IRR for the period indicated on Limited Partner invested capital based on contributions, distributions and unrealized value before management fees, expenses and carried interest.
|
|
(6)
|
Net Internal Rate of Return (“Net IRR”) represents the annualized IRR for the period indicated on Limited Partner invested capital based on contributions, distributions and unrealized value after management fees, expenses and carried interest.
|
|
(7)
|
Fully Invested funds are past the expiration date of the investment period as defined in the respective limited partnership agreement. In instances where a successor fund has had its first capital call, the predecessor fund is categorized as fully invested.
|
|
(8)
|
Aggregate includes the following funds: CMP I, CMP II, CSP I, and CASCOF.
|
|
(9)
|
Includes coinvestments and certain other stand-alone investments arranged by us.
|
|
(10)
|
For funds marked “NM,” IRR may be positive or negative, but is not considered meaningful because of the limited time since initial investment and early stage of capital deployment. For funds marked “Neg,” IRR is negative as of reporting period end.
|
129
|
Remaining
Fair Value(1) |
Unrealized
MOIC(2) |
Total
MOIC(3) |
%
Invested(4) |
In Accrued
Carry/ (Clawback) (5) |
LTM
Realized Carry (6) |
Catch-up
Rate |
Fee
Initiation Date(7) |
Quarters
Since Fee Initiation |
Original
Investment Period End Date |
||||||||||||||
|
|
As of June 30, 2017
|
|
|
|
|
||||||||||||||||||
|
Global Market Strategies
|
(Reported in Local Currency, in Millions)
|
|
|
|
|
||||||||||||||||||
|
CEMOF I
|
$
|
728.9
|
|
0.6x
|
0.9x
|
90
|
%
|
|
|
100
|
%
|
Dec-10
|
27
|
Dec-15
|
|||||||||
|
CSP III
|
$
|
522.6
|
|
1.4x
|
1.6x
|
105
|
%
|
X
|
X
|
80
|
%
|
Dec-11
|
23
|
Aug-15
|
|||||||||
|
CSP IV
|
$
|
282.6
|
|
1.2x
|
1.2x
|
19
|
%
|
X
|
|
100
|
%
|
Feb-17
|
2
|
Jun-20
|
|||||||||
|
CEMOF II
|
$
|
207.7
|
|
1.0x
|
1.1x
|
7
|
%
|
|
|
100
|
%
|
Dec-15
|
7
|
Feb-20
|
|||||||||
|
CSP II
|
$
|
159.2
|
|
0.9x
|
1.8x
|
100
|
%
|
X
|
|
80
|
%
|
Dec-07
|
39
|
Jun-11
|
|||||||||
|
All Other Funds (8)
|
$
|
203.4
|
|
0.8x
|
1.4x
|
NM
|
NM
|
||||||||||||||||
|
Coinvestment and Other (9)
|
$
|
481.9
|
|
0.7x
|
0.9x
|
NM
|
NM
|
||||||||||||||||
|
Total Global Market Strategies
|
$
|
2,586.3
|
|
0.8x
|
1.3x
|
|
|
||||||||||||||||
|
(1)
|
Net asset value of our carry funds. Reflects significant funds with remaining fair value of greater than $100 million.
|
|
(2)
|
Unrealized multiple of invested capital (“MOIC”) represents remaining fair market value, before management fees, expenses and carried interest, divided by remaining investment cost.
|
|
(3)
|
Total MOIC represents total fair value (realized proceeds combined with remaining fair value), before management fees, expenses and carried interest, divided by cumulative invested capital. For certain funds, represents the original cost of investments net of investment-level recallable proceeds, which is adjusted to reflect recyclability of invested capital for the purpose of calculating the fund MOIC.
|
|
(4)
|
Represents cumulative equity invested as of the reporting period divided by total commitments. Amount can be greater than 100% due to the re-investment of recallable distributions to fund investors.
|
|
(5)
|
Fund has a net accrued performance fee balance/(giveback obligation) as of the current quarter end, driven by a significant portion of the fund’s asset base.
|
|
(6)
|
Fund has generated realized net performance fees/(realized giveback) in the last twelve months.
|
|
(7)
|
Represents the date of the first capital contribution for management fees.
|
|
(8)
|
Aggregate includes the following funds: CSP I, CMP I, CMP II, CSC, and CASCOF. In Accrued Carry/(Clawback) and LTM Realized Carry not indicated because the indicator does not apply to each fund within the aggregate.
|
|
(9)
|
Includes co-investments, prefund investments and certain other stand-alone investments arranged by us. In Accrued Carry/(Clawback) and LTM Realized Carry not indicated because the indicator does not apply to each fund within the aggregate.
|
130
Investment Solutions
In February 2016, we decided to restructure our Investment Solutions segment to focus on private market secondaries, primary investments, co-investment and managed account activities and, given the challenging market environment, discontinue our fund of hedge funds and liquid alternative initiatives. As a result, the Partnership has substantially wound down the operations of DGAM.
The following table presents our results of operations for our Investment Solutions segment:
|
|
Three Months Ended June 30,
|
Six Months Ended June 30,
|
|||||||||||||
|
|
2017
|
2016
|
2017
|
2016
|
|||||||||||
|
|
(Dollars in millions)
|
||||||||||||||
|
Segment Revenues
|
|||||||||||||||
|
Fund level fee revenues
|
|||||||||||||||
|
Fund management fees
|
$
|
36.2
|
|
$
|
34.2
|
|
$
|
72.0
|
|
$
|
70.6
|
|
|||
|
Portfolio advisory fees, net
|
—
|
|
—
|
|
—
|
|
—
|
|
|||||||
|
Transaction fees, net
|
—
|
|
—
|
|
—
|
|
—
|
|
|||||||
|
Total fund level fee revenues
|
36.2
|
|
34.2
|
|
72.0
|
|
70.6
|
|
|||||||
|
Performance fees
|
|||||||||||||||
|
Realized
|
23.7
|
|
4.2
|
|
36.3
|
|
6.4
|
|
|||||||
|
Unrealized
|
4.7
|
|
15.0
|
|
27.9
|
|
26.7
|
|
|||||||
|
Total performance fees
|
28.4
|
|
19.2
|
|
64.2
|
|
33.1
|
|
|||||||
|
Investment income (loss)
|
|||||||||||||||
|
Realized
|
(0.1
|
)
|
—
|
|
—
|
|
—
|
|
|||||||
|
Unrealized
|
0.4
|
|
—
|
|
1.5
|
|
(1.0
|
)
|
|||||||
|
Total investment income (loss)
|
0.3
|
|
—
|
|
1.5
|
|
(1.0
|
)
|
|||||||
|
Interest
|
0.2
|
|
0.1
|
|
0.3
|
|
0.2
|
|
|||||||
|
Other income
|
0.1
|
|
0.1
|
|
0.2
|
|
0.2
|
|
|||||||
|
Total revenues
|
65.2
|
|
53.6
|
|
138.2
|
|
103.1
|
|
|||||||
|
Segment Expenses
|
|||||||||||||||
|
Compensation and benefits
|
|||||||||||||||
|
Direct base compensation
|
16.1
|
|
15.0
|
|
32.2
|
|
33.6
|
|
|||||||
|
Indirect base compensation
|
4.1
|
|
3.1
|
|
6.9
|
|
5.9
|
|
|||||||
|
Equity-based compensation
|
2.1
|
|
1.1
|
|
4.1
|
|
3.5
|
|
|||||||
|
Performance fee related
|
|||||||||||||||
|
Realized
|
23.4
|
|
3.7
|
|
35.5
|
|
5.4
|
|
|||||||
|
Unrealized
|
1.4
|
|
11.2
|
|
20.4
|
|
23.0
|
|
|||||||
|
Total compensation and benefits
|
47.1
|
|
34.1
|
|
99.1
|
|
71.4
|
|
|||||||
|
General, administrative, and other indirect expenses
|
8.7
|
|
7.9
|
|
15.5
|
|
17.3
|
|
|||||||
|
Depreciation and amortization expense
|
0.9
|
|
0.8
|
|
1.7
|
|
1.7
|
|
|||||||
|
Interest expense
|
1.5
|
|
1.4
|
|
3.0
|
|
3.0
|
|
|||||||
|
Total expenses
|
58.2
|
|
44.2
|
|
119.3
|
|
93.4
|
|
|||||||
|
Economic Net Income
|
$
|
7.0
|
|
$
|
9.4
|
|
$
|
18.9
|
|
$
|
9.7
|
|
|||
|
(-) Net Performance Fees
|
3.6
|
|
4.3
|
|
8.3
|
|
4.7
|
|
|||||||
|
(-) Investment Income (Loss)
|
0.3
|
|
—
|
|
1.5
|
|
(1.0
|
)
|
|||||||
|
(+) Equity-based Compensation
|
2.1
|
|
1.1
|
|
4.1
|
|
3.5
|
|
|||||||
|
(=) Fee Related Earnings
|
$
|
5.2
|
|
$
|
6.2
|
|
$
|
13.2
|
|
$
|
9.5
|
|
|||
|
(+) Realized Net Performance Fees
|
0.3
|
|
0.5
|
|
0.8
|
|
1.0
|
|
|||||||
|
(+) Realized Investment Loss
|
(0.1
|
)
|
—
|
|
—
|
|
—
|
|
|||||||
|
(=) Distributable Earnings
|
$
|
5.4
|
|
$
|
6.7
|
|
$
|
14.0
|
|
$
|
10.5
|
|
|||
131
Three Months Ended June 30, 2017
Compared to the
Three Months Ended June 30, 2016
and
Six Months Ended June 30, 2017
Compared to the
Six Months Ended June 30, 2016
Distributable Earnings
Distributable earnings
decreased
$1.3 million
for the
three months ended June 30, 2017
as compared to the
three months ended June 30, 2016
and
increased
$3.5 million
for the
six months ended June 30, 2017
as compared to the
six months ended June 30, 2016
. The following table provides the components of the changes in distributable earnings for the
three months and six months ended June 30, 2017
:
|
Three Months Ended
June 30, |
Six Months Ended
June 30, |
|||||
|
(Dollars in Millions)
|
||||||
|
Distributable earnings, June 30, 2016
|
$
|
6.7
|
|
$
|
10.5
|
|
|
Increases (decreases):
|
||||||
|
Decrease in realized net performance fees
|
(0.2
|
)
|
(0.2
|
)
|
||
|
Decrease in realized investment income
|
(0.1
|
)
|
—
|
|
||
|
(Decrease) increase in fee related earnings
|
(1.0
|
)
|
3.7
|
|
||
|
Total (decrease) increase
|
(1.3
|
)
|
3.5
|
|
||
|
Distributable earnings, June 30, 2017
|
$
|
5.4
|
|
$
|
14.0
|
|
Fee Related Earnings
Fee related earnings
decreased
$1.0 million
for the
three months ended June 30, 2017
as compared to the
three months ended June 30, 2016
and
increased
$3.7 million
for the
six months ended June 30, 2017
as compared to the
six months ended June 30, 2016
. The following table provides the components of the changes in fee related earnings for the
three months and six months ended June 30, 2017
:
|
Three Months Ended
June 30, |
Six Months Ended
June 30, |
|||||
|
(Dollars in Millions)
|
||||||
|
Fee related earnings, June 30, 2016
|
$
|
6.2
|
|
$
|
9.5
|
|
|
Increases (decreases):
|
||||||
|
Increase in fee revenues
|
2.0
|
|
1.4
|
|
||
|
(Increase) decrease in direct and indirect base compensation
|
(2.1
|
)
|
0.4
|
|
||
|
(Increase) decrease in general, administrative and other indirect expenses
|
(0.8
|
)
|
1.8
|
|
||
|
All other changes
|
(0.1
|
)
|
0.1
|
|
||
|
Total (decrease) increase
|
(1.0
|
)
|
3.7
|
|
||
|
Fee related earnings, June 30, 2017
|
$
|
5.2
|
|
$
|
13.2
|
|
Fee Revenues.
Total fee revenues
increased
$2.0 million
for the
three months ended June 30, 2017
as compared to the
three months ended June 30, 2016
and
increased
$1.4 million
for the
six months ended June 30, 2017
as compared to the
six months ended June 30, 2016
, primarily due to increased management fees from our private equity fund vehicles as a result of closings of new fund vehicles, including $1.2 million of catch-up management fees in the the
six months ended June 30, 2017
. This increase is partially offset by the wind down of DGAM and the related redemptions from its fund of hedge funds, which decreased our fee revenues by $1.7 million and $4.9 million for the
three months and six months ended June 30, 2017
, respectively, as compared to the
three months and six months ended June 30, 2016
.
Direct and indirect base compensation expense.
Direct and indirect base compensation expense
increased
$2.1 million
for the
three months ended June 30, 2017
as compared to the
three months ended June 30, 2016
, primarily due to increased compensation associated with fundraising activities, partially offset by lower headcount.
Direct and indirect base compensation expense
decreased
$0.4 million
for the
six months ended June 30, 2017
as compared to the
six months ended June 30, 2016
, primarily due to lower headcount. This decrease was partially offset by increased compensation associated with fundraising activities.
132
General, administrative and other indirect expenses.
General, administrative and other indirect expenses
increased
$0.8 million
for the
three months ended June 30, 2017
as compared to the
three months ended June 30, 2016
, primarily due to negative foreign currency adjustments and increased external costs associated with fundraising activities. These increases were partially offset by lower professional fees.
General, administrative and other indirect expenses
decreased
$1.8 million
for the
six months ended June 30, 2017
as compared to the
six months ended June 30, 2016
, primarily due to lower professional fees and real estate costs. These decreases were partially offset by negative foreign currency adjustments and increased external costs associated with fundraising activities.
Economic Net Income
Economic net income
decreased
$2.4 million
for the
three months ended June 30, 2017
as compared to the
three months ended June 30, 2016
and
increased
$9.2 million
for the
six months ended June 30, 2017
as compared to the
six months ended June 30, 2016
. The following table provides the components of the changes in economic net income for the
three months and six months ended June 30, 2017
:
|
Three Months Ended
June 30, |
Six Months Ended
June 30, |
|||||
|
(Dollars in Millions)
|
||||||
|
Economic net income, June 30, 2016
|
$
|
9.4
|
|
$
|
9.7
|
|
|
Increases (decreases):
|
||||||
|
(Decrease) increase in net performance fees
|
(0.7
|
)
|
3.6
|
|
||
|
Increase in investment income
|
0.3
|
|
2.5
|
|
||
|
Increase in equity-based compensation
|
(1.0
|
)
|
(0.6
|
)
|
||
|
(Decrease) increase in fee related earnings
|
(1.0
|
)
|
3.7
|
|
||
|
Total (decrease) increase
|
(2.4
|
)
|
9.2
|
|
||
|
Economic net income, June 30, 2017
|
$
|
7.0
|
|
$
|
18.9
|
|
Performance Fees.
Performance fees (realized and unrealized) for the
three months and six months ended June 30, 2017
and
2016
are from the following types of funds:
|
Performance Fees
|
|||||||||||||||
|
|
Three Months Ended June 30,
|
Six Months Ended June 30,
|
|||||||||||||
|
|
2017
|
2016
|
2017
|
2016
|
|||||||||||
|
|
(Dollars in millions)
|
||||||||||||||
|
Private equity fund vehicles
|
$
|
27.7
|
|
$
|
20.0
|
|
$
|
62.7
|
|
$
|
33.4
|
|
|||
|
Hedge fund of funds
|
—
|
|
—
|
|
—
|
|
—
|
|
|||||||
|
Real estate fund vehicles
|
0.7
|
|
(0.8
|
)
|
1.5
|
|
(0.3
|
)
|
|||||||
|
Total performance fees
|
$
|
28.4
|
|
$
|
19.2
|
|
$
|
64.2
|
|
$
|
33.1
|
|
|||
Under our arrangements with the historical owners and management team of AlpInvest, we generally do not retain any carried interest with respect to the historical investments and commitments to our AlpInvest fund vehicles that existed as of July 1, 2011 (including any options to increase any such commitments exercised after such date). We are entitled to 15% of the carried interest with respect to commitments from the historical owners of AlpInvest for the period between 2011 and 2020 and 40% of the carried interest in respect of all other commitments (including all future commitments from third parties).
The
increase
in performance fees for the
three months ended June 30, 2017
as compared to the
three months ended June 30, 2016
was primarily due to higher realizations in our carry funds in 2017. Additionally, our carry funds appreciated
1%
in the
three months ended June 30, 2017
(excluding the impact of foreign currency, appreciation was 5% for the
three months ended June 30, 2017
) while appreciating 3% in the
three months ended June 30, 2016
.
The
increase
in performance fees for the
six months ended June 30, 2017
as compared to the
six months ended June 30, 2016
was primarily due to higher realizations in our carry funds in 2017. Overall, our carry funds appreciated
4%
in the
six
133
months ended June 30, 2017
(excluding the impact of foreign currency, appreciation was 9% for the
six months ended June 30, 2017
) while appreciating 3% in the
six months ended June 30, 2016
.
The
$28.4 million
of performance fees for the
three months ended June 30, 2017
was driven primarily by performance fees recognized from the following funds:
•
Partnership Fund (2008) of $3.0 million,
•
ASF V (Onshore) of $2.2 million,
•
Co-investment Fund & Secondaries Fund (2014-2015) of $2.1 million,
•
APG Partnership Fund (2010) of $1.9 million, and
•
APG Partnership Fund (2009) of $1.7 million.
The
$19.2 million
of performance fees for the
three months ended June 30, 2016
was driven primarily by performance fees recognized from the following funds:
•
Co-investment Fund & Secondaries Fund (2012-2013) of $9.8 million,
•
Co-investment Fund & Secondaries Fund (2014-2015) of $4.0 million,
•
Co-investment Fund & Secondaries Fund (2011-2013) of $2.2 million, and
•
Partnership Fund (2013) of $1.9 million.
The
$64.2 million
of performance fees for the
six months ended June 30, 2017
was driven primarily by performance fees recognized from the following funds:
•
Co-investment Fund & Secondaries Fund (2009-2010) of $7.1 million,
•
Co-investment Fund & Secondaries Fund (2014-2015) of $5.8 million,
•
Partnership Fund (2008) of $4.3 million,
•
Co-investment Fund & Secondaries Fund (2012-2013) of $4.0 million, and
•
ASF V (Onshore) of $3.8 million.
The
$33.1 million
of performance fees for the
six months ended June 30, 2016
was driven primarily by performance fees recognized from the following funds:
•
Co-investment Fund & Secondaries Fund (2012-2013) of $9.8 million,
•
Co-investment Fund & Secondaries Fund (2014-2015) of $3.0 million,
•
Co-investment Fund & Secondaries Fund (2009-2010) of $3.0 million, and
•
Co-investment Fund & Secondaries Fund (2011-2013) of $2.2 million.
Performance fees of
$19.2 million
for the
three months ended June 30, 2016
are inclusive of performance fees reversed of approximately $4.6 million. Performance fees of
$33.1 million
for the
six months ended June 30, 2016
are inclusive of performance fees reversed of approximately $1.9 million. There were no significant performance fees reversed for the
three months and six months ended June 30, 2017
.
The appreciation in remaining value of our Investment Solutions carry funds for this segment are as follows:
|
Three Months Ended
June 30, |
Six Months Ended
June 30, |
||||
|
2017
|
2016
|
2017
|
2016
|
||
|
Carry funds
|
1%
|
3%
|
4%
|
3%
|
|
Note: The appreciation presented is a weighted average blend of the remaining investments in the respective carry funds within Investment Solutions. These carry funds include private equity and real estate investments in primary fund, co-investment and secondary strategies, which have different return profiles.
Net performance fees for the
three months ended June 30, 2017
were
$3.6 million
, representing
a decrease
of
$0.7 million
from
$4.3 million
in net performance fees for the
three months ended June 30, 2016
. The
decrease
in net performance fees was due to the lower appreciation of the carry funds for the
three months ended June 30, 2017
as compared to the
three months ended June 30, 2016
.
134
Net performance fees for the
six months ended June 30, 2017
were
$8.3 million
, representing
an increase
of
$3.6 million
from
$4.7 million
in net performance fees for the
six months ended June 30, 2016
. The
increase
in net performance fees was due to the higher appreciation of the carry funds for the
six months ended June 30, 2017
as compared to the
six months ended June 30, 2016
.
Equity-based Compensation.
Equity-based compensation was
$2.1 million
for the
three months ended June 30, 2017
,
an increase
of
$1.0 million
from
$1.1 million
for the
three months ended June 30, 2016
.
Equity-based compensation was
$4.1 million
for the
six months ended June 30, 2017
,
an increase
of
$0.6 million
from
$3.5 million
for the
six months ended June 30, 2016
.
Fee-earning AUM as of and for the
Three and Six
Months Ended
June 30, 2017
and
2016
Fee-earning AUM is presented below for each period together with the components of change during each respective period.
|
|
As of June 30,
|
||||||
|
|
2017
|
2016
|
|||||
|
Investment Solutions
|
(Dollars in millions)
|
||||||
|
Components of Fee-earning AUM (1)
|
|||||||
|
Fee-earning AUM based on capital commitments
|
$
|
9,319
|
|
$
|
7,410
|
|
|
|
Fee-earning AUM based on invested capital (2)
|
1,199
|
|
1,271
|
|
|||
|
Fee-earning AUM based on net asset value
|
783
|
|
816
|
|
|||
|
Fee-earning AUM based on lower of cost or fair market value
|
17,167
|
|
17,730
|
|
|||
|
Total Fee-earning AUM
|
$
|
28,468
|
|
$
|
27,227
|
|
|
|
(1)
|
For additional information concerning the components of Fee-earning AUM, see “—Fee-earning Assets under Management.”
|
|
(2)
|
Includes amounts committed to or reserved for certain AlpInvest and Metropolitan carry funds.
|
The table below provides the period to period rollforward of Fee-earning AUM.
|
|
Three Months Ended June 30,
|
Six Months Ended June 30,
|
|||||||||||||
|
|
2017
|
2016
|
2017
|
2016
|
|||||||||||
|
Investment Solutions
|
(Dollars in millions)
|
(Dollars in millions)
|
|||||||||||||
|
Fee-earning AUM Rollforward
|
|||||||||||||||
|
Balance, Beginning of Period
|
$
|
26,428
|
|
$
|
30,181
|
|
$
|
27,054
|
|
$
|
28,191
|
|
|||
|
Inflows, including Fee-paying Commitments (1)
|
1,931
|
|
793
|
|
2,932
|
|
2,580
|
|
|||||||
|
Outflows, including Distributions (2)
|
(1,078
|
)
|
(2,174
|
)
|
(3,045
|
)
|
(2,674
|
)
|
|||||||
|
Subscriptions, net of Redemptions (3)
|
—
|
|
(736
|
)
|
—
|
|
(1,002
|
)
|
|||||||
|
Market Appreciation/(Depreciation) (4)
|
(191
|
)
|
(179
|
)
|
(172
|
)
|
(322
|
)
|
|||||||
|
Foreign Exchange and other (5)
|
1,378
|
|
(658
|
)
|
1,699
|
|
454
|
|
|||||||
|
Balance, End of Period
|
$
|
28,468
|
|
$
|
27,227
|
|
$
|
28,468
|
|
$
|
27,227
|
|
|||
|
(1)
|
Inflows represent mandates where commitment fee period was activated and capital invested by carry fund vehicles outside the commitment fee period or weighted-average investment period.
|
|
(2)
|
Outflows represent distributions from carry fund vehicles outside the commitment fee period or weighted-average investment period and changes in fee basis for carry fund vehicles where the commitment fee period or weighted-average investment period has expired.
|
|
(3)
|
Represents subscriptions and redemptions in our fund of hedge funds vehicles.
|
|
(4)
|
Market Appreciation/(Depreciation) represents changes in the net asset value of our fund of hedge funds vehicles and realized and unrealized gains (losses) on our carry fund vehicles based on the lower of cost or fair value.
|
|
(5)
|
Represents the impact of foreign exchange rate fluctuations on the translation of our non-U.S. dollar denominated funds. Activity during the period is translated at the average rate for the period. Ending balances are translated at the spot rate as of the period end.
|
135
Fee-earning AUM was
$28.5 billion
at
June 30, 2017
, an increase of
$2.1 billion
, or approximately
8%
, compared to
$26.4 billion
at
March 31, 2017
. This was driven by inflows, including fee-paying commitments of
$1.9 billion
, due to activation of previously raised mandates in our AlpInvest vehicles, and foreign exchange gains of
$1.4 billion
from translating our euro-denominated AlpInvest Fee-earning AUM to USD. Partially offsetting this increase were outflows, including distributions, of
$1.1 billion
which were primarily attributable to our AlpInvest carry funds. Distributions from funds still in the commitment or weighted-average investment period do not impact Fee-earning AUM as these funds are based on commitments and not invested capital. Increases in fair value have an impact on Fee-earning AUM for Investment Solutions as fully committed funds are based on the lower of cost or fair value of the underlying investments.
Fee-earning AUM was
$28.5 billion
at
June 30, 2017
, an increase of
$1.4 billion
, or approximately
5%
, compared to
$27.1 billion
at
December 31, 2016
. The increase was driven by inflows, including fee-paying commitments, of
$2.9 billion
due to activation of previously raised mandates in our AlpInvest vehicles, and foreign exchange gains of
$1.7 billion
from translating our euro-denominated AlpInvest Fee-earning AUM to USD. This was partially offset by outflows, including distributions, of
$3.0 billion
primarily in our AlpInvest carry funds.
Fee-earning AUM was
$28.5 billion
at
June 30, 2017
, a decrease of
$1.3 billion
, or approximately
5%
, compared to
$27.2 billion
at
June 30, 2016
. The increase was driven by inflows, including fee-paying commitments, of
$7.6 billion
due to activation of previously raised mandates in our AlpInvest vehicles, market appreciation of
$0.7 billion
in funds outside the investment period, and foreign exchange gains of
$0.6 billion
from translating our euro-denominated AlpInvest Fee-earning AUM to USD. This was largely offset by outflows, including distributions, of
$6.5 billion
primarily in our AlpInvest carry funds and net subscriptions of
$1.2 billion
in our previously held DGAM fund of funds vehicles.
Fee-earning AUM was $27.2 billion at June 30, 2016, a decrease of $3.0 billion, or approximately 10%, compared to $30.2 billion at March 31, 2016. This was driven by outflows of $2.2 billion, primarily in our AlpInvest fund of funds vehicles, net redemptions in our DGAM fund of hedge funds vehicles of $0.7 billion, and foreign exchange loss of $0.7 billion in our Euro-denominated AlpInvest fund of funds vehicles. This was partially offset by inflows of $0.8 billion, due to activation of previously raised mandates in our AlpInvest vehicles.
Fee-earning AUM was $27.2 billion at June 30, 2016, a decrease of $1.0 billion, or approximately 4%, compared to $28.2 billion at December 31, 2015. This was driven by outflows of $2.7 billion, primarily in our AlpInvest fund of funds vehicles, net redemptions in our DGAM fund of hedge funds vehicles of $1.0 billion, and market depreciation of $0.3 billion primarily in our AlpInvest fund of funds vehicles. This was partially offset by inflows of $2.6 billion, due to activation of previously raised mandates in our AlpInvest vehicles.
Total AUM as of and for the
Three and Six
Months Ended
June 30, 2017
The table below provides the period to period rollforwards of Available Capital and Fair Value of Capital, and the resulting rollforward of Total AUM.
|
|
Three Months Ended June 30, 2017
|
Six Months Ended June 30, 2017
|
|||||||||||||||||||||
|
|
Available
Capital |
Fair Value
of Capital |
Total
AUM |
Available
Capital |
Fair Value
of Capital |
Total
AUM |
|||||||||||||||||
|
|
(Dollars in millions)
|
(Dollars in millions)
|
|||||||||||||||||||||
|
Investment Solutions
|
|||||||||||||||||||||||
|
Balance, Beginning of Period
|
$
|
14,876
|
|
$
|
29,096
|
|
$
|
43,972
|
|
$
|
14,294
|
|
$
|
28,798
|
|
$
|
43,092
|
|
|||||
|
Commitments (1)
|
1,538
|
|
—
|
|
1,538
|
|
2,881
|
|
—
|
|
2,881
|
|
|||||||||||
|
Capital Called, net (2)
|
(1,014
|
)
|
940
|
|
(74
|
)
|
(1,890
|
)
|
1,747
|
|
(143
|
)
|
|||||||||||
|
Distributions (3)
|
53
|
|
(2,389
|
)
|
(2,336
|
)
|
96
|
|
(4,376
|
)
|
(4,280
|
)
|
|||||||||||
|
Market Appreciation/(Depreciation) (4)
|
—
|
|
415
|
|
415
|
|
—
|
|
1,456
|
|
1,456
|
|
|||||||||||
|
Foreign Exchange and other (5)
|
311
|
|
1,840
|
|
2,151
|
|
383
|
|
2,277
|
|
2,660
|
|
|||||||||||
|
Balance, End of Period
|
$
|
15,764
|
|
$
|
29,902
|
|
$
|
45,666
|
|
$
|
15,764
|
|
$
|
29,902
|
|
$
|
45,666
|
|
|||||
|
(1)
|
Represents capital raised by our carry fund vehicles, including activation of new mandates, net of expired available capital.
|
|
(2)
|
Represents capital called by our carry fund vehicles, net of fund fees and expenses.
|
|
(3)
|
Represents distributions from our carry fund vehicles, net of amounts recycled.
|
136
|
(4)
|
Market Appreciation/(Depreciation) represents changes in the net asset value of our fund of hedge funds vehicles and realized and unrealized gains (losses) on fund investments, secondary investments, co-investments, and real estate fund vehicles. Fair market values for carry fund vehicles are based on the latest available valuations of the underlying limited partnership interests (in most cases as of
March 31, 2017
) as provided by their general partners, plus the net cash flows since the latest valuation, up to
June 30, 2017
.
|
|
(5)
|
Represents the impact of foreign exchange rate fluctuations on the translation of our non-U.S. dollar denominated funds. Activity during the period is translated at the average rate for the period. Ending balances are translated at the spot rate as of the period end.
|
Total AUM was
$45.7 billion
at
June 30, 2017
, an increase of
$1.7 billion
or approximately
4%
, compared to
$44.0 billion
at
March 31, 2017
. This increase was driven by
$2.2 billion
of foreign exchange gains resulting from the translation of our Euro-denominated AlpInvest AUM to USD, as well as
$1.5 billion
of new commitments raised primarily in our AlpInvest carry funds. This was partially offset by
$2.4 billion
of distributions, primarily in our AlpInvest carry funds, of which
$0.1 billion
were recallable.
Total AUM was
$45.7 billion
at
June 30, 2017
, an increase of
$2.6 billion
or approximately
6%
, compared to
$43.1 billion
at
December 31, 2016
. This increase was driven by
$2.9 billion
of new commitments raised primarily in our AlpInvest carry funds, as well as
$2.7 billion
of foreign exchange gains resulting from the translation of our Euro-denominated AlpInvest AUM to USD. This was partially offset by
$4.4 billion
of distributions, primarily in our AlpInvest carry funds, of which
$0.1 billion
were recallable.
Fund Performance Metrics
Fund performance information for our AlpInvest funds that have at least $1.0 billion in capital commitments, cumulative equity invested or total value as of
June 30, 2017
, which we refer to as our “significant funds” is included throughout this discussion and analysis to facilitate an understanding of our results of operations for the periods presented. The fund return information reflected in this discussion and analysis is not indicative of the performance of The Carlyle Group L.P. and is also not necessarily indicative of the future performance of any particular fund. An investment in The Carlyle Group L.P. is not an investment in any of our funds. There can be no assurance that any of our funds or our other existing and future funds will achieve similar returns.
137
The following tables reflect the performance of our significant funds in our Investment Solutions business.
|
|
|
|
TOTAL INVESTMENTS
|
||||||||||||||||||
|
|
|
|
As of June 30, 2017
|
||||||||||||||||||
|
|
Vintage
Year |
Fund Size
|
Cumulative
Invested Capital (2)(8) |
Total Fair
Value (3)(8) |
MOIC (4)
|
Gross
IRR
(6)(10)
|
Net IRR(7)(10)
|
||||||||||||||
|
Investment Solutions (1)
|
(Reported in Local Currency, in Millions)
|
||||||||||||||||||||
|
Fully Committed Funds (5)
|
|||||||||||||||||||||
|
Main Fund I - Fund Investments
|
2000
|
€
|
5,174.6
|
|
€
|
4,294.6
|
|
€
|
7,059.7
|
|
1.6x
|
12
|
%
|
11
|
%
|
||||||
|
Main Fund II - Fund Investments
|
2003
|
€
|
4,545.0
|
|
€
|
4,878.3
|
|
€
|
7,680.0
|
|
1.6x
|
10
|
%
|
9
|
%
|
||||||
|
Main Fund III - Fund Investments
|
2005
|
€
|
11,500.0
|
|
€
|
12,885.6
|
|
€
|
20,300.8
|
|
1.6x
|
10
|
%
|
9
|
%
|
||||||
|
Main Fund IV - Fund Investments
|
2009
|
€
|
4,877.3
|
|
€
|
4,909.2
|
|
€
|
7,462.2
|
|
1.5x
|
16
|
%
|
15
|
%
|
||||||
|
Main Fund V - Fund Investments
|
2012
|
€
|
5,080.0
|
|
€
|
3,377.8
|
|
€
|
4,061.3
|
|
1.2x
|
11
|
%
|
10
|
%
|
||||||
|
Main Fund VI - Fund Investments
|
2015
|
€
|
1,106.4
|
|
€
|
311.0
|
|
€
|
304.7
|
|
1.0x
|
NM
|
|
NM
|
|
||||||
|
Main Fund I - Secondary Investments
|
2002
|
€
|
519.4
|
|
€
|
483.5
|
|
€
|
914.2
|
|
1.9x
|
58
|
%
|
54
|
%
|
||||||
|
Main Fund II - Secondary Investments
|
2003
|
€
|
998.4
|
|
€
|
1,017.7
|
|
€
|
1,857.8
|
|
1.8x
|
27
|
%
|
26
|
%
|
||||||
|
Main Fund III - Secondary Investments
|
2006
|
€
|
2,250.0
|
|
€
|
2,349.6
|
|
€
|
3,526.2
|
|
1.5x
|
10
|
%
|
10
|
%
|
||||||
|
Main Fund IV - Secondary Investments
|
2010
|
€
|
1,859.1
|
|
€
|
1,948.4
|
|
€
|
3,260.5
|
|
1.7x
|
20
|
%
|
19
|
%
|
||||||
|
Main Fund V - Secondary Investments
|
2011
|
€
|
4,272.8
|
|
€
|
3,603.9
|
|
€
|
5,276.1
|
|
1.5x
|
22
|
%
|
20
|
%
|
||||||
|
Main Fund II - Co-Investments
|
2003
|
€
|
1,090.0
|
|
€
|
912.5
|
|
€
|
2,533.9
|
|
2.8x
|
44
|
%
|
42
|
%
|
||||||
|
Main Fund III - Co-Investments
|
2006
|
€
|
2,760.0
|
|
€
|
2,814.4
|
|
€
|
3,888.2
|
|
1.4x
|
5
|
%
|
5
|
%
|
||||||
|
Main Fund IV - Co-Investments
|
2010
|
€
|
1,475.0
|
|
€
|
1,359.8
|
|
€
|
3,526.3
|
|
2.6x
|
24
|
%
|
23
|
%
|
||||||
|
Main Fund V - Co-Investments
|
2012
|
€
|
1,122.2
|
|
€
|
1,036.8
|
|
€
|
2,272.0
|
|
2.2x
|
33
|
%
|
31
|
%
|
||||||
|
Main Fund II - Mezzanine Investments
|
2004
|
€
|
700.0
|
|
€
|
764.4
|
|
€
|
1,043.0
|
|
1.4x
|
7
|
%
|
7
|
%
|
||||||
|
Main Fund III - Mezzanine Investments
|
2006
|
€
|
2,000.0
|
|
€
|
1,968.3
|
|
€
|
2,651.7
|
|
1.3x
|
10
|
%
|
9
|
%
|
||||||
|
All Other Funds (9)
|
Various
|
€
|
1,939.0
|
|
€
|
2,677.6
|
|
1.4x
|
14
|
%
|
11
|
%
|
|||||||||
|
Total Fully Committed Funds
|
€
|
50,854.7
|
|
€
|
80,296.2
|
|
1.6x
|
13
|
%
|
12
|
%
|
||||||||||
|
Funds in the Commitment Period (5)
|
|||||||||||||||||||||
|
Main Fund VI - Secondary Investments
|
2017
|
€
|
4,160.5
|
|
€
|
442.5
|
|
€
|
440.8
|
|
1.0x
|
NM
|
|
NM
|
|
||||||
|
Main Fund VI - Co-Investments
|
2014
|
€
|
1,115.0
|
|
€
|
905.0
|
|
€
|
1,210.3
|
|
1.3x
|
22
|
%
|
19
|
%
|
||||||
|
Main Fund VII - Co-Investments
|
2017
|
€
|
1,375.5
|
|
€
|
38.6
|
|
€
|
38.5
|
|
1.0x
|
NM
|
|
NM
|
|
||||||
|
All Other Funds (9)
|
Various
|
€
|
583.8
|
|
€
|
723.8
|
|
1.2x
|
18
|
%
|
14
|
%
|
|||||||||
|
Total Funds in the Commitment Period
|
€
|
1,970.0
|
|
€
|
2,413.5
|
|
1.2x
|
20
|
%
|
16
|
%
|
||||||||||
|
TOTAL INVESTMENT SOLUTIONS
|
€
|
52,824.7
|
|
€
|
82,709.6
|
|
1.6x
|
13
|
%
|
12
|
%
|
||||||||||
|
TOTAL INVESTMENT SOLUTIONS (USD)(11)
|
$
|
60,288.4
|
|
$
|
94,395.8
|
|
1.6x
|
||||||||||||||
Note: Investment Solutions Fund Performance excludes the impact of Metropolitan Real Estate investment vehicles. As of March 31, 2017, these investment vehicles had a combined fair value of $1.1 billion.
|
(1)
|
Includes private equity and mezzanine primary fund investments, secondary fund investments and co-investments originated by the AlpInvest team. Excluded from the performance information shown are a) investments that were not originated by AlpInvest, and b) Direct Investments, which was spun off from AlpInvest in 2005. As of June 30, 2017, these excluded investments represent $0.3 billion of AUM at AlpInvest.
|
|
(2)
|
Represents the original cost of investments since inception of the fund.
|
|
(3)
|
Represents all realized proceeds combined with remaining fair value, before management fees, expenses and carried interest.
|
|
(4)
|
Multiple of invested capital (“MOIC”) represents total fair value, before management fees, expenses and carried interest, divided by cumulative invested capital.
|
|
(5)
|
Fully Committed funds are past the expiration date of the commitment period as defined in the respective limited partnership agreement.
|
|
(6)
|
Gross Internal Rate of Return (“Gross IRR”) represents the annualized IRR for the period indicated on Limited Partner invested capital based on contributions, distributions and unrealized value before management fees, expenses and carried interest.
|
|
(7)
|
Net Internal Rate of Return (“Net IRR”) represents the annualized IRR for the period indicated on Limited Partner invested capital based on contributions, distributions and unrealized value after management fees, expenses and carried interest.
|
|
(8)
|
To exclude the impact of FX, all foreign currency cash flows have been converted to EUR at the reporting period spot rate.
|
|
(9)
|
Aggregate includes Main Fund VII - Fund Investments, Main Fund VIII - Fund Investments, Main Fund I - Co-Investments, Main Fund I - Mezzanine Investments, Main Fund IV - Mezzanine Investments, Main Fund V - Mezzanine Investments, AlpInvest CleanTech Funds and funds which are not included as part of a main fund.
|
|
(10)
|
For funds marked “NM,” IRR may be positive or negative, but is not considered meaningful because of the limited time since initial investment and early stage of capital deployment. For funds marked “Neg,” IRR is negative as of reporting period end.
|
|
(11)
|
Represents the U.S. dollar equivalent balance translated at the spot rate as of period end.
|
138
Liquidity and Capital Resources
Historical Liquidity and Capital Resources
We have historically required limited capital resources to support the working capital and operating needs of our business. Our management fees have largely covered our operating costs and all realized performance fees, after covering the related compensation, are available for distribution to equityholders. Historically, approximately 95% of all capital commitments to our funds have been provided by our fund investors, with the remaining amount typically funded by our senior Carlyle professionals, advisors and other professionals.
Our Sources of Liquidity
We have multiple sources of liquidity to meet our capital needs, including cash on hand, annual cash flows, accumulated earnings and funds from our senior credit facility, including a term loan facility and a revolving credit facility with $750.0 million available as of
June 30, 2017
. We believe these sources will be sufficient to fund our capital needs for at least the next twelve months. If we determine that market conditions are favorable after taking into account our liquidity requirements, including the amounts available under our senior credit facility, we may seek to issue and sell common units in a registered public offering or a privately negotiated transaction, or we may issue additional senior notes, other debt or preferred equity.
Cash and cash equivalents.
Cash and cash equivalents were approximately
$0.8 billion
at
June 30, 2017
. However, a portion of this cash is allocated for specific business purposes, including, but not limited to, (i) performance fee-related cash that has been received but not yet distributed as performance fee-related compensation and amounts owed to non-controlling interests; (ii) proceeds received from realized investments that are allocable to non-controlling interests; and (iii) regulatory capital.
Corporate Treasury Investments.
Corporate treasury investments were approximately
$115.4 million
at
June 30, 2017
. These investments represent investments in U.S. Treasury and government agency obligations, commercial paper, certificates of deposit, other investment grade securities and other investments with original maturities of greater than three months when purchased.
After deducting cash amounts allocated to specific requirements mentioned above, the remaining cash and cash equivalents, including corporate treasury investments, is approximately $787 million as of
June 30, 2017
. This remaining amount will be used towards our primary liquidity needs, as outlined in the next section. This amount does not take into consideration ordinary course of business payables and reserves for specific business purposes.
Senior Credit Facility.
The senior credit facility includes $25.0 million in a term loan and $750.0 million in a revolving credit facility. The term loan and revolving credit facility mature on May 5, 2020. Principal amounts outstanding under the amended term loan and revolving credit facility accrue interest, at the option of the borrowers, either (a) at an alternate base rate plus an applicable margin not to exceed 0.75%, or (b) at LIBOR plus an applicable margin not to exceed 1.75% (
2.18%
at
June 30, 2017
).
The senior credit facility is unsecured. We are required to maintain management fee earning assets (as defined in the amended senior credit facility) of at least $65.3 billion and a total leverage ratio of less than 3.0 to 1.0, in each case, tested on a quarterly basis. Non-compliance with any of the financial or non-financial covenants without cure or waiver would constitute an event of default under the senior credit facility. An event of default resulting from a breach of certain financial or non-financial covenants may result, at the option of the lenders, in an acceleration of the principal and interest outstanding, and a termination of the revolving credit facility. The senior credit facility also contains other customary events of default, including defaults based on events of bankruptcy and insolvency, nonpayment of principal, interest or fees when due, breach of specified covenants, change in control and material inaccuracy of representations and warranties.
Our balance sheet at
June 30, 2017
reflects $25.0 million outstanding under our senior credit facility, comprised of $25.0 million of term loan balance outstanding. On April 6, 2017, we borrowed $250 million under the revolving credit facility of our senior credit facility. This amount was repaid in full on June 2, 2017.
139
CLO Term Loans.
For certain of our CLOs, the Partnership finances a portion of its investment in the CLOs through the proceeds received from term loans with financial institutions. The Partnership's outstanding CLO term loans consist of the following (Dollars in millions):
|
Formation Date
|
Borrowing
Outstanding June 30, 2017 |
Borrowing
Outstanding December 31, 2016 |
Maturity Date
(2)
|
Interest Rate as of
June 30, 2017 |
|||||||||||
|
October 3, 2013
|
$
|
14.4
|
|
(1)
|
$
|
13.2
|
|
(1)
|
September 28, 2018
|
1.75%
|
(3)
|
||||
|
June 7, 2016
|
20.6
|
|
20.6
|
|
July 15, 2027
|
2.96%
|
(4)
|
||||||||
|
April 19, 2017
|
22.8
|
|
—
|
|
April 22, 2031
|
3.09%
|
(5)
|
||||||||
|
June 28, 2017
|
23.2
|
|
—
|
|
July 22, 2031
|
3.25%
|
(6)
|
||||||||
|
February 28, 2017
|
70.5
|
|
—
|
|
September 21, 2029
|
2.33%
|
(7)
|
||||||||
|
$
|
151.5
|
|
$
|
33.8
|
|
||||||||||
(1) Original borrowing amount of
€12.6 million
.
(2) Maturity date is earlier of date indicated or the date that the CLO is dissolved.
(3) Incurs interest at EURIBOR plus
1.75%
.
(4) Incurs interest at the weighted average rate of the underlying senior notes. Interest income on the underlying collateral approximated the amount of interest expense and was not significant for the
three months and six months ended June 30, 2017
and
2016
.
(5) Incurs interest at LIBOR plus
1.932%
. Interest was not significant for the
three months and six months ended June 30, 2017
.
(6) Incurs interest at LIBOR plus
1.923%
. Interest was not significant for the
three months and six months ended June 30, 2017
.
(7) Original borrowing of
€61.8 million
; incurs interest at EURIBOR plus applicable margins as defined in agreement. Interest was not significant for the
three months and six months ended June 30, 2017
.
The CLO term loans are secured by the Partnership's investments in the respective CLO, have a general unsecured interest in the Carlyle entity that manages the CLO, and does not have recourse to any other Carlyle entity.
In January 2017, the Partnership entered into a master credit agreement with a financial institution under which the financial institution expects to provide term loans to the Partnership for the Partnership to purchase eligible interests in CLOs. This master credit agreement is available to the Partnership to purchase up to $100 million of eligible interests in up to five CLOs. This agreement will terminate at the earlier of the last closing of the fifth CLO term loan under this agreement and January 2020. Any term loan to be issued under this master credit agreement will be secured by the Partnership’s investment in the respective CLO as well as any senior management fee and subordinated management fee payable by each CLO. Any term loan will bear interest at LIBOR plus a weighted average spread and an applicable margin. Interest will be due quarterly. As of
June 30, 2017
, the following term loans were outstanding under this master credit agreement
•
$22.8 million
issued on April 19, 2017, due April 22, 2031, with an interest rate of
3.09%
as of
June 30, 2017
.
•
$23.2 million
issued on June 28, 2017, due July 22, 2031, with an interest rate of
3.25%
as of
June 30, 2017
.
European CLO Financing.
On February 28, 2017, a subsidiary of the Partnership entered into a financing agreement with several financial institutions under which these financial institutions provided a
€61.8 million
term loan (
$70.5 million
at
June 30, 2017
) to the Partnership. This term loan is secured by the Partnership’s investments in the retained notes in certain European CLOs that were formed in 2014 and 2015. This term loan will mature on the earlier of September 21, 2029 or the date that the certain European CLO retained notes have been redeemed. The Partnership may prepay the term loan in whole or in part at any time after the third year of the date of issuance without penalty. Prepayment of the term loan within the first three years will incur a penalty based on the prepayment amount. Interest on this term loan accrues at EURIBOR plus applicable margins (
2.33%
at
June 30, 2017
).
3.875% Senior Notes
. In January 2013, Carlyle Holdings Finance L.L.C., an indirect finance subsidiary of the Partnership, issued $500.0 million of 3.875% senior notes due February 1, 2023 at 99.966% of par. Interest is payable semi-annually on February 1 and August 1, beginning August 1, 2013. The notes are unsecured and unsubordinated obligations of Carlyle Holdings Finance L.L.C. and are fully and unconditionally guaranteed, jointly and severally, by The Carlyle Group L.P. and each of the Carlyle Holdings partnerships. The indenture governing the notes contains customary covenants that, among other things, limit Carlyle Holdings Finance L.L.C. and the guarantors’ ability, subject to certain exceptions, to incur indebtedness secured by liens on voting stock or profit participating equity interests of their subsidiaries or merge, consolidate or sell, transfer or lease assets. The notes also contain customary events of default. All or a portion of the notes may be redeemed at our option, in whole or in part, at any time and from time to time, prior to their stated maturity, at the make-whole
140
redemption price set forth in the notes. If a change of control repurchase event occurs, the notes are subject to repurchase at the repurchase price as set forth in the notes.
5.625% Senior Notes.
In March 2013, Carlyle Holdings II Finance L.L.C., an indirect finance subsidiary of the Partnership, issued $400.0 million of 5.625% Senior Notes due March 30, 2043 at 99.583% of par. Interest is payable semi-annually on March 30 and September 30, beginning September 30, 2013. The notes are unsecured and unsubordinated obligations of Carlyle Holdings II Finance L.L.C. and are fully and unconditionally guaranteed, jointly and severally, by The Carlyle Group L.P. and each of the Carlyle Holdings partnerships. The indenture governing the notes contains customary covenants and financial restrictions that, among other things, limit Carlyle Holdings Finance II L.L.C. and the guarantors’ ability, subject to certain exceptions, to incur indebtedness secured by liens on voting stock or profit participating equity interests of their subsidiaries or merge, consolidate or sell, transfer or lease assets. The notes also contain customary events of default. All or a portion of the notes may be redeemed at our option, in whole or in part, at any time and from time to time, prior to their stated maturity, at the make-whole redemption price set forth in the notes. If a change of control repurchase event occurs, the notes are subject to repurchase at the repurchase price as set forth in the notes.
In March 2014, Carlyle Holdings II Finance L.L.C. issued $200.0 million of 5.625% Senior Notes due March 30, 2043 at 104.315% of par. These notes were issued as additional 5.625% Senior Notes due March 30, 2043 and are treated as a single class with the already outstanding $400.0 million aggregate principal amount of these senior notes.
Promissory Notes.
On January 1, 2016, the Partnership issued a $120.0 million promissory note to BNRI as a result of a contingent consideration arrangement entered into in 2012 between the Partnership and BNRI as part of the Partnership's strategic investment in NGP (see Notes 5 and 7 to the unaudited condensed consolidated financial statements). Interest on the promissory note accrues at the three month LIBOR plus 2.50% (
3.80%
at
June 30, 2017
). The Partnership may prepay the promissory note in whole or in part at any time without penalty. The promissory note is scheduled to mature on January 1, 2022. In December 2016, the Partnership repurchased $11.2 million of the promissory note.
Additionally, in June 2017, as part of the settlement with investors in two commodities investment vehicles managed by an affiliate of the Partnership (discussed in Note 10 to the unaudited condensed consolidated financial statements), the Partnership issued a series of promissory notes, aggregating to
$53.9 million
, to the investors of these commodities investment vehicles. Interest on these promissory notes accrues at the three month LIBOR plus
2%
(
3.30%
at
June 30, 2017
). The Partnership may prepay these promissory notes in whole or in part at any time without penalty. These promissory notes are scheduled to mature on July 15, 2019.
Obligations of CLOs.
Loans payable of the Consolidated Funds represent amounts due to holders of debt securities issued by the CLOs. We are not liable for any loans payable of the CLOs. Several of the CLOs issued preferred shares representing the most subordinated interest, however these tranches are mandatorily redeemable upon the maturity dates of the senior secured loans payable, and as a result have been classified as liabilities under U.S. GAAP, and are included in loans payable of Consolidated Funds in our unaudited condensed consolidated balance sheets.
Loans payable of the CLOs are collateralized by the assets held by the CLOs and the assets of one CLO may not be used to satisfy the liabilities of another. This collateral consists of cash and cash equivalents, corporate loans, corporate bonds and other securities.
Loans Payable of a Consolidated Real Estate VIE.
Most of Urbplan’s customer and other receivables and investments have been pledged as collateral for the loans. As of
June 30, 2017
, substantially all of the loans payable of Urbplan are not in compliance with their related debt covenants or are otherwise in technical default. These violations do not cause a default or event of default under the Partnership’s senior credit facility or senior notes. Urbplan management is in discussions with the lenders to cure or re-negotiate the loans in default. Currently there are no outstanding notices of acceleration of payment on the loans in default. All of the loans payable of Urbplan are contractually non-recourse to us.
Realized performance fee revenue.
Another source of liquidity we may use to meet our capital needs is the realized performance fee revenue generated by our investment funds. Carried interest is generally realized when an underlying investment is profitably disposed of and the fund's cumulative returns are in excess of the preferred return. For certain funds, carried interest is realized once all invested capital and expenses have been returned to the fund’s investors and the fund’s cumulative returns are in excess of the preferred return. Incentive fees earned on our CLO vehicles generally are paid upon the dissolution of such vehicles.
141
Our accrued performance fees by segment as of
June 30, 2017
, gross and net of accrued giveback obligations, are set forth below:
|
Asset Class
|
Accrued
Performance
Fees
|
Accrued
Giveback
Obligation
|
Net Accrued
Performance
Fees
|
||||||||
|
|
(Dollars in millions)
|
||||||||||
|
Corporate Private Equity
|
$
|
2,076.5
|
|
$
|
(4.6
|
)
|
$
|
2,071.9
|
|
||
|
Real Assets
|
573.3
|
|
(157.6
|
)
|
415.7
|
|
|||||
|
Global Market Strategies
|
86.3
|
|
—
|
|
86.3
|
|
|||||
|
Investment Solutions
|
628.4
|
|
—
|
|
628.4
|
|
|||||
|
Total
|
$
|
3,364.5
|
|
$
|
(162.2
|
)
|
$
|
3,202.3
|
|
||
|
Plus: Accrued performance fees from NGP
|
100.0
|
|
|||||||||
|
Less: Accrued performance fee-related compensation
|
(1,725.6
|
)
|
|||||||||
|
Plus: Receivable for giveback obligations from current and former employees
|
3.0
|
|
|||||||||
|
Less: Deferred taxes on accrued performance fees
|
(66.3
|
)
|
|||||||||
|
Less: Net accrued performance fees attributable to non-controlling interests in consolidated entities
|
74.9
|
|
|||||||||
|
Net accrued performance fees excluding compensation and non-controlling interests
|
1,588.3
|
|
|||||||||
|
Less/Plus: Timing differences between the period when accrued performance fees are realized and the period they are collected/distributed
|
(24.6
|
)
|
|||||||||
|
Net accrued performance fees attributable to Carlyle Holdings, excluding realized amounts
|
$
|
1,563.7
|
|
||||||||
As of
June 30, 2017
, the net accrued performance fees attributable to Carlyle Holdings, excluding realized amounts, related to our carry funds and our other vehicles by segment were as follows (dollars in millions):
|
Corporate Private Equity:
|
|||
|
Buyout
|
$
|
1,031.6
|
|
|
Growth Capital
|
48.0
|
|
|
|
Total Corporate Private Equity
|
1,079.6
|
|
|
|
Real Assets:
|
|||
|
Real Estate
|
295.8
|
|
|
|
Natural Resources
|
106.7
|
|
|
|
Legacy Energy
|
(17.3
|
)
|
|
|
Total Real Assets
|
385.2
|
|
|
|
Global Market Strategies
|
43.5
|
|
|
|
Investment Solutions
|
55.4
|
|
|
|
Net accrued performance fees attributable to Carlyle Holdings
|
$
|
1,563.7
|
|
Realized investment income.
Another source of liquidity we may use to meet our capital needs is the realized investment income generated by our equity method investments and other principal investments. Investment income is realized when we redeem all or a portion of our investment or when we receive or are due cash income, such as dividends or distributions. Certain of the investments attributable to Carlyle Holdings (excluding certain general partner interests, strategic investments, and investments in certain CLOs) may be sold at our discretion as a source of liquidity.
Our Liquidity Needs
We generally use our working capital and cash flows to invest in growth initiatives, service our debt, fund the working capital needs of our business and investment funds and pay distributions to our unitholders.
In the future, we expect that our primary liquidity needs will be to:
|
•
|
provide capital to facilitate the growth of our existing business lines;
|
|
•
|
provide capital to facilitate our expansion into new, complementary business lines, including acquisitions;
|
142
|
•
|
pay operating expenses, including compensation and compliance costs and other obligations as they arise;
|
|
•
|
fund costs of litigation and contingencies, including related legal costs;
|
|
•
|
fund the capital investments of Carlyle in our funds;
|
|
•
|
fund capital expenditures;
|
|
•
|
repay borrowings and related interest costs and expenses;
|
|
•
|
pay earnouts and contingent cash consideration associated with our acquisitions and strategic investments;
|
|
•
|
pay income taxes;
|
|
•
|
make distributions to our unitholders and the holders of the Carlyle Holdings partnership units in accordance with our distribution policy, and;
|
|
•
|
repurchase our units.
|
Distributions.
With respect to distribution year 2017, the Board of Directors of our general partner has declared a distribution to common unitholders totaling approximately $49.2 million, or $0.52 per common unit, consisting of (i) $0.42 per common unit in respect of the second quarter of 2017, which is payable on August 21, 2017 to common unitholders of record on August 14, 2017, and (ii) $0.10 per common unit in respect of the first quarter of 2017, which was paid in May 2017.
With respect to distribution year 2016, through August 2016, we paid cumulative distributions of approximately $75.0 million to common unitholders, consisting of $0.26 per common unit in respect of the first quarter of 2016, which was paid in May 2016, and $0.63 per common unit in respect of the second quarter of 2016, which was paid in August 2016.
Distributions to common unitholders paid during the
six months ended June 30, 2017
totaled
$22.7 million
, representing the amount paid in February 2017 of $0.16 per common unit in respect of the fourth quarter of 2016 and the amount paid in May 2017 of $0.10 per common unit in respect of the first quarter of 2017. Distributions to common unitholders paid during the
six months ended June 30, 2016
totaled
$45.0 million
, representing the amount paid in March 2016 of $0.29 per common unit in respect of the fourth quarter of 2015 and the amount paid in May 2016 of $0.26 per common unit in respect of the first quarter of 2016.
It is Carlyle’s intention to cause Carlyle Holdings to make quarterly distributions to its partners, including The Carlyle Group L.P.’s wholly owned subsidiaries, that will enable The Carlyle Group L.P. to pay a quarterly distribution of approximately 75% of Distributable Earnings per common unit, net of taxes and amounts payable under the tax receivable agreement, for the quarter. Carlyle’s general partner may adjust the distribution for amounts determined to be necessary or appropriate to provide for the conduct of its business, to make appropriate investments in its business and its funds or to comply with applicable law or any of its financing agreements, or to provide for future cash requirements such as tax-related payments, clawback obligations and distributions to unitholders for any ensuing quarter. The amount to be distributed could also be adjusted upward in any one quarter.
Notwithstanding the foregoing, the declaration and payment of any distributions will be at the sole discretion of our general partner, which may change our distribution policy at any time. Our general partner will take into account general economic and business conditions, our strategic plans and prospects, our business and investment opportunities, our financial condition and operating results, working capital requirements and anticipated cash needs, contractual restrictions and obligations, legal, tax and regulatory restrictions, other constraints on the payment of distributions by us to our common unitholders or by our subsidiaries to us, and such other factors as our general partner may deem relevant.
Because our wholly owned subsidiaries must pay taxes and make payments under the tax receivable agreement, the amounts ultimately distributed by us to our common unitholders are expected to be less, on a per unit basis, than the amounts distributed by the Carlyle Holdings partnerships to the other limited partners of the Carlyle Holdings partnerships in respect of their Carlyle Holdings partnership units.
Fund commitments.
Generally, we intend to have Carlyle commit to fund approximately 1% of the capital commitments to our future carry funds, although we may elect to invest additional amounts in funds focused on new investment areas. We may, from time to time, exercise our right to purchase additional interests in our investment funds that become available in the ordinary course of their operations. We expect our senior Carlyle professionals and employees to continue to make significant capital contributions to our funds based on their existing commitments, and to make capital commitments to future funds
143
consistent with the level of their historical commitments. We also intend to make investments in our open-end funds and our CLO vehicles. Our investments in our U.S. and European CLO vehicles will comply with the risk retention rules as discussed in “Risk Retention Rules” later in this section.
Since our inception through
June 30, 2017
, we and our senior Carlyle professionals, operating executives and other professionals have invested or committed to invest in or alongside our funds. Approximately 5% of all capital commitments to our funds are funded collectively by us and our senior Carlyle professionals, operating executives and other professionals. The current invested capital and unfunded commitment of Carlyle and our senior Carlyle professionals, operating executives and other professionals to our investment funds as of
June 30, 2017
, consisted of the following:
|
Asset Class
|
Current
Equity
Invested
|
Unfunded
Commitment
|
Total Current
Equity Invested
and Unfunded
Commitment
|
||||||||
|
|
(Dollars in millions)
|
||||||||||
|
Corporate Private Equity
|
$
|
2,099.7
|
|
$
|
1,385.6
|
|
$
|
3,485.3
|
|
||
|
Real Assets
|
926.7
|
|
789.4
|
|
1,716.1
|
|
|||||
|
Global Market Strategies
|
917.3
|
|
538.5
|
|
1,455.8
|
|
|||||
|
Investment Solutions
|
46.6
|
|
148.9
|
|
195.5
|
|
|||||
|
Total
|
$
|
3,990.3
|
|
$
|
2,862.4
|
|
$
|
6,852.7
|
|
||
A substantial majority of these investments have been funded by, and a substantial majority of the remaining commitments are expected to be funded by, senior Carlyle professionals, operating executives and other professionals through our internal co-investment program. Of the
$2.9 billion
of unfunded commitments, approximately
$2.5 billion
is subscribed individually by senior Carlyle professionals, operating executives and other professionals, with the balance funded directly by the Partnership.
Investments as of
June 30, 2017
consist of the following (dollars in millions):
|
Investments
|
$
|
1,302.3
|
|
|
Less: Amounts attributable to non-controlling interests in consolidated entities
|
(324.6
|
)
|
|
|
Less: Strategic equity method investments in NGP Management
|
(395.9
|
)
|
|
|
Less: Investment in NGP accrued performance fees
|
(100.0
|
)
|
|
|
Investments excluding non-controlling interests and NGP
|
481.8
|
|
|
|
Plus: investments in Consolidated Funds, eliminated in consolidation
|
195.3
|
|
|
|
Total investments attributable to Carlyle Holdings, exclusive of NGP Management
|
$
|
677.1
|
|
Of the
$677.1 million
of total investments, approximately
$151.5 million
are financed with loans (see
Sources of Liquidity
earlier in this section). The financing of our CLO investments within the last year has caused our total investments to increase at a faster rate than in prior periods. We expect this trend to continue in the near term.
Repurchase Program.
In February 2016, the Board of Directors of the general partner of the Partnership authorized the repurchase of up to $200 million of common units and/or Carlyle Holdings units. Under this unit repurchase program, units may be repurchased from time to time in open market transactions, in privately negotiated transactions or otherwise. We expect that the majority of the repurchases under this program will be done via open market transactions. No units will be repurchased from our executive officers under this program. The timing and actual number of common units and/or Carlyle Holdings units repurchased will depend on a variety of factors, including legal requirements, price, and economic and market conditions. This unit repurchase program may be suspended or discontinued at any time and does not have a specified expiration date. For the
six months ended June 30, 2017
, we have paid an aggregate of $0.2 million to repurchase and retire 14,190 units with all of the repurchases done via open market transactions. Since inception of the program, we have paid an aggregate of $59.1 million to repurchase and retire 3,695,889 units.
144
Cash Flows
The significant captions and amounts from our consolidated statements of cash flows which include the effects of our Consolidated Funds and CLOs in accordance with U.S. GAAP are summarized below.
|
|
Six Months Ended June 30,
|
||||||
|
|
2017
|
2016
|
|||||
|
|
(Dollars in millions)
|
||||||
|
Statements of Cash Flows Data
|
|||||||
|
Net cash provided by operating activities
|
$
|
373.1
|
|
$
|
(394.0
|
)
|
|
|
Net cash used in investing activities
|
(12.9
|
)
|
(2.0
|
)
|
|||
|
Net cash (used in) provided by financing activities
|
(277.0
|
)
|
209.8
|
|
|||
|
Effect of foreign exchange rate changes
|
35.8
|
|
2.0
|
|
|||
|
Net change in cash and cash equivalents
|
$
|
119.0
|
|
$
|
(184.2
|
)
|
|
Net Cash Provided by Operating Activities.
Net cash provided by operating activities was primarily driven by our earnings in the respective periods after adjusting for significant non-cash activity, including non-cash performance fees, the related non-cash performance fee related compensation, non-cash equity-based compensation, and depreciation, amortization and impairments, all of which are included in earnings.
Operating cash inflows primarily include the receipt of management fees and realized performance fees, while operating cash outflows primarily include payments for operating expenses, including compensation and general, administrative, and other expenses. During the
six months ended June 30, 2017 and 2016
, net cash provided by operating activities primarily included the receipt of management fees and realized performance fees, totaling approximately $0.9 billion and $1.1 billion, respectively. These inflows were offset by payments for compensation and general, administrative and other expenses of approximately $0.9 billion and $0.7 billion for the
six months ended June 30, 2017 and 2016
, respectively.
Cash used to purchase investments as well as the proceeds from the sale of such investments are also reflected in our operating activities as investments are a normal part of our operating activities. During the
six months ended June 30, 2017
, investment proceeds were
$306.9 million
while investment purchases were
$204.3 million
. During the
six months ended June 30, 2016
, investment proceeds were
$133.3 million
as compared to purchases of
$162.9 million
.
The net cash provided by operating activities for the
six months ended June 30, 2017 and 2016
also reflects the investment activity of our Consolidated Funds. For the
six months ended June 30, 2017
, purchases of investments by the Consolidated Funds were
$1,514.9 million
, while proceeds from the sales and settlements of investments by the Consolidated Funds were
$1,746.8 million
. For the
six months ended June 30, 2016
, purchases of investments by the Consolidated Funds were
$1,310.5 million
, while proceeds from the sales and settlements of investments by the Consolidated Funds were
$466.6 million
.
Net Cash Provided By (Used In) Investing Activities.
Our investing activities generally reflect cash used for acquisitions, fixed assets and software for internal use, and changes in restricted cash. For the
six months ended June 30, 2017
, cash used in investing activities principally reflects purchases of fixed assets. Purchases of fixed assets were
$16.7 million
and
$8.4 million
for the
six months ended June 30, 2017 and 2016
, respectively.
Net Cash Used in Financing Activities.
Financing activities are a net use of cash in the
six months ended June 30, 2017
and a source of cash in the
six months ended June 30, 2016
.
For the
six months ended June 30, 2017
, the Partnership received net proceeds of
$112.1 million
from the issuance of various CLO term loans. See Note 7 to the unaudited condensed consolidated financial statements for more information on these term loans.
Distributions to our common unitholders were
$22.7 million
and
$45.0 million
for the
six months ended June 30, 2017 and 2016
, respectively. Distributions to the non-controlling interest holders in Carlyle Holdings were
$63.1 million
and
$148.4 million
for the
six months ended June 30, 2017 and 2016
, respectively. The net (payments) borrowings on loans payable by our Consolidated Funds during the
six months ended June 30, 2017 and 2016
were
$(310.4) million
and
$412.3 million
, respectively. Contributions from non-controlling interest holders were
$25.8 million
and
$71.6 million
for the
six months ended June 30, 2017 and 2016
, respectively, which relate primarily to contributions from the non-controlling interest holders in Consolidated Funds. For the
six months ended June 30, 2017 and 2016
, distributions to non-controlling interest holders were
145
$53.0 million
and
$61.3 million
, respectively, which relate primarily to distributions to the non-Carlyle interests in majority-owned subsidiaries.
Our Balance Sheet
Total assets were
$10.9 billion
at
June 30, 2017
, an increase of
$0.9 billion
from
December 31, 2016
. The increase in total assets was primarily attributable to increases in accrued performance fees, investments and cash and cash equivalents of
$883.4 million
,
$195.3 million
and
$119.0 million
, respectively. These increases were partially offset by a decrease in cash and cash equivalents held at Consolidated Funds of
$345.4 million
. Cash and cash equivalents, including corporate treasury investments, were approximately $0.9 billion at both
June 30, 2017
and
December 31, 2016
.
Total liabilities were
$8.7 billion
at
June 30, 2017
, an increase of
$0.2 billion
from
December 31, 2016
. The increase in liabilities was primarily attributable to increases in accrued compensation and benefits and debt obligations of
$356.0 million
and
$171.9 million
, respectively. These increases were partially offset by decreases in other liabilities of Consolidated Funds and loans payable of Consolidated Funds of
$188.1 million
and
$145.1 million
from
December 31, 2016
to
June 30, 2017
.
The assets and liabilities of the Consolidated Funds are generally held within separate legal entities and, as a result, the assets of the Consolidated Funds are not available to meet our liquidity requirements and similarly the liabilities of the Consolidated Funds are non-recourse to us. For example, as previously discussed, the CLO term loans generally are secured by the Partnership's investment in the CLO, have a general unsecured interest in the Carlyle entity that manages the CLO, and do not have recourse to any other Carlyle entity. The assets and liabilities of the consolidated real estate VIE are also held in separate legal entities; we have not guaranteed or assumed any obligation for repayment of its liabilities nor are its assets available to meet our liquidity requirements.
Our balance sheet without the effect of the Consolidated Funds can be seen in Note 19 to the unaudited condensed consolidated financial statements included in this Quarterly Report on Form 10-Q. At
June 30, 2017
, our total assets were
$6.7 billion
, including cash and cash equivalents, including corporate treasury investments, of $0.9 billion and net accrued performance fees of $1.6 billion.
Unconsolidated Entities
Our corporate private equity funds and certain of our real estate funds have entered into lines of credit secured by their investors’ unpaid capital commitments or by a pledge of the equity of the underlying investment. These lines of credit are used primarily to reduce the overall number of capital calls to investors or for working capital needs. In certain instances, however, they may be used for other investment related activities, including serving as bridge financing for investments. The degree of leverage employed varies among our funds.
Off-balance Sheet Arrangements
In the normal course of business, we enter into various off-balance sheet arrangements including sponsoring and owning limited or general partner interests in consolidated and non-consolidated funds, entering into derivative transactions, entering into operating leases and entering into guarantee arrangements. We also have ongoing capital commitment arrangements with certain of our consolidated and non-consolidated funds. We do not have any other off-balance sheet arrangements that would require us to fund losses or guarantee target returns to investors in any of our other investment funds.
For further information regarding our off-balance sheet arrangements, see Note 2 and Note 10 to the unaudited condensed consolidated financial statements included in this Quarterly Report on Form 10-Q.
146
Contractual Obligations
The following table sets forth information relating to our contractual obligations as of
June 30, 2017
on a consolidated basis and on a basis excluding the obligations of the Consolidated Funds:
|
July 1, 2017 to
December 31, 2017
|
2018-2019
|
2020-2021
|
Thereafter
|
Total
|
|||||||||||||||
|
|
(Dollars in millions)
|
||||||||||||||||||
|
Debt obligations (including senior notes)
(a)
|
$
|
6.7
|
|
$
|
61.6
|
|
$
|
133.8
|
|
$
|
1,237.1
|
|
$
|
1,439.2
|
|
||||
|
Interest payable
(b)
|
31.0
|
|
124.0
|
|
123.2
|
|
770.3
|
|
1,048.5
|
|
|||||||||
|
Contingent cash and other consideration
(c)
|
1.3
|
|
37.5
|
|
—
|
|
—
|
|
38.8
|
|
|||||||||
|
Operating lease obligations
(d)
|
26.3
|
|
96.8
|
|
89.8
|
|
332.0
|
|
544.9
|
|
|||||||||
|
Capital commitments to Carlyle funds
(e)
|
2,862.4
|
|
—
|
|
—
|
|
—
|
|
2,862.4
|
|
|||||||||
|
Tax receivable agreement payments
(f)
|
—
|
|
—
|
|
28.0
|
|
119.5
|
|
147.5
|
|
|||||||||
|
Loans payable of Consolidated Funds
(g)
|
39.6
|
|
157.6
|
|
157.1
|
|
4,269.5
|
|
4,623.8
|
|
|||||||||
|
Loans payable of a consolidated real estate VIE
(h)
|
20.4
|
|
56.7
|
|
43.2
|
|
22.6
|
|
142.9
|
|
|||||||||
|
Unfunded commitments of the CLOs
(i)
|
21.4
|
|
—
|
|
—
|
|
—
|
|
21.4
|
|
|||||||||
|
Consolidated contractual obligations
|
3,009.1
|
|
534.2
|
|
575.1
|
|
6,751.0
|
|
10,869.4
|
|
|||||||||
|
Loans payable of Consolidated Funds
(g)
|
(39.6
|
)
|
(157.6
|
)
|
(157.1
|
)
|
(4,269.5
|
)
|
(4,623.8
|
)
|
|||||||||
|
Loans payable of a consolidated real estate VIE
(h)
|
(20.4
|
)
|
(56.7
|
)
|
(43.2
|
)
|
(22.6
|
)
|
(142.9
|
)
|
|||||||||
|
Capital commitments to Carlyle funds
(e)
|
(2,517.2
|
)
|
—
|
|
—
|
|
—
|
|
(2,517.2
|
)
|
|||||||||
|
Unfunded commitments of the CLOs
(i)
|
(21.4
|
)
|
—
|
|
—
|
|
—
|
|
(21.4
|
)
|
|||||||||
|
Carlyle Operating Entities contractual obligations
|
$
|
410.5
|
|
$
|
319.9
|
|
$
|
374.8
|
|
$
|
2,458.9
|
|
$
|
3,564.1
|
|
||||
|
(a)
|
The table above assumes that no prepayments are made on the CLO term loans, promissory notes or senior notes and that the outstanding balance on the revolving credit facility term loan is repaid on the maturity date of the senior credit facility, which is May 5, 2020. See Note 7 to the unaudited condensed consolidated financial statements for the various maturity dates of the CLO term loans, promissory notes and senior notes.
|
|
(b)
|
The interest rate on the debt obligations as of
June 30, 2017
consist of: 3.875% on $500.0 million of senior notes, 5.625% on $600.0 million of senior notes, approximately
2.18%
on $25.0 million remaining term loan under our senior credit facility, a range of approximately 1.75% to 3.25% for our CLO term loans, approximately
3.80%
on $108.8 million of our NGP promissory note and approximately
3.30%
on $53.9 million of our settlement promissory notes. Interest payments assume that no prepayments are made and loans are held until maturity.
|
|
(c)
|
These obligations represent our estimate of amounts to be paid on the contingent cash and other consideration obligations associated with our business acquisitions and strategic investment in NGP Management. Refer to “— Contingent Cash Payments for Business Acquisitions and Strategic Investments” below for the maximum amounts we may be required to pay under these arrangements and Note 5 and Note 8 to the unaudited condensed consolidated financial statements included in this Quarterly Report on Form 10-Q for more information.
|
|
(d)
|
We lease office space in various countries around the world and maintain our headquarters in Washington, D.C., where we lease our primary office space under a non-cancelable lease agreement expiring on July 31, 2026. Our office leases in other locations expire in various years from 2017 through 2031. The amounts in this table represent the minimum lease payments required over the term of the lease.
|
|
(e)
|
These obligations represent commitments by us to fund a portion of the purchase price paid for each investment made by our funds. These amounts are generally due on demand and are therefore presented in the less than one year category. A substantial majority of these investments is expected to be funded by senior Carlyle professionals and other professionals through our internal co-investment program. Of the
$2.9 billion
of unfunded commitments, approximately
$2.5 billion
is subscribed individually by senior Carlyle professionals, advisors and other professionals, with the balance funded directly by the Partnership.
|
|
(f)
|
Represents obligations by the Partnership’s corporate taxpayers to make payments under the tax receivable agreement. Holders of partnership units in Carlyle Holdings may exchange their Carlyle Holdings partnership units for common units in The Carlyle Group L.P. on a one-for-one basis. These exchanges may reduce the amount of tax that the corporate taxpayers would be required to pay in the future. The corporate taxpayers will pay to the limited partner of Carlyle Holdings making the exchange 85% of the amount of cash savings that the corporate taxpayers realize upon an exchange. See “Tax Receivable Agreement” below.
|
|
(g)
|
These obligations represent amounts due to holders of debt securities issued by the consolidated CLO vehicles. These obligations include interest to be paid on debt securities issued by the consolidated CLO vehicles. Interest payments assume that no prepayments are made and loans are held until maturity. For debt securities with rights only to the residual value of the CLO and no stated interest, no interest payments were included in this calculation. Interest payments on variable-rate debt securities are based on interest rates in effect as of
June 30, 2017
, at spreads to market rates pursuant to the debt agreements, and range from 0.78% to 8.76%.
|
|
(h)
|
These obligations represent amounts owed to the lenders of Urbplan. These obligations include interest to be paid on the loans of Urbplan. Principal and interest payments shown herein assume that amounts will be paid according to the contractual maturities of the loans without acceleration due to default or covenant violation or other voluntarily prepayments. Interest payments on variable-rate debt are based on interest rates in effect as of
June 30, 2017
, at spreads to market rates pursuant to the loan agreements, and range from 11.2% to 18.0%. Due to the timing and availability of financial information from Urbplan, we consolidate the financial position and results of operations of Urbplan on a financial reporting lag of 90 days. The balances shown in this table are based on Urbplan’s outstanding borrowings as of March 31, 2017.
|
|
(i)
|
These obligations represent commitments of the CLOs to fund certain investments. These amounts are generally due on demand and are therefore presented in the less than one year category.
|
Excluded from the table above are liabilities for uncertain tax positions of $19.7 million at
June 30, 2017
as we are unable to estimate when such amounts may be paid. Also excluded from the table above are outstanding commitments of Urbplan for
147
land development services estimated to be less than
$10.0 million
of future costs to be incurred; these amounts have been excluded as we are uncertain as to the timing and amount of such payments.
Contingent Funding of the Consolidated Real Estate VIE
As described in Note 16 to the unaudited condensed consolidated financial statements included in this Quarterly Report on Form 10-Q, we and certain of our senior Carlyle professionals have made and may make additional investments in and fundings for the benefit of Urbplan. From 2013 through
June 30, 2017
,
$383.9 million
has been funded to Urbplan by us and our senior Carlyle professionals (including losses from related foreign currency forward contracts). We have funded
$136.4 million
of the
$383.9 million
and the remaining
$247.5 million
has been funded by our senior Carlyle professionals indirectly through the Partnership. For the
three months ended June 30, 2017
,
$8.1 million
was funded to Urbplan, of which we funded the entire
$8.1 million
.
No contractual or other obligations exist to provide additional financial support to Urbplan from the Partnership. Urbplan continues to seek opportunities to restructure its existing debt obligations to reduce its cash requirements and is also pursuing other strategic alternatives. The Partnership does not anticipate providing any additional financial support to satisfy Urbplan's debt obligations. The Partnership may consider providing additional financial support for other purposes depending on the circumstances at the time, including the ability of Urbplan to satisfactorily restructure its debt obligations with its financial creditors or to facilitate other strategic alternatives. Such transactions could result in future charges related to the Partnership's ownership of Urbplan, and such charges, if any, are currently estimated to be in the range of
$30 million
to
$50 million
.
We may not recover, in whole or in part, the capital that we have invested in or any additional capital that we may elect to invest in Urbplan in the future, and our results of operations could be adversely impacted by impairments, write-downs, lawsuits by customers or creditors, bankruptcy, other claims against Urbplan or us or other losses associated with our investment in Urbplan. Urbplan is currently a party to a significant number of claims filed against Urbplan by its customers. In addition, Urbplan is a party to various litigation, disputes and other potential claims. We do not believe it is probable that the outcome of any existing Urbplan litigation, government investigations and proceedings, disputes, or other potential claims will materially affect us or our consolidated financial statements.
The assets and liabilities of Urbplan are held in legal entities separate from the Partnership; we have not guaranteed or assumed any obligation for repayment of Urbplan’s liabilities nor are the assets of Urbplan available to meet our liquidity requirements. Urbplan has substantially completed construction of its development projects, and no new development projects have been approved. At this time, Urbplan's projected revenues and cash flow may be insufficient to timely satisfy all of Urbplan's debt obligations, necessitating a restructuring of its debt obligations or a potential bankruptcy reorganization or insolvency proceeding. Furthermore, while the Partnership has not expressly assumed any of Urbplan's obligations or liabilities, in any such proceeding customers or other creditors in certain circumstances might seek to assert claims against the Partnership and its affiliate assets unrelated to Urbplan under certain consumer protection, labor or other laws.
Contingent Cash Payments for Business Acquisitions and Strategic Investments
We have certain contingent cash obligations associated with our business acquisitions and our strategic investment in NGP Management. For our business acquisitions, these contingent cash payments relate to performance-based contingent cash consideration payable to the sellers of the businesses, some of whom are Carlyle professionals. Certain of these payments to those Carlyle professionals require such Carlyle professionals to be employed by us at the time the performance conditions are met, while other payments are not contingent upon employment.
For our strategic investment in NGP Management, the contingent cash payments relate to performance-based contingent cash consideration payable to ECM Capital, L.P. and an affiliate of Barclays Bank PLC. The performance-based contingent cash consideration payable to an affiliate of Barclays Bank PLC totaling $183.0 million, was paid in January 2016 with $63.0 million in cash and $120.0 million in a six year promissory note (accruing interest at the three month LIBOR plus 2.5%) issued by the Partnership. In December 2016, we repurchased approximately $11.2 million of this promissory note. See Note 7 to the unaudited condensed consolidated financial statements included in this Quarterly Report on Form 10-Q for more information.
Based on the terms of the underlying contracts, the maximum amounts that could be paid from contingent cash obligations associated with business acquisitions and the strategic investment in NGP Management as of
June 30, 2017
is
$49.1 million
versus the liabilities recognized on the balance sheet of
$32.5 million
. Based on the historical and projected performance of our acquisitions, the Partnership believes that approximately
$10.3 million
of the maximum amounts of the contingent cash obligations are unlikely to be paid.
Some of the employment-based contingent cash consideration agreements do not contain provisions limiting the amount that could be paid by us. For purposes of the estimate above, we have used our current estimate of the amount to be paid upon
148
the determination dates for such payments. In our consolidated financial statements, we record the performance-based contingent cash consideration from our business acquisitions at fair value at each reporting period. For the employment-based contingent cash consideration, we accrue the compensation liability over the implied service period.
Risk Retention Rules
The Dodd-Frank Act requires sponsors of asset-backed securities, including CLOs, to retain at least 5% of the credit risk related to the assets that underlie asset-backed securities (referred to herein as the U.S. Risk Retention Rules). The U.S. Risk Retention Rules became effective on December 24, 2016 and apply to sponsors of CLOs issued thereafter. As a sponsor of CLOs issued in Europe, we currently comply with similar risk retention rules that have been in place since 2014. To comply with the U.S. Risk Retention Rules, we expect that we will contribute approximately $750 million to new CLOs issued over the next five years. Our contribution to the new CLOs will be funded through a variety of sources, including direct funding from the Partnership, funding from senior Carlyle professionals, funding from third party investors, and limited recourse borrowing. The allocation of funding sources, and therefore the amount of capital required from the Partnership, will be determined in the future.
For additional information related to the U.S. Risk Retention Rules, see “—Regulatory changes in the United States could adversely affect our business and the possibility of increased regulatory focus could result in additional burdens and expenses on our business” within Item 1A of our 2016 Annual Report on Form 10-K.
Guarantees
See Note 10 to the unaudited condensed consolidated financial statements included in this Quarterly Report on Form 10-Q for information related to our material guarantees.
Indemnifications
In many of our service contracts, we agree to indemnify the third-party service provider under certain circumstances. The terms of the indemnities vary from contract to contract, and the amount of indemnification liability, if any, cannot be determined and has not been included in the table above or recorded in our consolidated financial statements as of
June 30, 2017
.
Tax Receivable Agreement
Holders of partnership units in Carlyle Holdings (other than The Carlyle Group L.P.’s wholly-owned subsidiaries), subject to the vesting and minimum retained ownership requirements and transfer restrictions applicable to such holders as set forth in the partnership agreements of the Carlyle Holdings partnerships, may (subject to the terms of the exchange agreement) exchange their Carlyle Holdings partnership units for The Carlyle Group L.P. common units on a one-for-one basis. A Carlyle Holdings limited partner must exchange one partnership unit in each of the three Carlyle Holdings partnerships to effect an exchange for a common unit. The exchanges are expected to result in increases in the tax basis of the tangible and intangible assets of Carlyle Holdings. These increases in tax basis may increase (for tax purposes) depreciation and amortization deductions and therefore reduce the amount of tax that Carlyle Holdings I GP Inc. and any other corporate taxpayers would otherwise be required to pay in the future, although the IRS may challenge all or part of that tax basis increase, and a court could sustain such a challenge.
We have entered into a tax receivable agreement with the limited partners of the Carlyle Holdings partnerships that will provide for the payment by the corporate taxpayers to such parties of 85% of the amount of cash savings, if any, in U.S. federal, state and local income tax or franchise tax that the corporate taxpayers realize as a result of these increases in tax basis and of certain other tax benefits related to entering into the tax receivable agreement, including tax benefits attributable to payments under the tax receivable agreement. This payment obligation is an obligation of the corporate taxpayers and not of Carlyle Holdings. While the actual increase in tax basis, as well as the amount and timing of any payments under this agreement, will vary depending upon a number of factors, including the timing of exchanges, the price of our common units at the time of the exchange, the extent to which such exchanges are taxable and the amount and timing of our income, we expect that as a result of the size of the transfers and increases in the tax basis of the tangible and intangible assets of Carlyle Holdings, the payments that we may make under the tax receivable agreement will be substantial.
See Note 2 to the unaudited condensed consolidated financial statements included in this Quarterly Report on Form 10-Q for additional information related to our tax receivable agreement.
149
Contingent Obligations (Giveback)
Carried interest is ultimately realized when: (1) an underlying investment is profitably disposed of, (2) certain costs borne by the limited partner investors have been reimbursed, (3) the fund's cumulative returns are in excess of the preferred return, and (4) we have decided to collect carry rather than return additional capital to limited partner investors. Realized carried interest may be required to be returned by us in future periods if the funds' investment values decline below certain levels. When the fair value of a fund's investments remains constant or falls below certain return hurdles, previously recognized performance fees are reversed.
See Note 10 to the unaudited condensed consolidated financial statements included in this Quarterly Report on Form 10-Q for additional information related to our contingent obligations (giveback).
Other Contingencies
In the ordinary course of business, we are a party to litigation, investigations, inquiries, employment-related matters, disputes and other potential claims. We discuss certain of these matters in Note 10 to the unaudited condensed consolidated financial statements included in this Quarterly Report on Form 10-Q.
Carlyle Common Units and Carlyle Holdings Partnership Units
A rollforward of the outstanding Carlyle Group L.P. common units and Carlyle Holdings partnership units from
December 31, 2016
through
June 30, 2017
is as follows:
|
Units as of December 31, 2016
|
Units Issued - DRUs
|
Units
Forfeited |
Units
Exchanged |
Units Repurchased / Retired
|
Units as of June 30, 2017
|
||||||||||||
|
The Carlyle Group L.P.
common units |
84,610,951
|
|
3,301,126
|
|
—
|
|
3,153,493
|
|
(14,190
|
)
|
91,051,380
|
|
|||||
|
Carlyle Holdings
partnership units |
241,847,796
|
|
—
|
|
(437,314
|
)
|
(3,153,493
|
)
|
—
|
|
238,256,989
|
|
|||||
|
Total
|
326,458,747
|
|
3,301,126
|
|
(437,314
|
)
|
—
|
|
(14,190
|
)
|
329,308,369
|
|
|||||
The Carlyle Group L.P. common units issued during the period from
December 31, 2016
through
June 30, 2017
relate to the vesting of the Partnership’s deferred restricted common units during the
six months ended June 30, 2017
. Further, The Carlyle Group L.P. common units in the table above includes 7,782 common units that the Partnership is expected to acquire from Carlyle Holdings in future periods upon the vesting of certain of the Partnership’s unvested common units associated with the acquisition of the remaining 40% equity interest in AlpInvest in August 2013.
The Carlyle Holdings partnership units forfeited during the period from
December 31, 2016
through
June 30, 2017
relate to unvested Carlyle Holdings partnership units that were forfeited when the holder ceased to provide services to the Partnership.
The Carlyle Holdings partnership units exchanged relate to the exchange of Carlyle Holdings partnership units held by NGP and certain limited partners for common units on a one-for-one basis. Beginning with the second quarter of 2017, senior Carlyle professionals can exchange their Carlyle Holdings partnership units for common units on a quarterly basis, subject to the terms of the Exchange Agreement. We intend to facilitate an orderly exchange process to seek to minimize the impact on the trading price of our common units. During the
three months ended June 30, 2017
, senior Carlyle professionals exchanged approximately 3.0 million of their Carlyle Holdings partnership units for common units.
The Carlyle Group L.P. common units and Carlyle Holdings partnership units repurchased during the period from
December 31, 2016
through
June 30, 2017
relate to units repurchased and subsequently retired as part of our unit repurchase program that was initiated in February 2016.
The total units as of
June 30, 2017
as shown above exclude approximately 5.1 million common units in connection with the vesting of deferred restricted common units subsequent to
June 30, 2017
that will participate in the unitholder distribution that will be paid in August 2017.
150
Our primary exposure to market risk is related to our role as general partner or investment advisor to our investment funds and the sensitivities to movements in the fair value of their investments, including the effect on management fees, performance fees and investment income. Although our investment funds share many common themes, each of our alternative asset management asset classes runs its own investment and risk management processes, subject to our overall risk tolerance and philosophy. The investment process of our investment funds involves a comprehensive due diligence approach, including review of reputation of shareholders and management, company size and sensitivity of cash flow generation, business sector and competitive risks, portfolio fit, exit risks and other key factors highlighted by the deal team. Key investment decisions are subject to approval by both the fund-level managing directors, as well as the investment committee, which is generally comprised of one or more of the three founding partners, one “sector” head, one or more operating executives and senior investment professionals associated with that particular fund. Once an investment in a portfolio company has been made, our fund teams closely monitor the performance of the portfolio company, generally through frequent contact with management and the receipt of financial and management reports.
There was no material change in our market risks during the three months ended
June 30, 2017
. For additional information, refer to our Annual Report on Form 10-K for the year ended December 31, 2016.
Evaluation of Disclosure Controls and Procedures
We maintain disclosure controls and procedures (as that term is defined in Rules 13a-15(e) and 15d-15(e) under the Securities Exchange Act of 1934, as amended (the “Exchange Act”)) that are designed to ensure that information required to be disclosed in our reports under the Exchange Act is recorded, processed, summarized and reported within the time periods specified in the SEC’s rules and forms, and that such information is accumulated and communicated to our management, including our co-principal executive officers and principal financial officer, as appropriate, to allow timely decisions regarding required disclosures. In designing disclosure controls and procedures, our management necessarily was required to apply its judgment in evaluating the cost-benefit relationship of possible disclosure controls and procedures. The design of any disclosure controls and procedures also is based in part upon certain assumptions about the likelihood of future events, and there can be no assurance that any design will succeed in achieving its stated goals under all potential future conditions. Any controls and procedures, no matter how well designed and operated, can provide only reasonable, not absolute, assurance of achieving the desired control objectives.
Our management, with the participation of our co-principal executive officers and principal financial officer, has evaluated the effectiveness of the design and operation of our disclosure controls and procedures as of the end of the period covered by this report. Based upon that evaluation and subject to the foregoing, our co-principal executive officers and principal financial officer concluded that, as of the end of the period covered by this report, the design and operation of our disclosure controls and procedures were effective to accomplish their objectives at the reasonable assurance level.
Changes in Internal Control over Financial Reporting
There have been no changes in our internal control over financial reporting (as defined in Rule 13a-15(f) and 15d-15(f) under the Exchange Act) during the fiscal quarter ended
June 30, 2017
that have materially affected, or that are reasonably likely to materially affect, our internal control over financial reporting.
151
The information required with respect to this item can be found under “Legal Matters” in Note 10, Commitments and Contingencies, of the notes to the Partnership’s unaudited condensed consolidated financial statements contained in this quarterly report, and such information is incorporated by reference into this Item 1.
For a discussion of our potential risks and uncertainties, see the information under Item 1A. “Risk Factors” in our Annual Report on Form 10-K for the year ended December 31, 2016, which is accessible on the SEC’s website at sec.gov.
Issuer Purchases of Equity Securities
The following table sets forth repurchases of our common units during the
three months ended June 30, 2017
for the periods indicated:
|
Period
|
(a) Total number of units purchased
|
(b) Average price paid per unit
|
(c) Total number of units purchased as part of publicly announced plans or programs
|
(d) Maximum number (or approximate dollar value) of units that may yet be purchased under the plans or programs
|
||
|
(Dollars in millions, except unit and per unit data)
|
||||||
|
April 1, 2017 to
April 30, 2017
(1)
|
—
|
|
$—
|
—
|
|
$140.9
|
|
May 1, 2017 to
May 31, 2017
(1)
|
—
|
|
$—
|
—
|
|
$140.9
|
|
June 1, 2017 to
June 30, 2017
(1)
|
—
|
|
$—
|
—
|
|
$140.9
|
|
Total
|
—
|
|
—
|
|
||
|
(1)
|
In February 2016, the Board of Directors of the general partner of the Partnership authorized the repurchase of up to $200 million of common units and/or Carlyle Holdings units. Under this unit repurchase program, which was publicly announced on February 10, 2016, units may be repurchased from time to time in open market transactions, in privately negotiated transactions or otherwise. We expect that the majority of repurchases under this program will be done via open market transactions. No units will be repurchased from our executive officers under this program. The timing and actual number of common units and/or Carlyle Holdings units repurchased will depend on a variety of factors, including legal requirements, price, and economic and market conditions. This unit repurchase program may be suspended or discontinued at any time and does not have a specified expiration date. During the
three months ended June 30, 2017
, no units were repurchased. As of
June 30, 2017
, we had $141 million in remaining authorization under the unit repurchase program.
|
Not applicable.
Not applicable.
152
None.
Required exhibits are listed in the Index to Exhibits and are incorporated herein by reference.
153
SIGNATURE
Pursuant to the requirements of the Securities Exchange Act of 1934, the registrant has duly caused this report to be signed on its behalf by the undersigned thereunto duly authorized.
|
|
The Carlyle Group L.P.
|
|||
|
|
By:
|
|
Carlyle Group Management L.L.C.,
its general partner
|
|
|
Date: August 2, 2017
|
|
By:
|
|
/s/ Curtis L. Buser
|
|
|
Name:
|
|
Curtis L. Buser
|
|
|
|
Title:
|
|
Chief Financial Officer
|
|
|
|
|
(Principal Financial Officer and Authorized Officer)
|
||
154
INDEX TO EXHIBITS
The following is a list of all exhibits filed or furnished as part of this report:
|
Exhibit No.
|
Description
|
|
3.1
|
Certificate of Limited Partnership of The Carlyle Group L.P. (incorporated by reference to Exhibit 3.1 to Registrant’s Registration Statement on Form S-1 (File No. 333-176685) filed with the SEC on September 6, 2011).
|
|
3.2
|
Amended and Restated Limited Partnership Agreement of The Carlyle Group L.P. (incorporated by reference to Exhibit 3.1 on Form 8-K filed with the SEC on May 8, 2012).
|
|
31.1 *
|
Certification of the co-principal executive officer pursuant to Rule 13a – 14(a).
|
|
31.2 *
|
Certification of the co-principal executive officer pursuant to Rule 13a – 14(a).
|
|
31.3 *
|
Certification of the co-principal executive officer pursuant to Rule 13a – 14(a).
|
|
31.4 *
|
Certification of the principal financial officer pursuant to Rule 13a – 14(a).
|
|
32.1 *
|
Certification of the co-principal executive officer pursuant to 18 U.S.C. Section 1350, as adopted pursuant to Section 906 of the Sarbanes-Oxley Act of 2002.
|
|
32.2 *
|
Certification of the co-principal executive officer pursuant to 18 U.S.C. Section 1350, as adopted pursuant to Section 906 of the Sarbanes-Oxley Act of 2002.
|
|
32.3 *
|
Certification of the co-principal executive officer pursuant to 18 U.S.C. Section 1350, as adopted pursuant to Section 906 of the Sarbanes-Oxley Act of 2002.
|
|
32.4 *
|
Certification of the principal financial officer pursuant to 18 U.S.C. Section 1350, as adopted pursuant to Section 906 of the Sarbanes-Oxley Act of 2002.
|
|
101.INS
|
XBRL Instance Document.
|
|
101.SCH
|
XBRL Taxonomy Extension Schema Document.
|
|
101.CAL
|
XBRL Taxonomy Extension Calculation Linkbase Document.
|
|
101.DEF
|
XBRL Taxonomy Extension Definition Linkbase Document.
|
|
101.LAB
|
XBRL Taxonomy Extension Labels Linkbase Document.
|
|
101.PRE
|
XBRL Taxonomy Extension Presentation Linkbase Document.
|
|
*
|
Filed herewith.
|
The agreements and other documents filed as exhibits to this report are not intended to provide factual information or other disclosure other than with respect to the terms of the agreements or other documents themselves, and you should not rely on them for that purpose. In particular, any representations and warranties made by us in these agreements or other documents were made solely within the specific context of the relevant agreement or document and may not describe the actual state of affairs as of the date they were made or at any other time.
155
TABLE OF CONTENTS
Part I Financial InformationItem 1. Financial StatementsItem 2. Management S Discussion and Analysis Of Financial Condition and Results Of OperationsItem 3. Quantitative and Qualitative Disclosures About Market RiskItem 4. Controls and ProceduresPart II - Other InformationItem 1. Legal ProceedingsItem 1A. Risk FactorsItem 2. Unregistered Sales Of Equity Securities and Use Of ProceedsItem 3. Defaults Upon Senior SecuritiesItem 4. Mine Safety DisclosuresItem 5. Other InformationItem 6. Exhibits