TCG BDC, INC.
10-Ks and 10-Qs
|
|
|
|
|
|
|
|
|
|
|
|
|
|
|
|
|
|
|
|
|
|
|
|
|
|
|
|
|
|
|
|
|
|
|
|
|
|
|
|
|
|
|
|
|
|
|
|
|
|
|
|
|
|
|
|
UNITED STATES
SECURITIES AND EXCHANGE COMMISSION
Washington, D.C. 20549
FORM 10-K
|
☒
|
ANNUAL REPORT PURSUANT TO SECTION 13 OR 15(d) OF THE SECURITIES EXCHANGE ACT OF 1934
|
For the fiscal year ended
December 31, 2019
OR
|
☐
|
TRANSITION REPORT PURSUANT TO SECTION 13 OR 15(d) OF THE SECURITIES EXCHANGE ACT OF 1934
|
For the transition period from to
Commission File No. 000-54899
TCG BDC, INC.
(Exact name of Registrant as specified in its charter)
|
Maryland
|
|
80-0789789
|
|
(State or other jurisdiction of
incorporation or organization)
|
|
(I.R.S. Employer
Identification Number)
|
520 Madison Avenue, 40th Floor, New York, NY 10022
(Address of principal executive office) (Zip Code)
(212) 813-4900
(Registrant’s telephone number, including area code)
Securities registered pursuant to Section 12(b) of the Act:
|
Title of each class
|
Trading Symbol(s)
|
Name of each exchange on which registered
|
|
Common Stock, par value $0.01 per share
|
CGBD
|
The Nasdaq Global Select Market
|
Securities registered pursuant to Section 12(g) of the Act: None
Indicate by check mark if the registrant is a well-known seasoned issuer, as defined in Rule 405 of the Securities Act. Yes
x
No ☐
Indicate by check mark if the registrant is not required to file reports pursuant to Section 13 or Section 15(d) of the Act. Yes ☐ No
x
Indicate by check mark whether the registrant (1) has filed all reports required to be filed by Section 13 or 15(d) of the Securities Exchange Act of 1934 during the preceding 12 months (or for such shorter period that the registrant was required to file such reports), and (2) has been subject to such filing requirements for the past 90 days: Yes
x
No ☐
Indicate by check mark whether the registrant has submitted electronically every Interactive Data File required to be submitted pursuant to Rule 405 of Regulation S-T (§232.405 of this chapter) during the preceding 12 months (or for such shorter period that the registrant was required to submit such files). Yes ☐ No ☐
Indicate by check mark whether the registrant is a large accelerated filer, an accelerated filer, a non-accelerated filer, or a smaller reporting company. See definitions of “large accelerated filer,” “accelerated filer,” and “smaller reporting company” in Rule 12b-2 of the Exchange Act. (Check one):
|
Large accelerated filer
|
|
x
|
|
Accelerated filer
|
|
☐
|
|
Non-accelerated filer
|
|
☐
|
|
Smaller reporting company
|
|
☐
|
If an emerging growth company, indicate by check mark if the registrant has elected not to use the extended transition period complying with any new or revised financial accounting standards provided pursuant to Section 13(a) of the Exchange Act. ☐
Indicate by check mark whether the registrant is a shell company (as defined in Rule 12b-2 of the Exchange Act). Yes ☐ No
x
The aggregate market value of the registrant’s common stock at June 30, 2019, based on the closing price of the common stock on that date of
$15.24
on The Nasdaq Global Select Market, held by those persons deemed by the registrant to be non-affiliates was approximately
$932,411,482
.
The number of shares of the registrant’s common stock, $0.01 par value per share, outstanding at
February 25, 2020
was
57,181,623
.
Documents Incorporated by Reference:
Portions of the registrant’s Proxy Statement for its
2019
Annual Meeting of Stockholders to be filed not later than 120 days after the end of the fiscal year covered by this Annual Report on Form 10-K are incorporated by reference into Part III of this Form 10-K.
TCG BDC, INC.
INDEX
|
Part I
|
||
|
Item 1.
|
||
|
Item 1A.
|
||
|
Item 1B.
|
||
|
Item 2.
|
||
|
Item 3.
|
||
|
Item 4.
|
||
|
Part II
|
||
|
Item 5.
|
||
|
Item 6.
|
||
|
Item 7.
|
||
|
Item 7A.
|
||
|
Item 8.
|
||
|
Item 9.
|
||
|
Item 9A.
|
||
|
Item 9B.
|
||
|
Part III
|
||
|
Item 10.
|
||
|
Item 11.
|
||
|
Item 12.
|
||
|
Item 13.
|
||
|
Item 14.
|
||
|
Part IV
|
||
|
Item 15.
|
||
|
Item 16.
|
||
CAUTIONARY STATEMENT REGARDING FORWARD-LOOKING STATEMENTS
We have included or incorporated by reference in this Form 10-K, and from time to time our management may make, “forward-looking statements”. These forward-looking statements are not historical facts, but instead relate to future events or the future performance or financial condition of TCG BDC, Inc. (together with its consolidated subsidiaries, “we,” “us,” “our,” “TCG BDC” or the “Company”). These statements are based on current expectations, estimates and projections about us, our current or prospective portfolio investments, our industry, our beliefs, and our assumptions. The forward-looking statements contained in this Form 10-K and the documents incorporated by reference herein involve a number of risks and uncertainties, including statements concerning:
|
•
|
our, or our portfolio companies’, future business, operations, operating results or prospects;
|
|
•
|
the return or impact of current and future investments;
|
|
•
|
the general economy and its impact on the industries in which we invest;
|
|
•
|
the impact of any protracted decline in the liquidity of credit markets on our business;
|
|
•
|
the impact of fluctuations in interest rates on our business;
|
|
•
|
our future operating results;
|
|
•
|
the impact of changes in laws, policies or regulations (including the interpretation thereof) affecting our operations or the operations of our portfolio companies;
|
|
•
|
the valuation of our investments in portfolio companies, particularly those having no liquid trading market;
|
|
•
|
our ability to recover unrealized losses;
|
|
•
|
market conditions and our ability to access alternative debt markets and additional debt and equity capital;
|
|
•
|
our contractual arrangements and relationships with third parties;
|
|
•
|
uncertainty surrounding the financial stability of the United States, Europe and China;
|
|
•
|
the social, geopolitical, financial, trade and legal implications of Brexit;
|
|
•
|
the financial condition of and ability of our current and prospective portfolio companies to achieve their objectives;
|
|
•
|
competition with other entities and our affiliates for investment opportunities;
|
|
•
|
the speculative and illiquid nature of our investments;
|
|
•
|
the use of borrowed money to finance a portion of our investments;
|
|
•
|
our expected financings and investments;
|
|
•
|
the adequacy of our cash resources and working capital;
|
|
•
|
the timing, form and amount of any dividend distributions;
|
|
•
|
the timing of cash flows, if any, from the operations of our portfolio companies;
|
|
•
|
the ability to consummate acquisitions;
|
|
•
|
the ability of our investment adviser to locate suitable investments for us and to monitor and administer our investments;
|
|
•
|
currency fluctuations could adversely affect the results of our investments in foreign companies, particularly to the extent that we receive payments denominated in foreign currency rather than U.S. dollars;
|
|
•
|
the ability of The Carlyle Group Employee Co., L.L.C. to attract and retain highly talented professionals that can provide services to our investment adviser and administrator;
|
|
•
|
our ability to maintain our status as a business development company; and
|
|
•
|
our intent to satisfy the requirements of a regulated investment company under Subchapter M of the Internal Revenue Code of 1986, as amended.
|
1
We use words such as “anticipates,” “believes,” “expects,” “intends,” “will,” “should,” “may,” “plans,” “continue,” “believes,” “seeks,” “estimates,” “would,” “could,” “targets,” “projects,” “outlook,” “potential,” “predicts” and variations of these words and similar expressions to identify forward-looking statements, although not all forward-looking statements include these words. Our actual results and condition could differ materially from those implied or expressed in the forward-looking statements for any reason, including the factors set forth in “Risk Factors” in Part I, Item 1A of and elsewhere in this Form 10-K.
We have based the forward-looking statements included in this Form 10-K on information available to us on the date of this Form 10-K, and we assume no obligation to update any such forward-looking statements. Although we undertake no obligation to revise or update any forward-looking statements, whether as a result of new information, future events or otherwise, you are advised to consult any additional disclosures that we may make directly to you or through reports that we have filed or in the future may file with the Securities and Exchange Commission (the “SEC”), including our annual reports on Form 10-K, quarterly reports on Form 10-Q and current reports on Form 8-K.
2
PART I
In this annual report, except where the context suggests otherwise:
|
•
|
the terms “we,” “us,” “our,” “Company” and “TCG BDC” refer to TCG BDC, Inc., a Maryland corporation and its consolidated subsidiaries;
|
|
•
|
the term “SPV” refers to TCG BDC SPV LLC, our wholly owned and consolidated subsidiary;
|
|
•
|
the term “2015-1 Issuer” refers to Carlyle Direct Lending CLO 2015-1R LLC (formerly known as Carlyle GMS Finance MM CLO 2015-1 LLC), our wholly owned and consolidated subsidiary;
|
|
•
|
the term “Carlyle” refers to The Carlyle Group Inc. (formerly, The Carlyle Group L.P.) (NASDAQ: CG) and its affiliates and its consolidated subsidiaries (other than portfolio companies of its affiliated funds);
|
|
•
|
the term “CDL” refers to the Carlyle Direct Lending platform, which is Carlyle’s direct lending business unit that operates within the broader Carlyle Global Credit segment;
|
|
•
|
the terms “CGCA” and “Administrator” refer to Carlyle Global Credit Administration L.L.C., our administrator, a wholly owned and consolidated subsidiary of Carlyle;
|
|
•
|
the terms “CGCIM” and “Investment Adviser” refer to Carlyle Global Credit Investment Management L.L.C., our investment adviser, a wholly owned and consolidated subsidiary of Carlyle;
|
|
•
|
the term “Credit Fund” refers to Middle Market Credit Fund, LLC, an unconsolidated limited liability company, in which we own a 50% economic interest and co-manage with Credit Partners USA LLC, and its wholly owned and consolidated subsidiaries; and
|
|
•
|
references to “this Form 10-K” are to our Annual Report on Form 10-K for the year ended
December 31, 2019
.
|
Item 1. Business
We are an externally managed specialty finance company whose primary focus is making directly originated loans to middle market companies. We are managed by our Investment Adviser, a wholly owned subsidiary of The Carlyle Group Inc. We have elected to be regulated as a business development company (“BDC”) under the Investment Company Act of 1940, as amended (together with the rules and regulations promulgated thereunder, the “Investment Company Act”). In addition, we have elected to be treated, and intend to continue to comply with the requirements to qualify annually, as a regulated investment company (“RIC”) under the Internal Revenue Code of 1986, as amended (together with the rules and regulations promulgated thereunder, the “Code”). We commenced investment operations in May 2013 and closed our initial public offering in June 2017.
Our investment objective is to generate current income and capital appreciation primarily through debt investments in U.S. middle market companies. Our core investment strategy focuses on lending to U.S. middle market companies, which we define as companies with approximately $25 million to $100 million of earnings before interest, taxes, depreciation and amortization (“EBITDA”), which we believe is a useful proxy for cash flow. We complement this core strategy with additive, diversifying assets including, but not limited to, specialty lending investments. We seek to achieve our investment objective primarily through direct origination of secured debt instruments, including first lien senior secured loans (which may include stand-alone first lien loans, first lien/last out loans and “unitranche” loans) and second lien senior secured loans (collectively, “Middle Market Senior Loans”), with the balance of our assets invested in higher yielding investments (which may include unsecured debt, mezzanine debt and investments in equities).
We invest primarily in loans to middle market companies whose debt, if rated, is rated below investment grade, and, if not rated, would likely be rated below investment grade if it were rated (that is, below BBB- or Baa3, which is often referred to as “junk”). Exposure to below investment grade instruments involves certain risks, including speculation with respect to the borrower’s capacity to pay interest and repay principal. See Item 1A of this Form 10-K “
Risk Factors—Risks Related to Our Investments—Our investments are risky and speculative
”.
We generate revenues primarily in the form of interest income from the investments we hold. In addition, we generate income from dividends on direct equity investments, capital gains on the sales of loans and debt and equity securities and various loan origination and other fees.
In conducting our investment activities, we believe that we benefit from the significant scale and resources of Carlyle, including our Investment Adviser and its affiliates.
3
Formation Transactions and Corporate Structure
We were formed in February 2012 as a Maryland corporation structured as an externally managed, non-diversified closed-end investment company. On May 2, 2013, we elected to be regulated as a BDC under the Investment Company Act and commenced substantial investment operations upon the completion of our initial closing of equity capital commitments. In addition, for U.S. federal income tax purposes, we have elected to be treated as a RIC under the Code commencing with our taxable year ended December 31, 2013.
Effective on March 15, 2017, we changed our name from “Carlyle GMS Finance, Inc.” to “TCG BDC, Inc.” On June 19, 2017, we closed our initial public offering, issuing 9,454,200 shares of our common stock (including shares issued pursuant to the exercise of the underwriters’ over-allotment option on July 5, 2017) at a public offering price of $18.50 per share. Shares of common stock of TCG BDC began trading on the Nasdaq Global Select Market under the symbol “CGBD” on June 14, 2017.
Our Investment Adviser
Our investment activities are managed by our Investment Adviser. The principal executive offices of our Investment Adviser are located at 520 Madison Avenue, 40th Floor, New York, NY 10022, with additional offices in Chicago, Boston and Los Angeles. Our Investment Adviser is responsible for sourcing potential investments, conducting research and due diligence on prospective investments, analyzing and structuring investments and monitoring investments on an ongoing basis.
Our Investment Adviser is served by origination, capital markets, underwriting and portfolio management teams comprised of experienced investment professionals across Carlyle's Global Credit segment, as defined below. Our investment approach is focused on long-term credit performance and principal preservation. Our Investment Adviser’s investment team utilizes a rigorous, systematic, and consistent investment process, refined over Carlyle’s 32-year history investing in private markets across multiple cycles, designed to achieve enhanced risk-adjusted returns.
Our Investment Adviser’s five-person investment committee is responsible for reviewing and approving our investment opportunities. The members of the investment committee have experience investing through different credit cycles. The investment committee is led by Mark Jenkins, a Managing Director and Head of Global Credit at Carlyle.
Our Investment Adviser also serves, and may serve in the future, as investment adviser to other existing and future affiliated BDCs that have investment objectives similar to our investment objectives.
Our Investment Adviser entered into a personnel agreement with The Carlyle Group Employee Co., L.L.C. (“Carlyle Employee Co.”), an affiliate of our Investment Adviser, pursuant to which Carlyle Employee Co. provides our Investment Adviser with access to investment professionals that comprise our Investment Adviser’s investment team. As of
December 31, 2019
, our Investment Adviser’s investment team included a team of 125 investment professionals across the Global Credit segment. The five members of our Investment Adviser’s investment committee have an average of over 25 years of industry experience. In addition, our Investment Adviser and its investment team are supported by a team of finance, operations and administrative professionals currently employed by Carlyle Employee Co., a wholly owned subsidiary of Carlyle.
Our Investment Adviser, its investment professionals, our executive officers and directors, and other current and future principals of our Investment Adviser serve or may serve as investment advisers, officers, directors or principals of entities or investment funds that operate in the same or a related line of business as we do and/or investment funds, accounts and other similar arrangements advised by Carlyle. An affiliated investment fund, account or other similar arrangement currently formed or formed in the future and managed by our Investment Adviser or its affiliates may have overlapping investment objectives and strategies with our own and, accordingly, may invest in asset classes similar to those targeted by us. As a result, our Investment Adviser and/or its affiliates may face conflicts of interest arising out of the investment advisory activities of our Investment Adviser and other operations of Carlyle. See “
—Allocation of Investment Opportunities and Potential Conflicts of Interest
” and “
Risk Factors—Risks Related to Our Business and Structure—There are significant potential conflicts of interest, including the management of other investment funds and accounts by our Investment Adviser, which could impact our investment returns
” in Part I, Item 1A of this Form 10-K for more information.
Our Administrator
CGCA, a Delaware limited liability company, serves as our Administrator. Pursuant to an administration agreement between us and the Administrator (the “Administration Agreement”), our Administrator provides services to us and we reimburse our Administrator for its costs and expenses and our allocable portion of overhead incurred by our Administrator in
4
performing its obligations under the Administration Agreement, including our allocable portion of the compensation of certain of our officers and staff. In addition, our Administrator has entered into a sub-administration agreement with Carlyle Employee Co. (the “Carlyle Sub-Administration Agreement”), which provides our Administrator with access to personnel. Our Administrator has also entered into a sub-administration agreement with State Street Bank and Trust Company (“State Street” and such agreement, the “State Street Sub-Administration Agreement” and, together with the Carlyle Sub-Administration Agreement, the “Sub-Administration Agreements”), pursuant to which State Street provides for certain administrative and professional services. State Street also serves as our custodian.
Carlyle
Our Investment Adviser and Administrator are affiliates of Carlyle. Carlyle is a global investment firm with deep industry expertise that deploys private capital across four business segments: Corporate Private Equity, Real Assets, Global Credit and Investment Solutions. With $224 billion of assets under management (“AUM”) as of
December 31, 2019
, Carlyle’s purpose is to invest wisely and create value on behalf of its investors, portfolio companies and the communities in which we live and invest. Carlyle employs more than 1,775 employees, including 671 investment professionals in 32 offices across six continents, and serves more than 2,600 active carry fund investors from 94 countries.
Established in 1999 with its first high yield fund, Carlyle’s Global Credit segment advises a group of 64 active funds that span the credit spectrum: liquid credit, illiquid credit, and real assets credit. Taken together, these various capital sources provide the opportunity for Carlyle to offer highly customizable and creative financing solutions to borrowers to meet their specific capital needs. In 2019, Carlyle hired several new senior investment professionals to expand Global Credit’s investment breadth and geographical presence.
Primary areas of focus for Carlyle’s Global Credit segment include:
|
•
|
Loans and
Structured Credit.
The structured credit funds invest primarily in performing senior secured bank loans through structured vehicles and other investment vehicles. In 2019, in addition to multiple resets and refinancings, Carlyle closed three new U.S. CLOs and two CLOs in Europe with a total of $1.8 billion and $0.9 billion, respectively, or AUM at December 31, 2019. As of
December 31, 2019
, Carlyle’s loans and structured credit team advised 49 structured credit funds and two carry funds in the United States, Europe, and Asia totaling, in the aggregate, approximately $27 billion in AUM.
|
|
•
|
Direct Lending.
Carlyle’s direct lending business includes Carlyle’s BDCs, which invest primarily in first lien loans (which include unitranche, “first out” and “last out” loans) and second lien loans of middle market companies, typically defined as companies with annual EBITDA ranging from $25 million to $100 million, which often lack access to the broadly syndicated loan and bond markets. In 2019, Carlyle expanded its direct lending capabilities by adding personnel to bolster its underwriting capabilities. As of
December 31, 2019
, Carlyle’s direct lending investment team advised six funds consisting of two BDCs (including CGBD) and four separately managed accounts, totaling, in the aggregate, approximately more than $5 billion in AUM.
|
|
•
|
Opportunistic Credit.
Carlyle’s opportunistic credit team invests primarily in highly-structured and privately-negotiated capital solutions supporting corporate borrowers through secured loans, senior subordinated debt, mezzanine debt, convertible notes, and other debt like instruments, as well as preferred and common equity in such borrowers. The team will also look to invest in special situations (i.e., event-driven opportunities that exhibit hybrid credit and equity features) as well as market dislocations (i.e., primary and secondary market investments in liquid debt instruments that arise as a result of temporary market volatility). As of
December 31, 2019
, Carlyle’s opportunistic credit team advised one fund and one separately managed account totaling, in the aggregate, more than $3 billion in AUM.
|
|
•
|
Distressed Credit.
The distressed credit funds generally invest in liquid and illiquid securities and obligations, including secured debt, senior and subordinated unsecured debt, convertible debt obligations, preferred stock and public and private equity of financially distressed companies in defensive and asset-rich industries. In certain investments, these funds may seek to restructure pre-reorganization debt claims into controlling positions in the equity of the reorganized companies. As of
December 31, 2019
, Carlyle’s distressed credit team advised three funds totaling, in the aggregate, approximately $3 billion in AUM.
|
|
•
|
Aircraft Financing and Servicing.
Carlyle Aviation Partners, Ltd. (“Carlyle Aviation Partners”) is Carlyle's multi-strategy investment platform that is engaged in commercial aviation aircraft financing and investment and providing investment management services related to the commercial aviation industry. As of
December 31, 2019
, Carlyle Aviation Partners had approximately $7 billion in AUM across four active carry funds, securitization vehicles and liquid strategies.
|
5
|
•
|
Energy Credit.
Carlyle’s energy credit team invests primarily in privately-negotiated mezzanine debt investments in North American energy and power projects and companies. As of
December 31, 2019
, Carlyle’s energy credit team advised two funds with approximately $3 billion in AUM.
|
|
•
|
Capital Solutions.
Carlyle Capital Solutions (“CCS”) is Carlyle's loan syndication and capital markets business that launched in 2018. The primary focus of Carlyle Capital Solutions is to originate and syndicate loans and underwrite securities of both third parties and Carlyle portfolio companies.
|
Strategic Relationships
From time to time, we may establish strategic relationships that may diversify our product offering, increase our scale, enhance our origination capabilities or provide other benefits. To this end, in early 2016, we agreed to co-invest with Credit Partners USA LLC (“Credit Partners”), a wholly owned subsidiary of PSP Investments Holding USA LLC, an affiliate of a large Canadian pension fund, to form Credit Fund, a joint venture primarily focused on investing in first lien loans to middle market companies. Since its inception and through December 31, 2019, Credit Fund has invested in over $2.2 billion (before any repayments or exits) of senior secured loans. We and Credit Partners each have 50% economic ownership of Credit Fund and have commitments to fund, from time to time, capital of up to $400 million each. See “
—Competitive Strengths—Strategic Relationships
.”
Competitive Strengths
Carlyle Global Credit’s key competitive strengths are based on Carlyle’s integrated platform, which allows it to mitigate competition and thereby improve our ability to deliver on the expectations of shareholders. The following characteristics distinguish Carlyle’s capabilities:
Market Leading Direct Origination Platform
. We have access to Carlyle Global Credit’s large direct origination platform, including a dedicated financial sponsor coverage team and the sourcing capabilities of other investment professionals on the platform who regularly generate attractive investment opportunities for the Company. Through these integrated efforts the origination team generates, and expects to continue to generate, a significant amount of differentiated, directly originated deal flow from which to select attractive investment opportunities.
Broad Product Capabilities
. Carlyle Global Credit offers a broad range of leveraged finance products to the marketplace, which allows us to invest across the entire capital structure, as well as via specialty products such as asset-based loans. These integrated and differentiated capabilities make our investment highly relevant to borrowers, as Carlyle Global Credit can construct comprehensive, tailored financing solutions. By doing so, Carlyle Global Credit is able to more frequently assert greater control over structure, price and terms of investments, which we can leverage in seeking to generate attractive risk-adjusted returns for our stockholders.
Scaled Capital Base.
With $49 billion of AUM, we believe Carlyle Global Credit’s hold sizes are among the largest in the market. Carlyle Global Credit's ability to deploy comparatively larger amounts of capital delivers certainty of execution for borrowers and mitigates the threat of competition, resulting in the ability to drive terms and generate attractive investment opportunities. In addition, scaled capital deployment allows Carlyle Global Credit to establish leadership positions in financing transactions, which results in improved informational access and incremental influence and control in debt financings.
Depth of Expertise
. We benefit from our Investment Adviser’s utilization of the broader resources of Carlyle, which includes access to Carlyle’s relationships and institutional knowledge from over three decades of private market investing. Our Investment Adviser's dedicated, sector aligned underwriting teams have significant experience and tenure. These teams leverage Carlyle’s broader resources – over 670 investment professionals, 45 operating executives, information obtained through direct ownership of over 265 companies, lending relationships with over 700 companies, and in-house government affairs and economic research teams – to generate differentiated diligence insights and inform fundamental credit selection. As a firm, Carlyle seeks to bring the collective power of the global platform with respect to individual investments. We believe this integrated and collaborative approach allows us to move faster, and with higher conviction, than many of our competitors.
Rigorous Investment Process Conducted by Experienced Investment Team.
Carlyle employs a robust, iterative and heavily documented underwriting process. Our Investment Adviser’s investment team comprises investment professionals who have extensive middle market lending experience. As of
December 31, 2019
, the investment team included a team of 125 investment professionals across the Global Credit segment. The five members of our Investment Adviser’s investment committee have an average of over 25 years of industry experience. We believe the breadth and depth of the investment team's experience in sourcing, structuring, executing, and monitoring a broad range of investments provides us with a significant competitive advantage in building a high quality portfolio of investments.
6
Defensive Investment Approach.
Our portfolio has been defensively constructed, and is highly diversified by borrower, industry sector, sponsor relationships and other metrics. As of
December 31, 2019
, we had a portfolio of
136
investments in
112
portfolio companies across
28
industries and
63
unique sponsors. As of
December 31, 2019
, approximately
99.7%
of our debt investments bore interest at floating rates, primarily subject to interest rate floors, and
78.3%
of our portfolio was invested in first lien debt investments (including
3.7%
first lien/last out loans).
Market Opportunity
We believe the middle market lending environment provides attractive investment opportunities as a result of a combination of the following factors:
Favorable Market Environment.
We believe the middle market remains one of the most attractive investment areas due to its large size, superior value relative to the broadly syndicated loan market, and supply-demand imbalance that continues to favor non-bank lenders. We believe market yields remain attractive and leverage levels at middle market companies are stable, creating a favorable investment environment.
Large and Growing U.S. Middle Market.
The U.S. middle market is the largest market by many measures, which is expected to enable us to invest selectively as approximately 70% of middle market loan volume is sponsor-backed. According to S&P Capital IQ, as of
December 31, 2019
, there are over 70,000 U.S. middle market companies generating between $20 million and $1 billion in annual revenue, compared with approximately 3,500 companies with revenue greater than $1 billion. We believe these middle market companies, both sponsored and non-sponsored, represent a significant growth segment of the U.S. economy and often require substantial capital investments to grow.
Benefits of Traditional Middle Market Focus – Leverage, Pricing and Risk.
According to the S&P Global Market Intelligence LCD Quarterly Leveraged Lending Review (Q4 2018) and Fitch U.S. Leveraged Loan Default Insight (January 25, 2019), middle market companies, which we primarily categorize as borrowers with EBITDA between $25 million and $100 million, are generally less levered, have larger equity contributions, and experience lower rates of default versus large cap broadly syndicated loans, which we define as loans to borrowers with greater than $100 million of EBITDA. Middle market loans relative to broadly syndicated loans also tend to achieve more attractive economics in the form of upfront fees, spreads, and prepayment penalties, and benefit from stronger defensive structures through terms including, but not limited to documentation, asset security, priority in payments, covenants, and information/governance, all of which potentially provide more favorable protection against credit deterioration. Middle market lenders like us are also often able to complete more thorough due diligence investigations prior to investment than lenders in the broadly syndicated space. We believe the confluence of these factors have resulted in, over the three-year period from 2017 to 2019, middle market loans driving an approximate 150 to 200 basis points spread premium over broadly syndicated loans according to the S&P Global Market Intelligence LCD Leveraged Loan Index, without taking incremental credit risk as evidenced by lower default rates and higher recovery rates as compared to broadly syndicated loans.
Market Environment Favors Non-Traditional Lenders.
Traditional middle market lenders, such as commercial and regional banks and commercial finance companies, have contracted their origination and lending activities and are focusing on more liquid asset classes or have exited the business. At the same time, institutional investors have sought to invest in larger, more liquid offerings, limiting the ability of middle market companies to raise debt capital through public capital markets. This has resulted in other capital providers, such as specialty finance companies, structured-credit vehicles such as CLOs, BDCs, and private investment funds, actively investing in the middle market. We believe the aforementioned changes and restrictions have created a large and growing market opportunity for alternative lenders such as us.
Favorable Capital Markets Trends.
Current and future demand for middle market financings, driven by private equity investment and upcoming maturities are expected to provide us with ample deal flow. Current data from the Refinitiv LPC Middle Market Quarterly Report (as of December 31, 2019) suggests that approximately $597 billion of upcoming loan maturities for middle market companies are due between 2020 and 2026, and the Preqin PE North American Report suggests that there is approximately $700 billion of uninvested private equity capital as of December 31, 2019. We believe these refinancings and uninvested capital will provide a steady flow of attractive opportunities for well-positioned lenders with deep and longstanding sponsor and market relationships, particularly for providers of full capital structure financing solutions.
Investment Strategy
We primarily target loans to U.S.-based middle market companies that require capital for growth, acquisitions, recapitalizations, and refinancings, with a focus on companies controlled by private equity investment firms. In addition, we
7
may also make investments in non-private equity owned public or private companies of various sizes; as well as invest in certain non-U.S.-based borrowers. We seek to partner with strong management teams executing long-term, value-maximizing strategies. Target investments typically exhibit some or all of the following characteristics:
|
•
|
Borrowers with EBITDA of $25—$100 million;
|
|
•
|
Leading market positions;
|
|
•
|
Defensible business strategies with significant barriers to entry;
|
|
•
|
Diversified product offerings, customer bases and supplier profiles;
|
|
•
|
Experienced management teams with successful track records;
|
|
•
|
Significant valuation cushion, typically expressed as a significant equity investment from a financial sponsor;
|
|
•
|
Demonstrated stability and/or growth of revenue;
|
|
•
|
Predictable cash flows with limited risks of disruption;
|
|
•
|
Low capital expenditures requirements; and
|
|
•
|
A North American base of operations.
|
While we believe that the criteria listed above are important in identifying and investing in prospective portfolio companies, not all of these criteria will be necessarily met by each prospective portfolio company. In addition, we may change our investment objective and/or investment criteria over time without notice to or consent from our investors.
Investment Approach and Risk Monitoring of Investments
Our Investment Adviser utilizes a rigorous, systematic and consistent due diligence underwriting process to evaluate all investment opportunities. Our Investment Adviser’s investment teams primarily consist of origination professionals, underwriters and portfolio management professionals. An investment team works on a particular transaction from initial screening through closing, and the same team continues to monitor the credit for the life cycle of the investment.
We view our investment process as consisting of the phases described below:
Origination.
Our Investment Adviser has built a strong direct origination platform. Our Investment Adviser’s origination team sources approximately 1,000 opportunities per year with an ultimate investment rate by us of less than 5% annually. The scale of our Investment Adviser’s origination platform allows us to maximize access to investment opportunities, enhance overall investment selectivity and diversify risks in our portfolio. We further seek to reduce risk by partnering with experienced sponsors with strong track records. We believe lending to companies owned by leading private equity firms (versus non-sponsored companies) has several important and potentially defensive characteristics.
Carlyle's financial sponsor origination team covers over 200 private equity firms, generally organized on a regional basis with offices in Boston, Chicago, Los Angeles and New York. It is their responsibility to source specific opportunities, identify potential loan candidates, and apply creative and flexible solutions to solve clients’ financing needs. Each originator maintains long-standing relationships with potential sources of deal flow and is responsible for covering a specified target market. We believe those originators’ strength and breadth of relationships, combined with our platform's capabilities, allow us to source investments across a wide range of markets enabling our Investment Adviser to be highly selective in recommending investments.
Transaction Screening.
After the senior originator has completed an initial screen, the investment team will prepare and present a screening memo that includes, but is not limited to, a business description, proposed transaction financing structures, preliminary financial analysis (including a cash flow forecast incorporating downside scenarios), debt and equity comparables, and the team's initial assessment of investment merits and key risks and market/industry considerations to a screening committee of senior members of the Direct Lending team (the "Screening Committee"). Based on feedback from the committee, the deal team will prepare and disseminate an outcome email that documents the takeaways from the meeting, including preferred financing structure as well as terms, key diligence items, and next steps.
Underwriting.
Following an indication from the Screening Committee to move forward in the diligence process, the investment team will compile a detailed diligence list and prepare for in-depth credit analysis. During the investment process, the investment team works closely with the private equity sponsor / borrower in all aspects of due diligence. Formal due diligence includes meeting with the management team, reviewing the data room and performing key financial analysis, creating a more
8
detailed financial model with sensitivities across various market environments, reviewing sell-side and third party research including industry reports and financial diligence, following up with industry experts within the Carlyle network for additional feedback and drafting the commitment papers and term sheet. As part of the extensive due diligence process, the investment team fully leverages all internal Carlyle resources to aid in investment decisions. This includes, as needed, speaking to Carlyle Private Equity investment professionals (in accordance with information barrier restrictions), Carlyle operating executives, Carlyle’s Chief Economist & Director of Research, Carlyle’s government affairs professionals, and any executive within Carlyle’s private equity portfolio, which includes over 275 companies worldwide. In addition, the investment team may utilize third party expert networks to supplement its work to gain further insight into company and industry factors from various thought leaders across the company’s markets. This part of the process is iterative and involves re-screening with members of the Investment Adviser's investment committee before seeking final investment committee approval. Over the course of the underwriting process, the investment team crafts a fulsome memo, with diligence completed on a variety of industry, company-specific, financial and legal topics that includes, but is not limited to, the following:
|
•
|
Overview of the opportunity, investment team recommendation, and risks and mitigants
|
|
•
|
Structure, terms and pricing of the proposed facilities
|
|
•
|
Sources and uses and capitalization table
|
|
•
|
Industry diligence, including growth, key trends, risk of disruption, competitive landscape, borrower's market position, fragmentation and consolidation, M&A trends / multiples, barriers to entry and regulatory framework
|
|
•
|
Details on core product and service offering, including revenue visibility and quality, revenue and gross profit build-up by key products / services (including price and volume trends, if applicable), and other relevant sector-specific metrics
|
|
•
|
Customer diligence, including concentration, wallet share, tenure, health of customer base, contract details (if applicable), and sales and marketing strategy
|
|
•
|
Supply chain diligence, including supplier concentration, raw material exposure and logistics
|
|
•
|
Details on operations, including IT and technology, operating footprint (including real estate and leases, if applicable), distribution, and employee base
|
|
•
|
Financial diligence, including cyclicality, seasonality, fixed and variable costs, EBITDA adjustments, capital expenditures, working capital, taxes, foreign exchange exposure, and off-balance sheet liabilities
|
|
•
|
Financial model, including detailed, bottom-up cash flow model with sensitivities for key business risks
|
|
•
|
Debt and equity comparables
|
|
•
|
Details on management team and private equity sponsor (if applicable)
|
|
•
|
Details on legal documentation, including construction of EBITDA, affirmative and negative covenants (including financial covenants), events of default, enforcement of remedies, security and collateral package (including protections around material IP or other key collateral), voting provisions, and other key terms
|
|
•
|
Environmental, regulatory, or legal issues and insurance coverage
|
|
•
|
Adherence with environmental, social and governance policies
|
|
•
|
Items as to which approval is conditional and which require further due diligence and/or subsequent resolution
|
Monitoring.
We view proactive portfolio monitoring as a vital part of the investment process, which includes the continuous review by the portfolio management, underwriting and workout teams, with multiple layers of risk review and oversight. Our Investment Adviser utilizes a proprietary credit surveillance dashboard, an objective rules-based Internal Risk Rating system and proprietary valuation model to assess risk in the portfolio. The portfolio management process involves a variety of ongoing and scheduled reviews that allow for early detection of issues and escalation to the Investment Committee and workout team to avoid credit losses. This process includes detailed weekly portfolio dashboard updates, monthly reviews of watch list credits, quarterly meetings to conduct formal portfolio reviews, focused on technical analysis of financial performance, and portfolio diversification, and ongoing ad-hoc meetings to handle borrower-specific requests, including follow-on transactions and amendments. Our Investment Adviser supplements these processes with additional analyses and projections, including stress scenarios, to assess the potential exposure of our portfolio to variable macroeconomic factors and market conditions. For more information on the Internal Risk Ratings of our portfolio, see Part II, Item 7 of this Form 10-K “
Management’s Discussion and Analysis of Financial Condition and Results of Operations—Portfolio and Investment Activity
.”
9
Portfolio Composition
As of
December 31, 2019
and
2018
, the fair value of our investments was approximately
$2,124 million
and
$1,972 million
, respectively, in
112
and 96 portfolio companies/investment fund, respectively. The type, geography and industry composition of our investments, each as a percentage of the fair value of our investments as of
December 31, 2019
and
2018
, were as follows:
|
|
As of December 31,
|
|||||
|
Type—% of Fair Value
|
2019
|
2018
|
||||
|
First Lien Debt (excluding First Lien/Last Out)
|
74.63
|
%
|
68.12
|
%
|
||
|
First Lien/Last Out Unitranche
|
3.68
|
|
10.29
|
|
||
|
Second Lien Debt
|
11.04
|
|
9.07
|
|
||
|
Equity Investments
|
1.02
|
|
1.25
|
|
||
|
Investment Fund
|
9.63
|
|
11.27
|
|
||
|
Total
|
100.00
|
%
|
100.00
|
%
|
||
|
|
As of December 31,
|
|||||
|
Type—% of Fair Value of First and Second Lien Debt
|
2019
|
2018
|
||||
|
Floating Rate
|
99.73
|
%
|
99.20
|
%
|
||
|
Fixed Rate
|
0.27
|
|
0.80
|
|
||
|
Total
|
100.00
|
%
|
100.00
|
%
|
||
|
|
As of December 31,
|
|||||
|
Geography—% of Fair Value
|
2019
|
2018
|
||||
|
Canada
|
1.93
|
%
|
0.79
|
%
|
||
|
Cyprus
|
0.23
|
|
—
|
|
||
|
Jamaica
|
0.01
|
|
—
|
|
||
|
Luxembourg
|
1.72
|
|
—
|
|
||
|
United Kingdom
|
1.25
|
|
0.49
|
|
||
|
United States
|
94.86
|
|
98.72
|
|
||
|
Total
|
100.00
|
%
|
100.00
|
%
|
||
10
|
|
As of December 31,
|
|||||
|
Industry—% of Fair Value
|
2019
|
2018
|
||||
|
Aerospace & Defense
|
5.17
|
%
|
1.42
|
%
|
||
|
Automotive
|
1.87
|
|
0.33
|
|
||
|
Banking, Finance, Insurance & Real Estate
|
5.42
|
|
6.49
|
|
||
|
Beverage, Food & Tobacco
|
3.82
|
|
3.77
|
|
||
|
Business Services
|
7.89
|
|
8.24
|
|
||
|
Capital Equipment
|
2.12
|
|
—
|
|
||
|
Chemicals, Plastics & Rubber
|
1.27
|
|
1.13
|
|
||
|
Construction & Building
|
0.66
|
|
0.13
|
|
||
|
Consumer Services
|
1.81
|
|
1.51
|
|
||
|
Containers, Packaging & Glass
|
3.21
|
|
2.40
|
|
||
|
Durable Consumer Goods
|
0.55
|
|
0.05
|
|
||
|
Energy: Electricity
|
1.46
|
|
2.18
|
|
||
|
Energy: Oil & Gas
|
0.56
|
|
0.61
|
|
||
|
Environmental Industries
|
2.03
|
|
1.82
|
|
||
|
Forest Products & Paper
|
—
|
|
2.51
|
|
||
|
Healthcare & Pharmaceuticals
|
9.07
|
|
11.82
|
|
||
|
High Tech Industries
|
10.13
|
|
12.24
|
|
||
|
Hotel, Gaming & Leisure
|
4.48
|
|
3.89
|
|
||
|
Investment Fund
|
9.63
|
|
11.27
|
|
||
|
Media: Broadcast & Subscription
|
2.19
|
|
1.08
|
|
||
|
Media: Advertising, Printing & Publishing
|
1.76
|
|
2.98
|
|
||
|
Non-durable Consumer Goods
|
0.09
|
|
2.53
|
|
||
|
Retail
|
2.03
|
|
—
|
|
||
|
Software
|
10.63
|
|
6.30
|
|
||
|
Sovereign & Public Finance
|
1.76
|
|
1.95
|
|
||
|
Telecommunications
|
5.47
|
|
5.78
|
|
||
|
Transportation: Cargo
|
1.99
|
|
3.62
|
|
||
|
Transportation: Consumer
|
1.71
|
|
1.85
|
|
||
|
Wholesale
|
1.22
|
|
2.10
|
|
||
|
Total
|
100.00
|
%
|
100.00
|
%
|
||
See the Consolidated Schedules of Investments as of
December 31, 2019
and
2018
in our consolidated financial statements in Part II, Item 8 of this Form 10-K for more information on these investments, including a list of companies and type, cost and fair value of investments.
Allocation of Investment Opportunities and Potential Conflicts of Interest
An affiliated investment fund, account or other similar arrangement currently formed or formed in the future and managed by our Investment Adviser or its affiliates may have overlapping investment objectives and strategies with our own and, accordingly, may invest in asset classes similar to those targeted by us. This creates potential conflicts in allocating investment opportunities among us and such other investment funds, accounts and similar arrangements, particularly in circumstances where the availability or liquidity of such investment opportunities is limited or where co-investments by us and other funds, accounts or arrangements are not permitted under applicable law, as discussed below.
For example, Carlyle sponsors several investment funds, accounts and other similar arrangements, including, without limitation, structured credit funds, future closed-end registered investment companies, BDCs, carry funds, and managed accounts. The SEC has granted us exemptive relief that permits us and certain of our affiliates to co-invest in suitable negotiated investments (the “Exemptive Relief”). If Carlyle is presented with investment opportunities that generally fall within our investment objective and other board-established criteria and those of other Carlyle funds, accounts or other similar arrangements (including other existing and future affiliated BDCs) whether focused on a debt strategy or otherwise, Carlyle allocates such opportunities among us and such other Carlyle funds, accounts or other similar arrangements in a manner
11
consistent with the Exemptive Relief, our Investment Adviser’s allocation policies and procedures and Carlyle’s other allocation policies and procedures, where applicable, as discussed below. More specifically, investment opportunities in suitable negotiated investments for investment funds, accounts and other similar arrangements managed by our Investment Adviser, and other funds, accounts or similar arrangements managed by affiliated investment advisers that seek to co-invest with us or other Carlyle BDCs, are allocated in accordance with the Exemptive Relief. Investment opportunities for all other investment funds, accounts and other similar arrangements not managed by our Investment Adviser are allocated in accordance with their respective investment advisers’ and Carlyle’s other allocation policies and procedures. Such policies and procedures may result in certain investment opportunities that are attractive to us being allocated to other funds that are not managed by our Investment Adviser. Carlyle’s, including our Investment Adviser’s, allocation policies and procedures are designed to allocate investment opportunities fairly and equitably among its clients over time, taking into account a variety of factors which may include the sourcing of the transaction, the nature of the investment focus of each such other Carlyle fund, accounts or other similar arrangements, each fund’s, account’s or similar arrangement’s desired level of investment, the relative amounts of capital available for investment, the nature and extent of involvement in the transaction on the part of the respective teams of investment professionals, any requirements contained in the governing agreements of the Carlyle funds, accounts or other similar arrangements and other considerations deemed relevant by Carlyle in good faith, including suitability considerations and reputational matters. The application of these considerations may cause differences in the performance of different Carlyle funds, accounts and similar arrangements that have similar strategies.
Because we are a BDC, we are not generally permitted to make loans to companies controlled by Carlyle or other funds managed by Carlyle.
We are also not permitted to make any co-investments with clients of our Investment Adviser or its affiliates (including any fund managed by Carlyle) without complying with our Exemptive Relief, subject to certain exceptions, including with respect to our downstream affiliates. Co-investments made under the Exemptive Relief are subject to compliance with the conditions and other requirements contained in the Exemptive Relief, which could limit our ability to participate in a co-investment transaction. We may also co-invest with funds managed by Carlyle or any of its downstream affiliates, subject to compliance with applicable law and regulations, existing regulatory guidance, and our Investment Adviser’s and Carlyle’s other allocation policies and procedures.
While Carlyle and our Investment Adviser seek to implement their respective allocation processes in a fair and equitable manner under the particular circumstances, there can be no assurance that it will result in equivalent allocation of or participation in investment opportunities or equivalent performance of investments allocated to us as compared to the other entities. In some cases, due to information barriers that are in place, we and other Carlyle investment funds, accounts or other similar arrangements may compete with each other for specific investment opportunities without being aware that they are competing with each other. Carlyle has a conflict system in place above these information barriers to identify potential conflicts early in the process and determine if an allocation decision needs to be made or if an investment is precluded. If the conflicts system detects a potential conflict, the legal and compliance departments of Carlyle assess investment opportunities to determine whether a particular investment opportunity is required to be allocated to a particular investment fund, account or other similar arrangement (including us) or is prohibited from being allocated to a particular investment fund, account or similar arrangement. Subject to a determination by the legal and compliance departments (if applicable), portfolio management teams and, as applicable, the Investment Adviser's allocation committees, are then charged with ensuring that investment opportunities are allocated to the appropriate investment fund, account or similar arrangement in accordance with our Investment Adviser's allocation policies and procedures. In addition, in some cases Carlyle and our Investment Adviser may make investment recommendations to investment funds, accounts and other similar arrangements where the investment funds, accounts and other similar arrangements make the investment independently of Carlyle and our Investment Adviser. As a result, there are circumstances where investments appropriate for us are instead allocated, in whole or in part, to such other investment funds, accounts or other similar arrangements irrespective of our Investment Adviser’s and Carlyle’s other policies and procedures regarding allocation of investments. Where Carlyle otherwise has discretion to allocate investment opportunities among various funds, accounts and other similar arrangements, it should be noted that Carlyle may determine to allocate such investment opportunities away from us.
During periods of unusual market conditions, our Investment Adviser may deviate from its normal trade allocation practices. For example, this may occur with respect to the management of unlevered and/or long-only investment funds, accounts or similar arrangements that are typically managed on a side-by-side basis with levered and/or long-short investment funds, accounts or similar arrangements.
12
Election to be Taxed as a RIC
We have elected to be treated, and intend to continue to qualify annually, as a RIC for U.S. federal income tax purposes under Subchapter M of the Code. As a RIC, we generally will not pay corporate-level U.S. federal income taxes on any net ordinary income or capital gains that we timely distribute to our stockholders as dividends. Instead, dividends we distribute generally will be taxable to the holders of our common stock, and any net operating losses, foreign tax credits and other tax attributes may not pass through to the holders of our common stock. To qualify as a RIC, we must, among other things, meet certain source-of-income and asset diversification requirements (as described below). In addition, we must distribute to our stockholders on an annual basis at least 90% of our investment company taxable income (generally, our net ordinary income plus the excess of our realized net short-term capital gains over realized net long-term capital losses, determined without regard to the dividends paid deduction) for any taxable year (the “Annual Distribution Requirement”). The following discussion assumes that we qualify as a RIC and have satisfied the Annual Distribution Requirement. If we (1) qualify as a RIC, and (2) satisfy the Annual Distribution Requirement, then we are not subject to U.S. federal income tax on the portion of our net taxable income we distribute (or are deemed to distribute) to stockholders. We are subject to U.S. federal income tax at regular corporate rates on any income or capital gains not distributed (or deemed distributed) to our stockholders.
In addition, if we fail to distribute in a timely manner an amount at least equal to the sum of (1) 98% of our ordinary income for the calendar year, (2) 98.2% of our capital gain net income (both long-term and short-term) for the one-year period ending October 31 in that calendar year and (3) any income realized, but not distributed, in the preceding year (the “Excise Tax Distribution Requirements”), we are liable for a 4% excise tax on the portion of the undistributed amounts of such income that are less than the amounts required to be distributed based on the Excise Tax Distribution Requirements. For this purpose, however, any ordinary income or capital gain net income retained by us that is subject to corporate income tax for the tax year ending in that calendar year is considered to have been distributed by year end (or earlier if estimated taxes are paid).
In order to qualify as a RIC for U.S. federal income tax purposes, we must, among other things:
|
•
|
continue to qualify as a BDC under the Investment Company Act at all times during each taxable year;
|
|
•
|
derive in each taxable year at least 90% of our gross income from dividends, interest, payments with respect to loans of certain securities, gains from the sale of stock or other securities or foreign currencies, net income from certain “qualified publicly traded partnerships,” or other income derived with respect to our business of investing in such stock or securities or foreign currencies (the “90% Gross Income Test”); and
|
|
•
|
diversify our holdings so that at the end of each quarter of the taxable year:
|
|
•
|
at least 50% of the value of our assets consists of cash, cash equivalents, U.S. government securities, securities of other RICs, and other securities if such other securities of any one issuer do not represent more than 5% of the value of our assets or more than 10% of the outstanding voting securities of the issuer; and
|
|
•
|
no more than 25% of the value of our assets is invested in the securities, other than U.S. government securities or securities of other RICs, of one issuer, or two or more issuers that are controlled, as determined under applicable Code rules, by us and that are engaged in the same or similar or related trades or businesses, or of certain “qualified publicly traded partnerships” (the “Diversification Tests”).
|
Moreover, our ability to dispose of assets to meet our distribution requirements may be limited by (1) the illiquid nature of our portfolio and/or (2) other requirements relating to our qualification as a RIC, including the Diversification Tests. If we dispose of assets in order to meet the Annual Distribution Requirement or the Excise Tax Distribution Requirements, we may make such dispositions at times that, from an investment standpoint, are not advantageous. If we are prohibited from making distributions or are unable to raise additional debt or equity capital or sell assets to make distributions, we may not be able to make sufficient distributions to satisfy the Annual Distribution Requirement, and therefore would not be able to maintain our qualification as a RIC. Additionally, we may make investments that result in the recognition of ordinary income rather than capital gain, or that prevent us from accruing a long-term holding period. These investments may prevent us from making capital gain distributions as described below. We intend to monitor our transactions, make the appropriate tax elections and make the appropriate entries in our books and records when we make any such investments in order to mitigate the effect of these rules.
A RIC is limited in its ability to deduct expenses in excess of its “investment company taxable income” (which is, generally, ordinary income plus net realized short-term capital gains in excess of net realized long-term capital losses). If our expenses in a given year exceed gross taxable income, we would have a net operating loss for that year. However, a RIC is not permitted to carry forward net operating losses to subsequent years. In addition, expenses can be used only to offset investment
13
company taxable income, not net capital gain. Due to these limits on the deductibility of expenses, we may for U.S. federal income tax purposes have aggregate taxable income for several years that we distribute and that is taxable to our stockholders even if such income is greater than the aggregate net income we actually earned during those years. Such distributions may be made from our cash assets or by liquidation of investments, if necessary. We may realize gains or losses from such liquidations. In the event we realize net capital gains from such transactions, a holder may receive a larger capital gain distribution than the holder would have received in the absence of such transactions.
Regulation
General—Regulation as a Business Development Company
We have elected to be regulated as a BDC under the Investment Company Act and have elected to be treated as a RIC under the Code. A BDC must be organized in the United States for the purpose of investing in or lending to primarily private companies and making significant managerial assistance available to them. A BDC may use capital provided by public stockholders and from other sources to make long-term, private investments in businesses. A publicly-traded BDC provides stockholders with the ability to retain the liquidity of a publicly traded stock while sharing in the possible benefits, if any, of investing in primarily privately owned companies.
We may not change the nature of our business so as to cease to be, or withdraw our election as, a BDC unless authorized by vote of a majority of the outstanding voting securities, as required by the Investment Company Act. A majority of the outstanding voting securities of a company is defined under the Investment Company Act as the lesser of: (a) 67% or more of such company’s voting securities present at a meeting if more than 50% of the outstanding voting securities of such company are present or represented by proxy, or (b) more than 50% of the outstanding voting securities of such company. We do not anticipate any substantial change in the nature of our business.
As with other companies regulated by the Investment Company Act, a BDC must adhere to certain substantive regulatory requirements. A majority of our directors must be persons who are not “interested persons,” as that term is defined in Section 2(a)(19) of the Investment Company Act (such directors are referred to as the “Independent Directors” and the directors who are not Independent Directors are referred to as the “Interested Directors”). We are required to provide and maintain a bond issued by a reputable fidelity insurance company to protect the BDC. Furthermore, as a BDC, we are prohibited from protecting any director or officer against any liability to us or our stockholders arising from willful misfeasance, bad faith, gross negligence or reckless disregard of the duties involved in the conduct of such person’s office.
The Investment Company Act contains prohibitions and restrictions relating to certain transactions between BDCs and certain affiliates (including any investment advisers or sub-advisers), principal underwriters and certain affiliates of those affiliates or underwriters. Because we are a BDC, we are not generally permitted to make loans to companies controlled by Carlyle or other funds managed by Carlyle. We are also not permitted to make any co-investments with our Investment Adviser or its affiliates (including any fund managed by Carlyle) without complying with our Exemptive Relief, subject to certain exceptions, including with respect to our downstream affiliates. Co-investments made under the Exemptive Relief are subject to compliance with the conditions and other requirements contained in the Exemptive Relief, which could limit our ability to participate in a co-investment transaction. We may also co-invest with funds managed by Carlyle or any of its downstream affiliates, subject to compliance with applicable law and regulations, existing regulatory guidance, and our Investment Adviser’s allocation policies and procedures.
As a BDC, we are generally required to meet a minimum “asset coverage” ratio after each issuance of senior securities. “Asset coverage” generally refers to a company’s total assets, less all liabilities and indebtedness not represented by “senior securities,” as defined in the Investment Company Act, divided by total senior securities representing indebtedness and, if applicable, preferred stock. “Senior securities” for this purpose includes borrowings from banks or other lenders, debt securities and preferred stock. On April 9, 2018 and June 6, 2018, our Board of Directors, including a “required majority” (as such term is defined in Section 57(o) of the Investment Company Act), and our stockholders, respectively, approved the application to us of the 150% minimum asset coverage ratio set forth in Section 61(a)(2) of the 1940 Act. As a result, the minimum asset coverage ratio applicable to us was reduced from 200% to 150%, effective as of June 7, 2018, the first day after our 2018 annual meeting of stockholders. See Part I, Item 1A of this Form 10-K
“Risk Factors—Risks Related to Our Business and Structure—New legislation allows us to incur additional leverage.
”
We may invest up to 100% of our assets in securities acquired directly from issuers in privately negotiated transactions. With respect to such securities, we may, for the purpose of public resale, be deemed an “underwriter” as that term is defined in the Securities Act of 1933, as amended (the “Securities Act”). Our intention is to not write (sell) or buy put or call options to manage risks associated with the publicly traded securities of our portfolio companies. We may enter into hedging
14
transactions to manage the risks associated with interest rate and currency fluctuations. We may purchase or otherwise receive warrants or options to purchase the common stock of our portfolio companies in connection with acquisition financings or other investments. In connection with such an acquisition, we may acquire rights to require the issuers of acquired securities or their affiliates to repurchase them under certain circumstances.
We do not intend to acquire securities issued by any investment company that exceed the limits imposed by the Investment Company Act. Under these limits, except for registered money market funds, we generally cannot acquire more than 3% of the voting stock of any investment company, invest more than 5% of the value of our total assets in the securities of one investment company or invest more than 10% of the value of our total assets in the securities of investment companies in the aggregate. The portion of our portfolio invested in securities issued by investment companies ordinarily will subject our stockholders to additional indirect expenses. Our investment portfolio is also subject to diversification requirements by virtue of our intended status to be a RIC for U.S. tax purposes. See Part I, Item 1A of this Form 10-K “
Risk Factors—Risks Related to Our Business and Structure
” for more information.
In addition, investment companies registered under the Investment Company Act and private funds that are excluded from the definition of “investment company” pursuant to either Section 3(c)(1) or 3(c)(7) of the Investment Company Act may not acquire directly or through a controlled entity more than 3% of our total outstanding voting stock (measured at the time of the acquisition), unless the funds comply with an exemption under the Investment Company Act. As a result, certain of our investors may hold a smaller position in our shares than if they were not subject to these restrictions.
We are generally not able to issue and sell our common stock at a price below net asset value ("NAV") per share. See Part I, Item 1A of this Form 10-K
“Risk Factors—Risks Related to Our Business and Structure—Regulations governing our operation as a BDC affect our ability to, and the way in which we will, raise additional capital. As a BDC, the necessity of raising additional capital may expose us to risks, including the typical risks associated with leverage.
” We may, however, sell our common stock, or warrants, options or rights to acquire our common stock, at a price below the then-current NAV of our common stock if our Board of Directors determines that such sale is in our best interests and the best interests of our stockholders, and our stockholders approve such sale. In addition, we may generally issue new shares of our common stock at a price below NAV in rights offerings to existing stockholders, in payment of dividends and in certain other limited circumstances.
We are subject to periodic examination by the SEC for compliance with the Investment Company Act.
As a BDC, we are subject to certain risks and uncertainties. See Part I, Item 1A of this Form 10-K “
Risk Factors—Risks Related to Our Business and Structure.
”
Qualifying Assets
As a BDC, we generally have to invest at least 70% of our total assets in “qualifying assets,” including securities and indebtedness of private U.S. companies and certain public U.S. companies, cash, cash equivalents, U.S. government securities and high-quality debt investments that mature in one year or less. We also may invest up to 30% of our portfolio in non-qualifying assets, as permitted by the Investment Company Act. Specifically, as part of this 30% basket, we may invest in entities that are not considered “eligible portfolio companies” (as defined in the Investment Company Act), including companies located outside of the United States, entities that are operating pursuant to certain exceptions under the Investment Company Act, and publicly traded entities whose public equity market capitalization exceeds the levels provided for under the Investment Company Act.
Managerial Assistance to Portfolio Companies
As a BDC, we must offer, and must provide upon request, significant managerial assistance to certain of our portfolio companies. This assistance could involve, among other things, monitoring the operations of our portfolio companies, participating in board and management meetings, consulting with and advising officers of portfolio companies and providing other organizational and financial guidance. Our Investment Adviser may provide all or a portion of this assistance pursuant to our administration agreement, the costs of which will be reimbursed by us. We may receive fees for these services.
Temporary Investments
Pending investment in other types of “qualifying assets,” as described above, our investments may consist of cash, cash equivalents, U.S. government securities or high-quality debt securities maturing in one year or less from the time of investment, which we refer to, collectively, as “temporary investments,” so that 70% of our assets are qualifying assets. We may also invest in U.S. Treasury bills or in repurchase agreements, provided that such agreements are fully collateralized by
15
cash or securities issued by the U.S. government or its agencies. A repurchase agreement involves the purchase by an investor, such as us, of a specified security and the simultaneous agreement by the seller to repurchase it at an agreed-upon future date and at a price which is greater than the purchase price by an amount that reflects an agreed-upon interest rate. There is no percentage restriction on the proportion of our assets that may be invested in such repurchase agreements. However, if more than 25% of our gross assets constitute repurchase agreements from a single counterparty, we would not meet the diversification tests in order to qualify as a RIC. Thus, we do not intend to enter into repurchase agreements with a single counterparty in excess of this limit. Our Investment Adviser will monitor the creditworthiness of the counterparties with which we enter into repurchase agreement transactions.
Indebtedness and Senior Securities
We are permitted, under specified conditions, to issue multiple classes of indebtedness and one class of stock senior to our common stock if our asset coverage, as defined in the Investment Company Act, is at least equal to 150% immediately after each such issuance. In addition, while any senior securities remain outstanding, we must make provisions to prohibit any distribution to our stockholders or the repurchase of such securities or shares unless we meet the applicable asset coverage ratios at the time of the distribution or repurchase. We may also borrow amounts up to 5% of the value of our total assets for temporary or emergency purposes without regard to asset coverage. For a discussion of the risks associated with leverage, see Part I, Item 1A of this Form 10-K “
Risk Factor—Risks Relating to Our Business and Structure—Regulations governing our operation as a BDC affect our ability to, and the way in which we will, raise additional capital. As a BDC, the necessity of raising additional capital may expose us to risks, including the typical risks associated with leverage.
”
Codes of Ethics
We and our Investment Adviser have each adopted a code of ethics pursuant to Rule 17j-1 under the Investment Company Act and Rule 204A-1 under the Advisers Act, respectively (collectively, the “Rule 17j-1 Codes of Ethics”), which establish procedures for personal investments and restricts certain transactions and apply to, among others, our Chief Executive Officer and Chief Financial Officer. The Rule 17j-1Codes of Ethics generally do not permit investments by personnel subject to them in securities that may be purchased or sold by us. The Rule 17j-1 Code of Ethics are filed with the SEC (www.sec.gov).
We have also adopted a Code of Ethics for Principal Executive and Senior Financial Officers under the Sarbanes-Oxley Act of 2002 (the “SOX Code of Ethics”), which applies to, among others, our Chief Executive Officer and Chief Financial Officer. The SOX Code of Ethics is available free of charge on our website (http://www.tcgbdc.com).
There have been no material changes to the Rule 17j-1 Code of Ethics or the SOX Code of Ethics or material waivers of the code that apply to our Chief Executive Officer or Chief Financial Officer.
Compliance Policies and Procedures
We and our Investment Adviser have each adopted and implemented written policies and procedures reasonably designed to detect and prevent violation of the federal securities laws and are required to review these compliance policies and procedures annually for their adequacy and the effectiveness of their implementation. Our Chief Compliance Officer is responsible for administering these policies and procedures.
Sarbanes-Oxley Act of 2002
The Sarbanes-Oxley Act of 2002, as amended (the “Sarbanes-Oxley Act”) imposes a wide variety of regulatory requirements on publicly-held companies and their insiders. Many of these requirements affect us. For example:
|
•
|
pursuant to Rule 13a-14 of the Securities and Exchange Act of 1934, as amended (the “Exchange Act”), our Chief Executive Officer and Chief Financial Officer must certify the accuracy of the financial statements contained in our periodic reports;
|
|
•
|
pursuant to Item 307 of Regulation S-K, our periodic reports must disclose our conclusions about the effectiveness of our disclosure controls and procedures;
|
|
•
|
pursuant to Rule 13a-15 of the Exchange Act, our management must prepare a report regarding its assessment of our internal control over financial reporting and must obtain an audit of the effectiveness of internal control over financial reporting performed by our independent registered public accounting firm; and
|
|
•
|
pursuant to Item 308 of Regulation S-K and Rule 13a-15 of the Exchange Act, our periodic reports must disclose whether there were significant changes in our internal controls over financial reporting or in other
|
16
factors that could significantly affect these controls subsequent to the date of their evaluation, including any corrective actions with regard to material weaknesses.
The Sarbanes-Oxley Act requires us to review our current policies and procedures to determine whether we comply with the Sarbanes-Oxley Act and the regulations promulgated thereunder. We will continue to monitor our compliance with all regulations that are adopted under the Sarbanes-Oxley Act and will take actions necessary to ensure that we are in compliance therewith.
Proxy Voting Policies and Procedures
We have delegated our proxy voting responsibility to our Investment Adviser. The proxy voting policies and procedures of our Investment Adviser are set forth below. These guidelines are reviewed periodically by our Investment Adviser and our Independent Directors, and, accordingly, are subject to change.
An investment adviser registered under the Advisers Act has a fiduciary duty to act solely in the best interests of its clients. As part of this duty, our Investment Adviser recognizes that it must vote portfolio securities in a timely manner free of conflicts of interest and in the best interests of its clients.
These policies and procedures for voting proxies are intended to comply with Section 206 of, and Rule 206(4)-6 under, the Advisers Act.
Our Investment Adviser will vote proxies relating to our portfolio securities in what it perceives to be the best interest of our stockholders. Our Investment Adviser will review on a case-by-case basis each proposal submitted to a stockholder vote to determine its impact on the portfolio securities held by us. Although our Investment Adviser will generally vote against proposals that may have a negative impact on our portfolio securities, it may vote for such a proposal if there exist compelling long-term reasons to do so.
Our Investment Adviser’s proxy voting decisions will be made by its investment committee. To ensure that the vote is not the product of a conflict of interest, our Investment Adviser will require that: (1) anyone involved in the decision making process disclose to our Investment Adviser’s investment committee, and Independent Directors, any potential conflict that he or she is aware of and any contact that he or she has had with any interested party regarding a proxy vote; and (2) employees involved in the decision making process or vote administration are prohibited from revealing how our Investment Adviser intends to vote on a proposal in order to reduce any attempted influence from interested parties.
Stockholders may obtain information regarding how we voted proxies by making a written request for proxy voting information to: TCG BDC, Inc., c/o Carlyle Global Credit Investment Management L.L.C., 520 Madison Avenue, 40
th
Floor, New York, NY 10022.
Privacy Principles
We endeavor to maintain the privacy of our stockholders and to safeguard their non-public personal information. The following information is provided to help stockholders understand what non-public personal information we collect, how we protect that information and why, in certain cases, we may share that information with select other parties.
We may collect non-public personal information about stockholders from our subscription agreements or other forms, such as name, address, account number and the types and amounts of investments, and information about transactions with us or our affiliates, such as participation in other investment programs, ownership of certain types of accounts or other account data and activity. We may disclose the non-public personal information that we collect from our stockholders or former stockholders, as described above, to our affiliates and service providers and as allowed by applicable law or regulation. Any party that receives this information from us is permitted to use it only for the services required by us and as allowed by applicable law or regulation, and is not permitted to share or use this information for any other purpose. We permit access only by authorized personnel who need access to that non-public personal information to provide services to us and our stockholders. We also maintain physical, electronic and procedural safeguards for non-public personal information that are designed to comply with applicable law.
Compliance with Listing Requirements
Our shares of common stock began trading on the Nasdaq Global Select Market under the symbol “CGBD” on June 14, 2017. As a listed company on the Nasdaq Global Select Market, we are subject to various listing standards including
17
corporate governance listing standards. We monitor our compliance with all listing standards and take actions necessary to ensure that we are in compliance therewith.
Reporting Obligations and Available Information
We furnish our stockholders with annual reports containing audited financial statements, quarterly reports, and such other periodic reports as we determine to be appropriate or as may be required by law. We are required to comply with all periodic reporting, proxy solicitation and other applicable requirements under the Exchange Act.
Our annual reports on Form 10-K, quarterly reports on Form 10-Q, current reports on Form 8-K, Definitive Proxy Statement on Schedule 14A, as well as reports on Forms 3, 4 and 5 regarding directors, officers or 10% beneficial owners of us, filed or furnished pursuant to section 13(a), 15(d) or 16(a) of the Exchange Act, are available free of charge on our website (http://www.tcgbdc.com).
The SEC also maintains a website that contains reports, proxy and information statements, and other information regarding issuers that file electronically with the SEC, including us, which can be accessed at www.sec.gov.
Competition
Our primary competitors in providing financing to middle market companies include public and private funds, other BDCs, commercial and investment banks, collateralized loan obligations, commercial finance companies and, to the extent they provide an alternative form of financing, private equity and hedge funds. Many of our potential competitors are substantially larger and have considerably greater financial, technical and marketing resources than we do. For example, some competitors may have a lower cost of funds and access to funding sources that will not be available to us. In addition, some of our competitors may have higher risk tolerances or different risk assessments than we do, which could allow them to consider a wider variety of investments and establish more relationships than us. Furthermore, many of our competitors are not subject to the regulatory restrictions that the Investment Company Act and the Code impose on us. We cannot assure you that the competitive pressures we will face will not have a material adverse effect on our business, financial condition and results of operations. Also, as a result of this competition, we may not be able to take advantage of attractive investment opportunities from time to time, and we can offer no assurance that we will be able to identify and make investments that are consistent with our investment objective.
We expect to use the expertise of the members of our Investment Adviser’s investment committee and its investment team to assess investment risks and determine appropriate pricing for our investments. In addition, we expect that extensive direct origination resources, broad product capabilities, ability to commit capital in scale and the depth of expertise of our Investment Adviser’s investment team will enable us to learn about and compete effectively for, financing opportunities with attractive middle market companies in the industries in which we seek to invest. For additional information concerning the competitive risks we face, see Part I, Item 1A of this Form 10-K
“Risk Factors—Risks Related to Our Investments—We operate in a highly competitive market for investment opportunities, and compete with investment vehicles sponsored or advised by our affiliates”.
Staffing
We do not currently have any employees. Our interim Treasurer and principal accounting officer, a Managing Director of Carlyle, and our Chief Compliance Officer and Secretary, a Vice President of Carlyle, are retained by our Administrator pursuant to the Carlyle Sub-Administration Agreement. Each of these professionals performs their respective functions for us under the terms of our Administration Agreement.
Our day-to-day investment operations are managed by our Investment Adviser. Pursuant to its personnel agreement with Carlyle Employee Co., our Investment Adviser has access to the members of its investment committee, and a team of additional experienced investment professionals who, collectively, comprise the Investment Adviser’s investment team. Our Investment Adviser may hire additional investment professionals to provide services to us.
18
Item 1A. Risk Factors
An investment in the Company involves a high degree of risk. You should carefully consider these risk factors, together with all of the other information included in this report, before you decide whether to make an investment in the Company. There can be no assurance that the Company’s investment objective will be achieved or that an investor will receive a return of its capital. In addition, there will be occasions when the Investment Adviser and its affiliates may encounter potential conflicts of interest in connection with the Company. The risks set out below are not the only risks we face. Additional risks and uncertainties not currently known to us or that we currently deem to be immaterial also may materially adversely affect our business, financial condition and/or operating results. The following considerations, in addition to the considerations set forth elsewhere herein, should be carefully evaluated before making an investment in the Company. If any of the following events occur, our business, financial condition and operating result could be materially and adversely affected. In such case, the NAV and the trading price of our common stock and the trading price, if any, of any other securities that we may issue could decline, and you may lose all or part of your investment.
Risks Related to Our Business and Structure
Capital markets may experience periods of disruption and instability. These market conditions may materially and adversely affect debt and equity capital markets in the United States and abroad, which may have a negative impact on our business and operations.
The U.S. and global capital markets have in the past, and may in the future, experience periods of extreme volatility and disruption during economic downturns and recessions. Increases to budget deficits or direct and contingent sovereign debt may create concerns about the ability of certain nations to service their sovereign debt obligations and any risks resulting from any such debt crisis in Europe, the U.S. or elsewhere could have a detrimental impact on the global economy, sovereign and non-sovereign debt in certain countries and the financial condition of financial institutions generally. Austerity measures that certain countries may agree to as part of any debt crisis or disruptions to major financial trading markets may adversely affect world economic conditions, our business and the businesses of our portfolio companies. In June 2016, the United Kingdom held a referendum in which voters approved an exit from the European Union (“Brexit”). The UK officially left the EU on January 31, 2020 and an 11-month transition period commenced to obtain a new trade agreement. The implications of the withdrawal and the pending trade agreement are unclear. Disruptions in the capital markets, which may be caused by political trends and government actions in the U.S. and elsewhere, could adversely affect our business, the businesses of our portfolio companies, and the broader financial and credit markets. Disruptions may also reduce the availability of debt and equity capital for the market as a whole and to financial firms in particular. At various times, such disruptions have resulted in, and may in the future result in, a lack of liquidity in parts of the debt capital markets, significant write-offs in the financial services sector and the repricing of credit risk. Such conditions may occur for a prolonged period of time again, and may materially worsen in the future, including as a result of U.S. government shutdowns, or future downgrades to the U.S. government's sovereign credit rating or the perceived credit worthiness of the U.S. or other large global economies. Unfavorable economic conditions, including future recessions, could also increase our funding costs, limit our access to the capital markets, or result in a decision by lenders no to extend credit to us. These conditions may cause us to reduce the volume of loans we originate and/or fund, adversely affect the value of our portfolio investments or otherwise have a material adverse effect on our business, financial condition, results of operations and cash flows.
Economic recessions or downturns could impair our portfolio companies and harm our operating results.
Many of the portfolio companies in which we make investments may be susceptible to economic slowdowns or recessions and may be unable to repay the loans we made to them during these periods. Therefore, our non-performing assets may increase and the value of our portfolio may decrease during these periods as we are required to record our investments at their current fair value. Adverse economic conditions also may decrease the value of collateral securing some of our loans and the value of our equity investments. Economic slowdowns or recessions could lead to financial losses in our portfolio and a decrease in revenues, net income and assets. Unfavorable economic conditions also could increase our and our portfolio companies’ funding costs, limit our and our portfolio companies’ access to the capital markets or result in a decision by lenders not to extend credit to us or our portfolio companies. These events could prevent us from increasing investments and harm our operating results.
A portfolio company’s failure to satisfy financial or operating covenants imposed by us or other lenders could lead to defaults and, potentially, acceleration of the time when the loans are due and foreclosure on its secured assets, which could trigger cross-defaults under other agreements and jeopardize the portfolio company’s ability to meet its obligations under the debt that we hold. We may incur additional expenses to the extent necessary to seek recovery upon default or to negotiate new terms with a defaulting portfolio company. In addition, if one of our portfolio companies were to go bankrupt, depending on the
19
facts and circumstances, including the extent to which we will actually provide significant managerial assistance to that portfolio company, a bankruptcy court might subordinate all or a portion of our claim to that of other creditors.
Changes to U.S. tariff and import/export regulations may have a negative effect on our portfolio companies and, in turn, harm us.
There has been ongoing discussion and commentary regarding potential, significant changes to U.S. trade policies, treaties and tariffs, resulting in significant uncertainty about the future relationship between the United States and other countries with respect to trade policies, treaties and tariffs. These developments, or the perception that any of them could occur, may have a material adverse effect on global economic conditions and the stability of global financial markets, and may significantly reduce global trade and, in particular, trade between the impacted nations and the United States. Any of these factors could depress economic activity and restrict our portfolio companies’ access to suppliers or customers and have a material adverse effect on their business, financial condition and results of operations, which in turn would negatively impact us.
We are dependent upon our Investment Adviser for our future success.
We do not have any employees. We depend on the diligence, skill and network of business contacts of our Investment Adviser’s investment professionals and CDL to source appropriate investments for us. We depend on members of our Investment Adviser’s investment team to appropriately analyze our investments and our Investment Adviser’s investment committee to approve and monitor our middle market portfolio investments. Our Investment Adviser’s investment committee, together with the other members of its investment team, evaluate, negotiate, structure, close and monitor our investments. Our future success will depend on the continued availability of the members of our Investment Adviser’s investment committee and the other investment professionals available to our Investment Adviser. Neither we nor our Investment Adviser has employment agreements with these individuals or other key personnel, and we cannot provide any assurance that unforeseen business, medical, personal or other circumstances would not lead any such individual to terminate his or her relationship with us. The loss of any senior investment professionals to which our Investment Adviser has access, including members of our Investment Adviser's investment committee, or a significant number of the investment professionals of our Investment Adviser, could have a material adverse effect on our ability to achieve our investment objective as well as on our financial condition and results of operations. In addition, we cannot assure you that CGCIM will remain our investment adviser or that we will continue to have access to Carlyle’s investment professionals or its information and deal flow. If, due to extraordinary market conditions or other reasons, we and other funds managed by our Investment Adviser or its affiliates were to incur substantial losses, the revenues of our Investment Adviser and its affiliates may decline substantially. Such losses may hamper our Investment Adviser's and its affiliates' ability to provide the same level of service to us as it would have. Further, there can be no assurance that CGCIM will replicate its own or Carlyle’s historical success, and we caution you that our investment returns could be substantially lower than the returns achieved by other Carlyle-managed funds.
Our financial condition, results of operations and ability to achieve our investment objective depend on our ability to source investments, access financing and manage future growth effectively.
Our ability to achieve our investment objective and to grow depends on our ability to acquire suitable investments and monitor and administer those investments, which depends, in turn, on our Investment Adviser’s ability to identify, invest in and monitor companies that meet our investment criteria.
Accomplishing this result on a cost-effective basis is largely a function of our Investment Adviser’s structuring of the investment process, its ability to provide competent, attentive and efficient services to us and its ability to access financing for us on acceptable terms. Our Investment Adviser’s investment team has substantial responsibilities under the investment advisory agreement between us and our Investment Adviser (the “Investment Advisory Agreement”) and in connection with managing us and certain other investment funds and accounts advised by our Investment Adviser, and may also be called upon to provide managerial assistance to our portfolio companies. These demands on their time, which will increase as the number of investments grow, may distract them or slow the rate of investment. In order for us to grow, Carlyle will need to hire, train, supervise, manage and retain new employees. However, we can offer no assurance that any such investment professionals will contribute effectively to the work of our Investment Adviser. Any failure to manage our future growth effectively could have a material adverse effect on our business, financial condition and results of operations.
We may need to raise additional capital to grow because we must distribute most of our income.
We may need additional capital to fund growth in our investments, and a reduction in the availability of new capital could limit our ability to grow. We have elected to be treated, and intend to qualify annually, as a RIC for U.S. federal income tax purposes under Subchapter M of the Code. To maintain our status as a RIC, among other requirements, we must distribute
20
on a timely basis at least 90% of our investment company taxable income to our stockholders to maintain our RIC status. As a result, any such cash earnings may not be available to fund investment originations or repay maturing debt.
We have borrowed under the credit facilities and through the issuance of debt securities and in the future may borrow under additional debt facilities from financial institutions. On May 24, 2013, our wholly owned subsidiary, the SPV, entered into a senior secured revolving credit facility (as amended, the “SPV Credit Facility”) with a maximum principal amount of $400 million. In addition, on March 21, 2014, we entered into a senior secured revolving credit facility (as amended, the “Credit Facility” and, together with the SPV Credit Facility, the “Facilities”) with a maximum principal amount of $593 million. Further, on June 26, 2015, we completed a $400 million term debt securitization (the “2015-1 Debt Securitization”). The notes offered in the 2015-1 Debt Securitization (the “2015-1 Notes”) were issued by the 2015-1 Issuer, our wholly owned and consolidated subsidiary. On August 30, 2018, the 2015-1 Issuer refinanced the 2015-1 Debt Securitization (the “2015-1 Debt Securitization Refinancing”) by redeeming in full the 2015-1 Notes and issuing new notes (the “2015-1R Notes”) for $449.2 million as wart of a $550 million securitization. On December 30, 2019, we closed a private offering of $115 million in aggregate principal amount of 4.750% senior unsecured notes due December 31, 2024 (the “Senior Notes”).
We expect to issue additional debt and equity securities to fund our growth. If we fail to obtain funds from such sources or from other sources to fund our investments, it could limit our ability to grow, which may have an adverse effect on the value of our securities. We may pursue growth through acquisitions or strategic investments in new businesses. Completion and timing of any such acquisitions or strategic investments may be subject to a number of contingencies and risks. There can be no assurance that the integration of an acquired business will be successful or that an acquired business will prove to be profitable or sustainable.
In addition, as a BDC, our ability to borrow or issue preferred stock may be restricted if our total assets are less than 150% of our total borrowings and preferred stock. Furthermore, equity capital may be difficult to raise because, subject to some limited exceptions, as a BDC, we are generally not able to issue additional shares of our common stock at a price per share less than NAV without first obtaining approval for such issuance from our stockholders and our Independent Directors.
Any failure on our part to maintain our status as a BDC or RIC would reduce our operating flexibility, may hinder our achievement of our investment objective, may limit our investment choices and may subject us to greater regulation.
The Investment Company Act imposes numerous constraints on the operations of BDCs and RICs that do not apply to other types of investment vehicles. For example, under the Investment Company Act, we are required as a BDC to invest at least 70% of our total assets in specified types of “qualifying assets,” primarily in private U.S. companies or thinly-traded U.S. public companies, cash, cash equivalents, U.S. government securities and other high quality debt investments that mature in one year or less. In addition, in order to continue to qualify as a RIC for U.S. federal income tax purposes, we are required to satisfy certain source-of-income, diversification and distribution requirements. These constraints, among others, may hinder our ability to take advantage of attractive investment opportunities and to achieve our investment objective. See Part I, Item 1 of this Form 10-K “
Business—Election to be Taxed as a RIC
.”
Furthermore, any failure to comply with the requirements imposed on us as a BDC by the Investment Company Act could cause the SEC to bring an enforcement action against us and/or expose us to claims of private litigants. In addition, upon approval of a majority of our outstanding voting securities as required by the Investment Company Act, we may elect to withdraw our status as a BDC. If we decide to withdraw our election, or if we otherwise fail to qualify, or maintain our qualification, as a BDC, we might be regulated as a closed-end investment company that is required to register under the Investment Company Act, which would subject us to additional regulatory restrictions, significantly decrease our operating flexibility and could significantly increase our cost of doing business. In addition, any such failure could cause an event of default under our outstanding indebtedness, which could have a material adverse effect on our business, financial condition or results of operations.
Regulations governing our operation as a BDC affect our ability to, and the way in which we will, raise additional capital. As a BDC, the necessity of raising additional capital may expose us to risks, including the typical risks associated with leverage.
We may issue debt securities or preferred stock and/or borrow money from banks or other financial institutions, which we refer to collectively as “senior securities,” up to the maximum amount permitted by the Investment Company Act. In addition, we may seek to securitize certain of our loans. Under the provisions of the Investment Company Act, we are permitted, as a BDC, to issue senior securities only in amounts such that our asset coverage ratio, as defined in the Investment Company Act, equals at least 150% of total assets less all liabilities and indebtedness not represented by senior securities, after each issuance of senior securities. If the value of our assets declines, we may be unable to satisfy this test, which may prohibit us from paying dividends and could prevent us from maintaining our status as a RIC or may prohibit us from repurchasing
21
shares of our common stock. If that happens, we may be required to sell a portion of our investments and, depending on the nature of our leverage, repay a portion of our indebtedness at a time when such sales may be disadvantageous. Accordingly, any failure to satisfy this test could have a material adverse effect on our business, financial condition or results of operations. As of
December 31, 2019
, our asset coverage calculated in accordance with the Investment Company Act was
181.01%
. Also, any amounts that we use to service our indebtedness would not be available for distributions to our common stockholders. Furthermore, as a result of issuing senior securities, our common stockholders would also be exposed to typical risks associated with increased leverage, including an increased risk of loss resulting from increased indebtedness.
If we issue preferred stock, the preferred stock would rank “senior” to common stock in our capital structure, preferred stockholders would have separate voting rights on certain matters and might have other rights, preferences, or privileges more favorable than those of our common stockholders, and the issuance of preferred stock could have the effect of delaying, deferring or preventing a transaction or a change of control that might involve a premium price for holders of our common stock or otherwise be in their best interest.
We are not generally able to issue and sell our common stock at a price below the NAV per share. We may, however, sell our common stock, or warrants, options or rights to acquire our common stock, at a price below the then-current NAV per share of our common stock if our Board determines that such sale is in the best interests of us and our stockholders and our stockholders approve such sale. In any such case, the price at which our securities are to be issued and sold may not be less than a price that, in the determination of our Board of Directors, closely approximates the market value of such securities (less any distributing commission or discount). If we raise additional funds by issuing more common stock, or senior securities convertible into, or exchangeable for, our common stock, then the percentage ownership of our stockholders at that time will decrease, and holders of our common stock might experience dilution.
We borrow money, which magnifies the potential for gain or loss on amounts invested and may increase the risk of investing in us.
As part of our business strategy, we, including through our wholly owned subsidiaries, borrow from and issue senior debt securities to banks, insurance companies and other lenders. Holders of these loans or senior securities would have fixed-dollar claims on our assets that are superior to the claims of our stockholders. If the value of our assets decreases, leverage will cause our NAV to decline more sharply than it otherwise would have without leverage. Similarly, any decrease in our income would cause our net income to decline more sharply than it would have if we had not borrowed. This decline could negatively affect our ability to make dividend payments on our common stock.
Our ability to service our borrowings depends largely on our financial performance and is subject to prevailing economic conditions and competitive pressures. In addition, our management fees are payable based on our gross assets, including assets acquired through the use of leverage (but excluding cash and any temporary investments in cash-equivalents), which may give our Investment Adviser an incentive to use leverage to make additional investments. See
“—We may be obligated to pay our Investment Adviser incentive compensation even if we incur a loss.”
The amount of leverage that we employ will depend on our Investment Adviser’s and our Board of Directors’ assessment of market and other factors at the time of any proposed borrowing. We cannot assure you that we will be able to continue to obtain credit at all or on terms acceptable to us.
In addition to having fixed-dollar claims on our assets that are superior to the claims of our common stockholders, obligations to lenders may be secured by a first priority security interest in our portfolio of investments and cash. In the case of a liquidation event, those lenders would receive proceeds to the extent of their security interest before any distributions are made to our stockholders under certain circumstances. In addition, as the holder of the preferred interests issued by the 2015-1 Issuer (the “2015-1 Issuer Preferred Interests”) on the closing date of the 2015-1 Debt Securitization in exchange for our contribution to the 2015-1 Issuer of the initial closing date loan portfolio (i.e., the subordinated class of the 2015-1 Securitization), we may be required to absorb losses with respect to the 2015-1 Debt Securitization.
Our Facilities, the Senior Notes and the 2015-1R Notes impose financial and operating covenants that restrict our business activities, remedies on default and similar matters. As of
December 31, 2019
, we were in material compliance with the operating and financial covenants of our Facilities, the Senior Notes and the 2015-1 Notes. However, our continued compliance with these covenants depends on many factors, some of which are beyond our control. Accordingly, although we believe we will continue to be in compliance, we cannot assure you that we will continue to comply with the covenants in our Facilities, the Senior Notes and the 2015-1R Notes. Failure to comply with these covenants could result in a default. If we were unable to obtain a waiver of a default from the lenders or holders of that indebtedness, as applicable, those lenders or holders could accelerate repayment under that indebtedness, which may result in cross-acceleration of other indebtedness. An acceleration
22
could have a material adverse impact on our business, financial condition and results of operations. Lastly, we may be unable to obtain additional leverage, which would, in turn, affect our return on capital.
As of
December 31, 2019
, we had a combined
$1,181 million
of outstanding consolidated indebtedness under our Facilities, Senior Notes and 2015-1R Notes. Our annualized interest cost as of
December 31, 2019
, was
4.01%
, excluding fees (such as fees on undrawn amounts and amortization of upfront fees). Since we generally pay interest at a floating rate on our Facilities and 2015-1R Notes, an increase in interest rates will generally increase our borrowing costs.
The following table illustrates the effect of leverage on returns from an investment in our common stock assuming various annual returns on our portfolio, net of expenses. The calculations in the table below are hypothetical, and actual returns may be higher or lower than those appearing in the table below.
|
Assumed Return on Our
Portfolio
(Net of Expenses)
|
|||||||||
|
Assumed annual returns on the Company's portfolio (net of expenses)
|
(10)%
|
(5)%
|
0%
|
5%
|
10%
|
||||
|
Corresponding return to common stockholder
(1)
|
(27.83)%
|
(16.39)%
|
(4.95)%
|
6.48%
|
17.92%
|
||||
|
(1)
|
Assumes, as of
December 31, 2019
, (i)
$2,187.5 million
in total assets, (ii)
$1,181 million
in outstanding indebtedness, (iii)
$956 million
in net assets and (iv) weighted average effective annual interest rate, excluding fees (such as fees on undrawn amounts and amortization of financing costs), of
4.01%
.
|
Based on an outstanding indebtedness of
$1,181 million
as of
December 31, 2019
, and the weighted average effective annual interest rate, excluding fees (such as fees on undrawn amounts and amortization of financing costs), of
4.01%
as of that date, our investment portfolio at fair value would have had to produce an annual return of approximately 2.17% to cover annual interest payments on the outstanding debt. For more information on our indebtedness, see Part II, Item 7 of this Form 10-K “
Management’s Discussion and Analysis of Financial Condition and Results of Operations—Financial Condition, Liquidity and Capital Resources.
”
Our indebtedness could adversely affect our business, financial conditions or results of operations.
We cannot assure you that our business will generate sufficient cash flow from operations or that future borrowings will be available to us under our credit facilities or otherwise in an amount sufficient to enable us to repay our indebtedness or to fund our other liquidity needs. We may need to refinance all or a portion of our indebtedness on or before it matures. We cannot assure you that we will be able to refinance any of our indebtedness on commercially reasonable terms or at all. If we cannot service our indebtedness, we may have to take actions such as selling assets or seeking additional equity. We cannot assure you that any such actions, if necessary, could be effected on commercially reasonable terms or at all, or on terms that would not be disadvantageous to our stockholders or on terms that would not require us to breach the terms and conditions of our existing or future debt agreements.
Changes in interest rates may increase our cost of capital, reduce the ability of our portfolio companies to service their debt obligations and decrease our net investment income.
General interest rate fluctuations and changes in credit spreads on floating rate loans may have a substantial negative impact on our investments and investment opportunities and, accordingly, may have a material adverse effect on our rate of return on invested capital, our net investment income and our NAV. Substantially all of our debt investments have variable interest rates that reset periodically based on benchmarks such as the London Interbank Offered Rate (“LIBOR” or “L”) and the U.S. Prime Rate (“Prime Rate” or “P”), so an increase in interest rates from their historically low present levels may make it more difficult for our portfolio companies to service their obligations under the debt investments that we hold. Rising interest rates could also cause portfolio companies to shift cash from other productive uses to the payment of interest, which may have a material adverse effect on their business and operations and could, over time, lead to increased defaults. Furthermore, because we typically borrow money to make investments, our net investment income depends, in part, upon the difference between the rate at which we borrow funds and the rate at which we invest those funds. As a result, we can offer no assurance that a significant change in market interest rates will not have a material adverse effect on our net investment income to the extent we use debt to finance our investments. In periods of rising interest rates, our cost of funds would increase, which could reduce our net investment income.
In general, rising interest rates will negatively impact the price of a fixed rate debt instrument and falling interest rates will have a positive impact on price. Adjustable rate instruments also react to interest rate changes in a similar manner, although generally to a lesser degree (depending, however, on the characteristics of the reset terms, including the index chosen,
23
frequency of reset and reset caps or floors, among other factors). Interest rate sensitivity is generally more pronounced and less predictable in instruments with uncertain payment or prepayment schedules.
In addition, a rise in the general level of interest rates can be expected to lead to higher interest rates applicable to our debt investments. Accordingly, an increase in interest rates would make it easier for us to meet or exceed the incentive fee hurdle rate in our Investment Advisory Agreement and may result in a substantial increase in the amount of incentive fees payable to our Investment Adviser with respect to our pre-incentive fee net investment income. Also, an increase in interest rates available to investors could make an investment in our common stock less attractive if we are not able to increase our distribution rate, which could reduce the value of our common stock.
Changes in or the discontinuation of LIBOR may adversely affect our business and results of operations.
On July 27, 2017, the U.K. Financial Conduct Authority announced that it intends to stop persuading or compelling banks to submit LIBOR rates after 2021. At this time, it is not possible to predict the effect of any such changes, any establishment of alternative reference rates or any other reforms to LIBOR that may be enacted in the United Kingdom or elsewhere. It is possible that banks will not continue to provide submissions for the calculation of LIBOR. Similarly, it is not possible to predict whether LIBOR will continue to be viewed as an acceptable market benchmark, what rate or rates may become accepted alternatives to LIBOR, or what the effect of any such changes in views or alternatives may have on the financial markets for LIBOR-linked financial instruments.
To identify a successor rate for U.S. dollar LIBOR, the Alternative Reference Rates Committee ("ARRC"), a U.S.-based group convened by the Federal Reserve and the Federal Reserve Bank of New York, was formed. Financial regulators in the United Kingdom, the European Union, Japan and Switzerland also formed working groups with the aim of recommending alternatives to LIBOR denominated in their local currencies. The ARRC has identified the Secured Overnight Financing Rate ("SOFR") as its preferred alternative rate for LIBOR. SOFR is a measure of the cost of borrowing cash overnight, collateralized by U.S. Treasury securities, and is based on directly observable U.S. Treasury-backed repurchase transactions. Although SOFR appears to be the preferred replacement rate for U.S. dollar LIBOR, it is unclear if other benchmarks may emerge or if other rates will be adopted outside the U.S.
The expected discontinuance of LIBOR may require us to renegotiate the credit agreements extending beyond 2021 with our portfolio companies that utilize LIBOR as a factor in determining the interest rate, in order to replace LIBOR with the new standard that is established, which may have an adverse effect on our ability to receive attractive returns.
In addition, if LIBOR ceases to exist, we may need to renegotiate certain terms of our Facilities and 2015-R Notes. If we are unable to do so, amounts outstanding under the Facilities and 2015-R Notes may bear interest at a higher rate, which would increase the cost of our borrowings and, in turn, affect our return on capital.
Depending on several factors, including those set forth above, and the related costs of negotiating and documenting necessary changes to documentation, our business, financial condition and results of operations could be materially adversely impacted by the market transition or reform of certain reference rates and benchmarks. Other factors include the pace of the transition to replacement or reformed rates, the specific terms and parameters for and market acceptance of any alternative reference rates, prices and liquidity of trading markets for products based on alternative reference rates, and our ability to transition and develop appropriate systems and analytics for one or more alternative reference rates.
We may experience fluctuations in our quarterly results.
We could experience fluctuations in our quarterly operating results due to a number of factors, including, the pace at which investments are made, the interest rate payable on the debt securities we acquire, the default rate on such securities, rates of repayment, the level of our expenses, variations in and the timing of the recognition of realized and unrealized gains or losses and changes in unrealized appreciation or depreciation, the degree to which we encounter competition in our markets and general economic conditions. As a result of these factors, results for any period should not be relied upon as being indicative of performance in future periods.
There are significant potential conflicts of interest, including the management of other investment funds and accounts by our Investment Adviser, which could impact our investment returns.
Our executive officers and directors, other current and future principals of our Investment Adviser and certain members of our Investment Adviser’s investment committee currently serve, and may continue to service, as officers, directors or principals of other entities and affiliates of our Investment Adviser and funds managed by our affiliates that operate in the same or a related line of business as we do. Currently, our executive officers, as well as the other principals of our Investment
24
Adviser manage other funds affiliated with Carlyle, including other existing and future affiliated BDCs, including TCG BDC II, Inc. (“BDC II”). In addition, our Investment Adviser’s investment team has responsibilities for sourcing and managing U.S. middle market debt investments for certain other investment funds and accounts. Accordingly, they have obligations to investors in those entities, the fulfillment of which may not be in the best interests of, or may be adverse to the interests of, us or our stockholders. Although the professional staff of our Investment Adviser will devote as much time to our management as appropriate to enable our Investment Adviser to perform its duties in accordance with the Investment Advisory Agreement, the investment professionals of our Investment Adviser may have conflicts in allocating their time and services among us, on the one hand, and investment vehicles managed by Carlyle or one or more of its affiliates on the other hand.
Our Investment Adviser and its affiliated investment managers may face conflicts in allocating investment opportunities between us and affiliated investment vehicles that have overlapping objectives with ours. For example, certain affiliated investment vehicles may have arrangements that provide for higher management or incentive fees, greater expense reimbursements or overhead allocations, or permit the Investment Adviser and its affiliates to receive transaction fees not permitted under the Investment Company Act, all of which may contribute to this conflict of interest and create an incentive for our Investment Adviser or its affiliated managers to favor such other accounts. Furthermore, our Investment Adviser and its affiliated investment managers may form vehicles for the benefit of third-party investors that will be entitled to a portion of the allocation with respect to an investment. Such co-investment rights could result in us being allocated a smaller share of an investment than would otherwise be the case in the absence of such co-investment rights. Although our Investment Adviser will endeavor to allocate investment opportunities in a fair and equitable manner in accordance with its allocation policies and procedures, it is possible that, in the future, we may not be given the opportunity to participate in investments made by investment funds managed by our Investment Adviser or an investment manager affiliated with our Investment Adviser, including Carlyle.
We and our affiliates own, and may continue to own, investments at different levels of a portfolio company’s capital structure or otherwise own different classes of a portfolio company’s securities, which may give rise to conflicts of interest or perceived conflicts of interest. Conflicts may also arise because portfolio decisions regarding our portfolio may benefit our affiliates. Our affiliates may pursue or enforce rights with respect to one of our portfolio companies, and those activities may have an adverse effect on us.
It is possible that Carlyle or an affiliated investment vehicle will invest in a company that is or becomes a competitor of a portfolio company of ours. Such investment could create a conflict between us, on the one hand, and Carlyle or the affiliated investment vehicle, on the other hand. In such a situation, Carlyle or our Investment Adviser may also have a conflict in the allocation of its own resources to our portfolio company. In addition, certain affiliated investment vehicles will be focused primarily on investing in other funds that may have strategies that overlap and/or directly conflict and compete with us.
As a result of the expansion of Carlyle’s platform into various lines of business in the alternative asset management industry, Carlyle is subject to a number of actual and potential conflicts of interest and subject to greater regulatory oversight than that to which it would otherwise be subject if it had just one line of business. In addition, as Carlyle expands its platform, the allocation of investment opportunities among its investment funds, including us, is expected to become more complex. In addressing these conflicts and regulatory requirements across Carlyle’s various businesses, Carlyle has implemented, and may continue to implement, certain policies and procedures. For example, Carlyle has established an information barrier between Carlyle Global Credit, on the one hand, and the rest of Carlyle, on the other, which restricts the communications of Carlyle Global Credit with other Carlyle investment professionals pursuant to the information barrier policy. In addition, we may come into possession of material non-public information with respect to issuers in which we may be considering making an investment. As a consequence, we may be precluded from providing such information or other ideas to other funds affiliated with Carlyle that may benefit from such information or we may be precluded from otherwise consummating a contemplated investment. To the extent we or any other funds affiliated with Carlyle fail to appropriately deal with any such conflicts, it could negatively impact our reputation or Carlyle’s reputation and our ability to raise additional funds and the willingness of counterparties to do business with us or result in potential litigation against us.
In the ordinary course of business, we enter, and may continue to enter, into transactions with affiliates and portfolio companies that may be considered related party transactions. We have implemented certain policies and procedures whereby certain of our executive officers screen each of our transactions for any possible affiliations between the proposed portfolio investment, us and other affiliated persons, including our Investment Adviser, stockholders that own more than 5% of us, employees, officers and directors of us and our Investment Adviser and certain persons directly or indirectly controlling, controlled by or under common control with the foregoing persons. We will not enter into any agreements unless and until we are satisfied that doing so will not raise concerns under the Investment Company Act or, if such concerns exist, we have taken appropriate actions to seek Board of Directors review and approval or SEC exemptive relief for such transaction.
25
In the course of our investing activities, we pay management and incentive fees to our Investment Adviser and reimburse our Investment Adviser for certain expenses it incurs in accordance with our Investment Advisory Agreement. The base management fee is based on our gross assets and the incentive fee is paid on income, both of which include leverage. As a result, investors in our common stock invest on a “gross” basis and receive distributions on a “net” basis after expenses, resulting in a lower rate of return than an investor might achieve through direct investments. Because these fees are based on gross assets, our Investment Adviser benefits to the extent we incur debt or use leverage. Accordingly, there may be times when the senior management team of our Investment Adviser has interests that differ from those of our stockholders, giving rise to a conflict.
In addition, we pay our Administrator, an affiliate of our Investment Adviser, its costs and expenses and our allocable portion of overhead incurred by it in performing its obligations under the Administration Agreement, including, compensation paid to or compensatory distributions received by our officers (including our Chief Compliance Officer and Chief Financial Officer) and their respective staff who provide services to us, operations staff who provide services to us, and internal audit staff in their role of performing our Sarbanes-Oxley Act internal control assessment. These arrangements create conflicts of interest that our Board of Directors monitors. Despite Carlyle’s good faith judgment to arrive at a fair and reasonable expense allocation methodology, the use of any particular methodology may lead us to bear relatively more expense in certain instances and relatively less in other instances compared to what we would have borne if a different methodology had been used. However, Carlyle seeks to make allocations that are equitable on an overall basis in its good faith judgment.
We may be obligated to pay our Investment Adviser incentive compensation even if we incur a loss.
Our Investment Adviser is entitled to incentive compensation for each calendar quarter in an amount equal to a percentage of the excess of our pre-incentive fee net investment income for that quarter (before deducting incentive compensation) above a performance threshold for that quarter. In calculating our performance threshold, we use net assets which results in a lower hurdle rate than if we used gross assets like we do for determining our base management fee. Our pre-incentive fee net investment income for incentive compensation purposes excludes realized and unrealized capital losses and depreciation that we may incur in the calendar quarter, even if such capital losses or depreciation result in a net loss on our statement of operations for that quarter. Thus, we may be required to pay our Investment Adviser incentive compensation for a calendar quarter even if there is a decline in the value of our portfolio or we incur a net loss for that quarter.
Our fee structure may induce our Investment Adviser to pursue speculative investments and incur leverage, and investors may bear the cost of multiple levels of fees and expenses.
The incentive fees payable by us to our Investment Adviser may create an incentive for our Investment Adviser to pursue investments on our behalf that are riskier or more speculative than would be the case in the absence of such compensation arrangement. The incentive fees payable to our Investment Adviser are calculated based on a percentage of our return on invested capital. This may encourage our Investment Adviser to use leverage to increase the return on our investments. In particular, a portion of the incentive fees payable to the Investment Adviser is calculated based on the Company’s pre-incentive fee net investment income, expressed as a rate of return on the value of the Company’s net assets at the end of the immediately preceding calendar quarter, subject to a “hurdle rate” of 1.50% per quarter (6% annualized) and a “catch-up rate” of 1.82% per quarter (7.28% annualized). See Note 4 to the consolidated financial statements included in Part II, Item 8 of this Form 10-K. Accordingly, an increase in leverage may make it easier for the Company to meet or exceed the hurdle rate applicable to the income-based incentive fee and may result in an increase in the amount of income-based incentive fee payable to the Investment Adviser.
Under certain circumstances, the use of leverage may increase the likelihood of default, which would impair the value of our securities. In addition, our Investment Adviser receives the incentive fees based, in part, upon net capital gains realized on our investments. Unlike that portion of the incentive fees based on income, there is no hurdle rate applicable to the portion of the incentive fees based on net capital gains. As a result, our Investment Adviser may have incentive to invest more capital in investments that are likely to result in capital gains as compared to income producing securities. Such a practice could result in our investing in more speculative securities than would otherwise be the case, which could result in higher investment losses, particularly during economic downturns.
The “catch-up” portion of the incentive fees may encourage our Investment Adviser to accelerate or defer interest payable by portfolio companies from one calendar quarter to another, potentially resulting in fluctuations in timing and dividend amounts.
Additionally, the incentive fees payable by us to our Investment Adviser may create an incentive for our Investment Adviser to cause us to realize capital gains or losses that may not be in the best interest of us or our stockholders. Under the
26
incentive fee structure, our Investment Adviser benefits when we recognize capital gains and, because our Investment Adviser determines when an investment is sold, our Investment Adviser controls the timing of the recognition of such capital gains. Our Board of Directors is charged with protecting our stockholders’ interests by monitoring how our Investment Adviser addresses these and other conflicts of interest associated with its management services and compensation.
We may invest, to the extent permitted by law, in the securities and instruments of other investment companies, including private funds, and, to the extent we so invest, bear our ratable share of any such investment company’s expenses, including management and performance fees. We also remain obligated to pay management and incentive fees to our Investment Adviser with respect to the assets invested in the securities and instruments of other investment companies. With respect to each of these investments, each of our stockholders bears his or her share of the management and incentive fees of our Investment Adviser as well as indirectly bearing the management and performance fees and other expenses of any investment companies in which we invest.
We will be subject to corporate-level income tax if we are unable to maintain our qualification as a RIC for U.S. federal income tax purposes under Subchapter M of the Code.
Although we have elected to be treated, and intend to qualify annually, as a RIC for U.S. federal income tax purposes under Subchapter M of the Code, we cannot assure you that we will be able to maintain RIC status. To maintain RIC status and be relieved of U.S. federal income taxes on income and gains distributed to our stockholders, we must, among other things, have in effect an election to be treated, and continue to qualify, as a BDC under the Investment Company Act at all times during each taxable year and meet the Annual Distribution Requirement, the 90% Gross Income Test and the Diversification Tests (each as defined and explained more fully in Part I, Item 1 of this Form 10-K “
Business—Election to be Taxed as a RIC.
”).
If we fail to maintain our RIC status for any reason, and we do not qualify for certain relief provisions under the Code, we would be subject to corporate-level U.S. federal income tax (and any applicable U.S. state and local taxes) regardless of whether we make any distributions to our stockholders. In this event, the resulting taxes and any resulting penalties could substantially reduce our net assets, the amount of our income available for distribution and the amount of our distributions to our stockholders, which would have a material adverse effect on our financial performance. For additional discussion regarding the tax implications of a RIC, see Part I, Item 1 of this Form 10-K “
Business—Election to be Taxed as a RIC.
”
We may have difficulty satisfying the Annual Distribution Requirement in order to maintain our RIC status if we recognize income before or without receiving cash representing such income.
We may make investments that produce income that is not matched by a corresponding cash receipt by us, such as original issue discount (“OID”), which may arise, for example, if we receive warrants in connection with the making of a loan, or payment-in-kind (“PIK”) interest representing contractual interest added to the loan principal balance and due at the end of the loan term. Any such income would be treated as income earned by us and therefore would be subject to the Annual Distribution Requirement (as defined and explained more fully in Part I, Item 1 of this Form 10-K “
Business—Election to be Taxed as a RIC.
”). Such investments may require us to borrow money or dispose of other securities in order to comply with those requirements. However, under the Investment Company Act, we are not permitted to make distributions to our stockholders while our debt obligations and other senior securities are outstanding unless an “asset coverage” test is met. See Part I, Item 1 of this Form 10-K “
Business—Regulation—Indebtedness and Senior Securities
.”
If we are prohibited from making distributions or are unable to raise additional debt or equity capital or sell assets to make distributions, we may not be able to make sufficient distributions to satisfy the Annual Distribution Requirement, and therefore would not be able to maintain our qualification as a RIC. Additionally, we may make investments that result in the recognition of ordinary income rather than capital gain, or that prevent us from accruing a long-term holding period. These investments may prevent us from making capital gain distributions. See Part I, Item 1 of this Form 10-K “
Business—Election to be Taxed as a RIC.
”
A portion of our income and fees may not be qualifying income for purposes of the income source requirement.
Some of the income and fees that we may recognize will not satisfy the income source requirement applicable to RICs. In order to ensure that such income and fees do not disqualify us as a RIC for a failure to satisfy such requirement, we may be required to recognize such income and fees indirectly through one or more entities treated as corporations for U.S. federal income tax purposes. Such corporations will be required to pay U.S. corporate income tax on their earnings, which ultimately will reduce the amount of income available for distribution.
27
If we are not treated as a “publicly offered regulated investment company,” as defined in the Code, certain U.S. stockholders will be treated as having received a dividend from us in the amount of such U.S. stockholders’ allocable share of the management and incentive fees paid to our Investment Adviser and certain of our other expenses, and these fees and expenses will be treated as miscellaneous itemized deductions of such U.S. stockholders.
We expect to be treated as a “publicly offered regulated investment company” as a result of shares of our common stock being treated as regularly traded on an established securities market. However, we cannot assure you that we will be treated as a publicly offered regulated investment company for all years. If we are not treated as a publicly offered regulated investment company for any calendar year, each U.S. stockholder that is an individual, trust or estate will be treated as having received a dividend from us in the amount of such U.S. stockholder’s allocable share of the management and incentive fees paid to our Investment Adviser and certain of our other expenses for the calendar year, and these fees and expenses will be treated as miscellaneous itemized deductions of such U.S. stockholder. Miscellaneous itemized deductions generally are deductible by a U.S. stockholder that is an individual, trust or estate only to the extent that the aggregate of such U.S. stockholder’s miscellaneous itemized deductions exceeds 2% of such U.S. stockholder’s adjusted gross income for U.S. federal income tax purposes, are not deductible for purposes of the alternative minimum tax and are subject to the overall limitation on itemized deductions under the Code. See Part I, Item 1 of this Form 10-K “
Business—Election to be Taxed as a RIC.
”
If we fail to maintain the adequacy of our internal controls over financial reporting, we may not be able to accurately report our financial results, which may adversely affect investor confidence in us and, as a result, the value of our securities.
Effective internal controls over financial reporting are necessary for us to provide reliable financial reports. Matters impacting our internal controls may cause us to be unable to report our financial information on a timely basis and thereby subject us to adverse regulatory consequences, including sanctions by the SEC or violations of applicable stock exchange listing rules, and result in a breach of the covenants under the agreements governing any of our financing arrangements. There could also be a negative reaction in the financial markets due to a loss of investor confidence in us and the reliability of our financial statements. Additionally, if we identify one or more material weaknesses in our internal control over financial reporting, we will be unable to assert that our internal controls are effective. If we are unable to assert that our internal control over financial reporting is effective, or if our independent registered public accounting firm were to report a material weakness in our internal controls over financial reporting, we could lose investor confidence in the accuracy and completeness of our financial reports. This could materially adversely affect us and lead to a decline in the price of our securities.
Our internal control over financial reporting may not prevent or detect misstatements because of its inherent limitations. Even effective internal controls can provide only reasonable assurance with respect to the preparation and fair presentation of financial statements. If we fail to maintain the adequacy of our internal controls, including any failure to implement required new or improved controls, or if we experience difficulties in their implementation, our operations, financial reporting or financial results could be harmed and we could fail to meet our financial reporting obligations.
Certain investors are limited in their ability to make significant investments in us.
Private funds that are excluded from the definition of “investment company” either pursuant to Section 3(c)(1) or 3(c)(7) of the Investment Company Act are restricted from acquiring directly or through a controlled entity more than 3% of our total outstanding voting stock (measured at the time of the acquisition). Investment companies registered under the Investment Company Act and BDCs are also subject to this restriction as well as other limitations under the Investment Company Act that would restrict the amount that they are able to invest in our securities. As a result, certain investors will be limited in their ability to make significant investments in us at a time that they might desire to do so.
Our Board of Directors is authorized to reclassify any unissued shares of common stock into one or more classes of preferred stock, which could convey special rights and privileges to its owners.
Under the Maryland General Corporation Law (“MGCL”) and our charter (our “Charter”), our Board of Directors is authorized to classify and reclassify any authorized but unissued shares of stock into one or more classes of stock, including preferred stock. Prior to the issuance of shares of each class or series, the Board of Directors is required by Maryland law and our Charter to set the terms, preferences, conversion or other rights, voting powers, restrictions, limitations as to dividends or other distributions, qualifications and terms or conditions of redemption for each class or series. Thus, the Board of Directors could authorize the issuance of shares of preferred stock with terms and conditions which could have the effect of delaying, deferring or preventing a transaction or a change in control that might involve a premium price for holders of our common stock or otherwise be in their best interest. The cost of any such reclassification would be borne by our existing common stockholders. Certain matters under the Investment Company Act require the separate vote of the holders of any issued and outstanding preferred stock. For example, holders of preferred stock would vote separately from the holders of common stock on a proposal to cease operations as a BDC. In addition, the Investment Company Act provides that holders of preferred stock
28
are entitled to vote separately from holders of common stock to elect two preferred stock directors. We currently have no plans to issue preferred stock, but may determine to do so in the future. The issuance of preferred stock convertible into shares of common stock might also reduce the net income per share and NAV per share of our common stock upon conversion, provided, that we will only be permitted to issue such convertible preferred stock to the extent we comply with the requirements of Section 61 of the Investment Company Act, including obtaining common stockholder approval. In addition, under the Investment Company Act, participating preferred stock and preferred stock constitutes a “senior security” for purposes of the 150% asset coverage test. These effects, among others, could have an adverse effect on an investment in our common stock.
Provisions of the MGCL and of our Charter and bylaws could deter takeover attempts and have an adverse impact on the price of our common stock.
The MGCL and our Charter and bylaws contain provisions that may discourage, delay or make more difficult a change in control of us or the removal of our directors. We are subject to the Maryland Business Combination Act (“MBCA”), subject to any applicable requirements of the Investment Company Act. Our Board of Directors has adopted a resolution exempting from the MBCA any business combination between us and any other person, subject to prior approval of such business combination by our Board of Directors, including approval by a majority of our Independent Directors. If the resolution exempting business combinations is repealed or our Board of Directors does not approve a business combination, the MBCA may discourage third parties from trying to acquire control of us and increase the difficulty of consummating such an offer. Our bylaws exempt from the Maryland Control Share Acquisition Act (“Control Share Act”) acquisitions of our stock by any person. If we amend our bylaws to repeal the exemption from the Control Share Act, the Control Share Act also may make it more difficult for a third party to obtain control of us and increase the difficulty of consummating such a transaction. However, we will amend our bylaws to be subject to the Control Share Act only if our Board of Directors determines that it would be in our best interests and if the SEC staff does not object to our determination that our being subject to the Control Share Act does not conflict with the Investment Company Act.
We have also adopted measures that may make it difficult for a third party to obtain control of us, including provisions of our Charter classifying our Board of Directors in three classes serving staggered three-year terms, and authorizing our Board of Directors to classify or reclassify shares of our stock in one or more classes or series, to cause the issuance of additional shares of our stock, to amend our Charter without stockholder approval and to increase or decrease the number of shares of stock or the number of shares of stock of any class or series that we have authority to issue. These provisions, as well as other provisions of our Charter and bylaws, may delay, defer or prevent a transaction or a change in control that might otherwise be in the best interests of our stockholders.
Our Board of Directors may change our investment objective, operating policies and strategies without prior notice and without stockholder approval.
Our Board of Directors has the authority to modify or, if applicable, waive our investment objectives, operating policies and strategies without prior notice (except as required by the Investment Company Act) and without stockholder approval. In addition, none of our investment policies is fundamental and any of them may be changed without stockholder approval. However, absent stockholder approval, we may not change the nature of our business so as to cease to be, or withdraw our election as, a BDC. We cannot predict the effect any changes to our current investment objectives, operating policies or strategies would have on our business, operating results and value of our stock. Nevertheless, the effects may adversely affect our business and impact our ability to make distributions.
We are highly dependent on information systems and systems failures could significantly disrupt our business, which may, in turn, negatively affect the market price of our common stock and our ability to pay dividends.
Our business is highly dependent on the communications and information systems of the Adviser, its affiliates and third parties. Any failure or interruption of those systems or services, including as a result of the termination or suspension of an agreement with any third-party service providers, could cause delays or other problems in our activities. Our financial, accounting, data processing, backup or other operating systems and facilities may fail to operate properly or become disabled or damaged as a result of a number of factors including events that are wholly or partially beyond our control and adversely affect our business. There could be:
|
•
|
sudden electrical or telecommunications outages;
|
|
•
|
natural disasters such as earthquakes, tornadoes and hurricanes;
|
|
•
|
disease pandemics;
|
|
•
|
events arising from local or larger scale political or social matters, including terrorist acts; and
|
29
|
•
|
cyber-attacks.
|
These events, in turn, could have a material adverse effect on our operating results and negatively affect the market price of our common stock and our ability to pay dividends to our stockholders.
Cybersecurity risks and cyber incidents may adversely affect our business or those of our portfolio companies by causing a disruption to our operations, a compromise or corruption of confidential information and/or damage to business relationships, or those of our portfolio companies, all of which could negatively impact our business, results of operations or financial condition.
A cyber incident is considered to be any adverse event that threatens the confidentiality, integrity or availability of our information resources. These incidents may be an intentional attack or an unintentional event and could involve gaining unauthorized access to, use, alteration or destruction of our information systems for purposes of misappropriating assets, obtaining ransom payments, stealing confidential information, corrupting data or causing operational disruption, or may involve phishing. The result of these incidents may include disrupted operations, misstated or unreliable financial data, liability for stolen information, misappropriation of assets, increased cybersecurity protection and insurance costs, litigation and damage to our business relationships. This could result in significant losses, reputational damage, litigation, regulatory fines or penalties, or otherwise adversely affect our business, financial condition or results of operations. In addition, we may be required to expend significant additional resources to modify our protective measures and to investigate and remediate vulnerabilities or other exposures arising from operational and security risks. The costs related to cybersecurity incidents may not be fully insured or indemnified. As our and our portfolio companies’ reliance on technology has increased, so have the risks posed to our information systems, both internal and those provided by our Adviser and third-party service providers, and the information systems of our portfolio companies. We, our Adviser and its affiliates have implemented processes, procedures and internal controls to help mitigate cybersecurity risks and cyber intrusions, but these measures, as well as our increased awareness of the nature and extent of a risk of a cyber incident, may be ineffective and do not guarantee that a cyber incident will not occur or that our financial results, operations or confidential information will not be negatively impacted by such an incident.
Third parties with which we do business (including, but not limited to, service providers, such as accountants, custodians, transfer agents and administrators, and the issuers of securities in which we invest) may also be sources or targets of cybersecurity or other technological risks. We outsource certain functions and these relationships allow for the storage and processing of our information and assets, as well as certain investor, counterparty, employee and borrower information. While we engage in actions to reduce our exposure resulting from outsourcing, we cannot control the cybersecurity plans and systems put in place by these third parties and ongoing threats may result in unauthorized access, loss, exposure or destruction of data, or other cybersecurity incidents, with increased costs and other consequences, including those described above. Privacy and information security laws and regulation changes, and compliance with those changes, may also result in cost increases due to system changes and the development of new administrative processes.
Changes in laws or regulations governing our business or the businesses of our portfolio companies, changes in the interpretation thereof or newly enacted laws or regulations, and any failure by us or our portfolio companies to comply with these laws or regulations may adversely affect our business and the businesses of our portfolio companies.
We and our portfolio companies are subject to laws and regulations at the U.S. federal, state and local levels and, in some cases, foreign levels. These laws and regulations, as well as their interpretation, may change from time to time, and new laws, regulations and interpretations may also come into effect. Any such new or changed laws or regulations could have a material adverse effect on our business or the business of our portfolio companies. The legal, tax and regulatory environment for BDCs, investment advisers and the instruments that they utilize (including derivative instruments) is continuously evolving. In addition, there is significant uncertainty regarding recently enacted legislation and the regulations that have recently been adopted and future regulations that may or may not be adopted pursuant to such legislation) and, consequently, the full impact that such legislation will ultimately have on us and the markets in which we trade and invest is not fully known. Such uncertainty and any resulting confusion may itself be detrimental to the efficient functioning of the markets and the success of certain investment strategies.
On February 3, 2017, President Trump signed Executive Order 13772 (the “Executive Order”) announcing the new Administration’s policy to regulate the U.S. financial system in a manner consistent with certain “Core Principles,” including regulation that is efficient, effective and appropriately tailored. The Executive Order directed the Secretary of the Treasury, in consultation with the heads of the member agencies of the Financial Stability Oversight Council, to report to the President on
30
the extent to which existing laws, regulations and other government policies promote the Core Principles and to identify any laws, regulations or other government policies that inhibit federal regulation of the U.S. financial system.
On June 12, 2017, the U.S. Department of the Treasury published the first of several reports in response to the Executive Order on the depository system covering banks and other savings institutions. On October 6, 2017, the Treasury released a second report outlining ways to streamline and reform the U.S. regulatory system for capital markets, followed by a third report, on October 26, 2017, examining the current regulatory framework for the asset management and insurance industries. The Treasury released a fourth report on July 31, 2018 describing recommendations relating to nonbank financial institutions, financial technology and innovation. Subsequent reports are expected to address retail and institutional investment products and vehicles.
On December 22, 2017, President Trump signed into law the Tax Cuts and Jobs Act, which significantly revised the Internal Revenue Code, including, a reduction in the corporate income tax rate, a new limitation on the deductibility of interest expense, and significant changes to the taxation of income earned from foreign sources and foreign subsidiaries. The Tax Cuts and Jobs Act also authorizes the IRS to issue regulations with respect to the new provisions. Among other things, Tax Reform limits the ability of borrowers to fully deduct interest expense. This could potentially affect the loan market, for example by impacting the demand for loans available from us or the terms of such loans. The changes to interest deductibility, utility of net operating losses and other provisions of Tax Reform could also in certain circumstances increase the U.S. tax burden on our portfolio assets which, in turn, could negatively impact their ability to service their interest expense obligations to us.
On May 24, 2018, President Trump signed into law the Economic Growth, Regulatory Relief, and Consumer Protection Act, which leaves the architecture and core features of the Dodd-Frank Act intact but significantly recalibrates applicability thresholds, revises various post-crisis regulatory requirements, and provides targeted regulatory relief to certain financial institutions. Among the most significant of its amendments to the Dodd-Frank Act are a substantial increase in the $50 billion asset threshold for automatic regulation of bank holding companies as “systemically important financial institutions” (“SIFIs”) an exemption from the Volcker Rule for insured depository institutions with less than $10 billion in consolidated assets and lower levels of trading assets and liabilities, as well as amendments to the liquidity leverage ratio and supplementary leverage ratio requirements. The effect of this change and any further rules or regulations are and could be complex and far-reaching, and the change and any future laws or regulations or changes thereto could negatively impact our operations, cash flows or financial condition, impose additional costs on us, intensify the regulatory supervision of us or otherwise adversely affect our business, financial condition and results of operations.
In addition, as private equity firms become more influential participants in the U.S. and global financial markets and economy generally, there recently has been pressure for greater governmental scrutiny and/or regulation of the private equity industry. It is uncertain as to what form and in what jurisdictions such enhanced scrutiny and/or regulation, if any, on the private equity industry may ultimately take. Therefore, there can be no assurance as to whether any such scrutiny or initiatives will have an adverse impact on the private equity industry, including our ability to effect operating improvements or restructurings of our portfolio companies or otherwise achieve our objectives.
Over the last several years, there also has been an increase in regulatory attention to the extension of credit outside of the traditional banking sector, raising the possibility that some portion of the non-bank financial sector will be subject to new regulation. While it cannot be known at this time whether any regulation will be implemented or what form it will take, increased regulation of non-bank credit extension could negatively impact our operating results or financial condition, impose additional costs on us, intensify the regulatory supervision of us or otherwise adversely affect our business.
Our Investment Adviser, Administrator and sub-administrators are able to resign upon 60 days’ notice, and we may not be able to find a suitable replacement within that time, resulting in a disruption in our operations that could adversely affect our financial condition, business and results of operations.
Our Investment Adviser, our Administrator and our sub-administrators have the right to resign under the Investment Advisory Agreement, the Administration Agreement and the Sub-Administration Agreements, respectively, upon 60 days’ written notice, whether a replacement has been found or not. If any of them resigns, it may be difficult to find a replacement with similar expertise and ability to provide the same or equivalent services on acceptable terms within 60 days, or at all. If a replacement is not found quickly, our business, results of operation and financial condition as well as our ability to pay distributions are likely to be adversely affected and the value of our shares may decline. In addition, the coordination of our internal management and investment activities is likely to suffer if we are unable to identify and reach an agreement with a single institution or group of executives having the expertise possessed by our Investment Adviser, our Administrator and their affiliates, including certain of our sub-administrators. Even if a comparable service provider or individuals performing such services are retained, whether internal or external, their integration into our business and lack of familiarity with our investment
31
objective may result in additional costs and time delays that may materially adversely affect our business, results of operations and financial condition. Moreover, the termination by our Investment Adviser of our Investment Advisory Agreement for any reason will be an event of default under the SPV Credit Facility, which could result in the immediate acceleration of the amounts due under the SPV Credit Facility. Similarly, it will be an event of default under the Credit Facility if our Investment Adviser or an affiliate of our Investment Adviser ceases to manage us, which could result in the immediate acceleration of the amounts due under the Credit Facility.
Our Investment Adviser’s liability is limited under the Investment Advisory Agreement, and we are required to indemnify our Investment Adviser against certain liabilities, which may lead our Investment Adviser to act in a riskier manner on our behalf than it would when acting for its own account.
Our Investment Adviser has not assumed any responsibility to us other than to render the services described in the Investment Advisory Agreement, and it will not be responsible for any action of our Board of Directors in declining to follow our Investment Adviser’s advice or recommendations. Pursuant to the Investment Advisory Agreement, our Investment Adviser and its members and their respective officers, managers, partners, agents, employees, controlling persons and members and any other person or entities affiliated with it will not be liable to us for their acts under the Investment Advisory Agreement, absent willful misfeasance, bad faith, gross negligence or reckless disregard in the performance of their duties. We have agreed to indemnify, defend and protect our Investment Adviser and its members and their respective officers, managers, partners, agents, employees, controlling persons and members and any other person or entities affiliated with it with respect to all damages, liabilities, costs and expenses arising out of or otherwise based upon the performance of any of our Investment Adviser’s duties or obligations under the Investment Advisory Agreement or otherwise as an Investment Adviser for us, and not arising out of willful misfeasance, bad faith, gross negligence or reckless disregard in the performance of their duties under the Investment Advisory and Agreement. These protections may lead our Investment Adviser to act in a riskier manner when acting on our behalf than it would when acting for its own account. See “
Risks Related to Our Business and Structure
—
Our fee structure may induce our Investment Adviser to pursue speculative investments and incur leverage, and investors may bear the cost of multiple levels of fees and expenses.
”
We are subject to certain risks as a result of our direct interest in the 2015-1 Issuer Preferred Interests.
Because each of the SPV and the 2015-1 Issuer is disregarded as an entity separate from its owner for U.S. federal income tax purposes, the sale or contribution by the SPV to us and the sale or contribution by us to the 2015-1 Issuer as part of the 2015-1 Debt Securitization and 2015-1 Debt Securitization Refinancing did not constitute a taxable event for U.S. federal income tax purposes. If the U.S. Internal Revenue Service were to take a contrary position, there could be a material adverse effect on our business, financial condition, results of operations or cash flows.
The 2015-1 Issuer Preferred Interests are subordinated obligations of the 2015-1 Issuer.
The 2015-1 Issuer is the residual claimant on funds, if any, remaining after holders of all classes of the 2015-1R Notes have been paid in full on each payment date or upon maturity of the 2015-1R Notes under the 2015-1 Debt Securitization Refinancing documents. The 2015-1 Issuer Preferred Interests represent all of the equity interest in the 2015-1 Issuer and, as the holder of the 2015-1 Issuer Preferred Interests, we may receive distributions, if any, only to the extent that the 2015-1 Issuer makes distributions out of funds remaining after holders of all classes of the 2015-1R Notes have been paid in full on each payment date any amounts due and owing on such payment date or upon maturity of the 2015-1R Notes. There is no guarantee that we will receive any distributions as the holders of the 2015-1 Issuer Preferred Interests.
The interests of holders of the 2015-1R Notes issued by the 2015-1 Issuer may not be aligned with our interests.
The 2015-1R Notes are the debt obligations ranking senior in right of payment to our interests. As such, there are circumstances in which the interests of holders of the 2015-1R Notes may not be aligned with our interests. For example, under the terms of the 2015-1 Issuer, holders of the 2015-1R Notes have the right to receive payments of principal and interest prior to distribution to our interests.
For as long as the 2015-1R Notes remain outstanding, holders of the 2015-1R Notes have the right to act, in certain circumstances, with respect to the portfolio loans in ways that may benefit their interests but not the interests of holders of the 2015-1 Issuer Preferred Interests, including by exercising remedies under the indenture governing the 2015-1R Notes (the “2015-1 Indenture”).
32
If an event of default has occurred and acceleration occurs in accordance with the terms of the 2015-1 Indenture, the 2015-1R Notes then outstanding will be paid in full before any further payment or distribution to the 2015-1 Issuer Preferred Interests. In addition, if an event of default occurs, holders of a majority of the 2015-1R Notes then outstanding will be entitled to determine the remedies to be exercised under the 2015-1 Indenture, subject to the terms of the 2015-1 Indenture. For example, upon the occurrence of an event of default with respect to the notes issued by the 2015-1 Issuer, the trustee or holders of a majority of the 2015-1R Notes then outstanding may declare the principal, together with any accrued interest, of all the 2015-1R Notes to be immediately due and payable. This would have the effect of accelerating the principal on such notes, triggering a repayment obligation on the part of the 2015-1 Issuer. If at such time the portfolio loans of the 2015-1 Issuer were not performing well, the 2015-1 Issuer may not have sufficient proceeds available to enable the trustee under the 2015-1 Indenture to pay a distribution to holders of the 2015-1 Issuer Preferred Interests.
Remedies pursued by the holders of the 2015-1R Notes could be adverse to the interests of the holders of the 2015-1 Issuer Preferred Interests, and the holders of the 2015-1R Notes have no obligation to consider any possible adverse effect on such other interests. Thus, any remedies pursued by the holders of the 2015-1R Notes may not be in our best interests and we may not receive payments or distributions upon an acceleration of the 2015-1R Notes. Any failure of the 2015-1 Issuer to make distributions on the 2015-1 Issuer Preferred Interests we hold, directly or indirectly, whether as a result of an event of default or otherwise, could have a material adverse effect on our business, financial condition, results of operations and cash flows and may result in an inability of us to make distributions sufficient to allow for us to qualify as a RIC for U.S. federal income tax purposes.
The 2015-1 Issuer may fail to meet certain asset coverage tests.
Under the documents governing the 2015-1 Debt Securitization Refinancing, there are two coverage tests applicable to the 2015-1R Notes.
The first such test compares the amount of interest received on the portfolio loans held by the 2015-1 Issuer to the amount of interest payable in respect of the 2015-1R Notes. To meet this first test, interest received on the portfolio loans must equal at least 110% of the interest payable in respect of the 2015-1R Notes issued by the 2015-1 Issuer.
The second such test compares the adjusted collateral principal amount of the portfolio loans of the 2015-1 Debt Securitization Refinancing to the aggregate outstanding principal amount of the 2015-1R Notes. To meet this second test at any time, the adjusted collateral principal amount of the portfolio loans must equal at least 116.4% of the outstanding principal amount of the 2015-1R Notes.
If any coverage test with respect to the 2015-1R Notes is not met, proceeds from the portfolio of loans that otherwise would have been distributed to the holders of the 2015-1 Issuer Preferred Interests will instead be used to redeem first the 2015-1R Notes, to the extent necessary to satisfy the applicable asset coverage tests on a pro forma basis after giving effect to all payments made in respect of the 2015-1R Notes, which we refer to as a mandatory redemption, or to obtain the necessary ratings confirmation. There is no guarantee that the 2015-1R Notes will meet either of these coverage tests, and thus, we may not receive distributions as the holders of the 2015-1 Issuer Preferred Interests.
We may not receive cash from the 2015-1 Issuer.
We receive cash from the 2015-1 Issuer only to the extent of payments on the distributions, if any, with respect to the 2015-1 Issuer Preferred Interests as permitted under the 2015-1 Debt Securitization Refinancing. The 2015-1 Issuer may only make payments on the 2015-1 Issuer Preferred Interests to the extent permitted by the payment priority provisions of the 2015-1 Indenture, as applicable, which generally provide, distribution to Preferred Interests holder may not be made on any payment date unless all amounts owing under the 2015-1R Notes are paid in full. There is no guarantee that we will receive any distributions as the holders of the 2015-1 Issuer Preferred Interests.
In addition, if the 2015-1 Issuer does not meet the asset coverage tests or the interest coverage test set forth in the documents governing the 2015-1 Debt Securitization Refinancing, cash would be diverted to first pay the 2015-1R Notes in amounts sufficient to cause such tests to be satisfied. Even if we do not receive cash directly from the 2015-1 Issuer, such amount will still be treated as income subject to our requirement to distribute 90% of our net investment income to our shareholders. Therefore, in the event that we fail to receive cash directly from the 2015-1 Issuer, we could be unable to make such distributions in amounts sufficient to maintain our status as a RIC for U.S. federal income tax purposes, or at all.
33
We may be required to assume liabilities of the 2015-1 Issuer and are indirectly liable for certain representations and warranties in connection with the 2015-1 Debt Securitization Refinancing.
As part of the 2015-1 Debt Securitization Refinancing, we entered into a contribution agreement under which we are required to repurchase any loan (or participation interest therein) which was sold to the 2015-1 Issuer in breach of any representation or warranty made by us with respect to such loan on the date such loan was sold. To the extent we fail to satisfy any such repurchase obligation, the trustee of the 2015-1 Debt Securitization Refinancing may, on behalf of the 2015-1 Issuer, bring an action against us to enforce these repurchase obligations.
The structure of the 2015-1 Debt Securitization Refinancing is intended to prevent, in the event of our bankruptcy, the consolidation of the 2015-1 Issuer with our operations. If the true sale of the assets in the 2015-1 Debt Securitization Refinancing were not respected in the event of our insolvency, a trustee or debtor-in-possession might reclaim the assets of the 2015-1 Issuer for our estate. However, in doing so, we would become directly liable for all of the indebtedness then outstanding under the 2015-1 Debt Securitization Refinancing, which would equal the full amount of debt of the 2015-1 Issuer reflected on our consolidated balance sheet.
In addition, in connection with 2015-1 Debt Securitization Refinancing, the Company has made customary representations, warranties and covenants to the 2015-1 Issuer. We remain liable for any breach of such representations for the life of the 2015-1 Debt Securitization Refinancing.
Risks Related to Our Investments
Our investments are risky and speculative.
We invest primarily in loans to middle market companies whose debt, if rated, is rated below investment grade and, if not rated, would likely be rated below investment grade if it were rated. Investments rated below investment grade are generally considered higher risk than investment grade instruments. Bonds that are rated below investment grade are sometimes referred to as “high yield bonds” or “junk bonds.” Exposure to below investment grade instruments involves certain risks, including speculation with respect to the borrower’s capacity to pay interest and repay principal. In our first lien senior secured loans, the fact that a loan is secured does not guarantee that we will receive principal and interest payments according to the loan’s terms, or at all, or that we will be able to collect on the loan should we be forced to enforce our remedies. To the extent we hold second lien senior secured loans and junior debt investments, holders of first lien loans may be repaid before us in the event of a bankruptcy or other insolvency proceeding. This may result in an above average amount of risk and loss of principal. Unitranche loans generally allow the borrower to make a large lump sum payment of principal at the end of the loan term, and there is a heightened risk of loss if the borrower is unable to pay the lump sum or refinance the amount owed at maturity. When we invest in loans, we have acquired and may in the future acquire equity securities as well. However, we may not be able to realize gains from our equity interests, and any gains that we do realize on the disposition of any equity interests may not be sufficient to offset any other losses we experience.
In addition, investing in middle market companies involves a number of significant risks, including:
|
•
|
these companies may have limited financial resources and may be unable to meet their obligations under their debt securities that we hold, which may be accompanied by a deterioration in the value of any collateral and a reduction in the likelihood of us realizing on any guarantees or security we may have obtained in connection with our investment;
|
|
•
|
they typically have shorter operating histories, narrower product lines and smaller market shares than larger businesses, which tend to render them more vulnerable to competitors’ actions and market conditions, as well as general economic downturns;
|
|
•
|
they are more likely to depend on the management talents and efforts of a small group of persons; therefore, the death, disability, resignation or termination of one or more of these persons could have a material adverse impact on a portfolio company and, in turn, on us;
|
|
•
|
there is generally little public information about these companies. These companies and their financial information are usually not subject to the Exchange Act and other regulations that govern public companies, and we may be unable to uncover all material information about these companies, which may prevent us from making a fully informed investment decision and cause us to lose money on our investments;
|
|
•
|
they generally have less predictable operating results, may from time to time be parties to litigation, may be engaged in rapidly changing businesses with products subject to a substantial risk of obsolescence, and may
|
34
require substantial additional capital to support their operations, finance expansion or maintain their competitive position. In addition, our executive officers, directors and our Investment Adviser may, in the ordinary course of business, be named as defendants in litigation arising from our investments in the portfolio companies;
|
•
|
changes in laws and regulations, as well as their interpretations, may adversely affect their business, financial structure or prospects; and
|
|
•
|
they may have difficulty accessing the capital markets to meet future capital needs, which may limit their ability to grow or to repay their outstanding indebtedness upon maturity.
|
Our portfolio securities are generally illiquid and typically do not have a readily available market price and, in such a case, we will value these securities at fair value as determined in good faith under procedures adopted by our Board of Directors, which valuation is inherently subjective and may not reflect what we may actually realize from the sale of the investment.
Substantially all of our portfolio investments are in the form of debt investments that are not publicly traded and are illiquid compared to publicly traded securities, and there can be no assurance that we will be able to realize returns on such investments in a timely manner. The fair value of these illiquid portfolio securities is not readily determinable, and the due diligence process that our Investment Adviser undertakes in connection with our investments may not reveal all the facts that may be relevant in connection with such investment. We value these investments on at least a quarterly basis in accordance with our valuation policy, which is at all times consistent with accounting principles generally accepted in the United States (“US GAAP”). Our Board of Directors utilizes the services of a third-party valuation firm to aid it in determining the fair value of these investments as well as the recommendations of our Investment Adviser’s investment professionals, which are based upon the most recent portfolio company financial statements available and projected financial results of each portfolio company. The Board of Directors discusses valuations and determines the fair value in good faith based on the input of our Investment Adviser and the third-party valuation firm. The participation of our Investment Adviser in our valuation process, and the indirect pecuniary interest in our Investment Adviser by the Interested Directors on our Board of Directors, could result in a conflict of interest, since the management fee is based on our gross assets and also because our Investment Adviser is receiving performance-based incentive fees.
The factors that are considered in the fair value pricing of our investments include the nature and realizable value of any collateral, the portfolio company’s ability to make payments and its earnings, the markets in which the portfolio company does business, comparisons to publicly traded companies, discounted cash flow, relevant credit market indices, and other relevant factors. When an external event such as a purchase transaction, public offering or subsequent equity sale occurs, we consider the pricing indicated by the external event to corroborate our valuation. Because such valuations, and particularly valuations of private investments and private companies, are inherently uncertain, may fluctuate over short periods of time and may be based on estimates, our determinations of fair value may differ materially from the values that would have been used if a ready market for these securities existed. Also, since these valuations are, to a large extent, based on estimates, comparisons and qualitative evaluations of private information, it could make it more difficult for investors to value accurately our investments and could lead to undervaluation or overvaluation of our securities. In addition, the valuation of these types of securities may result in substantial write-downs and earnings volatility. If our Investment Adviser is unable to uncover all material information about these companies, we may not make a fully informed investment decision, and we may lose money on our investments. Also, privately held companies frequently have less diverse product lines and smaller market presence than larger competitors.
Decreases in the market values or fair values of our investments are recorded as unrealized depreciation. The effect of all of these factors on our portfolio can reduce our NAV by increasing net unrealized depreciation in our portfolio. Depending on market conditions, we could incur substantial realized losses and may suffer unrealized losses, which could have a material adverse impact on our business, financial condition and results of operations.
Our NAV as of a particular date may be materially greater than or less than the value that would be realized if our assets were to be liquidated as of such date. For example, if we were required to sell a certain asset or all or a substantial portion of our assets on a particular date, the actual price that we would realize upon the disposition of such asset or assets could be materially less than the value of such asset or assets as reflected in our NAV. Volatile market conditions could also cause reduced liquidity in the market for certain assets, which could result in liquidation values that are materially less than the values of such assets as reflected in our NAV.
35
We operate in a highly competitive market for investment opportunities, and compete with investment vehicles sponsored or advised by our affiliates.
The activity of identifying, completing and realizing attractive investments is highly competitive and involves a high degree of uncertainty. The availability of investment opportunities generally will be subject to market conditions. In particular, in light of changes in such conditions, including changes in long-term interest rates, certain types of investments may not be available to us on terms that are as attractive as the terms on which opportunities were available to previous investment programs sponsored by Carlyle. A number of entities compete with us to make the types of investments that we target in middle market companies. We compete with other BDCs, public and private funds, commercial and investment banks, commercial finance companies, and, to the extent they provide an alternative form of financing, private equity funds, some of which are affiliates of us. Furthermore, over the past several years, an ever-increasing number of debt and credit opportunities funds have been formed and many such existing funds have grown substantially in size. Additional funds with similar objectives may be formed in the future by Carlyle or by other unrelated parties. Many of our competitors are substantially larger and have considerably greater financial, technical and marketing resources than we do. Consequently, it is possible that competition for appropriate investment opportunities may increase, thus reducing the number of investment opportunities available to us and adversely affecting the terms upon which investments can be made. Furthermore, many of our competitors are not subject to the regulatory restrictions that the Investment Company Act and the Code impose on us. The competitive pressures we face may have a material adverse effect on our business, financial condition and results of operations. As a result of this competition, we may not be able to take advantage of attractive investment opportunities from time to time, and, accordingly, we may incur legal, due diligence and other costs on investments which may not be successful and we may not recover all of our costs, which would adversely affect returns. We can offer no assurance that we will be able to identify and make investments that are consistent with our investment objective.
We do not seek to compete primarily based on the interest rates we offer, and we believe that some of our competitors may make loans with interest rates that are comparable to or lower than the rates we offer. We may lose investment opportunities if we do not match our competitors’ pricing, terms and structure. However, if we match our competitors’ pricing, terms and structure, we may experience decreased net interest income and increased risk of credit loss.
Our portfolio companies may be highly leveraged.
Some of our portfolio companies are highly leveraged, which may have adverse consequences to these companies and to us as an investor. These companies may be subject to restrictive financial and operating covenants and the leverage may impair these companies’ ability to finance their future operations and capital needs. As a result, these companies’ flexibility to respond to changing business and economic conditions and to take advantage of business opportunities may be limited. Further, a leveraged company’s income and net assets will tend to increase or decrease at a greater rate than if borrowed money were not used. Moreover, rising interest rates may significantly increase a company's or project's interest expense, or a significant industry downturn may affect a company's ability to generate positive cash flow, in either case causing an inability of a leveraged company to service outstanding debt. In the event such leveraged company cannot generate adequate cash flow to meet debt obligations, the company may default on its loan agreements or be forced into bankruptcy resulting in a restructuring or liquidation of the company. Leveraged companies may enter into bankruptcy proceedings at higher rates than companies that are not leveraged.
Depending on the facts and circumstances of our investments and the extent of our involvement in the management of a portfolio company, upon the bankruptcy of a portfolio company, a bankruptcy court may recharacterize our debt investments as equity interests and subordinate all or a portion of our claim to that of other creditors. This could occur even though we may have structured our investment as senior debt.
Our portfolio companies may incur debt that ranks equally with, or senior to, some of our investments in such companies and if there is a default, we may experience a loss on our investment.
To the extent we invest in second lien, mezzanine or other instruments, our portfolio companies typically may be permitted to incur other debt that ranks equally with, or senior to, such debt instruments. By their terms, such debt instruments may provide that the holders are entitled to receive payment of interest or principal on or before the dates on which we will be entitled to receive payments in respect of the debt securities in which we invest. Also, in the event of insolvency, liquidation, dissolution, reorganization or bankruptcy of a portfolio company, holders of debt instruments ranking senior to our investment in that portfolio company would typically be entitled to receive payment in full before we receive any distribution in respect of our investment. In such cases, after repaying such senior creditors, such portfolio company may not have sufficient remaining assets to use for repaying its obligation to us. In the case of debt ranking equally with debt securities in which we invest, we would have to share on an equal basis any distributions with other creditors holding such debt in the event of an insolvency, liquidation, dissolution, reorganization or bankruptcy of the relevant portfolio company.
36
The rights we may have with respect to the collateral securing the debt investments we make in our portfolio companies with senior debt outstanding may also be limited pursuant to the terms of one or more intercreditor agreements that we enter into with the holders of senior debt. Under such an intercreditor agreement, at any time that obligations that have the benefit of the first priority liens are outstanding, any of the following actions that may be taken in respect of the collateral will be at the direction of the holders of the obligations secured by the first priority liens: the ability to cause the commencement of enforcement proceedings against the collateral; the ability to control the conduct of such proceedings; the approval of amendments to collateral documents; releases of liens on the collateral; and waivers of past defaults under collateral documents. We may not have the ability to control or direct such actions, even if our rights are adversely affected.
We may also make unsecured loans to portfolio companies. Liens on such portfolio companies’ collateral, if any, will secure the portfolio company’s obligations under its outstanding secured debt and may secure certain future debt that is permitted to be incurred by the portfolio company under its secured loan agreements. The holders of obligations secured by such liens will generally control the liquidation of, and be entitled to receive proceeds from, any realization of such collateral to repay their obligations in full before us. In addition, the value of such collateral in the event of liquidation will depend on market and economic conditions, the availability of buyers and other factors. There can be no assurance that the proceeds, if any, from sales of such collateral would be sufficient to satisfy our unsecured loan obligations after payment in full of all secured loan obligations. If such proceeds were not sufficient to repay the outstanding secured loan obligations, then our unsecured claims would rank equally with the unpaid portion of such secured creditors’ claims against the portfolio company’s remaining assets, if any.
Our portfolio may be concentrated in a limited number of portfolio companies and industries, which will subject us to a risk of significant loss if any of these companies defaults on its obligations under any of its debt instruments or if there is a downturn in a particular industry.
We are classified as a non-diversified investment company within the meaning of the Investment Company Act, which means that we are not limited by the Investment Company Act with respect to the proportion of our assets that we may invest in securities of a single issuer, excluding limitations on investments in other investment companies. Although we do not intend to focus our investments in any specific industries, our portfolio may be concentrated in a limited number of portfolio companies and industries. Beyond the asset diversification requirements associated with our qualification as a RIC under Subchapter M of the Code and under the Facilities, Senior Notes and 2015-1 Notes, we do not have fixed guidelines for diversification, and while we do not target any specific industries, our investments may be concentrated in relatively few industries. As a result, the aggregate returns we will realize may be significantly adversely affected if a small number of investments perform poorly or if we need to write down the value of one or more investments. Additionally, a downturn in any particular industry in which we are invested could also significantly impact our aggregate returns.
Declines in the prices of corporate debt securities and illiquidity in the corporate debt markets may adversely affect the fair value of our portfolio investments, reducing our NAV through increased net unrealized depreciation.
As a BDC, we are required to account for our investments at market value or, if no market value is ascertainable, at fair value as determined in good faith by or under the direction of our Board of Directors. Decreases in the market values or fair values of our investments are recorded as unrealized depreciation. Depending on market conditions, we could incur substantial realized losses and suffer additional unrealized losses, which would reduce our NAV and have a material adverse impact on our business, financial condition and results of operations.
To the extent we make investments in restructurings and reorganizations they may be subject to greater regulatory and legal risks than other traditional direct investments in portfolio companies.
We have in the past and may in the future make investments in restructurings that involve, or otherwise invest in the debt securities of, companies that are experiencing or are expected to experience severe financial difficulties. These severe financial difficulties may never be overcome and may cause such companies to become subject to bankruptcy proceedings. As such, these investments could subject us to certain additional potential liabilities that may exceed the value of our original investment therein. The level of analytical sophistication, both financial and legal, necessary for successful financing to companies experiencing significant business and financial difficulties is unusually high.
The financial projections of our portfolio companies could prove inaccurate.
We generally evaluate the capital structure of portfolio companies on the basis of financial projections prepared by the management of such portfolio companies. These projected operating results are normally based primarily on judgments of the
37
management of the portfolio companies. In all cases, projections are only estimates of future results that are based upon assumptions made at the time that the projections are developed. General economic conditions, which are not predictable with accuracy, along with other factors may cause actual performance to fall short of the financial projections that were used to establish a given portfolio company’s capital structure. Because of the leverage that is typically employed by our portfolio companies, this could cause a substantial decrease in the value of our investment in the portfolio company. The inaccuracy of financial projections could thus cause our performance to fall short of our expectations.
In addition, when sourcing debt investments, we expect to rely significantly upon representations made to us by the borrower. There can be no assurance that such representations are accurate or complete, or that any due diligence undertaken would identify any misrepresentation or omission.
The due diligence investigation that our Investor Adviser carries out with respect to an investment opportunity may not reveal or highlight all relevant facts that may be necessary or helpful in evaluating such investment opportunity, and will not result in the investment being successful.
Before we make investments, our Investment Adviser will typically conduct due diligence that it deems reasonable and appropriate based on the facts and circumstances applicable to each investment. Due diligence may entail evaluation of important and complex business, financial, tax, accounting, environmental and legal issues. Outside consultants, legal advisors, accountants, credit rating agencies, investment banks and other third parties may be involved in the due diligence process to varying degrees depending on the type of investment. When conducting due diligence and making an assessment regarding an investment, our Investment Adviser will rely on the resources available to it, including information provided by the portfolio companies and, in some circumstances, third-party investigations. In addition, investment analyses and decisions by our Investment Adviser may be required to be undertaken on an expedited basis to take advantage of certain investment opportunities. In such cases, the information available to our Investment Adviser at the time of making an investment decision may be limited. The due diligence investigation that our Investment Adviser carries out with respect to an investment opportunity may not reveal or highlight all relevant facts that may be necessary or helpful in evaluating such investment opportunity. Moreover, the due diligence investigation does not ensure that such investment will be successful. In addition, Carlyle's Environmental, Social and Governance program may cause us not to make an investment we otherwise would have made or impact other action taken or refrained from.
Our portfolio companies prepay loans from time to time, which may have the effect of reducing our investment income if the returned capital cannot be invested in transactions with equal or greater yields.
Loans are generally prepayable at any time, most of them at no premium to par. We are generally unable to predict the rate and frequency of such repayments. Whether a loan is prepaid will depend both on the continued positive performance of the portfolio company and the existence of favorable financing market conditions that allow such portfolio company the ability to replace existing financing with less expensive capital. In periods of rising interest rates, the risk of prepayment of floating rate loans may increase if other financing sources are available. As market conditions change frequently, we will often be unable to predict when, and if, this may be possible for each of our portfolio companies. In the case of some of these loans, having the loan called early may have the effect of reducing our actual investment income below our expected investment income if the capital returned cannot be invested in transactions with equal or greater yields.
We invest through joint ventures, partnerships or other special purpose vehicles and our investments through these vehicles may entail greater risks, or risks that we otherwise would not incur, if we otherwise made such investments directly.
We make indirect investments in portfolio companies through joint ventures, partnerships or other special purpose vehicles (“Investment Vehicles”) including Credit Fund. In general, the risks associated with indirect investments in portfolio companies through an Investment Vehicle are similar to those associated with a direct investment in a portfolio company. While we intend to analyze the credit and business of a potential portfolio company in determining whether to make an investment through an Investment Vehicle, we will nonetheless be exposed to the creditworthiness of the Investment Vehicle. In the event of a bankruptcy proceeding against the portfolio company, the assets of the portfolio company would typically be used to satisfy its obligations prior to the satisfaction of our investment in the Investment Vehicle (i.e., our investment in the Investment Vehicle would be structurally subordinated to the obligations of the portfolio company). In addition, if we are to invest in an Investment Vehicle, we may be required to rely on our partners in the Investment Vehicle when making decisions regarding such Investment Vehicle’s investments, accordingly, the value of the investment could be adversely affected if our interests diverge from those of our partners in the Investment Vehicle.
38
Our ability to enter into transactions with Carlyle and our other affiliates is restricted.
As a BDC, we are required to comply with certain regulatory requirements. We and any company controlled by us, on the one hand, and our upstream affiliates, or our Investment Adviser and its affiliates, on the other hand, are prohibited under the Investment Company Act from knowingly participating in certain transactions without the prior approval of our Independent Directors (as defined below) and, in some cases, the SEC. Any person that owns, directly or indirectly, 5% or more of our outstanding voting securities is our upstream affiliate for purposes of the Investment Company Act, and we or a company controlled by us are generally prohibited from buying or selling any security (other than our securities) from or to such affiliate, absent the prior approval of our Independent Directors and so long as such person does not own more than 25% of our outstanding voting securities or otherwise control us. We or a company controlled by us are prohibited from buying or selling any security from or to our Investment Adviser or its affiliates, or any person who owns more than 25% of our voting securities or is otherwise deemed to control, be controlled by, or be under common control with, us, with such persons, absent the prior approval of the SEC.
The Investment Company Act also prohibits certain “joint” transactions with our upstream affiliates, or our Investment Adviser or its affiliates, which could include investments in the same portfolio company (whether at the same or different times), without prior approval of our Independent Directors and, in some cases, the SEC (other than in certain limited situations pursuant to current regulatory guidance as described below). The analysis of whether a particular transaction constitutes a joint transaction requires a review of the relevant facts and circumstances then existing. The SEC has granted us Exemptive Relief that permits us and certain present and future funds advised by our Investment Adviser and certain other present and future investment advisers controlling, controlled by or under common control with our Investment Adviser to co-invest in suitable negotiated investments. Co-investments made under the Exemptive Relief are subject to compliance with the conditions and other requirements contained in the Exemptive Relief, which could limit our ability to participate in a co-investment transaction. In addition to co-investing pursuant to our Exemptive Relief, we may also co-invest with funds managed by Carlyle or any of its downstream affiliates, subject to compliance with applicable law and regulations, existing regulatory guidance, our Investment Adviser’s allocation procedures and Carlyle’s other allocation policies and procedures, where applicable. For example, we may invest alongside such investors consistent with guidance promulgated by the SEC staff permitting us and an affiliated person to purchase interests in a single class of privately placed securities so long as certain conditions are met, including that we negotiate no term other than price. We may, in certain cases, also make investments in securities owned by affiliates that we acquire from non-affiliates. In such circumstances, our ability to participate in any restructuring of such investment or other transaction involving the issuer of such investment may be limited, and as a result, we may realize a loss on such investments that might have been prevented or reduced had we not been restricted in participating in such restructuring or other transaction.
Our failure to make follow-on investments in our portfolio companies could impair the value of our investments.
Following an initial investment in a portfolio company, we have made, and may continue to make, additional investments in that portfolio company as “follow-on” investments to:
|
•
|
increase or maintain in whole or in part our equity ownership percentage;
|
|
•
|
exercise warrants, options or convertible securities that were acquired in the original or subsequent financing; or
|
|
•
|
attempt to preserve or enhance the value of our investment.
|
We may elect not to make follow-on investments, may be constrained in our ability to employ available funds, or otherwise may lack sufficient funds to make those investments. We have the discretion to make any follow-on investments, subject to the availability of capital resources. However, doing so could be placing even more capital at risk in existing portfolio companies.
The failure to make follow-on investments may, in some circumstances, jeopardize the continued viability of a portfolio company and our initial investment, or may result in a missed opportunity for us to increase our participation in a successful investment. Even if we have sufficient capital to make a desired follow-on investment, we may elect not to make a follow-on investment because we may not want to increase our concentration of risk, because we prefer other opportunities or because we are inhibited by compliance with BDC requirements or the desire to maintain our tax status.
The disposition of our investments may result in contingent liabilities.
A significant portion of our investments involve private securities. In connection with the disposition of an investment in private securities, we may be required to make representations about the business and financial affairs of the portfolio company typical of those made in connection with the sale of a business. We may also be required to indemnify the purchasers
39
of such investment to the extent that any such representations turn out to be inaccurate or with respect to potential liabilities. These arrangements may result in contingent liabilities that ultimately result in funding obligations that we must satisfy through our return of distributions previously made to us.
Because we generally do not hold controlling equity interests in our portfolio companies, we may not be in a position to exercise control over our portfolio companies or to prevent decisions by management of our portfolio companies that could decrease the value of our investments.
Although we may do so in the future, currently we do not intend to hold controlling equity positions in our portfolio companies. Accordingly, we may not be able to control decisions relating to a minority equity investment, including decisions relating to the management and operation of the portfolio company and the timing and nature of any exit. As a result, we are subject to the risk that a portfolio company may make business decisions with which we disagree, and that the management and/or stockholders of a portfolio company may take risks or otherwise act in ways that are adverse to our interests. Due to the lack of liquidity of the investments that we typically hold in our portfolio companies, we may not be able to dispose of our investments in the event we disagree with the actions of a portfolio company and may therefore suffer a decrease in the value of our investments. If any of the foregoing were to occur, our financial condition, results of operations and cash flow could suffer as a result.
We may expose ourselves to risks if we engage in hedging transactions.
If we engage in hedging transactions, we may expose ourselves to risks associated with such transactions. We may utilize instruments such as forward contracts, credit default swaps, currency options and interest rate swaps, caps, collars and floors to seek to hedge against fluctuations in the relative values of our portfolio positions from changes in currency exchange rates, credit risk premiums, and market interest rates. Hedging against a decline in the values of our portfolio positions does not eliminate the possibility of fluctuations in the values of such positions or prevent losses if the values of such positions decline. However, such hedging can establish other positions designed to gain from those same developments, thereby offsetting the decline in the value of such portfolio positions. Such hedging transactions may also limit the opportunity for gain if the values of the underlying portfolio positions should increase. It may not be possible to hedge against an exchange rate or interest rate fluctuation at an acceptable price. The success of any hedging transactions we may enter into will depend on our ability to correctly predict movements in currencies and interest rates. Therefore, while we may enter into such transactions to seek to reduce currency exchange rate and interest rate risks, unanticipated changes in currency exchange rates or interest rates may result in poorer overall investment performance than if we had not engaged in any such hedging transactions. In addition, the degree of correlation between price movements of the instruments used in a hedging strategy and price movements in the portfolio positions being hedged may vary. Moreover, for a variety of reasons, we may not seek to establish a perfect correlation between such hedging instruments and the portfolio holdings being hedged. Any such imperfect correlation may prevent us from achieving the effect of the intended hedge and expose us to risk of loss. In addition, it may not be possible to hedge fully or perfectly against currency fluctuations affecting the value of securities denominated in non-U.S. currencies because the value of those securities is likely to fluctuate as a result of factors not related to currency fluctuations. Income derived from hedging transactions is generally not eligible to be distributed to non-U.S. stockholders free from U.S. withholding tax. We may be unable or determine not to hedge against particular risks, including if we determine that available hedging transactions are not available at an appropriate price.
There are certain risks associated with holding debt obligations that have original issue discount or payment-in-kind interest.
OID may arise if we hold securities issued at a discount or in certain other circumstances. OID and PIK create the risk that incentive fees will be paid to the Investment Adviser based on non-cash accruals that ultimately may not be realized, while the Investment Adviser will be under no obligation to reimburse us for these fees. We hold investments that result in OID interest and PIK interest.
The higher interest rates of OID instruments reflect the payment deferral and increased credit risk associated with these instruments, and OID instruments generally represent a significantly higher credit risk than coupon loans. Even if the accounting conditions for income accrual are met, the borrower could still default when our actual collection is supposed to occur at the maturity of the obligation.
OID instruments may have unreliable valuations because their continuing accruals require continuing judgments about the collectability of the deferred payments and the value of any associated collateral. OID income may also create uncertainty about the source of our cash dividends.
40
For accounting purposes, any cash dividends to stockholders representing OID income are not treated as coming from paid-in capital, even if the cash to pay them comes from the proceeds of issuances of our common stock. As a result, despite the fact that a dividend representing OID income could be paid out of amounts invested by our stockholders, the Investment Company Act does not require that stockholders be given notice of this fact by reporting it as a return of capital.
PIK interest has the effect of generating investment income at a compounding rate, thereby further increasing the incentive fees payable to the Investment Adviser. Similarly, all things being equal, the deferral associated with PIK interest also increases the loan-to-value ratio at a compounding rate.
Our investments may be affected by force majeure events.
Our investments may be affected by force majeure events (e.g. events beyond the control of the party claiming that the event has occurred, including, without limitation, acts of God, fire, flood, earthquakes, outbreaks of infectious disease, pandemic or any other serious public health concern, war, trade war, cyber security breaches, terrorism and labor strikes). Some force majeure events may adversely affect the ability of a party (including a portfolio company or a counterparty to us or a portfolio company) to perform its obligations until it is able to remedy the force majeure event. In addition, the cost to a portfolio company or us of repairing or replacing damaged assets resulting from such force majeure event could be considerable. Certain force majeure events (such as war or an outbreak of an infectious disease) could have a broader negative impact on the world economy and international business activity generally, or in any of the countries in which we may invest specifically.
Risks Related to an Investment in Our Common Stock and Other Securities That We May Issue
Investing in our securities may involve a high degree of risk.
The investments we make in accordance with our investment objective may result in a higher amount of risk than alternative investment options and volatility or loss of principal. Our investments in portfolio companies may be highly speculative and aggressive, and therefore an investment in our securities may not be suitable for someone with lower risk tolerance.
The market price of our securities may fluctuate significantly.
The market price and liquidity of the market for our common stock and any other securities that we may issue may be significantly affected by numerous factors, some of which are beyond our control and may not be directly related to our operating performance. These factors include:
|
•
|
changes or perceived changes in the value of our portfolio investments as a result of changes in market factors, such as interest rate shifts, and also portfolio specific performance, such as portfolio company defaults, among others reasons;
|
|
•
|
significant volatility in the market price and trading volume of securities of BDCs or other companies in our sector, which are not necessarily related to the operating performance of these companies;
|
|
•
|
price and volume fluctuations in the overall stock market from time to time;
|
|
•
|
the inclusion or exclusion of our securities from certain indices;
|
|
•
|
changes in law, regulatory policies or tax guidelines, particularly with respect to RICs or BDCs;
|
|
•
|
any loss of RIC status;
|
|
•
|
changes in our earnings or perceived changes or variations in our operating results;
|
|
•
|
changes in accounting guidelines governing valuation of our investments;
|
|
•
|
any shortfall in revenue or net income or any increase in losses from levels expected by investors or securities analysts;
|
|
•
|
the inability of our Investment Adviser to employ additional experienced investment professionals or the departure of any of our Investment Adviser’s key personnel;
|
|
•
|
short-selling pressure with respect to shares of our common stock or BDCs generally;
|
|
•
|
future sales of our securities convertible into or exchangeable or exercisable for our common stock or the conversion of such securities;
|
41
|
•
|
uncertainty surrounding the strength of the U.S. economy and where the debt market is in the credit cycle;
|
|
•
|
uncertainty between the U.S. and other countries with respect to trade policies, treaties, and tariffs;
|
|
•
|
the social, geopolitical, financial, trade and legal implications of Brexit;
|
|
•
|
fluctuations in base interest rates, such as LIBOR, EURIBOR, the Federal Funds Rate or the Prime Rate, and the uncertainties regarding the future of LIBOR;
|
|
•
|
operating performance of companies comparable to us;
|
|
•
|
general economic trends and other external factors; and
|
|
•
|
loss of a major funding source.
|
In the past, following periods of volatility in the market price of a company’s securities, securities class action litigation has often been brought against that company. If our stock price fluctuates significantly, we may be the target of securities litigation in the future. Securities litigation could result in substantial costs and divert management’s attention and resources from our business.
Our shares of common stock have traded at a discount from NAV and may do so again, which could limit our ability to raise additional equity capital.
We cannot assure you that a trading market for our common stock can be sustained. In addition, we cannot predict the prices at which our common stock will trade. Shares of closed-end investment companies, including BDCs, frequently trade at a discount from NAV and our common stock may also be discounted in the market. This characteristic of closed-end investment companies is separate and distinct from the risk that our NAV per share may decline. We cannot predict whether our common stock will trade at, above or below NAV. The risk of loss associated with this characteristic of closed-end management investment companies may be greater for investors expecting to sell shares of common stock purchased in the offering soon after the offering. Recently, the stocks of BDCs as an industry, including from time to time shares of our common stock, have traded below NAV and during much of 2009 traded at near historic lows as a result of concerns over liquidity, leverage restrictions and distribution requirements. See
“Risk Factors—Risks Related to Our Business and Structure—Capital markets may experience periods of disruption and instability. These market conditions may materially and adversely affect debt and equity capital markets in the United States and abroad, which may have a negative impact on our business and operations.”
In addition, when our common stock is trading below its NAV, we will generally not be able to sell additional shares of our common stock to the public at its market price without, among other things, first obtaining the requisite approval of our stockholders.
We may in the future determine to issue preferred stock, which could adversely affect the market value of our common stock.
The issuance of shares of preferred stock with dividend or conversion rights, liquidation preferences or other economic terms favorable to the holders of preferred stock could adversely affect the market price for our common stock by making an investment in the common stock less attractive. In addition, the dividends on any preferred stock we issue must be cumulative. Payment of dividends and repayment of the liquidation preference of preferred stock must take preference over any dividends or other payments to our common stockholders, and holders of preferred stock are not subject to any of our expenses or losses and are not entitled to participate in any income or appreciation in excess of their stated preference (other than convertible preferred stock that converts into common stock). In addition, under the Investment Company Act, preferred stock constitutes a “senior security” for purposes of the 150% asset coverage test.
Purchases of our common stock under our stock repurchase program, including a Company 10b5-1 Plan, may have resulted in the price of our common stock being higher than the price that otherwise might have existed in the open market.
On November 4, 2019, the Company’s Board of Directors authorized a 12-month extension of a previously approved $100 million stock repurchase program (the “Company Stock Repurchase Program”). Under such authorization, the Company Stock Repurchase Program will continue in effect until the earlier of November 5, 2020 and the date $100 million has been used to repurchase shares (including amounts already used to repurchase common stock prior to the extension of the Program. Pursuant to the Program, the Company is authorized to repurchase its outstanding common stock in the open market and/or through privately negotiated transactions at prices not to exceed the Company’s net asset value per share as reported in its most recent financial statements, in accordance with the guidelines specified in Rule 10b-18 of the Exchange Act, and the Company is authorized to determine, in its discretion, the timing, manner, price and amount of any repurchases, based upon the
42
evaluation of economic and market conditions, stock price, available cash, applicable legal and regulatory requirements and other factors, which may include purchases pursuant to Rule 10b5-1 of the Exchange Act. The Program does not require the Company to repurchase any specific number of shares and there can be no assurance as to the amount of shares repurchased under the Program. The Program may be suspended, extended, modified or discontinued by the Company at any time, subject to applicable law.
Pursuant to the authorization described above, the Company adopted a 10b5-1 plan (the “Company 10b5-1 Plan”). The Company 10b5-1 Plan provides that purchases will be conducted on the open market in accordance with Rule 10b5-1 and 10b-18 under the Exchange Act and will otherwise be subject to applicable law, which may prohibit purchases under certain circumstances. The amount of purchases made under the Company 10b5-1 Plan or otherwise and how much will be purchased at any time is uncertain, dependent on prevailing market prices and trading volumes, all of which we cannot predict.
These activities may have had the effect of maintaining the market price of our common stock or retarding a decline in the market price of the common stock, and, as a result, the price of our common stock may have been higher than the price that otherwise might have existed in the open market.
Sales of substantial amounts of our common stock in the public market may have an adverse effect on the market price of our common stock.
As of
February 25, 2020
, we had
57,181,623
shares of common stock outstanding. Sales of substantial amounts of our common stock, or the availability of such shares for sale, could adversely affect the prevailing market prices for our common stock. If this occurs and continues, it could impair our ability to raise additional capital through the sale of equity securities should we desire to do so.
Our stockholders will experience dilution in their ownership percentage if they opt out of our dividend reinvestment plan.
Our dividend reinvestment plan is an “opt out” dividend reinvestment plan, pursuant to which all dividends declared in cash payable to stockholders that do not elect to receive their distributions in cash are automatically reinvested in shares of our common stock, rather than receiving cash. As a result, our stockholders that “opt out” of our dividend reinvestment plan may experience dilution in their ownership percentage of our common stock over time. See Part II, Item 5 of this Form 10-K “
Market for Registrant’s Common Equity, Related Stockholder Matters and Issuer Purchases of Equity Securities—Common Stock
” and “
Market for Registrant’s Common Equity, Related Stockholder Matters and Issuer Purchases of Equity Securities—Distribution Policy
” for a description of our dividend policy and obligations.
There is a risk that our stockholders may not receive distributions or that our distributions may not grow over time and a portion of our distributions to you may be a return of capital for U.S. federal income tax purposes.
We intend to make distributions on a quarterly basis to our stockholders out of assets legally available for distribution. We cannot assure you that we will achieve investment results that will allow us to make a specified level of cash distributions or year-to-year increases in cash distributions. If we declare a dividend and if enough stockholders opt to receive cash distributions rather than participate in our dividend reinvestment plan, we may be forced to sell some of our investments in order to make cash dividend payments. In addition, due to the asset coverage test applicable to us as a BDC, we may be limited in our ability to make distributions. The Facilities may also limit our ability to declare dividends if we default under certain provisions. Further, if we invest a greater amount of assets in equity securities that do not pay current dividends, it could reduce the amount available for distribution. See Part II, Item 5 of this Form 10-K “
Market for Registrant’s Common Equity, Related Stockholder Matters and Issuer Purchases of Equity Securities—Common Stock.
” The above referenced restrictions on distributions may also inhibit our ability to make required interest payments to holders of our debt, which may cause a default under the terms of our debt agreements. Such a default could materially increase our cost of raising capital, as well as cause us to incur penalties under the terms of our debt agreements.
The distributions we pay to our stockholders in a year may exceed our taxable income for that year and, accordingly, a portion of such distributions may constitute a return of capital for U.S. federal income tax purposes that would reduce a stockholder’s adjusted tax basis in its shares of our common stock or preferred stock and correspondingly increase such stockholder’s gain, or reduce such stockholder’s loss, on disposition of such shares. Distributions in excess of a stockholder’s adjusted tax basis in its shares of our common stock or preferred stock will constitute capital gains to such stockholder.
43
Our stockholders may receive shares of our common stock as dividends, which could result in adverse tax consequences to them.
In order to satisfy the Annual Distribution Requirement applicable to RICs, we will have the ability to declare a large portion of a dividend in shares of our common stock instead of in cash. As long as a portion of such dividend is paid in cash and certain requirements are met, the entire distribution generally will be treated as a dividend for U.S. federal income tax purposes. As a result, a stockholder generally would be taxed on 100% of the fair market value of the dividend on the date the dividend is received by the stockholder in the same manner as a cash dividend, even though most of the dividend was paid in shares of our common stock. If a U.S. stockholder sells the common stock that it receives as a dividend in order to pay this tax, the sales proceeds may be less than the amount included in income with respect to the dividend, depending on the trading price (if any) of our common stock at the time of the sale. Furthermore, with respect to non-U.S. stockholders, we may be required to withhold U.S. tax with respect to such dividends, including in respect of all or a portion of such dividend that is payable in common stock. In addition, if a significant number of our stockholders were to determine to sell shares of our common stock in order to pay taxes owed on dividends, it may put downward pressure on the trading price (if any) of our common stock. It is unclear whether and to what extent we will be able to pay taxable dividends of the type described in this paragraph.
We may have difficulty paying our required distributions if we recognize taxable income before or without receiving cash representing such income.
For U.S. federal income tax purposes, we will include in our taxable income certain amounts that we have not yet received in cash, such as OID or accruals on a contingent payment debt instrument, which may occur if we receive warrants in connection with the origination of a loan or possibly in other circumstances or contracted PIK interest, which generally represents contractual interest added to the loan balance and due at the end of the loan term. Such OID and PIK interest will be included in our taxable income before we receive any corresponding cash payments. We also may be required to include in our taxable income certain other amounts that we will not receive in cash. The credit risk associated with the collectability of deferred payments may be increased as and when a portfolio company increases the amount of interest on which it is deferring cash payment through deferred interest features. Our investments with a deferred interest feature may represent a higher credit risk than loans for which interest must be paid in full in cash on a regular basis. For example, even if the accounting conditions for income accrual are met, the borrower could still default when our actual collection is scheduled to occur upon maturity of the obligation.
Because in certain cases we may recognize taxable income before or without receiving cash representing such income, we may have difficulty making distributions to our stockholders that will be sufficient to enable us to meet the Annual Distribution Requirement necessary for us to maintain our status as a RIC. Accordingly, we may need to sell some of our assets at times and/or at prices that we would not consider advantageous, we may need to raise additional equity or debt capital, or we may need to forego new investment opportunities or otherwise take actions that are disadvantageous to our business (or be unable to take actions that are advantageous to our business) to enable us to make distributions to our stockholders that will be sufficient to enable us to meet the Annual Distribution Requirement. If we are unable to obtain cash from other sources to meet the Annual Distribution Requirement, we may fail to qualify for the U.S. federal income tax benefits allowable to RICs and, thus, become subject to a corporate-level U.S. federal income tax (and any applicable U.S. state and local taxes). Alternatively, we may, with the consent of all our shareholders, designate an amount as a consent dividend (
i.e.
, a deemed dividend). In that case, although we would not distribute any actual cash to our shareholders, the consent dividend would be treated like an actual dividend under the Code for all U.S. federal income tax purposes. This would allow us to deduct the amount of the consent dividend and our shareholders would be required to include that amount in income as if it were actually distributed. For additional discussion regarding the tax implications of a RIC, see Part I, Item 1 of this Form 10-K “
Business—Election to be Taxed as a RIC
.”
Non-U.S. stockholders may be subject to withholding of U.S. federal income tax on dividends we pay.
Distributions of our “investment company taxable income” to a non-U.S. stockholder that are not effectively connected with the non-U.S. stockholder’s conduct of a trade or business within the United States may be subject to withholding of U.S. federal income tax at a 30% rate (or lower rate provided by an applicable income tax treaty) to the extent of our current or accumulated earnings and profits. Certain properly designated dividends are generally exempt from withholding of U.S. federal income tax, including certain dividends that are paid in respect of our (i) “qualified net interest income” (generally, our U.S.-source interest income, other than certain contingent interest and interest from obligations of a corporation or partnership in which we or the non-U.S. stockholder are at least a 10% shareholder, reduced by expenses that are allocable to such income) or (ii) “qualified short-term capital gains” (generally, the excess of our net short-term capital gain over our long-term capital loss for such taxable year), and certain other requirements were satisfied. No assurance can be given
44
as to whether any of our distributions will be eligible for this exemption from withholding of U.S. federal income tax or, if eligible, will be designated as such by us. See Part I, Item 1 of this Form 10-K “
Business—Election to be Taxed as a RIC
.”
Holders of any preferred stock that we may issue would have the right to elect members of the board of directors and class voting rights on certain matters.
Holders of any preferred stock we might issue, voting separately as a single class, would have the right to elect two members of the board of directors at all times and in the event dividends become two full years in arrears would have the right to elect a majority of the directors until such arrearage is completely eliminated. In addition, preferred stockholders have class voting rights on certain matters, including changes in fundamental investment restrictions and conversion to open-end status, and accordingly can veto any such changes. Restrictions imposed on the declarations and payment of dividends or other distributions to the holders of our common stock and preferred stock, both by the Investment Company Act and by requirements imposed by rating agencies or the terms of our credit facilities, might impair our ability to maintain our qualification as a RIC for federal income tax purposes. While we would intend to redeem our preferred stock to the extent necessary to enable us to distribute our income as required to maintain our qualification as a RIC, there can be no assurance that such actions could be effected in time to meet the tax requirements.
Item 1B. Unresolved Staff Comments
None.
Item 2. Properties
We maintain our principal executive office at 520 Madison Avenue, 40
th
Floor, New York, NY 10022. We do not own any real estate.
Item 3. Legal Proceedings
The Company may become party to certain lawsuits in the ordinary course of business, including proceedings relating to the enforcement of our rights under contracts with our portfolio companies. The Company is not currently subject to any material legal proceedings, nor, to our knowledge, is any material legal proceeding threatened against the Company. See also Note 11 to the consolidated financial statements in Part II, Item 8 of this Form 10-K.
Item 4. Mine Safety Disclosures
Not applicable.
45
PART II
Item 5. Market for Registrant’s Common Equity, Related Stockholder Matters and Issuer Purchases of Equity Securities (dollar amounts in thousands, except per share data)
Common Stock
Our common stock is traded on The Nasdaq Global Select Market under the symbol “CGBD.” Our common stock has historically traded at prices both above and below our NAV per share. It is not possible to predict whether our common stock will trade at, above or below NAV. See Part I, Item 1A of this Form 10-K “
Risk Factors—Risks Related to an Investment in Our Securities—Our shares of common stock have traded at a discount from NAV and may do so again, which could limit our ability to raise additional equity capital.
”
On February 24, 2020, the last reported closing sales price of our common stock on The Nasdaq Global Select Market was
$13.32
per share, which represented a discount of approximately
19.6%
to the NAV per share reported by us as of
December 31, 2019
.
Holders
As of February 24, 2020, there were approximately 27 holders of record of our common stock (including Cede & Co.).
Distributions
To the extent that we have taxable income available, we intend to distribute quarterly dividends to our stockholders. The amount of our dividends, if any, will be determined by our Board of Directors. Any dividends to our stockholders will be declared out of assets legally available for distribution. We anticipate that our distributions will generally be paid from taxable earnings, including interest and capital gains generated by our investment portfolio, and any other income, including any other fees (other than fees for providing managerial assistance), such as commitment, origination, structuring, diligence and consulting fees or other fees, that we receive from portfolio companies. However, if we do not generate sufficient taxable earnings during a year, all or part of a distribution may constitute a return of capital. The specific tax characteristics of our dividends and other distributions will be reported to stockholders after the end of each calendar year.
We have elected to be treated, and intend to continue to qualify annually, as a RIC. To maintain our qualification as a RIC, we must, among other things, distribute at least 90% of our ordinary income and realized net short-term capital gains in excess of realized net long-term capital losses, if any, to our stockholders on an annual basis. In order to avoid certain excise taxes imposed on RICs, we intend to distribute during each calendar year an amount at least equal to the sum of: (1) 98% of our ordinary income for the calendar year; (2) 98.2% of our capital gain net income (both long-term and short-term) for the one-year period ending on October 31 of the calendar year; and, (3) any undistributed ordinary income and capital gain net income for preceding years that were not distributed during such years and on which we paid no U.S. federal income tax less certain over-distributions in prior years. In addition, although we currently intend to distribute realized net capital gains (i.e., net long term capital gains in excess of short term capital losses), if any, at least annually, we may in the future decide to retain such capital gains for investment, pay U.S. federal income tax on such amounts at regular corporate tax rates, and elect to treat such gains as deemed distributions to stockholders. We can offer no assurance that we will achieve results that will permit the payment of any cash distributions and, to the extent that we issue senior securities, we will be prohibited from making distributions if doing so causes us to fail to maintain the asset coverage ratios stipulated by the Investment Company Act or if distributions are limited by the terms of any of our borrowings.
We intend to make distributions in cash unless a stockholder elects to receive dividends and/or long-term capital gains distributions in additional shares of common stock.
See “—Dividend Reinvestment Plan”
below. We can offer no assurance that we will achieve results that will permit the payment of any cash distributions and, if we issue senior securities, we will be prohibited from making distributions if doing so causes us to fail to maintain the asset coverage ratios stipulated by the Investment Company Act or if distributions are limited by the terms of any of our borrowings.
Dividend Reinvestment Plan
Prior to July 5, 2017, we had an “opt in” dividend reinvestment plan. Effective on July 5, 2017, we converted our “opt in” dividend reinvestment plan to an “opt out” dividend reinvestment plan that provides for reinvestment of our dividends and other distributions on behalf of our stockholders, other than those stockholders who have “opted out” of the plan. As a result of adopting the plan, if our Board of Directors authorizes, and we declare, a cash dividend or distribution, our stockholders who have not elected to “opt out” of our dividend reinvestment plan will have their cash dividends or distributions automatically
46
reinvested in additional shares of our common stock, rather than receiving cash. Each registered stockholder may elect to have such stockholder’s dividends and distributions distributed in cash rather than participate in the plan. For any registered stockholder that does not so elect, distributions on such stockholder’s shares will be reinvested by State Street Bank and Trust Company, our plan administrator, in additional shares. The number of shares to be issued to the stockholder will be determined based on the total dollar amount of the cash distribution payable, net of applicable withholding taxes. We intend to use primarily newly issued shares to implement the plan so long as the market value per share is equal to or greater than the net asset value per share on the relevant valuation date. If the market value per share is less than the net asset value per share on the relevant valuation date, the plan administrator would implement the plan through the purchase of common stock on behalf of participants in the open market, unless we instruct the plan administrator otherwise.
Recent Sales of Unregistered Securities and Use of Proceeds
The Company did not sell any securities during the period covered by this Form 10-K that were not registered under the Securities Act.
Stock Performance Graph
This graph compares the stockholder return on our common stock from June 14, 2017 (the date our common stock commenced trading on The Nasdaq Global Select Market) to
December 31, 2019
with that of the Standard & Poor’s BDC Index (the “S&P BDC Index”) and the Standard & Poor’s 500 Stock Index (the “S&P 500 Index”). This graph assumes that on June 14, 2017, $100 was invested in our common stock, the S&P BDC Index and the S&P 500 Index. The graph also assumes the reinvestment of all cash dividends prior to any tax effect. The graph and other information furnished under this Part II, Item 5 of this Form 10-K shall not be deemed to be “soliciting material” or to be “filed” with the SEC or subject to Regulation 14A or 14C under, or to the liabilities of Section 18 of, the Exchange Act. The stock price performance included in the below graph is not necessarily indicative of future stock performance.
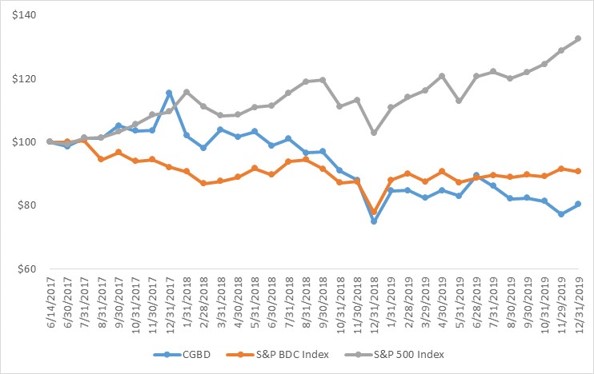
47
Purchases of Equity Securities by the Issuer and Affiliated Purchasers
The following table provides information regarding purchases of our common stock made by or on behalf of the Company or any “affiliated purchaser” (as defined in Rule 10b-18(a)(3) under the Exchange Act) during the fourth quarter of
2019
.
|
Period
|
Total Number of Shares Purchased
(1)
|
Average Price Paid Per Share
|
Total Number of Shares Purchased as Part of Publicly Announced Plans or Programs
(1)(2)
|
Maximum (or Approximate Dollar Value) of Shares that May Yet Be Purchased Under the Plans or Programs
|
||||||||||
|
October 1, 2019 through October 31, 2019
|
—
|
|
$
|
—
|
|
—
|
|
$
|
47,628
|
|
||||
|
November 1, 2019 through November 30, 2019
|
91,000
|
|
13.50
|
|
91,000
|
|
46,400
|
|
||||||
|
December 1, 2019 through December 31, 2019
|
1,233,432
|
|
13.78
|
|
1,233,432
|
|
29,406
|
|
||||||
|
Total
|
1,324,432
|
|
1,324,432
|
|
||||||||||
|
(1)
|
On trade date basis.
|
|
(2)
|
Shares purchased by the Company pursuant to the Company's Stock Repurchase Program, which was entered into on November 5, 2018, and announced on November 6, 2018. Pursuant to the program, the Company is authorized to repurchase up to $100 million in the aggregate of its outstanding common stock in the open market and/or through privately negotiated transactions at prices not to exceed the Company’s net asset value per share as reported in its most recent financial statements, in accordance with the guidelines specified in Rule 10b-18 of the Exchange Act. The timing, manner, price and amount of any repurchases will be determined by the Company, in its discretion, based upon the evaluation of economic and market conditions, stock price, available cash, applicable legal and regulatory requirements and other factors, and may include purchases pursuant to Rule 10b5-1 of the Exchange Act. The program was expected to be in effect until November 5, 2019, or until the approved dollar amount has been used to repurchase shares. On November 4, 2019, the Company's Board of Directors approved the continuation of the Company Stock Repurchase Program until November 5, 2020, or until the approved dollar amount has been used to repurchase shares. The continuation of the program was announced on November 5, 2019. The program does not require the Company to repurchase any specific number of shares and there can be no assurance as to the amount of shares repurchased under the program. The program may be suspended, extended, modified or discontinued by the Company at any time, subject to applicable law. Pursuant to the authorization described above, the Company adopted the Company 10b5-1 Plan. The Company 10b5-1 Plan provides that purchases will be conducted on the open market in accordance with Rules 10b5-1 and 10b-18 under the Exchange Act and will otherwise be subject to applicable law, which may prohibit purchases under certain circumstances. The amount of purchases made under the Company 10b5-1 Plan or otherwise and how much will be purchased at any time is uncertain, dependent on prevailing market prices and trading volumes, all of which we cannot predict.
|
48
Item 6. Selected Financial Data
The tables below set forth our selected consolidated historical financial data for the periods indicated. The selected consolidated historical financial data as of and for the years ended
December 31, 2019
,
2018
,
2017
,
2016
and
2015
have been derived from our audited consolidated financial statements, which are included in “
Financial Statements and Supplementary Data
” in Part II, Item 8 of this Form 10-K. Our historical results are not necessarily indicative of future results. The selected financial data in this section is not intended to replace the financial statements and is qualified in its entirety by the financial statements and related notes included in this filing.
The selected consolidated financial information and other data presented below should be read in conjunction with the information contained in Part II, Item 7 of this Form 10-K “
Management’s Discussion and Analysis of Financial Condition and Results of Operations
,” the audited consolidated financial statements and the notes thereto in Part II, Item 8 of this Form 10-K, “
Financial Statements and Supplementary Data
”.
|
|
For the years ended December 31,
|
||||||||||||||||||
|
|
2019
|
2018
|
2017
|
2016
|
2015
|
||||||||||||||
|
(dollar amounts in thousands, except per share data)
|
|
|
|
|
|||||||||||||||
|
Consolidated Statements of Operations Data
|
|||||||||||||||||||
|
Income
|
|||||||||||||||||||
|
Total investment income
|
$
|
221,298
|
|
$
|
207,526
|
|
$
|
165,001
|
|
$
|
110,971
|
|
$
|
69,190
|
|
||||
|
Expenses
|
|||||||||||||||||||
|
Net expenses (including excise tax expense)
|
113,633
|
|
99,090
|
|
72,850
|
|
51,350
|
|
33,666
|
|
|||||||||
|
Net investment income (loss)
|
107,665
|
|
108,436
|
|
92,151
|
|
59,621
|
|
35,524
|
|
|||||||||
|
Net realized gain (loss) on investments and non-investment assets and liabilities
|
(38,343
|
)
|
(1,368
|
)
|
(11,692
|
)
|
(9,644
|
)
|
1,164
|
|
|||||||||
|
Net change in unrealized appreciation (depreciation) on investments and non-investment assets and liabilities
|
(7,992
|
)
|
(67,953
|
)
|
3,741
|
|
19,832
|
|
(18,015
|
)
|
|||||||||
|
Net increase (decrease) in net assets resulting from operations
|
61,330
|
|
39,115
|
|
84,200
|
|
69,809
|
|
18,673
|
|
|||||||||
|
Per Share Data
|
|||||||||||||||||||
|
Basic and diluted net investment income
|
$
|
1.79
|
|
$
|
1.73
|
|
$
|
1.74
|
|
$
|
1.65
|
|
$
|
1.43
|
|
||||
|
Basic and diluted earnings
|
$
|
1.02
|
|
$
|
0.63
|
|
$
|
1.59
|
|
$
|
1.93
|
|
$
|
0.75
|
|
||||
|
Dividends declared
(1)
|
$
|
1.74
|
|
$
|
1.68
|
|
$
|
1.64
|
|
$
|
1.68
|
|
$
|
1.74
|
|
||||
|
(1)
|
Cumulative per share dividends declared by the Company’s Board of Directors for the years ended
December 31, 2019
,
2018
,
2017
,
2016
and
2015
, which are inclusive of special dividends of
$0.26
,
$0.20
,
$0.12
,
$0.07
, and
$0.18
per share, respectively.
|
49
|
|
As of and for the years ended December 31,
|
||||||||||||||||||
|
|
2019
|
2018
|
2017
|
2016
|
2015
|
||||||||||||||
|
(dollar amounts in thousands, except per share data)
|
|
|
|
|
|||||||||||||||
|
Consolidated Statements of Assets and Liabilities Data
|
|||||||||||||||||||
|
Investments—non-controlled/non-affiliated, at fair value
|
$
|
1,897,057
|
|
$
|
1,731,319
|
|
$
|
1,779,584
|
|
$
|
1,323,102
|
|
$
|
1,052,666
|
|
||||
|
Investments—non-controlled/affiliated, at fair value
|
—
|
|
18,543
|
|
15,431
|
|
—
|
|
—
|
|
|||||||||
|
Investments—controlled/affiliated, at fair value
|
226,907
|
|
222,295
|
|
172,516
|
|
99,657
|
|
—
|
|
|||||||||
|
Cash and cash equivalents
|
36,751
|
|
87,186
|
|
32,039
|
|
38,489
|
|
41,837
|
|
|||||||||
|
Total assets
|
2,187,533
|
|
2,084,743
|
|
2,021,383
|
|
1,490,155
|
|
1,104,032
|
|
|||||||||
|
Secured borrowings
|
616,543
|
|
514,635
|
|
562,893
|
|
421,885
|
|
234,313
|
|
|||||||||
|
2015-1 Notes
|
446,289
|
|
446,043
|
|
271,053
|
|
270,849
|
|
270,644
|
|
|||||||||
|
Senior Notes
|
115,000
|
|
—
|
|
—
|
|
—
|
|
—
|
|
|||||||||
|
Total liabilities
|
1,231,062
|
|
1,021,525
|
|
894,079
|
|
726,018
|
|
532,306
|
|
|||||||||
|
Total net assets
|
956,471
|
|
1,063,218
|
|
1,127,304
|
|
764,137
|
|
571,726
|
|
|||||||||
|
Net assets per share
|
$
|
16.56
|
|
$
|
17.09
|
|
$
|
18.12
|
|
$
|
18.32
|
|
$
|
18.14
|
|
||||
|
Other Data:
|
|||||||||||||||||||
|
Number of portfolio companies/structured finance obligations/investment fund at year end
|
112
|
|
96
|
|
90
|
|
86
|
|
85
|
|
|||||||||
|
Average funded investments in new portfolio companies/structured finance obligations/investment fund
(1)
|
$
|
19,617
|
|
$
|
20,218
|
|
$
|
26,816
|
|
$
|
12,188
|
|
$
|
12,996
|
|
||||
|
Total return based on NAV
(2)
|
7.08
|
%
|
3.59
|
%
|
7.86
|
%
|
10.25
|
%
|
5.41
|
%
|
|||||||||
|
(1)
|
Average is calculated per portfolio company based on the total amount funded during the period divided by the number of investments made in portfolio companies/structured finance obligations/investment fund during the year.
|
|
(2)
|
Total return is based on the change in NAV per share during the year plus the declared dividends, assuming reinvestment of dividends in accordance with the dividend reinvestment plan, divided by the beginning NAV for the year. Total return for the years ended December 31,
2017
,
2016
and
2015
was inclusive of
$(0.11)
and
$0.01
and
$0.11
, respectively, per share increase in NAV related to the offering price of the Company’s common stock. Excluding the effects of the higher offering price of the Company’s common stock, total return would have been
8.46%
,
10.20%
and
4.83%
, respectively (refer to Note 9 in Part II, Item 8 of this Form 10-K for additional information).
|
Item 7. Management’s Discussion and Analysis of Financial Condition and Results of Operations (dollar amounts in thousands, except per share data, unless otherwise indicated)
The following discussion and analysis of our financial condition and results of operations should be read in conjunction with Part I, Item 6 of this Form 10-K “Selected Financial Data” and our consolidated financial statements and related notes in Part II, Item 8 of this Form 10-K “Financial Statements and Supplementary Data.” This discussion contains forward-looking statements and involves numerous risks and uncertainties, including, but not limited to those described in Part I, Item 1A of this Form 10-K “Risk Factors.” Our actual results could differ materially from those anticipated by such forward-looking information due to factors discussed under “Risk Factors” and “Cautionary Statement Regarding Forward-Looking Statements” appearing elsewhere in this Form 10-K.
OVERVIEW
We are a Maryland corporation formed on February 8, 2012, and structured as an externally managed, non-diversified closed-end investment company. We have elected to be regulated as a BDC under the Investment Company Act. We have elected to be treated, and intend to continue to comply with the requirements to qualify annually, as a RIC under Subchapter M of the Code.
Our investment objective is to generate current income and capital appreciation primarily through debt investments in U.S. middle market companies. Our core investment strategy focuses on lending to U.S. middle market companies, which we define as companies with approximately $25 million to $100 million of EBITDA, which we believe is a useful proxy for cash flow. We complement this core strategy with additive, diversifying assets including, but not limited to, specialty lending investments. We seek to achieve our investment objective primarily through direct originations of Middle Market Senior Loans, with the balance of our assets invested in higher yielding investments (which may include unsecured debt, mezzanine debt and investments in equities). We generally make Middle Market Senior Loans to private U.S. middle market companies that are, in many cases, controlled by private equity firms. Depending on market conditions, we expect that between 70% and 80% of the
50
value of our assets will be invested in Middle Market Senior Loans. We expect that the composition of our portfolio will change over time given our Investment Adviser’s view on, among other things, the economic and credit environment (including with respect to interest rates) in which we are operating.
On June 19, 2017, we closed our IPO, issuing 9,454,200 shares of our common stock (including shares issued pursuant to the exercise of the underwriters’ over-allotment option on July 5, 2017) at a public offering price of $18.50 per share. Net of underwriting costs, we received cash proceeds of $169,488. Shares of common stock of TCG BDC began trading on the Nasdaq Global Select Market under the symbol “CGBD” on June 14, 2017.
On June 9, 2017, we acquired NF Investment Corp. (“NFIC”), a BDC managed by our Investment Advisor (the “NFIC Acquisition”). As a result, we issued 434,233 shares of common stock to the NFIC stockholders and approximately $145,602 in cash, and acquired approximately $153,648 in net assets.
We are externally managed by our Investment Adviser, an investment adviser registered under the Advisers Act. Our Administrator provides the administrative services necessary for us to operate. Both our Investment Adviser and our Administrator are wholly owned subsidiaries of Carlyle Investment Management L.L.C., a subsidiary of Carlyle.
In conducting our investment activities, we believe that we benefit from the significant scale and resources of Carlyle, including our Investment Adviser and its affiliates. We have operated our business as a BDC since we began our investment activities in May 2013.
KEY COMPONENTS OF OUR RESULTS OF OPERATIONS
Investments
Our level of investment activity can and does vary substantially from period to period depending on many factors, including the amount of debt available to middle market companies, the general economic environment and the competitive environment for the type of investments we make.
Revenue
We generate revenue primarily in the form of interest income on debt investments we hold. In addition, we generate income from dividends on direct equity investments, capital gains on the sales of loans and debt and equity securities and various loan origination and other fees. Our debt investments generally have a stated term of five to eight years and generally bear interest at a floating rate usually determined on the basis of a benchmark such as LIBOR. Interest on these debt investments is generally paid quarterly. In some instances, we receive payments on our debt investments based on scheduled amortization of the outstanding balances. In addition, we receive repayments of some of our debt investments prior to their scheduled maturity date. The frequency or volume of these repayments fluctuates significantly from period to period. Our portfolio activity also reflects the proceeds of sales of securities. We may also generate revenue in the form of commitment, origination, amendment, structuring or due diligence fees, fees for providing managerial assistance and consulting fees.
Expenses
Our primary operating expenses include the payment of: (i) investment advisory fees, including base management fees and incentive fees, to our Investment Adviser pursuant to the Investment Advisory Agreement between us and our Investment Adviser; (ii) costs and other expenses and our allocable portion of overhead incurred by our Administrator in performing its administrative obligations under the Administration Agreement between us and our Administrator; and (iii) other operating expenses as detailed below:
|
•
|
administration fees payable under our Administration Agreement and Sub-Administration Agreements, including related expenses;
|
|
•
|
the costs of any offerings of our common stock and other securities, if any;
|
|
•
|
calculating individual asset values and our net asset value (including the cost and expenses of any independent valuation firms);
|
|
•
|
expenses, including travel expenses, incurred by our Investment Adviser, or members of our Investment Adviser team managing our investments, or payable to third parties, performing due diligence on prospective portfolio companies and, if necessary, expenses of enforcing our rights;
|
|
•
|
the base management fee and any incentive fee payable under our Investment Advisory Agreement;
|
51
|
•
|
certain costs and expenses relating to distributions paid on our shares;
|
|
•
|
debt service and other costs of borrowings or other financing arrangements;
|
|
•
|
the allocated costs incurred by our Investment Adviser in providing managerial assistance to those portfolio companies that request it;
|
|
•
|
amounts payable to third parties relating to, or associated with, making or holding investments;
|
|
•
|
the costs associated with subscriptions to data service, research-related subscriptions and expenses and quotation equipment and services used in making or holding investments;
|
|
•
|
transfer agent and custodial fees;
|
|
•
|
costs of hedging;
|
|
•
|
commissions and other compensation payable to brokers or dealers;
|
|
•
|
federal and state registration fees;
|
|
•
|
any U.S. federal, state and local taxes, including any excise taxes;
|
|
•
|
independent director fees and expenses;
|
|
•
|
costs of preparing financial statements and maintaining books and records, costs of preparing tax returns, costs of Sarbanes-Oxley Act compliance and attestation and costs of filing reports or other documents with the SEC (or other regulatory bodies), and other reporting and compliance costs, including registration and listing fees, and the compensation of professionals responsible for the preparation or review of the foregoing;
|
|
•
|
the costs of any reports, proxy statements or other notices to our stockholders (including printing and mailing costs), the costs of any stockholders’ meetings and the compensation of investor relations personnel responsible for the preparation of the foregoing and related matters;
|
|
•
|
the costs of specialty and custom software for monitoring risk, compliance and overall portfolio, including any development costs incurred prior to the filing of our election to be regulated as a BDC;
|
|
•
|
our fidelity bond;
|
|
•
|
directors and officers/errors and omissions liability insurance, and any other insurance premiums;
|
|
•
|
indemnification payments;
|
|
•
|
direct fees and expenses associated with independent audits, agency, consulting and legal costs; and
|
|
•
|
all other expenses incurred by us or our Administrator in connection with administering our business, including our allocable share of certain officers and their staff compensation.
|
We expect our general and administrative expenses to be relatively stable or to decline as a percentage of total assets during periods of asset growth and to increase during periods of asset declines.
52
PORTFOLIO AND INVESTMENT ACTIVITY
Below is a summary of certain characteristics of our investment portfolio as of
December 31, 2019
,
2018
and
2017
.
|
As of December 31,
|
||||||||
|
2019
|
2018
|
2017
|
||||||
|
Count of investments
|
136
|
|
119
|
|
107
|
|
||
|
Count of portfolio companies / investment fund
|
112
|
|
96
|
|
90
|
|
||
|
Count of industries
|
28
|
|
27
|
|
28
|
|
||
|
Count of sponsors
|
63
|
|
57
|
|
57
|
|
||
|
Percentage of total investment fair value:
|
||||||||
|
First lien debt
|
74.6
|
%
|
68.1
|
%
|
65.7
|
%
|
||
|
First lien / last out loans
|
3.7
|
%
|
10.3
|
%
|
12.1
|
%
|
||
|
Second lien debt
|
11.0
|
%
|
9.1
|
%
|
12.5
|
%
|
||
|
Total secured debt
|
89.3
|
%
|
87.5
|
%
|
90.3
|
%
|
||
|
Credit Fund
|
9.6
|
%
|
11.3
|
%
|
8.8
|
%
|
||
|
Equity investments
|
1.0
|
%
|
1.3
|
%
|
0.9
|
%
|
||
|
Percentage of debt investment fair value:
|
||||||||
|
Floating rate
(1)
|
99.7
|
%
|
99.2
|
%
|
99.0
|
%
|
||
|
Fixed interest rate
|
0.3
|
%
|
0.8
|
%
|
1.0
|
%
|
||
(1) Primarily subject to interest rate floors.
53
Our investment activity for the years ended
December 31, 2019
,
2018
and
2017
is presented below (information presented herein is at amortized cost unless otherwise indicated):
|
|
For the years ended December 31,
|
||||||||||
|
|
2019
|
2018
|
2017
|
||||||||
|
Investments:
|
|||||||||||
|
Total investments, beginning of year
|
$
|
2,043,591
|
|
$
|
1,971,012
|
|
$
|
1,429,981
|
|
||
|
New investments purchased
|
1,000,467
|
|
950,255
|
|
1,340,824
|
|
|||||
|
Net accretion of discount on investments
|
12,955
|
|
12,814
|
|
11,747
|
|
|||||
|
Net realized gain (loss) on investments
|
(38,376
|
)
|
(1,368
|
)
|
(11,692
|
)
|
|||||
|
Investments sold or repaid
|
(817,186
|
)
|
(889,122
|
)
|
(799,848
|
)
|
|||||
|
Total investments, end of year
|
$
|
2,201,451
|
|
$
|
2,043,591
|
|
$
|
1,971,012
|
|
||
|
Principal amount of investments funded:
|
|||||||||||
|
First Lien Debt (excluding First Lien/Last Out)
|
$
|
653,217
|
|
$
|
648,034
|
|
$
|
837,732
|
|
||
|
First Lien/Last Out Unitranche
|
73,272
|
|
23,507
|
|
153,674
|
|
|||||
|
Second Lien Debt
|
144,217
|
|
135,587
|
|
179,162
|
|
|||||
|
Equity Investments
|
5,436
|
|
5,302
|
|
8,887
|
|
|||||
|
Investment Fund
|
131,699
|
|
151,650
|
|
187,460
|
|
|||||
|
Total
|
$
|
1,007,841
|
|
$
|
964,080
|
|
$
|
1,366,915
|
|
||
|
Principal amount of investments sold or repaid:
|
|||||||||||
|
First Lien Debt (excluding First Lien/Last Out)
|
$
|
(419,151
|
)
|
$
|
(566,490
|
)
|
$
|
(498,475
|
)
|
||
|
First Lien/Last Out Unitranche
|
(204,702
|
)
|
(29,682
|
)
|
(86,939
|
)
|
|||||
|
Second Lien Debt
|
(88,695
|
)
|
(200,465
|
)
|
(107,748
|
)
|
|||||
|
Structured Finance Obligations
|
—
|
|
—
|
|
(27,000
|
)
|
|||||
|
Investment Fund
|
(145,200
|
)
|
(93,900
|
)
|
(112,594
|
)
|
|||||
|
Total
|
$
|
(860,818
|
)
|
$
|
(891,537
|
)
|
$
|
(832,756
|
)
|
||
|
Number of new funded investments
|
51
|
|
47
|
|
50
|
|
|||||
|
Average amount of new funded investments
|
$
|
19,617
|
|
$
|
20,218
|
|
$
|
26,816
|
|
||
|
Percentage of new funded debt investments at floating interest rates
|
99
|
%
|
100
|
%
|
99
|
%
|
|||||
|
Percentage of new funded debt investments at fixed interest rates
|
1
|
%
|
—
|
%
|
1
|
%
|
|||||
As of
December 31, 2019
and
2018
, investments consisted of the following:
|
|
December 31, 2019
|
December 31, 2018
|
|||||||||||
|
|
Amortized Cost
|
Fair Value
|
Amortized Cost
|
Fair Value
|
|||||||||
|
First Lien Debt (excluding First Lien/Last Out)
|
$
|
1,649,721
|
|
$
|
1,585,042
|
|
1,375,437
|
|
1,343,422
|
|
|||
|
First Lien/Last Out Unitranche
|
78,951
|
|
78,096
|
|
241,263
|
|
202,849
|
|
|||||
|
Second Lien Debt
|
234,006
|
|
234,532
|
|
179,434
|
|
178,958
|
|
|||||
|
Equity Investments
|
22,272
|
|
21,698
|
|
17,456
|
|
24,633
|
|
|||||
|
Investment Fund
|
216,501
|
|
204,596
|
|
230,001
|
|
222,295
|
|
|||||
|
Total
|
$
|
2,201,451
|
|
$
|
2,123,964
|
|
2,043,591
|
|
1,972,157
|
|
|||
54
The weighted average yields
(1)
for our first and second lien debt, based on the amortized cost and fair value as of
December 31, 2019
and
2018
, were as follows:
|
|
December 31, 2019
|
December 31, 2018
|
|||||||||
|
|
Amortized Cost
|
Fair Value
|
Amortized Cost
|
Fair Value
|
|||||||
|
First Lien Debt (excluding First Lien/Last Out)
|
8.00
|
%
|
8.17
|
%
|
9.16
|
%
|
9.38
|
%
|
|||
|
First Lien/Last Out Unitranche
|
6.63
|
%
|
9.53
|
%
|
10.62
|
%
|
12.63
|
%
|
|||
|
First Lien Debt Total
|
7.91
|
%
|
8.23
|
%
|
9.38
|
%
|
9.80
|
%
|
|||
|
Second Lien Debt
|
10.44
|
%
|
10.42
|
%
|
11.04
|
%
|
11.07
|
%
|
|||
|
First and Second Lien Debt Total
|
8.22
|
%
|
8.50
|
%
|
9.54
|
%
|
9.94
|
%
|
|||
|
(1)
|
Weighted average yields include the effect of accretion of discounts and amortization of premiums and are based on interest rates as of
December 31, 2019
and
2018
. Weighted average yield on debt and income producing securities at fair value is computed as (a) the annual stated interest rate or yield earned plus the net annual amortization of OID and market discount earned on accruing debt included in such securities, divided by (b) total first lien and second lien debt at fair value included in such securities. Weighted average yield on debt and income producing securities at amortized cost is computed as (a) the annual stated interest rate or yield earned plus the net annual amortization of OID and market discount earned on accruing debt included in such securities, divided by (b) total first lien and second lien debt at amortized cost included in such securities. Actual yields earned over the life of each investment could differ materially from the yields presented above.
|
Total weighted average yields (which includes the effect of accretion of discount and amortization of premiums) of our first and second lien debt investments as measured on an amortized cost basis decreased from
9.54%
to
8.22%
from
December 31, 2018
to
December 31, 2019
. The decrease in weighted average yields was primarily due to a decrease in the effective LIBOR rate applicable to loans in the portfolio and the impact of loans on non-accrual status.
The following table summarizes the fair value of our performing and non-accrual/non-performing investments as of
December 31, 2019
and
2018
:
|
|
December 31, 2019
|
December 31, 2018
|
|||||||||||
|
|
Fair Value
|
Percentage
|
Fair Value
|
Percentage
|
|||||||||
|
Performing
|
$
|
2,071,535
|
|
97.53
|
%
|
$
|
1,957,830
|
|
99.27
|
%
|
|||
|
Non-accrual
(1)
|
52,429
|
|
2.47
|
|
14,327
|
|
0.73
|
|
|||||
|
Total
|
$
|
2,123,964
|
|
100.00
|
%
|
$
|
1,972,157
|
|
100.00
|
%
|
|||
|
(1)
|
For information regarding our non-accrual policy, see Note 2 to the consolidated financial statements included in Part II, Item 8 of this Form 10-K.
|
See the Consolidated Schedules of Investments as of
December 31, 2019
and
2018
in our consolidated financial statements in Part II, Item 8 of this Form 10-K
“Financial Statements and Supplementary Data”
for more information on these investments, including a list of companies and type and amount of investments.
As part of the monitoring process, our Investment Adviser has developed risk assessment policies pursuant to which it regularly assesses the risk profile of each of our debt investments and rates each of them based on the following categories, which we refer to as “Internal Risk Ratings”:
55
Internal Risk Ratings Definitions
|
Rating
|
Definition
|
|
|
1
|
|
Performing—Low Risk:
Borrower is operating more than 10% ahead of the base case.
|
|
2
|
|
Performing—Stable Risk:
Borrower is operating within 10% of the base case (above or below). This is the initial rating assigned to all new borrowers.
|
|
3
|
|
Performing—Management Notice:
Borrower is operating more than 10% below the base case. A financial covenant default may have occurred, but there is a low risk of payment default.
|
|
4
|
|
Watch List:
Borrower is operating more than 20% below the base case and there is a high risk of covenant default, or it may have already occurred. Payments are current although subject to greater uncertainty, and there is moderate to high risk of payment default.
|
|
5
|
|
Watch List—Possible Loss:
Borrower is operating more than 30% below the base case. At the current level of operations and financial condition, the borrower does not have the ability to service and ultimately repay or refinance all outstanding debt on current terms. Payment default is very likely or may have occurred. Loss of principal is possible.
|
|
6
|
|
Watch List—Probable Loss:
Borrower is operating more than 40% below the base case, and at the current level of operations and financial condition, the borrower does not have the ability to service and ultimately repay or refinance all outstanding debt on current terms. Payment default is very likely or may have already occurred. Additionally, the prospects for improvement in the borrower’s situation are sufficiently negative that impairment of some or all principal is probable.
|
Our Investment Adviser’s risk rating model is based on evaluating portfolio company performance in comparison to the base case when considering certain credit metrics including, but not limited to, adjusted EBITDA and net senior leverage as well as specific events including, but not limited to, default and impairment.
Our Investment Adviser monitors and, when appropriate, changes the investment ratings assigned to each debt investment in our portfolio. In connection with our quarterly valuation process, our Investment Adviser reviews our investment ratings on a regular basis. The following table summarizes the Internal Risk Ratings as of
December 31, 2019
and
2018
:
|
|
December 31, 2019
|
December 31, 2018
|
|||||||||||
|
(dollar amounts in millions)
|
Fair Value
|
% of Fair Value
|
Fair Value
|
% of Fair Value
|
|||||||||
|
Internal Risk Rating 1
|
$
|
39.2
|
|
2.06
|
%
|
$
|
71.0
|
|
4.12
|
%
|
|||
|
Internal Risk Rating 2
|
1,501.4
|
|
79.12
|
|
1,302.9
|
|
75.52
|
|
|||||
|
Internal Risk Rating 3
|
132.9
|
|
7.00
|
|
208.4
|
|
12.08
|
|
|||||
|
Internal Risk Rating 4
|
159.0
|
|
8.38
|
|
105.1
|
|
6.09
|
|
|||||
|
Internal Risk Rating 5
|
65.2
|
|
3.44
|
|
23.5
|
|
1.36
|
|
|||||
|
Internal Risk Rating 6
|
—
|
|
—
|
|
14.3
|
|
0.83
|
|
|||||
|
Total
|
$
|
1,897.7
|
|
100.00
|
%
|
$
|
1,725.2
|
|
100.00
|
%
|
|||
As of
December 31, 2019
and
2018
, the weighted average Internal Risk Rating of our debt investment portfolio was
2.3
and
2.3
respectively. As of
December 31, 2019
and
2018
,
18
and
12
of our debt investments, with an aggregate fair value of
$224.3 million
and
$142.9 million
, respectively, were assigned an Internal Risk Rating of 4-6. As of
December 31, 2019
and
2018
, five and two first lien debt investments in the portfolio with a fair value of
$52.4 million
and
$14.3 million
, respectively, were on non-accrual status, which represented approximately
2.47%
and
0.73%
, respectively, of total investments at fair value. The remaining first and second lien debt investments were performing and current on their interest payments as of
December 31, 2019
and
2018
.
During the year ended
December 31, 2019
, 11 investments with fair value of $210.4 million were downgraded to an Internal Risk Rating of 4 due to changes in financial condition and performance of the respective portfolio companies and 4 investments with fair value of $74.6 million were upgraded and removed from the Watch List due to improved performance of the respective portfolio companies and one investment on Watch List with fair value of $9.5 million was sold.
56
CONSOLIDATED RESULTS OF OPERATIONS
For the years ended
December 31, 2019
,
2018
and
2017
The net increase or decrease in net assets from operations may vary substantially from period to period as a result of various factors, including the recognition of realized gains and losses and net change in unrealized appreciation and depreciation. As a result, quarterly comparisons may not be meaningful.
Investment Income
Investment income for the years ended
December 31, 2019
,
2018
and
2017
, was as follows:
|
|
For the years ended December 31,
|
||||||||||
|
|
2019
|
2018
|
2017
|
||||||||
|
Investment income:
|
|||||||||||
|
First Lien Debt
|
$
|
168,750
|
|
$
|
151,000
|
|
$
|
119,222
|
|
||
|
Second Lien Debt
|
24,203
|
|
27,678
|
|
26,057
|
|
|||||
|
Equity Investments
|
63
|
|
63
|
|
95
|
|
|||||
|
Investment Fund
|
27,931
|
|
28,490
|
|
19,453
|
|
|||||
|
Cash
|
351
|
|
295
|
|
174
|
|
|||||
|
Total investment income
|
$
|
221,298
|
|
$
|
207,526
|
|
$
|
165,001
|
|
||
The increase in investment income for the year ended
December 31, 2019
from the comparable period in
2018
was primarily driven by our increasing invested balance. As of
December 31, 2019
, the size of our portfolio increased to
$2,201,451
from
$2,043,591
as of
December 31, 2018
at amortized cost, and total principal amount of investments outstanding increased to
$2,207,949
from $2,073,835 as of
December 31, 2018
. As of
December 31, 2019
, the weighted average yield of our first and second lien debt decreased to
8.22%
from
9.54%
as of
December 31, 2018
, on amortized cost, primarily due to the decrease in LIBOR and loans placed on non-accrual status.
The increase in investment income for the year ended
December 31, 2018
from the comparable period in
2017
was primarily driven by our deployment of capital, increasing invested balance, an increase in LIBOR, and increased interest and dividend income from Credit Fund. The size of our portfolio increased to
$2,043,591
as of
December 31, 2018
from $1,971,012 as of
December 31, 2017
, at amortized cost, and total principal amount of investments outstanding increased to $2,073,835 as of
December 31, 2018
from $2,000,315 as of
December 31, 2017
. As of
December 31, 2018
, the weighted average yield of our first and second lien debt increased to
9.54%
from
8.86%
as of
December 31, 2017
, on amortized cost, primarily due to the increase in LIBOR, partially offset by generally lower yields on new investments compared to the yields on exited investments and loans placed on non-accrual status.
Interest income on our first and second lien debt investments is dependent on the composition and credit quality of the portfolio. Generally, we expect the portfolio to generate predictable quarterly interest income based on the terms stated in each loan’s credit agreement. As of
December 31, 2019
and
2018
, five and two first lien debt investments in the portfolio were on non-accrual with the fair value of
$52,429
and
$14,327
, which represents approximately
2.47%
and
0.73%
of total investments at fair value, respectively. The remaining first and second lien debt investments were performing and current on their interest payments as of
December 31, 2019
and
2018
. As of
December 31, 2017
, one first lien debt investment in the portfolio was non-performing. The fair value of the loans in the portfolio on non-accrual status was $19,487, which represents approximately 0.99% of total investments at fair value. The remaining first and second lien debt investments were performing and current on their interest payments as of
December 31, 2017
and for the year then ended.
Net investment income (loss) for the years ended
December 31, 2019
,
2018
and
2017
was as follows:
|
|
For the years ended December 31,
|
||||||||||
|
|
2019
|
2018
|
2017
|
||||||||
|
Total investment income
|
$
|
221,298
|
|
$
|
207,526
|
|
$
|
165,001
|
|
||
|
Net expenses (including Excise tax expense)
|
(113,633
|
)
|
(99,090
|
)
|
(72,850
|
)
|
|||||
|
Net investment income (loss)
|
$
|
107,665
|
|
$
|
108,436
|
|
$
|
92,151
|
|
||
57
Expenses
|
|
For the years ended December 31,
|
||||||||||
|
|
2019
|
2018
|
2017
|
||||||||
|
Base management fees
|
$
|
31,316
|
|
$
|
29,626
|
|
$
|
25,254
|
|
||
|
Incentive fees
|
22,872
|
|
23,002
|
|
21,084
|
|
|||||
|
Professional fees
|
2,745
|
|
3,404
|
|
2,895
|
|
|||||
|
Administrative service fees
|
539
|
|
701
|
|
661
|
|
|||||
|
Interest expense
|
50,587
|
|
37,801
|
|
24,510
|
|
|||||
|
Credit facility fees
|
3,079
|
|
2,295
|
|
1,983
|
|
|||||
|
Directors’ fees and expenses
|
353
|
|
370
|
|
443
|
|
|||||
|
Other general and administrative
|
1,738
|
|
1,661
|
|
1,683
|
|
|||||
|
Excise tax expense
|
404
|
|
230
|
|
264
|
|
|||||
|
Waiver of base management fees
|
—
|
|
—
|
|
(5,927
|
)
|
|||||
|
Net expenses
|
$
|
113,633
|
|
$
|
99,090
|
|
$
|
72,850
|
|
||
Interest expense and credit facility fees for the years ended
December 31, 2019
,
2018
and
2017
were comprised of the following:
|
|
For the years ended December 31,
|
||||||||||
|
|
2019
|
2018
|
2017
|
||||||||
|
Interest expense
|
50,587
|
|
$
|
37,801
|
|
$
|
24,510
|
|
|||
|
Facility unused commitment fee
|
1,263
|
|
1,260
|
|
1,117
|
|
|||||
|
Amortization of deferred financing costs
|
1,618
|
|
901
|
|
745
|
|
|||||
|
Other fees
|
198
|
|
134
|
|
121
|
|
|||||
|
Total interest expense and credit facility fees
|
$
|
53,666
|
|
$
|
40,096
|
|
$
|
26,493
|
|
||
|
Cash paid for interest expense
|
$
|
49,981
|
|
$
|
34,676
|
|
$
|
22,519
|
|
||
|
Average principal debt outstanding
|
1,125,547
|
|
$
|
864,734
|
|
$
|
728,144
|
|
|||
|
Weighted average interest rate
|
4.41
|
%
|
4.32
|
%
|
3.32
|
%
|
|||||
The increase in interest expense for the year ended
December 31, 2019
compared to the comparable period in
2018
was primarily driven by increased drawings under the Facilities related to increased deployment of capital for investments.
The increase in interest expense for the year ended
December 31, 2018
compared to the comparable period in
2017
was driven by increased drawings under the Facilities related to increased deployment of capital for investments, an increase in LIBOR, and a one-time acceleration of $652 of amortization of debt issuance costs related to the 2015-1 Debt Securitization Refinancing.
The increase in credit facility fees for the year ended
December 31, 2019
compared to the comparable period in
2018
was
driven by a one-time acceleration of $628 of amortization of debt issuance costs related to the commitment reduction of the SPV Credit Facility.
58
Below is a summary of the base management fees and incentive fees incurred during the years ended
December 31, 2019
,
2018
and
2017
:
|
For the years ended December 31,
|
|||||||||||
|
2019
|
2018
|
2017
|
|||||||||
|
Base management fees
|
$
|
31,316
|
|
$
|
29,626
|
|
$
|
25,254
|
|
||
|
Waiver of base management fees
|
—
|
|
—
|
|
5,927
|
|
|||||
|
Base management fees, net of waiver
|
31,316
|
|
29,626
|
|
19,327
|
|
|||||
|
Incentive fees on pre-incentive fee net investment income
|
22,872
|
|
23,002
|
|
21,084
|
|
|||||
|
Realized capital gains incentive fees
|
—
|
|
—
|
|
—
|
|
|||||
|
Accrued capital gains incentive fees
|
—
|
|
—
|
|
—
|
|
|||||
|
Total capital gains incentive fees
|
—
|
|
—
|
|
—
|
|
|||||
|
Total incentive fees
|
22,872
|
|
23,002
|
|
21,084
|
|
|||||
|
Total base management fees and incentive fees
|
$
|
54,188
|
|
$
|
52,628
|
|
$
|
40,411
|
|
||
The increase in base management fees for the year ended
December 31, 2019
from the comparable period in
2018
and for the year ended
December 31, 2018
from the comparable period in
2017
were driven by our deployment of capital and our increasing invested balance.
For the years ended
December 31, 2019
,
2018
and
2017
, we recorded no accrued capital gains incentive fees based upon our cumulative net realized and unrealized appreciation (depreciation) as of
December 31, 2019
,
2018
and
2017
, respectively. The accrual for any capital gains incentive fee under accounting principles generally accepted in the United States (“U.S. GAAP”) in a given period may result in an additional expense if such cumulative amount is greater than in the prior period or a reduction of previously recorded expense if such cumulative amount is less than in the prior period. If such cumulative amount is negative, then there is no accrual. See Note
4
to the consolidated financial statements included in Part II, Item 8 of this Form 10-K for more information on our incentive and base management fees.
Professional fees include legal, rating agencies, audit, tax, valuation, technology and other professional fees incurred related to the management of us. Administrative service fees represent fees paid to the Administrator for our allocable portion of overhead and other expenses incurred by the Administrator in performing its obligations under the administration agreement, including our allocable portion of the cost of certain of our executive officers and their respective staff. Other general and administrative expenses include insurance, filing, research, subscriptions and other costs. The decrease in professional fees for the year ended
December 31, 2019
from the comparable period in
2018
was driven by a decrease in non-recurring professional fees.
Net Realized Gain (Loss) and Net Change in Unrealized Appreciation (Depreciation) on Investments
During the years ended
December 31, 2019
,
2018
and
2017
, we had realized gains on
15
,
4
, and
15
investments, respectively, totaling approximately
$14,719
,
$3,534
, and
$684
, respectively, which was offset by realized losses on
13
,
6
, and
12
investments, respectively, totaling approximately
$53,062
,
$4,902
, and
$12,376
, respectively. During the years ended
December 31, 2019
,
2018
and
2017
, we had a change in unrealized appreciation on
91
,
40
, and
64
investments, respectively, totaling approximately
$70,167
,
$14,680
, and
$38,290
, respectively, which was offset by a change in unrealized depreciation on
71
,
105
, and
71
investments, respectively, totaling approximately
$76,220
,
$82,633
, and
$34,549
, respectively.
During April 2019, SolAero Technologies Corp. ("SolAero") completed a restructuring whereby a portion of the first lien debt held by us was exchanged into common equity. As a result, $9,460 of unrealized depreciation was reversed and we realized a loss of $9,102 during the year ended December 31, 2019. On December 31, 2019, we wrote off our remaining balance in the Product Quest Manufacturing, LLC ("Product Quest") first lien/last out, given our expectation of zero recovery. As a result, $32,270 of unrealized depreciation was reversed and we realized a loss of $32,270 during the year ended December 31, 2019. Additionally, during October 2019, we exited our equity investment in Twenty-Eighty, Inc. ("Twenty-Eighty"). As a result, $4,391 of unrealized appreciation was reversed and we realized a gain of $7,990 during the year ended December 31, 2019.
59
During September 2018, Tweddle Group, Inc. completed a restructuring whereby a portion of the first lien debt held by us was exchanged into common equity. As a result, $3,832 of unrealized depreciation was reversed and we realized a loss of $4,087 during the year ended December 31, 2018.
Net realized gain (loss) and net change in unrealized appreciation (depreciation) by the type of investments for the years ended
December 31, 2019
,
2018
and
2017
were as follows:
|
|
For the years ended December 31,
|
||||||||||
|
|
2019
|
2018
|
2017
|
||||||||
|
Net realized gain (loss) on investments
|
$
|
(38,376
|
)
|
$
|
(1,368
|
)
|
$
|
(11,692
|
)
|
||
|
Net change in unrealized appreciation (depreciation) on investments
|
(6,053
|
)
|
(67,953
|
)
|
3,741
|
|
|||||
|
Net realized gain (loss) and net change in unrealized appreciation (depreciation) on investments
|
$
|
(44,429
|
)
|
$
|
(69,321
|
)
|
$
|
(7,951
|
)
|
||
Net realized gain (loss) and net change in unrealized appreciation (depreciation) by the type of investments for the years ended
December 31, 2019
,
2018
and
2017
were as follows:
|
|
For the years ended December 31,
|
|||||||||||||||||||||||
|
|
2019
|
2018
|
2017
|
|||||||||||||||||||||
|
Type
|
Net realized gain (loss)
|
Net change in unrealized appreciation (depreciation)
|
Net realized gain (loss)
|
Net change in unrealized appreciation (depreciation)
|
Net realized gain (loss)
|
Net change in unrealized appreciation (depreciation)
|
||||||||||||||||||
|
First Lien Debt
|
$
|
(52,633
|
)
|
$
|
4,894
|
|
$
|
(4,903
|
)
|
$
|
(59,374
|
)
|
$
|
(8,240
|
)
|
$
|
(5,277
|
)
|
||||||
|
Second Lien Debt
|
—
|
|
1,003
|
|
2
|
|
(3,822
|
)
|
(360
|
)
|
4,442
|
|
||||||||||||
|
Structured Finance Obligations
|
—
|
|
—
|
|
—
|
|
—
|
|
(3,092
|
)
|
4,023
|
|
||||||||||||
|
Equity Investments
|
14,257
|
|
(7,751
|
)
|
3,533
|
|
3,214
|
|
—
|
|
2,560
|
|
||||||||||||
|
Investment Fund
|
—
|
|
(4,199
|
)
|
—
|
|
(7,971
|
)
|
—
|
|
(2,007
|
)
|
||||||||||||
|
Total
|
$
|
(38,376
|
)
|
$
|
(6,053
|
)
|
$
|
(1,368
|
)
|
$
|
(67,953
|
)
|
$
|
(11,692
|
)
|
$
|
3,741
|
|
||||||
Net change in unrealized depreciation in our investments for the year ended
December 31, 2019
compared to the comparable period in
2018
was primarily driven by the unrealized depreciation in Dimensional Dental Management,
LLC and Dermatology Associates, offset by the reversal of prior period unrealized depreciation on Product Quest Manufacturing, LLC and SolAero Technologies Corp., as well as due to changes in various inputs utilized under our valuation methodology, including, but not limited to, market spreads, enterprise value multiples, borrower leverage multiples and borrower ratings, and the impact of exits. Net change in unrealized depreciation in our investments for the year ended
December 31, 2018
compared to the comparable period in
2017
was primarily due to the unrealized depreciation in Product Quest Manufacturing, LLC which filed for bankruptcy protection in 2018, as well as changes in various inputs utilized under our valuation methodology, including, but not limited to, market spreads, borrower leverage multiples and borrower ratings, and the impact of exits.
MIDDLE MARKET CREDIT FUND, LLC
Overview
On February 29, 2016, the Company and Credit Partners entered into an amended and restated limited liability company agreement, which was subsequently amended on June 24, 2016 (as amended, the “Limited Liability Company Agreement”) to co-manage Credit Fund, a Delaware limited liability company that is not consolidated in the Company’s consolidated financial statements. Credit Fund primarily invests in first lien loans of middle market companies. Credit Fund is managed by a six-member board of managers, on which the Company and Credit Partners each have equal representation. Establishing a quorum for Credit Fund’s board of managers requires at least four members to be present at a meeting, including at least two of the Company’s representatives and two of Credit Partners’ representatives. The Company and Credit Partners each have 50% economic ownership of Credit Fund and have commitments to fund, from time to time, capital of up to $400,000 each. Funding of such commitments generally requires the approval of the board of Credit Fund, including the board members appointed by the Company. By virtue of its membership interest, the Company and Credit Partners each indirectly bear an allocable share of all expenses and other obligations of Credit Fund.
60
Together with Credit Partners, the Company co-invests through Credit Fund. Investment opportunities for Credit Fund are sourced primarily by the Company and its affiliates. Portfolio and investment decisions with respect to Credit Fund must be unanimously approved by a quorum of Credit Fund’s investment committee consisting of an equal number of representatives of the Company and Credit Partners. Therefore, although the Company owns more than 25% of the voting securities of Credit Fund, the Company does not believe that it has control over Credit Fund (other than for purposes of the Investment Company Act). Middle Market Credit Fund SPV, LLC (the “Credit Fund Sub”), MMCF CLO 2017-1 LLC (the “2017-1 Issuer”), MMCF CLO 2019-2, LLC (the "2019-2 Issuer", formerly known as MMCF Warehouse, LLC (the "Credit Fund Warehouse")) and MMCF Warehouse II, LLC (the "Credit Fund Warehouse II"), each a Delaware limited liability company, were formed on April 5, 2016 and October 6, 2017, November 26, 2018 and August 16, 2019, respectively. Credit Fund Sub, the 2017-1 Issuer, the 2019-2 Issuer, and Credit Fund Warehouse II are wholly owned subsidiaries of Credit Fund and are consolidated in Credit Fund’s consolidated financial statements commencing from the date of their respective formations. Credit Fund Sub, the 2017-1 Issuer, the 2019-2 Issuer and Credit Fund Warehouse II primarily invest in first lien loans of middle market companies. Credit Fund and its wholly owned subsidiaries follow the same Internal Risk Rating System as the Company. Refer to "Debt" below for discussions regarding the credit facilities entered into and the notes issued by such wholly-owned subsidiaries.
Credit Fund, the Company and Credit Partners entered into an administration agreement with Carlyle Global Credit Administration L.L.C., the administrative agent of Credit Fund (in such capacity, the “Administrative Agent”), pursuant to which the Administrative Agent is delegated certain administrative and non-discretionary functions, is authorized to enter into sub-administration agreements at the expense of Credit Fund with the approval of the board of managers of Credit Fund, and is reimbursed by Credit Fund for its costs and expenses and Credit Fund’s allocable portion of overhead incurred by the Administrative Agent in performing its obligations thereunder.
Selected Financial Data
Since inception of Credit Fund and through
December 31, 2019
and
2018
, the Company and Credit Partners each made capital contributions of
$1
and
$1
in members’ equity, respectively, and
$123,500
and
$118,000
in subordinated loans, respectively, to Credit Fund. Below is certain summarized consolidated information for Credit Fund as of
December 31, 2019
and
2018
.
|
As of December 31,
|
|||||||
|
2019
|
2018
|
||||||
|
ASSETS
|
|||||||
|
Investments, at fair value (amortized cost of $1,258,157 and $1,198,537,respectively)
|
$
|
1,246,839
|
|
$
|
1,173,508
|
|
|
|
Cash and cash equivalents
|
64,787
|
|
55,698
|
|
|||
|
Other assets
|
9,369
|
|
6,849
|
|
|||
|
Total assets
|
$
|
1,320,995
|
|
$
|
1,236,055
|
|
|
|
LIABILITIES AND MEMBERS’ EQUITY
|
|||||||
|
Secured borrowings
|
$
|
441,077
|
|
$
|
572,178
|
|
|
|
Notes payable, net of unamortized debt issuance costs of $3,441 and $1,849, respectively)
|
528,407
|
|
309,114
|
|
|||
|
Mezzanine loans
(1)
|
93,000
|
|
112,000
|
|
|||
|
Other liabilities
|
32,383
|
|
34,195
|
|
|||
|
Subordinated loans and members’ equity
(1)
|
226,128
|
|
208,568
|
|
|||
|
Total liabilities and members’ equity
|
$
|
1,320,995
|
|
$
|
1,236,055
|
|
|
(1) As of
December 31, 2019
and
2018
, the Company's ownership interest in the subordinated loans and members' equity was
$111,596
and
$110,295
, respectively, and
$93,000
and
$112,000
, respectively in the mezzanine loans.
61
|
For the Years Ended December 31,
|
|||||||
|
2019
|
2018
|
||||||
|
Total investment income
|
$
|
94,092
|
|
$
|
82,560
|
|
|
|
Expenses
|
|||||||
|
Interest and credit facility expenses
|
59,228
|
|
51,936
|
|
|||
|
Other expenses
|
2,230
|
|
1,988
|
|
|||
|
Total expenses
|
61,458
|
|
53,924
|
|
|||
|
Net investment income (loss)
|
32,634
|
|
28,636
|
|
|||
|
Net realized gain (loss) on investments
|
(8,285
|
)
|
33
|
|
|||
|
Net change in unrealized appreciation (depreciation) on investments
|
13,711
|
|
(26,133
|
)
|
|||
|
Net increase (decrease) resulting from operations
|
$
|
38,060
|
|
$
|
2,536
|
|
|
Below is a summary of Credit Fund’s portfolio, followed by a listing of the loans in Credit Fund’s portfolio as of
December 31, 2019
and
2018
:
|
As of December 31,
|
|||||||
|
|
2019
|
2018
|
|||||
|
Senior secured loans
(1)
|
$
|
1,260,582
|
|
$
|
1,207,913
|
|
|
|
Weighted average yields of senior secured loans based on amortized cost
(2)
|
6.51
|
%
|
7.16
|
%
|
|||
|
Weighted average yields of senior secured loans based on fair value
(2)
|
6.55
|
%
|
7.32
|
%
|
|||
|
Number of portfolio companies in Credit Fund
|
61
|
|
60
|
|
|||
|
Average amount per portfolio company
(1)
|
$
|
20,665
|
|
$
|
20,132
|
|
|
|
Number of loans on non-accrual status
|
1
|
|
1
|
|
|||
|
Fair value of loans on non-accrual status
|
$
|
21,150
|
|
$
|
25,400
|
|
|
|
Percentage of portfolio at floating interest rates
(3) (4)
|
98.3
|
%
|
99.9
|
%
|
|||
|
Percentage of portfolio at fixed interest rates
(4)
|
1.7
|
%
|
0.1
|
%
|
|||
|
Fair value of loans with PIK provisions
|
$
|
21,150
|
|
$
|
1,119
|
|
|
|
Percentage of portfolio with PIK provisions
(4)
|
1.7
|
%
|
0.1
|
%
|
|||
|
(1)
|
At par/principal amount.
|
|
(2)
|
Weighted average yields include the effect of accretion of discounts and amortization of premiums and are based on interest rates as of
December 31, 2019
and
2018
. Weighted average yield on debt and income producing securities at fair value is computed as (a) the annual stated interest rate or yield earned plus the net annual amortization of OID and market discount earned on accruing debt included in such securities, divided by (b) total first lien and second lien debt at fair value included in such securities. Weighted average yield on debt and income producing securities at amortized cost is computed as (a) the annual stated interest rate or yield earned plus the net annual amortization of OID and market discount earned on accruing debt included in such securities, divided by (b) total first lien and second lien debt at amortized cost included in such securities. Actual yields earned over the life of each investment could differ materially from the yields presented above.
|
|
(3)
|
Floating rate debt investments are generally subject to interest rate floors.
|
|
(4)
|
Percentages based on fair value.
|
62
|
Consolidated Schedule of Investments as of December 31, 2019
|
|||||||||||||||||||||||
|
Investments
(1)
|
Footnotes
|
Industry
|
Reference Rate & Spread (2)
|
Interest
Rate (2) |
Maturity
Date
|
Par/
Principal
Amount
|
Amortized
Cost
(5)
|
Fair
Value
(6)
|
|||||||||||||||
|
First Lien Debt (98.11% of fair value)
|
|||||||||||||||||||||||
|
Achilles Acquisition, LLC
|
\+#
|
(2) (3)
|
Banking, Finance, Insurance & Real Estate
|
L + 4.00%
|
5.75%
|
10/13/2025
|
$
|
17,865
|
|
$
|
17,776
|
|
$
|
17,763
|
|
||||||||
|
Acrisure, LLC
|
+\
|
(2) (3)
|
Banking, Finance, Insurance & Real Estate
|
L + 3.75%
|
5.85%
|
11/22/2023
|
11,820
|
|
11,810
|
|
11,805
|
|
|||||||||||
|
Acrisure, LLC
|
+\#
|
(2) (3)
|
Banking, Finance, Insurance & Real Estate
|
L + 4.25%
|
6.35%
|
11/22/2023
|
20,674
|
|
20,639
|
|
20,674
|
|
|||||||||||
|
Advanced Instruments, LLC
|
^+\*
|
(2) (3) (7)
|
Healthcare & Pharmaceuticals
|
L + 5.25%
|
6.99%
|
10/31/2022
|
35,610
|
|
35,536
|
|
35,466
|
|
|||||||||||
|
Alku, LLC
|
+#
|
(2) (3)
|
Business Services
|
L + 5.50%
|
7.44%
|
7/29/2026
|
25,000
|
|
24,754
|
|
24,624
|
|
|||||||||||
|
Alpha Packaging Holdings, Inc.
|
+*\
|
(2) (3)
|
Containers, Packaging & Glass
|
L + 4.25%
|
6.35%
|
5/12/2020
|
16,684
|
|
16,676
|
|
16,601
|
|
|||||||||||
|
AmeriLife Group, LLC
|
^#
|
(2) (3) (7)
|
Banking, Finance, Insurance & Real Estate
|
L + 4.50%
|
6.20%
|
6/5/2026
|
16,627
|
|
16,557
|
|
16,558
|
|
|||||||||||
|
Anchor Packaging, Inc.
|
^#
|
(2) (3) (7)
|
Containers, Packaging & Glass
|
L + 4.00%
|
5.70%
|
7/18/2026
|
20,462
|
|
20,363
|
|
20,457
|
|
|||||||||||
|
API Technologies Corp.
|
\+
|
(2) (3)
|
Aerospace & Defense
|
L + 4.25%
|
5.95%
|
5/9/2026
|
14,925
|
|
14,853
|
|
14,807
|
|
|||||||||||
|
Aptean, Inc.
|
+\
|
(2) (3)
|
Software
|
L + 4.25%
|
6.34%
|
4/23/2026
|
12,406
|
|
12,344
|
|
12,385
|
|
|||||||||||
|
AQA Acquisition Holding, Inc.
|
^*\
|
(2) (3) (7)
|
High Tech Industries
|
L + 4.25%
|
6.16%
|
5/24/2023
|
18,954
|
|
18,922
|
|
18,860
|
|
|||||||||||
|
Avalign Technologies, Inc.
|
+\
|
(2) (3)
|
Healthcare & Pharmaceuticals
|
L + 4.50%
|
6.70%
|
12/22/2025
|
14,741
|
|
14,610
|
|
14,626
|
|
|||||||||||
|
Big Ass Fans, LLC
|
+*\
|
(2) (3)
|
Capital Equipment
|
L + 3.75%
|
5.85%
|
5/21/2024
|
13,909
|
|
13,841
|
|
13,903
|
|
|||||||||||
|
Borchers, Inc.
|
+*\
|
(2) (3) (7)
|
Chemicals, Plastics & Rubber
|
L + 4.50%
|
6.60%
|
11/1/2024
|
15,116
|
|
15,072
|
|
15,085
|
|
|||||||||||
|
Brooks Equipment Company, LLC
|
*
|
(2) (3)
|
Construction & Building
|
L + 5.00%
|
6.91%
|
8/29/2020
|
5,144
|
|
5,141
|
|
5,141
|
|
|||||||||||
|
Clarity Telecom LLC.
|
+
|
(2) (3)
|
Media: Broadcasting & Subscription
|
L + 4.50%
|
6.20%
|
8/30/2026
|
14,963
|
|
14,915
|
|
14,902
|
|
|||||||||||
|
Clearent Newco, LLC
|
^+\
|
(2) (3) (7)
|
High Tech Industries
|
L + 5.50%
|
7.44%
|
3/20/2025
|
29,738
|
|
29,436
|
|
29,134
|
|
|||||||||||
|
Datto, Inc.
|
+\
|
(2) (3)
|
High Tech Industries
|
L + 4.25%
|
5.95%
|
4/2/2026
|
12,438
|
|
12,375
|
|
12,420
|
|
|||||||||||
|
DecoPac, Inc.
|
+*\
|
(2) (3) (7)
|
Non-durable Consumer Goods
|
L + 4.25%
|
6.01%
|
9/29/2024
|
12,336
|
|
12,233
|
|
12,292
|
|
|||||||||||
|
Dent Wizard International Corporation
|
+\
|
(2) (3)
|
Automotive
|
L + 4.00%
|
5.70%
|
4/7/2020
|
36,880
|
|
36,843
|
|
36,717
|
|
|||||||||||
|
DTI Holdco, Inc.
|
+*\
|
(2) (3)
|
High Tech Industries
|
L + 4.75%
|
6.68%
|
9/30/2023
|
18,885
|
|
18,771
|
|
17,611
|
|
|||||||||||
|
Eliassen Group, LLC
|
+\
|
(2) (3)
|
Business Services
|
L + 4.50%
|
6.20%
|
11/5/2024
|
7,581
|
|
7,548
|
|
7,579
|
|
|||||||||||
|
EIP Merger Sub, LLC (Evolve IP)
|
+^
|
(2) (3) (7)
|
Telecommunications
|
L + 5.75%
|
7.45%
|
6/7/2023
|
19,661
|
|
19,605
|
|
19,661
|
|
|||||||||||
|
Exactech, Inc.
|
+\#
|
(2) (3)
|
Healthcare & Pharmaceuticals
|
L + 3.75%
|
5.45%
|
2/14/2025
|
21,772
|
|
21,634
|
|
21,751
|
|
|||||||||||
|
Excel Fitness Holdings, Inc.
|
+#
|
(2) (3)
|
Hotel, Gaming & Leisure
|
L + 5.25%
|
6.95%
|
10/7/2025
|
25,000
|
|
24,758
|
|
24,875
|
|
|||||||||||
|
Golden West Packaging Group LLC
|
+*\
|
(2) (3)
|
Containers, Packaging & Glass
|
L + 5.75%
|
7.45%
|
6/20/2023
|
29,464
|
|
29,303
|
|
29,072
|
|
|||||||||||
|
HMT Holding Inc.
|
^+*\
|
(2) (3) (7)
|
Energy: Oil & Gas
|
L + 5.00%
|
6.74%
|
11/17/2023
|
33,157
|
|
32,678
|
|
32,972
|
|
|||||||||||
|
Jensen Hughes, Inc.
|
\+^*
|
(2) (3) (7)
|
Utilities: Electric
|
L + 4.50%
|
6.24%
|
3/22/2024
|
33,909
|
|
33,757
|
|
33,550
|
|
|||||||||||
|
KAMC Holdings, Inc.
|
+#
|
(2) (3)
|
Energy: Electricity
|
L + 4.00%
|
5.91%
|
8/14/2026
|
13,965
|
|
13,899
|
|
13,881
|
|
|||||||||||
|
MAG DS Corp.
|
^+\
|
(2) (3) (7)
|
Aerospace & Defense
|
L + 4.75%
|
6.46%
|
6/6/2025
|
28,471
|
|
28,242
|
|
28,286
|
|
|||||||||||
|
Maravai Intermediate Holdings, LLC
|
+\#
|
(2) (3)
|
Healthcare & Pharmaceuticals
|
L + 4.25%
|
6.00%
|
8/2/2025
|
$
|
29,625
|
|
$
|
29,378
|
|
$
|
29,400
|
|
||||||||
|
Marco Technologies, LLC
|
^+\
|
(2) (3) (7)
|
Media: Advertising, Printing & Publishing
|
L + 4.25%
|
6.16%
|
10/30/2023
|
7,463
|
|
7,410
|
|
7,463
|
|
|||||||||||
63
|
Consolidated Schedule of Investments as of December 31, 2019
|
|||||||||||||||||||||||
|
Investments
(1)
|
Footnotes
|
Industry
|
Reference Rate & Spread (2)
|
Interest
Rate (2) |
Maturity
Date
|
Par/
Principal
Amount
|
Amortized
Cost
(5)
|
Fair
Value
(6)
|
|||||||||||||||
|
First Lien Debt (98.11% of fair value) (continued)
|
|||||||||||||||||||||||
|
Mold-Rite Plastics, LLC
|
+\
|
(2) (3)
|
Chemicals, Plastics & Rubber
|
L + 4.25%
|
5.95%
|
12/14/2021
|
14,557
|
|
14,519
|
|
14,524
|
|
|||||||||||
|
MSHC, Inc.
|
^+*\
|
(2) (3) (7)
|
Construction & Building
|
L + 4.25%
|
5.95%
|
12/31/2024
|
38,251
|
|
38,138
|
|
38,166
|
|
|||||||||||
|
Newport Group Holdings II, Inc.
|
\+#
|
(2) (3)
|
Banking, Finance, Insurance & Real Estate
|
L + 3.75%
|
5.65%
|
9/13/2025
|
23,715
|
|
23,487
|
|
23,663
|
|
|||||||||||
|
Odyssey Logistics & Technology Corp.
|
+*\#
|
(2) (3)
|
Transportation: Cargo
|
L + 4.00%
|
5.70%
|
10/12/2024
|
39,013
|
|
38,859
|
|
38,763
|
|
|||||||||||
|
Output Services Group
|
^+\
|
(2) (3) (7)
|
Media: Advertising, Printing & Publishing
|
L + 4.50%
|
6.20%
|
3/27/2024
|
19,621
|
|
19,570
|
|
19,469
|
|
|||||||||||
|
PAI Holdco, Inc.
|
+*\
|
(2) (3)
|
Automotive
|
L + 4.25%
|
6.35%
|
1/5/2025
|
19,532
|
|
19,458
|
|
19,532
|
|
|||||||||||
|
Park Place Technologies, Inc.
|
+\#
|
(2) (3)
|
High Tech Industries
|
L + 4.00%
|
5.70%
|
3/28/2025
|
22,566
|
|
22,489
|
|
22,566
|
|
|||||||||||
|
Pasternack Enterprises, Inc.
|
+\
|
(2) (3)
|
Capital Equipment
|
L + 4.00%
|
5.70%
|
7/2/2025
|
22,755
|
|
22,742
|
|
22,653
|
|
|||||||||||
|
Pathway Vet Alliance LLC
|
+\
|
(2) (3) (7)
|
Consumer Services
|
L + 4.50%
|
6.21%
|
12/20/2024
|
19,085
|
|
18,708
|
|
19,217
|
|
|||||||||||
|
Pharmalogic Holdings Corp.
|
+\
|
(2) (3)
|
Healthcare & Pharmaceuticals
|
L + 4.00%
|
5.70%
|
6/11/2023
|
11,320
|
|
11,296
|
|
11,302
|
|
|||||||||||
|
Premise Health Holding Corp.
|
^+\#
|
(2) (3) (7)
|
Healthcare & Pharmaceuticals
|
L + 3.50%
|
5.60%
|
7/10/2025
|
13,723
|
|
13,665
|
|
13,501
|
|
|||||||||||
|
Propel Insurance Agency, LLC
|
^+\
|
(2) (3) (7)
|
Banking, Finance, Insurance & Real Estate
|
L + 4.25%
|
6.35%
|
6/1/2024
|
22,532
|
|
22,056
|
|
22,395
|
|
|||||||||||
|
Q Holding Company
|
+*\#
|
(2) (3)
|
Automotive
|
L + 5.00%
|
6.70%
|
12/31/2023
|
21,955
|
|
21,777
|
|
21,922
|
|
|||||||||||
|
QW Holding Corporation (Quala)
|
^+*
|
(2) (3) (7)
|
Environmental Industries
|
L + 5.75%
|
7.73%
|
8/31/2022
|
11,630
|
|
11,449
|
|
11,531
|
|
|||||||||||
|
Radiology Partners, Inc.
|
+\#
|
(2) (3)
|
Healthcare & Pharmaceuticals
|
L + 4.75%
|
6.66%
|
7/9/2025
|
28,719
|
|
28,590
|
|
28,768
|
|
|||||||||||
|
RevSpring Inc.
|
+*\#
|
(2) (3)
|
Media: Advertising, Printing & Publishing
|
L + 4.00%
|
5.95%
|
10/11/2025
|
24,750
|
|
24,631
|
|
24,608
|
|
|||||||||||
|
Situs Group Holdings Corporation
|
\+^
|
(2) (3) (7)
|
Banking, Finance, Insurance & Real Estate
|
L + 4.75%
|
6.45%
|
6/28/2025
|
13,715
|
|
13,621
|
|
13,697
|
|
|||||||||||
|
Systems Maintenance Services Holding, Inc.
|
+*
|
(2) (3)
|
High Tech Industries
|
L + 5.00%
|
6.70%
|
10/30/2023
|
23,765
|
|
23,672
|
|
18,180
|
|
|||||||||||
|
Surgical Information Systems, LLC
|
+*\
|
(2) (3) (6)
|
High Tech Industries
|
L + 4.75%
|
7.47%
|
4/24/2023
|
26,168
|
|
26,005
|
|
25,715
|
|
|||||||||||
|
T2 Systems, Inc.
|
^+*
|
(2) (3) (7)
|
Transportation: Consumer
|
L + 6.75%
|
8.85%
|
9/28/2022
|
18,045
|
|
17,789
|
|
18,045
|
|
|||||||||||
|
The Original Cakerie, Ltd. (Canada)
|
+*
|
(2) (3) (7)
|
Beverage, Food & Tobacco
|
L + 5.00%
|
6.84%
|
7/20/2022
|
8,928
|
|
8,897
|
|
8,887
|
|
|||||||||||
|
The Original Cakerie, Ltd. (Canada)
|
^*
|
(2) (3) (7)
|
Beverage, Food & Tobacco
|
L + 4.50%
|
6.34%
|
7/20/2022
|
6,826
|
|
6,801
|
|
6,790
|
|
|||||||||||
|
ThoughtWorks, Inc.
|
+*\
|
(2) (3)
|
Business Services
|
L + 4.00%
|
5.70%
|
10/11/2024
|
11,824
|
|
11,794
|
|
11,824
|
|
|||||||||||
|
U.S. Acute Care Solutions, LLC
|
+\*
|
(2) (3)
|
Healthcare & Pharmaceuticals
|
L + 5.00%
|
6.91%
|
5/15/2021
|
31,431
|
|
31,331
|
|
29,869
|
|
|||||||||||
|
U.S. TelePacific Holdings Corp.
|
+*\
|
(2) (3)
|
Telecommunications
|
L + 5.00%
|
7.10%
|
5/2/2023
|
26,660
|
|
26,499
|
|
25,430
|
|
|||||||||||
|
Valet Waste Holdings, Inc.
|
+\
|
(2) (3)
|
Construction & Building
|
L + 3.75%
|
5.70%
|
9/28/2025
|
11,850
|
|
11,825
|
|
11,688
|
|
|||||||||||
|
Welocalize, Inc.
|
+^
|
(2) (3) (7)
|
Business Services
|
L + 4.50%
|
6.21%
|
12/2/2024
|
$
|
23,038
|
|
$
|
22,788
|
|
$
|
22,787
|
|
||||||||
|
WIRB - Copernicus Group, Inc.
|
+*\
|
(2) (3) (7)
|
Healthcare & Pharmaceuticals
|
L + 4.25%
|
5.95%
|
8/15/2022
|
20,888
|
|
20,822
|
|
20,887
|
|
|||||||||||
64
|
Consolidated Schedule of Investments as of December 31, 2019
|
|||||||||||||||||||||||
|
Investments
(1)
|
Footnotes
|
Industry
|
Reference Rate & Spread (2)
|
Interest
Rate (2) |
Maturity
Date
|
Par/
Principal
Amount
|
Amortized
Cost
(5)
|
Fair
Value
(6)
|
|||||||||||||||
|
First Lien Debt (98.11% of fair value) (continued)
|
|||||||||||||||||||||||
|
WRE Holding Corp.
|
^+*
|
(2) (3) (7)
|
Environmental Industries
|
L + 5.00%
|
6.91%
|
1/3/2023
|
$
|
7,431
|
|
$
|
7,372
|
|
$
|
7,304
|
|
||||||||
|
Zywave, Inc.
|
+*\
|
(2) (3) (7)
|
High Tech Industries
|
L + 5.00%
|
6.93%
|
11/17/2022
|
19,228
|
|
19,107
|
|
19,211
|
|
|||||||||||
|
First Lien Debt Total
|
$
|
1,231,436
|
|
$
|
1,223,215
|
|
|||||||||||||||||
|
Second Lien Debt (1.75% of fair value)
|
|||||||||||||||||||||||
|
DBI Holding, LLC
|
^*
|
(2) (3) (8)
|
Transportation: Cargo
|
8.00% PIK
|
8.00%
|
2/1/2026
|
$
|
21,150
|
|
$
|
20,697
|
|
$
|
21,150
|
|
||||||||
|
Zywave, Inc.
|
*
|
(2) (3)
|
High Tech Industries
|
L + 9.00%
|
10.94%
|
11/17/2023
|
666
|
|
660
|
|
664
|
|
|||||||||||
|
Second Lien Debt Total
|
$
|
21,357
|
|
$
|
21,814
|
|
|||||||||||||||||
|
Equity Investments (0.15% of fair value)
|
|||||||||||||||||||||||
|
DBI Holding, LLC
|
^
|
Transportation: Cargo
|
16,957
|
|
$
|
5,364
|
|
$
|
1,810
|
|
|||||||||||||
|
Equity Investments Total
|
$
|
5,364
|
|
$
|
1,810
|
|
|||||||||||||||||
|
Total Investments
|
$
|
1,258,157
|
|
$
|
1,246,839
|
|
|||||||||||||||||
^ Denotes that all or a portion of the assets are owned by Credit Fund. Credit Fund has entered into a revolving credit facility (the "Credit Fund Facility"). Accordingly, such assets are not available to creditors of Credit Fund Sub, the 2017-1 Issuer, the 2019-2 Issuer or Credit Fund Warehouse II.
+ Denotes that all or a portion of the assets are owned by Credit Fund Sub. Credit Fund Sub has entered into a revolving credit facility (the “Credit Fund Sub Facility”). The lenders of the Credit Fund Sub Facility have a first lien security interest in substantially all of the assets of Credit Fund Sub. Accordingly, such assets are not available to creditors of Credit Fund, the 2017-1 Issuer, the 2019-2 Issuer or Credit Fund Warehouse II.
* Denotes that all or a portion of the assets are owned by the 2017-1 Issuer and secure the notes issued in connection with a $399,900 term debt securitization completed by Credit Fund on December 19, 2017 (the “2017-1 Debt Securitization”). Accordingly, such assets are not available to creditors of Credit Fund, Credit Fund Sub, the 2019-2 Issuer or Credit Fund Warehouse II.
\ Denotes that all or a portion of the assets are owned by the 2019-2 Issuer and secure the notes issued in connection with a $399,900 term debt securitization completed by Credit Fund on May 21, 2019 (the “2019-2 Debt Securitization”). Accordingly, such assets are not available to creditors of Credit Fund, Credit Fund Sub, the 2017-1 Issuer or Credit Fund Warehouse II.
# Denotes that all or a portion of the assets are owned by the Credit Fund Warehouse II. Credit Fund Warehouse II has entered into a revolving credit facility (the "Credit Fund Warehouse II"). The lenders of the Credit Fund Warehouse II Facility have a first lien security interest in substantially all of the assets of the Credit Fund Warehouse II. Accordingly, such assets are not available to creditors of Credit Fund, Credit Fund Sub, 2017-1 Issuer or 2019-2 Issuer.
|
(1)
|
Unless otherwise indicated, issuers of investments held by Credit Fund are domiciled in the United States. As of
December 31, 2019
, the geographical composition of investments as a percentage of fair value was
1.26%
in Canada and
98.60%
in the United States. Certain portfolio company investments are subject to contractual restrictions on sales.
|
|
(2)
|
Variable rate loans to the portfolio companies bear interest at a rate that is determined by reference to either LIBOR or an alternate base rate (commonly based on the Federal Funds Rate or the U.S. Prime Rate), which generally resets quarterly. For each such loan, Credit Fund has indicated the reference rate used and provided the spread and the interest rate in effect as of
December 31, 2019
. As of
December 31, 2019
, the reference rates for Credit Fund's variable rate loans were the 30-day LIBOR at
1.75%
, the
90
-day LIBOR at
1.91%
and the 180-day LIBOR at
1.91%
.
|
|
(3)
|
Loan includes interest rate floor feature, which is generally 1.00%.
|
|
(4)
|
Amortized cost represents original cost, including origination fees and upfront fees received that are deemed to be an adjustment to yield, adjusted for the accretion/amortization of discounts/premiums, as applicable, on debt investments using the effective interest method.
|
|
(5)
|
Fair value is determined in good faith by or under the direction of the board of managers of Credit Fund, pursuant to Credit Fund’s valuation policy, with the fair value of all investments determined using significant unobservable inputs, which is substantially similar to the valuation policy of the Company provided in Note
3
, Fair Value Measurements, to the consolidated financial statements in Part II, Item 8 of this Form 10-K.
|
|
(6)
|
In addition to the interest earned based on the stated interest rate of this loan, which is the amount reflected in this schedule, Credit Fund is entitled to receive additional interest as a result of an agreement among lenders as follows: Surgical Information Systems, LLC (
0.89%
). Pursuant to the agreement among lenders in respect of these loans, these investments represent a first lien/last out loan, which has a secondary priority behind the first lien/first out loan with respect to principal, interest and other payment.
|
65
|
(7)
|
As of
December 31, 2019
, Credit Fund and Credit Fund Sub had the following unfunded commitments to fund delayed draw and revolving senior secured loans:
|
|
First Lien Debt – unfunded delayed draw and revolving term loans commitments
|
Type
|
Unused Fee
|
Par/ Principal Amount
|
Fair Value
|
|||||||||
|
Advanced Instruments, LLC
|
Revolver
|
0.50
|
%
|
$
|
563
|
|
$
|
(2
|
)
|
||||
|
AmeriLife Group, LLC
|
Delayed Draw
|
1.00
|
|
298
|
|
(1
|
)
|
||||||
|
Anchor Packaging, Inc.
|
Delayed Draw
|
1.00
|
|
4,487
|
|
(1
|
)
|
||||||
|
AQA Acquisition Holding, Inc.
|
Revolver
|
0.50
|
|
2,459
|
|
(11
|
)
|
||||||
|
Borchers, Inc.
|
Revolver
|
0.50
|
|
1,935
|
|
(3
|
)
|
||||||
|
Clearent Newco, LLC
|
Delayed Draw
|
1.00
|
|
6,636
|
|
(110
|
)
|
||||||
|
DecoPac, Inc.
|
Revolver
|
0.50
|
|
2,143
|
|
(7
|
)
|
||||||
|
EIP Merger Sub, LLC (Evolve IP)
|
Revolver
|
0.50
|
|
1,680
|
|
—
|
|
||||||
|
EIP Merger Sub, LLC (Evolve IP)
|
Delayed Draw
|
1.00
|
|
2,240
|
|
—
|
|
||||||
|
HMT Holding Inc.
|
Revolver
|
0.50
|
|
6,173
|
|
(29
|
)
|
||||||
|
Jensen Hughes, Inc.
|
Revolver
|
0.50
|
|
1,136
|
|
(11
|
)
|
||||||
|
Jensen Hughes, Inc.
|
Delayed Draw
|
1.00
|
|
2,365
|
|
(23
|
)
|
||||||
|
MAG DS Corp.
|
Revolver
|
0.50
|
|
2,188
|
|
(13
|
)
|
||||||
|
Marco Technologies, LLC
|
Delayed Draw
|
1.00
|
|
7,500
|
|
—
|
|
||||||
|
MSHC, Inc.
|
Delayed Draw
|
1.00
|
|
1,913
|
|
(4
|
)
|
||||||
|
Output Services Group
|
Delayed Draw
|
4.25
|
|
116
|
|
(1
|
)
|
||||||
|
Pathway Vet Alliance LLC
|
Delayed Draw
|
1.00
|
|
19,867
|
|
68
|
|
||||||
|
Premise Health Holding Corp.
|
Delayed Draw
|
1.00
|
|
1,103
|
|
(17
|
)
|
||||||
|
Propel Insurance Agency, LLC
|
Revolver
|
0.50
|
|
2,381
|
|
(10
|
)
|
||||||
|
Propel Insurance Agency, LLC
|
Delayed Draw
|
0.50
|
|
7,143
|
|
(31
|
)
|
||||||
|
QW Holding Corporation (Quala)
|
Revolver
|
0.50
|
|
5,498
|
|
(31
|
)
|
||||||
|
QW Holding Corporation (Quala)
|
Delayed Draw
|
1.00
|
|
217
|
|
(1
|
)
|
||||||
|
Situs Group Holdings Corporation
|
Delayed Draw
|
1.00
|
|
1,216
|
|
(1
|
)
|
||||||
|
T2 Systems, Inc.
|
Revolver
|
0.50
|
|
1,369
|
|
—
|
|
||||||
|
The Original Cakerie, Ltd. (Canada)
|
Revolver
|
0.50
|
|
1,199
|
|
(5
|
)
|
||||||
|
Welocalize, Inc.
|
Revolver
|
0.50
|
|
2,057
|
|
(21
|
)
|
||||||
|
WIRB - Copernicus Group, Inc.
|
Revolver
|
0.50
|
|
1,000
|
|
—
|
|
||||||
|
WIRB - Copernicus Group, Inc.
|
Delayed Draw
|
1.00
|
|
2,592
|
|
—
|
|
||||||
|
WRE Holding Corp.
|
Revolver
|
0.50
|
|
441
|
|
(6
|
)
|
||||||
|
WRE Holding Corp.
|
Delayed Draw
|
1.00
|
|
1,981
|
|
(25
|
)
|
||||||
|
Zywave, Inc.
|
Revolver
|
0.50
|
|
998
|
|
(1
|
)
|
||||||
|
Total unfunded commitments
|
$
|
92,894
|
|
$
|
(297
|
)
|
|||||||
(8) Loan was on non-accrual status as of
December 31, 2019
.
66
|
Consolidated Schedule of Investments as of December 31, 2018
|
|||||||||||||||||||||||
|
Investments
(1)
|
Footnotes
|
Industry
|
Reference Rate & Spread
(2)
|
Interest Rate
(2)
|
Maturity Date
|
Par/ Principal Amount
|
Amortized Cost
(5)
|
Fair Value
(6)
|
|||||||||||||||
|
First Lien Debt (99.91% of fair value)
|
|||||||||||||||||||||||
|
Achilles Acquisition, LLC
|
+\
|
(2) (3)
|
Banking, Finance, Insurance & Real Estate
|
L + 4.00%
|
6.56%
|
10/11/2025
|
$
|
18,000
|
|
$
|
17,906
|
|
$
|
17,716
|
|
||||||||
|
Acrisure, LLC
|
+
|
(2) (3)
|
Banking, Finance, Insurance & Real Estate
|
L + 4.25%
|
6.77%
|
11/22/2023
|
20,886
|
|
20,843
|
|
19,981
|
|
|||||||||||
|
Acrisure, LLC
|
+\
|
(2) (3)
|
Banking, Finance, Insurance & Real Estate
|
L + 3.75%
|
6.27%
|
11/22/2023
|
11,940
|
|
11,928
|
|
11,333
|
|
|||||||||||
|
Advanced Instruments, LLC
|
^+*
|
(2) (3) (8)
|
Healthcare & Pharmaceuticals
|
L + 5.25%
|
7.63%
|
10/31/2022
|
11,791
|
|
11,695
|
|
11,690
|
|
|||||||||||
|
Ahead, LLC
|
^+
|
(2) (3) (8)
|
High Tech Industries
|
L + 4.25%
|
6.87%
|
6/29/2023
|
20,059
|
|
19,959
|
|
19,856
|
|
|||||||||||
|
Alpha Packaging Holdings, Inc.
|
+*
|
(2) (3)
|
Containers, Packaging & Glass
|
L + 4.25%
|
7.05%
|
5/12/2020
|
16,860
|
|
16,830
|
|
16,813
|
|
|||||||||||
|
AM Conservation Holding Corporation
|
+*
|
(2) (3)
|
Energy: Electricity
|
L + 4.50%
|
7.30%
|
10/31/2022
|
38,310
|
|
38,079
|
|
38,027
|
|
|||||||||||
|
AQA Acquisition Holding, Inc.
|
^+*
|
(2) (3) (8)
|
High Tech Industries
|
L + 4.25%
|
7.05%
|
5/24/2023
|
19,148
|
|
19,111
|
|
18,978
|
|
|||||||||||
|
Avalign Technologies, Inc.
|
+\
|
(2) (3)
|
Healthcare & Pharmaceuticals
|
L + 4.50%
|
7.00%
|
12/22/2025
|
13,000
|
|
12,874
|
|
12,848
|
|
|||||||||||
|
Big Ass Fans, LLC
|
+*\
|
(2) (3)
|
Capital Equipment
|
L + 3.75%
|
6.55%
|
5/21/2024
|
14,052
|
|
13,973
|
|
13,840
|
|
|||||||||||
|
Borchers, Inc.
|
^+*
|
(2) (3) (8)
|
Chemicals, Plastics & Rubber
|
L + 4.50%
|
7.30%
|
11/1/2024
|
15,589
|
|
15,533
|
|
15,545
|
|
|||||||||||
|
Brooks Equipment Company, LLC
|
+*
|
(2) (3)
|
Construction & Building
|
L + 5.00%
|
7.71%
|
8/29/2020
|
5,948
|
|
5,940
|
|
5,935
|
|
|||||||||||
|
Clearent Newco, LLC
|
^+
|
(2) (3) (8)
|
High Tech Industries
|
L + 4.00%
|
6.52%
|
3/20/2024
|
23,093
|
|
22,702
|
|
22,819
|
|
|||||||||||
|
DBI Holding, LLC
|
+*
|
(2) (3) (9)
|
Transportation: Cargo
|
L + 5.25%
|
7.76%
|
8/1/2021
|
34,494
|
|
34,276
|
|
25,400
|
|
|||||||||||
|
DBI Holding, LLC
|
^
|
Transportation: Cargo
|
15% (100% PIK)
|
7.76%
|
2/1/2020
|
1,119
|
|
1,119
|
|
1,119
|
|
||||||||||||
|
DecoPac, Inc.
|
^+*
|
(2) (3) (8)
|
Non-durable Consumer Goods
|
L + 4.25%
|
7.05%
|
9/29/2024
|
12,696
|
|
12,571
|
|
12,619
|
|
|||||||||||
|
Dent Wizard International Corporation
|
+
|
(2) (3)
|
Automotive
|
L + 4.00%
|
6.51%
|
4/7/2020
|
24,256
|
|
24,183
|
|
24,110
|
|
|||||||||||
|
DTI Holdco, Inc.
|
+*\
|
(2) (3)
|
High Tech Industries
|
L + 4.75%
|
7.28%
|
9/30/2023
|
19,081
|
|
18,941
|
|
17,793
|
|
|||||||||||
|
EIP Merger Sub, LLC (Evolve IP)
|
+*
|
(2) (3) (4)
|
Telecommunications
|
L + 5.75%
|
8.27%
|
6/7/2022
|
22,358
|
|
21,923
|
|
21,788
|
|
|||||||||||
|
EIP Merger Sub, LLC (Evolve IP)
|
*
|
(2) (3) (7)
|
Telecommunications
|
L + 5.75%
|
8.27%
|
6/7/2022
|
1,500
|
|
1,469
|
|
1,462
|
|
|||||||||||
|
Eliassen Group, LLC
|
+
|
(2) (3)
|
Business Services
|
L + 4.50%
|
7.00%
|
11/5/2024
|
6,250
|
|
6,226
|
|
6,202
|
|
|||||||||||
|
Exactech, Inc.
|
+\
|
(2) (3)
|
Healthcare & Pharmaceuticals
|
L + 3.75%
|
6.27%
|
2/14/2025
|
12,903
|
|
12,849
|
|
12,741
|
|
|||||||||||
|
Executive Consulting Group, LLC, Inc.
|
^+
|
(2) (3) (8)
|
Business Services
|
L + 4.50%
|
7.30%
|
6/20/2024
|
15,318
|
|
15,168
|
|
15,132
|
|
|||||||||||
|
Golden West Packaging Group LLC
|
+*
|
(2) (3)
|
Containers, Packaging & Glass
|
L + 5.25%
|
7.77%
|
6/20/2023
|
30,180
|
|
29,978
|
|
29,760
|
|
|||||||||||
|
HMT Holding Inc.
|
^+*
|
(2) (3) (8)
|
Energy: Oil & Gas
|
L + 4.50%
|
7.02%
|
11/17/2023
|
33,490
|
|
32,902
|
|
33,172
|
|
|||||||||||
|
J.S. Held, LLC
|
+*
|
(2) (3)
|
Banking, Finance, Insurance & Real Estate
|
L + 4.50%
|
7.30%
|
9/25/2024
|
20,309
|
|
20,137
|
|
19,998
|
|
|||||||||||
|
Jensen Hughes, Inc.
|
^+*
|
(2) (3) (8)
|
Utilities: Electric
|
L + 4.50%
|
7.30%
|
3/22/2024
|
27,978
|
|
27,896
|
|
27,382
|
|
|||||||||||
|
Kestra Financial, Inc.
|
+*
|
(2) (3)
|
Banking, Finance, Insurance & Real Estate
|
L + 4.25%
|
6.76%
|
6/24/2022
|
21,744
|
|
21,547
|
|
21,690
|
|
|||||||||||
|
MAG DS Corp.
|
^+
|
(2) (3) (8)
|
Aerospace & Defense
|
L + 4.75%
|
7.27%
|
6/6/2025
|
22,885
|
|
22,679
|
|
22,665
|
|
|||||||||||
|
Maravai Intermediate Holdings, LLC
|
+\
|
(2)
|
Healthcare & Pharmaceuticals
|
L + 4.25%
|
6.81%
|
8/2/2025
|
29,925
|
|
29,640
|
|
29,578
|
|
|||||||||||
67
|
Consolidated Schedule of Investments as of December 31, 2018
|
|||||||||||||||||||||||
|
Investments
(1)
|
Footnotes
|
Industry
|
Reference Rate & Spread
(2)
|
Interest
Rate (2) |
Maturity Date
|
Par/ Principal Amount
|
Amortized Cost
(5)
|
Fair Value
(6)
|
|||||||||||||||
|
First Lien Debt (99.91% of fair value)
|
|||||||||||||||||||||||
|
Mold-Rite Plastics, LLC
|
+
|
(2) (3)
|
Chemicals, Plastics & Rubber
|
L + 4.50%
|
7.30%
|
12/14/2021
|
$
|
14,850
|
|
$
|
14,793
|
|
$
|
14,762
|
|
||||||||
|
MSHC, Inc.
|
^+*
|
(2) (3) (8)
|
Construction & Building
|
L + 4.25%
|
6.89%
|
7/31/2023
|
23,579
|
|
23,514
|
|
23,088
|
|
|||||||||||
|
Newport Group Holdings II, Inc.
|
+\
|
(2)
|
Banking, Finance, Insurance & Real Estate
|
L + 3.75%
|
6.54%
|
9/13/2025
|
17,790
|
|
17,666
|
|
17,564
|
|
|||||||||||
|
North American Dental Management, LLC
|
^+*
|
(2) (3) (8)
|
Healthcare & Pharmaceuticals
|
L + 5.25%
|
8.04%
|
7/7/2023
|
37,781
|
|
37,329
|
|
37,093
|
|
|||||||||||
|
North Haven CA Holdings, Inc.
|
^+*
|
(2) (3) (8)
|
Business Services
|
L + 4.50%
|
7.02%
|
10/2/2023
|
35,139
|
|
34,789
|
|
34,401
|
|
|||||||||||
|
Odyssey Logistics & Technology Corporation
|
+*\
|
(2) (3)
|
Transportation: Cargo
|
L + 4.00%
|
6.52%
|
10/12/2024
|
39,680
|
|
39,496
|
|
39,149
|
|
|||||||||||
|
Output Services Group
|
^+\
|
(2) (3) (8)
|
Media: Advertising, Printing & Publishing
|
L + 4.25%
|
6.77%
|
3/27/2024
|
17,400
|
|
17,338
|
|
16,663
|
|
|||||||||||
|
PAI Holdco, Inc.
|
+*
|
(2) (3)
|
Automotive
|
L + 4.25%
|
7.05%
|
1/5/2025
|
19,727
|
|
19,637
|
|
19,459
|
|
|||||||||||
|
Park Place Technologies, Inc.
|
+\
|
(2) (3)
|
High Tech Industries
|
L + 4.00%
|
6.52%
|
3/29/2025
|
15,922
|
|
15,856
|
|
15,639
|
|
|||||||||||
|
Pasternack Enterprises, Inc.
|
+
|
(2) (3)
|
Capital Equipment
|
L + 4.00%
|
6.52%
|
7/2/2025
|
20,076
|
|
20,076
|
|
19,745
|
|
|||||||||||
|
Pharmalogic Holdings Corp.
|
^+
|
(2) (3) (8)
|
Healthcare & Pharmaceuticals
|
L + 4.00%
|
6.52%
|
6/11/2023
|
7,017
|
|
6,995
|
|
6,949
|
|
|||||||||||
|
Ping Identity Corporation
|
+\
|
(2) (3)
|
High Tech Industries
|
L + 3.75%
|
6.27%
|
1/25/2025
|
4,975
|
|
4,956
|
|
4,915
|
|
|||||||||||
|
Premier Senior Marketing, LLC
|
*
|
(2) (3)
|
Banking, Finance, Insurance & Real Estate
|
L + 4.25%
|
6.75%
|
11/30/2025
|
4,953
|
|
4,953
|
|
4,875
|
|
|||||||||||
|
Premise Health Holding Corp.
|
^+\
|
(2) (3) (8)
|
Healthcare & Pharmaceuticals
|
L + 3.75%
|
6.55%
|
7/10/2025
|
13,862
|
|
13,805
|
|
13,717
|
|
|||||||||||
|
Propel Insurance Agency, LLC
|
^+
|
(2) (3) (8)
|
Banking, Finance, Insurance & Real Estate
|
L + 4.25%
|
6.75%
|
6/1/2024
|
21,088
|
|
20,535
|
|
20,628
|
|
|||||||||||
|
PSI Services, LLC
|
^+*
|
(2) (3) (8)
|
Business Services
|
L + 5.00%
|
7.52%
|
1/20/2023
|
29,919
|
|
29,469
|
|
29,239
|
|
|||||||||||
|
Q Holding Company
|
+*
|
(2) (3)
|
Automotive
|
L + 5.00%
|
7.52%
|
12/18/2021
|
17,099
|
|
17,058
|
|
16,969
|
|
|||||||||||
|
QW Holding Corporation (Quala)
|
^+*
|
(2) (3) (8)
|
Environmental Industries
|
L + 6.75%
|
9.22%
|
8/31/2022
|
9,704
|
|
9,338
|
|
9,489
|
|
|||||||||||
|
RevSpring, Inc.
|
+*\
|
(2) (3)
|
Media: Advertising, Printing & Publishing
|
L + 4.25%
|
7.05%
|
10/11/2025
|
20,000
|
|
19,953
|
|
19,680
|
|
|||||||||||
|
Situs Group Holdings Corporation
|
+
|
(2) (3)
|
Banking, Finance, Insurance & Real Estate
|
L + 4.50%
|
7.02%
|
2/26/2023
|
8,915
|
|
8,892
|
|
8,887
|
|
|||||||||||
|
Surgical Information Systems, LLC
|
+*
|
(2) (3) (7)
|
High Tech Industries
|
L + 4.85%
|
7.37%
|
4/24/2023
|
27,708
|
|
27,494
|
|
27,171
|
|
|||||||||||
|
Systems Maintenance Services Holding, Inc.
|
+*
|
(2) (3)
|
High Tech Industries
|
L + 5.00%
|
7.52%
|
10/28/2023
|
24,010
|
|
23,907
|
|
17,842
|
|
|||||||||||
|
T2 Systems Canada, Inc.
|
+
|
(2) (3)
|
Transportation: Consumer
|
L + 6.75%
|
9.34%
|
9/28/2022
|
2,646
|
|
2,598
|
|
2,630
|
|
|||||||||||
|
T2 Systems, Inc.
|
^+*
|
(2) (3) (8)
|
Transportation: Consumer
|
L + 6.75%
|
9.34%
|
9/28/2022
|
15,775
|
|
15,484
|
|
15,677
|
|
|||||||||||
|
The Original Cakerie, Co. (Canada)
|
+*
|
(2) (3)
|
Beverage, Food & Tobacco
|
L + 5.00%
|
7.50%
|
7/20/2022
|
9,019
|
|
8,968
|
|
8,932
|
|
|||||||||||
|
The Original Cakerie, Ltd. (Canada)
|
+
|
(2) (3) (8)
|
Beverage, Food & Tobacco
|
L + 4.50%
|
7.02%
|
7/20/2022
|
6,957
|
|
6,917
|
|
6,883
|
|
|||||||||||
|
ThoughtWorks, Inc.
|
+*\
|
(2) (3)
|
Business Services
|
L + 4.00%
|
6.52%
|
10/12/2024
|
11,944
|
|
11,909
|
|
11,770
|
|
|||||||||||
|
U.S. Acute Care Solutions, LLC
|
+*
|
(2) (3)
|
Healthcare & Pharmaceuticals
|
L + 5.00%
|
7.52%
|
5/15/2021
|
31,705
|
|
31,540
|
|
31,395
|
|
|||||||||||
|
U.S. TelePacific Holdings Corp.
|
+*\
|
(2) (3)
|
Telecommunications
|
L + 5.00%
|
7.80%
|
5/2/2023
|
26,660
|
|
26,459
|
|
24,768
|
|
|||||||||||
|
Upstream Intermediate, LLC
|
^+
|
(2) (3) (8)
|
Healthcare & Pharmaceuticals
|
L + 4.25%
|
6.77%
|
1/3/2024
|
17,939
|
|
17,863
|
|
17,677
|
|
|||||||||||
68
|
Consolidated Schedule of Investments as of December 31, 2018
|
|||||||||||||||||||||||
|
Investments (1)
|
Footnotes
|
Industry
|
Reference Rate & Spread (2)
|
Interest
Rate (2) |
Maturity Date
|
Par/ Principal Amount
|
Amortized Cost
(5)
|
Fair Value
(6)
|
|||||||||||||||
|
First Lien Debt (99.91% of fair value)
|
|||||||||||||||||||||||
|
Valet Waste Holdings, Inc.
|
+\
|
(2) (3)
|
Construction & Building
|
L + 4.00%
|
6.52%
|
9/28/2025
|
$
|
11,970
|
|
$
|
11,947
|
|
$
|
11,902
|
|
||||||||
|
Valicor Environmental Services, LLC
|
^+*
|
(2) (3) (8)
|
Environmental Industries
|
L + 4.75%
|
7.27%
|
6/1/2023
|
33,410
|
|
32,914
|
|
32,995
|
|
|||||||||||
|
WIRB - Copernicus Group, Inc.
|
^+*
|
(2) (3) (8)
|
Healthcare & Pharmaceuticals
|
L + 4.25%
|
6.77%
|
8/15/2022
|
17,194
|
|
17,098
|
|
16,931
|
|
|||||||||||
|
WRE Holding Corp.
|
^+*
|
(2) (3) (8)
|
Environmental Industries
|
L + 5.00%
|
7.52%
|
1/3/2023
|
7,238
|
|
7,162
|
|
6,993
|
|
|||||||||||
|
Zywave, Inc.
|
^+*
|
(2) (3) (8)
|
High Tech Industries
|
L + 5.00%
|
7.52%
|
11/17/2022
|
18,050
|
|
17,914
|
|
17,991
|
|
|||||||||||
|
First Lien Debt Total
|
$
|
1,197,499
|
|
$
|
1,172,460
|
|
|||||||||||||||||
|
Second Lien Debt (0.09% of fair value)
|
|||||||||||||||||||||||
|
Zywave, Inc.
|
*
|
(2) (3)
|
High Tech Industries
|
L + 9.00%
|
11.65%
|
11/17/2023
|
$
|
1,050
|
|
$
|
1,038
|
|
$
|
1,048
|
|
||||||||
|
Second Lien Debt Total
|
$
|
1,038
|
|
$
|
1,048
|
|
|||||||||||||||||
|
Total Investments
|
$
|
1,198,537
|
|
$
|
1,173,508
|
|
|||||||||||||||||
^ Denotes that all or a portion of the assets are owned by Credit Fund. Credit Fund has entered into the Credit Fund Facility. The lenders of the Credit Fund Facility have a first lien security interest in substantially all of the assets of Credit Fund. Accordingly, such assets are not available to creditors of Credit Fund Sub, the 2017-1 Issuer or the Credit Fund Warehouse.
+ Denotes that all or a portion of the assets are owned by Credit Fund Sub. Credit Fund Sub has entered into a revolving credit facility (the “Credit Fund Sub Facility”). The lenders of the Credit Fund Sub Facility have a first lien security interest in substantially all of the assets of Credit Fund Sub. Accordingly, such assets are not available to creditors of Credit Fund, the 2017-1 Issuer or the Credit Fund Warehouse.
* Denotes that all or a portion of the assets are owned by the 2017-1 Issuer and secure the notes issued in connection with a $399,900 term debt securitization completed by Credit Fund on December 19, 2017 (the “2017-1 Debt Securitization”). Accordingly, such assets are not available to creditors of Credit Fund, Credit Fund Sub or the Credit Fund Warehouse.
\ Denotes that all or a portion of the assets are owned by the Credit Fund Warehouse. Credit Fund Warehouse has entered into a revolving credit facility (the “Credit Fund Warehouse Facility”). The lenders of the Credit Fund Warehouse Facility have a first lien security interest in substantially all of the assets of the Credit Fund Warehouse. Accordingly, such assets are not available to creditors of Credit Fund, Credit Fund Sub or the 2017-1 Issuer.
|
(1)
|
Unless otherwise indicated, issuers of investments held by Credit Fund are domiciled in the United States. As of
December 31, 2018
, the geographical composition of investments as a percentage of fair value was
1.35%
in Canada and
98.65%
in the United States. Certain portfolio company investments are subject to contractual restrictions on sales.
|
|
(2)
|
Variable rate loans to the portfolio companies bear interest at a rate that may be determined by reference to either LIBOR or an alternate base rate (commonly based on the Federal Funds Rate or the U.S. Prime Rate), which generally resets quarterly. For each such loan, Credit Fund has provided the interest rate in effect as of
December 31, 2018
. As of
December 31, 2018
, all of Credit Fund’s LIBOR loans were indexed to the 30-day LIBOR at
2.50%
, the 90-day LIBOR at
2.81%
and the 180-day LIBOR at
2.88%
.
|
|
(3)
|
Loan includes interest rate floor feature, which is generally 1.00%.
|
|
(4)
|
Credit Fund receives less than the stated interest rate of this loan as a result of an agreement among lenders. The interest rate reduction is
1.20%
on EIP Merger Sub, LLC (Evolve IP). Pursuant to the agreement among lenders in respect of this loan, this investment represents a first lien/first out loan, which has first priority ahead of the first lien/last out loan with respect to principal, interest and other payments.
|
|
(5)
|
Amortized cost represents original cost, including origination fees and upfront fees received that are deemed to be an adjustment to yield, adjusted for the accretion/amortization of discounts/premiums, as applicable, on debt investments using the effective interest method.
|
|
(6)
|
Fair value is determined in good faith by or under the direction of the board of managers of Credit Fund, pursuant to Credit Fund’s valuation policy, with the fair value of all investments determined using significant unobservable inputs, which is substantially similar to the valuation policy of the Company provided in Note
3
, Fair Value Measurements.
|
|
(7)
|
In addition to the interest earned based on the stated interest rate of this loan, which is the amount reflected in this schedule, Credit Fund is entitled to receive additional interest as a result of an agreement among lenders as follows: EIP Merger Sub, LLC (Evolve IP) (
3.75%
) and Surgical Information Systems, LLC (
0.89%
). Pursuant to the agreement among lenders in respect of this loan, this investment represents a first lien/last out loan, which has a secondary priority behind the first lien/first out loan with respect to principal, interest and other payments.
|
69
(8) As of
December 31, 2018
, Credit Fund had the following unfunded commitments to fund delayed draw and revolving senior secured loans:
|
First Lien Debt – unfunded delayed draw and revolving term loans commitments
|
Type
|
Unused Fee
|
Par/ Principal Amount
|
Fair Value
|
|||||||||
|
Advanced Instruments, LLC
|
Revolver
|
0.50
|
%
|
$
|
1,333
|
|
$
|
(10
|
)
|
||||
|
Ahead, LLC
|
Revolver
|
0.50
|
|
4,688
|
|
(38
|
)
|
||||||
|
AQA Acquisition Holding, Inc.
|
Revolver
|
0.50
|
|
2,459
|
|
(19
|
)
|
||||||
|
Borchers, Inc.
|
Revolver
|
0.50
|
|
1,935
|
|
(5
|
)
|
||||||
|
Clearent Newco, LLC
|
Delayed Draw
|
1.00
|
|
4,988
|
|
(46
|
)
|
||||||
|
Clearent Newco, LLC
|
Revolver
|
0.50
|
|
1,760
|
|
(16
|
)
|
||||||
|
DecoPac, Inc.
|
Revolver
|
0.50
|
|
2,143
|
|
(11
|
)
|
||||||
|
Executive Consulting Group, LLC, Inc.
|
Revolver
|
0.50
|
|
2,368
|
|
(25
|
)
|
||||||
|
HMT Holding Inc.
|
Revolver
|
0.50
|
|
6,173
|
|
(49
|
)
|
||||||
|
Jensen Hughes, Inc.
|
Revolver
|
0.50
|
|
2,000
|
|
(39
|
)
|
||||||
|
Jensen Hughes, Inc.
|
Delayed Draw
|
1.00
|
|
337
|
|
(7
|
)
|
||||||
|
MAG DS Corp.
|
Revolver
|
0.50
|
|
2,022
|
|
(18
|
)
|
||||||
|
MSHC, Inc.
|
Delayed Draw
|
0.32
|
|
9,852
|
|
(145
|
)
|
||||||
|
North American Dental Management, LLC
|
Revolver
|
0.50
|
|
2,000
|
|
(35
|
)
|
||||||
|
North Haven CA Holdings, Inc. (CoAdvantage)
|
Revolver
|
0.50
|
|
6,114
|
|
(109
|
)
|
||||||
|
Output Services Group
|
Delayed Draw
|
4.25
|
|
2,518
|
|
(93
|
)
|
||||||
|
Pharmalogic Holdings Corp.
|
Delayed Draw
|
1.00
|
|
2,947
|
|
(20
|
)
|
||||||
|
Premise Health Holding Corp.
|
Delayed Draw
|
1.00
|
|
1,103
|
|
(11
|
)
|
||||||
|
Propel Insurance Agency, LLC
|
Delayed Draw
|
0.50
|
|
7,143
|
|
(110
|
)
|
||||||
|
Propel Insurance Agency, LLC
|
Revolver
|
0.50
|
|
1,667
|
|
(26
|
)
|
||||||
|
PSI Services LLC
|
Revolver
|
0.50
|
|
754
|
|
(17
|
)
|
||||||
|
QW Holding Corporation (Quala)
|
Revolver
|
0.50
|
|
5,498
|
|
(52
|
)
|
||||||
|
T2 Systems, Inc.
|
Revolver
|
0.50
|
|
1,173
|
|
(7
|
)
|
||||||
|
The Original Cakerie, Ltd. (Canada)
|
Revolver
|
0.50
|
|
1,132
|
|
(10
|
)
|
||||||
|
Upstream Intermediate, LLC
|
Revolver
|
0.50
|
|
1,606
|
|
(22
|
)
|
||||||
|
Valicor Environmental Services, LLC
|
Revolver
|
0.50
|
|
4,971
|
|
(54
|
)
|
||||||
|
WIRB - Copernicus Group, Inc.
|
Delayed Draw
|
1.00
|
|
6,480
|
|
(69
|
)
|
||||||
|
WIRB - Copernicus Group, Inc.
|
Revolver
|
0.50
|
|
1,000
|
|
(11
|
)
|
||||||
|
WRE Holding Corp.
|
Delayed Draw
|
0.89
|
|
2,069
|
|
(51
|
)
|
||||||
|
WRE Holding Corp.
|
Revolver
|
0.50
|
|
613
|
|
(15
|
)
|
||||||
|
Zywave, Inc.
|
Revolver
|
0.50
|
|
600
|
|
(2
|
)
|
||||||
|
Total unfunded commitments
|
$
|
91,446
|
|
$
|
(1,142
|
)
|
|||||||
(9) Loan was on non-accrual status as of
December 31, 2018
.
Debt
The Credit Fund, Credit Fund Sub and Credit Fund Warehouse II are party to separate credit facilities as described below. In addition, until May 15, 2019, the 2019-2 Issuer (formerly known as the Credit Fund Warehouse) was party to the Credit Fund Warehouse Facility. As of
December 31, 2019
, Credit Fund, Credit Fund Sub, and Credit Fund Warehouse II were in compliance with all covenants and other requirements of their respective credit facility agreements. As of December 31, 2018, Credit Fund, Credit Fund Sub and the 2019-2 Issuer were in compliance with all covenants and other requirements of their respective credit facility agreements. Below is a summary of the borrowings and repayments under the credit facilities for the respective periods.
70
|
Credit Fund
Facility |
Credit Fund Sub
Facility |
Credit Fund Warehouse Facility
|
Credit Fund Warehouse II Facility
|
|||||||||||||
|
Outstanding balance as of December 31, 2017
|
$
|
85,750
|
|
$
|
377,686
|
|
$
|
—
|
|
N/A
|
||||||
|
Borrowings
|
120,150
|
|
239,235
|
|
101,044
|
|
N/A
|
|||||||||
|
Repayments
|
(93,900
|
)
|
(145,787
|
)
|
—
|
|
N/A
|
|||||||||
|
Outstanding balance as of December 31, 2018
|
112,000
|
|
471,134
|
|
101,044
|
|
—
|
|
||||||||
|
Borrowings
|
126,200
|
|
223,870
|
|
34,544
|
|
97,571
|
|
||||||||
|
Repayments
|
(145,200
|
)
|
(351,498
|
)
|
(135,588
|
)
|
—
|
|
||||||||
|
Outstanding balance as of December 31, 2019
|
$
|
93,000
|
|
$
|
343,506
|
|
$
|
—
|
|
$
|
97,571
|
|
||||
Credit Fund Facility.
On June 24, 2016, Credit Fund entered into the Credit Fund Facility with the Company, which was subsequently amended on June 5, 2017, October 2, 2017, November 3, 2017, June 22, 2018, June 29, 2018 and February 21, 2019, pursuant to which Credit Fund may from time to time request mezzanine loans from the Company. The maximum principal amount of the Credit Fund Facility is $175,000. The maturity date of the Credit Fund Facility is March 22, 2020. Amounts borrowed under the Credit Fund Facility bear interest at a rate of LIBOR plus 9.00%.
Credit Fund Sub Facility.
On June 24, 2016, Credit Fund Sub closed on the Credit Fund Sub Facility with lenders, which was subsequently amended on May 31, 2017, October 27, 2017, August 24, 2018 and December 12, 2019. The Credit Fund Sub Facility provides for secured borrowings during the applicable revolving period up to an amount equal to $640,000. The facility is secured by a first lien security interest in substantially all of the portfolio investments held by Credit Fund Sub. The maturity date of the Credit Fund Sub Facility is May 22, 2024. Amounts borrowed under the Credit Fund Sub Facility bear interest at a rate of LIBOR plus 2.25%.
Credit Fund Warehouse Facility
.
On November 26, 2018, Credit Fund Warehouse closed on the Credit Fund Warehouse Facility with lenders. The Credit Fund Warehouse Facility provided for secured borrowings during the applicable revolving period up to an amount equal to $150,000. The Credit Fund Warehouse Facility was secured by a first lien security interest in substantially all of the portfolio investments held by the Credit Fund Warehouse. The maturity date of the Credit Fund Warehouse Facility was November 26, 2019. Amounts borrowed under the Credit Fund Warehouse Facility bore interest at a rate of LIBOR plus 1.05%. Effective May 15, 2019, the Warehouse Facility changed its name from “MMCF Warehouse, LLC” to “MMCF CLO 2019-2, LLC” and secured borrowings outstanding were repaid in connection with the 2019-2 Debt Securitization.
Credit Fund Warehouse II Facility
.
On August 16, 2019, Credit Fund Warehouse II closed on a revolving credit facility (the "Credit Fund Warehouse II Facility") with lenders. The Credit Fund Warehouse II Facility provides for secured borrowings during the applicable revolving period up to an amount equal to $150,000. The Credit Fund Warehouse II Facility is secured by a first lien security interest in substantially all of the portfolio investments held by the Credit Fund Warehouse II Facility. The maturity date of the Credit Fund Warehouse II Facility is August 16, 2022. Amounts borrowed under the Credit Fund Warehouse II Facility bear interest at a rate of LIBOR plus 1.05% for the first 12 months, LIBOR plus 1.15% for the next 12 months and LIBOR plus 1.50% in the final 12 months.
2017-1 Notes
On December 19, 2017, Credit Fund completed the 2017-1 Debt Securitization. The notes offered in the 2017-1 Debt Securitization (the “2017-1 Notes”) were issued by the 2017-1 Issuer, a wholly owned and consolidated subsidiary of Credit Fund, and are secured by a diversified portfolio of the 2017-1 Issuer consisting primarily of first and second lien senior secured loans. The 2017-1 Debt Securitization was executed through a private placement of the 2017-1 Notes, consisting of:
•
$231,700 of Aaa/AAA Class A-1 Notes, which bear interest at the three-month LIBOR plus 1.17%;
•
$48,300 of Aa2/AA Class A-2 Notes, which bear interest at the three-month LIBOR plus 1.50%;
•
$15,000 of A2/A Class B-1 Notes, which bear interest at the three-month LIBOR plus 2.25%;
•
$9,000 of A2/A Class B-2 Notes which bear interest at 4.30%;
•
$22,900 of Baa2/BBB Class C Notes which bear interest at the three-month LIBOR plus 3.20%; and
•
$25,100 of Ba2/BB Class D Notes which bear interest at the three-month LIBOR plus 6.38%.
71
The 2017-1 Notes are scheduled to mature on January 15, 2028. Credit Fund received 100% of the preferred interests issued by the 2017-1 Issuer (the “2017-1 Issuer Preferred Interests”) on the closing date of the 2017-1 Debt Securitization in exchange for Credit Fund’s contribution to the 2017-1 Issuer of the initial closing date loan portfolio. The 2017-1 Issuer Preferred Interests do not bear interest and had a nominal value of $47,900 at closing.
As of
December 31, 2019
and
2018
, the 2017-1 Issuer was in compliance with all covenants and other requirements of the indenture.
2019-2 Notes
On May 21, 2019, Credit Fund completed the 2019-2 Debt Securitization. The notes offered in the 2019-2 Debt Securitization (the “2019-2 Notes”) were issued by the 2019-2 Issuer, a wholly owned and consolidated subsidiary of Credit Fund, and are secured by a diversified portfolio of the 2019-2 Issuer consisting primarily of first and second lien senior secured loans. The 2019-2 Debt Securitization was executed through a private placement of the 2019-2 Notes, consisting of:
|
•
|
$233,000 of Aaa/AAA Class A-1 Notes, which bear interest at the three-month LIBOR plus 1.50%;
|
|
•
|
$48,000 of Aa2/AA Class A-2 Notes, which bear interest at the three-month LIBOR plus 2.40%;
|
|
•
|
$23,000 of A2/A Class B Notes, which bear interest at the three-month LIBOR plus 3.45%;
|
|
•
|
$27,000 of Baa2/BBB- Class C Notes which bear interest at the three-month LIBOR plus 4.55%; and
|
|
•
|
$21,000 of Ba2/BB- Class D Notes which bear interest at the three-month LIBOR plus 8.03%.
|
The 2019-2 Notes are scheduled to mature on April 15, 2029. Credit Fund received 100% of the preferred interests issued by the 2019-2 Issuer (the “2019-2 Issuer Preferred Interests”) on the closing date of the 2019-2 Debt Securitization in exchange for Credit Fund’s contribution to the 2019-2 Issuer of the initial closing date loan portfolio. The 2019-2 Issuer Preferred Interests do not bear interest and had a nominal value of $48,300 at closing.
As of
December 31, 2019
, the 2019-2 Issuer was in compliance with all covenants and other requirements of the indenture.
FINANCIAL CONDITION, LIQUIDITY AND CAPITAL RESOURCES
We generate cash from the net proceeds of offerings of our common stock and through cash flows from operations, including investment sales and repayments as well as income earned on investments and cash equivalents. We may also fund a portion of our investments through borrowings under the Facilities, the issuance of debt, and through securitization of a portion of our existing investments. The primary use of existing funds and any funds raised in the future is expected to be for investments in portfolio companies, repayment of indebtedness, cash distributions to our stockholders and for other general corporate purposes.
The SPV closed on May 24, 2013 on the SPV Credit Facility, which was subsequently amended on June 30, 2014, June 19, 2015, June 9, 2016, May 26, 2017 and August 9, 2018. The SPV Credit Facility provides for secured borrowings during the applicable revolving period up to an amount equal to the lesser of $275,000 (the borrowing base as calculated pursuant to the terms of the SPV Credit Facility) and the amount of net cash proceeds and unpledged capital commitments the Company has received, with an accordion feature that can, subject to certain conditions, increase the aggregate maximum credit commitment up to an amount not to exceed $750,000, subject to restrictions imposed on borrowings under the Investment Company Act and certain restrictions and conditions set forth in the SPV Credit Facility, including adequate collateral to support such borrowings. The SPV Credit Facility imposes financial and operating covenants on us and the SPV that restrict our and its business activities. Continued compliance with these covenants will depend on many factors, some of which are beyond our control.
We closed on March 21, 2014 on the Credit Facility, which was subsequently amended on January 8, 2015, May 25, 2016, March 22, 2017, September 25, 2018 and June 14, 2019. The maximum principal amount of the Credit Facility is $688,000, subject to availability under the Credit Facility, which is based on certain advance rates multiplied by the value of the Company’s portfolio investments (subject to certain concentration limitations) net of certain other indebtedness that the Company may incur in accordance with the terms of the Credit Facility. Proceeds of the Credit Facility may be used for general corporate purposes, including the funding of portfolio investments. Maximum capacity under the Credit Facility may be increased, subject to certain conditions, to $900,000 through the exercise by the Company of an uncommitted accordion feature through which existing and new lenders may, at their option, agree to provide additional financing. The Credit Facility includes a $50,000 limit for swingline loans and a $20,000 limit for letters of credit. Subject to certain exceptions, the Credit Facility is
72
secured by a first lien security interest in substantially all of the portfolio investments held by the Company. The Credit Facility includes customary covenants, including certain financial covenants related to asset coverage, shareholders’ equity and liquidity, certain limitations on the incurrence of additional indebtedness and liens, and other maintenance covenants, as well as usual and customary events of default for senior secured revolving credit facilities of this nature.
Although we believe that we and the SPV will remain in compliance, there are no assurances that we or the SPV will continue to comply with the covenants in the Credit Facility and SPV Credit Facility, as applicable. Failure to comply with these covenants could result in a default under the Credit Facility and/or the SPV Credit Facility that, if we or the SPV were unable to obtain a waiver from the applicable lenders, could result in the immediate acceleration of the amounts due under the Credit Facility and/or the SPV Credit Facility, and thereby have a material adverse impact on our business, financial condition and results of operations.
For more information on the SPV Credit Facility and the Credit Facility, see Note
6
to the consolidated financial statements in Part II, Item 8 of this Form 10-K.
On December 30, 2019, the Company closed a private offering of $115.0 million in aggregate principal amount of 4.750% Senior Unsecured Notes due December 31, 2024 (the "Senior Notes"). Interest is payable quarterly, beginning March 31, 2020. This interest rate is subject to increase (up to 5.75%) in the event that, subject to certain exceptions, the Senior Notes cease to have an investment grade rating. The note purchase agreement for the Senior Notes contains customary terms and conditions for senior unsecured notes issued in a private placement, including, without limitation, affirmative and negative covenants such as information reporting, maintenance of the Company’s status as a business development company within the meaning of the Investment Company Act and a regulated investment company under the Code, minimum asset coverage ratio and interest coverage ratio, and prohibitions on certain fundamental changes at the Company or any subsidiary guarantor. Continued compliance with these covenants will depend on many factors, some of which are beyond our control. In particular, the Company is obligated to offer to repay the notes at par if certain change in control events occur. The note purchase agreement also contains customary events of default with customary cure and notice, including, without limitation, nonpayment, breach of covenant, material breach of representation or warranty under the note purchase agreement, cross-acceleration under other indebtedness of the Company or certain significant subsidiaries, certain judgments and orders, and certain events of bankruptcy. The Senior Notes are general unsecured obligations of the Company that rank pari passu with all outstanding and future unsecured unsubordinated indebtedness issued by the Company.
On June 26, 2015, we completed the 2015-1 Debt Securitization. The 2015-1 Notes were issued by Carlyle Direct Lending CLO 2015-1R LLC (formerly known as Carlyle GMS Finance MM CLO 2015-1 LLC) (the “2015-1 Issuer”), a wholly owned and consolidated subsidiary of us. On August 30, 2018, the 2015-1 Issuer refinanced the 2015-1 Debt Securitization (the “2015-1 Debt Securitization Refinancing”) by redeeming in full the 2015-1 Notes and issuing new notes (the “2015-1R Notes”). The 2015-1R Notes are secured by a diversified portfolio of the 2015-1 Issuer consisting primarily of first and second lien senior secured loans. On the closing date of the 2015-1 Debt Securitization Refinancing, the 2015-1 Issuer, among other things:
(a) refinanced the issued Class A-1A Notes by redeeming in full the Class A-1A Notes and issuing new AAA Class A-1-1-R Notes in an aggregate principal amount of $234,800 which bear interest at the three-month LIBOR plus 1.55%;
(b) refinanced the issued Class A-1B Notes by redeeming in full the Class A-1B Notes and issuing new AAA Class A-1-2-R Notes in an aggregate principal amount of $50,000 which bear interest at the three-month LIBOR plus 1.48% for the first 24 months and the three-month LIBOR plus 1.78% thereafter;
(c) refinanced the issued Class A-1C Notes by redeeming in full the Class A-1C Notes and issuing new AAA Class A-1-3-R Notes in an aggregate principal amount of $25,000 which bear interest at 4.56%;
(d) refinanced the issued Class A-2 Notes by redeeming in full the Class A-2 Notes and issuing new Class A-2-R Notes in an aggregate principal amount of $66,000 which bear interest at the three-month LIBOR plus 2.20%;
(e) issued new single-A Class B Notes and BBB- Class C Notes in aggregate principal amounts of $46,400 and $27,000, respectively, which bear interest at the three-month LIBOR plus 3.15% and the three-month LIBOR plus 4.00%, respectively;
(f) reduced the 2015-1 Issuer Preferred Interests by approximately $21,375 from a nominal value of $125,900 to approximately $104,525 at close; and
(g) extended the reinvestment period end date and maturity date applicable to the 2015-1 Issuer to October 15, 2023 and October 15, 2031, respectively.
73
In connection with the contribution, we have made customary representations, warranties and covenants to the 2015-1 Issuer. The Class A-1-1-R, Class A-1-2-R, Class A-1-3-R, Class A-2-R, Class B and Class C Notes are included in the consolidated financial statements included in Part II, Item 8 of this Form 10-K. The 2015-1 Issuer Preferred Interests were eliminated in consolidation.
For more information on the Senior Notes and the 2015-1R Notes, see Note
7
to the consolidated financial statements in Part II, Item 8 of this Form 10-K.
As of
December 31, 2019
and
2018
, we had
$36,751
and
$87,186
, respectively, in cash and cash equivalents. The Facilities consisted of the following as of
December 31, 2019
and
2018
:
|
|
December 31, 2019
|
||||||||||||||
|
|
Total
Facility
|
Borrowings
Outstanding
|
Unused
Portion
(1)
|
Amounts Available
(2)
|
|||||||||||
|
SPV Credit Facility
|
$
|
275,000
|
|
$
|
232,469
|
|
$
|
42,531
|
|
$
|
4,225
|
|
|||
|
Credit Facility
|
688,000
|
|
384,074
|
|
303,926
|
|
264,198
|
|
|||||||
|
Total
|
$
|
963,000
|
|
$
|
616,543
|
|
$
|
346,457
|
|
$
|
268,423
|
|
|||
|
|
December 31, 2018
|
||||||||||||||
|
|
Total
Facility
|
Borrowings
Outstanding
|
Unused
Portion
(1)
|
Amounts Available
(2)
|
|||||||||||
|
SPV Credit Facility
|
$
|
400,000
|
|
$
|
224,135
|
|
$
|
175,865
|
|
$
|
2,547
|
|
|||
|
Credit Facility
|
413,000
|
|
290,500
|
|
122,500
|
|
122,500
|
|
|||||||
|
Total
|
$
|
813,000
|
|
$
|
514,635
|
|
$
|
298,365
|
|
$
|
125,047
|
|
|||
|
(1)
|
The unused portion is the amount upon which commitment fees are based.
|
|
(2)
|
Available for borrowing based on the computation of collateral to support the borrowings and subject to compliance with applicable covenants and financial ratios.
|
As the Senior Notes were issued on December 30, 2019, their fair value approximates carrying value as of
December 31, 2019
. The following were the carrying values (before debt issuance costs) and fair values of the Company's 2015-1R Notes disclosed but not carried at fair value as of
December 31, 2019
and
2018
:
|
|
December 31, 2019
|
December 31, 2018
|
|||||||||||||
|
2015-1R Notes
|
Carrying Value
|
Fair Value
|
Carrying Value
|
Fair Value
|
|||||||||||
|
Aaa/AAA Class A-1-1-R Notes
|
$
|
234,800
|
|
$
|
233,053
|
|
$
|
234,800
|
|
$
|
229,632
|
|
|||
|
Aaa/AAA Class A-1-2-R Notes
|
50,000
|
|
49,908
|
|
50,000
|
|
49,442
|
|
|||||||
|
Aaa/AAA Class A-1-3-R Notes
|
25,000
|
|
25,163
|
|
25,000
|
|
24,990
|
|
|||||||
|
AA Class A-2-R Notes
|
66,000
|
|
66,000
|
|
66,000
|
|
66,000
|
|
|||||||
|
A Class B Notes
|
46,400
|
|
46,400
|
|
46,400
|
|
44,242
|
|
|||||||
|
BBB- Class C Notes
|
27,000
|
|
27,000
|
|
27,000
|
|
24,809
|
|
|||||||
|
Total
|
$
|
449,200
|
|
$
|
447,524
|
|
$
|
449,200
|
|
$
|
439,115
|
|
|||
As of
December 31, 2019
and
2018
, we had a combined
$1,180,743
and
$963,835
, respectively, of outstanding consolidated indebtedness under our Facilities, the 2015-1R Notes and the Senior Notes. Our annualized interest cost as of
December 31, 2019
and
2018
, was 4.01% and 4.55%, excluding fees (such as fees on undrawn amounts and amortization of upfront fees). For the years ended
December 31, 2019
,
2018
and
2017
, we incurred
$50,587
,
$37,801
and
$24,510
, respectively, of interest expense and
$1,263
,
$1,260
and
$1,117
, respectively, of unused commitment fees.
Equity Activity
On June 9, 2017, in connection with the NFIC Acquisition, the Company issued 434,233 shares of common stock valued at approximately $8,046. See Note 14 to the consolidated financial statements in Part II, Item 8 of this Form 10-K for additional information regarding the NFIC Acquisition.
On June 19, 2017, we closed our IPO, issuing 9,454,200 shares of our common stock (including shares issued pursuant to the exercise of the underwriters’ over-allotment option on July 5, 2017) at a public offering price of $18.50 per
74
share. Net of underwriting costs, we received cash proceeds of $169,488. Shares of common stock of TCG BDC began trading on the Nasdaq Global Select Market under the symbol “CGBD” on June 14, 2017. Upon the completion of the IPO, uncalled capital commitments payable to the Company by the Company’s pre-IPO investors were automatically reduced to zero.
Shares issued and outstanding as of
December 31, 2019
and
2018
were
57,763,811
and
62,230,251
, respectively.
The following table summarizes activity in the number of shares of our common stock outstanding during the years ended
December 31, 2019
,
2018
and
2017
:
|
|
For the years ended December 31,
|
|||||||
|
|
2019
|
2018
|
2017
|
|||||
|
Shares outstanding, beginning of year
|
62,230,251
|
|
62,207,603
|
|
41,702,318
|
|
||
|
Common stock issued
|
—
|
|
—
|
|
20,146,561
|
|
||
|
Reinvestment of dividends
|
—
|
|
361,056
|
|
358,724
|
|
||
|
Repurchase of common stock
|
(4,466,440
|
)
|
(338,408
|
)
|
—
|
|
||
|
Shares outstanding, end of year
|
57,763,811
|
|
62,230,251
|
|
62,207,603
|
|
||
Contractual Obligations
A summary of our significant contractual payment obligations was as follows as of
December 31, 2019
and
2018
:
|
As of December 31,
|
|||||||
|
Payment Due by Period
|
2019
|
2018
|
|||||
|
Less than 1 Year
|
$
|
—
|
|
$
|
—
|
|
|
|
1-3 Years
|
—
|
|
—
|
|
|||
|
3-5 Years
(1)
|
731,543
|
|
514,635
|
|
|||
|
More than 5 Years
(2)
|
449,200
|
|
449,200
|
|
|||
|
Total
|
$
|
1,180,743
|
|
$
|
963,835
|
|
|
(1) Includes amounts outstanding under the Facilities and the Senior Notes.
(2) Includes amounts outstanding under the 2015-1R Notes.
OFF BALANCE SHEET ARRANGEMENTS
In the ordinary course of our business, we enter into contracts or agreements that contain indemnifications or warranties. Future events could occur which may give rise to liabilities arising from these provisions against us. We believe that the likelihood of such an event is remote; however, the maximum potential exposure is unknown. No accrual has been made in these consolidated financial statements as of
December 31, 2019
and
2018
, in Part II, Item 8 of this Form 10-K, for any such exposure.
We have in the past and may in the future become obligated to fund commitments such as revolving credit facilities, bridge financing commitments, or delayed draw commitments.
We had the following unfunded commitments to fund delayed draw and revolving senior secured loans as of the indicated dates:
|
|
Principal Amount as of December 31,
|
||||||
|
|
2019
|
2018
|
|||||
|
Unfunded delayed draw commitments
|
$
|
75,874
|
|
$
|
97,261
|
|
|
|
Unfunded revolving term loan commitments
|
74,016
|
|
59,856
|
|
|||
|
Total unfunded commitments
|
$
|
149,890
|
|
$
|
157,117
|
|
|
Pursuant to an undertaking by us in connection with the 2015-1 Debt Securitization, we agreed to hold on an ongoing basis the 2015-1 Issuer Preferred Interests with an aggregate dollar purchase price at least equal to 5% of the aggregate outstanding amount of all collateral obligations by the 2015-1 Issuer for so long as any securities of the 2015-1 Issuer remains outstanding. As of
December 31, 2019
and
2018
, we were in compliance with this undertaking.
75
DIVIDENDS AND DISTRIBUTIONS TO COMMON STOCKHOLDERS
Prior to July 5, 2017, we had an “opt in” dividend reinvestment plan. Effective on July 5, 2017, we converted our “opt in” dividend reinvestment plan to an “opt out” dividend reinvestment plan that provides for reinvestment of our dividends and other distributions on behalf of our stockholders, other than those stockholders who have “opted out” of the plan. As a result of adopting the plan, if our Board of Directors authorizes, and we declare, a cash dividend or distribution, our stockholders who have not elected to “opt out” of our dividend reinvestment plan will have their cash dividends or distributions automatically reinvested in additional shares of our common stock, rather than receiving cash. Each registered stockholder may elect to have such stockholder’s dividends and distributions distributed in cash rather than participate in the plan. For any registered stockholder that does not so elect, distributions on such stockholder’s shares will be reinvested by State Street Bank and Trust Company, our plan administrator, in additional shares. The number of shares to be issued to the stockholder will be determined based on the total dollar amount of the cash distribution payable, net of applicable withholding taxes. We intend to use primarily newly issued shares to implement the plan so long as the market value per share is equal to or greater than the net asset value per share on the relevant valuation date. If the market value per share is less than the net asset value per share on the relevant valuation date, the plan administrator would implement the plan through the purchase of common stock on behalf of participants in the open market, unless we instruct the plan administrator otherwise.
The following table summarizes the Company’s dividends declared during the three most recent fiscal years:
|
Date Declared
|
Record Date
|
Payment Date
|
Per Share Amount
|
|
|||||
|
2017
|
|||||||||
|
March 20, 2017
|
March 20, 2017
|
April 24, 2017
|
$
|
0.41
|
|
|
|||
|
June 20, 2017
|
June 30, 2017
|
July 18, 2017
|
0.37
|
|
|
||||
|
August 7, 2017
|
September 29, 2017
|
October 18, 2017
|
0.37
|
|
|
||||
|
November 7, 2017
|
December 29, 2017
|
January 17, 2018
|
0.37
|
|
|
||||
|
December 13, 2017
|
December 29, 2017
|
January 17, 2018
|
0.12
|
|
(1)
|
||||
|
Total
|
$
|
1.64
|
|
||||||
|
2018
|
|||||||||
|
February 26, 2018
|
March 29, 2018
|
April 17, 2018
|
$
|
0.37
|
|
|
|||
|
May 2, 2018
|
June 29, 2018
|
July 17, 2018
|
0.37
|
|
|||||
|
August 6, 2018
|
September 28, 2018
|
October 17, 2018
|
0.37
|
|
|||||
|
November 5, 2018
|
December 28, 2018
|
January 17, 2019
|
0.37
|
|
|||||
|
December 12, 2018
|
December 28, 2018
|
January 17, 2019
|
0.20
|
|
(1)
|
||||
|
Total
|
$
|
1.68
|
|
||||||
|
2019
|
|||||||||
|
February 22, 2019
|
March 29, 2019
|
April 17, 2019
|
$
|
0.37
|
|
||||
|
May 6, 2019
|
June 28, 2019
|
July 17, 2019
|
0.37
|
|
|||||
|
June 17, 2019
|
June 28, 2019
|
July 17, 2019
|
0.08
|
|
(1)
|
||||
|
August 5, 2019
|
September 30, 2019
|
October 17, 2019
|
0.37
|
|
|||||
|
November 4, 2019
|
December 31, 2019
|
January 17, 2020
|
0.37
|
|
|||||
|
December 12, 2019
|
December 31, 2019
|
January 17, 2020
|
0.18
|
|
(1)
|
||||
|
Total
|
$
|
1.74
|
|
||||||
|
(1)
|
Represents a special dividend.
|
ASSET COVERAGE
In accordance with the Investment Company Act, a BDC is only allowed to borrow amounts such that its “asset coverage,” as defined in the Investment Company Act, satisfies the minimum asset coverage ratio specified in the Investment Company Act after such borrowing. “Asset coverage” generally refers to a company’s total assets, less all liabilities and indebtedness not represented by “senior securities,” as defined in the Investment Company Act, divided by total senior securities representing indebtedness and, if applicable, preferred stock. “Senior securities” for this purpose includes borrowings from banks or other lenders, debt securities and preferred stock.
Prior to March 23, 2018, BDCs were required to maintain a minimum asset coverage ratio of 200%. On March 23, 2018, an amendment to Section 61(a) of the Investment Company Act was signed into law to permit BDCs to reduce the minimum asset coverage ratio from 200% to 150%, so long as certain approval and disclosure requirements are satisfied. Under the 200% minimum asset coverage ratio, BDCs are permitted to borrow up to one dollar for investment purposes for every one dollar of investor equity, and under the 150% minimum asset coverage ratio, BDCs are permitted to borrow up to two dollars for investment purposes for every one dollar of investor equity. In other words, Section 61(a) of the 1940 Act, as amended, permits BDCs to potentially increase their debt-to-equity ratio from a maximum of 1 to 1 to a maximum of 2 to 1.
On April 9, 2018 and June 6, 2018, the Board of Directors, including a “required majority” (as such term is defined in Section 57(o) of the Investment Company Act), and the stockholders of the Company, respectively, approved the application to the Company of the 150% minimum asset coverage ratio set forth in Section 61(a)(2) of the 1940 Act. As a result, the minimum asset coverage ratio applicable to the Company was reduced from 200% to 150%, effective as of June 7, 2018.
As of
December 31, 2019
and
2018
, the Company had total senior securities of
$1,180,743
and
$963,835
, respectively, consisting of secured borrowings under the Facilities, the Senior Notes and the 2015-1R Notes, and had asset coverage ratios of
181.01%
and
210.31%
, respectively. For a discussion of the principal risk factors associated with these senior securities, see Part I, Item 1A of this Form 10‑K.
CRITICAL ACCOUNTING POLICIES
The preparation of our consolidated financial statements requires us to make estimates and assumptions that affect the reported amounts of assets, liabilities, revenues, and expenses. Changes in the economic environment, financial markets, and any other parameters used in determining such estimates could cause actual results to differ. Our critical accounting policies, including those relating to the valuation of our investment portfolio, are described below. The critical accounting policies should be read in connection with our “
Risk Factors
” in Part I, Item 1A of this Form 10-K.
Fair Value Measurements
The Company applies fair value accounting in accordance with the terms of Financial Accounting Standards Board ASC Topic 820,
Fair Value Measurement
(“ASC 820”). ASC 820 defines fair value as the amount that would be exchanged to sell an asset or transfer a liability in an orderly transfer between market participants at the measurement date. The Company values securities/instruments traded in active markets on the measurement date by multiplying the closing price of such traded securities/instruments by the quantity of shares or amount of the instrument held. The Company may also obtain quotes with respect to certain of its investments, such as its securities/instruments traded in active markets and its liquid securities/instruments that are not traded in active markets, from pricing services, brokers, or counterparties (i.e. “consensus pricing”). When doing so, the Company determines whether the quote obtained is sufficient according to U.S. GAAP to determine the fair value of the security. The Company may use the quote obtained or alternative pricing sources may be utilized including valuation techniques typically utilized for illiquid securities/instruments.
Securities/instruments that are illiquid or for which the pricing source does not provide a valuation or methodology or provides a valuation or methodology that, in the judgment of the Investment Adviser or the Board of Directors, does not represent fair value shall each be valued as of the measurement date using all techniques appropriate under the circumstances and for which sufficient data is available. These valuation techniques may vary by investment and include comparable public market valuations, comparable precedent transaction valuations and/or discounted cash flow analyses. The process generally used to determine the applicable value is as follows: (i) the value of each portfolio company or investment is initially reviewed by the investment professionals responsible for such portfolio company or investment and, for non-traded investments, a standardized template designed to approximate fair market value based on observable market inputs, updated credit statistics and unobservable inputs is used to determine a preliminary value, which is also reviewed alongside consensus pricing, where available; (ii) preliminary valuation conclusions are documented and reviewed by a valuation committee comprised of members of senior management; (iii) the Board of Directors engages a third-party valuation firm to provide positive assurance
on portions of the Middle Market Senior Loans and equity investments portfolio each quarter (such that each non-traded investment other than Credit Fund is reviewed by a third-party valuation firm at least once on a rolling twelve month basis) including a review of management’s preliminary valuation and conclusion on fair value; (iv) the Audit Committee of the Board of Directors (the “Audit Committee”) reviews the assessments of the Investment Adviser and the third-party valuation firm and provides the Board of Directors with any recommendations with respect to changes to the fair value of each investment in the portfolio; and (v) the Board of Directors discusses the valuation recommendations of the Audit Committee and determines the fair value of each investment in the portfolio in good faith based on the input of the Investment Adviser and, where applicable, the third-party valuation firm.
All factors that might materially impact the value of an investment are considered, including, but not limited to the assessment of the following factors, as relevant:
|
•
|
the nature and realizable value of any collateral;
|
|
•
|
call features, put features and other relevant terms of debt;
|
|
•
|
the portfolio company’s leverage and ability to make payments;
|
|
•
|
the portfolio company’s public or private credit rating;
|
|
•
|
the portfolio company’s actual and expected earnings and discounted cash flow;
|
|
•
|
prevailing interest rates and spreads for similar securities and expected volatility in future interest rates;
|
|
•
|
the markets in which the portfolio company does business and recent economic and/or market events; and
|
|
•
|
comparisons to comparable transactions and publicly traded securities.
|
Investment performance data utilized are the most recently available financial statements and compliance certificate received from the portfolio companies as of the measurement date which in many cases may reflect a lag in information.
Due to the inherent uncertainty of determining the fair value of investments that do not have a readily available market value, the fair value of the Company’s investments may fluctuate from period to period. Because of the inherent uncertainty of valuation, these estimated values may differ significantly from the values that would have been reported had a ready market for the investments existed, and it is reasonably possible that the difference could be material.
In addition, changes in the market environment and other events that may occur over the life of the investments may cause the realized gains or losses on investments to be different from the net change in unrealized appreciation or depreciation currently reflected in the consolidated financial statements as of
December 31, 2019
and
2018
.
U.S. GAAP establishes a hierarchical disclosure framework which ranks the level of observability of market price inputs used in measuring investments at fair value. The observability of inputs is impacted by a number of factors, including the type of investment and the characteristics specific to the investment and state of the marketplace, including the existence and transparency of transactions between market participants. Investments with readily available quoted prices or for which fair value can be measured from quoted prices in active markets generally have a higher degree of market price observability and a lesser degree of judgment applied in determining fair value.
For further information on the fair value hierarchies, our framework for determining fair value, and the composition of our portfolio, see Note 3 to the consolidated financial statements in Part II, Item 8 of this Form 10-K for further information on fair value measurements.
Use of Estimates
The preparation of consolidated financial statements in Part II, Item 8 of this Form 10-K in conformity with US GAAP requires management to make assumptions and estimates that affect the reported amounts of assets and liabilities and disclosure of contingent assets and liabilities at the date of the financial statements and the reported amounts of revenues and expenses during the reporting period. Management’s estimates are based on historical experiences and other factors, including expectations of future events that management believes to be reasonable under the circumstances. It also requires management to exercise judgment in the process of applying the Company’s accounting policies. Assumptions and estimates regarding the valuation of investments and their resulting impact on base management and incentive fees involve a higher degree of judgment and complexity and these assumptions and estimates may be significant to the consolidated financial statements in Part II, Item 8 of this Form 10-K. Actual results could differ from these estimates and such differences could be material.
76
Investments
Investment transactions are recorded on the trade date. Realized gains or losses are measured by the difference between the net proceeds from the repayment or sale and the amortized cost basis of the investment using the specific identification method without regard to unrealized appreciation or depreciation previously recognized, and includes investments charged off during the period, net of recoveries. Net change in unrealized appreciation or depreciation on investments as presented in the Consolidated Statements of Operations in Part II, Item 8 of this Form 10-K reflects the net change in the fair value of investments, including the reversal of previously recorded unrealized appreciation or depreciation when gains or losses are realized.
Revenue Recognition
Interest from Investments and Realized Gain/Loss on Investments
Interest income is recorded on an accrual basis and includes the accretion of discounts and amortization of premiums. Discounts from and premiums to par value on debt investments purchased are accreted/amortized into interest income over the life of the respective security using the effective interest method. The amortized cost of debt investments represents the original cost, including origination fees and upfront fees received that are deemed to be an adjustment to yield, adjusted for the accretion of discounts and amortization of premiums, if any. At time of exit, the realized gain or loss on an investment is the difference between the amortized cost at time of exit and the cash received at exit using the specific identification method.
The Company may have loans in its portfolio that contain payment-in-kind (“PIK”) provisions. PIK represents interest that is accrued and recorded as interest income at the contractual rates, increases the loan principal on the respective capitalization dates, and is generally due at maturity. Such income is included in interest income in the Consolidated Statements of Operations included in Part II, Item 8 of this Form 10-K.
Dividend Income
Dividend income from the investment fund is recorded on the record date for the investment fund to the extent that such amounts are payable by the investment fund and are expected to be collected.
Other Income
Other income may include income such as consent, waiver, amendment, unused, syndication and prepayment fees associated with the Company’s investment activities as well as any fees for managerial assistance services rendered by the Company to the portfolio companies. Such fees are recognized as income when earned or the services are rendered. The Company may receive fees for guaranteeing the outstanding debt of a portfolio company. Such fees are amortized into other income over the life of the guarantee. The unamortized amount, if any, is included in other assets in the Consolidated Statements of Assets and Liabilities included in Part II, Item 8 of this Form 10-K.
Non-Accrual Income
Loans are generally placed on non-accrual status when principal or interest payments are past due 30 days or more or when there is reasonable doubt that principal or interest will be collected in full. Accrued and unpaid interest is generally reversed when a loan is placed on non-accrual status. Interest payments received on non-accrual loans may be recognized as income or applied to principal depending upon management’s judgment regarding collectability. Non-accrual loans are restored to accrual status when past due principal and interest are paid current and, in management’s judgment, are likely to remain current. Management may not place a loan on non-accrual status if the loan has sufficient collateral value and is in the process of collection.
Income Taxes
For federal income tax purposes, the Company has elected to be treated as a RIC under the Code, and intends to make the required distributions to its stockholders as specified therein. In order to qualify as a RIC, the Company must meet certain minimum distribution, source-of-income and asset diversification requirements. If such requirements are met, then the Company is generally required to pay income taxes only on the portion of its taxable income and gains it does not distribute.
The minimum distribution requirements applicable to RICs require the Company to distribute to its stockholders at least 90% of its investment company taxable income (“ICTI”), as defined by the Code, each year. Depending on the level of ICTI earned in a tax year, the Company may choose to carry forward ICTI in excess of current year distributions into the next
77
tax year. Any such carryover ICTI must be distributed before the end of that next tax year through a dividend declared prior to filing the final tax return related to the year which generated such ICTI.
In addition, based on the excise distribution requirements, the Company is subject to a 4% nondeductible federal excise tax on undistributed income unless the Company distributes in a timely manner an amount at least equal to the sum of (1) 98% of its ordinary income for each calendar year, (2) 98.2% of capital gain net income (both long-term and short-term) for the one-year period ending October 31 in that calendar year and (3) any income realized, but not distributed, in the preceding year. For this purpose, however, any ordinary income or capital gain net income retained by the Company that is subject to corporate income tax is considered to have been distributed. The Company intends to make sufficient distributions each taxable year to satisfy the excise distribution requirements.
The Company evaluates tax positions taken or expected to be taken in the course of preparing its consolidated financial statements to determine whether the tax positions are “more-likely than not” to be sustained by the applicable tax authority. All penalties and interest associated with income taxes, if any, are included in income tax expense.
The SPV and the 2015-1 Issuer are disregarded entities for tax purposes and are consolidated with the tax return of the Company.
Dividends and Distributions to Common Stockholders
To the extent that the Company has taxable income available, the Company intends to make quarterly distributions to its common stockholders. Dividends and distributions to common stockholders are recorded on the record date. The amount to be distributed is determined by the Board of Directors each quarter and is generally based upon the taxable earnings estimated by management and available cash. Net realized capital gains, if any, are generally distributed at least annually, although the Company may decide to retain such capital gains for investment.
RELATED PARTY TRANSACTIONS
Investment Advisory Agreement
On April 3, 2013, the Company’s Board of Directors, including a majority of the directors who are not “interested persons” as defined in Section 2(a)(19) of the Investment Company Act (the “Independent Directors”), approved an investment advisory agreement (the “Original Investment Advisory Agreement”) between the Company and the Investment Adviser in accordance with, and on the basis of an evaluation satisfactory to such directors as required by, Section 15(c) of the Investment Company Act.
The Original Investment Advisory Agreement was amended on September 15, 2017 (as amended, the “First Amended and Restated Investment Advisory Agreement”) after the approval of the Company’s Board of Directors, including a majority of the Independent Directors, at an in-person meeting of the Board of Directors held on May 30, 2017 and the approval of the Company’s stockholders at a special meeting of stockholders held on September 15, 2017. The First Amended and Restated Investment Advisory Agreement amended the Original Investment Advisory Agreement to, among other things, (i) reduce the incentive fee payable by the Company to the Investment Adviser from an annual rate of 20% to an annual rate of 17.5%, (ii) delete the incentive fee payment deferral test described below, and (iii) include in the pre-incentive fee net investment income, in the case of investments with a deferred interest feature, accrued income that the Company has not yet received in cash.
On August 6, 2018, the First Amended and Restated Investment Advisory Agreement was further amended (as amended, the “Investment Advisory Agreement”) after the approval of the Company’s Board of Directors, including a majority of the Independent Directors, at an in-person meeting of the Board of Directors held on August 6, 2018. The Investment Advisory Agreement amended the First Amended and Restated Investment Advisory Agreement to incorporate a one-third (0.50%) reduction in the 1.50% annual base management fee rate charged by the Investment Adviser on assets financed using leverage in excess of 1.0x debt to equity, effective July 1, 2018.
The initial term of the Investment Advisory Agreement is two years from September 15, 2017 and, unless terminated earlier, the Investment Advisory Agreement will renew automatically for successive annual periods, provided that such continuance is specifically approved at least annually by the vote of the Board of Directors and by the vote of a majority of the Independent Directors. The Investment Advisory Agreement will automatically terminate in the event of an assignment and may be terminated by either party without penalty upon at least 60 days’ written notice to the other party. Subject to the overall supervision of the Board of Directors, the Investment Adviser provides investment advisory services to the Company. For
78
providing these services, the Investment Adviser receives fees from the Company consisting of two components—a base management fee and an incentive fee.
Effective September 15, 2017, the base management fee has been calculated and payable quarterly in arrears at an annual rate of 1.50% of the average value of the gross assets at the end of the two most recently completed fiscal quarters; provided, however, effective July 1, 2018, the base management fee has been calculated at an annual rate of 1.00% of the average value of the gross assets as of the end of the two most recently completed calendar quarters that exceeds the product of (A) 200% and (B) the average value of the Company’s net asset value at the end of the two most recently completed calendar quarters. The base management fee will be appropriately adjusted for any share issuances or repurchases during such fiscal quarter and the base management fees for any partial month or quarter will be pro-rated. The Company’s gross assets exclude any cash and cash equivalents and include assets acquired through the incurrence of debt from use of the SPV Credit Facility, Credit Facility, 2015-1R Notes and 2015-1 Notes (see Note 6, Borrowings, and Note 7, Notes Payable, to the consolidated financial statements in Part II, Item 8 of this Form 10-K). For purposes of this calculation, cash and cash equivalents include any temporary investments in cash-equivalents, U.S. government securities and other high quality investment grade debt investments that mature in 12 months or less from the date of investment.
Prior to September 15, 2017, under the Original Investment Advisory Agreement, the base management fee was calculated and payable quarterly in arrears at an annual rate of 1.50% of the average daily gross assets of the Company for the period adjusted for share issuances or repurchases. Prior to the IPO, the Investment Adviser waived its right to receive one-third (0.50%) of the 1.50% base management fee. Any waived base management fees are not subject to recoupment by the Investment Adviser. The fee waiver terminated when the IPO had been consummated. As previously disclosed, in connection with the IPO, the Investment Adviser agreed to continue the fee waiver until the completion of the first full quarter after the consummation of the IPO. As a result, beginning October 1, 2017, the base management fee has been calculated at an annual rate of 1.50% of the Company’s gross assets; provided, however, effective July 1, 2018, the base management fee has been calculated at an annual rate of 1.00% of the average value of the gross assets as of the end of the two most recently completed calendar quarters that exceeds the product of (A) 200% and (B) the average value of the Company’s net asset value at the end of the two most recently completed calendar quarters.
The incentive fee has two parts. The first part is calculated and payable quarterly in arrears based on the pre-incentive fee net investment income for the immediately preceding calendar quarter. The second part is determined and payable in arrears based on capital gains as of the end of each calendar year.
Pre-incentive fee net investment income means interest income, dividend income and any other income (including any other fees (other than fees for providing managerial assistance), such as commitment, origination, structuring, diligence and consulting fees or other fees that the Company receives from portfolio companies) accrued during the calendar quarter, minus the operating expenses accrued for the quarter (including the base management fee, expenses payable under the administration agreement, and any interest expense or fees on any credit facilities or outstanding debt and dividends paid on any issued and outstanding preferred stock, but excluding the incentive fee). Pre-incentive fee net investment income includes, in the case of investments with a deferred interest feature, accrued income that the Company has not yet received in cash. Pre-incentive fee net investment income does not include any realized capital gains, realized capital losses or unrealized capital appreciation or depreciation.
Effective September 15, 2017, pre-incentive fee net investment income, expressed as a rate of return on the value of our net assets at the end of the immediately preceding calendar quarter, has been compared to a “hurdle rate” of 1.50% per quarter (6% annualized) or a “catch-up rate” of 1.82% per quarter (7.28% annualized), as applicable.
Pursuant to the Investment Advisory Agreement, the Company pays its Investment Adviser an incentive fee with respect to its pre-incentive fee net investment income in each calendar quarter as follows:
|
•
|
no incentive fee based on pre-incentive fee net investment income in any calendar quarter in which its pre-incentive fee net investment income does not exceed the hurdle rate of 1.50%;
|
|
•
|
100% of pre-incentive fee net investment income with respect to that portion of such pre-incentive fee net investment income, if any, that exceeds the hurdle rate but is less than 1.82% in any calendar quarter (7.28% annualized). The Company refers to this portion of the pre-incentive fee net investment income (which exceeds the hurdle rate but is less than 1.82%) as the “catch-up.” The “catch-up” is meant to provide the Investment Adviser with approximately 17.5% of the Company’s pre-incentive fee net investment income as if a hurdle rate did not apply if this net investment income exceeds 1.82% in any calendar quarter; and
|
79
|
•
|
17.5% of the amount of pre-incentive fee net investment income, if any, that exceeds 1.82% in any calendar quarter (7.28% annualized) will be payable to the Investment Adviser. This reflects that once the hurdle rate is reached and the catch-up is achieved, 17.5% of all pre-incentive fee investment income thereafter is allocated to the Investment Adviser.
|
The second part of the incentive fee is determined and payable in arrears as of the end of each calendar year (or upon termination of the Investment Advisory Agreement, as of the termination date), and equals 17.5% of realized capital gains, if any, on a cumulative basis from inception through the date of determination, computed net of all realized capital losses on a cumulative basis and unrealized capital depreciation, less the aggregate amount of any previously paid capital gain incentive fees, provided that, the incentive fee determined at the end of the first calendar year of operations may be calculated for a period of shorter than twelve calendar months to take into account any realized capital gains computed net of all realized capital losses on a cumulative basis and unrealized capital depreciation.
Prior to the September 15, 2017, under the Original Investment Advisory Agreement, pre-incentive fee net investment income, which did not include, in the case of investments with a deferred interest feature, accrued income that the Company has not yet received in cash, and was expressed as a rate of return on the average daily Hurdle Calculation Value (as defined below) throughout the immediately preceding calendar quarter, was compared to a “hurdle rate” of 1.50% per quarter (6% annualized) or a “catch-up” of 1.875% per quarter (7.50% annualized), as applicable. “Hurdle Calculation Value” meant, on any given day, the sum of (x) the value of net assets as of the end of the calendar quarter immediately preceding such day plus (y) the aggregate amount of capital drawn from investors (or reinvested in the Company pursuant to a dividend reinvestment plan) from the beginning of the current quarter to such day minus (z) the aggregate amount of distributions (including share repurchases) made by the Company from the beginning of the current quarter to such day, but only to the extent such distributions were not declared and accounted for on the books and records in a previous quarter. In addition, under the Original Investment Advisory Agreement, the Company deferred payment of any incentive fee otherwise earned by the Investment Adviser if, during the most recent four full calendar quarter periods ending on or prior to the date such payment is to be made, the sum of (a) the aggregate distributions to stockholders and (b) the change in net assets (defined as gross assets less indebtedness and before taking into account any incentive fees payable during the period) is less than 6.0% of net assets (defined as gross assets less indebtedness) at the beginning of such period. These calculations were adjusted for any share issuances or repurchases. Any deferred incentive fees were carried over for payment in subsequent calculation periods.
As previously disclosed, in connection with the IPO, the Investment Adviser agreed to charge 17.5% instead of 20% with respect to, or effectively waive 2.5% from, the entire calculation of the incentive fee beginning on the first full quarter following the consummation of the IPO until the earlier of (i) October 1, 2017 and (ii) the date that the Company’s stockholders vote on the approval of the amendment to the Original Investment Advisory Agreement. The Company’s stockholders voted to approve the Investment Advisory Agreement on September 15, 2017.
On April 3, 2013, the Investment Adviser entered into a personnel agreement with Carlyle Employee Co., pursuant to which Carlyle Employee Co. provides the Investment Adviser with access to investment professionals.
Administration Agreement
On April 3, 2013, the Company’s Board of Directors approved an administration agreement (the “Administration Agreement”) between the Company and the Administrator. Pursuant to the Administration Agreement, the Administrator provides services and receives reimbursements equal to an amount that reimburses the Administrator for its costs and expenses and the Company’s allocable portion of overhead incurred by the Administrator in performing its obligations under the Administration Agreement, including the Company’s allocable portion of the compensation paid to or compensatory distributions received by the Company’s officers (including the Chief Compliance Officer and Chief Financial Officer) and respective staff who provide services to the Company, operations staff who provide services to the Company, and any internal audit staff, to the extent internal audit performs a role in the Company’s Sarbanes-Oxley Act internal control assessment. Reimbursement under the Administration Agreement occurs quarterly in arrears.
The initial term of the Administration Agreement was two years from April 3, 2013 and, unless terminated earlier, the Administration Agreement will renew automatically for successive annual periods, provided that such continuance is specifically approved at least annually by (i) the vote of the Board of Directors or by a majority vote of the outstanding voting securities of the Company and (ii) the vote of a majority of the Company’s Independent Directors. On May 6, 2019, the Company’s Board of Directors, including a majority of the Independent Directors, approved the continuance of the Administration Agreement for a one year period. The Administration Agreement may not be assigned by a party without the consent of the other party and may be terminated by either party without penalty upon at least 60 days’ written notice to the other party.
80
Sub-Administration Agreements
On April 3, 2013, the Administrator entered into a sub-administration agreement with Carlyle Employee Co. (the “Carlyle Sub-Administration Agreement”). Pursuant to the Carlyle Sub-Administration Agreement, Carlyle Employee Co. provides the Administrator with access to personnel.
On April 3, 2013, the Administrator entered into a sub-administration agreement with State Street Bank and Trust Company (“State Street” and, such agreement, the “State Street Sub-Administration Agreement” and, together with the Carlyle Sub-Administration Agreement, the “Sub-Administration Agreements”). On March 11, 2015, the Company’s Board of Directors, including a majority of the Independent Directors, approved an amendment to the State Street Sub-Administration Agreement. The initial term of the State Street Sub-Administration Agreement ends on April 1, 2017 and, unless terminated earlier, the State Street Sub-Administration Agreement will renew automatically for successive annual periods, provided that such continuance is specifically approved at least annually by (i) the vote of the Board of Directors or by the vote of a majority of the outstanding voting securities of the Company and (ii) the vote of a majority of the Company’s Independent Directors. On May 6, 2019, the Company’s Board of Directors, including a majority of the Independent Directors, approved the continuance of the State Street Sub-Administration Agreement for a one year period. The State Street Sub-Administration Agreement may be terminated upon at least 60 days’ written notice and without penalty by the vote of a majority of the outstanding securities of the Company, or by the vote of the Board of Directors or by either party to the State Street Sub-Administration Agreement.
Board of Directors
The Company’s Board of Directors currently consists of five members, three of whom are Independent Directors. On April 3, 2013, the Board of Directors established an Audit Committee consisting of its Independent Directors. The Board of Directors also established a Pricing Committee of the Board of Directors, a Nominating and Governance Committee of the Board of Directors and a Compensation Committee of the Board of Directors, and may establish additional committees in the future.
Item 7A. Quantitative and Qualitative Disclosures About Market Risk
We are subject to financial market risks, including changes in the valuations of our investment portfolio and interest rates.
Valuation Risk
Our investments may not have a readily available market price, and we value these investments at fair value as determined in good faith by our Board of Directors in accordance with our valuation policy. There is no single standard for determining fair value in good faith. As a result, determining fair value requires that judgment be applied to the specific facts and circumstances of each portfolio investment while employing a consistently applied valuation process for the types of investments we make. Due to the inherent uncertainty of determining the fair value of investments that do not have a readily available market value, the fair value of our investments may fluctuate from period to period. Because of the inherent uncertainty of valuation, these estimated values may differ significantly from the values that would have been used had a ready market for the investments existed, and it is possible that the difference could be material.
Interest Rate Risk
As of
December 31, 2019
, on a fair value basis, approximately
0.3%
of our debt investments bear interest at a fixed rate and approximately
99.7%
of our debt investments bear interest at a floating rate, which primarily are subject to interest rate floors. Interest rates on the investments held within our portfolio of investments are typically based on floating LIBOR, with many of these investments also having a LIBOR floor. Additionally, our Facilities are also subject to floating interest rates and are currently paid based on floating LIBOR rates.
Interest rate sensitivity refers to the change in earnings that may result from changes in the level of interest rates. There can be no assurance that a significant change in market interest rates will not have a material adverse effect on our income in the future.
The following table estimates the potential changes in net cash flow generated from interest income, should interest rates increase or decrease by 100, 200 or 300 basis points. Interest income is calculated as revenue from interest generated from our settled portfolio of debt investments held as of
December 31, 2019
and
2018
, excluding structured finance obligations and our investment in Credit Fund. These hypothetical calculations are based on a model of the settled debt investments in our portfolio, excluding structured finance obligations and our investment in Credit Fund, held as of
December 31, 2019
and
2018
, and are only adjusted for assumed changes in the underlying base interest rates and the impact of that change on interest income. Interest expense is calculated based on outstanding secured borrowings and notes payable as of
December 31, 2019
and
2018
and based on the terms of our Facilities and notes payable. Interest expense on our Facilities and notes payable is calculated using the stated interest rate as of
December 31, 2019
and
2018
, adjusted for the hypothetical changes in rates, as shown below. We intend to continue to finance a portion of our investments with borrowings and the interest rates paid on our borrowings may impact significantly our net interest income.
We regularly measure exposure to interest rate risk. We assess interest rate risk and manage interest rate exposure on an ongoing basis by comparing our interest rate sensitive assets to our interest rate sensitive liabilities. Based on that review, we determine whether or not any hedging transactions are necessary to mitigate exposure to changes in interest rates.
81
Based on our Consolidated Statements of Assets and Liabilities as of
December 31, 2019
and
2018
, the following table shows the annual impact on net investment income of base rate changes in interest rates for our settled debt investments (considering interest rate floors for variable rate instruments), excluding our investment in Credit Fund, and outstanding secured borrowings and notes payable assuming no changes in our investment and borrowing structure:
|
|
As of December 31, 2019
|
As of December 31, 2018
|
||||||||||||||||||||||
|
Basis Point Change
|
Interest
Income
|
Interest
Expense
|
Net
Investment
Income
|
Interest
Income
|
Interest
Expense
|
Net
Investment
Income
|
||||||||||||||||||
|
Up 300 basis points
|
$
|
57,441
|
|
$
|
(31,167
|
)
|
$
|
26,274
|
|
$
|
52,554
|
|
$
|
(28,165
|
)
|
$
|
24,389
|
|
||||||
|
Up 200 basis points
|
$
|
38,294
|
|
$
|
(20,778
|
)
|
$
|
17,516
|
|
$
|
35,036
|
|
$
|
(18,777
|
)
|
$
|
16,259
|
|
||||||
|
Up 100 basis points
|
$
|
19,147
|
|
$
|
(10,389
|
)
|
$
|
8,758
|
|
$
|
17,518
|
|
$
|
(9,388
|
)
|
$
|
8,130
|
|
||||||
|
Down 100 basis points
|
$
|
(16,433
|
)
|
$
|
10,389
|
|
$
|
(6,044
|
)
|
$
|
(17,477
|
)
|
$
|
9,388
|
|
$
|
(8,089
|
)
|
||||||
|
Down 200 basis points
|
$
|
(18,678
|
)
|
$
|
20,225
|
|
$
|
1,547
|
|
$
|
(28,103
|
)
|
$
|
18,777
|
|
$
|
(9,326
|
)
|
||||||
|
Down 300 basis points
|
$
|
(19,053
|
)
|
$
|
20,823
|
|
$
|
1,770
|
|
$
|
(28,741
|
)
|
$
|
22,953
|
|
$
|
(5,788
|
)
|
||||||
82
Item 8. Financial Statements and Supplementary Data
TCG BDC, INC.
INDEX TO CONSOLIDATED FINANCIAL STATEMENTS
83
Report of Independent Registered Public Accounting Firm
To the Board of Directors and Stockholders of TCG BDC, Inc.
Opinion on the Financial Statements
We have audited the accompanying consolidated statements of assets and liabilities of TCG BDC, Inc. (the “Company”), including the consolidated schedules of investments, as of December 31, 2019 and 2018, the related consolidated statements of operations, changes in net assets and cash flows for each of the three years in the period ended December 31, 2019, and the related notes (collectively referred to as the “consolidated financial statements”). In our opinion, the consolidated financial statements present fairly, in all material respects, the financial position of the Company
at December 31, 2019 and 2018, and the results of its operations, changes in its net assets, and its cash flows for each of the three years in the period ended December 31, 2019, in conformity with U.S. generally accepted accounting principles.
We also have audited, in accordance with the standards of the Public Company Accounting Oversight Board (United States) (PCAOB), the Company's internal control over financial reporting as of December 31, 2019, based on criteria established in Internal Control-Integrated Framework issued by the Committee of Sponsoring Organizations of the Treadway Commission (2013 framework) and our report dated February 25, 2020
expressed an unqualified opinion thereon.
Basis for Opinion
These financial statements are the responsibility of the Company’s management. Our responsibility is to express an opinion on the Company’s financial statements based on our audits. We are a public accounting firm registered with the PCAOB and are required to be independent with respect to the Company in accordance with the U.S. federal securities laws and the applicable rules and regulations of the Securities and Exchange Commission and the PCAOB.
We conducted our audits in accordance with the standards of the PCAOB. Those standards require that we plan and perform the audit to obtain reasonable assurance about whether the financial statements are free of material misstatement, whether due to error or fraud. Our audits included performing procedures to assess the risks of material misstatement of the financial statements, whether due to error or fraud, and performing procedures that respond to those risks. Such procedures included examining, on a test basis, evidence regarding the amounts and disclosures in the financial statements. Our procedures included confirmation of investments owned as of December 31, 2019 and 2018, by correspondence with the custodians and debt agents. Our audits also included evaluating the accounting principles used and significant estimates made by management, as well as evaluating the overall presentation of the financial statements. We believe that our audits provide a reasonable basis for our opinion.
Critical Audit Matter
The critical audit matter communicated below is a matter arising from the current period audit of the financial statements that was communicated or required to be communicated to the audit committee and that: (1) relates to accounts or disclosures that are material to the financial statements and (2) involved our especially challenging, subjective or complex judgments. The communication of the critical audit matter does not alter in any way our opinion on the consolidated financial statements, taken as a whole, and we are not, by communicating the critical audit matter below, providing a separate opinion on the critical audit matter or on the account or disclosures to which it relates.
84
|
Valuation of investments using significant unobservable inputs
|
|
|
Description of the Matter
|
At December 31, 2019, the fair value of the Company's investments categorized in Level III of the fair value hierarchy (Level III investments) totaled $2.124 billion. As discussed in Note 3 to the consolidated financial statements (Note 3), management determined the fair value of the Company’s Level III investments by using valuation techniques such as comparable public market valuations, comparable precedent transaction valuations and/or discounted cash flow analyses and using inputs which were significant to the valuation of these investments, such as observable market inputs, updated credit statistics, and significant unobservable inputs (significant inputs). The significant unobservable inputs used to determine fair value required significant management judgment or estimation and, as disclosed in Note 3, included discount rates, comparable multiples, recovery rates, default rates, and indicative quotes.
Auditing the fair value of the Company's Level III investments was complex and judgmental due to the valuation techniques and significant unobservable inputs used by the Company to determine fair value.
|
|
How We Addressed the Matter in our Audit
|
We obtained an understanding, evaluated the design and tested the operating effectiveness of controls over the Company's investment valuation process. This included controls over management’s assessment of the valuation techniques and significant inputs used by management to determine the fair value measurements.
To test the valuation of the Company’s Level III investments, our audit procedures included, among others, evaluating the valuation techniques and significant inputs used by the Company. For each Level III investment, we gained an understanding of the valuation technique(s) and significant inputs used to value the investment and reviewed the information considered by the Board of Directors relating to the valuation. Our procedures also included testing, for a sample of Level III investments, significant inputs and the mathematical accuracy of the Company's valuation models. For example, we compared market spreads, market value (EBITDA) multiples of publicly traded comparable companies, available precedent sales transactions of comparable companies, default rates and recovery rates to information available from third-party market research providers. We also compared certain of the significant inputs to underlying sources like public and private credit ratings and the most recently available portfolio company financial statements and compliance certificates provided by management. To evaluate the reasonableness of the unobservable inputs, we assessed whether these inputs were developed in a manner consistent with the Company’s valuation policies and in some instances, with the assistance of our valuation specialists, we independently developed fair value estimates using portfolio company and market information and compared them to the Company's estimates. We searched for and evaluated information that corroborated or contradicted the Company's significant inputs. We also evaluated subsequent events and transactions and considered whether they corroborated or contradicted the Company's year-end valuations.
|
/s/ Ernst & Young LLP
We have served as the Company’s auditor since 2012.
New York, NY
February 25, 2020
85
Report of Independent Registered Public Accounting Firm
The Board of Directors and Stockholders of
TCG BDC, Inc.
Opinion on Internal Control over Financial Reporting
We have audited TCG BDC, Inc.’s internal control over financial reporting as of December 31, 2019, based on criteria established in Internal Control-Integrated Framework issued by the Committee of Sponsoring Organizations of the Treadway Commission (2013 framework) (the COSO criteria). In our opinion, TCG BDC, Inc. (the “Company”) maintained, in all material respects, effective internal control over financial reporting as of December 31, 2019, based on the COSO criteria.
We also have audited, in accordance with the standards of the Public Company Accounting Oversight Board (United States) (PCAOB), the consolidated statements of assets and liabilities of the Company, including the consolidated schedules of investments, as of December 31, 2019 and 2018, and the related consolidated statements of operations, changes in net assets and cash flows for each of the three years in the period ended December 31, 2019, and the related notes and our report dated February 25, 2020 expressed an unqualified opinion thereon.
Basis for Opinion
The Company’s management is responsible for maintaining effective internal control over financial reporting and for its assessment of the effectiveness of internal control over financial reporting included in the accompanying Management’s Report on Internal Control Over Financial Reporting. Our responsibility is to express an opinion on the Company’s internal control over financial reporting based on our audit. We are a public accounting firm registered with the PCAOB and are required to be independent with respect to the Company in accordance with the U.S. federal securities laws and the applicable rules and regulations of the Securities and Exchange Commission and the PCAOB.
We conducted our audit in accordance with the standards of the PCAOB. Those standards require that we plan and perform the audit to obtain reasonable assurance about whether effective internal control over financial reporting was maintained in all material respects.
Our audit included obtaining an understanding of internal control over financial reporting, assessing the risk that a material weakness exists, testing and evaluating the design and operating effectiveness of internal control based on the assessed risk, and performing such other procedures as we considered necessary in the circumstances. We believe that our audit provides a reasonable basis for our opinion.
Definition and Limitations of Internal Control Over Financial Reporting
A company’s internal control over financial reporting is a process designed to provide reasonable assurance regarding the reliability of financial reporting and the preparation of financial statements for external purposes in accordance with generally accepted accounting principles. A company’s internal control over financial reporting includes those policies and procedures that (1) pertain to the maintenance of records that, in reasonable detail, accurately and fairly reflect the transactions and dispositions of the assets of the company; (2) provide reasonable assurance that transactions are recorded as necessary to permit preparation of financial statements in accordance with generally accepted accounting principles, and that receipts and expenditures of the company are being made only in accordance with authorizations of management and directors of the company; and (3) provide reasonable assurance regarding prevention or timely detection of unauthorized acquisition, use, or disposition of the company’s assets that could have a material effect on the financial statements.
Because of its inherent limitations, internal control over financial reporting may not prevent or detect misstatements. Also, projections of any evaluation of effectiveness to future periods are subject to the risk that controls may become inadequate because of changes in conditions, or that the degree of compliance with the policies or procedures may deteriorate.
/s/ Ernst & Young LLP
New York, NY
February 25, 2020
86
TCG BDC, INC.
CONSOLIDATED STATEMENTS OF ASSETS AND LIABILITIES
(dollar amounts in thousands, except per share data)
|
December 31, 2019
|
December 31, 2018
|
||||||
|
ASSETS
|
|||||||
|
Investments, at fair value
|
|||||||
|
Investments—non-controlled/non-affiliated, at fair value (amortized cost of $1,960,755 and $1,799,751, respectively)
|
$
|
1,897,057
|
|
$
|
1,731,319
|
|
|
|
Investments—non-controlled/affiliated, at fair value (amortized cost of $0 and $13,839, respectively)
|
—
|
|
18,543
|
|
|||
|
Investments—controlled/affiliated, at fair value (amortized cost of $240,696 and $230,001, respectively)
|
226,907
|
|
222,295
|
|
|||
|
Total investments, at fair value (amortized cost of $2,201,451 and $2,043,591, respectively)
|
2,123,964
|
|
1,972,157
|
|
|||
|
Cash and cash equivalents
|
36,751
|
|
87,186
|
|
|||
|
Receivable for investment sold
|
6,162
|
|
8,060
|
|
|||
|
Deferred financing costs
|
4,032
|
|
3,950
|
|
|||
|
Interest receivable from non-controlled/non-affiliated investments
|
9,462
|
|
5,853
|
|
|||
|
Interest receivable from non-controlled/affiliated investments
|
—
|
|
3
|
|
|||
|
Interest and dividend receivable from controlled/affiliated investments
|
6,845
|
|
7,405
|
|
|||
|
Prepaid expenses and other assets
|
317
|
|
129
|
|
|||
|
Total assets
|
$
|
2,187,533
|
|
$
|
2,084,743
|
|
|
|
LIABILITIES
|
|||||||
|
Secured borrowings (Note 6)
|
$
|
616,543
|
|
$
|
514,635
|
|
|
|
2015-1R Notes, net of unamortized debt issuance costs of $2,911 and $3,157, respectively (Note 7)
|
446,289
|
|
446,043
|
|
|||
|
Senior Notes
|
115,000
|
|
—
|
|
|||
|
Payable for investments purchased
|
—
|
|
1,870
|
|
|||
|
Due to Investment Adviser
|
—
|
|
236
|
|
|||
|
Interest and credit facility fees payable (Notes 6 and 7)
|
6,764
|
|
7,500
|
|
|||
|
Dividend payable (Note 9)
|
31,760
|
|
35,497
|
|
|||
|
Base management and incentive fees payable (Note 4)
|
13,236
|
|
13,834
|
|
|||
|
Administrative service fees payable (Note 4)
|
77
|
|
94
|
|
|||
|
Other accrued expenses and liabilities
|
1,393
|
|
1,816
|
|
|||
|
Total liabilities
|
1,231,062
|
|
1,021,525
|
|
|||
|
Commitments and contingencies (Notes 8 and 11)
|
|||||||
|
NET ASSETS
|
|||||||
|
Common stock, $0.01 par value; 200,000,000 shares authorized; 57,763,811 and 62,230,251 shares issued and outstanding at December 31, 2019 and December 31, 2018, respectively
|
578
|
|
622
|
|
|||
|
Paid-in capital in excess of par value
|
1,109,238
|
|
1,174,334
|
|
|||
|
Offering costs
|
(1,633
|
)
|
(1,633
|
)
|
|||
|
Total distributable earnings (loss)
|
(151,712
|
)
|
(110,105
|
)
|
|||
|
Total net assets
|
$
|
956,471
|
|
$
|
1,063,218
|
|
|
|
NET ASSETS PER SHARE
|
$
|
16.56
|
|
$
|
17.09
|
|
|
The accompanying notes are an integral part of these consolidated financial statements.
87
TCG BDC, INC.
CONSOLIDATED STATEMENTS OF OPERATIONS
(dollar amounts in thousands, except per share data)
|
|
For the years ended December 31,
|
||||||||||
|
|
2019
|
2018
|
2017
|
||||||||
|
Investment income:
|
|||||||||||
|
From non-controlled/non-affiliated investments:
|
|||||||||||
|
Interest income
|
$
|
184,529
|
|
$
|
168,222
|
|
$
|
133,807
|
|
||
|
Other income
|
7,329
|
|
9,134
|
|
10,526
|
|
|||||
|
Total investment income from non-controlled/non-affiliated investments
|
191,858
|
|
177,356
|
|
144,333
|
|
|||||
|
From non-controlled/affiliated investments:
|
|||||||||||
|
Interest income
|
1,209
|
|
1,680
|
|
1,215
|
|
|||||
|
Total investment income from non-controlled/affiliated investments
|
1,209
|
|
1,680
|
|
1,215
|
|
|||||
|
From controlled/affiliated investments:
|
|||||||||||
|
Interest income
|
12,481
|
|
13,240
|
|
10,753
|
|
|||||
|
Dividend income
|
15,750
|
|
15,250
|
|
8,700
|
|
|||||
|
Total investment income from controlled/affiliated investments
|
28,231
|
|
28,490
|
|
19,453
|
|
|||||
|
Total investment income
|
221,298
|
|
207,526
|
|
165,001
|
|
|||||
|
Expenses:
|
|||||||||||
|
Base management fees (Note 4)
|
31,316
|
|
29,626
|
|
25,254
|
|
|||||
|
Incentive fees (Note 4)
|
22,872
|
|
23,002
|
|
21,084
|
|
|||||
|
Professional fees
|
2,745
|
|
3,404
|
|
2,895
|
|
|||||
|
Administrative service fees (Note 4)
|
539
|
|
701
|
|
661
|
|
|||||
|
Interest expense (Notes 6 and 7)
|
50,587
|
|
37,801
|
|
24,510
|
|
|||||
|
Credit facility fees (Note 6)
|
3,079
|
|
2,295
|
|
1,983
|
|
|||||
|
Directors’ fees and expenses
|
353
|
|
370
|
|
443
|
|
|||||
|
Other general and administrative
|
1,738
|
|
1,661
|
|
1,683
|
|
|||||
|
Total expenses
|
113,229
|
|
98,860
|
|
78,513
|
|
|||||
|
Waiver of base management fees (Note 4)
|
—
|
|
—
|
|
5,927
|
|
|||||
|
Net expenses
|
113,229
|
|
98,860
|
|
72,586
|
|
|||||
|
Net investment income (loss) before taxes
|
108,069
|
|
108,666
|
|
92,415
|
|
|||||
|
Excise tax expense
|
404
|
|
230
|
|
264
|
|
|||||
|
Net investment income (loss)
|
107,665
|
|
108,436
|
|
92,151
|
|
|||||
|
Net realized gain (loss) and net change in unrealized appreciation (depreciation) on investments:
|
|||||||||||
|
Net realized gain (loss) from:
|
|||||||||||
|
Non-controlled/non-affiliated investments
|
(29,285
|
)
|
(1,368
|
)
|
(11,692
|
)
|
|||||
|
Controlled/affiliated investments
|
(9,091
|
)
|
—
|
|
—
|
|
|||||
|
Currency gains (losses) on non-investment assets and liabilities
|
33
|
|
—
|
|
—
|
|
|||||
|
Net change in unrealized appreciation (depreciation) on investments:
|
|||||||||||
|
Non-controlled/non-affiliated investments
|
4,734
|
|
(65,528
|
)
|
6,590
|
|
|||||
|
Non-controlled/affiliated investments
|
(4,704
|
)
|
5,546
|
|
(842
|
)
|
|||||
|
Controlled/affiliated investments
|
(6,083
|
)
|
(7,971
|
)
|
(2,007
|
)
|
|||||
|
Net change in unrealized currency gains (losses) on non-investment assets and liabilities
|
(1,939
|
)
|
—
|
|
—
|
|
|||||
|
Net realized gain (loss) and net change in unrealized appreciation (depreciation) on investments and non-investment assets and liabilities
|
(46,335
|
)
|
(69,321
|
)
|
(7,951
|
)
|
|||||
|
Net increase (decrease) in net assets resulting from operations
|
$
|
61,330
|
|
$
|
39,115
|
|
$
|
84,200
|
|
||
|
Basic and diluted earnings per common share (Note 9)
|
$
|
1.02
|
|
$
|
0.63
|
|
$
|
1.59
|
|
||
|
Weighted-average shares of common stock outstanding—Basic and Diluted (Note 9)
|
60,189,502
|
|
62,533,614
|
|
52,997,450
|
|
|||||
The accompanying notes are an integral part of these consolidated financial statements.
88
TCG BDC, INC.
CONSOLIDATED STATEMENTS OF CHANGES IN NET ASSETS
(dollar amounts in thousands)
|
|
For the years ended December 31,
|
||||||||||
|
|
2019
|
2018
|
2017
|
||||||||
|
Increase (decrease) in net assets resulting from operations:
|
|||||||||||
|
Net investment income (loss)
|
$
|
107,665
|
|
$
|
108,436
|
|
$
|
92,151
|
|
||
|
Net realized gain (loss) on investments and non-investment assets and liabilities
|
(38,343
|
)
|
(1,368
|
)
|
(11,692
|
)
|
|||||
|
Net change in unrealized appreciation (depreciation) on investments
|
(6,053
|
)
|
(67,953
|
)
|
3,741
|
|
|||||
|
Net change in unrealized currency gains (losses) on non-investment assets and liabilities
|
(1,939
|
)
|
—
|
|
—
|
|
|||||
|
Net increase (decrease) in net assets resulting from operations
|
61,330
|
|
39,115
|
|
84,200
|
|
|||||
|
Capital transactions:
|
|||||||||||
|
Common stock issued, net of offering and underwriting costs
|
—
|
|
(15
|
)
|
365,475
|
|
|||||
|
Reinvestment of dividends
|
—
|
|
6,629
|
|
6,681
|
|
|||||
|
Repurchase of common stock
|
(64,717
|
)
|
(4,867
|
)
|
—
|
|
|||||
|
Dividends declared (Note 12)
|
(103,360
|
)
|
(104,948
|
)
|
(93,189
|
)
|
|||||
|
Net increase (decrease) in net assets resulting from capital share transactions
|
(168,077
|
)
|
(103,201
|
)
|
278,967
|
|
|||||
|
Net increase (decrease) in net assets
|
(106,747
|
)
|
(64,086
|
)
|
363,167
|
|
|||||
|
Net assets at beginning of year
|
1,063,218
|
|
1,127,304
|
|
764,137
|
|
|||||
|
Net assets at end of year
|
$
|
956,471
|
|
$
|
1,063,218
|
|
$
|
1,127,304
|
|
||
The accompanying notes are an integral part of these consolidated financial statements.
89
TCG BDC, INC.
CONSOLIDATED STATEMENTS OF CASH FLOWS
(dollar amounts in thousands)
|
|
For the years ended December 31,
|
||||||||||
|
|
2019
|
2018
|
2017
|
||||||||
|
Cash flows from operating activities:
|
|||||||||||
|
Net increase (decrease) in net assets resulting from operations
|
$
|
61,330
|
|
$
|
39,115
|
|
$
|
84,200
|
|
||
|
Adjustments to reconcile net increase (decrease) in net assets resulting from operations to net cash provided by (used in) operating activities:
|
|||||||||||
|
Amortization of deferred financing costs
|
1,864
|
|
1,896
|
|
949
|
|
|||||
|
Net accretion of discount on investments
|
(12,955
|
)
|
(12,814
|
)
|
(11,747
|
)
|
|||||
|
Paid-in-kind interest
|
(7,958
|
)
|
(4,676
|
)
|
(1,057
|
)
|
|||||
|
Net realized (gain) loss on investments
|
38,343
|
|
1,368
|
|
11,692
|
|
|||||
|
Net change in unrealized (appreciation) depreciation on investments
|
6,053
|
|
67,953
|
|
(3,741
|
)
|
|||||
|
Net change in unrealized currency (gains) losses on non-investment assets and liabilities
|
1,939
|
|
—
|
|
—
|
|
|||||
|
Cost of investments purchased and change in payable for investments purchased
|
(994,374
|
)
|
(953,163
|
)
|
(1,280,124
|
)
|
|||||
|
Proceeds from sales and repayments of investments and change in receivable for investments sold
|
819,084
|
|
888,069
|
|
812,576
|
|
|||||
|
Changes in operating assets:
|
|||||||||||
|
Interest receivable
|
(3,606
|
)
|
(1,312
|
)
|
(3,767
|
)
|
|||||
|
Dividend receivable
|
560
|
|
(860
|
)
|
(1,515
|
)
|
|||||
|
Prepaid expenses and other assets
|
(188
|
)
|
(53
|
)
|
(34
|
)
|
|||||
|
Changes in operating liabilities:
|
|||||||||||
|
Due to Investment Adviser
|
(236
|
)
|
167
|
|
(146
|
)
|
|||||
|
Interest and credit facility fees payable
|
(736
|
)
|
2,147
|
|
1,754
|
|
|||||
|
Base management and incentive fees payable
|
(598
|
)
|
736
|
|
4,941
|
|
|||||
|
Administrative service fees payable
|
(17
|
)
|
(1
|
)
|
(42
|
)
|
|||||
|
Other accrued expenses and liabilities
|
(397
|
)
|
223
|
|
410
|
|
|||||
|
Net cash provided by (used in) operating activities
|
(91,892
|
)
|
28,795
|
|
(385,651
|
)
|
|||||
|
Cash flows from financing activities:
|
|||||||||||
|
Proceeds from issuance of common stock, net of offering and underwriting costs
|
—
|
|
(15
|
)
|
357,429
|
|
|||||
|
Repurchase of common stock
|
(64,717
|
)
|
(4,867
|
)
|
—
|
|
|||||
|
Borrowings on SPV Credit Facility and Credit Facility
|
755,179
|
|
812,650
|
|
816,216
|
|
|||||
|
Repayments of SPV Credit Facility and Credit Facility
|
(655,209
|
)
|
(860,908
|
)
|
(675,208
|
)
|
|||||
|
Proceeds from issuance of Senior Unsecured Notes
|
115,000
|
|
—
|
|
—
|
|
|||||
|
Repayments of debt assumed from NFIC Acquisition
|
—
|
|
—
|
|
(42,128
|
)
|
|||||
|
Proceeds from issuance of 2015-1R Notes
|
—
|
|
449,200
|
|
—
|
|
|||||
|
Redemption of 2015-1 Notes
|
—
|
|
(273,000
|
)
|
—
|
|
|||||
|
Debt issuance costs paid
|
(1,699
|
)
|
(3,405
|
)
|
(1,063
|
)
|
|||||
|
Dividends paid in cash
|
(107,097
|
)
|
(93,303
|
)
|
(76,045
|
)
|
|||||
|
Net cash provided by (used in) financing activities
|
41,457
|
|
26,352
|
|
379,201
|
|
|||||
|
Net increase (decrease) in cash and cash equivalents
|
(50,435
|
)
|
55,147
|
|
(6,450
|
)
|
|||||
|
Cash and cash equivalents, beginning of year
|
87,186
|
|
32,039
|
|
38,489
|
|
|||||
|
Cash and cash equivalents, end of year
|
$
|
36,751
|
|
$
|
87,186
|
|
$
|
32,039
|
|
||
|
Supplemental disclosures:
|
|||||||||||
|
Offering expenses and debt issuance costs due
|
$
|
—
|
|
$
|
25
|
|
$
|
—
|
|
||
|
Interest paid during the year
|
$
|
49,981
|
|
$
|
34,676
|
|
$
|
22,519
|
|
||
|
Taxes, including excise tax, paid during year
|
$
|
225
|
|
$
|
105
|
|
$
|
179
|
|
||
|
Dividends declared during the year
|
$
|
103,360
|
|
$
|
104,948
|
|
$
|
93,189
|
|
||
|
Reinvestment of dividends
|
$
|
—
|
|
$
|
6,629
|
|
$
|
6,681
|
|
||
|
Cost of investments received in the NFIC Acquisition from shares issued (Note 13)
|
$
|
—
|
|
$
|
—
|
|
$
|
(8,046
|
)
|
||
|
Shares issued in consideration of NFIC Acquisition (Note 13)
|
$
|
—
|
|
$
|
—
|
|
$
|
8,046
|
|
||
|
Debt assumed from NFIC Acquisition (Note 13)
|
$
|
—
|
|
$
|
—
|
|
$
|
42,128
|
|
||
The accompanying notes are an integral part of these consolidated financial statements.
90
TCG BDC, INC.
CONSOLIDATED SCHEDULE OF INVESTMENTS
As of December 31, 2019
(dollar amounts in thousands)
|
Investments—non-controlled/non-affiliated
(1)
|
Footnotes
|
Industry
|
Reference Rate & Spread
(2)
|
Interest Rate
(2)
|
Acquisition Date
|
Maturity Date
|
Par/ Principal Amount **
|
Amortized Cost
(4)
|
Fair Value
(5)
|
% of Net
Assets
|
|||||||||||||||||||
|
First Lien Debt (77.29%)
|
|||||||||||||||||||||||||||||
|
Aero Operating, LLC (Dejana Industries, Inc.)
|
^+*
|
(2) (3) (13)
|
Business Services
|
L + 7.25%
|
9.16%
|
1/5/2018
|
12/29/2022
|
$
|
3,517
|
|
$
|
3,491
|
|
$
|
3,449
|
|
0.36
|
%
|
|||||||||||
|
Airnov, Inc.
|
^
|
(2) (3) (13)
|
Containers, Packaging & Glass
|
L + 5.25%
|
7.16%
|
12/20/2019
|
12/19/2025
|
12,813
|
|
12,602
|
|
12,601
|
|
1.32
|
|
||||||||||||||
|
Alpha Packaging Holdings, Inc.
|
+*
|
(2) (3)
|
Containers, Packaging & Glass
|
L + 4.25%
|
6.35%
|
6/26/2015
|
5/12/2020
|
2,836
|
|
2,836
|
|
2,822
|
|
0.30
|
|
||||||||||||||
|
Alpine SG, LLC
|
^*
|
(2) (3)
|
High Tech Industries
|
L + 6.50%
|
8.43%
|
2/2/2018
|
11/16/2022
|
15,301
|
|
15,187
|
|
15,244
|
|
1.59
|
|
||||||||||||||
|
American Physician Partners, LLC
|
^+*
|
(2) (3) (13)
|
Healthcare & Pharmaceuticals
|
L + 6.50%
|
8.58%
|
1/7/2019
|
12/21/2021
|
38,235
|
|
37,868
|
|
38,110
|
|
3.98
|
|
||||||||||||||
|
AMS Group HoldCo, LLC
|
^+*
|
(2) (3) (13)
|
Transportation: Cargo
|
L + 6.00%
|
8.07%
|
9/29/2017
|
9/29/2023
|
30,808
|
|
30,361
|
|
30,457
|
|
3.18
|
|
||||||||||||||
|
Analogic Corporation
|
^+*
|
(2) (3) (13)
|
Healthcare & Pharmaceuticals
|
L + 6.00%
|
7.70%
|
6/22/2018
|
6/22/2024
|
34,784
|
|
34,190
|
|
34,784
|
|
3.64
|
|
||||||||||||||
|
Anchor Hocking, LLC
|
^
|
(2) (3)
|
Durable Consumer Goods
|
L + 8.75%
|
10.66%
|
1/25/2019
|
1/25/2024
|
10,707
|
|
10,410
|
|
10,359
|
|
1.08
|
|
||||||||||||||
|
Apptio, Inc.
|
^
|
(2) (3) (13)
|
Software
|
L + 7.25%
|
8.96%
|
1/10/2019
|
1/10/2025
|
35,541
|
|
34,874
|
|
35,237
|
|
3.68
|
|
||||||||||||||
|
Aurora Lux FinCo S.Á.R.L. (Luxembourg)
|
^
|
(2) (3) (7)
|
Software
|
L + 6.00%
|
7.93%
|
12/24/2019
|
12/24/2026
|
37,500
|
|
36,563
|
|
36,563
|
|
3.82
|
|
||||||||||||||
|
Avenu Holdings, LLC
|
+*
|
(2) (3)
|
Sovereign & Public Finance
|
L + 5.25%
|
7.35%
|
9/28/2018
|
9/28/2024
|
38,665
|
|
38,125
|
|
37,227
|
|
3.89
|
|
||||||||||||||
|
Barnes & Noble, Inc.
|
^
|
(2) (3) (11)
|
Retail
|
L + 5.50%
|
9.07%
|
8/7/2019
|
8/7/2024
|
17,637
|
|
17,225
|
|
17,196
|
|
1.80
|
|
||||||||||||||
|
BMS Holdings III Corp.
|
^*
|
(2) (3) (13)
|
Construction & Building
|
L + 5.25%
|
7.35%
|
9/30/2019
|
9/30/2026
|
11,638
|
|
11,274
|
|
11,591
|
|
1.21
|
|
||||||||||||||
|
Brooks Equipment Company, LLC
|
+*
|
(2) (3)
|
Construction & Building
|
L + 5.00%
|
6.91%
|
6/26/2015
|
8/29/2020
|
2,443
|
|
2,439
|
|
2,441
|
|
0.26
|
|
||||||||||||||
|
Capstone Logistics Acquisition, Inc.
|
+*
|
(2) (3)
|
Transportation: Cargo
|
L + 4.50%
|
6.20%
|
6/26/2015
|
10/7/2021
|
3,976
|
|
3,962
|
|
3,894
|
|
0.41
|
|
||||||||||||||
|
Captive Resources Midco, LLC
|
^*
|
(2) (3) (13)
|
Banking, Finance, Insurance & Real Estate
|
L + 6.00%
|
8.18%
|
6/30/2015
|
5/31/2025
|
30,301
|
|
29,814
|
|
30,158
|
|
3.15
|
|
||||||||||||||
|
Central Security Group, Inc.
|
+*
|
(2) (3)
|
Consumer Services
|
L + 5.63%
|
7.33%
|
6/26/2015
|
10/6/2021
|
22,634
|
|
22,531
|
|
19,466
|
|
2.04
|
|
||||||||||||||
|
Chartis Holding, LLC
|
^
|
(2) (3) (13)
|
Business Services
|
L + 5.25%
|
7.28%
|
5/1/2019
|
5/1/2025
|
15,926
|
|
15,538
|
|
15,723
|
|
1.64
|
|
||||||||||||||
|
Chemical Computing Group ULC (Canada)
|
^*
|
(2) (3) (7) (13)
|
Software
|
L + 5.25%
|
6.95%
|
8/30/2018
|
8/30/2023
|
14,674
|
|
14,567
|
|
14,539
|
|
1.52
|
|
||||||||||||||
|
CircusTrix Holdings, LLC
|
^+*
|
(2) (3) (13)
|
Hotel, Gaming & Leisure
|
L + 5.50%
|
7.20%
|
2/2/2018
|
12/6/2021
|
9,397
|
|
9,342
|
|
9,242
|
|
0.97
|
|
||||||||||||||
|
Comar Holding Company, LLC
|
^+*
|
(2) (3) (13)
|
Containers, Packaging & Glass
|
L + 5.25%
|
6.96%
|
6/18/2018
|
6/18/2024
|
27,783
|
|
27,254
|
|
27,101
|
|
2.83
|
|
||||||||||||||
|
Cority Software Inc. (Canada)
|
^
|
(2) (3) (7) (13)
|
Software
|
L + 5.50%
|
7.57%
|
7/2/2019
|
7/2/2026
|
27,000
|
|
26,435
|
|
26,400
|
|
2.76
|
|
||||||||||||||
|
Dent Wizard International Corporation
|
+
|
(2) (3)
|
Automotive
|
L + 4.00%
|
5.70%
|
4/28/2015
|
4/7/2022
|
877
|
|
877
|
|
873
|
|
0.09
|
|
||||||||||||||
|
Derm Growth Partners III, LLC (Dermatology Associates)
|
^
|
(2) (3) (9)
|
Healthcare & Pharmaceuticals
|
L + 6.25% (100% PIK)
|
8.16%
|
5/31/2016
|
5/31/2022
|
56,310
|
|
56,026
|
|
39,716
|
|
4.15
|
|
||||||||||||||
|
DermaRite Industries, LLC
|
^*
|
(2) (3) (13)
|
Healthcare & Pharmaceuticals
|
L + 7.00%
|
8.70%
|
3/3/2017
|
3/3/2022
|
22,647
|
|
22,481
|
|
21,690
|
|
2.27
|
|
||||||||||||||
|
Digicel Limited (Jamaica)
|
^
|
(7)
|
Telecommunications
|
6.00%
|
6.00%
|
7/23/2019
|
4/15/2021
|
250
|
|
202
|
|
195
|
|
0.02
|
|
||||||||||||||
|
Dimensional Dental Management, LLC
|
^
|
(2) (3) (11) (13)
|
Healthcare & Pharmaceuticals
|
L + 5.75%
|
10.00%
|
2/12/2016
|
2/12/2021
|
1,224
|
|
1,199
|
|
1,224
|
|
0.13
|
|
||||||||||||||
|
Dimensional Dental Management, LLC
|
^
|
(2) (3) (9) (11)
|
Healthcare & Pharmaceuticals
|
L + 5.75%
|
8.66%
|
2/12/2016
|
7/22/2020
|
33,674
|
|
33,301
|
|
—
|
|
—
|
|
||||||||||||||
91
TCG BDC, INC.
CONSOLIDATED SCHEDULE OF INVESTMENTS
As of December 31, 2019
(dollar amounts in thousands)
|
Investments—non-controlled/non-affiliated
(1)
|
Footnotes
|
Industry
|
Reference Rate & Spread
(2)
|
Interest Rate
(2)
|
Acquisition Date
|
Maturity Date
|
Par/ Principal Amount **
|
Amortized Cost
(4)
|
Fair Value
(5)
|
% of Net
Assets
|
|||||||||||||||||||
|
First Lien Debt (77.29%) (continued)
|
|||||||||||||||||||||||||||||
|
Direct Travel, Inc.
|
^+*
|
(2) (3)
|
Hotel, Gaming & Leisure
|
L + 6.50%
|
8.41%
|
10/14/2016
|
12/1/2021
|
$
|
36,805
|
|
$
|
36,515
|
|
$
|
36,757
|
|
3.84
|
%
|
|||||||||||
|
DTI Holdco, Inc.
|
*
|
(2) (3)
|
High Tech Industries
|
L + 4.75%
|
6.68%
|
12/18/2018
|
9/30/2023
|
1,974
|
|
1,871
|
|
1,841
|
|
0.19
|
|
||||||||||||||
|
Emergency Communications Network, LLC
|
^+*
|
(2) (3)
|
Telecommunications
|
L + 6.25%
|
8.14%
|
6/1/2017
|
6/1/2023
|
24,375
|
|
24,233
|
|
22,323
|
|
2.33
|
|
||||||||||||||
|
Ensono, LP
|
*
|
(2) (3)
|
Telecommunications
|
L + 5.25%
|
6.95%
|
4/30/2018
|
6/27/2025
|
8,537
|
|
8,452
|
|
8,537
|
|
0.89
|
|
||||||||||||||
|
Ethos Veterinary Health LLC
|
^+
|
(2) (3) (13)
|
Consumer Services
|
L + 4.75%
|
6.45%
|
5/17/2019
|
5/15/2026
|
10,869
|
|
10,744
|
|
10,807
|
|
1.13
|
|
||||||||||||||
|
EvolveIP, LLC
|
^+*
|
(2) (3)
|
Telecommunications
|
L + 5.75%
|
7.45%
|
11/26/2019
|
6/7/2023
|
34,420
|
|
33,923
|
|
34,420
|
|
3.60
|
|
||||||||||||||
|
Frontline Technologies Holdings, LLC
|
^*
|
(2) (3)
|
Software
|
L + 5.75%
|
7.85%
|
9/18/2017
|
9/18/2023
|
48,242
|
|
47,949
|
|
48,705
|
|
5.09
|
|
||||||||||||||
|
FWR Holding Corporation
|
^+*
|
(2) (3) (13)
|
Beverage, Food & Tobacco
|
L + 5.50%
|
7.29%
|
8/21/2017
|
8/21/2023
|
48,630
|
|
47,950
|
|
48,393
|
|
5.06
|
|
||||||||||||||
|
Green Energy Partners/Stonewall, LLC
|
+*
|
(2) (3)
|
Energy: Electricity
|
L + 5.50%
|
7.60%
|
6/26/2015
|
11/10/2021
|
19,550
|
|
19,374
|
|
18,034
|
|
1.89
|
|
||||||||||||||
|
GRO Sub Holdco, LLC (Grand Rapids)
|
^+*
|
(2) (3) (13)
|
Healthcare & Pharmaceuticals
|
L + 6.00%
|
8.10%
|
2/28/2018
|
2/22/2023
|
6,465
|
|
6,380
|
|
6,085
|
|
0.64
|
|
||||||||||||||
|
Hummel Station, LLC
|
+*
|
(2) (3)
|
Energy: Electricity
|
L + 6.00%
|
7.70%
|
2/3/2016
|
10/27/2022
|
14,641
|
|
14,169
|
|
12,896
|
|
1.35
|
|
||||||||||||||
|
Hydrofarm, LLC
|
^
|
(2) (3)
|
Wholesale
|
L+10.00% (30% Cash / 70% PIK)
|
11.91%
|
5/15/2017
|
5/12/2022
|
21,556
|
|
21,254
|
|
13,647
|
|
1.43
|
|
||||||||||||||
|
iCIMS, Inc.
|
^
|
(2) (3) (13)
|
Software
|
L + 6.50%
|
8.29%
|
9/12/2018
|
9/12/2024
|
23,930
|
|
23,507
|
|
23,927
|
|
2.50
|
|
||||||||||||||
|
Innovative Business Services, LLC
|
^*
|
(2) (3) (13)
|
High Tech Industries
|
L + 5.50%
|
7.53%
|
4/5/2018
|
4/5/2023
|
16,143
|
|
15,782
|
|
15,880
|
|
1.66
|
|
||||||||||||||
|
K2 Insurance Services, LLC
|
^+*
|
(2) (3) (13)
|
Banking, Finance, Insurance & Real Estate
|
L + 5.00%
|
7.19%
|
7/3/2019
|
7/1/2024
|
22,027
|
|
21,487
|
|
22,062
|
|
2.31
|
|
||||||||||||||
|
Kaseya Inc.
|
^
|
(2) (3) (13)
|
High Tech Industries
|
L + 5.50%, 1.00% PIK
|
8.41%
|
5/3/2019
|
5/2/2025
|
19,545
|
|
19,145
|
|
19,590
|
|
2.05
|
|
||||||||||||||
|
Legacy.com, Inc.
|
^
|
(2) (3) (11)
|
High Tech Industries
|
L + 9.98%
|
11.77%
|
3/20/2017
|
3/20/2023
|
17,080
|
|
16,832
|
|
16,325
|
|
1.71
|
|
||||||||||||||
|
Lifelong Learner Holdings, LLC
|
^*
|
(2) (3) (13)
|
Business Services
|
L + 5.75%
|
7.51%
|
10/18/2019
|
10/18/2026
|
23,523
|
|
22,971
|
|
23,240
|
|
2.43
|
|
||||||||||||||
|
Liqui-Box Holdings, Inc.
|
^
|
(2) (3)
|
Containers, Packaging & Glass
|
L + 4.50%
|
6.41%
|
6/3/2019
|
6/3/2024
|
—
|
|
(26
|
)
|
(37
|
)
|
—
|
|
||||||||||||||
|
Mailgun Technologies, Inc.
|
^
|
(2) (3) (13)
|
High Tech Industries
|
L + 5.00%
|
7.10%
|
3/26/2019
|
3/26/2025
|
11,853
|
|
11,607
|
|
11,655
|
|
1.22
|
|
||||||||||||||
|
National Carwash Solutions, Inc.
|
^+
|
(2) (3) (13)
|
Automotive
|
L + 6.00%
|
7.69%
|
8/7/2018
|
4/28/2023
|
9,511
|
|
9,342
|
|
9,428
|
|
0.99
|
|
||||||||||||||
|
National Technical Systems, Inc.
|
^+*
|
(2) (3) (13)
|
Aerospace & Defense
|
L + 6.25%
|
7.94%
|
6/26/2015
|
6/12/2021
|
27,950
|
|
27,801
|
|
27,920
|
|
2.92
|
|
||||||||||||||
|
NES Global Talent Finance US, LLC (United Kingdom)
|
+*
|
(2) (3) (7)
|
Energy: Oil & Gas
|
L + 5.50%
|
7.43%
|
5/9/2018
|
5/11/2023
|
9,890
|
|
9,762
|
|
9,763
|
|
1.02
|
|
||||||||||||||
|
Nexus Technologies, LLC
|
*
|
(2) (3)
|
High Tech Industries
|
L + 5.50%, 1.50% PIK
|
8.91%
|
12/11/2018
|
12/5/2023
|
6,172
|
|
6,119
|
|
5,621
|
|
0.59
|
|
||||||||||||||
|
NMI AcquisitionCo, Inc.
|
^+*
|
(2) (3) (13)
|
High Tech Industries
|
L + 5.75%
|
7.45%
|
9/6/2017
|
9/6/2022
|
50,067
|
|
49,471
|
|
49,888
|
|
5.22
|
|
||||||||||||||
92
TCG BDC, INC.
CONSOLIDATED SCHEDULE OF INVESTMENTS
As of December 31, 2019
(dollar amounts in thousands)
|
Investments—non-controlled/non-affiliated
(1)
|
Footnotes
|
Industry
|
Reference Rate & Spread
(2)
|
Interest Rate
(2)
|
Acquisition Date
|
Maturity Date
|
Par/ Principal Amount **
|
Amortized Cost
(4)
|
Fair Value
(5)
|
% of Net
Assets
|
|||||||||||||||||||
|
First Lien Debt (77.29%) (continued)
|
|||||||||||||||||||||||||||||
|
Northland Telecommunications Corporation
|
^*
|
(2) (3) (13)
|
Media: Broadcast & Subscription
|
L + 5.75%
|
7.46%
|
10/1/2018
|
10/1/2025
|
$
|
46,603
|
|
$
|
45,916
|
|
$
|
46,529
|
|
4.86
|
%
|
|||||||||||
|
Paramit Corporation
|
+*
|
(2) (3)
|
Capital Equipment
|
L + 4.50%
|
6.22%
|
5/3/2019
|
5/3/2025
|
6,298
|
|
6,241
|
|
6,268
|
|
0.66
|
|
||||||||||||||
|
PF Growth Partners, LLC
|
^+*
|
(2) (3) (13)
|
Hotel, Gaming & Leisure
|
L + 5.00%
|
6.70%
|
7/1/2019
|
7/11/2025
|
7,161
|
|
7,045
|
|
7,135
|
|
0.75
|
|
||||||||||||||
|
Plano Molding Company, LLC
|
^
|
(2) (3)
|
Hotel, Gaming & Leisure
|
L + 7.50%
|
9.20%
|
5/1/2015
|
5/12/2021
|
14,752
|
|
14,645
|
|
14,085
|
|
1.47
|
|
||||||||||||||
|
PPC Flexible Packaging, LLC
|
+*
|
(2) (3) (13)
|
Containers, Packaging & Glass
|
L + 5.50%
|
7.19%
|
11/23/2018
|
11/23/2024
|
13,591
|
|
13,404
|
|
13,464
|
|
1.41
|
|
||||||||||||||
|
PPT Management Holdings, LLC
|
^
|
(2) (3)
|
Healthcare & Pharmaceuticals
|
L + 6.00%, 0.75% PIK
|
8.66%
|
12/15/2016
|
12/16/2022
|
27,744
|
|
27,627
|
|
23,155
|
|
2.42
|
|
||||||||||||||
|
Pretium Packaging, LLC
|
^
|
(2) (3)
|
Containers, Packaging & Glass
|
L + 5.00%
|
6.91%
|
8/15/2019
|
11/14/2023
|
7,700
|
|
7,631
|
|
7,700
|
|
0.81
|
|
||||||||||||||
|
PricewaterhouseCoopers Public Sector LLP
|
^
|
(2) (3) (13)
|
Aerospace & Defense
|
L + 3.25%
|
5.16%
|
5/1/2018
|
5/1/2023
|
—
|
|
(105
|
)
|
(46
|
)
|
—
|
|
||||||||||||||
|
Product Quest Manufacturing, LLC
|
^
|
(2) (3) (9) (13)
|
Containers, Packaging & Glass
|
L + 6.75%
|
5.75%
|
9/21/2017
|
3/31/2020
|
840
|
|
840
|
|
840
|
|
0.09
|
|
||||||||||||||
|
Propel Insurance Agency, LLC
|
^
|
(2) (3)
|
Banking, Finance, Insurance & Real Estate
|
L + 4.25%
|
6.35%
|
6/1/2018
|
6/1/2024
|
2,363
|
|
2,347
|
|
2,353
|
|
0.25
|
|
||||||||||||||
|
QW Holding Corporation (Quala)
|
^+*
|
(2) (3) (13)
|
Environmental Industries
|
L + 5.75%
|
7.73%
|
8/31/2016
|
8/31/2022
|
43,358
|
|
42,802
|
|
43,106
|
|
4.51
|
|
||||||||||||||
|
Redwood Services Group, LLC
|
^
|
(2) (3)
|
High Tech Industries
|
L + 6.00%
|
7.91%
|
11/13/2018
|
6/6/2023
|
8,427
|
|
8,363
|
|
8,342
|
|
0.87
|
|
||||||||||||||
|
Riveron Acquisition Holdings, Inc.
|
^+*
|
(2) (3)
|
Banking, Finance, Insurance & Real Estate
|
L + 6.00%
|
7.91%
|
5/22/2019
|
5/22/2025
|
19,968
|
|
19,605
|
|
19,587
|
|
2.05
|
|
||||||||||||||
|
RSC Acquisition, Inc.
|
^
|
(2) (3) (13)
|
Banking, Finance, Insurance & Real Estate
|
L + 5.50%
|
7.41%
|
11/1/2019
|
11/1/2026
|
11,594
|
|
11,222
|
|
11,449
|
|
1.20
|
|
||||||||||||||
|
Sapphire Convention, Inc. (Smart City)
|
*+^
|
(2) (3) (13)
|
Telecommunications
|
L + 5.25%
|
7.27%
|
11/20/2018
|
11/20/2025
|
28,577
|
|
28,009
|
|
28,329
|
|
2.96
|
|
||||||||||||||
|
Smile Doctors, LLC
|
^*+
|
(2) (3) (13)
|
Healthcare & Pharmaceuticals
|
L + 6.00%
|
8.07%
|
10/6/2017
|
10/6/2022
|
22,227
|
|
22,136
|
|
21,996
|
|
2.30
|
|
||||||||||||||
|
Sovos Brands Intermediate, Inc.
|
+*
|
(2) (3)
|
Beverage, Food & Tobacco
|
L + 5.00%
|
7.20%
|
11/16/2018
|
11/20/2025
|
19,899
|
|
19,714
|
|
19,750
|
|
2.06
|
|
||||||||||||||
|
SPay, Inc.
|
^+*
|
(2) (3) (13)
|
Hotel, Gaming & Leisure
|
L + 5.75%
|
7.46%
|
6/15/2018
|
6/17/2024
|
20,512
|
|
20,179
|
|
18,694
|
|
1.95
|
|
||||||||||||||
|
Superior Health Linens, LLC
|
^+*
|
(2) (3) (13)
|
Business Services
|
L + 7.50%, 0.50% PIK
|
9.91%
|
9/30/2016
|
9/30/2021
|
21,805
|
|
21,666
|
|
19,933
|
|
2.08
|
|
||||||||||||||
|
Surgical Information Systems, LLC
|
^+*
|
(2) (3) (11)
|
High Tech Industries
|
L + 4.50%
|
7.47%
|
4/24/2017
|
4/24/2023
|
26,168
|
|
26,007
|
|
25,715
|
|
2.69
|
|
||||||||||||||
|
T2 Systems, Inc.
|
^+*
|
(2) (3) (13)
|
Transportation: Consumer
|
L + 6.75%
|
8.85%
|
9/28/2016
|
9/28/2022
|
35,648
|
|
35,159
|
|
35,648
|
|
3.73
|
|
||||||||||||||
|
Tank Holding Corp.
|
^
|
(2) (3) (13)
|
Capital Equipment
|
L + 4.00%
|
5.76%
|
3/26/2019
|
3/26/2024
|
—
|
|
—
|
|
—
|
|
—
|
|
||||||||||||||
|
The Leaders Romans Bidco Limited (United Kingdom)
|
^
|
(2) (3) (7)
|
Banking, Finance, Insurance & Real Estate
|
L + 6.75%, 3.50% PIK
|
11.01%
|
7/23/2019
|
6/30/2024
|
£
|
19,577
|
|
24,865
|
|
26,531
|
|
2.77
|
|
|||||||||||||
|
Transform SR Holdings, LLC
|
^
|
(2) (3)
|
Retail
|
L + 7.25%
|
9.18%
|
2/11/2019
|
2/12/2024
|
19,050
|
|
18,887
|
|
18,860
|
|
1.97
|
|
||||||||||||||
|
Trump Card, LLC
|
^+*
|
(2) (3) (13)
|
Transportation: Cargo
|
L + 5.50%
|
7.63%
|
6/26/2018
|
4/21/2022
|
7,918
|
|
7,881
|
|
7,869
|
|
0.82
|
|
||||||||||||||
93
TCG BDC, INC.
CONSOLIDATED SCHEDULE OF INVESTMENTS
As of December 31, 2019
(dollar amounts in thousands)
|
Investments—non-controlled/non-affiliated
(1)
|
Footnotes
|
Industry
|
Reference Rate & Spread
(2)
|
Interest Rate
(2)
|
Acquisition Date
|
Maturity Date
|
Par/ Principal Amount **
|
Amortized Cost
(4)
|
Fair Value
(5)
|
% of Net
Assets |
|||||||||||||||||||
|
First Lien Debt (77.29%) (continued)
|
|||||||||||||||||||||||||||||
|
TSB Purchaser, Inc. (Teaching Strategies, LLC)
|
^+*
|
(2) (3) (13)
|
Media: Advertising, Printing & Publishing
|
L + 6.00%
|
8.10%
|
5/14/2018
|
5/14/2024
|
$
|
28,294
|
|
$
|
27,726
|
|
$
|
28,105
|
|
2.94
|
|
|||||||||||
|
Turbo Buyer, Inc.
|
^
|
(2) (3) (13)
|
Automotive
|
L + 6.00%
|
7.69%
|
12/2/2019
|
12/2/2025
|
27,897
|
|
27,033
|
|
27,439
|
|
2.87
|
|
||||||||||||||
|
Tweddle Group, Inc.
|
^
|
(2) (3)
|
Media: Advertising, Printing & Publishing
|
L + 4.50%
|
6.20%
|
9/17/2018
|
9/17/2023
|
1,908
|
|
1,885
|
|
1,859
|
|
0.19
|
|
||||||||||||||
|
U.S. Acute Care Solutions, LLC
|
+*
|
(2) (3)
|
Healthcare & Pharmaceuticals
|
L + 5.00%
|
6.91%
|
2/21/2019
|
5/15/2021
|
4,265
|
|
4,230
|
|
4,053
|
|
0.42
|
|
||||||||||||||
|
Unifrutti Financing PLC (Cyprus)
|
^
|
(2) (3) (7)
|
Beverage, Food & Tobacco
|
7.50%, 1.00% PIK
|
8.50%
|
9/15/2019
|
9/15/2026
|
€
|
4,530
|
|
4,746
|
|
4,836
|
|
0.51
|
|
|||||||||||||
|
USLS Acquisition, Inc.
|
^*
|
(2) (3) (13)
|
Business Services
|
L + 5.75%
|
7.85%
|
11/30/2018
|
11/30/2024
|
22,139
|
|
21,741
|
|
21,674
|
|
2.27
|
|
||||||||||||||
|
VRC Companies, LLC
|
^+*
|
(2) (3) (13)
|
Business Services
|
L + 6.50%
|
8.21%
|
3/31/2017
|
3/31/2023
|
57,164
|
|
56,674
|
|
57,106
|
|
5.97
|
|
||||||||||||||
|
Westfall Technik, Inc.
|
^
|
(2) (3) (13)
|
Chemicals, Plastics & Rubber
|
L + 5.75%
|
7.66%
|
9/13/2018
|
9/13/2024
|
27,973
|
|
27,432
|
|
26,962
|
|
2.82
|
|
||||||||||||||
|
WP CPP Holdings, LLC (CPP)
|
^
|
(2) (3)
|
Aerospace & Defense
|
L + 3.75%
|
5.66%
|
7/18/2019
|
4/30/2025
|
20,000
|
|
19,817
|
|
19,826
|
|
2.07
|
|
||||||||||||||
|
Zemax Software Holdings, LLC
|
^*
|
(2) (3) (13)
|
Software
|
L + 5.75%
|
7.85%
|
6/25/2018
|
6/25/2024
|
10,146
|
|
10,013
|
|
10,087
|
|
1.05
|
|
||||||||||||||
|
Zenith Merger Sub, Inc.
|
^
|
(2) (3) (13)
|
Business Services
|
L + 5.25%
|
7.35%
|
12/13/2017
|
12/13/2023
|
16,530
|
|
16,321
|
|
16,405
|
|
1.72
|
|
||||||||||||||
|
First Lien Debt Total
|
$
|
1,725,479
|
|
$
|
1,707,292
|
|
$
|
1,641,653
|
|
171.66
|
%
|
||||||||||||||||||
|
Second Lien Debt (11.04%)
|
|||||||||||||||||||||||||||||
|
Access CIG, LLC
|
*
|
(2) (3)
|
Business Services
|
L + 7.75%
|
9.44%
|
2/14/2018
|
2/27/2026
|
$
|
2,700
|
|
$
|
2,687
|
|
$
|
2,681
|
|
0.28
|
%
|
|||||||||||
|
Aimbridge Acquisition Co., Inc.
|
^*
|
(2) (3)
|
Hotel, Gaming & Leisure
|
L + 7.50%
|
9.19%
|
2/1/2019
|
2/1/2027
|
9,241
|
|
9,089
|
|
9,160
|
|
0.96
|
|
||||||||||||||
|
AQA Acquisition Holding, Inc.
|
^
|
(2) (3)
|
High Tech Industries
|
L + 8.00%
|
10.09%
|
10/1/2018
|
5/24/2024
|
40,000
|
|
39,670
|
|
39,740
|
|
4.15
|
|
||||||||||||||
|
Brave Parent Holdings, Inc.
|
^*
|
(2) (3)
|
Software
|
L + 7.50%
|
9.43%
|
10/3/2018
|
4/19/2026
|
19,062
|
|
18,660
|
|
18,261
|
|
1.91
|
|
||||||||||||||
|
Higginbotham Insurance Agency, Inc.
|
^
|
(2) (3)
|
Banking, Finance, Insurance & Real Estate
|
L + 7.50%
|
9.20%
|
12/3/2019
|
12/19/2025
|
2,500
|
|
2,475
|
|
2,493
|
|
0.26
|
|
||||||||||||||
|
Jazz Acquisition, Inc.
|
^
|
(2) (3)
|
Aerospace & Defense
|
L + 8.00%
|
10.10%
|
6/13/2019
|
6/18/2027
|
23,450
|
|
23,117
|
|
23,225
|
|
2.43
|
|
||||||||||||||
|
Le Tote, Inc.
|
^
|
(2) (3)
|
Retail
|
L + 6.75%
|
8.66%
|
11/8/2019
|
11/8/2024
|
7,143
|
|
6,969
|
|
6,964
|
|
0.73
|
|
||||||||||||||
|
Outcomes Group Holdings, Inc.
|
^*
|
(2) (3)
|
Business Services
|
L + 7.50%
|
9.41%
|
10/23/2018
|
10/26/2026
|
4,500
|
|
4,490
|
|
4,487
|
|
0.47
|
|
||||||||||||||
|
Pathway Vet Alliance, LLC
|
^
|
(2) (3) (13)
|
Consumer Services
|
L + 8.50%
|
10.22%
|
11/14/2019
|
12/23/2025
|
8,050
|
|
7,814
|
|
8,074
|
|
0.84
|
|
||||||||||||||
|
Pharmalogic Holdings Corp.
|
^
|
(2) (3)
|
Healthcare & Pharmaceuticals
|
L + 8.00%
|
9.70%
|
6/7/2018
|
12/11/2023
|
800
|
|
797
|
|
796
|
|
0.08
|
|
||||||||||||||
|
Quartz Holding Company (QuickBase, Inc.)
|
^
|
(2) (3)
|
Software
|
L + 8.00%
|
9.71%
|
4/2/2019
|
4/2/2027
|
11,900
|
|
11,677
|
|
11,662
|
|
1.22
|
|
||||||||||||||
|
Reladyne, Inc.
|
^+*
|
(2) (3) (13)
|
Wholesale
|
L + 9.50%
|
11.60%
|
4/19/2018
|
1/21/2023
|
12,242
|
|
12,080
|
|
12,234
|
|
1.28
|
|
||||||||||||||
|
Tank Holding Corp.
|
^*
|
(2) (3)
|
Capital Equipment
|
L + 8.25%
|
11.04%
|
3/26/2019
|
3/26/2027
|
37,380
|
|
36,771
|
|
37,223
|
|
3.89
|
|
||||||||||||||
|
Ultimate Baked Goods MIDCO, LLC (Rise Baking)
|
^
|
(2) (3)
|
Beverage, Food & Tobacco
|
L + 8.00%
|
9.70%
|
8/9/2018
|
8/9/2026
|
8,333
|
|
8,187
|
|
8,243
|
|
0.86
|
|
||||||||||||||
|
Watchfire Enterprises, Inc.
|
^
|
(2) (3)
|
Media: Advertising, Printing & Publishing
|
L + 8.00%
|
9.95%
|
10/2/2013
|
10/2/2021
|
7,000
|
|
6,966
|
|
6,998
|
|
0.73
|
|
||||||||||||||
|
WP CPP Holdings, LLC (CPP)
|
^*
|
(2) (3)
|
Aerospace & Defense
|
L + 7.75%
|
9.68%
|
7/18/2019
|
4/30/2026
|
39,500
|
|
39,125
|
|
38,833
|
|
4.06
|
|
||||||||||||||
94
TCG BDC, INC.
CONSOLIDATED SCHEDULE OF INVESTMENTS
As of December 31, 2019
(dollar amounts in thousands)
|
Investments—non-controlled/non-affiliated
(1)
|
Footnotes
|
Industry
|
Reference Rate & Spread
(2)
|
Interest Rate
(2)
|
Acquisition Date
|
Maturity Date
|
Par/ Principal Amount **
|
Amortized Cost
(4)
|
Fair Value
(5)
|
% of Net
Assets |
|||||||||||||||||||
|
Second Lien Debt (11.04%) (continued)
|
|||||||||||||||||||||||||||||
|
Zywave, Inc.
|
^
|
(2) (3)
|
High Tech Industries
|
L + 9.00%
|
10.94%
|
11/18/2016
|
11/17/2023
|
$
|
3,468
|
|
$
|
3,432
|
|
$
|
3,458
|
|
0.36
|
|
|||||||||||
|
Second Lien Debt Total
|
$
|
237,269
|
|
$
|
234,006
|
|
$
|
234,532
|
|
24.51
|
%
|
||||||||||||||||||
|
Investments—non-controlled/non-affiliated (1)
|
Footnotes
|
Industry
|
Acquisition Date
|
Shares/ Units
|
Cost
|
Fair Value
(5)
|
Percentage
of Net Assets
|
|||||||||||||||
|
Equity Investments (0.98%)
|
||||||||||||||||||||||
|
ANLG Holdings, LLC
|
^
|
(6)
|
Healthcare & Pharmaceuticals
|
6/22/2018
|
880
|
|
$
|
880
|
|
$
|
973
|
|
0.10
|
%
|
||||||||
|
Avenu Holdings, LLC
|
^
|
(6)
|
Sovereign & Public Finance
|
9/28/2018
|
172
|
|
172
|
|
154
|
|
0.02
|
|
||||||||||
|
Chartis Holding, LLC
|
^
|
(6)
|
Business Services
|
5/1/2019
|
433
|
|
433
|
|
589
|
|
0.06
|
|
||||||||||
|
CIP Revolution Holdings, LLC
|
^
|
(6)
|
Media: Advertising, Printing & Publishing
|
8/19/2016
|
318
|
|
318
|
|
444
|
|
0.05
|
|
||||||||||
|
Cority Software Inc. (Canada)
|
^
|
(6)
|
Software
|
7/2/2019
|
250
|
|
250
|
|
306
|
|
0.03
|
|
||||||||||
|
DecoPac, Inc.
|
^
|
(6)
|
Non-durable Consumer Goods
|
9/29/2017
|
1,500
|
|
1,500
|
|
1,999
|
|
0.21
|
|
||||||||||
|
Derm Growth Partners III, LLC (Dermatology Associates)
|
^
|
(6)
|
Healthcare & Pharmaceuticals
|
5/31/2016
|
1,000
|
|
1,000
|
|
—
|
|
—
|
|
||||||||||
|
GRO Sub Holdco, LLC (Grand Rapids)
|
^
|
(6)
|
Healthcare & Pharmaceuticals
|
3/29/2018
|
500
|
|
500
|
|
137
|
|
0.01
|
|
||||||||||
|
K2 Insurance Services, LLC
|
^
|
(6)
|
Banking, Finance, Insurance & Real Estate
|
7/3/2019
|
433
|
|
433
|
|
486
|
|
0.05
|
|
||||||||||
|
Legacy.com, Inc.
|
^
|
(6)
|
High Tech Industries
|
3/20/2017
|
1,500
|
|
1,500
|
|
783
|
|
0.08
|
|
||||||||||
|
Mailgun Technologies, Inc.
|
^
|
(6)
|
High Tech Industries
|
3/26/2019
|
424
|
|
424
|
|
605
|
|
0.06
|
|
||||||||||
|
North Haven Goldfinch Topco, LLC
|
^
|
(6)
|
Containers, Packaging & Glass
|
6/18/2018
|
2,315
|
|
$
|
2,315
|
|
$
|
2,542
|
|
0.27
|
%
|
||||||||
|
Paramit Corporation
|
^
|
(6)
|
Capital Equipment
|
6/17/2019
|
150
|
|
500
|
|
501
|
|
0.05
|
|
||||||||||
|
PPC Flexible Packaging, LLC
|
^
|
(6)
|
Containers, Packaging & Glass
|
2/1/2019
|
965
|
|
965
|
|
1,174
|
|
0.12
|
|
||||||||||
|
Rough Country, LLC
|
^
|
(6)
|
Durable Consumer Goods
|
5/25/2017
|
755
|
|
755
|
|
1,225
|
|
0.13
|
|
||||||||||
|
SiteLock Group Holdings, LLC
|
^
|
(6)
|
High Tech Industries
|
4/5/2018
|
446
|
|
446
|
|
587
|
|
0.06
|
|
||||||||||
|
T2 Systems Parent Corporation
|
^
|
(6)
|
Transportation: Consumer
|
9/28/2016
|
556
|
|
556
|
|
628
|
|
0.07
|
|
||||||||||
|
Tailwind HMT Holdings Corp.
|
^
|
(6)
|
Energy: Oil & Gas
|
11/17/2017
|
20
|
|
2,000
|
|
2,211
|
|
0.23
|
|
||||||||||
|
Tank Holding Corp.
|
^
|
(6)
|
Capital Equipment
|
3/26/2019
|
850
|
|
850
|
|
1,035
|
|
0.11
|
|
||||||||||
|
Turbo Buyer, Inc.
|
^
|
(6)
|
Automotive
|
12/2/2019
|
1,925
|
|
1,925
|
|
1,925
|
|
0.20
|
|
||||||||||
|
Tweddle Holdings, Inc.
|
^*
|
(6)
|
Media: Advertising, Printing & Publishing
|
9/17/2018
|
17
|
|
—
|
|
—
|
|
—
|
|
||||||||||
|
USLS Acquisition, Inc.
|
^
|
(6)
|
Business Services
|
11/30/2018
|
641
|
|
641
|
|
720
|
|
0.08
|
|
||||||||||
|
Zenith American Holding, Inc.
|
^
|
(6)
|
Business Services
|
12/13/2017
|
1,564
|
|
782
|
|
1,490
|
|
0.16
|
|
||||||||||
|
Zillow Topco LP
|
^
|
(6)
|
Software
|
6/25/2018
|
313
|
|
312
|
|
358
|
|
0.04
|
|
||||||||||
|
Equity Investments Total
|
$
|
19,457
|
|
$
|
20,872
|
|
2.19
|
%
|
||||||||||||||
|
Total investments—non-controlled/non-affiliated
|
$
|
1,960,755
|
|
$
|
1,897,057
|
|
198.36
|
%
|
||||||||||||||
95
TCG BDC, INC.
CONSOLIDATED SCHEDULE OF INVESTMENTS
As of December 31, 2019
(dollar amounts in thousands)
|
Investments—controlled/affiliated
|
Footnotes
|
Industry
|
Reference Rate & Spread
(2)
|
Interest Rate
(2)
|
Acquisition Date
|
Maturity Date
|
Par/ Principal Amount **
|
Amortized Cost
(4)
|
Fair
Value
(5)
|
% of Net
Assets
|
|||||||||||||||||||
|
First Lien Debt (1.01%)
|
|||||||||||||||||||||||||||||
|
SolAero Technologies Corp. (A1 Term Loan)
|
^
|
(2) (3) (9) (10)
|
Telecommunications
|
L + 8.00% (100% PIK)
|
9.91%
|
4/12/2019
|
10/12/2022
|
$
|
3,166
|
|
$
|
3,166
|
|
$
|
3,166
|
|
0.33
|
%
|
|||||||||||
|
SolAero Technologies Corp. (A2 Term Loan)
|
^
|
(2) (3) (9) (10)
|
Telecommunications
|
L + 8.00% (100% PIK)
|
9.91%
|
4/12/2019
|
10/12/2022
|
8,707
|
|
8,707
|
|
8,707
|
|
0.91
|
|
||||||||||||||
|
SolAero Technologies Corp. (Priority Term Loan)
|
^
|
(2) (3) (10) (13)
|
Telecommunications
|
L + 6.00%
|
7.91%
|
4/12/2019
|
10/12/2022
|
9,612
|
|
9,507
|
|
9,612
|
|
1.00
|
|
||||||||||||||
|
First Lien Debt Total
|
$
|
21,485
|
|
$
|
21,380
|
|
$
|
21,485
|
|
2.24
|
%
|
||||||||||||||||||
|
Investments—controlled/affiliated
|
Footnotes
|
Industry
|
Acquisition Date
|
Shares/ Units
|
Cost
|
Fair
Value (5) |
% of Net Assets
|
|||||||||||||||
|
—%
|
||||||||||||||||||||||
|
SolAero Technologies Corp.
|
^
|
(6) (10)
|
Telecommunications
|
4/12/2019
|
3
|
|
$
|
2,815
|
|
$
|
826
|
|
0.09
|
%
|
||||||||
|
Equity Investments Total
|
$
|
2,815
|
|
$
|
826
|
|
0.41
|
%
|
||||||||||||||
|
Investments—controlled/affiliated
|
Industry
|
Reference Rate & Spread
(2)
|
Interest Rate
(2)
|
Acquisition Date
|
Maturity Date
|
Par Amount/ LLC Interest
|
Cost
|
Fair Value
(7)
|
% of Net Assets
|
|||||||||||||||||||||
|
Investment Fund (9.63%)
|
||||||||||||||||||||||||||||||
|
Middle Market Credit Fund, Mezzanine Loan
|
^
|
(2) (7) (8) (10)
|
Investment Fund
|
L + 9.00%
|
10.97%
|
6/30/2016
|
5/18/2021
|
$
|
93,000
|
|
$
|
93,000
|
|
$
|
93,000
|
|
9.72
|
%
|
||||||||||||
|
Middle Market Credit Fund, LLC, Subordinated Loan and Member's Interest
|
^
|
(7) (10)
|
Investment Fund
|
N/A
|
0.001%
|
2/29/2016
|
3/1/2021
|
123,500
|
|
123,501
|
|
111,596
|
|
11.67
|
%
|
|||||||||||||||
|
Investment Fund Total
|
$
|
216,500
|
|
$
|
216,501
|
|
$
|
204,596
|
|
21.39
|
%
|
|||||||||||||||||||
|
Total investments—controlled/affiliated
|
$
|
237,988
|
|
$
|
240,696
|
|
$
|
226,907
|
|
24.04
|
%
|
|||||||||||||||||||
|
Total investments
|
$
|
2,201,002
|
|
$
|
2,201,451
|
|
$
|
2,123,964
|
|
222.4
|
%
|
|||||||||||||||||||
^ Denotes that all or a portion of the assets are owned by TCG BDC, Inc. (together with its consolidated subsidiaries, “we,” “us,” “our,” “TCG BDC” or the “Company”). The Company has entered into a senior secured revolving credit facility (as amended, the “Credit Facility”). The lenders of the Credit Facility have a first lien security interest in substantially all of the portfolio investments held by the Company (see Note 6, Borrowings). Accordingly, such assets are not available to creditors of TCG BDC SPV LLC (the “SPV”) or Carlyle Direct Lending CLO 2015-1R LLC (formerly known as Carlyle GMS Finance MM CLO 2015-1 LLC) (the “2015-1 Issuer”).
+ Denotes that all or a portion of the assets are owned by the Company’s wholly owned subsidiary, the SPV. The SPV has entered into a senior secured revolving credit facility (as amended, the “SPV Credit Facility” and, together with the Credit Facility, the “Facilities”). The lenders of the SPV Credit Facility have a first lien security interest in substantially all of the assets of the SPV (see Note 6, Borrowings). Accordingly, such assets are not available to creditors of the Company or the 2015-1 Issuer.
* Denotes that all or a portion of the assets are owned by the Company's wholly owned subsidiary, the 2015-1 Issuer, and secure the notes issued in connection with a term debt securitization completed by the Company on June 26, 2015 (see Note 7, Notes Payable). Accordingly, such assets are not available to the creditors of the Company or the SPV.
** Par amount is denominated in USD ("$") unless otherwise noted, as denominated in Euro (“€”) or British Pound (“£”)
|
(1)
|
Unless otherwise indicated, issuers of debt and equity investments held by the Company are domiciled in the United States. Under the Investment Company Act of 1940, as amended (together with the rules and regulations promulgated thereunder, the “Investment Company Act”), the Company would be deemed to “control” a portfolio company if the Company owned more than 25% of its outstanding voting securities and/or held the power to exercise control over the management or policies of the portfolio company. As of
December 31, 2019
, the Company does not “control” any of these portfolio companies.
|
96
TCG BDC, INC.
CONSOLIDATED SCHEDULE OF INVESTMENTS
As of December 31, 2019
(dollar amounts in thousands)
Under the Investment Company Act, the Company would be deemed an “affiliated person” of a portfolio company if the Company owns 5% or more of the portfolio company’s outstanding voting securities. As of
December 31, 2019
, the Company is not an “affiliated person” of any of these portfolio companies. Certain portfolio company investments are subject to contractual restrictions on sales.
|
(2)
|
Variable rate loans to the portfolio companies bear interest at a rate that is determined by reference to either LIBOR (“L”) or an alternate base rate (commonly based on the Federal Funds Rate or the U.S. Prime Rate), which generally resets quarterly. For each such loan, the Company has indicated the reference rate used and provided the spread and the interest rate in effect as of
December 31, 2019
. As of
December 31, 2019
, the reference rates for our variable rate loans were the 30-day LIBOR at
1.75%
, the 90-day LIBOR at
1.91%
and the 180-day LIBOR at
1.91%
.
|
|
(3)
|
Loan includes interest rate floor feature, which is generally 1.00%.
|
|
(4)
|
Amortized cost represents original cost, including origination fees and upfront fees received that are deemed to be an adjustment to yield, adjusted for the accretion/amortization of discounts/premiums, as applicable, on debt investments using the effective interest method.
|
|
(5)
|
Fair value is determined in good faith by or under the direction of the Board of Directors of the Company (see Note 2, Significant Accounting Policies, and Note 3, Fair Value Measurements), pursuant to the Company’s valuation policy. The fair value of all first lien and second lien debt investments, equity investments and the investment fund was determined using significant unobservable inputs.
|
|
(6)
|
Security acquired in transaction exempt from registration under the Securities Act of 1933, as amended (the “Securities Act”), and may be deemed to be “restricted securities” under the Securities Act, unless otherwise noted. As of
December 31, 2019
, the aggregate fair value of these securities is
$21,698
, or
2.60%
of the Company’s net assets.
|
|
(7)
|
The Company has determined the indicated investments are non-qualifying assets under Section 55(a) of the Investment Company Act. Under the Investment Company Act, the Company may not acquire any non-qualifying assets unless, at the time such acquisition is made, qualifying assets represent at least 70% of the Company’s total assets.
|
|
(8)
|
Represents a corporate mezzanine loan, which is subordinated to senior secured term loans of the portfolio company/investment fund.
|
|
(9)
|
Loan was on non-accrual status as of
December 31, 2019
.
|
|
(10)
|
Under the Investment Company Act, the Company is deemed to be an “affiliated person” of and “control” this investment fund because the Company owns more than 25% of the investment fund’s outstanding voting securities and/or has the power to exercise control over management or policies of such investment fund. See Note 5, Middle Market Credit Fund, LLC, for more details. Transactions related to investments in controlled affiliates for the year ended
December 31, 2019
, were as follows:
|
|
Investments—controlled/affiliated
|
Fair Value as of December 31, 2018
|
Additions/Purchases
|
Reductions/Sales/ Paydowns
|
Net Realized Gain (Loss)
|
Net Change in Unrealized Appreciation (Depreciation)
|
Fair Value as of December 31, 2019
|
Dividend and Interest Income
|
||||||||||||||||||||
|
Middle Market Credit Fund, LLC, Mezzanine Loan
|
$
|
112,000
|
|
$
|
126,200
|
|
$
|
(145,200
|
)
|
$
|
—
|
|
$
|
—
|
|
$
|
93,000
|
|
$
|
12,181
|
|
||||||
|
Middle Market Credit Fund, LLC, Subordinated Loan and Member’s Interest
|
110,295
|
|
5,500
|
|
—
|
|
—
|
|
(4,199
|
)
|
111,596
|
|
15,750
|
|
|||||||||||||
|
Total investments—controlled/affiliated
|
$
|
222,295
|
|
$
|
131,700
|
|
$
|
(145,200
|
)
|
$
|
—
|
|
$
|
(4,199
|
)
|
$
|
204,596
|
|
$
|
27,931
|
|
||||||
|
Investments—controlled/affiliated
|
Fair Value as of December 31, 2018
|
Additions/Purchases
|
Reductions/Sales/ Paydowns
|
Net Realized Gain (Loss)
|
Net Change in Unrealized Appreciation (Depreciation)
|
Fair Value as of December 31, 2019
|
Dividend and Interest Income
|
||||||||||||||||||||
|
SolAero Technologies Corp.
|
$
|
17,968
|
|
$
|
—
|
|
$
|
(18,319
|
)
|
$
|
(9,091
|
)
|
$
|
9,442
|
|
$
|
—
|
|
$
|
—
|
|
||||||
|
SolAero Technologies Corp. (Priority Term Loan)
|
—
|
|
9,630
|
|
—
|
|
—
|
|
—
|
|
9,630
|
|
226
|
|
|||||||||||||
|
SolAero Technologies Corp. (A1 Term Loan)
|
—
|
|
3,166
|
|
—
|
|
—
|
|
—
|
|
3,166
|
|
—
|
|
|||||||||||||
|
SolAero Technologies Corp. (A2 Term Loan)
|
—
|
|
8,707
|
|
—
|
|
—
|
|
—
|
|
8,707
|
|
—
|
|
|||||||||||||
|
Solaero Technology Corp. (Equity)
|
—
|
|
2,815
|
|
—
|
|
—
|
|
(554
|
)
|
2,261
|
|
—
|
|
|||||||||||||
|
Total investments—controlled/affiliated
|
$
|
17,968
|
|
$
|
24,318
|
|
$
|
(18,319
|
)
|
$
|
(9,091
|
)
|
$
|
8,888
|
|
$
|
23,764
|
|
$
|
226
|
|
||||||
|
(11)
|
In addition to the interest earned based on the stated interest rate of this loan, which is the amount reflected in this schedule, the Company is entitled to receive additional interest as a result of an agreement among lenders as follows: Barnes & Noble, Inc. (1.83%), Dimensional Dental Management, LLC (4.87%), Legacy.com Inc. (3.73%) and Surgical Information Systems, LLC (1.13%) . Pursuant to the agreement among lenders in respect of this loan, this investment represents a first lien/last out loan, which has a secondary priority behind the first lien/first out loan with respect to principal, interest and other payments.
|
97
TCG BDC, INC.
CONSOLIDATED SCHEDULE OF INVESTMENTS
As of December 31, 2019
(dollar amounts in thousands)
|
(12)
|
Under the Investment Company Act, the Company is deemed an “affiliated person” of this portfolio company because the Company owns 5% or more of the portfolio company’s outstanding voting securities. Transactions related to investments in non-controlled affiliates for the year ended
December 31, 2019
, were as follows:
|
|
Investments—non-controlled/affiliated
|
Fair Value as of December 31, 2018
|
Purchases/ Paid-in-kind interest
|
Sales/ Paydowns
|
Net Accretion of Discount
|
Net Realized Gain (Loss)
|
Net Change in Unrealized Appreciation (Depreciation)
|
Fair Value as of December 31, 2019
|
Interest Income
|
|||||||||||||||||||||||
|
TwentyEighty, Inc. - Revolver
|
$
|
—
|
|
$
|
—
|
|
$
|
—
|
|
$
|
1
|
|
$
|
—
|
|
$
|
(1
|
)
|
$
|
—
|
|
$
|
—
|
|
|||||||
|
TwentyEighty, Inc. - (Term A Loans)
|
316
|
|
—
|
|
(415
|
)
|
1
|
|
101
|
|
(1
|
)
|
—
|
|
19
|
|
|||||||||||||||
|
TwentyEighty, Inc. - (Term B Loans)
|
6,855
|
|
230
|
|
(7,102
|
)
|
76
|
|
—
|
|
(59
|
)
|
—
|
|
498
|
|
|||||||||||||||
|
TwentyEighty, Inc. - (Term C Loans)
|
6,981
|
|
489
|
|
(7,397
|
)
|
179
|
|
—
|
|
(252
|
)
|
—
|
|
692
|
|
|||||||||||||||
|
TwentyEighty Investors LLC (Equity)
|
4,391
|
|
—
|
|
—
|
|
—
|
|
7,990
|
|
(4,391
|
)
|
—
|
|
—
|
|
|||||||||||||||
|
Total investments—non-controlled/affiliated
|
$
|
18,543
|
|
$
|
719
|
|
$
|
(14,914
|
)
|
$
|
257
|
|
$
|
8,091
|
|
$
|
(4,704
|
)
|
$
|
—
|
|
$
|
1,209
|
|
|||||||
|
(13)
|
As of
December 31, 2019
, the Company had the following unfunded commitments to fund delayed draw and revolving senior secured loans:
|
|
Investments—non-controlled/non-affiliated
|
Type
|
Unused Fee
|
Par/ Principal Amount
|
Fair Value
|
|||||||
|
First and Second Lien Debt—unfunded delayed draw and revolving term loans commitments
|
|||||||||||
|
Aero Operating, LLC (Dejana Industries, Inc.)
|
Revolver
|
1.00%
|
$
|
159
|
|
$
|
(3
|
)
|
|||
|
Airnov, Inc.
|
Revolver
|
0.50
|
1,250
|
|
(19
|
)
|
|||||
|
American Physician Partners, LLC
|
Revolver
|
0.50
|
1,500
|
|
(5
|
)
|
|||||
|
AMS Group HoldCo, LLC
|
Revolver
|
0.50
|
2,315
|
|
(25
|
)
|
|||||
|
Analogic Corporation
|
Revolver
|
0.50
|
3,029
|
|
—
|
|
|||||
|
Apptio, Inc.
|
Revolver
|
0.50
|
2,367
|
|
(19
|
)
|
|||||
|
BMS Holdings III Corp.
|
Delayed Draw
|
1.00
|
3,333
|
|
(10
|
)
|
|||||
|
Captive Resources Midco, LLC
|
Revolver
|
0.50
|
2,143
|
|
(9
|
)
|
|||||
|
Chartis Group, LLC
|
Revolver
|
0.50
|
2,401
|
|
(20
|
)
|
|||||
|
Chartis Group, LLC
|
Delayed Draw
|
0.50
|
6,402
|
|
(52
|
)
|
|||||
|
Chemical Computing Group ULC (Canada)
|
Revolver
|
0.50
|
903
|
|
(8
|
)
|
|||||
|
Comar Holding Company, LLC
|
Delayed Draw
|
1.00
|
5,136
|
|
(103
|
)
|
|||||
|
Comar Holding Company, LLC
|
Revolver
|
0.50
|
1,168
|
|
(23
|
)
|
|||||
|
Cority Software, Inc. (Canada)
|
Revolver
|
0.50
|
3,000
|
|
(60
|
)
|
|||||
|
DermaRite Industries, LLC
|
Revolver
|
0.50
|
807
|
|
(33
|
)
|
|||||
|
Dimensional Dental Management, LLC
|
Revolver
|
0.50
|
48
|
|
—
|
|
|||||
|
Ethos Veterinary Health, LLC
|
Delayed Draw
|
1.00
|
2,696
|
|
(12
|
)
|
|||||
|
Evolve IP
|
Revolver
|
0.50
|
2,941
|
|
—
|
|
|||||
|
Evolve IP
|
Delayed Draw
|
1.00
|
3,922
|
|
—
|
|
|||||
|
FWR Holding Corporation
|
Delayed Draw
|
1.00
|
87
|
|
—
|
|
|||||
|
FWR Holding Corporation
|
Revolver
|
0.50
|
667
|
|
(3
|
)
|
|||||
|
GRO Sub Holdco, LLC (Grand Rapids)
|
Revolver
|
0.50
|
$
|
1,071
|
|
$
|
(54
|
)
|
|||
98
TCG BDC, INC.
CONSOLIDATED SCHEDULE OF INVESTMENTS
As of December 31, 2019
(dollar amounts in thousands)
|
Investments—non-controlled/non-affiliated
|
Type
|
Unused Fee
|
Par/ Principal Amount
|
Fair Value
|
|||||||
|
iCIMS, Inc.
|
Revolver
|
0.50%
|
$
|
1,252
|
|
—
|
|
||||
|
Innovative Business Services, LLC
|
Revolver
|
0.50
|
2,232
|
|
(32
|
)
|
|||||
|
K2 Insurance Services, LLC
|
Revolver
|
0.50
|
2,290
|
|
3
|
|
|||||
|
K2 Insurance Services, LLC
|
Delayed Draw
|
1.00
|
5,344
|
|
6
|
|
|||||
|
Kaseya Inc.
|
Revolver
|
0.50
|
661
|
|
1
|
|
|||||
|
Kaseya Inc.
|
Delayed Draw
|
0.50
|
1,918
|
|
4
|
|
|||||
|
Lifelong Learner Holdings, LLC
|
Revolver
|
0.50
|
1,901
|
|
(19
|
)
|
|||||
|
Lifelong Learner Holdings, LLC
|
Delayed Draw
|
—
|
2,878
|
|
(29
|
)
|
|||||
|
Liqui-Box Holdings, Inc.
|
Revolver
|
0.50
|
2,630
|
|
(37
|
)
|
|||||
|
Mailgun Technologies, Inc.
|
Revolver
|
0.50
|
1,342
|
|
(20
|
)
|
|||||
|
National Car Wash Solutions, LP
|
Revolver
|
0.50
|
310
|
|
(2
|
)
|
|||||
|
National Car Wash Solutions, LP
|
Delayed Draw
|
1.00
|
1,111
|
|
(8
|
)
|
|||||
|
National Technical Systems, Inc.
|
Revolver
|
0.50
|
2,500
|
|
(2
|
)
|
|||||
|
NMI AcquisitionCo, Inc.
|
Revolver
|
0.50
|
1,280
|
|
(4
|
)
|
|||||
|
Northland Telecommunications Corporation
|
Revolver
|
0.50
|
2,960
|
|
(4
|
)
|
|||||
|
Pathway Vet Alliance, LLC
|
Delayed Draw
|
1.00
|
7,950
|
|
12
|
|
|||||
|
PF Growth Partners, LLC
|
Delayed Draw
|
1.00
|
1,028
|
|
(3
|
)
|
|||||
|
PPC Flexible Packaging, LLC
|
Revolver
|
0.50
|
1,957
|
|
(16
|
)
|
|||||
|
PricewaterhouseCoopers Public Sector LLP
|
Revolver
|
0.50
|
6,250
|
|
(46
|
)
|
|||||
|
QW Holding Corporation (Quala)
|
Delayed Draw
|
1.00
|
809
|
|
(5
|
)
|
|||||
|
RSC Acquisition, Inc.
|
Revolver
|
0.50
|
608
|
|
(4
|
)
|
|||||
|
RSC Acquisition, Inc.
|
Delayed Draw
|
1.00
|
7,757
|
|
(57
|
)
|
|||||
|
Sapphire Convention, Inc. (Smart City
|
Revolver
|
0.50
|
4,528
|
|
(34
|
)
|
|||||
|
Smile Doctors, LLC
|
Revolver
|
0.50
|
707
|
|
(7
|
)
|
|||||
|
Smile Doctors, LLC
|
Delayed Draw
|
1.00
|
1,477
|
|
(14
|
)
|
|||||
|
SolAero Technologies Corp. (Priority Term Loan)
|
Revolver
|
1.00
|
542
|
|
—
|
|
|||||
|
SPay, Inc.
|
Revolver
|
0.50
|
682
|
|
(58
|
)
|
|||||
|
Superior Health Linens, LLC
|
Revolver
|
0.50
|
693
|
|
(58
|
)
|
|||||
|
T2 Systems, Inc.
|
Revolver
|
0.50
|
2,053
|
|
—
|
|
|||||
|
Tank Holding Corp.
|
Revolver
|
0.50
|
47
|
|
—
|
|
|||||
|
TSB Purchaser, Inc. (Teaching Strategies, LLC)
|
Revolver
|
0.50
|
1,342
|
|
(9
|
)
|
|||||
|
The Leaders Romans Bidco Limited (United Kingdom)
|
Delayed Draw
|
1.69
|
£
|
3,533
|
|
(94
|
)
|
||||
|
Trump Card, LLC
|
Revolver
|
0.50
|
369
|
|
(2
|
)
|
|||||
|
Turbo Buyer, Inc.
|
Revolver
|
0.50
|
2,151
|
|
(28
|
)
|
|||||
|
Turbo Buyer, Inc.
|
Delayed Draw
|
1.00
|
4,904
|
|
(64
|
)
|
|||||
|
USLS Acquisition, Inc.
|
Revolver
|
0.50
|
946
|
|
(19
|
)
|
|||||
|
VRC Companies, LLC
|
Delayed Draw
|
0.75
|
210
|
|
—
|
|
|||||
|
VRC Companies, LLC
|
Revolver
|
0.50
|
1,119
|
|
(1
|
)
|
|||||
|
Westfall Technik, Inc.
|
Revolver
|
0.50%
|
431
|
|
$
|
(11
|
)
|
||||
99
TCG BDC, INC.
CONSOLIDATED SCHEDULE OF INVESTMENTS
As of December 31, 2019
(dollar amounts in thousands)
|
Investments—non-controlled/non-affiliated
|
Type
|
Unused Fee
|
Par/ Principal Amount
|
Fair Value
|
|||||||
|
Westfall Technik, Inc.
|
Delayed Draw
|
1.00
|
$
|
12,190
|
|
(304
|
)
|
||||
|
Zemax Software Holdings, LLC
|
Revolver
|
0.50
|
1,284
|
|
(7
|
)
|
|||||
|
Zenith American Holding, Inc.
|
Delayed Draw
|
1.00
|
3,189
|
|
(18
|
)
|
|||||
|
Zenith American Holding, Inc.
|
Revolver
|
0.50
|
3,180
|
|
(17
|
)
|
|||||
|
Total unfunded commitments
|
$
|
149,890
|
|
$
|
(1,465
|
)
|
|||||
As of
December 31, 2019
, investments at fair value consisted of the following:
|
Type
|
Amortized Cost
|
Fair Value
|
% of Fair Value
|
||||||||
|
First Lien Debt (excluding First Lien/Last Out)
|
$
|
1,649,721
|
|
$
|
1,585,042
|
|
74.63
|
%
|
|||
|
First Lien/Last Out Unitranche
|
78,951
|
|
78,096
|
|
3.68
|
|
|||||
|
Second Lien Debt
|
234,006
|
|
234,532
|
|
11.04
|
|
|||||
|
Equity Investments
|
22,272
|
|
21,698
|
|
1.02
|
|
|||||
|
Investment Fund
|
216,501
|
|
204,596
|
|
9.63
|
|
|||||
|
Total
|
$
|
2,201,451
|
|
$
|
2,123,964
|
|
100.00
|
%
|
|||
100
TCG BDC, INC.
CONSOLIDATED SCHEDULE OF INVESTMENTS
As of December 31, 2019
(dollar amounts in thousands)
The rate type of debt investments at fair value as of
December 31, 2019
was as follows:
|
Rate Type
|
Amortized Cost
|
Fair Value
|
% of Fair Value of First and Second Lien Debt
|
||||||||
|
Floating Rate
|
$
|
1,957,730
|
|
$
|
1,892,639
|
|
99.73
|
%
|
|||
|
Fixed Rate
|
4,948
|
|
5,031
|
|
0.27
|
|
|||||
|
Total
|
$
|
1,962,678
|
|
$
|
1,897,670
|
|
100.00
|
%
|
|||
The industry composition of investments at fair value as of
December 31, 2019
was as follows:
|
Industry
|
Amortized Cost
|
Fair Value
|
% of Fair Value
|
|||||||
|
Aerospace & Defense
|
$
|
109,755
|
|
$
|
109,758
|
|
5.17
|
%
|
||
|
Automotive
|
39,177
|
|
39,665
|
|
1.87
|
|
||||
|
Banking, Finance, Insurance & Real Estate
|
112,248
|
|
115,119
|
|
5.42
|
|
||||
|
Beverage, Food & Tobacco
|
80,597
|
|
81,222
|
|
3.82
|
|
||||
|
Business Services
|
167,435
|
|
167,497
|
|
7.89
|
|
||||
|
Capital Equipment
|
44,362
|
|
45,027
|
|
2.12
|
|
||||
|
Chemicals, Plastics & Rubber
|
27,432
|
|
26,962
|
|
1.27
|
|
||||
|
Construction & Building
|
13,713
|
|
14,032
|
|
0.66
|
|
||||
|
Consumer Services
|
41,089
|
|
38,347
|
|
1.81
|
|
||||
|
Containers, Packaging & Glass
|
67,821
|
|
68,207
|
|
3.21
|
|
||||
|
Durable Consumer Goods
|
11,165
|
|
11,584
|
|
0.55
|
|
||||
|
Energy: Electricity
|
33,543
|
|
30,930
|
|
1.46
|
|
||||
|
Energy: Oil & Gas
|
11,762
|
|
11,974
|
|
0.56
|
|
||||
|
Environmental Industries
|
42,802
|
|
43,106
|
|
2.03
|
|
||||
|
Healthcare & Pharmaceuticals
|
248,615
|
|
192,719
|
|
9.07
|
|
||||
|
High Tech Industries
|
215,856
|
|
215,274
|
|
10.13
|
|
||||
|
Hotel, Gaming & Leisure
|
96,815
|
|
95,073
|
|
4.48
|
|
||||
|
Investment Fund
|
216,501
|
|
204,596
|
|
9.63
|
|
||||
|
Media: Broadcast & Subscription
|
45,916
|
|
46,529
|
|
2.19
|
|
||||
|
Media: Advertising, Printing & Publishing
|
36,895
|
|
37,406
|
|
1.76
|
|
||||
|
Non-durable Consumer Goods
|
1,500
|
|
1,999
|
|
0.09
|
|
||||
|
Retail
|
43,081
|
|
43,020
|
|
2.03
|
|
||||
|
Software
|
224,807
|
|
226,045
|
|
10.63
|
|
||||
|
Sovereign & Public Finance
|
38,297
|
|
37,381
|
|
1.76
|
|
||||
|
Telecommunications
|
119,014
|
|
116,115
|
|
5.47
|
|
||||
|
Transportation: Cargo
|
42,204
|
|
42,220
|
|
1.99
|
|
||||
|
Transportation: Consumer
|
35,715
|
|
36,276
|
|
1.71
|
|
||||
|
Wholesale
|
33,334
|
|
25,881
|
|
1.22
|
|
||||
|
Total
|
$
|
2,201,451
|
|
$
|
2,123,964
|
|
100.00
|
%
|
||
101
TCG BDC, INC.
CONSOLIDATED SCHEDULE OF INVESTMENTS
As of December 31, 2019
(dollar amounts in thousands)
The geographical composition of investments at fair value as of
December 31, 2019
was as follows:
|
Geography
|
Amortized Cost
|
Fair Value
|
% of Fair Value
|
|||||||
|
Canada
|
$
|
41,002
|
|
$
|
40,939
|
|
1.93
|
%
|
||
|
Cyprus
|
4,746
|
|
4,836
|
|
0.23
|
|
||||
|
Jamaica
|
202
|
|
195
|
|
0.01
|
|
||||
|
Luxembourg
|
36,563
|
|
36,563
|
|
1.72
|
|
||||
|
United Kingdom
|
24,865
|
|
26,531
|
|
1.25
|
|
||||
|
United States
|
2,094,073
|
|
2,014,900
|
|
94.86
|
|
||||
|
Total
|
$
|
2,201,451
|
|
$
|
2,123,964
|
|
100.00
|
%
|
||
The accompanying notes are an integral part of these consolidated financial statements.
102
TCG BDC, INC.
CONSOLIDATED SCHEDULE OF INVESTMENTS
As of December 31, 2018
(dollar amounts in thousands)
|
Investments—non-controlled/non-affiliated
(1)
|
Footnotes
|
Industry
|
Reference Rate & Spread
(2)
|
Interest Rate
(2)
|
Acquisition Date
|
Maturity Date
|
Par/ Principal Amount
|
Amortized Cost
(4)
|
Fair Value
(5)
|
% of Net
Assets
|
|||||||||||||||||||
|
First Lien Debt (77.62%)
|
|||||||||||||||||||||||||||||
|
Advanced Instruments, LLC
|
^+*
|
(2) (3) (14)
|
Healthcare & Pharmaceuticals
|
L + 5.25%
|
7.63%
|
11/1/2016
|
10/31/2022
|
$
|
19,967
|
|
$
|
19,716
|
|
$
|
19,804
|
|
1.86
|
%
|
|||||||||||
|
Aero Operating, LLC (Dejana Industries, Inc.)
|
^+*
|
(2) (3) (14)
|
Business Services
|
L + 7.25%
|
9.60%
|
1/5/2018
|
12/29/2022
|
3,556
|
|
3,520
|
|
3,512
|
|
0.33
|
|
||||||||||||||
|
Alpha Packaging Holdings, Inc.
|
+*
|
(2) (3)
|
Containers, Packaging & Glass
|
L + 4.25%
|
7.05%
|
6/26/2015
|
5/12/2020
|
2,866
|
|
2,865
|
|
2,858
|
|
0.27
|
|
||||||||||||||
|
Alpine SG, LLC
|
^*
|
(2) (3)
|
High Tech Industries
|
L + 6.00%
|
8.52%
|
2/2/2018
|
11/16/2022
|
9,695
|
|
9,607
|
|
9,659
|
|
0.91
|
|
||||||||||||||
|
AMS Group HoldCo, LLC
|
^+*
|
(2) (3) (14)
|
Transportation: Cargo
|
L + 6.00%
|
8.80%
|
9/29/2017
|
9/29/2023
|
32,612
|
|
31,996
|
|
31,721
|
|
2.98
|
|
||||||||||||||
|
Analogic Corporation
|
^+*
|
(2) (3) (14)
|
Healthcare & Pharmaceuticals
|
L + 6.00%
|
8.52%
|
6/22/2018
|
6/22/2024
|
35,249
|
|
34,536
|
|
34,414
|
|
3.23
|
|
||||||||||||||
|
Avenu Holdings, LLC
|
+*
|
(2) (3)
|
Sovereign & Public Finance
|
L + 5.25%
|
8.05%
|
9/28/2018
|
9/28/2024
|
39,057
|
|
38,396
|
|
38,354
|
|
3.60
|
|
||||||||||||||
|
Brooks Equipment Company, LLC
|
+*
|
(2) (3)
|
Construction & Building
|
L + 5.00%
|
7.71%
|
6/26/2015
|
8/29/2020
|
2,502
|
|
2,492
|
|
2,496
|
|
0.23
|
|
||||||||||||||
|
Capstone Logistics Acquisition, Inc.
|
+*
|
(2) (3)
|
Transportation: Cargo
|
L + 4.50%
|
7.02%
|
6/26/2015
|
10/7/2021
|
14,306
|
|
14,234
|
|
14,262
|
|
1.34
|
|
||||||||||||||
|
Captive Resources Midco, LLC
|
^+*
|
(2) (3) (14)
|
Banking, Finance, Insurance & Real Estate
|
L + 5.75%
|
8.27%
|
6/30/2015
|
12/18/2021
|
29,441
|
|
29,212
|
|
29,139
|
|
2.74
|
|
||||||||||||||
|
Central Security Group, Inc.
|
+*
|
(2) (3)
|
Consumer Services
|
L + 5.63%
|
8.15%
|
6/26/2015
|
10/6/2021
|
30,349
|
|
30,142
|
|
29,742
|
|
2.80
|
|
||||||||||||||
|
Chemical Computing Group ULC (Canada)
|
^*
|
(2) (3) (8) (14)
|
Software
|
L + 5.50%
|
8.02%
|
8/30/2018
|
8/30/2023
|
15,794
|
|
15,636
|
|
15,617
|
|
1.47
|
|
||||||||||||||
|
CIP Revolution Holdings, LLC
|
^+*
|
(2) (3) (14)
|
Media: Advertising, Printing & Publishing
|
L + 6.00%
|
8.80%
|
8/19/2016
|
8/19/2021
|
20,592
|
|
20,463
|
|
20,358
|
|
1.91
|
|
||||||||||||||
|
CircusTrix Holdings, LLC
|
^+*
|
(2) (3) (14)
|
Hotel, Gaming & Leisure
|
L + 5.50%
|
8.02%
|
2/2/2018
|
12/16/2021
|
9,212
|
|
9,001
|
|
8,972
|
|
0.84
|
|
||||||||||||||
|
Comar Holding Company, LLC
|
^*
|
(2) (3) (14)
|
Containers, Packaging & Glass
|
L + 5.25%
|
7.77%
|
6/18/2018
|
6/18/2024
|
27,086
|
|
26,452
|
|
26,505
|
|
2.49
|
|
||||||||||||||
|
Continuum Managed Services Holdco, LLC
|
^+*
|
(2) (3) (14)
|
High Tech Industries
|
L + 6.25%
|
8.53%
|
6/20/2017
|
6/8/2023
|
28,243
|
|
27,621
|
|
27,711
|
|
2.60
|
|
||||||||||||||
|
Dade Paper & Bag, LLC
|
^+*
|
(2) (3)
|
Forest Products & Paper
|
L + 7.50%
|
10.02%
|
6/9/2017
|
6/10/2024
|
49,250
|
|
48,464
|
|
47,798
|
|
4.49
|
|
||||||||||||||
|
Datto, Inc.
|
^*
|
(2) (3) (14)
|
High Tech Industries
|
L + 8.00%
|
10.46%
|
12/7/2017
|
12/7/2022
|
35,622
|
|
35,178
|
|
35,280
|
|
3.31
|
|
||||||||||||||
|
Dent Wizard International Corporation
|
+
|
(2) (3)
|
Automotive
|
L + 4.00%
|
6.51%
|
4/28/2015
|
4/7/2020
|
886
|
|
885
|
|
881
|
|
0.08
|
|
||||||||||||||
|
Derm Growth Partners III, LLC (Dermatology Associates)
|
^+*
|
(2) (3) (14)
|
Healthcare & Pharmaceuticals
|
L + 6.25%
|
9.05%
|
5/31/2016
|
5/31/2022
|
51,599
|
|
51,203
|
|
50,946
|
|
4.78
|
|
||||||||||||||
|
DermaRite Industries, LLC
|
^*
|
(2) (3) (14)
|
Healthcare & Pharmaceuticals
|
L + 7.00%
|
9.52%
|
3/3/2017
|
3/3/2022
|
22,328
|
|
22,097
|
|
21,399
|
|
2.01
|
|
||||||||||||||
|
Dimensional Dental Management, LLC
|
^
|
(2) (3) (12)
|
Healthcare & Pharmaceuticals
|
L + 6.75%
|
9.28%
|
2/12/2016
|
2/12/2021
|
33,674
|
|
33,276
|
|
28,172
|
|
2.65
|
|
||||||||||||||
|
Direct Travel, Inc.
|
^+*
|
(2) (3) (14)
|
Hotel, Gaming & Leisure
|
L + 6.50%
|
9.30%
|
10/14/2016
|
12/1/2021
|
35,292
|
|
34,878
|
|
34,975
|
|
3.28
|
|
||||||||||||||
|
DTI Holdco, Inc.
|
^*
|
(2) (3)
|
High Tech Industries
|
L + 4.75%
|
7.28%
|
12/18/2018
|
9/30/2023
|
1,995
|
|
1,870
|
|
1,860
|
|
0.17
|
|
||||||||||||||
|
EIP Merger Sub, LLC (Evolve IP)
|
^+*
|
(2) (3) (12)
|
Telecommunications
|
L + 5.75%
|
8.27%
|
6/7/2016
|
6/7/2022
|
36,093
|
|
35,433
|
|
35,169
|
|
3.30
|
|
||||||||||||||
|
Emergency Communications Network, LLC
|
^+*
|
(2) (3)
|
Telecommunications
|
L + 6.25%
|
8.75%
|
6/1/2017
|
6/1/2023
|
24,625
|
|
24,452
|
|
24,133
|
|
2.27
|
|
||||||||||||||
|
Ensono, LP
|
*
|
(2) (3)
|
Telecommunications
|
L + 5.25%
|
7.77%
|
4/30/2018
|
6/27/2025
|
8,623
|
|
8,618
|
|
8,450
|
|
0.79
|
|
||||||||||||||
|
Frontline Technologies Holdings, LLC
|
^
|
(2) (3) (14)
|
Software
|
L + 6.50%
|
9.02%
|
9/18/2017
|
9/18/2023
|
38,804
|
|
38,456
|
|
38,450
|
|
3.61
|
|
||||||||||||||
103
TCG BDC, INC.
CONSOLIDATED SCHEDULE OF INVESTMENTS (Continued)
As of December 31, 2018
(dollar amounts in thousands)
|
Investments—non-controlled/non-affiliated
(1)
|
Footnotes
|
Industry
|
Reference Rate & Spread
(2)
|
Interest Rate
(2)
|
Acquisition Date
|
Maturity Date
|
Par/ Principal Amount
|
Amortized Cost
(4)
|
Fair Value
(5)
|
% of Net
Assets
|
|||||||||||||||||||
|
First Lien Debt (77.62%) (continued)
|
|||||||||||||||||||||||||||||
|
FWR Holding Corporation
|
^+*
|
(2) (3) (14)
|
Beverage, Food & Tobacco
|
L + 5.75%
|
8.26%
|
8/21/2017
|
8/21/2023
|
$
|
46,755
|
|
$
|
45,782
|
|
$
|
46,393
|
|
4.36
|
%
|
|||||||||||
|
Green Energy Partners/Stonewall, LLC
|
+*
|
(2) (3)
|
Energy: Electricity
|
L + 5.50%
|
8.30%
|
6/26/2015
|
11/13/2021
|
19,750
|
|
19,494
|
|
19,536
|
|
1.83
|
|
||||||||||||||
|
GRO Sub Holdco, LLC (Grand Rapids)
|
^+*
|
(2) (3) (14)
|
Healthcare & Pharmaceuticals
|
L + 6.00%
|
8.80%
|
2/28/2018
|
2/22/2024
|
6,661
|
|
6,466
|
|
6,209
|
|
0.58
|
|
||||||||||||||
|
Hummel Station, LLC
|
+*
|
(2) (3)
|
Energy: Electricity
|
L + 6.00%
|
8.52%
|
2/3/2016
|
10/27/2022
|
14,790
|
|
14,164
|
|
14,422
|
|
1.35
|
|
||||||||||||||
|
Hydrofarm, LLC
|
^
|
(2) (3)
|
Wholesale
|
L+10.00% (30% cash/70% PIK)
|
12.50%
|
5/15/2017
|
5/12/2022
|
20,306
|
|
19,958
|
|
13,989
|
|
1.31
|
|
||||||||||||||
|
iCIMS, Inc.
|
^
|
(2) (3) (14)
|
Software
|
L + 6.50%
|
8.94%
|
9/12/2018
|
9/12/2024
|
20,025
|
|
19,616
|
|
19,297
|
|
1.81
|
|
||||||||||||||
|
Indra Holdings Corp. (Totes Isotoner)
|
^
|
(2) (3)
|
Non-durable Consumer Goods
|
L + 4.25%
|
6.77%
|
4/29/2014
|
5/1/2021
|
18,965
|
|
17,561
|
|
9,483
|
|
0.89
|
|
||||||||||||||
|
Innovative Business Services, LLC
|
^*
|
(2) (3) (14)
|
High Tech Industries
|
L + 5.50%
|
7.91%
|
4/5/2018
|
4/5/2023
|
16,307
|
|
15,789
|
|
15,948
|
|
1.50
|
|
||||||||||||||
|
Legacy.com, Inc.
|
^
|
(2) (3) (12)
|
High Tech Industries
|
L + 6.00%
|
8.79%
|
3/20/2017
|
3/20/2023
|
17,000
|
|
16,696
|
|
16,827
|
|
1.58
|
|
||||||||||||||
|
Maravai Intermediate Holdings, LLC
|
^*
|
(2)
|
Healthcare & Pharmaceuticals
|
L + 4.25%
|
6.81%
|
8/2/2018
|
8/2/2025
|
19,950
|
|
19,766
|
|
19,719
|
|
1.85
|
|
||||||||||||||
|
Metrogistics, LLC
|
+*
|
(2) (3)
|
Transportation: Cargo
|
L + 6.50%
|
9.00%
|
12/13/2016
|
9/30/2022
|
17,517
|
|
17,349
|
|
17,424
|
|
1.65
|
|
||||||||||||||
|
Moxie Liberty, LLC
|
+*
|
(2) (3)
|
Energy: Electricity
|
L + 6.50%
|
9.30%
|
10/16/2017
|
8/21/2020
|
9,873
|
|
9,208
|
|
8,964
|
|
0.84
|
|
||||||||||||||
|
National Carwash Solutions, Inc.
|
^+
|
(2) (3) (14)
|
Automotive
|
L + 6.00%
|
8.35%
|
8/7/2018
|
4/28/2023
|
5,843
|
|
5,662
|
|
5,688
|
|
0.53
|
|
||||||||||||||
|
National Technical Systems, Inc.
|
^+*
|
(2) (3) (14)
|
Aerospace & Defense
|
L + 6.25%
|
8.87%
|
6/26/2015
|
6/12/2021
|
28,237
|
|
27,990
|
|
28,160
|
|
2.64
|
|
||||||||||||||
|
NES Global Talent Finance US, LLC (United Kingdom)
|
+*
|
(2) (3) (8)
|
Energy: Oil & Gas
|
L + 5.50%
|
8.03%
|
5/9/2018
|
5/11/2023
|
9,992
|
|
9,833
|
|
9,695
|
|
0.91
|
|
||||||||||||||
|
Nexus Technologies, LLC
|
^
|
(2) (3)
|
High Tech Industries
|
L + 5.50%
|
8.30%
|
12/11/2018
|
12/5/2023
|
6,234
|
|
6,177
|
|
6,158
|
|
0.58
|
|
||||||||||||||
|
NMI AcquisitionCo, Inc.
|
^+*
|
(2) (3) (14)
|
High Tech Industries
|
L + 6.75%
|
9.27%
|
9/6/2017
|
9/6/2022
|
51,424
|
|
50,646
|
|
49,501
|
|
4.65
|
|
||||||||||||||
|
North American Dental Management, LLC
|
^
|
(2) (3) (14)
|
Healthcare & Pharmaceuticals
|
L + 5.25%
|
8.04%
|
10/26/2018
|
7/7/2023
|
2,060
|
|
1,962
|
|
1,973
|
|
0.19
|
|
||||||||||||||
|
Northland Telecommunications Corporation
|
^*
|
(2) (3) (14)
|
Media: Broadcast & Subscription
|
L + 5.75%
|
8.10%
|
10/1/2018
|
10/1/2025
|
21,638
|
|
21,297
|
|
21,311
|
|
2.00
|
|
||||||||||||||
|
Payment Alliance International, Inc.
|
^
|
(2) (3) (12)
|
Business Services
|
L + 6.05%
|
8.13%
|
9/15/2017
|
9/15/2021
|
23,723
|
|
23,324
|
|
23,588
|
|
2.22
|
|
||||||||||||||
|
Plano Molding Company, LLC
|
^
|
(2) (3)
|
Hotel, Gaming & Leisure
|
L + 7.50%
|
9.98%
|
5/1/2015
|
5/12/2021
|
14,902
|
|
14,726
|
|
13,729
|
|
1.29
|
|
||||||||||||||
|
PPC Flexible Packaging, LLC
|
^+
|
(2) (3) (14)
|
Containers, Packaging & Glass
|
L + 5.25%
|
7.77%
|
11/23/2018
|
11/23/2024
|
11,962
|
|
11,761
|
|
11,839
|
|
1.11
|
|
||||||||||||||
|
PPT Management Holdings, LLC
|
^
|
(2) (3)
|
Healthcare & Pharmaceuticals
|
L+7.50% (100% PIK)
|
9.85%
|
12/15/2016
|
12/16/2022
|
26,820
|
|
26,675
|
|
22,194
|
|
2.08
|
|
||||||||||||||
|
PricewaterhouseCoopers Public Sector LLP
|
^
|
(2) (3) (14)
|
Aerospace & Defense
|
L + 2.75%
|
5.25%
|
5/1/2018
|
5/1/2023
|
—
|
|
(131
|
)
|
(160
|
)
|
(0.02
|
)
|
||||||||||||||
|
Prime Risk Partners, Inc.
|
^
|
(2) (3) (12) (14)
|
Banking, Finance, Insurance & Real Estate
|
L + 5.00%
|
7.80%
|
8/15/2017
|
8/13/2023
|
24,389
|
|
23,906
|
|
23,466
|
|
2.20
|
|
||||||||||||||
|
Prime Risk Partners, Inc.
|
^
|
(2) (3)
|
Banking, Finance, Insurance & Real Estate
|
L + 5.00%
|
7.44%
|
8/15/2017
|
8/13/2023
|
1,925
|
|
1,887
|
|
1,871
|
|
0.18
|
|
||||||||||||||
104
TCG BDC, INC.
CONSOLIDATED SCHEDULE OF INVESTMENTS (Continued)
As of December 31, 2018
(dollar amounts in thousands)
|
Investments—non-controlled/non-affiliated
(1)
|
Footnotes
|
Industry
|
Reference Rate & Spread
(2)
|
Interest Rate
(2)
|
Acquisition Date
|
Maturity Date
|
Par/ Principal Amount
|
Amortized Cost
(4)
|
Fair Value
(5)
|
% of Net
Assets
|
|||||||||||||||||||
|
First Lien Debt (77.62%) (continued)
|
|||||||||||||||||||||||||||||
|
Product Quest Manufacturing, LLC
|
^
|
(2) (3) (14)
|
Containers, Packaging & Glass
|
L + 6.75%
|
10.00%
|
9/21/2017
|
3/31/2019
|
$
|
4,051
|
|
$
|
4,051
|
|
$
|
4,051
|
|
0.38
|
%
|
|||||||||||
|
Product Quest Manufacturing, LLC
|
^
|
(2) (3) (10) (12)
|
Containers, Packaging & Glass
|
L + 5.75%
|
8.09%
|
9/9/2015
|
9/9/2020
|
33,000
|
|
32,270
|
|
—
|
|
—
|
|
||||||||||||||
|
Prowler Acquisition Corp. (Pipeline Supply and Service, LLC)
|
+*
|
(2) (3)
|
Wholesale
|
L + 4.50%
|
7.30%
|
12/1/2017
|
1/28/2020
|
14,752
|
|
14,396
|
|
14,663
|
|
1.38
|
|
||||||||||||||
|
PSI Services, LLC
|
^
|
(2) (3)
|
Business Services
|
L + 5.00%
|
7.52%
|
9/19/2018
|
1/20/2023
|
4,546
|
|
4,487
|
|
4,445
|
|
0.42
|
|
||||||||||||||
|
QW Holding Corporation (Quala)
|
^+*
|
(2) (3)
|
Environmental Industries
|
L + 6.75%
|
9.22%
|
8/31/2016
|
8/31/2022
|
36,179
|
|
35,604
|
|
35,835
|
|
3.37
|
|
||||||||||||||
|
Redwood Services Group, LLC
|
*
|
(2) (3)
|
High Tech Industries
|
L + 6.00%
|
8.71%
|
11/13/2018
|
6/6/2023
|
5,323
|
|
5,277
|
|
5,242
|
|
0.49
|
|
||||||||||||||
|
Sapphire Convention, Inc. (Smart City)
|
^*
|
(2) (3) (14)
|
Telecommunications
|
L + 5.25%
|
7.89%
|
11/20/2018
|
11/20/2025
|
28,866
|
|
28,207
|
|
28,264
|
|
2.65
|
|
||||||||||||||
|
Smile Doctors, LLC
|
^+*
|
(2) (3) (14)
|
Healthcare & Pharmaceuticals
|
L + 5.75%
|
8.55%
|
10/6/2017
|
10/6/2022
|
18,155
|
|
18,037
|
|
17,782
|
|
1.67
|
|
||||||||||||||
|
SolAero Technologies Corp.
|
^
|
(2) (3) (10)
|
Telecommunications
|
L + 5.25%
|
7.75%
|
5/24/2016
|
12/10/2020
|
24,362
|
|
23,787
|
|
14,327
|
|
1.35
|
|
||||||||||||||
|
SolAero Technologies Corp.
|
^
|
(2) (3)
|
Telecommunications
|
L+ 7.25%, 4.00% PIK
|
10.25%
|
9/6/2018
|
3/31/2019
|
3,641
|
|
3,623
|
|
3,641
|
|
0.34
|
|
||||||||||||||
|
Sovos Brands Intermediate, Inc.
|
^
|
(2)
|
Beverage, Food & Tobacco
|
L + 5.00%
|
7.64%
|
11/16/2018
|
11/20/2025
|
20,100
|
|
19,903
|
|
19,782
|
|
1.86
|
|
||||||||||||||
|
SPay, Inc.
|
^+*
|
(2) (3) (14)
|
Hotel, Gaming & Leisure
|
L + 5.75%
|
8.22%
|
6/15/2018
|
6/15/2024
|
19,909
|
|
19,347
|
|
19,009
|
|
1.79
|
|
||||||||||||||
|
Superior Health Linens, LLC
|
^+*
|
(2) (3) (14)
|
Business Services
|
L + 7.00%
|
9.52%
|
9/30/2016
|
9/30/2021
|
21,100
|
|
20,891
|
|
20,840
|
|
1.96
|
|
||||||||||||||
|
Surgical Information Systems, LLC
|
^+*
|
(2) (3) (12)
|
High Tech Industries
|
L + 4.85%
|
7.37%
|
4/24/2017
|
4/24/2023
|
27,708
|
|
27,497
|
|
27,171
|
|
2.55
|
|
||||||||||||||
|
T2 Systems Canada, Inc.
|
*
|
(2) (3)
|
Transportation: Consumer
|
L + 6.75%
|
9.34%
|
5/24/2017
|
9/28/2022
|
3,969
|
|
3,899
|
|
3,946
|
|
0.37
|
|
||||||||||||||
|
T2 Systems, Inc.
|
^+*
|
(2) (3) (14)
|
Transportation: Consumer
|
L + 6.75%
|
9.34%
|
9/28/2016
|
9/28/2022
|
32,331
|
|
31,756
|
|
32,133
|
|
3.02
|
|
||||||||||||||
|
The Hilb Group, LLC
|
^
|
(2) (3) (12)
|
Banking, Finance, Insurance & Real Estate
|
L + 6.00%
|
8.80%
|
6/24/2015
|
6/24/2021
|
49,451
|
|
48,861
|
|
48,456
|
|
4.55
|
|
||||||||||||||
|
The Topps Company, Inc.
|
+*
|
(2) (3)
|
Non-durable Consumer Goods
|
L + 6.00%
|
8.80%
|
6/26/2015
|
10/2/2020
|
22,127
|
|
21,951
|
|
22,127
|
|
2.08
|
|
||||||||||||||
|
Trump Card, LLC
|
^+*
|
(2) (3) (14)
|
Transportation: Cargo
|
L + 5.00%
|
7.80%
|
6/26/2018
|
4/21/2022
|
8,157
|
|
8,107
|
|
8,036
|
|
0.75
|
|
||||||||||||||
|
TSB Purchaser, Inc. (Teaching Strategies, LLC)
|
^+*
|
(2) (3) (14)
|
Media: Advertising, Printing & Publishing
|
L + 6.00%
|
8.80%
|
5/14/2018
|
5/14/2024
|
28,028
|
|
27,352
|
|
27,462
|
|
2.58
|
|
||||||||||||||
|
Tweddle Group, Inc.
|
^
|
(2) (3)
|
Media: Advertising, Printing & Publishing
|
L + 4.50%
|
6.97%
|
9/17/2018
|
9/17/2023
|
2,400
|
|
2,366
|
|
2,386
|
|
0.22
|
|
||||||||||||||
|
USLS Acquisition, Inc.
|
^
|
(2) (3) (14)
|
Business Services
|
L + 5.75%
|
8.46%
|
11/30/2018
|
11/30/2024
|
17,730
|
|
17,282
|
|
17,178
|
|
1.61
|
|
||||||||||||||
|
VRC Companies, LLC
|
^+*
|
(2) (3) (14)
|
Business Services
|
L + 6.50%
|
9.02%
|
3/31/2017
|
3/31/2023
|
54,181
|
|
53,345
|
|
53,410
|
|
5.03
|
|
||||||||||||||
|
Watchfire Enterprises, Inc.
|
*
|
(2) (3)
|
Media: Advertising, Printing & Publishing
|
L + 4.00%
|
6.80%
|
6/9/2017
|
10/2/2020
|
1,248
|
|
1,241
|
|
1,248
|
|
0.12
|
|
||||||||||||||
|
Westfall Technik, Inc.
|
^
|
(2) (3) (14)
|
Chemicals, Plastics & Rubber
|
L + 5.00%
|
7.79%
|
9/13/2018
|
9/13/2024
|
10,585
|
|
10,218
|
|
9,902
|
|
0.93
|
|
||||||||||||||
|
Zemax Software Holdings, LLC
|
^*
|
(2) (3) (14)
|
Software
|
L + 5.75%
|
8.55%
|
6/25/2018
|
6/25/2024
|
10,248
|
|
10,111
|
|
10,144
|
|
0.95
|
|
||||||||||||||
|
Zenith Merger Sub, Inc.
|
^+*
|
(2) (3) (14)
|
Business Services
|
L + 5.50%
|
8.30%
|
12/13/2017
|
12/13/2023
|
10,881
|
|
10,732
|
|
10,778
|
|
1.01
|
|
||||||||||||||
|
First Lien Debt Total
|
$
|
1,629,394
|
|
$
|
1,602,861
|
|
$
|
1,532,119
|
|
143.88
|
%
|
||||||||||||||||||
105
TCG BDC, INC.
CONSOLIDATED SCHEDULE OF INVESTMENTS (Continued)
As of December 31, 2018
(dollar amounts in thousands)
|
Investments—non-controlled/non-affiliated
(1)
|
Footnotes
|
Industry
|
Reference Rate & Spread
(2)
|
Interest Rate
(2)
|
Acquisition Date
|
Maturity Date
|
Par/ Principal Amount
|
Amortized Cost
(4)
|
Fair Value
(5)
|
% of Net
Assets
|
|||||||||||||||||||
|
Second Lien Debt (9.07%)
|
|||||||||||||||||||||||||||||
|
Access CIG, LLC
|
^
|
(2)
|
Business Services
|
L + 7.75%
|
10.46%
|
2/14/2018
|
2/27/2026
|
$
|
2,701
|
|
$
|
2,678
|
|
$
|
2,650
|
|
0.25
|
%
|
|||||||||||
|
AmeriLife Group, LLC
|
^*
|
(2) (3)
|
Banking, Finance, Insurance & Real Estate
|
L + 8.75%
|
11.27%
|
7/9/2015
|
1/10/2023
|
22,000
|
|
21,712
|
|
21,910
|
|
2.06
|
|
||||||||||||||
|
AQA Acquisition Holding, Inc.
|
^
|
(2) (3)
|
High Tech Industries
|
L + 8.00%
|
10.40%
|
10/1/2018
|
5/24/2024
|
40,000
|
|
39,623
|
|
39,336
|
|
3.69
|
|
||||||||||||||
|
Argon Medical Devices Holdings, Inc.
|
^*
|
(2) (3)
|
Healthcare & Pharmaceuticals
|
L + 8.00%
|
10.52%
|
11/2/2017
|
1/23/2026
|
7,500
|
|
7,468
|
|
7,446
|
|
0.70
|
|
||||||||||||||
|
Brave Parent Holdings, Inc.
|
^*
|
(2) (3)
|
Software
|
L + 7.50%
|
10.02%
|
10/3/2018
|
4/19/2026
|
19,062
|
|
18,616
|
|
18,301
|
|
1.72
|
|
||||||||||||||
|
Drew Marine Group Inc.
|
^+*
|
(2) (3)
|
Chemicals, Plastics & Rubber
|
L + 7.00%
|
9.52%
|
11/19/2013
|
5/19/2021
|
12,500
|
|
12,487
|
|
12,396
|
|
1.16
|
|
||||||||||||||
|
Outcomes Group Holdings, Inc.
|
^*
|
(2)
|
Business Services
|
L + 7.50%
|
10.28%
|
10/23/2018
|
10/26/2026
|
4,500
|
|
4,500
|
|
4,447
|
|
0.42
|
|
||||||||||||||
|
Pharmalogic Holdings Corp.
|
^
|
(2) (3) (14)
|
Healthcare & Pharmaceuticals
|
L + 8.00%
|
10.52%
|
6/7/2018
|
12/11/2023
|
563
|
|
560
|
|
563
|
|
0.05
|
|
||||||||||||||
|
Project Accelerate Parent, LLC
|
^*
|
(2) (3)
|
Software
|
L + 8.50%
|
10.89%
|
1/2/2018
|
1/2/2026
|
22,500
|
|
21,986
|
|
22,109
|
|
2.08
|
|
||||||||||||||
|
Prowler Acquisition Corp. (Pipeline Supply and Service, LLC)
|
^
|
(2) (3)
|
Wholesale
|
L + 8.50%
|
11.30%
|
1/24/2014
|
7/28/2020
|
3,000
|
|
2,972
|
|
2,939
|
|
0.28
|
|
||||||||||||||
|
Reladyne, Inc.
|
^+*
|
(2) (3)
|
Wholesale
|
L + 9.50%
|
12.30%
|
4/19/2018
|
1/21/2023
|
10,000
|
|
9,830
|
|
9,915
|
|
0.93
|
|
||||||||||||||
|
Santa Cruz Holdco, Inc.
|
^
|
(2) (3)
|
Non-durable Consumer Goods
|
L + 8.25%
|
10.69%
|
12/15/2017
|
12/13/2024
|
17,138
|
|
16,984
|
|
16,903
|
|
1.59
|
|
||||||||||||||
|
Ultimate Baked Goods MIDCO, LLC (Rise Baking)
|
^
|
(2) (3)
|
Beverage, Food & Tobacco
|
L + 8.00%
|
10.52%
|
8/9/2018
|
8/9/2026
|
8,333
|
|
8,176
|
|
8,108
|
|
0.76
|
|
||||||||||||||
|
Watchfire Enterprises, Inc.
|
^
|
(2) (3)
|
Media: Advertising, Printing & Publishing
|
L + 8.00%
|
10.80%
|
10/2/2013
|
10/2/2021
|
7,000
|
|
6,950
|
|
6,996
|
|
0.66
|
|
||||||||||||||
|
Zywave, Inc.
|
^
|
(2) (3)
|
High Tech Industries
|
L + 9.00%
|
11.65%
|
11/18/2016
|
11/17/2023
|
4,950
|
|
4,892
|
|
4,939
|
|
0.46
|
|
||||||||||||||
|
Second Lien Debt Total
|
$
|
181,747
|
|
$
|
179,434
|
|
$
|
178,958
|
|
16.81
|
%
|
||||||||||||||||||
|
Investments—non-controlled/non-affiliated (1)
|
Footnotes
|
Industry
|
Acquisition Date
|
Shares/ Units
|
Cost
|
Fair Value
(5)
|
Percentage
of Net Assets
|
||||||||||||||||
|
Equity Investments (1.03%)
|
|||||||||||||||||||||||
|
ANLG Holdings, LLC
|
^
|
(7)
|
Healthcare & Pharmaceuticals
|
43,273
|
|
879,689
|
|
$
|
880
|
|
$
|
880
|
|
0.08
|
%
|
||||||||
|
Avenu Holdings, LLC
|
^
|
(7)
|
Sovereign & Public Finance
|
43,371
|
|
172,413
|
|
172
|
|
172
|
|
0.02
|
|
||||||||||
|
CIP Revolution Holdings, LLC
|
^
|
(7)
|
Media: Advertising, Printing & Publishing
|
42,601
|
|
31,825
|
|
318
|
|
262
|
|
0.03
|
|
||||||||||
|
Dade Paper & Bag, LLC
|
^
|
(7)
|
Forest Products & Paper
|
42,895
|
|
1,500,000
|
|
1,500
|
|
1,639
|
|
0.15
|
|
||||||||||
|
DecoPac, Inc.
|
^
|
(7)
|
Non-durable Consumer Goods
|
43,007
|
|
1,500,000
|
|
1,500
|
|
1,434
|
|
0.13
|
|
||||||||||
|
Derm Growth Partners III, LLC (Dermatology Associates)
|
^
|
(7)
|
Healthcare & Pharmaceuticals
|
42,521
|
|
1,000,000
|
|
1,000
|
|
1,415
|
|
0.13
|
|
||||||||||
|
GRO Sub Holdco, LLC (Grand Rapids)
|
^
|
(7)
|
Healthcare & Pharmaceuticals
|
43,188
|
|
500,000
|
|
500
|
|
219
|
|
0.02
|
|
||||||||||
|
Legacy.com, Inc.
|
^
|
(7)
|
High Tech Industries
|
42,814
|
|
1,500,000
|
|
1,500
|
|
1,227
|
|
0.12
|
|
||||||||||
|
North Haven Goldfinch Topco, LLC
|
^
|
(7)
|
Containers, Packaging & Glass
|
43,269
|
|
2,314,815
|
|
2,315
|
|
2,103
|
|
0.20
|
|
||||||||||
|
Power Stop Intermediate Holdings, LLC
|
^
|
(7)
|
Automotive
|
42,153
|
|
7,150
|
|
—
|
|
34
|
|
—
|
|
||||||||||
|
Rough Country, LLC
|
^
|
(7)
|
Durable Consumer Goods
|
42,880
|
|
754,775
|
|
755
|
|
988
|
|
0.09
|
|
||||||||||
106
TCG BDC, INC.
CONSOLIDATED SCHEDULE OF INVESTMENTS (Continued)
As of December 31, 2018
(dollar amounts in thousands)
|
Investments—non-controlled/non-affiliated (1)
|
Footnotes
|
Industry
|
Acquisition Date
|
Shares/ Units
|
Cost
|
Fair Value (5)
|
% of Net Assets
|
||||||||||||||||
|
Equity Investments (1.03%) (continued)
|
|||||||||||||||||||||||
|
SiteLock Group Holdings, LLC
|
^
|
(7)
|
High Tech Industries
|
43,195
|
|
446,429
|
|
$
|
446
|
|
$
|
446
|
|
0.04
|
%
|
||||||||
|
T2 Systems Parent Corporation
|
^
|
(7)
|
Transportation: Consumer
|
42,641
|
|
555,556
|
|
555
|
|
483
|
|
0.05
|
|
||||||||||
|
Tailwind HMT Holdings Corp.
|
^
|
(7)
|
Energy: Oil & Gas
|
43,056
|
|
20,000
|
|
2,000
|
|
2,373
|
|
0.22
|
|
||||||||||
|
THG Acquisition, LLC (The Hilb Group, LLC)
|
^
|
(7)
|
Banking, Finance, Insurance & Real Estate
|
42,179
|
|
1,500,000
|
|
1,500
|
|
3,100
|
|
0.29
|
|
||||||||||
|
Tweddle Holdings, Inc.
|
^
|
(7)
|
Media: Advertising, Printing & Publishing
|
43,360
|
|
17,208
|
|
—
|
|
—
|
|
—
|
|
||||||||||
|
USLS Acquisition, Inc.
|
^
|
(7)
|
Business Services
|
43,434
|
|
640,569
|
|
640
|
|
641
|
|
0.06
|
|
||||||||||
|
Zenith American Holding, Inc.
|
^
|
(7)
|
Business Services
|
43,082
|
|
1,561,644
|
|
1,562
|
|
2,513
|
|
0.24
|
|
||||||||||
|
Zillow Topco LP
|
^
|
(7)
|
Software
|
43,276
|
|
312,500
|
|
313
|
|
313
|
|
0.03
|
|
||||||||||
|
Equity Investments Total
|
$
|
17,456
|
|
$
|
20,242
|
|
1.90
|
%
|
|||||||||||||||
|
Total investments—non-controlled/non-affiliated
|
$
|
1,799,751
|
|
$
|
1,731,319
|
|
162.59
|
%
|
|||||||||||||||
|
Investments—non-controlled/affiliated
|
Footnotes
|
Industry
|
Reference Rate & Spread
(2)
|
Interest Rate
(2)
|
Acquisition Date
|
Maturity Date
|
Par/ Principal Amount
|
Amortized Cost
(4)
|
Fair Value
(5)
|
% of Net Assets
|
|||||||||||||||||||
|
First Lien Debt (0.72%)
|
|||||||||||||||||||||||||||||
|
TwentyEighty, Inc. - Revolver
|
^
|
(2) (3) (13) (14)
|
Business Services
|
L + 8.00%
|
10.90%
|
1/31/2017
|
3/21/2020
|
$
|
—
|
|
$
|
(3
|
)
|
$
|
—
|
|
—
|
%
|
|||||||||||
|
TwentyEighty, Inc. - (Term A Loans)
|
^
|
(2) (3) (13)
|
Business Services
|
L + 8.00%
|
11.06%
|
1/31/2017
|
3/21/2020
|
316
|
|
315
|
|
316
|
|
0.03
|
|
||||||||||||||
|
TwentyEighty, Inc. - (Term B Loans)
|
^
|
(13)
|
Business Services
|
N/A
|
8.00% (4.00%
cash, 4.00% PIK) |
1/31/2017
|
3/21/2020
|
6,995
|
|
6,853
|
|
6,855
|
|
0.72
|
|
||||||||||||||
|
TwentyEighty, Inc. - (Term C Loans)
|
^
|
(13)
|
Business Services
|
N/A
|
9.00% (0.25%
cash, 8.75% PIK) |
1/31/2017
|
3/21/2020
|
7,123
|
|
6,674
|
|
6,981
|
|
0.73
|
|
||||||||||||||
|
First Lien Debt Total
|
$
|
14,434
|
|
$
|
13,839
|
|
$
|
14,152
|
|
1.48
|
%
|
||||||||||||||||||
|
Investments—non-controlled/affiliated
|
Footnotes
|
Industry
|
Acquisition Date
|
Shares/ Units
|
Cost
|
Fair
Value (5) |
% of Net Assets
|
|||||||||||||||
|
Equity Investments (0.22%)
|
||||||||||||||||||||||
|
TwentyEighty Investors LLC
|
^
|
(7) (13)
|
Business Services
|
1/31/2017
|
69,786
|
|
$
|
—
|
|
$
|
4,391
|
|
0.46
|
%
|
||||||||
|
Equity Investments Total
|
$
|
—
|
|
$
|
4,391
|
|
0.41
|
%
|
||||||||||||||
|
Total investments—non-controlled/affiliated
|
$
|
13,839
|
|
$
|
18,543
|
|
1.89
|
%
|
||||||||||||||
107
TCG BDC, INC.
CONSOLIDATED SCHEDULE OF INVESTMENTS (Continued)
As of December 31, 2018
(dollar amounts in thousands)
|
Investments—controlled/affiliated
|
Industry
|
Reference Rate & Spread
(2)
|
Interest Rate
(2)
|
Acquisition Date
|
Maturity Date
|
Par Amount/ LLC Interest
|
Cost
|
Fair Value
(7)
|
% of Net Assets
|
|||||||||||||||||||||
|
Investment Fund (11.34%)
|
||||||||||||||||||||||||||||||
|
Middle Market Credit Fund, LLC, Mezzanine Loan
|
^
|
(2) (8) (9) (11)
|
Investment Fund
|
L+9.00%
|
11.47%
|
6/30/2016
|
3/22/2019
|
$
|
112,000
|
|
$
|
112,000
|
|
$
|
112,000
|
|
11.71
|
%
|
||||||||||||
|
Middle Market Credit Fund, LLC, Subordinated Loan and Member’s Interest
|
^
|
(8) (11)
|
Investment Fund
|
N/A
|
0.001%
|
2/29/2016
|
3/1/2021
|
118,001
|
|
118,001
|
|
110,295
|
|
11.53
|
%
|
|||||||||||||||
|
Investment Fund Total
|
$
|
230,001
|
|
$
|
230,001
|
|
$
|
222,295
|
|
23.24
|
%
|
|||||||||||||||||||
|
Total investments—controlled/affiliated
|
$
|
230,001
|
|
$
|
230,001
|
|
$
|
222,295
|
|
23.24
|
%
|
|||||||||||||||||||
|
Total investments
|
$
|
2,073,835
|
|
$
|
2,043,591
|
|
$
|
1,972,157
|
|
187.72
|
%
|
|||||||||||||||||||
^ Denotes that all or a portion of the assets are owned by TCG BDC, Inc. (together with its consolidated subsidiaries, “we,” “us,” “our,” “TCG BDC” or the “Company”). The Company has entered into a senior secured revolving credit facility (as amended, the “Credit Facility” and, together with the SPV Credit Facility, the “Facilities”). The lenders of the Credit Facility have a first lien security interest in substantially all of the portfolio investments held by the Company (see Note 6, Borrowings, to these consolidated financial statements). Accordingly, such assets are not available to creditors of the SPV or the 2015-1 Issuer.
+ Denotes that all or a portion of the assets are owned by the Company’s wholly owned subsidiary, TCG BDC SPV LLC (the “SPV”). The SPV has entered into a senior secured revolving credit facility (as amended, the “SPV Credit Facility”). The lenders of the SPV Credit Facility have a first lien security interest in substantially all of the assets of the SPV (see Note 6, Borrowings, to these consolidated financial statements). Accordingly, such assets are not available to creditors of the Company or Carlyle Direct Lending CLO 2015-1R LLC (formerly known as Carlyle GMS Finance MM CLO 2015-1 LLC) (the “2015-1 Issuer”).
* Denotes that all or a portion of the assets are owned by the 2015-1 Issuer and secure the notes issued in connection with a term debt securitization completed by the Company on June 26, 2015 (see Note 7, Notes Payable, to these consolidated financial statements). Accordingly, such assets are not available to the creditors of the SPV or the Company.
|
(1)
|
Unless otherwise indicated, issuers of debt and equity investments held by the Company are domiciled in the United States. Under the Investment Company Act of 1940, as amended (together with the rules and regulations promulgated thereunder, the “Investment Company Act”), the Company would be deemed to “control” a portfolio company if the Company owned more than 25% of its outstanding voting securities and/or held the power to exercise control over the management or policies of the portfolio company. As of
December 31, 2018
, the Company does not “control” any of these portfolio companies. Under the Investment Company Act, the Company would be deemed an “affiliated person” of a portfolio company if the Company owns 5% or more of the portfolio company’s outstanding voting securities. As of
December 31, 2018
, the Company is not an “affiliated person” of any of these portfolio companies. Certain portfolio company investments are subject to contractual restrictions on sales.
|
|
(2)
|
Variable rate loans to the portfolio companies bear interest at a rate that is determined by reference to either LIBOR (“L”) or an alternate base rate (commonly based on the Federal Funds Rate or the U.S. Prime Rate), which generally resets quarterly. For each such loan, the Company has indicated the reference rate used and provided the spread and the interest rate in effect as of
December 31, 2018
. As of
December 31, 2018
, the reference rates for our variable rate loans were the 30-day LIBOR at
2.50%
, the 90-day LIBOR at
2.81%
and the 180-day LIBOR at
2.88%
.
|
|
(3)
|
Loan includes interest rate floor feature, which is generally 1.00%.
|
|
(4)
|
Amortized cost represents original cost, including origination fees and upfront fees received that are deemed to be an adjustment to yield, adjusted for the accretion/amortization of discounts/premiums, as applicable, on debt investments using the effective interest method.
|
|
(5)
|
Fair value is determined in good faith by or under the direction of the Board of Directors of the Company (see Note 2, Significant Accounting Policies, and Note 3, Fair Value Measurements, to these consolidated financial statements), pursuant to the Company’s valuation policy. The fair value of all first lien and second lien debt investments, equity investments and the investment fund mezzanine loan was determined using significant unobservable inputs.
|
|
(6)
|
Amortized cost represents original cost, including origination fees and upfront fees received that are deemed to be an adjustment to yield, adjusted for the accretion/amortization of discounts/premiums, as applicable, on debt investments using the effective interest method.
|
|
(7)
|
Security acquired in transaction exempt from registration under the Securities Act of 1933, as amended (the “Securities Act”), and may be deemed to be “restricted securities” under the Securities Act, unless otherwise noted. As of
December 31, 2018
, the aggregate fair value of these securities is
$24,633
, or
2.58%
of the Company’s net assets.
|
|
(8)
|
The Company has determined the indicated investments are non-qualifying assets under Section 55(a) of the Investment Company Act. Under the Investment Company Act, the Company may not acquire any non-qualifying assets unless, at the time such acquisition is made, qualifying assets represent at least 70% of the Company’s total assets.
|
|
(9)
|
Represents a corporate mezzanine loan, which is subordinated to senior secured term loans of the portfolio company/investment fund.
|
|
(10)
|
Loan was on non-accrual status as of
December 31, 2018
.
|
|
(11)
|
Under the Investment Company Act, the Company is deemed to be an “affiliated person” of and “control” this investment fund because the Company owns more than 25% of the investment fund’s outstanding voting securities and/or has the power to exercise control over management or policies of such investment fund. See Note 5, Middle Market Credit Fund, LLC, to these consolidated financial statements for more details. Transactions related to investments in controlled affiliates for the year ended
December 31, 2018
were as follows:
|
108
TCG BDC, INC.
CONSOLIDATED SCHEDULE OF INVESTMENTS (Continued)
As of December 31, 2018
(dollar amounts in thousands)
|
Investments—controlled/affiliated
|
Fair Value as of December 31, 2017
|
Additions/ Purchases
|
Reductions/ Sales/ Paydowns
|
Net Realized Gain (Loss)
|
Net Change in Unrealized Appreciation (Depreciation)
|
Fair Value as of December 31, 2018
|
Dividend and Interest Income
|
||||||||||||||||||||
|
Middle Market Credit Fund, LLC, Mezzanine Loan
|
$
|
85,750
|
|
$
|
120,150
|
|
$
|
(93,900
|
)
|
$
|
—
|
|
$
|
—
|
|
$
|
112,000
|
|
$
|
12,481
|
|
||||||
|
Middle Market Credit Fund, LLC, Subordinated Loan and Member’s Interest
|
86,766
|
|
31,500
|
|
—
|
|
—
|
|
(6,083
|
)
|
110,295
|
|
15,750
|
|
|||||||||||||
|
Total investments—controlled/affiliated
|
$
|
172,516
|
|
$
|
151,650
|
|
$
|
(93,900
|
)
|
$
|
—
|
|
$
|
(6,083
|
)
|
$
|
222,295
|
|
$
|
28,231
|
|
||||||
|
(12)
|
In addition to the interest earned based on the stated interest rate of this loan, which is the amount reflected in this schedule, the Company is entitled to receive additional interest as a result of an agreement among lenders as follows: Dimensional Dental Management, LLC (
4.51%
), EIP Merger Sub, LLC (Evolve IP) (
3.75%
), Legacy.com Inc. (
4.00%
), Payment Alliance International Inc. (
3.06%
), Prime Risk Partners, Inc. (
2.88%
), Product Quest Manufacturing, LLC (
3.54%
), Surgical Information Systems, LLC (
0.89%
) and The Hilb Group, LLC (
3.33%
). Pursuant to the agreement among lenders in respect of this loan, this investment represents a first lien/last out loan, which has a secondary priority behind the first lien/first out loan with respect to principal, interest and other payments.
|
|
(13)
|
Under the Investment Company Act, the Company is deemed an “affiliated person” of this portfolio company because the Company owns 5% or more of the portfolio company’s outstanding voting securities. Transactions related to investments in non-controlled affiliates for the year ended
December 31, 2018
were as follows:
|
|
Investments—non-controlled/affiliated
|
Fair Value as of December 31, 2017
|
Purchases/ Paid-in-kind interest
|
Sales/ Paydowns
|
Net Accretion of Discount
|
Net Realized Gain (Loss)
|
Net Change in Unrealized Appreciation (Depreciation)
|
Fair value as of December 31, 2018
|
Interest Income
|
|||||||||||||||||||||||
|
TwentyEighty, Inc. - Revolver
|
$
|
(20
|
)
|
$
|
—
|
|
$
|
—
|
|
$
|
3
|
|
$
|
—
|
|
$
|
17
|
|
$
|
—
|
|
$
|
3
|
|
|||||||
|
TwentyEighty, Inc. - (Term A Loans)
|
3,760
|
|
—
|
|
(3,574
|
)
|
18
|
|
—
|
|
112
|
|
316
|
|
264
|
|
|||||||||||||||
|
TwentyEighty, Inc. - (Term B Loans)
|
6,360
|
|
240
|
|
—
|
|
119
|
|
—
|
|
136
|
|
6,855
|
|
654
|
|
|||||||||||||||
|
TwentyEighty, Inc. - (Term C Loans)
|
5,331
|
|
602
|
|
—
|
|
158
|
|
—
|
|
890
|
|
6,981
|
|
759
|
|
|||||||||||||||
|
TwentyEighty Investors LLC (Equity)
|
—
|
|
—
|
|
—
|
|
—
|
|
—
|
|
4,391
|
|
4,391
|
|
—
|
|
|||||||||||||||
|
Total investments—non-controlled/affiliated
|
$
|
15,431
|
|
$
|
842
|
|
$
|
(3,574
|
)
|
$
|
298
|
|
$
|
—
|
|
$
|
5,546
|
|
$
|
18,543
|
|
$
|
1,680
|
|
|||||||
|
(14)
|
As of
December 31, 2018
, the Company had the following unfunded commitments to fund delayed draw and revolving senior secured loans:
|
|
Investments—non-controlled/non-affiliated
|
Type
|
Unused Fee
|
Par/ Principal Amount
|
Fair Value
|
||||||||
|
First and Second Lien Debt—unfunded delayed draw and revolving term loans commitments
|
||||||||||||
|
Advanced Instruments, LLC
|
Revolver
|
0.50%
|
$
|
1,167
|
|
$
|
(9
|
)
|
||||
|
Aero Operating LLC (Dejana Industries, Inc.)
|
Revolver
|
1.00
|
202
|
|
(2
|
)
|
||||||
|
AMS Group HoldCo, LLC
|
Delayed Draw
|
1.00
|
4,009
|
|
(95
|
)
|
||||||
|
AMS Group HoldCo, LLC
|
Revolver
|
0.50
|
810
|
|
(19
|
)
|
||||||
|
Analogic Corporation
|
Revolver
|
0.50
|
3,365
|
|
(73
|
)
|
||||||
|
Captive Resources Midco, LLC
|
Delayed Draw
|
1.25
|
3,572
|
|
(31
|
)
|
||||||
|
Captive Resources Midco, LLC
|
Revolver
|
0.50
|
2,143
|
|
(18
|
)
|
||||||
|
Investments—non-controlled/non-affiliated
|
Type
|
Unused Fee
|
Par/ Principal Amount
|
Fair Value
|
||||||||
109
TCG BDC, INC.
CONSOLIDATED SCHEDULE OF INVESTMENTS (Continued)
As of December 31, 2018
(dollar amounts in thousands)
|
Chemical Computing Group ULC
|
Revolver
|
0.50%
|
$
|
903
|
|
$
|
(10
|
)
|
||||
|
CIP Revolution Holdings, LLC
|
Revolver
|
0.50
|
532
|
|
(6
|
)
|
||||||
|
CircusTrix Holdings, LLC
|
Delayed Draw
|
1.00
|
1,115
|
|
(26
|
)
|
||||||
|
Comar Holding Company, LLC
|
Delayed Draw
|
1.00
|
5,136
|
|
(87
|
)
|
||||||
|
Comar Holding Company, LLC
|
Revolver
|
0.50
|
2,129
|
|
(36
|
)
|
||||||
|
Continuum Managed Services HoldCo, LLC
|
Revolver
|
0.50
|
2,500
|
|
(43
|
)
|
||||||
|
Datto, Inc.
|
Revolver
|
0.50
|
726
|
|
(7
|
)
|
||||||
|
DermaRite Industries LLC
|
Revolver
|
0.50
|
1,324
|
|
(52
|
)
|
||||||
|
Derm Growth Partners III, LLC (Dermatology Associates)
|
Revolver
|
0.50
|
968
|
|
(12
|
)
|
||||||
|
Direct Travel, Inc.
|
Delayed Draw
|
1.00
|
1,872
|
|
(16
|
)
|
||||||
|
FWR Holding Corporation
|
Revolver
|
0.50
|
2,778
|
|
(20
|
)
|
||||||
|
Frontline Technologies Holdings, LLC
|
Delayed Draw
|
1.00
|
7,705
|
|
(59
|
)
|
||||||
|
GRO Sub Holdco, LLC (Grand Rapids)
|
Delayed Draw
|
1.00
|
7,000
|
|
(85
|
)
|
||||||
|
GRO Sub Holdco, LLC (Grand Rapids)
|
Revolver
|
0.50
|
1,071
|
|
(13
|
)
|
||||||
|
iCIMS, Inc.
|
Revolver
|
0.50
|
1,252
|
|
(43
|
)
|
||||||
|
Innovative Business Services, LLC
|
Delayed Draw
|
1.00
|
3,886
|
|
(62
|
)
|
||||||
|
Innovative Business Services, LLC
|
Revolver
|
0.50
|
2,232
|
|
(36
|
)
|
||||||
|
National Carwash Solutions, Inc.
|
Delayed Draw
|
1.00
|
3,817
|
|
(57
|
)
|
||||||
|
National Carwash Solutions, Inc.
|
Revolver
|
0.50
|
632
|
|
(9
|
)
|
||||||
|
National Technical Systems, Inc.
|
Revolver
|
0.50
|
2,500
|
|
(6
|
)
|
||||||
|
NMI AcquisitionCo, Inc.
|
Revolver
|
0.50
|
435
|
|
(16
|
)
|
||||||
|
North American Dental Management, LLC
|
Delayed Draw
|
1.00
|
3,002
|
|
(52
|
)
|
||||||
|
Northland Telecommunications Corporation
|
Revolver
|
0.50
|
1,702
|
|
(24
|
)
|
||||||
|
Pharmalogic Holdings Corp.
|
Delayed Draw
|
1.00
|
237
|
|
—
|
|
||||||
|
PPC Flexible Packaging, LLC
|
Revolver
|
0.50
|
1,737
|
|
(16
|
)
|
||||||
|
Prime Risk Partners, Inc.
|
Delayed Draw
|
0.50
|
457
|
|
(10
|
)
|
||||||
|
Prime Risk Partners, Inc.
|
Delayed Draw
|
0.50
|
5,694
|
|
(175
|
)
|
||||||
|
Product Quest Manufacturing, LLC
|
Revolver
|
0.50
|
1,906
|
|
—
|
|
||||||
|
PricewaterhouseCoopers Public Sector LLP
|
Revolver
|
0.50
|
6,250
|
|
(160
|
)
|
||||||
|
SPay, Inc.
|
Delayed Draw
|
1.00
|
10,227
|
|
(197
|
)
|
||||||
|
SPay, Inc.
|
Revolver
|
0.50
|
546
|
|
(19
|
)
|
||||||
|
Sapphire Convention, Inc.
|
Revolver
|
0.50
|
4,528
|
|
(81
|
)
|
||||||
|
Smile Doctors, LLC
|
Delayed Draw
|
1.00
|
6,394
|
|
(97
|
)
|
||||||
|
Smile Doctors, LLC
|
Revolver
|
0.50
|
51
|
|
(1
|
)
|
||||||
|
Investments—non-controlled/non-affiliated
|
Type
|
Unused Fee
|
Par/ Principal Amount
|
Fair Value
|
||||||||
110
TCG BDC, INC.
CONSOLIDATED SCHEDULE OF INVESTMENTS (Continued)
As of December 31, 2018
(dollar amounts in thousands)
|
Superior Health Linens, LLC
|
Revolver
|
0.50%
|
$
|
1,867
|
|
$
|
(21
|
)
|
|||
|
T2 Systems, Inc.
|
Revolver
|
0.50
|
1,760
|
|
(10
|
)
|
|||||
|
TSB Purchaser, Inc. (Teaching Strategies, LLC)
|
Revolver
|
0.50
|
1,891
|
|
(36
|
)
|
|||||
|
The Hilb Group, LLC
|
Delayed Draw
|
1.00
|
11,262
|
|
(185
|
)
|
|||||
|
Trump Card, LLC
|
Revolver
|
0.50
|
635
|
|
(9
|
)
|
|||||
|
TwentyEighty, Inc. (f/k/a Miller Heiman, Inc.)
|
Revolver
|
0.50
|
607
|
|
—
|
|
|||||
|
USLS Acquisition, Inc.
|
Delayed Draw
|
1.00
|
4,137
|
|
(98
|
)
|
|||||
|
USLS Acquisition, Inc.
|
Revolver
|
0.50
|
1,418
|
|
(34
|
)
|
|||||
|
VRC Companies, LLC
|
Delayed Draw
|
1.00
|
2,481
|
|
(33
|
)
|
|||||
|
VRC Companies, LLC
|
Revolver
|
0.50
|
1,227
|
|
(16
|
)
|
|||||
|
Westfall Technik, Inc.
|
Delayed Draw
|
1.00
|
15,259
|
|
(372
|
)
|
|||||
|
Westfall Technik, Inc.
|
Revolver
|
0.50
|
2,155
|
|
(53
|
)
|
|||||
|
Zemax Software Holdings, LLC
|
Revolver
|
0.50
|
1,284
|
|
(12
|
)
|
|||||
|
Zenith Merger Sub, Inc.
|
Revolver
|
0.50
|
2,622
|
|
(20
|
)
|
|||||
|
Total unfunded commitments
|
$
|
157,117
|
|
$
|
(2,679
|
)
|
|||||
As of
December 31, 2018
, investments at fair value consisted of the following:
|
Type
|
Amortized Cost
|
Fair Value
|
% of Fair Value
|
||||||||
|
First Lien Debt (excluding First Lien/Last Out)
|
$
|
1,375,437
|
|
$
|
1,343,422
|
|
68.12
|
%
|
|||
|
First Lien/Last Out Unitranche
|
241,263
|
|
202,849
|
|
10.29
|
|
|||||
|
Second Lien Debt
|
179,434
|
|
178,958
|
|
9.07
|
|
|||||
|
Equity Investments
|
17,456
|
|
24,633
|
|
1.25
|
|
|||||
|
Investment Fund
|
230,001
|
|
222,295
|
|
11.27
|
|
|||||
|
Total
|
$
|
2,043,591
|
|
$
|
1,972,157
|
|
100.00
|
%
|
|||
The rate type of debt investments at fair value as of
December 31, 2018
was as follows:
|
Rate Type
|
Amortized Cost
|
Fair Value
|
% of Fair Value of First and Second Lien Debt
|
||||||||
|
Floating Rate
|
$
|
1,782,607
|
|
$
|
1,711,393
|
|
99.20
|
%
|
|||
|
Fixed Rate
|
13,527
|
|
13,836
|
|
0.80
|
|
|||||
|
Total
|
$
|
1,796,134
|
|
$
|
1,725,229
|
|
100.00
|
%
|
|||
111
TCG BDC, INC.
CONSOLIDATED SCHEDULE OF INVESTMENTS (Continued)
As of December 31, 2018
(dollar amounts in thousands)
The industry composition of investments at fair value as of
December 31, 2018
was as follows:
|
Industry
|
Amortized Cost
|
Fair Value
|
% of Fair Value
|
||||||||
|
Aerospace & Defense
|
$
|
27,859
|
|
$
|
28,000
|
|
1.42
|
%
|
|||
|
Automotive
|
6,547
|
|
6,603
|
|
0.33
|
|
|||||
|
Banking, Finance, Insurance & Real Estate
|
127,078
|
|
127,942
|
|
6.49
|
|
|||||
|
Beverage, Food & Tobacco
|
73,861
|
|
74,283
|
|
3.77
|
|
|||||
|
Business Services
|
156,800
|
|
162,545
|
|
8.24
|
|
|||||
|
Chemicals, Plastics & Rubber
|
22,705
|
|
22,298
|
|
1.13
|
|
|||||
|
Construction & Building
|
2,492
|
|
2,496
|
|
0.13
|
|
|||||
|
Consumer Services
|
30,142
|
|
29,742
|
|
1.51
|
|
|||||
|
Containers, Packaging & Glass
|
79,714
|
|
47,356
|
|
2.40
|
|
|||||
|
Durable Consumer Goods
|
755
|
|
988
|
|
0.05
|
|
|||||
|
Energy: Electricity
|
42,866
|
|
42,922
|
|
2.18
|
|
|||||
|
Energy: Oil & Gas
|
11,833
|
|
12,068
|
|
0.61
|
|
|||||
|
Environmental Industries
|
35,604
|
|
35,835
|
|
1.82
|
|
|||||
|
Forest Products & Paper
|
49,964
|
|
49,437
|
|
2.51
|
|
|||||
|
Healthcare & Pharmaceuticals
|
244,142
|
|
233,135
|
|
11.82
|
|
|||||
|
High Tech Industries
|
242,819
|
|
241,305
|
|
12.24
|
|
|||||
|
Hotel, Gaming & Leisure
|
77,952
|
|
76,685
|
|
3.89
|
|
|||||
|
Investment Fund
|
230,001
|
|
222,295
|
|
11.27
|
|
|||||
|
Media: Broadcast & Subscription
|
21,297
|
|
21,311
|
|
1.08
|
|
|||||
|
Media: Advertising, Printing & Publishing
|
58,690
|
|
58,712
|
|
2.98
|
|
|||||
|
Non-durable Consumer Goods
|
57,996
|
|
49,947
|
|
2.53
|
|
|||||
|
Software
|
124,734
|
|
124,231
|
|
6.30
|
|
|||||
|
Sovereign & Public Finance
|
38,568
|
|
38,526
|
|
1.95
|
|
|||||
|
Telecommunications
|
124,120
|
|
113,984
|
|
5.78
|
|
|||||
|
Transportation: Cargo
|
71,686
|
|
71,443
|
|
3.62
|
|
|||||
|
Transportation: Consumer
|
36,210
|
|
36,562
|
|
1.85
|
|
|||||
|
Wholesale
|
47,156
|
|
41,506
|
|
2.10
|
|
|||||
|
Total
|
$
|
2,043,591
|
|
$
|
1,972,157
|
|
100.00
|
%
|
|||
The geographical composition of investments at fair value as of
December 31, 2018
was as follows:
|
Geography
|
Amortized Cost
|
Fair Value
|
% of Fair Value
|
||||||||
|
Canada
|
$
|
15,636
|
|
$
|
15,617
|
|
0.79
|
%
|
|||
|
United Kingdom
|
9,833
|
|
9,695
|
|
0.49
|
|
|||||
|
United States
|
2,018,122
|
|
1,946,845
|
|
98.72
|
|
|||||
|
Total
|
$
|
2,043,591
|
|
$
|
1,972,157
|
|
100.00
|
%
|
|||
The accompanying notes are an integral part of these consolidated financial statements.
112
TCG BDC, INC.
NOTES TO CONSOLIDATED FINANCIAL STATEMENTS
As of
December 31, 2019
(dollar amounts in thousands, except per share data)
1. ORGANIZATION
TCG BDC, Inc. (together with its consolidated subsidiaries, “we,” “us,” “our,” “TCG BDC” or the “Company”) is a Maryland corporation formed on February 8, 2012, and structured as an externally managed, non-diversified closed-end investment company. The Company is managed by its investment adviser, Carlyle Global Credit Investment Management L.L.C. (“CGCIM” or “Investment Adviser”), a wholly owned subsidiary of The Carlyle Group Inc. The Company has elected to be regulated as a business development company (“BDC”) under the Investment Company Act of 1940, as amended (together with the rules and regulations promulgated thereunder, the “Investment Company Act”). In addition, the Company has elected to be treated, and intends to continue to comply with the requirements to qualify annually, as a regulated investment company (“RIC”) under Subchapter M of the Internal Revenue Code of 1986, as amended (together with the rules and regulations promulgated thereunder, the “Code”).
The Company’s investment objective is to generate current income and capital appreciation primarily through debt investments in U.S. middle market companies. The Company's core investment strategy focuses on lending to U.S. middle market companies, which the Company defines as companies with approximately $25 million to $100 million of earnings before interest, taxes, depreciation and amortization (“EBITDA”), which the Company believes is a useful proxy for cash flow. The Company complements this core strategy with additive, diversifying assets including, but not limited to, specialty lending investments. The Company seeks to achieve its investment objective primarily through direct origination of secured debt instruments, including first lien senior secured loans (which may include stand-alone first lien loans, first lien/last out loans and “unitranche” loans) and second lien senior secured loans (collectively, “Middle Market Senior Loans”), with the balance of its assets invested in higher yielding investments (which may include unsecured debt, mezzanine debt and investments in equities). The Middle Market Senior Loans are generally made to private U.S. middle market companies that are, in many cases, controlled by private equity firms. Depending on market conditions, the Company expects that between 70% and 80% of the value of its assets will be invested in Middle Market Senior Loans. The Company expects that the composition of its portfolio will change over time given the Investment Adviser’s view on, among other things, the economic and credit environment (including with respect to interest rates) in which the Company is operating.
The Company invests primarily in loans to middle market companies whose debt, if rated, is rated below investment grade, and, if not rated, would likely be rated below investment grade if it were rated (that is, below BBB- or Baa3, which is often referred to as “junk”). Exposure to below investment grade instruments involves certain risks, including speculation with respect to the borrower’s capacity to pay interest and repay principal.
On May 2, 2013, the Company completed its initial closing of capital commitments (the “Initial Closing”) and subsequently commenced substantial investment operations. Effective March 15, 2017, the Company changed its name from “Carlyle GMS Finance, Inc.” to “TCG BDC, Inc.” On June 19, 2017, the Company closed its initial public offering (“IPO”), issuing 9,454,200 shares of its common stock (including shares issued pursuant to the exercise of the underwriters’ over-allotment option on July 5, 2017) at a public offering price of $18.50 per share. Net of underwriting costs, the Company received cash proceeds of $169,488. Shares of common stock of TCG BDC began trading on the Nasdaq Global Select Market under the symbol “CGBD” on June 14, 2017.
Until December 31, 2017, the Company was an “emerging growth company,” as that term is used in the Jumpstart Our Business Startups Act of 2012. As of June 30, 2017, the market value of the common stock held by non-affiliates exceeded $700,000. Accordingly, the Company ceased to be an emerging growth company as of December 31, 2017.
The Company is externally managed by the Investment Adviser, an investment adviser registered under the Investment Advisers Act of 1940, as amended. Carlyle Global Credit Administration L.L.C. (“CGCA” or the “Administrator”) provides the administrative services necessary for the Company to operate. Both the Investment Adviser and the Administrator are wholly owned subsidiaries of Carlyle Investment Management L.L.C., a subsidiary of The Carlyle Group Inc. “Carlyle” refers to The Carlyle Group Inc. and its affiliates and its consolidated subsidiaries (other than portfolio companies of its affiliated funds), a global alternative asset manager publicly traded on the Nasdaq Global Select Market under the symbol “CG”. Refer to the sec.gov website for further information on Carlyle.
113
TCG BDC SPV LLC (the “SPV”) is a Delaware limited liability company that was formed on January 3, 2013. The SPV invests in first and second lien senior secured loans. The SPV is a wholly owned subsidiary of the Company and is consolidated in these consolidated financial statements commencing from the date of its formation, January 3, 2013. Effective March 15, 2017, the SPV changed its name from “Carlyle GMS Finance SPV LLC” to “TCG BDC SPV LLC”.
On June 9, 2017, pursuant to the Agreement and Plan of Merger, dated May 3, 2017 (the “Agreement”), by and between the Company and NF Investment Corp. (“NFIC”), NFIC merged with and into the Company (the “NFIC Acquisition”), with the Company as the surviving entity. The NFIC Acquisition was accounted for as an asset acquisition. NFIC SPV LLC (the “NFIC SPV” and, together with the SPV, the “SPVs”) is a Delaware limited liability company that was formed on June 18, 2013. Upon the consummation of the NFIC Acquisition, the NFIC SPV became a wholly owned subsidiary of the Company and is consolidated in these consolidated financial statements commencing from the closing date of the NFIC Acquisition, June 9, 2017.
On June 26, 2015, the Company completed a $400,000 term debt securitization (the “2015-1 Debt Securitization”). The notes offered in the 2015-1 Debt Securitization (the “2015-1 Notes”) were issued by Carlyle Direct Lending CLO 2015-1R LLC (formerly known as Carlyle GMS Finance MM CLO 2015-1 LLC) (the “2015-1 Issuer”), a wholly owned and consolidated subsidiary of the Company. On August 30, 2018, the 2015-1 Issuer refinanced the 2015-1 Debt Securitization (the “2015-1 Debt Securitization Refinancing”) by redeeming in full the 2015-1 Notes and issuing new notes (the “2015-1R Notes”). The 2015-1R Notes are secured by a diversified portfolio of the 2015-1 Issuer consisting primarily of first and second lien senior secured loans. Refer to Note
7
to these consolidated financial statements for details. The 2015-1 Issuer is consolidated in these consolidated financial statements commencing from the date of its formation, May 8, 2015.
On February 29, 2016, the Company and Credit Partners USA LLC (“Credit Partners”) entered into an amended and restated limited liability company agreement, which was subsequently amended on June 24, 2016 (as amended, the “Limited Liability Company Agreement”) to co-manage Middle Market Credit Fund, LLC (“Credit Fund”). Credit Fund primarily invests in first lien loans of middle market companies. Credit Fund is managed by a six-member board of managers, on which the Company and Credit Partners each have equal representation. The Company and Credit Partners each have 50% economic ownership of Credit Fund and have commitments to fund, from time to time, capital of up to $400,000 each. Refer to Note 5, Middle Market Credit Fund, LLC, to these consolidated financial statements for details.
As a BDC, the Company is required to comply with certain regulatory requirements. As part of these requirements, the Company must not acquire any assets other than “qualifying assets” specified in the Investment Company Act unless, at the time the acquisition is made, at least 70% of its total assets are qualifying assets (with certain limited exceptions).
To qualify as a RIC, the Company must, among other things, meet certain source-of-income and asset diversification requirements and timely distribute to its stockholders generally at least 90% of its investment company taxable income, as defined by the Code, for each year. Pursuant to this election, the Company generally does not have to pay corporate level taxes on any income that it distributes to stockholders, provided that the Company satisfies those requirements.
2. SIGNIFICANT ACCOUNTING POLICIES
Basis of Presentation
The consolidated financial statements have been prepared on the accrual basis of accounting in accordance with accounting principles generally accepted in the United States (“U.S. GAAP”). The Company is an investment company for the purposes of accounting and financial reporting in accordance with Financial Accounting Standards Board ("FASB") Accounting Standards Codification (“ASC”) Topic 946,
Financial Services—Investment Companies
(“ASC 946”)
.
The consolidated financial statements include the accounts of the Company and its wholly owned subsidiaries, the SPVs and the 2015-1 Issuer. All significant intercompany balances and transactions have been eliminated. U.S. GAAP for an investment company requires investments to be recorded at fair value. The carrying value for all other assets and liabilities approximates their fair value.
The annual financial statements have been prepared in accordance with U.S. GAAP for annual financial information and pursuant to the requirements for reporting on Form 10-K and Article 6 of Regulation S-X. In the opinion of management, all adjustments considered necessary for the fair presentation of consolidated financial statements for the years presented have been included.
114
Use of Estimates
The preparation of consolidated financial statements in conformity with U.S. GAAP requires management to make assumptions and estimates that affect the reported amounts of assets and liabilities and disclosure of contingent assets and liabilities at the date of the financial statements and the reported amounts of revenues and expenses during the reporting period. Management’s estimates are based on historical experiences and other factors, including expectations of future events that management believes to be reasonable under the circumstances. It also requires management to exercise judgment in the process of applying the Company’s accounting policies. Assumptions and estimates regarding the valuation of investments and their resulting impact on base management and incentive fees involve a higher degree of judgment and complexity and these assumptions and estimates may be significant to the consolidated financial statements. Actual results could differ from these estimates and such differences could be material.
Investments
Investment transactions are recorded on the trade date. Realized gains or losses are measured by the difference between the net proceeds from the repayment or sale and the amortized cost basis of the investment using the specific identification method without regard to unrealized appreciation or depreciation previously recognized, and includes investments charged off during the period, net of recoveries. Net change in unrealized appreciation or depreciation on investments as presented in the accompanying Consolidated Statements of Operations reflects the net change in the fair value of investments, including the reversal of previously recorded unrealized appreciation or depreciation when gains or losses are realized. See Note
3
to these consolidated financial statements for further information about fair value measurements.
Cash and Cash Equivalents
Cash and cash equivalents consist of demand deposits and highly liquid investments (e.g., money market funds, U.S. treasury notes) with original maturities of three months or less. Cash equivalents are carried at amortized cost, which approximates fair value. The Company’s cash and cash equivalents are held with two large financial institutions and cash held in such financial institutions may, at times, exceed the Federal Deposit Insurance Corporation insured limit.
Revenue Recognition
Interest from Investments and Realized Gain/Loss on Investments
Interest income is recorded on an accrual basis and includes the accretion of discounts and amortization of premiums. Discounts from and premiums to par value on debt investments purchased are accreted/amortized into interest income over the life of the respective security using the effective interest method. The amortized cost of debt investments represents the original cost, including origination fees and upfront fees received that are deemed to be an adjustment to yield, adjusted for the accretion of discounts and amortization of premiums, if any. At time of exit, the realized gain or loss on an investment is the difference between the amortized cost at time of exit and the cash received at exit using the specific identification method.
The Company may have loans in its portfolio that contain payment-in-kind (“PIK”) provisions. PIK represents interest that is accrued and recorded as interest income at the contractual rates, increases the loan principal on the respective capitalization dates, and is generally due at maturity. Such income is included in interest income in the Consolidated Statements of Operations. As of
December 31, 2019
and
2018
, the fair value of the loans in the portfolio with PIK provisions was
$164,902
and $
15,451
, respectively. For the years ended
December 31, 2019
,
2018
and
2017
, the Company earned
$6,596
,
$3,239
, and
$1,057
in PIK income included in interest income in the accompanying Consolidated Statements of Operations.
Dividend Income
Dividend income from the investment fund is recorded on the record date for the investment fund to the extent that such amounts are payable by the investment fund and are expected to be collected.
Other Income
Other income may include income such as consent, waiver, amendment, unused, underwriting and prepayment fees associated with the Company’s investment activities as well as any fees for managerial assistance services rendered by the Company to the portfolio companies. Such fees are recognized as income when earned or the services are rendered. The Company may receive fees for guaranteeing the outstanding debt of a portfolio company. Such fees are amortized into other income over the life of the guarantee. The unamortized amount, if any, is included in other assets in the accompanying
115
Consolidated Statements of Assets and Liabilities. For the years ended
December 31, 2019
,
2018
and
2017
, the Company earned
$7,329
,
$9,134
and
$10,526
, respectively, in other income, primarily from syndication and prepayment fees.
Non-Accrual Income
Loans are generally placed on non-accrual status when principal or interest payments are past due 30 days or more or when there is reasonable doubt that principal or interest will be collected in full. Accrued and unpaid interest is generally reversed when a loan is placed on non-accrual status. Interest payments received on non-accrual loans may be recognized as income or applied to principal depending upon management’s judgment regarding collectability. Non-accrual loans are restored to accrual status when past due principal and interest are paid current and, in management’s judgment, are likely to remain current. Management may not place a loan on non-accrual status if the loan has sufficient collateral value and is in the process of collection. As of
December 31, 2019
and
2018
, the fair value of the loans in the portfolio on non-accrual status was
$52,429
and
$14,327
, respectively. The remaining first and second lien debt investments were performing and current on their interest payments as of
December 31, 2019
and
2018
.
The Facilities, Senior Notes, 2015-1R Notes and 2015-1 Notes – Related Costs, Expenses and Deferred Financing Costs
Interest expense and unused commitment fees on the Facilities are recorded on an accrual basis. Unused commitment fees are included in credit facility fees in the accompanying Consolidated Statements of Operations.
The Facilities and the Senior Notes are recorded at carrying value, which approximates fair value.
Deferred financing costs include capitalized expenses related to the closing or amendments of the Facilities. Amortization of deferred financing costs for each credit facility is computed on the straight-line basis over the respective term of each credit facility. The unamortized balance of such costs is included in deferred financing costs in the accompanying Consolidated Statements of Assets and Liabilities. The amortization of such costs is included in credit facility fees in the accompanying Consolidated Statements of Operations.
Debt issuance costs include capitalized expenses including structuring and arrangement fees related to the offering of the 2015-1R Notes, 2015-1 Notes and Senior Notes. Amortization of debt issuance costs for the notes is computed on the effective yield method over the term of the notes, except for a portion that was accelerated in connection with the 2015-1 Debt Securitization Refinancing as described in Note 7 to these consolidated financial statements. The unamortized balance of such costs is presented as a direct deduction to the carrying amount of the notes in the accompanying Consolidated Statements of Assets and Liabilities. The amortization of such costs is included in interest expense in the accompanying Consolidated Statements of Operations.
The notes are recorded at carrying value, which approximates fair value.
Offering Costs
Offering costs consist primarily of fees and expenses incurred in connection with the offering of shares, including legal, underwriting, printing and other costs, as well as costs associated with the preparation and filing of applicable registration statements. Offering costs are charged against equity when incurred. During the year ended December 31, 2017,
$3,088
of offering costs were incurred, 50% of which were paid by the Investment Adviser.
Income Taxes
For federal income tax purposes, the Company has elected to be treated as a RIC under the Code, and intends to make the required distributions to its stockholders as specified therein. In order to qualify as a RIC, the Company must meet certain minimum distribution, source-of-income and asset diversification requirements. If such requirements are met, then the Company is generally required to pay income taxes only on the portion of its taxable income and gains it does not distribute.
The minimum distribution requirements applicable to RICs require the Company to distribute to its stockholders at least 90% of its investment company taxable income (“ICTI”), as defined by the Code, each year, although depending on the level of ICTI earned in a tax year, the Company may choose to carry forward ICTI in excess of the current year 90% distribution requirement into the next tax year. Any such carryover ICTI must be distributed before the end of that next tax year through a dividend declared prior to filing the final tax return related to the year which generated such ICTI.
116
In addition, based on the excise distribution requirements, the Company is subject to a 4% nondeductible federal excise tax on undistributed income unless the Company distributes in a timely manner an amount at least equal to the sum of (1) 98% of its ordinary income for each calendar year, (2) 98.2% of capital gain net income (both long-term and short-term) for the one-year period ending October 31 in that calendar year and (3) any income realized, but not distributed, in the preceding year. For this purpose, however, any ordinary income or capital gain net income retained by the Company that is subject to corporate income tax is considered to have been distributed. The Company intends to make sufficient distributions each taxable year to satisfy the excise distribution requirements.
The Company evaluates tax positions taken or expected to be taken in the course of preparing its consolidated financial statements to determine whether the tax positions are “more-likely than not” to be sustained by the applicable tax authority. The SPV and the 2015-1 Issuer are disregarded entities for tax purposes and are consolidated with the tax return of the Company. All penalties and interest associated with income taxes, if any, are included in income tax expense. For the years ended
December 31, 2019
,
2018
and
2017
, the Company incurred
$404
,
$230
and
$264
, respectively, in excise tax expense.
Dividends and Distributions to Common Stockholders
To the extent that the Company has taxable income available, the Company intends to make quarterly distributions to its common stockholders. Dividends and distributions to common stockholders are recorded on the record date. The amount to be distributed is determined by the Board of Directors each quarter and is generally based upon the taxable earnings estimated by management and available cash. Net realized capital gains, if any, are generally distributed at least annually, although the Company may decide to retain such capital gains for investment.
Prior to July 5, 2017, the Company had an “opt in” dividend reinvestment plan. Effective on July 5, 2017, the Company converted the “opt in” dividend reinvestment plan to an “opt out” dividend reinvestment plan that provides for reinvestment of dividends and other distributions on behalf of the stockholders, other than those stockholders who have “opted out” of the plan. As a result of adopting the plan, if the Board of Directors authorizes, and the Company declares, a cash dividend or distribution, the stockholders who have not elected to “opt out” of the dividend reinvestment plan will have their cash dividends or distributions automatically reinvested in additional shares of the Company’s common stock, rather than receiving cash. Each registered stockholder may elect to have such stockholder’s dividends and distributions distributed in cash rather than participate in the plan. For any registered stockholder that does not so elect, distributions on such stockholder’s shares will be reinvested by State Street Bank and Trust Company, the Company’s plan administrator, in additional shares. The number of shares to be issued to the stockholder will be determined based on the total dollar amount of the cash distribution payable, net of applicable withholding taxes. The Company intends to use primarily newly issued shares to implement the plan so long as the market value per share is equal to or greater than the net asset value per share on the relevant valuation date. If the market value per share is less than the net asset value per share on the relevant valuation date, the plan administrator would implement the plan through the purchase of common stock on behalf of participants in the open market, unless the Company instructs the plan administrator otherwise.
Functional Currency
The functional currency of the Company is the U.S. Dollar. Investments are generally made in the local currency of the country in which the investment is domiciled and are translated into U.S. Dollars with foreign currency translation gains or losses recorded within net change in unrealized appreciation (depreciation) on investments in the accompanying consolidated statements of operations. Foreign currency translation gains and losses on non-investment assets and liabilities are separately reflected in the accompanying consolidated statements of operations.
Recent Accounting Standards Updates
In August 2018, the Securities and Exchange Commission (the "SEC") adopted amendments to certain disclosure requirements intended to eliminate redundant, duplicative, overlapping, outdated, or superseded disclosures, in light of other SEC disclosure requirements, U.S. GAAP requirements, or changes in the information environment in its Disclosure Update and Simplification release (the “DUS Release”). The Company adopted the DUS Release on November 5, 2018, which did not have a material impact on the Company’s consolidated financial statements.
In September 2018, related to the DUS Release, the FASB issued Compliance and Disclosure Interpretation 105.09 guidance (“CDI 105.09”) on compliance with the new requirement to present changes in shareholders’ equity in interim financial statements within Form 10-Q filings. The DUS Release requires disclosure of changes in shareholders’ equity within a
117
registrant’s Form 10-Q filing on a quarter-to-date and year-to-date basis for both the current year and prior year comparative periods. CDI 105.09 notes that the SEC would not object if a registrant first discloses the changes in shareholders’ equity in its Form 10-Q for the quarter that begins after November 5, 2018. The Company adopted the new requirement to present changes in shareholders’ equity in interim financial statements within Form 10-Q filings starting with the quarter that began on January 1, 2019. The adoption of the new requirement did not have a material impact on the Company’s consolidated financial statements.
On June 16, 2016, the FASB issued ASU 2016-13,
Financial Instruments – Credit Losses (Topic 326): Measurement of Credit Losses on Financial Instruments
. This ASU is intended to introduce new guidance for the accounting for credit losses on instruments within scope based on an estimate of current expected credit losses. The guidance will be effective for fiscal years, and interim periods within those fiscal years, beginning after December 15, 2019, with early adoption permitted. The Company does not expect the adoption of ASU 2016-13 to have a material impact on its financial statements.
3. FAIR VALUE MEASUREMENTS
The Company applies fair value accounting in accordance with the terms of ASC Topic 820,
Fair Value Measurement
(“ASC 820”). ASC 820 defines fair value as the amount that would be exchanged to sell an asset or transfer a liability in an orderly transfer between market participants at the measurement date. The Company values securities/instruments traded in active markets on the measurement date by multiplying the closing price of such traded securities/instruments by the quantity of shares or amount of the instrument held. The Company may also obtain quotes with respect to certain of its investments, such as its securities/instruments traded in active markets and its liquid securities/instruments that are not traded in active markets, from pricing services, brokers, or counterparties (i.e., “consensus pricing”). When doing so, the Company determines whether the quote obtained is sufficient according to U.S. GAAP to determine the fair value of the security. The Company may use the quote obtained or alternative pricing sources may be utilized including valuation techniques typically utilized for illiquid securities/instruments.
Securities/instruments that are illiquid or for which the pricing source does not provide a valuation or methodology or provides a valuation or methodology that, in the judgment of the Investment Adviser or the Company’s Board of Directors, does not represent fair value shall each be valued as of the measurement date using all techniques appropriate under the circumstances and for which sufficient data is available. These valuation techniques may vary by investment and include comparable public market valuations, comparable precedent transaction valuations and/or discounted cash flow analyses. The process generally used to determine the applicable value is as follows: (i) the value of each portfolio company or investment is initially reviewed by the investment professionals responsible for such portfolio company or investment and, for non-traded investments, a standardized template designed to approximate fair market value based on observable market inputs, updated credit statistics and unobservable inputs is used to determine a preliminary value, which is also reviewed alongside consensus pricing, where available; (ii) preliminary valuation conclusions are documented and reviewed by a valuation committee comprised of members of senior management; (iii) the Board of Directors engages a third-party valuation firm to provide positive assurance on portions of the Middle Market Senior Loans and equity investments portfolio each quarter (such that each non-traded investment other than Credit Fund is reviewed by a third-party valuation firm at least once on a rolling twelve month basis) including a review of management’s preliminary valuation and conclusion on fair value; (iv) the Audit Committee of the Board of Directors (the “Audit Committee”) reviews the assessments of the Investment Adviser and the third-party valuation firm and provides the Board of Directors with any recommendations with respect to changes to the fair value of each investment in the portfolio; and (v) the Board of Directors discusses the valuation recommendations of the Audit Committee and determines the fair value of each investment in the portfolio in good faith based on the input of the Investment Adviser and, where applicable, the third-party valuation firm.
All factors that might materially impact the value of an investment are considered, including, but not limited to the assessment of the following factors, as relevant:
|
•
|
the nature and realizable value of any collateral;
|
|
•
|
call features, put features and other relevant terms of debt;
|
|
•
|
the portfolio company’s leverage and ability to make payments;
|
|
•
|
the portfolio company’s public or private credit rating;
|
|
•
|
the portfolio company’s actual and expected earnings and discounted cash flow;
|
|
•
|
prevailing interest rates and spreads for similar securities and expected volatility in future interest rates;
|
|
•
|
the markets in which the portfolio company does business and recent economic and/or market events; and
|
|
•
|
comparisons to comparable transactions and publicly traded securities.
|
118
Investment performance data utilized are the most recently available financial statements and compliance certificates received from the portfolio companies as of the measurement date which in many cases may reflect a lag in information.
Due to the inherent uncertainty of determining the fair value of investments that do not have a readily available market value, the fair value of the Company’s investments may fluctuate from period to period. Because of the inherent uncertainty of valuation, these estimated values may differ significantly from the values that would have been reported had a ready market for the investments existed, and it is reasonably possible that the difference could be material.
In addition, changes in the market environment and other events that may occur over the life of the investments may cause the realized gains or losses on investments to be different from the net change in unrealized appreciation or depreciation currently reflected in the consolidated financial statements as of
December 31, 2019
,
2018
and
2017
.
U.S. GAAP establishes a hierarchical disclosure framework which ranks the level of observability of market price inputs used in measuring investments at fair value. The observability of inputs is impacted by a number of factors, including the type of investment and the characteristics specific to the investment and state of the marketplace, including the existence and transparency of transactions between market participants. Investments with readily available quoted prices or for which fair value can be measured from quoted prices in active markets generally have a higher degree of market price observability and a lesser degree of judgment applied in determining fair value.
Investments measured and reported at fair value are classified and disclosed based on the observability of inputs used in determination of fair values, as follows:
|
•
|
Level 1—inputs to the valuation methodology are quoted prices available in active markets for identical investments as of the reporting date. The types of financial instruments in Level 1 generally include unrestricted securities, including equities and derivatives, listed in active markets. The Company does not adjust the quoted price for these investments, even in situations where the Company holds a large position and a sale could reasonably impact the quoted price.
|
|
•
|
Level 2—inputs to the valuation methodology are either directly or indirectly observable as of the reporting date and are those other than quoted prices in active markets. The type of financial instruments in this category generally includes less liquid and restricted securities listed in active markets, securities traded in other than active markets, government and agency securities, and certain over-the-counter derivatives where the fair value is based on observable inputs.
|
|
•
|
Level 3—inputs to the valuation methodology are unobservable and significant to overall fair value measurement. The inputs into the determination of fair value require significant management judgment or estimation. Financial instruments that are in this category generally include investments in privately-held entities and certain over-the-counter derivatives where the fair value is based on unobservable inputs.
|
In certain cases, the inputs used to measure fair value may fall into different levels of the fair value hierarchy. In such cases, an investment’s level within the fair value hierarchy is based on the lowest level of input that is significant to the overall fair value measurement. The Investment Adviser’s assessment of the significance of a particular input to the fair value measurement in its entirety requires judgment, and considers factors specific to the investment.
Transfers between levels, if any, are recognized at the beginning of the year in which the transfers occur. For the year ended
December 31, 2019
,
t
here were no transfers between levels.
For the year ended December 31, 2018
,
t
he investment in the subordinated loan and member’s interest of the investment fund transferred from investments measured at net asset value to Level 3 as a result of the change in valuation approach under practical expedient to discounted cash flow analysis.
119
The following tables summarize the Company’s investments measured at fair value on a recurring basis by the above fair value hierarchy levels as of
December 31, 2019
and
2018
:
|
|
December 31, 2019
|
||||||||||||||
|
|
Level 1
|
Level 2
|
Level 3
|
Total
|
|||||||||||
|
Assets
|
|||||||||||||||
|
First Lien Debt
|
$
|
—
|
|
$
|
—
|
|
$
|
1,663,138
|
|
$
|
1,663,138
|
|
|||
|
Second Lien Debt
|
—
|
|
—
|
|
234,532
|
|
234,532
|
|
|||||||
|
Equity Investments
|
—
|
|
—
|
|
21,698
|
|
21,698
|
|
|||||||
|
Investment Fund
|
|||||||||||||||
|
Mezzanine Loan
|
—
|
|
—
|
|
93,000
|
|
93,000
|
|
|||||||
|
Subordinated Loan and Member's Interest
|
—
|
|
—
|
|
111,596
|
|
111,596
|
|
|||||||
|
Total
|
$
|
—
|
|
$
|
—
|
|
$
|
2,123,964
|
|
$
|
2,123,964
|
|
|||
|
|
December 31, 2018
|
||||||||||||||
|
|
Level 1
|
Level 2
|
Level 3
|
Total
|
|||||||||||
|
Assets
|
|||||||||||||||
|
First Lien Debt
|
$
|
—
|
|
$
|
—
|
|
$
|
1,546,271
|
|
$
|
1,546,271
|
|
|||
|
Second Lien Debt
|
—
|
|
—
|
|
178,958
|
|
178,958
|
|
|||||||
|
Equity Investments
|
—
|
|
—
|
|
24,633
|
|
24,633
|
|
|||||||
|
Investment Fund
|
|||||||||||||||
|
Mezzanine Loan
|
—
|
|
—
|
|
112,000
|
|
112,000
|
|
|||||||
|
Subordinated Loan and Member's Interest
|
—
|
|
—
|
|
110,295
|
|
110,295
|
|
|||||||
|
Total
|
$
|
—
|
|
$
|
—
|
|
$
|
1,972,157
|
|
$
|
1,972,157
|
|
|||
120
The changes in the Company’s investments at fair value for which the Company has used Level 3 inputs to determine fair value and net change in unrealized appreciation (depreciation) included in earnings for Level 3 investments still held are as follows:
|
Financial Assets
|
|||||||||||||||||||||||
|
|
For the year ended December 31, 2019
|
||||||||||||||||||||||
|
|
First Lien Debt
|
Second Lien Debt
|
Equity Investments
|
Investment Fund - Mezzanine Loan
|
Investment Fund - Subordinated Loan and Member's Interest
|
Total
|
|||||||||||||||||
|
Balance, beginning of year
|
$
|
1,546,271
|
|
$
|
178,958
|
|
$
|
24,633
|
|
$
|
112,000
|
|
$
|
110,295
|
|
$
|
1,972,157
|
|
|||||
|
Purchases
|
718,358
|
|
141,814
|
|
8,595
|
|
126,200
|
|
5,500
|
|
1,000,467
|
|
|||||||||||
|
Sales
|
(79,741
|
)
|
—
|
|
(18,036
|
)
|
—
|
|
—
|
|
(97,777
|
)
|
|||||||||||
|
Paydowns
|
(485,514
|
)
|
(88,695
|
)
|
—
|
|
(145,200
|
)
|
—
|
|
(719,409
|
)
|
|||||||||||
|
Accretion of discount
|
11,503
|
|
1,452
|
|
—
|
|
—
|
|
—
|
|
12,955
|
|
|||||||||||
|
Net realized gains (losses)
|
(52,633
|
)
|
—
|
|
14,257
|
|
—
|
|
—
|
|
(38,376
|
)
|
|||||||||||
|
Net change in unrealized appreciation (depreciation)
|
4,894
|
|
1,003
|
|
(7,751
|
)
|
—
|
|
(4,199
|
)
|
(6,053
|
)
|
|||||||||||
|
Balance, end of year
|
$
|
1,663,138
|
|
$
|
234,532
|
|
$
|
21,698
|
|
$
|
93,000
|
|
$
|
111,596
|
|
$
|
2,123,964
|
|
|||||
|
Net change in unrealized appreciation (depreciation) included in earnings related to investments still held at the reporting date included in net change in unrealized appreciation (depreciation) on investments on the Consolidated Statements of Operations
|
$
|
(45,731
|
)
|
$
|
1,096
|
|
$
|
(1,587
|
)
|
—
|
|
$
|
(4,199
|
)
|
$
|
(50,421
|
)
|
||||||
|
Financial Assets
|
|||||||||||||||||||||
|
|
For the year ended December 31, 2018
|
||||||||||||||||||||
|
|
First Lien Debt
|
Second Lien Debt
|
Equity Investments
|
Investment Fund - Mezzanine Loan
|
Investment Fund - Subordinated Loan
|
Total
|
|||||||||||||||
|
Balance, beginning of year
|
$
|
1,531,276
|
|
$
|
246,233
|
|
$
|
17,506
|
|
85,750
|
|
—
|
|
$
|
1,880,765
|
|
|||||
|
Purchases
|
660,409
|
|
132,913
|
|
5,283
|
|
120,150
|
|
31,500
|
|
950,255
|
|
|||||||||
|
Transfers in
|
—
|
|
—
|
|
—
|
|
—
|
|
86,766
|
|
86,766
|
|
|||||||||
|
Sales
|
(103,841
|
)
|
(3,960
|
)
|
(4,903
|
)
|
—
|
|
—
|
|
(112,704
|
)
|
|||||||||
|
Paydowns
|
(486,947
|
)
|
(195,571
|
)
|
—
|
|
(93,900
|
)
|
—
|
|
(776,418
|
)
|
|||||||||
|
Accretion of discount
|
9,651
|
|
3,163
|
|
—
|
|
—
|
|
—
|
|
12,814
|
|
|||||||||
|
Net realized gains (losses)
|
(4,903
|
)
|
2
|
|
3,533
|
|
—
|
|
—
|
|
(1,368
|
)
|
|||||||||
|
Net change in unrealized appreciation (depreciation)
|
(59,374
|
)
|
(3,822
|
)
|
3,214
|
|
—
|
|
(7,971
|
)
|
(67,953
|
)
|
|||||||||
|
Balance, end of year
|
$
|
1,546,271
|
|
$
|
178,958
|
|
$
|
24,633
|
|
112,000
|
|
110,295
|
|
$
|
1,972,157
|
|
|||||
|
Net change in unrealized appreciation (depreciation) included in earnings related to investments still held at the reporting date included in net change in unrealized appreciation (depreciation) on investments on the Consolidated Statements of Operations
|
$
|
(56,061
|
)
|
$
|
(516
|
)
|
$
|
3,763
|
|
—
|
|
(7,971
|
)
|
$
|
(60,785
|
)
|
|||||
The Company generally uses the following framework when determining the fair value of investments that are categorized as Level 3:
Investments in debt securities are initially evaluated to determine whether the enterprise value of the portfolio company is greater than the applicable debt. The enterprise value of the portfolio company is estimated using a market approach and an income approach. The market approach utilizes market value (EBITDA) multiples of publicly traded comparable companies and available precedent sales transactions of comparable companies. The Company carefully considers numerous factors when selecting the appropriate companies whose multiples are used to value its portfolio companies. These factors include, but are not limited to, the type of organization, similarity to the business being valued, relevant risk factors, as
121
well as size, profitability and growth expectations. The income approach typically uses a discounted cash flow analysis of the portfolio company.
Investments in debt securities that do not have sufficient coverage through the enterprise value analysis are valued based on an expected probability of default and discount recovery analysis.
Investments in debt securities with sufficient coverage through the enterprise value analysis are generally valued using a discounted cash flow analysis of the underlying security. Projected cash flows in the discounted cash flow typically represent the relevant security’s contractual interest, fees and principal payments plus the assumption of full principal recovery at the security’s expected maturity date. The discount rate to be used is determined using an average of two market-based methodologies. Investments in debt securities may also be valued using consensus pricing.
Investments in equities are generally valued using a market approach and/or an income approach. The market approach utilizes EBITDA multiples of publicly traded comparable companies and available precedent sales transactions of comparable companies. The income approach typically uses a discounted cash flow analysis of the portfolio company.
Investments in the mezzanine loan are valued using collateral analysis with expected recovery rate of principal and interest. Investments in the subordinated loan and member’s interest of the investment fund are valued using discounted cash flow analysis with expected discount rate, default rate and recovery rate of principal and interest.
The following tables summarize the quantitative information related to the significant unobservable inputs for Level 3 instruments which are carried at fair value as of
December 31, 2019
and
2018
:
|
|
Fair Value as of
|
Valuation Techniques
|
Significant Unobservable Inputs
|
Range
|
Weighted Average
|
|||||||||||
|
|
of December 31, 2019
|
Low
|
High
|
|||||||||||||
|
Investments in First Lien Debt
|
$
|
1,332,584
|
|
Discounted Cash Flow
|
Discount Rate
|
3.64
|
%
|
24.45
|
%
|
8.13
|
%
|
|||||
|
318,681
|
|
Consensus Pricing
|
Indicative Quotes
|
77.94
|
|
100.00
|
|
96.96
|
|
|||||||
|
11,873
|
|
Income Approach
|
Discount Rate
|
12.22
|
%
|
19.32
|
%
|
13.16
|
%
|
|||||||
|
Market Approach
|
Comparable Multiple
|
7.89x
|
|
8.38x
|
|
8.49x
|
|
|||||||||
|
Total First Lien Debt
|
1,663,138
|
|
||||||||||||||
|
Investments in Second Lien Debt
|
188,736
|
|
Discounted Cash Flow
|
Discount Rate
|
7.40
|
%
|
10.66
|
%
|
8.85
|
%
|
||||||
|
45,796
|
|
Consensus Pricing
|
Indicative Quotes
|
97.50
|
|
98.31
|
|
98.19
|
|
|||||||
|
Total Second Lien Debt
|
234,532
|
|
||||||||||||||
|
Investments in Equity
|
21,698
|
|
Income Approach
|
Discount Rate
|
7.76
|
%
|
15.31
|
%
|
8.84
|
%
|
||||||
|
Market Approach
|
Comparable Multiple
|
6.37x
|
|
16.65x
|
|
9.24x
|
|
|||||||||
|
Total Equity Investments
|
21,698
|
|
||||||||||||||
|
Investments in Investment Fund
|
||||||||||||||||
|
Mezzanine Loan
|
93,000
|
|
Collateral Analysis
|
Recovery Rate
|
100.00
|
%
|
100.00
|
%
|
100.00
|
%
|
||||||
|
Subordinated Loan and Member's Interest
|
111,596
|
|
Discounted Cash Flow
|
Discount Rate
|
10.00
|
%
|
10.00
|
%
|
10.00
|
%
|
||||||
|
Discounted Cash Flow
|
Default Rate
|
2.00
|
%
|
2.00
|
%
|
2.00
|
%
|
|||||||||
|
Discounted Cash Flow
|
Recovery Rate
|
75.00
|
%
|
75.00
|
%
|
75.00
|
%
|
|||||||||
|
Total Investments in Investment Fund
|
204,596
|
|
||||||||||||||
|
Total Level 3 Investments
|
$
|
2,123,964
|
|
|||||||||||||
122
|
|
Fair Value as of
|
Valuation Techniques
|
Significant
Unobservable Inputs |
Range
|
Weighted Average
|
|||||||||||
|
|
of December 31, 2018
|
Low
|
High
|
|||||||||||||
|
Investments in First Lien Debt
|
$
|
1,457,170
|
|
Discounted Cash Flow
|
Discount Rate
|
6.45
|
%
|
26.48
|
%
|
10.49
|
%
|
|||||
|
74,774
|
|
Consensus Pricing
|
Indicative Quotes
|
50.00
|
|
100.00
|
|
92.04
|
|
|||||||
|
14,327
|
|
Income Approach
|
Discount Rate
|
15.12
|
%
|
15.12
|
%
|
15.12
|
%
|
|||||||
|
Market Approach
|
Comparable Multiple
|
6.76x
|
|
6.76x
|
|
6.76x
|
|
|||||||||
|
Total First Lien Debt
|
1,546,271
|
|
||||||||||||||
|
Investments in Second Lien Debt
|
176,307
|
|
Discounted Cash Flow
|
Discount Rate
|
9.34
|
%
|
13.22
|
%
|
11.31
|
%
|
||||||
|
2,651
|
|
Consensus Pricing
|
Indicative Quotes
|
98.17
|
|
98.17
|
|
98.17
|
|
|||||||
|
Total Second Lien Debt
|
178,958
|
|
||||||||||||||
|
Investments in Equities
|
24,633
|
|
Income Approach
|
Discount Rate
|
8.51
|
%
|
12.84
|
%
|
10.49
|
%
|
||||||
|
Market Approach
|
Comparable Multiple
|
7.22x
|
|
14.70x
|
|
9.74x
|
|
|||||||||
|
Total Equity Investments
|
24,633
|
|
||||||||||||||
|
Investments in Investment Fund
|
||||||||||||||||
|
Mezzanine Loan
|
112,000
|
|
Collateral Analysis
|
Recovery Rate
|
100.00
|
%
|
100.00
|
%
|
100.00
|
%
|
||||||
|
Subordinated Loan
|
110,295
|
|
Discounted Cash Flow
|
Discount Rate
|
10.00
|
%
|
10.00
|
%
|
10.00
|
%
|
||||||
|
Discounted Cash Flow
|
Default Rate
|
2.00
|
%
|
2.00
|
%
|
2.00
|
%
|
|||||||||
|
Discounted Cash Flow
|
Recovery Rate
|
75.00
|
%
|
75.00
|
%
|
75.00
|
%
|
|||||||||
|
Total Investment Fund
|
$
|
222,295
|
|
|||||||||||||
|
Total Level 3 Investments
|
$
|
1,972,157
|
|
|||||||||||||
The significant unobservable inputs used in the fair value measurement of the Company’s investments in first and second lien debt securities are discount rates, indicative quotes and comparable EBITDA multiples. Significant increases in discount rates would result in a significantly lower fair value measurement. Significant decreases in indicative quotes or comparable EBITDA multiples in isolation may result in a significantly lower fair value measurement.
The significant unobservable inputs used in the fair value measurement of the Company’s investments in equities are discount rates and comparable EBITDA multiples. Significant increases in discount rates would result in a significantly lower fair value measurement. Significant decreases in comparable EBITDA multiples would result in a significantly lower fair value measurement.
The significant unobservable inputs used in the fair value measurement of the Company’s investments in the mezzanine loan of Credit Fund are recovery rates of principal and interest. Significant decreases in recovery rates would result in a significantly lower fair value measurement.
The significant unobservable inputs used in the fair value measurement of the Company’s investments in the subordinated loan and member’s interest of Credit Fund are discount rates, default rates and recovery rates. Significant increases in discount rates or default rates would result in a significantly lower fair value measurement. Significant decreases in recovery rates would result in a significantly lower fair value measurement.
Financial instruments disclosed but not carried at fair value
The following table presents the carrying value and fair value of the Company’s secured borrowings disclosed but not carried at fair value as of
December 31, 2019
and
2018
:
|
|
December 31, 2019
|
December 31, 2018
|
|||||||||||||
|
|
Carrying Value
|
Fair Value
|
Carrying Value
|
Fair Value
|
|||||||||||
|
Secured borrowings
|
$
|
616,543
|
|
$
|
616,543
|
|
$
|
514,635
|
|
$
|
514,635
|
|
|||
|
Total
|
$
|
616,543
|
|
$
|
616,543
|
|
$
|
514,635
|
|
$
|
514,635
|
|
|||
The carrying values of the secured borrowings approximate their respective fair values and are categorized as Level 3 within the hierarchy. Secured borrowings are valued generally using discounted cash flow analysis. The significant unobservable inputs used in the fair value measurement of the Company’s secured borrowings are discount rates. Significant increases in discount rates would result in a significantly lower fair value measurement.
123
The following table represents the carrying values (before debt issuance costs) and fair values of the Company’s 2015-1R Notes disclosed but not carried at fair value as of
December 31, 2019
and
2018
:
|
|
December 31, 2019
|
December 31, 2018
|
|||||||||||||
|
2015-1R Notes
|
Carrying Value
|
Fair Value
|
Carrying Value
|
Fair Value
|
|||||||||||
|
Aaa/AAA Class A-1-1-R Notes
|
$
|
234,800
|
|
$
|
233,053
|
|
$
|
234,800
|
|
$
|
229,632
|
|
|||
|
Aaa/AAA Class A-1-2-R Notes
|
50,000
|
|
49,908
|
|
50,000
|
|
49,442
|
|
|||||||
|
Aaa/AAA Class A-1-3-R Notes
|
25,000
|
|
25,163
|
|
25,000
|
|
24,990
|
|
|||||||
|
AA Class A-2-R Notes
|
66,000
|
|
66,000
|
|
66,000
|
|
66,000
|
|
|||||||
|
A Class B Notes
|
46,400
|
|
46,400
|
|
46,400
|
|
44,242
|
|
|||||||
|
BBB- Class C Notes
|
27,000
|
|
27,000
|
|
27,000
|
|
24,809
|
|
|||||||
|
Total
|
$
|
449,200
|
|
$
|
447,524
|
|
$
|
449,200
|
|
$
|
439,115
|
|
|||
The fair value determination of the Company’s notes payable was based on the market quotation(s) received from broker/dealer(s). These fair value measurements were based on significant inputs not observable and thus represent Level 3 measurements as defined in the accounting guidance for fair value measurement.
As the Senior Notes were issued on December 30, 2019, their fair value as of December 31, 2019 approximates their carrying value.
The carrying value of other financial assets and liabilities approximates their fair value based on the short term nature of these items.
4. RELATED PARTY TRANSACTIONS
Investment Advisory Agreement
On April 3, 2013, the Company’s Board of Directors, including a majority of the directors who are not “interested persons” as defined in Section 2(a)(19) of the Investment Company Act (the “Independent Directors”), approved an investment advisory agreement (the “Original Investment Advisory Agreement”) between the Company and the Investment Adviser in accordance with, and on the basis of an evaluation satisfactory to such directors as required by, Section 15(c) of the Investment Company Act.
The Original Investment Advisory Agreement was amended on September 15, 2017 (as amended, the “First Amended and Restated Investment Advisory Agreement”) after the approval of the Company’s Board of Directors, including a majority of the Independent Directors, at an in-person meeting of the Board of Directors held on May 30, 2017 and the approval of the Company’s stockholders at a special meeting of stockholders held on September 15, 2017. The First Amended and Restated Investment Advisory Agreement amended the Original Investment Advisory Agreement to, among other things, (i) reduce the incentive fee payable by the Company to the Investment Adviser from an annual rate of 20% to an annual rate of 17.5%, (ii) delete the incentive fee payment deferral test described below, and (iii) include in the pre-incentive fee net investment income, in the case of investments with a deferred interest feature, accrued income that the Company has not yet received in cash.
On August 6, 2018, the First Amended and Restated Investment Advisory Agreement was further amended (as amended, the “Investment Advisory Agreement”) after the approval of the Company’s Board of Directors, including a majority of the Independent Directors, at an in-person meeting of the Board of Directors held on August 6, 2018. The Investment Advisory Agreement amended the First Amended and Restated Investment Advisory Agreement to incorporate a one-third (0.50%) reduction in the 1.50% annual base management fee rate charged by the Investment Adviser on assets financed using leverage in excess of 1.0x debt to equity, effective July 1, 2018.
The initial term of the Investment Advisory Agreement is two years from September 15, 2017 and, unless terminated earlier, the Investment Advisory Agreement will renew automatically for successive annual periods, provided that such continuance is specifically approved at least annually by the vote of the Board of Directors and by the vote of a majority of the Independent Directors. The Investment Advisory Agreement will automatically terminate in the event of an assignment and may be terminated by either party without penalty upon at least 60 days’ written notice to the other party. Subject to the overall supervision of the Board of Directors, the Investment Adviser provides investment advisory services to the Company. For providing these services, the Investment Adviser receives fees from the Company consisting of two components—a base management fee and an incentive fee.
124
Effective September 15, 2017, the base management fee has been calculated and payable quarterly in arrears at an annual rate of 1.50% of the average value of the gross assets at the end of the two most recently completed fiscal quarters; provided, however, effective July 1, 2018, the base management fee has been calculated at an annual rate of 1.00% of the average value of the gross assets as of the end of the two most recently completed calendar quarters that exceeds the product of (A) 200% and (B) the average value of the Company’s net asset value at the end of the two most recently completed calendar quarters. The base management fee will be appropriately adjusted for any share issuances or repurchases during such fiscal quarter and the base management fees for any partial month or quarter will be pro-rated. The Company’s gross assets exclude any cash and cash equivalents and include assets acquired through the incurrence of debt from use of the SPV Credit Facility, Credit Facility, 2015-1R Notes and 2015-1 Notes (see Note 6, Borrowings, and Note 7, Notes Payable, to these consolidated financial statements). For purposes of this calculation, cash and cash equivalents include any temporary investments in cash-equivalents, U.S. government securities and other high quality investment grade debt investments that mature in 12 months or less from the date of investment.
Prior to September 15, 2017, under the Original Investment Advisory Agreement, the base management fee was calculated and payable quarterly in arrears at an annual rate of 1.50% of the average daily gross assets of the Company for the period adjusted for share issuances or repurchases. Prior to the IPO, the Investment Adviser waived its right to receive one-third (0.50%) of the 1.50% base management fee. Any waived base management fees are not subject to recoupment by the Investment Adviser. The fee waiver terminated when the IPO had been consummated. As previously disclosed, in connection with the IPO, the Investment Adviser agreed to continue the fee waiver until the completion of the first full quarter after the consummation of the IPO. As a result, beginning October 1, 2017, the base management fee has been calculated at an annual rate of 1.50% of the Company’s gross assets; provided, however, effective July 1, 2018, the base management fee has been calculated at an annual rate of 1.00% of the average value of the gross assets as of the end of the two most recently completed calendar quarters that exceeds the product of (A) 200% and (B) the average value of the Company’s net asset value at the end of the two most recently completed calendar quarters.
The incentive fee has two parts. The first part is calculated and payable quarterly in arrears based on the pre-incentive fee net investment income for the immediately preceding calendar quarter. The second part is determined and payable in arrears based on capital gains as of the end of each calendar year.
Pre-incentive fee net investment income means interest income, dividend income and any other income (including any other fees (other than fees for providing managerial assistance), such as commitment, origination, structuring, diligence and consulting fees or other fees that the Company receives from portfolio companies) accrued during the calendar quarter, minus the operating expenses accrued for the quarter (including the base management fee, expenses payable under the administration agreement, and any interest expense or fees on any credit facilities or outstanding debt and dividends paid on any issued and outstanding preferred stock, but excluding the incentive fee). Pre-incentive fee net investment income includes, in the case of investments with a deferred interest feature, accrued income that the Company has not yet received in cash. Pre-incentive fee net investment income does not include any realized capital gains, realized capital losses or unrealized capital appreciation or depreciation.
Effective September 15, 2017, pre-incentive fee net investment income, expressed as a rate of return on the value of the Company’s net assets at the end of the immediately preceding calendar quarter, has been compared to a “hurdle rate” of 1.50% per quarter (6% annualized) or a “catch-up rate” of 1.82% per quarter (7.28% annualized), as applicable.
Pursuant to the Investment Advisory Agreement, the Company pays its Investment Adviser an incentive fee with respect to its pre-incentive fee net investment income in each calendar quarter as follows:
|
•
|
no incentive fee based on pre-incentive fee net investment income in any calendar quarter in which its pre-incentive fee net investment income does not exceed the hurdle rate of 1.50%;
|
|
•
|
100% of pre-incentive fee net investment income with respect to that portion of such pre-incentive fee net investment income, if any, that exceeds the hurdle rate but is less than 1.82% in any calendar quarter (7.28% annualized). The Company refers to this portion of the pre-incentive fee net investment income (which exceeds the hurdle rate but is less than 1.82%) as the “catch-up.” The “catch-up” is meant to provide the Investment Adviser with approximately 17.5% of the Company’s pre-incentive fee net investment income as if a hurdle rate did not apply if this net investment income exceeds 1.82% in any calendar quarter; and
|
|
•
|
17.5% of the amount of pre-incentive fee net investment income, if any, that exceeds 1.82% in any calendar quarter (7.28% annualized) will be payable to the Investment Adviser. This reflects that once the hurdle rate
|
125
is reached and the catch-up is achieved, 17.5% of all pre-incentive fee investment income thereafter is allocated to the Investment Adviser.
The second part of the incentive fee is determined and payable in arrears as of the end of each calendar year (or upon termination of the Investment Advisory Agreement, as of the termination date), and equals 17.5% of realized capital gains, if any, on a cumulative basis from inception through the date of determination, computed net of all realized capital losses on a cumulative basis and unrealized capital depreciation, less the aggregate amount of any previously paid capital gain incentive fees, provided that, the incentive fee determined at the end of the first calendar year of operations may be calculated for a period of shorter than twelve calendar months to take into account any realized capital gains computed net of all realized capital losses on a cumulative basis and unrealized capital depreciation.
Prior to September 15, 2017, under the Original Investment Advisory Agreement, pre-incentive fee net investment income, which did not include, in the case of investments with a deferred interest feature, accrued income that the Company has not yet received in cash, and was expressed as a rate of return on the average daily Hurdle Calculation Value (as defined below) throughout the immediately preceding calendar quarter, was compared to a “hurdle rate” of 1.50% per quarter (6% annualized) or a “catch-up” of 1.875% per quarter (7.50% annualized), as applicable. “Hurdle Calculation Value” meant, on any given day, the sum of (x) the value of net assets as of the end of the calendar quarter immediately preceding such day plus (y) the aggregate amount of capital drawn from investors (or reinvested in the Company pursuant to a dividend reinvestment plan) from the beginning of the current quarter to such day minus (z) the aggregate amount of distributions (including share repurchases) made by the Company from the beginning of the current quarter to such day, but only to the extent such distributions were not declared and accounted for on the books and records in a previous quarter. In addition, under the Original Investment Advisory Agreement, the Company deferred payment of any incentive fee otherwise earned by the Investment Adviser if, during the most recent four full calendar quarter periods ending on or prior to the date such payment is to be made, the sum of (a) the aggregate distributions to stockholders and (b) the change in net assets (defined as gross assets less indebtedness and before taking into account any incentive fees payable during the period) is less than 6.0% of net assets (defined as gross assets less indebtedness) at the beginning of such period. These calculations were adjusted for any share issuances or repurchases. Any deferred incentive fees were carried over for payment in subsequent calculation periods.
As previously disclosed, in connection with the IPO, the Investment Adviser agreed to charge 17.5% instead of 20% with respect to the entire calculation of the incentive fee beginning on the first full quarter following the consummation of the IPO until the earlier of (i) October 1, 2017 and (ii) the date that the Company’s stockholders vote on the approval of the amendment to the Original Investment Advisory Agreement. The Company’s stockholders voted to approve the Investment Advisory Agreement on September 15, 2017.
Below is a summary of the base management fees and incentive fees incurred during the years ended
December 31, 2019
,
2018
and
2017
.
|
For the years ended December 31,
|
|||||||||||
|
2019
|
2018
|
2017
|
|||||||||
|
Base management fees
|
$
|
31,316
|
|
$
|
29,626
|
|
$
|
25,254
|
|
||
|
Waiver of base management fees
|
—
|
|
—
|
|
5,927
|
|
|||||
|
Base management fees, net of waiver
|
31,316
|
|
29,626
|
|
19,327
|
|
|||||
|
Incentive fees on pre-incentive fee net investment income
|
22,872
|
|
23,002
|
|
21,084
|
|
|||||
|
Realized capital gains incentive fees
|
—
|
|
—
|
|
—
|
|
|||||
|
Accrued capital gains incentive fees
|
—
|
|
—
|
|
—
|
|
|||||
|
Total capital gains incentive fees
|
—
|
|
—
|
|
—
|
|
|||||
|
Total incentive fees
|
22,872
|
|
23,002
|
|
21,084
|
|
|||||
|
Total base management fees and incentive fees
|
$
|
54,188
|
|
$
|
52,628
|
|
$
|
40,411
|
|
||
Accrued capital gains incentive fees are based upon the cumulative net realized and unrealized appreciation (depreciation) from inception. Accordingly, the accrual for any capital gains incentive fee under U.S. GAAP in a given period may result in an additional expense if such cumulative amount is greater than in the prior period or a reduction of previously recorded expense if such cumulative amount is less than in the prior period. If such cumulative amount is negative, then there is no accrual.
126
As of
December 31, 2019
and
2018
,
$13,236
and
$13,834
, respectively, was included in base management and incentive fees payable in the accompanying Consolidated Statements of Assets and Liabilities.
On April 3, 2013, the Investment Adviser entered into a personnel agreement with The Carlyle Group Employee Co., L.L.C. (“Carlyle Employee Co.”), an affiliate of the Investment Adviser, pursuant to which Carlyle Employee Co. provides the Investment Adviser with access to investment professionals.
Administration Agreement
On April 3, 2013, the Company’s Board of Directors approved an administration agreement (the “Administration Agreement”) between the Company and the Administrator. Pursuant to the Administration Agreement, the Administrator provides services and receives reimbursements equal to an amount that reimburses the Administrator for its costs and expenses and the Company’s allocable portion of overhead incurred by the Administrator in performing its obligations under the Administration Agreement, including the Company’s allocable portion of the compensation paid to or compensatory distributions received by the Company’s officers (including the Chief Compliance Officer and Treasurer) and respective staff who provide services to the Company, operations staff who provide services to the Company, and any internal audit staff, to the extent internal audit performs a role in the Company’s Sarbanes-Oxley Act internal control assessment. Reimbursement under the Administration Agreement occurs quarterly in arrears.
The initial term of the Administration Agreement is two years from April 3, 2013 and, unless terminated earlier, the Administration Agreement will renew automatically for successive annual periods, provided that such continuance is specifically approved at least annually by (i) the vote of the Board of Directors or by a majority vote of the outstanding voting securities of the Company and (ii) the vote of a majority of the Company’s Independent Directors. On May 6, 2019, the Company’s Board of Directors, including a majority of the Independent Directors, approved the continuance of the Administration Agreement for a one year period. The Administration Agreement may not be assigned by a party without the consent of the other party and may be terminated by either party without penalty upon at least 60 days’ written notice to the other party.
For the years ended
December 31, 2019
,
2018
and
2017
, the Company incurred
$539
,
$701
and
$661
, respectively, in fees under the Administrative Agreement, which were included in administrative service fees in the accompanying Consolidated Statements of Operations. As of
December 31, 2019
and
2018
,
$77
and
$94
, respectively, was unpaid and included in administrative service fees payable in the accompanying Consolidated Statements of Assets and Liabilities.
Sub-Administration Agreements
On April 3, 2013, the Administrator entered into a sub-administration agreement with Carlyle Employee Co. (the “Carlyle Sub-Administration Agreement”). Pursuant to the Carlyle Sub-Administration Agreement, Carlyle Employee Co. provides the Administrator with access to personnel.
On April 3, 2013, the Administrator entered into a sub-administration agreement with State Street Bank and Trust Company (“State Street” and, such agreement, the “State Street Sub-Administration Agreement” and, together with the Carlyle Sub-Administration Agreement, the “Sub-Administration Agreements”). On March 11, 2015, the Company’s Board of Directors, including a majority of the Independent Directors, approved an amendment to the State Street Sub-Administration Agreement. The initial term of the State Street Sub-Administration Agreement ends on April 1, 2017 and, unless terminated earlier, the State Street Sub-Administration Agreement will renew automatically for successive annual periods, provided that such continuance is specifically approved at least annually by (i) the vote of the Board of Directors or by the vote of a majority of the outstanding voting securities of the Company and (ii) the vote of a majority of the Company’s Independent Directors. On May 6, 2019, the Company’s Board of Directors, including a majority of the Independent Directors, approved the continuance of the State Street Sub-Administration Agreement for a one year period. The State Street Sub-Administration Agreement may be terminated upon at least 60 days’ written notice and without penalty by the vote of a majority of the outstanding securities of the Company, or by the vote of the Board of Directors or by either party to the State Street Sub-Administration Agreement.
For the years ended
December 31, 2019
,
2018
and
2017
, fees incurred in connection with the State Street Sub-Administration Agreement, which amounted to
$755
,
$764
and
$725
, respectively, were included in other general and administrative in the accompanying Consolidated Statements of Operations. As of
December 31, 2019
and
2018
,
$380
and
$383
, respectively, was unpaid and included in other accrued expenses and liabilities in the accompanying Consolidated Statements of Assets and Liabilities.
127
Placement Fees
On April 3, 2013, the Company entered into a placement fee arrangement with TCG Securities, L.L.C. (“TCG”), a licensed broker-dealer and an affiliate of the Investment Adviser, which may require stockholders to pay a placement fee to TCG for TCG’s services. At the time of the IPO, the placement fee arrangement with TCG was automatically terminated.
For the year ended December 31, 2017, TCG earned placement fees of $19 from the Company’s stockholders in connection with the issuance or sale of the Company’s common stock prior to the IPO. TCG did not earn placement fees during the years ended December 31, 2018 and 2019.
Board of Directors
The Company’s Board of Directors currently consists of five members, three of whom are Independent Directors. On April 3, 2013, the Board of Directors established an Audit Committee consisting of its Independent Directors. The Board of Directors also established a Pricing Committee of the Board of Directors, a Nominating and Governance Committee of the Board of Directors and a Compensation Committee of the Board of Directors, and may establish additional committees in the future. For the years ended
December 31, 2019
,
2018
and
2017
, the Company incurred
$353
,
$370
and
$443
, respectively, in fees and expenses associated with its Independent Directors' services on the Company's Board of Directors and the Audit Committee. As of
December 31, 2019
and
2018
,
$0
and
$0
, respectively, was unpaid and included in other accrued expenses and liabilities in the accompanying Consolidated Statements of Assets and Liabilities.
Transactions with Credit Fund
During the years ended
December 31, 2019
,
2018
and
2017
, the Company sold
2
,
4
and
17
investments, respectively, to Credit Fund for proceeds of
$34,728
,
$85,002
and
$135,466
, respectively, and realized gains of
$208
,
$0
and
$190
, respectively. See Note
5
, Middle Market Credit Fund, LLC, to these consolidated financial statements.
5. MIDDLE MARKET CREDIT FUND, LLC
Overview
On February 29, 2016, the Company and Credit Partners entered into the Limited Liability Company Agreement to co-manage Credit Fund, a Delaware limited liability company that is not consolidated in the Company’s consolidated financial statements. Credit Fund primarily invests in first lien loans of middle market companies. Credit Fund is managed by a six-member board of managers, on which the Company and Credit Partners each have equal representation. Establishing a quorum for Credit Fund’s board of managers requires at least four members to be present at a meeting, including at least two of the Company’s representatives and two of Credit Partners’ representatives. The Company and Credit Partners each have 50% economic ownership of Credit Fund and have commitments to fund, from time to time, capital of up to $400,000 each. Funding of such commitments generally requires the approval of the board of Credit Fund, including the board members appointed by the Company. By virtue of its membership interest, the Company and Credit Partners each indirectly bear an allocable share of all expenses and other obligations of Credit Fund.
Together with Credit Partners, the Company co-invests through Credit Fund. Investment opportunities for Credit Fund are sourced primarily by the Company and its affiliates. Portfolio and investment decisions with respect to Credit Fund must be unanimously approved by a quorum of Credit Fund’s investment committee consisting of an equal number of representatives of the Company and Credit Partners. Therefore, although the Company owns more than 25% of the voting securities of Credit Fund, the Company does not believe that it has control over Credit Fund (other than for purposes of the Investment Company Act). Middle Market Credit Fund SPV, LLC (the “Credit Fund Sub”), MMCF CLO 2017-1 LLC (the “2017-1 Issuer”), MMCF CLO 2019-2, LLC (the "2019-2 Issuer", formerly known as MMCF Warehouse, LLC (the "Credit Fund Warehouse")) and MMCF Warehouse II, LLC (the "Credit Fund Warehouse II), each a Delaware limited liability company, were formed on April 5, 2016, October 6, 2017, November 26, 2018 and August 16, 2019, respectively. Credit Fund Sub, the 2017-1 Issuer, the 2019-2 Issuer and the Credit Fund Warehouse II are wholly owned subsidiaries of Credit Fund and are consolidated in Credit Fund’s consolidated financial statements commencing from the date of their respective formations. Credit Fund Sub, the 2017-1 Issuer, the 2019-2 Issuer and Credit Fund Warehouse II primarily invest in first lien loans of middle market companies. Credit Fund and its wholly owned subsidiaries follow the same Internal Risk Rating System as the Company. Refer to "Debt" below for discussion regarding the credit facilities entered into and the notes issued by such wholly-owned subsidiaries.
Credit Fund, the Company and Credit Partners entered into an administration agreement with Carlyle Global Credit Administration L.L.C., the administrative agent of Credit Fund (in such capacity, the “Administrative Agent”), pursuant to
128
which the Administrative Agent is delegated certain administrative and non-discretionary functions, is authorized to enter into sub-administration agreements at the expense of Credit Fund with the approval of the board of managers of Credit Fund, and is reimbursed by Credit Fund for its costs and expenses and Credit Fund’s allocable portion of overhead incurred by the Administrative Agent in performing its obligations thereunder.
Selected Financial Data
Since inception of Credit Fund and through
December 31, 2019
and
2018
, the Company and Credit Partners each made capital contributions of
$1
and
$1
in members’ equity, respectively, and
$123,500
and
$118,000
in subordinated loans, respectively, to Credit Fund. Below is certain summarized consolidated information for Credit Fund as of
December 31, 2019
and
2018
.
|
As of December 31,
|
|||||||
|
2019
|
2018
|
||||||
|
ASSETS
|
|||||||
|
Investments, at fair value (amortized cost of $1,258,157 and $1,198,537,respectively)
|
$
|
1,246,839
|
|
$
|
1,173,508
|
|
|
|
Cash and cash equivalents
|
64,787
|
|
55,698
|
|
|||
|
Other assets
|
9,369
|
|
6,849
|
|
|||
|
Total assets
|
$
|
1,320,995
|
|
$
|
1,236,055
|
|
|
|
LIABILITIES AND MEMBERS’ EQUITY
|
|||||||
|
Secured borrowings
|
$
|
441,077
|
|
$
|
572,178
|
|
|
|
Notes payable, net of unamortized debt issuance costs of $3,441 and $1,849, respectively)
|
528,407
|
|
309,114
|
|
|||
|
Mezzanine loans
(1)
|
93,000
|
|
112,000
|
|
|||
|
Other liabilities
|
32,383
|
|
34,195
|
|
|||
|
Subordinated loans and members’ equity
(1)
|
226,128
|
|
208,568
|
|
|||
|
Total liabilities and members’ equity
|
$
|
1,320,995
|
|
$
|
1,236,055
|
|
|
(1) As of
December 31, 2019
and
2018
, the Company's ownership interest in the subordinated loans and members' equity was
$111,596
and
$110,295
, respectively, and
$93,000
and
$112,000
, respectively, in the mezzanine loans.
|
For the Years Ended December 31,
|
|||||||
|
2019
|
2018
|
||||||
|
Total investment income
|
$
|
94,092
|
|
$
|
82,560
|
|
|
|
Expenses
|
|||||||
|
Interest and credit facility expenses
|
59,228
|
|
51,936
|
|
|||
|
Other expenses
|
2,230
|
|
1,988
|
|
|||
|
Total expenses
|
61,458
|
|
53,924
|
|
|||
|
Net investment income (loss)
|
32,634
|
|
28,636
|
|
|||
|
Net realized gain (loss) on investments
|
(8,285
|
)
|
33
|
|
|||
|
Net change in unrealized appreciation (depreciation) on investments
|
13,711
|
|
(26,133
|
)
|
|||
|
Net increase (decrease) resulting from operations
|
$
|
38,060
|
|
$
|
2,536
|
|
|
129
Below is a summary of Credit Fund’s portfolio, followed by a listing of the loans in Credit Fund’s portfolio as of
December 31, 2019
and
2018
:
|
As of December 31,
|
|||||||
|
|
2019
|
2018
|
|||||
|
Senior secured loans
(1)
|
$
|
1,260,582
|
|
$
|
1,207,913
|
|
|
|
Weighted average yields of senior secured loans based on amortized cost
(2)
|
6.51
|
%
|
7.16
|
%
|
|||
|
Weighted average yields of senior secured loans based on fair value
(2)
|
6.55
|
%
|
7.32
|
%
|
|||
|
Number of portfolio companies in Credit Fund
|
61
|
|
60
|
|
|||
|
Average amount per portfolio company
(1)
|
$
|
20,665
|
|
$
|
20,132
|
|
|
|
Number of loans on non-accrual status
|
1
|
|
1
|
|
|||
|
Fair value of loans on non-accrual status
|
$
|
21,150
|
|
$
|
25,400
|
|
|
|
Percentage of portfolio at floating interest rates
(3) (4)
|
98.3
|
%
|
99.9
|
%
|
|||
|
Percentage of portfolio at fixed interest rates
(4)
|
1.7
|
%
|
0.1
|
%
|
|||
|
Fair value of loans with PIK provisions
|
$
|
21,150
|
|
$
|
1,119
|
|
|
|
Percentage of portfolio with PIK provisions
(4)
|
1.7
|
%
|
0.1
|
%
|
|||
|
(1)
|
At par/principal amount.
|
|
(2)
|
Weighted average yields include the effect of accretion of discounts and amortization of premiums and are based on interest rates as of
December 31, 2019
and
2018
. Weighted average yield on debt and income producing securities at fair value is computed as (a) the annual stated interest rate or yield earned plus the net annual amortization of OID and market discount earned on accruing debt included in such securities, divided by (b) total first lien and second lien debt at fair value included in such securities. Weighted average yield on debt and income producing securities at amortized cost is computed as (a) the annual stated interest rate or yield earned plus the net annual amortization of OID and market discount earned on accruing debt included in such securities, divided by (b) total first lien and second lien debt at amortized cost included in such securities. Actual yields earned over the life of each investment could differ materially from the yields presented above.
|
|
(3)
|
Floating rate debt investments are generally subject to interest rate floors.
|
|
(4)
|
Percentages based on fair value.
|
130
|
Consolidated Schedule of Investments as of December 31, 2019
|
|||||||||||||||||||||||
|
Investments
(1)
|
Footnotes
|
Industry
|
Reference Rate & Spread
(2)
|
Interest Rate
(2)
|
Maturity Date
|
Par/ Principal Amount
|
Amortized Cost
(5)
|
Fair Value
(6)
|
|||||||||||||||
|
First Lien Debt (98.11% of fair value)
|
|||||||||||||||||||||||
|
Achilles Acquisition, LLC
|
\+#
|
(2) (3)
|
Banking, Finance, Insurance & Real Estate
|
L + 4.00%
|
5.75%
|
10/13/2025
|
$
|
17,865
|
|
$
|
17,776
|
|
$
|
17,763
|
|
||||||||
|
Acrisure, LLC
|
+\
|
(2) (3)
|
Banking, Finance, Insurance & Real Estate
|
L + 3.75%
|
5.85%
|
11/22/2023
|
11,820
|
|
11,810
|
|
11,805
|
|
|||||||||||
|
Acrisure, LLC
|
+\#
|
(2) (3)
|
Banking, Finance, Insurance & Real Estate
|
L + 4.25%
|
6.35%
|
11/22/2023
|
20,674
|
|
20,639
|
|
20,674
|
|
|||||||||||
|
Advanced Instruments, LLC
|
^+\*
|
(2) (3) (7)
|
Healthcare & Pharmaceuticals
|
L + 5.25%
|
6.99%
|
10/31/2022
|
35,610
|
|
35,536
|
|
35,466
|
|
|||||||||||
|
Alku, LLC
|
+#
|
(2) (3)
|
Business Services
|
L + 5.50%
|
7.44%
|
7/29/2026
|
25,000
|
|
24,754
|
|
24,624
|
|
|||||||||||
|
Alpha Packaging Holdings, Inc.
|
+*\
|
(2) (3)
|
Containers, Packaging & Glass
|
L + 4.25%
|
6.35%
|
5/12/2020
|
16,684
|
|
16,676
|
|
16,601
|
|
|||||||||||
|
AmeriLife Group, LLC
|
^#
|
(2) (3) (7)
|
Banking, Finance, Insurance & Real Estate
|
L + 4.50%
|
6.20%
|
6/5/2026
|
16,627
|
|
16,557
|
|
16,558
|
|
|||||||||||
|
Anchor Packaging, Inc.
|
^#
|
(2) (3) (7)
|
Containers, Packaging & Glass
|
L + 4.00%
|
5.70%
|
7/18/2026
|
20,462
|
|
20,363
|
|
20,457
|
|
|||||||||||
|
API Technologies Corp.
|
\+
|
(2) (3)
|
Aerospace & Defense
|
L + 4.25%
|
5.95%
|
5/9/2026
|
14,925
|
|
14,853
|
|
14,807
|
|
|||||||||||
|
Aptean, Inc.
|
+\
|
(2) (3)
|
Software
|
L + 4.25%
|
6.34%
|
4/23/2026
|
12,406
|
|
12,344
|
|
12,385
|
|
|||||||||||
|
AQA Acquisition Holding, Inc.
|
^*\
|
(2) (3) (7)
|
High Tech Industries
|
L + 4.25%
|
6.16%
|
5/24/2023
|
18,954
|
|
18,922
|
|
18,860
|
|
|||||||||||
|
Avalign Technologies, Inc.
|
+\
|
(2) (3)
|
Healthcare & Pharmaceuticals
|
L + 4.50%
|
6.70%
|
12/22/2025
|
14,741
|
|
14,610
|
|
14,626
|
|
|||||||||||
|
Big Ass Fans, LLC
|
+*\
|
(2) (3)
|
Capital Equipment
|
L + 3.75%
|
5.85%
|
5/21/2024
|
13,909
|
|
13,841
|
|
13,903
|
|
|||||||||||
|
Borchers, Inc.
|
+*\
|
(2) (3) (7)
|
Chemicals, Plastics & Rubber
|
L + 4.50%
|
6.60%
|
11/1/2024
|
15,116
|
|
15,072
|
|
15,085
|
|
|||||||||||
|
Brooks Equipment Company, LLC
|
*
|
(2) (3)
|
Construction & Building
|
L + 5.00%
|
6.91%
|
8/29/2020
|
5,144
|
|
5,141
|
|
5,141
|
|
|||||||||||
|
Clarity Telecom LLC.
|
+
|
(2) (3)
|
Media: Broadcasting & Subscription
|
L + 4.50%
|
6.20%
|
8/30/2026
|
14,963
|
|
14,915
|
|
14,902
|
|
|||||||||||
|
Clearent Newco, LLC
|
^+\
|
(2) (3) (7)
|
High Tech Industries
|
L + 5.50%
|
7.44%
|
3/20/2025
|
29,738
|
|
29,436
|
|
29,134
|
|
|||||||||||
|
Datto, Inc.
|
+\
|
(2) (3)
|
High Tech Industries
|
L + 4.25%
|
5.95%
|
4/2/2026
|
12,438
|
|
12,375
|
|
12,420
|
|
|||||||||||
|
DecoPac, Inc.
|
+*\
|
(2) (3) (7)
|
Non-durable Consumer Goods
|
L + 4.25%
|
6.01%
|
9/29/2024
|
12,336
|
|
12,233
|
|
12,292
|
|
|||||||||||
|
Dent Wizard International Corporation
|
+\
|
(2) (3)
|
Automotive
|
L + 4.00%
|
5.70%
|
4/7/2020
|
36,880
|
|
36,843
|
|
36,717
|
|
|||||||||||
|
DTI Holdco, Inc.
|
+*\
|
(2) (3)
|
High Tech Industries
|
L + 4.75%
|
6.68%
|
9/30/2023
|
18,885
|
|
18,771
|
|
17,611
|
|
|||||||||||
|
Eliassen Group, LLC
|
+\
|
(2) (3)
|
Business Services
|
L + 4.50%
|
6.20%
|
11/5/2024
|
7,581
|
|
7,548
|
|
7,579
|
|
|||||||||||
|
EIP Merger Sub, LLC (Evolve IP)
|
+^
|
(2) (3) (7)
|
Telecommunications
|
L + 5.75%
|
7.45%
|
6/7/2023
|
19,661
|
|
19,605
|
|
19,661
|
|
|||||||||||
|
Exactech, Inc.
|
+\#
|
(2) (3)
|
Healthcare & Pharmaceuticals
|
L + 3.75%
|
5.45%
|
2/14/2025
|
21,772
|
|
21,634
|
|
21,751
|
|
|||||||||||
|
Excel Fitness Holdings, Inc.
|
+#
|
(2) (3)
|
Hotel, Gaming & Leisure
|
L + 5.25%
|
6.95%
|
10/7/2025
|
25,000
|
|
24,758
|
|
24,875
|
|
|||||||||||
|
Golden West Packaging Group LLC
|
+*\
|
(2) (3)
|
Containers, Packaging & Glass
|
L + 5.75%
|
7.45%
|
6/20/2023
|
29,464
|
|
29,303
|
|
29,072
|
|
|||||||||||
|
HMT Holding Inc.
|
^+*\
|
(2) (3) (7)
|
Energy: Oil & Gas
|
L + 5.00%
|
6.74%
|
11/17/2023
|
33,157
|
|
32,678
|
|
32,972
|
|
|||||||||||
|
Jensen Hughes, Inc.
|
\+^*
|
(2) (3) (7)
|
Utilities: Electric
|
L + 4.50%
|
6.24%
|
3/22/2024
|
33,909
|
|
33,757
|
|
33,550
|
|
|||||||||||
|
KAMC Holdings, Inc.
|
+#
|
(2) (3)
|
Energy: Electricity
|
L + 4.00%
|
5.91%
|
8/14/2026
|
13,965
|
|
13,899
|
|
13,881
|
|
|||||||||||
|
MAG DS Corp.
|
^+\
|
(2) (3) (7)
|
Aerospace & Defense
|
L + 4.75%
|
6.46%
|
6/6/2025
|
28,471
|
|
28,242
|
|
28,286
|
|
|||||||||||
131
|
Consolidated Schedule of Investments as of December 31, 2019
|
|||||||||||||||||||||||
|
Investments
(1)
|
Footnotes
|
Industry
|
Reference Rate & Spread
(2)
|
Interest
Rate
(2)
|
Maturity Date
|
Par/ Principal Amount
|
Amortized Cost
(5)
|
Fair Value
(6)
|
|||||||||||||||
|
First Lien Debt (98.11% of fair value) (continued)
|
|||||||||||||||||||||||
|
Maravai Intermediate Holdings, LLC
|
+\#
|
(2) (3)
|
Healthcare & Pharmaceuticals
|
L + 4.25%
|
6.00%
|
8/2/2025
|
$
|
29,625
|
|
$
|
29,378
|
|
$
|
29,400
|
|
||||||||
|
Marco Technologies, LLC
|
^+\
|
(2) (3) (7)
|
Media: Advertising, Printing & Publishing
|
L + 4.25%
|
6.16%
|
10/30/2023
|
7,463
|
|
7,410
|
|
7,463
|
|
|||||||||||
|
Mold-Rite Plastics, LLC
|
+\
|
(2) (3)
|
Chemicals, Plastics & Rubber
|
L + 4.25%
|
5.95%
|
12/14/2021
|
14,557
|
|
14,519
|
|
14,524
|
|
|||||||||||
|
MSHC, Inc.
|
^+*\
|
(2) (3) (7)
|
Construction & Building
|
L + 4.25%
|
5.95%
|
12/31/2024
|
38,251
|
|
38,138
|
|
38,166
|
|
|||||||||||
|
Newport Group Holdings II, Inc.
|
\+#
|
(2) (3)
|
Banking, Finance, Insurance & Real Estate
|
L + 3.75%
|
5.65%
|
9/13/2025
|
23,715
|
|
23,487
|
|
23,663
|
|
|||||||||||
|
Odyssey Logistics & Technology Corp.
|
+*\#
|
(2) (3)
|
Transportation: Cargo
|
L + 4.00%
|
5.70%
|
10/12/2024
|
39,013
|
|
38,859
|
|
38,763
|
|
|||||||||||
|
Output Services Group
|
^+\
|
(2) (3) (7)
|
Media: Advertising, Printing & Publishing
|
L + 4.50%
|
6.20%
|
3/27/2024
|
19,621
|
|
19,570
|
|
19,469
|
|
|||||||||||
|
PAI Holdco, Inc.
|
+*\
|
(2) (3)
|
Automotive
|
L + 4.25%
|
6.35%
|
1/5/2025
|
19,532
|
|
19,458
|
|
19,532
|
|
|||||||||||
|
Park Place Technologies, Inc.
|
+\#
|
(2) (3)
|
High Tech Industries
|
L + 4.00%
|
5.70%
|
3/28/2025
|
22,566
|
|
22,489
|
|
22,566
|
|
|||||||||||
|
Pasternack Enterprises, Inc.
|
+\
|
(2) (3)
|
Capital Equipment
|
L + 4.00%
|
5.70%
|
7/2/2025
|
22,755
|
|
22,742
|
|
22,653
|
|
|||||||||||
|
Pathway Vet Alliance LLC
|
+\
|
(2) (3) (7)
|
Consumer Services
|
L + 4.50%
|
6.21%
|
12/20/2024
|
19,085
|
|
18,708
|
|
19,217
|
|
|||||||||||
|
Pharmalogic Holdings Corp.
|
+\
|
(2) (3)
|
Healthcare & Pharmaceuticals
|
L + 4.00%
|
5.70%
|
6/11/2023
|
11,320
|
|
11,296
|
|
11,302
|
|
|||||||||||
|
Premise Health Holding Corp.
|
^+\#
|
(2) (3) (7)
|
Healthcare & Pharmaceuticals
|
L + 3.50%
|
5.60%
|
7/10/2025
|
13,723
|
|
13,665
|
|
13,501
|
|
|||||||||||
|
Propel Insurance Agency, LLC
|
^+\
|
(2) (3) (7)
|
Banking, Finance, Insurance & Real Estate
|
L + 4.25%
|
6.35%
|
6/1/2024
|
22,532
|
|
22,056
|
|
22,395
|
|
|||||||||||
|
Q Holding Company
|
+*\#
|
(2) (3)
|
Automotive
|
L + 5.00%
|
6.70%
|
12/31/2023
|
21,955
|
|
21,777
|
|
21,922
|
|
|||||||||||
|
QW Holding Corporation (Quala)
|
^+*
|
(2) (3) (7)
|
Environmental Industries
|
L + 5.75%
|
7.73%
|
8/31/2022
|
11,630
|
|
11,449
|
|
11,531
|
|
|||||||||||
|
Radiology Partners, Inc.
|
+\#
|
(2) (3)
|
Healthcare & Pharmaceuticals
|
L + 4.75%
|
6.66%
|
7/9/2025
|
28,719
|
|
28,590
|
|
28,768
|
|
|||||||||||
|
RevSpring Inc.
|
+*\#
|
(2) (3)
|
Media: Advertising, Printing & Publishing
|
L + 4.00%
|
5.95%
|
10/11/2025
|
24,750
|
|
24,631
|
|
24,608
|
|
|||||||||||
|
Situs Group Holdings Corporation
|
\+^
|
(2) (3) (7)
|
Banking, Finance, Insurance & Real Estate
|
L + 4.75%
|
6.45%
|
6/28/2025
|
13,715
|
|
13,621
|
|
13,697
|
|
|||||||||||
|
Systems Maintenance Services Holding, Inc.
|
+*
|
(2) (3)
|
High Tech Industries
|
L + 5.00%
|
6.70%
|
10/30/2023
|
23,765
|
|
23,672
|
|
18,180
|
|
|||||||||||
|
Surgical Information Systems, LLC
|
+*\
|
(2) (3) (6)
|
High Tech Industries
|
L + 4.75%
|
7.47%
|
4/24/2023
|
26,168
|
|
26,005
|
|
25,715
|
|
|||||||||||
|
T2 Systems, Inc.
|
^+*
|
(2) (3) (7)
|
Transportation: Consumer
|
L + 6.75%
|
8.85%
|
9/28/2022
|
18,045
|
|
17,789
|
|
18,045
|
|
|||||||||||
|
The Original Cakerie, Ltd. (Canada)
|
+*
|
(2) (3) (7)
|
Beverage, Food & Tobacco
|
L + 5.00%
|
6.84%
|
7/20/2022
|
8,928
|
|
8,897
|
|
8,887
|
|
|||||||||||
|
The Original Cakerie, Ltd. (Canada)
|
^*
|
(2) (3) (7)
|
Beverage, Food & Tobacco
|
L + 4.50%
|
6.34%
|
7/20/2022
|
6,826
|
|
6,801
|
|
6,790
|
|
|||||||||||
|
ThoughtWorks, Inc.
|
+*\
|
(2) (3)
|
Business Services
|
L + 4.00%
|
5.70%
|
10/11/2024
|
11,824
|
|
11,794
|
|
11,824
|
|
|||||||||||
|
U.S. Acute Care Solutions, LLC
|
+\*
|
(2) (3)
|
Healthcare & Pharmaceuticals
|
L + 5.00%
|
6.91%
|
5/15/2021
|
31,431
|
|
31,331
|
|
29,869
|
|
|||||||||||
|
U.S. TelePacific Holdings Corp.
|
+*\
|
(2) (3)
|
Telecommunications
|
L + 5.00%
|
7.10%
|
5/2/2023
|
26,660
|
|
26,499
|
|
25,430
|
|
|||||||||||
|
Valet Waste Holdings, Inc.
|
+\
|
(2) (3)
|
Construction & Building
|
L + 3.75%
|
5.70%
|
9/28/2025
|
11,850
|
|
11,825
|
|
11,688
|
|
|||||||||||
|
Welocalize, Inc.
|
+^
|
(2) (3) (7)
|
Business Services
|
L + 4.50%
|
6.21%
|
12/2/2024
|
23,038
|
|
22,788
|
|
22,787
|
|
|||||||||||
|
WIRB - Copernicus Group, Inc.
|
+*\
|
(2) (3) (7)
|
Healthcare & Pharmaceuticals
|
L + 4.25%
|
5.95%
|
8/15/2022
|
20,888
|
|
20,822
|
|
20,887
|
|
|||||||||||
132
|
Consolidated Schedule of Investments as of December 31, 2019
|
|||||||||||||||||||||||
|
Investments
(1)
|
Footnotes
|
Industry
|
Reference Rate & Spread
(2)
|
Interest
Rate
(2)
|
Maturity Date
|
Par/ Principal Amount
|
Amortized Cost
(5)
|
Fair Value
(6)
|
|||||||||||||||
|
First Lien Debt (98.11% of fair value) (continued)
|
|||||||||||||||||||||||
|
WRE Holding Corp.
|
^+*
|
(2) (3) (7)
|
Environmental Industries
|
L + 5.00%
|
6.91%
|
1/3/2023
|
$
|
7,431
|
|
$
|
7,372
|
|
$
|
7,304
|
|
||||||||
|
Zywave, Inc.
|
+*\
|
(2) (3) (7)
|
High Tech Industries
|
L + 5.00%
|
6.93%
|
11/17/2022
|
19,228
|
|
19,107
|
|
19,211
|
|
|||||||||||
|
First Lien Debt Total
|
$
|
1,231,436
|
|
$
|
1,223,215
|
|
|||||||||||||||||
|
Second Lien Debt (1.75% of fair value)
|
|||||||||||||||||||||||
|
DBI Holding, LLC
|
^*
|
(2) (3) (8)
|
Transportation: Cargo
|
8.00% PIK
|
8.00%
|
2/1/2026
|
$
|
21,150
|
|
$
|
20,697
|
|
$
|
21,150
|
|
||||||||
|
Zywave, Inc.
|
*
|
(2) (3)
|
High Tech Industries
|
L + 9.00%
|
10.94%
|
11/17/2023
|
$
|
666
|
|
$
|
660
|
|
$
|
664
|
|
||||||||
|
Second Lien Debt Total
|
$
|
21,357
|
|
$
|
21,814
|
|
|||||||||||||||||
|
Equity Investments (0.15% of fair value)
|
|||||||||||||||||||||||
|
DBI Holding, LLC
|
^
|
|
Transportation: Cargo
|
|
|
|
$
|
16,957
|
|
$
|
5,364
|
|
$
|
1,810
|
|
||||||||
|
Equity Investments Total
|
$
|
5,364
|
|
$
|
1,810
|
|
|||||||||||||||||
|
Total Investments
|
$
|
1,258,157
|
|
$
|
1,246,839
|
|
|||||||||||||||||
^ Denotes that all or a portion of the assets are owned by Credit Fund. Credit Fund has entered into a revolving credit facility (the "Credit Fund Facility"). Accordingly, such assets are not available to creditors of Credit Fund Sub, the 2017-1 Issuer, the 2019-2 Issuer or Credit Fund Warehouse II.
+ Denotes that all or a portion of the assets are owned by Credit Fund Sub. Credit Fund Sub has entered into a revolving credit facility (the “Credit Fund Sub Facility”). The lenders of the Credit Fund Sub Facility have a first lien security interest in substantially all of the assets of Credit Fund Sub. Accordingly, such assets are not available to creditors of Credit Fund, the 2017-1 Issuer, the 2019-2 Issuer or Credit Fund Warehouse II.
* Denotes that all or a portion of the assets are owned by the 2017-1 Issuer and secure the notes issued in connection with a $399,900 term debt securitization completed by Credit Fund on December 19, 2017 (the “2017-1 Debt Securitization”). Accordingly, such assets are not available to creditors of Credit Fund, Credit Fund Sub, the 2019-2 Issuer or Credit Fund Warehouse II.
\ Denotes that all or a portion of the assets are owned by the 2019-2 Issuer and secure the notes issued in connection with a $399,900 term debt securitization completed by Credit Fund on May 21, 2019 (the “2019-2 Debt Securitization”). Accordingly, such assets are not available to creditors of Credit Fund, Credit Fund Sub, the 2017-1 Issuer or Credit Fund Warehouse II.
# Denotes that all or a portion of the assets are owned by the Credit Fund Warehouse II. Credit Fund Warehouse II has entered into a revolving credit facility (the "Credit Fund Warehouse II"). The lenders of the Credit Fund Warehouse II Facility have a first lien security interest in substantially all of the assets of the Credit Fund Warehouse II. Accordingly, such assets are not available to creditors of Credit Fund, Credit Fund Sub, 2017-1 Issuer or 2019-2 Issuer.
|
(1)
|
Unless otherwise indicated, issuers of investments held by Credit Fund are domiciled in the United States. As of
December 31, 2019
, the geographical composition of investments as a percentage of fair value was
1.26%
in Canada and
98.74%
in the United States. Certain portfolio company investments are subject to contractual restrictions on sales.
|
|
(2)
|
Variable rate loans to the portfolio companies bear interest at a rate that is determined by reference to either LIBOR or an alternate base rate (commonly based on the Federal Funds Rate or the U.S. Prime Rate), which generally resets quarterly. For each such loan, Credit Fund has indicated the reference rate used and provided the spread and the interest rate in effect as of
December 31, 2019
. As of
December 31, 2019
, the reference rates for Credit Fund's variable rate loans were the 30-day LIBOR at
1.75%
, the 90-day LIBOR at
1.91%
and the 180-day LIBOR at
1.91%
.
|
|
(3)
|
Loan includes interest rate floor feature, which is generally 1.00%.
|
|
(4)
|
Amortized cost represents original cost, including origination fees and upfront fees received that are deemed to be an adjustment to yield, adjusted for the accretion/amortization of discounts/premiums, as applicable, on debt investments using the effective interest method.
|
|
(5)
|
Fair value is determined in good faith by or under the direction of the board of managers of Credit Fund, pursuant to Credit Fund’s valuation policy, with the fair value of all investments determined using significant unobservable inputs, which is substantially similar to the valuation policy of the Company provided in Note
3
, Fair Value Measurements, to these consolidated financial statements.
|
|
(6)
|
In addition to the interest earned based on the stated interest rate of this loan, which is the amount reflected in this schedule, Credit Fund is entitled to receive additional interest as a result of an agreement among lenders as follows: Surgical Information Systems, LLC (
0.89%
). Pursuant to the agreement among lenders in respect of these loans, these investments represent a first lien/last out loan, which has a secondary priority behind the first lien/first out loan with respect to principal, interest and other payments.
|
133
|
(7)
|
As of
December 31, 2019
, Credit Fund and Credit Fund Sub had the following unfunded commitments to fund delayed draw and revolving senior secured loans:
|
|
First Lien Debt – unfunded delayed draw and revolving term loans commitments
|
Type
|
Unused Fee
|
Par/ Principal Amount
|
Fair Value
|
|||||||||
|
Advanced Instruments, LLC
|
Revolver
|
0.50
|
%
|
$
|
563
|
|
$
|
(2
|
)
|
||||
|
AmeriLife Group, LLC
|
Delayed Draw
|
1.00
|
298
|
|
(1
|
)
|
|||||||
|
Anchor Packaging, Inc.
|
Delayed Draw
|
1.00
|
4,487
|
|
(1
|
)
|
|||||||
|
AQA Acquisition Holding, Inc.
|
Revolver
|
0.50
|
2,459
|
|
(11
|
)
|
|||||||
|
Borchers, Inc.
|
Revolver
|
0.50
|
1,935
|
|
(3
|
)
|
|||||||
|
Clearent Newco, LLC
|
Delayed Draw
|
1.00
|
6,636
|
|
(110
|
)
|
|||||||
|
DecoPac, Inc.
|
Revolver
|
0.50
|
2,143
|
|
(7
|
)
|
|||||||
|
EIP Merger Sub, LLC (Evolve IP)
|
Revolver
|
0.50
|
1,680
|
|
—
|
|
|||||||
|
EIP Merger Sub, LLC (Evolve IP)
|
Delayed Draw
|
1.00
|
2,240
|
|
—
|
|
|||||||
|
HMT Holding Inc.
|
Revolver
|
0.50
|
6,173
|
|
(29
|
)
|
|||||||
|
Jensen Hughes, Inc.
|
Revolver
|
0.50
|
1,136
|
|
(11
|
)
|
|||||||
|
Jensen Hughes, Inc.
|
Delayed Draw
|
1.00
|
2,365
|
|
(23
|
)
|
|||||||
|
MAG DS Corp.
|
Revolver
|
0.50
|
2,188
|
|
(13
|
)
|
|||||||
|
Marco Technologies, LLC
|
Delayed Draw
|
1.00
|
7,500
|
|
—
|
|
|||||||
|
MSHC, Inc.
|
Delayed Draw
|
1.00
|
1,913
|
|
(4
|
)
|
|||||||
|
Output Services Group
|
Delayed Draw
|
4.25
|
116
|
|
(1
|
)
|
|||||||
|
Pathway Vet Alliance LLC
|
Delayed Draw
|
1.00
|
19,867
|
|
68
|
|
|||||||
|
Premise Health Holding Corp.
|
Delayed Draw
|
1.00
|
1,103
|
|
(17
|
)
|
|||||||
|
Propel Insurance Agency, LLC
|
Revolver
|
0.50
|
2,381
|
|
(10
|
)
|
|||||||
|
Propel Insurance Agency, LLC
|
Delayed Draw
|
0.50
|
7,143
|
|
(31
|
)
|
|||||||
|
QW Holding Corporation (Quala)
|
Revolver
|
0.50
|
5,498
|
|
(31
|
)
|
|||||||
|
QW Holding Corporation (Quala)
|
Delayed Draw
|
1.00
|
217
|
|
(1
|
)
|
|||||||
|
Situs Group Holdings Corporation
|
Delayed Draw
|
1.00
|
1,216
|
|
(1
|
)
|
|||||||
|
T2 Systems, Inc.
|
Revolver
|
0.50
|
1,369
|
|
—
|
|
|||||||
|
The Original Cakerie, Ltd. (Canada)
|
Revolver
|
0.50
|
1,199
|
|
(5
|
)
|
|||||||
|
Welocalize, Inc.
|
Revolver
|
0.50
|
2,057
|
|
(21
|
)
|
|||||||
|
WIRB - Copernicus Group, Inc.
|
Revolver
|
0.50
|
1,000
|
|
—
|
|
|||||||
|
WIRB - Copernicus Group, Inc.
|
Delayed Draw
|
1.00
|
2,592
|
|
—
|
|
|||||||
|
WRE Holding Corp.
|
Revolver
|
0.50
|
441
|
|
(6
|
)
|
|||||||
|
WRE Holding Corp.
|
Delayed Draw
|
1.00
|
1,981
|
|
(25
|
)
|
|||||||
|
Zywave, Inc.
|
Revolver
|
0.50
|
998
|
|
(1
|
)
|
|||||||
|
Total unfunded commitments
|
$
|
92,894
|
|
$
|
(297
|
)
|
|||||||
|
(8)
|
Loan was on non-accrual status as of
December 31, 2019
.
|
134
|
Consolidated Schedule of Investments as of December 31, 2018
|
|||||||||||||||||||||||
|
Investments
(1)
|
Footnotes
|
Industry
|
Reference Rate & Spread
(2)
|
Interest Rate
(2)
|
Maturity Date
|
Par/ Principal Amount
|
Amortized Cost
(5)
|
Fair Value
(6)
|
|||||||||||||||
|
First Lien Debt (99.91% of fair value)
|
|||||||||||||||||||||||
|
Achilles Acquisition, LLC
|
+\
|
(2) (3)
|
Banking, Finance, Insurance & Real Estate
|
L + 4.00%
|
6.56%
|
10/11/2025
|
$
|
18,000
|
|
$
|
17,906
|
|
$
|
17,716
|
|
||||||||
|
Acrisure, LLC
|
+
|
(2) (3)
|
Banking, Finance, Insurance & Real Estate
|
L + 4.25%
|
6.77%
|
11/22/2023
|
20,886
|
|
20,843
|
|
19,981
|
|
|||||||||||
|
Acrisure, LLC
|
+\
|
(2) (3)
|
Banking, Finance, Insurance & Real Estate
|
L + 3.75%
|
6.27%
|
11/22/2023
|
11,940
|
|
11,928
|
|
11,333
|
|
|||||||||||
|
Advanced Instruments, LLC
|
^+*
|
(2) (3) (8)
|
Healthcare & Pharmaceuticals
|
L + 5.25%
|
7.63%
|
10/31/2022
|
11,791
|
|
11,695
|
|
11,690
|
|
|||||||||||
|
Ahead, LLC
|
^+
|
(2) (3) (8)
|
High Tech Industries
|
L + 4.25%
|
6.87%
|
6/29/2023
|
20,059
|
|
19,959
|
|
19,856
|
|
|||||||||||
|
Alpha Packaging Holdings, Inc.
|
+*
|
(2) (3)
|
Containers, Packaging & Glass
|
L + 4.25%
|
7.05%
|
5/12/2020
|
16,860
|
|
16,830
|
|
16,813
|
|
|||||||||||
|
AM Conservation Holding Corporation
|
+*
|
(2) (3)
|
Energy: Electricity
|
L + 4.50%
|
7.30%
|
10/31/2022
|
38,310
|
|
38,079
|
|
38,027
|
|
|||||||||||
|
AQA Acquisition Holding, Inc.
|
^+*
|
(2) (3) (8)
|
High Tech Industries
|
L + 4.25%
|
7.05%
|
5/24/2023
|
19,148
|
|
19,111
|
|
18,978
|
|
|||||||||||
|
Avalign Technologies, Inc.
|
+\
|
(2) (3)
|
Healthcare & Pharmaceuticals
|
L + 4.50%
|
7.00%
|
12/22/2025
|
13,000
|
|
12,874
|
|
12,848
|
|
|||||||||||
|
Big Ass Fans, LLC
|
+*\
|
(2) (3)
|
Capital Equipment
|
L + 3.75%
|
6.55%
|
5/21/2024
|
14,052
|
|
13,973
|
|
13,840
|
|
|||||||||||
|
Borchers, Inc.
|
^+*
|
(2) (3) (8)
|
Chemicals, Plastics & Rubber
|
L + 4.50%
|
7.30%
|
11/1/2024
|
15,589
|
|
15,533
|
|
15,545
|
|
|||||||||||
|
Brooks Equipment Company, LLC
|
+*
|
(2) (3)
|
Construction & Building
|
L + 5.00%
|
7.71%
|
8/29/2020
|
5,948
|
|
5,940
|
|
5,935
|
|
|||||||||||
|
Clearent Newco, LLC
|
^+
|
(2) (3) (8)
|
High Tech Industries
|
L + 4.00%
|
6.52%
|
3/20/2024
|
23,093
|
|
22,702
|
|
22,819
|
|
|||||||||||
|
DBI Holding, LLC
|
+*
|
(2) (3) (9)
|
Transportation: Cargo
|
L + 5.25%
|
7.76%
|
8/1/2021
|
34,494
|
|
34,276
|
|
25,400
|
|
|||||||||||
|
DBI Holding, LLC
|
^
|
Transportation: Cargo
|
15% (100% PIK)
|
7.76%
|
2/1/2020
|
1,119
|
|
1,119
|
|
1,119
|
|
||||||||||||
|
DecoPac, Inc.
|
^+*
|
(2) (3) (8)
|
Non-durable Consumer Goods
|
L + 4.25%
|
7.05%
|
9/29/2024
|
12,696
|
|
12,571
|
|
12,619
|
|
|||||||||||
|
Dent Wizard International Corporation
|
+
|
(2) (3)
|
Automotive
|
L + 4.00%
|
6.51%
|
4/7/2020
|
24,256
|
|
24,183
|
|
24,110
|
|
|||||||||||
|
DTI Holdco, Inc.
|
+*\
|
(2) (3)
|
High Tech Industries
|
L + 4.75%
|
7.28%
|
9/30/2023
|
19,081
|
|
18,941
|
|
17,793
|
|
|||||||||||
|
EIP Merger Sub, LLC (Evolve IP)
|
+*
|
(2) (3) (4)
|
Telecommunications
|
L + 5.75%
|
8.27%
|
6/7/2022
|
22,358
|
|
21,923
|
|
21,788
|
|
|||||||||||
|
EIP Merger Sub, LLC (Evolve IP)
|
*
|
(2) (3) (7)
|
Telecommunications
|
L + 5.75%
|
8.27%
|
6/7/2022
|
1,500
|
|
1,469
|
|
1,462
|
|
|||||||||||
|
Eliassen Group, LLC
|
+
|
(2) (3)
|
Business Services
|
L + 4.50%
|
7.00%
|
11/5/2024
|
6,250
|
|
6,226
|
|
6,202
|
|
|||||||||||
|
Exactech, Inc.
|
+\
|
(2) (3)
|
Healthcare & Pharmaceuticals
|
L + 3.75%
|
6.27%
|
2/14/2025
|
12,903
|
|
12,849
|
|
12,741
|
|
|||||||||||
|
Executive Consulting Group, LLC, Inc.
|
^+
|
(2) (3) (8)
|
Business Services
|
L + 4.50%
|
7.30%
|
6/20/2024
|
15,318
|
|
15,168
|
|
15,132
|
|
|||||||||||
|
Golden West Packaging Group LLC
|
+*
|
(2) (3)
|
Containers, Packaging & Glass
|
L + 5.25%
|
7.77%
|
6/20/2023
|
30,180
|
|
29,978
|
|
29,760
|
|
|||||||||||
|
HMT Holding Inc.
|
^+*
|
(2) (3) (8)
|
Energy: Oil & Gas
|
L + 4.50%
|
7.02%
|
11/17/2023
|
33,490
|
|
32,902
|
|
33,172
|
|
|||||||||||
|
J.S. Held, LLC
|
+*
|
(2) (3)
|
Banking, Finance, Insurance & Real Estate
|
L + 4.50%
|
7.30%
|
9/25/2024
|
20,309
|
|
20,137
|
|
19,998
|
|
|||||||||||
|
Jensen Hughes, Inc.
|
^+*
|
(2) (3) (8)
|
Utilities: Electric
|
L + 4.50%
|
7.30%
|
3/22/2024
|
27,978
|
|
27,896
|
|
27,382
|
|
|||||||||||
|
Kestra Financial, Inc.
|
+*
|
(2) (3)
|
Banking, Finance, Insurance & Real Estate
|
L + 4.25%
|
6.76%
|
6/24/2022
|
21,744
|
|
21,547
|
|
21,690
|
|
|||||||||||
|
MAG DS Corp.
|
^+
|
(2) (3) (8)
|
Aerospace & Defense
|
L + 4.75%
|
7.27%
|
6/6/2025
|
22,885
|
|
22,679
|
|
22,665
|
|
|||||||||||
|
Maravai Intermediate Holdings, LLC
|
+\
|
(2)
|
Healthcare & Pharmaceuticals
|
L + 4.25%
|
6.81%
|
8/2/2025
|
29,925
|
|
29,640
|
|
29,578
|
|
|||||||||||
135
|
Consolidated Schedule of Investments as of December 31, 2018
|
|||||||||||||||||||||||
|
Investments
(1)
|
Footnotes
|
Industry
|
Reference Rate & Spread
(2)
|
Interest
Rate (2) |
Maturity Date
|
Par/ Principal Amount
|
Amortized Cost
(5)
|
Fair Value
(6)
|
|||||||||||||||
|
First Lien Debt (99.91% of fair value)
|
|||||||||||||||||||||||
|
Mold-Rite Plastics, LLC
|
+
|
(2) (3)
|
Chemicals, Plastics & Rubber
|
L + 4.50%
|
7.30%
|
12/14/2021
|
$
|
14,850
|
|
$
|
14,793
|
|
$
|
14,762
|
|
||||||||
|
MSHC, Inc.
|
^+*
|
(2) (3) (8)
|
Construction & Building
|
L + 4.25%
|
6.89%
|
7/31/2023
|
23,579
|
|
23,514
|
|
23,088
|
|
|||||||||||
|
Newport Group Holdings II, Inc.
|
+\
|
(2)
|
Banking, Finance, Insurance & Real Estate
|
L + 3.75%
|
6.54%
|
9/13/2025
|
17,790
|
|
17,666
|
|
17,564
|
|
|||||||||||
|
North American Dental Management, LLC
|
^+*
|
(2) (3) (8)
|
Healthcare & Pharmaceuticals
|
L + 5.25%
|
8.04%
|
7/7/2023
|
37,781
|
|
37,329
|
|
37,093
|
|
|||||||||||
|
North Haven CA Holdings, Inc.
|
^+*
|
(2) (3) (8)
|
Business Services
|
L + 4.50%
|
7.02%
|
10/2/2023
|
35,139
|
|
34,789
|
|
34,401
|
|
|||||||||||
|
Odyssey Logistics & Technology Corporation
|
+*\
|
(2) (3)
|
Transportation: Cargo
|
L + 4.00%
|
6.52%
|
10/12/2024
|
39,680
|
|
39,496
|
|
39,149
|
|
|||||||||||
|
Output Services Group
|
^+\
|
(2) (3) (8)
|
Media: Advertising, Printing & Publishing
|
L + 4.25%
|
6.77%
|
3/27/2024
|
17,400
|
|
17,338
|
|
16,663
|
|
|||||||||||
|
PAI Holdco, Inc.
|
+*
|
(2) (3)
|
Automotive
|
L + 4.25%
|
7.05%
|
1/5/2025
|
19,727
|
|
19,637
|
|
19,459
|
|
|||||||||||
|
Park Place Technologies, Inc.
|
+\
|
(2) (3)
|
High Tech Industries
|
L + 4.00%
|
6.52%
|
3/29/2025
|
15,922
|
|
15,856
|
|
15,639
|
|
|||||||||||
|
Pasternack Enterprises, Inc.
|
+
|
(2) (3)
|
Capital Equipment
|
L + 4.00%
|
6.52%
|
7/2/2025
|
20,076
|
|
20,076
|
|
19,745
|
|
|||||||||||
|
Pharmalogic Holdings Corp.
|
^+
|
(2) (3) (8)
|
Healthcare & Pharmaceuticals
|
L + 4.00%
|
6.52%
|
6/11/2023
|
7,017
|
|
6,995
|
|
6,949
|
|
|||||||||||
|
Ping Identity Corporation
|
+\
|
(2) (3)
|
High Tech Industries
|
L + 3.75%
|
6.27%
|
1/25/2025
|
4,975
|
|
4,956
|
|
4,915
|
|
|||||||||||
|
Premier Senior Marketing, LLC
|
*
|
(2) (3)
|
Banking, Finance, Insurance & Real Estate
|
L + 4.25%
|
6.75%
|
11/30/2025
|
4,953
|
|
4,953
|
|
4,875
|
|
|||||||||||
|
Premise Health Holding Corp.
|
^+\
|
(2) (3) (8)
|
Healthcare & Pharmaceuticals
|
L + 3.75%
|
6.55%
|
7/10/2025
|
13,862
|
|
13,805
|
|
13,717
|
|
|||||||||||
|
Propel Insurance Agency, LLC
|
^+
|
(2) (3) (8)
|
Banking, Finance, Insurance & Real Estate
|
L + 4.25%
|
6.75%
|
6/1/2024
|
21,088
|
|
20,535
|
|
20,628
|
|
|||||||||||
|
PSI Services, LLC
|
^+*
|
(2) (3) (8)
|
Business Services
|
L + 5.00%
|
7.52%
|
1/20/2023
|
29,919
|
|
29,469
|
|
29,239
|
|
|||||||||||
|
Q Holding Company
|
+*
|
(2) (3)
|
Automotive
|
L + 5.00%
|
7.52%
|
12/18/2021
|
17,099
|
|
17,058
|
|
16,969
|
|
|||||||||||
|
QW Holding Corporation (Quala)
|
^+*
|
(2) (3) (8)
|
Environmental Industries
|
L + 6.75%
|
9.22%
|
8/31/2022
|
9,704
|
|
9,338
|
|
9,489
|
|
|||||||||||
|
RevSpring, Inc.
|
+*\
|
(2) (3)
|
Media: Advertising, Printing & Publishing
|
L + 4.25%
|
7.05%
|
10/11/2025
|
20,000
|
|
19,953
|
|
19,680
|
|
|||||||||||
|
Situs Group Holdings Corporation
|
+
|
(2) (3)
|
Banking, Finance, Insurance & Real Estate
|
L + 4.50%
|
7.02%
|
2/26/2023
|
8,915
|
|
8,892
|
|
8,887
|
|
|||||||||||
|
Surgical Information Systems, LLC
|
+*
|
(2) (3) (7)
|
High Tech Industries
|
L + 4.85%
|
7.37%
|
4/24/2023
|
27,708
|
|
27,494
|
|
27,171
|
|
|||||||||||
|
Systems Maintenance Services Holding, Inc.
|
+*
|
(2) (3)
|
High Tech Industries
|
L + 5.00%
|
7.52%
|
10/28/2023
|
24,010
|
|
23,907
|
|
17,842
|
|
|||||||||||
|
T2 Systems Canada, Inc.
|
+
|
(2) (3)
|
Transportation: Consumer
|
L + 6.75%
|
9.34%
|
9/28/2022
|
2,646
|
|
2,598
|
|
2,630
|
|
|||||||||||
|
T2 Systems, Inc.
|
^+*
|
(2) (3) (8)
|
Transportation: Consumer
|
L + 6.75%
|
9.34%
|
9/28/2022
|
15,775
|
|
15,484
|
|
15,677
|
|
|||||||||||
|
The Original Cakerie, Co. (Canada)
|
+*
|
(2) (3)
|
Beverage, Food & Tobacco
|
L + 5.00%
|
7.50%
|
7/20/2022
|
9,019
|
|
8,968
|
|
8,932
|
|
|||||||||||
|
The Original Cakerie, Ltd. (Canada)
|
+
|
(2) (3) (8)
|
Beverage, Food & Tobacco
|
L + 4.50%
|
7.02%
|
7/20/2022
|
6,957
|
|
6,917
|
|
6,883
|
|
|||||||||||
|
ThoughtWorks, Inc.
|
+*\
|
(2) (3)
|
Business Services
|
L + 4.00%
|
6.52%
|
10/12/2024
|
11,944
|
|
11,909
|
|
11,770
|
|
|||||||||||
|
U.S. Acute Care Solutions, LLC
|
+*
|
(2) (3)
|
Healthcare & Pharmaceuticals
|
L + 5.00%
|
7.52%
|
5/15/2021
|
31,705
|
|
31,540
|
|
31,395
|
|
|||||||||||
|
U.S. TelePacific Holdings Corp.
|
+*\
|
(2) (3)
|
Telecommunications
|
L + 5.00%
|
7.80%
|
5/2/2023
|
26,660
|
|
26,459
|
|
24,768
|
|
|||||||||||
|
Upstream Intermediate, LLC
|
^+
|
(2) (3) (8)
|
Healthcare & Pharmaceuticals
|
L + 4.25%
|
6.77%
|
1/3/2024
|
17,939
|
|
17,863
|
|
17,677
|
|
|||||||||||
136
|
Consolidated Schedule of Investments as of December 31, 2018
|
|||||||||||||||||||||||
|
Investments (1)
|
Footnotes
|
Industry
|
Reference Rate & Spread (2)
|
Interest
Rate (2) |
Maturity Date
|
Par/ Principal Amount
|
Amortized Cost
(5)
|
Fair Value
(6)
|
|||||||||||||||
|
First Lien Debt (99.91% of fair value)
|
|||||||||||||||||||||||
|
Valet Waste Holdings, Inc.
|
+\
|
(2) (3)
|
Construction & Building
|
L + 4.00%
|
6.52%
|
9/28/2025
|
$
|
11,970
|
|
$
|
11,947
|
|
$
|
11,902
|
|
||||||||
|
Valicor Environmental Services, LLC
|
^+*
|
(2) (3) (8)
|
Environmental Industries
|
L + 4.75%
|
7.27%
|
6/1/2023
|
33,410
|
|
32,914
|
|
32,995
|
|
|||||||||||
|
WIRB - Copernicus Group, Inc.
|
^+*
|
(2) (3) (8)
|
Healthcare & Pharmaceuticals
|
L + 4.25%
|
6.77%
|
8/15/2022
|
17,194
|
|
17,098
|
|
16,931
|
|
|||||||||||
|
WRE Holding Corp.
|
^+*
|
(2) (3) (8)
|
Environmental Industries
|
L + 5.00%
|
7.52%
|
1/3/2023
|
7,238
|
|
7,162
|
|
6,993
|
|
|||||||||||
|
Zywave, Inc.
|
^+*
|
(2) (3) (8)
|
High Tech Industries
|
L + 5.00%
|
7.52%
|
11/17/2022
|
18,050
|
|
17,914
|
|
17,991
|
|
|||||||||||
|
First Lien Debt Total
|
$
|
1,197,499
|
|
$
|
1,172,460
|
|
|||||||||||||||||
|
Second Lien Debt (0.09% of fair value)
|
|||||||||||||||||||||||
|
Zywave, Inc.
|
*
|
(2) (3)
|
High Tech Industries
|
L + 9.00%
|
11.65%
|
11/17/2023
|
$
|
1,050
|
|
$
|
1,038
|
|
$
|
1,048
|
|
||||||||
|
Second Lien Debt Total
|
$
|
1,038
|
|
$
|
1,048
|
|
|||||||||||||||||
|
Total Investments
|
$
|
1,198,537
|
|
$
|
1,173,508
|
|
|||||||||||||||||
^ Denotes that all or a portion of the assets are owned by Credit Fund. Credit Fund has entered into the Credit Fund Facility. Accordingly, such assets are not available to creditors of Credit Fund Sub, the 2017-1 Issuer or the Credit Fund Warehouse.
+ Denotes that all or a portion of the assets are owned by Credit Fund Sub. Credit Fund Sub has entered into the “Credit Fund Sub Facility. The lenders of the Credit Fund Sub Facility have a first lien security interest in substantially all of the assets of Credit Fund Sub. Accordingly, such assets are not available to creditors of Credit Fund, the 2017-1 Issuer or the Credit Fund Warehouse.
* Denotes that all or a portion of the assets are owned by the 2017-1 Issuer and secure the notes issued in connection with a $399,900 term debt securitization completed by Credit Fund on December 19, 2017 (the “2017-1 Debt Securitization”). Accordingly, such assets are not available to creditors of Credit Fund, Credit Fund Sub or the Credit Fund Warehouse.
\ Denotes that all or a portion of the assets are owned by the Credit Fund Warehouse. Credit Fund Warehouse has entered into the Credit Fund Warehouse Facility. The lenders of the Credit Fund Warehouse Facility have a first lien security interest in substantially all of the assets of the Credit Fund Warehouse. Accordingly, such assets are not available to creditors of Credit Fund, Credit Fund Sub or the 2017-1 Issuer.
|
(1)
|
Unless otherwise indicated, issuers of investments held by Credit Fund are domiciled in the United States. As of
December 31, 2018
, the geographical composition of investments as a percentage of fair value was
1.35%
in Canada and
98.65%
in the United States. Certain portfolio company investments are subject to contractual restrictions on sales.
|
|
(2)
|
Variable rate loans to the portfolio companies bear interest at a rate that may be determined by reference to either LIBOR or an alternate base rate (commonly based on the Federal Funds Rate or the U.S. Prime Rate), which generally resets quarterly. For each such loan, Credit Fund has provided the interest rate in effect as of
December 31, 2018
. As of
December 31, 2018
, all of Credit Fund’s LIBOR loans were indexed to the 30-day LIBOR at
2.50%
, the 90-day LIBOR at
2.81%
and the 180-day LIBOR at
2.88%
.
|
|
(3)
|
Loan includes interest rate floor feature, which is generally 1.00%.
|
|
(4)
|
Credit Fund receives less than the stated interest rate of this loan as a result of an agreement among lenders. The interest rate reduction is
1.20%
on EIP Merger Sub, LLC (Evolve IP). Pursuant to the agreement among lenders in respect of this loan, this investment represents a first lien/first out loan, which has first priority ahead of the first lien/last out loan with respect to principal, interest and other payments.
|
|
(5)
|
Amortized cost represents original cost, including origination fees and upfront fees received that are deemed to be an adjustment to yield, adjusted for the accretion/amortization of discounts/premiums, as applicable, on debt investments using the effective interest method.
|
|
(6)
|
Fair value is determined in good faith by or under the direction of the board of managers of Credit Fund, pursuant to Credit Fund’s valuation policy, with the fair value of all investments determined using significant unobservable inputs, which is substantially similar to the valuation policy of the Company provided in Note
3
, Fair Value Measurements.
|
|
(7)
|
In addition to the interest earned based on the stated interest rate of this loan, which is the amount reflected in this schedule, Credit Fund is entitled to receive additional interest as a result of an agreement among lenders as follows: EIP Merger Sub, LLC (Evolve IP) (
3.75%
) and Surgical Information Systems, LLC (
0.89%
). Pursuant to the agreement among lenders in respect of this loan, this investment represents a first lien/last out loan, which has a secondary priority behind the first lien/first out loan with respect to principal, interest and other payments.
|
137
(8) As of
December 31, 2018
, Credit Fund had the following unfunded commitments to fund delayed draw and revolving senior secured loans:
|
First Lien Debt – unfunded delayed draw and revolving term loans commitments
|
Type
|
Unused Fee
|
Par/ Principal Amount
|
Fair Value
|
|||||||||
|
Advanced Instruments, LLC
|
Revolver
|
0.50
|
%
|
$
|
1,333
|
|
$
|
(10
|
)
|
||||
|
Ahead, LLC
|
Revolver
|
0.50
|
|
4,688
|
|
(38
|
)
|
||||||
|
AQA Acquisition Holding, Inc.
|
Revolver
|
0.50
|
|
2,459
|
|
(19
|
)
|
||||||
|
Borchers, Inc.
|
Revolver
|
0.50
|
|
1,935
|
|
(5
|
)
|
||||||
|
Clearent Newco, LLC
|
Delayed Draw
|
1.00
|
|
4,988
|
|
(46
|
)
|
||||||
|
Clearent Newco, LLC
|
Revolver
|
0.50
|
|
1,760
|
|
(16
|
)
|
||||||
|
DecoPac, Inc.
|
Revolver
|
0.50
|
|
2,143
|
|
(11
|
)
|
||||||
|
Executive Consulting Group, LLC, Inc.
|
Revolver
|
0.50
|
|
2,368
|
|
(25
|
)
|
||||||
|
HMT Holding Inc.
|
Revolver
|
0.50
|
|
6,173
|
|
(49
|
)
|
||||||
|
Jensen Hughes, Inc.
|
Revolver
|
0.50
|
|
2,000
|
|
(39
|
)
|
||||||
|
Jensen Hughes, Inc.
|
Delayed Draw
|
1.00
|
|
337
|
|
(7
|
)
|
||||||
|
MAG DS Corp.
|
Revolver
|
0.50
|
|
2,022
|
|
(18
|
)
|
||||||
|
MSHC, Inc.
|
Delayed Draw
|
0.32
|
|
9,852
|
|
(145
|
)
|
||||||
|
North American Dental Management, LLC
|
Revolver
|
0.50
|
|
2,000
|
|
(35
|
)
|
||||||
|
North Haven CA Holdings, Inc. (CoAdvantage)
|
Revolver
|
0.50
|
|
6,114
|
|
(109
|
)
|
||||||
|
Output Services Group
|
Delayed Draw
|
4.25
|
|
2,518
|
|
(93
|
)
|
||||||
|
Pharmalogic Holdings Corp.
|
Delayed Draw
|
1.00
|
|
2,947
|
|
(20
|
)
|
||||||
|
Premise Health Holding Corp.
|
Delayed Draw
|
1.00
|
|
1,103
|
|
(11
|
)
|
||||||
|
Propel Insurance Agency, LLC
|
Delayed Draw
|
0.50
|
|
7,143
|
|
(110
|
)
|
||||||
|
Propel Insurance Agency, LLC
|
Revolver
|
0.50
|
|
1,667
|
|
(26
|
)
|
||||||
|
PSI Services LLC
|
Revolver
|
0.50
|
|
754
|
|
(17
|
)
|
||||||
|
QW Holding Corporation (Quala)
|
Revolver
|
0.50
|
|
5,498
|
|
(52
|
)
|
||||||
|
T2 Systems, Inc.
|
Revolver
|
0.50
|
|
1,173
|
|
(7
|
)
|
||||||
|
The Original Cakerie, Ltd. (Canada)
|
Revolver
|
0.50
|
|
1,132
|
|
(10
|
)
|
||||||
|
Upstream Intermediate, LLC
|
Revolver
|
0.50
|
|
1,606
|
|
(22
|
)
|
||||||
|
Valicor Environmental Services, LLC
|
Revolver
|
0.50
|
|
4,971
|
|
(54
|
)
|
||||||
|
WIRB - Copernicus Group, Inc.
|
Delayed Draw
|
1.00
|
|
6,480
|
|
(69
|
)
|
||||||
|
WIRB - Copernicus Group, Inc.
|
Revolver
|
0.50
|
|
1,000
|
|
(11
|
)
|
||||||
|
WRE Holding Corp.
|
Delayed Draw
|
0.89
|
|
2,069
|
|
(51
|
)
|
||||||
|
WRE Holding Corp.
|
Revolver
|
0.50
|
|
613
|
|
(15
|
)
|
||||||
|
Zywave, Inc.
|
Revolver
|
0.50
|
|
600
|
|
(2
|
)
|
||||||
|
Total unfunded commitments
|
$
|
91,446
|
|
$
|
(1,142
|
)
|
|||||||
(9) Loan was on non-accrual status as of
December 31, 2018
.
Debt
Credit Fund Facilities
The Credit Fund, Credit Fund Sub and Credit Fund Warehouse II are party to separate credit facilities as described below. In addition, until May 15, 2019, the 2019-2 Issuer (formerly known as the Credit Fund Warehouse) was party to the Credit Fund Warehouse Facility. As of
December 31, 2019
, Credit Fund, Credit Fund Sub, and Credit Fund Warehouse II were in compliance with all covenants and other requirements of their respective credit facility agreements. As of December 31, 2018, Credit Fund, Credit Fund Sub and the 2019-2 Issuer were in compliance with all covenants and other requirements of their respective credit facility agreements. Below is a summary of the borrowings and repayments under the credit facilities for the respective periods.
138
|
Credit Fund
Facility |
Credit Fund Sub
Facility |
Credit Fund Warehouse Facility
|
Credit Fund Warehouse II Facility
|
|||||||||||||
|
Outstanding balance as of December 31, 2017
|
$
|
85,750
|
|
$
|
377,686
|
|
$
|
—
|
|
N/A
|
||||||
|
Borrowings
|
120,150
|
|
239,235
|
|
101,044
|
|
N/A
|
|||||||||
|
Repayments
|
(93,900
|
)
|
(145,787
|
)
|
—
|
|
N/A
|
|||||||||
|
Outstanding balance as of December 31, 2018
|
112,000
|
|
471,134
|
|
101,044
|
|
—
|
|
||||||||
|
Borrowings
|
126,200
|
|
223,870
|
|
34,544
|
|
97,571
|
|
||||||||
|
Repayments
|
(145,200
|
)
|
(351,498
|
)
|
(135,588
|
)
|
—
|
|
||||||||
|
Outstanding balance as of December 31, 2019
|
$
|
93,000
|
|
$
|
343,506
|
|
$
|
—
|
|
$
|
97,571
|
|
||||
Credit Fund Facility.
On June 24, 2016, Credit Fund entered into the Credit Fund Facility with the Company, which was subsequently amended on June 5, 2017, October 2, 2017, November 3, 2017, June 22, 2018, June 29, 2018 and February 21, 2019, pursuant to which Credit Fund may from time to time request mezzanine loans from the Company. The maximum principal amount of the Credit Fund Facility is $175,000. The maturity date of the Credit Fund Facility is March 22, 2020. Amounts borrowed under the Credit Fund Facility bear interest at a rate of LIBOR plus 9.00%.
Credit Fund Sub Facility.
On June 24, 2016, Credit Fund Sub closed on the Credit Fund Sub Facility with lenders, which was subsequently amended on May 31, 2017, October 27, 2017, August 24, 2018 and December 12, 2019. The Credit Fund Sub Facility provides for secured borrowings during the applicable revolving period up to an amount equal to $640,000. The facility is secured by a first lien security interest in substantially all of the portfolio investments held by Credit Fund Sub. The maturity date of the Credit Fund Sub Facility is May 22, 2024. Amounts borrowed under the Credit Fund Sub Facility bear interest at a rate of LIBOR plus 2.25%.
Credit Fund Warehouse Facility
.
On November 26, 2018, Credit Fund Warehouse closed on the Credit Fund Warehouse Facility with lenders. The Credit Fund Warehouse Facility provided for secured borrowings during the applicable revolving period up to an amount equal to $150,000. The Credit Fund Warehouse Facility was secured by a first lien security interest in substantially all of the portfolio investments held by the Credit Fund Warehouse. The maturity date of the Credit Fund Warehouse Facility was November 26, 2019. Amounts borrowed under the Credit Fund Warehouse Facility bore interest at a rate of LIBOR plus 1.05%. Effective May 15, 2019, the Warehouse Facility changed its name from “MMCF Warehouse, LLC” to “MMCF CLO 2019-2, LLC” and secured borrowings outstanding were repaid in connection with the 2019-2 Debt Securitization.
Credit Fund Warehouse II Facility
.
On August 16, 2019, Credit Fund Warehouse II closed on a revolving credit facility (the "Credit Fund Warehouse II Facility") with lenders. The Credit Fund Warehouse II Facility provides for secured borrowings during the applicable revolving period up to an amount equal to $150,000. The Credit Fund Warehouse II Facility is secured by a first lien security interest in substantially all of the portfolio investments held by the Credit Fund Warehouse II Facility. The maturity date of the Credit Fund Warehouse II Facility is August 16, 2022. Amounts borrowed under the Credit Fund Warehouse II Facility bear interest at a rate of LIBOR plus 1.05% for the first 12 months, LIBOR plus 1.15% for the next 12 months and LIBOR plus 1.50% in the final 12 months.
2017-1 Notes
On December 19, 2017, Credit Fund completed the 2017-1 Debt Securitization. The notes offered in the 2017-1 Debt Securitization (the “2017-1 Notes”) were issued by the 2017-1 Issuer, a wholly owned and consolidated subsidiary of Credit Fund, and are secured by a diversified portfolio of the 2017-1 Issuer consisting primarily of first and second lien senior secured loans. The 2017-1 Debt Securitization was executed through a private placement of the 2017-1 Notes, consisting of:
•
$231,700 of Aaa/AAA Class A-1 Notes, which bear interest at the three-month LIBOR plus 1.17%;
•
$48,300 of Aa2/AA Class A-2 Notes, which bear interest at the three-month LIBOR plus 1.50%;
•
$15,000 of A2/A Class B-1 Notes, which bear interest at the three-month LIBOR plus 2.25%;
•
$9,000 of A2/A Class B-2 Notes which bear interest at 4.30%;
•
$22,900 of Baa2/BBB Class C Notes which bear interest at the three-month LIBOR plus 3.20%; and
•
$25,100 of Ba2/BB Class D Notes which bear interest at the three-month LIBOR plus 6.38%.
139
The 2017-1 Notes are scheduled to mature on January 15, 2028. Credit Fund received 100% of the preferred interests issued by the 2017-1 Issuer (the “2017-1 Issuer Preferred Interests”) on the closing date of the 2017-1 Debt Securitization in exchange for Credit Fund's contribution to the 2017-1 Issuer of the initial closing date loan portfolio. The 2017-1 Issuer Preferred Interests do not bear interest and had a nominal value of $47,900 at closing.
As of
December 31, 2019
and
2018
, the 2017-1 Issuer was in compliance with all covenants and other requirements of the indenture.
2019-2 Notes
On May 21, 2019, Credit Fund completed the 2019-2 Debt Securitization. The notes offered in the 2019-2 Debt Securitization (the “2019-2 Notes”) were issued by the 2019-2 Issuer, a wholly owned and consolidated subsidiary of Credit Fund, and are secured by a diversified portfolio of the 2019-2 Issuer consisting primarily of first and second lien senior secured loans. The 2019-2 Debt Securitization was executed through a private placement of the 2019-2 Notes, consisting of:
|
•
|
$233,000 of Aaa/AAA Class A-1 Notes, which bear interest at the three-month LIBOR plus 1.50%;
|
|
•
|
$48,000 of Aa2/AA Class A-2 Notes, which bear interest at the three-month LIBOR plus 2.40%;
|
|
•
|
$23,000 of A2/A Class B Notes, which bear interest at the three-month LIBOR plus 3.45%;
|
|
•
|
$27,000 of Baa2/BBB- Class C Notes which bear interest at the three-month LIBOR plus 4.55%; and
|
|
•
|
$21,000 of Ba2/BB- Class D Notes which bear interest at the three-month LIBOR plus 8.03%.
|
The 2019-2 Notes are scheduled to mature on April 15, 2029. Credit Fund received 100% of the preferred interests issued by the 2019-2 Issuer (the “2019-2 Issuer Preferred Interests”) on the closing date of the 2019-2 Debt Securitization in exchange for Credit Fund’s contribution to the 2019-2 Issuer of the initial closing date loan portfolio. The 2019-2 Issuer Preferred Interests do not bear interest and had a nominal value of $48,300 at closing.
As of
December 31, 2019
, the 2019-2 Issuer was in compliance with all covenants and other requirements of the indenture.
6. BORROWINGS
The Company and the SPV are party to credit facilities as described below. In accordance with the Investment Company Act, the Company is currently only allowed to borrow amounts such that its asset coverage, as defined in the Investment Company Act, is at least 150% after such borrowing. As of
December 31, 2019
and
2018
, asset coverage was
181.01%
and
210.31%
, respectively, and the Company and the SPV were in compliance with all covenants and other requirements of their respective credit facility agreements. Below is a summary of the borrowings and repayments under the credit facilities for the years ended
December 31, 2019
,
2018
and
2017
, and the outstanding balances under the credit facilities for the respective periods.
|
For the Year Ended and as of December 31,
|
|||||||||||
|
2019
|
2018
|
2017
|
|||||||||
|
Outstanding borrowing, beginning of period
|
$
|
514,635
|
|
$
|
562,893
|
|
$
|
421,885
|
|
||
|
Borrowings
|
755,179
|
|
812,650
|
|
816,216
|
|
|||||
|
Repayments
|
(655,209
|
)
|
(860,908
|
)
|
(675,208
|
)
|
|||||
|
Foreign currency translation
|
1,938
|
|
—
|
|
—
|
|
|||||
|
Outstanding borrowing, end of period
|
$
|
616,543
|
|
$
|
514,635
|
|
$
|
562,893
|
|
||
SPV Credit Facility
The SPV closed on the SPV Credit Facility on May 24, 2013, which was subsequently amended on June 30, 2014, June 19, 2015, June 9, 2016, May 26, 2017 and August 9, 2018. The SPV Credit Facility provides for secured borrowings during the applicable revolving period up to an amount equal to the lesser of $275,000 (the borrowing base as calculated pursuant to the terms of the SPV Credit Facility) and the amount of net cash proceeds and unpledged capital commitments the Company has received, with an accordion feature that can, subject to certain conditions, increase the aggregate maximum credit commitment up to an amount not to exceed $750,000, subject to restrictions imposed on borrowings under the Investment
140
Company Act and certain restrictions and conditions set forth in the SPV Credit Facility, including adequate collateral to support such borrowings. On December 31, 2019, the Company irrevocably reduced its commitments under the SPV Credit Facility to $275,000. The SPV Credit Facility has a revolving period through May 21, 2021 and a maturity date of May 23, 2023. Borrowings under the SPV Credit Facility bear interest initially at the applicable commercial paper rate (if the lender is a conduit lender) or LIBOR (or, if applicable, a rate based on the prime rate or federal funds rate) plus 2.00% per year through May 21, 2021, with pre-determined future interest rate increases of 0.875%-1.75% following the end of the revolving period. The SPV is also required to pay an undrawn commitment fee of between 0.50% and 0.75% per year depending on the drawings under the SPV Credit Facility. Payments under the SPV Credit Facility are made quarterly. The lenders have a first lien security interest on substantially all of the assets of the SPV.
As part of the SPV Credit Facility, the SPV is subject to limitations as to how borrowed funds may be used and the types of loans that are eligible to be acquired by the SPV including, but not limited to, restrictions on sector and geographic concentrations, loan size, payment frequency, tenor and minimum investment ratings (or estimated ratings). In addition, borrowed funds are intended to be used primarily to purchase first lien loan assets, and the SPV is limited in its ability to purchase certain other assets (including, but not limited to, second lien loans, covenant-lite loans, revolving and delayed draw loans and discount loans) and other assets are not permitted to be purchased (including, but not limited to paid-in-kind loans). The SPV Credit Facility has certain requirements relating to asset coverage, interest coverage, collateral quality and portfolio performance, including limitations on delinquencies and charge offs, certain violations of which could result in the immediate acceleration of the amounts due under the SPV Credit Facility. The SPV Credit Facility is also subject to a borrowing base that applies different advance rates to assets held by the SPV based generally on the fair market value of such assets. Under certain circumstances as set forth in the SPV Credit Facility, the Company could be obliged to repurchase loans from the SPV.
Credit Facility
The Company closed on the Credit Facility on March 21, 2014, which was subsequently amended on January 8, 2015, May 25, 2016, March 22, 2017, September 25, 2018 and June 14, 2019. The maximum principal amount of the Credit Facility is $688,000, subject to availability under the Credit Facility, which is based on certain advance rates multiplied by the value of the Company’s portfolio investments (subject to certain concentration limitations) net of certain other indebtedness that the Company may incur in accordance with the terms of the Credit Facility. Proceeds of the Credit Facility may be used for general corporate purposes, including the funding of portfolio investments. Maximum capacity under the Credit Facility may be increased to $900,000 through the exercise by the Company of an uncommitted accordion feature through which existing and new lenders may, at their option, agree to provide additional financing. The Credit Facility includes a $50,000 limit for swingline loans and a $20,000 limit for letters of credit. The Company may borrow amounts in U.S. dollars or certain other permitted currencies. Amounts drawn under the Credit Facility, including amounts drawn in respect of letters of credit, bear interest at either LIBOR plus an applicable spread of 2.25%, or an “alternative base rate” (which is the highest of a prime rate, the federal funds effective rate plus 0.50%, or one month LIBOR plus 1.00%) plus an applicable spread of 1.25%. The Company may elect either the LIBOR or the “alternative base rate” at the time of drawdown, and loans may be converted from one rate to another at any time, subject to certain conditions. The Company also pays a fee of 0.375% on undrawn amounts under the Credit Facility and, in respect of each undrawn letter of credit, a fee and interest rate equal to the then-applicable margin under the Credit Facility while the letter of credit is outstanding. The availability period under the Credit Facility will terminate on June 14, 2023 and the Credit Facility will mature on June 14, 2024. During the period from June 14, 2023 to June 14, 2024, the Company will be obligated to make mandatory prepayments under the Credit Facility out of the proceeds of certain asset sales, other recovery events and equity and debt issuances.
Subject to certain exceptions, the Credit Facility is secured by a first lien security interest in substantially all of the portfolio investments held by the Company. The Credit Facility includes customary covenants, including certain financial covenants related to asset coverage, shareholders’ equity and liquidity, certain limitations on the incurrence of additional indebtedness and liens, and other maintenance covenants, as well as usual and customary events of default for senior secured revolving credit facilities of this nature.
141
Summary of Facilities
The Facilities consisted of the following as of
December 31, 2019
and
2018
:
|
|
December 31, 2019
|
||||||||||||||
|
|
Total
Facility
|
Borrowings
Outstanding
|
Unused
Portion
(1)
|
Amount Available
(2)
|
|||||||||||
|
SPV Credit Facility
|
$
|
275,000
|
|
$
|
232,469
|
|
$
|
42,531
|
|
$
|
4,225
|
|
|||
|
Credit Facility
|
688,000
|
|
384,074
|
|
303,926
|
|
264,198
|
|
|||||||
|
Total
|
$
|
963,000
|
|
$
|
616,543
|
|
$
|
346,457
|
|
$
|
268,423
|
|
|||
|
|
December 31, 2018
|
||||||||||||||
|
|
Total
Facility
|
Borrowings
Outstanding
|
Unused
Portion (1) |
Amount Available
(2)
|
|||||||||||
|
SPV Credit Facility
|
$
|
400,000
|
|
$
|
224,135
|
|
$
|
175,865
|
|
$
|
2,547
|
|
|||
|
Credit Facility
|
413,000
|
|
290,500
|
|
122,500
|
|
122,500
|
|
|||||||
|
Total
|
$
|
813,000
|
|
$
|
514,635
|
|
$
|
298,365
|
|
$
|
125,047
|
|
|||
|
(1)
|
The unused portion is the amount upon which commitment fees are based.
|
|
(2)
|
Available for borrowing based on the computation of collateral to support the borrowings and subject to compliance with applicable covenants and financial ratios.
|
For the years ended
December 31, 2019
,
2018
and
2017
, the components of interest expense and credit facility fees were as follows:
|
|
For the years ended December 31,
|
||||||||||
|
|
2019
|
2018
|
2017
|
||||||||
|
Interest expense
|
$
|
30,221
|
|
$
|
37,801
|
|
$
|
24,510
|
|
||
|
Facility unused commitment fee
|
1,263
|
|
1,260
|
|
1,117
|
|
|||||
|
Amortization of deferred financing costs
|
1,618
|
|
901
|
|
745
|
|
|||||
|
Other fees
|
198
|
|
134
|
|
121
|
|
|||||
|
Total interest expense and credit facility fees
|
$
|
33,300
|
|
$
|
40,096
|
|
$
|
26,493
|
|
||
|
Cash paid for interest expense
|
$
|
30,312
|
|
$
|
34,676
|
|
$
|
22,519
|
|
||
|
Average principal debt outstanding
|
$
|
676,347
|
|
$
|
864,734
|
|
$
|
728,144
|
|
||
|
Weighted average interest rate
|
4.41
|
%
|
4.32
|
%
|
3.32
|
%
|
|||||
As of
December 31, 2019
and
2018
, the components of interest and credit facility fees payable were as follows:
|
As of December 31,
|
|||||||
|
2019
|
2018
|
||||||
|
Interest expense payable
|
$
|
2,201
|
|
$
|
2,978
|
|
|
|
Unused commitment fees payable
|
187
|
|
205
|
|
|||
|
Other credit facility fees payable
|
30
|
|
23
|
|
|||
|
Interest and credit facility fees payable
|
$
|
2,418
|
|
$
|
3,206
|
|
|
|
Weighted average interest rate
(based on floating LIBOR rates) |
3.88
|
%
|
4.67
|
%
|
|||
7. NOTES PAYABLE
4.750% Senior Unsecured Notes
On December 30, 2019, the Company closed a private offering of $115.0 million in aggregate principal amount of 4.750% Senior Unsecured Notes due December 31, 2024 (the "Senior Notes"). Interest is payable quarterly, beginning March
142
31, 2020. This interest rate is subject to increase (up to 5.75%) in the event that, subject to certain exceptions, the Senior Notes cease to have an investment grade rating. The Company is obligated to offer to repay the notes at par if certain change in control events occur. The Senior Notes are general unsecured obligations of the Company that rank pari passu with all outstanding and future unsecured unsubordinated indebtedness issued by the Company. Interest expense on the Senior Notes was not significant for the year ended December 31, 2019.
The note purchase agreement for the Senior Notes contains customary terms and conditions for senior unsecured notes issued in a private placement, including, without limitation, affirmative and negative covenants such as information reporting, maintenance of the Company’s status as a business development company within the meaning of the Investment Company Act and a regulated investment company under the Code, minimum asset coverage ratio and interest coverage ratio, and prohibitions on certain fundamental changes at the Company or any subsidiary guarantor, as well as customary events of default with customary cure and notice, including, without limitation, nonpayment, breach of covenant, material breach of representation or warranty under the note purchase agreement, cross-acceleration under other indebtedness of the Company or certain significant subsidiaries, certain judgments and orders, and certain events of bankruptcy. As of
December 31, 2019
, the Company was in compliance with these terms and conditions.
2015-1R Notes
On June 26, 2015, the Company completed the 2015-1 Debt Securitization. The 2015-1 Notes were issued by the 2015-1 Issuer, a wholly-owned and consolidated subsidiary of the Company. The 2015-1 Debt Securitization was executed through a private placement of the 2015-1 Notes, consisting of:
•
$160,000 of Aaa/AAA Class A-1A Notes;
•
$40,000 of Aaa/AAA Class A-1B Notes;
•
$27,000 of Aaa/AAA Class A-1C Notes; and
•
$46,000 of Aa2 Class A-2 Notes.
The 2015-1 Notes were issued at par and were scheduled to mature on July 15, 2027. The Company received 100% of the preferred interests issued by the 2015-1 Issuer (the “2015-1 Issuer Preferred Interests”) on the closing date of the 2015-1 Debt Securitization in exchange for the Company’s contribution to the 2015-1 Issuer of the initial closing date loan portfolio. The 2015-1 Issuer Preferred Interests do not bear interest and had a nominal value of $125,900 at closing. In connection with the contribution, the Company made customary representations, warranties and covenants to the 2015-1 Issuer in the purchase agreement. The Class A-1A, Class A-1B and Class A-1C and Class A-2 Notes are included in these consolidated financial statements. The 2015-1 Issuer Preferred Interests were eliminated in consolidation.
On the closing date of the 2015-1 Debt Securitization, the 2015-1 Issuer effected a one-time distribution to the Company of a substantial portion of the proceeds of the private placement of the 2015-1 Notes, net of expenses, which distribution was used to repay a portion of certain amounts outstanding under the SPV Credit Facility and the Credit Facility. As part of the 2015-1 Debt Securitization, certain first and second lien senior secured loans were distributed by the SPV to the Company pursuant to a distribution and contribution agreement.
On August 30, 2018, the Company and the 2015-1 Issuer closed the 2015-1 Debt Securitization Refinancing. On the closing date of the 2015-1 Debt Securitization Refinancing, the 2015-1 Issuer, among other things:
(a) refinanced the issued Class A-1A Notes by redeeming in full the Class A-1A Notes and issuing new AAA Class A-1-1-R Notes in an aggregate principal amount of $234,800 which bear interest at the three-month LIBOR plus 1.55%;
(b) refinanced the issued Class A-1B Notes by redeeming in full the Class A-1B Notes and issuing new AAA Class A-1-2-R Notes in an aggregate principal amount of $50,000 which bear interest at the three-month LIBOR plus 1.48% for the first 24 months and the three-month LIBOR plus 1.78% thereafter;
(c) refinanced the issued Class A-1C Notes by redeeming in full the Class A-1C Notes and issuing new AAA Class A-1-3-R Notes in an aggregate principal amount of $25,000 which bear interest at 4.56%;
(d) refinanced the issued Class A-2 Notes by redeeming in full the Class A-2 Notes and issuing new Class A-2-R Notes in an aggregate principal amount of $66,000 which bear interest at the three-month LIBOR plus 2.20%;
(e) issued new single-A Class B Notes and BBB- Class C Notes in aggregate principal amounts of $46,400 and $27,000, respectively, which bear interest at the three-month LIBOR plus 3.15% and the three-month LIBOR plus 4.00%, respectively;
(f) reduced the 2015-1 Issuer Preferred Interests by approximately $21,375 from a nominal value of $125,900 to approximately $104,525 at close; and
143
(g) extended the reinvestment period end date and maturity date applicable to the 2015-1 Issuer to October 15, 2023 and October 15, 2031, respectively.
Following the 2015-1 Debt Securitization Refinancing, the Company retained the 2015-1 Issuer Preferred Interests. The 2015-1R Notes in the 2015-1 Debt Securitization Refinancing were issued by the 2015-1 Issuer and are secured by a diversified portfolio of the 2015-1 Issuer consisting primarily of first and second lien senior secured loans.
On the closing date of the 2015-1 Debt Securitization Refinancing, the 2015-1 Issuer effected a one-time distribution to the Company of a substantial portion of the proceeds of the private placement of the 2015-1R Notes, net of expenses, which distribution was used to repay a portion of certain amounts outstanding under the SPV Credit Facility and the Credit Facility. As part of the 2015-1 Debt Securitization Refinancing, certain first and second lien senior secured loans were distributed by the SPV to the Company pursuant to a distribution and contribution agreement. The Company contributed the loans that comprised the initial closing date loan portfolio (including the loans distributed to the Company from the SPV) to the 2015-1 Issuer pursuant to a contribution agreement. Future loan transfers from the Company to the 2015-1 Issuer will be made pursuant to a sale agreement and are subject to the approval of the Company’s Board of Directors. Assets of the 2015-1 Issuer are not available to the creditors of the SPV or the Company. In connection with the issuance and sale of the 2015-1R Notes, the Company made customary representations, warranties and covenants in the purchase agreement.
During the reinvestment period, pursuant to the indenture governing the 2015-1R Notes, all principal collections received on the underlying collateral may be used by the 2015-1 Issuer to purchase new collateral under the direction of Investment Adviser in its capacity as collateral manager of the 2015-1 Issuer and in accordance with the Company’s investment strategy.
The Investment Adviser serves as collateral manager to the 2015-1 Issuer under a collateral management agreement (the “Collateral Management Agreement”). Pursuant to the Collateral Management Agreement, the 2015-1 Issuer pays management fees (comprised of base management fees, subordinated management fees and incentive management fees) to the Investment Adviser for rendering collateral management services. As per the Collateral Management Agreement, for the period the Company retains all of the 2015-1 Issuer Preferred Interests, the Investment Adviser does not earn management fees for providing such collateral management services. The Company currently retains all of the 2015-1 Issuer Preferred Interests, thus the Investment Adviser did not earn any management fees from the 2015-1 Issuer for the year ended
December 31, 2019
and
2018
. Any such waived fees may not be recaptured by the Investment Adviser.
Pursuant to an undertaking by the Company in connection with the 2015-1 Debt Securitization Refinancing, the Company has agreed to hold on an ongoing basis the 2015-1 Issuer Preferred Interests with an aggregate dollar purchase price at least equal to 5% of the aggregate outstanding amount of all collateral obligations by the 2015-1 Issuer for so long as any securities of the 2015-1 Issuer remain outstanding. As of
December 31, 2019
, the Company was in compliance with its undertaking.
The 2015-1 Issuer pays ongoing administrative expenses to the trustee, independent accountants, legal counsel, rating agencies and independent managers in connection with developing and maintaining reports, and providing required services in connection with the administration of the 2015-1 Issuer.
As of
December 31, 2019
, there were
59
first lien and second lien senior secured loans with a total fair value of approximately
$538,923
and cash of
$6,378
securing the 2015-1R Notes. The pool of loans in the securitization must meet certain requirements, including asset mix and concentration, term, agency rating, collateral coverage, minimum coupon, minimum spread and sector diversity requirements in the indenture governing the 2015-1R Notes.
For the years ended
December 31, 2019
and
2018
, the effective annualized weighted average interest rates, which include amortization of debt issuance costs on the 2015-1R Notes and 2015-1 Notes, were
4.47%
and
4.24%
, respectively based on floating LIBOR rates, excluding the one-time impact of the 2015-1 Debt Securitization Refinancing. As of
December 31, 2019
and
2018
, the weighted average interest rates were
4.01%
and
4.42%
, respectively, based on floating LIBOR rates.
144
As of
December 31, 2019
and
2018
,
$3,891
and
$4,294
, respectively, of interest expense was included in interest and credit facility fees payable. For the years ended
December 31, 2019
,
2018
and
2017
, the components of interest expense on the 2015-1R and 2015-1 Notes were as follows:
|
|
For the years ended December 31,
|
||||||||||
|
|
2019
|
2018
|
2017
|
||||||||
|
Interest expense
|
$
|
20,104
|
|
$
|
14,079
|
|
$
|
9,010
|
|
||
|
Amortization of deferred financing costs
|
247
|
|
995
|
|
204
|
|
|||||
|
Total interest expense
|
$
|
20,351
|
|
$
|
15,074
|
|
$
|
9,214
|
|
||
|
Cash paid for interest expense
|
$
|
19,669
|
|
$
|
11,787
|
|
$
|
8,713
|
|
||
Related to the 2015-1 Debt Securitization Refinancing, $652 of debt issuance costs were immediately expensed on August 30, 2018 in lieu of continuing to amortize over the term of the notes.
8. COMMMITMENTS AND CONTINGENCIES
A summary of significant contractual payment obligations was as follows as of
December 31, 2019
and
2018
:
|
Payment Due by Period
|
December 31,
2019 |
December 31,
2018 |
|||||
|
Less than 1 Year
|
$
|
—
|
|
$
|
—
|
|
|
|
1-3 Years
|
—
|
|
—
|
|
|||
|
3-5 Years
|
731,543
|
|
514,635
|
|
|||
|
More than 5 Years
|
449,200
|
|
449,200
|
|
|||
|
Total
|
$
|
1,180,743
|
|
$
|
963,835
|
|
|
In the ordinary course of its business, the Company enters into contracts or agreements that contain indemnification or warranties. Future events could occur that lead to the execution of these provisions against the Company. The Company believes that the likelihood of such an event is remote; however, the maximum potential exposure is unknown. No accrual has been made in the consolidated financial statements as of
December 31, 2019
and
2018
for any such exposure.
The Company had the following unfunded commitments to fund delayed draw and revolving senior secured loans as of the indicated dates:
|
|
Par Value as of
|
||||||
|
|
December 31,
2019 |
December 31,
2018 |
|||||
|
Unfunded delayed draw commitments
|
$
|
75,874
|
|
$
|
97,261
|
|
|
|
Unfunded revolving term loan commitments
|
74,016
|
|
59,856
|
|
|||
|
Total unfunded commitments
|
$
|
149,890
|
|
$
|
157,117
|
|
|
9. NET ASSETS
The Company has the authority to issue 200,000,000 shares of common stock, $0.01 per share par value. On November 5, 2018, the Company’s Board of Directors approved a $100 million stock repurchase program (the “Company Stock Repurchase Program”). The Company Stock Repurchase Program was to be in effect until November 5, 2019, or until the approved dollar amount had been used to repurchase shares. On November 4, 2019, the Company's Board of Directors approved the continuation of the Company Stock Repurchase Program until November 5, 2020, or until the approved dollar amount has been used to repurchase shares.
145
During the year ended
December 31, 2019
, the Company repurchased and extinguished
4,466,440
shares for
$64,717
. The following table summarizes capital activity during the year ended
December 31, 2019
:
|
|
Common Stock
|
Capital in Excess of Par Value
|
Offering Costs
|
Accumulated Net Investment Income (Loss)
|
Accumulated Net Realized Gain (Loss) on Investments
|
Accumulated Net Unrealized Appreciation (Depreciation) on Investments
|
Total Net Assets
|
|||||||||||||||||||||||
|
Shares
|
Amount
|
|||||||||||||||||||||||||||||
|
Balance, beginning of year
|
62,230,251
|
|
$
|
622
|
|
$
|
1,174,334
|
|
$
|
(1,633
|
)
|
$
|
5,901
|
|
$
|
(44,572
|
)
|
$
|
(71,434
|
)
|
$
|
1,063,218
|
|
|||||||
|
Offering costs
|
—
|
|
—
|
|
—
|
|
—
|
|
—
|
|
—
|
|
—
|
|
—
|
|
||||||||||||||
|
Net investment income (loss)
|
—
|
|
—
|
|
—
|
|
—
|
|
107,665
|
|
—
|
|
—
|
|
107,665
|
|
||||||||||||||
|
Net realized gain (loss) on investments
|
—
|
|
—
|
|
—
|
|
—
|
|
—
|
|
(38,343
|
)
|
—
|
|
(38,343
|
)
|
||||||||||||||
|
Net change in unrealized appreciation (depreciation) on investments
|
—
|
|
—
|
|
—
|
|
—
|
|
—
|
|
—
|
|
(7,992
|
)
|
(7,992
|
)
|
||||||||||||||
|
Dividends declared
|
—
|
|
—
|
|
—
|
|
—
|
|
(103,360
|
)
|
—
|
|
—
|
|
(103,360
|
)
|
||||||||||||||
|
Repurchase of common stock
|
(4,466,440
|
)
|
(44
|
)
|
(64,673
|
)
|
—
|
|
—
|
|
—
|
|
—
|
|
(64,717
|
)
|
||||||||||||||
|
Tax reclassification of stockholders’ equity in accordance with U.S. GAAP
|
—
|
|
—
|
|
(423
|
)
|
—
|
|
162
|
|
261
|
|
—
|
|
—
|
|
||||||||||||||
|
Balance, end of year
|
57,763,811
|
|
$
|
578
|
|
$
|
1,109,238
|
|
$
|
(1,633
|
)
|
$
|
10,368
|
|
$
|
(82,654
|
)
|
$
|
(79,426
|
)
|
$
|
956,471
|
|
|||||||
During the year ended
December 31, 2018
, the Company issued
361,056
shares for
$6,629
in connection with the reinvestment of dividends. The following table summarizes capital activity during the year ended
December 31, 2018
:
|
|
Common Stock
|
Capital in Excess of Par Value
|
Offering Costs
|
Accumulated Net Investment Income (Loss)
|
Accumulated Net Realized Gain (Loss) on Investments
|
Accumulated Net Unrealized Appreciation (Depreciation) on Investments
|
Total Net Assets
|
|||||||||||||||||||||||
|
Shares
|
Amount
|
|||||||||||||||||||||||||||||
|
Balance, beginning of year
|
62,207,603
|
|
$
|
622
|
|
$
|
1,172,807
|
|
$
|
(1,618
|
)
|
$
|
2,522
|
|
$
|
(43,548
|
)
|
$
|
(3,481
|
)
|
$
|
1,127,304
|
|
|||||||
|
Reinvestment of dividends
|
361,056
|
|
4
|
|
6,625
|
|
—
|
|
—
|
|
—
|
|
—
|
|
6,629
|
|
||||||||||||||
|
Offering costs
|
—
|
|
—
|
|
—
|
|
(15
|
)
|
—
|
|
—
|
|
—
|
|
(15
|
)
|
||||||||||||||
|
Net investment income (loss)
|
—
|
|
—
|
|
—
|
|
—
|
|
108,436
|
|
—
|
|
—
|
|
108,436
|
|
||||||||||||||
|
Net realized gain (loss) on investments
|
—
|
|
—
|
|
—
|
|
—
|
|
—
|
|
(1,368
|
)
|
—
|
|
(1,368
|
)
|
||||||||||||||
|
Net change in unrealized appreciation (depreciation) on investments
|
—
|
|
—
|
|
—
|
|
—
|
|
—
|
|
—
|
|
(67,953
|
)
|
(67,953
|
)
|
||||||||||||||
|
Dividends declared
|
—
|
|
—
|
|
—
|
|
—
|
|
(104,948
|
)
|
—
|
|
—
|
|
(104,948
|
)
|
||||||||||||||
|
Repurchase of common stock
|
(338,408
|
)
|
(4
|
)
|
(4,863
|
)
|
—
|
|
—
|
|
—
|
|
—
|
|
(4,867
|
)
|
||||||||||||||
|
Tax reclassification of stockholders’ equity in accordance with U.S. GAAP
|
—
|
|
—
|
|
(235
|
)
|
—
|
|
(109
|
)
|
344
|
|
—
|
|
—
|
|
||||||||||||||
|
Balance, end of year
|
62,230,251
|
|
$
|
622
|
|
$
|
1,174,334
|
|
$
|
(1,633
|
)
|
$
|
5,901
|
|
$
|
(44,572
|
)
|
$
|
(71,434
|
)
|
$
|
1,063,218
|
|
|||||||
146
During the year ended
December 31, 2017
, the Company issued
20,505,285
shares for
$373,700
including reinvestment of dividends. In connection with the NFIC Acquisition, the Company issued 434,233 shares of common stock valued at approximately $8,046. See Note
14
to these consolidated financial statements for additional information regarding the NFIC Acquisition. In connection with the Company’s IPO, the Company issued 9,454,200 shares of common stock (including shares issued pursuant to the exercise of the underwriters’ over-allotment option) at a public offering price of $18.50 per share. Net of underwriting costs, the Company received cash proceeds of $169,488. The following table summarizes capital activity during the year ended
December 31, 2017
:
|
|
Common Stock
|
Capital in Excess of Par Value
|
Offering Costs
|
Accumulated Net Investment Income (Loss)
|
Accumulated Net Realized Gain (Loss) on Investments
|
Accumulated Net Unrealized Appreciation (Depreciation) on Investments
|
Total Net Assets
|
|||||||||||||||||||||||
|
Shares
|
Amount
|
|||||||||||||||||||||||||||||
|
Balance, beginning of year
|
41,702,318
|
|
$
|
417
|
|
$
|
799,580
|
|
$
|
(74
|
)
|
$
|
(3,207
|
)
|
$
|
(25,357
|
)
|
$
|
(7,222
|
)
|
$
|
764,137
|
|
|||||||
|
Common stock issued
|
20,146,561
|
|
201
|
|
366,818
|
|
—
|
|
—
|
|
—
|
|
—
|
|
367,019
|
|
||||||||||||||
|
Reinvestment of dividends
|
358,724
|
|
4
|
|
6,677
|
|
—
|
|
—
|
|
—
|
|
—
|
|
6,681
|
|
||||||||||||||
|
Offering costs
|
—
|
|
—
|
|
—
|
|
(1,544
|
)
|
—
|
|
—
|
|
—
|
|
(1,544
|
)
|
||||||||||||||
|
Net investment income (loss)
|
—
|
|
—
|
|
—
|
|
—
|
|
92,151
|
|
—
|
|
—
|
|
92,151
|
|
||||||||||||||
|
Net realized gain (loss) on investments
|
—
|
|
—
|
|
—
|
|
—
|
|
—
|
|
(11,692
|
)
|
—
|
|
(11,692
|
)
|
||||||||||||||
|
Net change in unrealized appreciation (depreciation) on investments
|
—
|
|
—
|
|
—
|
|
—
|
|
—
|
|
—
|
|
3,741
|
|
3,741
|
|
||||||||||||||
|
Dividends declared
|
—
|
|
—
|
|
—
|
|
—
|
|
(93,189
|
)
|
—
|
|
—
|
|
(93,189
|
)
|
||||||||||||||
|
Tax reclassification of stockholders’ equity in accordance with U.S. GAAP
|
—
|
|
—
|
|
(268
|
)
|
—
|
|
6,767
|
|
(6,499
|
)
|
—
|
|
—
|
|
||||||||||||||
|
Balance, end of year
|
62,207,603
|
|
$
|
622
|
|
$
|
1,172,807
|
|
$
|
(1,618
|
)
|
$
|
2,522
|
|
$
|
(43,548
|
)
|
$
|
(3,481
|
)
|
$
|
1,127,304
|
|
|||||||
There were no shares issued related to capital activity during the year ended
December 31, 2019
. The following table summarizes total shares issued and proceeds received related to capital activity during the years ended
December 31, 2018
and
December 31, 2017
:
|
Year Ended December 31, 2018
|
Shares Issued
|
Proceeds Received
|
||||
|
January 17, 2018*
|
361,056
|
|
$
|
6,629
|
|
|
|
Total
|
361,056
|
|
$
|
6,629
|
|
|
|
Year Ended December 31, 2017
|
Shares Issued
|
Proceeds Received
|
||||
|
January 24, 2017*
|
5,837
|
|
$
|
108
|
|
|
|
April 24, 2017*
|
5,133
|
|
94
|
|
||
|
May 19, 2017
|
2,141,417
|
|
39,488
|
|
||
|
June 9, 2017
|
8,116,711
|
|
149,997
|
|
||
|
June 9, 2017**
|
434,233
|
|
8,046
|
|
||
|
June 19, 2017***
|
9,000,000
|
|
161,505
|
|
||
|
July 5, 2017
|
454,200
|
|
7,983
|
|
||
|
October 18, 2017*
|
347,754
|
|
6,479
|
|
||
|
Total
|
20,505,285
|
|
$
|
373,700
|
|
|
* Represents shares issued upon the reinvestment of dividends.
** Represents shares issued in accordance with the elections of the NFIC stockholders pursuant to the NFIC Acquisition (see Note
14
, NFIC Acquisition, to these consolidated financial statements).
*** Represents shares issued and net proceeds received in connection with the Company’s IPO.
On June 19, 2017, the Company closed its IPO, issuing 9,454,200 shares of its common stock (including the exercise of the underwriters’ over-allotment option on July 5, 2017) at a public offering price of $18.50 per share. Net of underwriting costs, the common stock issued in the IPO and net asset value experienced dilution during the period, and such subscription and IPO transactions decreased net asset value by $0.11 per share for the year ended December 31, 2017.
The Company computes earnings per common share in accordance with ASC 260,
Earnings Per Share.
Basic earnings per common share were calculated by dividing net increase (decrease) in net assets resulting from operations attributable to the Company by the weighted-average number of common shares outstanding for the year.
147
Basic and diluted earnings per common share were as follows:
|
|
For the years ended December 31,
|
||||||||||
|
|
2019
|
2018
|
2017
|
||||||||
|
Net increase (decrease) in net assets resulting from operations
|
$
|
61,330
|
|
$
|
39,115
|
|
$
|
84,200
|
|
||
|
Weighted-average common shares outstanding
|
60,189,502
|
|
62,533,614
|
|
52,997,450
|
|
|||||
|
Basic and diluted earnings per common share
|
$
|
1.02
|
|
$
|
0.63
|
|
$
|
1.59
|
|
||
The following table summarizes the Company’s dividends declared during the three most recent fiscal years:
|
Date Declared
|
Record Date
|
Payment Date
|
Per Share Amount
|
|
|||||
|
March 20, 2017
|
March 20, 2017
|
April 24, 2017
|
$
|
0.41
|
|
|
|||
|
June 20, 2017
|
June 30, 2017
|
July 18, 2017
|
$
|
0.37
|
|
|
|||
|
August 7, 2017
|
September 29, 2017
|
October 18, 2017
|
$
|
0.37
|
|
|
|||
|
November 7, 2017
|
December 29, 2017
|
January 17, 2018
|
$
|
0.37
|
|
|
|||
|
December 13, 2017
|
December 29, 2017
|
January 17, 2018
|
$
|
0.12
|
|
(1)
|
|||
|
February 26, 2018
|
March 29, 2018
|
April 17, 2018
|
$
|
0.37
|
|
||||
|
May 2, 2018
|
June 29, 2018
|
July 17, 2018
|
$
|
0.37
|
|
||||
|
August 6, 2018
|
September 28, 2018
|
October 17, 2018
|
$
|
0.37
|
|
||||
|
November 5, 2018
|
December 28, 2018
|
January 17, 2019
|
$
|
0.37
|
|
||||
|
December 12, 2018
|
December 28, 2018
|
January 17, 2019
|
$
|
0.20
|
|
(1)
|
|||
|
February 22, 2019
|
March 29, 2019
|
April 17, 2019
|
$
|
0.37
|
|
||||
|
May 6, 2019
|
June 28, 2019
|
July 17, 2019
|
$
|
0.37
|
|
||||
|
June 17, 2019
|
June 28, 2019
|
July 17, 2019
|
$
|
0.08
|
|
(1)
|
|||
|
August 5, 2019
|
September 30, 2019
|
October 17, 2019
|
$
|
0.37
|
|
||||
|
November 4, 2019
|
December 31, 2019
|
January 17, 2020
|
$
|
0.37
|
|
||||
|
December 12, 2019
|
December 31, 2019
|
January 17, 2020
|
$
|
0.18
|
|
(1)
|
|||
|
(1)
|
Represents a special dividend.
|
148
10. CONSOLIDATED FINANCIAL HIGHLIGHTS
The following is a schedule of consolidated financial highlights for the years ended
December 31, 2019
,
2018
,
2017
,
2016
and
2015
:
|
|
For the years ended December 31,
|
||||||||||||||||||
|
|
2019
|
2018
|
2017
|
2016
|
2015
|
||||||||||||||
|
Per Share Data:
|
|||||||||||||||||||
|
Net asset value per share, beginning of year
|
$
|
17.09
|
|
$
|
18.12
|
|
$
|
18.32
|
|
$
|
18.14
|
|
$
|
18.86
|
|
||||
|
Net investment income (loss)
(1)
|
1.79
|
|
1.73
|
|
1.74
|
|
1.65
|
|
1.43
|
|
|||||||||
|
Net realized gain (loss) and net change in unrealized appreciation (depreciation) on investments
|
(0.75
|
)
|
(1.10
|
)
|
(0.19
|
)
|
0.20
|
|
(0.52
|
)
|
|||||||||
|
Net increase (decrease) in net assets resulting from operations
|
1.04
|
|
0.63
|
|
1.55
|
|
1.85
|
|
0.91
|
|
|||||||||
|
Dividends declared
(2)
|
(1.74
|
)
|
(1.68
|
)
|
(1.64
|
)
|
(1.68
|
)
|
(1.74
|
)
|
|||||||||
|
Accretion due to share repurchases
|
0.17
|
|
0.02
|
|
—
|
|
—
|
|
—
|
|
|||||||||
|
Effect of offering price of subscriptions and the offering price of common stock in the IPO, net of underwriting and offering costs
(3)
|
—
|
|
—
|
|
(0.11
|
)
|
0.01
|
|
0.11
|
|
|||||||||
|
Net asset value per share, end of year
|
$
|
16.56
|
|
$
|
17.09
|
|
$
|
18.12
|
|
$
|
18.32
|
|
$
|
18.14
|
|
||||
|
Market price per share, end of year
|
$
|
13.38
|
|
12.40
|
|
20.04
|
|
n/a
|
|
n/a
|
|
||||||||
|
Number of shares outstanding, end of year
|
57,763,811
|
|
62,230,251
|
|
62,207,603
|
|
41,702,318
|
|
31,524,803
|
|
|||||||||
|
Total return based on net asset value
(4)
|
7.08
|
%
|
3.59
|
%
|
7.86
|
%
|
10.25
|
%
|
5.41
|
%
|
|||||||||
|
Total return based on market price
(5)
|
21.94
|
%
|
(29.74
|
)%
|
14.97
|
%
|
n/a
|
|
n/a
|
|
|||||||||
|
Net assets, end of year
|
$
|
956,471
|
|
$
|
1,063,218
|
|
$
|
1,127,304
|
|
$
|
764,137
|
|
$
|
571,726
|
|
||||
|
Ratio to average net assets:
|
|||||||||||||||||||
|
Expenses net of waiver, before incentive fees
|
8.79
|
%
|
6.77
|
%
|
5.25
|
%
|
5.46
|
%
|
5.11
|
%
|
|||||||||
|
Expenses net of waiver, after incentive fees
|
11.05
|
%
|
8.81
|
%
|
7.39
|
%
|
7.69
|
%
|
6.94
|
%
|
|||||||||
|
Expenses gross of waiver, after incentive fees
|
11.05
|
%
|
8.81
|
%
|
7.97
|
%
|
8.62
|
%
|
7.86
|
%
|
|||||||||
|
Net investment income (loss)
(6)
|
10.47
|
%
|
9.64
|
%
|
9.35
|
%
|
8.93
|
%
|
7.33
|
%
|
|||||||||
|
Interest expense and credit facility fees
|
5.22
|
%
|
3.57
|
%
|
2.69
|
%
|
2.85
|
%
|
2.37
|
%
|
|||||||||
|
Ratios/Supplemental Data:
|
|||||||||||||||||||
|
Asset coverage, end of period
|
181.01
|
%
|
210.31
|
%
|
234.86
|
%
|
209.97
|
%
|
212.70
|
%
|
|||||||||
|
Portfolio turnover
|
38.97
|
%
|
45.88
|
%
|
49.18
|
%
|
32.39
|
%
|
26.04
|
%
|
|||||||||
|
Weighted-average shares outstanding
|
60,189,502
|
|
62,533,614
|
|
52,997,450
|
|
36,152,390
|
|
24,830,200
|
|
|||||||||
|
(1)
|
For the years ended
December 31, 2019
,
2018
,
2017
,
2016
and
2015
, net investment income (loss) per share was calculated as net investment income (loss) for the year divided by the weighted-average number of shares outstanding for the year.
|
|
(2)
|
For the years ended
December 31, 2019
,
2018
,
2017
,
2016
and
2015
, dividends declared per share was calculated as the sum of dividends declared during the year divided by the number of shares outstanding at each respective quarter-end date (refer to Note
9
to these consolidated financial statements).
|
|
(3)
|
Increase (decrease) is due to the offering price of subscriptions and the issuance of common stock in the IPO, net of underwriting and offering costs during the period (refer to Note
9
to these consolidated financial statements).
|
|
(4)
|
Total return is based on the change in net asset value per share during the year plus the declared dividends, assuming reinvestment of dividends in accordance with the dividend reinvestment plan, divided by the beginning net asset value for the year. Total return for the years ended December 31,
2017
,
2016
, and
2015
was inclusive of
$(0.11)
,
$0.01
, and
$0.11
respectively, per share increase (decrease) in net asset value for the years related to the offering price of subscriptions and the offering price of common stock in the IPO, net of underwriting and offering costs during the year. Excluding the effects of these common stock issuances, total return would have been
8.46%
,
10.20%
, and
4.83%
, respectively (refer to Note
9
to these consolidated financial statements).
|
|
(5)
|
Total return based on market value (not annualized) is calculated as the change in market value per share during the period plus the declared dividends, assuming reinvestment of dividends in accordance with the dividend reinvestment plan, divided by the beginning market price for the period.
|
|
(6)
|
The net investment income ratio is net of the waiver of base management fees.
|
11. LITIGATION
The Company may become party to certain lawsuits in the ordinary course of business. The Company does not believe that the outcome of current matters, if any, will materially impact the Company or its consolidated financial statements. As of
December 31, 2019
and
2018
, the Company was not subject to any material legal proceedings, nor, to the Company’s knowledge, is any material legal proceeding threatened against the Company.
In addition, portfolio investments of the Company could be the subject of litigation or regulatory investigations in the ordinary course of business. The Company does not believe that the outcome of any current contingent liabilities of its portfolio investments, if any, will materially affect the Company or these consolidated financial statements.
12. TAX
The Company has not recorded a liability for any uncertain tax positions pursuant to the provisions of ASC 740,
Income Taxes
, as of
December 31, 2019
and
2018
.
In the normal course of business, the Company is subject to examination by federal and certain state, local and foreign tax regulators. As of
December 31, 2019
and
2018
, the Company had filed tax returns and therefore is subject to examination.
Book and tax basis differences relating to stockholder dividends and distributions and other permanent book and tax differences are reclassified among the Company’s capital accounts. In addition, the character of income and gains to be distributed is determined in accordance with income tax regulations that may differ from U.S. GAAP. As of
December 31, 2019
and
2018
, permanent differences primarily due to non-deductible excise tax and non-deductible expenses from investments in partnerships resulted in a net decrease in distributable earnings (loss) by
$423
and
$235
, respectively, and net decrease in additional paid-in capital in excess of par by
$423
and
$235
, respectively, on the Consolidated Statements of Assets and Liabilities. Total earnings and NAV were not affected.
The tax character of the distributions paid for the fiscal years ended
December 31, 2019
,
2018
and
2017
was as follows:
|
|
For the years ended
December 31,
|
||||||||||
|
|
2019
|
2018
|
2017
|
||||||||
|
Ordinary income
|
$
|
103,360
|
|
$
|
104,948
|
|
$
|
93,189
|
|
||
|
Tax return of capital
|
$
|
—
|
|
$
|
—
|
|
$
|
—
|
|
||
Income Tax Information and Distributions to Stockholders
As of
December 31, 2019
and
2018
, the components of accumulated earnings (deficit) on a tax basis were as follows:
|
2019
|
2018
|
||||||
|
Undistributed ordinary income
|
$
|
11,639
|
|
$
|
7,625
|
|
|
|
Other book/tax temporary differences
(1)
|
(1,271
|
)
|
(1,725
|
)
|
|||
|
Capital loss carryforwards
|
(83,433
|
)
|
(45,151
|
)
|
|||
|
Net unrealized appreciation (depreciation) on investments
(2)
|
(78,646
|
)
|
(70,854
|
)
|
|||
|
Total accumulated earnings (deficit)
|
$
|
(151,711
|
)
|
$
|
(110,105
|
)
|
|
|
(1)
|
Consists of the unamortized portion of organization costs as of
December 31, 2019
and
2018
, respectively.
|
|
(2)
|
The difference between the book-basis and tax-basis unrealized appreciation (depreciation) on investments is attributable primarily to the tax deferral of losses on wash sales, the tax treatment of partnership investments, the tax treatment of passive foreign investment companies, which include the structured finance obligations. Also, consists of book to tax difference on interest income on CLO equity investments recognized using the effective yield method for financial statement purposes.
|
149
As of
December 31, 2019
and
2018
, the cost of investments for federal income tax purposes and gross unrealized appreciation and depreciation on investments were as follows:
|
2019
|
2018
|
||||||
|
Cost of investments
|
$
|
2,200,671
|
|
$
|
2,043,012
|
|
|
|
Gross unrealized appreciation on investments
|
17,094
|
|
81,038
|
|
|||
|
Gross unrealized depreciation on investments
|
(95,740
|
)
|
(151,892
|
)
|
|||
|
Net unrealized appreciation (depreciation) on investments
|
$
|
(78,646
|
)
|
$
|
(70,854
|
)
|
|
On December 22, 2010, the Regulated Investment Company Modernization Act of 2010 (the “RIC Modernization Act”) was enacted which changed various technical rules governing the tax treatment of RICs. The changes are generally effective for taxable years beginning after the date of enactment. Under the RIC Modernization Act, the fund will be permitted to carry forward capital losses incurred in taxable years beginning after the date of enactment for an unlimited period. However, any losses incurred during those future taxable years will be required to be utilized prior to the losses incurred in pre-enactment taxable years, which carry an expiration date. As a result of this ordering rule, pre-enactment capital loss carryforwards may be more likely to expire unused. Additionally, post-enactment capital losses that are carried forward will retain their character as either short-term or long-term losses rather than being considered all short-term as under previous law. As of
December 31, 2019
and
2018
, the Company did not have any pre-enactment capital loss carryforwards, and had
$83,433
and
$45,151
, respectively, of post enactment capital loss carryforwards,
$11,142
and
$6,364
of which were post-enactment short-term capital loss carryforwards, respectively, and
$72,291
and
$38,787
, of which were post-enactment long-term capital loss carryforwards, respectively.
13. SELECTED QUARTERLY FINANCIAL DATA (UNAUDITED)
|
|
2019
|
||||||||||||||
|
|
Q4
|
Q3
|
Q2
|
Q1
|
|||||||||||
|
Total investment income
|
$
|
53,465
|
|
$
|
55,779
|
|
$
|
56,867
|
|
$
|
55,187
|
|
|||
|
Net expenses
|
27,853
|
|
29,024
|
|
28,896
|
|
27,625
|
|
|||||||
|
Net investment income (loss)
|
25,377
|
|
26,755
|
|
27,971
|
|
27,652
|
|
|||||||
|
Net realized gain (loss) and net change in unrealized appreciation (depreciation) on investments
|
1,459
|
|
(35,744
|
)
|
(18,214
|
)
|
6,164
|
|
|||||||
|
Net increase (decrease) in net assets resulting from operations
|
26,836
|
|
(8,989
|
)
|
9,757
|
|
33,726
|
|
|||||||
|
NAV per share
|
16.56
|
|
16.58
|
|
17.06
|
|
17.30
|
|
|||||||
|
Basic and diluted earnings per common share
|
$
|
0.46
|
|
$
|
(0.15
|
)
|
$
|
0.16
|
|
$
|
0.55
|
|
|||
|
|
2018
|
||||||||||||||
|
|
Q4
|
Q3
|
Q2
|
Q1
|
|||||||||||
|
Total investment income
|
$
|
56,311
|
|
$
|
51,280
|
|
$
|
52,452
|
|
$
|
47,483
|
|
|||
|
Net expenses
|
26,900
|
|
25,595
|
|
24,242
|
|
22,353
|
|
|||||||
|
Net investment income (loss)
|
29,411
|
|
25,685
|
|
28,210
|
|
25,130
|
|
|||||||
|
Net realized gain (loss) and net change in unrealized appreciation (depreciation) on investments
|
(30,571
|
)
|
(19,605
|
)
|
(15,104
|
)
|
(4,041
|
)
|
|||||||
|
Net increase (decrease) in net assets resulting from operations
|
(1,160
|
)
|
6,080
|
|
13,106
|
|
21,089
|
|
|||||||
|
NAV per share
|
16.59
|
|
17.66
|
|
17.93
|
|
18.09
|
|
|||||||
|
Basic and diluted earnings per common share
|
$
|
(0.02
|
)
|
$
|
0.10
|
|
$
|
0.21
|
|
$
|
0.34
|
|
|||
150
|
|
2017
|
||||||||||||||
|
|
Q4
|
Q3
|
Q2
|
Q1
|
|||||||||||
|
Total investment income
|
$
|
49,510
|
|
$
|
42,648
|
|
$
|
38,744
|
|
$
|
34,099
|
|
|||
|
Net expenses
|
22,994
|
|
17,568
|
|
17,296
|
|
14,992
|
|
|||||||
|
Net investment income (loss)
|
26,516
|
|
25,080
|
|
21,448
|
|
19,107
|
|
|||||||
|
Net realized gain (loss) and net change in unrealized appreciation (depreciation) on investments
|
467
|
|
463
|
|
(5,947
|
)
|
(2,934
|
)
|
|||||||
|
Net increase (decrease) in net assets resulting from operations
|
26,983
|
|
25,543
|
|
15,501
|
|
16,173
|
|
|||||||
|
NAV per share
|
18.12
|
|
18.18
|
|
18.14
|
|
18.30
|
|
|||||||
|
Basic and diluted earnings per common share
|
$
|
0.44
|
|
$
|
0.41
|
|
$
|
0.34
|
|
$
|
0.39
|
|
|||
14. NFIC ACQUISITION
On June 9, 2017 (the “Acquisition Date”), the Company closed the NFIC Acquisition, with the Company as the surviving entity. As of the effective time of the NFIC Acquisition, each share of common stock of NFIC was converted into the right to receive a mixture of cash and shares of common stock of the Company, in accordance with the elections of the NFIC stockholders (the “Elections”). Based on the results of the Elections, the NFIC stockholders received in the aggregate 434,233 shares of common stock of the Company and approximately $145,602 in cash.
The NFIC Acquisition was accounted for under the asset acquisition method of accounting in accordance with ASC Topic 805,
Business Combinations
. As the acquirer for accounting purposes, the Company allocated the purchase price based on the estimated fair value of NFIC’s assets acquired and liabilities assumed as of the Acquisition Date. There was no goodwill created because the NFIC Acquisition was accounted for as an asset acquisition.
The Company used the fair market value of NFIC’s assets and liabilities as of the Acquisition Date to account for the NFIC Acquisition. The following table summarizes the assets and liabilities of NFIC as of the Acquisition Date:
|
ASSETS
|
|||
|
Total investments, at fair value
|
$
|
190,672
|
|
|
Cash and other assets
|
12,464
|
|
|
|
Total assets
|
$
|
203,136
|
|
|
LIABILITIES
|
|||
|
Secured borrowings
|
$
|
42,128
|
|
|
Other accrued expenses and liabilities
|
7,360
|
|
|
|
Total liabilities
|
49,488
|
|
|
|
NET ASSETS
|
|||
|
Total net assets
|
$
|
153,648
|
|
On June 9, 2017, the debt assumed as part of the NFIC Acquisition was fully repaid.
For the year ended
December 31, 2017
, the Company incurred $322 in professional fees and other costs related to the
NFIC Acquisition
.
The Company determined that the fair value of the net assets acquired equaled the purchase price excluding these costs. Accordingly, these costs related to the NFIC Acquisition were expensed.
15. SUBSEQUENT EVENTS
Subsequent events have been evaluated through the date the consolidated financial statements were issued. There have been no subsequent events that require recognition or disclosure through the date the consolidated financial statements were issued, except as disclosed below.
Subsequent to
December 31, 2019
, the Company borrowed
$97,500
under the Facilities to fund investment acquisitions. The Company also voluntarily repaid
$28,994
under the Facilities.
On February 24, 2020, the Board of Directors declared a quarterly dividend of $0.37, which is payable on April 17, 2020 to stockholders of record on March 31, 2020.
151
Item 9. Changes and Disagreements with Accountants on Accounting and Financial Disclosure
None.
Item 9A. Controls and Procedures.
Evaluation of Disclosure Controls and Procedures
As of the end of the period covered by this report, we carried out an evaluation, under the supervision and with the participation of our management, including our Chief Executive Officer (Principal Executive Officer) and our Chief Financial Officer (Principal Financial Officer), of the effectiveness of the design and operation of our disclosure controls and procedures (as defined in Rule 13a-15 of the Exchange Act). Based on that evaluation, our Chief Executive Officer and our Chief Financial Officer have concluded that our current disclosure controls and procedures are effective in timely alerting them of material information relating to the Company that is required to be disclosed by us in the reports we file or submit under the Exchange Act.
Management’s Report on Internal Control Over Financial Reporting
Our management is responsible for establishing and maintaining adequate internal control over financial reporting (as defined in Rules 13a-15(f) and 15d-15(f) of the Exchange Act). The Company’s internal control over financial reporting is a process designed under the supervision of its Chief Executive Officer (Principal Executive Officer) and Chief Financial Officer (Principal Financial Officer) and effected by the Company’s Board of Directors, management and other personnel, to provide reasonable assurance regarding the reliability of financial reporting and the preparation of its consolidated financial statements for external reporting purposes in accordance with U.S. generally accepted accounting principles.
The Company’s internal control over financial reporting includes policies and procedures that pertain to the maintenance of records that, in reasonable detail, accurately and fairly reflect transactions and dispositions of the Company’s assets; provide reasonable assurance that transactions are recorded as necessary to permit preparation of consolidated financial statements in accordance with U.S. generally accepted accounting principles, and that receipts and expenditures of the Company are being made only in accordance with authorizations of management and the directors; and provide reasonable assurance regarding prevention or timely detection of unauthorized acquisition, use or disposition of the Company’s assets that could have a material effect on its consolidated financial statements.
Because of its inherent limitations, internal control over financial reporting may not prevent or detect misstatements. In addition, projections of any evaluation of effectiveness to future periods are subject to the risk that controls may become inadequate because of changes in conditions, or that the degree of compliance with the policies or procedures may deteriorate.
Management conducted an evaluation of the effectiveness of the Company’s internal control over financial reporting as of
December 31, 2019
based on the framework established in
Internal Control—Integrated Framework (2013)
issued by the Committee of Sponsoring Organizations of the Treadway Commission. Based on this assessment, management concluded that the Company’s internal control over financial reporting as of
December 31, 2019
was effective.
Attestation Report of the Registered Public Accounting Firm
Our independent registered public accounting firm, Ernst & Young LLP, has issued an audit report on the effectiveness of the Company’s internal control over financial reporting, which is contained in Part II, Item 8 of this Form 10-K, “
Financial Statements and Supplementary Data
.”
Changes in Internal Controls Over Financial Reporting
There have been no changes in our internal control over financial reporting during the fiscal quarter ended
December 31, 2019
that have materially affected, or are reasonably likely to materially affect, our internal control over financial reporting.
Item 9B. Other Information
On February 24, 2020, the Board of Directors of the Company appointed Peter Gaunt as the Company’s Treasurer and principal accounting officer, effective March 31, 2020. Mr. Gaunt will succeed Michele Reing, who has acted in these roles on an interim basis since September 23, 2019. Mr. Gaunt, 38, joined The Carlyle Group, Inc. as a Principal in Carlyle Global Credit in December 2019. Prior to joining Carlyle, Mr. Gaunt was Corporate Controller at Hercules Capital, where he led the
152
accounting, FP&A, Treasury and Capital Markets teams. Prior to Hercules Capital, Mr. Gaunt was a Senior Manager in Ernst & Young’s Wealth and Asset Management Practice servicing Business Development Companies, Mortgage REITs, Mutual Funds and Private Equity Funds. Mr. Gaunt also spent time with Credit Suisse in its Asset Management division.
153
PART III
Item 10. Directors, Executive Officers and Corporate Governance
Information in response to this item is incorporated by reference from our Proxy Statement relating to our
2020
annual meeting of stockholders. The Proxy Statement will be filed with the SEC within 120 days after the end of the fiscal year covered by this Form 10-K pursuant to Regulation 14A under the Exchange Act.
Information relating to our codes of ethics, which apply to, among others, our Chief Executive Officer and Chief Financial Officer, is included in Part I, Item 1 of this Form 10-K “
Business-Regulation-Code of Ethics
.”
Item 11. Executive Compensation
Information in response to this item is incorporated by reference from our Proxy Statement relating to our
2020
annual meeting of stockholders.
Item 12. Security Ownership of Certain Beneficial Owners and Management and Related Stockholder Matters
Information in response to this item is incorporated by reference from our Proxy Statement relating to our
2020
annual meeting of stockholders.
Item 13. Certain Relationships and Related Transactions, and Director Independence
Information in response to this item is incorporated by reference from our Proxy Statement relating to our
2020
annual meeting of stockholders.
Item 14. Principal Accountant Fees and Services
Information in response to this item is incorporated by reference from our Proxy Statement relating to our
2020
annual meeting of stockholders.
154
PART IV
Item 15. Exhibits and Financial Statement Schedules
(a) Documents filed as part of this annual report
The following reports and consolidated financial statements are set forth in Part II, Item 8 of this Form 10-K:
(b) Exhibits
The following exhibits are filed as part of this report or hereby incorporated by reference to exhibits previously field with the SEC:
|
3.1
|
|
|
3.2
|
|
|
3.3
|
|
|
3.4
|
|
|
4.1
|
|
|
4.2
|
|
|
10.1
|
|
|
10.2
|
|
|
10.3
|
|
|
10.4
|
|
|
10.5
|
|
|
10.6
|
|
|
10.7
|
|
|
10.8
|
|
155
|
10.9
|
|
|
10.10
|
|
|
10.11
|
|
|
10.12
|
|
|
10.13
|
|
|
10.14
|
|
|
10.15
|
|
|
10.16
|
|
|
10.17
|
|
|
10.18
|
|
|
10.19
|
|
|
14.1
|
|
|
14.2
|
|
|
21.1
|
|
|
31.1
|
|
|
31.2
|
|
|
32.1
|
|
|
32.2
|
|
|
99.1
|
|
156
|
*
|
Filed herewith.
|
|
(1)
|
Incorporated by reference to Exhibit 3.1 to the Company’s Form 10-12G/A filed by the Company on April 11, 2013 (File No. 000-54899)
|
|
(2)
|
Incorporated by reference to Exhibit 3.2 to the Company’s Form 10-K filed by the Company on March 22, 2017 (File No. 000-54899)
|
|
(3)
|
Incorporated by reference to Exhibit 3.2 to the Company’s Form 10-12G/A filed by the Company on April 11, 2013 (File No. 000-54899)
|
|
(4)
|
Incorporated by reference to Exhibit 3.4 to the Company’s Form 10-K filed by the Company on March 22, 2017 (File No. 000-54899)
|
|
(5)
|
Incorporated by reference to Exhibit 4.1 to the Company’s Form 10-12G/A filed by the Company on April 11, 2013 (File No. 000-54899)
|
|
(6)
|
Incorporated by reference to Exhibit 10.2 to the Company’s Form 10-Q filed by the Company on August 12, 2015 (File No. 814-00995)
|
|
(7)
|
Incorporated by reference to Exhibit (e)(1) to the Company’s Form N-2 filed by the Company on June 5, 2017 (File No. 333-218114)
|
|
(7)
|
Incorporated by reference to Exhibit (e)(2) to the Company’s Form N-2 filed by the Company on June 5, 2017 (File No. 333-218114)
|
|
(8)
|
Incorporated by reference to Exhibit 10.1 to the Company’s Form 10-Q filed by the Company on November 6, 2018 (File No. 814-00995)
|
|
(9)
|
Incorporated by reference to Exhibit (j) to the Company’s Registration Statement on Form N-2 filed by the Company on May 19, 2017 (File No. 333-218114)
|
|
(10)
|
Incorporated by reference to Exhibit 10.2 to the Company’s Form 10-12G/A filed by the Company on April 11, 2013 (File No. 000-54899)
|
|
(11)
|
Incorporated by reference to Exhibit 10.3 to the Company’s Form 10-12G/A filed by the Company on April 11, 2013 (File No. 000-54899)
|
|
(12)
|
Incorporated by reference to Exhibit 10.1 to the Company’s Form 10-Q filed by the Company on July 31, 2013 (File No. 814-00995)
|
|
(13)
|
Incorporated by reference to Exhibit 10.2 to the Company’s Form 10-Q filed by the Company on August 6, 2019 (File No. 814-00995)
|
|
(14)
|
Incorporated by reference to Exhibit 10.1 to the Company’s Form 10-Q filed by the Company on August 13, 2014 (File No. 814-00995)
|
|
(15)
|
Incorporated by reference to Exhibit 10.1 to the Company’s Form 10-Q filed by the Company on August 12, 2015 (File No. 814-00995)
|
|
(16)
|
Incorporated by reference to Exhibit 10.3 to the Company’s Form 10-Q filed by the Company on August 12, 2015 (File No. 814-00995)
|
|
(17)
|
Incorporated by reference to Exhibit 10.4 to the Company’s Form 10-Q filed by the Company on August 12, 2015 (File No. 814-00995)
|
|
(18)
|
Incorporated by reference to Exhibit 10.2 to the Company’s Form 10-Q filed by the Company on August 8, 2016 (File No. 814-00995)
|
|
(19)
|
Incorporated by reference to Exhibit (k)(13) to the Company’s Form N-2 filed by the Company on June 5, 2017 (File No. 333-218114)
|
|
(20)
|
Incorporated by reference to Exhibit 10.1 to the Company’s Form 10-Q filed by the Company on November 10, 2016 (File No. 814-00995)
|
|
(21)
|
Incorporated by reference to Exhibit 2.1 to the Company’s Form 8-K filed by the Company on May 9, 2017 (File No. 814-00995)
|
|
(22)
|
Incorporated by reference to Exhibit 10.2 to the Company’s Form 10-Q filed by the Company on November 6, 2018 (File No. 814-00995)
|
|
(23)
|
Incorporated by reference to Exhibit 10.3 to the Company’s Form 10-Q filed by the Company on November 6, 2018 (File No. 814-00995)
|
|
(24)
|
Incorporated by reference to Exhibit 10.1 to the Company’s Form 8-K filed by the Company on December 30, 2019 (File No. 814-00995)
|
|
(25)
|
Incorporated by reference to Exhibit 14.1 to the Company’s Form 10-K filed by the Company on February 26, 2019 (File No. 814-00995)
|
157
(c) Consolidated Financial Statement Schedules
Separate financial statements of subsidiaries not consolidated:
Consolidated Financial Statements of Middle Market Credit Fund, LLC for the years ended
December 31, 2019
and
2018
are filed as Exhibit 99.1 hereto.
Item 16. Form 10-K Summary
None.
158
SIGNATURES
Pursuant to the requirements of the Securities Exchange Act of 1934, the registrant has duly caused this report to be signed on its behalf by the undersigned thereunto duly authorized.
|
|
TCG BDC, INC.
|
||||
|
Dated: February 25, 2020
|
By
|
/s/ Linda Pace
|
|||
|
Linda Pace
|
|||||
|
Director and Chief Executive Officer (principal executive officer)
|
|||||
|
Pursuant to the requirements of the Securities Exchange Act of 1934, this report has been signed below by the following persons on behalf of the registrant and in the capacities and on the dates indicated.
|
|||||
|
Dated: February 25, 2020
|
By
|
/s/ Linda Pace
|
|||
|
Linda Pace
|
|||||
|
Director and Chief Executive Officer (principal executive officer)
|
|||||
|
Dated: February 25, 2020
|
|
By
|
|
/s/ Thomas M. Hennigan
|
|
|
|
|
Thomas M. Hennigan
|
|||
|
|
|
Chief Financial Officer
(principal financial officer)
|
|||
|
Dated: February 25, 2020
|
By
|
/s/ Michele Reing
|
|||
|
Michele Reing
|
|||||
|
Treasurer
(principal accounting officer)
|
|||||
|
Dated: February 25, 2020
|
|
By
|
|
/s/ Nigel D.T. Andrews
|
|
|
|
|
Nigel D.T. Andrews
|
|||
|
|
|
Director
|
|||
|
Dated: February 25, 2020
|
|
By
|
|
/s/ Leslie E. Bradford
|
|
|
|
|
Leslie E. Bradford
|
|||
|
|
|
Director
|
|||
|
Dated: February 25, 2020
|
|
By
|
|
/s/ Eliot P.S. Merrill
|
|
|
|
|
Eliot P.S. Merrill
|
|||
|
|
|
Director
|
|||
|
Dated: February 25, 2020
|
|
By
|
|
/s/ John G. Nestor
|
|
|
|
|
John G. Nestor
|
|||
|
|
|
Director
|
|||
159
TABLE OF CONTENTS
Part IItem 1. BusinessItem 1A. Risk FactorsItem 1B. Unresolved Staff CommentsItem 2. PropertiesItem 3. Legal ProceedingsItem 4. Mine Safety DisclosuresPart IIItem 6. Selected Financial DataItem 7A. Quantitative and Qualitative Disclosures About Market RiskItem 8. Financial Statements and Supplementary DataItem 9. Changes and Disagreements with Accountants on Accounting and Financial DisclosureItem 9A. Controls and ProceduresItem 9B. Other InformationPart IIIItem 10. Directors, Executive Officers and Corporate GovernanceItem 11. Executive CompensationItem 12. Security Ownership Of Certain Beneficial Owners and Management and Related Stockholder MattersItem 13. Certain Relationships and Related Transactions, and Director IndependenceItem 14. Principal Accountant Fees and ServicesPart IVItem 15. Exhibits and Financial Statement SchedulesItem 16. Form 10-k Summary