COGNEX CORP
10-Ks and 10-Qs
|
|
|
|
|
|
|
|
|
|
|
|
|
|
|
|
|
|
|
|
|
|
|
|
|
|
|
|
|
|
|
|
|
|
|
|
|
|
|
|
|
|
|
|
|
|
|
|
|
|
|
|
|
|
|
|
|
|
|
UNITED STATES
SECURITIES AND EXCHANGE COMMISSION
Washington, D.C. 20549
FORM 10-K
(Mark One)
[ X ] Annual report pursuant to Section 13 or 15(d) of the Securities Exchange Act of 1934 for the fiscal year ended
December 31, 2017
or
[ ] Transition report pursuant to Section 13 or 15(d) of the Securities Exchange Act of 1934 for the transition period from
to
.
Commission File Number
001-34218
COGNEX CORPORATION
(Exact name of registrant as specified in its charter)
|
Massachusetts
|
|
04-2713778
|
||
|
(State or other jurisdiction of
incorporation or organization)
|
|
(I.R.S. Employer
Identification No.)
|
||
|
One Vision Drive
Natick, Massachusetts 01760-2059
(508) 650-3000
|
||||
|
(Address, including zip code, and telephone number,
including area code, of principal executive offices)
|
||||
Securities registered pursuant to Section 12(b) of the Act:
|
Title of Each Class
|
Name of Exchange on Which Registered
|
|
|
Common Stock, par value $.002 per share
|
The NASDAQ Stock Market LLC
|
|
|
Preferred Stock Purchase Rights
|
The NASDAQ Stock Market LLC
|
|
Securities registered pursuant to Section 12(g) of the Act: None
Indicate by check mark if the registrant is a well-known seasoned issuer, as defined in Rule 405 of the Securities Act.
|
|
Yes
|
|
X
|
|
|
No
|
|
|
||||
Indicate by check mark if the registrant is not required to file reports pursuant to Section 13 or Section 15(d) of the Act.
|
|
Yes
|
|
|
|
|
No
|
|
X
|
|
|||
Indicate by check mark whether the registrant (1) has filed all reports required to be filed by Section 13 or 15(d) of the Securities Exchange Act of 1934 during the preceding 12 months (or for such shorter period that the registrant was required to file such reports), and (2) has been subject to such filing requirements for the past 90 days.
|
|
Yes
|
|
X
|
|
|
No
|
|
|
|
|||
Indicate by check mark whether the registrant has submitted electronically and posted on its corporate web site, if any, every Interactive Data File required to be submitted and posted pursuant to Rule 405 of Regulation S-T during the preceding 12 months (or for such shorter period that the registrant was required to submit and post such files).
|
|
Yes
|
|
X
|
|
|
No
|
|
|
|
|||
Indicate by check mark if disclosure of delinquent filers pursuant to Item 405 of Regulation S-K is not contained herein, and will not be contained, to the best of the registrant’s knowledge, in definitive proxy or information statements incorporated by reference in Part III of this Form 10-K or any amendment to this Form 10-K. [ X ]
Indicate by check mark whether the registrant is a large accelerated filer, an accelerated filer, a non-accelerated filer, a smaller reporting company, or emerging growth company. See the definitions of “large accelerated filer,” “accelerated filer,” “smaller reporting company” and "emerging growth company" in Rule 12b-2 of the Exchange Act. (Check one):
|
x
Large accelerated filer
|
¨
Accelerated filer
|
|
|
¨
Non-accelerated filer (Do not check if a smaller reporting company)
|
(Do not check if a smaller reporting company)
|
|
|
¨
Smaller reporting company
|
||
|
¨
Emerging growth company
|
||
If an emerging growth company, indicate by check mark if the registrant has elected not to use the extended transition period for complying with any new or revised financial accounting standards provided pursuant to Section 13(a) of the Exchange Act.
o
Indicate by check mark whether the registrant is a shell company (as defined in Rule 12b-2 of the Exchange Act).
|
|
Yes
|
|
|
|
|
No
|
|
X
|
|
|||
Aggregate market value of voting stock held by non-affiliates of the registrant as of
July 2, 2017
: $
7,009,710,000
Common stock, par value $.002 per share, outstanding as of
January 28, 2018
:
173,551,058
shares
DOCUMENTS INCORPORATED BY REFERENCE:
The registrant intends to file a Definitive Proxy Statement pursuant to Regulation 14A within 120 days of the end of the fiscal year ended
December 31, 2017
. Portions of such Proxy Statement are incorporated by reference in Part III of this report.
COGNEX CORPORATION
ANNUAL REPORT ON FORM 10-K
FOR THE YEAR ENDED DECEMBER 31,
2017
INDEX
|
ITEM 1.
|
||
|
ITEM 1A.
|
||
|
ITEM 1B.
|
||
|
ITEM 2.
|
||
|
ITEM 3.
|
||
|
ITEM 4.
|
||
|
ITEM 4A.
|
||
|
ITEM 5.
|
||
|
ITEM 6.
|
||
|
ITEM 7.
|
||
|
ITEM 7A.
|
||
|
ITEM 8.
|
||
|
ITEM 9.
|
||
|
ITEM 9A.
|
||
|
ITEM 9B.
|
||
|
ITEM 10.
|
||
|
ITEM 11.
|
||
|
ITEM 12.
|
||
|
ITEM 13.
|
||
|
ITEM 14.
|
||
|
ITEM 15.
|
||
|
ITEM 16.
|
||
This Annual Report on Form 10-K contains forward-looking statements within the meaning of the Federal Securities Laws. Readers can identify these forward-looking statements by our use of the words “expects,” “anticipates,” “estimates,” “believes,” “projects,” “intends,” “plans,” “will,” “may,” “shall,” “could,” “should,” and similar words and other statements of a similar sense. Our future results may differ materially from current results and from those projected in the forward-looking statements as a result of known and unknown risks and uncertainties. Readers should pay particular attention to considerations described in the section captioned “Risk Factors,” appearing in Part I - Item 1A of this Annual Report on Form 10-K. We caution readers not to place undue reliance upon any such forward-looking statements, which speak only as of the date made. We disclaim any obligation to subsequently revise forward-looking statements to reflect the occurrence of anticipated or unanticipated events or circumstances after the date such statements are made.
Unless the context otherwise requires, the words “Cognex
®
,” the “Company,” “we,” “our,” “us,” and “our company” refer to Cognex Corporation and its consolidated subsidiaries.
Corporate Profile
Cognex Corporation was incorporated in Massachusetts in 1981. Our corporate headquarters are located at One Vision Drive, Natick, Massachusetts 01760 and our telephone number is (508) 650-3000.
Cognex is a leading worldwide provider of machine vision products that capture and analyze visual information in order to automate tasks, primarily in manufacturing processes, where vision is required. Machine vision products are used to automate the manufacture and tracking of discrete items, such as mobile phones, aspirin bottles, and automobile tires, by locating, identifying, inspecting, and measuring them during the manufacturing or distribution process. Machine vision is important for applications in which human vision is inadequate to meet requirements for size, accuracy, or speed, or in instances where substantial cost savings are obtained through the reduction of labor or improved product quality. Today, many types of manufacturing equipment require machine vision because of the increasing demands for speed and accuracy in manufacturing processes, as well as the decreasing size of items being manufactured.
What is Machine Vision?
Since the beginning of the Industrial Revolution, human vision has played an indispensable role in the process of manufacturing products. Human eyes did what no machines could do themselves: locating and positioning work, tracking the flow of parts, and inspecting output for quality and consistency. Today, however, the requirements of many manufacturing processes have surpassed the limits of human eyesight. Manufactured items often are produced too quickly or with tolerances too small to be analyzed by the human eye. In response to manufacturers’ needs, “machine vision” technology emerged, providing manufacturing equipment with the gift of sight. Machine vision systems were first widely embraced by manufacturers of electronic components who needed this technology to produce computer chips with decreasing geometries. However, advances in technology and ease-of-use, combined with the decreasing cost of implementing vision applications, have made machine vision available to a broader range of users.
1
Machine vision products combine cameras with intelligent software to collect images and then answer questions about these images, such as:
|
Question
|
|
Description
|
|
Example
|
|
GUIDANCE
|
|
|
||
|
Where is it?
|
|
Determining the exact physical location and orientation of an object.
|
|
Determining the position of a printed circuit board so that a robot can automatically be guided to place electronic components.
|
|
IDENTIFICATION
|
|
|
||
|
What is it?
|
|
Identifying an object by analyzing its physical appearance or by reading a serial number or symbol.
|
|
Reading a two-dimensional barcode directly marked on an automotive airbag so that it can be tracked and processed correctly through manufacturing.
|
|
INSPECTION
|
|
|
||
|
How good is it?
|
|
Inspecting an object for flaws or defects.
|
|
Checking for debris to ensure that foreign objects are not present in a product before shipping to consumers.
|
|
GAUGING
|
|
|
||
|
What size is it?
|
|
Determining the dimensions of an object.
|
|
Determining the diameter of a bearing prior to final assembly.
|
Machine Vision Market
Cognex machine vision is primarily used in the manufacturing sector, where the technology is widely recognized as an important component of automated production and quality assurance. In this sector, the Company’s customers are primarily in the factory automation market. Factory automation customers purchase Cognex vision products and incorporate them into their manufacturing processes. Virtually every manufacturer can achieve better quality and manufacturing efficiency by using machine vision, and therefore, this market includes a broad base of customers across a variety of industries, including consumer electronics, automotive, consumer products, food and beverage, medical devices, and pharmaceuticals. Factory automation customers also purchase Cognex products for use outside of the assembly process, such as using ID products in logistics automation for package sorting and distribution. A small percentage of our customers are in the semiconductor and electronics capital equipment market. These customers purchase Cognex vision products and integrate them into the automation equipment that they manufacture and then sell to their customers to either make semiconductor chips or assemble printed circuit boards.
In 2017, 2016, and 2015, direct and indirect revenue from Apple Inc. accounted for 21%, 19%, and 18% of total revenue, respectively.
Business Strategy
Our goal is to expand our position as a leading worldwide provider of machine vision products. We are selective in choosing growth opportunities that we believe will maintain our historically high gross margin percentages, which have ranged from the mid-to-high 70s for the past several years and reflect the value our customers place on our innovative products. Our strong and unique corporate culture reinforces our values of customer first and innovation, and enables us to attract and retain smart, highly-educated, experienced talent who are motivated to solve the most challenging vision tasks.
We invest heavily in research and development in order to maintain our position as a technology leader in machine vision. We invest in technology that makes vision easier to use and more affordable, and therefore, available to a broader base of customers, such as our vision sensor products that enable customers with a lower budget to use machine vision without the help of sophisticated engineers. We also invest in technology that addresses the most challenging vision applications, such as our 3D vision products that solve applications where a height or volume measurement is required. We identify large customers with high-volume applications and offer them collaborative development to deliver solutions to solve their complex vision problems.
We continue to invest in our core markets, such as consumer electronics and automotive, where we are a leading provider of vision and ID products for factory automation, while we seek opportunities to expand into adjacent markets for vision, such as logistics, airport baggage handling, mobile terminals, life sciences, and collaborative robotics. We invest through internal development, as well as the acquisition of businesses and technologies.
We reach a broad base of customers through our worldwide direct sales force that sells to large, strategic customers, as well as through our network of distributors and integrators that sell primarily to smaller customers who may be more geographically remote. We invest in emerging, high-growth regions where many manufacturers can benefit from
2
incorporating machine vision into their production processes. This includes investment in our fast-growing region, China, where rising wages for assembly workers and a greater focus on product quality are driving assembly automation, particularly in the consumer electronics industry.
Acquisitions and Divestitures
Our business strategy includes selective expansion into new machine vision applications and markets through the acquisition of businesses and technologies. In 2017, 2016, and 2015, we completed seven small business acquisitions, which were not significant individually or in the aggregate. The purchase price for each business ranged from $2.5 million to $23 million. In addition to completed technology and customer relationships, these acquisitions included engineering talent expected to help accelerate the development of future products. Management considers business acquisitions to be an important part of our growth strategy, and although we continue to actively seek out acquisition opportunities, we are selective in choosing businesses that we believe will enhance our long-term growth rate and profitability. We plan to continue to seek opportunities to expand our product lines, customer base, distribution network, and technical talent through acquisitions in the machine vision industry.
On July 6, 2015, we completed the sale of our Surface Inspection Systems Division (SISD) to AMETEK, Inc. for $156 million in cash. The after-tax gain associated with this sale was $78 million. SISD specialized in machine vision products that inspect the surfaces of materials processed in a continuous fashion. SISD did not meet our long-term objectives and its divestiture was a strategic decision for us. With this sale, we are focusing our efforts on discrete manufacturing where we see the greatest growth potential. The financial results of SISD are reported as a discontinued operation in this Annual Report on Form 10-K and all prior period comparative financial data have been reported excluding SISD.
We had previously reported SISD as one of our two segments. Given the disposition of the SISD segment, management reviewed its segment reporting and concluded that the Company now operates in one segment, machine vision technology. We offer a variety of machine vision products that have similar economic characteristics, have the same production processes, and are distributed by the same sales channels to the same types of customers. Information about segments may be found in Note 18 to the Consolidated Financial Statements, appearing in Part II - Item 8 of this Annual Report on Form 10-K.
Products
Cognex offers a full range of vision and ID products designed to meet customer needs at different performance and price points. Our products range from low-cost vision sensors that are easily integrated, to PC-based systems for users with more experience or more complex requirements. Our products also have a variety of physical forms, depending upon the user's needs. For example, customers can purchase vision software to use with their own camera and processor, or they can purchase a standalone unit that combines camera, processor, and software into a single package.
Vision Software
Vision software provides users with the most flexibility by combining the full general-purpose library of Cognex vision tools with the cameras, frame grabbers, and peripheral equipment of their choice. The vision software may run on the customer’s PC, which enables easy integration with PC-based data and controls. Applications based upon Cognex vision software perform a wide range of vision tasks, including part location, identification, measurement, assembly verification, and robotic guidance. Cognex's VisionPro
®
software offers an extensive suite of patented vision tools for advanced programming, while Cognex Designer allows customers to build complete vision applications with the simplicity of a graphical, flowchart-based programming environment. Cognex also offers a series of displacement sensors that are sold with vision software for use in highly demanding 3D applications.
Vision Systems
Vision systems combine camera, processor, and vision software into a single, rugged package with a simple and flexible user interface for configuring applications. These general-purpose vision systems are designed to be easily programmed to perform a wide range of vision tasks including part location, identification, measurement, assembly verification, and robotic guidance. Cognex offers the In-Sight
®
product line of vision systems in a wide range of models to meet various price and performance requirements.
Vision Sensors
Unlike general-purpose vision systems that can be programmed to perform a wide variety of vision tasks, vision sensors are designed to deliver very simple, low-cost, reliable solutions for a limited number of common vision applications such as checking the presence and size of parts. Cognex offers the In-Sight 2000 Series, which combines the power of an In-Sight vision system with the simplicity and affordability of a vision sensor.
3
ID Products
ID products quickly and reliably read codes (e.g., one-dimensional barcodes or two-dimensional data matrix codes) that have been applied to, or directly marked on, discrete items during the manufacturing process. Manufacturers of goods ranging from automotive parts, pharmaceutical items, aircraft components, and medical devices are increasingly using direct part mark (DPM) identification to ensure that the appropriate manufacturing processes are performed in the correct sequence and on the right parts. In addition, DPM is used to track parts from the beginning of their life to the end, and is also used in supply chain management and repair.
Cognex also offers applications in the automatic identification market outside of the manufacturing sector, such as using ID products in logistics automation for package sorting and distribution. As shipping volumes grow and more retail sales occur through ecommerce, more distribution centers are choosing to upgrade their traditional laser-based scanners to image-based barcode readers, which may cost-effectively increase package sorter efficiency and throughput by improving read rates. Cognex offers the DataMan
®
product line of barcode readers, which includes both hand-held and fixed-mount models, and barcode verifiers, as well as the MX Series of vision-enabled Mobile Terminals that allow customers to leverage the latest mobile device technology for industrial barcode reading applications.
Research, Development, and Engineering
Cognex engages in research, development, and engineering (RD&E) to enhance our existing products and to develop new products and functionality to address market opportunities. In addition to internal research and development efforts, we intend to continue our strategy of gaining access to new technology through strategic relationships and acquisitions where appropriate.
As of
December 31, 2017
, Cognex employed 445 professionals in RD&E, many of whom are software developers. Cognex’s RD&E expenses totaled $99,205,000 in
2017
, and $78,269,000 in
2016
, and $69,791,000 in
2015
, or approximately 13%, 15%, and 15% of revenue, respectively. We believe that a continued commitment to RD&E activities is essential in order to maintain or achieve product leadership with our existing products and to provide innovative new product offerings, as well as to provide engineering support for large customers. In addition, we consider our ability to accelerate time-to-market for new products to be critical to our revenue growth. Therefore, we expect to continue to make significant RD&E investments in the future. At any point in time, we have numerous research and development projects underway. Although we target our annual RD&E spending to be between 10% and 15% of total revenue, this percentage is impacted by revenue levels and investing cycles.
Manufacturing and Order Fulfillment
Cognex’s products are manufactured utilizing a turnkey operation whereby the majority of component procurement, system assembly, and initial testing are performed by third-party contract manufacturers. Cognex’s primary contract manufacturer is located in Indonesia. The contract manufacturers use specified components sourced from a vendor list approved by Cognex and assembly/test documentation created and controlled by Cognex. Certain components are presently sourced from a single vendor that is selected based upon price and performance considerations. In the event of a supply disruption from a single-source vendor, these components may be purchased from alternative vendors.
After the completion of initial testing, a fully assembled product from the contract manufacturers is routed to our facility in Cork, Ireland or Natick, Massachusetts, USA, where trained Cognex personnel load Cognex software onto the product and perform quality control procedures. Finished product for customers in the Americas is then shipped from our Natick, Massachusetts facility, while finished product for customers outside of the Americas is shipped from our Cork, Ireland facility.
Sales Channels and Support Services
Cognex sells its products through a worldwide direct sales force that focuses on the development of strategic accounts that generate or are expected to generate significant sales volume, as well as through a global network of integration and distribution partners. Our integration partners are experts in vision and complementary technologies that can provide turnkey solutions for complex automation projects using vision, and our distribution partners provide sales and local support to help Cognex reach the many prospects for our products in factories around the world.
As of December 31, 2017, Cognex’s sales force consisted of 744 professionals, and our partner network consisted 389 active integrators and authorized distributors. Sales engineers call directly on targeted accounts, with the assistance of application engineers, and manage the activities of our integration and distribution partners within their territories in order to provide an advantageous sales model for our products. The majority of our sales engineers are degreed engineers. Cognex has sales and support personnel located throughout the Americas, Europe, and Asia.
4
Sales to customers based outside of the United States represented approximately 76% of total revenue in 2017 compared to approximately 74% of total revenue in 2016. In 2017, approximately 43% of our total revenue came from customers based in Europe, 14% from customers based in Greater China, 5% from customers based in Japan, and 14% from customers based in other regions outside the United States. Sales to customers based in Europe are denominated in Euros and U.S. Dollars, sales to customers based in Greater China are denominated in Yuan for sales within Mainland China and U.S. Dollars in other territories, sales to customers based in Japan are predominantly denominated in Yen, and sales to customers based in other regions are denominated in U.S. Dollars. Financial information about geographic areas may be found in
Note 18 to the Consolidated Financial Statements, appearing in Part II - Item 8 of this Annual Report on Form 10-K.
Cognex’s service offerings include maintenance and support, consulting, and training services. Maintenance and support programs include hardware support programs that entitle customers to have failed products repaired, as well as software support programs that provide customers with application support and software updates on the latest software releases. Application support is provided by technical support personnel located at Cognex regional offices, as well as by field service engineers that provide support at the customer’s production site. We provide consulting services that range from a specific area of functionality to a completely integrated vision application or installed ID application. Training services include a variety of product courses that are available at our offices worldwide, at customer facilities, and on computer-based tutorials, video, and the internet.
Intellectual Property
We rely on the technical expertise, creativity, and knowledge of our personnel, and therefore, we utilize patent, trademark, copyright, and trade secret protection to maintain our competitive position and protect our proprietary rights in our products and technology. While our intellectual property rights are important to our success, we believe that our business as a whole is not materially dependent on any particular patent, trademark, copyright, or other intellectual property right.
As of
December 31, 2017
, Cognex had been granted, or owned by assignment, 571 patents issued worldwide and had another 443 patent applications pending worldwide. Cognex has used, registered, or applied to register a number of trademark registrations in the United States and in other countries. Cognex’s trademark and servicemark portfolio includes various registered marks, including, among others, Cognex
®
, VisionPro
®
, In-Sight
®
, and DataMan
®
, as well as many common-law marks.
Compliance with Environmental Provisions
Cognex’s capital expenditures, earnings, and competitive position are not materially affected by compliance with federal, state, and local environmental provisions which have been enacted or adopted to regulate the distribution of materials into the environment.
Competition
The machine vision market is highly fragmented and competitive. Our competitors include other vendors of machine vision systems, controllers, and components; manufacturers of image processing systems, sensors, and components; and system integrators. In addition, in the semiconductor and electronics capital equipment market, and with respect to machine builders in the factory automation market, we compete with the internal engineering departments of current or prospective customers. In the identification and logistics market, we compete with manufacturers of automatic identification systems. Key competitors in geographies worldwide include Keyence Corporation, Sick AG, and Omron Corporation. Any of these competitors may have greater financial and other resources than Cognex. Although we consider Cognex to be one of the leading machine vision companies in the world, reliable estimates of the machine vision market and the number and relative size of competitors are not readily available.
Cognex’s ability to compete depends upon our ability to design, manufacture, and sell high-quality products, as well as our ability to develop new products and functionality that meet evolving customer requirements. The primary competitive factors affecting the choice of a machine vision or ID system include vendor reputation, product functionality and performance, ease of use, price, and post-sales support. The importance of each of these factors varies depending upon the specific customer’s needs.
Backlog
As of
December 31, 2017
, backlog, which includes deferred revenue, totaled $42,186,000, compared to $39,335,000 as of
December 31, 2016
. Backlog reflects customer purchase orders for products scheduled for shipment primarily within 120 days for customers in the logistics industry and primarily within 60 days for customers in all other industries. The level of backlog at any particular date is not necessarily indicative of future revenue. Delivery schedules may be extended and orders may be canceled at any time subject to certain cancellation penalties.
5
Employees
As of
December 31, 2017
, Cognex employed
1,771
persons, including 967 in sales, marketing, and service activities; 445 in research, development, and engineering; 163 in manufacturing and quality assurance; and 196 in information technology, finance, and administration. Of our
1,771
employees, 998 are based outside of the United States. We have not experienced any work stoppages due to labor disputes. We believe that our employee relations are good.
Available Information
Cognex maintains a website on the World Wide Web at www.cognex.com. We make available, free of charge, on our website in the “Company” section under the caption “Investor Information” followed by “Financial Information” and then “SEC FiIings,” our Annual Report on Form 10-K, Quarterly Reports on Form 10-Q, and Current Reports on Form 8-K, including exhibits, and amendments to those reports filed or furnished pursuant to Section 13(a) or 15(d) of the Securities Exchange Act of 1934, as amended, as soon as reasonably practicable after such reports are electronically filed with, or furnished to, the SEC. Cognex’s reports filed with, or furnished to, the SEC are also available at the SEC’s website at www.sec.gov. Information contained on our website is not a part of, or incorporated by reference into, this Annual Report on Form 10-K.
The risks and uncertainties described below are not the only ones that we face. Additional risks and uncertainties that we are unaware of, or that we currently deem immaterial, also may become important factors that affect our company in the future. If any of these risks were to occur, our business, financial condition, or results of operations could be materially and adversely affected. This section includes or refers to certain forward-looking statements. We refer you to the explanation of the qualifications and limitations on such forward-looking statements, appearing under the heading "Forward-Looking Statements" in Part II - Item 7 of this Annual Report on Form 10-K.
The loss of a large customer could have an adverse effect on our business.
Revenue from a single customer accounted for 21%, 19%, and 18% of total revenue in 2017, 2016, and 2015, respectively. Large customers may divert management’s attention from other operational matters and pull resources from other areas of the business, resulting in potential loss of revenue from other customers. In addition, large customers may receive preferred pricing and a higher level of post-sale support, which may lower our gross margin percentage. Furthermore, we typically extend credit terms to large customers, resulting in large accounts receivable balances, and in certain instances due to long supplier lead times, we may purchase inventory in advance of receipt of a customer purchase order, which exposes us to an increased risk of excess or obsolete inventory and resulting charges.
In some cases, end customers of our resellers may be large consumers of our products. Furthermore, there may be industry leaders that are able to exert purchasing power over their vendors' supply chains, particularly in the automotive and consumer electronics industries. The loss of, or significant curtailment of purchases by, any one or more of our larger customers could have a material adverse effect on our operating results.
Global economic conditions may negatively impact our operating results.
Our revenue levels are impacted by global economic conditions, as we have a significant business presence in many countries throughout the world. If global economic conditions were to deteriorate, our revenue and our ability to generate operating profits could be materially adversely affected.
As a result of global economic conditions, our business is subject to the following risks, among others:
|
•
|
our customers may not have sufficient cash flow or access to financing to purchase our products,
|
|
•
|
our customers may not pay us within agreed upon terms or may default on their payments altogether,
|
|
•
|
our vendors may be unable to fulfill their delivery obligations to us in a timely manner,
|
|
•
|
lower demand for our products may result in charges for excess and obsolete inventory if we are unable to sell inventory that is either already on hand or committed to purchase,
|
|
•
|
lower cash flows may result in impairment charges for acquired intangible assets or goodwill,
|
|
•
|
a decline in our stock price may make stock options a less attractive form of compensation and a less effective form of retention for our employees, and
|
|
•
|
the trading price of our common stock may be volatile.
|
As of December 31, 2017, the Company had $828 million in cash and investments. In addition, Cognex has no long-term debt and we do not anticipate needing debt financing in the near future. We believe that our strong cash position
6
puts us in a relatively good position to weather economic downturns. Nevertheless, our operating results have been materially adversely affected in the past, and could be materially adversely affected in the future, as a result of unfavorable economic conditions and reduced capital spending by manufacturers worldwide.
A downturn in the consumer electronics or automotive industries may adversely affect our business.
In 2017, the largest industries that we served in the factory automation market were the consumer electronics and automotive industries. Our business is impacted by the level of capital spending in these industries, as well as the product design cycles of our major customers in these industries. The market leaders in these industries are able to exert purchasing power over their vendors' supply chains, and our large customers in these industries may decide to purchase fewer products from Cognex or stop purchasing from Cognex altogether. As a result, our operating results could be materially and adversely affected by declining sales in these industries.
Our inability to penetrate new markets may impede our revenue growth.
We are pursuing applications in the automatic identification market outside of the manufacturing sector, such as using ID products in logistics automation for package sorting and distribution. As shipping volumes grow, more distribution centers are choosing to upgrade their traditional laser-based scanners to image-based barcode readers, which may cost-effectively increase package sorter efficiency and throughput by improving read rates. Cognex has introduced image-based barcode readers in order to penetrate the ID logistics market and grow our ID Products business beyond the traditional manufacturing sector that we currently serve. Our growth plan is dependent upon successfully penetrating the ID logistics market and we are making significant investments in this area. Therefore, our failure to generate revenue in this new market in the amounts or within the time periods anticipated may have a material adverse impact on our revenue growth and operating results.
Economic, political, and other risks associated with international sales and operations could adversely affect our business and operating results.
In 2017, approximately 76% of our revenue was derived from customers located outside of the United States. We anticipate that international sales will continue to account for a significant portion of our revenue. In addition, certain of our products are assembled by third-party contract manufacturers, primarily located in Indonesia. We intend to continue to expand our sales and operations outside of the United States and expand our presence in international emerging markets. As a result, our business is subject to the risks inherent in international sales and operations, including, among other things:
|
•
|
various regulatory and statutory requirements,
|
|
•
|
difficulties in injecting and repatriating cash,
|
|
•
|
export and import restrictions,
|
|
•
|
transportation delays,
|
|
•
|
employment regulations and local labor conditions,
|
|
•
|
difficulties in staffing and managing foreign sales operations,
|
|
•
|
instability in economic or political conditions,
|
|
•
|
difficulties protecting intellectual property,
|
|
•
|
business systems connectivity issues, and
|
|
•
|
potentially adverse tax consequences.
|
Any of these factors could have a material adverse effect on our operating results.
Fluctuations in foreign currency exchange rates and the use of derivative instruments to hedge these exposures could adversely affect our reported results, liquidity, and competitive position.
We face exposure to foreign currency exchange rate fluctuations, as a significant portion of our revenues, expenses, assets, and liabilities are denominated in currencies other than the functional currencies of our subsidiaries or the reporting currency of our company, which is the U.S. Dollar. In certain instances, we utilize forward contracts to hedge against foreign currency fluctuations. These contracts are used to minimize foreign currency gains or losses, as the gains or losses on the derivative are intended to offset the losses or gains on the underlying exposure. We do not engage in foreign currency speculation. If the counterparty to any of our hedging arrangements experiences financial difficulties, or is otherwise unable to honor the terms of the contract, we may experience material losses.
Our foreign currency hedging program includes foreign currency cash flow hedges that protect our budgeted revenues and expenses against foreign currency exchange rate changes compared to our budgeted rates. These derivatives
7
are designated for hedge accounting, and therefore, the effective portion of the forward contract's gain or loss is reported in shareholders' equity as other comprehensive income (loss) and is reclassified into current operations as the hedged transaction impacts current operations. Should these hedges fail to qualify for hedge accounting or be ineffective, the gain or loss on the forward contract would be reported in current operations immediately as opposed to when the hedged transaction impacts current operations, which may result in material foreign currency gains or losses.
The success of our foreign currency risk management program depends upon forecasts of transaction activity denominated in various currencies. To the extent that these forecasts are overstated or understated during periods of currency volatility, we could experience unanticipated foreign currency gains or losses that could have a material impact on our results of operations. Furthermore, our failure to identify new exposures and hedge them in an effective manner may result in material foreign currency gains or losses.
A significant portion of our revenues and expenses are denominated in the Euro, the Japanese Yen, and the Chinese Yuan, also known as Renminbi. Our predominant currency of sale is the U.S. Dollar in the Americas, the Euro and U.S. Dollar in Europe, the Yuan in Mainland China, the Yen in Japan, and the U.S. Dollar in other regions. We estimate that approximately 39% of our sales in 2017 were invoiced in currencies other than the U.S. Dollar, and we expect sales denominated in foreign currencies to continue to represent a significant portion of our total revenue. While we also have expenses denominated in these same foreign currencies, the impact on revenues has historically been, and is expected to continue to be, greater than the offsetting impact on expenses. Therefore, in times when the U.S. Dollar strengthens in relation to these foreign currencies, we would expect to report a net decrease in operating income. Conversely, in times when the U.S. Dollar weakens in relation to these foreign currencies, we would expect to report a net increase in operating income. Thus, changes in the relative strength of the U.S. Dollar may have a material impact on our operating results.
Information security breaches or business system disruptions may adversely affect our business.
We rely on our information technology infrastructure and management information systems to effectively run our business. We may be subject to information security breaches caused by hacking, malicious software, or acts of vandalism or terrorism. Our security measures or those of our third-party service providers may not detect or prevent such breaches. Any such compromise to our information security could result in theft of our intellectual property, a misappropriation of our cash or other assets, an interruption in our operations, the unauthorized publication of our confidential business or proprietary information, the unauthorized release of customer, vendor, or employee data, the violation of privacy or other laws, and the exposure to litigation, any of which could harm our business and operating results.
Disruptions with our management information systems may cause significant business disruption. In 2017, we began work to replace our Enterprise Resource Planning (ERP) system, which is the management information system that integrates our manufacturing, order fulfillment, and financial activities. We expect the new system to be placed into service in the second quarter of 2018. Replacing an ERP system is a significant investment in terms of both time and money, and may divert management's attention from other operational matters. The conversion from the old system to the new system may result in significant business disruption, including our ability to process orders, ship products, invoice customers, process payments, and otherwise run our business. Any disruption occurring with our ERP system, or any of our other management information systems, may have a material adverse effect on our operating results.
Our business could suffer if we lose the services of, or fail to attract, key personnel.
We are highly dependent upon the management and leadership of Robert J. Shillman, our Chairman of the Board of Directors and Chief Culture Officer, and Robert J. Willett, our President and Chief Executive Officer, as well as other members of our senior management team. Although we have many experienced and qualified senior managers, the loss of key personnel could have a material adverse effect on our company.
We have historically used stock options as a key component of our employee compensation program in order to align employee interests with the interests of our shareholders, provide competitive compensation and benefits packages, and encourage employee retention. We are limited as to the number of options that we may grant under our stock option plans. Accordingly, we may find it difficult to attract, retain, and motivate employees, and any such difficulties could materially adversely affect our business.
Furthermore, we expect our stock-based compensation expense to increase in future years due to a higher valuation of our stock options resulting primarily from the significant increase in our stock price in 2017, which is used as an input to this valuation.
8
If we fail to effectively manage our growth, our business and operating results could suffer.
In 2017, the Company’s revenue grew by 44% over the prior year. To help support this growth, our headcount increased from 1,421 employees as of December 31, 2016 to 1,771 employees as of December 31, 2017. Although this represents a net headcount increase of 350 persons, the number of new employees that we hired and trained was higher due to workforce attrition. In addition, we currently utilize a large number of third-party contractors to provide on-site technical support and installation services.
To support our growth and execute on our operating plans and strategic initiatives, we must effectively attract, train, develop, motivate, and retain skilled employees, while maintaining our unique corporate culture. We believe our strong corporate culture is critical to our ability to collaborate, innovate, execute, and adapt in a high-growth, fast-changing business environment. We may not be able to hire and train new employees and contractors quickly enough to meet our business needs. If we fail to quickly adapt our hiring and training plans to our business levels or effectively execute on our hiring plans, our efficiency and ability to meet our operating goals could suffer. Furthermore, employee productivity, morale, and retention could suffer, which may have a material adverse effect on our business and operating results.
Additionally, the growth and expansion of our business and product offerings place significant demand on our employees and, in particular, our management team. The growth of our business may require significant additional resources to meet these daily requirements, which may not scale in a cost-effective manner or may negatively impact our customers’ experience. Effective management information systems, including our new Enterprise Resource Planning (ERP) system to be implemented in 2018, and strong internal controls are also necessary to support our growth. If we are unable to manage the growth of our organization and business effectively, our operating results may be materially and adversely affected.
The failure of a key supplier to deliver quality product in a timely manner or our inability to obtain components for our products could adversely affect our operating results.
A significant portion of our product is manufactured by a third-party contractor located in Indonesia. This contractor has agreed to provide Cognex with termination notification periods and last-time-buy rights, if and when that may be applicable. We rely upon this contractor to provide quality product and meet delivery schedules. We engage in extensive product quality programs and processes, including actively monitoring the performance of our third-party manufacturers; however, we may not detect all product quality issues through these programs and processes.
Certain components are presently sourced from a single vendor that is selected based on price and performance considerations. In the event of a supply disruption from a single-source vendor, these components may be purchased from alternative vendors, which may result in manufacturing delays based on the lead time of the new vendor. Certain key electronic and mechanical components that are purchased from strategic suppliers, such as processors or imagers, are fundamental to the design of Cognex products. A disruption in the supply of these key components, such as a last-time-buy announcement, natural disaster, financial bankruptcy, or other event, may require us to purchase a significant amount of inventory at unfavorable prices resulting in lower gross margins and higher risk of carrying excess inventory.
We are subject to the requirements of the Dodd-Frank Wall Street Reform and Consumer Protection Act that obligates companies to inquire into the origin of conflict minerals in their supply chains. We are working with our supply chain partners to take reasonable steps to assure conflict minerals are not sourced by Cognex or our supply chain partners. These steps may include purchasing supply from alternative vendors. If we are unable to secure adequate supply from alternative vendors, we may have to redesign our products, which may lead to a delay in manufacturing and a possible loss of sales. Although we are taking certain actions to mitigate supply risk, an interruption in, termination of, or material change in the purchase terms of any key components could have a material adverse effect on our operating results.
Our failure to effectively manage product transitions or accurately forecast customer demand could result in excess or obsolete inventory and resulting charges.
Because the market for our products is characterized by rapid technological advances, we frequently introduce new products with improved ease-of-use, improved hardware performance, additional software features and functionality, or lower cost that may replace existing products. Among the risks associated with the introduction of new products are difficulty predicting customer demand and effectively managing inventory levels to ensure adequate supply of the new product and avoid excess supply of the legacy product.
9
We may strategically enter into non-cancelable commitments with vendors to purchase materials for our products in advance of demand to take advantage of favorable pricing, address concerns about the availability of future supplies, or build safety stock to help ensure customer shipments are not delayed should we experience higher than anticipated demand for materials with long lead times. In 2017, inventories increased significantly from $26,984,000 as of December 31, 2016 to $67,923,000 as of December 31, 2017. While a portion of this increase was to support the higher business level, we also made strategic purchases to build safety stock in advance of the Company's Enterprise Resource Planning (ERP) system implementation planned for 2018 and to mitigate our exposure to significant increases in demand similar to what we experienced in 2017. These measures to purchase inventory may expose us to an increased risk of excess or obsolete inventory and resulting charges if actual demand is lower than anticipated. Our failure to effectively manage product transitions or accurately forecast customer demand, in terms of both volume and configuration, has led to, and may again in the future lead to, an increased risk of excess or obsolete inventory and resulting charges.
Our products may contain design or manufacturing defects, which could result in reduced demand, significant delays, or substantial costs.
If flaws in either the design or manufacture of our products were to occur, we could experience a rate of failure in our products that could result in significant delays in shipment and material repair or replacement costs. Our release-to-market process may not be robust enough to detect significant design flaws or software bugs. While we engage in extensive product quality programs and processes, including actively monitoring and evaluating the quality of our component suppliers and contract manufacturers, these actions may not be sufficient to avoid a product failure rate that results in:
|
•
|
substantial delays in shipment,
|
|
•
|
significant repair or replacement costs,
|
|
•
|
product liability claims or lawsuits, or
|
|
•
|
potential damage to our reputation.
|
Any of these results could have a material adverse effect on our operating results.
Our failure to introduce new products in a successful and timely manner could result in the loss of our market share and a decrease in our revenues and profits.
The market for our products is characterized by rapidly changing technology. Accordingly, we believe that our future success will depend upon our ability to accelerate time-to-market for new products with improved functionality, ease-of-use, performance, or price. There can be no assurance that we will be able to introduce new products in accordance with scheduled release dates or that new products will achieve market acceptance. Our ability to keep pace with the rapid rate of technological change in the high-technology marketplace could have a material adverse effect on our operating results.
Product development is often a complex, time-consuming, and costly process involving significant investment in research and development with no assurance of return on investment. Our strong balance sheet allows us to continue to make significant investments in research, development, and marketing for new products and technologies. Research is by its nature speculative and the ultimate commercial success of a product depends upon various factors, many of which are not under our control. We may not achieve significant revenue from new product investments for a number of years, if at all. Moreover, new products may not generate the gross margins that we have experienced historically.
Our failure to properly manage the distribution of our products and services could result in the loss of revenues and profits.
We utilize a direct sales force, as well as a network of integration and distribution partners, to sell our products and services. Successfully managing the interaction of our direct and indirect sales channels to reach various potential customers for our products and services is a complex process. In addition, our reliance upon indirect selling methods may reduce visibility to demand and pricing issues. Each sales channel has distinct risks and costs, and therefore, our failure to implement the most advantageous balance in the sales model for our products and services could adversely affect our revenue and profitability.
10
If we fail to successfully protect our intellectual property, our competitive position and operating results could suffer.
We rely on our proprietary software technology and hardware designs, as well as the technical expertise, creativity, and knowledge of our personnel to maintain our position as a leading provider of machine vision products. Software piracy and reverse engineering, specifically from companies in Russia and Asia, may result in counterfeit products that are misrepresented in the market as Cognex products. Although we use a variety of methods to protect our intellectual property, we rely most heavily on patent, trademark, copyright, and trade secret protection, as well as non-disclosure agreements with customers, suppliers, employees, and consultants. We also attempt to protect our intellectual property by restricting access to our proprietary information by a combination of technical and internal security measures. These measures, however, may not be adequate to:
|
•
|
protect our proprietary technology,
|
|
•
|
protect our patents from challenge, invalidation, or circumvention, or
|
|
•
|
ensure that our intellectual property will provide us with competitive advantages.
|
Our pending and future patent applications may not issue as patents or, if issued, may not issue in a form that will provide us with any meaningful protection or any competitive advantage. Even if issued, existing or future patents may be challenged, narrowed, invalidated, or circumvented, which could limit our ability to stop competitors from developing and marketing similar products or limit the length of terms of patent protection we may have for our products. Furthermore, other companies may design around technologies we have patented, licensed, or developed. Moreover, changes in patent laws or their interpretation in the United States and other countries could also diminish the value of our intellectual property or narrow the scope of our patent protection. In addition, the legal systems of certain countries do not favor the aggressive enforcement of patents, and the laws of foreign countries may not protect our rights to the same extent as the laws of the United States. As a result, our patent portfolio may not provide us with sufficient rights to exclude others from commercializing products similar to ours.
Any of these adverse circumstances could have a material adverse effect on our operating results.
Our Company may be subject to time-consuming and costly litigation.
From time to time, we may be subject to various claims and lawsuits by competitors, customers, or other parties arising in the ordinary course of business, including lawsuits charging patent infringement, or claims and lawsuits instituted by us to protect our intellectual property or for other reasons. We may be a party to actions that are described in the section captioned “Legal Proceedings,” appearing in Part I - Item 3 of this Annual Report on Form 10-K. These matters can be time-consuming, divert management’s attention and resources, and cause us to incur significant expenses. Furthermore, the results of any of these actions may have a material adverse effect on our operating results.
Increased competition may result in decreased demand or prices for our products and services.
The machine vision market is highly fragmented and competitive. Our competitors include other vendors of machine vision systems, controllers, and components; manufacturers of image processing systems, sensors, and components; and system integrators. Any of these competitors may have greater financial and other resources than we do. We may not be able to compete successfully in the future and our investments in research and development, sales and marketing, and support activities may be insufficient to enable us to maintain our competitive advantage. In addition, competitive pressures could lead to price erosion that could have a material adverse effect on our gross margins and operating results. We refer you to the section captioned “Competition,” appearing in Part I - Item 1 of this Annual Report on Form 10-K for further information regarding the competition that we face.
Implementation of our acquisition strategy may not be successful, which could affect our ability to increase our revenue or profitability and result in the impairment of acquired intangible assets.
We have in the past acquired, and will in the future consider the acquisition of, businesses and technologies in the machine vision industry. Our business may be negatively impacted by risks related to those acquisitions. These risks include, among others:
|
•
|
the inability to find or close attractive acquisition opportunities,
|
|
•
|
the diversion of management’s attention from other operational matters,
|
|
•
|
the inability to realize expected synergies resulting from the acquisition,
|
|
•
|
difficulties or delays in integrating the personnel, operations, technologies, products and systems of acquired businesses,
|
11
|
•
|
the failure to retain key customers or employees, and
|
|
•
|
the impairment of acquired intangible assets resulting from lower-than-expected cash flows from the acquired assets.
|
Acquisitions are inherently risky and the inability to effectively manage these risks could have a material adverse effect on our operating results.
We are at risk for impairment charges with respect to our investments or for acquired intangible assets or goodwill, which could have a material adverse effect on our results of operations.
As of December 31, 2017, our investment portfolio of debt securities totaled $721 million. These debt securities are reported at fair value, with unrealized gains and losses, net of tax, recorded in shareholders’ equity as other comprehensive income (loss) since these securities are designated as available-for-sale securities.
As of December 31, 2017, our portfolio of debt securities had a net unrealized loss of $58,000. Included in this net loss, were gross unrealized losses totaling $1,164,000, of which $837,000 were in a loss position for less than twelve months and $327,000 were in a loss position for greater than twelve months. As of December 31, 2017, these unrealized losses were determined to be temporary. However, if conditions change and future unrealized losses were determined to be other-than-temporary, we would be required to record an impairment charge.
Management monitors the carrying value of its debt securities compared to their fair value to determine whether an other-than-temporary impairment has occurred. In considering whether a decline in fair value is other-than-temporary, we consider many factors, both qualitative and quantitative. Management considers the type of security, the credit rating of the security, the length of time the security has been in a loss position, the size of the loss position, our ability and intent to hold the security to expected recovery of value, and other meaningful information. If a decline in fair value is determined to be other-than-temporary, an impairment charge would be recorded in current operations to reduce the carrying value of the investment to its fair value. Should the fair value of investments decline in future periods below their carrying value, management will need to determine whether this decline is other-than-temporary and future impairment charges may be required.
As of December 31, 2017, we had $113 million in acquired goodwill. The fair value of goodwill is susceptible to changes in the fair value of the reporting segment in which the goodwill resides, and therefore, a decline in our market capitalization or cash flows relative to our net book value may result in future impairment charges.
As of December 31, 2017, we had $13 million in acquired intangible assets, consisting primarily of acquired completed technologies and customer relationships. These assets are susceptible to changes in fair value due to a decrease in the historical or projected cash flows from the use of the asset, which may be negatively impacted by economic trends. A decline in the cash flows generated by these assets may result in future impairment charges.
If we determine that any of these investments, goodwill, or intangible assets is impaired, we would be required to take a related charge to earnings that could have a material adverse effect on our results of operations.
We may have additional tax liabilities, which could adversely affect our operating results and financial condition.
We are subject to income taxes in the United States, as well as numerous foreign jurisdictions. Significant judgment is required in determining our worldwide provision for income taxes. In the ordinary course of business, there are many transactions and calculations where the ultimate tax determination is uncertain. We are regularly under audit by tax authorities. Although we believe our tax positions are reasonable, the final determination of tax audits and any related litigation could be materially different than that which is reflected in our financial statements and could have a material adverse effect on our income tax provision, net income, or cash flows in the period in which the determination is made.
On December 22, 2017, the Tax Cuts and Jobs Act (the "Tax Act") was signed into law and, as a result, the U.S. federal statutory corporate tax rate was lowered from 35% to 21%. The Company has remeasured its deferred tax positions as of December 31, 2017 at the new enacted tax rate, and accordingly, has recognized tax expense of $12,523,000 from the write-down of deferred tax assets in 2017. The Tax Act also subjects unrepatriated foreign earnings to a one-time transition tax, for which the Company has recorded estimated tax expense of $101,379,000 in 2017. The Securities and Exchange Commission (SEC) released Staff Accounting Bulletin (SAB) No. 118 to provide guidance to companies on how to implement the accounting and disclosure changes required as a result of the Tax Act. The SEC staff guidance has recognized that, due to the complexity of the Tax Act, the accounting for this change in the law may be incomplete for income tax effects of the Tax Act upon issuance of a company's financial statements for the reporting period in which the Tax Act was enacted. SAB No. 118 states that if a company can determine a reasonable estimate for the effects of the Tax Act then this estimate can be included in the financial statements. The Company has made what it considers to be a reasonable estimate of the impact of the new taxes relating to foreign earnings and the write-down
12
of its deferred tax assets in its financial statements. This significant estimate is highly judgmental and changes to this estimate could result in material charges or credits in future reporting periods. U.S. Treasury regulations and administrative guidance have not been finalized as of the date of this Annual Report on Form 10-K. The issuance of final regulations may require the Company to revise its estimates of earnings and profits as well as certain deferred taxes as required.
The Company will continue to gather and analyze information on historical unrepatriated foreign earnings and to monitor state laws relating to this income to finalize both the federal and state tax impact. The Tax Act limits certain deductions and these limitations may impact the value of existing deferred tax assets. The Company will continue to review the impact of these limitations as regulatory guidance is issued.
None
In 1994, Cognex purchased and renovated a 100,000 square-foot building located in Natick, Massachusetts that serves as our corporate headquarters and is occupied by employees primarily in research, development, and engineering, manufacturing and quality assurance, and information technology, finance and administration functions. In 1997, Cognex completed construction of a 50,000 square-foot addition to this building.
In 1995, Cognex purchased an 83,000 square-foot office building adjacent to our corporate headquarters that is partially occupied by employees primarily in sales, marketing, service, and information technology functions. The remainder of this building is occupied by a tenant who has a lease agreement that expires in 2021.
In 1997, Cognex purchased a three and one-half acre parcel of land adjacent to our corporate headquarters. This land is being held for future expansion.
In 2007, Cognex purchased a 19,000 square-foot building adjacent to our corporate headquarters. A portion of this facility serves as the distribution center for customers in the Americas. The remainder of this building is occupied by a tenant who has a lease agreement that expires in 2022.
In 2014, Cognex purchased the 50,000 square foot building in Cork, Ireland where we had previously leased space for several years. This facility serves as the distribution center for customers outside of the Americas.
Cognex conducts certain of its operations in leased facilities. These lease agreements expire at various dates through 2024. Certain of these leases contain renewal options, retirement obligations, escalation clauses, rent holidays, and leasehold improvement incentives.
Various claims and legal proceedings generally incidental to the normal course of business are pending or threatened on behalf of or against the Company. While we cannot predict the outcome of these matters, we believe that any liability arising from them will not have a material adverse effect on our financial position, liquidity, or results of operations.
Not applicable.
The following table sets forth the names, ages, and titles of Cognex’s executive officers as of
December 31, 2017
:
|
Name
|
Age
|
Title
|
||
|
Robert J. Shillman
|
71
|
Chairman of the Board of Directors and Chief Culture Officer
|
||
|
Robert J. Willett
|
50
|
President and Chief Executive Officer
|
||
|
John J. Curran
|
51
|
Senior Vice President of Finance, Chief Financial Officer, and Treasurer
|
||
|
Sheila M. DiPalma
|
51
|
Senior Vice President of Corporate Employee Services
|
||
Executive officers are elected annually by the Board of Directors. There are no family relationships among the directors and executive officers of the Company.
Dr. Shillman and Mr. Willett have been employed by Cognex in their current positions for no less than the past five years.
13
Mr. Curran joined Cognex in 2016 after 21 years at EMC Corporation, a company that manages business involved in the transformation of information technology, where he most recently served as Senior Vice President and Corporate Controller. While at EMC, Mr. Curran also held leadership positions in corporate and international finance, and served as Interim CFO of Pivotal, Inc., a $200M subsidiary of EMC focusing on application and data infrastructure software, agile development services, and data science consulting. He holds a Bachelor of Science degree in Accounting and a Master of Business Administration from Babson College.
Ms. DiPalma joined Cognex in 1992 as Senior Reporting Accountant. She served for more than 20 years in a series of increasingly responsible roles in the Finance Department, including six years as Cognex Treasurer, before transitioning to Corporate Employee Services in 2016. Prior to joining Cognex, Ms. DiPalma was a member of the audit firm PricewaterhouseCoopers. She holds a Bachelor of Science degree in Accounting from Boston College, a Master of Science degree in Taxation from Bentley College, and is a Certified Public Accountant.
14
The Company’s common stock is traded on The NASDAQ Stock Market LLC, under the symbol CGNX. As of
January 28, 2018
, there were approximately 700 shareholders of record of the Company’s common stock. The Company believes the number of beneficial owners of the Company’s common stock on that date was substantially greater.
In October 2017, the Company's Board of Directors declared a two-for-one stock split of the Company's common stock, which was effected through a stock dividend distributed on December 1, 2017. All references made to share or per share amounts in the tables and narratives below have been restated to reflect the effect of this two-for-one stock split.
The high and low sales prices of the Company’s common stock as reported by the NASDAQ Stock Market for each quarter in
2017
and
2016
were as follows:
|
First
|
Second
|
Third
|
Fourth
|
||||||||||||
|
2017
|
|||||||||||||||
|
High
|
$
|
42.31
|
|
$
|
49.00
|
|
$
|
57.68
|
|
$
|
72.99
|
|
|||
|
Low
|
31.18
|
|
39.74
|
|
42.23
|
|
55.26
|
|
|||||||
|
2016
|
|||||||||||||||
|
High
|
$
|
20.79
|
|
$
|
22.62
|
|
$
|
26.73
|
|
$
|
32.98
|
|
|||
|
Low
|
14.01
|
|
17.58
|
|
20.97
|
|
24.84
|
|
|||||||
The Company’s Board of Directors declared and paid cash dividends for each quarter of 2017 and 2016 as follows:
|
First
|
Second
|
Third
|
Fourth
|
||||||||||||
|
2017
|
$
|
0.0375
|
|
$
|
0.0425
|
|
$
|
0.0425
|
|
$
|
0.0450
|
|
|||
|
2016
|
$
|
0.0350
|
|
$
|
0.0375
|
|
$
|
0.0375
|
|
$
|
0.0375
|
|
|||
Future dividends will be declared at the discretion of the Company's Board of Directors and will depend upon such factors as the Board deems relevant, including, among other things, the Company's ability to generate positive cash flow from operations.
In April 2017, the Company’s Board of Directors authorized the repurchase of $100,000,000 of the Company’s common stock. Purchases under this program began in the third quarter of 2017 when the prior program was completed. During the fourth quarter of 2017, the Company repurchased 365,000 shares at a cost of $24,368,000 under this program. The Company may repurchase shares under this program in future periods depending on a variety of factors, including, among other things, the impact of dilution from employee stock options, stock price, share availability, and cash requirements.
The following table sets forth information with respect to purchases by the Company of shares of its common stock during the fourth quarter of 2017:
|
Total Number of
Shares Purchased
|
Average
Price Paid
per Share
|
Total Number of
Shares Purchased as
Part of Publicly
Announced Plans or
Programs
|
Approximate Dollar
Value of Shares that
May Yet Be
Purchased Under the
Plans or Programs
|
|||||||||
|
October 2 - October 29, 2017
|
—
|
|
—
|
|
—
|
|
$
|
69,568,000
|
|
|||
|
October 30 - November 26, 2017
|
365,000
|
|
66.76
|
|
365,000
|
|
45,200,000
|
|
||||
|
November 27 - December 31, 2017
|
—
|
|
—
|
|
—
|
|
45,200,000
|
|
||||
|
Total
|
365,000
|
|
66.76
|
|
365,000
|
|
$
|
45,200,000
|
|
|||
In February 2018, the Company's Board of Directors authorized the repurchase of an additional $150,000,000 of common stock, which repurchases may commence once the Company completes the existing program and will be subject to market conditions and other relevant factors.
15
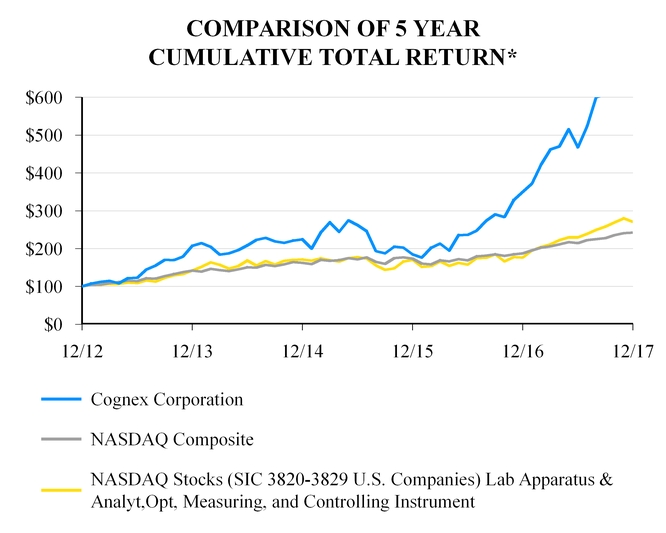
Set forth below is a line graph comparing the annual percentage change in the cumulative total shareholder return on the Company’s common stock, based upon the market price of the Company’s common stock, with the total return on companies within the Nasdaq Composite Index and the Research Data Group, Inc. Nasdaq Lab Apparatus & Analytical, Optical, Measuring & Controlling Instrument (SIC 3820-3829 US Companies) Index (the “Nasdaq Lab Apparatus Index”). The performance graph assumes an investment of $100 in each of the Company and the two indices, and the reinvestment of any dividends. The historical information set forth below is not necessarily indicative of future performance. Data for the Nasdaq Composite Index and the Nasdaq Lab Apparatus Index was provided to the Company by Research Data Group, Inc.
|
*$100 invested on 12/31/2012 in stock or index, including reinvestment of dividends. Fiscal year ended December 31.
|
|||||||||||||||||
|
12/12
|
12/13
|
12/14
|
12/15
|
12/16
|
12/17
|
||||||||||||
|
Cognex Corporation
|
100.00
|
|
207.56
|
|
224.68
|
|
184.56
|
|
349.89
|
|
674.36
|
|
|||||
|
NASDAQ Composite
|
100.00
|
|
141.63
|
|
162.09
|
|
173.33
|
|
187.19
|
|
242.29
|
|
|||||
|
NASDAQ Stocks
|
100.00
|
|
141.84
|
|
171.12
|
|
170.50
|
|
176.31
|
|
270.62
|
|
|||||
|
(SIC 3820-3829 U.S. Companies) Lab Apparatus & Analyt,Opt, Measuring, and Controlling Instrument
|
|||||||||||||||||
16
|
|
Year Ended December 31,
|
||||||||||||||||||
|
|
2017
|
2016
|
2015
|
2014
|
2013
|
||||||||||||||
|
|
(In thousands, except per share amounts)
|
||||||||||||||||||
|
Statement of Operations Data:
|
|||||||||||||||||||
|
Revenue
|
$
|
747,950
|
|
$
|
520,753
|
|
$
|
450,557
|
|
$
|
426,449
|
|
$
|
307,651
|
|
||||
|
Cost of revenue (1)
|
168,698
|
|
115,590
|
|
102,571
|
|
94,067
|
|
62,889
|
|
|||||||||
|
Gross margin
|
579,252
|
|
405,163
|
|
347,986
|
|
332,382
|
|
244,762
|
|
|||||||||
|
Research, development, and engineering expenses (1)
|
99,205
|
|
78,269
|
|
69,791
|
|
55,831
|
|
44,315
|
|
|||||||||
|
Selling, general, and administrative expenses (1)
|
220,728
|
|
166,110
|
|
156,674
|
|
148,699
|
|
123,509
|
|
|||||||||
|
Operating income
|
259,319
|
|
160,784
|
|
121,521
|
|
127,852
|
|
76,938
|
|
|||||||||
|
Non-operating income
|
7,603
|
|
8,011
|
|
5,441
|
|
3,904
|
|
1,518
|
|
|||||||||
|
Income from continuing operations before income tax expense
|
266,922
|
|
168,795
|
|
126,962
|
|
131,756
|
|
78,456
|
|
|||||||||
|
Income tax expense on continuing operations
|
89,744
|
|
18,968
|
|
19,298
|
|
20,915
|
|
11,273
|
|
|||||||||
|
Net income from continuing operations
|
177,178
|
|
149,827
|
|
107,664
|
|
110,841
|
|
67,183
|
|
|||||||||
|
Net income (loss) from discontinued operations (1)
|
—
|
|
(255
|
)
|
79,410
|
|
10,644
|
|
6,390
|
|
|||||||||
|
Net income
|
$
|
177,178
|
|
$
|
149,572
|
|
$
|
187,074
|
|
$
|
121,485
|
|
$
|
73,573
|
|
||||
|
Basic earnings per weighted-average common and common-equivalent share (2):
|
|||||||||||||||||||
|
Net income from continuing operations
|
$
|
1.02
|
|
$
|
0.88
|
|
$
|
0.62
|
|
$
|
0.64
|
|
$
|
0.39
|
|
||||
|
Net income (loss) from discontinued operations
|
$
|
—
|
|
$
|
—
|
|
$
|
0.46
|
|
$
|
0.06
|
|
$
|
0.03
|
|
||||
|
Net income
|
$
|
1.02
|
|
$
|
0.88
|
|
$
|
1.08
|
|
$
|
0.70
|
|
$
|
0.42
|
|
||||
|
Diluted earnings per weighted-average common and common-equivalent share (2):
|
|||||||||||||||||||
|
Net income from continuing operations
|
$
|
0.99
|
|
$
|
0.86
|
|
$
|
0.61
|
|
$
|
0.62
|
|
$
|
0.38
|
|
||||
|
Net income (loss) from discontinued operations
|
$
|
—
|
|
$
|
—
|
|
$
|
0.45
|
|
$
|
0.06
|
|
$
|
0.03
|
|
||||
|
Net income
|
$
|
0.99
|
|
$
|
0.86
|
|
$
|
1.06
|
|
$
|
0.68
|
|
$
|
0.41
|
|
||||
|
Weighted-average common and common-equivalent shares outstanding (2):
|
|||||||||||||||||||
|
Basic
|
173,287
|
|
170,676
|
|
172,592
|
|
173,716
|
|
173,892
|
|
|||||||||
|
Diluted
|
179,551
|
|
174,144
|
|
175,982
|
|
178,142
|
|
177,802
|
|
|||||||||
|
Cash dividends per common share (2)
|
$
|
0.17
|
|
$
|
0.15
|
|
$
|
0.11
|
|
$
|
—
|
|
$
|
—
|
|
||||
|
(1) Amounts include stock-based compensation expense, as follows:
|
|||||||||||||||||||
|
Cost of revenue
|
$
|
1,881
|
|
$
|
1,052
|
|
$
|
1,515
|
|
$
|
1,116
|
|
$
|
820
|
|
||||
|
Research, development, and engineering
|
11,022
|
|
6,271
|
|
5,194
|
|
3,709
|
|
2,502
|
|
|||||||||
|
Selling, general, and administrative
|
19,039
|
|
13,235
|
|
13,032
|
|
9,234
|
|
6,461
|
|
|||||||||
|
Discontinued operations
|
—
|
|
—
|
|
1,533
|
|
1,099
|
|
837
|
|
|||||||||
|
Total stock-based compensation expense
|
$
|
31,942
|
|
$
|
20,558
|
|
$
|
21,274
|
|
$
|
15,158
|
|
$
|
10,620
|
|
||||
|
(2) Prior period results have been adjusted to reflect the two-for-one stock split effected in the form of a stock dividend which occurred in 2017.
|
|||||||||||||||||||
|
|
December 31,
|
||||||||||||||||||
|
|
2017
|
2016
|
2015
|
2014
|
2013
|
||||||||||||||
|
|
(In thousands)
|
||||||||||||||||||
|
Balance Sheet Data:
|
|||||||||||||||||||
|
Working capital
|
$
|
517,036
|
|
$
|
460,571
|
|
$
|
390,806
|
|
$
|
182,252
|
|
$
|
270,549
|
|
||||
|
Total assets
|
1,287,870
|
|
1,038,604
|
|
887,756
|
|
821,734
|
|
709,699
|
|
|||||||||
|
Shareholders’ equity
|
1,095,353
|
|
962,599
|
|
825,667
|
|
736,437
|
|
643,912
|
|
|||||||||
17
FORWARD-LOOKING STATEMENTS
Certain statements made in this report, as well as oral statements made by the Company from time to time, constitute forward-looking statements within the meaning of Section 27A of the Securities Act of 1933, as amended, and Section 21E of the Securities Exchange Act of 1934, as amended. Readers can identify these forward-looking statements by our use of the words “expects,” “anticipates,” “estimates,” “believes,” “projects,” “intends,” “plans,” “will,” “may,” “shall,” “could,” “should,” and similar words and other statements of a similar sense. These statements are based upon our current estimates and expectations as to prospective events and circumstances, which may or may not be in our control and as to which there can be no firm assurances given. These forward-looking statements, which include statements regarding business and market trends, future financial performance, customer order rates, expected areas of growth, emerging markets, future product mix, research and development activities, investments, and strategic plans, involve known and unknown risks and uncertainties that could cause actual results to differ materially from those projected. Such risks and uncertainties include: (1) the loss of a large customer; (2) current and future conditions in the global economy; (3) the reliance on revenue from the consumer electronics or automotive industries; (4) the inability to penetrate new markets; (5) the inability to achieve significant international revenue; (6) fluctuations in foreign currency exchange rates and the use of derivative instruments; (7) information security breaches or business system disruptions; (8) the inability to attract and retain skilled employees; (9) the failure to effectively manage our growth; (10) the reliance upon key suppliers to manufacture and deliver critical components for our products; (11) the failure to effectively manage product transitions or accurately forecast customer demand; (12) the inability to design and manufacture high-quality products; (13) the technological obsolescence of current products and the inability to develop new products; (14) the failure to properly manage the distribution of products and services; (15) the inability to protect our proprietary technology and intellectual property; (16) our involvement in time-consuming and costly litigation; (17) the impact of competitive pressures; (18) the challenges in integrating and achieving expected results from acquired businesses; (19) potential impairment charges with respect to our investments or for acquired intangible assets or goodwill; and (20) exposure to additional tax liabilities. The foregoing list should not be construed as exhaustive and we encourage readers to refer to the detailed discussion of risk factors included in Part I - Item 1A of this Annual Report on Form 10-K. The Company cautions readers not to place undue reliance upon any such forward-looking statements, which speak only as of the date made. The Company disclaims any obligation to subsequently revise forward-looking statements to reflect the occurrence of anticipated or unanticipated events or circumstances after the date such statements are made.
EXECUTIVE OVERVIEW
Cognex Corporation is a leading worldwide provider of machine vision products that capture and analyze visual information in order to automate tasks, primarily in manufacturing processes, where vision is required. On July 6, 2015, the Company completed the sale of its Surface Inspection Systems Division (SISD) that specialized in machine vision products that inspect the surfaces of materials processed in a continuous fashion. The financial results of SISD are reported as a discontinued operation for all periods presented.
In addition to product revenue derived from the sale of machine vision products, the Company also generates revenue by providing maintenance and support, consulting, and training services to its customers; however, service revenue accounted for less than 10% of total revenue for all periods presented.
The Company’s customers are predominantly in the factory automation market. Factory automation customers purchase Cognex products and incorporate them into their manufacturing processes. Customers in the consumer electronics and automotive industries contribute the largest percentage to the Company's factory automation revenue. Virtually every manufacturer can achieve better quality and manufacturing efficiency by using machine vision, and therefore, this market also includes a broad base of customers across a variety of other industries, including consumer products, food and beverage, medical devices, and pharmaceuticals. Factory automation customers also purchase Cognex products for use outside of the manufacturing process, such as using ID products in logistics automation for package sorting and distribution. A small percentage of the Company’s customers are in the semiconductor and electronics capital equipment market. These customers purchase Cognex products and integrate them into the automation equipment that they manufacture and then sell to their customers to either make semiconductor chips or assemble printed circuit boards.
Revenue for the year ended December 31, 2017 totaled $747,950,000, representing an increase of 44% over 2016. Revenue increased from the prior year in all major regions across a variety of industries, including the consumer electronics, automotive, and logistics industries. Gross margin was 77% of revenue in 2017 compared to 78% of revenue in 2016 due primarily to higher revenue from a material customer with preferred pricing. Operating expenses increased by 31% from the prior year due principally to higher personnel-related costs from headcount additions,
18
incentive compensation plans, and stock-based compensation expense. The significant increase in revenue drove a 61% increase in operating income from the prior year, and an operating income margin that expanded to 35% of revenue in 2017 from 31% of revenue in 2016. Income tax expense in 2017 included a one-time transition tax on unrepatriated foreign earnings under the Tax Cuts and Jobs Act signed into law on December 22, 2017. As a result, net income increased by 18% from the prior year, and the net income margin was 24% of revenue in 2017 compared to 29% of revenue in 2016. Net income per diluted share increased to $0.99 in 2017 from $0.86 in 2016.
The following table sets forth certain consolidated financial data for continuing operations as a percentage of revenue:
|
|
Year Ended December 31,
|
|||||||
|
2017
|
2016
|
2015
|
||||||
|
Revenue
|
100
|
%
|
100
|
%
|
100
|
%
|
||
|
Cost of revenue
|
23
|
|
22
|
|
23
|
|
||
|
Gross margin
|
77
|
|
78
|
|
77
|
|
||
|
Research, development, and engineering expenses
|
13
|
|
15
|
|
15
|
|
||
|
Selling, general, and administrative expenses
|
29
|
|
32
|
|
35
|
|
||
|
Operating income
|
35
|
|
31
|
|
27
|
|
||
|
Non-operating income
|
1
|
|
1
|
|
1
|
|
||
|
Income from continuing operations before income tax expense
|
36
|
|
32
|
|
28
|
|
||
|
Income tax expense on continuing operations
|
12
|
|
3
|
|
4
|
|
||
|
Net income from continuing operations
|
24
|
%
|
29
|
%
|
24
|
%
|
||
RESULTS OF OPERATIONS
As foreign currency exchange rates are a factor in understanding period-to-period comparisons, we believe the presentation of results on a constant-currency basis in addition to reported results helps improve investors’ ability to understand our operating results and evaluate our performance in comparison to prior periods. We also use results on a constant-currency basis as one measure to evaluate our performance. Constant-currency information compares results between periods as if exchange rates had remained constant period-over-period. We generally refer to such amounts calculated on a constant-currency basis as excluding the impact of foreign currency exchange rate changes. Results on a constant-currency basis are not in accordance with accounting principles generally accepted in the United States of America (U.S. GAAP) and should be considered in addition to, and not as a substitute for, results prepared in accordance with U.S. GAAP.
Year Ended December 31, 2017 Compared to Year Ended December 31, 2016
Revenue
Revenue for the year ended December 31, 2017 increased by $227,197,000, or 44%, from the prior year. Changes in foreign currency exchange rates did not have a material impact on revenue. Revenue increased by 33% in the Americas, 40% in Europe, and 63% in Asia due to a higher volume of machine vision products sold in all regions. Although the increase in revenue came from a variety of industries, strong sales in the logistics industry was a large contributor to the growth in the Americas and strong sales in the consumer electronics industry was a large contributor to the growth in Europe and Asia.
Gross Margin
Gross margin as a percentage of revenue was 77% in 2017 compared to 78% in 2016. The decrease in gross margin was due primarily to higher revenue from a material customer in the consumer electronics industry under a preferred pricing arrangement, and to a lesser extent, an increased level of projects in the logistics industry that require installation services with lower margins. These decreases were partially offset by the favorable impact of material cost reductions and volume purchasing, as well as manufacturing efficiencies achieved from a higher revenue level as fixed manufacturing costs were spread over a larger revenue base.
Operating Expenses
Research, Development, and Engineering Expenses
Research, development, and engineering (RD&E) expenses in 2017 increased by $20,936,000, or 27%, from the prior year as detailed in the table below (in thousands).
19
|
RD&E expenses in 2016
|
$
|
78,269
|
|
|
Personnel-related costs
|
9,234
|
|
|
|
Stock-based compensation expense
|
4,725
|
|
|
|
Outsourced engineering costs
|
1,275
|
|
|
|
Other
|
5,702
|
|
|
|
RD&E expenses in 2017
|
$
|
99,205
|
|
RD&E expenses increased due to higher personnel-related costs resulting primarily from headcount additions, which included engineering talent from six business acquisitions completed since August 2016. The Company also incurred higher spending on outsourced engineering to support new product initiatives. Stock-based compensation expense was higher than the prior year due to a higher valuation of stock options granted early in 2017.
RD&E expenses as a percentage of revenue was 13% in 2017 compared to 15% in 2016. We believe that a continued commitment to RD&E activities is essential in order to maintain or achieve product leadership with our existing products and to provide innovative new product offerings, as well as to provide engineering support for large customers. In addition, we consider our ability to accelerate time to market for new products to be critical to our revenue growth. Therefore, we expect to continue to make significant RD&E investments in the future, and we target our annual RD&E spending to be between 10% and 15% of revenue. This percentage is impacted by revenue levels and investing cycles.
Selling, General, and Administrative Expenses
Selling, general, and administrative (SG&A) expenses in 2017 increased by $54,618,000, or 33%, from the prior year as detailed in the table below (in thousands).
|
SG&A expenses in 2016
|
$
|
166,110
|
|
|
Personnel-related costs
|
17,387
|
|
|
|
Incentive compensation plans
|
10,513
|
|
|
|
Stock-based compensation expense
|
5,752
|
|
|
|
Travel expenses
|
5,654
|
|
|
|
ERP outside services
|
3,684
|
|
|
|
Sales demonstration equipment
|
2,985
|
|
|
|
Recruiting costs
|
2,421
|
|
|
|
Other
|
6,222
|
|
|
|
SG&A expenses in 2017
|
$
|
220,728
|
|
SG&A expenses increased due to higher personnel-related and recruiting costs resulting from headcount additions, principally sales personnel. In addition, higher incentive compensation plan expenses, including sales commission and Company bonus plans, were recorded in 2017 as a result of the additional headcount and higher achievement levels based upon the Company's performance. Travel expenses and sales demonstration equipment costs were also higher in 2017 due to additional sales personnel and the higher business level. Stock-based compensation expense was higher than the prior year due to a higher valuation of stock options granted early in 2017.
In 2017, the Company incurred costs for outside services related to the preliminary project and application development stages for a new Enterprise Resource Planning (ERP) system, which is the management information system that integrates the Company's manufacturing, order fulfillment, and financial activities. As of the date of this report, we expect to place the new ERP system into service in the second quarter of 2018.
Non-operating Income (Expense)
The Company recorded foreign currency losses of $1,601,000 in 2017 and foreign currency gains of $101,000 in 2016. The foreign currency losses in 2017 resulted primarily from the revaluation and settlement of accounts receivable denominated in U.S. Dollars recorded on the books of the Company's Irish subsidiary, for which the functional currency is the Euro. During the period of time that these receivables were outstanding, the U.S. Dollar weakened versus the Euro resulting in foreign currency losses.
Investment income increased by $2,503,000, or 36%, from the prior year. The increase was due to higher yields, as well as additional funds available for investment on the Company's portfolio of debt securities.
The Company recorded other expense of $338,000 in 2017 and other income of $871,000 in 2016. Other income (expense) included a benefit of $28,000 in 2017 and a benefit of $463,000 in 2016 resulting from the revaluation of contingent consideration liabilities arising from business acquisitions. In addition, the Company received a foreign
20
government subsidy in the amount of $422,000 that was recorded in other income in 2016. Other income (expense) also included rental income, net of associated expenses, from leasing space in buildings adjacent to the Company’s corporate headquarters. Fewer tenants occupied this space in 2017, resulting in lower non-operating rental income.
Income Tax Expense
The Company’s effective tax rate was 34% of the Company’s pre-tax income in 2017 compared to 11% in 2016.
On December 22, 2017, the United States Congress passed and the President signed into law the Tax Cuts and Jobs Act of 2017 (the "Tax Act"). The Tax Act includes a number of changes that impact the Company's deferred tax positions, with the primary impact resulting from a decrease in the U.S. federal statutory corporate tax rate from 35% to 21%. The Company has remeasured its deferred tax positions as of December 31, 2017 at the new enacted tax rate, and accordingly, has recognized tax expense of $12,523,000 from the write-down of deferred tax assets in 2017.
In addition, the Tax Act subjects unrepatriated foreign earnings to a one-time transition tax, regardless of the Company's financial statement assertion related to indefinite reinvestment or whether the Company ultimately repatriates any of the foreign earnings, for which the Company has recorded estimated tax expense of $101,379,000 in 2017.
Furthermore, the Tax Act replaces the current system of taxing U.S. corporations on repatriated foreign earnings with a partial territorial system that provides a 100% dividends-received deduction to domestic corporations for foreign-source dividends received from 10% or more owned foreign corporations. The Company has recorded a decrease in tax expense of $3,843,000 in 2017 from the reversal of the tax effect of a 2016 dividend paid in 2017 from a wholly-owned foreign subsidiary to its domestic entity.
In addition to the 2017 impact of the Tax Act, the effective tax rate included a decrease in tax expense of $38,569,000 in 2017 and $11,889,000 in 2016 from the excess tax benefit arising from the difference between the deduction for tax purposes and the compensation cost recognized for financial reporting purposes from stock option exercises. The Company cannot predict the level of stock option exercises by employees in future periods.
Remaining discrete tax events resulted in a decrease in tax expense of $2,502,000 in 2017, consisting primarily of the final true-up of the prior year's tax accrual upon filing the actual tax returns and the expiration of the statutes of limitations for certain reserves for income tax uncertainties, and an increase in tax expense of $475,000 in 2016.
The majority of income earned outside of the United States is indefinitely reinvested to provide funds for international expansion. The Company is tax resident in numerous jurisdictions around the world and has identified its major tax jurisdictions as the United States, Ireland, and China. The statutory tax rate is 12.5% in Ireland and 25% in China. International rights to certain of the Company’s intellectual property are held by a subsidiary whose legal jurisdiction does not tax this income, resulting in a foreign effective tax rate lower than the above mentioned statutory rates. However, this income has been included in the provisional estimate of the one-time transitional tax on unrepatriated foreign earnings under the Tax Act. The Company has not yet determined how the Tax Act will impact its financial statement assertion related to indefinite reinvestment in future years.
Year Ended December 31, 2016 Compared to Year Ended December 31, 2015
Revenue
Revenue for the year ended December 31, 2016 increased by $70,196,000, or 16%, from the prior year. Changes in foreign currency exchange rates did not have a material impact on revenue. Revenue from factory automation customers increased by $70,737,000, or 17%, while revenue from semiconductor and electronics capital equipment manufacturers, which represented only 4% of revenue in 2016 and 5% of revenue in 2015, decreased by $541,000, or 2%, from the prior year.
The increase in factory automation revenue was due in part to higher revenue from a material customer in the consumer electronics industry. Revenue from all other factory automation customers increased from the prior year by 15% due to a higher volume of machine vision products sold. This increase from all other factory automation customers came from all major regions, including a 12% increase from customers based in the Americas, a 17% increase from customers based in Europe, and a 19% increase from customers based in Asia.
Gross Margin
Gross margin as a percentage of revenue was 78% in 2016 compared to 77% in 2015. The increase in gross margin was due primarily to the favorable impact of material cost reductions and volume purchasing, as well as manufacturing efficiencies achieved from a higher revenue level as fixed manufacturing costs were spread over a larger revenue base. These increases were partially offset by a trend toward higher hardware content in our product sales as we
21
move away from software-only solutions, higher inventory charges, and an increased level of projects in the logistics industry that require installation services with lower margins.
Operating Expenses
Research, Development, and Engineering Expenses
Research, development, and engineering (RD&E) expenses in 2016 increased by $8,478,000, or 12%, from the prior year as detailed in the table below (in thousands).
|
RD&E expenses in 2015
|
$
|
69,791
|
|
|
Personnel-related costs
|
3,615
|
|
|
|
Incentive compensation plans
|
3,014
|
|
|
|
Stock-based compensation expense
|
1,067
|
|
|
|
Other
|
782
|
|
|
|
RD&E expenses in 2016
|
$
|
78,269
|
|
RD&E expenses increased due to higher personnel-related costs resulting primarily from headcount additions to support new product initiatives and the higher business level. These headcount additions included engineering talent from four business acquisitions completed in the last few months of 2016 that are expected to help accelerate the development of future products. In addition, higher incentive compensation plan accruals were recorded in 2016 as a result of higher achievement levels based upon the Company's performance. Stock-based compensation expense was also higher than the prior year.
Selling, General, and Administrative Expenses
Selling, general, and administrative (SG&A) expenses in 2016 increased by $9,436,000, or 6%, from the prior year as detailed in the table below (in thousands).
|
SG&A expenses in 2015
|
$
|
156,674
|
|
|
Incentive compensation plans
|
6,388
|
|
|
|
Personnel-related costs
|
4,232
|
|
|
|
Sales demonstration equipment
|
1,159
|
|
|
|
Depreciation expense
|
1,500
|
|
|
|
Microscan legal fees and settlement
|
(5,023
|
)
|
|
|
Other
|
1,180
|
|
|
|
SG&A expenses in 2016
|
$
|
166,110
|
|
SG&A expenses increased due to higher incentive compensation plan accruals, including sales commission plans and bonus plans as a result of higher achievement levels based upon the Company's performance. In addition, personnel-related costs were higher in 2016 resulting from headcount additions, principally sales personnel. The Company also increased its spending on sales demonstration equipment related to new products and incurred higher depreciation expense related primarily to information technology and facilities investments. Offsetting these increases was the settlement of patent litigation actions with Microscan Systems, Inc. in 2015. The company recorded legal fees of $3,190,000 and a settlement expense of $1,833,000 related to these actions in 2015.
Non-operating Income (Expense)
The Company recorded foreign currency gains of $101,000 in 2016 and $1,122,000 in 2015. The foreign currency gains in each period resulted primarily from the revaluation and settlement of accounts receivable, accounts payable, and intercompany balances that are reported in one currency and collected in another.
Investment income increased by $3,365,000, or 92%, from the prior year. In 2016, the Company received $2,257,000 in cash distributions from its limited partnership investment, of which $942,000 was accounted for as a return of capital, reducing the carrying value of this investment to zero, with the remaining $1,315,000 recorded as investment income. Future distributions will be recorded as investment income as they occur. The remaining increase in investment income was due to increased funds available for investment, as well as higher yields on the Company's portfolio of debt securities.
The Company recorded other income of $871,000 in 2016 and $645,000 in 2015. Other income included a benefit of $463,000 in 2016 and $790,000 in 2015 resulting from a decrease in the fair value of the contingent consideration liability that arose from a 2015 business acquisition (refer to Note 20 to the Consolidated Financial Statements in Part II - Item 8 of this Annual Report on Form 10-K for further information). Other income also included a foreign government
22
subsidy of $422,000 in 2016 and $268,000 in 2015. In addition, other income (expense) included rental income, net of associated expenses, from leasing space in buildings adjacent to the Company’s corporate headquarters. Rental expenses declined from the prior year, while rental income was relatively flat.
Income Tax Expense
The Company’s effective tax rate was 11% of the Company’s pre-tax income in 2016 compared to 15% in 2015.
The effective tax rate for 2016 included a decrease in tax expense of $11,889,000 from the excess tax benefit arising from the difference between the deduction for tax purposes and the compensation cost recognized for financial reporting purposes from stock option exercises. In 2016, the Company adopted Accounting Standards Update 2016-09, "Improvements to Employee Share-Based Payment Accounting," which was issued by the Financial Accounting Standards Board in March 2016. This Update requires excess tax benefits to be recognized as income tax benefit in the income statement. Previous guidance required excess tax benefits to be recognized as additional paid-in-capital in shareholders' equity on the balance sheet. The effective tax rate for 2016 also included the impact of the following additional discrete tax events: (1) a decrease in tax expense of $893,000 from the expiration of the statutes of limitations for certain reserves for income tax uncertainties, (2) a decrease in tax expense of $439,000 from the final true-up of the prior-year's tax accrual upon filing the actual tax returns, (3) an increase in tax expense of $547,000 from a 5% withholding tax triggered by the movement of intellectual property purchased as part of a foreign business acquisition, and (4) an increase in tax expense of $1,260,000 from the write-off of a deferred tax asset related to foreign branches resulting from an IRS rule change.
The effective tax rate for 2015 included the impact of the following discrete tax events: (1) a decrease in tax expense of $1,105,000 from the final true-up of the prior year’s tax accrual upon filing the actual tax returns, (2) a decrease in tax expense of $975,000 from the expiration of statutes of limitations for certain reserves for income tax uncertainties, (3) a decrease in tax expense, net of reserves, of $910,000 from the retroactive application of the 2015 research and development tax credit passed by Congress in December 2015 and applied retroactively to January 1, 2015, and (4) an increase in tax expense of $65,000 from the write down of a deferred tax asset.
Excluding the impact of these discrete tax events, the Company’s effective tax rate was 18% in both 2016 and 2015. The majority of income earned outside of the United States is indefinitely reinvested to provide funds for international expansion. The Company is tax resident in numerous jurisdictions around the world and has identified its major tax jurisdictions as the United States, Ireland and China. The statutory tax rate is 12.5% in Ireland and 25% in China, compared to the U.S. federal statutory corporate tax rate of 35%. International rights to certain of the Company’s intellectual property are held by a subsidiary whose legal jurisdiction does not tax this income, resulting in a foreign effective tax rate lower than the above mentioned statutory rates.
Discontinued Operations
On July 6, 2015, the Company completed the sale of its Surface Inspection Systems Division (SISD) that specialized in machine vision products that inspect the surfaces of materials processed in a continuous fashion. The financial results of SISD are reported as a discontinued operation for all periods presented. Net loss from discontinued operations was $255,000 in 2016 compared to net income of $79,410,000 in 2015. Net income in 2015 included a gain on the sale of SISD, net of tax, of $78,182,000. Refer to Note 19 to the Consolidated Financial Statements in Part II - Item 8 of this Annual Report on Form 10-K for further information.
A binding arbitration was concluded in the second quarter of 2016 with respect to certain product performance claims made by an SISD customer, for which the Company remained responsible under the indemnity provisions of the sale transaction. In that proceeding, the tribunal ordered the Company to pay the customer approximately $326,000, primarily representing a refund of the product purchase price. The tribunal also ordered the customer to pay the Company approximately $45,000, primarily representing reimbursement of legal fees. The net settlement of $281,000 was recorded in discontinued operations in 2016, along with $123,000 of legal fees. The tax benefit related to this expense was $149,000, resulting in a net loss from discontinued operations of $255,000.
LIQUIDITY AND CAPITAL RESOURCES
The Company has historically been able to generate positive cash flow from operations, which has funded its operating activities and other cash requirements and has resulted in an accumulated cash and investment balance of $827,984,000 as of
December 31, 2017
. The Company has established guidelines relative to credit ratings, diversification, and maturities of its investments that maintain liquidity.
The Company’s cash requirements in 2017 were met with positive cash flows from operations, investment maturities, and the proceeds from stock option exercises. Cash requirements consisted of operating activities, investment purchases, the repurchase of common stock, the payment of dividends, cash paid for business acquisitions, and capital
23
expenditures. Working capital requirements included a significant increase in accounts receivable resulting from the higher business level and the timing of invoicing for a material customer, as well as a significant increase in inventories to support the higher business level and build safety stock in advance of the Company's Enterprise Resource Planning (ERP) system implementation and to mitigate the Company's exposure to significant increases in demand similar to what it experienced in 2017.
Capital expenditures in 2017 totaled $28,754,000 and consisted primarily of computer hardware and software (including the ERP system referred to in the subsequent paragraph), manufacturing test equipment related to new product introductions, and improvements made to the Company’s headquarters building in Natick, Massachusetts, and the Company's distribution center in Cork, Ireland.
In 2017, cash outflows related to the preliminary project and application development activities for a new ERP system totaled $10,814,000, consisting of $3,684,000 of external direct costs for outside services and $1,716,000 of internal personnel-related costs for employees assigned to this project, both of which were expensed, and $5,414,000 of capital expenditures. As of the date of this report, the Company expects the capitalized software to be placed into service in the second quarter of 2018.
The Tax Cuts and Jobs Act was signed into law on December 22, 2017, and as a result, the Company has recorded a one-time estimated transition tax on unrepatriated foreign earnings of $101,379,000 in 2017. The Company has offset this expense with net operating losses and tax prepayments resulting in a net estimated liability of $66,741,000, which is payable over eight years beginning in 2019.
The following table summarizes the Company’s material contractual obligations, both fixed and contingent (in thousands):
|
Year Ended December 31,
|
Inventory Purchase Commitments
|
Leases
|
Total
|
||||||||
|
2018
|
$
|
6,528
|
|
$
|
5,762
|
|
$
|
12,290
|
|
||
|
2019
|
—
|
|
4,087
|
|
4,087
|
|
|||||
|
2020
|
—
|
|
2,962
|
|
2,962
|
|
|||||
|
2021
|
—
|
|
2,371
|
|
2,371
|
|
|||||
|
2022
|
—
|
|
1,219
|
|
1,219
|
|
|||||
|
Thereafter
|
—
|
|
865
|
|
865
|
|
|||||
|
$
|
6,528
|
|
$
|
17,266
|
|
$
|
23,794
|
|
|||
In addition to the obligations described above, the following items may also result in future material uses of cash:
Stock Repurchases
In November 2015, the Company's Board of Directors authorized the repurchase of $100,000,000 of the Company's common stock. As of December 31, 2017, the Company repurchased 2,670,000 shares at a cost of $100,000,000 under this program, including 1,592,000 shares at a cost of $68,915,000 in 2017. Stock repurchases under this November 2015 program are now complete. In April 2017, the Company's Board of Directors authorized the repurchase of an additional $100,000,000 of the Company's common stock. As of December 31, 2017, the Company repurchased 941,000 shares at a cost of $54,800,000 under this program, leaving a remaining authorized balance of $45,200,000. Total stock repurchases in 2017 amounted to $123,715,000. The Company may repurchase shares under this program in future periods depending on a variety of factors, including, among other things, the impact of dilution from employee stock options, stock price, share availability, and cash requirements.
Dividends
The Company’s Board of Directors declared and paid cash dividends of $0.0375 per share in the first quarter of 2017, $0.0425 per share in the second and third quarters of 2017, and $0.0450 per share in the fourth quarter of 2017. Total cash dividends paid in 2017 amounted to $29,037,000. Future dividends will be declared at the discretion of the Company's Board of Directors and will depend upon such factors as the Board deems relevant, including, among other things, the Company's ability to generate positive cash flow from operations.
24
Acquisitions
The Company’s business strategy includes selective expansion into new machine vision markets and applications through the acquisition of businesses and technologies. The Company has completed seven business acquisitions since August 2015, none of which are significant individually or in the aggregate to the Company's financial positions or operating results. Certain of these acquisitions have contractual obligations for deferred cash payments, contingent cash payments tied to performance, and special incentive cash payments tied to employment, none of which are materially individually or in the aggregate to the Company's cash flows.
On April 4, 2017, the Company acquired all of the outstanding shares of ViDi Systems, S.A., a privately-held vision software company based in Switzerland. The total purchase price of $23,015,000 included cash payment of $20,019,000 in 2017, with the remaining $2,996,000, representing a holdback to secure potential claims under the agreement, expected to be paid in the fourth quarter of 2018.
On April 12, 2017, the Company acquired selected assets and assumed selected liabilities of GVi Ventures, Inc., a privately-held maker of pre-configured vision solutions for common automotive applications based in the United States. The total purchase price of $5,368,000 included cash payment of $4,069,000 in 2017 and contingent consideration, valued at $1,299,000 as of the acquisition date, to be paid out over five years. The undiscounted potential outcomes related to the contingent consideration range from $0 to $3,500,000. As of December 31, 2017, the fair value of the contingent consideration was $1,581,000.
The Company believes that its existing cash and investment balances, together with cash flow from operations, will be sufficient to meet its operating, investing, and financing activities for the next twelve months. As of December 31, 2017, the Company had $827,984,000 in cash and investments. In addition, Cognex has no long-term debt and does not anticipate needing debt financing in the near future. We believe that our strong cash position has put us in a relatively good position with respect to our longer-term liquidity needs.
OFF-BALANCE SHEET ARRANGEMENTS
As of
December 31, 2017
, the Company has no off-balance sheet arrangements as defined in Item 303(a)(4)(ii) of Regulation S-K.
CRITICAL ACCOUNTING POLICIES AND ESTIMATES
Our discussion and analysis of the Company’s financial condition and results of operations are based upon the consolidated financial statements included in this Annual Report on Form 10-K, which have been prepared in accordance with accounting principles generally accepted in the United States. The preparation of these financial statements requires management to make estimates and judgments that affect the reported amounts of assets, liabilities, revenue, and expenses, and related disclosure of contingent assets and liabilities. We base our estimates on historical experience and various other assumptions believed to be reasonable under the circumstances, the results of which form the basis for making judgments about the carrying values of assets and liabilities that are not readily apparent from other sources. Actual results could differ from these estimates under different assumptions or circumstances resulting in charges that could be material in future reporting periods. We believe the following critical accounting policies require the use of significant estimates and judgments in the preparation of our consolidated financial statements.
Revenue Recognition
The Company’s product revenue is derived from the sale of machine vision systems, which can take the form of hardware with embedded software or software-only, and related accessories. The Company also generates revenue by providing maintenance and support, consulting, and training services to its customers. Certain of the Company’s arrangements include multiple deliverables that provide the customer with a combination of products or services. In order to recognize revenue, the Company requires that a signed customer contract or purchase order is received, the fee from the arrangement is fixed or determinable, and collection of the resulting receivable is probable. Assuming that these criteria have been met, product revenue is generally recognized upon delivery, revenue from maintenance and support programs is recognized ratably over the program period, and revenue from consulting and training services is recognized when the services have been provided. When customer-specified acceptance criteria exist that are substantive, product revenue is deferred, along with associated incremental direct costs, until these criteria have been met and any remaining performance obligations are inconsequential or perfunctory.
25
For the majority of the Company's revenue transactions, revenue recognition and invoicing both occur upon delivery. In certain circumstances, however, the agreement with the customer provides for invoicing terms which differ from revenue recognition criteria, resulting in either deferred revenue or unbilled revenue. Invoicing that precedes revenue recognition is common for various customers in the logistics industry where milestone billings are prevalent, resulting in deferred revenue. Conversely, the Company records unbilled revenue in connection with a material customer in the consumer electronics industry. For this arrangement, the Company recognizes revenue for all delivered products when the first production line that incorporates these products is validated, because at that point the remaining performance obligations are inconsequential or perfunctory. Invoicing for all delivered products occurs as the production lines incorporating those products are installed over a period of several weeks. The Company also has a technical support obligation related to this arrangement for which revenue is deferred and recognized over the support period.
The majority of the Company’s product offerings consist of hardware with embedded software. Under the revenue recognition rules for tangible products, the fee from a multiple-deliverable arrangement is allocated to each of the deliverables based upon their relative selling prices as determined by a selling-price hierarchy. A deliverable in an arrangement qualifies as a separate unit of accounting if the delivered item has value to the customer on a stand-alone basis. A delivered item that does not qualify as a separate unit of accounting is combined with the other undelivered items in the arrangement and revenue is recognized for those combined deliverables as a single unit of accounting. The selling price used for each deliverable is based upon vendor-specific objective evidence (VSOE) if available, third-party evidence (TPE) if VSOE is not available, and management’s best estimate of selling price (BESP) if neither VSOE nor TPE are available. VSOE is the price charged for a deliverable when it is sold separately. TPE is the price of the Company’s or any competitor’s largely interchangeable products or services in stand-alone sales to similarly-situated customers. BESP is the price at which the Company would sell the deliverable if it were sold regularly on a stand-alone basis, considering market conditions and entity-specific factors.
The Company reports revenue for certain of its product accessory sales on a net basis, by reducing the gross sale amount by the related costs, when certain factors in the arrangement with the customer indicate that the Company is acting as an agent, rather than as a principal.
Management exercises judgment in connection with the determination of the amount of revenue to be recognized each period. Such judgments include, but are not limited to, determining whether separate contracts with the same customer that are entered into at or near the same time should be accounted for as a single arrangement, identifying the various elements in an arrangement, determining if delivered items have stand-alone value, determining the relative selling prices of the arrangement’s deliverables, determining whether options to buy additional products or services in the future are substantive and should be accounted for as a deliverable in the original arrangement, assessing whether the fee is fixed or determinable, determining the probability of collecting the receivable, determining whether customer-specified acceptance criteria are substantive in nature, determining whether remaining performance obligations are inconsequential or perfunctory, assessing whether vendor-specific objective evidence of fair value has been established for undelivered elements, and determining whether the Company is acting as a principal or an agent in an arrangement.
Investments
As of
December 31, 2017
, the Company’s investment portfolio of debt securities totaled $721,402,000. The debt securities are reported at fair value, with unrealized gains and losses, net of tax, recorded in shareholders’ equity as other comprehensive income (loss) since these securities are designated as available-for-sale securities. As of
December 31, 2017
, the Company’s portfolio of debt securities had a net unrealized loss of $58,000. Included in this net loss were gross unrealized losses totaling $1,164,000, of which $837,000 were in a loss position for less than twelve months and $327,000 were in a loss position for greater than twelve months.
The Company applies a three-level valuation hierarchy for fair value measurements. The categorization of assets and liabilities within the valuation hierarchy is based upon the lowest level of input that is significant to the measurement of fair value. Level 1 inputs to the valuation methodology utilize unadjusted quoted market prices in active markets for identical assets and liabilities. Level 2 inputs to the valuation methodology are other observable inputs, including quoted market prices for similar assets and liabilities, quoted prices for identical and similar assets and liabilities in markets that are not active, or other inputs that are observable or can be corroborated by observable market data. Level 3 inputs to the valuation methodology are unobservable inputs based upon management’s best estimate of the inputs that market participants would use in pricing the asset or liability at the measurement date, including assumptions about risk. Changes in the valuation methodology, interest rates, credit rates, or the market for these investments could result in changes to their fair values. Changes to the Level of an investment within the fair value hierarchy are determined at the end of the reporting period.
26
The Company’s debt securities are reported at fair value based upon model-driven valuations in which all significant inputs are observable or can be derived from or corroborated by observable market data for substantially the full term of the asset, and are therefore classified as Level 2. Management is responsible for estimating the fair value of these financial assets and liabilities, and in doing so, considers valuations provided by a large, third-party pricing service. This service maintains regular contact with market makers, brokers, dealers, and analysts to gather information on market movement, direction, trends, and other specific data. They use this information to structure yield curves for various types of debt securities and arrive at the daily valuations.
Management monitors the carrying value of its debt securities compared to their fair value to determine whether an other-than-temporary impairment has occurred. In considering whether a decline in fair value is other-than-temporary, we consider many factors, both qualitative and quantitative in nature, including the type of security, the credit rating of the security, the length of time the security has been in a loss position, the size of the loss position, our ability and intent to hold the security to expected recovery of value, and other meaningful information. If a decline in fair value is determined to be other-than-temporary, an impairment charge would be recorded in current operations to reduce the carrying value of the investment to its fair value. There were no other-than-temporary impairments of investments in 2017, 2016, or 2015.
Accounts Receivable
The Company maintains reserves against its accounts receivable for potential credit losses. Ongoing credit evaluations of customers are performed and the Company has historically not experienced significant losses related to the collection of its accounts receivable. Allowances for specific accounts determined to be at risk for collection are estimated by management taking into account the length of time the receivable has been outstanding, the customer’s current ability to pay its obligations to the Company, general economic and industry conditions, as well as various other factors. Global economic uncertainty may result in longer payment cycles and challenges in collecting accounts receivable balances, which make these estimates more judgmental. An adverse change in any of these factors could result in higher than expected customer defaults and may result in the need for additional bad debt provisions. As of
December 31, 2017
, the Company’s reserve against accounts receivable was $1,568,000, or 1% of the gross accounts receivable balance. A 10% difference in the reserve against accounts receivable as of
December 31, 2017
would have affected net income by approximately $144,000.
Inventories
Inventories are stated at the lower of cost and net realizable value. Net realizable value is the estimated selling price in the ordinary course of business, less readily predictable costs of completion, disposal, and transportation. Management estimates excess and obsolescence exposures based upon assumptions about future demand, product transitions, and market conditions, and records reserves to reduce the carrying value of inventories to their net realizable value. Volatility in the global economy makes these assumptions about future demand more judgmental. Among the risks associated with the introduction of new products are difficulty predicting customer demand and effectively managing inventory levels to ensure adequate supply of the new product and avoid excess supply of the legacy product. In addition, we may strategically enter into non-cancelable commitments with vendors to purchase materials for products in advance of demand to take advantage of favorable pricing or address concerns about the availability of future supplies and long lead times. As of
December 31, 2017
, the Company’s reserve for excess and obsolete inventory totaled $4,961,000, or 6% of the gross inventory balance. A 10% difference in inventory reserves as of
December 31, 2017
would have affected net income by approximately $456,000.
Long-lived Assets
The Company has long-lived assets, including property, plant, and equipment and acquired intangible assets. These assets are susceptible to shortened estimated useful lives and changes in fair value due to changes in their use, market or economic changes, or other events or circumstances. The Company evaluates the potential impairment of these long-lived assets whenever events or circumstances indicate their carrying value may not be recoverable. Factors that could trigger an impairment review include historical or projected results that are less than the assumptions used in the original valuation of an acquired asset, a change in the Company’s business strategy or its use of an acquired asset, or negative economic or industry trends.
If an event or circumstance indicates the carrying value of long-lived assets may not be recoverable, the Company assesses the recoverability of the assets by comparing the carrying value of the assets to the sum of the undiscounted future cash flows that the assets are expected to generate over their remaining economic lives. If the carrying value exceeds the sum of the undiscounted future cash flows, the Company compares the fair value of the long-lived assets to the carrying value and records an impairment loss for the difference. The Company generally estimates the fair value of its long-lived assets using the income approach based upon a discounted cash flow model. The income approach requires the use of many assumptions and estimates including future revenues and expenses, discount
27
factors, income tax rates, the identification of groups of assets with highly independent cash flows, and assets’ economic lives. Volatility in the global economy makes these assumptions and estimates more judgmental. No impairment losses were recorded in 2017, 2016, or 2015. Actual future operating results and the remaining economic lives of our long-lived assets could differ from those used in assessing the recoverability of these assets and could result in an impairment of long-lived assets in future periods.
Internal-use Software
The accounting treatment for computer software developed for internal use depends upon the nature of activities performed at each stage of development. The preliminary project stage includes conceptual formulation of design alternatives, determination of system requirements, vendor demonstrations, and final selection of vendors, and during this stage costs are expensed as incurred. The application development stage includes software configuration, coding, hardware installation, and testing. During this stage, certain costs are capitalized, including external direct costs of materials and services, as well as payroll and payroll-related costs for employees who are directly associated with the project, while certain costs are expensed as incurred, including training and data conversion costs. The post-implementation stage includes support and maintenance, and during this stage costs are expensed as incurred. Capitalization begins when both the preliminary project stage is completed and management commits to funding the project. Capitalization ceases at the point the project is substantially complete and ready for its intended use, that is, after all substantial testing is completed. The application of these rules requires the use of judgment to determine when the project has reached the next stage of development, which costs are directly associated with the project, and when the asset is ready for its intended use.
Goodwill
Management evaluates the potential impairment of goodwill annually each fourth quarter and whenever events or circumstances indicate their carrying value may not be recoverable. On July 6, 2015, the Company completed the sale of its Surface Inspection Systems Division (SISD). The Company had previously identified SISD, along with its Modular Vision Systems Division (MVSD), as reporting units for purposes of its goodwill impairment test. Given the disposition of SISD, management reviewed its reporting units and concluded that the Company now has one reporting unit
.
Determining the Company’s reporting units requires judgments regarding what constitutes a business and at what level discrete financial information is available and reviewed by management.
The Company performs a qualitative assessment of goodwill (commonly known as “step zero”) to determine whether further impairment testing is necessary. If this qualitative assessment indicates that it is more likely than not that the fair value of a reporting unit is less than its carrying amount, the entity would proceed to a two-step process. Step one compares the fair value of the reporting unit with its carrying value, including goodwill. If the carrying amount exceeds the fair value of the reporting unit, step two is required to measure the amount of impairment loss. Step two compares the implied fair value of the reporting unit goodwill to the carrying amount of the goodwill. The Company estimates the fair value of its reporting unit using the income approach based upon a discounted cash flow model. In addition, the Company uses the market approach, which compares the reporting unit to publicly-traded companies and transactions involving similar businesses, to support the conclusions based upon the income approach. The income approach requires the use of many assumptions and estimates including future revenues, expenses, capital expenditures, and working capital, as well as discount factors and income tax rates.
Factors that management considered in the qualitative assessment include macroeconomic conditions, industry and market considerations, overall financial performance (both current and projected), changes in management or strategy, changes in the composition or carrying amount of net assets, and market capitalization. Based on the qualitative assessment, management does not believe that it is more likely than not that the carrying value of its reporting unit exceeds its fair value. No impairment losses were recorded in 2017, 2016, or 2015.
Warranty Obligations
The Company records the estimated cost of fulfilling product warranties at the time of sale based upon historical costs to fulfill claims. Obligations may also be recorded subsequent to the time of sale whenever specific events or circumstances impacting product quality become known that would not have been taken into account using historical data. While we engage in extensive product quality programs and processes, including actively monitoring and evaluating the quality of our component suppliers and third-party contract manufacturers, the Company’s warranty obligation is affected by product failure rates, material usage, and service delivery costs incurred in correcting a product failure. An adverse change in any of these factors may result in the need for additional warranty provisions. As of
December 31, 2017
, the Company’s accrued warranty obligations amounted to $4,701,000. A 10% difference in accrued warranty obligations as of
December 31, 2017
would have affected net income by approximately $433,000.
28
Contingencies
Estimated losses from contingencies are accrued by management based upon whether a loss is probable and whether management has the ability to reasonably estimate the amount of the loss. Estimating potential losses, or even a range of losses, is difficult and involves a great deal of judgment. Management relies primarily on assessments made by its internal and external legal counsel to make the determination as to whether a loss contingency arising from litigation should be recorded or disclosed. This analysis is performed each reporting period or when facts and circumstances dictate. Should the resolution of a contingency result in a loss that we did not accrue because management did not believe that the loss was probable or capable of being reasonably estimated, then this loss would result in a charge to income in the period the contingency was resolved. The Company did not have any significant accrued contingencies as of December 31, 2017.
Derivative Instruments
In certain instances, the Company enters into forward contracts to hedge against foreign currency fluctuations. The Company's forward contracts are reported at fair value based upon model-driven valuations in which all significant inputs are observable or can be derived from or corroborated by observable market data for substantially the full term of the asset or liability, and are therefore classified as Level 2. The Company's forward contracts are typically traded or executed in over-the-counter markets with a relatively high degree of pricing transparency. The market participants are generally large commercial banks.
Currently, the Company enters into two types of hedges to manage foreign currency exchange rate risk. The first are economic hedges which utilize foreign currency forward contracts to manage the exposure to fluctuations in foreign currency exchange rates arising primarily from foreign-denominated receivables and payables. The gains and losses on these derivatives are intended to be offset by the changes in the fair value of the assets and liabilities being hedged. These economic hedges are not designated as effective hedges, and therefore, do not qualify for effective hedge accounting. The second are cash flow hedges which utilize foreign currency forward contracts to protect our budgeted revenues and expenses against foreign currency exchange rate changes compared to our budgeted rates. These cash flow hedges are designated for hedge accounting, and therefore, the effective portion of the forward contract's gain or loss is reported in shareholders' equity as other comprehensive income (loss) and is reclassified into current operations as the hedged transaction impacts current operations. Should these hedges fail to qualify for hedge accounting or be ineffective, the gain or loss on the forward contract would be reported in current operations immediately as opposed to when the hedged transaction impacts current operations. This may result in material foreign currency gains or losses.
Stock-Based Compensation
Compensation expense is recognized for all stock option and restricted stock grants. Determining the appropriate valuation model and estimating the fair values of these grants requires the input of subjective assumptions, including expected stock price volatility, dividend yields, expected term, and forfeiture rates. The expected volatility assumption is based partially upon the historical volatility of the Company’s common stock, which may or may not be a true indicator of future volatility, particularly as the Company continues to seek to diversify its customer base. The assumptions used in calculating the fair values of stock option grants represent management’s best estimates, but these estimates involve inherent uncertainties and the application of judgment. As a result, if factors change and different assumptions are used, stock-based compensation expense could be significantly different from what the Company recorded in the current period.
Income Taxes
Significant judgment is required in determining worldwide income tax expense based upon tax laws in the various jurisdictions in which the Company operates. The Company has established reserves for income taxes by applying the “more likely than not” criteria, under which the recognition threshold is met when an entity concludes that a tax position, based solely on its technical merits, is more likely than not to be sustained upon examination by the relevant tax authority. All tax positions are analyzed periodically and adjustments are made as events occur that warrant modification, such as the completion of audits or the expiration of statutes of limitations, which may result in future charges or credits to income tax expense.
As part of the process of preparing consolidated financial statements, management is required to estimate income taxes in each of the jurisdictions in which the Company operates. This process involves estimating the current tax liability, as well as assessing temporary differences arising from the different treatment of items for financial statement and tax purposes. These differences result in deferred tax assets and liabilities, which are recorded on the Consolidated Balance Sheets.
29
On December 22, 2017, the Tax Cuts and Jobs Act (the "Tax Act") was signed into law and, as a result, the U.S. federal statutory corporate tax rate was lowered from 35% to 21%. The Company has remeasured its deferred tax positions as of December 31, 2017 at the new enacted tax rate, and accordingly, has recognized tax expense of $12,523,000 from the write down of deferred tax assets in 2017. Management has evaluated the realizability of these remeasured deferred tax assets and has determined that it is more likely than not that the remeasured value of these assets will be realized, net of any valuation allowance. In reaching this conclusion, we have evaluated relevant criteria, including the Company’s historical profitability, current projections of future profitability, and the lives of tax credits, net operating and capital losses, and other carryforwards, certain of which have indefinite lives. Should the Company fail to generate sufficient pre-tax profits in future periods, we may be required to record further material adjustments to these deferred tax assets, resulting in additional charges to income in the period of determination.
The Tax Act also subjects unrepatriated foreign earnings to a one-time transition tax, for which the Company has recorded estimated tax expense of $101,379,000 in 2017. The Securities and Exchange Commission (SEC) released Staff Accounting Bulletin (SAB) No. 118 to provide guidance to companies on how to implement the accounting and disclosure changes required as a result of the Tax Act. The SEC staff guidance has recognized that, due to the complexity and timing of the release of the Tax Act, the accounting for this change in the law may be incomplete upon issuance of a company's financial statements for the reporting period in which the Tax Act was enacted. SAB No. 118 states that if a company can determine a reasonable estimate for the effects of the Tax Act then this estimate can be included in the financial statements. The Company has made what it considers to be a reasonable estimate of the impact of the new taxes relating to foreign earnings and the write-down of its deferred tax assets in its financial statements. This significant estimate is highly judgmental and changes to this estimate could result in material charges or credits in future reporting periods. U.S. Treasury regulations and administrative guidance have not been finalized as of the date of this Annual Report on Form 10-K. The issuance of final regulations may require the Company to revise its estimates of earnings and profits as well as certain deferred taxes as required.
The Company will continue to gather and analyze information on historical unrepatriated foreign earnings and to monitor state laws relating to this income to finalize both the federal and state tax impact. The Tax Act limits certain deductions and these limitations may impact the value of existing deferred tax assets. The Company will continue to review the impact of these limitations as regulatory guidance is issued.
Business Combinations
Business combinations are accounted for under the acquisition method of accounting. Determining what constitutes a business to qualify as a business combination requires some judgment. Allocating the purchase price requires the Company to identify and estimate the fair values of various assets acquired and liabilities assumed. Management is responsible for determining the appropriate valuation model and estimated fair values, and in doing so, considers a number of factors, including information provided by an outside valuation advisor. Management primarily establishes fair value using the income approach based upon a discounted cash flow model. The income approach requires the use of many assumptions and estimates including future revenues and expenses, as well as discount factors. Contingent consideration liabilities are reported at their estimated fair values based upon probability-adjusted present values of the consideration expected to be paid, using significant inputs and estimates. Key assumptions used in these estimates include probability assessments with respect to the likelihood of achieving certain milestones and discount rates consistent with the level of risk of achievement. The fair value of these contingent consideration liabilities are remeasured each reporting period, with changes in the fair value recorded in "Other income (expense)" on the Consolidated Statement of Operations. The remeasured liability amount could be significantly different from the amount at the acquisition date, resulting in material charges or credits in future reporting periods.
NEW PRONOUNCEMENTS
Refer to Part II, Item 8 - Note 2 within this Form 10-K, for a full description of recently issued accounting pronouncements including the expected dates of adoption and expected impact on the financial position and results of operations of the Company.
The Company is exposed to certain risks relating to its ongoing business operations, including foreign currency exchange rate risk and interest rate risk. The Company currently mitigates certain foreign currency exchange rate risks with derivative instruments. The Company does not currently manage its interest rate risk with derivative instruments.
30
Foreign Currency Risk
The Company faces exposure to foreign currency exchange rate fluctuations, as a significant portion of its revenues, expenses, assets, and liabilities are denominated in currencies other than the functional currencies of the Company’s subsidiaries or the reporting currency of the Company, which is the U.S. Dollar. In certain instances, we utilize forward contracts to hedge against foreign currency fluctuations. These contracts are used to minimize foreign gains or losses, as the gains or losses on the derivative are intended to offset the losses or gains on the underlying exposure. We do not engage in foreign currency speculation.
The Company’s foreign currency risk management strategy is principally designed to mitigate the potential financial impact of changes in the value of transactions and balances denominated in foreign currencies resulting from changes in foreign currency exchange rates. The Company enters into two types of hedges to manage this risk. The first are economic hedges which utilize foreign currency forward contracts with maturities of up to
45 days
to manage the exposure to fluctuations in foreign currency exchange rates arising primarily from foreign-denominated receivables and payables. The gains and losses on these derivatives are intended to be offset by the changes in the fair value of the assets and liabilities being hedged. The second are cash flow hedges which utilize foreign currency forward contracts with maturities of up to
18 months
to hedge specific forecasted transactions of the Company's foreign subsidiaries with the goal of protecting our budgeted revenues and expenses against foreign currency exchange rate changes compared to our budgeted rates.
The Company had the following outstanding forward contracts (in thousands):
|
December 31, 2017
|
December 31, 2016
|
||||||||||||||||||
|
Currency
|
Notional Value
|
USD Equivalent
|
High Rate
|
Low Rate
|
Notional Value
|
USD Equivalent
|
High Rate
|
Low Rate
|
|||||||||||
|
Derivatives Designated as Hedging Instruments:
|
|||||||||||||||||||
|
Japanese Yen
|
—
|
|
$
|
—
|
|
—
|
|
—
|
|
342,500
|
|
$
|
2,960
|
|
132.28
|
|
113.98
|
|
|
|
Hungarian Forint
|
—
|
|
—
|
|
—
|
|
—
|
|
39,000
|
|
130
|
|
316.62
|
|
316.13
|
|
|||
|
Singapore Dollar
|
—
|
|
—
|
|
—
|
|
—
|
|
150
|
|
97
|
|
1.6328
|
|
1.6293
|
|
|||
|
Derivatives Not Designated as Hedging Instruments:
|
|||||||||||||||||||
|
Japanese Yen
|
455,000
|
|
$
|
4,049
|
|
134.88
|
|
134.88
|
|
650,000
|
|
$
|
5,554
|
|
123.12
|
|
123.12
|
|
|
|
British Pound
|
1,650
|
|
2,232
|
|
0.8874
|
|
0.8874
|
|
1,350
|
|
1,658
|
|
0.8567
|
|
0.8567
|
|
|||
|
Korean Won
|
1,825,000
|
|
1,708
|
|
1,282
|
|
1,282
|
|
1,750,000
|
|
1,450
|
|
1,270
|
|
1,270
|
|
|||
|
Hungarian Forint
|
545,000
|
|
2,110
|
|
309.95
|
|
309.95
|
|
425,000
|
|
1,448
|
|
308.79
|
|
308.79
|
|
|||
|
Singapore Dollar
|
—
|
|
—
|
|
—
|
|
—
|
|
1,350
|
|
929
|
|
1.5287
|
|
1.5287
|
|
|||
|
Taiwanese Dollar
|
37,725
|
|
1,278
|
|
35.43
|
|
35.43
|
|
26,000
|
|
802
|
|
34.12
|
|
34.12
|
|
|||
|
Swiss Franc
|
1,365
|
|
1,401
|
|
0.9740
|
|
0.9740
|
|
—
|
|
—
|
|
—
|
|
—
|
|
|||
A change in foreign currency exchange rates could materially impact the fair value of these contracts; however, if this occurred, the fair value of the underlying exposures hedged by the contracts would change by a similar amount. Accordingly, management does not believe that a material change in foreign currency exchange rates used in the fair value of our derivative instruments would materially impact operations or cash flows.
The success of our foreign currency risk management program depends upon forecasts of transaction activity denominated in various currencies. To the extent that these forecasts are overstated or understated during periods of currency volatility, we could experience unanticipated foreign currency gains or losses that could have a material impact on our results of operations. Furthermore, our failure to identify new exposures and hedge them in an effective manner may result in material foreign currency gains or losses.
The Company’s functional currency/reporting currency exchange rate exposures result from revenues and expenses that are denominated in currencies other than the U.S. Dollar. A significant portion of our revenues and expenses are denominated in the Euro, the Japanese Yen, and the Chinese Yuan, also known as Renminbi. Our predominant currency of sale is the U.S. Dollar in the Americas, the Euro and U.S. Dollar in Europe, the Yuan in Mainland China, the Yen in Japan, and the U.S. Dollar in other regions. We estimate that approximately 39% of our sales in 2017 were invoiced in currencies other than the U.S. Dollar, and we expect sales denominated in foreign currencies to continue to represent a significant portion of our total revenue. While we also have expenses denominated in these same foreign currencies, the impact on revenues has historically been, and is expected to continue to be, greater than the
31
offsetting impact on expenses. Therefore, in times when the U.S. Dollar strengthens in relation to these foreign currencies, we would expect to report a net decrease in operating income. Conversely, in times when the U.S. Dollar weakens in relation to these foreign currencies, we would expect to report a net increase in operating income. Thus, changes in the relative strength of the U.S. Dollar may have a material impact on our operating results.
Interest Rate Risk
The Company’s investment portfolio of debt securities includes corporate bonds, treasury bills, asset-backed securities, agency bonds, sovereign bonds and municipal bonds. Debt securities with original maturities greater than three months are designated as available-for-sale and are reported at fair value. As of
December 31, 2017
, the fair value of the Company’s portfolio of debt securities amounted to $721,402,000 with amortized cost amounts totaling
$721,460,000
, maturities that do not exceed seven years, and a yield to maturity of 1.72%. Differences between
the fair value and principal amounts of the Company’s portfolio of debt securities are primarily attributable to discounts and premiums arising at the acquisition date, as well as unrealized gains and losses as of the balance sheet date.
Although it is the Company’s policy to invest in debt securities with effective maturities that do not exceed ten years, 89% of the investment portfolio as of
December 31, 2017
has effective maturity dates of less than three years. Given the relatively short maturities and investment-grade quality of the Company’s portfolio of debt securities as of
December 31, 2017
, a sharp rise in interest rates should not have a material adverse effect on the fair value of these instruments. As a result, the Company does not currently hedge these interest rate exposures.
The following table presents the hypothetical change in the fair value of the Company’s portfolio of debt securities arising from selected potential changes in interest rates (in thousands). This modeling technique measures the change in fair value that would result from a parallel shift in the yield curve plus or minus 50 and 100 basis points (BP) over a twelve-month time horizon.
|
Type of security
|
Valuation of securities given
an interest rate decrease
|
No change in
interest rates
|
Valuation of securities given
an interest rate increase
|
|||||||||||||||||
|
(100 BP)
|
|
(50 BP)
|
|
50 BP
|
|
100 BP
|
|
|||||||||||||
|
Corporate bonds
|
$
|
345,451
|
|
$
|
344,430
|
|
$
|
343,409
|
|
$
|
342,388
|
|
$
|
341,368
|
|
|||||
|
Treasury bills
|
174,869
|
|
174,349
|
|
173,830
|
|
173,310
|
|
172,790
|
|
||||||||||
|
Asset-backed securities
|
131,714
|
|
131,322
|
|
130,930
|
|
130,539
|
|
130,147
|
|
||||||||||
|
Sovereign bonds
|
34,934
|
|
34,830
|
|
34,726
|
|
34,622
|
|
34,518
|
|
||||||||||
|
Agency bonds
|
25,650
|
|
25,574
|
|
25,498
|
|
25,422
|
|
25,345
|
|
||||||||||
|
Municipal bonds
|
13,084
|
|
13,047
|
|
13,009
|
|
12,970
|
|
12,933
|
|
||||||||||
|
$
|
725,702
|
|
$
|
723,552
|
|
$
|
721,402
|
|
$
|
719,251
|
|
$
|
717,101
|
|
||||||
32
INDEX TO FINANCIAL STATEMENTS AND SUPPLEMENTARY DATA
|
Consolidated Financial Statements:
|
|
|
Financial Statement Schedule:
|
|
33
REPORT OF INDEPENDENT REGISTERED PUBLIC ACCOUNTING FIRM
Board of Directors and Shareholders
Cognex Corporation
Opinion on the financial statements
We have audited the accompanying consolidated balance sheets of Cognex Corporation (a Massachusetts corporation) and subsidiaries (the “Company”) as of
December 31, 2017
and
2016
, the related consolidated statements of operations, comprehensive income, cash flows, and shareholders’ equity for each of the three years in the period ended
December 31, 2017
, and the related notes (collectively referred to as the “financial statements”). In our opinion, the financial statements present fairly, in all material respects, the financial position of the Company as of
December 31, 2017
and
2016
, and the results of their operations and their cash flows for each of the three years in the period ended
December 31, 2017
, in conformity with accounting principles generally accepted in the United States of America.
We also have audited, in accordance with the standards of the Public Company Accounting Oversight Board (United States) (“PCAOB”), the Company’s internal control over financial reporting as of
December 31, 2017
, based on criteria established in the 2013
Internal Control-Integrated Framework
issued by the Committee of Sponsoring Organizations of the Treadway Commission (“COSO”), and our report dated
February 15, 2018
expressed an unqualified opinion.
Basis for opinion
These financial statements are the responsibility of the Company’s management. Our responsibility is to express an opinion on the Company’s financial statements based on our audits. We are a public accounting firm registered with the PCAOB and are required to be independent with respect to the Company in accordance with the U.S. federal securities laws and the applicable rules and regulations of the Securities and Exchange Commission and the PCAOB.
We conducted our audits in accordance with the standards of the PCAOB. Those standards require that we plan and perform the audit to obtain reasonable assurance about whether the financial statements are free of material misstatement, whether due to error or fraud. Our audits included performing procedures to assess the risks of material misstatement of the financial statements, whether due to error or fraud, and performing procedures that respond to those risks. Such procedures included examining, on a test basis, evidence supporting the amounts and disclosures in the financial statements. Our audits also included evaluating the accounting principles used and significant estimates made by management, as well as evaluating the overall presentation of the financial statements. We believe that our audits provide a reasonable basis for our opinion.
/s/ GRANT THORNTON LLP
We have served as the Company’s auditor since 2007.
Boston, Massachusetts
February 15, 2018
34
|
|
Year Ended December 31,
|
||||||||||
|
2017
|
2016
|
2015
|
|||||||||
|
|
(In thousands, except per share amounts)
|
||||||||||
|
Revenue
|
$
|
747,950
|
|
$
|
520,753
|
|
$
|
450,557
|
|
||
|
Cost of revenue
|
168,698
|
|
115,590
|
|
102,571
|
|
|||||
|
Gross margin
|
579,252
|
|
405,163
|
|
347,986
|
|
|||||
|
Research, development, and engineering expenses
|
99,205
|
|
78,269
|
|
69,791
|
|
|||||
|
Selling, general, and administrative expenses
|
220,728
|
|
166,110
|
|
156,674
|
|
|||||
|
Operating income
|
259,319
|
|
160,784
|
|
121,521
|
|
|||||
|
Foreign currency gain (loss)
|
(1,601
|
)
|
101
|
|
1,122
|
|
|||||
|
Investment income
|
9,542
|
|
7,039
|
|
3,674
|
|
|||||
|
Other income (expense)
|
(338
|
)
|
871
|
|
645
|
|
|||||
|
Income from continuing operations before income tax expense
|
266,922
|
|
168,795
|
|
126,962
|
|
|||||
|
Income tax expense on continuing operations
|
89,744
|
|
18,968
|
|
19,298
|
|
|||||
|
Net income from continuing operations
|
177,178
|
|
149,827
|
|
107,664
|
|
|||||
|
Net income (loss) from discontinued operations (Note 19)
|
—
|
|
(255
|
)
|
79,410
|
|
|||||
|
Net income
|
$
|
177,178
|
|
$
|
149,572
|
|
$
|
187,074
|
|
||
|
Basic earnings per weighted-average common and common-equivalent share (1):
|
|||||||||||
|
Net income from continuing operations
|
$
|
1.02
|
|
$
|
0.88
|
|
$
|
0.62
|
|
||
|
Net income (loss) from discontinued operations
|
$
|
—
|
|
$
|
—
|
|
$
|
0.46
|
|
||
|
Net income
|
$
|
1.02
|
|
$
|
0.88
|
|
$
|
1.08
|
|
||
|
Diluted earnings per weighted-average common and common-equivalent share (1):
|
|||||||||||
|
Net income from continuing operations
|
$
|
0.99
|
|
$
|
0.86
|
|
$
|
0.61
|
|
||
|
Net income (loss) from discontinued operations
|
$
|
—
|
|
$
|
—
|
|
$
|
0.45
|
|
||
|
Net income
|
$
|
0.99
|
|
$
|
0.86
|
|
$
|
1.06
|
|
||
|
Weighted-average common and common-equivalent shares outstanding (1):
|
|||||||||||
|
Basic
|
173,287
|
|
170,676
|
|
172,592
|
|
|||||
|
Diluted
|
179,551
|
|
174,144
|
|
175,982
|
|
|||||
|
Cash dividends per common share (1)
|
$
|
0.17
|
|
$
|
0.15
|
|
$
|
0.11
|
|
||
|
(1) Prior period results have been adjusted to reflect the two-for-one stock split effected in the form of a stock dividend which occurred in the fourth quarter of 2017.
|
|||||||||||
The accompanying notes are an integral part of these consolidated financial statements.
35
COGNEX CORPORATION – CONSOLIDATED STATEMENTS OF COMPREHENSIVE INCOME
|
|
Year Ended December 31,
|
||||||||||
|
2017
|
2016
|
2015
|
|||||||||
|
|
(In thousands)
|
||||||||||
|
Net income
|
$
|
177,178
|
|
$
|
149,572
|
|
$
|
187,074
|
|
||
|
Other comprehensive income (loss), net of tax:
|
|||||||||||
|
Cash flow hedges:
|
|||||||||||
|
Net unrealized gain (loss), net of tax of ($5), ($22), and $22 in 2017, 2016, and 2015, respectively
|
4
|
|
(567
|
)
|
(27
|
)
|
|||||
|
Reclassification of net realized (gain) loss into current operations
|
(41
|
)
|
398
|
|
201
|
|
|||||
|
Net change related to cash flow hedges
|
(37
|
)
|
(169
|
)
|
174
|
|
|||||
|
Available-for-sale investments:
|
|||||||||||
|
Net unrealized gain (loss), net of tax of $2, $248, and ($279) in 2017, 2016, and 2015, respectively
|
703
|
|
1,672
|
|
(939
|
)
|
|||||
|
Reclassification of net realized (gain) loss into current operations
|
(829
|
)
|
(191
|
)
|
(344
|
)
|
|||||
|
Net change related to available-for-sale investments
|
(126
|
)
|
1,481
|
|
(1,283
|
)
|
|||||
|
Foreign currency translation adjustments:
|
|||||||||||
|
Foreign currency translation adjustments, net of tax of $0, ($228) and ($711) in 2017, 2016, and 2015, respectively
|
21,992
|
|
(5,616
|
)
|
(11,616
|
)
|
|||||
|
Net change related to foreign currency translation adjustments
|
21,992
|
|
(5,616
|
)
|
(11,616
|
)
|
|||||
|
Other comprehensive income (loss), net of tax
|
21,829
|
|
(4,304
|
)
|
(12,725
|
)
|
|||||
|
Total comprehensive income
|
$
|
199,007
|
|
$
|
145,268
|
|
$
|
174,349
|
|
||
The accompanying notes are an integral part of these consolidated financial statements.
36
|
|
December 31,
|
||||||
|
2017
|
2016
|
||||||
|
|
(In thousands)
|
||||||
|
ASSETS
|
|||||||
|
Current assets:
|
|||||||
|
Cash and cash equivalents
|
$
|
106,582
|
|
$
|
79,641
|
|
|
|
Short-term investments
|
297,961
|
|
341,194
|
|
|||
|
Accounts receivable, less reserves of $1,568 and $873 in 2017 and 2016, respectively
|
119,388
|
|
55,438
|
|
|||
|
Unbilled revenue
|
7,454
|
|
2,217
|
|
|||
|
Inventories
|
67,923
|
|
26,984
|
|
|||
|
Prepaid expenses and other current assets
|
30,800
|
|
20,870
|
|
|||
|
Total current assets
|
630,108
|
|
526,344
|
|
|||
|
Long-term investments
|
423,441
|
|
324,335
|
|
|||
|
Property, plant, and equipment, net
|
78,048
|
|
53,992
|
|
|||
|
Goodwill
|
113,208
|
|
95,280
|
|
|||
|
Intangible assets, net
|
13,189
|
|
8,312
|
|
|||
|
Deferred income taxes
|
27,385
|
|
28,022
|
|
|||
|
Other assets
|
2,491
|
|
2,319
|
|
|||
|
Total assets
|
$
|
1,287,870
|
|
$
|
1,038,604
|
|
|
|
LIABILITIES AND SHAREHOLDERS’ EQUITY
|
|||||||
|
Current liabilities:
|
|||||||
|
Accounts payable
|
$
|
23,463
|
|
$
|
9,830
|
|
|
|
Accrued expenses
|
68,249
|
|
42,539
|
|
|||
|
Accrued income taxes
|
11,391
|
|
5,193
|
|
|||
|
Deferred revenue and customer deposits
|
9,969
|
|
8,211
|
|
|||
|
Total current liabilities
|
113,072
|
|
65,773
|
|
|||
|
Deferred income taxes
|
312
|
|
—
|
|
|||
|
Reserve for income taxes
|
6,488
|
|
5,361
|
|
|||
|
Accrued income taxes
|
66,741
|
|
—
|
|
|||
|
Other non-current liabilities
|
5,904
|
|
4,871
|
|
|||
|
Total liabilities
|
192,517
|
|
76,005
|
|
|||
|
Commitments and contingencies (Note 10)
|
|
|
|
|
|||
|
Shareholders’ equity (1):
|
|||||||
|
Common stock, $.002 par value – Authorized: 200,000 shares, issued and outstanding: 173,507 and 171,878 shares in 2017 and 2016, respectively
|
347
|
|
344
|
|
|||
|
Additional paid-in capital
|
461,338
|
|
374,847
|
|
|||
|
Retained earnings
|
668,267
|
|
643,836
|
|
|||
|
Accumulated other comprehensive loss, net of tax
|
(34,599
|
)
|
(56,428
|
)
|
|||
|
Total shareholders’ equity
|
1,095,353
|
|
962,599
|
|
|||
|
$
|
1,287,870
|
|
$
|
1,038,604
|
|
||
|
(1) Prior period amounts have been adjusted to reflect the two-for-one stock split effected in the form of a stock dividend which occurred in the fourth quarter of 2017.
|
|||||||
The accompanying notes are an integral part of these consolidated financial statements.
37
|
|
Year Ended December 31,
|
||||||||||
|
2017
|
2016
|
2015
|
|||||||||
|
|
(In thousands)
|
||||||||||
|
Cash flows from operating activities:
|
|||||||||||
|
Net income
|
$
|
177,178
|
|
$
|
149,572
|
|
$
|
187,074
|
|
||
|
Adjustments to reconcile net income to net cash provided by operating activities:
|
|||||||||||
|
(Gain) loss on sale of discontinued business
|
—
|
|
255
|
|
(78,182
|
)
|
|||||
|
Stock-based compensation expense
|
31,942
|
|
20,558
|
|
20,168
|
|
|||||
|
Depreciation of property, plant, and equipment
|
13,683
|
|
11,678
|
|
9,868
|
|
|||||
|
Amortization of intangible assets
|
3,308
|
|
3,391
|
|
4,250
|
|
|||||
|
Impairment of intangible assets
|
469
|
|
—
|
|
—
|
|
|||||
|
Amortization of discounts or premiums on investments
|
205
|
|
383
|
|
690
|
|
|||||
|
Realized (gain) loss on sale of investments
|
(829
|
)
|
(1,506
|
)
|
(344
|
)
|
|||||
|
Revaluation of contingent consideration
|
(28
|
)
|
(463
|
)
|
(790
|
)
|
|||||
|
Change in deferred income taxes
|
1,787
|
|
(1,908
|
)
|
(1,409
|
)
|
|||||
|
Changes in operating assets and liabilities:
|
|||||||||||
|
Accounts receivable
|
(55,185
|
)
|
(13,251
|
)
|
(3,950
|
)
|
|||||
|
Unbilled revenue
|
(4,604
|
)
|
(2,308
|
)
|
(242
|
)
|
|||||
|
Inventories
|
(37,088
|
)
|
10,409
|
|
(9,457
|
)
|
|||||
|
Accounts payable
|
12,322
|
|
2,087
|
|
(8,872
|
)
|
|||||
|
Accrued expenses
|
14,476
|
|
7,771
|
|
(2,831
|
)
|
|||||
|
Accrued income taxes
|
71,327
|
|
2,110
|
|
9,957
|
|
|||||
|
Deferred revenue and customer deposits
|
1,035
|
|
(3,188
|
)
|
1,527
|
|
|||||
|
Other
|
(5,675
|
)
|
(3,509
|
)
|
870
|
|
|||||
|
Net cash provided by operating activities
|
224,323
|
|
182,081
|
|
128,327
|
|
|||||
|
Cash flows from investing activities:
|
|||||||||||
|
Purchases of investments
|
(636,856
|
)
|
(751,868
|
)
|
(686,650
|
)
|
|||||
|
Maturities and sales of investments
|
584,464
|
|
657,250
|
|
601,441
|
|
|||||
|
Purchases of property, plant, and equipment
|
(28,754
|
)
|
(12,816
|
)
|
(18,228
|
)
|
|||||
|
Cash paid for acquisition of business, net of cash acquired
|
(24,118
|
)
|
(14,285
|
)
|
(1,023
|
)
|
|||||
|
Cash paid for purchased technology
|
—
|
|
—
|
|
(10,475
|
)
|
|||||
|
Net cash received (paid) from sale of discontinued business
|
(291
|
)
|
(113
|
)
|
104,388
|
|
|||||
|
Net cash used in investing activities
|
(105,555
|
)
|
(121,832
|
)
|
(10,547
|
)
|
|||||
|
Cash flows from financing activities:
|
|||||||||||
|
Issuance of common stock under stock plans
|
54,557
|
|
43,468
|
|
27,582
|
|
|||||
|
Repurchase of common stock
|
(123,715
|
)
|
(47,149
|
)
|
(126,351
|
)
|
|||||
|
Payment of dividends
|
(29,037
|
)
|
(25,213
|
)
|
(18,062
|
)
|
|||||
|
Payment of contingent consideration
|
(1,926
|
)
|
(337
|
)
|
—
|
|
|||||
|
Net cash used in financing activities
|
(100,121
|
)
|
(29,231
|
)
|
(116,831
|
)
|
|||||
|
Effect of foreign exchange rate changes on cash and cash equivalents
|
8,294
|
|
(3,352
|
)
|
(4,668
|
)
|
|||||
|
Net change in cash and cash equivalents
|
26,941
|
|
27,666
|
|
(3,719
|
)
|
|||||
|
Cash and cash equivalents at beginning of year
|
79,641
|
|
51,975
|
|
55,694
|
|
|||||
|
Cash and cash equivalents at end of year
|
$
|
106,582
|
|
$
|
79,641
|
|
$
|
51,975
|
|
||
|
Non-cash items related to discontinued operations:
|
|||||||||||
|
Stock-based compensation expense
|
$
|
—
|
|
$
|
—
|
|
$
|
1,533
|
|
||
|
Depreciation and amortization expense
|
—
|
|
—
|
|
566
|
|
|||||
|
Capital expenditures
|
—
|
|
—
|
|
482
|
|
|||||
The accompanying notes are an integral part of these consolidated financial statements.
38
COGNEX CORPORATION – CONSOLIDATED STATEMENTS OF SHAREHOLDERS’ EQUITY
|
|
Common Stock (1)
|
Additional
Paid-in
Capital (1)
|
Retained
Earnings (1)
|
Accumulated
Other
Comprehensive
Loss
|
Total
Shareholders’
Equity
|
||||||||||||||||||
|
(In thousands)
|
Shares
|
Par Value
|
|||||||||||||||||||||
|
Balance as of December 31, 2014
|
173,084
|
|
$
|
346
|
|
$
|
251,541
|
|
$
|
523,949
|
|
$
|
(39,399
|
)
|
$
|
736,437
|
|
||||||
|
Issuance of common stock under stock plans
|
3,040
|
|
6
|
|
27,576
|
|
—
|
|
—
|
|
27,582
|
|
|||||||||||
|
Repurchase of common stock
|
(6,412
|
)
|
(12
|
)
|
—
|
|
(126,339
|
)
|
—
|
|
(126,351
|
)
|
|||||||||||
|
Stock-based compensation expense
|
—
|
|
—
|
|
21,274
|
|
—
|
|
—
|
|
21,274
|
|
|||||||||||
|
Excess tax benefit from stock option exercises
|
—
|
|
—
|
|
9,964
|
|
—
|
|
—
|
|
9,964
|
|
|||||||||||
|
Tax benefit for research and development credits as a result of stock options
|
—
|
|
—
|
|
474
|
|
—
|
|
—
|
|
474
|
|
|||||||||||
|
Payment of dividends
|
—
|
|
—
|
|
—
|
|
(18,062
|
)
|
—
|
|
(18,062
|
)
|
|||||||||||
|
Net income
|
—
|
|
—
|
|
—
|
|
187,074
|
|
—
|
|
187,074
|
|
|||||||||||
|
Net unrealized loss on cash flow hedges, net of tax of $22
|
—
|
|
—
|
|
—
|
|
—
|
|
(27
|
)
|
(27
|
)
|
|||||||||||
|
Reclassification of net realized loss on cash flow hedges
|
—
|
|
—
|
|
—
|
|
—
|
|
201
|
|
201
|
|
|||||||||||
|
Net unrealized loss on available-for-sale investments, net of tax of ($279)
|
—
|
|
—
|
|
—
|
|
—
|
|
(939
|
)
|
(939
|
)
|
|||||||||||
|
Reclassification of net realized gain on the sale of available-for-sale investments
|
—
|
|
—
|
|
—
|
|
—
|
|
(344
|
)
|
(344
|
)
|
|||||||||||
|
Foreign currency translation adjustment, net of tax of ($711)
|
—
|
|
—
|
|
—
|
|
—
|
|
(11,616
|
)
|
(11,616
|
)
|
|||||||||||
|
Balance as of December 31, 2015
|
169,712
|
|
$
|
340
|
|
$
|
310,829
|
|
$
|
566,622
|
|
$
|
(52,124
|
)
|
$
|
825,667
|
|
||||||
|
Issuance of common stock under stock plans
|
3,954
|
|
8
|
|
43,460
|
|
—
|
|
—
|
|
43,468
|
|
|||||||||||
|
Repurchase of common stock
|
(1,788
|
)
|
(4
|
)
|
—
|
|
(47,145
|
)
|
—
|
|
(47,149
|
)
|
|||||||||||
|
Stock-based compensation expense
|
—
|
|
—
|
|
20,558
|
|
—
|
|
—
|
|
20,558
|
|
|||||||||||
|
Payment of dividends
|
—
|
|
—
|
|
—
|
|
(25,213
|
)
|
—
|
|
(25,213
|
)
|
|||||||||||
|
Net income
|
—
|
|
—
|
|
—
|
|
149,572
|
|
—
|
|
149,572
|
|
|||||||||||
|
Net unrealized loss on cash flow hedges, net of tax of ($22)
|
—
|
|
—
|
|
—
|
|
—
|
|
(567
|
)
|
(567
|
)
|
|||||||||||
|
Reclassification of net realized loss on cash flow hedges
|
—
|
|
—
|
|
—
|
|
—
|
|
398
|
|
398
|
|
|||||||||||
|
Net unrealized gain on available-for-sale investments, net of tax of $248
|
—
|
|
—
|
|
—
|
|
—
|
|
1,672
|
|
1,672
|
|
|||||||||||
|
Reclassification of net realized gain on the sale of available-for-sale investments
|
—
|
|
—
|
|
—
|
|
—
|
|
(191
|
)
|
(191
|
)
|
|||||||||||
|
Foreign currency translation adjustment, net of tax of ($228)
|
—
|
|
—
|
|
—
|
|
—
|
|
(5,616
|
)
|
(5,616
|
)
|
|||||||||||
|
Balance as of December 31, 2016
|
171,878
|
|
$
|
344
|
|
$
|
374,847
|
|
$
|
643,836
|
|
$
|
(56,428
|
)
|
$
|
962,599
|
|
||||||
|
Issuance of common stock under stock plans
|
4,162
|
|
8
|
|
54,549
|
|
—
|
|
—
|
|
54,557
|
|
|||||||||||
|
Repurchase of common stock
|
(2,533
|
)
|
(5
|
)
|
—
|
|
(123,710
|
)
|
—
|
|
(123,715
|
)
|
|||||||||||
|
Stock-based compensation expense
|
—
|
|
—
|
|
31,942
|
|
—
|
|
—
|
|
31,942
|
|
|||||||||||
|
Payment of dividends
|
—
|
|
—
|
|
—
|
|
(29,037
|
)
|
—
|
|
(29,037
|
)
|
|||||||||||
|
Net income
|
—
|
|
—
|
|
—
|
|
177,178
|
|
—
|
|
177,178
|
|
|||||||||||
|
Net unrealized gain on cash flow hedges, net of tax of ($5)
|
—
|
|
—
|
|
—
|
|
—
|
|
4
|
|
4
|
|
|||||||||||
|
Reclassification of net realized gain on cash flow hedges
|
—
|
|
—
|
|
—
|
|
—
|
|
(41
|
)
|
(41
|
)
|
|||||||||||
|
Net unrealized gain on available-for-sale investments, net of tax of $2
|
—
|
|
—
|
|
—
|
|
—
|
|
703
|
|
703
|
|
|||||||||||
|
Reclassification of net realized gain on the sale of available-for-sale investments
|
—
|
|
—
|
|
—
|
|
—
|
|
(829
|
)
|
(829
|
)
|
|||||||||||
|
Foreign currency translation adjustment, net of tax of $0
|
—
|
|
—
|
|
—
|
|
—
|
|
21,992
|
|
21,992
|
|
|||||||||||
|
Balance as of December 31, 2017
|
173,507
|
|
$
|
347
|
|
$
|
461,338
|
|
$
|
668,267
|
|
$
|
(34,599
|
)
|
$
|
1,095,353
|
|
||||||
|
(1) Prior period amounts have been adjusted to reflect the two-for-one stock split effected in the form of a stock dividend which occurred in the fourth quarter of 2017.
|
|||||||||||||||||||||||
The accompanying notes are an integral part of these consolidated financial statements.
39
The accompanying consolidated financial statements reflect the application of the significant accounting policies described below.
Nature of Operations
Cognex Corporation is a leading provider of machine vision products that capture and analyze visual information in order to automate tasks, primarily in manufacturing processes, where vision is required.
Use of Estimates in the Preparation of Financial Statements
The preparation of financial statements in conformity with accounting principles generally accepted in the United States of America (U.S. GAAP) requires management to make estimates and judgments that affect the reported amounts of assets and liabilities and the disclosure of contingent liabilities as of the balance sheet date, and the reported amounts of revenues and expenses during the year. Actual results could differ from those estimates. Significant estimates and judgments include those related to revenue recognition, investments, accounts receivable, inventories, long-lived assets, internal-use software, goodwill, warranty obligations, contingencies, derivative instruments, stock-based compensation, income taxes, and business combinations.
Basis of Consolidation
The consolidated financial statements include the accounts of Cognex Corporation and its subsidiaries, all of which are wholly-owned. All intercompany accounts and transactions have been eliminated.
Foreign Currency Translation
The financial statements of the Company’s foreign subsidiaries, where the local currency is the functional currency, are translated using exchange rates in effect at the end of the year for assets and liabilities and average exchange rates during the year for results of operations. The resulting foreign currency translation adjustment, net of tax, is recorded in shareholders’ equity as other comprehensive income (loss).
Fair Value Measurements
The Company applies a three-level valuation hierarchy for fair value measurements. The categorization of assets and liabilities within the valuation hierarchy is based upon the lowest level of input that is significant to the measurement of fair value. Level 1 inputs to the valuation methodology utilize unadjusted quoted market prices in active markets for identical assets and liabilities. Level 2 inputs to the valuation methodology are other observable inputs, including quoted market prices for similar assets and liabilities, quoted prices for identical and similar assets and liabilities in markets that are not active, or other inputs that are observable or can be corroborated by observable market data. Level 3 inputs to the valuation methodology are unobservable inputs based upon management’s best estimate of the inputs that market participants would use in pricing the asset or liability at the measurement date, including assumptions about risk. A change to the level of an asset or liability within the fair value hierarchy is determined at the end of a reporting period.
Cash, Cash Equivalents, and Investments
Money market instruments purchased with original maturities of three months or less are classified as cash equivalents and are stated at amortized cost. Debt securities with original maturities greater than three months and remaining maturities of one year or less are classified as short-term investments, as well as equity securities that the Company intends to sell within one year. Debt securities with remaining maturities greater than one year are classified as long-term investments. It is the Company’s policy to invest in debt securities with effective maturities that do not exceed
ten
years.
Debt securities with original maturities greater than three months are designated as available-for-sale and are reported at fair value, with unrealized gains and losses, net of tax, recorded in shareholders’ equity as other comprehensive income (loss). Equity securities that are held for short periods of time with the intention of selling them in the near term are designated as trading and are reported at fair value, with unrealized gains and losses recorded in current operations. Realized gains and losses are included in current operations, along with the amortization of the discount or premium on debt securities arising at acquisition, and are calculated using the specific identification method. The Company’s limited partnership interest is accounted for using the cost method because the Company’s investment is less than
5%
of the partnership and the Company has no influence over the partnership’s operating and financial
40
policies. The carrying value of this investment has been reduced to zero, and therefore, distributions are recorded as investment income as they occur.
Management monitors the carrying value of its investments in debt securities compared to their fair value to determine whether an other-than-temporary impairment has occurred. If the fair value of a debt security is less than its amortized cost, the Company assesses whether the impairment is other-than-temporary. In considering whether a decline in fair value is other-than-temporary, we consider many factors. In its evaluation of its debt securities, management considers the type of security, the credit rating of the security, the length of time the security has been in a loss position, the size of the loss position, our intent and ability to hold the security to expected recovery of value, and other meaningful information. An impairment is considered other-than-temporary if (i) the Company has the intent to sell the security, (ii) it is more likely than not that the Company will be required to sell the security before recovery of the entire amortized cost basis, or (iii) the Company does not expect to recover the entire amortized cost basis of the security. If impairment is considered other-than-temporary based upon condition (i) or (ii) described above, the entire difference between the amortized cost and the fair value of the security is recognized in current operations. If an impairment is considered other-than-temporary based upon condition (iii), the amount representing credit losses (defined as the difference between the present value of the cash flows expected to be collected and the amortized cost basis of the security) is recognized in current operations and the amount relating to all other factors is recognized in shareholders' equity as other comprehensive income (loss).
Accounts Receivable
The Company extends credit with various payment terms to customers based upon an evaluation of their financial condition. Accounts that are outstanding longer than the payment terms are considered to be past due. The Company establishes reserves against accounts receivable for potential credit losses and records bad debt expense in current operations when it determines receivables are at risk for collection based upon the length of time the receivable has been outstanding, the customer’s current ability to pay its obligations to the Company, general economic and industry conditions, as well as various other factors. Receivables are written off against these reserves in the period they are determined to be uncollectible and payments subsequently received on previously written-off receivables are recorded as a reversal of the bad debt expense.
Inventories
Inventories are stated at the lower of cost and net realizable value. Cost is determined using standard costs, which approximates actual costs under the first-in, first-out (FIFO) method. Net realizable value is the estimated selling prices in the ordinary course of business, less reasonably predictable costs of completion, disposal, and transportation.
The Company’s inventory is subject to rapid technological change or obsolescence. The Company reviews inventory quantities on hand and estimates excess and obsolescence exposures based upon assumptions about future demand, product transitions, and market conditions, and records reserves to reduce the carrying value of inventories to their net realizable value. If actual future demand is less than estimated, additional inventory write-downs would be required.
The Company generally disposes of obsolete inventory upon determination of obsolescence. The Company does not dispose of excess inventory immediately, due to the possibility that some of this inventory could be sold to customers as a result of differences between actual and forecasted demand. When inventory has been written down below cost, such reduced amount is considered the new cost basis for subsequent accounting purposes. As a result, the Company would recognize a higher than normal gross margin if the reserved inventory were subsequently sold.
Property, Plant, and Equipment
Property, plant, and equipment are stated at cost and depreciated using the straight-line method over the assets’ estimated useful lives. Buildings’ useful lives are
39
years, building improvements’ useful lives are
ten
years, and the useful lives of computer hardware and software, manufacturing test equipment, and furniture and fixtures range from
two
to
five
years. Leasehold improvements are depreciated over the shorter of the estimated useful lives or the remaining terms of the leases. Maintenance and repairs are expensed when incurred; additions and improvements are capitalized. Upon retirement or disposition, the cost and related accumulated depreciation of the disposed assets are removed from the accounts, with any resulting gain or loss included in current operations.
Internal-use Software
Internal-use software is software acquired, internally developed, or modified solely to meet the entity's internal needs, and during the software's development, no substantive plan exists to sell the software. The accounting treatment for computer software developed for internal use depends upon the nature of activities performed at each stage of
41
development. The preliminary project stage includes conceptual formulation of design alternatives, determination of system requirements, vendor demonstrations, and final selection of vendors, and during this stage costs are expensed as incurred. The application development stage includes software configuration, coding, hardware installation, and testing. During this stage, certain costs are capitalized, including external direct costs of materials and services, as well as payroll and payroll-related costs for employees who are directly associated with the project, while certain costs are expensed as incurred, including training and data conversion costs. The post-implementation stage includes support and maintenance, and during this stage costs are expensed as incurred.
Capitalization begins when both the preliminary project stage is completed and management commits to funding the project. Capitalization ceases at the point the project is substantially complete and ready for its intended use, that is, after all substantial testing is completed. Costs of specified upgrades and enhancements to internal-use software are capitalized if it is probable that those expenditures result in additional functionality. Capitalized costs are amortized on a straight line basis over the estimated useful life.
Goodwill
Goodwill is stated at cost. The Company evaluates the possible impairment of goodwill annually each fourth quarter and whenever events or circumstances indicate the carrying value of the goodwill may not be recoverable. For the past
seven
years, the Company has performed a qualitative assessment of goodwill (commonly known as “step zero”) to determine whether further impairment testing is necessary. Factors that management considers in this assessment include macroeconomic conditions, industry and market considerations, overall financial performance (both current and projected), changes in management or strategy, changes in the composition or carrying amount of net assets, and market capitalization. In addition, management takes into consideration the goodwill valuation under the last quantitative analysis that was performed. If this qualitative assessment indicates that it is more likely than not that the fair value of a reporting unit is less than its carrying amount, the entity would proceed to a two-step process. Step one compares the fair value of the reporting unit with its carrying value, including goodwill. If the carrying amount exceeds the fair value of the reporting unit, step two is required to measure the amount of impairment loss. Step two compares the implied fair value of the reporting unit goodwill to the carrying amount of the goodwill.
Intangible Assets
Intangible assets are stated at cost and amortized over the assets’ estimated useful lives. Intangible assets are either amortized in relation to the relative cash flows anticipated from the intangible asset or using the straight-line method, depending upon facts and circumstances. The useful lives of distribution networks range from
eleven
to
twelve
years, of completed technologies from
five
to
seven
years, of customer relationships from
five
to
eight
years, and of non-compete agreements
three
years. The Company evaluates the possible impairment of long-lived assets, including intangible assets, whenever events or circumstances indicate the carrying value of the assets may not be recoverable. At the occurrence of a certain event or change in circumstances, the Company evaluates the potential impairment of an asset by estimating the future undiscounted cash flows expected to result from the use and eventual disposition of the asset. If the sum of the estimated future cash flows is less than the carrying value, the Company determines the amount of such impairment by comparing the fair value of the asset to its carrying value. The fair value is based upon the present value of the estimated future cash flows using a discount rate commensurate with the risks involved.
Warranty Obligations
The Company warrants its products to be free from defects in material and workmanship for periods primarily ranging from
one
to
three
years from the time of sale based upon the product being purchased and the terms of the customer arrangement. Warranty obligations are evaluated and recorded at the time of sale since it is probable that customers will make claims under warranties related to products that have been sold and the amount of these claims can be reasonably estimated based upon historical costs to fulfill claims. Obligations may also be recorded subsequent to the time of sale whenever specific events or circumstances impacting product quality become known that would not have been taken into account using historical data.
Contingencies
Loss contingencies are accrued if the loss is probable and the amount of the loss can be reasonably estimated. Legal costs associated with potential loss contingencies, such as patent infringement matters, are expensed as incurred.
42
Revenue Recognition
The Company’s product revenue is derived from the sale of machine vision systems, which can take the form of hardware with embedded software or software-only, and related accessories. The Company also generates revenue by providing maintenance and support, consulting, and training services to its customers. Certain of the Company’s arrangements include multiple deliverables that provide the customer with a combination of products or services. In order to recognize revenue, the Company requires that a signed customer contract or purchase order is received, the fee from the arrangement is fixed or determinable, and collection of the resulting receivable is probable. Assuming that these criteria have been met, product revenue is generally recognized upon delivery, revenue from maintenance and support programs is recognized ratably over the program period, and revenue from consulting and training services is recognized when the services have been provided. When customer-specified acceptance criteria exists that are substantive, product revenue is deferred, along with associated incremental direct costs, until these criteria have been met and any remaining performance obligations are inconsequential or perfunctory.
For the majority of the Company’s revenue transactions, revenue recognition and invoicing both occur upon delivery. In certain circumstances, however, the agreement with the customer provides for invoicing terms which differ from revenue recognition criteria, resulting in either deferred revenue or unbilled revenue. Invoicing that precedes revenue recognition is common for various customers in the logistics industry where milestone billings are prevalent, resulting in deferred revenue. Conversely, the Company records unbilled revenue in connection with a material customer in the consumer electronics industry. For this arrangement, the Company recognizes revenue for all delivered products when the first production line that incorporates these products is validated, because at that point the remaining performance obligations are inconsequential or perfunctory. Invoicing for all delivered products occurs as the production lines incorporating those products are installed over a period of several weeks. The Company also has a technical support obligation related to this arrangement for which revenue is deferred and recognized over the support period.
The majority of the Company’s product offerings consist of hardware with embedded software. Under the revenue recognition rules for tangible products, the fee from a multiple-deliverable arrangement is allocated to each of the deliverables based upon their relative selling prices as determined by a selling-price hierarchy. A deliverable in an arrangement qualifies as a separate unit of accounting if the delivered item has value to the customer on a stand-alone basis. A delivered item that does not qualify as a separate unit of accounting is combined with the other undelivered items in the arrangement and revenue is recognized for those combined deliverables as a single unit of accounting. The selling price used for each deliverable is based upon vendor-specific objective evidence (VSOE) if available, third-party evidence (TPE) if VSOE is not available, and management’s best estimate of selling price (BESP) if neither VSOE nor TPE are available. VSOE is the price charged for a deliverable when it is sold separately. TPE is the price of the Company’s or any competitor’s largely interchangeable products or services in stand-alone sales to similarly-situated customers. BESP is the price at which the Company would sell the deliverable if it were sold regularly on a stand-alone basis, considering market conditions and entity-specific factors.
The selling prices used in the relative selling price allocation method for (1) certain of the Company’s services are based upon VSOE, (2) third-party accessories available from other vendors are based upon TPE, and (3) hardware products with embedded software, custom accessories, and services for which VSOE does not exist are based upon BESP. The Company does not believe TPE exists for these products and services because they are differentiated from competing products and services in terms of functionality and performance and there are no competing products or services that are largely interchangeable. BESP has been established for each product line within each region. Management establishes BESP with consideration for market conditions, such as the impact of competition and geographic considerations, and entity-specific factors, such as pricing practices, gross margin objectives, customer size, and market share goals. Management believes that BESP is reflective of reasonable pricing of that deliverable as if priced on a stand-alone basis.
Under the revenue recognition rules for software-only products, the fee from a multiple-deliverable arrangement is allocated to each of the undelivered elements based upon VSOE, which is limited to the price charged when the same deliverable is sold separately, with the residual value from the arrangement allocated to the delivered element. The portion of the fee that is allocated to each deliverable is then recognized as revenue when the criteria for revenue recognition are met with respect to that deliverable. If VSOE does not exist for all of the undelivered elements, then all revenue from the arrangement is typically deferred until all elements have been delivered to the customer.
The Company’s products are sold directly to end users, as well as to resellers including original equipment manufacturers (OEMs), distributors, and integrators. Revenue is recognized upon delivery of the product to the reseller, assuming all other revenue recognition criteria have been met. The Company establishes reserves against revenue for potential
43
product returns, since the amount of future returns can be reasonably estimated based upon experience. These reserves have historically been immaterial.
Certain customers are offered pricing discounts on current sales based upon purchasing volumes or preferred pricing arrangements, for which revenue is reported net of these discounts.
The Company reports revenue for certain of its product accessory sales on a net basis, by reducing the gross sale amount by the related costs, when certain factors in the arrangement with the customer indicate that the Company is acting as an agent, rather than as a principal.
Amounts billed to customers related to shipping and handling, as well as reimbursements received from customers for out-of-pocket expenses, are classified as revenue, with the associated costs included in cost of revenue.
Research and Development
Research and development costs for internally-developed or acquired products are expensed when incurred until technological feasibility has been established for the product. Thereafter, all software costs may be capitalized until the product is available for general release to customers. The Company determines technological feasibility at the time the product reaches beta in its stage of development. Historically, the time incurred between beta and general release to customers has been short, and therefore, the costs have been insignificant.
Advertising Costs
Advertising costs are expensed as incurred and totaled
$1,679,000
in
2017
,
$1,674,000
in
2016
, and
$2,009,000
in
2015
.
Stock-Based Compensation
The Company’s share-based payments that result in compensation expense consist of stock option grants and restricted stock awards. The Company has reserved a specific number of shares of its authorized but unissued shares for issuance upon the exercise of stock options or the granting of restricted stock. When a stock option is exercised or a restricted stock award is granted, the Company issues new shares from this pool. The fair values of stock options are estimated on the grant date using a binomial lattice model. Management is responsible for determining the appropriate valuation model and estimating these fair values, and in doing so, considers a number of factors, including information provided by an outside valuation advisor.
The Company recognizes compensation expense related to stock options using the graded attribution method, in which expense is recognized on a straight-line basis over the service period for each separately vesting portion of the stock option as if the option were, in substance, multiple awards. The amount of compensation expense recognized at the end of the vesting period is based upon the number of stock options for which the requisite service has been completed. No compensation expense is recognized for options that are forfeited for which the employee does not render the requisite service. The term “forfeitures” is distinct from “expirations” and represents only the unvested portion of the surrendered option. The Company applies estimated forfeiture rates to its unvested options to arrive at the amount of compensation expense that is expected to be recognized over the requisite service period. At the end of each separately vesting portion of an option, the expense that was recognized by applying the estimated forfeiture rate is compared to the expense that should be recognized based upon the employee’s service, and a credit to expense is recorded related to those employees that have not rendered the requisite service.
Taxes
The Company recognizes a tax position in its financial statements when that tax position, based solely upon its technical merits, is more likely than not to be sustained upon examination by the relevant taxing authority. Those tax positions failing to qualify for initial recognition are recognized in the first interim period in which they meet the more likely than not standard, or are resolved through negotiation or litigation with the taxing authority, or upon expiration of the statutes of limitations. Derecognition of a tax position that was previously recognized occurs when an entity subsequently determines that a tax position no longer meets the more likely than not threshold of being sustained.
Only the portion of the liability that is expected to be paid within one year is classified as a current liability. As a result, liabilities expected to be resolved without the payment of cash (e.g., resolution due to the expiration of the statutes of limitations) or are not expected to be paid within one year are not classified as current. It is the Company’s policy to record estimated interest and penalties as income tax expense and tax credits as a reduction in income tax expense.
Deferred tax assets and liabilities are determined based upon the differences between the financial statement and tax bases of assets and liabilities as measured by the enacted tax rates that will be in effect when these differences reverse.
44
Valuation allowances are provided if, based upon the weight of available evidence, it is more likely than not that some or all of the deferred tax assets will not be realized.
Sales tax in the United States and similar taxes in other jurisdictions that are collected from customers and remitted to government authorities are presented on a gross basis (i.e., a receivable from the customer with a corresponding payable to the government). Amounts collected from customers and retained by the Company during tax holidays are recognized as non-operating income when earned.
Net Income Per Share
Basic net income per share is computed by dividing net income available to common shareholders by the weighted-average number of common shares outstanding for the period. Diluted net income per share is computed by dividing net income available to common shareholders by the weighted-average number of common shares outstanding for the period plus potential dilutive common shares. Dilutive common equivalent shares consist of stock options and are calculated using the treasury stock method. Common equivalent shares do not qualify as participating securities. In periods where the Company records a net loss, potential common stock equivalents are not included in the calculation of diluted net loss per share.
Comprehensive Income
Comprehensive income is defined as the change in equity of a company during a period from transactions and other events and circumstances, excluding transactions resulting from investments by owners and distributions to owners. Accumulated other comprehensive loss, net of tax, as of December 31,
2017
and December 31,
2016
, consists of foreign currency translation adjustments of
$33,270,000
and
$55,262,000
, respectively; net unrealized losses on available-for-sale investments of
$58,000
and net unrealized gains on available-for-sale investments of
$68,000
, respectively; net unrealized gains on derivative instruments of $
0
and $
37,000
, respectively; and losses on currency swaps, net of gains on long-term intercompany loans of
$1,271,000
in each year.
Amounts reclassified from accumulated other comprehensive income to investment income on the Consolidated Statements of Operations were net realized gains of
$829,000
,
$191,000
, and
$344,000
for
2017
,
2016
, and
2015
, respectively.
Concentrations of Risk
Financial instruments that potentially subject the Company to concentrations of credit risk consist primarily of cash, cash equivalents, investments, and trade receivables. The Company has certain domestic and foreign cash balances that exceed the insured limits set by the Federal Deposit Insurance Corporation (FDIC) in the United States and equivalent regulatory agencies in foreign countries. The Company primarily invests in investment-grade debt securities and has established guidelines relative to credit ratings, diversification, and maturities of its debt securities that maintain safety and liquidity. The Company has not experienced any significant realized losses on its debt securities.
The Company performs ongoing credit evaluations of its customers and maintains allowances for potential credit losses. The Company has not experienced any significant losses related to the collection of its accounts receivable.
A significant portion of the Company's product is manufactured by a third-party contractor located in Indonesia. This contractor has agreed to provide Cognex with termination notification periods and last-time-buy rights, if and when that may be applicable. We rely upon this contractor to provide quality product and meet delivery schedules. We engage in extensive product quality programs and processes, including actively monitoring the performance of our third-party manufacturers; however, we may not detect all product quality issues through these programs and processes.
Certain components are presently sourced from a single vendor that is selected based on price and performance considerations. In the event of a supply disruption from a single-source vendor, these components may be purchased from alternative vendors, which may result in manufacturing delays based on the lead time of the new vendor. Certain key electronic and mechanical components that are purchased from strategic suppliers, such as processors or imagers, are fundamental to the design of Cognex products. A disruption in the supply of these key components, such as a last-time-buy announcement, natural disaster, financial bankruptcy, or other event, may require us to purchase a significant amount of inventory at unfavorable prices resulting in lower gross margins and higher risk of carrying excess inventory. If we are unable to secure adequate supply from alternative sources, we may have to redesign our products, which may lead to a delay in manufacturing and a possible loss of sales.
45
Derivative Instruments
Derivative instruments are recorded on the Consolidated Balance Sheets at fair value. Changes in the fair value of derivatives are recorded each period in current operations or in shareholders' equity as other comprehensive income (loss), depending upon whether the derivative is designated as a hedge transaction and, if it is, the effectiveness of the hedge. At the inception of the contract, the Company designates foreign currency forward exchange contracts as either a cash flow hedge of certain forecasted foreign currency denominated sales and purchase transactions or as an economic hedge. Changes in the fair value of a derivative that is highly effective and that is designated and qualifies as a cash flow hedge are recorded in shareholders' equity as other comprehensive income (loss), and reclassified into current operations in the same period during which the hedged transaction affects current operations and in the same financial statement line item as that of the forecasted transaction. Cash flow hedges are evaluated for effectiveness quarterly. Any hedge ineffectiveness (which represents the amount by which the changes in the fair value of the derivative exceed the variability in the cash flows of the forecasted transaction) is recorded in current operations in the period in which ineffectiveness is determined. Changes in the fair value of the Company’s economic hedges (not designated as a cash flow hedge) are reported in current operations. The cash flows from derivative instruments are presented in the same category on the Consolidated Statements of Cash Flows as the category for the cash flows from the hedged item. Generally, this accounting policy election results in cash flows related to derivative instruments being classified as an operating activity on the Consolidated Statements of Cash Flows.
The Company formally documents all relationships between hedging instruments and hedged items, as well as its risk-management objective and strategy for undertaking various hedge transactions. This process includes linking all derivatives that are designated as cash flow hedges to specific forecasted transactions. The Company also formally assesses (both at the hedge’s inception and on an ongoing basis) whether the derivatives that are used in hedging transactions have been highly effective in offsetting changes in the fair value or cash flows of hedged items and whether those derivatives may be expected to remain highly effective in future periods. When it is determined that a derivative is not (or has ceased to be) highly effective as a hedge, the Company discontinues hedge accounting prospectively, as discussed below.
The Company discontinues hedge accounting prospectively when (1) it determines that the derivative is no longer effective in offsetting changes in the cash flows of a hedged item; (2) the derivative expires or is sold, terminated, or exercised; (3) it is no longer probable that the forecasted transaction will occur; or (4) management determines that designating the derivative as a hedging instrument is no longer appropriate or desired. When the Company discontinues hedge accounting because it is no longer probable that the forecasted transaction will occur in the originally expected period, the gain or loss on the derivative remains in accumulated other comprehensive income (loss) and is reclassified into current operations when the forecasted transaction affects current operations. However, if it is probable that a forecasted transaction will not occur by the end of the originally specified time period or within an additional two-month period of time thereafter, the gain or loss that was accumulated in other comprehensive income (loss) is recognized immediately in current operations. In all situations in which hedge accounting is discontinued and the derivative remains outstanding, the Company carries the derivative at fair value on the Consolidated Balance Sheets, recognizing changes in the fair value in current operations, unless it is designated in a new hedging relationship.
The Company recognizes all derivative instruments as either current assets or current liabilities at fair value on the Consolidated Balance Sheets. When the Company is engaged in more than one outstanding derivative contract with the same counterparty and also has a legally enforceable master netting agreement with that counterparty, the “net” mark-to-market exposure represents the netting of the positive and negative exposures with that counterparty. Accordingly, cash flow hedges are presented net on the Consolidated Balance Sheets.
Business Combinations
The Company determines whether a transaction qualifies as a business combination by applying the definition of a business, which requires the assets acquired and liabilities assumed to be inputs and processes that have the ability to create outputs. The Company accounts for business combinations under the acquisition method of accounting, which requires the following steps: (1) identifying the acquirer, (2) determining the acquisition date, (3) recognizing and measuring the identifiable assets acquired and the liabilities assumed, and (4) recognizing and measuring goodwill. The Company measures the identifiable assets acquired and liabilities assumed at their estimated fair values as of the acquisition date. Management is responsible for determining the appropriate valuation model and estimated fair values, and in doing so, considers a number of factors, including information provided by an outside valuation advisor. Management primarily establishes fair value using the income approach based upon a discounted cash flow model. The income approach requires the use of many assumptions and estimates including future revenues and expenses, as well as discount factors. Contingent consideration liabilities are reported at their estimated fair values based upon
46
probability-adjusted present values of the consideration expected to be paid, using significant inputs and estimates. Key assumptions used in these estimates include probability assessments with respect to the likelihood of achieving certain milestones and discount rates consistent with the level of risk of achievement. The fair values of these contingent consideration liabilities are remeasured each reporting period with changes in fair value recorded in "Other income (expense)" on the Consolidated Statements of Operations. Goodwill is recognized as of the acquisition date as the excess of the consideration transferred over the net amount of assets acquired and liabilities assumed. Transaction costs are expensed as incurred.
47
Accounting Standards Update (ASU) 2014-09, “Revenue from Contracts with Customers”
The amendments in ASU 2014-09 will supersede and replace all currently existing U.S. GAAP, including industry-specific revenue recognition guidance, with a single, principle-based revenue recognition framework. The concept guiding this new model is that revenue recognition will depict transfer of control to the customer in an amount that reflects consideration to which an entity expects to be entitled. The core principles supporting this framework include (1) identifying the contract with a customer, (2) identifying separate performance obligations within the contract, (3) determining the transaction price, (4) allocating the transaction price to the performance obligations, and (5) recognizing revenue. This new framework will require entities to apply significantly more judgment. This increase in management judgment will require expanded disclosure on estimation methods, inputs, and assumptions for revenue recognition.
In March 2016, ASU 2016-08, "Principal versus Agent Considerations (Reporting Revenue Gross versus Net)," was issued, in April 2016, ASU 2016-10, "Identifying Performance Obligations and Licensing," was issued, in May 2016, ASU 2016-12, "Narrow-Scope Improvements and Practical Expedients," was issued, and in December 2016, ASU 2016-20, "Technical Corrections and Improvements," was issued. These Updates do not change the core principle of the guidance under ASU 2014-09, but rather provide implementation guidance. ASU 2015-14, "Deferral of the effective date," amended the effective date of ASU 2014-09 for public companies to annual reporting periods beginning after December 15, 2017. Early adoption was permitted, but only beginning after December 15, 2016. The Financial Accounting Standards Board may release additional implementation guidance in future periods.
We will adopt this standard using the full retrospective method to present all periods reported on a consistent basis. Upon adoption, revenue for software-only products sold as part of multiple-deliverable arrangements will no longer be deferred when vendor-specific objective evidence of fair value does not exist for undelivered elements of the arrangement. This change will likely result in earlier recognition of revenue. In addition, we expect certain of the Company’s product accessory sales, which are currently reported on a net basis, to be reported on a gross basis as a result of applying the expanded guidance in the new standard related to principal versus agent considerations. This change will result in the Company reporting higher revenue and higher cost of revenue when these sales are reported on a gross basis, although the gross margin dollars will not change. Furthermore, for arrangements that include customer-specified acceptance criteria, we expect to recognize revenue when we can objectively determine that control has been transferred to the customer in accordance with the agreed-upon specifications in the contract, which may occur before formal customer acceptance. This change will primarily impact revenue recognition for arrangements in the logistics industry where certain customer solutions include installed ID products and will likely result in earlier recognition of revenue.
The following table summarizes the impact of the new revenue standard in the Company’s revenue, cost of revenue, and gross margin for the years ended December 31, 2017, 2016, and 2015 (in thousands):
|
2017
|
2016
|
2015
|
|||||||||
|
Revenue as reported
|
$
|
747,950
|
|
$
|
520,753
|
|
$
|
450,557
|
|
||
|
Adjustment to revenue
|
18,133
|
|
8,762
|
|
20,434
|
|
|||||
|
Revenue as restated
|
$
|
766,083
|
|
$
|
529,515
|
|
$
|
470,991
|
|
||
|
Cost of revenue as reported
|
$
|
168,698
|
|
$
|
115,590
|
|
$
|
102,571
|
|
||
|
Adjustment to cost of revenue
|
18,591
|
|
15,480
|
|
20,514
|
|
|||||
|
Cost of revenue as restated
|
$
|
187,289
|
|
$
|
131,070
|
|
$
|
123,085
|
|
||
|
Gross margin as reported
|
$
|
579,252
|
|
$
|
405,163
|
|
$
|
347,986
|
|
||
|
Adjustment to gross margin
|
(458
|
)
|
(6,718
|
)
|
(80
|
)
|
|||||
|
Gross margin as restated
|
$
|
578,794
|
|
$
|
398,445
|
|
$
|
347,906
|
|
||
|
Gross margin percentage as reported
|
77
|
%
|
78
|
%
|
77
|
%
|
|||||
|
Adjustment to gross margin percentage
|
(1
|
)%
|
(3
|
)%
|
(3
|
)%
|
|||||
|
Gross margin percentage as restated
|
76
|
%
|
75
|
%
|
74
|
%
|
|||||
48
Accounting Standards Update (ASU) 2016-01, "Financial Instruments - Recognition and Measurement of Financial Assets and Financial Liabilities"
ASU 2016-01 provides guidance related to certain aspects of recognition, measurement, presentation, and disclosure of financial instruments. The amendments in this Update affect all entities that hold financial assets or owe financial liabilities. This ASU requires equity investments (except those accounted under the equity method) to be measured at fair value with changes in fair value recognized in net income. However, an entity may choose to measure equity investments that do not have readily determinable fair values at cost minus impairment. This ASU also eliminates the requirement for public companies to disclose the methods and significant assumptions used to estimate the fair value for financial instruments measured at amortized cost on the balance sheet, and it requires separate presentation of financial assets and financial liabilities by measurement category and form of financial asset on the balance sheet or the accompanying notes to the financial statements. For public companies, the guidance in ASU 2016-01 is effective for annual periods beginning after December 15, 2017, and interim periods within those annual periods. Early adoption is not permitted except for certain amendments in this Update. Management does not expect ASU 2016-01 to have a material impact on the Company's financial statements and disclosures.
Accounting Standards Update (ASU) 2016-02, "Leases"
ASU 2016-02 creates Topic 842, Leases. The objective of this Update is to increase transparency and comparability among organizations by recognizing lease assets and lease liabilities on the balance sheet, and disclosing key information about leasing arrangements. This ASU applies to any entity that enters into a lease, although lessees will see the most significant changes. The main difference between current U.S. GAAP and Topic 842 is the recognition of lease assets and lease liabilities on the balance sheet for those leases classified as operating leases under current U.S. GAAP. Topic 842 distinguishes between finance leases and operating leases, which are substantially similar to the classification criteria for distinguishing between capital leases and operating leases under current U.S. GAAP. For public companies, the guidance in ASU 2016-02 is effective for annual periods beginning after December 15, 2018, and interim periods within those annual periods. This ASU should be applied using a modified retrospective approach. Management is in the process of evaluating the impact of this Update.
Accounting Standards Update (ASU) 2016-13, "Financial Instruments - Measurement of Credit Losses"
ASU 2016-13 applies to all reporting entities holding financial assets that are not accounted for at fair value through net income (debt securities). The amendments in this Update eliminate the probable initial recognition threshold to recognize a credit loss under current U.S. GAAP and, instead, reflect an entity’s current estimate of all expected credit losses. In addition, this Update broadens the information an entity must consider in developing the credit loss estimate, including the use of reasonable and supportable forecasted information. The amendments in this Update require that credit losses on available-for-sale debt securities be presented as an allowance rather than as a write-down and an entity will be able to record reversals of credit losses in current period net income. For public companies, the guidance in ASU 2016-13 is effective for annual periods beginning after December 15, 2019, and interim periods within those annual periods. This ASU should be applied through a cumulative-effect adjustment to retained earnings as of the beginning of the first reporting period in which the guidance is effective. Management does not expect ASU 2016-13 to have a material impact on the Company's financial statements and disclosures.
Accounting Standards Update (ASU) 2016-16, "Income Taxes - Intra-Entity Transfers of Assets Other than Inventory"
ASU 2016-16 applies to all reporting entities with intra-entity transfers of assets other than inventory. The amendments in this Update allow the recognition of deferred income taxes for an intra-entity transfer of an asset other than inventory when the transfer occurs, as opposed to when the asset has been sold to an outside party under current U.S. GAAP. Two common examples of assets included in the scope of this Update are intellectual property and property, plant, and equipment. For public companies, the amendments in ASU 2016-16 are effective for annual reporting periods beginning after December 15, 2017, and interim reporting periods within those annual periods. Early adoption is permitted for all entities as of the beginning of an annual reporting period for which financial statements (interim or annual) have not been issued or made available for issuance. This ASU should be applied on a modified retrospective basis through a cumulative-effect adjustment directly to retained earnings as of the beginning of the period of adoption. Management does not expect ASU 2016-16 to have a material impact on the Company's financial statements and disclosures.
Accounting Standards Update (ASU) 2017-01, "Business Combinations - Clarifying the Definition of a Business"
ASU 2017-01 applies to all reporting entities that must determine whether they have acquired or sold a business. The amendments in this Update clarify the definition of a business with the objective of adding guidance to assist entities with evaluating whether transactions should be accounted for as acquisitions (or disposals) of assets or businesses.
49
For public companies, the amendments in ASU 2017-01 are effective for annual reporting periods beginning after December 15, 2017, and interim reporting periods within those annual periods. This ASU should be applied prospectively on or after the effective date and no disclosures are required at transition. Early adoption is permitted for transactions for which the acquisition date occurs before the issuance date or the effective date of the amendments in this Update, only when the transaction has not been reported in financial statements that have been issued. Management does not expect ASU 2017-01 to have a material impact on the Company's financial statements and disclosures.
Accounting Standards Update (ASU) 2017-04, "Intangibles - Goodwill and Other - Simplifying the Test for Goodwill Impairment"
ASU 2017-04 applies to all reporting entities that have goodwill reported in their financial statements. The amendments in this Update eliminate Step 2 from the goodwill impairment test reducing the cost and complexity of evaluating goodwill for impairment. In computing the implied fair value of goodwill under Step 2, an entity had to perform procedures to determine the fair value at the impairment date of its assets and liabilities as would be required in a business combination. Instead, under the amendments in this Update, an entity should perform its goodwill impairment test by comparing the fair value of a reporting unit with its carrying amount and recognize an impairment charge for the amount by which the carrying amount exceeds the reporting unit's fair value. For public companies, the amendments in ASU 2017-04 are effective for the annual or any interim goodwill impairment tests for reporting periods beginning after December 15, 2019. This ASU should be applied prospectively and an entity is required to disclose the nature of and reason for the change in accounting principle upon transition. Early adoption is permitted for interim or annual goodwill impairment tests performed on testing dates after January 1, 2017. Management does not expect ASU 2017-04 to have a material impact on the Company's financial statements and disclosures.
Accounting Standards Update (ASU) 2017-08, "Receivables - Nonrefundable Fees and Other Costs - Premium Amortization on Purchased Callable Debt Securities "
ASU 2017-08 applies to all reporting entities that hold investments in callable debt securities that have an amortized cost basis in excess of the amount that is repayable by the issuer at the earliest call date (that is, at a premium). The amendments in this Update shorten the amortization period for certain callable debt securities held at a premium. Specifically, the amendments require the premium to be amortized to the earliest call date. The amendments do not require an accounting change for securities held at a discount; the discount continues to be amortized to maturity. Under current GAAP, premiums and discounts on callable debt securities generally are amortized to the maturity date. If that callable debt security is subsequently called, the entity records a loss equal to the unamortized premium. The amendments in this Update more closely align the amortization period of premiums and discounts to expectations incorporated in market pricing on the underlying securities. For public companies, the amendments in ASU 2017-08 are effective for annual periods beginning after December 15, 2019 and interim reporting periods within annual years beginning after December 15, 2020. This ASU should be applied on a modified retrospective basis through a cumulative-effect adjustment directly to retained earnings as of the beginning of the period of adoption, and, in the period of adoption, the entity is required to provide disclosures about the change in accounting principle. Early adoption is permitted, including adoption in an interim period. Management is in the process of evaluating the impact of this Update.
50
Accounting Standards Update (ASU) 2017-09, "Compensation - Stock Compensation - Scope of Modification Accounting"
ASU 2017-09 applies to all reporting entities that change the terms or conditions of a share-based payment award.
Currently, the definition of the term modification is broad and its interpretation results in diversity in practice. The amendments in this Update provide guidance about which changes to the terms or conditions of a share-based payment award require an entity to apply modification accounting in Topic 718. An entity should account for the effects of a modification unless all the following are met: 1) the fair value of the modified award is the same as the fair value of the original award immediately before the original award is modified, 2) the vesting conditions of the modified award are the same as the vesting conditions of the original award immediately before the original award is modified, and 3) the classification of the modified award as an equity instrument or a liability instrument is the same as the classification of the original award immediately before the original award is modified. For public companies, the amendments in ASU 2017-09 are effective for annual reporting periods beginning after December 15, 2017, and interim reporting periods within those annual periods. Early adoption is permitted including adoption in an interim period, for reporting periods for which financial statements have not yet been issued. This ASU should be applied prospectively to an award modified on or after the adoption date. Management does not expect ASU 2017-09 to have a material impact on the Company's financial statements and disclosures.
Accounting Standards Update (ASU) 2017-12, "Derivatives and Hedging - Targeted Improvements to Accounting for Hedging Activities"
ASU 2017-12 applies to all reporting entities that elect to apply hedge accounting. The hedge accounting requirements under current GAAP sometimes do not permit an entity to properly recognize the economic results of the hedging strategy in the financial statements, and they are difficult to understand and interpret. The amendments in this Update make certain targeted improvements to simplify the application of the hedge accounting guidance. Also, they better align the risk management activities and financial reporting for hedging relationships through changes to both 1) the designation and measurement guidance for qualifying hedging relationships and 2) the presentation of hedge results. For public companies, the amendments in ASU 2017-12 are effective for annual reporting periods beginning after December 15, 2018, and interim reporting periods within those annual periods. Early adoption is permitted including adoption in any interim period after issuance of the Update. All transition requirements and elections should be applied to hedging relationships existing on the date of adoption. The entity should apply a cumulative-effect adjustment related to eliminating the separate measurement of ineffectiveness to accumulated other comprehensive income with a corresponding adjustment to the opening balance of retained earnings as of the beginning of the fiscal year that an entity adopts the amendments in this Update. The amended presentation and disclosure guidance is required only prospectively. Management is in the process of evaluating the impact of this Update.
51
Financial Assets and Liabilities that are Measured at Fair Value on a Recurring Basis
The following table summarizes the financial assets and liabilities measured at fair value on a recurring basis as of December 31,
2017
(in thousands):
|
Quoted Prices in
Active Markets
for Identical
Assets (Level 1)
|
Significant Other
Observable
Inputs (Level 2)
|
Unobservable Inputs (Level 3)
|
|||||||||
|
Assets:
|
|||||||||||
|
Money market instruments
|
$
|
8,631
|
|
$
|
—
|
|
$
|
—
|
|
||
|
Corporate bonds
|
—
|
|
343,409
|
|
—
|
|
|||||
|
Treasury bills
|
—
|
|
173,830
|
|
—
|
|
|||||
|
Asset-backed securities
|
—
|
|
130,930
|
|
—
|
|
|||||
|
Sovereign bonds
|
—
|
|
34,726
|
|
—
|
|
|||||
|
Agency bonds
|
—
|
|
25,498
|
|
—
|
|
|||||
|
Municipal bonds
|
—
|
|
13,009
|
|
—
|
|
|||||
|
Economic hedge forward contracts
|
—
|
|
16
|
|
—
|
|
|||||
|
Liabilities:
|
|||||||||||
|
Economic hedge forward contracts
|
—
|
|
13
|
|
—
|
|
|||||
|
Contingent consideration liabilities
|
—
|
|
—
|
|
3,557
|
|
|||||
The Company’s money market instruments are reported at fair value based upon the daily market price for identical assets in active markets, and are therefore classified as Level 1.
The Company’s debt securities and forward contracts are reported at fair value based upon model-driven valuations in which all significant inputs are observable or can be derived from or corroborated by observable market data for substantially the full term of the asset or liability, and are therefore classified as Level 2. Management is responsible for estimating the fair value of these financial assets and liabilities, and in doing so, considers valuations provided by a large, third-party pricing service. For debt securities, this service maintains regular contact with market makers, brokers, dealers, and analysts to gather information on market movement, direction, trends, and other specific data. They use this information to structure yield curves for various types of debt securities and arrive at the daily valuations. The Company's forward contracts are typically traded or executed in over-the-counter markets with a high degree of pricing transparency. The market participants are generally large commercial banks.
The Company did not record an other-than-temporary impairment of these financial assets in
2017
,
2016
, or
2015
.
The Company's contingent consideration liabilities are reported at fair value based upon probability-adjusted present values of the consideration expected to be paid, using significant inputs that are not observable in the market, and are therefore classified as Level 3. Key assumptions used in these estimates include probability assessments with respect to the likelihood of achieving certain revenue milestones. The fair values of these contingent consideration liabilities were calculated using discount rates consistent with the level of risk of achievement, and are remeasured each reporting period with changes in fair value recorded in "Other income (expense)" on the Consolidated Statements of Operations.
52
The following table summarizes the activity for the Company's liabilities measured at fair value using Level 3 inputs (in thousands):
|
Balance as of December 31, 2015
|
$
|
3,000
|
|
|
Payment of Manatee contingent consideration
|
(337
|
)
|
|
|
Fair value adjustment to Manatee contingent consideration
|
(463
|
)
|
|
|
Contingent consideration resulting from EnShape acquisition
|
1,362
|
|
|
|
Contingent consideration resulting from Chiaro acquisition
|
611
|
|
|
|
Balance as of December 31, 2016
|
4,173
|
|
|
|
Payment of EnShape contingent consideration
|
(1,401
|
)
|
|
|
Payment of Manatee contingent consideration
|
(525
|
)
|
|
|
Contingent consideration resulting from GVi acquisition
|
1,299
|
|
|
|
Fair value adjustment to Manatee contingent consideration
|
(325
|
)
|
|
|
Fair value adjustment to Chiaro contingent consideration
|
15
|
|
|
|
Fair value adjustment to GVi contingent consideration
|
282
|
|
|
|
Foreign exchange rate changes
|
39
|
|
|
|
Balance as of December 31, 2017
|
$
|
3,557
|
|
Refer to Note 20 to the Consolidated Financial Statements for further information regarding acquisitions.
Non-financial Assets that are Measured at Fair Value on a Non-recurring Basis
Non-financial assets such as property, plant, and equipment, goodwill, and intangible assets are required to be measured at fair value only when an impairment loss is recognized. The Company did not record an impairment charge related to these assets in
2017
,
2016
, or
2015
.
Cash, cash equivalents, and investments consisted of the following (in thousands):
|
|
December 31,
|
||||||
|
|
2017
|
2016
|
|||||
|
Cash
|
$
|
97,951
|
|
$
|
77,307
|
|
|
|
Money market instruments
|
8,631
|
|
2,334
|
|
|||
|
Cash and cash equivalents
|
106,582
|
|
79,641
|
|
|||
|
Treasury bills
|
150,371
|
|
67,175
|
|
|||
|
Asset-backed securities
|
59,203
|
|
69,614
|
|
|||
|
Corporate bonds
|
47,395
|
|
141,188
|
|
|||
|
Sovereign bonds
|
21,579
|
|
7,298
|
|
|||
|
Agency bonds
|
10,608
|
|
2,903
|
|
|||
|
Municipal bonds
|
8,805
|
|
6,517
|
|
|||
|
Euro liquidity fund
|
—
|
|
46,499
|
|
|||
|
Short-term investments
|
297,961
|
|
341,194
|
|
|||
|
Corporate bonds
|
296,014
|
|
169,952
|
|
|||
|
Asset-backed securities
|
71,727
|
|
26,946
|
|
|||
|
Treasury bills
|
23,459
|
|
92,280
|
|
|||
|
Agency bonds
|
14,890
|
|
10,339
|
|
|||
|
Sovereign bonds
|
13,147
|
|
23,585
|
|
|||
|
Municipal bonds
|
4,204
|
|
1,233
|
|
|||
|
Long-term investments
|
423,441
|
|
324,335
|
|
|||
|
$
|
827,984
|
|
$
|
745,170
|
|
||
53
The Company’s cash balance included foreign bank balances totaling
$66,777,000
and
$68,076,000
as of December 31,
2017
and
2016
, respectively.
Treasury bills consist of debt securities issued by the U.S. government; asset-backed securities consist of debt securities collateralized by pools of receivables or loans with credit enhancement; corporate bonds consist of debt securities issued by both domestic and foreign companies; sovereign bonds consist of direct debt issued by foreign governments; agency bonds consist of domestic or foreign obligations of government agencies and government-sponsored enterprises that have government backing; municipal bonds consist of debt securities issued by state and local government entities; and the Euro liquidity fund invests in a portfolio of investment-grade bonds. The Euro liquidity fund is denominated in Euros, and the remaining securities are denominated in U.S. Dollars.
The following table summarizes the Company’s available-for-sale investments as of December 31,
2017
(in thousands):
|
Amortized
Cost
|
Gross
Unrealized
Gains
|
Gross
Unrealized
Losses
|
Fair Value
|
||||||||||||
|
Short-term:
|
|||||||||||||||
|
Treasury bills
|
$
|
150,726
|
|
$
|
—
|
|
$
|
(355
|
)
|
$
|
150,371
|
|
|||
|
Asset-backed securities
|
59,267
|
|
8
|
|
(72
|
)
|
59,203
|
|
|||||||
|
Corporate bonds
|
47,391
|
|
29
|
|
(25
|
)
|
47,395
|
|
|||||||
|
Sovereign bonds
|
21,607
|
|
1
|
|
(29
|
)
|
21,579
|
|
|||||||
|
Agency bonds
|
10,600
|
|
8
|
|
—
|
|
10,608
|
|
|||||||
|
Municipal bonds
|
8,805
|
|
—
|
|
—
|
|
8,805
|
|
|||||||
|
Long-term:
|
|
|
|||||||||||||
|
Corporate bonds
|
295,427
|
|
981
|
|
(394
|
)
|
296,014
|
|
|||||||
|
Asset-backed securities
|
71,801
|
|
30
|
|
(104
|
)
|
71,727
|
|
|||||||
|
Treasury bills
|
23,567
|
|
—
|
|
(108
|
)
|
23,459
|
|
|||||||
|
Agency bonds
|
14,878
|
|
14
|
|
(2
|
)
|
14,890
|
|
|||||||
|
Sovereign bonds
|
13,171
|
|
35
|
|
(59
|
)
|
13,147
|
|
|||||||
|
Municipal bonds
|
4,220
|
|
—
|
|
(16
|
)
|
4,204
|
|
|||||||
|
$
|
721,460
|
|
$
|
1,106
|
|
$
|
(1,164
|
)
|
$
|
721,402
|
|
||||
The following table summarizes the Company’s gross unrealized losses and fair values for available-for-sale investments in an unrealized loss position as of December 31,
2017
(in thousands):
|
|
Unrealized Loss
Position For Less than
12 Months
|
Unrealized Loss
Position For Greater than 12 Months |
Total
|
||||||||||||||||||||
|
|
Fair Value
|
Unrealized
Losses
|
Fair Value
|
Unrealized
Losses |
Fair Value
|
Unrealized
Losses |
|||||||||||||||||
|
Treasury bills
|
$
|
145,051
|
|
$
|
(403
|
)
|
$
|
25,176
|
|
$
|
(60
|
)
|
$
|
170,227
|
|
$
|
(463
|
)
|
|||||
|
Corporate bonds
|
126,659
|
|
(241
|
)
|
19,324
|
|
(178
|
)
|
145,983
|
|
(419
|
)
|
|||||||||||
|
Asset-backed securities
|
75,842
|
|
(171
|
)
|
2,698
|
|
(5
|
)
|
78,540
|
|
(176
|
)
|
|||||||||||
|
Sovereign bonds
|
3,809
|
|
(4
|
)
|
17,941
|
|
(84
|
)
|
21,750
|
|
(88
|
)
|
|||||||||||
|
Agency Bonds
|
5,928
|
|
(2
|
)
|
—
|
|
—
|
|
5,928
|
|
(2
|
)
|
|||||||||||
|
Municipal bonds
|
4,203
|
|
(16
|
)
|
—
|
|
—
|
|
4,203
|
|
(16
|
)
|
|||||||||||
|
$
|
361,492
|
|
$
|
(837
|
)
|
$
|
65,139
|
|
$
|
(327
|
)
|
$
|
426,631
|
|
$
|
(1,164
|
)
|
||||||
As of December 31,
2017
, the Company did not recognize any other-than-temporary impairment of these investments. In its evaluation, management considered the type of security, the credit rating of the security, the length of time the security has been in a loss position, the size of the loss position, our intent and ability to hold the security to expected recovery of value, and other meaningful information. The Company does not intend to sell, and is unlikely to be required to sell, any of these available-for-sale investments before its effective maturity or market price recovery.
The Company recorded gross realized gains on the sale of debt securities totaling
$929,000
in
2017
,
$292,000
in
2016
, and
$549,000
in 2015, and gross realized losses on the sale of debt securities totaling
$100,000
in
2017
,
$101,000
in
2016
, and
$205,000
in 2015. These gains and losses are included in "Investment income" on the Consolidated
54
Statement of Operations. Prior to the sale of these securities, unrealized gains and losses for these debt securities, net of tax, are recorded in shareholders’ equity as other comprehensive income (loss).
The following table summarizes the effective maturity dates of the Company’s available-for-sale investments as of December 31,
2017
(in thousands):
|
<1 Year
|
1-2 Years
|
2-3 Years
|
3-4 Years
|
4-5 Years
|
5-7 Years
|
Total
|
|||||||||||||||||||||
|
Corporate bonds
|
$
|
47,395
|
|
$
|
154,541
|
|
$
|
77,772
|
|
$
|
26,545
|
|
$
|
32,352
|
|
$
|
4,804
|
|
$
|
343,409
|
|
||||||
|
Treasury bills
|
150,371
|
|
23,459
|
|
—
|
|
—
|
|
—
|
|
—
|
|
173,830
|
|
|||||||||||||
|
Asset-backed securities
|
59,203
|
|
46,985
|
|
13,456
|
|
3,262
|
|
2,334
|
|
5,690
|
|
130,930
|
|
|||||||||||||
|
Sovereign bonds
|
21,579
|
|
4,580
|
|
8,567
|
|
—
|
|
—
|
|
—
|
|
34,726
|
|
|||||||||||||
|
Agency bonds
|
10,608
|
|
8,962
|
|
—
|
|
—
|
|
5,928
|
|
—
|
|
25,498
|
|
|||||||||||||
|
Municipal bonds
|
8,805
|
|
2,854
|
|
1,350
|
|
—
|
|
—
|
|
—
|
|
13,009
|
|
|||||||||||||
|
$
|
297,961
|
|
$
|
241,381
|
|
$
|
101,145
|
|
$
|
29,807
|
|
$
|
40,614
|
|
$
|
10,494
|
|
$
|
721,402
|
|
|||||||
Inventories consisted of the following (in thousands):
|
|
December 31,
|
||||||
|
|
2017
|
2016
|
|||||
|
Raw materials
|
$
|
33,927
|
|
$
|
18,224
|
|
|
|
Work-in-process
|
2,114
|
|
2,760
|
|
|||
|
Finished goods
|
31,882
|
|
6,000
|
|
|||
|
$
|
67,923
|
|
$
|
26,984
|
|
||
Property, plant, and equipment consisted of the following (in thousands):
|
|
December 31,
|
||||||
|
|
2017
|
2016
|
|||||
|
Land
|
$
|
3,951
|
|
$
|
3,951
|
|
|
|
Buildings
|
24,589
|
|
23,280
|
|
|||
|
Building improvements
|
33,189
|
|
28,049
|
|
|||
|
Leasehold improvements
|
6,513
|
|
5,237
|
|
|||
|
Computer hardware and software
|
61,835
|
|
39,409
|
|
|||
|
Manufacturing test equipment
|
21,312
|
|
18,726
|
|
|||
|
Furniture and fixtures
|
6,363
|
|
4,843
|
|
|||
|
157,752
|
|
123,495
|
|
||||
|
Less: accumulated depreciation
|
(79,704
|
)
|
(69,503
|
)
|
|||
|
$
|
78,048
|
|
$
|
53,992
|
|
||
The cost of property, plant, and equipment totaling
$6,327,000
and
$3,191,000
was removed from both the asset and accumulated depreciation balances in
2017
and
2016
, respectively. Gains and losses on these disposals were immaterial in both periods.
Buildings include rental property with a cost basis of
$5,750,000
as of December 31,
2017
and
2016
, and accumulated depreciation of
$3,069,000
and
$2,922,000
as of December 31,
2017
and
2016
, respectively.
55
The changes in the carrying value of goodwill were as follows (in thousands):
|
Amount
|
||||
|
Balance as of December 31, 2015
|
$
|
81,448
|
|
|
|
Acquisition of AQSense, S.L.
|
1,383
|
|
||
|
Acquisition of EnShape GmbH
|
8,613
|
|
||
|
Acquisition of Chiaro Technologies LLC
|
2,911
|
|
||
|
Acquisition of Webscan, Inc.
|
925
|
|
||
|
Balance as of December 31, 2016
|
95,280
|
|
||
|
Acquisition of ViDi Systems, S.A.
|
18,333
|
|
||
|
Acquisition of GVi Ventures, Inc.
|
1,476
|
|
||
|
Adjustment to EnShape goodwill
|
(1,881
|
)
|
||
|
Balance as of December 31, 2017
|
$
|
113,208
|
|
|
Refer to Note 20 to the Consolidated Financial Statements for further information regarding acquisitions.
For its
2017
analysis of goodwill, management elected to perform a qualitative assessment (commonly known as “step zero”). Based upon this assessment, management does not believe that it is more likely than not that the carrying value of the reporting unit exceeds its fair value. Factors that management considered in the qualitative assessment include macroeconomic conditions, industry and market considerations, overall financial performance (both current and projected), changes in management or strategy, changes in the composition or carrying amount of net assets, and market capitalization. As of
December 31, 2017
, management does not believe any qualitative factors exist that would change the conclusion of its assessment.
Amortized intangible assets consisted of the following (in thousands):
|
Gross
Carrying
Value
|
Accumulated
Amortization
|
Net
Carrying
Value
|
|||||||||
|
Distribution networks
|
$
|
38,060
|
|
$
|
38,060
|
|
$
|
—
|
|
||
|
Completed technologies
|
13,687
|
|
4,181
|
|
9,506
|
|
|||||
|
Customer relationships
|
8,607
|
|
5,202
|
|
3,405
|
|
|||||
|
Non-compete agreements
|
370
|
|
92
|
|
278
|
|
|||||
|
Balance as of December 31, 2017
|
$
|
60,724
|
|
$
|
47,535
|
|
$
|
13,189
|
|
||
|
|
Gross
Carrying
Value
|
Accumulated
Amortization
|
Net
Carrying
Value
|
||||||||
|
Distribution networks
|
$
|
38,060
|
|
$
|
37,422
|
|
$
|
638
|
|
||
|
Completed technologies
|
8,003
|
|
2,098
|
|
5,905
|
|
|||||
|
Customer relationships
|
6,605
|
|
4,836
|
|
1,769
|
|
|||||
|
Balance as of December 31, 2016
|
$
|
52,668
|
|
$
|
44,356
|
|
$
|
8,312
|
|
||
Estimated amortization expense for each of the five succeeding fiscal years and thereafter is as follows (in thousands):
|
Year Ended December 31,
|
Amount
|
|||
|
2018
|
$
|
3,076
|
|
|
|
2019
|
2,701
|
|
||
|
2020
|
2,185
|
|
||
|
2021
|
2,017
|
|
||
|
2022
|
1,691
|
|
||
|
Thereafter
|
1,519
|
|
||
|
$
|
13,189
|
|
||
56
Accrued expenses consisted of the following (in thousands):
|
|
December 31,
|
||||||
|
2017
|
2016
|
||||||
|
Company bonuses
|
$
|
13,721
|
|
$
|
11,462
|
|
|
|
Salaries, commissions, and payroll taxes
|
9,944
|
|
7,193
|
|
|||
|
Acquisition deferred and contingent liabilities
|
6,022
|
|
2,115
|
|
|||
|
Vacation
|
5,479
|
|
4,860
|
|
|||
|
Warranty obligations
|
4,701
|
|
4,335
|
|
|||
|
Foreign retirement obligations
|
4,260
|
|
3,388
|
|
|||
|
Other
|
24,122
|
|
9,186
|
|
|||
|
$
|
68,249
|
|
$
|
42,539
|
|
||
The changes in the warranty obligation were as follows (in thousands):
|
Balance as of December 31, 2015
|
$
|
4,174
|
|
|
Provisions for warranties issued during the period
|
3,001
|
|
|
|
Fulfillment of warranty obligations
|
(2,689
|
)
|
|
|
Foreign exchange rate changes
|
(151
|
)
|
|
|
Balance as of December 31, 2016
|
4,335
|
|
|
|
Provisions for warranties issued during the period
|
2,843
|
|
|
|
Fulfillment of warranty obligations
|
(3,109
|
)
|
|
|
Foreign exchange rate changes
|
632
|
|
|
|
Balance as of December 31, 2017
|
$
|
4,701
|
|
Commitments
As of
December 31, 2017
, the Company had outstanding purchase orders totaling
$6,528,000
to purchase inventory from various vendors. Certain of these purchase orders may be canceled by the Company, subject to cancellation penalties. These purchase commitments relate to expected sales in 2018.
The Company conducts certain of its operations in leased facilities. These lease agreements expire at various dates through 2024 and are accounted for as operating leases. Certain of these leases contain renewal options, retirement obligations, escalation clauses, rent holidays, and leasehold improvement incentives. Annual rental expense totaled
$6,738,000
in
2017
,
$6,090,000
in
2016
, and
$5,778,000
in
2015
.
Future minimum rental payments under these agreements are as follows (in thousands):
|
Year Ended December 31,
|
Amount
|
|||
|
2018
|
$
|
5,762
|
|
|
|
2019
|
4,087
|
|
||
|
2020
|
2,962
|
|
||
|
2021
|
2,371
|
|
||
|
2022
|
1,219
|
|
||
|
Thereafter
|
865
|
|
||
|
$
|
17,266
|
|
||
57
The Company owns buildings adjacent to its corporate headquarters that are partially occupied with tenants who have lease agreements that expire at various dates through 2021. Annual rental income totaled
$1,474,000
in
2017
,
$1,911,000
in
2016
, and
$1,921,000
in
2015
. Rental income and related expenses are included in “Other income (expense)” on the Consolidated Statements of Operations. Future minimum rental receipts under non-cancelable lease agreements are as follows (in thousands):
|
Year Ended December 31,
|
Amount
|
|||
|
2018
|
$
|
835
|
|
|
|
2019
|
848
|
|
||
|
2020
|
862
|
|
||
|
2021
|
492
|
|
||
|
2022
|
305
|
|
||
|
Thereafter
|
—
|
|
||
|
$
|
3,342
|
|
||
Contingencies
Various claims and legal proceedings generally incidental to the normal course of business are pending or threatened on behalf of or against the Company. While we cannot predict the outcome of these matters, we believe that any liability arising from them will not have a material adverse effect on our financial position, liquidity, or results of operations.
Except as limited by Massachusetts law, the by-laws of the Company require it to indemnify certain current or former directors, officers, and employees of the Company against expenses incurred by them in connection with each proceeding in which he or she is involved as a result of serving or having served in certain capacities. Indemnification is not available with respect to a proceeding as to which it has been adjudicated that the person did not act in good faith in the reasonable belief that the action was in the best interests of the Company. The maximum potential amount of future payments the Company could be required to make under these provisions is unlimited. The Company has never incurred significant costs related to these indemnification provisions. As a result, the Company believes the estimated fair value of these provisions is not material.
In the ordinary course of business, the Company may accept standard limited indemnification provisions in connection with the sale of its products, whereby it indemnifies its customers for certain direct damages incurred in connection with third-party patent or other intellectual property infringement claims with respect to the use of the Company’s products. The maximum potential amount of future payments the Company could be required to make under these provisions is generally subject to fixed monetary limits. The Company has never incurred significant costs to defend lawsuits or settle claims related to these indemnification provisions. As a result, the Company believes the estimated fair value of these provisions is not material.
In the ordinary course of business, the Company also accepts limited indemnification provisions from time to time, whereby it indemnifies customers for certain direct damages incurred in connection with bodily injury and property damage arising from the use of the Company’s products. The maximum potential amount of future payments the Company could be required to make under these provisions is generally limited and is likely recoverable under the Company’s insurance policies. As a result of this coverage, and the fact that the Company has never incurred significant costs to defend lawsuits or settle claims related to these indemnification provisions, the Company believes the estimated fair value of these provisions is not material.
Under the terms of the Company’s sale of its Surface Inspection Systems Division (SISD) to AMETEK, Inc., the Company has agreed to retain certain liabilities in connection with its business dealings occurring prior to the transaction closing date of July 6, 2015, and to indemnify AMETEK, Inc. in connection with these retained liabilities and for any breach of the representations and warranties made by the Company to AMETEK, Inc. in connection with the sale agreement itself, as is usual and customary in such transactions. A binding arbitration was concluded in 2016 with respect to certain product performance claims made by an SISD customer, for which the Company remained responsible under the indemnity provisions of the sale transaction. In that proceeding, the tribunal ordered the Company to pay the customer approximately
$326,000
, primarily representing a refund of the product purchase price. The tribunal also ordered the customer to pay the Company approximately
$45,000
, primarily representing reimbursement of legal fees. The net settlement of
$281,000
was recorded in discontinued operations in 2016.
58
The Company’s foreign currency risk management strategy is principally designed to mitigate the potential financial impact of changes in the value of transactions and balances denominated in foreign currencies resulting from changes in foreign currency exchange rates. The Company enters into two types of hedges to manage this risk. The first are economic hedges which utilize foreign currency forward contracts with maturities of up to
45 days
to manage the exposure to fluctuations in foreign currency exchange rates arising primarily from foreign-denominated receivables and payables. The gains and losses on these derivatives are intended to be offset by the changes in the fair value of the assets and liabilities being hedged. These economic hedges are not designated as hedging instruments for hedge accounting treatment. The second are cash flow hedges which utilize foreign currency forward contracts with maturities of up to
18 months
to hedge specific forecasted transactions of the Company's foreign subsidiaries with the goal of protecting our budgeted revenues and expenses against foreign currency exchange rate changes compared to our budgeted rates. These cash flow hedges are designated as hedging instruments for hedge accounting treatment.
The Company had the following outstanding forward contracts (in thousands):
|
December 31, 2017
|
December 31, 2016
|
||||||||||
|
Currency
|
Notional Value
|
|
USD Equivalent
|
|
Notional Value
|
|
USD Equivalent
|
|
|||
|
Derivatives Designated as Hedging Instruments:
|
|||||||||||
|
Japanese Yen
|
—
|
|
$
|
—
|
|
342,500
|
|
$
|
2,960
|
|
|
|
Hungarian Forint
|
—
|
|
—
|
|
39,000
|
|
130
|
|
|||
|
Singapore Dollar
|
—
|
|
—
|
|
150
|
|
97
|
|
|||
|
Derivatives Not Designated as Hedging Instruments:
|
|||||||||||
|
Japanese Yen
|
455,000
|
|
$
|
4,049
|
|
650,000
|
|
$
|
5,554
|
|
|
|
British Pound
|
1,650
|
|
2,232
|
|
1,350
|
|
1,658
|
|
|||
|
Korean Won
|
1,825,000
|
|
1,708
|
|
1,750,000
|
|
1,450
|
|
|||
|
Hungarian Forint
|
545,000
|
|
2,110
|
|
425,000
|
|
1,448
|
|
|||
|
Singapore Dollar
|
—
|
|
—
|
|
1,350
|
|
929
|
|
|||
|
Taiwanese Dollar
|
37,725
|
|
1,278
|
|
26,000
|
|
802
|
|
|||
|
Swiss Franc
|
1,365
|
|
1,401
|
|
—
|
|
—
|
|
|||
Information regarding the fair value of the outstanding forward contracts was as follows (in thousands):
|
|
Asset Derivatives
|
Liability Derivatives
|
|||||||||||||||||
|
Balance
Sheet
Location
|
Fair Value
|
Balance
Sheet
Location
|
Fair Value
|
||||||||||||||||
|
December 31, 2017
|
December 31, 2016
|
December 31, 2017
|
December 31, 2016
|
||||||||||||||||
|
Derivatives Designated as Hedging Instruments:
|
|||||||||||||||||||
|
Cash flow hedge forward contracts
|
Prepaid
expenses and
other current
assets
|
$
|
—
|
|
$
|
43
|
|
Accrued
expenses
|
$
|
—
|
|
$
|
—
|
|
|||||
|
Derivatives Not Designated as Hedging Instruments:
|
|||||||||||||||||||
|
Economic hedge forward contracts
|
Prepaid expenses and other current assets
|
$
|
16
|
|
$
|
1
|
|
Accrued expenses
|
$
|
13
|
|
$
|
11
|
|
|||||
59
The following table summarizes the gross activity for all derivative assets and liabilities which were presented on a net basis on the Consolidated Balance Sheets due to the right of offset with each counterparty (in thousands):
|
Asset Derivatives
|
Liability Derivatives
|
|||||||||||||||||
|
December 31, 2017
|
December 31, 2016
|
December 31, 2017
|
December 31, 2016
|
|||||||||||||||
|
Gross amounts of recognized assets
|
$
|
16
|
|
$
|
117
|
|
Gross amounts of recognized liabilities
|
$
|
13
|
|
$
|
11
|
|
|||||
|
Gross amounts offset
|
—
|
|
(73
|
)
|
Gross amounts offset
|
—
|
|
—
|
|
|||||||||
|
Net amount of assets presented
|
$
|
16
|
|
$
|
44
|
|
Net amount of liabilities presented
|
$
|
13
|
|
$
|
11
|
|
|||||
Information regarding the effect of derivative instruments, net of the underlying exposure, on the consolidated financial statements was as follows (in thousands):
|
|
Location in Financial Statements
|
Year Ended December 31,
|
|||||||||||
|
2017
|
2016
|
2015
|
|||||||||||
|
Derivatives Designated as Hedging Instruments:
|
|||||||||||||
|
Gains (losses) recorded in shareholders' equity (effective portion)
|
Accumulated other comprehensive income (loss), net of tax
|
$
|
—
|
|
$
|
37
|
|
$
|
206
|
|
|||
|
Gains (losses) reclassified from accumulated other comprehensive income (loss) into current operations (effective portion)
|
Revenue
|
$
|
30
|
|
$
|
(438
|
)
|
$
|
(387
|
)
|
|||
|
Research, development, and engineering expenses
|
3
|
|
13
|
|
14
|
|
|||||||
|
Selling, general, and administrative expenses
|
8
|
|
27
|
|
172
|
|
|||||||
|
Total gains (losses) reclassified from accumulated other comprehensive income (loss) into current operations
|
$
|
41
|
|
$
|
(398
|
)
|
$
|
(201
|
)
|
||||
|
Gains (losses) recognized in current operations (ineffective portion and discontinued derivatives)
|
Foreign currency gain (loss)
|
$
|
—
|
|
$
|
—
|
|
$
|
—
|
|
|||
|
Derivatives Not Designated as Hedging Instruments:
|
|||||||||||||
|
Gains (losses) recognized in current operations
|
Foreign currency gain (loss)
|
|
$
|
270
|
|
$
|
(515
|
)
|
$
|
(13
|
)
|
||
60
The following table summarizes the changes in accumulated other comprehensive income (loss), net of tax, related to derivative instruments (in thousands):
|
Balance as of December 31, 2015
|
$
|
206
|
|
|
Net unrealized loss on cash flow hedges
|
(567
|
)
|
|
|
Reclassification of net realized loss on cash flow hedges into current operations
|
398
|
|
|
|
Balance as of December 31, 2016
|
37
|
|
|
|
Net unrealized gain on cash flow hedges
|
4
|
|
|
|
Reclassification of net realized gain on cash flow hedges into current operations
|
(41
|
)
|
|
|
Balance as of December 31, 2017
|
$
|
—
|
|
Preferred Stock
The Company has
400,000
shares of authorized but unissued
$.01
par value preferred stock.
Common Stock
On April 28, 2016, the Company's shareholders approved an amendment to the Company's Articles of Organization to increase the authorized number of shares of common stock from
140,000,000
to
200,000,000
.
In October 2017, the Company’s Board of Directors declared a
two
-for-one stock split, effected in the form of a stock dividend, on the shares of the Company’s common stock. Each shareholder of record on November 17, 2017 received an additional share of common stock for each share of common stock then held. The stock was distributed on December 1, 2017. The Company retained the current par value of
$.002
per share for all shares of common stock. All references in the financial statements to the number of shares outstanding, number of shares repurchased, per-share amounts, and stock option data related to the Company’s common stock have been adjusted to reflect the effect of the stock split for all periods presented. Shareholders’ equity reflects the stock split by reclassifying from “Additional paid in capital” and "Retained earnings" to “Common stock” an amount equal to the par value of the additional shares arising from the split.
Each outstanding share of common stock entitles the record holder to
one
vote on all matters submitted to a vote of the Company’s shareholders. Common shareholders are also entitled to dividends when and if declared by the Company’s Board of Directors.
Shareholder Rights Plan
The Company has adopted a Shareholder Rights Plan, the purpose of which is, among other things, to enhance the Board of Directors’ ability to protect shareholder interests and to ensure that shareholders receive fair treatment in the event any coercive takeover attempt of the Company is made in the future. The Shareholder Rights Plan could make it more difficult for a third party to acquire, or could discourage a third party from acquiring, the Company or a large block of the Company’s common stock. The following summary description of the Shareholder Rights Plan does not purport to be complete and is qualified in its entirety by reference to the Company’s Shareholder Rights Plan, which has been previously filed by the Company with the Securities and Exchange Commission as an exhibit to a Registration Statement on Form 8-A filed on December 5, 2008.
In connection with the adoption of the Shareholder Rights Plan, the Board of Directors of the Company declared a dividend distribution of
one
purchase right (a “Right”) for each outstanding share of common stock to shareholders of record as of the close of business on December 5, 2008. The Rights currently are not exercisable and are attached to and trade with the outstanding shares of common stock. Under the Shareholder Rights Plan, the Rights become exercisable if a person becomes an “acquiring person” by acquiring
15%
or more of the outstanding shares of common stock or if a person commences a tender offer that would result in that person owning
15%
or more of the common stock. If a person becomes an “acquiring person,” each holder of a Right (other than the acquiring person) would be entitled to purchase, at the then-current exercise price, such number of shares of the Company’s preferred stock which are equivalent to shares of common stock having twice the exercise price of the Right. If the Company is acquired in a merger or other business combination transaction after any such event, each holder of a Right would then be entitled to purchase, at the then-current exercise price, shares of the acquiring company’s common stock having a value of twice the exercise price of the Right. The Rights will expire at the close of business on December 5, 2018, unless previously redeemed or exchanged by the Company.
61
Stock Repurchases
In November 2015, the Company's Board of Directors authorized the repurchase of
$100,000,000
of the Company's common stock. As of December 31, 2017, the Company repurchased
2,670,000
shares at a cost of
$100,000,000
under this program, including
1,592,000
shares at a cost of
$68,915,000
in 2017. Stock repurchases under this November 2015 program are now complete. In April 2017, the Company's Board of Directors authorized the repurchase of an additional
$100,000,000
of the Company's common stock. As of December 31, 2017, the Company repurchased
941,000
shares at a cost of
$54,800,000
under this program, leaving a remaining authorized balance of
$45,200,000
. Total stock repurchases in 2017 amounted to
$123,715,000
. The Company may repurchase shares under this program in future periods depending on a variety of factors, including, among other things, the impact of dilution from employee stock options, stock price, share availability, and cash requirements.
Dividends
The Company’s Board of Directors declared and paid cash dividends of
$0.0350
per share in the first quarter of 2016, and
$0.0375
in the second, third, and fourth quarters of 2016, as well as in the first quarter of 2017. The dividend was increased to
$0.0425
in the second and third quarters of 2017 and again increased to
$0.0450
in the fourth quarter of 2017. Total cash dividends paid amounted to
$29,037,000
and
$25,213,000
in 2017 and 2016, respectively. Future dividends will be declared at the discretion of the Company's Board of Directors and will depend upon such factors as the Board deems relevant, including, among other things, the Company's ability to generate positive cash flow from operations.
Stock Option Plans
The Company’s share-based payments that result in compensation expense consist of stock option grants and restricted stock awards. As of December 31,
2017
, the Company had
12,134,952
shares available for grant. Stock options are granted with an exercise price equal to the market value of the Company’s common stock at the grant date and generally vest over
four
years based upon continuous service and expire
ten
years from the grant date. Conditions of restricted stock awards may be based upon continuing employment and/or achievement of pre-established performance goals and objectives. Vesting for performance-based restricted stock awards and time-based restricted stock awards must be greater than
one
year and
three
years, respectively.
The following table summarizes the Company’s stock option activity:
|
Shares
(in thousands)
|
Weighted-
Average
Exercise
Price
|
Weighted-
Average
Remaining
Contractual
Term
(in years)
|
Aggregate
Intrinsic Value
(in thousands)
|
|||||||||
|
Outstanding as of December 31, 2016
|
12,866
|
|
$
|
16.08
|
|
|||||||
|
Granted
|
4,293
|
|
40.82
|
|
||||||||
|
Exercised
|
(4,162
|
)
|
13.11
|
|
||||||||
|
Forfeited or expired
|
(271
|
)
|
23.28
|
|
||||||||
|
Outstanding as of December 31, 2017
|
12,726
|
|
$
|
25.24
|
|
7.7
|
$
|
457,703
|
|
|||
|
Exercisable as of December 31, 2017
|
2,944
|
|
$
|
14.53
|
|
5.5
|
$
|
137,291
|
|
|||
|
Options vested or expected to vest as of
December 31, 2017 (1) |
11,276
|
|
$
|
24.44
|
|
7.6
|
$
|
414,567
|
|
|||
(1) In addition to the vested options, the Company expects a portion of the unvested options to vest at some point in the future. Options expected to vest are calculated by applying an estimated forfeiture rate to the unvested options.
62
The fair values of stock options granted in each period presented were estimated using the following weighted-average assumptions:
|
|
Year Ended December 31,
|
|||||||
|
|
2017
|
2016
|
2015
|
|||||
|
Risk-free rate
|
2.4
|
%
|
1.7
|
%
|
2.1
|
%
|
||
|
Expected dividend yield
|
0.40
|
%
|
0.83
|
%
|
1.25
|
%
|
||
|
Expected volatility
|
41
|
%
|
41
|
%
|
40
|
%
|
||
|
Expected term (in years)
|
5.4
|
|
5.6
|
|
5.4
|
|
||
Risk-free rate
The risk-free rate was based upon a treasury instrument whose term was consistent with the contractual term of the option.
Expected dividend yield
Generally, the current dividend yield is calculated by annualizing the cash dividend declared by the Company’s Board of Directors and dividing that result by the closing stock price on the grant date.
Expected volatility
The expected volatility was based upon a combination of historical volatility of the Company’s common stock over the contractual term of the option and implied volatility for traded options of the Company’s stock.
Expected term
The expected term was derived from the binomial lattice model from the impact of events that trigger exercises over time.
The Company stratifies its employee population into
two
groups: one consisting of senior management and another consisting of all other employees. The Company currently expects that approximately
75%
of its stock options granted to senior management and
72%
of its options granted to all other employees will actually vest. The Company currently applies an estimated forfeiture rate of
10%
to all unvested options for senior management and a rate of
12%
for all other employees. The Company revised its estimated forfeiture rates in the first quarter of
2017
,
2016
and
2015
, resulting in a decrease to compensation expense of
$673,000
in 2017, and an increase to compensation expense of
$334,000
and
$461,000
in
2016
and
2015
, respectively.
The weighted-average grant-date fair value of stock options granted was
$15.59
in
2017
,
$6.33
in
2016
, and
$7.18
in
2015
.
The total intrinsic value of stock options exercised was
$136,672,000
in
2017
,
$55,580,000
in
2016
, and
$43,987,000
in
2015
. The total fair value of stock options vested was
$21,519,000
in
2017
,
$18,114,000
in
2016
, and
$16,227,000
in
2015
.
As of December 31,
2017
, total unrecognized compensation expense related to non-vested stock options was
$38,679,000
, which is expected to be recognized over a weighted-average period of
1.52
years.
The following table summarizes the Company's restricted stock activity:
|
Shares (in thousands)
|
Weighted-Average Grant Fair Value
|
Aggregate Intrinsic Value (in thousands) (1)
|
||||||||
|
Nonvested as of December 31, 2016
|
40
|
|
$
|
17.03
|
|
|||||
|
Granted
|
—
|
|
—
|
|
||||||
|
Vested
|
(20
|
)
|
17.03
|
|
825
|
|
||||
|
Forfeited or expired
|
—
|
|
—
|
|
||||||
|
Nonvested as of December 31, 2017
|
20
|
|
$
|
17.03
|
|
$
|
1,223
|
|
||
(1) Fair market value as of December 31, 2017.
63
The fair values of restricted stock awards granted were determined based upon the market value of the Company's common stock at the time of grant. The initial cost is then amortized over the period of vesting until the restrictions lapse. These restricted shares will be fully vested in 2018. Participants are entitled to dividends on restricted stock awards, but only receive those amounts if the shares vest. The sale or transfer of these shares is restricted during the vesting period.
The total stock-based compensation expense and the related income tax benefit recognized was
$31,942,000
and
$10,473,000
, respectively, in
2017
,
$20,558,000
and
$6,747,000
, respectively, in
2016
, and
$21,274,000
and
$7,127,000
, respectively, in
2015
. No compensation expense was capitalized in
2017
,
2016
, or
2015
.
The following table presents the stock-based compensation expense by caption for each period presented on the Consolidated Statements of Operations (in thousands):
|
|
Year Ended December 31,
|
||||||||||
|
|
2017
|
2016
|
2015
|
||||||||
|
Cost of revenue
|
$
|
1,881
|
|
$
|
1,052
|
|
$
|
1,515
|
|
||
|
Research, development, and engineering
|
11,022
|
|
6,271
|
|
5,194
|
|
|||||
|
Selling, general, and administrative
|
19,039
|
|
13,235
|
|
13,032
|
|
|||||
|
Discontinued operations
|
—
|
|
—
|
|
1,533
|
|
|||||
|
$
|
31,942
|
|
$
|
20,558
|
|
$
|
21,274
|
|
|||
Upon the sale of the Company's Surface Inspection Systems Division, completed on July 6, 2015, the Company accelerated the vesting of stock options with respect to
380,000
underlying shares, resulting in an additional
$1,106,000
of stock-based compensation expense recorded in 2015.
Under the Company’s Employee Savings Plan, a defined contribution plan, U.S. employees, who have attained age
21
and not defined as highly compensated, may contribute up to
50%
of their pay on a pre-tax basis subject to the annual dollar limitations established by the Internal Revenue Service (IRS). Highly compensated employees as defined by the IRS, may contribute up to
25%
of their pay on a pre-tax basis. The Company currently matches
50%
of the first
6%
of pay an employee contributes. Company contributions vest
20%
,
40%
,
60%
, and
100%
after two, three, four, and five years of continuous employment with the Company, respectively. Company contributions totaled
$2,030,000
in
2017
,
$1,712,000
in
2016
, and
$1,845,000
in
2015
. Cognex stock is not an investment alternative and Company contributions are not made in the form of Cognex stock.
Domestic income from continuing operations before taxes was
$30,080,000
in
2017
,
$23,939,000
in
2016
, and
$11,637,000
in
2015
. Foreign income from continuing operations before taxes was
$236,842,000
in
2017
,
$144,856,000
in
2016
, and
$115,325,000
in
2015
.
Income tax expense on continuing operations consisted of the following (in thousands):
|
|
Year Ended December 31,
|
||||||||||
|
|
2017
|
2016
|
2015
|
||||||||
|
Current:
|
|||||||||||
|
Federal
|
$
|
78,054
|
|
$
|
14,459
|
|
$
|
16,430
|
|
||
|
State
|
2,687
|
|
(617
|
)
|
378
|
|
|||||
|
Foreign
|
7,714
|
|
8,149
|
|
4,946
|
|
|||||
|
88,455
|
|
21,991
|
|
21,754
|
|
||||||
|
Deferred:
|
|||||||||||
|
Federal
|
1,569
|
|
(3,031
|
)
|
(2,541
|
)
|
|||||
|
State
|
(639
|
)
|
1,066
|
|
(165
|
)
|
|||||
|
Foreign
|
359
|
|
(1,058
|
)
|
250
|
|
|||||
|
1,289
|
|
(3,023
|
)
|
(2,456
|
)
|
||||||
|
$
|
89,744
|
|
$
|
18,968
|
|
$
|
19,298
|
|
|||
64
A reconciliation of the U.S. federal statutory corporate tax rate to the Company’s income tax expense on continuing operations, or effective tax rate, was as follows:
|
|
Year Ended December 31,
|
|||||||
|
|
2017
|
2016
|
2015
|
|||||
|
Income tax provision at federal statutory corporate tax rate
|
35
|
%
|
35
|
%
|
35
|
%
|
||
|
State income taxes, net of federal benefit
|
—
|
|
1
|
|
—
|
|
||
|
Foreign tax rate differential
|
(27
|
)
|
(17
|
)
|
(19
|
)
|
||
|
Tax credit
|
(1
|
)
|
(1
|
)
|
—
|
|
||
|
Discrete tax benefit related to employee stock option exercises
|
(14
|
)
|
(7
|
)
|
—
|
|
||
|
Discrete tax expense related to 2017 Tax Act
|
36
|
|
—
|
|
—
|
|
||
|
Discrete tax expense related to write-down of deferred tax assets
|
5
|
|
—
|
|
—
|
|
||
|
Other discrete tax events
|
(1
|
)
|
—
|
|
(2
|
)
|
||
|
Other
|
1
|
|
—
|
|
1
|
|
||
|
Income tax provision on continuing operations
|
34
|
%
|
11
|
%
|
15
|
%
|
||
On December 22, 2017, the United States Congress passed and the President signed into law the Tax Cuts and Jobs Act of 2017 (the "Tax Act"). The Tax Act includes a number of changes that impact the Company's deferred tax positions, with the primary impact resulting from a decrease in the U.S. federal statutory corporate tax rate from 35% to 21%. The Company has remeasured its deferred tax positions as of December 31, 2017 at the new enacted tax rate, and accordingly, has recognized tax expense of
$12,523,000
from the write-down of deferred tax assets in 2017.
In addition, the Tax Act subjects unrepatriated foreign earnings to a one-time transition tax, regardless of the Company's financial statement assertion related to indefinite reinvestment or whether the Company ultimately repatriates any of the foreign earnings, for which the Company has recorded estimated tax expense of
$101,379,000
in 2017.
Furthermore, the Tax Act replaces the current system of taxing U.S. corporations on repatriated foreign earnings with a partial territorial system that provides a 100% dividends-received deduction to domestic corporations for foreign-source dividends received from 10% or more owned foreign corporations. The Company has recorded a decrease in tax expense of
$3,843,000
in 2017 from the reversal of the tax effect of a 2016 dividend paid in 2017 from a wholly-owned foreign subsidiary to its domestic entity.
The Securities and Exchange Commission (SEC) released Staff Accounting Bulletin (SAB) No. 118 to provide guidance to companies on how to implement the accounting and disclosure changes as a result of the Tax Act. The SEC staff guidance has recognized that, due to the complexity and timing of the release of the Tax Act, the accounting for this change in the law may be incomplete upon issuance of a company's financial statements for the reporting period in which the Tax Act was enacted. SAB No. 118 states that if a company can determine a reasonable estimate for the effects of the Tax Act then this estimate can be included in the financial statements. The Company has made what it considers to be a reasonable estimate of the impact of the new taxes relating to foreign earnings and the write-down of its deferred tax assets in its financial statements. This significant estimate is highly judgmental and changes to this estimate could result in material charges or credits in future reporting periods. U.S. Treasury regulations and administrative guidance have not been finalized as of the date of these financial statements. The issuance of final regulations may require the Company to revise its estimates of earnings and profits as well as certain deferred taxes as required.
The Company will continue to gather and analyze information on historical unrepatriated foreign earnings and to monitor state laws relating to this income to finalize both the federal and state tax impact. The Tax Act limits certain deductions and these limitations may impact the value of existing deferred tax assets. The Company will continue to review the impact of these limitations as regulatory guidance is issued.
The majority of income earned outside of the United States is indefinitely reinvested to provide funds for international expansion. The Company is tax resident in numerous jurisdictions around the world and has identified its major tax jurisdictions as the United States, Ireland, and China. The statutory tax rate is
12.5%
in Ireland and
25%
in China. International rights to certain of the Company’s intellectual property are held by a subsidiary whose legal jurisdiction does not tax this income, resulting in a foreign effective tax rate lower than the above mentioned statutory rates. However, this income has been included in the provisional estimate of the one-time transitional tax on unrepatriated foreign earnings under the Tax Act. The Company has not yet determined how the Tax Act will impact its financial statement assertion related to indefinite reinvestment in future years.
65
As of December 31, 2017 and December 31, 2016, respectively,
$498,653,000
and
$437,691,000
, of the Company’s cash, cash equivalents, and investments were held by foreign subsidiaries and are generally denominated in U.S. Dollars.
In 2016, the Company adopted Accounting Standards Update 2016-09, "Improvements to Employee Share-Based Payment Accounting." This Update required excess tax benefits arising from the difference between the deduction for tax purposes and the compensation expense for financial reporting purposes from stock option exercises to be recognized as an income tax benefit in the income statement. Previous guidance required excess tax benefits to be recognized as additional paid-in-capital in shareholders' equity on the balance sheet. This provision is required to be applied prospectively and therefore, 2015 was not restated. As a result of this change, income tax expense was reduced by
$38,569,000
in 2017 and
$11,889,000
in 2016.
Interest and penalties included in income tax expense was
$71,000
,
$92,000
, and
$34,000
in 2017, 2016, and 2015, respectively.
The changes in the reserve for income taxes, excluding gross interest and penalties, were as follows (in thousands):
|
Balance of reserve for income taxes as of December 31, 2015
|
$
|
5,296
|
|
|
Gross amounts of increases in unrecognized tax benefits as a result of tax positions taken in prior periods
|
11
|
|
|
|
Gross amounts of increases in unrecognized tax benefits as a result of tax positions taken in the current period
|
1,235
|
|
|
|
Gross amounts of decreases in unrecognized tax benefits relating to settlements with taxing authorities
|
—
|
|
|
|
Gross amounts of decreases in unrecognized tax benefits as a result of the expiration of the applicable statutes of limitations
|
(823
|
)
|
|
|
Balance of reserve for income taxes as of December 31, 2016
|
5,719
|
|
|
|
Gross amounts of decreases in unrecognized tax benefits as a result of tax positions taken in prior periods
|
(56
|
)
|
|
|
Gross amounts of increases in unrecognized tax benefits as a result of tax positions taken in the current period
|
1,993
|
|
|
|
Gross amounts of decreases in unrecognized tax benefits relating to settlements with taxing authorities
|
(116
|
)
|
|
|
Gross amounts of decreases in unrecognized tax benefits as a result of the expiration of the applicable statutes of limitations
|
(791
|
)
|
|
|
Balance of reserve for income taxes as of December 31, 2017
|
$
|
6,749
|
|
The Company’s reserve for income taxes, including gross interest and penalties, was
$7,516,000
as of December 31, 2017, which included
$6,488,000
classified as a non-current liability and
$1,028,000
recorded as a reduction to non-current deferred tax assets. The Company's reserve for income taxes, including gross interest and penalties, was
$6,389,000
as of December 31, 2016, which included
$5,361,000
classified as a non-current liability and
$1,028,000
recorded as a reduction to non-current deferred tax assets. The amount of gross interest and penalties included in these balances was
$767,000
and
$670,000
as of December 31, 2017 and December 31, 2016, respectively. If the Company’s tax positions were sustained or the statutes of limitations related to certain positions expired, these reserves would be released and income tax expense would be reduced in a future period. As a result of the expiration of certain statutes of limitations, there is a potential that a portion of these reserves could be released, which would decrease income tax expense by approximately
$1,000,000
to
$1,200,000
over the next twelve months.
The Company has defined its major tax jurisdictions as the United States, Ireland, and China, and within the United States, Massachusetts. Within the United States, the tax years 2014 through 2017 remain open to examination by the Internal Revenue Service and various state taxing authorities. The tax years 2012 through 2017 remain open to examination by various taxing authorities in other jurisdictions in which the Company operates.
In 2011, the Company finalized an Advanced Pricing Agreement (APA) with Japan that will cover tax years 2006 through 2011, with a requested extension to 2012. The Company has concluded negotiations for an APA between Japan and Ireland that will cover tax years 2014 through 2018 with retroactive application to 2013. The Company believes it is adequately reserved for these open years.
66
Deferred tax assets and liabilities consisted of the following (in thousands):
|
December 31,
|
|||||||
|
|
2017
|
2016
|
|||||
|
Non-current deferred tax assets:
|
|||||||
|
Stock-based compensation expense
|
$
|
11,664
|
|
$
|
15,365
|
|
|
|
Federal and state tax credit carryforwards
|
6,707
|
|
5,154
|
|
|||
|
Bonuses, commissions, and other compensation
|
5,704
|
|
2,483
|
|
|||
|
Inventory and revenue related
|
3,415
|
|
2,919
|
|
|||
|
Depreciation
|
2,279
|
|
2,882
|
|
|||
|
Other
|
3,012
|
|
3,714
|
|
|||
|
Gross non-current deferred tax assets
|
32,781
|
|
32,517
|
|
|||
|
Non-current deferred tax liabilities:
|
|||||||
|
Nondeductible intangible assets
|
(87
|
)
|
(379
|
)
|
|||
|
Gross non-current deferred tax liabilities
|
(87
|
)
|
(379
|
)
|
|||
|
Valuation allowance
|
(5,309
|
)
|
(4,116
|
)
|
|||
|
Net non-current deferred tax assets
|
$
|
27,385
|
|
$
|
28,022
|
|
|
|
Non-current deferred tax liabilities:
|
|||||||
|
Other
|
$
|
(312
|
)
|
$
|
—
|
|
|
|
Net non-current deferred tax liabilities
|
$
|
(312
|
)
|
$
|
—
|
|
|
In 2017, the Company recorded a valuation allowance of
$1,193,000
for state research and development tax credits that were not considered to be realizable. Should these credits be utilized in a future period, the reserve associated with these credits would be reversed in the period when it is determined that the credits can be utilized to offset future state income tax liabilities. In addition, the Company had
$7,735,000
of state research and development tax credit carryforwards, net of federal tax, as of December 31,
2017
, which will begin to expire in 2019.
While the deferred tax assets, net of valuation allowance, are not assured of realization, management has evaluated the realizability of these deferred tax assets and has determined that it is more likely than not that these assets will be realized. In reaching this conclusion, we have evaluated certain relevant criteria including the Company’s historical profitability, current projections of future profitability, and the lives of tax credits, net operating losses, and other carryforwards. Should the Company fail to generate sufficient pre-tax profits in future periods, we may be required to establish valuation allowances against these deferred tax assets, resulting in a charge to current operations in the period of determination.
On July 6, 2015, the Company completed the sale of its Surface Inspection Systems Division (SISD). A pre-tax gain of
$125,357,000
and associated income tax expense of
$47,175,000
was recorded in 2015.
Cash paid for income taxes totaled
$11,802,000
in
2017
,
$20,748,000
in
2016
, and
$58,280,000
in
2015
. The 2015 income tax payments included remittances related to the sale of SISD.
Weighted-average shares were calculated as follows (in thousands):
|
|
Year Ended December 31,
|
|||||||
|
2017
|
2016
|
2015
|
||||||
|
Basic weighted-average common shares outstanding
|
173,287
|
|
170,676
|
|
172,592
|
|
||
|
Effect of dilutive stock options
|
6,264
|
|
3,468
|
|
3,390
|
|
||
|
Diluted weighted-average common and common-equivalent shares outstanding
|
179,551
|
|
174,144
|
|
175,982
|
|
||
Stock options to purchase
3,363,141
,
4,391,598
, and
6,070,156
shares of common stock, on a weighted-average basis, were outstanding in
2017
,
2016
, and
2015
, respectively, but were not included in the calculation of dilutive net income per share because they were anti-dilutive.
67
On July 6, 2015, the Company completed the sale of its Surface Inspection Systems Division (SISD). Prior to this date, the Company had reported SISD as one of its
two
segments. Given the disposition of the SISD segment, management reviewed its segment reporting and concluded that the Company now operates in
one
segment, machine vision technology. Operating segments were not aggregated in reaching this conclusion. The Company’s chief operating decision maker is the chief executive officer, who makes decisions to allocate resources and assesses performance at the corporate level. The Company offers a variety of machine vision products that have similar economic characteristics, have the same production processes, and are distributed by the same sales channels to the same types of customers.
The following table summarizes information about geographic areas (in thousands):
|
United States
|
Europe
|
Greater China
|
Other
|
Total
|
|||||||||||||||
|
Year Ended December 31, 2017
|
|||||||||||||||||||
|
Revenue
|
$
|
179,914
|
|
$
|
323,879
|
|
$
|
103,406
|
|
$
|
140,751
|
|
$
|
747,950
|
|
||||
|
Long-lived assets
|
53,983
|
|
22,437
|
|
1,594
|
|
2,525
|
|
$
|
80,539
|
|
||||||||
|
Year Ended December 31, 2016
|
|||||||||||||||||||
|
Revenue
|
$
|
136,611
|
|
$
|
231,731
|
|
$
|
63,471
|
|
$
|
88,940
|
|
$
|
520,753
|
|
||||
|
Long-lived assets
|
40,404
|
|
12,981
|
|
994
|
|
1,932
|
|
$
|
56,311
|
|
||||||||
|
Year Ended December 31, 2015
|
|||||||||||||||||||
|
Revenue
|
$
|
119,781
|
|
$
|
199,127
|
|
$
|
54,137
|
|
$
|
77,512
|
|
$
|
450,557
|
|
||||
|
Long-lived assets
|
40,742
|
|
12,498
|
|
873
|
|
1,781
|
|
$
|
55,894
|
|
||||||||
Revenue is presented geographically based upon the customer’s country of domicile. Revenue from a single customer accounted for
21%
,
19%
, and
18%
of total revenue in 2017, 2016, and 2015, respectively.
On July 6, 2015, the Company completed the sale of its Surface Inspection Systems Division (SISD) to AMETEK, Inc. (AMETEK) for
$155,655,000
in cash. Transaction costs totaled
$5,198,000
and included $
1,106,000
of stock option expense from the accelerated vesting of stock options in connection with the sale.
The financial results of SISD are reported as a discontinued operation for all periods presented. In 2015, a pre-tax gain of
$125,357,000
and associated income tax expense of
$47,175,000
was recorded in "Net income (loss) from discontinued operations" on the Consolidated Statements of Operations. A binding arbitration was concluded in 2016 with respect to certain product performance claims made by an SISD customer, for which the Company remained responsible under the indemnity provisions of the sale transaction. In that proceeding, the tribunal ordered the Company to pay the customer approximately
$326,000
, primarily representing a refund of the product purchase price. The tribunal also ordered the customer to pay the Company approximately
$45,000
, primarily representing reimbursement of legal fees. The net settlement of
$281,000
was recorded in discontinued operations in 2016, along with
$123,000
of legal fees. The tax benefit related to this expense was
$149,000
, resulting in a net loss from discontinued operations of
$255,000
.
68
The major classes of revenue and expense included in discontinued operations were as follows (in thousands):
|
|
Year Ended December 31,
|
|||||||||||
|
|
2017
|
2016
|
2015
|
|||||||||
|
Revenue
|
$
|
—
|
|
$
|
—
|
|
$
|
23,248
|
|
|||
|
Cost of revenue
|
—
|
|
—
|
|
(11,291
|
)
|
||||||
|
Research, development, and engineering expenses
|
—
|
|
—
|
|
(2,126
|
)
|
||||||
|
Selling, general, and administrative expenses
|
—
|
|
—
|
|
(7,800
|
)
|
||||||
|
Foreign currency loss
|
—
|
|
—
|
|
(177
|
)
|
||||||
|
Operating income from discontinued business
|
—
|
|
—
|
|
1,854
|
|
||||||
|
Gain (loss) on sale of discontinued business
|
—
|
|
(404
|
)
|
125,357
|
|
||||||
|
Income from discontinued operations before income tax expense
|
—
|
|
(404
|
)
|
127,211
|
|
||||||
|
Income tax expense (benefit) on discontinued operations
|
—
|
|
(149
|
)
|
47,801
|
|
||||||
|
Net income (loss) from discontinued operations
|
$
|
—
|
|
$
|
(255
|
)
|
$
|
79,410
|
|
|||
Significant non-cash items related to the discontinued business were as follows (in thousands):
|
|
Year Ended December 31,
|
|||||||||||
|
|
2017
|
2016
|
2015
|
|||||||||
|
Stock-based compensation expense
|
$
|
—
|
|
$
|
—
|
|
$
|
1,533
|
|
|||
|
Depreciation expense
|
—
|
|
—
|
|
401
|
|
||||||
|
Amortization expense
|
—
|
|
—
|
|
165
|
|
||||||
|
Capital expenditures
|
—
|
|
—
|
|
482
|
|
||||||
The Company completed a total of
seven
business acquisitions in 2017, 2016, and 2015. All of these transactions were accounted for as business combinations. Pro-forma information for these acquisitions is not presented because they are not significant, either individually or in the aggregate. Revenue and earnings since the dates of the acquisitions included in the Company's Consolidated Statements of Operations are also not presented because they are not material.
Transaction costs were immaterial and were expensed as incurred.
Assets acquired and liabilities assumed have been recorded at their estimated fair values as of the acquisition date. Contingent consideration is remeasured each reporting period with changes in fair value recorded in "Other income (expense)" on the Consolidated Statements of Operations.
GVi Ventures, Inc.
On April 12, 2017, the Company acquired selected assets and assumed selected liabilities of GVi Ventures, Inc., a privately-held maker of pre-configured vision solutions for common automotive applications based in the United States. The total purchase price of
$5,368,000
included cash payment of
$4,069,000
and contingent consideration valued at
$1,299,000
as of the acquisition date. In addition, the Company entered into special incentive payments tied to employment, none of which are material, that the Company will record as compensation expense.
The undiscounted potential outcomes related to the contingent consideration range from
$0
to
$3,500,000
based upon certain milestone revenue levels over the next
five
years. In 2017, the Company recorded a
$282,000
expense representing a fair value adjustment in other expense, which increased the liability amount to
$1,581,000
as of December 31, 2017.
Under this transaction, in addition to customer relationships and completed technologies, the Company acquired a team of software engineers that are expected to develop new products and increase the Company's ability to serve large customers in the automotive industry.
69
The purchase price was allocated as follows (in thousands):
|
Accounts receivable
|
$
|
423
|
|
|
Inventories
|
120
|
|
|
|
Prepaid expenses and other current assets
|
1
|
|
|
|
Accounts payable
|
(152
|
)
|
|
|
Accrued expenses
|
(10
|
)
|
|
|
Completed technologies
|
910
|
|
|
|
Customer relationships
|
2,600
|
|
|
|
Goodwill
|
1,476
|
|
|
|
Purchase price
|
$
|
5,368
|
|
ViDi Systems S.A.
On April 4, 2017, the Company acquired all of the outstanding shares of ViDi Systems, S.A. (ViDi), a privately-held vision software company based in Switzerland. The total purchase price of
$23,015,000
included cash payment of
$20,019,000
, with the remaining
$2,996,000
recorded as a holdback to secure potential claims under the agreement. The holdback limitation period is
18
months from the acquisition date. In addition, the Company entered into a special incentive payment tied to employment, which is not material, that the Company will record as compensation expense.
Under this transaction, in addition to completed technologies, the Company acquired a team of software engineers that are expected to help the Company broaden the scope of applications that can be addressed with Cognex vision. ViDi's deep learning software uses artificial intelligence techniques to improve image analysis in applications where it is difficult to predict the full range of image variations that might be encountered. Using feedback, ViDi's software trains the system to distinguish between acceptable variations and defects.
The purchase price was allocated as follows (in thousands):
|
Cash
|
$
|
146
|
|
|
Accounts receivable
|
425
|
|
|
|
Prepaid expenses and other current assets
|
129
|
|
|
|
Property, plant, and equipment
|
40
|
|
|
|
Deferred income tax asset
|
620
|
|
|
|
Accounts payable
|
(98
|
)
|
|
|
Accrued expenses
|
(716
|
)
|
|
|
Deferred income tax liability
|
(1,008
|
)
|
|
|
Non-compete agreement
|
370
|
|
|
|
Completed technologies
|
4,774
|
|
|
|
Goodwill
|
18,333
|
|
|
|
Purchase price
|
$
|
23,015
|
|
The non-compete agreement and completed technology are included in "Intangible assets" on the Consolidated Balance Sheet. The non-compete agreement will be amortized to research, development and engineering expenses over
three
years, and the completed technology will be amortized to cost of revenue over
six
years, both on a straight-line basis. The portion of the acquired goodwill deductible for tax purposes is
$5,112,000
.
70
Webscan, Inc.
On December 9, 2016, the Company acquired selected assets and assumed selected liabilities of Webscan, Inc., a privately-held U.S.-based ID provider of barcode verifiers. The total purchase price of
$3,176,000
included
$3,000,000
in cash paid upon closing and
$176,000
in cash paid in January 2017 as a working capital adjustment. There are no contingent payments. In addition, the Company entered into special incentive payments tied to employment, none of which are material, that the Company will record as compensation expense.
Under this transaction, in addition to customer relationships and completed technologies, the Company acquired a team of individuals including software engineers that are expected to help the Company accelerate the development of future ID products.
The purchase price was allocated as follows (in thousands):
|
Accounts receivable
|
$
|
504
|
|
|
Inventories
|
296
|
|
|
|
Prepaid expenses and other current assets
|
8
|
|
|
|
Customer relationships
|
680
|
|
|
|
Completed technologies
|
840
|
|
|
|
Goodwill
|
925
|
|
|
|
Accounts payable
|
(77
|
)
|
|
|
Purchase price
|
$
|
3,176
|
|
The customer relationships and completed technologies are included in "Intangible assets" on the Consolidated Balance
Sheet. The customer relationships are being amort
ized to selling, general, and administrative e
xpenses on a straigh
t-line basis
over
seven
years, and the completed technologies are being amortized to cost of revenue on a straigh
t-line basis over
five
years. The portion of the acquired goodwill deductible for tax purposes is
$287,000
.
Chiaro Technologies LLC
On November 30, 2016, the Company acquired selected assets and assumed selected liabilities of Chiaro Technologies LLC, a privately-held U.S.-based 3D vision company. The total purchase price of
$4,149,000
included cash payment of
$3,538,000
and contingent consideration valued at
$611,000
as of the acquisition date. In addition, the Company entered into special incentive payments tied to employment, none of which are material, that the Company will record as compensation expense.
The undiscounted potential outcomes related to the contingent consideration range from
$0
to
$1,250,000
based upon certain milestone revenue levels over the next three years from the acquisition date. In 2017, the Company recorded a
$15,000
expense representing a fair value adjustment in other expense, which increased the liability amount to
$626,000
as of December 31, 2017.
Under this transaction, in addition to completed technologies, the Company acquired a team of software engineers that are expected to help the Company accelerate the development of future 3D vision products.
71
The purchase price was allocated as follows (in thousands):
|
Prepaid expenses and other current assets
|
$
|
3
|
|
|
Completed technologies
|
1,350
|
|
|
|
Goodwill
|
2,911
|
|
|
|
Accrued expenses
|
(115
|
)
|
|
|
Purchase price
|
$
|
4,149
|
|
EnShape GmbH
On October 27, 2016, the Company acquired all of the outstanding shares of EnShape GmbH, a privately-held 3D sensor provider based in Germany. The total purchase price of
$7,901,000
included
$5,395,000
in cash paid upon closing,
$1,144,000
of deferred cash payments as a holdback for potential indemnification claims payable in 2018, and
$1,362,000
of contingent cash payments based upon the completion of certain tasks by June 30, 2017. These tasks were completed and this payment was made in 2017. In addition, the Company entered into special incentive payments tied to employment, none of which are material, that the Company will record as compensation expense.
Under this transaction, in addition to customer relationships and completed technologies, the Company acquired a team of software engineers that are expected to help the Company accelerate the development of future 3D vision products.
The purchase price was allocated as follows (in thousands):
|
Cash
|
$
|
167
|
|
|
Accounts receivable
|
4
|
|
|
|
Inventories
|
79
|
|
|
|
Prepaid expenses and other current assets
|
1,896
|
|
|
|
Property, plant, and equipment
|
44
|
|
|
|
Customer relationships
|
447
|
|
|
|
Completed technologies
|
1,089
|
|
|
|
Goodwill
|
6,732
|
|
|
|
Accounts payable
|
(6
|
)
|
|
|
Accrued expenses
|
(209
|
)
|
|
|
Accrued income taxes
|
(2,342
|
)
|
|
|
Purchase price
|
$
|
7,901
|
|
The customer relationships and completed technologies are included in "Intangible assets" on the Consolidated Balance
Sheet. The customer relationships are being amort
ized to selling, general, and administrative e
xpenses, and the completed technologies are being amortized to cost of revenue, both on a straigh
t-line basis over
seven
years. The portion of the acquired goodwill deductible for tax purposes is
$328,000
.
AQSense, S.L.
On August 30, 2016, the Company acquired selected assets and assumed selected liabilities of AQSense, S.L., a privately-held 3D vision software provider based in Spain. The total purchase price of
$2,519,000
was paid in cash and there are no contingent payments.
Under this transaction, in addition to customer relationships and completed technologies, the Company acquired a team of software engineers that are expected to help the Company accelerate the development of future 3D vision products.
72
The purchase price was allocated as follows (in thousands):
|
Accounts receivable
|
$
|
168
|
|
|
Customer relationships
|
598
|
|
|
|
Completed technologies
|
384
|
|
|
|
Goodwill
|
1,383
|
|
|
|
Accrued expenses
|
(14
|
)
|
|
|
Purchase price
|
$
|
2,519
|
|
The completed technologies are included in "Intangible assets" on the Consolidated Balance Sheet and they are being amortized to cost of revenue on a straight-line basis over
five
years. The acquired goodwill is not deductible for tax purposes.
In the fourth quarter of 2017, the Company determined that the carrying value of the customer relationships was impaired and reduced this value to zero. The impairment charge was included in selling, general, and administrative expenses on the Consolidated Statements of Operations.
Manatee Works, Inc.
On August 21, 2015, the Company acquired selected assets of Manatee Works, Inc. (Manatee), a privately-held U.S.-based developer of barcode scanning software development kits (SDKs). The Company plans to leverage Manatee's current developer network and business model of attracting new developers to drive leads for its ID products. Under this transaction, the Company also acquired technology for use in mobile devices.
The total purchase price of
$4,813,000
included
$1,023,000
in cash paid upon closing and contingent consideration valued at
$3,790,000
on the acquisition date. In 2015, the Company recorded a
$790,000
benefit in other income, which reduced the liability amount to
$3,000,000
. In 2016, the Company paid
$337,000
and recorded a
$463,000
benefit in other income, which reduced the liability amount to
$2,200,000
. In 2017, the Company paid
$525,000
and recorded a
$325,000
benefit in other income, which reduced the liability amount to
$1,350,000
as of December 31, 2017. The undiscounted potential outcomes related to future contingent consideration range from
$0
to approximately
$2,200,000
in 2018 based upon reaching certain milestone revenue levels.
The purchase price was allocated as follows (in thousands):
|
Prepaid expenses and other current assets
|
$
|
23
|
|
|
Customer relationships
|
140
|
|
|
|
Completed technologies
|
590
|
|
|
|
Goodwill
|
4,060
|
|
|
|
Purchase price
|
$
|
4,813
|
|
The customer relationships and completed technologies are included in "Intangible assets" on the Consolidated Balance Sheets. The customer relationships are being amortized to selling, general, and administrative expenses, and the completed technologies are being amortized to cost of revenue, both on a straight-line basis over
five
years. The portion of the acquired goodwill deductible for tax purposes is
$366,000
.
On February 14, 2018, the Company's Board of Directors declared a cash dividend of
$0.045
per share. The dividend is payable
March 16, 2018
to all shareholders of record as of the close of business on
March 2, 2018
.
73
COGNEX CORPORATION - SELECTED QUARTERLY FINANCIAL DATA (UNAUDITED)
|
|
Quarter Ended
|
||||||||||||||
|
|
April 2, 2017
|
July 2, 2017
|
October 1, 2017
|
December 31,
2017 |
|||||||||||
|
|
(In thousands, except per share amounts)
|
||||||||||||||
|
Revenue
|
$
|
134,942
|
|
$
|
172,904
|
|
$
|
259,739
|
|
$
|
180,365
|
|
|||
|
Gross margin
|
106,717
|
|
135,433
|
|
197,379
|
|
139,723
|
|
|||||||
|
Operating income
|
37,426
|
|
59,538
|
|
110,247
|
|
52,108
|
|
|||||||
|
Net income (loss)
|
$
|
45,655
|
|
$
|
56,072
|
|
$
|
102,348
|
|
$
|
(26,897
|
)
|
|||
|
Basic net income (loss) per share (1)
|
$
|
0.26
|
|
$
|
0.32
|
|
$
|
0.59
|
|
$
|
(0.16
|
)
|
|||
|
Diluted net income (loss) per share (1) (2)
|
$
|
0.26
|
|
$
|
0.31
|
|
$
|
0.57
|
|
$
|
(0.16
|
)
|
|||
|
|
Quarter Ended
|
||||||||||||||
|
|
April 3, 2016
|
July 3, 2016
|
October 2, 2016
|
December 31,
2016 |
|||||||||||
|
|
(In thousands, except per share amounts)
|
||||||||||||||
|
Revenue
|
$
|
96,205
|
|
$
|
147,274
|
|
$
|
147,952
|
|
$
|
129,322
|
|
|||
|
Gross margin
|
75,237
|
|
112,061
|
|
115,203
|
|
102,662
|
|
|||||||
|
Operating income
|
16,344
|
|
49,675
|
|
54,528
|
|
40,237
|
|
|||||||
|
Net income from continuing operations
|
$
|
14,885
|
|
$
|
43,014
|
|
$
|
53,675
|
|
$
|
38,253
|
|
|||
|
Net income (loss) from discontinued operations
|
—
|
|
(255
|
)
|
—
|
|
—
|
|
|||||||
|
Net income
|
$
|
14,885
|
|
$
|
42,759
|
|
$
|
53,675
|
|
$
|
38,253
|
|
|||
|
Basic net income per share from continuing operations (1)
|
$
|
0.09
|
|
$
|
0.25
|
|
$
|
0.31
|
|
$
|
0.22
|
|
|||
|
Basic net income (loss) per share from discontinued operations (1)
|
—
|
|
—
|
|
—
|
|
—
|
|
|||||||
|
Basic net income per share (1)
|
$
|
0.09
|
|
$
|
0.25
|
|
$
|
0.31
|
|
$
|
0.22
|
|
|||
|
Diluted net income per share from continuing operations (1)
|
$
|
0.09
|
|
$
|
0.25
|
|
$
|
0.31
|
|
$
|
0.22
|
|
|||
|
Diluted net income (loss) per share from discontinued operations (1)
|
—
|
|
—
|
|
—
|
|
—
|
|
|||||||
|
Diluted net income per share (1)
|
$
|
0.09
|
|
$
|
0.25
|
|
$
|
0.31
|
|
$
|
0.22
|
|
|||
(1) Prior period results have been adjusted to reflect the two-for-one stock split effected in the form of a stock dividend which occurred in the quarter ended December 31, 2017.
(2) As a result of the net loss recorded for the quarter ended December 31, 2017, potential common stock equivalents of 7,145 were not included in the calculation of diluted net loss per share for this quarter.
74
REPORT OF INDEPENDENT REGISTERED PUBLIC ACCOUNTING FIRM
Board of Directors and Shareholders
Cognex Corporation
Opinion on financial statement schedule
We have audited in accordance with the standards of the Public Company Accounting Oversight Board (United States) (“PCAOB”) the consolidated financial statements of Cognex Corporation and subsidiaries (the “Company”) referred to in our report dated
February 15, 2018
, which is included in the
2017
Annual Report on Form 10-K of Cognex Corporation. In our opinion, this financial statement schedule, when considered in relation to the basic consolidated financial statements taken as a whole, presents fairly, in all material respects, the information set forth therein.
Basis for opinion
Our audits of the basic consolidated financial statements included the financial statement schedule listed in the index appearing under Item 15(2), which is the responsibility of the Company’s management. We are a public accounting firm registered with the PCAOB and are required to be independent with respect to the Company in accordance with the U.S. federal securities laws and the applicable rules and regulations of the Securities and Exchange Commission and the PCAOB.
/s/ GRANT THORNTON LLP
Boston, Massachusetts
February 15, 2018
75
COGNEX CORPORATION – SCHEDULE II – VALUATION AND QUALIFYING ACCOUNTS
|
|
|
Additions
|
|
|
|
|
|
|||||||||||||||||
|
Description
|
Balance at
Beginning
of Period
|
Charged to
Costs and
Expenses
|
Charged
to Other
Accounts
|
Deductions
|
|
Other
|
|
Balance at
End of
Period
|
||||||||||||||||
|
(In thousands)
|
||||||||||||||||||||||||
|
Reserve for Uncollectible Accounts Receivable:
|
||||||||||||||||||||||||
|
2017
|
$
|
873
|
|
$
|
724
|
|
$
|
—
|
|
$
|
(116
|
)
|
(a)
|
$
|
87
|
|
(b)
|
$
|
1,568
|
|
||||
|
2016
|
$
|
736
|
|
$
|
216
|
|
$
|
—
|
|
$
|
(64
|
)
|
(a)
|
$
|
(15
|
)
|
(b)
|
$
|
873
|
|
||||
|
2015
|
$
|
820
|
|
$
|
—
|
|
$
|
—
|
|
$
|
(44
|
)
|
(a)
|
$
|
(40
|
)
|
(b)
|
$
|
736
|
|
||||
|
Reserve for Excess and Obsolete Inventory:
|
||||||||||||||||||||||||
|
2017
|
$
|
3,317
|
|
$
|
3,281
|
|
$
|
—
|
|
$
|
(1,980
|
)
|
(a)
|
$
|
343
|
|
(c)
|
$
|
4,961
|
|
||||
|
2016
|
$
|
3,803
|
|
$
|
3,641
|
|
$
|
—
|
|
$
|
(4,075
|
)
|
(a)
|
$
|
(52
|
)
|
(c)
|
$
|
3,317
|
|
||||
|
2015
|
$
|
5,058
|
|
$
|
1,562
|
|
$
|
—
|
|
$
|
(2,443
|
)
|
(a)
|
$
|
(374
|
)
|
(c)
|
$
|
3,803
|
|
||||
|
Deferred Tax Valuation Allowance:
|
||||||||||||||||||||||||
|
2017
|
$
|
4,116
|
|
$
|
1,193
|
|
$
|
—
|
|
$
|
—
|
|
$
|
—
|
|
$
|
5,309
|
|
||||||
|
2016
|
$
|
3,259
|
|
$
|
857
|
|
$
|
—
|
|
$
|
—
|
|
$
|
—
|
|
$
|
4,116
|
|
||||||
|
2015
|
$
|
2,483
|
|
$
|
817
|
|
$
|
—
|
|
$
|
—
|
|
$
|
(41
|
)
|
$
|
3,259
|
|
||||||
|
(a)
|
Specific write-offs
|
|
(b)
|
Collections of previously written-off accounts and foreign currency exchange rate changes
|
|
(c)
|
Foreign currency exchange rate changes
|
76
There were no disagreements with accountants on accounting or financial disclosure during
2017
or
2016
.
Disclosure Controls and Procedures
As required by Rules 13a-15 and 15d-15 of the Securities Exchange Act of 1934, the Company has evaluated, with the participation of management, including the Chief Executive Officer and the Chief Financial Officer, the effectiveness of its disclosure controls and procedures (as defined in such rules) as of the end of the period covered by this report. Based on such evaluation, the Chief Executive Officer and Chief Financial Officer concluded that such disclosure controls and procedures were effective as of that date.
Management’s Report on Internal Control over Financial Reporting
Management is responsible for establishing and maintaining adequate internal control over financial reporting. Management has evaluated the effectiveness of the Company’s internal control over financial reporting based upon the framework in Internal Control – Integrated Framework issued in 2013 by the Committee of Sponsoring Organizations of the Treadway Commission (COSO).
Based upon our evaluation, management has concluded that the Company’s internal control over financial reporting was effective as of
December 31, 2017
.
Attestation Report of the Registered Public Accounting Firm on Internal Control over Financial Reporting
The Company’s internal control over financial reporting as of
December 31, 2017
has been audited by Grant Thornton LLP, an independent registered public accounting firm, as stated in their report which is included herein.
Changes in Internal Control over Financial Reporting
There have been no changes in the Company’s internal control over financial reporting that occurred during the fourth quarter of the year ended
December 31, 2017
that have materially affected, or are reasonably likely to materially affect, the Company’s internal control over financial reporting. The Company continues to review its disclosure controls and procedures, including its internal control over financial reporting, and may from time to time make changes aimed at enhancing their effectiveness and to ensure that the Company’s systems evolve with its business.
77
REPORT OF INDEPENDENT REGISTERED PUBLIC ACCOUNTING FIRM
Board of Directors and Shareholders Cognex Corporation
Opinion on internal control over financial reporting
We have audited the internal control over financial reporting of Cognex Corporation (a Massachusetts corporation) and subsidiaries (the “Company”) as of December 31,
2017
, based on criteria established in the 2013
Internal Control-Integrated Framework
issued by the Committee of Sponsoring Organizations of the Treadway Commission (COSO). In our opinion, the Company maintained, in all material respects, effective internal control over financial reporting as of December 31, 2017, based on criteria established in the 2013
Internal Control-Integrated Framework
issued by COSO.
We also have audited, in accordance with the standards of the Public Company Accounting Oversight Board (United States) (“PCAOB”), the consolidated financial statements of the Company as of and for the year ended December 31, 2017, and our report dated February 15, 2018 expressed an unqualified opinion on those financial statements.
Basis for opinion
The Company’s management is responsible for maintaining effective internal control over financial reporting and for its assessment of the effectiveness of internal control over financial reporting, included in the accompanying Management’s Report on Internal Control over Financial Reporting. Our responsibility is to express an opinion on the Company’s internal control over financial reporting based on our audit. We are a public accounting firm registered with the PCAOB and are required to be independent with respect to the Company in accordance with the U.S. federal securities laws and the applicable rules and regulations of the Securities and Exchange Commission and the PCAOB.
We conducted our audit in accordance with the standards of the PCAOB. Those standards require that we plan and perform the audit to obtain reasonable assurance about whether effective internal control over financial reporting was maintained in all material respects. Our audit included obtaining an understanding of internal control over financial reporting, assessing the risk that a material weakness exists, testing and evaluating the design and operating effectiveness of internal control based on the assessed risk, and performing such other procedures as we considered necessary in the circumstances. We believe that our audit provides a reasonable basis for our opinion.
Definition and limitations of internal control over financial reporting
A company’s internal control over financial reporting is a process designed to provide reasonable assurance regarding the reliability of financial reporting and the preparation of financial statements for external purposes in accordance with generally accepted accounting principles. A company’s internal control over financial reporting includes those policies and procedures that (1) pertain to the maintenance of records that, in reasonable detail, accurately and fairly reflect the transactions and dispositions of the assets of the company; (2) provide reasonable assurance that transactions are recorded as necessary to permit preparation of financial statements in accordance with generally accepted accounting principles, and that receipts and expenditures of the company are being made only in accordance with authorizations of management and directors of the company; and (3) provide reasonable assurance regarding prevention or timely detection of unauthorized acquisition, use, or disposition of the company’s assets that could have a material effect on the financial statements.
Because of its inherent limitations, internal control over financial reporting may not prevent or detect misstatements. Also, projections of any evaluation of effectiveness to future periods are subject to the risk that controls may become inadequate because of changes in conditions, or that the degree of compliance with the policies or procedures may deteriorate.
/s/ GRANT THORNTON LLP
Boston, Massachusetts
February 15, 2018
78
None
Information with respect to Directors and Executive Officers of the Company and the other matters required by Item 10 shall be included in the Company’s definitive Proxy Statement for the Annual Meeting of Shareholders to be held on
April 25, 2018
and is incorporated herein by reference. In addition, certain information with respect to Executive Officers of the Company may be found in the section captioned “Executive Officers of the Registrant,” appearing in Part I – Item 4A of this Annual Report on Form 10-K.
The Company has adopted a Code of Business Conduct and Ethics covering all employees, which is available, free of charge, on the Company’s website,
www.cognex.com
under "Company-Investor Information-Governance". The Company intends to disclose on its website any amendments to or waivers of the Code of Business Conduct and Ethics on behalf of the Company’s directors and executive officers that would otherwise be required to be disclosed under the rules of the SEC or The NASDAQ Stock Market LLC.
Information with respect to executive compensation and the other matters required by Item 11 shall be included in the Company’s definitive Proxy Statement for the Annual Meeting of Shareholders to be held on
April 25, 2018
and is incorporated herein by reference.
Information with respect to security ownership and the other matters required by Item 12 shall be included in the Company’s definitive Proxy Statement for the Annual Meeting of Shareholders to be held on
April 25, 2018
and is incorporated herein by reference.
The following table provides information as of
December 31, 2017
regarding shares of common stock that may be issued under the Company’s existing equity compensation plans:
|
Plan Category
|
Number of securities to be
issued upon exercise of
outstanding options,
warrants, and rights
|
Weighted-average exercise
price of outstanding options,
warrants, and rights
|
Number of securities
remaining available for future
issuance under equity
compensation plans
(excluding securities reflected
in column (a))
|
|||||||
|
|
(a)
|
|
|
|||||||
|
Equity compensation plans approved by shareholders (4)
|
12,287,670
|
|
(1)
|
$
|
25.9093
|
|
12,134,952
|
|
(2)
|
|
|
Equity compensation plans not approved by shareholders (4)
|
457,606
|
|
(3)
|
7.0190
|
|
—
|
|
|||
|
12,745,276
|
|
$
|
25.2311
|
|
12,134,952
|
|
||||
|
(1)
|
Includes shares to be issued upon exercise of outstanding options under the Company’s 1998 Stock Incentive Plan, 2007 Stock Option and Incentive Plan, and subsequent to shareholder approval, the 2001 General Stock Option Plan, as amended and restated.
|
|
(2)
|
Includes shares remaining available for future issuance under the Company’s 2007 Stock Option and Incentive Plan and 2001 General Stock Option Plan, as amended and restated.
|
|
(3)
|
Includes shares to be issued upon the exercise of outstanding options granted prior to shareholder approval under the 2001 General Stock Option Plan, as amended and restated.
|
|
(4)
|
All references made to share or per share amounts have been adjusted to reflect the two-for-one stock split which occurred in the fourth quarter of 2017.
|
The 2001 General Stock Option Plan was originally adopted by the Board of Directors in December 2001 without shareholder approval. In December 2011, this plan received shareholder approval for an amendment and restatement of the plan, extending the plan until September 2021. This plan provides for the granting of nonqualified stock options and incentive stock options to any employee who is actively employed by the Company and is not an officer or director of the Company. The maximum number of shares of common stock available for grant under this plan is 28,440,000 shares. All option grants must have an exercise price per share that is no less than the fair market value per share of the Company’s common stock on the grant date and must have a term that is no longer than ten years from the grant date. 24,748,740 stock options have been granted under the 2001 General Stock Option Plan.
79
Information with respect to certain relationships and related transactions and the other matters required by Item 13 shall be included in the Company’s definitive Proxy Statement for the Annual Meeting of Shareholders to be held on
April 25, 2018
and is incorporated herein by reference.
Information with respect to principal accounting fees and services and the other matters required by Item 14 shall be included in the Company’s definitive Proxy Statement for the Annual Meeting of Shareholders to be held on
April 25, 2018
and is incorporated herein by reference.
|
(1)
|
Financial Statements
|
The financial statements are included in Part II – Item 8 of this Annual Report on Form 10-K.
|
(2)
|
Financial Statement Schedule
|
Financial Statement Schedule II is included in Part II – Item 8 of this Annual Report on Form 10-K.
Other schedules are omitted because of the absence of conditions under which they are required or because the required information is provided in the consolidated financial statements or notes thereto.
|
(3)
|
Exhibits
|
The Exhibits filed as part of this Annual Report on Form 10-K are listed in the Exhibit Index, immediately preceding the signature page hereto.
Not applicable
80
EXHIBIT INDEX
|
EXHIBIT NUMBER
|
|
|
|
3A
|
||
|
3B
|
||
|
3C
|
||
|
3D
|
||
|
4A
|
Specimen Certificate for Shares of Common Stock (incorporated by reference to Exhibit 4 to Cognex's Registration Statement on Form S-1 [Registration No. 33-29020])
|
|
|
4B
|
||
|
10A *
|
||
|
10B *
|
||
|
10C *
|
||
|
10D *
|
||
|
10E *
|
||
|
10F *
|
||
|
10G *
|
||
|
10H *
|
||
|
10I *
|
||
|
10J *
|
||
|
10K *
|
||
|
10L *
|
||
|
10M *
|
||
|
10N *
|
||
81
|
10O *
|
||
|
10P *
|
||
|
10Q *
|
||
|
21
|
||
|
23.1
|
||
|
31.1
|
||
|
31.2
|
||
|
32.1
|
||
|
32.2
|
||
|
101
|
xBRL (Extensible Business Reporting Language)
|
|
|
The following materials from Cognex Corporation's Annual Report on Form 10-K for the period ended December 31, 2017, formatted in xBRL: (i) Consolidated Statements of Operations for the years ended December 31, 2017, December 31, 2016, and December 31, 2015; (ii) Consolidated Statements of Comprehensive Income for the years ended December 31, 2017, December 31, 2016, and December 31, 2015; (iii) Consolidated Balance Sheets as of December 31, 2017 and December 31, 2016; (iv) Consolidated Statements of Cash Flows for the years ended December 31, 2017, December 31, 2016, and December 31, 2015; (v) Consolidated Statements of Shareholders’ Equity for the years ended December 31, 2017, December 31, 2016, and December 31, 2015; and (vi) Notes to Consolidated Financial Statements.
* Indicates management contract or compensatory plan or arrangement |
||
82
SIGNATURES
Pursuant to the requirements of Section 13 or 15(d) of the Securities Exchange Act of 1934, the registrant has duly caused this report to be signed on its behalf by the undersigned, thereunto duly authorized.
|
COGNEX CORPORATION
|
||
|
By:
|
/s/ Robert J. Willett
|
|
|
Robert J. Willett
|
||
|
President and Chief Executive Officer
|
||
Pursuant to the requirements of the Securities Exchange Act of 1934, this report has been signed below by the following persons on behalf of the registrant and in the capacities and on the dates indicated.
|
Signature
|
Title
|
Date
|
||
|
/s/ Robert J. Shillman
|
Chairman of the Board of Directors and Chief Culture Officer
|
February 15, 2018
|
||
|
Robert J. Shillman
|
||||
|
/s/ Robert J. Willett
|
President, Chief Executive Officer, and Director (principal executive officer)
|
February 15, 2018
|
||
|
Robert J. Willett
|
||||
|
/s/ John J. Curran
|
Senior Vice President of Finance, Chief Financial Officer, and Treasurer (principal financial and accounting officer)
|
February 15, 2018
|
||
|
John J. Curran
|
||||
|
/s/ Patrick Alias
|
Director
|
February 15, 2018
|
||
|
Patrick Alias
|
||||
|
/s/ Eugene Banucci
|
Director
|
February 15, 2018
|
||
|
Eugene Banucci
|
||||
|
/s/ Theodor Krantz
|
Director
|
February 15, 2018
|
||
|
Theodor Krantz
|
||||
|
/s/ Jeffrey Miller
|
Director
|
February 15, 2018
|
||
|
Jeffrey Miller
|
||||
|
/s/ J. Bruce Robinson
|
Director
|
February 15, 2018
|
||
|
J. Bruce Robinson
|
||||
|
/s/ Jerry Schneider
|
Director
|
February 15, 2018
|
||
|
Jerry Schneider
|
||||
|
/s/ Anthony Sun
|
Director
|
February 15, 2018
|
||
|
Anthony Sun
|
||||
83
TABLE OF CONTENTS
Part IItem 1: BusinessNote 18 To The Consolidated Financial Statements, Appearing in Part II - Item 8 Of This Annual Report on Form 10-kItem 1A: Risk FactorsItem 1B: Unresolved Staff CommentsItem 2: PropertiesItem 3: Legal ProceedingsItem 4: Mine Safety DisclosuresItem 4A: Executive Officers Of The RegistrantPart IIItem 5: Market For Registrant S Common Equity, Related Stockholder Matters, and Issuer Purchases Of Equity SecuritiesItem 6: Selected Financial DataItem 7: Management S Discussion and Analysis Of Financial Condition and Results Of OperationsItem 7A: Quantitative and Qualitative Disclosures About Market RiskItem 8: Financial Statements and Supplementary DataNote 1: Summary Of Significant Accounting PoliciesNote 2: New PronouncementsNote 3: Fair Value MeasurementsNote 4: Cash, Cash Equivalents, and InvestmentsNote 5: InventoriesNote 6: Property, Plant, and EquipmentNote 7: GoodwillNote 8: Intangible AssetsNote 9: Accrued ExpensesNote 10: Commitments and ContingenciesNote 11: Indemnification ProvisionsNote 12: Derivative InstrumentsNote 13: Shareholders EquityNote 14: Stock-based CompensationNote 15: Employee Savings PlanNote 16: TaxesNote 17: Weighted Average SharesNote 18: Segment and Geographic InformationNote 19: Discontinued OperationsNote 20: AcquisitionsNote 21: Subsequent EventsItem 9: Changes in and Disagreements with Accountants on Accounting and Financial DisclosureItem 9A: Controls and ProceduresItem 9B: Other InformationPart IIIItem 10: Directors, Executive Officers, and Corporate GovernanceItem 11: Executive CompensationItem 12: Security Ownership Of Certain Beneficial Owners and Management and Related Stockholder MattersItem 13: Certain Relationships and Related Transactions, and Director IndependenceItem 14: Principal Accounting Fees and ServicesPart IVItem 15: Exhibits and Financial Statement SchedulesItem 16: Form 10-k Summary